The Amazonas State REDD+ System: a nested approach proposal for the Amazon Supported by: Developed by:

Amazonas jnr workshop
Aug 20, 2015
Welcome message from author
This document is posted to help you gain knowledge. Please leave a comment to let me know what you think about it! Share it to your friends and learn new things together.
Transcript
The Amazonas State REDD+ System: a nested approach proposal for the Amazon
Supported by:
Developed by:

A Nested Approach for REDD+ in
the Amazon
A proposal from the Brazilian GCF States (Acre, Amazonas, Pará, Mato
Grosso and Tocantins)
Verified Deforestation 1996-2012 (km2)
Baseline NPCC 2006-2020 (km2)
Reductions Targets NPCC 2006-2020 (km2)
96 97 98 99 00 01 02 03 04 05 06 07 08 09 10 11 12 13 14 15 16 17 18 19 20
5000
10000
15000
20000
25000
0
30000
Years
Def
ore
stat
ion
(K
m2
)
3.544.438.206 tCO2 (2006 – 2012)
NPCC: Baseline and targets for REDD+ in the Amazon (2006-2020)
9.274.214.738 tCO2

How to share REDD+ across the Amazon ?

Key issues for consideration
The amazon region has different government policies, land rights, stakeholders, drivers and agents of deforestation… “one size does not fits all”
Amazon states have autonomy and are moving towards implementation of their REDD+ programs
It is necessary to avoid double counting between projects, jurisdictions and national programs
Maximize funding opportunities from different sources: domestic, international, public and private, market and non market based mechanisms…

A National REDD+ Commission should define:
ProjectA
Project B
Project C
20% 80%
Monitoring and Fiscalization
Sustainable Activities
Increase agriculture efficiency
Sustainable Forest Management
Federal Government
4%
24%
2%
3%
27%
27%
9%
3% 1%
Alocation UREDD - 2006/2020
Acre
Amazonas
Amapá
Maranhão
Mato Grosso
Pará
Rondônia
Roraima
Tocantins
X% of UREDDs for Markets
Y% of UREDDs retail for domestic and
performance based payments
Amazon Fund
1, 854 GtCO2
9.274.214.738 tCO2 UREDD (2006 - 2020)
7,419 GtCO2

Forest C Stocks
(km2)
Forest C Stocks
(%)
Reduced
Deforestatioin
(km2)
Reduced
Deforestation in
relation to
Reduced
deforestation of
Brazilian Amazon
(%)
CREDD (%)
Acre 132.048,00 3,9% 203,52 3,8% 3,8%
Amazonas 1.459.969,00 43,1% 81,82 1,5% 22,3%
Amapá 117.188,00 3,5% - 7,29 -0,1% 1,7%
Maranhão 92.997,00 2,7% 290,93 5,4% 4,1%
Mato Grosso 338.066,00 10,0% 3.324,13 61,9% 36,0%
Pará 911.664,00 26,9% 656,81 12,2% 19,6%
Rondônia 141.566,00 4,2% 726,32 13,5% 8,9%
Roraima 161.202,00 4,8% 9,64 0,2% 2,5%
Tocantins 31.008,00 0,9% 82,56 1,5% 1,2%
TOTAL 3.385.708,00 100% 5.368,44 100% 100%
2006
(historical deforestation rate) –
(verified deforestation) by 2006
(Source: PRODES)
UREDD
Reduced deforestation by Brazilian Amazon States, in relation
to reduced deforestation of
Brazilian Amazon (%)
U-REDD: Allocation by Brazilian Amazon State, based
in a stock-flow mechanism, considering the share of 50%
to flow and 50% to stocks
Fontes: Cattaneo. A, 2009 ; OSIRIS, 2009 ; BANTER, 2010.
Forestry Area(km2) by 2006 (Brazilian
Amazon) (Source: BANTER)
Forest Carbon Stocks by State in
relation to Brazilian Amazon
forest carbon stocks (%)

Alocations for Amazon GCF States (2010 – 2020)
4%
24%
2%
3%
27%
27%
9%
3% 1%
UREDD allocations - 2010/2020
Acre
Amazonas
Amapá
Maranhão
Mato Grosso
Pará
Rondônia
Roraima
Tocantins
297.724.820 tCO2
1.792.669.833 tCO2
92.147.269 tCO2
2.153.669.960 tCO2
1.959.488.986 tCO2
73.425.938 tCO2
Fonte: Idesam 2012


U-REDD AM (2006 - 2020)
State Government
(29%)
24% = 1.792.669.833 t CO2
Buffer (UREDD geradas entre 2006 – 2009) – 297.205.286 tCO2
Call for projects (30%)
Municipal Governments
(10%)
Independent REDD+ projects
Environmental Management
Monitoring and fiscalization
State Protected Areas (14%)
Rural Settlements (15%)
Indigenous Lands (16%)

U-REDD AM (2006 - 2020)
State Government
(29%)
24% = 1.786.671.218 t CO2
Buffer (UREDD geradas entre 2006 – 2009) – 297.205.286 tCO2
Call for projects (30%)
Municipal Governments
(10%)
Independent REDD+ projects
Environmental Management
Monitoring and Fiscalization
State Protected Areas (14%)
• Historical Deforestation Rates (flow): Allocation to
consolidated deforestation frontier
• Forest Carbon Stocks (stock): Balanced distribution to non-
threatened areas
• Future Deforestation Risk Map: Allocation to future
deforestation frontiers
Rural Settlements (15%)
Indigenous Lands (16%)


State Protected Area (RDS Rio Madeira)
Forestry Area: 226.273 ha Historical rate of deforestation: 251 ha/year Projected deforestation: 16.548 ha (2011 – 2020)
Rural Settlement (PA Juma)
Forestry Area: 608.680 ha Historical rate of deforestation: 6.884 ha/year Projected deforestation: 145.923 ha (2011 - 2020)
IL Médio Rio Negro
Forestry Area: 989.277 ha Historical rate of deforestation: 226 ha/year Projected deforestation: 12.138 ha (2011 – 2020)

I.L. Médio Rio Negro
Step 1. Carbon Stocks (30%):
I.L Médio Rio Negro: 989.277,34 hectares of forests
Amazonas State: 123.560.872 hectares of forests
I.L. Médio Rio Negro has 0,8% of Amazonas´s forest carbon stocks
Step 2. Historical deforestation (30%):
I.L. Médio Rio Negro: 226 ha/year
Amazonas State: 81.030 ha/year
I.L. Médio Rio Negro represents 0,28% of Amazonas´s historical deforestation
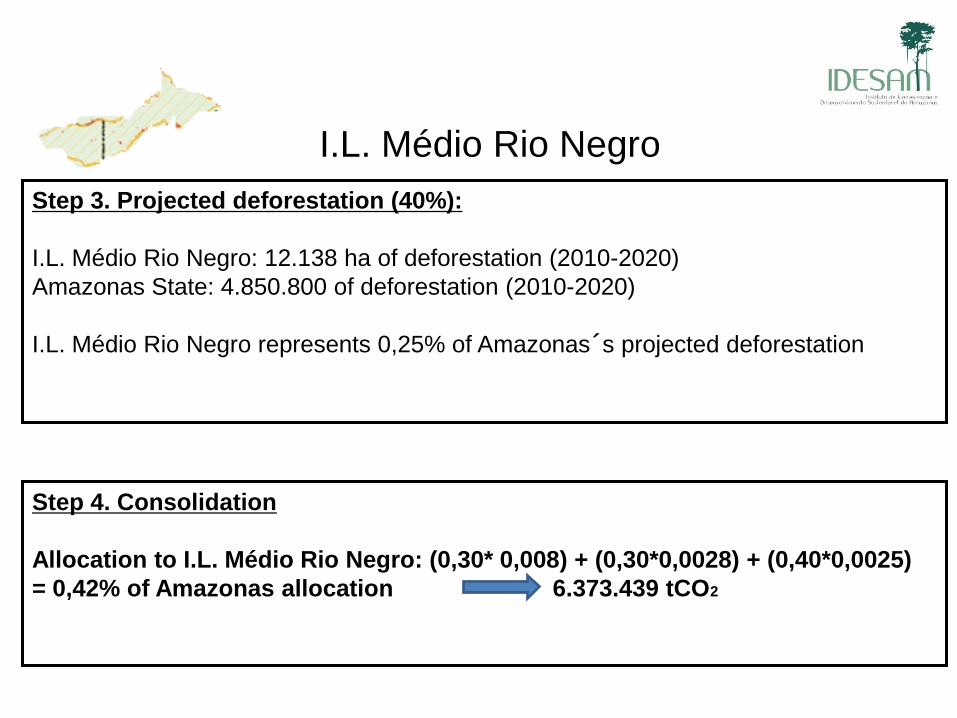
Step 4. Consolidation
Allocation to I.L. Médio Rio Negro: (0,30* 0,008) + (0,30*0,0028) + (0,40*0,0025)
= 0,42% of Amazonas allocation 6.373.439 tCO2
Step 3. Projected deforestation (40%):
I.L. Médio Rio Negro: 12.138 ha of deforestation (2010-2020)
Amazonas State: 4.850.800 of deforestation (2010-2020)
I.L. Médio Rio Negro represents 0,25% of Amazonas´s projected deforestation
I.L. Médio Rio Negro
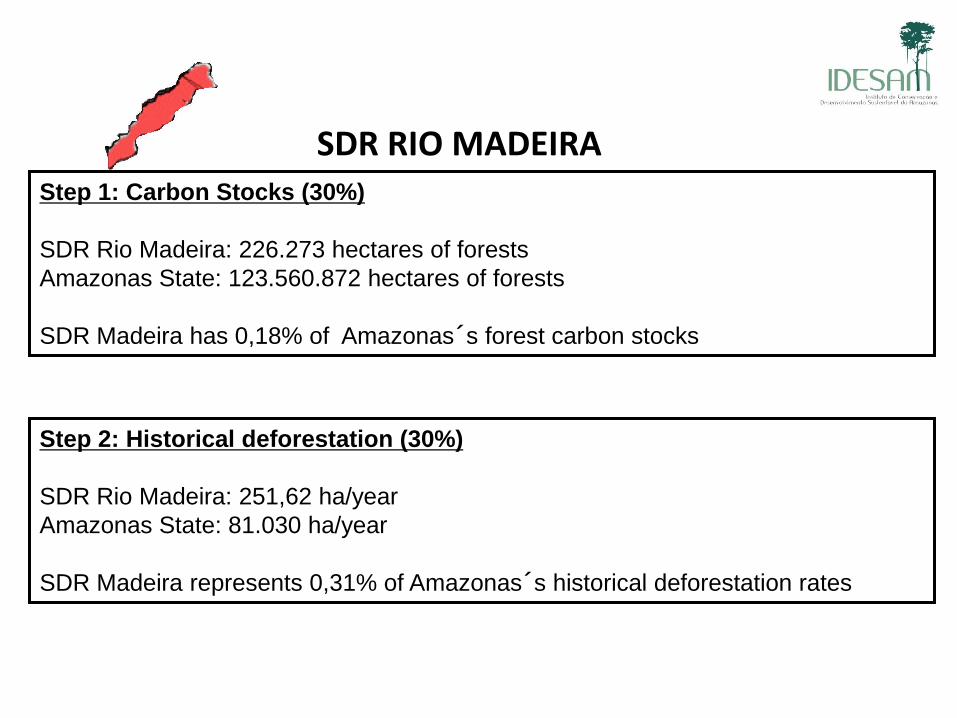
SDR RIO MADEIRA Step 1: Carbon Stocks (30%)
SDR Rio Madeira: 226.273 hectares of forests
Amazonas State: 123.560.872 hectares of forests
SDR Madeira has 0,18% of Amazonas´s forest carbon stocks
Step 2: Historical deforestation (30%)
SDR Rio Madeira: 251,62 ha/year
Amazonas State: 81.030 ha/year
SDR Madeira represents 0,31% of Amazonas´s historical deforestation rates

Step 4: Consolidation
Allocation to SDR Madeira: (0,30*0,0018) + (0,30*0,0031) + (0,40* 0,0034) = 0,28%
Amazonas allocation 4.199.955 tCO2
Step 3: Projected deforestation (40%)
SDR Madeira: 16.548 hectares (2010-2020)
Amazonas State: 4.850.800 hectares (2010-2020)
SDR Madeira represents 0,34% of Amazonas´s projected deforestation
RDS RIO MADEIRA
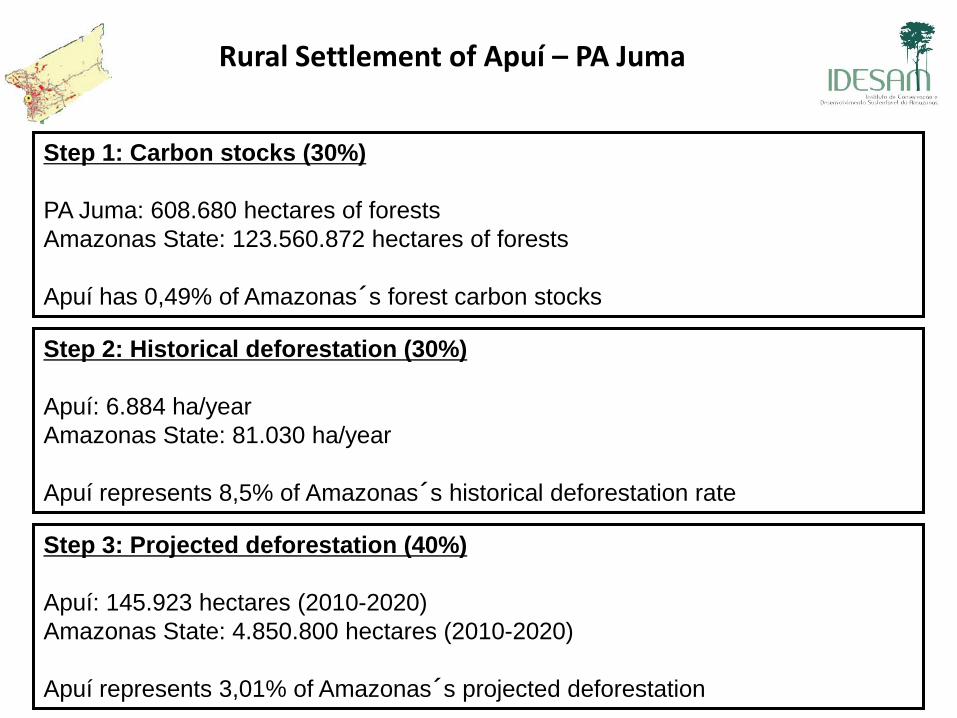
Step 1: Carbon stocks (30%)
PA Juma: 608.680 hectares of forests
Amazonas State: 123.560.872 hectares of forests
Apuí has 0,49% of Amazonas´s forest carbon stocks
Rural Settlement of Apuí – PA Juma
Step 3: Projected deforestation (40%)
Apuí: 145.923 hectares (2010-2020)
Amazonas State: 4.850.800 hectares (2010-2020)
Apuí represents 3,01% of Amazonas´s projected deforestation
Step 2: Historical deforestation (30%)
Apuí: 6.884 ha/year
Amazonas State: 81.030 ha/year
Apuí represents 8,5% of Amazonas´s historical deforestation rate

Step 4: Consolidation
(0,30*0,0049)+(0,30*0,085)+(0,40*0,03) = 3,9% of Amazonas allocation
60.147.532,92 t CO2
Rural settlement of Apuí – PA Juma
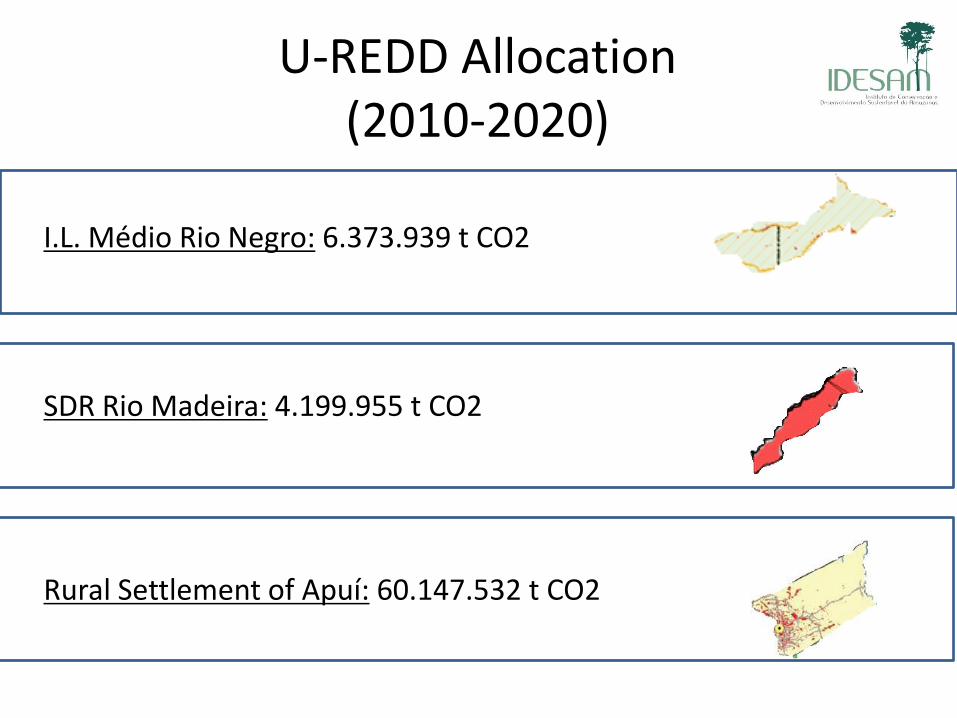
U-REDD Allocation (2010-2020)
I.L. Médio Rio Negro: 6.373.939 t CO2
SDR Rio Madeira: 4.199.955 t CO2
Rural Settlement of Apuí: 60.147.532 t CO2
Questions and lessons learned
Preliminary baselines + targets are an important step for early moving, but should be flexible for future changes
Subnational is important to channel funds for readiness and jurisdictional programatic activities Should be efficient, transparent and multi-stakeholder
Amazon, SISA Company, FAS
Target: reducing deforestation and improving livelihoods What is the best implementation arrangement?
Importance of learning lessons with pilots

Obrigado!!!
Related Documents