Amaç ve Kapsam AURUM Mühendislik Sistemleri ve Mimarlık Dergisi (A-JESA) dergisi karmaşık mühendislik sistemlerinin modellenmesi, analizi ve optimizasyonu ve ayrıca mimari tasarım, planlama, araştırma, eğitim, teknoloji, tarih ve sanat için yılda iki kez olmak üzere (Haziran-Aralık), İngilizce ve Türkçe yayınları kabul eden, uluslararası düzeyde yayınlanan bir dergi- dir. Yayım için uygun olan konu çeşitliliği tasarım, konstrüksiyon, makinelerin ve daha kompleks ısıl/mekanik/elekt- romekanik sistemlerin çalışma ve bakımı, bilgisayar mimarisi ve yazılım teknolojilerindeki gelişmeler, yeni hesapla- malı metodolojiler, güç sistemleri, dijital elektronik sistemler, sinyal işleme, iletişim sistemleri, endüstriyel sistemlerin ve hizmet sistemlerinin tasarım ve geliştirilmesi, çeşitli girdilerdeki kompleks sistemlerde risk ve belirsizlik analizini içerecek ancak bunlarla sınırlı olmayacak biçimde geniştir. Ayrıca, mimari alan araştırması alanlarında mimari tasarım çalışmaları, mimari eğitim, bilgisayar destekli tasarım, sinematik mimari, iç mimari, mimari eleştiri, inşaat yönetimi, konut çalışmaları ve sürdürülebilirlik de dahil ancak bunlarla sınırlı olmayan alanlar bulunmaktadır. Aims and Scope AURUM- Journal of Engineering Systems and Architecture (A-JESA) is a internationally refereed journal published bian- nually (June-December) and accepting English and Turkish publications for modeling, analysis, and optimization of complex engineering systems; and also architectural design, planning, research, education, technology, history and art. Range of topics eligible for publication is wide including but not limited to design, construction, operation and maintenance of machines and more complex thermal/ mechanical/ electromechanical systems, advances in com- puter architecture and software technologies, novel computational methodologies, power systems, digital electron- ics systems, signal processing, communication systems, design and advancement of industrial and service systems, risk and uncertainty analysis in complex systems in various domains. Additionally, in architectural field research ar- eas is wide including but not limited to architectural design studies, architectural education, computer aided de- sign, cinematic architecture, interior architecture, architectural criticism, construction management, housing studies and sustainability. A-JESA publishes theory and methodology papers describing novel approaches to the problems and issues related to engineering systems and architecture, innovative applications of the theory, invited reviews of literature, and short communications. The journal welcomes articles on interdisciplinary engineering and architec- tural research as well. Yazışma ve İnternet Adresi / E-mail and web-sites e-mail: [email protected] web: http://aurum.altinbas.edu.tr/tr/muhendislik-sistemleri-mimarlik-dergisi İletişim / Contact Adress Altınbaş Üniversitesi, Mahmutbey Dilmenler Cad. No. 26, 34217 Bağcılar – İSTANBUL Tel: (0 212) 604 01 00 • Fax: (0 212) 445 81 71 Yayın Aralığı / Publication Frequency Yılda 2 sayı – 6 ayda bir (Haziran ve Aralık) / Published biannually – every 6 months (June and December) Dil / Language Türkçe – İngilizce / Turkish – English Yazım Kuralları / Guide for Contributors https://dergipark.org.tr/en/pub/ajesa/writing-rules Web Tasarım & Görsel Tasarım/ Web Design & Visual Design Mehmet Ali ALTINEL Grafik Tasarım / Graphic Design ONUR SERTEL Teknik Asistan / Technical Assistant Büşra BÜYÜKTANIR Oğuz KOZ Dizgi / Typesetting İdeal Kültür Baskı / Print Sena Ofset Yayın Tarihi / Date of Publication 30 Haziran 2020

Welcome message from author
This document is posted to help you gain knowledge. Please leave a comment to let me know what you think about it! Share it to your friends and learn new things together.
Transcript
Amaç ve KapsamAURUM Mühendislik Sistemleri ve Mimarlık Dergisi (A-JESA) dergisi karmaşık mühendislik sistemlerinin modellenmesi, analizi ve optimizasyonu ve ayrıca mimari tasarım, planlama, araştırma, eğitim, teknoloji, tarih ve sanat için yılda iki kez olmak üzere (Haziran-Aralık), İngilizce ve Türkçe yayınları kabul eden, uluslararası düzeyde yayınlanan bir dergi-dir. Yayım için uygun olan konu çeşitliliği tasarım, konstrüksiyon, makinelerin ve daha kompleks ısıl/mekanik/elekt-romekanik sistemlerin çalışma ve bakımı, bilgisayar mimarisi ve yazılım teknolojilerindeki gelişmeler, yeni hesapla-malı metodolojiler, güç sistemleri, dijital elektronik sistemler, sinyal işleme, iletişim sistemleri, endüstriyel sistemlerin ve hizmet sistemlerinin tasarım ve geliştirilmesi, çeşitli girdilerdeki kompleks sistemlerde risk ve belirsizlik analizini içerecek ancak bunlarla sınırlı olmayacak biçimde geniştir. Ayrıca, mimari alan araştırması alanlarında mimari tasarım çalışmaları, mimari eğitim, bilgisayar destekli tasarım, sinematik mimari, iç mimari, mimari eleştiri, inşaat yönetimi, konut çalışmaları ve sürdürülebilirlik de dahil ancak bunlarla sınırlı olmayan alanlar bulunmaktadır.
Aims and ScopeAURUM- Journal of Engineering Systems and Architecture (A-JESA) is a internationally refereed journal published bian-nually (June-December) and accepting English and Turkish publications for modeling, analysis, and optimization of complex engineering systems; and also architectural design, planning, research, education, technology, history and art. Range of topics eligible for publication is wide including but not limited to design, construction, operation and maintenance of machines and more complex thermal/ mechanical/ electromechanical systems, advances in com-puter architecture and software technologies, novel computational methodologies, power systems, digital electron-ics systems, signal processing, communication systems, design and advancement of industrial and service systems, risk and uncertainty analysis in complex systems in various domains. Additionally, in architectural field research ar-eas is wide including but not limited to architectural design studies, architectural education, computer aided de-sign, cinematic architecture, interior architecture, architectural criticism, construction management, housing studies and sustainability. A-JESA publishes theory and methodology papers describing novel approaches to the problems and issues related to engineering systems and architecture, innovative applications of the theory, invited reviews of literature, and short communications. The journal welcomes articles on interdisciplinary engineering and architec-tural research as well.
Yazışma ve İnternet Adresi / E-mail and web-sitese-mail: [email protected] web: http://aurum.altinbas.edu.tr/tr/muhendislik-sistemleri-mimarlik-dergisi
İletişim / Contact AdressAltınbaş Üniversitesi, Mahmutbey Dilmenler Cad. No. 26, 34217 Bağcılar – İSTANBUL Tel: (0 212) 604 01 00 • Fax: (0 212) 445 81 71
Yayın Aralığı / Publication Frequency Yılda 2 sayı – 6 ayda bir (Haziran ve Aralık) / Published biannually – every 6 months (June and December)
Dil / Language Türkçe – İngilizce / Turkish – English
Yazım Kuralları / Guide for Contributors https://dergipark.org.tr/en/pub/ajesa/writing-rules
Web Tasarım & Görsel Tasarım/ Web Design & Visual DesignMehmet Ali ALTINEL
Grafik Tasarım / Graphic Design ONUR SERTEL
Teknik Asistan / Technical Assistant Büşra BÜYÜKTANIR Oğuz KOZ
Dizgi / Typesettingİdeal Kültür
Baskı / PrintSena Ofset
Yayın Tarihi / Date of Publication 30 Haziran 2020
AURUM Mühendislik Sistemleri ve Mimarlık Dergisi Aurum Journal of Engineering Systems and Architecture (A-JASE) ISSN: 2564-6397
Sahibi / OwnerAltınbaş Üniversitesi, Mütevelli Heyeti Başkanı Altınbaş University, President of the Board of Trustees Ali ALTINBAŞ
Genel Koordinatör / General CoordinatorProf. Dr. Çağrı ERHAN
Editörler /EditorsProf. Dr. Osman Nuri UÇAN (Altınbaş Üniversitesi), Baş Editör / Editor in Chief Prof. Dr. Oğuz BAYAT (Altınbaş Üniversitesi) Doç. Dr. Hakkı Oral ÖZHAN (Yeditepe Üniversitesi) Dr. Öğr. Üyesi Hakan KAYGUSUZ (Altınbaş Üniversitesi), Sorumlu Müdür/Director of Studies Dr. Öğr. Üyesi Ayşegül AKÇAY KAVAKOĞLU (Altınbaş Üniversitesi) Dr. Öğr. Üyesi Oğuz ATA (Altınbaş Üniversitesi)
Yayın Kurulu / Editorial BoardDennis ANDREJKO, Rochester Institute of Technology, USA, Nizamettin AYDIN, Yıldız Technical University, TURKEY, Niyazi Onur BAKIR, Altınbaş University, TURKEY, Hasan H. BALIK Yıldız, Technical University, TURKEY, Graham CAIRNS, AMPS, UNITED KINGDOM, Carlo CATTANI, University of Salerno, ITALY, Nur ÇAĞLAR, TOBB University, TURKEY, Georgy M. DIMIROVSKI, SS C. and Methodius University, MACEDONIA, Oktay OZCAN, Istanbul Aydın University, TURKEY, Maurizio CARLINI, University “La Tuscia”, ITALY, Luis F. CHAPARRO, University of Pittsburg, USA, Ersin GÖSE, National Defence University, TURKEY, Mehrdad HADIGHI, Pennsylvania State University, USA, Stanley HALLET, Catholic University of America, USA, Rachid HARBA, Orleans University, FRANCE, Rachid JENANNE, Orleans University, FRANCE, Ted LANDRUM, Manitoba University, CANADA, Peter STAVROULAKIS, Telecommunication System Ins., GREECE, Bahram SHAFAI, Northeastern University, USA, Masoud SALEHI, Northeastern University, USA, Arzu GÖNENÇ SORGUÇ, Middle East Technical University, TURKEY, Sinan Mert ŞENER, Istanbul Techical University, TURKEY, Jay WEITZEN, University of Massachusettes, USA, Neslihan DOSTOĞLU, İstanbul Kültür University, TURKEY, Mathew SCHWARTZ, New Jersey’s Science and Technology University, USA, Lale ÖZGENEL, Middle East Technical University, TURKEY
Danışma Kurulu / International Advisory BoardSema ALAÇAM, İstanbul Technical University, TURKEY, Aydın AKAN, İzmir University of Economics, TURKEY, Zafer ASLAN, İstanbul Aydın University, TURKEY, Emin ANARIM, Boğaziçi University, TURKEY, Doğu Çağdaş ATİLLA, Altınbaş University, TURKEY, Çağatay AYDIN, Altınbaş University, TURKEY, Süleyman BAŞTÜRK, Altınbaş University, TURKEY, Gülhan BENLİ, İstanbul Medipol University, TURKEY, Murat CEYLAN, Konya Selçuk University, TURKEY, Behzat Gökçen DEMİR, Ministry of Energy and Natural Sources, TURKEY, Abdi C. GÜZER, Middle East Technical University, TURKEY, Ali GÜNGÖR, Bahçeşehir University, TURKEY, Nihan T. HACIÖMEROĞLU, Osmangazi University, TURKEY, Gaye HAFEZ, Altınbaş University, TURKEY, Ertuğrul KARAÇUHA, Istanbul Technical University, TURKEY, Adem KARAHOCA, Nişantaşı University, TURKEY, Aykut KARAMAN, Altınbaş University, TURKEY, Mesut KARTAL, İstanbul Technical University, TURKEY, Hakan KUNTMAN, İstanbul Technical University, TURKEY, Sefer KURNAZ, Altınbaş University, TURKEY, Derya Güleç ÖZER, İstanbul Technical University, TURKEY, Halit PASTACI, Haliç University, TURKEY, Gürsev PİRGE, Altınbaş University, TURKEY, Ömer Fatih SAYAN, Telecommunications Authority, TURKEY, Murat SOYGENİŞ, Bahçeşehir University, TURKEY, Işıl Ruhi SİPAHİOGLU, TOBB University, TURKEY, Nuket SİVRİ, İstanbul University, TURKEY, Murat SÖNMEZ, TOBB University, TURKEY, Bige TUNCER, Singapore University of Technology and De, sign, SINGAPORE, Orkunt TURGAY, Altınbaş University, TURKEY, Bahadır UÇAN, Yıldız Technical University, TURKEY
Editörlerin Sorumlulukları ve Yükümlülükleri
AURUM editörleri, derginin yayımlanması kapsamında yürüttükleri tüm faaliyetlerde hesap verilebilirlik ilkesi çerçevesinde hareket etmekle yükümlüdürler. Editörlerin ana hedefi okuyucuların ihtiyaçlarına cevap vermenin yanında AURUM’un akademik niteliğini artırmaktır. Düşünce ve ifade özgürlüğünü desteklemek ve yayımlanan akademik içeriğin güvenilirliğini temin etmek başlıca görevleri arasındadır. Yayımcılık sektöründe yaşanan finansal zorluklar göz önünde bulundurulduğunda, AURUM’u ticari kaygılardan korumak, onun entelektüel ve etik standartlarından ödün vermesini önlemek editörlerin sorumluluğundadır. Editörler, gerekli olduğu durumlarda düzeltme, tekzip ya da özür yazısı gibi metinleri yayımlamayı peşinen kabul ederler. Dergi’nin okuyucuya karşı sorumluluğunun hassas bir mesele olmasına binaen AURUM editörlerinin okuyucuyu herhangi bir araştırma ya da akademik çalışmanın finansal destekçilerini açıklama mecburiyeti bulunmaktadır. Finansal destekçilerin, akademik bir çalışmanın üzerinde herhangi bir etkisi olması durumunda, okuyucu mutlaka bilgilendirilmelidir. Editörlerin akademik bir çalışmayı kabul ya da reddetme süreci öznel değerlendirmelere göre değil, nesnel standartlar çerçevesinde, çalışmanın özgünlüğü ve AURUM’un araştırma alanlarına uygunluğu bağlamında gerçekleştirilir. Makale gönderimleri tamamen demokratik esaslara göre yürütülür ve yapısal bir hata olmadıkça tüm başvurular değerlendirmeye alınır. Bir yazarın, çalışmasına ilişkin AURUM’dan kabul yazısı alması halinde, bu hakkı süreç içinde değişen/ göreve yeni başlayan editörler tarafından geri alınamaz. Yazarlara, editoryal değerlendirmelere itiraz etmesini sağlayacak süreçlerin işletilmesi hakkı verilir. Editörlerin, AURUM’da yayımlanacak metinlerin yayımlanmasına dair bir kılavuz hazırlama mecburiyetine binaen AURUM, web sitesinde yer alan yazım kurallarının arkasında durmakla beraber bu kılavuzda herhangi bir değişiklik yapma hakkını mahfuz tutar.
Liabilities and Responsibilities of Editors
AURUM editors are obliged to be accountable for all kinds of activities they engage within the context of publishing the journal. Their main goal is set to respond the need of readers and authors while enhancing the academic performance of the journal. It is their duty to support freedom of opinion and ensure the reliability of the academic content. Considering the financial challenges in publishing sector, the editors are obliged to exclude impacts of any commercial concerns on AURUM not to sacrifice from its intellectual and ethical standards.
They accept in advance to publish any kind of corrections, refutations and excuses when required. The responsibility towards readers is a sensitive issue where the editors should inform about the funder of particular research or other academic work. If the financial supporters of particular research have any impact on a scholarly work, the reader must be informed. Editors’ action to admit or reject a scholarly work must be free of subjective criterion but based on objective standards related to its uniqueness/ originality and relevance to the research areas of AURUM. The process of receiving application shall be fully democratic where all applications to be considered unless major errors are observed. Once an author receives an acceptance of publishing from AURUM, his/her right cannot be withdrawn in case of an editor change within the process. The authors shall be given an opportunity to initiate an appeal process against any editorial discretion. As editors should offer a guidance of preparing the manuscripts, AURUM stands behind its published ‘style guide’ and preserves it’s right to make revisions.

5
Cilt 4, Sayı 1 | Yaz 2020Volume 4, No 1 | Summer 2020
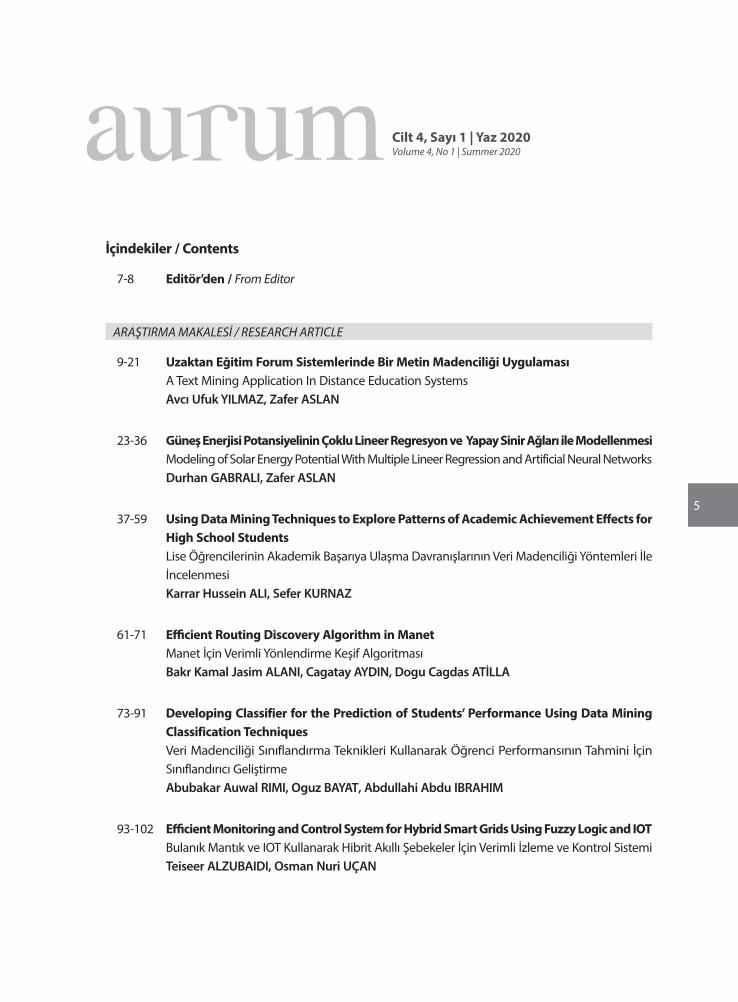
İçindekiler / Contents
7-8 Editör’den / From Editor
ARAŞTIRMA MAKALESİ / RESEARCH ARTICLE
9-21 Uzaktan Eğitim Forum Sistemlerinde Bir Metin Madenciliği UygulamasıA Text Mining Application In Distance Education SystemsAvcı Ufuk YILMAZ1, Zafer ASLAN2
23-36 Güneş Enerjisi Potansiyelinin Çoklu Lineer Regresyon ve Yapay Sinir Ağları ile ModellenmesiModeling of Solar Energy Potential With Multiple Lineer Regression and Artificial Neural NetworksDurhan GABRALI1, Zafer ASLAN2
37-59 Using Data Mining Techniques to Explore Patterns of Academic Achievement Effects for High School StudentsLise Öğrencilerinin Akademik Başarıya Ulaşma Davranışlarının Veri Madenciliği Yöntemleri İle İncelenmesiKarrar Hussein ALI, Sefer KURNAZ
61-71 Efficient Routing Discovery Algorithm in ManetManet İçin Verimli Yönlendirme Keşif AlgoritmasıBakr Kamal Jasim ALANI1, Cagatay AYDIN1, Dogu Cagdas ATİLLA1
73-91 Developing Classifier for the Prediction of Students’ Performance Using Data Mining Classification TechniquesVeri Madenciliği Sınıflandırma Teknikleri Kullanarak Öğrenci Performansının Tahmini İçin Sınıflandırıcı GeliştirmeAbubakar Auwal RIMI1, Oguz BAYAT2, Abdullahi Abdu IBRAHIM3
93-102 Efficient Monitoring and Control System for Hybrid Smart Grids Using Fuzzy Logic and IOTBulanık Mantık ve IOT Kullanarak Hibrit Akıllı Şebekeler İçin Verimli İzleme ve Kontrol SistemiTeiseer ALZUBAIDI1, Osman Nuri UÇAN

6
103-111 Automatic Combination of User Views for Database CreationVeritabanı Oluşturmada, Kullanıcı Görüşlerinin Bilgisayar Program İle Otomatik BütünleştirilmesiSefer KURNAZ1, Erden BAŞAR2
113-133 Yapılarda Yer Altı Suyuna Karşı Yapılan Koruma Sistemlerinin Uygulanabilirliği ve Güvenliğinin İncelenmesiInvestigation of Applicability And Safety of Conservation Systems Against Underground Water In BuildingsSepanta NAİMİ, Zafer ÖZDEMİR
135-152 21. Yüzyıl Dünya Fuarlarında (Expo) Türkiye’nin Mimari TemsiliArchitectural Presentation of Turkey In The 21St Century World’s Fairs (Expo)Erinç ONBAY1
7
AURUM MÜHENDİSLİK SİSTEMLERİ VE MİMARLIK DERGİSİAURUM JOURNAL OF ENGINEERING SYSTEMS AND ARCHITECTURE
Cilt 4, Sayı 1 | Yaz 2020Volume 4, No 1 | Summer 2020, 7
Editör’den
Altınbaş Üniversitesi tarafından basılan “Aurum Mühendislik Sistemleri ve Mimarlık Dergisi (A-JESA)” adlı uluslararası dergi; geniş kapsamda mühendislik ve mimarlık alanlarındaki özgün bilimsel çalışmaları hakem süreçlerinin olumlu olması halinde değerlendirmeye almaktadır. Stratejimiz, sıkı bir inceleme süreci sağ-layarak yüksek kalite standartlarında bilim ve teknolojide yeni eğilimleri gösteren yayınlara yer vermektir.
Geçtiğimiz sayımızda, yazılım projeleri ile ilgili olarak önemli olduğunu düşündüğümüz ve ilk olarak 2018 yılında yayınlanan “Yazılım Projelerinde Kalitenin Arttırılması: TMMi” başlıklı makaleyi tekrar yayınlamış-tık. Hepimizin içinde bulunduğu bu salgın sürecinde, uzaktan çalışma ve eğitimde yazılım projelerinin ne kadar önemli olduğuna yeniden tanık olduk. Konunun öneminin giderek artması üzerine, bu sayıda da uzaktan eğitim ile ilgili çalışmalara yer vermeye çalıştık. COVID-19 salgınını bilimi esas alarak hep bir-likte aşacağımıza inanıyoruz.
Yine bu sayıda sevindirici bir gelişme olarak dört adet saygın dizinde taranmaya başladık. ICI, DRJI, Asos Index ve idealonline dizinlerinde yer almamız bizim açımızdan sevindirici ve onur vericidir. Hedefimiz, ULAKBİM/TR Dizin tarafından taranarak bu saygın dizinde de yerimizi almaktır.
Yoğun inceleme süreçlerinin sonunda dergimizin 2020 yılına ait 4. cilt, 1. sayısını yayınlanmaktan büyük mutluluk duyuyoruz. Yayın kurulu üyelerine, bu sayının hakemlerine ve yazarlarına derginin misyonuna uygun bilimsel katkı ve yorumları için teşekkür etmek isterim.
Prof. Dr. Osman Nuri UÇAN Baş Editör

8
Cilt 4, Sayı 1 | Yaz 2020Volume 4, No 1 | Summer 2020, 8
From Editor
The scope of the Aurum Engineering Systems and Architecture (A-JESA) covers the novel scientific papers on engineering, architecture, mathematics and natural sciences. Our strategy is to demonstrate new trends in science and technology subject to high quality standards by ensuring a stringent peer review process.
Due to the importance of software projects, we republished the article titled “Improving Quality in Soft-ware Projects: TMMi” in our previous issue, which was originally published in 2018. We witnessed how important software projects are in distance work and education during the epidemic. With the increa-sing importance of the subject, we tried to include studies on distance education in this issue. We beli-eve we will overcome the COVID-19 outbreak on the basis of science.
As a pleasing development in this issue, we started to be indexed in four prestigious scientific indexes, namely ICI, DRJI, Asos Index and idealonline. Our goal is to be indexed by ULAKBİM/TR Dizin and take our place in this prestigious index.
It is our great pleasure to publish Volume 4, Number 1 (2020) of the international journal, “Aurum Engi-neering Systems and Architecture” (A-JESA) after serious review process. I sincerely wish to thank mem-bers of the editorial board, reviewers and authors of this issue who have generously contributed their time and knowledge to the work and the mission of the journal.
Prof. Dr. Osman Nuri UÇAN Editor in Chief
9
AURUM MÜHENDİSLİK SİSTEMLERİ VE MİMARLIK DERGİSİAURUM JOURNAL OF ENGINEERING SYSTEMS AND ARCHITECTURE
Cilt 4, Sayı 1 | Yaz 2020Volume 4, No 1 | Summer 2020, 9-21
ARAŞTIRMA MAKALESİ / RESEARCH ARTICLE
UZAKTAN EĞİTİM FORUM SİSTEMLERİNDE BİR METİN MADENCİLİĞİ UYGULAMASI
Avcı Ufuk YILMAZ1
1İstanbul Aydın Üniversitesi, Lisansüstü Eğitim Fakültesi, Bilgisayar Mühendisliği Programı, İstanbul [email protected] ORCID No: 0000-0002-7959-3560
Zafer ASLAN2
2İstanbul Aydın Üniversitesi, Mühendislik Fakültesi, Bilgisayar Mühendisliği Bölümü, İstanbul [email protected] ORCID No: 0000-0001-7707-7370
Teşekkür: Yazarlar bu yayın çalışması ile ilgili öneri ve desteklerinden dolayı Prof. Dr. Ali GÜNEŞ ve Doç. Dr. Metin ZONTUL’a teşekkürlerini sunarlar.
GELİŞ TARİHİ/RECEIVED DATE: 04.02.2020 KABUL TARİHİ/ACCEPTED DATE: 28.02.2020
Özet
Çalışmanın genel amacı uzaktan eğitim yazılımlarının forum sistemlerinden alınan verilerle metin madenciliği uygulaması oluşturmaktır. Eğitim sistemi olarak MOODLE uzaktan eğitim sistemi kullanılmış ve “www.enerjikaynaklari.info” web adresi üzerine kurulum yapılarak anlatılmıştır. MOODLE uzaktan eğitim sistemi Dünya genelinde üniversitelerde, eğitim kurumlarında, şirket içi eğitimlerde ve kişisel projelerde aktif olarak kullanılmaktadır. MOODLE’ın kurulumundan, internet ortamında yayınlanması, tema kurulumu, ders içerikleri eklemek, etkinlikler oluşturmak ve güvenlik ayarlarına kadar birçok bilgiye bu çalışmada erişilebilmektedir. MOODLE sistemi içerisinde yer alan forum etkinliğinden elde edilen veriler ile metin madenciliği uygulaması geliştirilecektir. Verileri işleyerek karar mekanizmaları üreten sistemlere olan ihtiyacın oldukça arttığını görmekteyiz. MOODLE sistemi ve farklı uzaktan eğitim sistemleri forum sistemleri ile metin madenciliği yapacak, yani veri işleme isteyecek bireyler için yol gösterici olacaktır. Metin madenciliği alanının duygu analizi modeli örnek uygulaması geliştirilmiştir.
Anahtar Kelimeler: Metin madenciliği, MOODLE, uzaktan eğitim, duygu analizi.
A TEXT MINING APPLICATION IN DISTANCE EDUCATION SYSTEMS
Abstract
The general purpose of the study is to create a text mining application with the data obtained from the forum systems of distance education software. MOODLE distance education system was used as the training system and It was explained by installing on the web address “www.enerjikaynaklari.info”. MOODLE distance education system is actively used in universities, educational institutions, in-house trainings and personal projects worldwide. A wide range of information can be found in this study, from the installation of MOODLE to its publication on the Internet, theme installation, adding course content, creating activities and security
10
Avcı UfUk YıLMAZ, ZAfer ASLAN
settings. Text mining application will be developed with the data obtained from the forum activity in MOODLE system. We see that the need for systems that produce decision mechanisms by processing data is increasing. Especially in an area such as education, it must be used to ensure our development. The MOODLE system and the different distance education systems will provide text mining with forum systems, which will guide the individuals who want to process data. A sample application was developed with the sentiment analysis model of the text mining field.
Keywords: Text mining, MOODLE, e-learning, sentiement analysis.
1. GİRİŞ
İnsanların yoğun çalışma temposu olması nedeniyle, zaman ve maliyet gibi faktörlerden kazanç sağlamak için uzaktan eğitim sistemi ile bilgi aktarılması oldukça önemlidir. Günümüzde örgün eğitimin dışında gerek örgün eğitimi destekleyici gerekse örgün eğitime başka bir seçenek olarak uzaktan eğitim önemini gittikçe arttırmaktadır (Elmas, Doğan ve Biroğul, 2008). Eğitim her konu da olabilir. Geliştireceğimiz uzaktan eğitim sisteminde de, sizlerin de olacağı gibi bir temaya yani eğitim konusuna ihtiyacımız olacaktır. Temamız “yeni enerji kaynakları” olarak belirlenmiştir. Böylece insanlar kolayca, gelecekleri olan yeni enerji kaynakları hakkında bilgilere sahip olabilecek ve paylaşımlar yapabileceklerdir. Aynı zamanda MOODLE Uzaktan Eğitim Sistemi’nin kurulması ve kullanımı hakkında detaylı bilgiye sahip olunacaktır. MOODLE’ın en önemli noktası açık kaynak kodlu olmasıdır. Böylece profesyonelce geliştirilmiş bir sistemi istenildiği gibi düzenlenebilir, hiçbir ücret ödemeden mükemmel online uzaktan eğitim sistemleri ortaya çıkarılabilir. Birçok dil desteği bulunmaktadır. MOODLE PHP yazılım dili ile geliştirilmiştir. Veritabanı ise MySQL ve PostgreSQL’dir. Eğitimin her alanı geleceğimiz için oldukça önemlidir. Bu nedenle eğitim sistemlerinin gelişimi de oldukça önemlidir. Çağımızın popüler alanlarından olan veri madenciliği ile MOODLE eğitim sistemini birleştirerek veri işlemesi yapılacaktır. Günümüzde birçok kaynaktan veri alıp bu verileri veritabanlarında saklayan kurumların amaçlarından biri de ham verileri bilgiye dönüştürmektir. Bu işlem yani veriyi bilgiye dönüştürme işlemi veri madenciliği olarak adlandırılmaktadır (Dener, Dörterler ve Orman, 2009). Sistem içerisinde bulunan forum etkinliği ile kullanıcıların eylemleri toplanacaktır. Veritabanından alınan veriler işlenerek, oluşturulan algoritmaya göre metin madenciliği ile işlenecektir. Forum içerisinde metinler analiz edilerek, API hizmeti ve CSV dosyası aracılığıyla duygu analizi yapılacaktır.
1.1 Tanımlar
Uzaktan eğitim
Bireylerin, yer ve zaman fark etmeden teknoloji altyapısını kullanarak eğitim aldığı sisteme uzaktan eğitim denir. Uzaktan eğitim oldukça önemlidir ve bu önem gün geçtikçe artmaktadır. Uzaktan eğitimin kullanılmasının sebepleri; nüfus artışı, maliyet, esnek zamanlarda kullanım olanağı sunması, mekân gerektirmemesi, tekrar edilebilir olması, aynı anda birçok kişiye hitap edebilme olanağı sağlaması, engelli bireyler için oldukça faydalı olması olarak sayılabilir. Durmadan artan nüfus ile beraber artık okulların sayısı yetersizleşmeye başlamıştır. Uzaktan eğitim sistemi ile mekân gerektirmeden düşük maliyet ile aynı
11
AURUM MÜHENDİSLİK SİSTEMLERİ VE MİMARLIK DERGİSİAURUM JOURNAL OF ENGINEERING SYSTEMS AND ARCHITECTURE
anda birçok kişiye eğitim verilebilir. Tam zamanlı çalışan insanların zaman bulamaması eğitim almaları konusunda en büyük engellerden biri olarak görünmektedir. Ancak uzaktan eğitim ile istenilen saatte ve zamanda eğitim alınabilir. Dersler kaçırılsa dâhil derslerin özetleri, sunum metinleri, kaynakları tekrar izlenebilir. Çoğu üniversitelerin tercih listelerinde uzaktan eğitim veren bölümlerin yer aldığını görebiliriz. Uzaktan eğitim süreci sonucunda öğrenciler diplomalarını alabilmektedir. Ancak uzaktan eğitimin bazı olumsuz yönleri de vardır. Bunlar; bilgisayar gereksinimi, Bilgisayar kullanmayı bilme gerekliliği, internete bağlı oluşu, uzaktan eğitimdeki bölüm çeşitliliğinin azlığı, öğrencilerin sosyal ortamdan uzaklaşması, yüz yüze eğitim alınamaması olarak sayılabilir. Bilgisayar ve internet olmadan uzaktan eğitim sistemine ulaşmamız imkânsızdır. Uzaktan eğitim sisteminin bir ekip işi olmasından dolayı bazı bölümlerde tam olarak ekip ve altyapı gereksinimleri sağlanamamıştır. Bu yetersizliklerden dolayı uzaktan eğitimdeki bölüm çeşitliliği örgün eğitimdeki bölüm çeşitliliğinden oldukça azdır. Örgün eğitim okul veya okul niteliği taşıyan kurumlarda, planlı olarak verilen eğitime denir. Bu alanda yaygın olarak kullanılan kısaltma ve terimler aşağıdaki gibi özetlenebilir;
- CMS (Content Management System): İçerik yönetim sistemi olarak adlandırılmaktadır.
- LMS (Learning Management System): Öğretim yönetim sistemi olarak adlandırılmaktadır.
- Senkron (Eş Zamanlı) Öğrenme: Teknoloji yardımıyla farklı ortamlarda olan kişilerin aynı anda eğitim verilmesine eş zamanlı öğrenme denir.
- Asenkron (Farklı Zamanlı) Öğrenme: Teknoloji yardımıyla farklı ortamlarda olan kişilerin farklı zamanlarda eğitim almasına farklı zamanlı öğrenme denir.
Metin madenciliği (Text mining)
Metin madenciliği bir veri madenciliği türüdür. Veri madenciliğinin kaynağı veridir. Veriyi işleyerek kararlar elde eder. Metin madenciliği için de işlenen veri metindir. Günümüzün en popüler alanlarından bir tanesidir. E-ticaret siteleri, bankacılık, siyaset gibi alanlarda aktif olarak kullanılmaktadır. Örneğin; online olarak olarak satılan bir ürün için, kullanıcılar tarafından yapılan yorumlar metin madenciliği ile analiz edilerek memnuniyet düzeyi ölçülebilir.
MOODLE
MOODLE açık kaynak kodlu olarak geliştirilmiş bir uzaktan eğitim (e-learning) sistemidir. “Modular Object Oriented Dynamic Learning Environment” kelimelerinin baş harflerinden türetilmiştir. Kelime anlamı olarak “Esnek Nesne Yönelimli Dinamik Öğrenme Ortamı” olarak açıklayabiliriz. Açık kaynak kodlu olması sayesinde ücretsiz olarak düzenlemeler sağlayabilir ve sistemi geliştirilebilir. MOODLE sistemi tüm Dünya’ya açık bir sistem olduğu için birçok dil desteği bulunmaktadır. 75 farklı dil seçeneği bulunmaktadır. PHP yazılım dili ile geliştirilmiş, veritabanında ise MySQL ve PostgreSQL kullanılmıştır. Açık kaynak kodlu olduğundan test kitlesi oldukça fazladır ve herhangi bir güvenlik açığı kolayca bulunup çok hızlı bir şekilde giderilebilir. Birçok büyük eğitim kurumu, üniversiteler genellikle uzaktan eğitim sistemlerini MOODLE ile oluşturmuşlardır. Tüm eğitim kurumlarının uzaktan eğitim ihtiyacını MOODLE ile çözülebilir. Bu kurumlara örnek olarak;
12
Avcı UfUk YıLMAZ, ZAfer ASLAN
- Boğaziçi University Courseware – “moodle.boun.edu.tr”
- İstanbul Aydın Üniversitesi – “UZEP”
- Koç School Virtual Learning Environment – “moodle.koc.k12.tr”
- Lycee Saint Benoit – “www2.sb.k12.tr”
- Terakki MOODLE – “lms.terakki.org.tr”
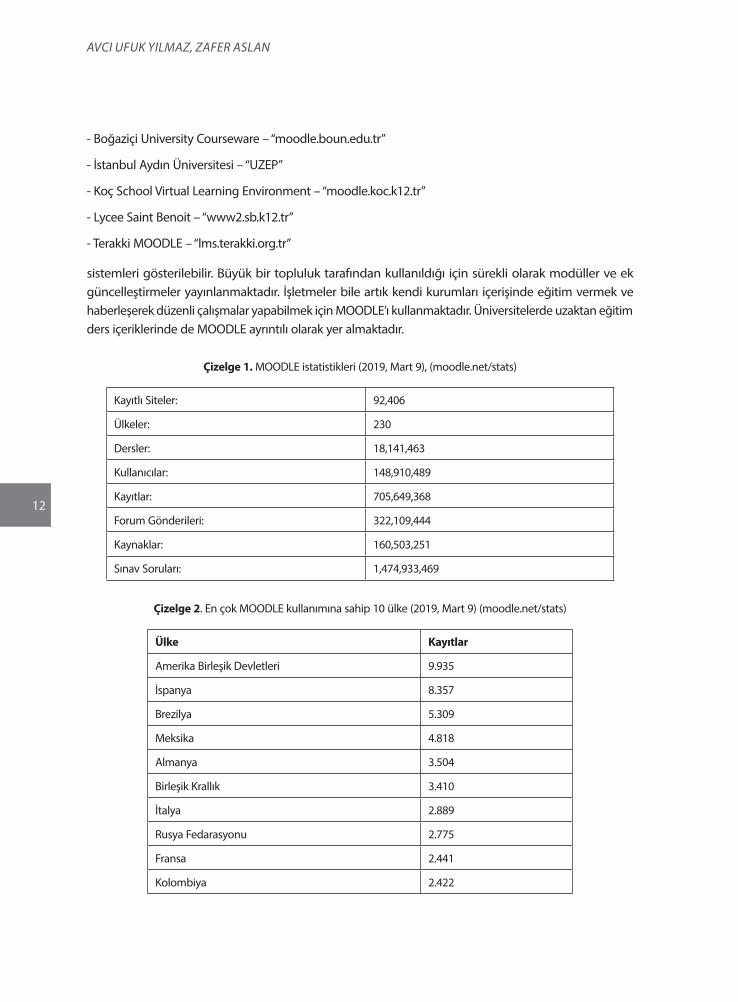
sistemleri gösterilebilir. Büyük bir topluluk tarafından kullanıldığı için sürekli olarak modüller ve ek güncelleştirmeler yayınlanmaktadır. İşletmeler bile artık kendi kurumları içerişinde eğitim vermek ve haberleşerek düzenli çalışmalar yapabilmek için MOODLE’ı kullanmaktadır. Üniversitelerde uzaktan eğitim ders içeriklerinde de MOODLE ayrıntılı olarak yer almaktadır.
Çizelge 1. MOODLE istatistikleri (2019, Mart 9), (moodle.net/stats)
Kayıtlı Siteler: 92,406
Ülkeler: 230
Dersler: 18,141,463
Kullanıcılar: 148,910,489
Kayıtlar: 705,649,368
Forum Gönderileri: 322,109,444
Kaynaklar: 160,503,251
Sınav Soruları: 1,474,933,469
Çizelge 2. En çok MOODLE kullanımına sahip 10 ülke (2019, Mart 9) (moodle.net/stats)
Ülke Kayıtlar
Amerika Birleşik Devletleri 9.935
İspanya 8.357
Brezilya 5.309
Meksika 4.818
Almanya 3.504
Birleşik Krallık 3.410
İtalya 2.889
Rusya Fedarasyonu 2.775
Fransa 2.441
Kolombiya 2.422
13
AURUM MÜHENDİSLİK SİSTEMLERİ VE MİMARLIK DERGİSİAURUM JOURNAL OF ENGINEERING SYSTEMS AND ARCHITECTURE
RSS (Rich Site Summary)
RSS ile çeşitli internet siteleri arasında bilgi akışı yani içerik besleme yapılabilir. Genellikle haber ve blog siteleri tarafından kullanılır. Örneğin bir haber sitesi üzerinden son dakika haberleri farklı bir site üzerine anlık olarak çekilebilir. RSS dosyaları ilk olarak NetScape firması tarafından geliştirilmeye başlanmıştır. Dosya uzantıları “.rss” ve “.xml” olmaktadır. RSS ile içerikler çok daha fazla kitleye ulaşabileceğinden web siteleri için yararlı olacaktır. RSS içeriği oluşturulurken kullanılması zorunlu bazı etiketler vardır. Bunlar;
<title> : RSS’e başlık ekleyebileceğimiz etikettir.
<description> : RSS açıklaması bu etiketle eklenir.
<link> : RSS veren sitenin, bağlantı linkinin belirtildiği etikettir.
<channel> : Başlık, açıklama ve link gibi bilgileri bu etikette verebilirsiniz.
CSV (Comma Separated Values)
CSV uzantılı dosyalar genellikle veritabanı verilerini metin olarak dışarı aktarmak için kullanılır. Verileri virgülle ayırarak, belirli bir düzende saklar. Excel programı ile uyumlu çalıştığı için genelde tercih edilir. Virgül ile verilerin ayrılması uzantının adını belirlemede kaynak olmuştur.
API (Application Programming Interface)
API, kelime anlamı olarak uygulama programlama arayüzü demektir. Bir yazılımdan diğer bir yazılıma, tanımlanmış sınırlandırmalar ve özellikler ile veri alışverişi gerçekleşmesi sağlayan yapıdır. Birçok büyük firma kendi API’lerini oluşturarak kendi altyapılarını farklı yazılımlar ile paylaşır.
2. METİN MADENCİLİĞİ
Veri madenciliği (Data Mining)
Günümüzde birçok kaynaktan veri alıp bu verileri veritabanlarında saklayan kurumların amaçlarından biri de ham verileri bilgiye dönüştürmektir. Bu işlem yani veriyi bilgiye dönüştürme işlemi veri madenciliği olarak adlandırılmaktadır (Dener, Dörterler ve Orman, 2009) Büyük firmaların artık veri işlemeye büyük yatırımlar yaptığını, yapılan yeni projelerin veri işleme odaklı olduğunu görmekteyiz. Veri madenciliğinin günümüzün ve geleceğimizin en popüler, değeri yükselen alanlarından biri olduğuna emin olabiliriz. Veri madenciliği genellikle büyük veriler ile yapılır. E-ticaret, muhasebe, bankacılık, tıp, mühendislik gibi her türlü alanda kullanılmaktadır. Özellikle e-ticaret alanında kullanıcıların satın alma alışkanlıklarını analiz ederek, kullanıcılar karşısına ilgi duyduğu ürünleri çıkarır ve firmaların çok daha fazla satış yapmasını sağlar. Veri madenciliğinde kullanılan en popüler yazılım dilleri Python ve R dilidir. Veri, bir veri tabanından çekilip sınıflanarak ayıklanır. Belirtilen algoritmaya göre ayıklanarak işlenir ve sonucunda karar verilir.
14
Avcı UfUk YıLMAZ, ZAfer ASLAN
Metin madenciliği (Text Mining)
Metin madenciliği, veri kaynağı olarak metni kabul eden veri madenciliği alanıdır. Metini işleyerek ortaya kararlar yani sonuçlar çıkarır. Örneğin sosyal medyada herhangi bir paylaşıma gelen yorumları bilgisayara analiz ettirerek, yorumların genel olarak olumlu veya olumsuz olduğu sonucuna varabiliriz. Özelikle çok daha büyük verilerde metin madenciliğinin rolü ve önemli daha çok artacaktır. Metin madenciliği ile zamandan ve maliyetten tasarruf sağlanır.
Online metin madenciliği uygulamaları
Metin madenciliği alanının popülerleşmesi ile birlikte birçok uygulama geliştirilmiştir. Masaüstü uygulamalar, kaynak dosyalar dışında online sistemler ortaya çıkarılarak kullanım oldukça kolaylaştırılmıştır. API hizmeti kullanarak, web sitesi uygulaması ve metin madenciliği yapılmak istenilen sistemler arasında kolayca bağlantı sağlanabilir ve anlık işlemler yapılabilir. API hizmeti dışında çoğu online sistemler XLS, CSV, Google Sheets, Zapier, Rapidminer, Zendesk gibi uygulama ve formatları da desteklemektedir. Bazı online metin madenciliği uygulamaları olarak Monkey Learn, Microsoft Azure, Gavagai, Text Mining Online, Meaning Cloud, Monkey Learn olarak sayılabilir. Desteklenen metin madenciliği modelleri aşağıdaki gibidir.
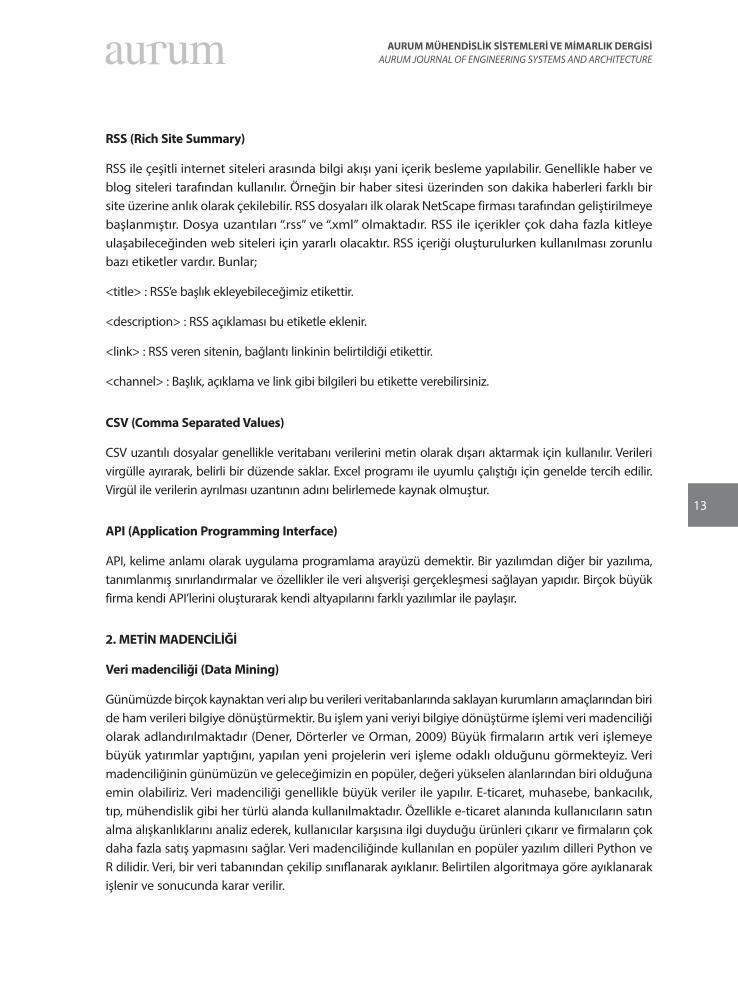
Duygu analizi (Sentiment analysis)
Hayatın her alanında alınan hizmetler, yaşanılan olaylar hakkında çıkarımlar, yorumlar yapılır. İnternetin yayılması ile birlikte insanlar duygularını tüm dünya ile paylaşabilmekte ve büyük bir yorum havuzu oluşturmaktadırlar. Bu yorumların veya paylaşımların hızlıca analiz edilmesi oldukça önemlidir. Metin madenciliğinin duygu analizi modeli ile yorumların ve paylaşımların olumlu, nötr (kararsız, ne iyi, ne de kötü) veya olumsuz olduğu hızlıca analiz edilebilir. Ürün memnuniyetleri, sosyal medya yorumları, anket cevapları ve benzer işlemler için oldukça yaygın olarak kullanılır.
Şekil 1. Duygu analizi örnek işlem
15
AURUM MÜHENDİSLİK SİSTEMLERİ VE MİMARLIK DERGİSİAURUM JOURNAL OF ENGINEERING SYSTEMS AND ARCHITECTURE
Duygu analizi için işlem yapılırken kapsam seviyeleri belirlenebilir.
Cümle Düzeyinde Duygu Analizi: Tek bir cümle kapsamında duygu analizi işlemi gerçekleştirir.
Belge Düzeyinde Duygu Analizi: Belgenin içeriğinin tümünde duygu analizi işlemi gerçekleştirilir.
Alt Cümle Düzeyinde Duygu Analizi: Bir cümle içerisinde bulunan alt ifadeleri analiz eder.
Duygu analizi işlem basamakları şöyledir;
1) Kelime Tanımlama: İyi kelimeler, kötü kelimeler, en iyi kelimeler, en kötü kelimeler gibi hedefe yönelik kelime tanımları yapılır.
2) Metin Analizi: Cümle içerisinde tanımlanan kelimeler taranır. Metin içerisinde iyi kelimeler, en iyi kelimeler, kötü kelimeler, en kötü kelimelerin toplam sayısı alınır.
3) Sonuç ve Karar: İyi kelimeler ve en iyi kelimelerin (pozitif) sayısı kötü kelimeler ve en kötü kelimeler (negatif) sayısından fazla ise duygu analizi olumlu yönde olacaktır. Tam tersi bir durumda ise duygu analizi olumsuz olumsuz olacaktır. İki duruma da uymuyorsa nötr sonuç döndürülecektir.
3. UYGULAMA
Forum RSS ayarları
MOODLE forum etkinliği içerisinde RSS hizmetini desteklemektedir. Ancak mevcut ayarlarda RSS ayarları güvenlik nedeniyle kapalıdır. Forum sistemlerinde RSS hizmetini açmak için yönetim panelinden “Site Yönetimi > Eklentiler > Etkinlik Eklentileri > Forum” yolları izlenir.
RSS içeriklerini etkinleştir: Forum içerisinde RSS içeriklerinin etkinleştirilmesini sağlar. Her bir forum için tek tek ayar yapmak gerekir.
RSS besleme türü: RSS içeriğinin türünü ayarlar.
RSS son makale sayısı: Varsayılan makale sayısını ayarlar. “0” olarak tanımlanırsa herhangi bir sınırlandırılma olmaz. Gerekli işlemler sağlandıktan sonra “Değişiklikleri kaydet” butonuna tıklanır.
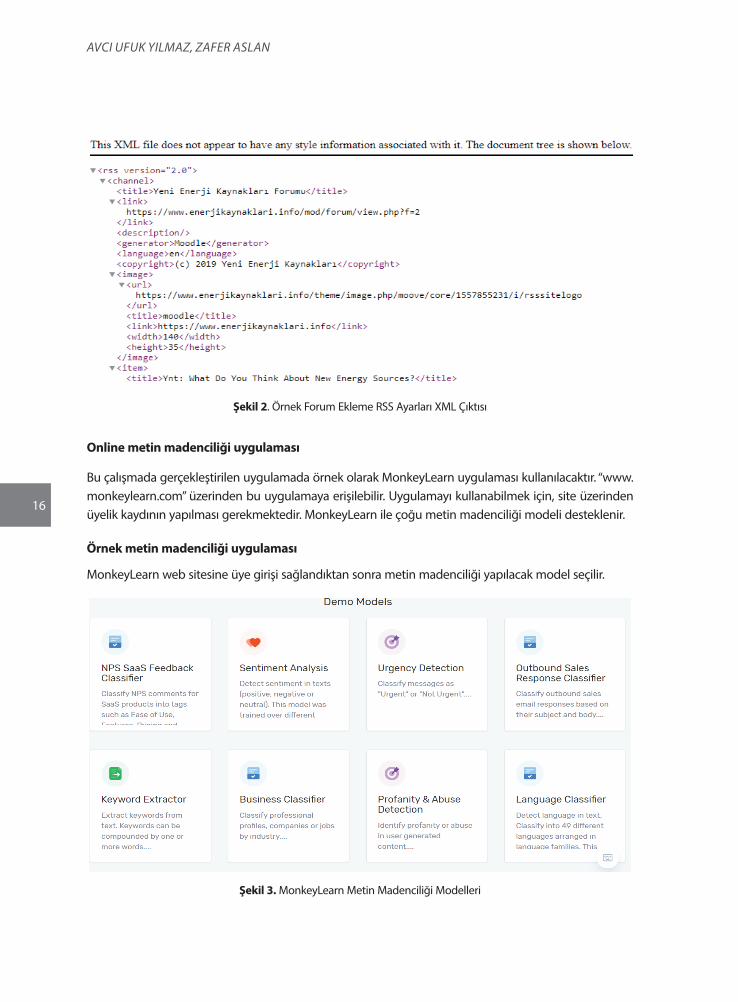
Forum eklenirken RSS sekmesi altından RSS beslemesi türü seçilir ve yakında zamandaki RSS makale sayısı belirlenir. RSS linkine ulaşmak için forum sayfasına tıklandıktan sonra sağ üst köşede bulunan çark simgesine tıklanır. Buradan açılan ekranda bulunan menüye tıklanır. RSS dosyası açılacaktır. RSS dosyası “.xml” formatı ile otomatik olarak link yapısı oluşturularak açılır. Bu link ile beraber farklı yazılımlara veri akışı sağlanabilir.
16
Avcı UfUk YıLMAZ, ZAfer ASLAN
Şekil 2. Örnek Forum Ekleme RSS Ayarları XML Çıktısı
Online metin madenciliği uygulaması
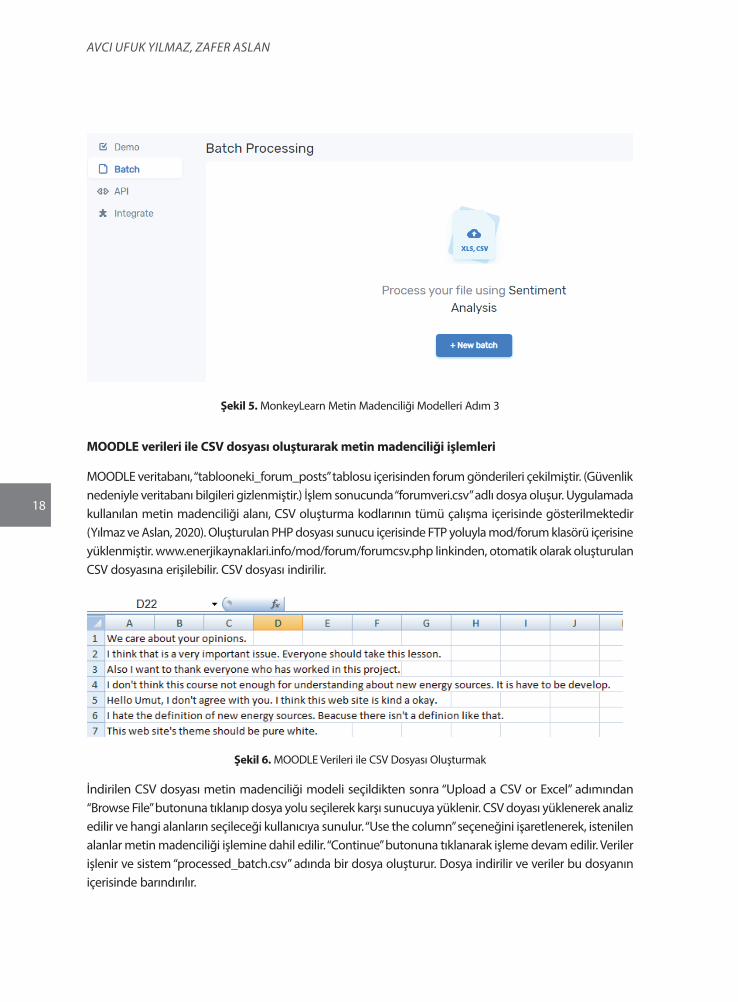
Bu çalışmada gerçekleştirilen uygulamada örnek olarak MonkeyLearn uygulaması kullanılacaktır. “www.monkeylearn.com” üzerinden bu uygulamaya erişilebilir. Uygulamayı kullanabilmek için, site üzerinden üyelik kaydının yapılması gerekmektedir. MonkeyLearn ile çoğu metin madenciliği modeli desteklenir.
Örnek metin madenciliği uygulaması
MonkeyLearn web sitesine üye girişi sağlandıktan sonra metin madenciliği yapılacak model seçilir.
Şekil 3. MonkeyLearn Metin Madenciliği Modelleri

17
AURUM MÜHENDİSLİK SİSTEMLERİ VE MİMARLIK DERGİSİAURUM JOURNAL OF ENGINEERING SYSTEMS AND ARCHITECTURE
Metin madenciliği modeli içerisinde veri işlenmesi gerçekleştirmek için öncelikle veri aktarımının sağlanması gerekir. Veri aktarımı kolayca sağlamak için API, Zapier, Google Sheets, Rapidminer, Zendesk entegrasyonları kullanılabilir. Model ID ve Your API Key bilgileri kullanıcıya özel bilgilerdir. Bu bilgiler entegrasyon aşamasında gereklidir. Bu nedenle Model ID ve Your API Key bilgilerine dikkat edilmelidir.
Şekil 4. MonkeyLearn Metin Madenciliği Modelleri Adım 2
Eğer .XLS ve .CSV uzantılı dosyalarda, işlenmeye hazır veriler mevcutsa “Batch” kategorisinden “+New batch” butonuna tıklanarak veriler içeri aktarılır.
18
Avcı UfUk YıLMAZ, ZAfer ASLAN
Şekil 5. MonkeyLearn Metin Madenciliği Modelleri Adım 3
MOODLE verileri ile CSV dosyası oluşturarak metin madenciliği işlemleri
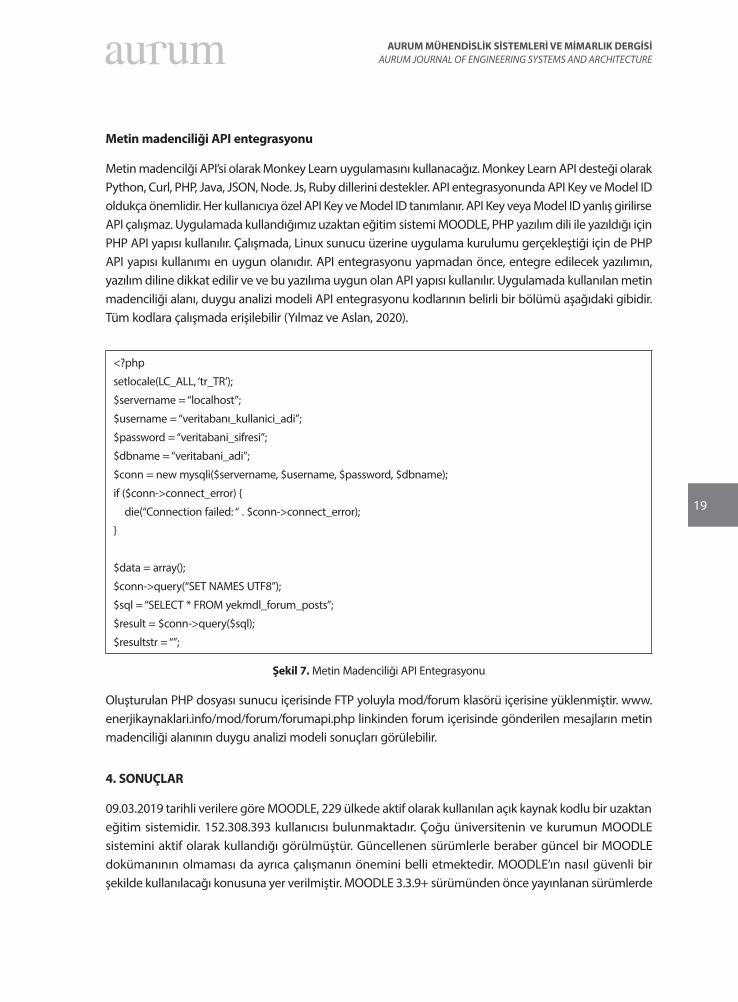
MOODLE veritabanı, “tablooneki_forum_posts” tablosu içerisinden forum gönderileri çekilmiştir. (Güvenlik nedeniyle veritabanı bilgileri gizlenmiştir.) İşlem sonucunda “forumveri.csv” adlı dosya oluşur. Uygulamada kullanılan metin madenciliği alanı, CSV oluşturma kodlarının tümü çalışma içerisinde gösterilmektedir (Yılmaz ve Aslan, 2020). Oluşturulan PHP dosyası sunucu içerisinde FTP yoluyla mod/forum klasörü içerisine yüklenmiştir. www.enerjikaynaklari.info/mod/forum/forumcsv.php linkinden, otomatik olarak oluşturulan CSV dosyasına erişilebilir. CSV dosyası indirilir.
Şekil 6. MOODLE Verileri ile CSV Dosyası Oluşturmak
İndirilen CSV dosyası metin madenciliği modeli seçildikten sonra “Upload a CSV or Excel” adımından “Browse File” butonuna tıklanıp dosya yolu seçilerek karşı sunucuya yüklenir. CSV doyası yüklenerek analiz edilir ve hangi alanların seçileceği kullanıcıya sunulur. “Use the column” seçeneğini işaretlenerek, istenilen alanlar metin madenciliği işlemine dahil edilir. “Continue” butonuna tıklanarak işleme devam edilir. Veriler işlenir ve sistem “processed_batch.csv” adında bir dosya oluşturur. Dosya indirilir ve veriler bu dosyanın içerisinde barındırılır.
19
AURUM MÜHENDİSLİK SİSTEMLERİ VE MİMARLIK DERGİSİAURUM JOURNAL OF ENGINEERING SYSTEMS AND ARCHITECTURE
Metin madenciliği API entegrasyonu
Metin madencilği API’si olarak Monkey Learn uygulamasını kullanacağız. Monkey Learn API desteği olarak Python, Curl, PHP, Java, JSON, Node. Js, Ruby dillerini destekler. API entegrasyonunda API Key ve Model ID oldukça önemlidir. Her kullanıcıya özel API Key ve Model ID tanımlanır. API Key veya Model ID yanlış girilirse API çalışmaz. Uygulamada kullandığımız uzaktan eğitim sistemi MOODLE, PHP yazılım dili ile yazıldığı için PHP API yapısı kullanılır. Çalışmada, Linux sunucu üzerine uygulama kurulumu gerçekleştiği için de PHP API yapısı kullanımı en uygun olanıdır. API entegrasyonu yapmadan önce, entegre edilecek yazılımın, yazılım diline dikkat edilir ve ve bu yazılıma uygun olan API yapısı kullanılır. Uygulamada kullanılan metin madenciliği alanı, duygu analizi modeli API entegrasyonu kodlarının belirli bir bölümü aşağıdaki gibidir. Tüm kodlara çalışmada erişilebilir (Yılmaz ve Aslan, 2020).
<?php
setlocale(LC_ALL, ‘tr_TR’);
$servername = “localhost”;
$username = “veritabanı_kullanici_adi”;
$password = “veritabani_sifresi”;
$dbname = “veritabani_adi”;
$conn = new mysqli($servername, $username, $password, $dbname);
if ($conn->connect_error) {
die(“Connection failed: “ . $conn->connect_error);
}
$data = array();
$conn->query(“SET NAMES UTF8”);
$sql = “SELECT * FROM yekmdl_forum_posts”;
$result = $conn->query($sql);
$resultstr = “”;
Şekil 7. Metin Madenciliği API Entegrasyonu
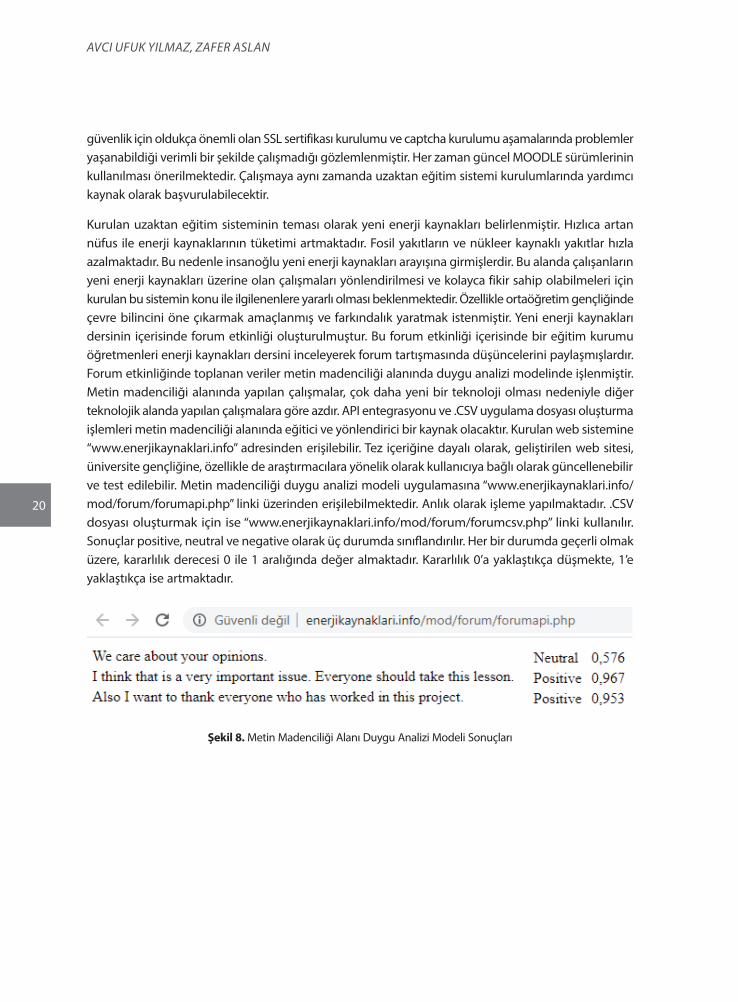
Oluşturulan PHP dosyası sunucu içerisinde FTP yoluyla mod/forum klasörü içerisine yüklenmiştir. www.enerjikaynaklari.info/mod/forum/forumapi.php linkinden forum içerisinde gönderilen mesajların metin madenciliği alanının duygu analizi modeli sonuçları görülebilir.
4. SONUÇLAR
09.03.2019 tarihli verilere göre MOODLE, 229 ülkede aktif olarak kullanılan açık kaynak kodlu bir uzaktan eğitim sistemidir. 152.308.393 kullanıcısı bulunmaktadır. Çoğu üniversitenin ve kurumun MOODLE sistemini aktif olarak kullandığı görülmüştür. Güncellenen sürümlerle beraber güncel bir MOODLE dokümanının olmaması da ayrıca çalışmanın önemini belli etmektedir. MOODLE’ın nasıl güvenli bir şekilde kullanılacağı konusuna yer verilmiştir. MOODLE 3.3.9+ sürümünden önce yayınlanan sürümlerde
20
Avcı UfUk YıLMAZ, ZAfer ASLAN
güvenlik için oldukça önemli olan SSL sertifikası kurulumu ve captcha kurulumu aşamalarında problemler yaşanabildiği verimli bir şekilde çalışmadığı gözlemlenmiştir. Her zaman güncel MOODLE sürümlerinin kullanılması önerilmektedir. Çalışmaya aynı zamanda uzaktan eğitim sistemi kurulumlarında yardımcı kaynak olarak başvurulabilecektir.
Kurulan uzaktan eğitim sisteminin teması olarak yeni enerji kaynakları belirlenmiştir. Hızlıca artan nüfus ile enerji kaynaklarının tüketimi artmaktadır. Fosil yakıtların ve nükleer kaynaklı yakıtlar hızla azalmaktadır. Bu nedenle insanoğlu yeni enerji kaynakları arayışına girmişlerdir. Bu alanda çalışanların yeni enerji kaynakları üzerine olan çalışmaları yönlendirilmesi ve kolayca fikir sahip olabilmeleri için kurulan bu sistemin konu ile ilgilenenlere yararlı olması beklenmektedir. Özellikle ortaöğretim gençliğinde çevre bilincini öne çıkarmak amaçlanmış ve farkındalık yaratmak istenmiştir. Yeni enerji kaynakları dersinin içerisinde forum etkinliği oluşturulmuştur. Bu forum etkinliği içerisinde bir eğitim kurumu öğretmenleri enerji kaynakları dersini inceleyerek forum tartışmasında düşüncelerini paylaşmışlardır. Forum etkinliğinde toplanan veriler metin madenciliği alanında duygu analizi modelinde işlenmiştir. Metin madenciliği alanında yapılan çalışmalar, çok daha yeni bir teknoloji olması nedeniyle diğer teknolojik alanda yapılan çalışmalara göre azdır. API entegrasyonu ve .CSV uygulama dosyası oluşturma işlemleri metin madenciliği alanında eğitici ve yönlendirici bir kaynak olacaktır. Kurulan web sistemine “www.enerjikaynaklari.info” adresinden erişilebilir. Tez içeriğine dayalı olarak, geliştirilen web sitesi, üniversite gençliğine, özellikle de araştırmacılara yönelik olarak kullanıcıya bağlı olarak güncellenebilir ve test edilebilir. Metin madenciliği duygu analizi modeli uygulamasına “www.enerjikaynaklari.info/mod/forum/forumapi.php” linki üzerinden erişilebilmektedir. Anlık olarak işleme yapılmaktadır. .CSV dosyası oluşturmak için ise “www.enerjikaynaklari.info/mod/forum/forumcsv.php” linki kullanılır. Sonuçlar positive, neutral ve negative olarak üç durumda sınıflandırılır. Her bir durumda geçerli olmak üzere, kararlılık derecesi 0 ile 1 aralığında değer almaktadır. Kararlılık 0’a yaklaştıkça düşmekte, 1’e yaklaştıkça ise artmaktadır.
Şekil 8. Metin Madenciliği Alanı Duygu Analizi Modeli Sonuçları
21
AURUM MÜHENDİSLİK SİSTEMLERİ VE MİMARLIK DERGİSİAURUM JOURNAL OF ENGINEERING SYSTEMS AND ARCHITECTURE
5. KAYNAKLAR
Al-Ajlan, A., ve Zedan, H. 2008. Why MOODLE., In 2008 12th IEEE Internation Workshop on Future Trends of Distributed Computing Systems (pp. 58-64). IEEE
Aslan, Z., Zontul, M., Tokgözlü, A., Kaynar, O., ve Altunç, M. 1987. Wind Speed And Energy Potential Analyses., İstanbul Aydın Üniversitesi Dergisi, 2 (7), 116-136.
Agarwal, A., Xie, B., Vovsha, I., Rambow, O., ve Passonneau, R. 2011. Sentiement Analysis of Twitter Data., In Proceedings of the Workshop on Language in Social Media (LSM 2011), (pp. 30-38).
Dener, M., Dörterler, M., ve Orman, A. 2009. Açık Kaynak Kodlu Veri Madenciliği Programları: WEKA’ da Örnek Uygulama., Akademik Bilişim, 9, 11 - 13
Dolgun, M Ozgur., Özdemir, T Güzel., ve Oğuz, D. 2009. Veri Madenciliği’nde Yapısal Olmayan Verinin Analizi: Metin ve Web Madenciliği., İstatistikçiler Dergisi: İstatistik ve Aktüerya, 2(2), 48-58.
Elmas, Ç., Doğan, N,. Biroğul, S,. ve Koç, M.S. 2008. MOODLE Eğitim Yönetim Sistemi ile Örnek Bir Dersin Uzaktan Eğitim Uygulaması., INTERNATIONAL JOURNAL OF INFORMATICS TECHNOLOGIES, 1(2), 53-62.
Güneş, A., ve Güneş, G. 2016. Dersi Gönüllü veya Zorunlu Olarak Uzaktan Eğitime Dayalı Alan Öğrencilerin Performanslarının Karşılaştırılması., 2. Uluslararası Eğitim, Uzaktan Eğitim ve Eğitim Teknolojileri Kongresi, Bildiriler Kitabı, Antalya.
Kaynar, O., Yıldız, M., Görmez, Y., ve Albayrak, A. 2016. Makine Öğrenmesi Yöntemleri ile Duygu Analizi., International Atrificial Intelligence and Data Processing Symposium IDAP’16, Malatya.
Koç, E., ve Şenel, M. C. 2013. Dünyada ve Türkiye’de Enerji Durumu - Genel Değerlendirme., Mühendis ve Makine, 54(639), 32-44.
Özarslan, Y. 2008. Uzaktan Eğitim Uygulamaları için Açık Kaynak Kodlu Öğrenme Yönetim Sistemleri, XIII. Türkiye’de İnternet Konferansı., Orta Doğu Teknik Üniversitesi, Ankara, 55-60.
Şeker S. E., ve Al-Naami, K. 2013. Sentimental Analysis on Turkish Blogs via Ensemble Classifier., Proceedings Of The 2013 International Conference On Data Mining, ISBN:1-60132-239-9, DMIN. 10-16.
MOODLE (2018, Kasım 10). Kasım 10, 2018 tarihinde www.moodle.org:
http://www.moodle.net/stats, adresinden alındı.
www.bilgisayarkavramlari.sadievrenseker.com, (2019, Aralık 9).

23
AURUM MÜHENDİSLİK SİSTEMLERİ VE MİMARLIK DERGİSİAURUM JOURNAL OF ENGINEERING SYSTEMS AND ARCHITECTURE
Cilt 4, Sayı 1 | Yaz 2020Volume 4, No 1 | Summer 2020, 23-36
ARAŞTIRMA MAKALESİ / RESEARCH ARTICLE
GÜNEŞ ENERJİSİ POTANSİYELİNİN ÇOKLU LİNEER REGRESYON VE YAPAY SİNİR AĞLARI İLE MODELLENMESİ
Durhan GABRALI1
1İAÜ, Fen Bilimleri Enstitüsü, Bilgisayar Mühendisliği Programı, Yüksek Lisans Öğrencisi, İstanbul [email protected] ORCID No: 0000-0002-4920-7876
Zafer ASLAN2
2İAÜ, Mühendislik Fakültesi, Bilgisayar Mühendisliği Bölümü, İstanbul [email protected] ORCID No: 0000-0001-7707-7370
GELİŞ TARİHİ/RECEIVED DATE: 08.08.2019 KABUL TARİHİ/ACCEPTED DATE: 27.08.2020
Özet
Son yıllarda fosil yakıt kaynaklarının tükenmeye başlaması ve çevresel kaygılar nedeniyle yenilenebilir enerji kaynaklarının mevcut enerji üretiminde kullanım payı giderek artmaktadır. En önemli yenilenebilir enerji kaynaklarından olan güneş enerjisi; temiz, sürdürülebilir ve çevre dostu enerji kaynağı olması nedeniyle öne çıkmaktadır. Bu nedenle mevcut güneş enerji sistemlerinin işletimi veya yeni sistemlerin kurulumu sırasında, ilgili bölgelerin güneş radyasyonu özelliklerinin bilinmesi ve tahmin edilmesi çok önemlidir. Bu çalışmada, İstanbul Büyükçekmece İlçesi Eskice Bölgesine ait 2016 yılı meteorolojik verileri (güneş radyasyonu, rüzgâr şiddeti, UV radyasyon indis, toprak üstü 5 cm sıcaklık, sıcaklık 2 m, rüzgâr yönü) kullanılarak güneş radyasyonu için ileriye yönelik kısa ve orta vadeli bir tahmin çalışması yapılmıştır. Modelleme için Çoklu Lineer Regresyon (ÇLR) ve esnek hesaplama yöntemlerinden biri olan Yapay Sinir Ağları (YSA) kullanılmıştır. Geliştirilen tüm modeller istatistiksel olarak karşılaştırılmıştır. Sonuçlar güneş radyasyonu tahmininde YSA modellerinin ÇLR modellerinden daha başarılı olduğunu göstermektedir. Mevsimsel olarak güneş radyasyonu için en başarılı tahmin Haziran ayında elde edilmiştir. Bu aşamada kullanılan YSA modeli ile güneş radyasyonu için R, nRMSE ve MAPE değerleri sırasıyla 0.912, %48.5, %28.21 olarak hesaplanmıştır. Bu verilere dayalı olarak seçilen inceleme bölgesinde ve Haziran ayında güneş enerji potansiyelinin yeter güvenirlik ile tahmin edilebileceği vurgulanabilir.
Anahtar Kelimeler: Yapay Sinir Ağları, Güneş Enerjisi, Güneş Radyasyonu Tahmini, Kısa Vadeli Tahmin, Çoklu Lineer Regresyon
MODELING OF SOLAR ENERGY POTENTIAL WITH MULTIPLE LINEER REGRESSION AND ARTIFICIAL NEURAL NETWORKS
Abstract
In recent years due to the depletion of fossil fuel resources and environmental concerns, the share of renewable energy resources in the current energy production show an increasing trend. Solar energy one of the most important renewable energy sources; is a clean, sustainable and environmentally friendly energy
24
Durhan GaBraLI, Zafer aSLan
source. Therefore it is very important to know and estimate the solar radiation properties of the respective regions during the operation of existing solar energy systems or the installation of new systems. In this study meteorological data of 2016 (solar radiation, wind intensity, UV radiation index, surface 5 cm temperature, temperature 2 m, wind direction) belonging to Eskice region of Büyükçekmece District of Istanbul were used for a estimation solar radiation short and medium term. Multiple Linear Regression (MLR), and Artificial Neural Networks (ANN) which is one of the soft computing methods were used for modeling. All models were compared statistically. The results show that ANN models are more successful than MLR models in solar radiation estimation. Seasonally the most successful forecast for solar radiation was obtained in June. With the ANN model used in this stage for solar radiation R, nRMSE and MAPE values were calculated as 0.912, %48.5 and %28.21 respectively. Based on these data, it can be emphasized that solar energy potential can be estimated with sufficient reliability in the selected region and in June.
Keywords: Artificial Neural Networks, Solar Energy, Solar Radiation Estimation, Short Term Forecast, Multiple Linear Regression
1. GİRİŞ
Günümüzde global enerji ihtiyacının büyük bolümü fosil yakıt kaynaklarından karşılanmaktadır. Birincil enerji tüketimi %80 civarında fosil yakıt kaynaklarından sağlanırken geri kalanı yenilenebilir enerji kaynaklarından elde edilmektedir (Yılmaz ve Öziç, 2018). Fosil kaynaklı yakıt rezervleri ise kullanıma bağlı olarak her gecen gün azalmakta ve sınırlı rezervler yüzünden gelecek yakın bir zamanda biteceği öngörülmektedir (Rahman ve diğerleri, 2014). Sınırlı sayıda rezerve sahip olmaları ve çevreye verdikleri zararlı etkilerden dolayı fosil enerji kaynaklarına alternatif olarak yenilenebilir enerji kaynakları önem kazanmaktadır. Gelecek yıllarda yenilenebilir enerji kaynaklarının toplam enerji üretimindeki payının artacağı öngörülmektedir. Yenilenebilir enerji kaynakları içerisinde güneş enerjisi en önemli kaynaklardan biridir. Güneş enerjisi için de güneş radyasyonu önemli bir parametredir.
Türkiye coğrafi konumu nedeniyle güneş enerji potansiyeli yüksek olan bir ülkedir. Türkiye’nin Güneş Enerjisi Potansiyeli Atlasına (GEPA) göre yıllık ortalama toplam güneş ışınımının en yüksek olduğu bölgeler Güneydoğu Anadolu ve Akdeniz bölgeleri olmakla beraber Türkiye’deki hemen hemen her bölgede güneş enerji sistemleri verimli bir şekilde kullanılabilir (Kılıç, 2015). Bu çalışmada Marmara Bölgesinde bulunan İstanbul İlindeki belirli bir bölgede geleneksel istatistiksel yöntemler ve YSA kullanarak değişik meteorolojik parametrelere bağlı olarak güneş radyasyonu için tahmin modellemesi yapılmıştır.
Bilim adamları ve araştırmacılar şimdiye kadar güneş radyasyonunun ileriye yönelik tahmini için birçok araştırma yapmışlardır. Yapılan literatür taraması bu konuda çok sayıda yöntemin kullanıldığını göstermektedir. Sun ve diğerleri (2018a) güneş radyasyonu tahmin yöntemlerini matematik ve istatistik tabanlı geleneksel yöntemler, sayısal hava tahmini ve makine öğrenmesi olmak üzere üç kategoriye ayırmışlardır. Matematik ve istatistik tabanlı geleneksel yöntemler şunları içerir; regresyon analizi, zaman serileri analizi, gri veya kara kutu teorisi, bulanık teori, dalgacık analizi ve Kalman filtresi. Sayısal hava tahmini performanslı bilgisayarların meteorolojik verileri kullanarak karmaşık denklemleri çözmesi ile gerçekleştirilir. Büyük veri madenciliğinin gelişmesiyle beraber makine öğrenmesi teknikleri günümüzde büyük ilgi görmektedir. Örneğin yapay sinir ağları, destek vektör makineleri (SVM) ve sezgisel akıllı optimizasyon algoritmaları güneş radyasyonu tahmininde yaygın olarak kullanılmaktadır. Esnek hesaplama yöntemlerini içeren
25
AURUM MÜHENDİSLİK SİSTEMLERİ VE MİMARLIK DERGİSİAURUM JOURNAL OF ENGINEERING SYSTEMS AND ARCHITECTURE
makine öğrenmesi tekniklerinin tahmin yöntemi olarak birçok araştırmacı tarafından kullanıldığı ve bazı yönlerden diğer yöntemlerden üstün olduğu yapılan literatür taramasında görülmüştür.
Erdil ve Arçaklıoğlu (2013) Türkiye’de farklı ölçüm istasyonlarından elde edilmiş boylam, rakım, ay, günlük minimum ve maksimum nem, ortalama güneşleme süresi, günlük minimum ve maksimum sıcaklık ile basınç verilerini girdi olarak kullanan ve günlük güneş radyasyonunu tahmin eden yapay sinir ağı modeli kullanmışlardır. Test sonuçlarında R2 değeri 0.997 ve ortalama yüzde hata 5.775 olarak bulunmuştur. Elde edilen sonuçlar tahmini ve ölçülen değerler arasındaki farkın çok düşük olduğunu göstermektedir.
Long ve diğerleri (2014) çiy sıcaklığı, güneşlenme süresi, rüzgâr hızı, güneş radyasyonu, üretilen güç gibi parametrelere bağlı olarak günlük güneş enerjisi tahminini YSA dahil dört farklı yöntemle gerçekleştirmişlerdir. Tahminde daha etkili olabilecek parametreleri seçmek için korelasyona dayalı parametre seçim prosedürü uygulanarak önemli parametreler modellerde giriş olarak seçilmiştir. YSA sonuçlarında R2 değeri 0.909, RMSE değeri 59.57, MAPE %11.87 olarak bulunmuştur.
Bou-Rabee ve diğerleri (2017) Kuveyt’te beş farklı bölgeden elde edilen verileri kullanarak günlük ortalama güneş radyasyonunu tahmin etmek için YSA modelleri kullanmışlardır. 2007-2010 arası verilerle eğitilen model, 2011 verileri ile test edilmiştir. Geliştirilen üç farklı YSA modeli içerinden Levenberg-Marquardt algoritmasını kullanan model %85.6 MAPE değeri ile en başarılı sonucu vermiştir.
Fan ve diğerleri (2019) küresel güneş radyasyonu tahmininde kullanılan ampirik ve makine öğrenmesi yöntemlerini kapsamlı bir literatür taraması yaparak özetlemişlerdir. Ayrıca Çin’in farklı iklim bölgelerinde küresel güneş ışınımı tahmininde 12 ampirik ve 12 makine öğrenmesi yöntemi kullanarak performanslarını karşılaştırmışlardır. Sonuçlar, makine öğrenmesi modellerinin (RMSE: 2.055-2.751 MJm− 2 d−1; R2: 0.839-0.936) genellikle ampirik modellerden (RMSE: 2.118–3.540 MJm− 2 d−1; R2: 0.834-0.935) daha iyi performans gösterdiğini ortaya koymaktadır. Tahmin doğruluğu ve hesaplama maliyetleri dikkate alındığında, çalışmada ANFIS şiddetle tavsiye edilmektedir.
Ghofrani ve diğerleri (2019) örüntü tanıma ve makine öğrenme tekniklerinin güneş ışınımı tahmini için kullanıldığını gösteren kapsamlı bir literatür taraması yapmışlardır. Bu araştırmanın sonuçları, veri kümeleme veya sınıflandırma ile düzensiz olan güneş ışınımı zaman serilerinin düzensiz kalıplarının tanımlanmasının, sinir ağları için daha iyi bir eğitim sağladığını ve tahmin doğruluğunu arttırdığını göstermektedir. Bununla birlikte, çoklu örüntü tanıma ve makine öğrenme tekniklerini kullanan hibrit tahmin yöntemlerinin hesaplama karmaşıklıkları, bunları çevrimiçi tahminler veya çok kısa vadeli tahminler için yetersiz kılmaktadır.
2. ÇALIŞMA BÖLGESİ VE VERİLER
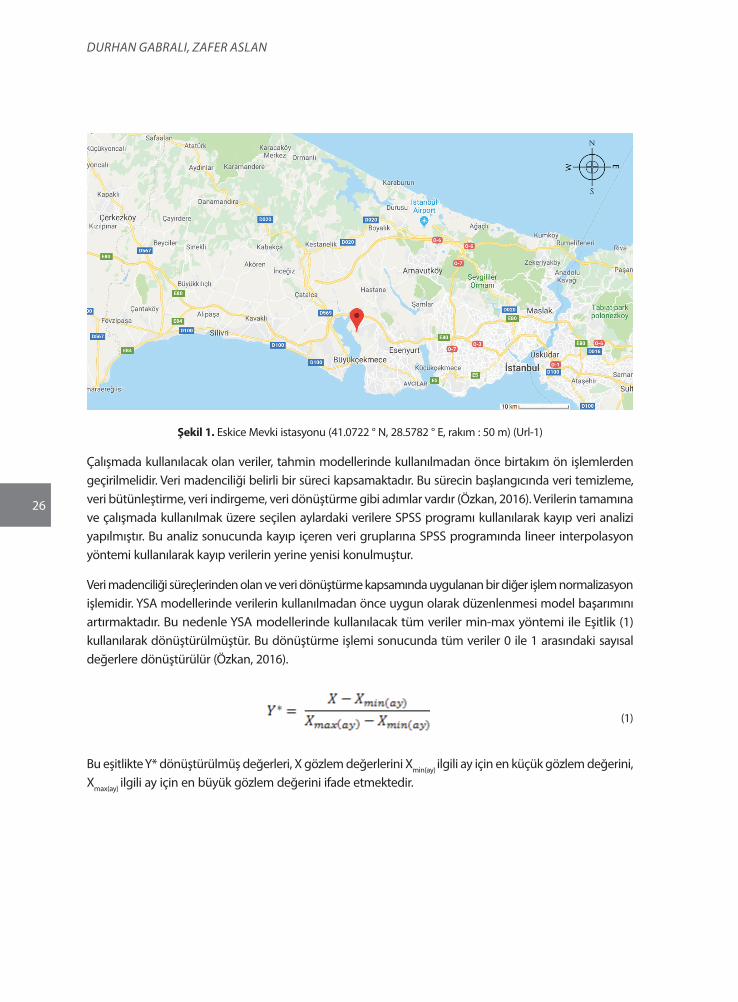
Bu çalışmada Şekil 1’deki haritada konumu gösterilen İstanbul İli Büyükçekmece İçesinde bulunan Tarım ve Orman Bakanlığına bağlı Tarım Bilgi Sistemi (TARBİL) Eskice Mevki istasyonundan alınan 2016 yılına ait güneş radyasyonu (W/m2), rüzgâr şiddeti (m/s), rüzgâr yönü, sıcaklık 2 m (°C), ultraviyole radyasyon indis, toprak üstü 5 cm sıcaklık (°C) verileri kullanılmıştır. Veriler 10 dakikalık periyotlarla kaydedilmiştir. Her veri grubundan toplamda 52576 adet kayıt bulunmaktadır. İstasyon 41.0722 ° N, 28.5782 ° E koordinatlarında olup rakım 50 m’dir. İstasyonun kule yüksekliği 10 m’dir.
26
Durhan GaBraLI, Zafer aSLan
Şekil 1. Eskice Mevki istasyonu (41.0722 ° N, 28.5782 ° E, rakım : 50 m) (Url-1)
Çalışmada kullanılacak olan veriler, tahmin modellerinde kullanılmadan önce birtakım ön işlemlerden geçirilmelidir. Veri madenciliği belirli bir süreci kapsamaktadır. Bu sürecin başlangıcında veri temizleme, veri bütünleştirme, veri indirgeme, veri dönüştürme gibi adımlar vardır (Özkan, 2016). Verilerin tamamına ve çalışmada kullanılmak üzere seçilen aylardaki verilere SPSS programı kullanılarak kayıp veri analizi yapılmıştır. Bu analiz sonucunda kayıp içeren veri gruplarına SPSS programında lineer interpolasyon yöntemi kullanılarak kayıp verilerin yerine yenisi konulmuştur.
Veri madenciliği süreçlerinden olan ve veri dönüştürme kapsamında uygulanan bir diğer işlem normalizasyon işlemidir. YSA modellerinde verilerin kullanılmadan önce uygun olarak düzenlenmesi model başarımını artırmaktadır. Bu nedenle YSA modellerinde kullanılacak tüm veriler min-max yöntemi ile Eşitlik (1) kullanılarak dönüştürülmüştür. Bu dönüştürme işlemi sonucunda tüm veriler 0 ile 1 arasındaki sayısal değerlere dönüştürülür (Özkan, 2016).
(1)
Bu eşitlikte Y* dönüştürülmüş değerleri, X gözlem değerlerini Xmin(ay) ilgili ay için en küçük gözlem değerini, Xmax(ay) ilgili ay için en büyük gözlem değerini ifade etmektedir.
27
AURUM MÜHENDİSLİK SİSTEMLERİ VE MİMARLIK DERGİSİAURUM JOURNAL OF ENGINEERING SYSTEMS AND ARCHITECTURE
3. YÖNTEM
3.1 Çoklu Lineer Regresyon
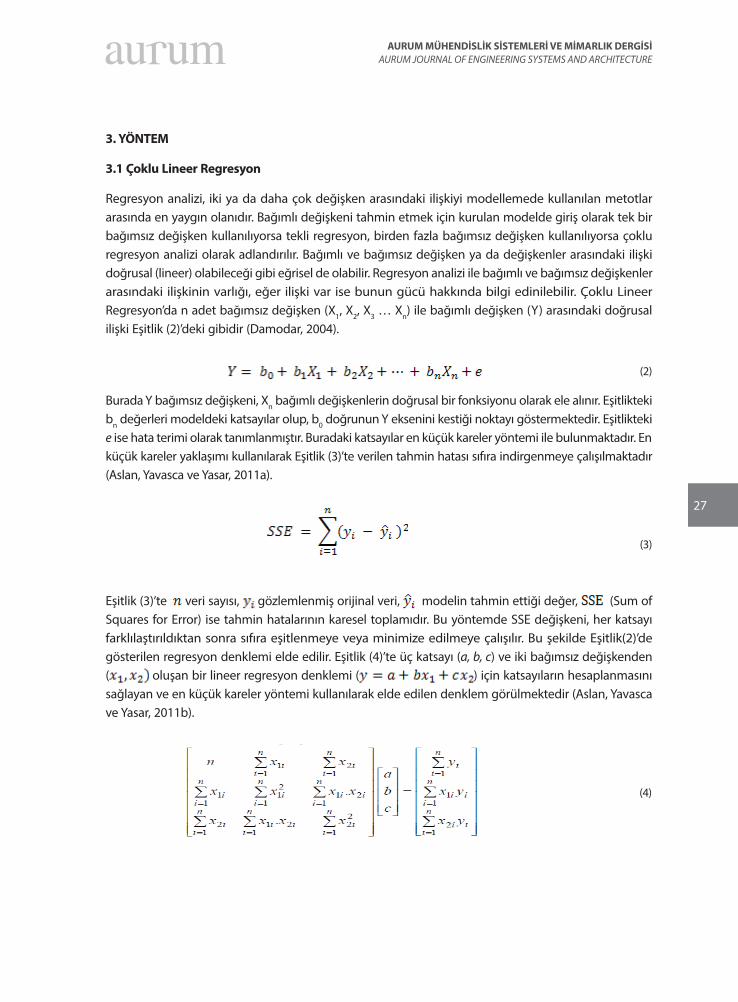
Regresyon analizi, iki ya da daha çok değişken arasındaki ilişkiyi modellemede kullanılan metotlar arasında en yaygın olanıdır. Bağımlı değişkeni tahmin etmek için kurulan modelde giriş olarak tek bir bağımsız değişken kullanılıyorsa tekli regresyon, birden fazla bağımsız değişken kullanılıyorsa çoklu regresyon analizi olarak adlandırılır. Bağımlı ve bağımsız değişken ya da değişkenler arasındaki ilişki doğrusal (lineer) olabileceği gibi eğrisel de olabilir. Regresyon analizi ile bağımlı ve bağımsız değişkenler arasındaki ilişkinin varlığı, eğer ilişki var ise bunun gücü hakkında bilgi edinilebilir. Çoklu Lineer Regresyon’da n adet bağımsız değişken (X1, X2, X3 … Xn) ile bağımlı değişken (Y) arasındaki doğrusal ilişki Eşitlik (2)’deki gibidir (Damodar, 2004).
(2)
Burada Y bağımsız değişkeni, Xn bağımlı değişkenlerin doğrusal bir fonksiyonu olarak ele alınır. Eşitlikteki bn değerleri modeldeki katsayılar olup, b0 doğrunun Y eksenini kestiği noktayı göstermektedir. Eşitlikteki e ise hata terimi olarak tanımlanmıştır. Buradaki katsayılar en küçük kareler yöntemi ile bulunmaktadır. En küçük kareler yaklaşımı kullanılarak Eşitlik (3)’te verilen tahmin hatası sıfıra indirgenmeye çalışılmaktadır (Aslan, Yavasca ve Yasar, 2011a).
(3)
Eşitlik (3)’te veri sayısı, gözlemlenmiş orijinal veri, modelin tahmin ettiği değer, (Sum of Squares for Error) ise tahmin hatalarının karesel toplamıdır. Bu yöntemde SSE değişkeni, her katsayı farklılaştırıldıktan sonra sıfıra eşitlenmeye veya minimize edilmeye çalışılır. Bu şekilde Eşitlik(2)’de gösterilen regresyon denklemi elde edilir. Eşitlik (4)’te üç katsayı (a, b, c) ve iki bağımsız değişkenden ( oluşan bir lineer regresyon denklemi ( ) için katsayıların hesaplanmasını sağlayan ve en küçük kareler yöntemi kullanılarak elde edilen denklem görülmektedir (Aslan, Yavasca ve Yasar, 2011b).
(4)
28
Durhan GaBraLI, Zafer aSLan
3.2 Yapay Sinir Ağları
Yapay sinir ağları insan beyninin yapısı ve çalışmasından esinlenerek geliştirilmiş, ağırlığı olan bağlantılarla birbirine bağlanmış, her birinin kendi belleği olan düğüm noktalarından oluşan paralel ve dağıtılmış bilgi saklama ve işleme yapılarıdır. YSA’lar için kısaca biyolojik sinir hücrelerinin yapısını ve çalışmasını taklit eden bilgisayar programlarıdır denilebilir. YSA’lar kendi kendine öğrenme yeteneğine sahiptirler. Öğrenmenin yanı sıra ezberleme ve bilgiler arasında ilişkiler oluşturma yeteneğine de sahiptirler. YSA’ların başlıca uygulama alanları sınıflandırma, tahmin ve modelleme olarak belirtilebilir (Elmas, 2016).
Öztemel (2016) ise YSA’ların kullanım alanlarını şu şekilde belirtmektedir. Sınıflandırma, örüntü tanıma, olasılık fonksiyon kestirimleri, ilişkilendirme veya örüntü eşleştirme, sinyal filtreleme, zeki ve doğrusal olmayan kontrol, zaman serisi analizleri, veri sıkıştırma, doğrusal olmayan sinyal işleme, doğrusal olmayan sistem modelleme ve optimizasyon.
Yapay sinir ağlarında bilgiler, ağın içindeki bağlantıların ağırlıklarında depolanır. Bir yapay ağda öğrenme işlemi, istenen bir işlevi yerine getirecek şekilde ağırlıkların ayarlanması sürecidir. YSA’da öğrenme işlemi düğümler arasındaki bağlantı ağırlıkların değiştirilmesi ile gerçekleştirilir. Öğrenme işlemi belirli kurallara göre yapılır ve bu konuda değişik yöntemler geliştirilmiştir. YSA bir sürü yapay sinir hücresinin bir araya gelip bağlanması ile oluşur. Genel olarak sinir hücreleri giriş, gizli ve çıkış katmanı olmak üzere üç katman halinde sıralanırlar (Öztemel, 2016).
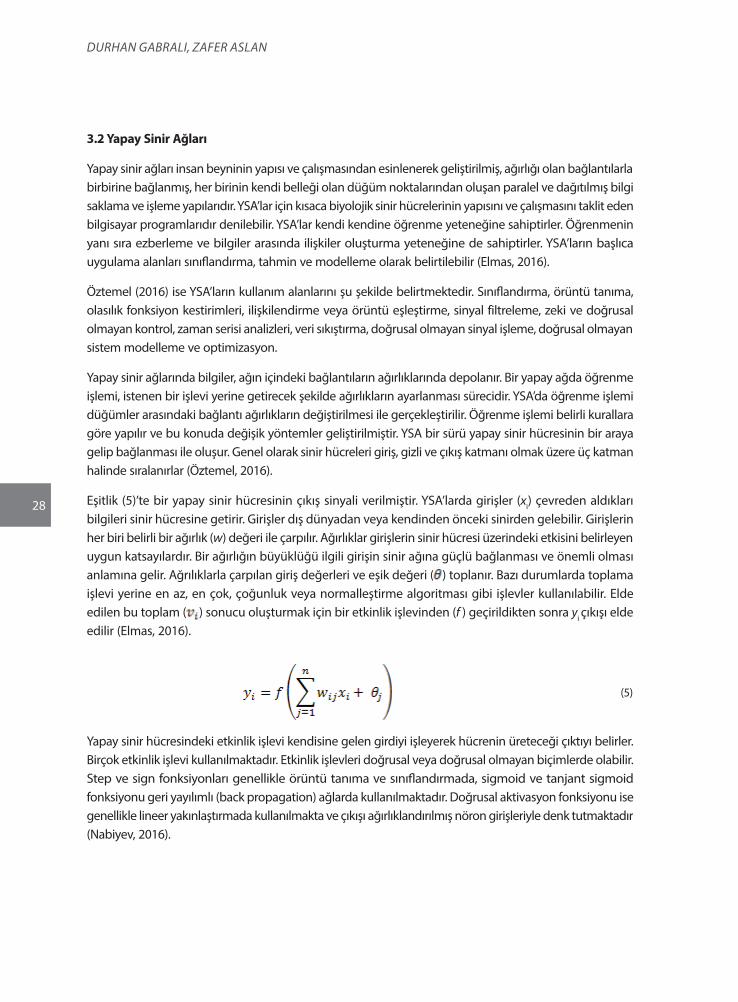
Eşitlik (5)’te bir yapay sinir hücresinin çıkış sinyali verilmiştir. YSA’larda girişler (xi) çevreden aldıkları bilgileri sinir hücresine getirir. Girişler dış dünyadan veya kendinden önceki sinirden gelebilir. Girişlerin her biri belirli bir ağırlık (w) değeri ile çarpılır. Ağırlıklar girişlerin sinir hücresi üzerindeki etkisini belirleyen uygun katsayılardır. Bir ağırlığın büyüklüğü ilgili girişin sinir ağına güçlü bağlanması ve önemli olması anlamına gelir. Ağrılıklarla çarpılan giriş değerleri ve eşik değeri ( ) toplanır. Bazı durumlarda toplama işlevi yerine en az, en çok, çoğunluk veya normalleştirme algoritması gibi işlevler kullanılabilir. Elde edilen bu toplam ( ) sonucu oluşturmak için bir etkinlik işlevinden (f ) geçirildikten sonra yi çıkışı elde edilir (Elmas, 2016).
(5)
Yapay sinir hücresindeki etkinlik işlevi kendisine gelen girdiyi işleyerek hücrenin üreteceği çıktıyı belirler. Birçok etkinlik işlevi kullanılmaktadır. Etkinlik işlevleri doğrusal veya doğrusal olmayan biçimlerde olabilir. Step ve sign fonksiyonları genellikle örüntü tanıma ve sınıflandırmada, sigmoid ve tanjant sigmoid fonksiyonu geri yayılımlı (back propagation) ağlarda kullanılmaktadır. Doğrusal aktivasyon fonksiyonu ise genellikle lineer yakınlaştırmada kullanılmakta ve çıkışı ağırlıklandırılmış nöron girişleriyle denk tutmaktadır (Nabiyev, 2016).
29
AURUM MÜHENDİSLİK SİSTEMLERİ VE MİMARLIK DERGİSİAURUM JOURNAL OF ENGINEERING SYSTEMS AND ARCHITECTURE
3.3 Model Performanslarının Değerlendirilmesinde Kullanılan Yöntemler
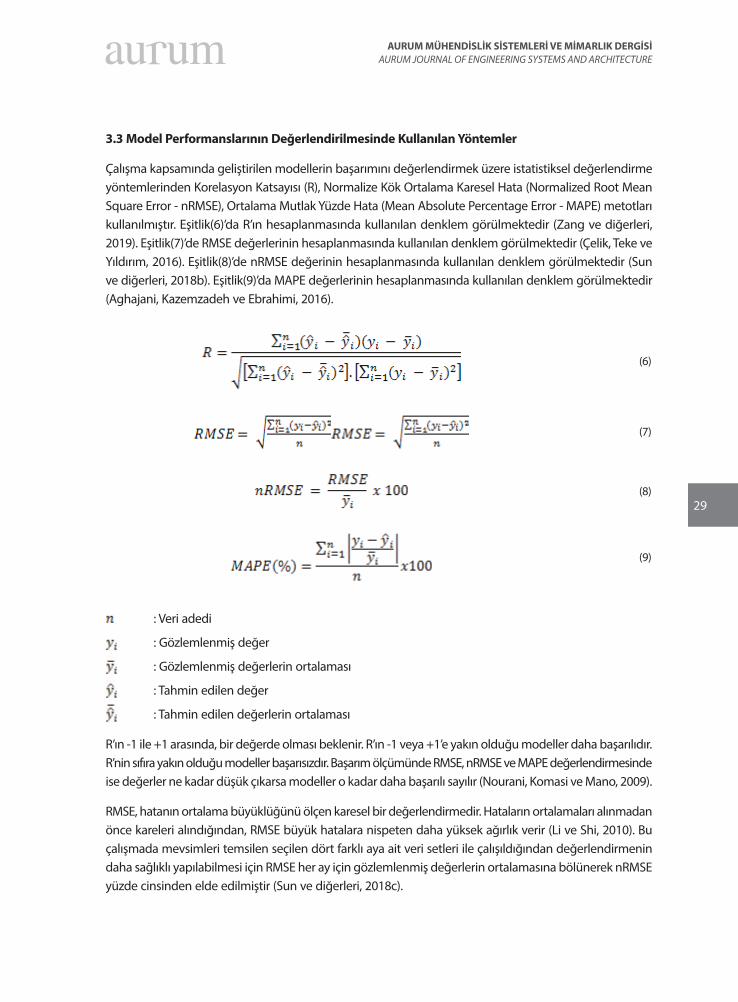
Çalışma kapsamında geliştirilen modellerin başarımını değerlendirmek üzere istatistiksel değerlendirme yöntemlerinden Korelasyon Katsayısı (R), Normalize Kök Ortalama Karesel Hata (Normalized Root Mean Square Error - nRMSE), Ortalama Mutlak Yüzde Hata (Mean Absolute Percentage Error - MAPE) metotları kullanılmıştır. Eşitlik(6)’da R’ın hesaplanmasında kullanılan denklem görülmektedir (Zang ve diğerleri, 2019). Eşitlik(7)’de RMSE değerlerinin hesaplanmasında kullanılan denklem görülmektedir (Çelik, Teke ve Yıldırım, 2016). Eşitlik(8)’de nRMSE değerinin hesaplanmasında kullanılan denklem görülmektedir (Sun ve diğerleri, 2018b). Eşitlik(9)’da MAPE değerlerinin hesaplanmasında kullanılan denklem görülmektedir (Aghajani, Kazemzadeh ve Ebrahimi, 2016).
(6)
(7)
(8)
(9)
: Veri adedi
: Gözlemlenmiş değer
: Gözlemlenmiş değerlerin ortalaması
: Tahmin edilen değer
: Tahmin edilen değerlerin ortalaması
R’ın -1 ile +1 arasında, bir değerde olması beklenir. R’ın -1 veya +1’e yakın olduğu modeller daha başarılıdır. R’nin sıfıra yakın olduğu modeller başarısızdır. Başarım ölçümünde RMSE, nRMSE ve MAPE değerlendirmesinde ise değerler ne kadar düşük çıkarsa modeller o kadar daha başarılı sayılır (Nourani, Komasi ve Mano, 2009).
RMSE, hatanın ortalama büyüklüğünü ölçen karesel bir değerlendirmedir. Hataların ortalamaları alınmadan önce kareleri alındığından, RMSE büyük hatalara nispeten daha yüksek ağırlık verir (Li ve Shi, 2010). Bu çalışmada mevsimleri temsilen seçilen dört farklı aya ait veri setleri ile çalışıldığından değerlendirmenin daha sağlıklı yapılabilmesi için RMSE her ay için gözlemlenmiş değerlerin ortalamasına bölünerek nRMSE yüzde cinsinden elde edilmiştir (Sun ve diğerleri, 2018c).
30
Durhan GaBraLI, Zafer aSLan
MAPE, tahmin değerlerine ait mutlak hata yüzdelerinin ortalamasını göstermektedir. MAPE değerlendirmesinde %10’nun altındaki değerler modellerin çok iyi olduğunu , %10 ile %20 arasındaki değerler iyi, %20 ile %50 arasındaki değerlerin kabul edilebilir ve %50’nin üstündeki değerler ise modellerin yanlış ve hatalı olabileceğini işaret etmektedir (Alkan, Öztürk ve Tosun, 2018).
4. UYGULAMA
Bu çalışmanın uygulama aşamasında Eskice Mevki istasyonuna ait veriler mevsimleri temsilen dört gruba ayrılmıştır. Her mevsim için başlangıç ayı seçilmiştir. İlkbahar mevsimini temsilen Mart ayı, yaz mevsimini temsilen Haziran ayı, sonbahar mevsimini temsilen Eylül ayı, kış mevsimini temsilen Aralık ayı verileri kullanılarak aylar bazında ayrı olarak modelleme çalışması gerçekleştirilmiştir.
4.1 Çoklu Lineer Regresyon ile Tahmin Modelleme
Çalışmanın bu aşamasında istatistiksel yöntemlerden çoklu lineer regresyon yöntemi kullanılarak mevsimleri temsilen seçilen aylar bazında güneş radyasyonu için tahmin çalışması yapılmıştır. Tahmin çalışmasında meteorolojik veriler kullanılarak ileriye yönelik 24 saat sonrası için 10 dakikalık adımlarla güneş radyasyonu tahmin edilmeye çalışılmıştır. SPSS programı kullanılarak adımsal (stepwise) yöntem ile çoklu lineer regresyon modeli uygulanmıştır.
Adımsal olarak adlandırılan regresyon yöntemi kalan karelerin toplamı üzerinde en büyük etkiye sahip olan değişkenlerin eklenmesine veya silinmesine dayanır (Ghorbani ve diğerleri, 2016). Bu yöntemde bağımsız değişkenler bağımlı değişkenle aralarındaki ilişkiye göre en güçlü ilişkiye sahip olandan başlanarak sırayla modele dahil edilir. Bağımlı değişkenle olan anlamlı ilişkisine göre ve modele olan anlamlı katkılarına göre bağımsız değişkenler her adımda modelde tutulur ya da modelden atılır. Yöntem modele girecek veya modelden çıkarılacak değişken kalmayıncaya kadar devam eder. Verilerin %70’i modeli kurmak ve eğitmek için kullanılmış, kalan %30’luk kısım ise test için saklı veri olarak ayrılmıştır. Bu seçimler rastgele değil belirli aralıklar verilerek yapılmıştır.
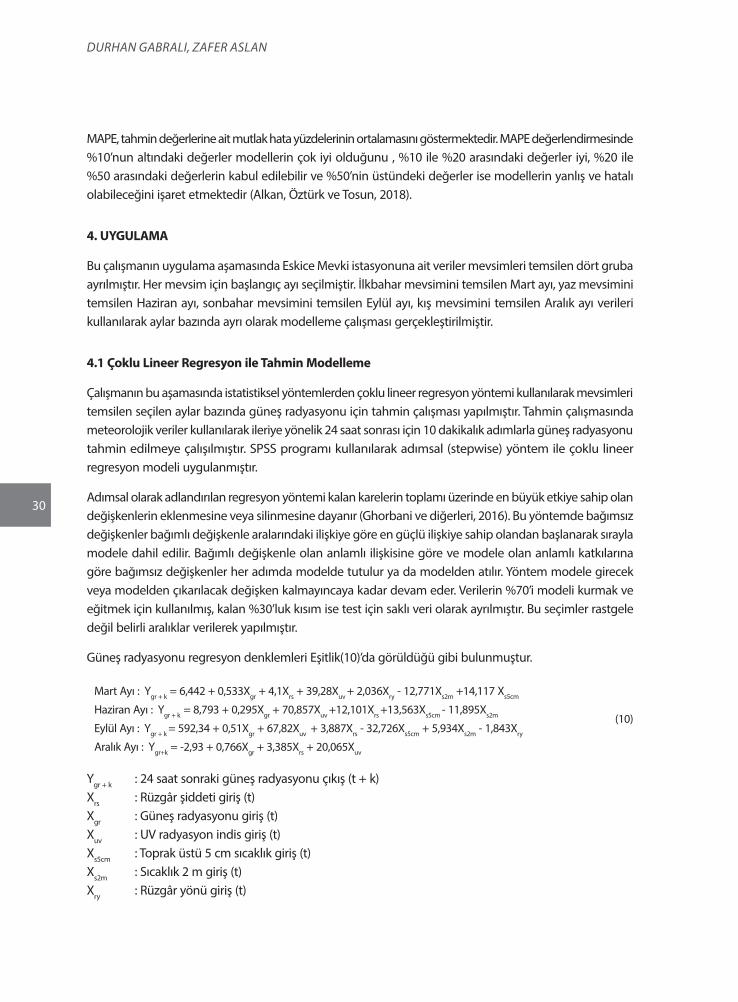
Güneş radyasyonu regresyon denklemleri Eşitlik(10)’da görüldüğü gibi bulunmuştur.
Mart Ayı : Ygr + k = 6,442 + 0,533Xgr + 4,1Xrs + 39,28Xuv + 2,036Xry - 12,771Xs2m +14,117 Xs5cm
Haziran Ayı : Ygr + k = 8,793 + 0,295Xgr + 70,857Xuv +12,101Xrs +13,563Xs5cm - 11,895Xs2m
Eylül Ayı : Ygr + k = 592,34 + 0,51Xgr + 67,82Xuv + 3,887Xrs - 32,726Xs5cm + 5,934Xs2m - 1,843Xry
Aralık Ayı : Ygr+k = -2,93 + 0,766Xgr + 3,385Xrs + 20,065Xuv
(10)
Ygr + k : 24 saat sonraki güneş radyasyonu çıkış (t + k) Xrs : Rüzgâr şiddeti giriş (t) Xgr : Güneş radyasyonu giriş (t) Xuv : UV radyasyon indis giriş (t) Xs5cm : Toprak üstü 5 cm sıcaklık giriş (t) Xs2m : Sıcaklık 2 m giriş (t) Xry : Rüzgâr yönü giriş (t)
31
AURUM MÜHENDİSLİK SİSTEMLERİ VE MİMARLIK DERGİSİAURUM JOURNAL OF ENGINEERING SYSTEMS AND ARCHITECTURE
4.2 YSA ile Tahmin Modelleme
Çalışma kapsamında İleri Beslemeli (Feed Forward), Geri Yayılımlı (Back Propagation) YSA modelleri kullanılmıştır. Kurulan modellerde bir adet giriş katmanı, bir adet gizli katman, bir adet çıkış katmanı olmak üzere toplam 3 katman bulunmaktadır. Girişte 6 adet veri grubu olduğu için giriş katmanı 6 nörondan oluşmaktadır. Çıkış katmanında ise güneş radyasyonu olan tek parametre olduğundan çıkış katmanı tek nöronludur.
YSA modellerinde gizli katmanlardaki nöron sayısını belirlemek için kesin bir kural yoktur. Genellikle belirli sayıdan başlamak suretiyle ve kademeli artırma ile modeller denenerek uygun sayı bulunmaya çalışılır. Olması gerekenden az belirlenen gizli nöron sayısı modellerin yetersiz sonuçlar vermesine, gereğinden fazla belirlenen gizli nöron sayısı da modellerin verileri ezberlemesine ve sadece eğitim verilerinde iyi sonuçlar verip test verilerinde başarısız olmasına neden olabilir (Çakır, 2018).
Gizli katmandaki hücre sayısının belirlenmesinde kesin bir kural olmamakla beraber genellikle gizli katman hücre sayısı giriş katmanındaki hücre sayısının iki katını geçmez. Ayrıca piramit kuralı denilen bir yöntem kullanılır. Bu kurala göre bir piramidin yapısına benzer şekilde giriş katmanından çıkış katmanına doğru hücre sayısının azalması gerektiği varsayılır. Giriş ve çıkış katmanındaki hücre sayıları sırayla n ve m olmak üzere piramit kuralına göre Eşitlik (11) ile gizli hücre sayısı bulunur (Yücesoy, 2011).
(11)
Bu çalışmada gizli katmandaki nöron sayısını belirlemek için çok sayıda deneme yapılmıştır. Piramit kuralı da dikkate alınarak yapılan denemelerde gizli katmanda 3 nöron kullanıldığı zaman genel olarak en iyi sonucun alındığı görülmüştür. Bu nedenle gizli katmandaki hücre sayısının 3 olmasına karar verilmiştir. Çalışmada geliştirilen YSA modelleri aşağıdaki şekilde isimlendirilmiştir.
YSA (Giriş Katmanı Nöron Sayısı, Gizli Katman Nöron Sayısı, Çıkış Katmanı Nöron Sayısı)
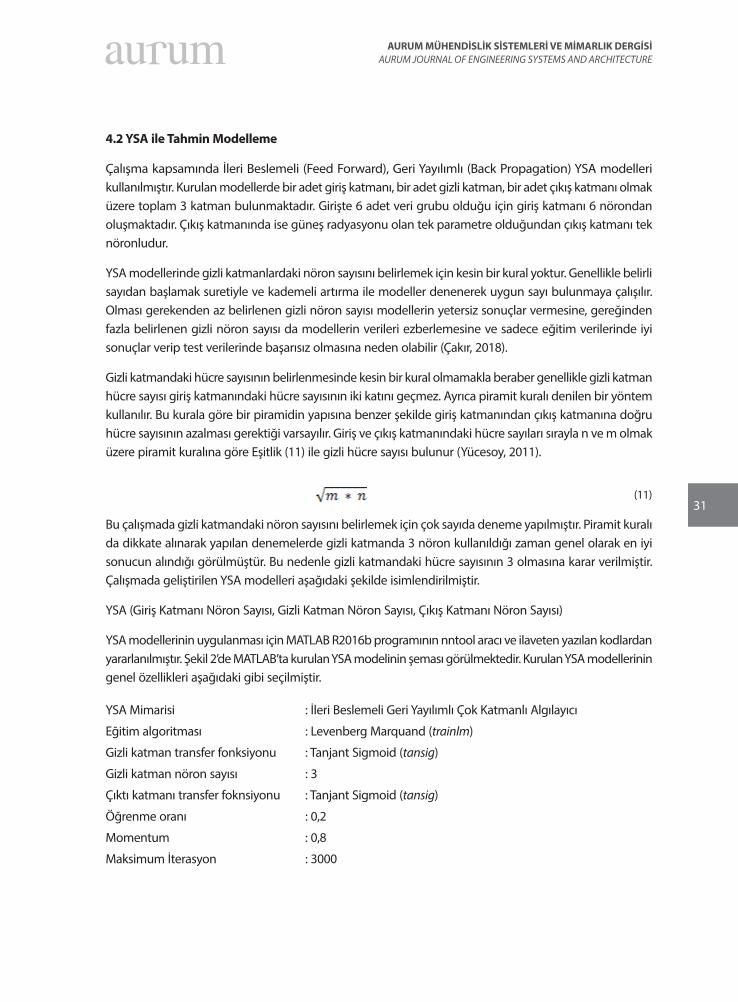
YSA modellerinin uygulanması için MATLAB R2016b programının nntool aracı ve ilaveten yazılan kodlardan yararlanılmıştır. Şekil 2’de MATLAB’ta kurulan YSA modelinin şeması görülmektedir. Kurulan YSA modellerinin genel özellikleri aşağıdaki gibi seçilmiştir.
YSA Mimarisi : İleri Beslemeli Geri Yayılımlı Çok Katmanlı Algılayıcı
Eğitim algoritması : Levenberg Marquand (trainlm)
Gizli katman transfer fonksiyonu : Tanjant Sigmoid (tansig)
Gizli katman nöron sayısı : 3
Çıktı katmanı transfer foknsiyonu : Tanjant Sigmoid (tansig)
Öğrenme oranı : 0,2
Momentum : 0,8
Maksimum İterasyon : 3000
32
Durhan GaBraLI, Zafer aSLan
Şekil 2. MATLAB YSA model şeması (MATLAB 2016, nntraintool)
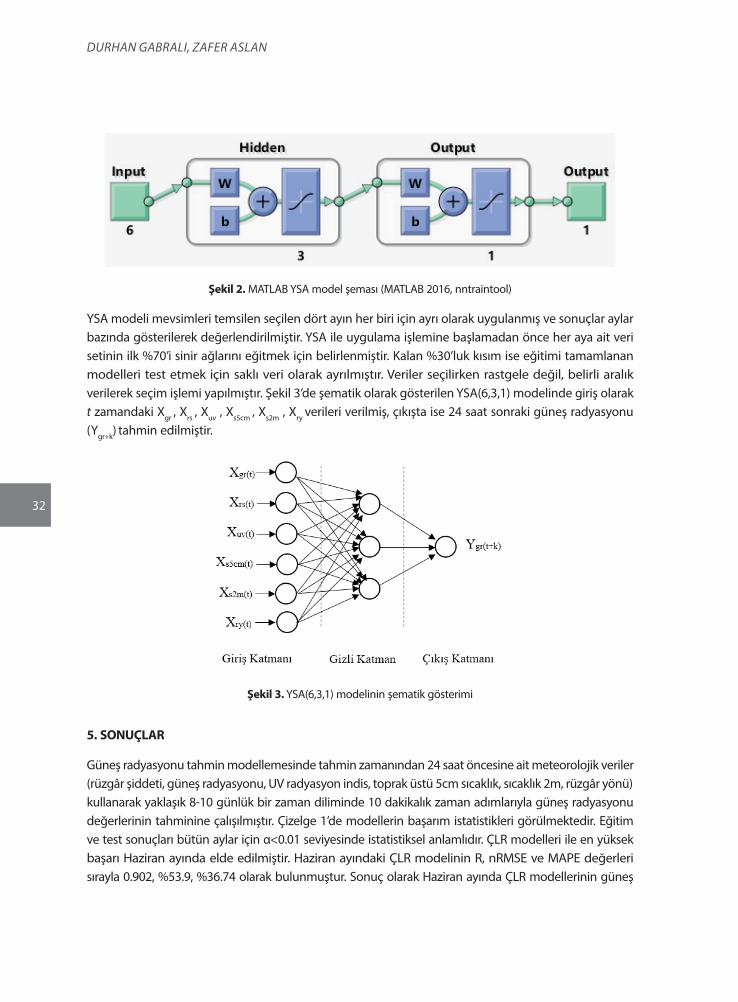
YSA modeli mevsimleri temsilen seçilen dört ayın her biri için ayrı olarak uygulanmış ve sonuçlar aylar bazında gösterilerek değerlendirilmiştir. YSA ile uygulama işlemine başlamadan önce her aya ait veri setinin ilk %70’i sinir ağlarını eğitmek için belirlenmiştir. Kalan %30’luk kısım ise eğitimi tamamlanan modelleri test etmek için saklı veri olarak ayrılmıştır. Veriler seçilirken rastgele değil, belirli aralık verilerek seçim işlemi yapılmıştır. Şekil 3’de şematik olarak gösterilen YSA(6,3,1) modelinde giriş olarak t zamandaki Xgr , Xrs , Xuv , Xs5cm , Xs2m , Xry verileri verilmiş, çıkışta ise 24 saat sonraki güneş radyasyonu (Ygr+k) tahmin edilmiştir.
Şekil 3. YSA(6,3,1) modelinin şematik gösterimi
5. SONUÇLAR
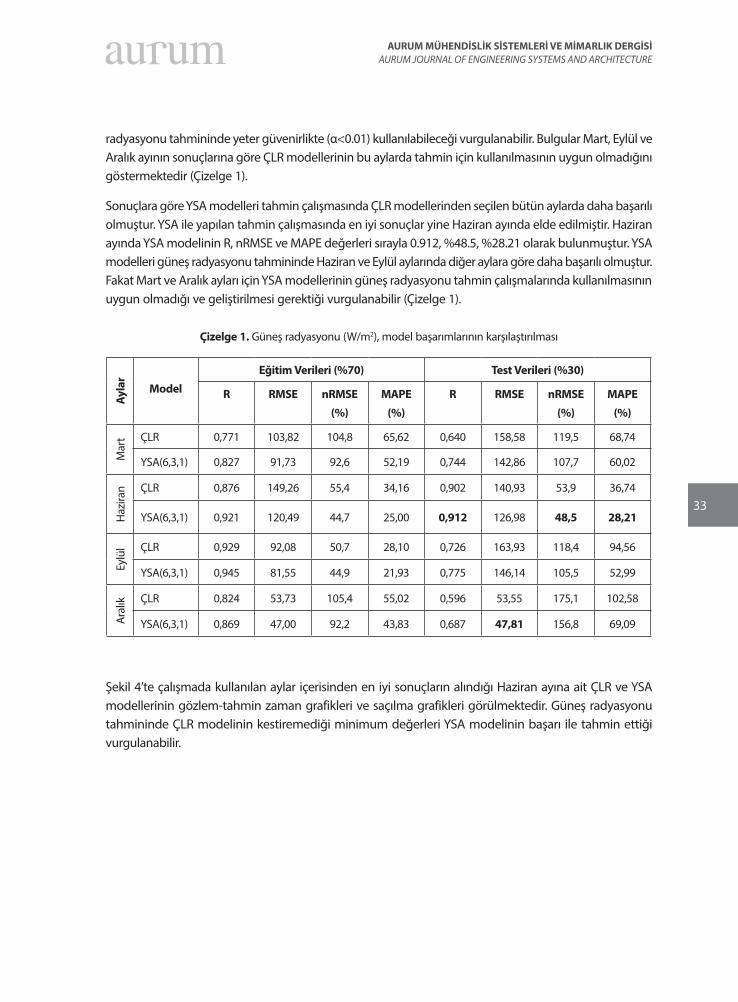
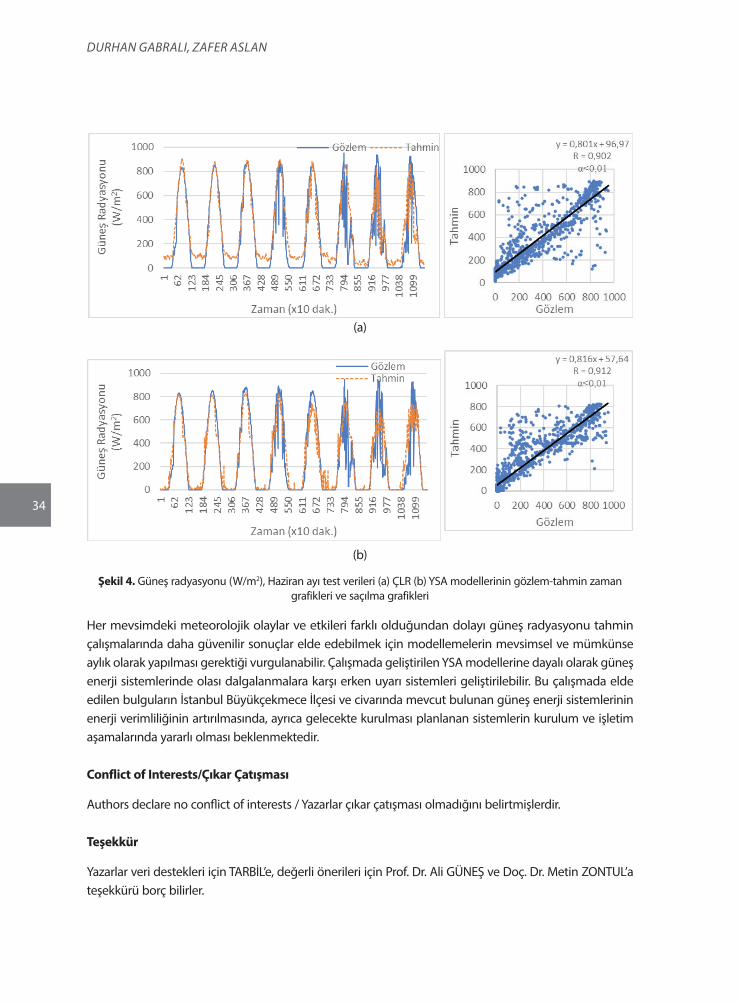
Güneş radyasyonu tahmin modellemesinde tahmin zamanından 24 saat öncesine ait meteorolojik veriler (rüzgâr şiddeti, güneş radyasyonu, UV radyasyon indis, toprak üstü 5cm sıcaklık, sıcaklık 2m, rüzgâr yönü) kullanarak yaklaşık 8-10 günlük bir zaman diliminde 10 dakikalık zaman adımlarıyla güneş radyasyonu değerlerinin tahminine çalışılmıştır. Çizelge 1’de modellerin başarım istatistikleri görülmektedir. Eğitim ve test sonuçları bütün aylar için α<0.01 seviyesinde istatistiksel anlamlıdır. ÇLR modelleri ile en yüksek başarı Haziran ayında elde edilmiştir. Haziran ayındaki ÇLR modelinin R, nRMSE ve MAPE değerleri sırayla 0.902, %53.9, %36.74 olarak bulunmuştur. Sonuç olarak Haziran ayında ÇLR modellerinin güneş
33
AURUM MÜHENDİSLİK SİSTEMLERİ VE MİMARLIK DERGİSİAURUM JOURNAL OF ENGINEERING SYSTEMS AND ARCHITECTURE
radyasyonu tahmininde yeter güvenirlikte (α<0.01) kullanılabileceği vurgulanabilir. Bulgular Mart, Eylül ve Aralık ayının sonuçlarına göre ÇLR modellerinin bu aylarda tahmin için kullanılmasının uygun olmadığını göstermektedir (Çizelge 1).
Sonuçlara göre YSA modelleri tahmin çalışmasında ÇLR modellerinden seçilen bütün aylarda daha başarılı olmuştur. YSA ile yapılan tahmin çalışmasında en iyi sonuçlar yine Haziran ayında elde edilmiştir. Haziran ayında YSA modelinin R, nRMSE ve MAPE değerleri sırayla 0.912, %48.5, %28.21 olarak bulunmuştur. YSA modelleri güneş radyasyonu tahmininde Haziran ve Eylül aylarında diğer aylara göre daha başarılı olmuştur. Fakat Mart ve Aralık ayları için YSA modellerinin güneş radyasyonu tahmin çalışmalarında kullanılmasının uygun olmadığı ve geliştirilmesi gerektiği vurgulanabilir (Çizelge 1).
Çizelge 1. Güneş radyasyonu (W/m2), model başarımlarının karşılaştırılması
Ayla
r
Model
Eğitim Verileri (%70) Test Verileri (%30)
R RMSE nRMSE
(%)
MAPE
(%)
R RMSE nRMSE
(%)
MAPE
(%)
Mar
t ÇLR 0,771 103,82 104,8 65,62 0,640 158,58 119,5 68,74
YSA(6,3,1) 0,827 91,73 92,6 52,19 0,744 142,86 107,7 60,02
Haz
iran ÇLR 0,876 149,26 55,4 34,16 0,902 140,93 53,9 36,74
YSA(6,3,1) 0,921 120,49 44,7 25,00 0,912 126,98 48,5 28,21
Eylü
l ÇLR 0,929 92,08 50,7 28,10 0,726 163,93 118,4 94,56
YSA(6,3,1) 0,945 81,55 44,9 21,93 0,775 146,14 105,5 52,99
Aral
ık ÇLR 0,824 53,73 105,4 55,02 0,596 53,55 175,1 102,58
YSA(6,3,1) 0,869 47,00 92,2 43,83 0,687 47,81 156,8 69,09
Şekil 4’te çalışmada kullanılan aylar içerisinden en iyi sonuçların alındığı Haziran ayına ait ÇLR ve YSA modellerinin gözlem-tahmin zaman grafikleri ve saçılma grafikleri görülmektedir. Güneş radyasyonu tahmininde ÇLR modelinin kestiremediği minimum değerleri YSA modelinin başarı ile tahmin ettiği vurgulanabilir.
34
Durhan GaBraLI, Zafer aSLan
(a)
(b)
Şekil 4. Güneş radyasyonu (W/m2), Haziran ayı test verileri (a) ÇLR (b) YSA modellerinin gözlem-tahmin zaman grafikleri ve saçılma grafikleri
Her mevsimdeki meteorolojik olaylar ve etkileri farklı olduğundan dolayı güneş radyasyonu tahmin çalışmalarında daha güvenilir sonuçlar elde edebilmek için modellemelerin mevsimsel ve mümkünse aylık olarak yapılması gerektiği vurgulanabilir. Çalışmada geliştirilen YSA modellerine dayalı olarak güneş enerji sistemlerinde olası dalgalanmalara karşı erken uyarı sistemleri geliştirilebilir. Bu çalışmada elde edilen bulguların İstanbul Büyükçekmece İlçesi ve civarında mevcut bulunan güneş enerji sistemlerinin enerji verimliliğinin artırılmasında, ayrıca gelecekte kurulması planlanan sistemlerin kurulum ve işletim aşamalarında yararlı olması beklenmektedir.
Conflict of Interests/Çıkar Çatışması
Authors declare no conflict of interests / Yazarlar çıkar çatışması olmadığını belirtmişlerdir.
Teşekkür
Yazarlar veri destekleri için TARBİL’e, değerli önerileri için Prof. Dr. Ali GÜNEŞ ve Doç. Dr. Metin ZONTUL’a teşekkürü borç bilirler.
35
AURUM MÜHENDİSLİK SİSTEMLERİ VE MİMARLIK DERGİSİAURUM JOURNAL OF ENGINEERING SYSTEMS AND ARCHITECTURE
6. KAYNAKÇA
Aghajani, A., Kazemzadeh, R., ve Ebrahimi, A. 2016. “A novel hybrid approach for predicting wind farm power production based on wavelet transform, hybrid neural networks and imperialist competitive algorithm”, Energy Conversion and Management, 121, 232-240.
Alkan, Ö., Öztürk, A., ve Tosun, S. 2018. “Rüzgâr ve Güneş Santrallerinde Kısa Dönem Enerji Üretim Tahmini İçin Matematiksel Modellerin Oluşturulması”, Düzce Üniversitesi Bilim ve Teknoloji Dergisi, 6(1), 188-195.
Aslan, Y., Yavasca, S., ve Yasar, C. 2011. “Long term Electric Peak load forecasting of Kutahya using different approaches”, International Journal on Technical and Physical Problems of Engineering, 3(2), 87-91.
Bou-Rabee, M., Sulaiman, S. A., Saleh, M. S., ve Marafi, S. 2017. Using artificial neural networks to estimate solar radiation in Kuwait , Renewable and Sustainable Energy Reviews, 72, 434-438.
Çakır, F. S. 2018. Yapay Sinir Ağları, I.Baskı, Nobel Akademik Yayıncılık, Ankara.
Çelik, Ö., Teke, A., ve Yıldırım, H. B. 2016. The optimized artificial neural network model with Levenberg–Marquardt algorithm for global solar radiation estimation in Eastern Mediterranean Region of Turkey., Journal of Cleaner Production, 116, 1-12.
Damodar, N. G. 2004. Basic Econometrics, 4th edition, The McGraw-Hill ,New York.
Elmas, Ç. 2016. Yapay Zeka Uygulamaları, III. Baskı, Seçkin Yayıncılık, Ankara.
Erdil, A., ve Arcaklioglu, E. 2013. The prediction of meteorological variables using artificial neural network., Neural Computing and Applications, 22(7-8), 1677-1683.
Fan, J., Wu, L., Zhang, F., Cai, H., Zeng, W., Wang, X., ve Zou, H. 2019. Empirical and machine learning models for predicting daily global solar radiation from sunshine duration: A review and case study in China., Renewable and Sustainable Energy Reviews, 100, 186-212.
Ghofrani, M., Azimi, R., ve Youshi, M. 2019. Pattern Recognition and Its Application in Solar Radiation Forecasting., IntechOpen.
Ghorbani, M. A., Khatibi, R., FazeliFard, M. H., Naghipour, L., ve Makarynskyy, O. 2016. Short-term wind speed predictions with machine learningtechniques., Meteorology and Atmospheric Physics, 128(1), 57-72.
Kılıç, F. Ç. 2015. Güneş Enerjisi, Türkiye’deki Son Durumu ve Üretim Teknolojileri. Engineer & The Machinery Magazine, 56(671), 28-40,available in https://www.mmo.org.tr/sites/default/files/09677e0899d72e8_ek%281%29.pdf , last accessed March 2019
Li, G., ve Shi, J. 2010. On comparing three artificial neural networks for wind speed forecasting., Applied Energy, 87(7), 2313-2320.
Long, H., Zhang, Z., ve Su, Y. 2014. Analysis of daily solar power prediction with data-driven approaches., Applied Energy, 126, 29-37.
36
Durhan GaBraLI, Zafer aSLan
Nabiyev, V. V. 2016. Yapay Zeka, V. Baskı, Seçkin Yayıncılık, Ankara.
Nourani, V., Komasi, M., ve Mano, A. 2009. A multivariate ANN-wavelet approach for rainfall–runoff modeling., 23(14), 2877–2894.
Özkan, Y. 2016. Veri Madenciliği Yöntemleri, III. Baskı, Papatya Yayıncılık Eğitim, İstanbul.
Öztemel, E. 2016. Yapay Sinir Ağları, IV. Baskı, Papatya Yayıncılık, İstanbul.
Rahman, M. M., B.Mostafiz, S., Paatero, J. V., ve Lahdelma, R. 2014. Extension of energy crops on surplus agricultural lands: A potentially viable option in developing countries while fossil fuel reserves are diminishing., Renewable and Sustainable Energy Reviews, 29, 108-119.
Sun, S., Wang, S., Zhang, G., ve Zheng, J. 2018. A decomposition-clustering-ensemble learning approach for solar radiation forecasting., Solar Energy, 163, 189-199.
Yılmaz, E. A., ve Öziç, H. C. 2018. Türkiye’nin Yenilenebilir Enerji Potansiyeli Ve Gelecek Hedefleri., ODÜ Sosyal Bilimler Araştırmaları Dergisi (ODÜSOBİAD), 8(3), 525-535.
Yücesoy, M. 2011. Temizlik kâğıtları sektöründe yapay sinir ağları ile talep tahmini., Dotora Tezi, İTÜ Fen Bilimleri Enstitüsü, İstanbul.
Zang, H., Cheng, L., Ding, T., Cheung, K. W., Wang, M., Wei, Z., ve Sun, G. 2019. Estimation and validation of daily global solar radiation by day of the year-based models for different climates in China., Renewable Energy, 135, 984-1003.
37
AURUM MÜHENDİSLİK SİSTEMLERİ VE MİMARLIK DERGİSİAURUM JOURNAL OF ENGINEERING SYSTEMS AND ARCHITECTURE
Cilt 4, Sayı 1 | Yaz 2020Volume 4, No 1 | Summer 2020, 37-59
ARAŞTIRMA MAKALESİ / RESEARCH ARTICLE
USING DATA MINING TECHNIQUES TO EXPLORE PATTERNS OF ACADEMIC ACHIEVEMENT EFFECTS FOR HIGH SCHOOL STUDENTS
Karrar Hussein ALI1
1Altinbas University, Institute of Graduate Studies, Department of Information Technology, Istanbul. [email protected] ORCID No: 0000-0002-6924-739X
Sefer KURNAZ2
2Altinbas University, Faculty of Engineering and Natural Sciences, Department of Computer Engineering, Istanbul.
mailto:[email protected] ORCID No: 0000-0002-7666-2639
GELİŞ TARİHİ/RECEIVED DATE: 05.02.2020 KABUL TARİHİ/ACCEPTED DATE: 17.05.2020
Abstract
This research presents an applied study of the field of knowledge discovery of educational data using data mining techniques, focusing on the development of teaching and learning, by discovering the main patterns of testing the data of the academic student of the intermediate level (baccalaureate) in Baghdad - Iraq, from 2010 to 2019 to get results on the Academic Performance Index. In this study, we discover some major patterns data, Some of this patterns association exists between student changed summation and the student gain level for some subjects, also the relation between summation degrees with degree gained from some subject. This research attempts to read this result and interpretation, supply and verification level and its type to supply to the ministry decision-maker. We choose data mining technique because it’s better to use the benefit of quantity data; we use a different way from data mining technique to support discovery result clusters using (k-means) and classification use a decision tree, after first pre-processing data for database and restriction like logical data warehouse shape, we use k-means algorithm of clusters technique and (J48) algorithm of the classification technique of the decision tree, this different way and algorithms application through WEKA tool, which supports more algorithms and way of data mining Last deductive abstract and suggests some recommendation which interest for the decision-maker. Results from this research built a logical data warehouse & applying the algorithm of data mining’s algorithm, besides the difficulties of some subjects which may form its tough words or other disqualification planning
Keywords: Data mining; Predicative models; Classification; Decision tree; Performance prediction.
LİSE ÖĞRENCİLERİNİN AKADEMİK BAŞARIYA ULAŞMA DAVRANIŞLARININ VERİ MADENCİLİĞİ YÖNTEMLERİ İLE İNCELENMESİ
Özet
Bu araştırma, veri madenciliği tekniklerini kullanarak bilginin keşfinde uygulamalı bir çalışma sunuyor, Bu çalışmanın temel amacı, 2010’den 2019’e kadar olan üçüncü Orta Sertifika - Bakalorya için öğrencilerin
38
Karrar Hussein aLi, sefer KurnaZ
akademik verilerinde mevcut bazı kalıpları keşfetmektir. Daha sonra Irak Eğitim Bakanlığındaki karar vericilerin eğitim politikalarını desteklemek için akademik performansa ilişkin genel göstergeler geldi. Özellikle veri hacminin yanı sıra, bu verilerin nispeten büyük zaman boyutu da arama sonuçlarından destek aldığından. Bu araştırmada, bu verilerde baskın olan bazı veri kalıplarının, eğitim açısından önemli göstergeler sağlayabilecek bir dizi örgütün varlığına göre özetlendiğini keşfettik. Bu kalıplardan, öğrencinin genel ortalaması ile bazı derslerin öğrenci başarısı arasında bir korelasyon vardır ve bazı derslerde elde edilen tahminde öğrenci başarısının değerlendirilmesi arasındaki ilişki vardır. Bu araştırma, bu sonucu okuma, yorumlama ve sunum seviyesini okumaya ve seviyesini ve kalitesini bakanlıktaki karar vericiye sunarak seviyesini doğrulamaya çalışır. Veri madenciliği teknikleri, bu verinin boyutundan yararlanmak için en uygun olarak seçilmiştir ve çünkü karar vermeyi desteklemek için sıklıkla kullanılan akıllı tümdengelim algoritmaları kullanmaktadır. Bulguları desteklemek için farklı veri madenciliği teknikleri metotları kullanıyoruz, yani küme oluşturma ve sınıflandırmada k- means algoritmasını kullanarak küme oluşturma işleminin ardından (logical data warehouse ) veritabanının ilk işlenmesi ve yeniden yapılandırılmasından sonra karar ağaçları kullanılarak kümeleme. Kümeli teknolojide K-means algoritması, karar ağacı için sınıflandırma tekniğindeki algoritma (J48), bu yöntemler ve algoritmalar weka aracı kullanılarak uygulanmıştır. Veri madenciliğinde birçok algoritma ve yöntemi destekleyen. Araştırma sonuçlarına göre mantıksal bir veri ambarı ve bazı veri madenciliği algoritmalarının Milli Eğitim Bakanlığı veri tabanına uygulanması, Öğrenci kayıtlarıyla ilgili diğer önemli sonuçlara ek olarak, birçok dersin öğrencileri bırakması ve çalışma dışı bırakması gibi, Çalışma planları ve müfredatta ya zor bir kelime ya da kusur.
Anahtar Kelimeler: Veri Madenciliği,Sınıflandırma,Karar ağacı,Performans tahmini,Tahmini modeller
1. INTRODUCTION
In today’s world, the age of knowledge explosion is surrounded by a huge amount of information in various aspects of life and different images, and information has become the most important components of contemporary life. This massive flow of information is due to the development of transport and information processing of communication devices and computers Information, computers and electronic communication systems, automation systems or computerized computer-based systems applications that have proven to be better than traditional systems, Important. in several aspects such as the application of e-learning. Currently, the use of e-services is one of the most important in most government institutions. Sahay, S. K et.all, NGOs with these huge sizes of data, orthodox methods of data analysis, which are a mixing of statistical methods and somewhat computer systems designed. to manage databases, deal with this type of data. Among the most recent exercised sciences in this field are KDD in databases at the top of DM and discovery science in discovery of knowledge of data in databases (KDD) Fayyad, et.all. as an attached image. In academic and academic institutions, scientific knowledge can be used to explore knowledge and explore data to improve academic performance by devising these data types of institutions for students and faculty Márquez-Vera, et.all. This is related to key performance indicators such as student achievements. duration rate, and staff fineness. Educational institutions, for example, can portend students who teardrop out students who will be students who have low academic accomplishment will graduates and other strategically information, and then can survey and develop educational politicking to help these student upgrade their education or guide them to disciplines That fit with their abilities, preparations, preferences, abilities and other politics and measures that will mend academic showing at the educational institution Prajapati, M. M, et.all.
39
AURUM MÜHENDİSLİK SİSTEMLERİ VE MİMARLIK DERGİSİAURUM JOURNAL OF ENGINEERING SYSTEMS AND ARCHITECTURE
2. PROBLEM OF STUDY
The low level of educational attainment is a big problem that needs to be solved. It is multidimensional problem that is sometimes psychological and sometimes a social problem. The problem of the study is determined by finding the factors that lead to the low achievement in the grades of students in the stage of education in the baccalaureate exams. The third average in Iraq.
3. LITERATURE REVIEW
This section presents a series of previous studies that are directly and indirectly related to the topic Many studies around the world have applied data mining algorithms to discover knowledge Educational applications for data mining in education, focusing on inputs and outputs of the educational process And how they affect each other:
Osmanbegovic, Edin, Suljic, Mirza, They collected student data during the summer semesters of the 2010-2011 academic year from the University of Tuzla, university of Economics, between first-year student and data taken through enrollments. Success was evaluated with the success grade of the exam. Student influence of social and demographics variable, result from high school and from the entrance exam, and attitude towards study that can have an impact on success. The purpose of the study was to find the best technique for portend student performance Osmanbegovic, E., & Suljic, et.all .
And Alom, et al., (2018) trajectory’s the students of Australia inception from their elementary school year 1 to accomplishment of their high school successfully and furthermore it too trajectory’s their consent into the higher educational universities or foundations. The criteria on which they are calculating the successive rates of the students is the gender of the students. In this paper data mining software Wilson calculator is used which is a practical meta-analysis effect size calculator and Orange so as to analyze data. Orange for given data sets provide the predictive modeling and the visualizations solutions Alom, B. M. M., & Courtney, et.all.
In 2013 Marquez Vera and Sergey Rovira proposed a method, and they used real data for a group of 670 students from the Zacatecas School, located in Mexico and data from the University of Barcelona. They used the classification method, machine learning in the white box, induction rules and decision tree algorithms. Three hypothesis-based trials were conducted to find the failure rate and the dropout rate at school. They used the method of selecting features, out of seventy-seven traits, only fifteen were considered, which is considered the best in education systems.Dimensional modeling and statistical techniques are also implemented in this work. The Weka tool is used, and the results are not represented in graphical form for a better understanding. The problem of data imbalance is resolved efficiently. In order to predict student performance based on pre-university and personal characteristics. Márquez-Vera, et.all
N. Rachbure and W. Punlumjeak suggested a comparison of four methods for selecting IG, GAs, SVM, Min-Red and Max-Rel features with four supervised technologies: KNN, DT, NB and NN. They found that Max-Rel and Min-Red are the best method with a accuracy of 99.12% using KNN. N. Hafieza, AA Aziz and Ahmad of UniSZA proposed a framework to predict the academic performance of students for undergraduate
40
Karrar Hussein aLi, sefer KurnaZ
students in the first year of the CS course between July 2006/07 and July 2013/14 using the DT, NB and RB rating and found that RB is the best model with a 71.3% accuracy Aldikanji, E., & Ajami, et.all.
Asif, R., et al (2017) Studies the performance related to the education of the students. The data taken of the students is focused on two aspects. Firstly, achievement of the student is predicted at the completion of the four year study programme. Then predictions are combined with the progressions. The outcomes is the generation of two groups of students, low and high grade achieving students. By this teachers get to support the students at the low level by giving them activities and the task and to the high level students more opportunities are given Asif, R., Merceron, A., Ali, et.all.
Kabakchieva used a set of educational data to analyze by using data mining algorithms. He used two techniques: Decision Tree and Bayes. Using the Weka application tool, data for 10,330 students and 20 teachers were collected and considered. Weka classification filters are implemented on datasets by an algorithm, where JRip and J48 provide accurate and reliable results. Bayes workbook and kNN workbooks are inaccurate Kabakchieva, et.all.
Another method proposed by Ahmed and his colleagues is used to predict student performance using the Weka tool by applying the included decision tree techniques, artificial intelligence, classification methods, neural networks, grouping, regression, and associate rules. ID3 methods have been used. On a set of data consisting of 1547 record used to predict performance. Used to implement decision tree. This method does not verify attributes such as mood, presence, and environmental factors. Another proposed model is based on longitudinal data derived from data from Gwinnett County public schools, and students who entered the 8th grade assessment in science and mathematics are implemented by Tamhan and his colleagues Aunsan, S., & Thammaboosadee, et.all. For missing values, the use of logistic regression, dependency, and Bayes classifier and decision trees means implementation techniques. They use the SPSS and weka designer taking into account demographics. From all these techniques logistic regression provides the best results. There was a problem filling the missing values. Produces noise forecasts and not a single workbook is enough for entire student data. Aggregation should be a practical option for optimizing risk prediction of student performance. Behavioral data and relevant recording factors should also be considered.
Tavares, R., et al,(2017) The prime focus of this paper is to enhance the digital educational resources in primary school for science education by implementing on the data mining techniques. There is a lot of impact on the students for the self regulated learning after adopting the learning approach. The analyses of the students behaviour is done after getting the particular help and the recommendations Tavares, R., Vieira, R., & Pedro, et.all.
4. ABOUT EDM
The term spread with the first workshop on the concept of EDM in 2005, which since 2008 has become an annual conference. A periodical has been created to publish the latest research on EDM Dellinger Dissertation,et.all.( EDM) One of the most important systems promoted, by the state and society is the educational system, so most of the scientific researches and studies, have spread to find ways to develop
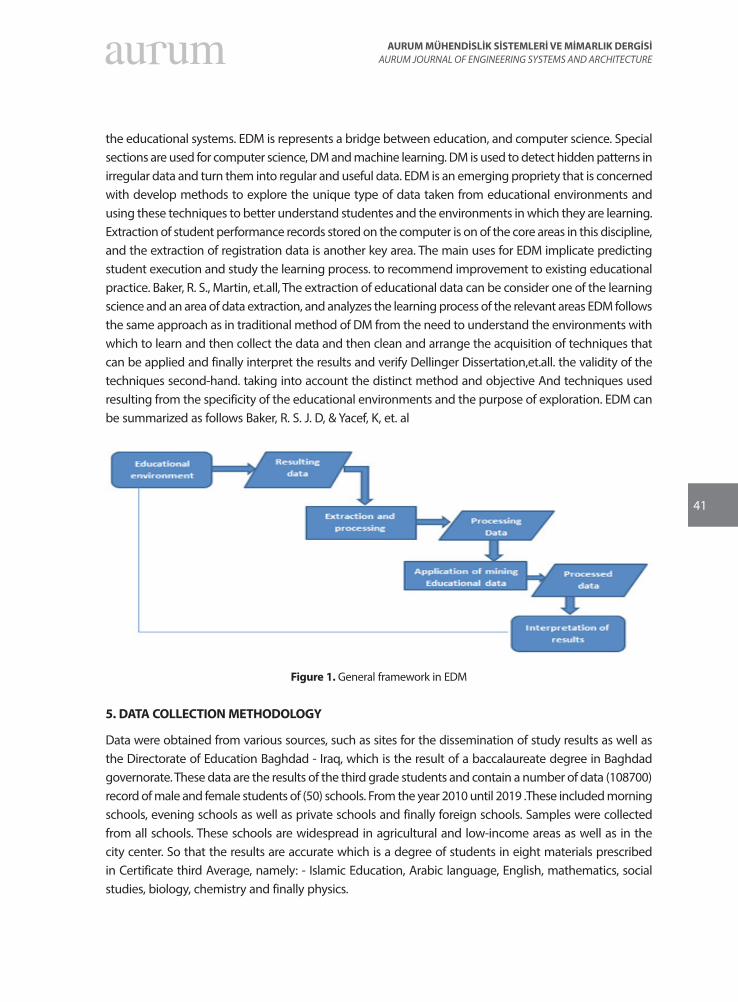
41
AURUM MÜHENDİSLİK SİSTEMLERİ VE MİMARLIK DERGİSİAURUM JOURNAL OF ENGINEERING SYSTEMS AND ARCHITECTURE
the educational systems. EDM is represents a bridge between education, and computer science. Special sections are used for computer science, DM and machine learning. DM is used to detect hidden patterns in irregular data and turn them into regular and useful data. EDM is an emerging propriety that is concerned with develop methods to explore the unique type of data taken from educational environments and using these techniques to better understand studentes and the environments in which they are learning. Extraction of student performance records stored on the computer is on of the core areas in this discipline, and the extraction of registration data is another key area. The main uses for EDM implicate predicting student execution and study the learning process. to recommend improvement to existing educational practice. Baker, R. S., Martin, et.all, The extraction of educational data can be consider one of the learning science and an area of data extraction, and analyzes the learning process of the relevant areas EDM follows the same approach as in traditional method of DM from the need to understand the environments with which to learn and then collect the data and then clean and arrange the acquisition of techniques that can be applied and finally interpret the results and verify Dellinger Dissertation,et.all. the validity of the techniques second-hand. taking into account the distinct method and objective And techniques used resulting from the specificity of the educational environments and the purpose of exploration. EDM can be summarized as follows Baker, R. S. J. D, & Yacef, K, et. al
Figure 1. General framework in EDM
5. DATA COLLECTION METHODOLOGY
Data were obtained from various sources, such as sites for the dissemination of study results as well as the Directorate of Education Baghdad - Iraq, which is the result of a baccalaureate degree in Baghdad governorate. These data are the results of the third grade students and contain a number of data (108700) record of male and female students of (50) schools. From the year 2010 until 2019 .These included morning schools, evening schools as well as private schools and finally foreign schools. Samples were collected from all schools. These schools are widespread in agricultural and low-income areas as well as in the city center. So that the results are accurate which is a degree of students in eight materials prescribed in Certificate third Average, namely: - Islamic Education, Arabic language, English, mathematics, social studies, biology, chemistry and finally physics.
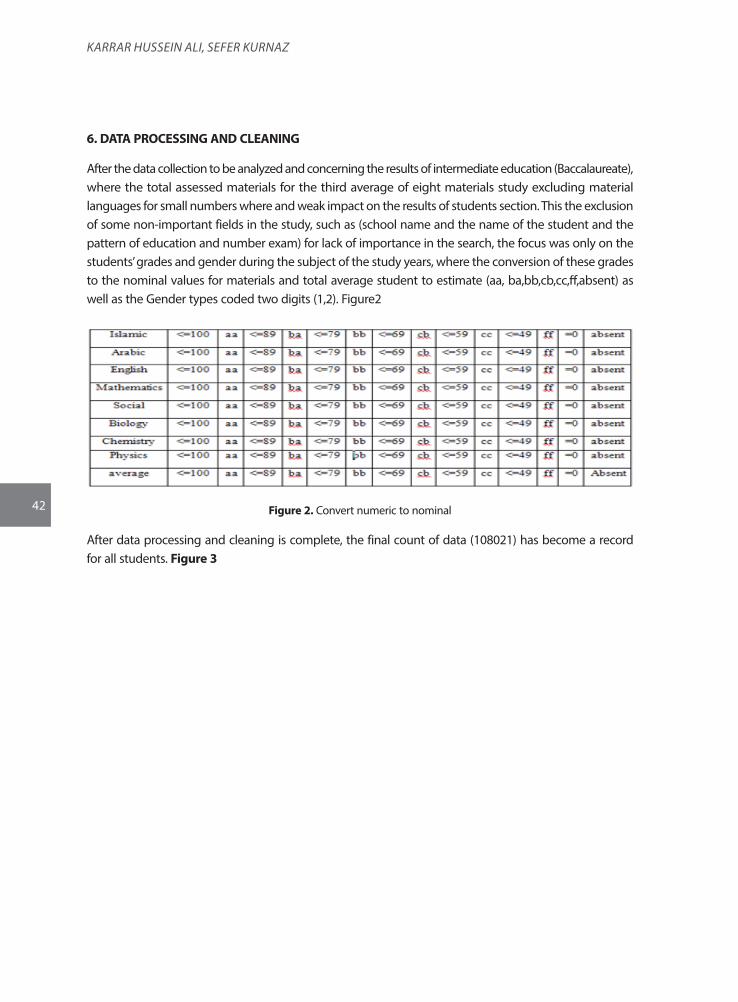
42
Karrar Hussein aLi, sefer KurnaZ
6. DATA PROCESSING AND CLEANING
After the data collection to be analyzed and concerning the results of intermediate education (Baccalaureate), where the total assessed materials for the third average of eight materials study excluding material languages for small numbers where and weak impact on the results of students section. This the exclusion of some non-important fields in the study, such as (school name and the name of the student and the pattern of education and number exam) for lack of importance in the search, the focus was only on the students’ grades and gender during the subject of the study years, where the conversion of these grades to the nominal values for materials and total average student to estimate (aa, ba,bb,cb,cc,ff,absent) as well as the Gender types coded two digits (1,2). Figure2
Figure 2. Convert numeric to nominal
After data processing and cleaning is complete, the final count of data (108021) has become a record for all students. Figure 3
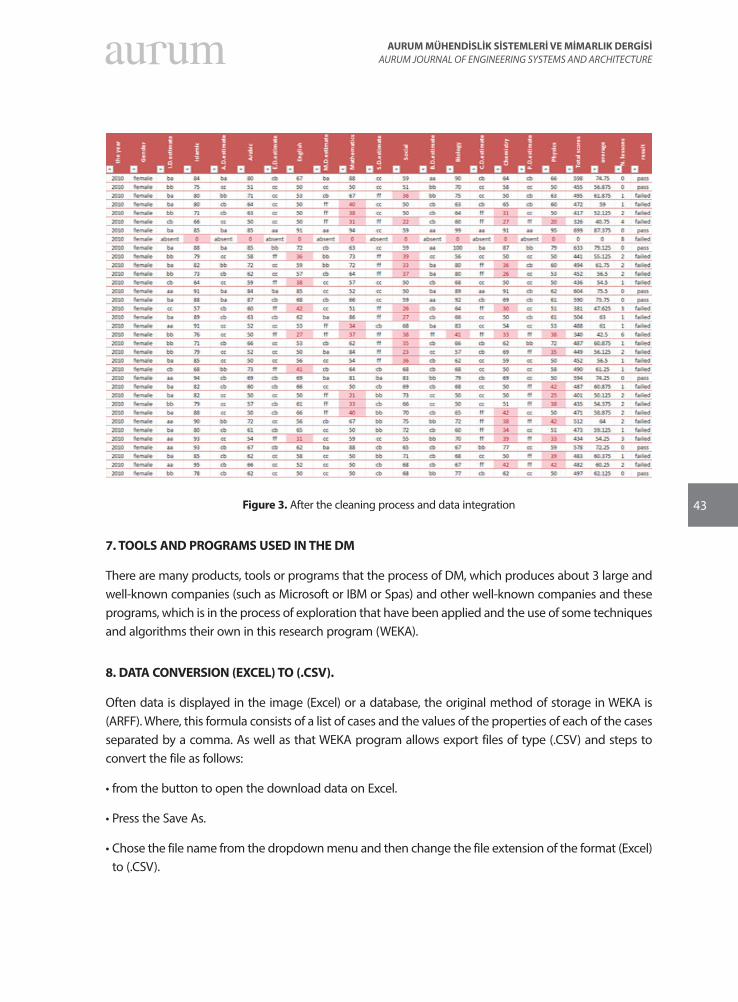
43
AURUM MÜHENDİSLİK SİSTEMLERİ VE MİMARLIK DERGİSİAURUM JOURNAL OF ENGINEERING SYSTEMS AND ARCHITECTURE
Figure 3. After the cleaning process and data integration
7. TOOLS AND PROGRAMS USED IN THE DM
There are many products, tools or programs that the process of DM, which produces about 3 large and well-known companies (such as Microsoft or IBM or Spas) and other well-known companies and these programs, which is in the process of exploration that have been applied and the use of some techniques and algorithms their own in this research program (WEKA).
8. DATA CONVERSION (EXCEL) TO (.CSV).
Often data is displayed in the image (Excel) or a database, the original method of storage in WEKA is (ARFF). Where, this formula consists of a list of cases and the values of the properties of each of the cases separated by a comma. As well as that WEKA program allows export files of type (.CSV) and steps to convert the file as follows:
• from the button to open the download data on Excel.
• Press the Save As.
• Chose the file name from the dropdown menu and then change the file extension of the format (Excel) to (.CSV).
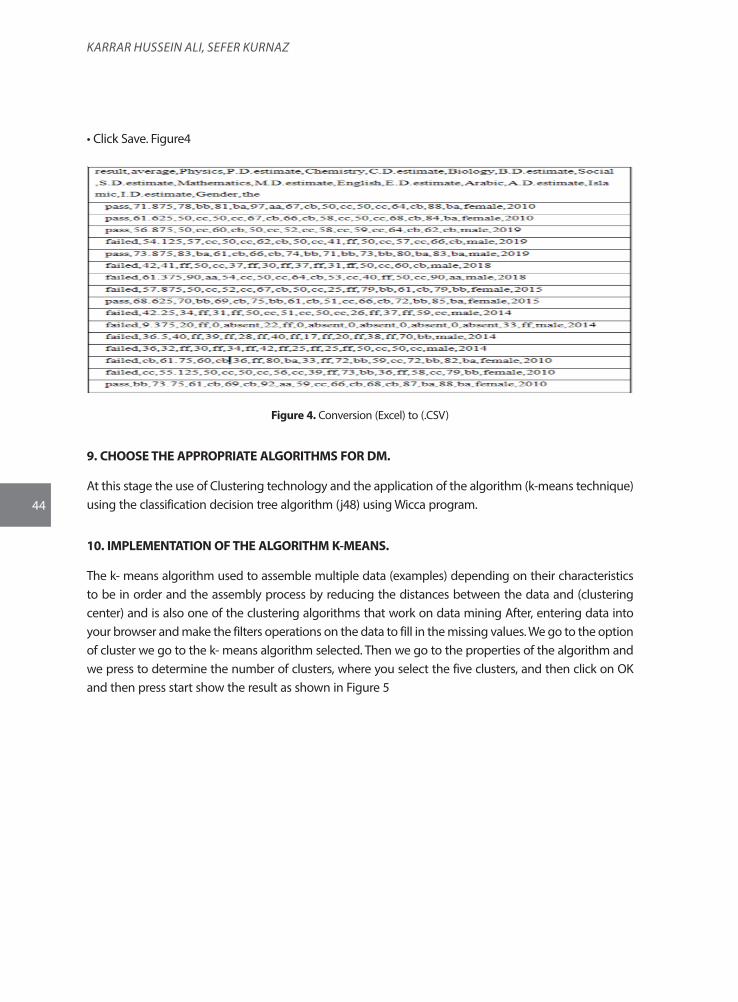
44
Karrar Hussein aLi, sefer KurnaZ
• Click Save. Figure4
Figure 4. Conversion (Excel) to (.CSV)
9. CHOOSE THE APPROPRIATE ALGORITHMS FOR DM.
At this stage the use of Clustering technology and the application of the algorithm (k-means technique) using the classification decision tree algorithm (j48) using Wicca program.
10. IMPLEMENTATION OF THE ALGORITHM K-MEANS.
The k- means algorithm used to assemble multiple data (examples) depending on their characteristics to be in order and the assembly process by reducing the distances between the data and (clustering center) and is also one of the clustering algorithms that work on data mining After, entering data into your browser and make the filters operations on the data to fill in the missing values. We go to the option of cluster we go to the k- means algorithm selected. Then we go to the properties of the algorithm and we press to determine the number of clusters, where you select the five clusters, and then click on OK and then press start show the result as shown in Figure 5
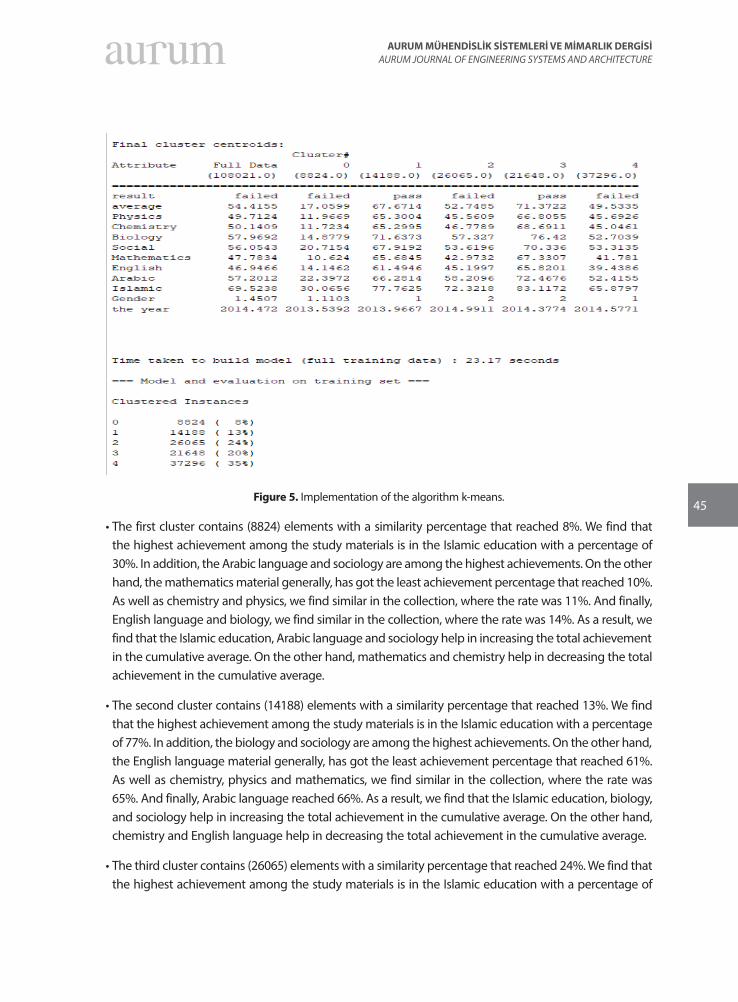
45
AURUM MÜHENDİSLİK SİSTEMLERİ VE MİMARLIK DERGİSİAURUM JOURNAL OF ENGINEERING SYSTEMS AND ARCHITECTURE
Figure 5. Implementation of the algorithm k-means.
• The first cluster contains (8824) elements with a similarity percentage that reached 8%. We find that the highest achievement among the study materials is in the Islamic education with a percentage of 30%. In addition, the Arabic language and sociology are among the highest achievements. On the other hand, the mathematics material generally, has got the least achievement percentage that reached 10%. As well as chemistry and physics, we find similar in the collection, where the rate was 11%. And finally, English language and biology, we find similar in the collection, where the rate was 14%. As a result, we find that the Islamic education, Arabic language and sociology help in increasing the total achievement in the cumulative average. On the other hand, mathematics and chemistry help in decreasing the total achievement in the cumulative average.
• The second cluster contains (14188) elements with a similarity percentage that reached 13%. We find that the highest achievement among the study materials is in the Islamic education with a percentage of 77%. In addition, the biology and sociology are among the highest achievements. On the other hand, the English language material generally, has got the least achievement percentage that reached 61%. As well as chemistry, physics and mathematics, we find similar in the collection, where the rate was 65%. And finally, Arabic language reached 66%. As a result, we find that the Islamic education, biology, and sociology help in increasing the total achievement in the cumulative average. On the other hand, chemistry and English language help in decreasing the total achievement in the cumulative average.
• The third cluster contains (26065) elements with a similarity percentage that reached 24%. We find that the highest achievement among the study materials is in the Islamic education with a percentage of
46
Karrar Hussein aLi, sefer KurnaZ
72%. In addition, the Arabic language and biology are among the highest achievements. On the other hand, the mathematics material generally, has got the least achievement percentage that reached 42%. As well as English language and physics, we find similar in the collection, where the rate was 45%. As chemistry had 46%, and finally, sociology reached 53%. As a result, we find that the Islamic education, biology, and Arabic language help in increasing the total achievement in the cumulative average. On the other hand, Mathematics and English language help in decreasing the total achievement in the cumulative average.
• The fourth cluster contains (21648) elements with a similarity percentage that reached 20%.We find that the highest achievement among the study materials is in the Islamic education with a percentage of 83%.In addition, the Arabic language and biology are among the highest achievements. On the other hand, the English language material generally, has got the least achievement percentage that reached 65%.Moreover, physics is nearly the same with the percentage of 66%.Also, and Mathematics had 67%. As chemistry had 68%, and finally, sociology reached 70%.As a result, we find that the Islamic education, Arabic language and biology help in increasing the total achievement in the cumulative average. On the other hand, English language and physics help in decreasing the total achievement in the cumulative average.
• Cluster fifth contains (37296) elements with a similarity percentage that reached 35%. We find that the highest achievement among the study materials is in the Islamic education with a percentage of 65%. In addition, the sociology and biology are among the highest achievements. On the other hand, the English language material generally, has got the least achievement percentage that reached 39%. As well as chemistry and physics, we find similar in the collection, where the rate was 45%. Moreover, Arabic language is nearly the same with the percentage of 52%, finally, where the mathematics reached 41%. As a result, we find that the Islamic education, biology, and sociology help in increasing the total achievement in the cumulative average. On the other hand, English language and mathematics help in decreasing the total achievement in the cumulative average.
• In other respects
1. Note the first cluster and the third cluster are similar in, the highest achievement rate in Islamic education and Arabic language, and the lowest achievement in mathematics.
2. The third cluster and the fifth cluster are similar in, the highest achievement rate in Islamic education. The lowest achievement in English and mathematics. Sociology and physics are similar in the collection.
3. The second cluster and the fourth cluster are similar, and the highest achievement rate in Islamic education, the lowest percentage in English.
4. Cluster second and fifth is different in achievement where the male is more than the female.
5. The third cluster is different in achievement where the female is more than the male.
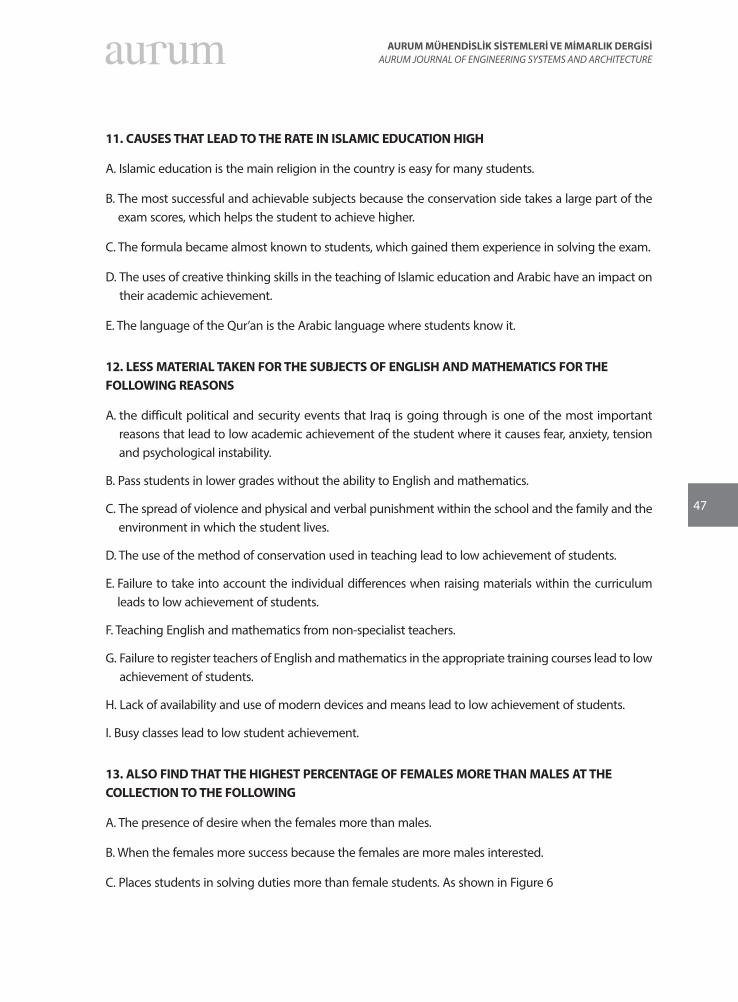
47
AURUM MÜHENDİSLİK SİSTEMLERİ VE MİMARLIK DERGİSİAURUM JOURNAL OF ENGINEERING SYSTEMS AND ARCHITECTURE
11. CAUSES THAT LEAD TO THE RATE IN ISLAMIC EDUCATION HIGH
A. Islamic education is the main religion in the country is easy for many students.
B. The most successful and achievable subjects because the conservation side takes a large part of the exam scores, which helps the student to achieve higher.
C. The formula became almost known to students, which gained them experience in solving the exam.
D. The uses of creative thinking skills in the teaching of Islamic education and Arabic have an impact on their academic achievement.
E. The language of the Qur’an is the Arabic language where students know it.
12. LESS MATERIAL TAKEN FOR THE SUBJECTS OF ENGLISH AND MATHEMATICS FOR THE FOLLOWING REASONS
A. the difficult political and security events that Iraq is going through is one of the most important reasons that lead to low academic achievement of the student where it causes fear, anxiety, tension and psychological instability.
B. Pass students in lower grades without the ability to English and mathematics.
C. The spread of violence and physical and verbal punishment within the school and the family and the environment in which the student lives.
D. The use of the method of conservation used in teaching lead to low achievement of students.
E. Failure to take into account the individual differences when raising materials within the curriculum leads to low achievement of students.
F. Teaching English and mathematics from non-specialist teachers.
G. Failure to register teachers of English and mathematics in the appropriate training courses lead to low achievement of students.
H. Lack of availability and use of modern devices and means lead to low achievement of students.
I. Busy classes lead to low student achievement.
13. ALSO FIND THAT THE HIGHEST PERCENTAGE OF FEMALES MORE THAN MALES AT THE COLLECTION TO THE FOLLOWING
A. The presence of desire when the females more than males.
B. When the females more success because the females are more males interested.
C. Places students in solving duties more than female students. As shown in Figure 6
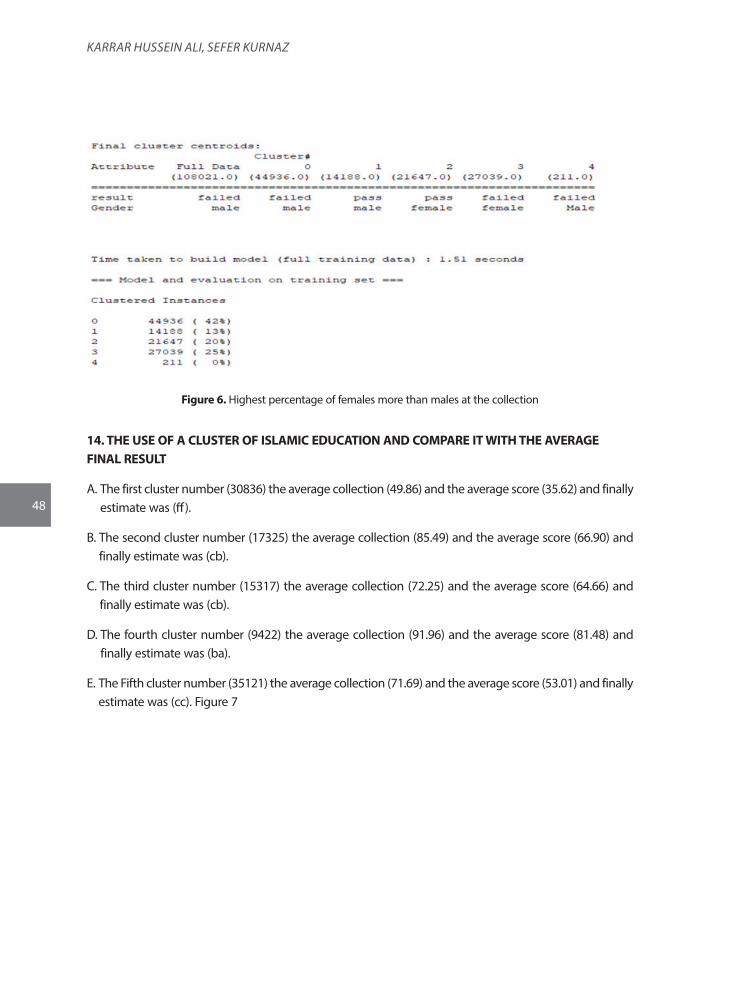
48
Karrar Hussein aLi, sefer KurnaZ
Figure 6. Highest percentage of females more than males at the collection
14. THE USE OF A CLUSTER OF ISLAMIC EDUCATION AND COMPARE IT WITH THE AVERAGE FINAL RESULT
A. The first cluster number (30836) the average collection (49.86) and the average score (35.62) and finally estimate was (ff).
B. The second cluster number (17325) the average collection (85.49) and the average score (66.90) and finally estimate was (cb).
C. The third cluster number (15317) the average collection (72.25) and the average score (64.66) and finally estimate was (cb).
D. The fourth cluster number (9422) the average collection (91.96) and the average score (81.48) and finally estimate was (ba).
E. The Fifth cluster number (35121) the average collection (71.69) and the average score (53.01) and finally estimate was (cc). Figure 7
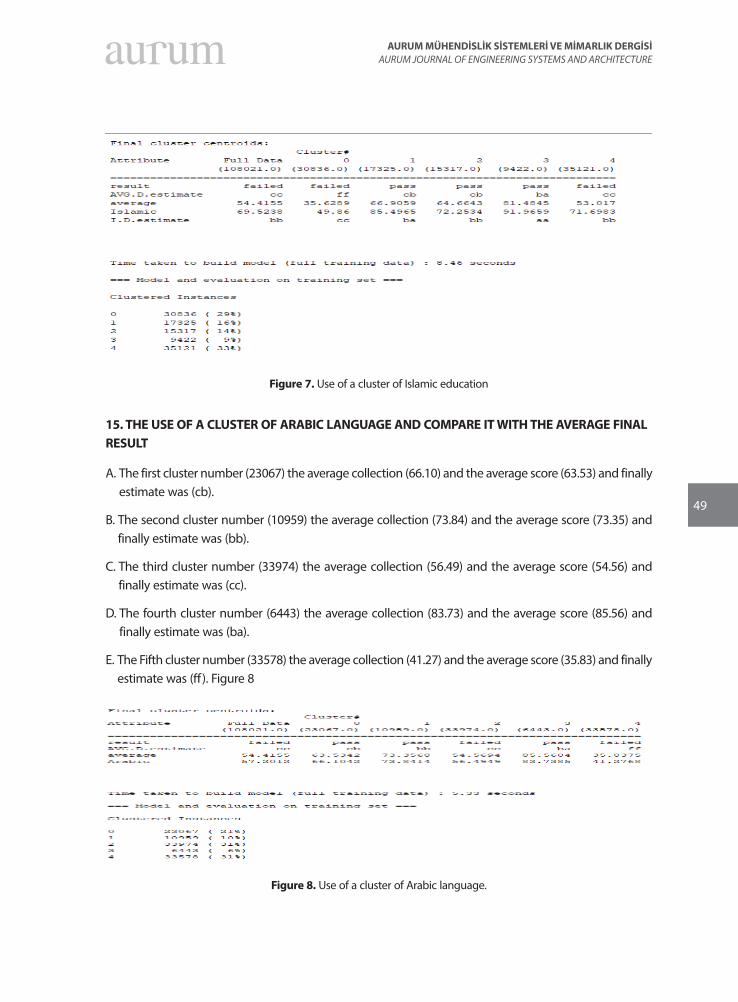
49
AURUM MÜHENDİSLİK SİSTEMLERİ VE MİMARLIK DERGİSİAURUM JOURNAL OF ENGINEERING SYSTEMS AND ARCHITECTURE
Figure 7. Use of a cluster of Islamic education
15. THE USE OF A CLUSTER OF ARABIC LANGUAGE AND COMPARE IT WITH THE AVERAGE FINAL RESULT
A. The first cluster number (23067) the average collection (66.10) and the average score (63.53) and finally estimate was (cb).
B. The second cluster number (10959) the average collection (73.84) and the average score (73.35) and finally estimate was (bb).
C. The third cluster number (33974) the average collection (56.49) and the average score (54.56) and finally estimate was (cc).
D. The fourth cluster number (6443) the average collection (83.73) and the average score (85.56) and finally estimate was (ba).
E. The Fifth cluster number (33578) the average collection (41.27) and the average score (35.83) and finally estimate was (ff). Figure 8
Figure 8. Use of a cluster of Arabic language.
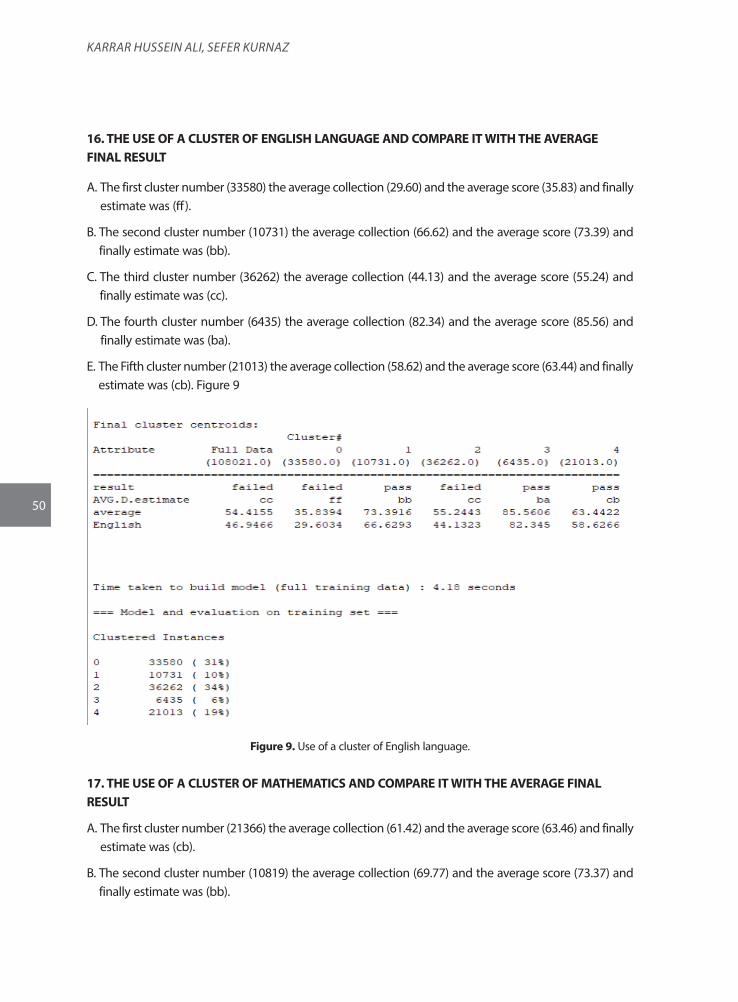
50
Karrar Hussein aLi, sefer KurnaZ
16. THE USE OF A CLUSTER OF ENGLISH LANGUAGE AND COMPARE IT WITH THE AVERAGE FINAL RESULT
A. The first cluster number (33580) the average collection (29.60) and the average score (35.83) and finally estimate was (ff).
B. The second cluster number (10731) the average collection (66.62) and the average score (73.39) and finally estimate was (bb).
C. The third cluster number (36262) the average collection (44.13) and the average score (55.24) and finally estimate was (cc).
D. The fourth cluster number (6435) the average collection (82.34) and the average score (85.56) and finally estimate was (ba).
E. The Fifth cluster number (21013) the average collection (58.62) and the average score (63.44) and finally estimate was (cb). Figure 9
Figure 9. Use of a cluster of English language.
17. THE USE OF A CLUSTER OF MATHEMATICS AND COMPARE IT WITH THE AVERAGE FINAL RESULT
A. The first cluster number (21366) the average collection (61.42) and the average score (63.46) and finally estimate was (cb).
B. The second cluster number (10819) the average collection (69.77) and the average score (73.37) and finally estimate was (bb).
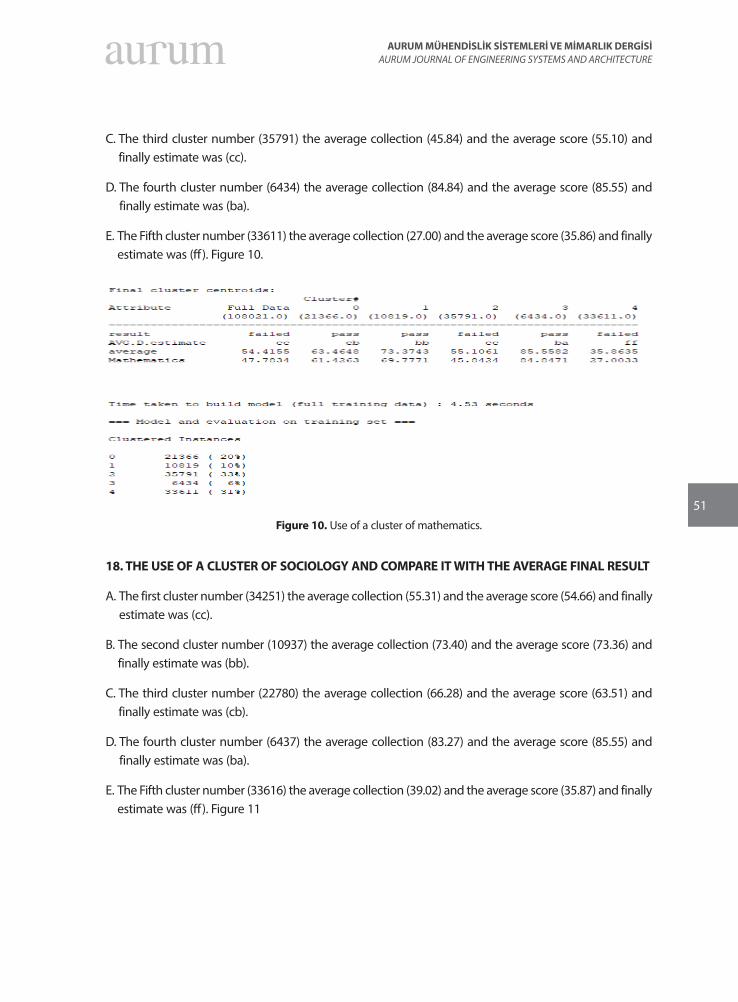
51
AURUM MÜHENDİSLİK SİSTEMLERİ VE MİMARLIK DERGİSİAURUM JOURNAL OF ENGINEERING SYSTEMS AND ARCHITECTURE
C. The third cluster number (35791) the average collection (45.84) and the average score (55.10) and finally estimate was (cc).
D. The fourth cluster number (6434) the average collection (84.84) and the average score (85.55) and finally estimate was (ba).
E. The Fifth cluster number (33611) the average collection (27.00) and the average score (35.86) and finally estimate was (ff). Figure 10.
Figure 10. Use of a cluster of mathematics.
18. THE USE OF A CLUSTER OF SOCIOLOGY AND COMPARE IT WITH THE AVERAGE FINAL RESULT
A. The first cluster number (34251) the average collection (55.31) and the average score (54.66) and finally estimate was (cc).
B. The second cluster number (10937) the average collection (73.40) and the average score (73.36) and finally estimate was (bb).
C. The third cluster number (22780) the average collection (66.28) and the average score (63.51) and finally estimate was (cb).
D. The fourth cluster number (6437) the average collection (83.27) and the average score (85.55) and finally estimate was (ba).
E. The Fifth cluster number (33616) the average collection (39.02) and the average score (35.87) and finally estimate was (ff). Figure 11
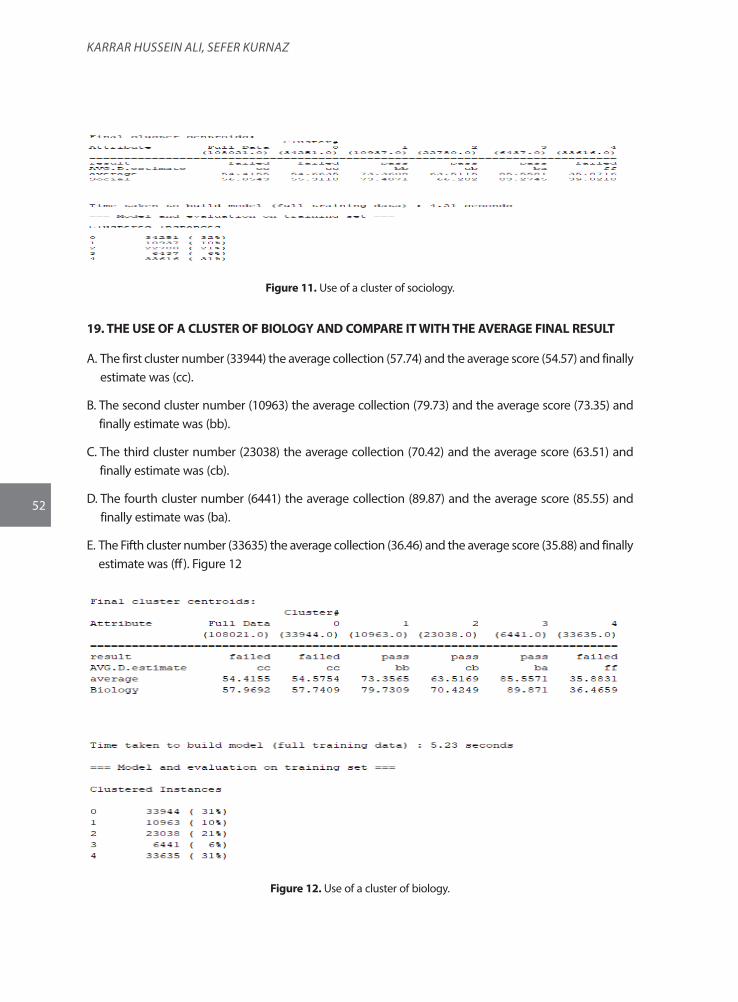
52
Karrar Hussein aLi, sefer KurnaZ
Figure 11. Use of a cluster of sociology.
19. THE USE OF A CLUSTER OF BIOLOGY AND COMPARE IT WITH THE AVERAGE FINAL RESULT
A. The first cluster number (33944) the average collection (57.74) and the average score (54.57) and finally estimate was (cc).
B. The second cluster number (10963) the average collection (79.73) and the average score (73.35) and finally estimate was (bb).
C. The third cluster number (23038) the average collection (70.42) and the average score (63.51) and finally estimate was (cb).
D. The fourth cluster number (6441) the average collection (89.87) and the average score (85.55) and finally estimate was (ba).
E. The Fifth cluster number (33635) the average collection (36.46) and the average score (35.88) and finally estimate was (ff). Figure 12
Figure 12. Use of a cluster of biology.
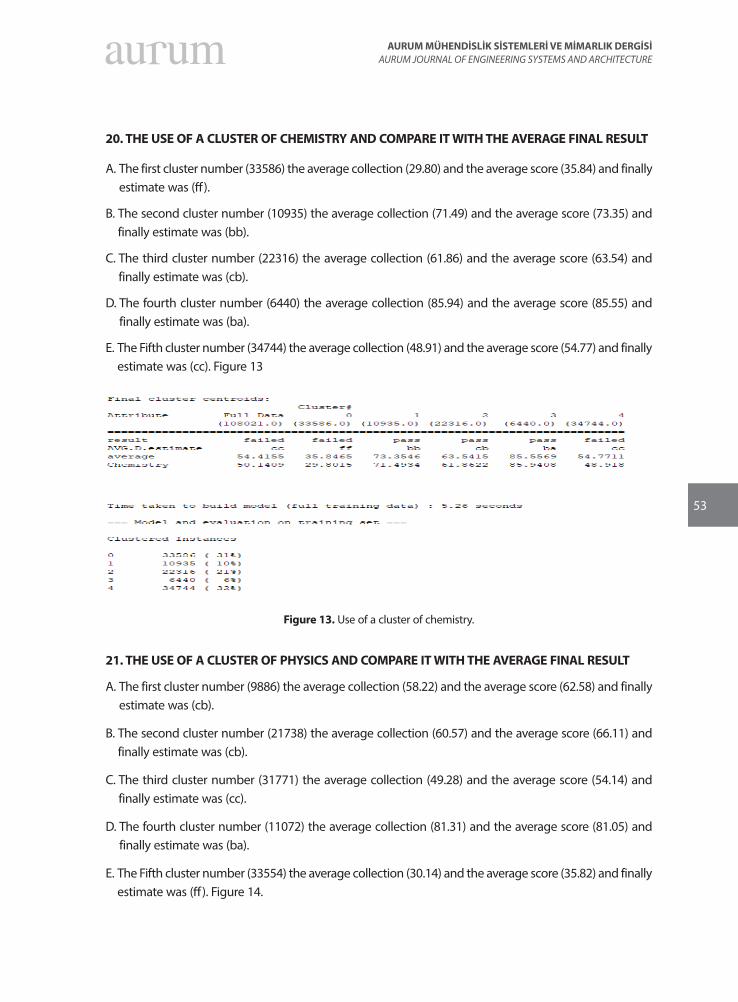
53
AURUM MÜHENDİSLİK SİSTEMLERİ VE MİMARLIK DERGİSİAURUM JOURNAL OF ENGINEERING SYSTEMS AND ARCHITECTURE
20. THE USE OF A CLUSTER OF CHEMISTRY AND COMPARE IT WITH THE AVERAGE FINAL RESULT
A. The first cluster number (33586) the average collection (29.80) and the average score (35.84) and finally estimate was (ff).
B. The second cluster number (10935) the average collection (71.49) and the average score (73.35) and finally estimate was (bb).
C. The third cluster number (22316) the average collection (61.86) and the average score (63.54) and finally estimate was (cb).
D. The fourth cluster number (6440) the average collection (85.94) and the average score (85.55) and finally estimate was (ba).
E. The Fifth cluster number (34744) the average collection (48.91) and the average score (54.77) and finally estimate was (cc). Figure 13
Figure 13. Use of a cluster of chemistry.
21. THE USE OF A CLUSTER OF PHYSICS AND COMPARE IT WITH THE AVERAGE FINAL RESULT
A. The first cluster number (9886) the average collection (58.22) and the average score (62.58) and finally estimate was (cb).
B. The second cluster number (21738) the average collection (60.57) and the average score (66.11) and finally estimate was (cb).
C. The third cluster number (31771) the average collection (49.28) and the average score (54.14) and finally estimate was (cc).
D. The fourth cluster number (11072) the average collection (81.31) and the average score (81.05) and finally estimate was (ba).
E. The Fifth cluster number (33554) the average collection (30.14) and the average score (35.82) and finally estimate was (ff). Figure 14.
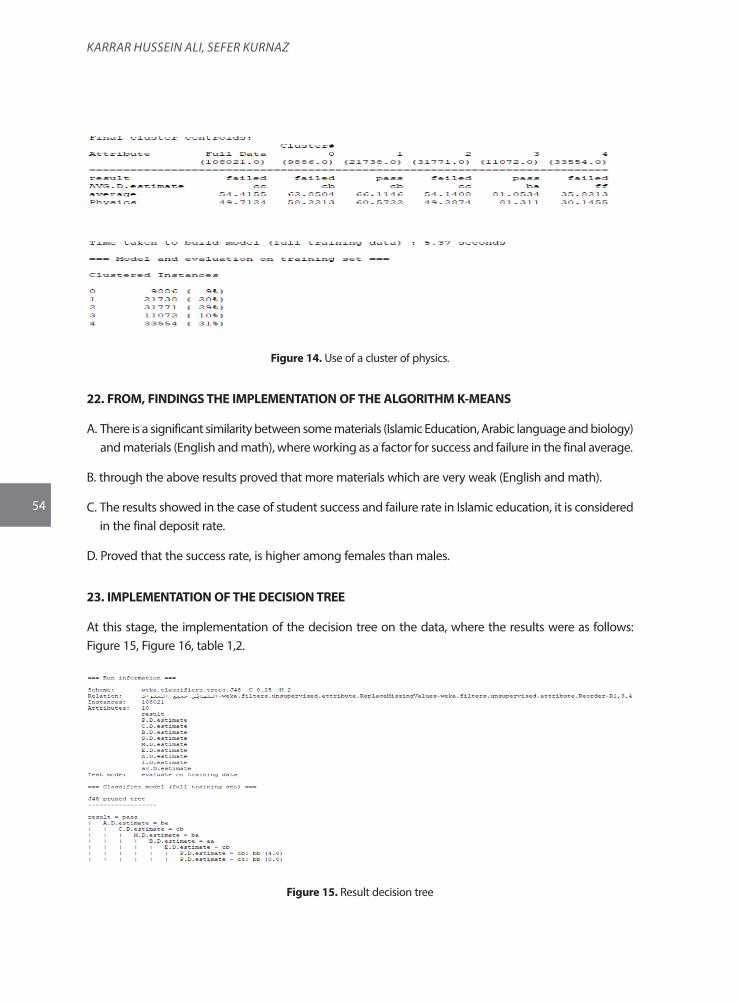
54
Karrar Hussein aLi, sefer KurnaZ
Figure 14. Use of a cluster of physics.
22. FROM, FINDINGS THE IMPLEMENTATION OF THE ALGORITHM K-MEANS
A. There is a significant similarity between some materials (Islamic Education, Arabic language and biology) and materials (English and math), where working as a factor for success and failure in the final average.
B. through the above results proved that more materials which are very weak (English and math).
C. The results showed in the case of student success and failure rate in Islamic education, it is considered in the final deposit rate.
D. Proved that the success rate, is higher among females than males.
23. IMPLEMENTATION OF THE DECISION TREE
At this stage, the implementation of the decision tree on the data, where the results were as follows: Figure 15, Figure 16, table 1,2.
Figure 15. Result decision tree
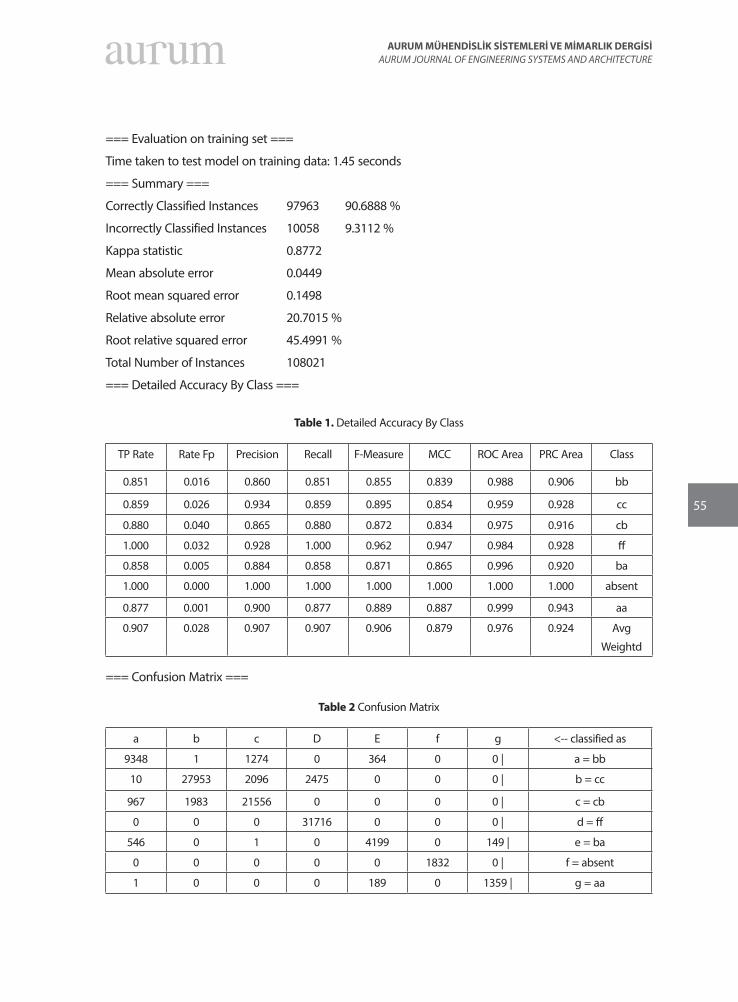
55
AURUM MÜHENDİSLİK SİSTEMLERİ VE MİMARLIK DERGİSİAURUM JOURNAL OF ENGINEERING SYSTEMS AND ARCHITECTURE
=== Evaluation on training set ===
Time taken to test model on training data: 1.45 seconds
=== Summary ===
Correctly Classified Instances 97963 90.6888 %
Incorrectly Classified Instances 10058 9.3112 %
Kappa statistic 0.8772
Mean absolute error 0.0449
Root mean squared error 0.1498
Relative absolute error 20.7015 %
Root relative squared error 45.4991 %
Total Number of Instances 108021
=== Detailed Accuracy By Class ===
Table 1. Detailed Accuracy By Class
TP Rate Rate Fp Precision Recall F-Measure MCC ROC Area PRC Area Class
0.851 0.016 0.860 0.851 0.855 0.839 0.988 0.906 bb
0.859 0.026 0.934 0.859 0.895 0.854 0.959 0.928 cc
0.880 0.040 0.865 0.880 0.872 0.834 0.975 0.916 cb
1.000 0.032 0.928 1.000 0.962 0.947 0.984 0.928 ff
0.858 0.005 0.884 0.858 0.871 0.865 0.996 0.920 ba
1.000 0.000 1.000 1.000 1.000 1.000 1.000 1.000 absent
0.877 0.001 0.900 0.877 0.889 0.887 0.999 0.943 aa
0.907 0.028 0.907 0.907 0.906 0.879 0.976 0.924 Avg
Weightd
=== Confusion Matrix ===
Table 2 Confusion Matrix
a b c D E f g <-- classified as
9348 1 1274 0 364 0 0 | a = bb
10 27953 2096 2475 0 0 0 | b = cc
967 1983 21556 0 0 0 0 | c = cb
0 0 0 31716 0 0 0 | d = ff
546 0 1 0 4199 0 149 | e = ba
0 0 0 0 0 1832 0 | f = absent
1 0 0 0 189 0 1359 | g = aa
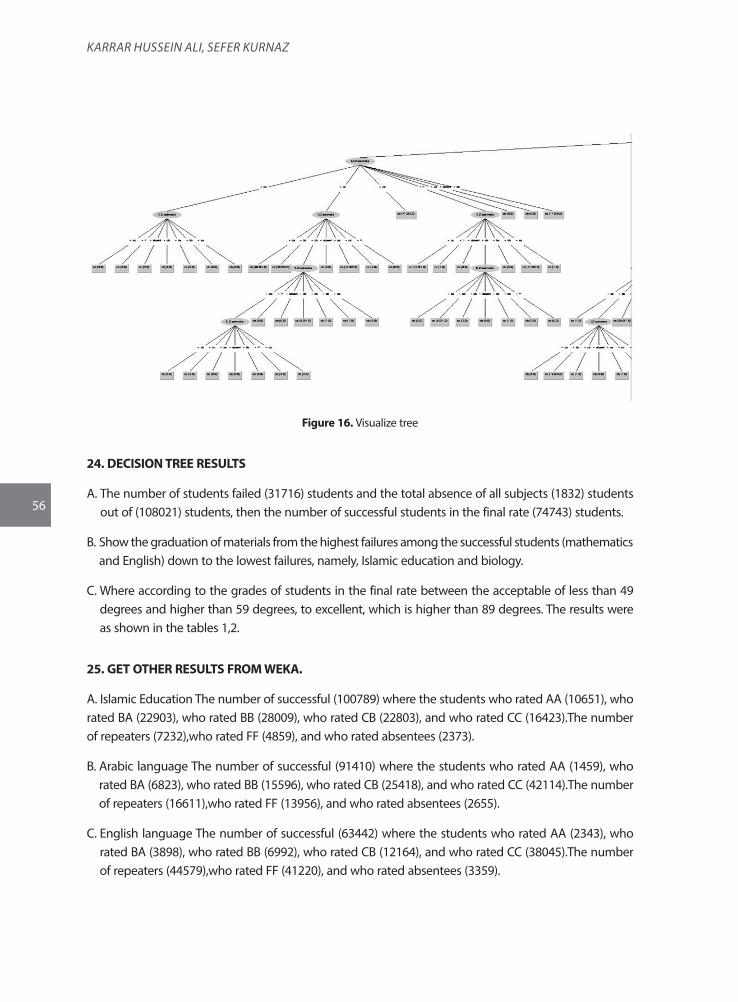
56
Karrar Hussein aLi, sefer KurnaZ
Figure 16. Visualize tree
24. DECISION TREE RESULTS
A. The number of students failed (31716) students and the total absence of all subjects (1832) students out of (108021) students, then the number of successful students in the final rate (74743) students.
B. Show the graduation of materials from the highest failures among the successful students (mathematics and English) down to the lowest failures, namely, Islamic education and biology.
C. Where according to the grades of students in the final rate between the acceptable of less than 49 degrees and higher than 59 degrees, to excellent, which is higher than 89 degrees. The results were as shown in the tables 1,2.
25. GET OTHER RESULTS FROM WEKA.
A. Islamic Education The number of successful (100789) where the students who rated AA (10651), who rated BA (22903), who rated BB (28009), who rated CB (22803), and who rated CC (16423).The number of repeaters (7232),who rated FF (4859), and who rated absentees (2373).
B. Arabic language The number of successful (91410) where the students who rated AA (1459), who rated BA (6823), who rated BB (15596), who rated CB (25418), and who rated CC (42114).The number of repeaters (16611),who rated FF (13956), and who rated absentees (2655).
C. English language The number of successful (63442) where the students who rated AA (2343), who rated BA (3898), who rated BB (6992), who rated CB (12164), and who rated CC (38045).The number of repeaters (44579),who rated FF (41220), and who rated absentees (3359).
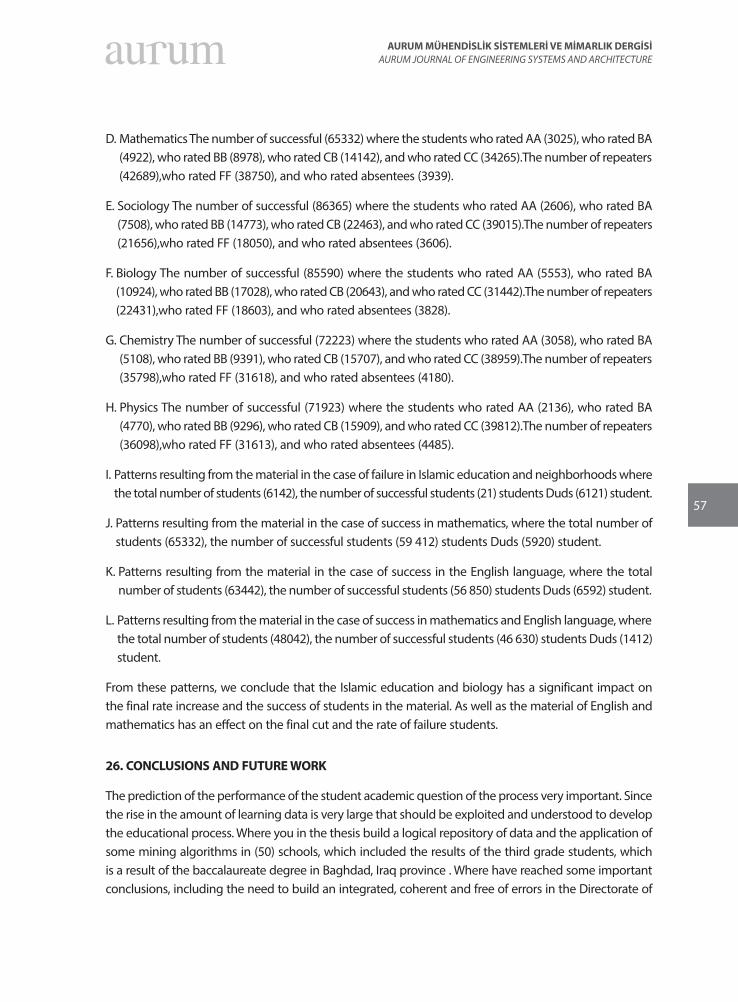
57
AURUM MÜHENDİSLİK SİSTEMLERİ VE MİMARLIK DERGİSİAURUM JOURNAL OF ENGINEERING SYSTEMS AND ARCHITECTURE
D. Mathematics The number of successful (65332) where the students who rated AA (3025), who rated BA (4922), who rated BB (8978), who rated CB (14142), and who rated CC (34265).The number of repeaters (42689),who rated FF (38750), and who rated absentees (3939).
E. Sociology The number of successful (86365) where the students who rated AA (2606), who rated BA (7508), who rated BB (14773), who rated CB (22463), and who rated CC (39015).The number of repeaters (21656),who rated FF (18050), and who rated absentees (3606).
F. Biology The number of successful (85590) where the students who rated AA (5553), who rated BA (10924), who rated BB (17028), who rated CB (20643), and who rated CC (31442).The number of repeaters (22431),who rated FF (18603), and who rated absentees (3828).
G. Chemistry The number of successful (72223) where the students who rated AA (3058), who rated BA (5108), who rated BB (9391), who rated CB (15707), and who rated CC (38959).The number of repeaters (35798),who rated FF (31618), and who rated absentees (4180).
H. Physics The number of successful (71923) where the students who rated AA (2136), who rated BA (4770), who rated BB (9296), who rated CB (15909), and who rated CC (39812).The number of repeaters (36098),who rated FF (31613), and who rated absentees (4485).
I. Patterns resulting from the material in the case of failure in Islamic education and neighborhoods where the total number of students (6142), the number of successful students (21) students Duds (6121) student.
J. Patterns resulting from the material in the case of success in mathematics, where the total number of students (65332), the number of successful students (59 412) students Duds (5920) student.
K. Patterns resulting from the material in the case of success in the English language, where the total number of students (63442), the number of successful students (56 850) students Duds (6592) student.
L. Patterns resulting from the material in the case of success in mathematics and English language, where the total number of students (48042), the number of successful students (46 630) students Duds (1412) student.
From these patterns, we conclude that the Islamic education and biology has a significant impact on the final rate increase and the success of students in the material. As well as the material of English and mathematics has an effect on the final cut and the rate of failure students.
26. CONCLUSIONS AND FUTURE WORK
The prediction of the performance of the student academic question of the process very important. Since the rise in the amount of learning data is very large that should be exploited and understood to develop the educational process. Where you in the thesis build a logical repository of data and the application of some mining algorithms in (50) schools, which included the results of the third grade students, which is a result of the baccalaureate degree in Baghdad, Iraq province . Where have reached some important conclusions, including the need to build an integrated, coherent and free of errors in the Directorate of
58
Karrar Hussein aLi, sefer KurnaZ
Education data warehouse. In addition, I noticed a relationship between some students and materials seep dropping out of the study because of the difficulty of vocabulary, the teacher teaching method or a defect in the school plans and curricula. And also it appeared to me and other important results related to student records such as final rates of relations and the period of interruption trends in academic students and the level of their performance by studying the baccalaureate. As well as after seeing the research appeared a correlation of specific materials low levels for students in which the results of a (English language and mathematics). There are several aspects have not been touched upon, such as the use of other ways cluster with the group of data for more information, and other aspects are not touched upon the lack of resources needed such as updating student data and update missing data for students in the database and the burdens of Iraqi education in order to be effective conclusion in the more patterns and relationships, such as health status, marital status, place of birth, the study of the teaching staff and the extent of data affected by the level of students and recent use of new techniques in data mining, such as genetic algorithm technology. All of these can be developed for future as works.
REFERENCES
Aldikanji, E., and Ajami, K. 2016. Studying Academic Indicators within Virtual Learning Environment Using Educational Data Mining. International Journal of Data Mining & Knowledge Management Process 6(6), 29–42.
Alom, B. M. M., and Courtney, M. 2018. Educational Data Mining: A Case Study Perspectives from Primary to University Education in Australia. International Journal of Information Technology and Computer Science 10(2), 1–9.
Asif, R., Merceron, A., Ali, S. A., Haider, N. G. 2017. Analyzing undergraduate students’ performance using educational data mining. Computers and Education (113), 177–194.
Aunsan, S., and Thammaboosadee, S. 2016. Constructing A Risk Behavior Guideline for Adolescent Students Using Decision Tree 01, 9–13.
Baker, R. S., Martin, T., and Rossi, L. M. 2016. Educational Data Mining and Learning Analytics. The Handbook of Cognition and Assessment, 379–396.
Baker, R. S. J. D., and Yacef, K. 2009. The State of Educational Data Mining in 2009 : A Review and Future Visions. Journal of Educational Data Mining (1)1, 3–16.
Dellinger Dissertation, J. T., Zhang, Y. L., Davis, B. W., Siemens, G. 2019. Pathway To Adopting Learning Analytics: Reconceptualizing the Decision-Making Process of K-12 Leaders in North Texas.
Fayyad, U. 1996. The KDD process for extracting useful knowledge from volumes of data. Communications of the ACM 39(11), 27–34
Kabakchieva, D. 2013. Predicting student performance by using data mining methods for classification. Cybernetics and Information Technologies 13(1), 61–72.

59
AURUM MÜHENDİSLİK SİSTEMLERİ VE MİMARLIK DERGİSİAURUM JOURNAL OF ENGINEERING SYSTEMS AND ARCHITECTURE
Márquez-Vera, C., Cano, A., Romero, C., Ventura, S. 2013. Predicting student failure at school using genetic programming and different data mining approaches with high dimensional and imbalanced data. Applied Intelligence 38(3), 315–330.
Osmanbegovic, E., and Suljic, M. 2012. Data mining approach for predicting student performance. Economic Review: Journal of Economics and Business 10(1), 3-12.
Prajapati, M. M., Patel, V. D., Patel, and D. M. 2018. Experimental investigation of Wire EDM process parameters on surface roughness of AISI 304L during main cut and trim cuts. International Research Journal of Engineering and Technology, 2562–2565.
Sahay S.K., and Sharma A. 2019 A Survey on the Detection of Android Malicious Apps. Advances in Computer Communication and Computational Sciences. Advances in Intelligent Systems and Computing. Vol. 924. Springer, Singapore
Tavares, R., Vieira, R., and Pedro, L. 2017. A preliminary proposal of a conceptual educational data mining framework for science education: Scientific competences development and self-regulated learning. 2017 International Symposium on Computers in Education. SIIE 2017. 2018-January, 1–6.

61
AURUM MÜHENDİSLİK SİSTEMLERİ VE MİMARLIK DERGİSİAURUM JOURNAL OF ENGINEERING SYSTEMS AND ARCHITECTURE
Cilt 4, Sayı 1 | Yaz 2020Volume 4, No 1 | Summer 2020, 61-71
ARAŞTIRMA MAKALESİ / RESEARCH ARTICLE
EFFICIENT ROUTING DISCOVERY ALGORITHM IN MANET
Bakr Kamal Jasim ALANI1
1ALTINBAŞ University, School of Engineering and Natural Science, Mahmutbey, Istanbul, Turkey [email protected] ORCID: 0000-0001-9500-3412
Çağatay AYDIN1
1ALTINBAŞ University, School of Engineering and Natural Science, Mahmutbey, Istanbul, Turkey [email protected] ORCID: 0000-0002-1895-0333
Dogu Cagdas ATİLLA1
1ALTINBAŞ University, School of Engineering and Natural Science, Mahmutbey, Istanbul, Turkey [email protected] ORCID: 0000-0002-4249-6951
GELİŞ TARİHİ/RECEIVED DATE: 08.01.2019 KABUL TARİHİ/ACCEPTED DATE: 24.12.2019
Abstract
There is a recent wireless technology called Mobile Ad-hoc Network (MANET) with a vast range of applications. MANET without infrastructure leads to routing faces challenges. A broadcasting technique is utilized in a MANET to find a route in on-demand routing protocols. Establishment and regular maintenance of a route represent the important challenge issues. Therefore, nodes require to control the broadcast packets among themselves. This situation leads to broadcast storm problem, which increases link breakage, reduce the duration and decreases the overall performance of the network. The commonly ideal protocol of MANET is reactive routing protocols, due to less control overhead and scalability. However, due to the mobility of the nodes, there is a frequent link breakages they are continually suffers and a new reactive routing protocol is proposed Aware Ad-Hoc On-demand Distance Vector routing protocol - Power and Time Direction Predication (AODV-PTD) aim to handle the diminish the connection breakages and get a steady route in Ad-Hoc networks. AODV-PTD evidence the route discovery and route reply depending on the power, time of the taking an interest hubs and their headings. In addition, the proposed AODV-PTD algorithm reduced the network overhead. Network reenactment version 2.35 (NS2.35) was utilized for looking at the proposed calculation with AODV routing protocol in terms end-to-end delay, average throughput, and packet delivery ratio.
Keywords: wireless ad-hoc network, mobile ad-hoc network, reactive routing protocol, aware ad-hoc on-demand distance vector, AODV, MANET.
MANET İÇİN VERİMLİ YÖNLENDİRME KEŞİF ALGORİTMASI
Özet
Mobil Tasarsız Ağ (Mobile Ad-Hoc Network - MANET), günümüzde çeşitli uygulamalara sahip yeni nesil kablosuz haberleşme ağlarında birdir. Ancak altyapısız olan MANET sıklıkla yönlendirme sorunlarıyla karşılaşmaktadır. İsteğe bağlı yönlendirme protokollerinde bir yol bulmak için MANET’te özel bir yayın tekniği kullanılmaktadır.
62
Bakr kamal Jasim alani, Çağatay ayDin, Dogu CagDas atilla
Bir rotanın kurulması ve düzenli bakımı göz önünde bulundurulması gereken başlıca zorluklarındandır. Bu nedenle, düğümlerin yayın paketlerini kendi aralarında kontrol etmeleri gerekir. Bu durum, bağlantı kopmasını artıran, süreyi azaltan ve ağın genel performansını azaltan yayın fırtınası sorununa yol açar. İdeal MANET protokolü olarak genellikle ek yükün daha az kontrol edilmesinin gerekmesi ve ölçeklenebilirlik nedeniyle reaktif yönlendirme protokolleri kullanılmaktadır. Bu çalışmada düğümlerin hareketliliği nedeniyle, sıklıkla bağlantı kopması önlemek için Farkındalıklı Tasarsız Geçici Mesafe Vektörü Yönlendirme Protokolü - Güç ve Zaman Yön Tahmini (Aware Ad-Hoc On-demand Distance Vector Routing Protocol - Power and Time Direction Predication - AODV-PTD) diye adlandırılan yeni bir reaktif yönlendirme protokolü önerilmektedir. Böylece tasarsız ağlarda bağlantı kopmalarının azaltılması ve istikrarlı bir yol izlenmesi hedeflenmektedir. AODV-PTD, güce, ilgili merkezlerde geçirdiği süreye ve başlıklarına bağlı olarak rotanın bulunması ve rotanın cevabını tespit etmeyi amaçlamaktadır. Bunlara ek olarak, önerilen AODV-PTD algoritması ağ yükünü düşürmektedir. Önerilen AODV yönlendirme protokolünün, uçtan uca gecikmesini, ortalama doğrudan veri transferi ve paket teslim oranını analiz etmek için Network Reenactment v2.35 (NS2.35) programı kullanılmıştır.
Anahtar Kelimeler: kablosuz ad-hoc ağlar, mobil ad-hoc ağlar, reaktif yönlendirme protokolü, farkındalıklı ad-hoc geçici mesafe vektörü yönlendirme protokolü, AODV, MANET
1. INTRODUCTION
Mobile Ad-hoc Network (MANET) had been a popular field of study during the last few years. MANET is a self-designing nodes in network of and associated without control. In MANET is multi-hop wireless network connection, without base station and changes dynamically structure of the network, shown in Figure 1. There are two cases when the data is transmitted by a mobile node to a destination node which depend on the range of wireless transmission. The first case, if two mobile nodes within transmission ranges, which that can communicate together directly. The second, a set of intermediate nodes is determined between the source and the destination nodes by the source node. When the source node (S) needs to transmit a packet to the node (A) this can connect directly, due to the two nodes in the transmission range. Another hand, the node S need to transmit the packet to the node B, The node B is out the transmission range, therefore, they cannot connect directly, the node A act an intermediate node to forward the packet between them. In order to find an optimal set of intermediate nodes between the source and the destination node process is called as route discovery.
MANET nodes have random mobility in the network. The nodes are consisted smart phones, tablets, and laptops. MANET is one of the most important technologies in wireless communication in that has wide application field (Alani and Alsaqour, 2017).
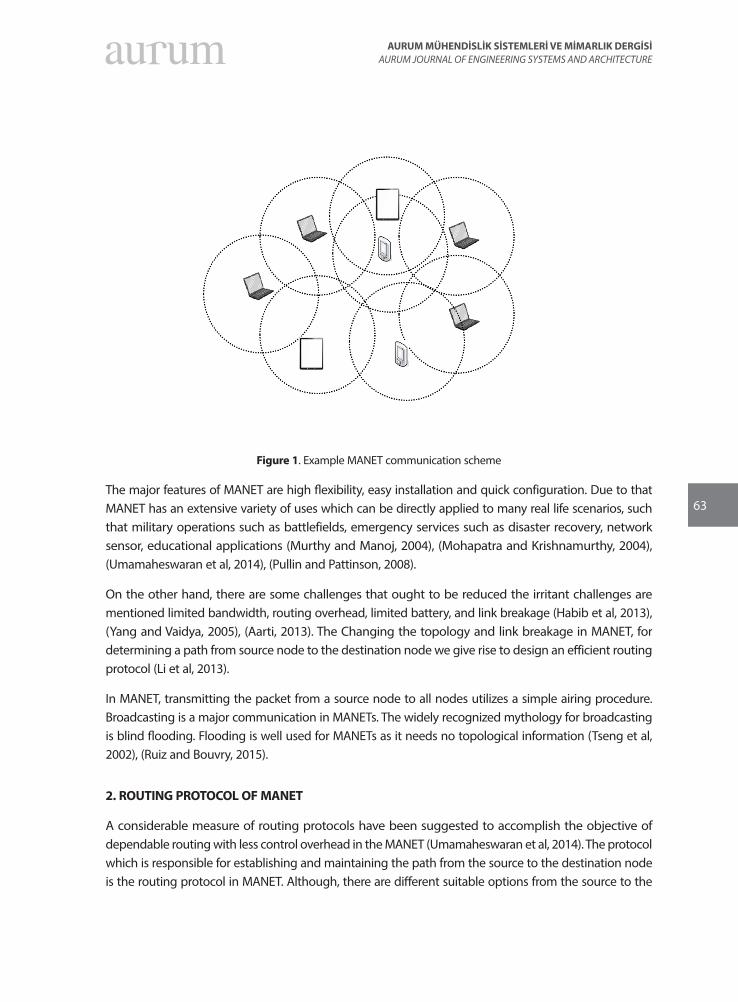
63
AURUM MÜHENDİSLİK SİSTEMLERİ VE MİMARLIK DERGİSİAURUM JOURNAL OF ENGINEERING SYSTEMS AND ARCHITECTURE
Figure 1. Example MANET communication scheme
The major features of MANET are high flexibility, easy installation and quick configuration. Due to that MANET has an extensive variety of uses which can be directly applied to many real life scenarios, such that military operations such as battlefields, emergency services such as disaster recovery, network sensor, educational applications (Murthy and Manoj, 2004), (Mohapatra and Krishnamurthy, 2004), (Umamaheswaran et al, 2014), (Pullin and Pattinson, 2008).
On the other hand, there are some challenges that ought to be reduced the irritant challenges are mentioned limited bandwidth, routing overhead, limited battery, and link breakage (Habib et al, 2013), (Yang and Vaidya, 2005), (Aarti, 2013). The Changing the topology and link breakage in MANET, for determining a path from source node to the destination node we give rise to design an efficient routing protocol (Li et al, 2013).
In MANET, transmitting the packet from a source node to all nodes utilizes a simple airing procedure. Broadcasting is a major communication in MANETs. The widely recognized mythology for broadcasting is blind flooding. Flooding is well used for MANETs as it needs no topological information (Tseng et al, 2002), (Ruiz and Bouvry, 2015).
2. ROUTING PROTOCOL OF MANET
A considerable measure of routing protocols have been suggested to accomplish the objective of dependable routing with less control overhead in the MANET (Umamaheswaran et al, 2014). The protocol which is responsible for establishing and maintaining the path from the source to the destination node is the routing protocol in MANET. Although, there are different suitable options from the source to the
64
Bakr kamal Jasim alani, Çağatay ayDin, Dogu CagDas atilla
destination node, the routing protocol must determine the best option and perform communication through that way. The optimum path may be aware of distance or the number of hops (Patel et al, 2014), (Shenbagapriya and Kumar, 2014). These criteria depends on the application area (Boukerche et al, 2011). To maximize the throughput while minimizing packet loss are the important aims of the routing protocols, control overhead, and energy usage. The routing protocols in MANET are ordered into three groupings based on their usefulness and execution, which included proactive, reactive, and hybrid routing protocols (Sarkar and Paul, 2015).
3. AD-HOC ON-DEMAND DISTANCE VECTOR ROUTING PROTOCOL
Perkins et al (2003), the AODV routing protocol was investigated. The AODV routing protocol combines the advantage of DSR protocols (Perkins et al, 2003) and (DSDV). AODV has the advantages of the (DSDV) protocol as it has arrangement numbers for keeping up the most recent data between nodes, and it has the benefits of the DSR, such as creating routes on interest and building the way between the sender and beneficiary through the route revelation mechanism. Reducing the number of broadcast messages is The goal of the AODV protocol forwarded through the network by findingjroutes on-demand rather than update the route information (Boukerche et al, 2011). AODV is one of the most important reactive routing protocols, and it is widely used in MANETs. The AODV protocol has four control message are utilized for discovering and maintaining mechanisms routes to the destination. These control messages are RREQ message, a Hello message, RERR message, and RREP message (Perkins et al, 2003).
4. THE PROPOSED ALGORITHM
The topology in MANET network is change typically that driven by the frequent changes occur when node move freely with no direction. This causes link breakage between node when transfer data and packet. Due to this, the source node broadcast procedure to established links between nodes network can be expired frequently.
To reduce the link breakage in AODV routing protocol, the proposed algorithm AODV Power, Time and Direction Predication (AODV-PTD) design to implemented base on original AODV protocol and the AODV-PTI scheme proposed by Alani and Alsaqour (2017) , and the EOAODV algorithm proposed by Gouda et al (2013).
Alani and Alsaqour (2017) proposed a scheme, namely AODV–PTI to lessen the superfluous control packets for disclosure routing. And focused on the information arrival and timing about recvRequest, recvError, and recvHello packet, then check the information and determine the route.
Gouda et al (2013) presented an Energy Optimal on demand routing protocol which alters communicated component of consentient AODV routing protocol. In this procedure, if an answer is lost, new route discovery method must be reinitiated.
The AODV-LTP algorithm make to check the power, time and direction of last three arrived packets. If the last three power is lower than the previous power (p1, p2, p3), and the time is greater than the previous
65
AURUM MÜHENDİSLİK SİSTEMLERİ VE MİMARLIK DERGİSİAURUM JOURNAL OF ENGINEERING SYSTEMS AND ARCHITECTURE
time, then it is required to check the direction of previous node. The AODV-LTP algorithm send the REPAIR massage to up node, that able to predict the status of bad routing path.
Both of the recvRequest, recvError, and recvHello functions have information about power and timing. Although only RREQ packets are ordinarily thought about when processing the communicated likelihood, in AODV-LTP algorithm, we use the timing data and power data linked with a packet touching base at the present node.
The goal of the AODV-LTP algorithm is to avoid link breakage and reduce the number of broadcast packets that are sent accordingly, AODV-LTP algorithm will be completely versatile, dynamic calculation that can alter broadcast frequency utilizing all accessible packet timing data that touches base at the node. Consequently, the execution of the AODV routing protocol will be pushed ahead.
5. SIMULATION ENVIRONMENT
To assess the execution of the calculation, we utilized NS-2.35, (Keshav, 1988). The mobility model utilize the random waypoint model (Navidi and Camp, 2004). In this model, the mobile nodes are moving freely and randomly without border limitation. The application layer at node generates CBR traffic. The transmission range is 200 meter (m) chosen. The node’s delay time is consistent to 0 to make the nodes movement constant. The quantity of nodes in the network was selected small network 20 nodes to large network 100 nodes. The maximum nodes speed chosen as between 5 m/s human speed to 50 m/s vehicle speed, all scenarios are place in 1000 m x 1000 m square area. The summary of the simulation parameters are given in Table 1.
Table 1. The simulation parameters
Description Value Unit
Simulation time 300 Second
Network area size 1000 x 1000 Meter
Number of nodes 20 – 50 Nodes
Data packet size 512 Bytes
Bandwidth 2 Mbps
Nodes speed 5 – 50 m/s
Pause time 0 Second
Data traffic CBR
66
Bakr kamal Jasim alani, Çağatay ayDin, Dogu CagDas atilla
5.1 Performance Metric
Performance metrics are used to measure the efficiency the proposed algorithm, and they utilized in the comparative study. The performance measure in this study algorithm is measured using: Average End-to-End Delay (Avg.E2E Delay), Average Throughput (Avg.TH), and Packet Delivery Ratio (PDR)
5.1.1 Average End-to-End Delay (AvgE2E Delay)
The data packet reaches the destination with the average time. To calculate this metric, the time that first packet was transmitted from the source was subtracted from the time when the first data packet arrived to destination. The delay by path discovery could be determined with this metric.
5.1.2 Average Throughput (Avg Throughput)
The Avg Throughput is the ratio of the number of data packets successfully delivered at the destination over the time between receiving the first and the last packets the simulation time.
5.1.3 Packet Delivery Ratio (PDR)
PDR is the ratio between a number of sending data packets and truly received data packets.
6. RESULTS AND DISCUSSIONS
The performance of AODV-LTP algorithm was compared with that of AODV protocol using the performance metrics mentioned above. Results showed that AODV-PTI shows better performance than AODV in terms of E2End Delay, Avg-Throughput, and PDR. This study in order to compare the performance of AODV-LTP algorithm based on different the number of nodes and speed ratio.
6.1 Comparison Result Based on The Number of Nodes
The network density is a decisive parameter. In this simulation, the number of nodes under different network density was set to 20, 40, 60, 80, and 100 nodes and each node has a maximum speed of 20 m/s for all the network parameters.
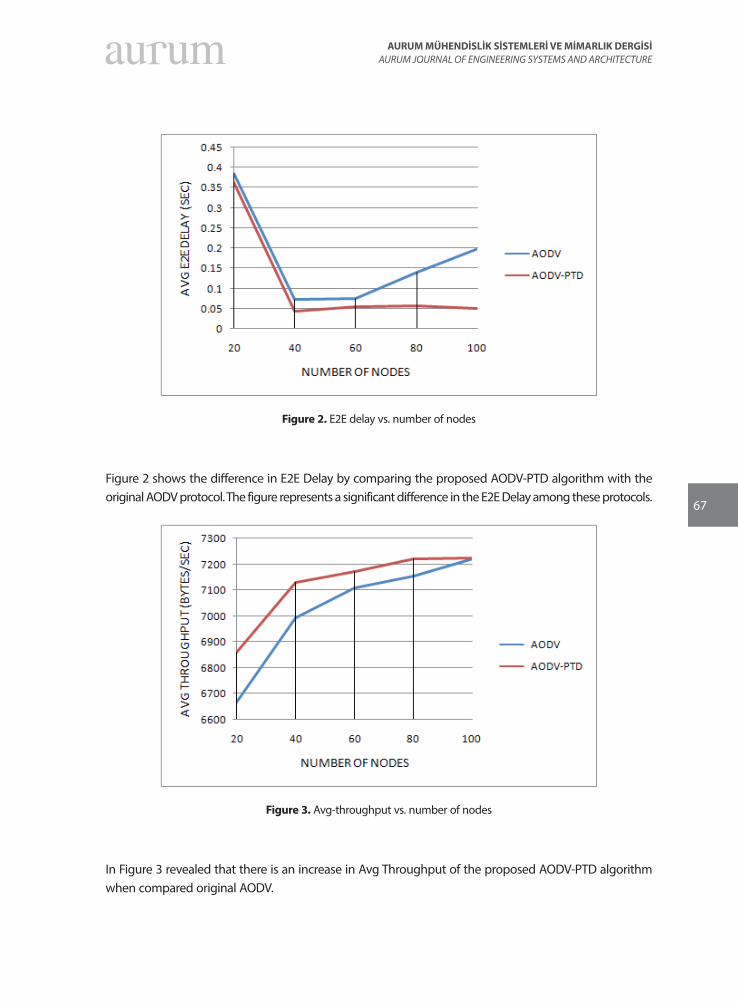
67
AURUM MÜHENDİSLİK SİSTEMLERİ VE MİMARLIK DERGİSİAURUM JOURNAL OF ENGINEERING SYSTEMS AND ARCHITECTURE
Figure 2. E2E delay vs. number of nodes
Figure 2 shows the difference in E2E Delay by comparing the proposed AODV-PTD algorithm with the original AODV protocol. The figure represents a significant difference in the E2E Delay among these protocols.
Figure 3. Avg-throughput vs. number of nodes
In Figure 3 revealed that there is an increase in Avg Throughput of the proposed AODV-PTD algorithm when compared original AODV.
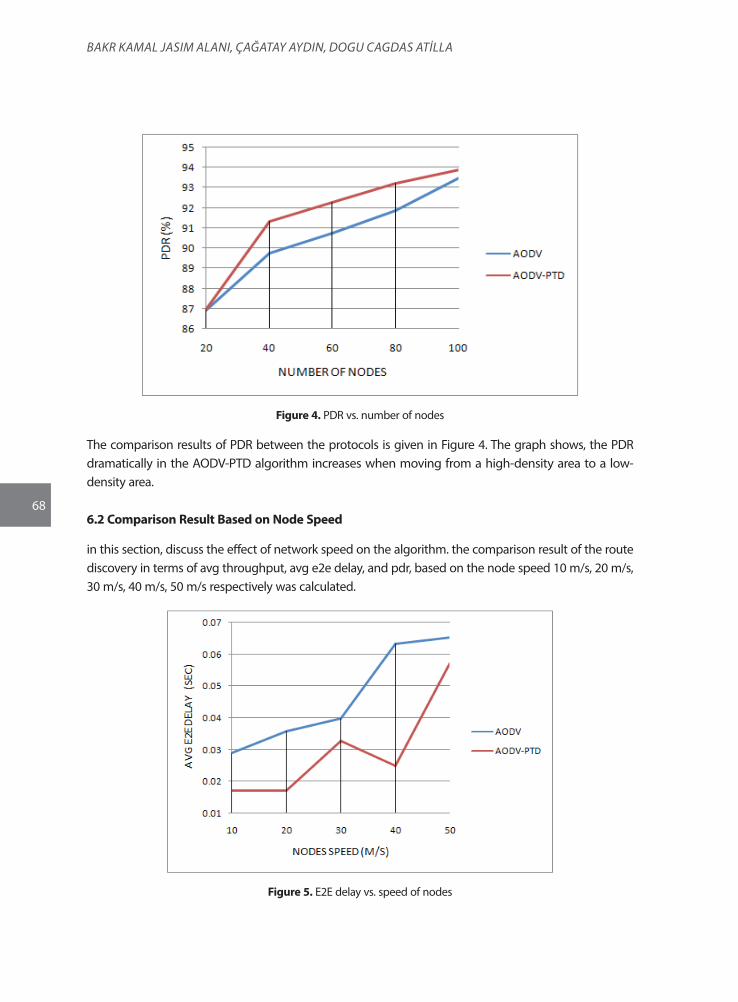
68
Bakr kamal Jasim alani, Çağatay ayDin, Dogu CagDas atilla
Figure 4. PDR vs. number of nodes
The comparison results of PDR between the protocols is given in Figure 4. The graph shows, the PDR dramatically in the AODV-PTD algorithm increases when moving from a high-density area to a low-density area.
6.2 Comparison Result Based on Node Speed
in this section, discuss the effect of network speed on the algorithm. the comparison result of the route discovery in terms of avg throughput, avg e2e delay, and pdr, based on the node speed 10 m/s, 20 m/s, 30 m/s, 40 m/s, 50 m/s respectively was calculated.
Figure 5. E2E delay vs. speed of nodes
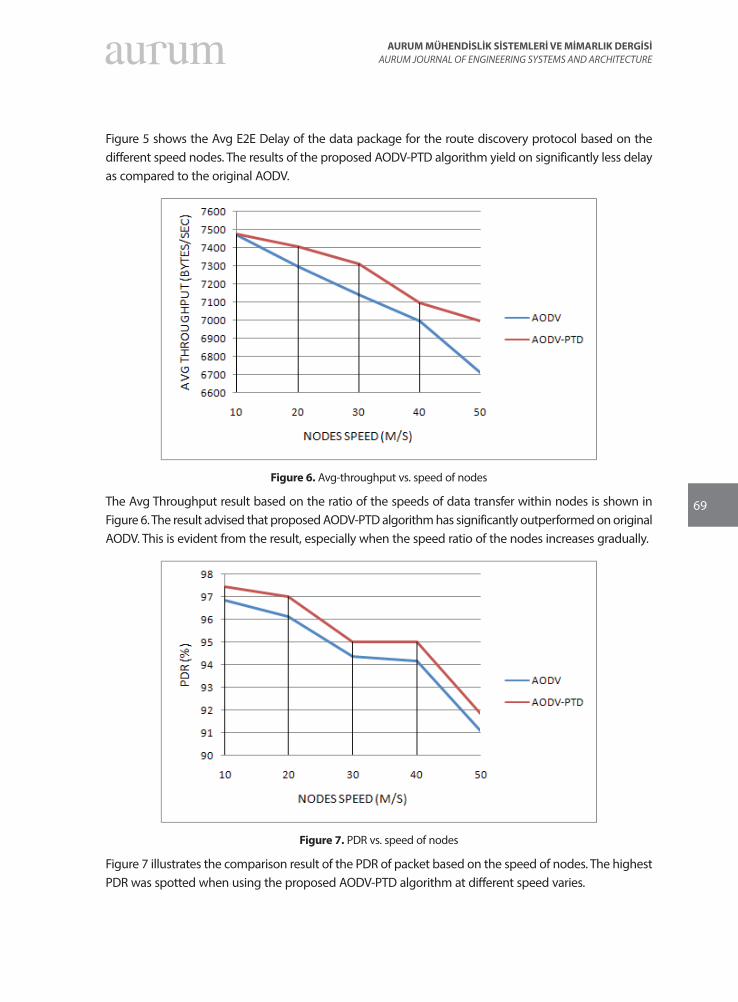
69
AURUM MÜHENDİSLİK SİSTEMLERİ VE MİMARLIK DERGİSİAURUM JOURNAL OF ENGINEERING SYSTEMS AND ARCHITECTURE
Figure 5 shows the Avg E2E Delay of the data package for the route discovery protocol based on the different speed nodes. The results of the proposed AODV-PTD algorithm yield on significantly less delay as compared to the original AODV.
Figure 6. Avg-throughput vs. speed of nodes
The Avg Throughput result based on the ratio of the speeds of data transfer within nodes is shown in Figure 6. The result advised that proposed AODV-PTD algorithm has significantly outperformed on original AODV. This is evident from the result, especially when the speed ratio of the nodes increases gradually.
Figure 7. PDR vs. speed of nodes
Figure 7 illustrates the comparison result of the PDR of packet based on the speed of nodes. The highest PDR was spotted when using the proposed AODV-PTD algorithm at different speed varies.
70
Bakr kamal Jasim alani, Çağatay ayDin, Dogu CagDas atilla
7. CONCLUSION
In this paper, the proposed AODV-PTD algorithm lead to decrease unnecessary control packets in route discovery and maintenance of routes between the source node and the destination node when link breakage occurs. After analyzing the result, it can be evidenced that the proposed AODV-PTD outperformed the original AODV. The network performance result of AODV-PTD against the AODV in terms of the number of nodes and speed ration between nodes yield on a higher throughput, PDR, and less E2E delay. This can be referred to the feasibility of the proposed algorithm in getting the power, time and direction of the last three packets. Such process helped to reduce the link breakage in the route network when transferring data in different destinations.
REFERENCES
Alani, H., and Alsaqour, R. 2017. Routing discovery scheme for high mobility in MANET. ARPN Journal of Engineering and Applied Sciences, 12(2), 536-543.
Murthy, C. S. R., and Manoj, B. S. 2004. Ad hoc wireless networks: Architectures and protocols, portable documents. Pearson education.
Mohapatra, P., and Krishnamurthy, S. (Eds.). 2004. AD HOC NETWORKS: technologies and protocols. Springer Science & Business Media.
Umamaheswaran, S., Kumar, N., and Biswas, P. K. 2014. A survey of routing protocol design patterns for mobile ad hoc networks., In 2014 2nd International Conference on Emerging Technology Trends in Electronics, Communication and Networking (pp. 1-6). IEEE.
Pullin, A. J., and Pattinson, C. 2008. A realistic battlefield model for the evaluation of MANET., In 2008 Fifth Annual Conference on Wireless on Demand Network Systems and Services (pp. 81-84). IEEE.
Habib, S., Saleem, S., and Saqib, K. M. 2013. Review on MANET routing protocols and challenges., In 2013 IEEE Student Conference on Research and Developement (pp. 529-533). IEEE.
Yang, X., and Vaidya, N. 2005. On physical carrier sensing in wireless ad hoc networks., In Proceedings IEEE 24th Annual Joint Conference of the IEEE Computer and Communications Societies (Vol. 4, pp. 2525-2535). IEEE.
Aarti, D. S.S. 2013. Tyagi, Study Of Manet: Characteristics, challenges, application and security attacks., International Journal of Advanced Research in Computer Science and Software Engineering, 3(5), 252-257.
Li, S., Lou, L., and Hong, L. 2013. Directional probabilistic broadcast in wireless mobile ad hoc networks., In 2013 International Conference on Computational and Information Sciences (pp. 1421-1424). IEEE.
Tseng, Y. C., Ni, S. Y., Chen, Y. S., and Sheu, J. P. 2002. The broadcast storm problem in a mobile ad hoc network, Wireless networks, 8(2-3), 153-167.
71
AURUM MÜHENDİSLİK SİSTEMLERİ VE MİMARLIK DERGİSİAURUM JOURNAL OF ENGINEERING SYSTEMS AND ARCHITECTURE
Ruiz, P., and Bouvry, P. 2015. Survey on broadcast algorithms for mobile ad hoc networks., ACM computing surveys (CSUR), 48(1), 1-35.
Patel, D. N., Patel, S. B., Kothadiya, H. R., Jethwa, P. D., and Jhaveri, R. H. 2014. A survey of reactive routing protocols in MANET., In International Conference on Information Communication and Embedded Systems (ICICES2014) (pp. 1-6). IEEE.
Shenbagapriya, R., and Kumar, N. 2014. A survey on proactive routing protocols in MANETs., In 2014 International Conference on Science Engineering and Management Research (ICSEMR) (pp. 1-7). IEEE.
Boukerche, A., Turgut, B., Aydin, N., Ahmad, M. Z., Bölöni, L., and Turgut, D. 2011. Routing protocols in ad hoc networks: A survey., Computer networks, 55(13), 3032-3080.
Sarkar, P., and Paul, H. 2015. Performance Comparison of AODV, DSR, DYMO and TORA Routing Protocols in Mobile Ad Hoc Networks., Int. J. on Network Security, 6.
Perkins, C., Belding-Royer, E., and Das, S. 2003. RFC3561: Ad hoc on-demand distance vector (AODV) routing.
Gouda, B. S., Panigrahi, P. P., and Choudhury, A. 2013. A new optimal approach for improving energy efficiency in wireless ad-hoc networks., In 2013 IEEE Conference on Information & Communication Technologies (pp. 1095-1100). IEEE.
Keshav, S. 1988. REAL: A network simulator., University of California Berkeley, Calif, USA.
Navidi, W., and Camp, T. 2004. Stationary distributions for the random waypoint mobility model., IEEE transactions on Mobile Computing, 3(1), 99-108.

73
AURUM MÜHENDİSLİK SİSTEMLERİ VE MİMARLIK DERGİSİAURUM JOURNAL OF ENGINEERING SYSTEMS AND ARCHITECTURE
Cilt 4, Sayı 1 | Yaz 2020Volume 4, No 1 | Summer 2020, 73-91
ARAŞTIRMA MAKALESİ / RESEARCH ARTICLE
DEVELOPING CLASSIFIER FOR THE PREDICTION OF STUDENTS’ PERFORMANCE USING DATA MINING CLASSIFICATION TECHNIQUES
Abubakar Auwal RIMI1
1Altinbas University, Department of Information Technology, Istanbul [email protected] ORCID NO: 0000-0002-5162-6551
Oguz BAYAT2
2Altinbas University, Department of Electrical and Computer Engineering, Istanbul [email protected] ORCID NO: 0000-0001-8428-2380
Abdullahi Abdu IBRAHIM3
3Altinbas University, Department of Electrical and Computer Engineering, Istanbul [email protected] ORCID NO: 0000-0001-9145-1939
RECEIVED DATE/GELİŞ TARİHİ: 11.12.2019 ACCEPTED DATE/KABUL TARİHİ: 26.05.2020
Abstract
Data mining is used in academic institutions to predict the performance of students using classification techniques. These techniques are applied on students’ features in order to find reasonable patterns that can be used as basis for the prediction. The availability of students’ data in digital form and increase in processing power of computer systems makes this whole process a reality. There are numerous researches done in this direction in order to prevent massive failure of students. However, these researches are focused mainly on the prediction of students from other countries. Although there are efforts by few indigenous researchers to perform research in this direction, they have not explored the most widely used features. The main aim of this research is to develop a classifier using locally generated students’ features for accurate performance prediction. The students’ features that are collected from different sources underwent preprocessing, which later were introduced into the weka for feature selection and eventually for learning and testing. The naïve Bayes classifier which emerged as the most accurate classifier was selected and implemented in our performance predictor tool. The tool was tested using another set of features and the evaluation result shows that the tool can predict the performance of students in their future examinations.
Keywords: Classifier, Prediction, Data mining, Demographic, Cognitive, Non cognitive.
VERİ MADENCİLİĞİ SINIFLANDIRMA TEKNİKLERİ KULLANARAK ÖĞRENCİ PERFORMANSININ TAHMİNİ İÇİN SINIFLANDIRICI GELİŞTİRME
Özet
Veri madenciliği, akademik kurumlarda sınıflandırma tekniklerini kullanan öğrencilerin performansını tahmin etmek için kullanılır. Bu teknikler, tahmine temel olarak kullanılabilecek makul kalıpları bulmak için öğrencilerin
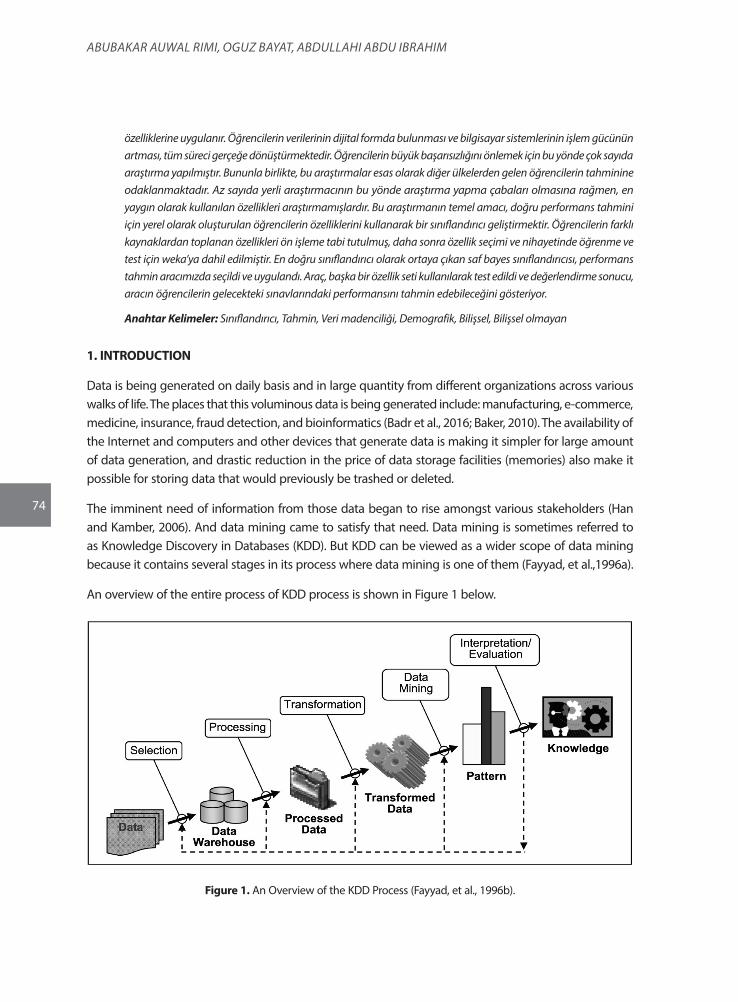
74
AbubAkAr AuwAl rIMI, Oguz bAYAT, AbdullAhI Abdu IbrAhIM
özelliklerine uygulanır. Öğrencilerin verilerinin dijital formda bulunması ve bilgisayar sistemlerinin işlem gücünün artması, tüm süreci gerçeğe dönüştürmektedir. Öğrencilerin büyük başarısızlığını önlemek için bu yönde çok sayıda araştırma yapılmıştır. Bununla birlikte, bu araştırmalar esas olarak diğer ülkelerden gelen öğrencilerin tahminine odaklanmaktadır. Az sayıda yerli araştırmacının bu yönde araştırma yapma çabaları olmasına rağmen, en yaygın olarak kullanılan özellikleri araştırmamışlardır. Bu araştırmanın temel amacı, doğru performans tahmini için yerel olarak oluşturulan öğrencilerin özelliklerini kullanarak bir sınıflandırıcı geliştirmektir. Öğrencilerin farklı kaynaklardan toplanan özellikleri ön işleme tabi tutulmuş, daha sonra özellik seçimi ve nihayetinde öğrenme ve test için weka’ya dahil edilmiştir. En doğru sınıflandırıcı olarak ortaya çıkan saf bayes sınıflandırıcısı, performans tahmin aracımızda seçildi ve uygulandı. Araç, başka bir özellik seti kullanılarak test edildi ve değerlendirme sonucu, aracın öğrencilerin gelecekteki sınavlarındaki performansını tahmin edebileceğini gösteriyor.
Anahtar Kelimeler: Sınıflandırıcı, Tahmin, Veri madenciliği, Demografik, Bilişsel, Bilişsel olmayan
1. INTRODUCTION
Data is being generated on daily basis and in large quantity from different organizations across various walks of life. The places that this voluminous data is being generated include: manufacturing, e-commerce, medicine, insurance, fraud detection, and bioinformatics (Badr et al., 2016; Baker, 2010). The availability of the Internet and computers and other devices that generate data is making it simpler for large amount of data generation, and drastic reduction in the price of data storage facilities (memories) also make it possible for storing data that would previously be trashed or deleted.
The imminent need of information from those data began to rise amongst various stakeholders (Han and Kamber, 2006). And data mining came to satisfy that need. Data mining is sometimes referred to as Knowledge Discovery in Databases (KDD). But KDD can be viewed as a wider scope of data mining because it contains several stages in its process where data mining is one of them (Fayyad, et al.,1996a).
An overview of the entire process of KDD process is shown in Figure 1 below.
Figure 1. An Overview of the KDD Process (Fayyad, et al., 1996b).
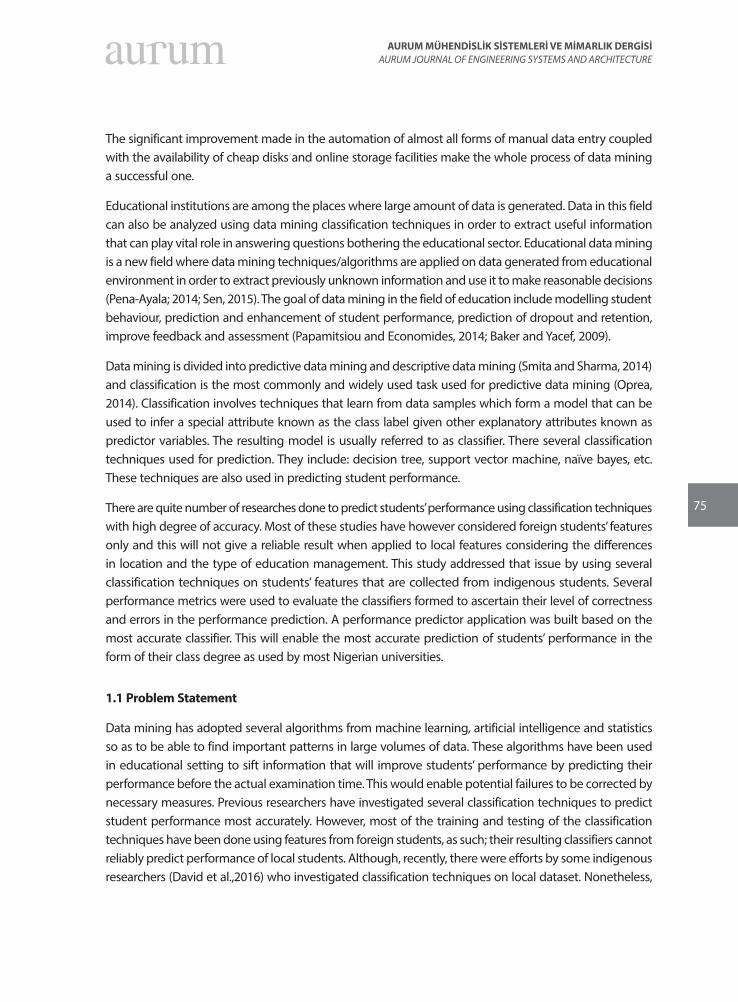
75
AURUM MÜHENDİSLİK SİSTEMLERİ VE MİMARLIK DERGİSİAURUM JOURNAL OF ENGINEERING SYSTEMS AND ARCHITECTURE
The significant improvement made in the automation of almost all forms of manual data entry coupled with the availability of cheap disks and online storage facilities make the whole process of data mining a successful one.
Educational institutions are among the places where large amount of data is generated. Data in this field can also be analyzed using data mining classification techniques in order to extract useful information that can play vital role in answering questions bothering the educational sector. Educational data mining is a new field where data mining techniques/algorithms are applied on data generated from educational environment in order to extract previously unknown information and use it to make reasonable decisions (Pena-Ayala; 2014; Sen, 2015). The goal of data mining in the field of education include modelling student behaviour, prediction and enhancement of student performance, prediction of dropout and retention, improve feedback and assessment (Papamitsiou and Economides, 2014; Baker and Yacef, 2009).
Data mining is divided into predictive data mining and descriptive data mining (Smita and Sharma, 2014) and classification is the most commonly and widely used task used for predictive data mining (Oprea, 2014). Classification involves techniques that learn from data samples which form a model that can be used to infer a special attribute known as the class label given other explanatory attributes known as predictor variables. The resulting model is usually referred to as classifier. There several classification techniques used for prediction. They include: decision tree, support vector machine, naïve bayes, etc. These techniques are also used in predicting student performance.
There are quite number of researches done to predict students’ performance using classification techniques with high degree of accuracy. Most of these studies have however considered foreign students’ features only and this will not give a reliable result when applied to local features considering the differences in location and the type of education management. This study addressed that issue by using several classification techniques on students’ features that are collected from indigenous students. Several performance metrics were used to evaluate the classifiers formed to ascertain their level of correctness and errors in the performance prediction. A performance predictor application was built based on the most accurate classifier. This will enable the most accurate prediction of students’ performance in the form of their class degree as used by most Nigerian universities.
1.1 Problem Statement
Data mining has adopted several algorithms from machine learning, artificial intelligence and statistics so as to be able to find important patterns in large volumes of data. These algorithms have been used in educational setting to sift information that will improve students’ performance by predicting their performance before the actual examination time. This would enable potential failures to be corrected by necessary measures. Previous researchers have investigated several classification techniques to predict student performance most accurately. However, most of the training and testing of the classification techniques have been done using features from foreign students, as such; their resulting classifiers cannot reliably predict performance of local students. Although, recently, there were efforts by some indigenous researchers (David et al.,2016) who investigated classification techniques on local dataset. Nonetheless,
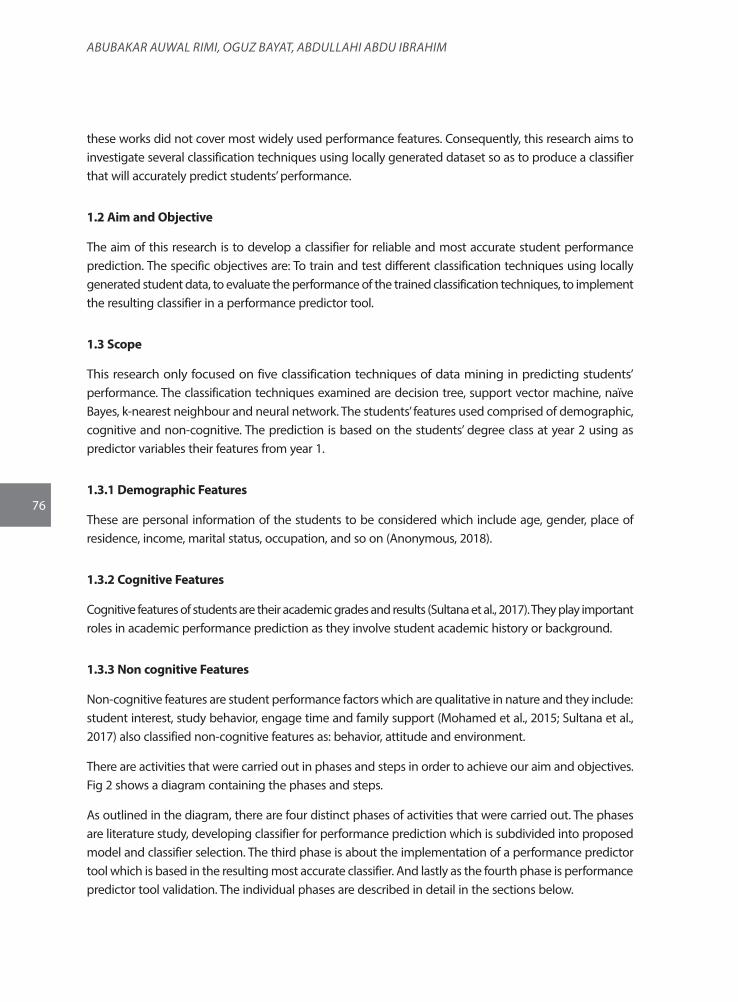
76
AbubAkAr AuwAl rIMI, Oguz bAYAT, AbdullAhI Abdu IbrAhIM
these works did not cover most widely used performance features. Consequently, this research aims to investigate several classification techniques using locally generated dataset so as to produce a classifier that will accurately predict students’ performance.
1.2 Aim and Objective
The aim of this research is to develop a classifier for reliable and most accurate student performance prediction. The specific objectives are: To train and test different classification techniques using locally generated student data, to evaluate the performance of the trained classification techniques, to implement the resulting classifier in a performance predictor tool.
1.3 Scope
This research only focused on five classification techniques of data mining in predicting students’ performance. The classification techniques examined are decision tree, support vector machine, naïve Bayes, k-nearest neighbour and neural network. The students’ features used comprised of demographic, cognitive and non-cognitive. The prediction is based on the students’ degree class at year 2 using as predictor variables their features from year 1.
1.3.1 Demographic Features
These are personal information of the students to be considered which include age, gender, place of residence, income, marital status, occupation, and so on (Anonymous, 2018).
1.3.2 Cognitive Features
Cognitive features of students are their academic grades and results (Sultana et al., 2017). They play important roles in academic performance prediction as they involve student academic history or background.
1.3.3 Non cognitive Features
Non-cognitive features are student performance factors which are qualitative in nature and they include: student interest, study behavior, engage time and family support (Mohamed et al., 2015; Sultana et al., 2017) also classified non-cognitive features as: behavior, attitude and environment.
There are activities that were carried out in phases and steps in order to achieve our aim and objectives. Fig 2 shows a diagram containing the phases and steps.
As outlined in the diagram, there are four distinct phases of activities that were carried out. The phases are literature study, developing classifier for performance prediction which is subdivided into proposed model and classifier selection. The third phase is about the implementation of a performance predictor tool which is based in the resulting most accurate classifier. And lastly as the fourth phase is performance predictor tool validation. The individual phases are described in detail in the sections below.
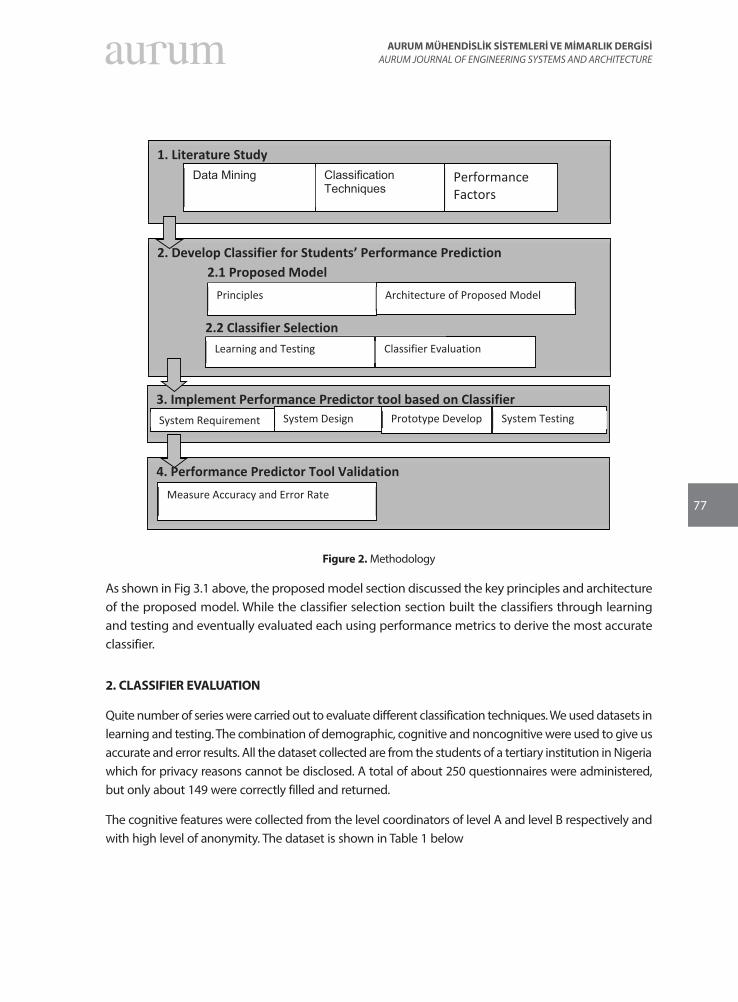
77
AURUM MÜHENDİSLİK SİSTEMLERİ VE MİMARLIK DERGİSİAURUM JOURNAL OF ENGINEERING SYSTEMS AND ARCHITECTURE
There are activities that were carried out in phases and steps in order to achieve our aim and objectives. Fig 2 shows a diagram containing the phases and steps. As outlined in the diagram, there are four distinct phases of activities that were carried out. The phases are literature study, developing classifier for performance prediction which is subdivided into proposed model and classifier selection. The third phase is about the implementation of a performance predictor tool which is based in the resulting most accurate classifier. And lastly as the fourth phase is performance predictor tool validation. The individual phases are described in detail in the sections below.
As shown in Fig 3.1 above, the proposed model section discussed the key principles and architecture of the proposed model. While the classifier selection section built the classifiers through learning and testing and eventually evaluated each using performance metrics to derive the most accurate classifier.
2. CLASSIFIER EVALUATION
Quite number of series were carried out to evaluate different classification techniques. We used datasets in learning and testing. The combination of demographic, cognitive and noncognitive were used to give us accurate and error results. All the dataset collected are from the students of a tertiary institution in Nigeria which for privacy reasons cannot be disclosed. A total of about 250 questionnaires were administered, but only about 149 were correctly filled and returned. The cognitive features were collected from the level coordinators of level A and level B respectively and with high level of anonymity. The dataset is shown in Table 1 below
1. Literature Study Data Mining Classification
Techniques Performance Factors
2. Develop Classifier for Students’ Performance Prediction
Principles
2.1 Proposed Model
Learning and Testing Classifier Evaluation
2.2 Classifier Selection
3. Implement Performance Predictor tool based on Classifier System Requirement System Design Prototype Develop System Testing
Architecture of Proposed Model
4. Performance Predictor Tool Validation Measure Accuracy and Error Rate
Figure 2 Methodology Figure 2. Methodology
As shown in Fig 3.1 above, the proposed model section discussed the key principles and architecture of the proposed model. While the classifier selection section built the classifiers through learning and testing and eventually evaluated each using performance metrics to derive the most accurate classifier.
2. CLASSIFIER EVALUATION
Quite number of series were carried out to evaluate different classification techniques. We used datasets in learning and testing. The combination of demographic, cognitive and noncognitive were used to give us accurate and error results. All the dataset collected are from the students of a tertiary institution in Nigeria which for privacy reasons cannot be disclosed. A total of about 250 questionnaires were administered, but only about 149 were correctly filled and returned.
The cognitive features were collected from the level coordinators of level A and level B respectively and with high level of anonymity. The dataset is shown in Table 1 below
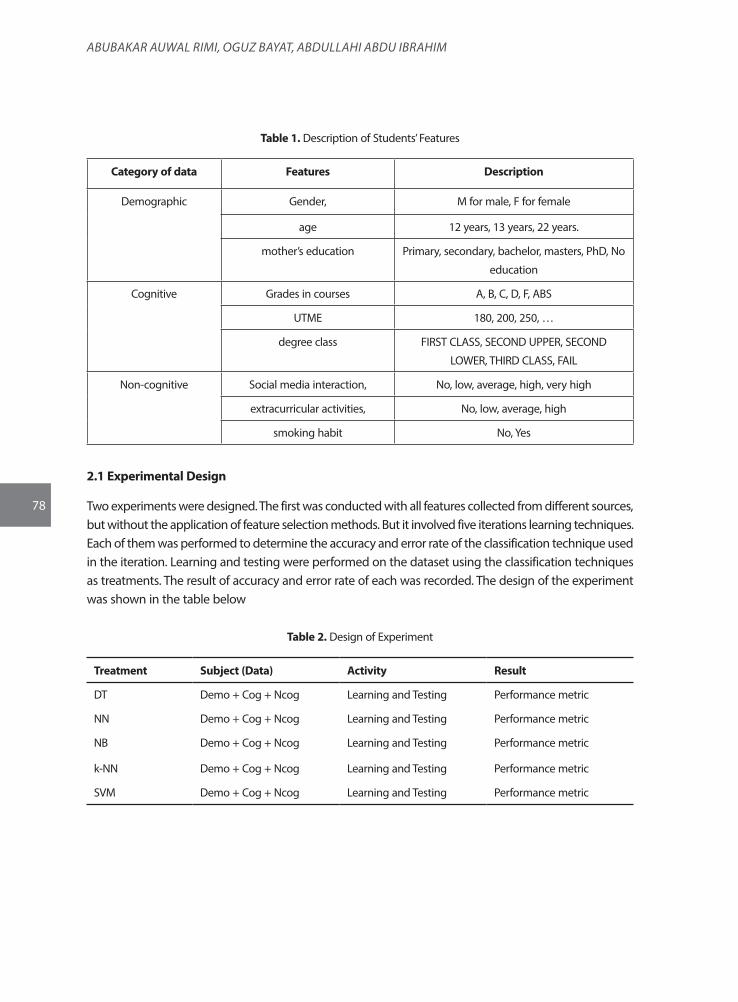
78
AbubAkAr AuwAl rIMI, Oguz bAYAT, AbdullAhI Abdu IbrAhIM
Table 1. Description of Students’ Features
Category of data Features Description
Demographic Gender, M for male, F for female
age 12 years, 13 years, 22 years.
mother’s education Primary, secondary, bachelor, masters, PhD, No
education
Cognitive Grades in courses A, B, C, D, F, ABS
UTME 180, 200, 250, …
degree class FIRST CLASS, SECOND UPPER, SECOND
LOWER, THIRD CLASS, FAIL
Non-cognitive Social media interaction, No, low, average, high, very high
extracurricular activities, No, low, average, high
smoking habit No, Yes
2.1 Experimental Design
Two experiments were designed. The first was conducted with all features collected from different sources, but without the application of feature selection methods. But it involved five iterations learning techniques. Each of them was performed to determine the accuracy and error rate of the classification technique used in the iteration. Learning and testing were performed on the dataset using the classification techniques as treatments. The result of accuracy and error rate of each was recorded. The design of the experiment was shown in the table below
Table 2. Design of Experiment
Treatment Subject (Data) Activity Result
DT Demo + Cog + Ncog Learning and Testing Performance metric
NN Demo + Cog + Ncog Learning and Testing Performance metric
NB Demo + Cog + Ncog Learning and Testing Performance metric
k-NN Demo + Cog + Ncog Learning and Testing Performance metric
SVM Demo + Cog + Ncog Learning and Testing Performance metric
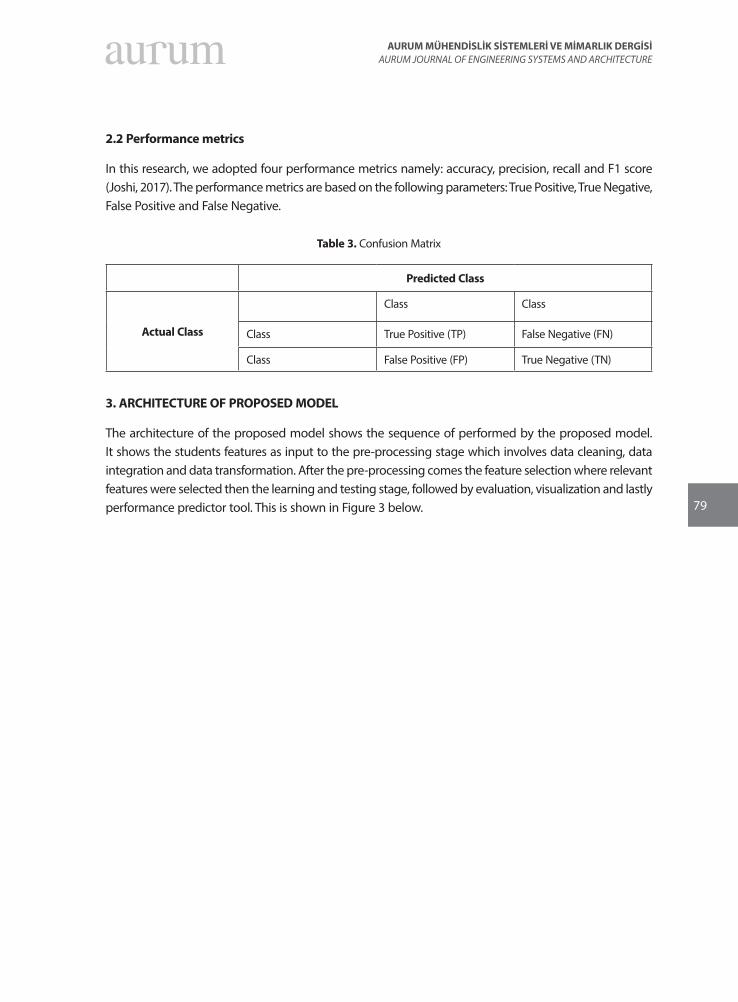
79
AURUM MÜHENDİSLİK SİSTEMLERİ VE MİMARLIK DERGİSİAURUM JOURNAL OF ENGINEERING SYSTEMS AND ARCHITECTURE
2.2 Performance metrics
In this research, we adopted four performance metrics namely: accuracy, precision, recall and F1 score (Joshi, 2017). The performance metrics are based on the following parameters: True Positive, True Negative, False Positive and False Negative.
Table 3. Confusion Matrix
Predicted Class
Actual Class
Class Class
Class True Positive (TP) False Negative (FN)
Class False Positive (FP) True Negative (TN)
3. ARCHITECTURE OF PROPOSED MODEL
The architecture of the proposed model shows the sequence of performed by the proposed model. It shows the students features as input to the pre-processing stage which involves data cleaning, data integration and data transformation. After the pre-processing comes the feature selection where relevant features were selected then the learning and testing stage, followed by evaluation, visualization and lastly performance predictor tool. This is shown in Figure 3 below.
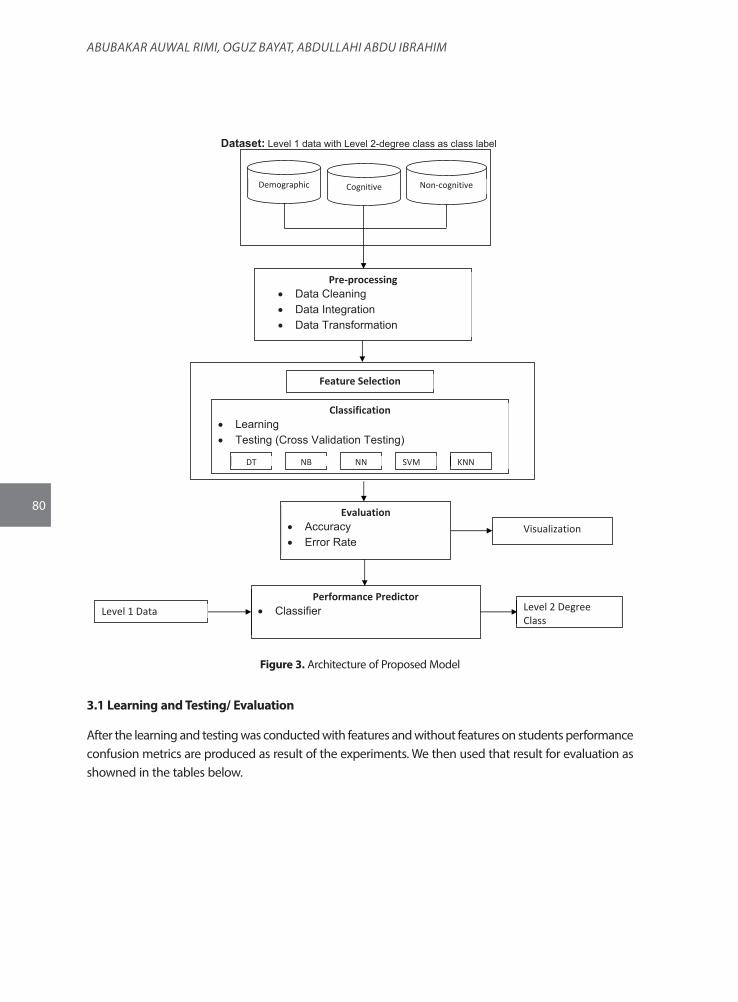
80
AbubAkAr AuwAl rIMI, Oguz bAYAT, AbdullAhI Abdu IbrAhIMThe architecture of the proposed model shows the sequence of performed by the proposed model. It shows the students features as input to the pre-processing stage which involves data cleaning, data integration and data transformation. After the pre-processing comes the feature selection where relevant features were selected then the learning and testing stage, followed by evaluation, visualization and lastly performance predictor tool. This is shown in Figure 3 below.
Dataset: Level 1 data with Level 2-degree class as class label
Pre‐processing Data Cleaning Data Integration Data Transformation
Visualization
Level 1 Data Level 2 Degree Class
Evaluation Accuracy Error Rate
Performance Predictor Classifier
Feature Selection
Classification Learning Testing (Cross Validation Testing)
DT NB NN SVM KNN
Demographic Non‐cognitive Cognitive
Figure 3 Architecture of Proposed Model
Figure 3. Architecture of Proposed Model
3.1 Learning and Testing/ Evaluation
After the learning and testing was conducted with features and without features on students performance confusion metrics are produced as result of the experiments. We then used that result for evaluation as showned in the tables below.
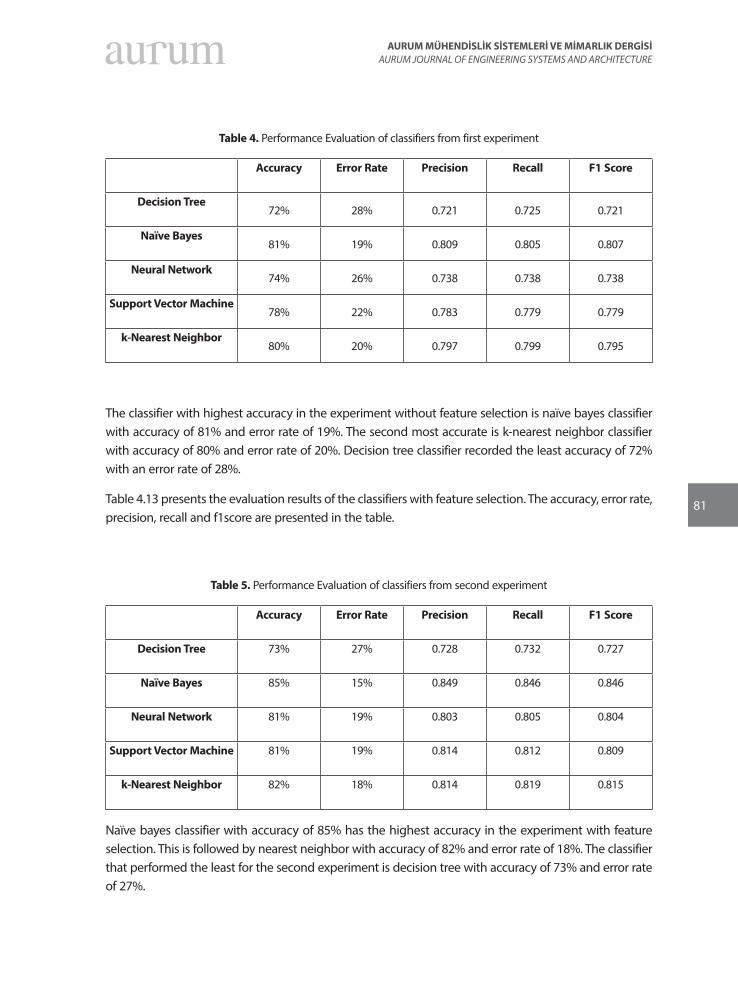
81
AURUM MÜHENDİSLİK SİSTEMLERİ VE MİMARLIK DERGİSİAURUM JOURNAL OF ENGINEERING SYSTEMS AND ARCHITECTURE
Table 4. Performance Evaluation of classifiers from first experiment
Accuracy Error Rate Precision Recall F1 Score
Decision Tree72% 28% 0.721 0.725 0.721
Naïve Bayes81% 19% 0.809 0.805 0.807
Neural Network74% 26% 0.738 0.738 0.738
Support Vector Machine78% 22% 0.783 0.779 0.779
k-Nearest Neighbor80% 20% 0.797 0.799 0.795
The classifier with highest accuracy in the experiment without feature selection is naïve bayes classifier with accuracy of 81% and error rate of 19%. The second most accurate is k-nearest neighbor classifier with accuracy of 80% and error rate of 20%. Decision tree classifier recorded the least accuracy of 72% with an error rate of 28%.
Table 4.13 presents the evaluation results of the classifiers with feature selection. The accuracy, error rate, precision, recall and f1score are presented in the table.
Table 5. Performance Evaluation of classifiers from second experiment
Accuracy Error Rate Precision Recall F1 Score
Decision Tree 73% 27% 0.728 0.732 0.727
Naïve Bayes 85% 15% 0.849 0.846 0.846
Neural Network 81% 19% 0.803 0.805 0.804
Support Vector Machine 81% 19% 0.814 0.812 0.809
k-Nearest Neighbor 82% 18% 0.814 0.819 0.815
Naïve bayes classifier with accuracy of 85% has the highest accuracy in the experiment with feature selection. This is followed by nearest neighbor with accuracy of 82% and error rate of 18%. The classifier that performed the least for the second experiment is decision tree with accuracy of 73% and error rate of 27%.
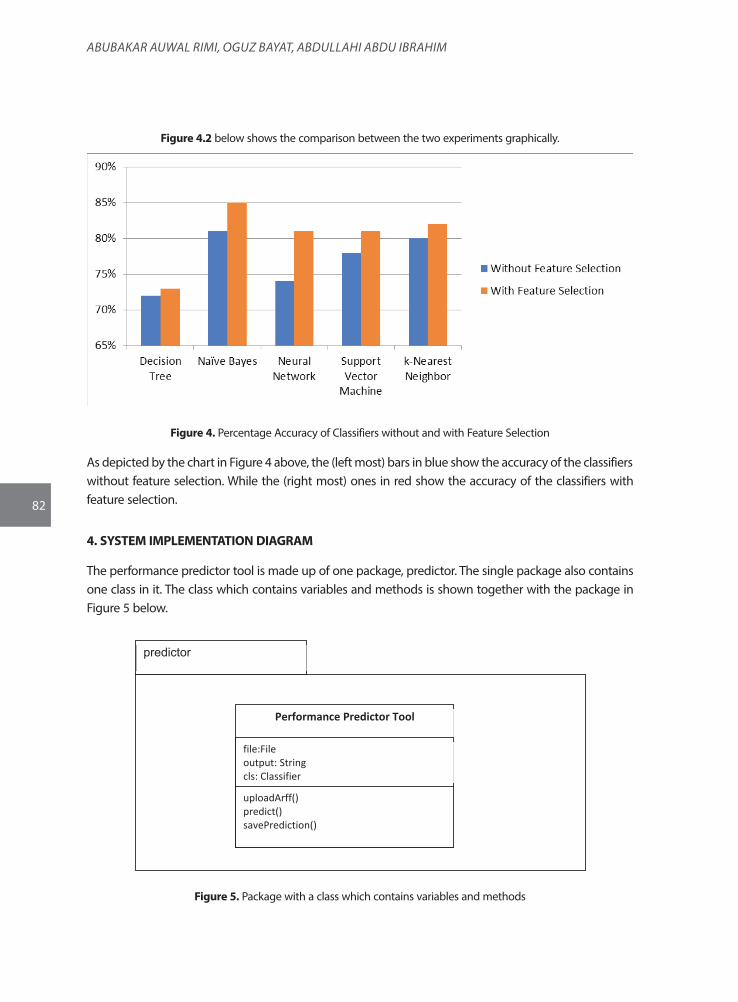
82
AbubAkAr AuwAl rIMI, Oguz bAYAT, AbdullAhI Abdu IbrAhIM
Figure 4.2 below shows the comparison between the two experiments graphically.
Figure 4. Percentage Accuracy of Classifiers without and with Feature Selection
As depicted by the chart in Figure 4 above, the (left most) bars in blue show the accuracy of the classifiers without feature selection. While the (right most) ones in red show the accuracy of the classifiers with feature selection.
4. SYSTEM IMPLEMENTATION DIAGRAM
The performance predictor tool is made up of one package, predictor. The single package also contains one class in it. The class which contains variables and methods is shown together with the package in Figure 5 below.
k-Nearest Neighbor
82% 18% 0.814 0.819 0.815
Naïve bayes classifier with accuracy of 85% has the highest accuracy in the experiment with feature selection. This is followed by nearest neighbor with accuracy of 82% and error rate of 18%. The classifier that performed the least for the second experiment is decision tree with accuracy of 73% and error rate of 27%. Figure 4.2 below shows the comparison between the two experiments graphically.
Figure 4 Percentage Accuracy of Classifiers without and with Feature Selection
As depicted by the chart in Figure 4 above, the (left most) bars in blue show the accuracy of the classifiers without feature selection. While the (right most) ones in red show the accuracy of the classifiers with feature selection.
4. SYSTEM IMPLEMENTATION DIAGRAM
The performance predictor tool is made up of one package, predictor. The single package also contains one class in it. The class which contains variables and methods is shown together with the package in Figure 5 below.
65%
70%
75%
80%
85%
90%
DecisionTree
Naïve Bayes NeuralNetwork
SupportVectorMachine
k‐NearestNeighbor
Without Feature Selection
With Feature Selection
predictor
Performance Predictor Tool file:File output: String cls: Classifier
uploadArff() predict() savePrediction()
Figure 5 Package with a class which contains variables and methods Figure 5. Package with a class which contains variables and methods
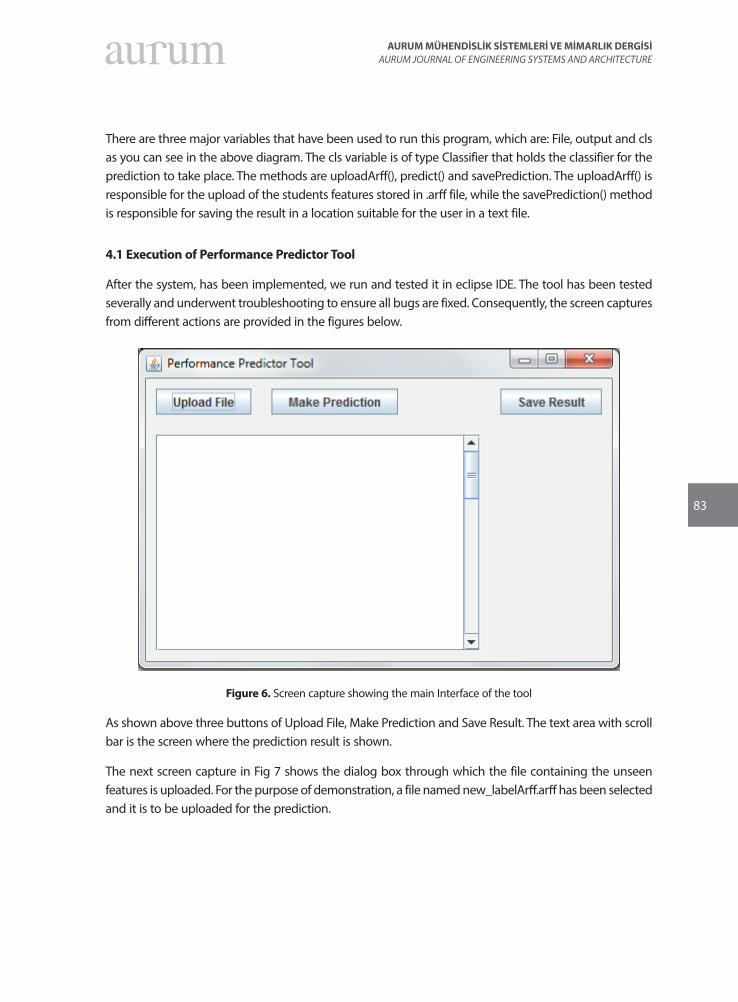
83
AURUM MÜHENDİSLİK SİSTEMLERİ VE MİMARLIK DERGİSİAURUM JOURNAL OF ENGINEERING SYSTEMS AND ARCHITECTURE
There are three major variables that have been used to run this program, which are: File, output and cls as you can see in the above diagram. The cls variable is of type Classifier that holds the classifier for the prediction to take place. The methods are uploadArff(), predict() and savePrediction. The uploadArff() is responsible for the upload of the students features stored in .arff file, while the savePrediction() method is responsible for saving the result in a location suitable for the user in a text file.
4.1 Execution of Performance Predictor Tool
After the system, has been implemented, we run and tested it in eclipse IDE. The tool has been tested severally and underwent troubleshooting to ensure all bugs are fixed. Consequently, the screen captures from different actions are provided in the figures below.
Figure 6. Screen capture showing the main Interface of the tool
As shown above three buttons of Upload File, Make Prediction and Save Result. The text area with scroll bar is the screen where the prediction result is shown.
The next screen capture in Fig 7 shows the dialog box through which the file containing the unseen features is uploaded. For the purpose of demonstration, a file named new_labelArff.arff has been selected and it is to be uploaded for the prediction.
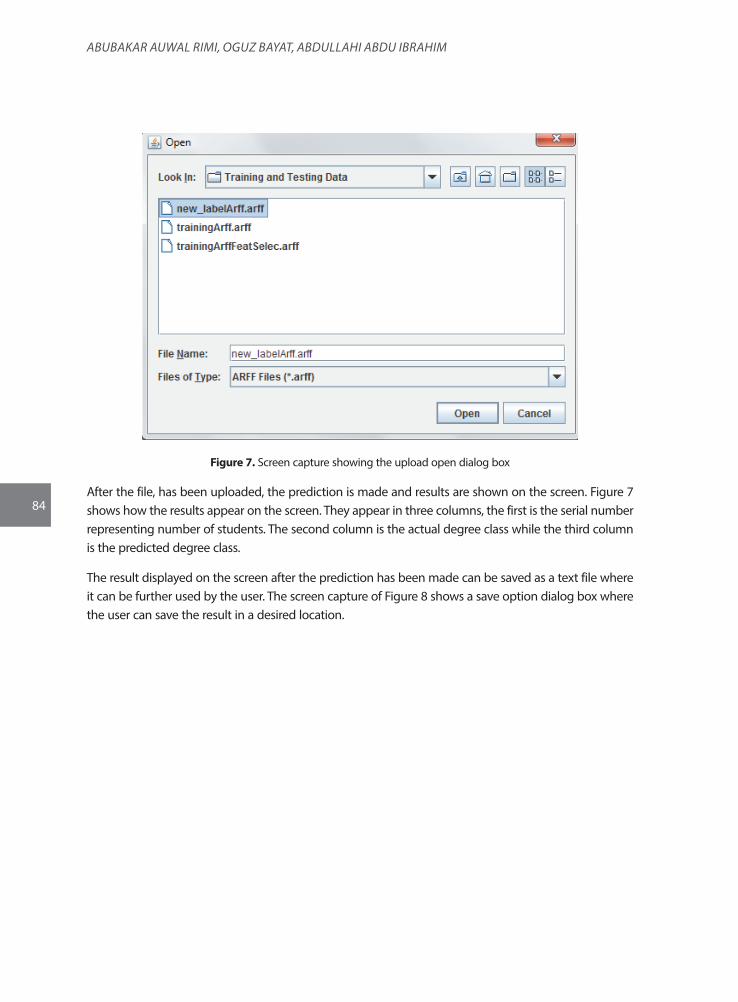
84
AbubAkAr AuwAl rIMI, Oguz bAYAT, AbdullAhI Abdu IbrAhIM
Figure 7. Screen capture showing the upload open dialog box
After the file, has been uploaded, the prediction is made and results are shown on the screen. Figure 7 shows how the results appear on the screen. They appear in three columns, the first is the serial number representing number of students. The second column is the actual degree class while the third column is the predicted degree class.
The result displayed on the screen after the prediction has been made can be saved as a text file where it can be further used by the user. The screen capture of Figure 8 shows a save option dialog box where the user can save the result in a desired location.
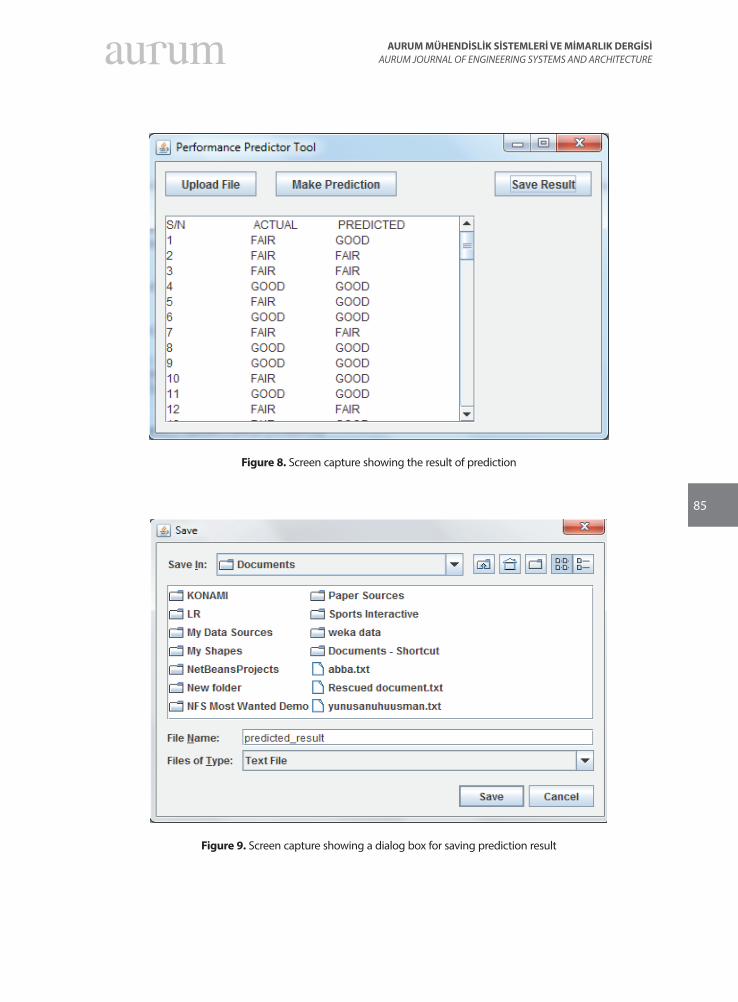
85
AURUM MÜHENDİSLİK SİSTEMLERİ VE MİMARLIK DERGİSİAURUM JOURNAL OF ENGINEERING SYSTEMS AND ARCHITECTURE
Figure 8. Screen capture showing the result of prediction
Figure 9. Screen capture showing a dialog box for saving prediction result
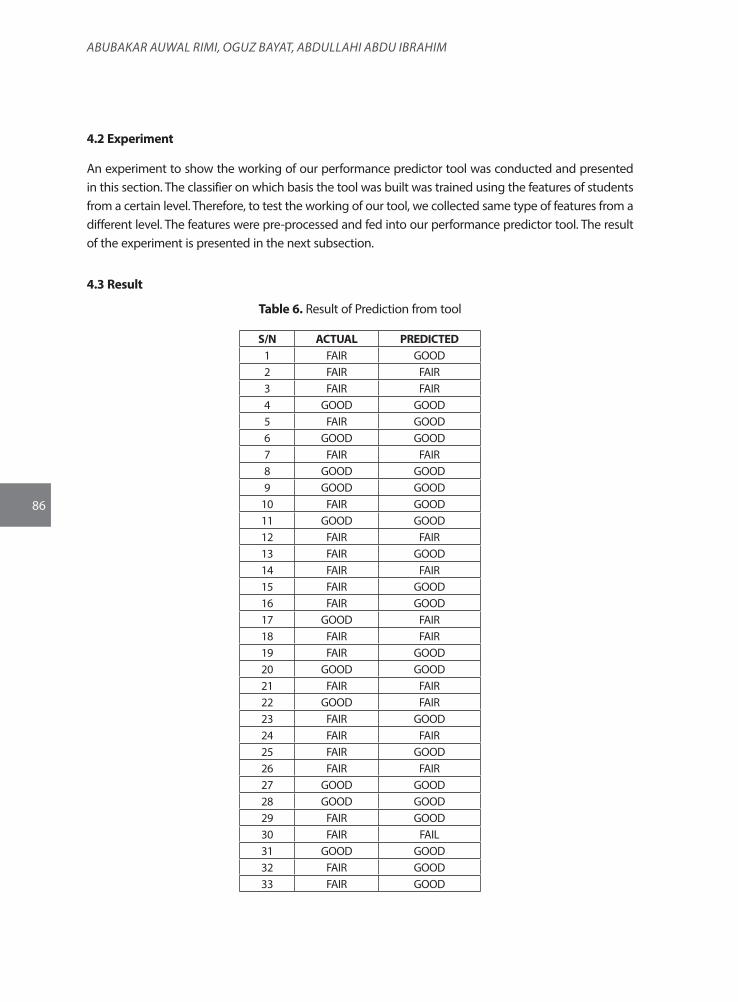
86
AbubAkAr AuwAl rIMI, Oguz bAYAT, AbdullAhI Abdu IbrAhIM
4.2 Experiment
An experiment to show the working of our performance predictor tool was conducted and presented in this section. The classifier on which basis the tool was built was trained using the features of students from a certain level. Therefore, to test the working of our tool, we collected same type of features from a different level. The features were pre-processed and fed into our performance predictor tool. The result of the experiment is presented in the next subsection.
4.3 Result
Table 6. Result of Prediction from tool
S/N ACTUAL PREDICTED1 FAIR GOOD2 FAIR FAIR3 FAIR FAIR4 GOOD GOOD5 FAIR GOOD6 GOOD GOOD7 FAIR FAIR8 GOOD GOOD9 GOOD GOOD
10 FAIR GOOD11 GOOD GOOD12 FAIR FAIR13 FAIR GOOD14 FAIR FAIR15 FAIR GOOD16 FAIR GOOD17 GOOD FAIR18 FAIR FAIR19 FAIR GOOD20 GOOD GOOD21 FAIR FAIR22 GOOD FAIR23 FAIR GOOD24 FAIR FAIR25 FAIR GOOD26 FAIR FAIR27 GOOD GOOD28 GOOD GOOD29 FAIR GOOD30 FAIR FAIL31 GOOD GOOD32 FAIR GOOD33 FAIR GOOD
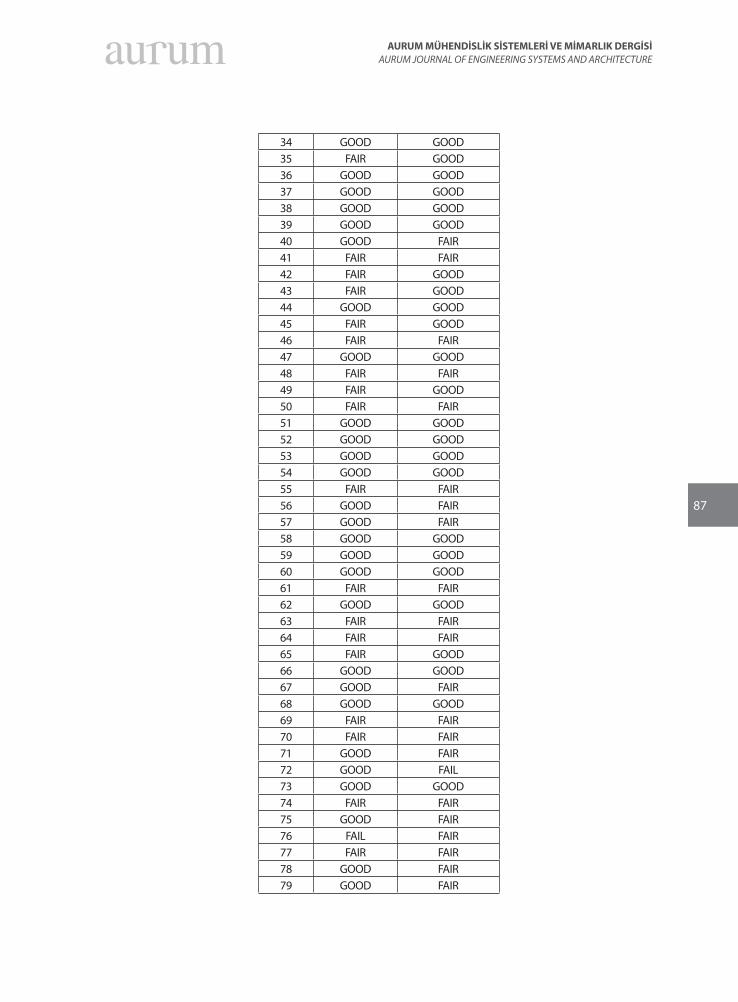
87
AURUM MÜHENDİSLİK SİSTEMLERİ VE MİMARLIK DERGİSİAURUM JOURNAL OF ENGINEERING SYSTEMS AND ARCHITECTURE
34 GOOD GOOD35 FAIR GOOD36 GOOD GOOD37 GOOD GOOD38 GOOD GOOD39 GOOD GOOD40 GOOD FAIR41 FAIR FAIR42 FAIR GOOD43 FAIR GOOD44 GOOD GOOD45 FAIR GOOD46 FAIR FAIR47 GOOD GOOD48 FAIR FAIR49 FAIR GOOD50 FAIR FAIR51 GOOD GOOD52 GOOD GOOD53 GOOD GOOD54 GOOD GOOD55 FAIR FAIR56 GOOD FAIR57 GOOD FAIR58 GOOD GOOD59 GOOD GOOD60 GOOD GOOD61 FAIR FAIR62 GOOD GOOD63 FAIR FAIR64 FAIR FAIR65 FAIR GOOD66 GOOD GOOD67 GOOD FAIR68 GOOD GOOD69 FAIR FAIR70 FAIR FAIR71 GOOD FAIR72 GOOD FAIL73 GOOD GOOD74 FAIR FAIR75 GOOD FAIR76 FAIL FAIR77 FAIR FAIR78 GOOD FAIR79 GOOD FAIR
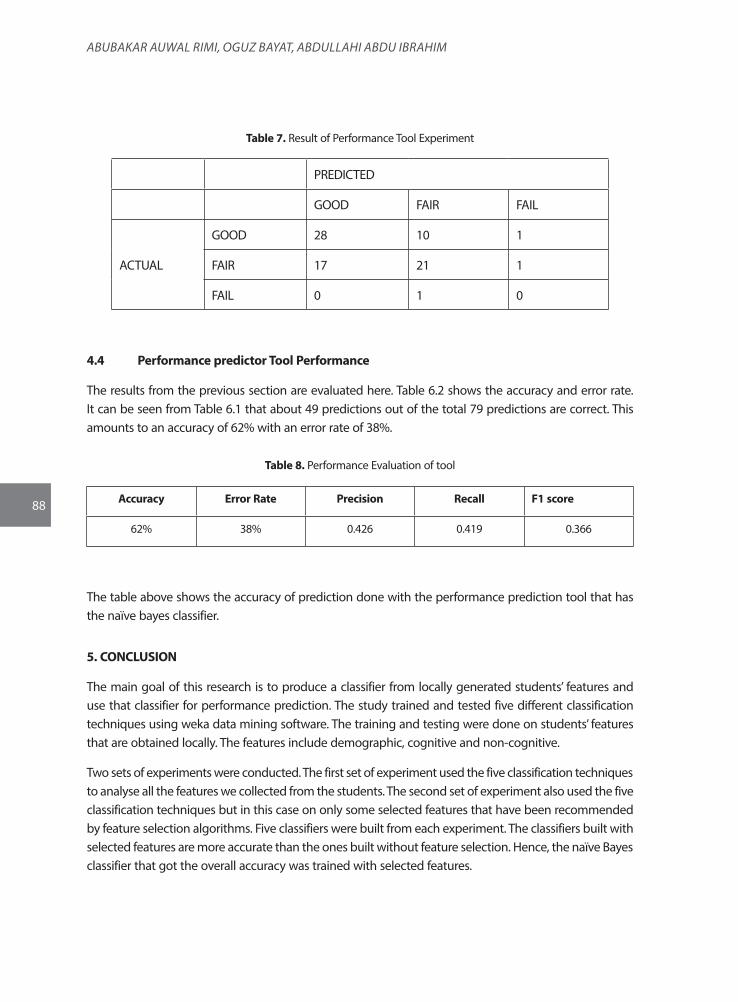
88
AbubAkAr AuwAl rIMI, Oguz bAYAT, AbdullAhI Abdu IbrAhIM
Table 7. Result of Performance Tool Experiment
PREDICTED
GOOD FAIR FAIL
ACTUAL
GOOD 28 10 1
FAIR 17 21 1
FAIL 0 1 0
4.4 Performance predictor Tool Performance
The results from the previous section are evaluated here. Table 6.2 shows the accuracy and error rate. It can be seen from Table 6.1 that about 49 predictions out of the total 79 predictions are correct. This amounts to an accuracy of 62% with an error rate of 38%.
Table 8. Performance Evaluation of tool
Accuracy Error Rate Precision Recall F1 score
62% 38% 0.426 0.419 0.366
The table above shows the accuracy of prediction done with the performance prediction tool that has the naïve bayes classifier.
5. CONCLUSION
The main goal of this research is to produce a classifier from locally generated students’ features and use that classifier for performance prediction. The study trained and tested five different classification techniques using weka data mining software. The training and testing were done on students’ features that are obtained locally. The features include demographic, cognitive and non-cognitive.
Two sets of experiments were conducted. The first set of experiment used the five classification techniques to analyse all the features we collected from the students. The second set of experiment also used the five classification techniques but in this case on only some selected features that have been recommended by feature selection algorithms. Five classifiers were built from each experiment. The classifiers built with selected features are more accurate than the ones built without feature selection. Hence, the naïve Bayes classifier that got the overall accuracy was trained with selected features.
89
AURUM MÜHENDİSLİK SİSTEMLERİ VE MİMARLIK DERGİSİAURUM JOURNAL OF ENGINEERING SYSTEMS AND ARCHITECTURE
Using Java programming language, a performance predictor tool that will enable users to make prediction based on the classifiers selected was developed and tested. The tool provided features for .arff file upload, new data prediction and prediction result saving. The tool also provided a screen where the prediction result can be viewed and comparison between actual and predicted value can be done.
6. REFERENCES
Abu Saa, A. 2016. Educational Data Mining and Students’ Performance Prediction. International Journal of Advanced Computer Science and Applications , 212-220.
Anonymous. 2018. Demographic Data. from Ryte, available in http://en.ryte.com/wiki/Demographic_Data ,last accessed September, 2019.
Badr, G., Algobail, A., Almutairi, H., and Almutery, M. 2016. Predicting Students’ Performance in University Courses: A Case Study and Tool in KSU Mathematics Department. Procedia Computer Science , 80-89.
Baker, R. S., and Yacef, K. 2009. The State of Educational Data Mining in 2009: A Review and Future Visions. Journal of Educational Data Mining , 3-16.
Baker, R. S. 2010. Data Mining for Education. International Encyclopedia of Education. Oxford, UK: Elsevier.
David, K. K., Adepeju, S. A., and Kolo, J. A. 2015. A Decision Tree Approach for Predicting Students Academic Performance. International Journal of Education and Management Engineering , 12-19.
Fayyad, U., Piatetsky-Shapiro, G., and Smyth, P. 1996. From Data Mining to Knowledge Discovery in Databases, AI Magazine , 37-54.
Han, J. and Kamber, M. 2006. Data Mining Concepts and Techniques, San Francisco: Morgan Kaufmann.
Joshi, R. 2017. Accuracy, Precision, Recall & F1 Score, Interpretation of Performance Measures, available in blog.exsilio.com/all/accuracy-precision-recall-f1-score-interpretation-of-performance-measures/ , last accessed March, 2019.
Mohamed, A. S., Husain, W., and Abdul Rahid, N. 2015. A Review on Predicting Student’s Performance Using Data Mining Techniques. Procedia Computer Science , 414-422.
Oprea, C. 2014. Perfromance Evaluation of the Data Mining Classification Methods. Annals of the Constantin Brancusi University of Targu Jiu, Economy Series, Special Issue-Information Society and Sustainable development (pp. 249-253). ACADEMICA BRANCUSI PUBLISHER.
Papamitsiou, Z., and Economides, A. A. 2014. Learning Analytics and Educational Data Mining in Practice: A Systematic Review of Empirical Evidence. Educational Technology & Society , 49-64.
Pena-Ayala, A. 2014. Educational data mining: A survey and a data mining-based analysis of recent works. Expert Systems with Applications , 1432-1462.

90
AbubAkAr AuwAl rIMI, Oguz bAYAT, AbdullAhI Abdu IbrAhIM
Sen, U. K. 2015. A Brief Review Status of Educational Data Mining. International Journal of Advanced Research in Computer Science & Technology
Smita, and Sharma, P. 2014. Use of Data Mining in Various Field. A Survey Paper, IOSR Journal of Computer Engineering , 18-21.
Sultana, S. Khan, S., and Abbas, M. A. 2017. Predicting performance of electrical engineering students using cognitive and non cognitive features for identification of potential dropouts. International Journal of Electrical Engineering Education , 1-14.
91
AURUM MÜHENDİSLİK SİSTEMLERİ VE MİMARLIK DERGİSİAURUM JOURNAL OF ENGINEERING SYSTEMS AND ARCHITECTURE
7. APPENDIX
ALTINBAS UNIVERSITY GRADUATE SCHOOL OF SCIENCE AND ENGINEERING
INFORMATION TECHNOLOGY DEPARTMENT QUESTIONNAIRE ON PREDICTION OF STUDENTS PERFORMANCE USING DATA MINING
CLASSIFICATION TECHNIQUES
Dear participant, I am a post-graduate student in Information Technology Department at Altinbas University. I am conducting a research on Educational Data Mining for my Masters Dissertation. The purpose of my study is to examine students’ data and use it to predict their future academic performance.
I would appreciate it if you help me answer the questions that follow as they are common questions and are assumed to be known by the target participants. And they will help in providing accurate result in the research. All information provided will be kept confidential. Thank you and God bless.
1. What is your gender? [ ] Male [ ] Female
2. How old are you? …………………..
3. Which of the social media tools do you use most often?
[ ] Facebook [ ] Twitter [ ] Whatsapp [ ] Instagram [ ] Others, specify ………..
[ ] I don’t use social media
4. If you use social media how much time do you spend on it per day?
[ ] Less than 1 hour [ ] 1 – 2 hours [ ] 2 – 4 hours [ ] More than 4 hours
An Extracurricular activity is any organized activity that a student does outside of school studies like sports, drama, music, literary and/or creative work, etc.
5. Do you participate in extracurricular activities? [ ] Yes [ ] No
6. How many hours do you spend on extracurricular activities per week?
[ ] 0 – 3 hours [ ] 4 – 7 hours [ ] 8 – 10 hours [ ] don’t participate at all
7. Do you smoke cigarette or shisha? [ ] Yes [ ] No
8. How often do you smoke any of the above?
[ ] Everyday [ ] 2 – 3 times a week [ ] Once a week [ ] Monthly
9. What is the highest level of education completed by your mother?
[ ] Primary [ ] Secondary [ ] NCE/Diploma [ ] Bachelor [ ] Masters [ ] PhD
[ ] No western education
10. What did you score in the that got you admitted into this Institution? ……………..

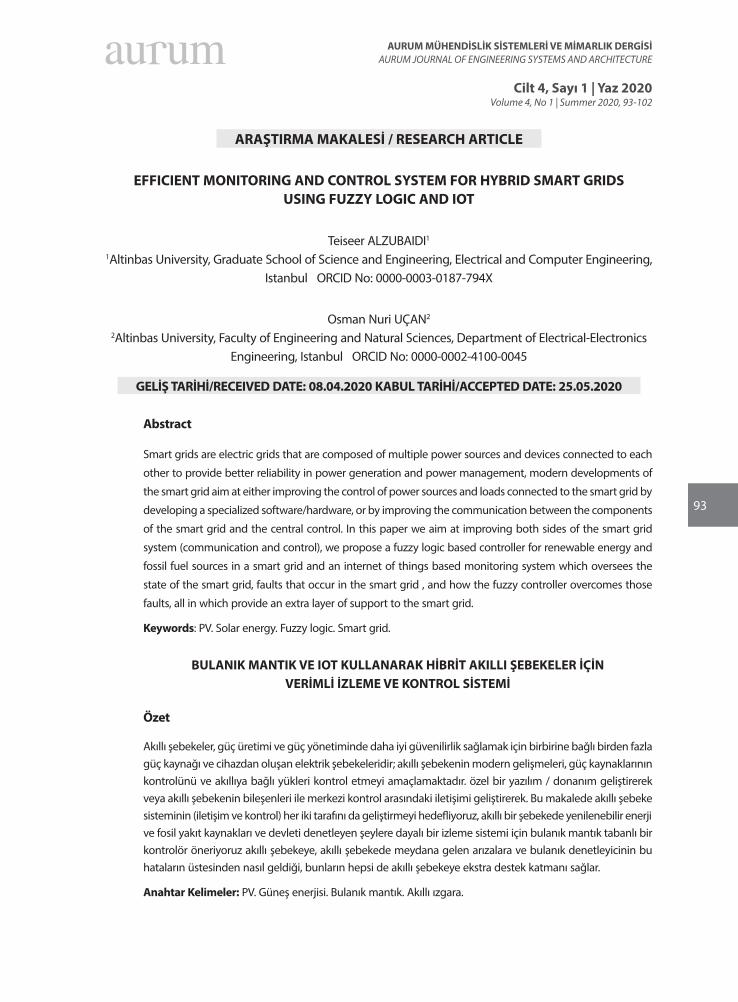
93
AURUM MÜHENDİSLİK SİSTEMLERİ VE MİMARLIK DERGİSİAURUM JOURNAL OF ENGINEERING SYSTEMS AND ARCHITECTURE
Cilt 4, Sayı 1 | Yaz 2020Volume 4, No 1 | Summer 2020, 93-102
ARAŞTIRMA MAKALESİ / RESEARCH ARTICLE
EFFICIENT MONITORING AND CONTROL SYSTEM FOR HYBRID SMART GRIDS USING FUZZY LOGIC AND IOT
Teiseer ALZUBAIDI1
1Altinbas University, Graduate School of Science and Engineering, Electrical and Computer Engineering, Istanbul ORCID No: 0000-0003-0187-794X
Osman Nuri UÇAN2
2Altinbas University, Faculty of Engineering and Natural Sciences, Department of Electrical-Electronics Engineering, Istanbul ORCID No: 0000-0002-4100-0045
GELİŞ TARİHİ/RECEIVED DATE: 08.04.2020 KABUL TARİHİ/ACCEPTED DATE: 25.05.2020
Abstract
Smart grids are electric grids that are composed of multiple power sources and devices connected to each
other to provide better reliability in power generation and power management, modern developments of
the smart grid aim at either improving the control of power sources and loads connected to the smart grid by
developing a specialized software/hardware, or by improving the communication between the components
of the smart grid and the central control. In this paper we aim at improving both sides of the smart grid
system (communication and control), we propose a fuzzy logic based controller for renewable energy and
fossil fuel sources in a smart grid and an internet of things based monitoring system which oversees the
state of the smart grid, faults that occur in the smart grid , and how the fuzzy controller overcomes those
faults, all in which provide an extra layer of support to the smart grid.
Keywords: PV. Solar energy. Fuzzy logic. Smart grid.
BULANIK MANTIK VE IOT KULLANARAK HİBRİT AKILLI ŞEBEKELER İÇİN VERİMLİ İZLEME VE KONTROL SİSTEMİ
Özet
Akıllı şebekeler, güç üretimi ve güç yönetiminde daha iyi güvenilirlik sağlamak için birbirine bağlı birden fazla güç kaynağı ve cihazdan oluşan elektrik şebekeleridir; akıllı şebekenin modern gelişmeleri, güç kaynaklarının kontrolünü ve akıllıya bağlı yükleri kontrol etmeyi amaçlamaktadır. özel bir yazılım / donanım geliştirerek veya akıllı şebekenin bileşenleri ile merkezi kontrol arasındaki iletişimi geliştirerek. Bu makalede akıllı şebeke sisteminin (iletişim ve kontrol) her iki tarafını da geliştirmeyi hedefliyoruz, akıllı bir şebekede yenilenebilir enerji ve fosil yakıt kaynakları ve devleti denetleyen şeylere dayalı bir izleme sistemi için bulanık mantık tabanlı bir kontrolör öneriyoruz akıllı şebekeye, akıllı şebekede meydana gelen arızalara ve bulanık denetleyicinin bu hataların üstesinden nasıl geldiği, bunların hepsi de akıllı şebekeye ekstra destek katmanı sağlar.
Anahtar Kelimeler: PV. Güneş enerjisi. Bulanık mantık. Akıllı ızgara.
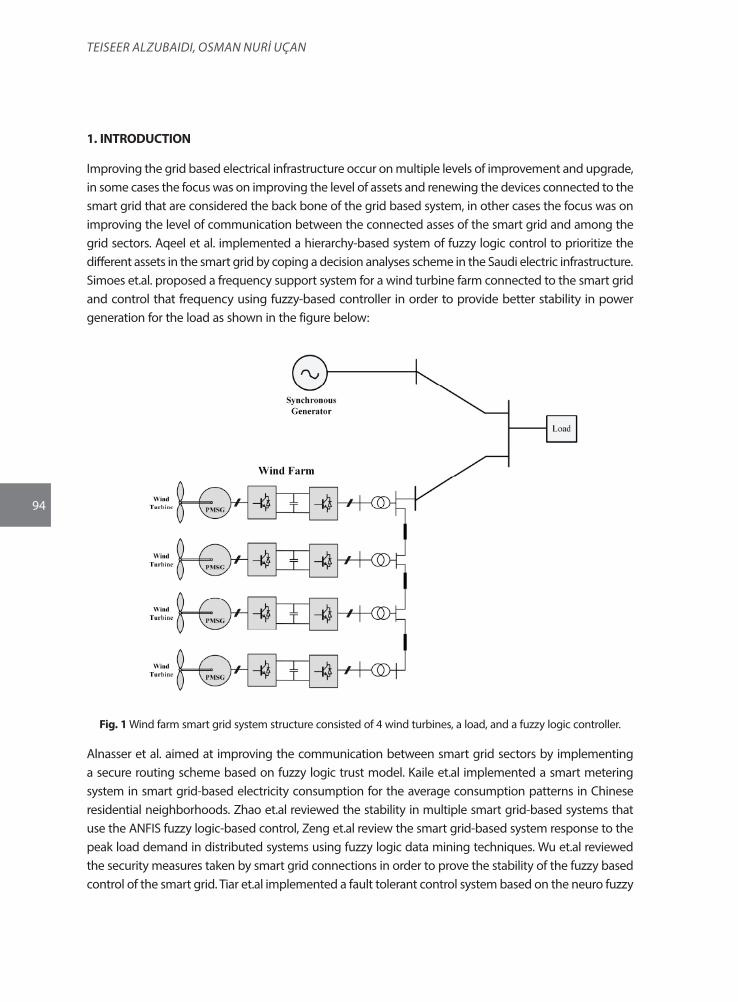
94
Teiseer ALZUBAiDi, OsmAn nUri UÇAn
1. INTRODUCTION
Improving the grid based electrical infrastructure occur on multiple levels of improvement and upgrade, in some cases the focus was on improving the level of assets and renewing the devices connected to the smart grid that are considered the back bone of the grid based system, in other cases the focus was on improving the level of communication between the connected asses of the smart grid and among the grid sectors. Aqeel et al. implemented a hierarchy-based system of fuzzy logic control to prioritize the different assets in the smart grid by coping a decision analyses scheme in the Saudi electric infrastructure. Simoes et.al. proposed a frequency support system for a wind turbine farm connected to the smart grid and control that frequency using fuzzy-based controller in order to provide better stability in power generation for the load as shown in the figure below:
Fig. 1 Wind farm smart grid system structure consisted of 4 wind turbines, a load, and a fuzzy logic controller.
Alnasser et al. aimed at improving the communication between smart grid sectors by implementing a secure routing scheme based on fuzzy logic trust model. Kaile et.al implemented a smart metering system in smart grid-based electricity consumption for the average consumption patterns in Chinese residential neighborhoods. Zhao et.al reviewed the stability in multiple smart grid-based systems that use the ANFIS fuzzy logic-based control, Zeng et.al review the smart grid-based system response to the peak load demand in distributed systems using fuzzy logic data mining techniques. Wu et.al reviewed the security measures taken by smart grid connections in order to prove the stability of the fuzzy based control of the smart grid. Tiar et.al implemented a fault tolerant control system based on the neuro fuzzy
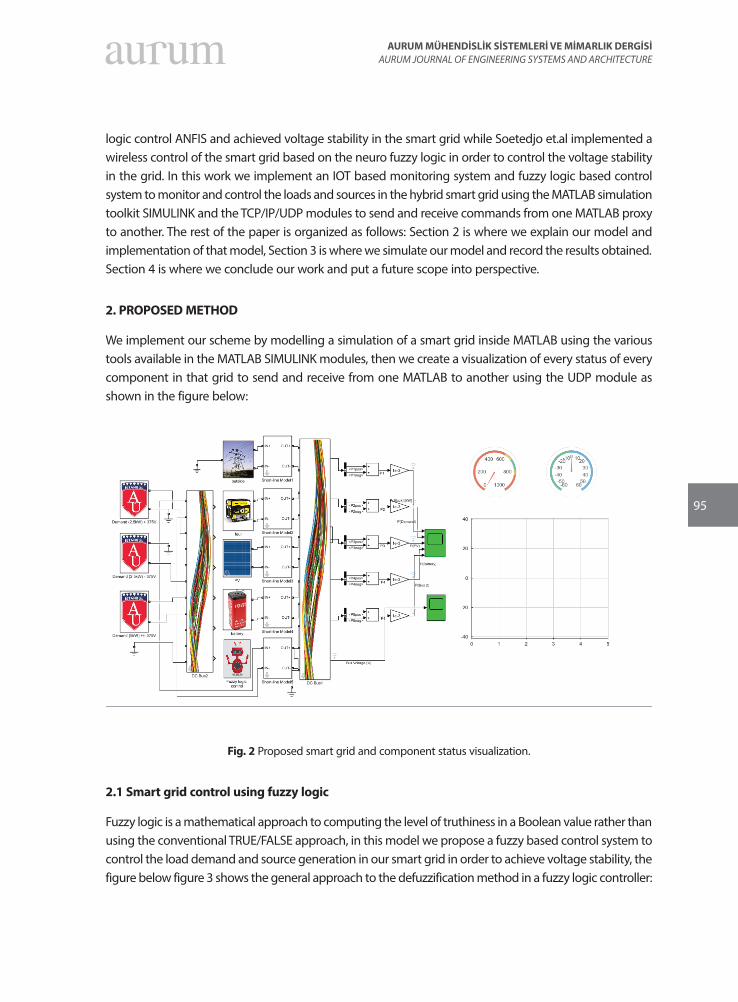
95
AURUM MÜHENDİSLİK SİSTEMLERİ VE MİMARLIK DERGİSİAURUM JOURNAL OF ENGINEERING SYSTEMS AND ARCHITECTURE
logic control ANFIS and achieved voltage stability in the smart grid while Soetedjo et.al implemented a wireless control of the smart grid based on the neuro fuzzy logic in order to control the voltage stability in the grid. In this work we implement an IOT based monitoring system and fuzzy logic based control system to monitor and control the loads and sources in the hybrid smart grid using the MATLAB simulation toolkit SIMULINK and the TCP/IP/UDP modules to send and receive commands from one MATLAB proxy to another. The rest of the paper is organized as follows: Section 2 is where we explain our model and implementation of that model, Section 3 is where we simulate our model and record the results obtained. Section 4 is where we conclude our work and put a future scope into perspective.
2. PROPOSED METHOD
We implement our scheme by modelling a simulation of a smart grid inside MATLAB using the various tools available in the MATLAB SIMULINK modules, then we create a visualization of every status of every component in that grid to send and receive from one MATLAB to another using the UDP module as shown in the figure below:
Fig. 2 Proposed smart grid and component status visualization.
2.1 Smart grid control using fuzzy logic
Fuzzy logic is a mathematical approach to computing the level of truthiness in a Boolean value rather than using the conventional TRUE/FALSE approach, in this model we propose a fuzzy based control system to control the load demand and source generation in our smart grid in order to achieve voltage stability, the figure below figure 3 shows the general approach to the defuzzification method in a fuzzy logic controller:
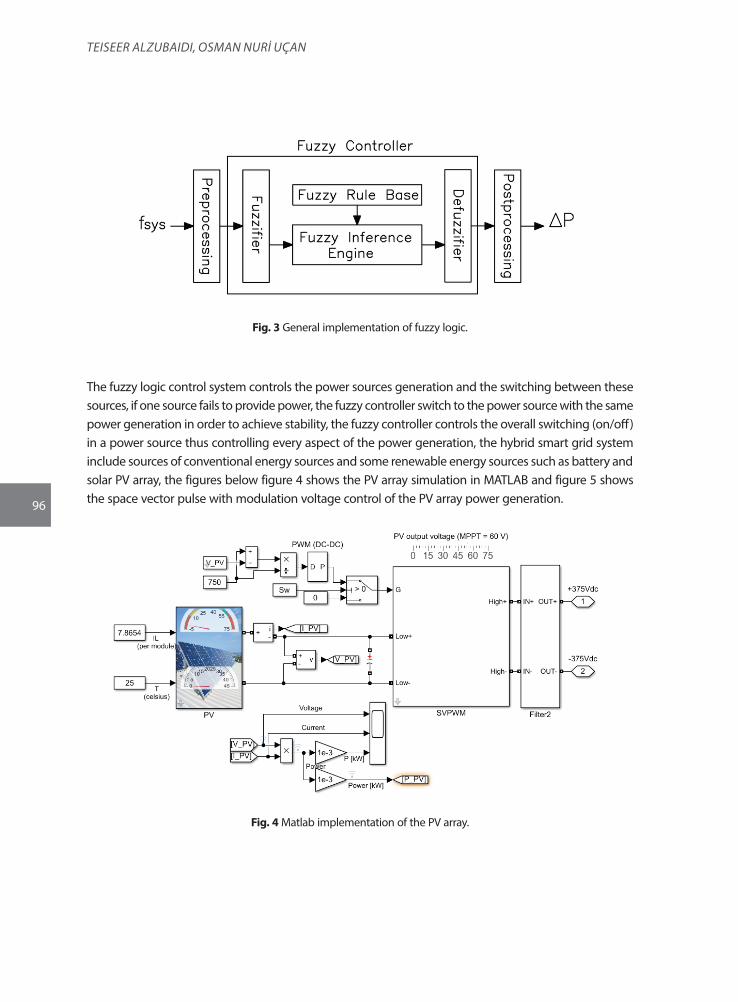
96
Teiseer ALZUBAiDi, OsmAn nUri UÇAn
Fig. 3 General implementation of fuzzy logic.
The fuzzy logic control system controls the power sources generation and the switching between these sources, if one source fails to provide power, the fuzzy controller switch to the power source with the same power generation in order to achieve stability, the fuzzy controller controls the overall switching (on/off) in a power source thus controlling every aspect of the power generation, the hybrid smart grid system include sources of conventional energy sources and some renewable energy sources such as battery and solar PV array, the figures below figure 4 shows the PV array simulation in MATLAB and figure 5 shows the space vector pulse with modulation voltage control of the PV array power generation.
Fig. 4 Matlab implementation of the PV array.
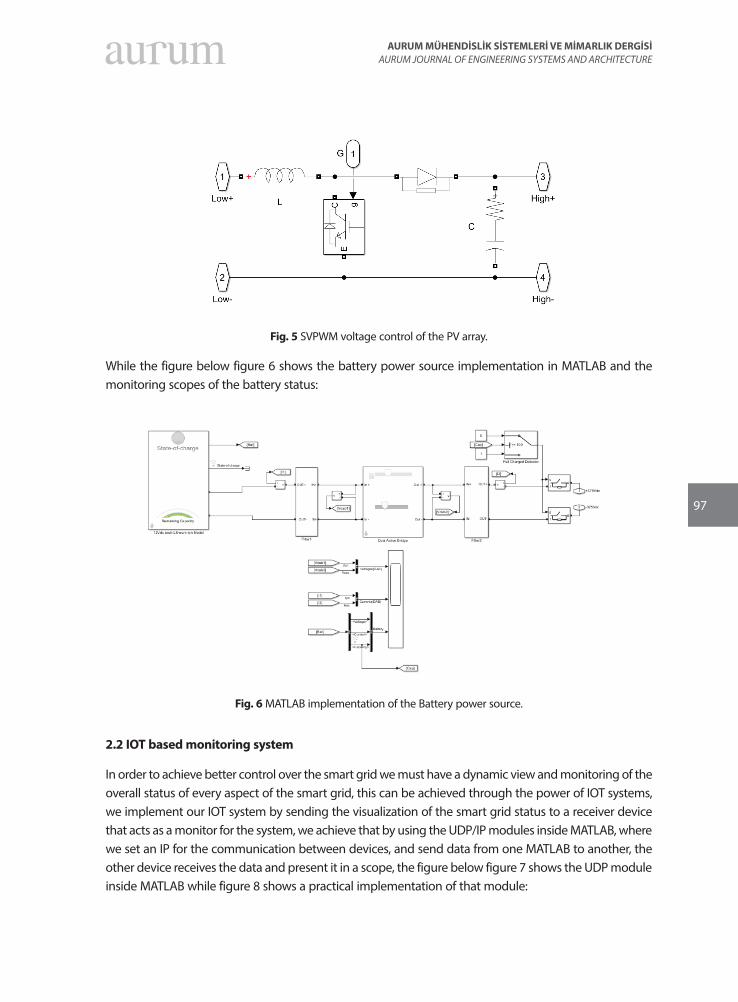
97
AURUM MÜHENDİSLİK SİSTEMLERİ VE MİMARLIK DERGİSİAURUM JOURNAL OF ENGINEERING SYSTEMS AND ARCHITECTURE
Fig. 5 SVPWM voltage control of the PV array.
While the figure below figure 6 shows the battery power source implementation in MATLAB and the monitoring scopes of the battery status:
Fig. 6 MATLAB implementation of the Battery power source.
2.2 IOT based monitoring system
In order to achieve better control over the smart grid we must have a dynamic view and monitoring of the overall status of every aspect of the smart grid, this can be achieved through the power of IOT systems, we implement our IOT system by sending the visualization of the smart grid status to a receiver device that acts as a monitor for the system, we achieve that by using the UDP/IP modules inside MATLAB, where we set an IP for the communication between devices, and send data from one MATLAB to another, the other device receives the data and present it in a scope, the figure below figure 7 shows the UDP module inside MATLAB while figure 8 shows a practical implementation of that module:
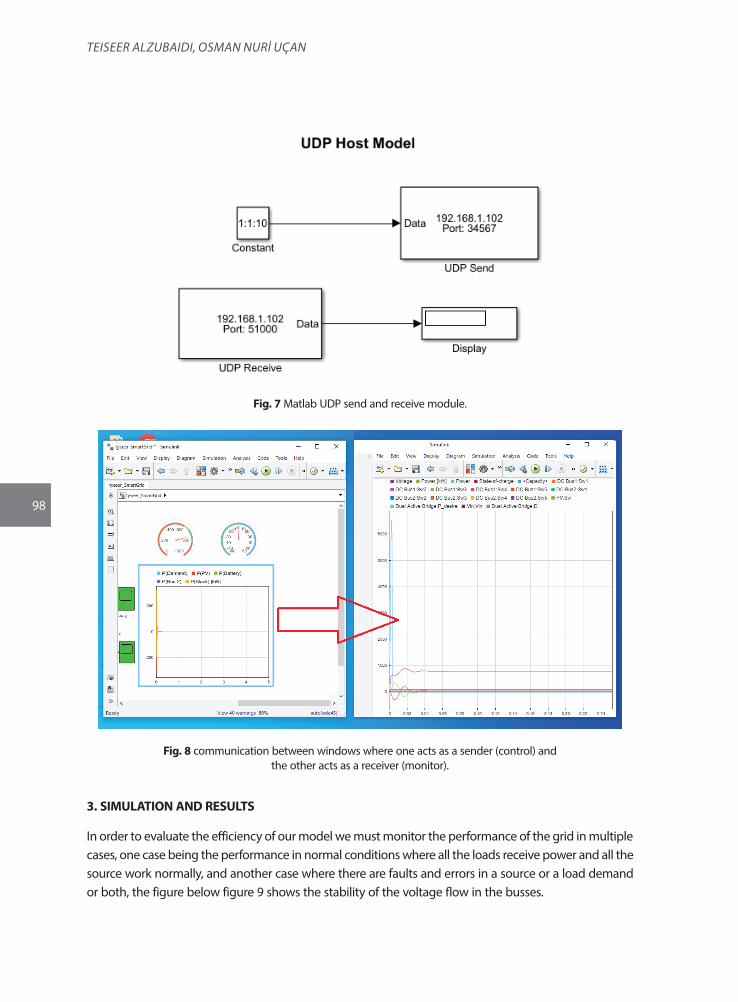
98
Teiseer ALZUBAiDi, OsmAn nUri UÇAn
Fig. 7 Matlab UDP send and receive module.
Fig. 8 communication between windows where one acts as a sender (control) and the other acts as a receiver (monitor).
3. SIMULATION AND RESULTS
In order to evaluate the efficiency of our model we must monitor the performance of the grid in multiple cases, one case being the performance in normal conditions where all the loads receive power and all the source work normally, and another case where there are faults and errors in a source or a load demand or both, the figure below figure 9 shows the stability of the voltage flow in the busses.
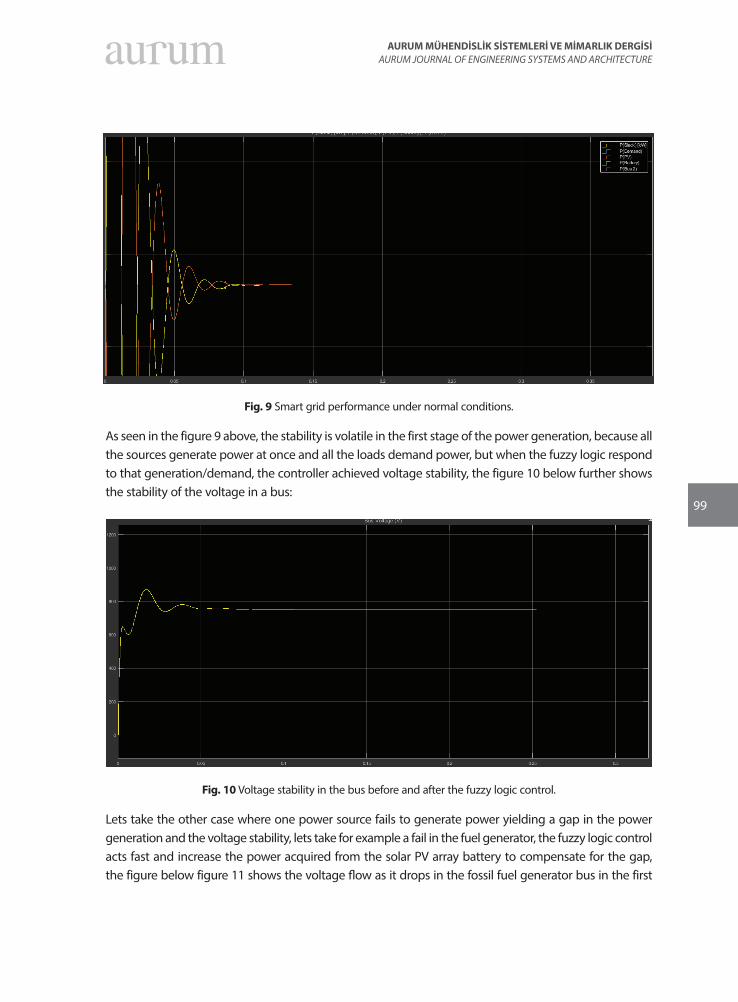
99
AURUM MÜHENDİSLİK SİSTEMLERİ VE MİMARLIK DERGİSİAURUM JOURNAL OF ENGINEERING SYSTEMS AND ARCHITECTURE
Fig. 9 Smart grid performance under normal conditions.
As seen in the figure 9 above, the stability is volatile in the first stage of the power generation, because all the sources generate power at once and all the loads demand power, but when the fuzzy logic respond to that generation/demand, the controller achieved voltage stability, the figure 10 below further shows the stability of the voltage in a bus:
Fig. 10 Voltage stability in the bus before and after the fuzzy logic control.
Lets take the other case where one power source fails to generate power yielding a gap in the power generation and the voltage stability, lets take for example a fail in the fuel generator, the fuzzy logic control acts fast and increase the power acquired from the solar PV array battery to compensate for the gap, the figure below figure 11 shows the voltage flow as it drops in the fossil fuel generator bus in the first
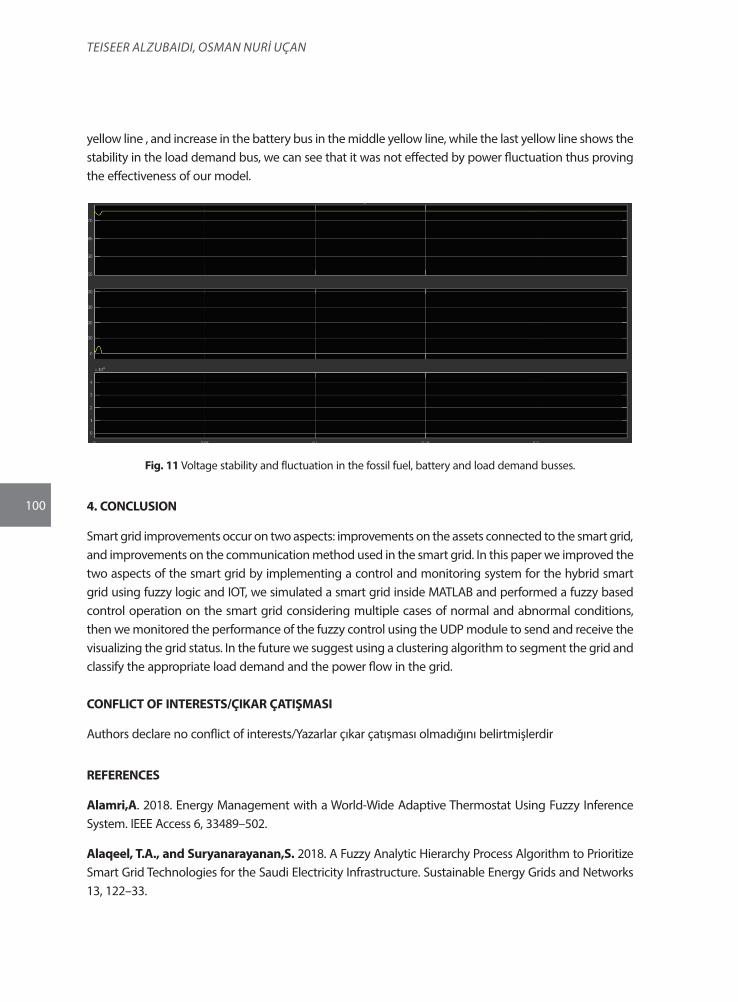
100
Teiseer ALZUBAiDi, OsmAn nUri UÇAn
yellow line , and increase in the battery bus in the middle yellow line, while the last yellow line shows the stability in the load demand bus, we can see that it was not effected by power fluctuation thus proving the effectiveness of our model.
Fig. 11 Voltage stability and fluctuation in the fossil fuel, battery and load demand busses.
4. CONCLUSION
Smart grid improvements occur on two aspects: improvements on the assets connected to the smart grid, and improvements on the communication method used in the smart grid. In this paper we improved the two aspects of the smart grid by implementing a control and monitoring system for the hybrid smart grid using fuzzy logic and IOT, we simulated a smart grid inside MATLAB and performed a fuzzy based control operation on the smart grid considering multiple cases of normal and abnormal conditions, then we monitored the performance of the fuzzy control using the UDP module to send and receive the visualizing the grid status. In the future we suggest using a clustering algorithm to segment the grid and classify the appropriate load demand and the power flow in the grid.
CONFLICT OF INTERESTS/ÇIKAR ÇATIŞMASI
Authors declare no conflict of interests/Yazarlar çıkar çatışması olmadığını belirtmişlerdir
REFERENCES
Alamri,A. 2018. Energy Management with a World-Wide Adaptive Thermostat Using Fuzzy Inference System. IEEE Access 6, 33489–502.
Alaqeel, T.A., and Suryanarayanan,S. 2018. A Fuzzy Analytic Hierarchy Process Algorithm to Prioritize Smart Grid Technologies for the Saudi Electricity Infrastructure. Sustainable Energy Grids and Networks 13, 122–33.
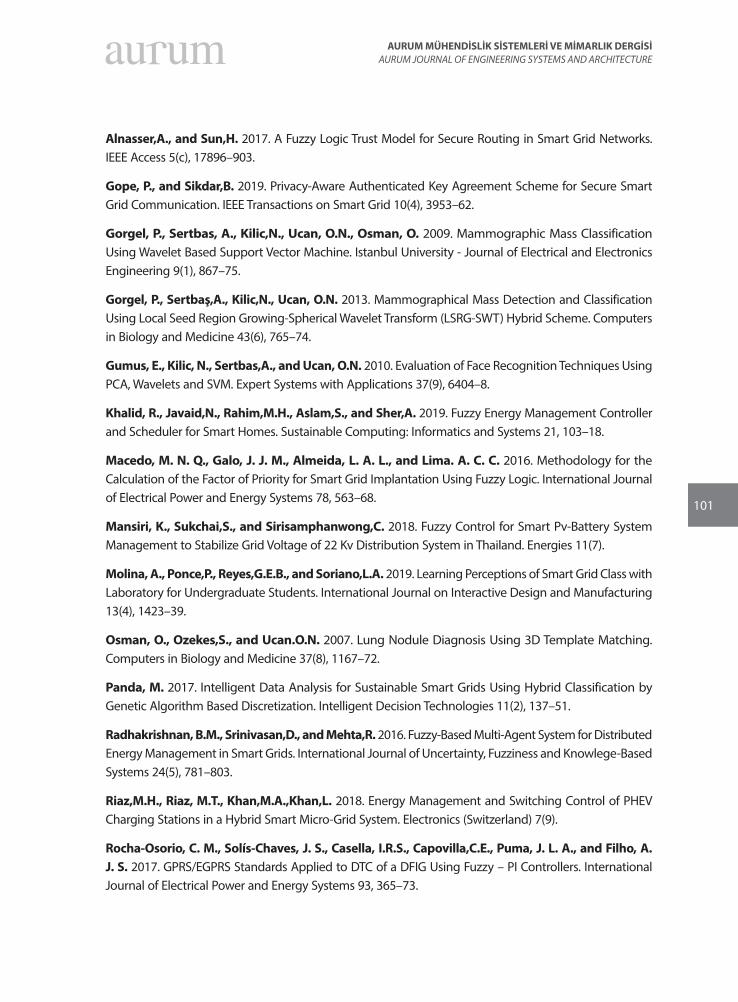
101
AURUM MÜHENDİSLİK SİSTEMLERİ VE MİMARLIK DERGİSİAURUM JOURNAL OF ENGINEERING SYSTEMS AND ARCHITECTURE
Alnasser,A., and Sun,H. 2017. A Fuzzy Logic Trust Model for Secure Routing in Smart Grid Networks. IEEE Access 5(c), 17896–903.
Gope, P., and Sikdar,B. 2019. Privacy-Aware Authenticated Key Agreement Scheme for Secure Smart Grid Communication. IEEE Transactions on Smart Grid 10(4), 3953–62.
Gorgel, P., Sertbas, A., Kilic,N., Ucan, O.N., Osman, O. 2009. Mammographic Mass Classification Using Wavelet Based Support Vector Machine. Istanbul University - Journal of Electrical and Electronics Engineering 9(1), 867–75.
Gorgel, P., Sertbaş,A., Kilic,N., Ucan, O.N. 2013. Mammographical Mass Detection and Classification Using Local Seed Region Growing-Spherical Wavelet Transform (LSRG-SWT) Hybrid Scheme. Computers in Biology and Medicine 43(6), 765–74.
Gumus, E., Kilic, N., Sertbas,A., and Ucan, O.N. 2010. Evaluation of Face Recognition Techniques Using PCA, Wavelets and SVM. Expert Systems with Applications 37(9), 6404–8.
Khalid, R., Javaid,N., Rahim,M.H., Aslam,S., and Sher,A. 2019. Fuzzy Energy Management Controller and Scheduler for Smart Homes. Sustainable Computing: Informatics and Systems 21, 103–18.
Macedo, M. N. Q., Galo, J. J. M., Almeida, L. A. L., and Lima. A. C. C. 2016. Methodology for the Calculation of the Factor of Priority for Smart Grid Implantation Using Fuzzy Logic. International Journal of Electrical Power and Energy Systems 78, 563–68.
Mansiri, K., Sukchai,S., and Sirisamphanwong,C. 2018. Fuzzy Control for Smart Pv-Battery System Management to Stabilize Grid Voltage of 22 Kv Distribution System in Thailand. Energies 11(7).
Molina, A., Ponce,P., Reyes,G.E.B., and Soriano,L.A. 2019. Learning Perceptions of Smart Grid Class with Laboratory for Undergraduate Students. International Journal on Interactive Design and Manufacturing 13(4), 1423–39.
Osman, O., Ozekes,S., and Ucan.O.N. 2007. Lung Nodule Diagnosis Using 3D Template Matching. Computers in Biology and Medicine 37(8), 1167–72.
Panda, M. 2017. Intelligent Data Analysis for Sustainable Smart Grids Using Hybrid Classification by Genetic Algorithm Based Discretization. Intelligent Decision Technologies 11(2), 137–51.
Radhakrishnan, B.M., Srinivasan,D., and Mehta,R. 2016. Fuzzy-Based Multi-Agent System for Distributed Energy Management in Smart Grids. International Journal of Uncertainty, Fuzziness and Knowlege-Based Systems 24(5), 781–803.
Riaz,M.H., Riaz, M.T., Khan,M.A.,Khan,L. 2018. Energy Management and Switching Control of PHEV Charging Stations in a Hybrid Smart Micro-Grid System. Electronics (Switzerland) 7(9).
Rocha-Osorio, C. M., Solís-Chaves, J. S., Casella, I.R.S., Capovilla,C.E., Puma, J. L. A., and Filho, A. J. S. 2017. GPRS/EGPRS Standards Applied to DTC of a DFIG Using Fuzzy – PI Controllers. International Journal of Electrical Power and Energy Systems 93, 365–73.
102
Teiseer ALZUBAiDi, OsmAn nUri UÇAn
Simões, M. G., and Bubshait,A. 2019. Frequency Support of Smart Grid Using Fuzzy Logic-Based Controller for Wind Energy Systems. Energies 12(8).
Soares, J., Borges,N., Ghazvini, M.A.F., Vale,Z., and Oliveira, P.B.M. 2016. Scenario Generation for Electric Vehicles’ Uncertain Behavior in a Smart City Environment. Energy 111, 664–75.
Soetedjo, A., Nakhoda,Y.I., and Saleh,C. 2018. Embedded Fuzzy Logic Controller and Wireless Communication for Home Energy Management Systems. Electronics (Switzerland) 7(9).
Tiar, M., Achour B., Drid,S., Abdeddaim,S., Sellali,M., and Medjmadj, S. 2019. Fault-Tolerant Control of a Smart PV-Grid Hybrid System. IET Renewable Power Generation 13(13), 2451–61.
Tsao, Y.C., Thanh, V. V., and Lu, J. C. 2019. Multiobjective Robust Fuzzy Stochastic Approach for Sustainable Smart Grid Design. Energy 176, 929–39.
Velusamy, D., and Pugalendhi, G.K. 2019. Fuzzy Integrated Bayesian Dempster–Shafer Theory to Defend Cross-Layer Heterogeneity Attacks in Communication Network of Smart Grid. Information Sciences 479, 542–66.
Wu, J., Ota,K., Dong,M., Li,J., and Wang, H. 2016. Big Data Analysis-Based Security Situational Awareness for Smart Grid. IEEE Transactions on Big Data 4(3), 408–17.
Zeng, B., Wei,X., Sun,B., Qiu,F., Zhang,J., and Quan,X. 2020. Assessing Capacity Credit of Demand Response in Smart Distribution Grids with Behavior-Driven Modeling Framework. International Journal of Electrical Power and Energy Systems 118(July 2019), 105745.
Zhao, H., and Li,N. 2016. Performance Evaluation for Sustainability of Strong Smart Grid by Using Stochastic AHP and Fuzzy TOPSIS Methods. Sustainability (Switzerland) 8(2), 1–22.
Zhou, K., Yang,C., and Shen,J. 2017. Discovering Residential Electricity Consumption Patterns through Smart-Meter Data Mining: A Case Study from China. Utilities Policy 44, 73–84.
103
AURUM MÜHENDİSLİK SİSTEMLERİ VE MİMARLIK DERGİSİAURUM JOURNAL OF ENGINEERING SYSTEMS AND ARCHITECTURE
Cilt 4, Sayı 1 | Yaz 2020Volume 4, No 1 | Summer 2020, 103-111
ARAŞTIRMA MAKALESİ / RESEARCH ARTICLE
AUTOMATIC COMBINATION OF USER VIEWS FOR DATABASE CREATION
Sefer KURNAZ1
1Altınbaş University, Faculty of Engineering and Natural Sciences, Department of Computer Engineering, Istanbul
[email protected], ORCID: 0000-0002-7666-2639
Erden BAŞAR2
2International Final University 1Altinbas University, Istanbul
[email protected], ORCID: 0000-0001-7134-6971
GELİŞ TARİHİ/RECEIVED DATE: 01.06.2020 KABUL TARİHİ/ACCEPTED DATE: 02.06.2020
Abstract
People make up their minds in accordance with the information that they have in hand. If they have the right information the decision will be right otherwise it will be inaccurate. Information can be created on demand, which means when information is needed it should be created as soon as possible. We can ask ourselves “What is the information?” If it is going to help me make my mind, I have to define it. Information can be defined as processed data. Data itself means raw information, while information is the form of meaningful data. In this study we are presenting how to build our data base to save information in correct form to create useful information. (Kurnaz and Başar, 1991)
Keyword: Database, Information, Data
VERİTABANI OLUŞTURMADA, KULLANICI GÖRÜŞLERİNİN BİLGİSAYAR PROGRAM İLE OTOMATİK BÜTÜNLEŞTİRİLMESİ
Özet
İnsanlar kararlarını ellerinde bulunan bilgiye göre verirler. Eğer eldeki bilgi doğru ise verilen karar da doğru olur, değilse karar yanlış olur. Bilgi ihtiyaç duyulduğu anda elde edilmelidir. Bunun anlamı bilgi ihtiyaç duyulduğunda hemen üretilmelidir. O zaman kendi kendimize bilgi nedir? sorusunu sorabiliriz. Eğer karar vermeme yardım edecekse bilgiyi tanımlayabilmeliyim. Bilgi işlenmiş veri olarak tanımlanabilir. Veri ise işlenmemiş bilgi olarak tanımlanabilir. Detaylı açıklama takip eden paragraflarda verilmektedir. Bu çalışmada biz veritabanımızı nasıl oluşturalımki veriyi doğru formatta saklasın ve ihtiyaç duyduğumuzda istediğimiz bilgiyi bize doğru olarak üretebilsin.
Anahtar Kelimeler: Veritabanı, Bilgi, Veri
104
Sefer KUrNAZ, erdeN BAŞAr
1. INTRODUCTION
We can save our data in different ways and in different formats, such as in files and in databases. We are not going to explain file system here, although they are used in database management system. There are different types of database management systems that can be used by the users to process their data. One of them is relational database management system. In relational database management system all entities are shown as tables. We can define a table as an entity set. A student table can be given as an example that composed of “Number”, “Name,” and “Address”. This does not mean this table is ready to be part of the database and is ready to be used by the users. We have to apply some process on tables before creating them in database. Before explaining these process lets make some general definitions. (Kurnaz and Başar, 1991)
a. Entity: It is an object that can be separable at least one feature from the other objects. As an example; a student is different from an instructor. Instructor teaches and student is a learner who learns what has been taught.
b. Attribute: It is a field of an entity. Number is an attribute of student.
c. Key: is the unique attribute value in the database.
d. Cardinality: The numbers of rows or records in a table.
e. Degree: The number of attributes in a table.
The records that composed of the entities data are saved in files on hard disk. As an example we can save student records in file called “Student” and the course records can be composed in a file called “Course”. When information is requested, an SQL command dealing with that information is written and executed in the database.
In order to create correct information, tables in database must satisfy canonical form conditions. Before creating a database each table should be tested in accordance with normal form rules. Table called “Instructor Course” as shown in Fig.1 is going to be used while we are explaining normal form rules. Now we can start to define normal forms and explain what we are talking about.
It will be good to explain table “Instructor Course” column names, before starting. Instructor Course: The name of Instructor Course Table,
InsNo: Instructor Number,
InsName: Instructor Name,
Address: Address,
Plate: Plate number of Address,
CrsNo: Course Number,
CrsName: Course Name.
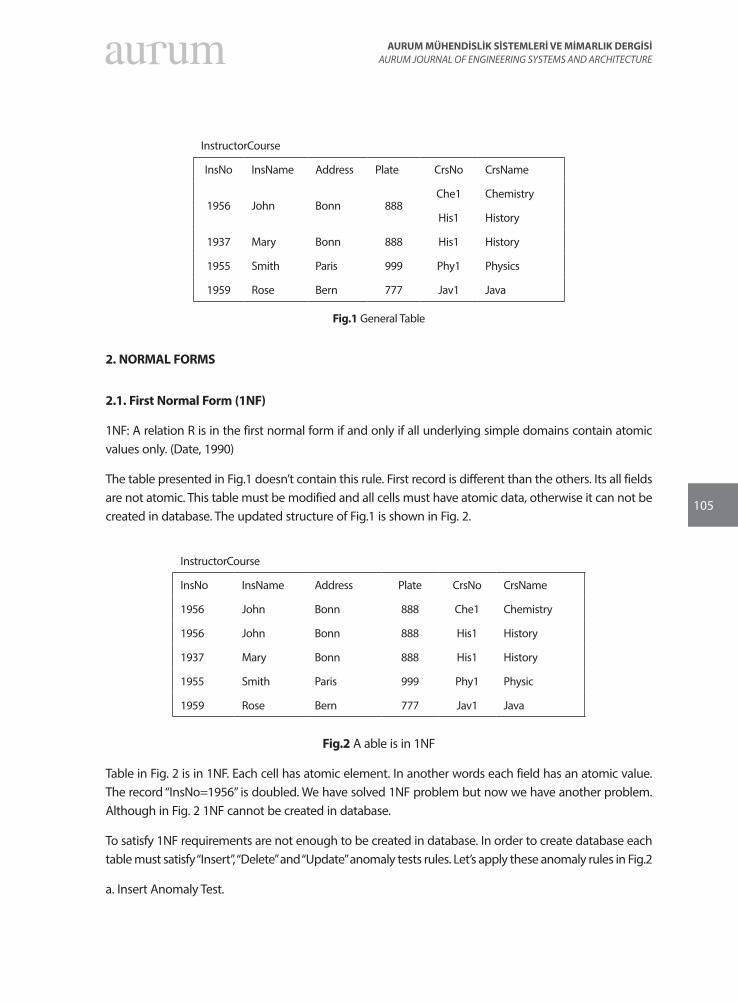
105
AURUM MÜHENDİSLİK SİSTEMLERİ VE MİMARLIK DERGİSİAURUM JOURNAL OF ENGINEERING SYSTEMS AND ARCHITECTURE
InstructorCourse
InsNo InsName Address Plate CrsNo CrsName
1956 John Bonn 888Che1 Chemistry
His1 History
1937 Mary Bonn 888 His1 History
1955 Smith Paris 999 Phy1 Physics
1959 Rose Bern 777 Jav1 Java
Fig.1 General Table
2. NORMAL FORMS
2.1. First Normal Form (1NF)
1NF: A relation R is in the first normal form if and only if all underlying simple domains contain atomic values only. (Date, 1990)
The table presented in Fig.1 doesn’t contain this rule. First record is different than the others. Its all fields are not atomic. This table must be modified and all cells must have atomic data, otherwise it can not be created in database. The updated structure of Fig.1 is shown in Fig. 2.
InstructorCourse
InsNo InsName Address Plate CrsNo CrsName
1956 John Bonn 888 Che1 Chemistry
1956 John Bonn 888 His1 History
1937 Mary Bonn 888 His1 History
1955 Smith Paris 999 Phy1 Physic
1959 Rose Bern 777 Jav1 Java
Fig.2 A able is in 1NF
Table in Fig. 2 is in 1NF. Each cell has atomic element. In another words each field has an atomic value. The record “InsNo=1956” is doubled. We have solved 1NF problem but now we have another problem. Although in Fig. 2 1NF cannot be created in database.
To satisfy 1NF requirements are not enough to be created in database. In order to create database each table must satisfy “Insert”, “Delete” and “Update” anomaly tests rules. Let’s apply these anomaly rules in Fig.2
a. Insert Anomaly Test.
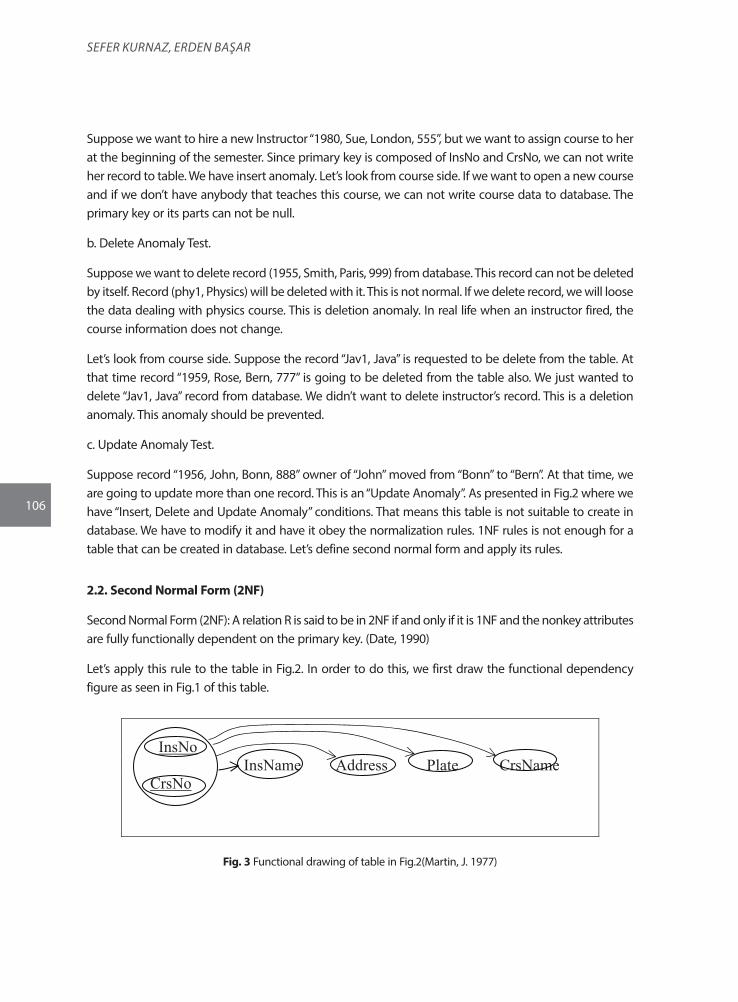
106
Sefer KUrNAZ, erdeN BAŞAr
Suppose we want to hire a new Instructor “1980, Sue, London, 555”, but we want to assign course to her at the beginning of the semester. Since primary key is composed of InsNo and CrsNo, we can not write her record to table. We have insert anomaly. Let’s look from course side. If we want to open a new course and if we don’t have anybody that teaches this course, we can not write course data to database. The primary key or its parts can not be null.
b. Delete Anomaly Test.
Suppose we want to delete record (1955, Smith, Paris, 999) from database. This record can not be deleted by itself. Record (phy1, Physics) will be deleted with it. This is not normal. If we delete record, we will loose the data dealing with physics course. This is deletion anomaly. In real life when an instructor fired, the course information does not change.
Let’s look from course side. Suppose the record “Jav1, Java” is requested to be delete from the table. At that time record “1959, Rose, Bern, 777” is going to be deleted from the table also. We just wanted to delete “Jav1, Java” record from database. We didn’t want to delete instructor’s record. This is a deletion anomaly. This anomaly should be prevented.
c. Update Anomaly Test.
Suppose record “1956, John, Bonn, 888” owner of “John” moved from “Bonn” to “Bern”. At that time, we are going to update more than one record. This is an “Update Anomaly”. As presented in Fig.2 where we have “Insert, Delete and Update Anomaly” conditions. That means this table is not suitable to create in database. We have to modify it and have it obey the normalization rules. 1NF rules is not enough for a table that can be created in database. Let’s define second normal form and apply its rules.
2.2. Second Normal Form (2NF)
Second Normal Form (2NF): A relation R is said to be in 2NF if and only if it is 1NF and the nonkey attributes are fully functionally dependent on the primary key. (Date, 1990)
Let’s apply this rule to the table in Fig.2. In order to do this, we first draw the functional dependency figure as seen in Fig.1 of this table.
Let’s look from course side. If we want to open a new course and if we don’t have anybody that teaches this course, we can not write course data to database. The primary key or its parts can not be null.
b. Delete Anomaly Test. Suppose we want to delete record (1955, Smith, Paris, 999) from database. This record can not be deleted by itself. Record (phy1, Physics) will be deleted with it. This is not normal. If we delete record, we will loose the data dealing with physics course. This is deletion anomaly. In real life when an instructor fired, the course information does not change.
Let’s look from course side. Suppose the record “Jav1, Java” is requested to be delete from the table. At that time record “1959, Rose, Bern, 777” is going to be deleted from the table also. We just wanted to delete “Jav1, Java” record from database. We didn’t want to delete instructor’s record. This is a deletion anomaly. This anomaly should be prevented.
c. Update Anomaly Test. Suppose record “1956, John, Bonn, 888” owner of “John” moved from “Bonn” to “Bern”. At that time, we are going to update more than one record. This is an “Update Anomaly”. As presented in Fig.2 where we have “Insert, Delete and Update Anomaly” conditions. That means this table is not suitable to create in database. We have to modify it and have it obey the normalization rules. 1NF rules is not enough for a table that can be created in database. Let’s define second normal form and apply its rules.
2.2. Second Normal Form (2NF) Second Normal Form (2NF): A relation R is said to be in 2NF if and only if it is 1NF and the nonkey attributes are fully functionally dependent on the primary key. (Date, 1990) Let’s apply this rule to the table in Fig.2. In order to do this, we first draw the functional dependency figure as seen in Fig.1 of this table.
InsNo InsName Address Plate CrsName CrsNo
Fig.3 Functional drawing of table in Fig.2(Martin, J. 1977)
Functional dependency diagram uses bubbles and arrows to show functional dependencies. As you see in Fig.3 each attribute is located in a single bubble. Only combined primary key is located in a single bubble InsNo its components. The arrow lines are drawn from primary key group to other attributes.
Fig. 3 Functional drawing of table in Fig.2(Martin, J. 1977)
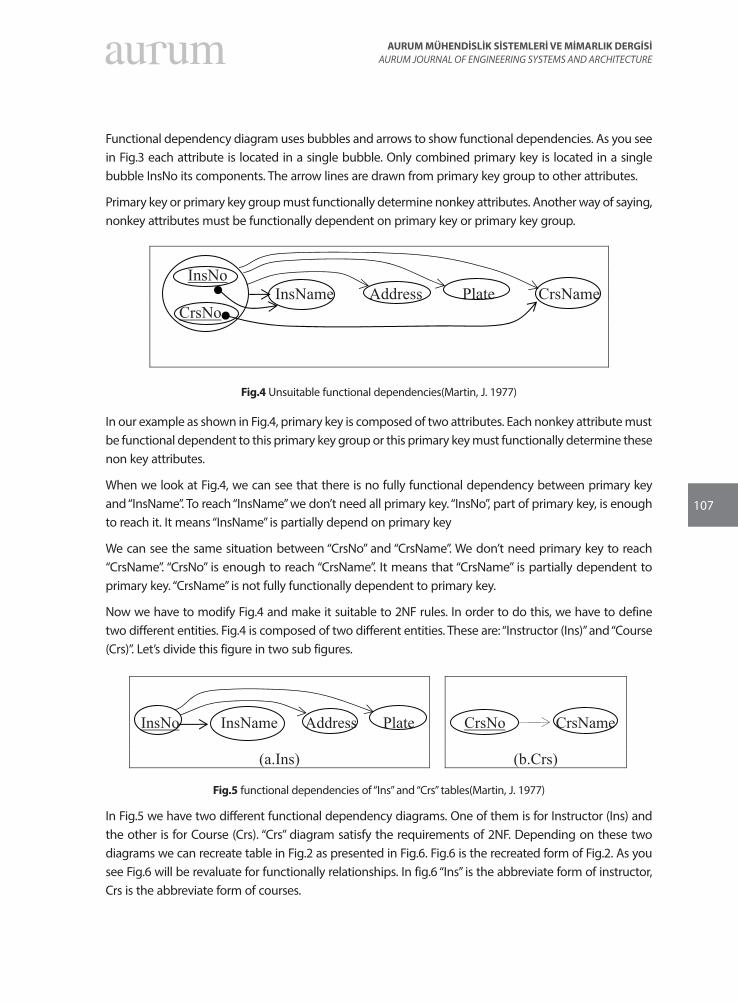
107
AURUM MÜHENDİSLİK SİSTEMLERİ VE MİMARLIK DERGİSİAURUM JOURNAL OF ENGINEERING SYSTEMS AND ARCHITECTURE
Functional dependency diagram uses bubbles and arrows to show functional dependencies. As you see in Fig.3 each attribute is located in a single bubble. Only combined primary key is located in a single bubble InsNo its components. The arrow lines are drawn from primary key group to other attributes.
Primary key or primary key group must functionally determine nonkey attributes. Another way of saying, nonkey attributes must be functionally dependent on primary key or primary key group.
Primary key or primary key group must functionally determine nonkey attributes. Another way of saying, nonkey attributes must be functionally dependent on primary key or primary key group.
InsNo InsName Address Plate CrsName CrsNo
Fig.4 Unsuitable functional dependencies(Martin, J. 1977)
In our example as shown in Fig.4, primary key is composed of two attributes. Each nonkey attribute must be functional dependent to this primary key group or this primary key must functionally determine these non key attributes.
When we look at Fig.4, we can see that there is no fully functional dependency between primary key and “InsName”. To reach “InsName” we don’t need all primary key. “InsNo”, part of primary key, is enough to reach it. It means “InsName” is partially depend on primary key
We can see the same situation between “CrsNo” and “CrsName”. We don’t need primary key to reach “CrsName”. “CrsNo” is enough to reach “CrsName”. It means that “CrsName” is partially dependent to primary key. “CrsName” is not fully functionally dependent to primary key.
Now we have to modify Fig.4 and make it suitable to 2NF rules. In order to do this, we have to define two different entities. Fig.4 is composed of two different entities. These are: “Instructor (Ins)” and “Course (Crs)”. Let’s divide this figure in two sub figures.
InsNo InsName Address Plate CrsNo CrsName
(a.Ins) (b.Crs)
Fig.5 functional dependencies of “Ins” and “Crs” tables(Martin, J. 1977) In Fig.5 we have two different functional dependency diagrams. One of them is for Instructor (Ins) and the other is for Course (Crs). “Crs” diagram satisfy the requirements of 2NF. Depending on these two diagrams we can recreate table in Fig.2 as presented in Fig.6. Fig.6 is the recreated form of Fig.2. As you see Fig.6 will be revaluate for functionally relationships. In fig.6 “Ins” is the abbreviate form of instructor, Crs is the abbreviate form of courses.
Ins CrsInsNo InsName Address Plate CrsNo CrsName1956 John Bonn 888 Che1 Chemistry1937 Mary Bonn 888 His1 History
Fig.4 Unsuitable functional dependencies(Martin, J. 1977)
In our example as shown in Fig.4, primary key is composed of two attributes. Each nonkey attribute must be functional dependent to this primary key group or this primary key must functionally determine these non key attributes.
When we look at Fig.4, we can see that there is no fully functional dependency between primary key and “InsName”. To reach “InsName” we don’t need all primary key. “InsNo”, part of primary key, is enough to reach it. It means “InsName” is partially depend on primary key
We can see the same situation between “CrsNo” and “CrsName”. We don’t need primary key to reach “CrsName”. “CrsNo” is enough to reach “CrsName”. It means that “CrsName” is partially dependent to primary key. “CrsName” is not fully functionally dependent to primary key.
Now we have to modify Fig.4 and make it suitable to 2NF rules. In order to do this, we have to define two different entities. Fig.4 is composed of two different entities. These are: “Instructor (Ins)” and “Course (Crs)”. Let’s divide this figure in two sub figures.
Primary key or primary key group must functionally determine nonkey attributes. Another way of saying, nonkey attributes must be functionally dependent on primary key or primary key group.
InsNo InsName Address Plate CrsName CrsNo
Fig.4 Unsuitable functional dependencies(Martin, J. 1977)
In our example as shown in Fig.4, primary key is composed of two attributes. Each nonkey attribute must be functional dependent to this primary key group or this primary key must functionally determine these non key attributes.
When we look at Fig.4, we can see that there is no fully functional dependency between primary key and “InsName”. To reach “InsName” we don’t need all primary key. “InsNo”, part of primary key, is enough to reach it. It means “InsName” is partially depend on primary key
We can see the same situation between “CrsNo” and “CrsName”. We don’t need primary key to reach “CrsName”. “CrsNo” is enough to reach “CrsName”. It means that “CrsName” is partially dependent to primary key. “CrsName” is not fully functionally dependent to primary key.
Now we have to modify Fig.4 and make it suitable to 2NF rules. In order to do this, we have to define two different entities. Fig.4 is composed of two different entities. These are: “Instructor (Ins)” and “Course (Crs)”. Let’s divide this figure in two sub figures.
InsNo InsName Address Plate CrsNo CrsName
(a.Ins) (b.Crs)
Fig.5 functional dependencies of “Ins” and “Crs” tables(Martin, J. 1977) In Fig.5 we have two different functional dependency diagrams. One of them is for Instructor (Ins) and the other is for Course (Crs). “Crs” diagram satisfy the requirements of 2NF. Depending on these two diagrams we can recreate table in Fig.2 as presented in Fig.6. Fig.6 is the recreated form of Fig.2. As you see Fig.6 will be revaluate for functionally relationships. In fig.6 “Ins” is the abbreviate form of instructor, Crs is the abbreviate form of courses.
Ins CrsInsNo InsName Address Plate CrsNo CrsName1956 John Bonn 888 Che1 Chemistry1937 Mary Bonn 888 His1 History
Fig.5 functional dependencies of “Ins” and “Crs” tables(Martin, J. 1977)
In Fig.5 we have two different functional dependency diagrams. One of them is for Instructor (Ins) and the other is for Course (Crs). “Crs” diagram satisfy the requirements of 2NF. Depending on these two diagrams we can recreate table in Fig.2 as presented in Fig.6. Fig.6 is the recreated form of Fig.2. As you see Fig.6 will be revaluate for functionally relationships. In fig.6 “Ins” is the abbreviate form of instructor, Crs is the abbreviate form of courses.
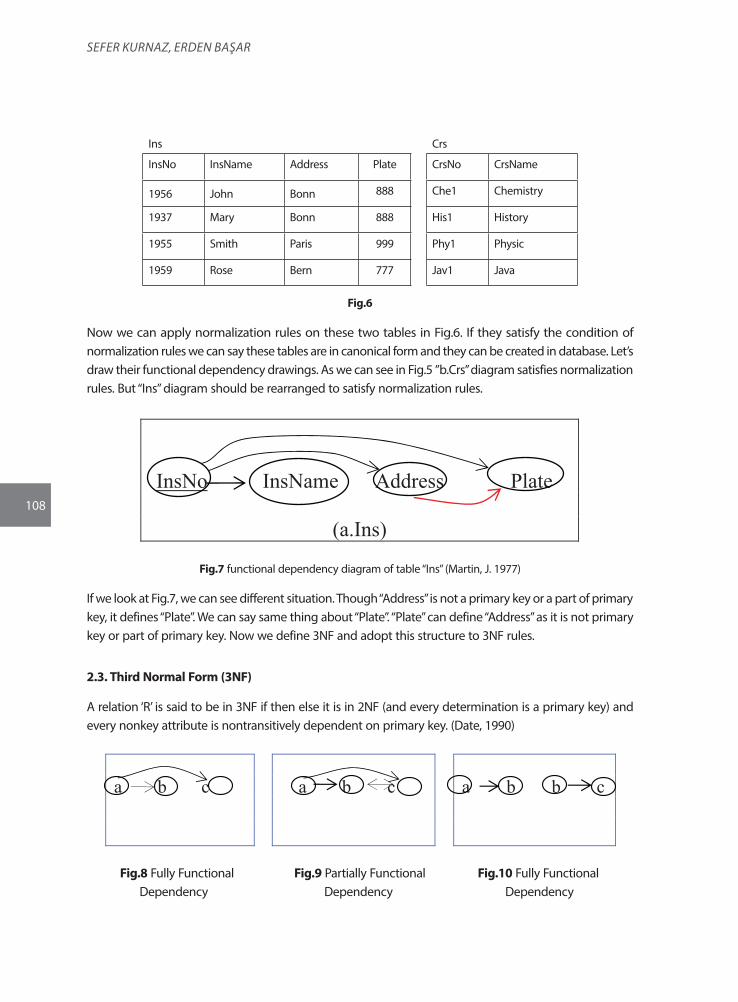
108
Sefer KUrNAZ, erdeN BAŞAr
Ins Crs
InsNo InsName Address Plate CrsNo CrsName
1956 John Bonn 888 Che1 Chemistry
1937 Mary Bonn 888 His1 History
1955 Smith Paris 999 Phy1 Physic
1959 Rose Bern 777 Jav1 Java
Fig.6
Now we can apply normalization rules on these two tables in Fig.6. If they satisfy the condition of normalization rules we can say these tables are in canonical form and they can be created in database. Let’s draw their functional dependency drawings. As we can see in Fig.5 ”b.Crs” diagram satisfies normalization rules. But “Ins” diagram should be rearranged to satisfy normalization rules.
1955 Smith Paris 999 Phy1 Physic1959 Rose Bern 777 Jav1 Java
Fig.6Now we can apply normalization rules on these two tables in Fig.6. If they satisfy the condition of normalization rules we can say these tables are in canonical form and they can be created in database. Let’s draw their functional dependency drawings. As we can see in Fig.5 ”b.Crs” diagram satisfies normalization rules. But “Ins” diagram should be rearranged to satisfy normalization rules.
InsNo InsName Address Plate
(a.Ins)
Fig.7 functional dependency diagram of table “Ins” (Martin, J. 1977) If we look at Fig.7, we can see different situation. Though “Address” is not a primary key or a part of primary key, it defines “Plate”. We can say same thing about “Plate”. “Plate” can define “Address” as it is not primary key or part of primary key. Now we define 3NF and adopt this structure to 3NF rules.
2.3. Third Normal Form (3NF) A relation ‘R’ is said to be in 3NF if then else it is in 2NF (and every determination is a primary key) and every nonkey attribute is nontransitively dependent on primary key. (Date, 1990)
a b c a b c a b b c
Fig.8 Fully Functional Fig.9 Partially Functional Fig.10 Fully Functional
Dependency Dependency Dependency If we look at Fig.8 we can see three bubble and three attributes. This figure shows fully functional dependency. Fig.8 is satisfying 3NF rules. In Fig.9 we can see three bubbles and three attributes.
Attribute “a” functional define attributes “b” and “c”. But “b” and “c” defines one of the others. Fig.9 does not satisfy 3N rules. If we convert Fig.9 to Fig.10 we get new structure that satisfies 3NF rules. Now we can modify Fig.7 and get Fig.11
InsN
o InsNa
me Plate Plate Address
Fig.7 functional dependency diagram of table “Ins” (Martin, J. 1977)
If we look at Fig.7, we can see different situation. Though “Address” is not a primary key or a part of primary key, it defines “Plate”. We can say same thing about “Plate”. “Plate” can define “Address” as it is not primary key or part of primary key. Now we define 3NF and adopt this structure to 3NF rules.
2.3. Third Normal Form (3NF)
A relation ‘R’ is said to be in 3NF if then else it is in 2NF (and every determination is a primary key) and every nonkey attribute is nontransitively dependent on primary key. (Date, 1990)
1955 Smith Paris 999 Phy1 Physic1959 Rose Bern 777 Jav1 Java
Fig.6Now we can apply normalization rules on these two tables in Fig.6. If they satisfy the condition of normalization rules we can say these tables are in canonical form and they can be created in database. Let’s draw their functional dependency drawings. As we can see in Fig.5 ”b.Crs” diagram satisfies normalization rules. But “Ins” diagram should be rearranged to satisfy normalization rules.
InsNo InsName Address Plate
(a.Ins)
Fig.7 functional dependency diagram of table “Ins” (Martin, J. 1977) If we look at Fig.7, we can see different situation. Though “Address” is not a primary key or a part of primary key, it defines “Plate”. We can say same thing about “Plate”. “Plate” can define “Address” as it is not primary key or part of primary key. Now we define 3NF and adopt this structure to 3NF rules.
2.3. Third Normal Form (3NF) A relation ‘R’ is said to be in 3NF if then else it is in 2NF (and every determination is a primary key) and every nonkey attribute is nontransitively dependent on primary key. (Date, 1990)
a b c a b c a b b c
Fig.8 Fully Functional Fig.9 Partially Functional Fig.10 Fully Functional
Dependency Dependency Dependency If we look at Fig.8 we can see three bubble and three attributes. This figure shows fully functional dependency. Fig.8 is satisfying 3NF rules. In Fig.9 we can see three bubbles and three attributes.
Attribute “a” functional define attributes “b” and “c”. But “b” and “c” defines one of the others. Fig.9 does not satisfy 3N rules. If we convert Fig.9 to Fig.10 we get new structure that satisfies 3NF rules. Now we can modify Fig.7 and get Fig.11
InsN
o InsNa
me Plate Plate Address
Fig.8 Fully Functional Fig.9 Partially Functional Fig.10 Fully Functional Dependency Dependency Dependency
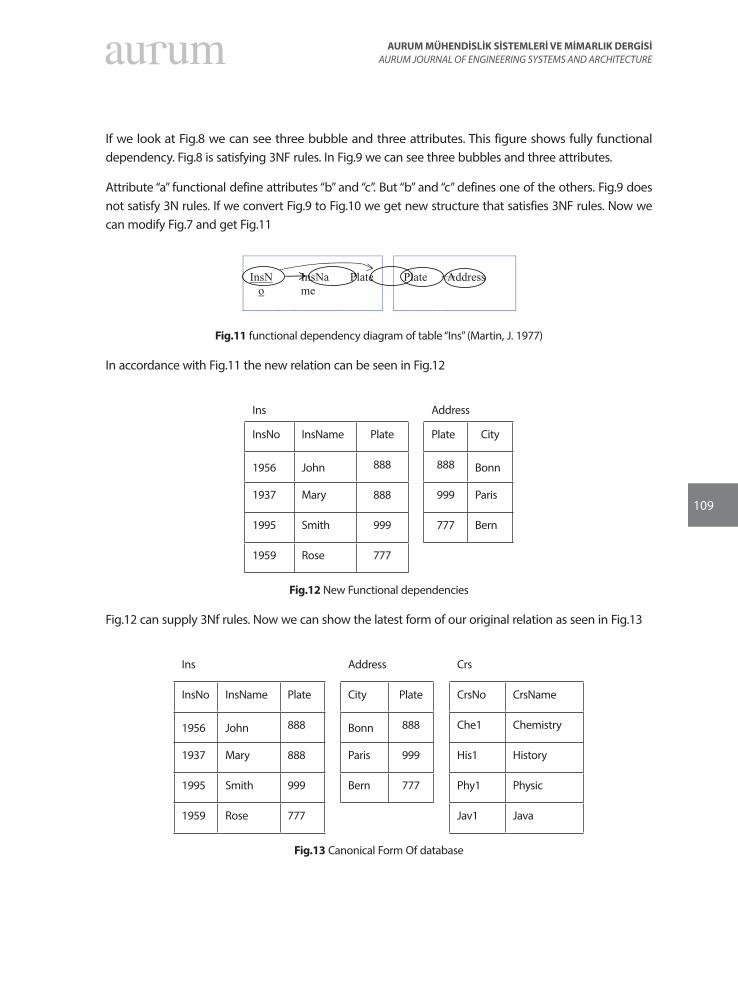
109
AURUM MÜHENDİSLİK SİSTEMLERİ VE MİMARLIK DERGİSİAURUM JOURNAL OF ENGINEERING SYSTEMS AND ARCHITECTURE
If we look at Fig.8 we can see three bubble and three attributes. This figure shows fully functional dependency. Fig.8 is satisfying 3NF rules. In Fig.9 we can see three bubbles and three attributes.
Attribute “a” functional define attributes “b” and “c”. But “b” and “c” defines one of the others. Fig.9 does not satisfy 3N rules. If we convert Fig.9 to Fig.10 we get new structure that satisfies 3NF rules. Now we can modify Fig.7 and get Fig.11
1955 Smith Paris 999 Phy1 Physic1959 Rose Bern 777 Jav1 Java
Fig.6Now we can apply normalization rules on these two tables in Fig.6. If they satisfy the condition of normalization rules we can say these tables are in canonical form and they can be created in database. Let’s draw their functional dependency drawings. As we can see in Fig.5 ”b.Crs” diagram satisfies normalization rules. But “Ins” diagram should be rearranged to satisfy normalization rules.
InsNo InsName Address Plate
(a.Ins)
Fig.7 functional dependency diagram of table “Ins” (Martin, J. 1977) If we look at Fig.7, we can see different situation. Though “Address” is not a primary key or a part of primary key, it defines “Plate”. We can say same thing about “Plate”. “Plate” can define “Address” as it is not primary key or part of primary key. Now we define 3NF and adopt this structure to 3NF rules.
2.3. Third Normal Form (3NF) A relation ‘R’ is said to be in 3NF if then else it is in 2NF (and every determination is a primary key) and every nonkey attribute is nontransitively dependent on primary key. (Date, 1990)
a b c a b c a b b c
Fig.8 Fully Functional Fig.9 Partially Functional Fig.10 Fully Functional
Dependency Dependency Dependency If we look at Fig.8 we can see three bubble and three attributes. This figure shows fully functional dependency. Fig.8 is satisfying 3NF rules. In Fig.9 we can see three bubbles and three attributes.
Attribute “a” functional define attributes “b” and “c”. But “b” and “c” defines one of the others. Fig.9 does not satisfy 3N rules. If we convert Fig.9 to Fig.10 we get new structure that satisfies 3NF rules. Now we can modify Fig.7 and get Fig.11
InsN
o InsNa
me Plate Plate Address
Fig.11 functional dependency diagram of table “Ins” (Martin, J. 1977)
In accordance with Fig.11 the new relation can be seen in Fig.12
Ins Address
InsNo InsName Plate Plate City
1956 John 888 888 Bonn
1937 Mary 888 999 Paris
1995 Smith 999 777 Bern
1959 Rose 777
Fig.12 New Functional dependencies
Fig.12 can supply 3Nf rules. Now we can show the latest form of our original relation as seen in Fig.13
Ins Address Crs
InsNo InsName Plate City Plate CrsNo CrsName
1956 John 888 Bonn 888 Che1 Chemistry
1937 Mary 888 Paris 999 His1 History
1995 Smith 999 Bern 777 Phy1 Physic
1959 Rose 777 Jav1 Java
Fig.13 Canonical Form Of database
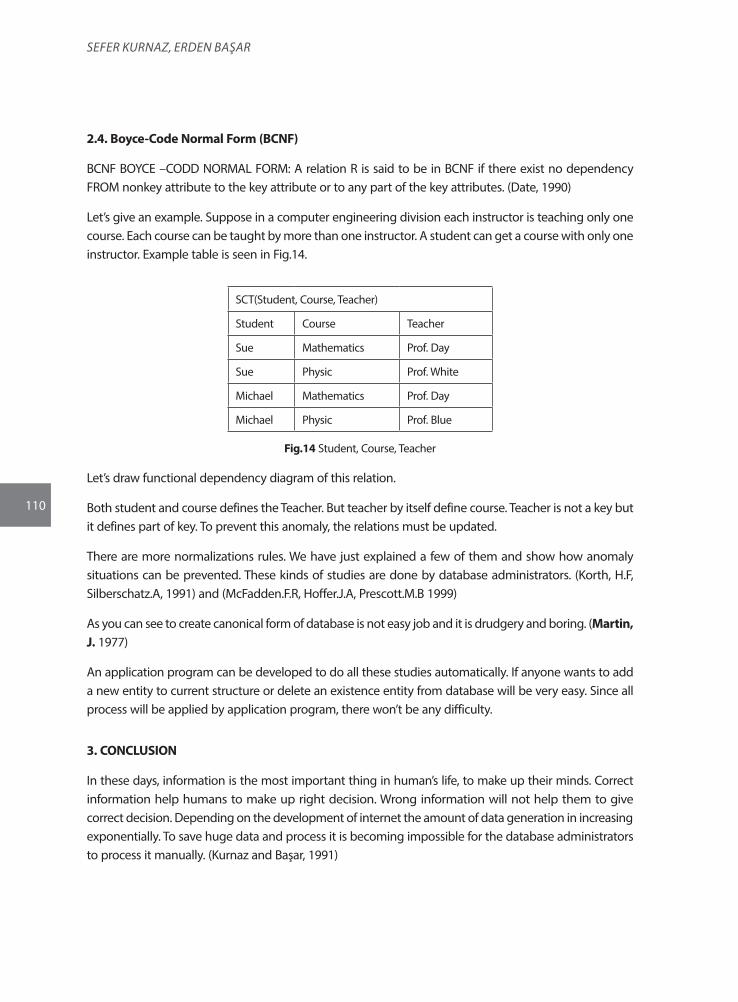
110
Sefer KUrNAZ, erdeN BAŞAr
2.4. Boyce-Code Normal Form (BCNF)
BCNF BOYCE –CODD NORMAL FORM: A relation R is said to be in BCNF if there exist no dependency FROM nonkey attribute to the key attribute or to any part of the key attributes. (Date, 1990)
Let’s give an example. Suppose in a computer engineering division each instructor is teaching only one course. Each course can be taught by more than one instructor. A student can get a course with only one instructor. Example table is seen in Fig.14.
SCT(Student, Course, Teacher)
Student Course Teacher
Sue Mathematics Prof. Day
Sue Physic Prof. White
Michael Mathematics Prof. Day
Michael Physic Prof. Blue
Fig.14 Student, Course, Teacher
Let’s draw functional dependency diagram of this relation.
Both student and course defines the Teacher. But teacher by itself define course. Teacher is not a key but it defines part of key. To prevent this anomaly, the relations must be updated.
There are more normalizations rules. We have just explained a few of them and show how anomaly situations can be prevented. These kinds of studies are done by database administrators. (Korth, H.F, Silberschatz.A, 1991) and (McFadden.F.R, Hoffer.J.A, Prescott.M.B 1999)
As you can see to create canonical form of database is not easy job and it is drudgery and boring. (Martin, J. 1977)
An application program can be developed to do all these studies automatically. If anyone wants to add a new entity to current structure or delete an existence entity from database will be very easy. Since all process will be applied by application program, there won’t be any difficulty.
3. CONCLUSION
In these days, information is the most important thing in human’s life, to make up their minds. Correct information help humans to make up right decision. Wrong information will not help them to give correct decision. Depending on the development of internet the amount of data generation in increasing exponentially. To save huge data and process it is becoming impossible for the database administrators to process it manually. (Kurnaz and Başar, 1991)
111
AURUM MÜHENDİSLİK SİSTEMLERİ VE MİMARLIK DERGİSİAURUM JOURNAL OF ENGINEERING SYSTEMS AND ARCHITECTURE
Some application software must be developed to be used by the database administrators. Developing a database manually is drudgery and boring. Application program can help automate the processes explained in this article. The purpose of this article is to point out the difficulties in database creation and the possible solution by creating an application to process the data efficiently. In the future it is hoped that these kind of application programs number will be increased. Different types of data mining application software are available, but their purposes are different than the software we mentioned in our article.
REFERENCES
Date, C.J. 1990. An Introduction to Database Systems. Addison-Wesley Publishing Company.
Korth, H.F, Silberschatz.A Database System Conceps. McGraw-Hill,Inc 1991.
McFadden.F.R, Hoffer.J.A, Prescott.M.B Modern Database Management. An imprint of Addison Wesley Longman, Inc 1999
Kurnaz, S., and Basar, E. 1991. Veritabanı Oluşturmada Kullanılan Kullanıcı Görüşlerinin Bütünleştirilmesinin Bilgisayar Kullanılarak Gerçekleştirilmesi, Ege University, Bornova , İzmir.
Martin, J. 1977. Computer Database Organization. PRENTICE-HALL, INC., Englewood Cliffs, New Jersey 07632

113
AURUM MÜHENDİSLİK SİSTEMLERİ VE MİMARLIK DERGİSİAURUM JOURNAL OF ENGINEERING SYSTEMS AND ARCHITECTURE
Cilt 4, Sayı 1 | Yaz 2020Volume 4, No 1 | Summer 2020, 113-133
ARAŞTIRMA MAKALESİ / RESEARCH ARTICLE
YAPILARDA YER ALTI SUYUNA KARŞI YAPILAN KORUMA SİSTEMLERİNİN UYGULANABİLİRLİĞİ VE GÜVENLİĞİNİN İNCELENMESİ
Sepanta NAİMİ1
1İstanbul Aydın Üniversitesi, Mühendislik Fakültesi, İnşaat Mühendisliği Bölümü [email protected] ORCID:0000-0001-8641-7090
Zafer ÖZDEMİR2
2İstanbul Aydın Üniversitesi, Mühendislik Fakültesi, İnşaat Mühendisliği Bölümü [email protected] ORCID:0000-0001-8627-3859
GELİŞ TARİHİ/RECEIVED DATE: 18.05.2020 KABUL TARİHİ/ACCEPTED DATE: 23.05.2020
ÖZET
Su, insanların yaşamını sürdürebilmesi için vazgeçilmez bir yere sahip olmasına rağmen, yapılar için olumsuz etkileri olan, tahrip edici bir maddedir. Yapılarda en büyük dayanıma ihtiyaç duyulan yerler temel ve bodrumlar olmakla birlikte, yapılara en büyük zararı veren sular, temel ve bodrumları etkileyen yer altı sularıdır. Bu sebeple, yapılarda yer altı suyuna karşı koruma sistemleri uygulanmalıdır. Eğer gerekli çalışmalar yapılıp, tedbir alınmaz ise, yer altı suları çeşitli şekillerde yapıya etki eder ve zamanla yapıda olumsuz durumlara neden olur. Yapılmayan veya yanlış yapılan su yalıtım uygulamaları, yapı ömrünü önemli derecede azaltmakta, insan güvenliği ve sağlığını tehdit etmekte, yapı güvenliğinde geri dönüşü olmayan sorunlara neden olmaktadır. Bu nedenle, yapılarda yer altı suyuna karşı yapılan koruma sistemlerinin neler olduğu, sistem özellikleri, kullanım alanları ve esasları ele alınmıştır. Bu doğrultuda, su yalıtım uygulamalarında kullanılan malzemeler sınıflandırılmış, özellikleri, uygulama usul ve kaideleri anlatılmıştır. Söz konusu bu çalışma, malzeme sınıflarını ve kullanım alanlarını öğrenmede yardımcı olabilecek, doğru su yalıtım uygulamalarının ve malzemelerinin tercih edilmesine katı sağlayacaktır.
Anahtar Kelimeler: Yer altı suyu, Temel ve Bodrum, Su Yalıtımı, Malzeme, Korozyon
INVESTIGATION OF APPLICABILITY AND SAFETY OF CONSERVATION SYSTEMS AGAINST UNDERGROUND WATER IN BUILDINGS
ABSTRACT
Although water has an indispensable place for people to survive, it is a destructive substance that has negative effects for structures. Although the places that need the greatest strength in the structures are the basics and basements, the water that does the greatest damage to the structures is the groundwater that affects the foundations and basements. For this reason, underground water protection systems should be applied in the structures. If necessary studies are carried out and precautions are not taken, groundwater affects the structure in various ways and causes adverse situations in the structure over time. Waterproofing practices
114
Sepanta naİMİ, Zafer ÖZDeMİr
that are not made or miscarried significantly reduce building life, threaten human safety and health, cause irreversible problems in building safety. Therefore, what protection systems against groundwater systems, system characteristics, uses and principles are discussed in the structures. Accordingly, the materials used in waterproofing applications are classified and their characteristics, application procedures and bases are explained. This study will help learn material classes and uses and will soliden the choice of accurate waterproofing practices and materials.
Keywords: Groundwater, Building foundation and Basement, Water isolation,, Material, Corrosion
1. GİRİŞ
Yapı ömrü, projelendirme, uygulama ve bakım olmak üzere üç ana unsura bağlıdır. Doğru projelendirilip uygulanan ve yapı ömrü boyunca gerekli bakımları yapılan binalar uzun yıllar boyunca sağlıklı bir şekilde hizmet edebilmektedir.
Yapılarda, projelendirme, uygulama ve kullanım aşamaların da karşımıza çıkan ve yapılarda olumsuz tesirlere neden olan en önemli etkenlerden biri de sudur. Yapılarda suya karşı önlem alınmadığı taktirde, güvenli, sağlıklı, konforlu ve uzun ömürlü bir yapıdan söz edilemez (Gel, 2007). Su, yapılarda ;
- Yağışlar
- Yer altı suları
- Sızıntı suları, toprak nemi
- Yapı içerisindeki su
- Su buharının yoğuşması ile karşımıza çıkar.
Suyun, belirtilen şekillerde yapıyı olumsuz etkilemesi, suya karşı alınan önlemler ve yapılan uygulamalar sayesinde önlenebilir. Bu uygulamalara, su yalıtımı adı verilir. Su yalıtım uygulamalarında dikkat edilecek önemli unsur, doğru teşhis, doğru zemin hazırlığı, doğru malzeme seçimi ve uygulamasıdır.
Yapılara çeşitli şekillerle etki eden su ve nem, taşıyıcı elemanlarda korozyon meydana getirir, donatılarda kesit ve dayanımın büyük oranda azalmasına neden olur (Naimi and Çelikağ, 2010). Yapılan çalışmalar sonucu, su yalıtımı olmayan yapılarda, kullanılan demirler 10 yıl gibi kısa bir sürede taşıma kapasitesinin %66’sını kaybettiği ortaya çıkarılmıştır. Bu nedenle dayanımını kaybeden yapı, kullanım ömrünü tamamlayamaz (Coşkun, 2012).
Türkiye, deprem kuşağı ülkesidir ve nüfusunun %95’i deprem bölgesinde yaşamaktadır. (Birinci, 2013). Su yalıtımın olmadığı ve suya maruz kalan bir yapıda 10 yıl içerisinde dayanımının büyük bir kısmını kaybeden yapı, depreme karşı beklenilen performansı gösteremez. Bu bilgiler ışığında, suyun yapılarda oluşturduğu olumsuz etkilere karşı önlem alınması, hayati bir öneme sahiptir.
115
AURUM MÜHENDİSLİK SİSTEMLERİ VE MİMARLIK DERGİSİAURUM JOURNAL OF ENGINEERING SYSTEMS AND ARCHITECTURE
17 Ağustos 1999 Gölcük depremi sonrası, İBB tarafından hazırlanan rapora göre, 55 bin konut incelenmiş, bu konutların %64’ünde korozyon etkisiyle hasar meydana geldiği tespit edilmiştir (Bitüder, 2014). Bu rapora göre, yapılarda meydana gelen hasarların en büyük nedenini korozyon oluşturmaktadır. Bu nedenle, su yalıtım yönetmeliği, deprem yönetmeliği kadar dikkate alınmalı, uygulanmalı ve kontrol edilmelidir.
1.1 Çalışmanın Amacı ve Kapsamı
Bu çalışmadaki amaç, yapılan su yalıtım uygulamaları ve kullanılan malzemelerin uygulanabilirliğini incelemektir. Bu sayede, yer altı suyunun olumsuz etkilerinden kurtulmak için doğru su yalıtım uygulamalarının ve malzemelerinin tercih edilmesine katı sağlamaktır.
Bu amaçla, yer altı suyunun fiziksel ve kimyasal etkilerine karşı yapılabilecek su yalıtım uygulamalarının neler olduğu, hangi malzemelerin ne şekilde kullanıldığı, yer altı su yalıtım uygulamalarının güvenliği ve önemi irdelenmiştir.
1.2 Literatür Çalışması
Literatür taraması yapıldığında, yapılan çalışmaların sınırlı olduğu ve yer altı suyuna karşı yapılan su yalıtım uygulamalarının öneminin yeterince anlatılamadığı ve önemli bir yere sahip olduğu bilincinin oluşturulamadığı gözlemlenmiştir.
Oymael (1997) kitabında, suyun yapılara etkime şekillerini ve neden olduğu hasarları açıklamaktadır. Özellikle temellerde ki su yalıtım uygulamalarının telafisinin olmadığını ve uzmanlık gerektirdiğini anlatmaktadır.
Tekin (2003) yüksek lisans tezinde, yapı elemanlarında su ve ısı etkisini incelemiş, malzeme seçiminin de tasarımın bir parçası olduğu, doğru uygulama ve malzeme seçiminin, yapın ekonomik ömrünü tamamlamasında önemli bir etken olduğu belirtilmiştir.
Ekinci ve Yıldırım (2004) çalışmalarında, toprak altı su yalıtım uygulamalarının önemi ve karşılaşılabilecek sorunları anlatmışlardır. Buna karşı yapılabilecek uygulamalar hakkında bilgi verilmiştir. Temel ve bodrumların sürekli su ve neme maruz kaldıklarından, su yalıtımı uygulamasının önemine dikkat çekmişlerdir.
Şimşek (2005) yüksek lisans tezinde, yapının yer altı sularına karşı uzun ömürlü olabilmesi için, zeminin de yapı kadar önemli olduğu anlatılmıştır. Yapının, zemin ile temesin da yer altı sularının oluşturduğu korozyonun ön plana çıkarak yapının ömrünü kısalttığı vurgulamıştır.
Avlar (1999) bildirisinde, canlıların yaşamını sürdürebilmesi için ve yapıların inşaa edilebilmesi için gerekli olan suyun, yapıların tamamlanmasından sonra zararlı bir madde haline gelebileceği vurgulanmıştır. Suyun oluşturacağı zararlar kent ve yapı ölçeğinde incelenmiş, oluşum nedenleri ve önleme uygulamaları irdelenmiştir. Bu sayede kullanıcılar açısından sonuçları ve önemi vurgulanmıştır.
Birinci (2013) çalışmasında, ülkemizin deprem kuşağında olduğu ve nüfusunun neredeyse tamamımın deprem ile iç içe yaşadığı vurgulanmıştır. Bu doğrultuda ilçelerin durumu ve mevcut yapı stoğu ele alınmış,
116
Sepanta naİMİ, Zafer ÖZDeMİr
kentsel dönüşüm mevzuatı ve mali politikaların önemi ortaya konmuştur. Son 50 yıldaki yapıların duruma göz önünde bulundurularak kentsel dönüşüm gerekliliğini vurgulamıştır.
Oymael (2001) kitabında, genel anlamda su yalıtımı ve su yalıtım malzemeleri hakkında bilgiler vermiştir.
2. YAPILARDA YER ALTI SUYUNA KARŞI YAPILAN KORUMA SİSTEMLERİ
Su canlıların hayatın devam ettirebilmesi için vazgeçilmez bir kaynaktır. Yapılar için ise bu tam tersidir. Su, yapının ömrünü ve kullanım kalitesini doğrudan etkileyen önemli bir unsurdur. Bu yüzden yapılardaki su yalıtımı konusu hayati öneme sahiptir.
Su yalıtımı, yapının tasarımından itibaren düşünülmesi ve hesaplanması gerekilen önemli parametrelerden birisidir. Suyu, yapıdan uzaklaştırmak ve güvenli bir yalıtımı sağlamak için, yapının su ile temas edecek veya edebilecek elemanların belirlenmesi, bu doğrultuda tasarlanması ve kullanılacak malzemelerin seçilmesi gerekmektedir.
2.1.Yer Altı Sularına Karşı Yalıtım ve Uzaklaştırma
Yer altında iklim ve arazi yapısına göre, birikme suyu, yer altı suyu, kapiler su ve boşluklardaki su buharı bulunmaktadır. Bu sulara karşı önlem alınmadan önce, yapının hangi amaçla kullanılacağı, su yalıtım tedbirleri ve planlaması yapının dizayn aşamasında belirlenmiş olması gerekmektedir (Akıncıtürk, 2001). Bu planlamayı yapmadan önce ise, arazinin zemin etüdleri yapılarak, zeminin su geçirimliliği ve yer altı su seviyesi bilinmelidir.
Yer altı suları, sızıntı suların geçirimsiz tabakalarda birikmesi sonucu oluşur ve mevsimlere göre farklılık gösterir. Bu yüzden yapının tasarım aşamasında, yer altı su seviyesinin en yüksek olduğu değerler dikkate alınmalıdır. Ayrıca yer altı su seviyesi gibi su rejiminin ve debisinin de değişebileceği unutulmamalıdır.
2.1.1 Temel ve Bodrumlarda Su Yaltımı
Temel ve bodrumlarda ki su yalıtımın amacı, yapıyı sudan korumakla beraber, toprakta bulunan kimyasal maddelerden de yapıyı korumaktır(Akyol, 2008). Yağış suları yer çekimi etkisiyle sızarak alt tabakaya iner, geçirimsiz tabakaya ulaştığında yer altı suyunu oluşturur. Yer altı suları, kılcal boşluklardan yer çekimine ters doğrultuda hareket ederek kapiler suları oluşturur ve yapıyı kılcaklık yolu ile etkiler (Ekinci ve Yıldırım, 2004).
Temel ve bodrumlar, yapının tüm ağırlığını taşıdığı için korozyona karşı en iyi korunması gereken yapı bölümleridir. Yer altında kalan temel ve bodrumlar, zemin oturmaları ve deprem etkisiyle en çok gerilmeye maruz kalan elemanlardır. Suyun etkisine maruz kalan temel ve bodrumlar da donatılar, korozyona uğrayarak paslanarak çürümeye başlarlar ve taşıyıcı özelliklerini yitirirler. Sonraki aşamalarda yapı elemanları suya karşı korunmaya çalışılsa da bu çürüme etkisi durdurulamaz (Akyol, 2008).
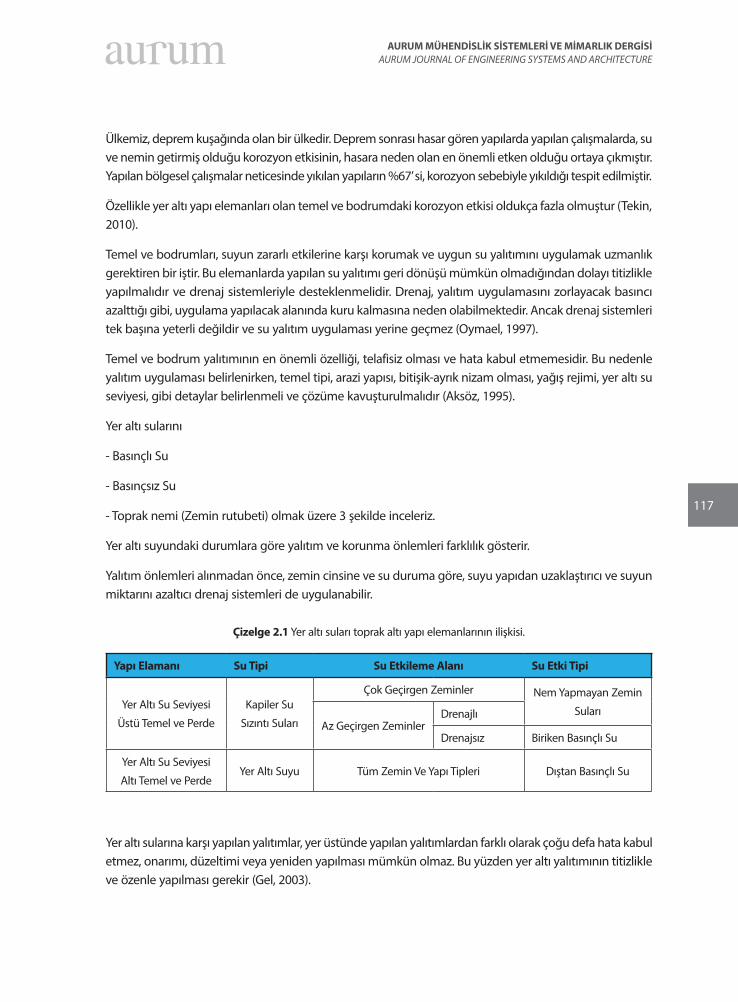
117
AURUM MÜHENDİSLİK SİSTEMLERİ VE MİMARLIK DERGİSİAURUM JOURNAL OF ENGINEERING SYSTEMS AND ARCHITECTURE
Ülkemiz, deprem kuşağında olan bir ülkedir. Deprem sonrası hasar gören yapılarda yapılan çalışmalarda, su ve nemin getirmiş olduğu korozyon etkisinin, hasara neden olan en önemli etken olduğu ortaya çıkmıştır. Yapılan bölgesel çalışmalar neticesinde yıkılan yapıların %67’ si, korozyon sebebiyle yıkıldığı tespit edilmiştir.
Özellikle yer altı yapı elemanları olan temel ve bodrumdaki korozyon etkisi oldukça fazla olmuştur (Tekin, 2010).
Temel ve bodrumları, suyun zararlı etkilerine karşı korumak ve uygun su yalıtımını uygulamak uzmanlık gerektiren bir iştir. Bu elemanlarda yapılan su yalıtımı geri dönüşü mümkün olmadığından dolayı titizlikle yapılmalıdır ve drenaj sistemleriyle desteklenmelidir. Drenaj, yalıtım uygulamasını zorlayacak basıncı azalttığı gibi, uygulama yapılacak alanında kuru kalmasına neden olabilmektedir. Ancak drenaj sistemleri tek başına yeterli değildir ve su yalıtım uygulaması yerine geçmez (Oymael, 1997).
Temel ve bodrum yalıtımının en önemli özelliği, telafisiz olması ve hata kabul etmemesidir. Bu nedenle yalıtım uygulaması belirlenirken, temel tipi, arazi yapısı, bitişik-ayrık nizam olması, yağış rejimi, yer altı su seviyesi, gibi detaylar belirlenmeli ve çözüme kavuşturulmalıdır (Aksöz, 1995).
Yer altı sularını
- Basınçlı Su
- Basınçsız Su
- Toprak nemi (Zemin rutubeti) olmak üzere 3 şekilde inceleriz.
Yer altı suyundaki durumlara göre yalıtım ve korunma önlemleri farklılık gösterir.
Yalıtım önlemleri alınmadan önce, zemin cinsine ve su duruma göre, suyu yapıdan uzaklaştırıcı ve suyun miktarını azaltıcı drenaj sistemleri de uygulanabilir.
Çizelge 2.1 Yer altı suları toprak altı yapı elemanlarının ilişkisi.
Yapı Elamanı Su Tipi Su Etkileme Alanı Su Etki Tipi
Yer Altı Su Seviyesi
Üstü Temel ve Perde
Kapiler Su
Sızıntı Suları
Çok Geçirgen Zeminler Nem Yapmayan Zemin
SularıAz Geçirgen Zeminler
Drenajlı
Drenajsız Biriken Basınçlı Su
Yer Altı Su Seviyesi
Altı Temel ve PerdeYer Altı Suyu Tüm Zemin Ve Yapı Tipleri Dıştan Basınçlı Su
Yer altı sularına karşı yapılan yalıtımlar, yer üstünde yapılan yalıtımlardan farklı olarak çoğu defa hata kabul etmez, onarımı, düzeltimi veya yeniden yapılması mümkün olmaz. Bu yüzden yer altı yalıtımının titizlikle ve özenle yapılması gerekir (Gel, 2003).
118
Sepanta naİMİ, Zafer ÖZDeMİr
2.1.2 Toprak altı tahliye (drenaj) sistemleri
Drenaj, yağmur ve kar gibi yer üstü sularının ve yer altı sularının kontrol altına alınması, yapıdan uzaklaştırılması, toplanması ve yer altı su seviyesinin düşürülmesi için yapılan sistemlerdir. Drenaj (tahliye) sistemlerin asli görevi, yer altı sularını tahliye ederek, yapıya etki eden yer altı suyunun basıncını azaltarak yapının zemin üzerinden dengede kalmasını ve yapı çevresindeki yer altı neminin düşürülmesini sağlamaktır. Titizlikle yapılan drenaj çalışmaları, bodrum katlardaki nem problemini ortadan kaldırır, yapıya uygulanan hidrostatik basıncı ve don etkisinin olumsuzluklarını ortadan kaldırır. Drenaj sadece yapıdaki etkileri önlemek için değil, çevredeki sel ve toprak kaymalarını önlemek içinde yapılır.
Yapının konumlanma şekli ve arazi eğimi drenaj için önemlidir. Eğer arazi eğimli ve temel altı geçirimsiz bir tabakaya sahip ise sular geçirimli tabalardan geçip, temel altındaki geçirimsiz tabaka da birikmeye başlar. Biriken sular yapıya hidrostatik basınç uygular ve olumsuz etkilerine maruz bırakır. Bu durumda drenaj sistemini zorunlu hale getirir. (Şimşek, 2005).
Geçici drenaj
Geçici drenaj sistemi, yapı drenaj ve yalıtım sistemlerinin uygulanabilmesi için, yer altı su seviyesi altında kalan imalatlar için yapılır. Yapının, temel ve bodrum katlarının suyun olumsuz etkilerine maruz kalmaması için uygulanır (Nam, 1997:96).
Geçici drenaj sistemi, suya karşı alınan tüm önlemler bittikten sonra uygun şekilde kapatılmalıdır. (Ertem, 2002:244).
Kalıcı drenaj
Yapının, geçirimsiz bir tabaka üzerine kurulduğu, yer altı su seviyesinin altında olan ve yıllık yağış miktarının fazla olduğu bölgeler için, suyun yapı ömrü boyunca tahliye edilmesi gerekir.
Drenaj sisteminde su, toprak atına ve üstüne konulan yatak ve dikey drenaj borularıyla tahliye edilir. Sistemin devamlı olması için drenaj elemanlarının çalışma şekilleri bilinerek hareket edilmelidir.
3. SU YALITIM MALZEMELERİ VE UYGULAMALARI
Su yalıtım uygulamaları için kullanılacak yöntemler ve bu yöntemlere göre belirlenecek olan malzemeler, projeye başlanmadan belirlenmeli ve yapı inşası sırasında uygulama sırası geldiğinde, uygulama tekniğine uygun bir şekilde titizlikle uygulanmalıdır. Su yalıtımı, proje öncesi veya uygulama yapılma aşamasının öncesinde planlanamaması ve gerekli araştırmaların yapılamaması, yanlış sistem ve malzemenin seçilmesi sonucunda yeterli olmayabilir, yapının ömrü boyunca sorunlara neden olabilir. Bu sorunlar neticesinde, yapı hizmet süresince sorunları devamlı artar, beklenilen kullanım süresini tamamlayamadan hizmet dışı kalabilir.
119
AURUM MÜHENDİSLİK SİSTEMLERİ VE MİMARLIK DERGİSİAURUM JOURNAL OF ENGINEERING SYSTEMS AND ARCHITECTURE
Su yalıtım uygulamalarında, doğru yalıtım sistemi ve yalıtım malzemesi seçimi yanı sıra, uygulanan işçilik kalitesi ve uygulama tekniği önemli bir etkendir. Uygulama hataları ve kalitesiz işsizlik, yanlış yöntem ve malzemeyle birleştiğinde, suyun vermiş olduğu hasarlarla ilgili sürekli bakım onarım gerektirecektir. Bu da malzeme ve işçilikten ödün vermenin ve ucuza kaçmanın pahalıya mal olacağını göstermektedir.
Yapılarda uygulanan su yalıtım yöntemleri yapısal ve yüzeysel olarak ikiye ayrılır. Yüzeysel su yalıtımı temel, yapısal su yalıtımı ise yardımcı niteliktedir.
Bir diğer uygulama sınıflandırma biçimi de pozitif ve negatif şeklindedir. Pozitif yalıtım suyun olduğu yani yapının dış tarafından uygulanırken, negatif yalıtım suyun olmadığı yani yapının iç tarafından uygulanır. Pozitif su yalıtım uygulaması suyu yapı elemanlarından direk uzaklaştırırken, negatif su yalıtım uygulaması ise yapının kullanımındaki rahatsızlığı gidermek ve suyun iç kısımlarda görünmemesi amacıyla yapılan uygulamadır. (Tekin ve diğerleri, 2015:79).
Su yalıtım malzemeleri:
- Sürme (püskürtme) tip su yalıtım malzemeleri,
- Serme tip su yalıtım malzemeleri,
- Dolgu tip su yalıtım malzemeleri
Olarak üç tipte tanımlanabilir. Su yalıtımı malzemelerinde, yukarıda bahsedilen 3 tipte de temel prensip olarak boşluk bırakmaksızın süreklilik olacak şekilde uygulanmalıdır.
3.1 Yüzeysel Su Yalıtımı
Su yalıtım malzemesi ile sızdırmaz bir tabaka elde etmek için yapılan ve esas olarak pozitif yani yapı dışından veya negatif yani içeriden uygulanarak sızdırmaz bir yüzey elde etmemizi sağlayan sisteme denir. Yüzeysel su yalıtımı, cinsine ve üretim şekline göre püskürtme (likit) ve örtü (membran) şeklinde uygulanır. Yüzeysel su yalıtımında esas olan, uygulanacak yüzeyin kullanılacak malzemeye uygunluğudur.
Aşağıdaki tabloda, yüzeysel su yalıtım malzemeleri özetlenmiştir.
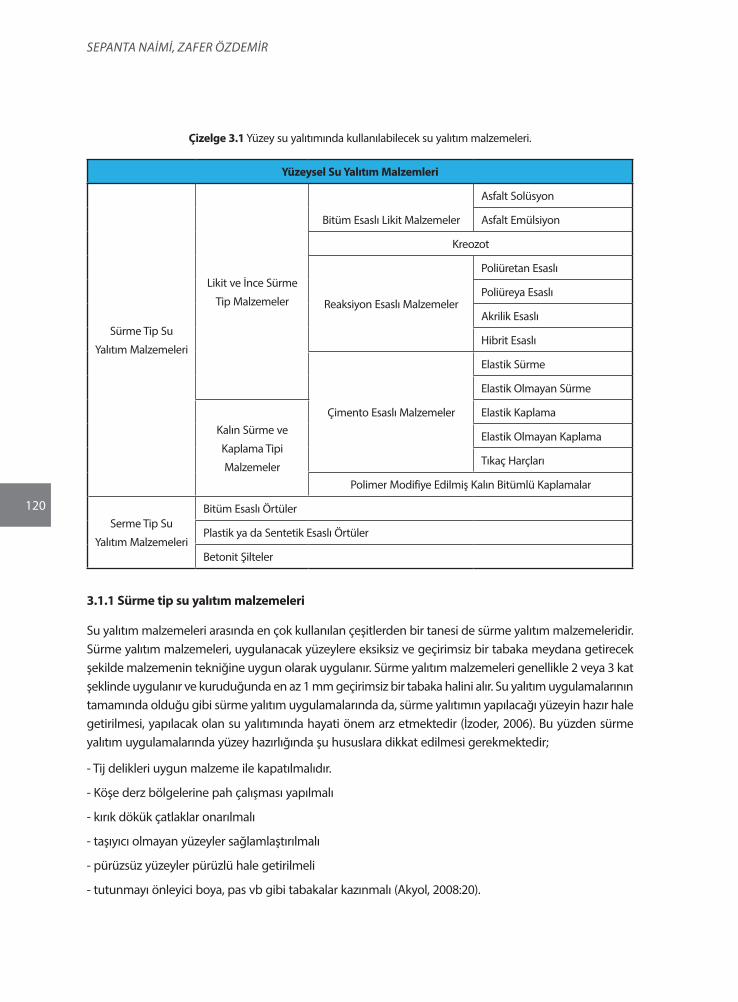
120
Sepanta naİMİ, Zafer ÖZDeMİr
Çizelge 3.1 Yüzey su yalıtımında kullanılabilecek su yalıtım malzemeleri.
Yüzeysel Su Yalıtım Malzemleri
Sürme Tip Su
Yalıtım Malzemeleri
Likit ve İnce Sürme
Tip Malzemeler
Bitüm Esaslı Likit Malzemeler
Asfalt Solüsyon
Asfalt Emülsiyon
Kreozot
Reaksiyon Esaslı Malzemeler
Poliüretan Esaslı
Poliüreya Esaslı
Akrilik Esaslı
Hibrit Esaslı
Çimento Esaslı Malzemeler
Elastik Sürme
Elastik Olmayan Sürme
Kalın Sürme ve
Kaplama Tipi
Malzemeler
Elastik Kaplama
Elastik Olmayan Kaplama
Tıkaç Harçları
Polimer Modifiye Edilmiş Kalın Bitümlü Kaplamalar
Serme Tip Su
Yalıtım Malzemeleri
Bitüm Esaslı Örtüler
Plastik ya da Sentetik Esaslı Örtüler
Betonit Şilteler
3.1.1 Sürme tip su yalıtım malzemeleri
Su yalıtım malzemeleri arasında en çok kullanılan çeşitlerden bir tanesi de sürme yalıtım malzemeleridir. Sürme yalıtım malzemeleri, uygulanacak yüzeylere eksiksiz ve geçirimsiz bir tabaka meydana getirecek şekilde malzemenin tekniğine uygun olarak uygulanır. Sürme yalıtım malzemeleri genellikle 2 veya 3 kat şeklinde uygulanır ve kuruduğunda en az 1 mm geçirimsiz bir tabaka halini alır. Su yalıtım uygulamalarının tamamında olduğu gibi sürme yalıtım uygulamalarında da, sürme yalıtımın yapılacağı yüzeyin hazır hale getirilmesi, yapılacak olan su yalıtımında hayati önem arz etmektedir (İzoder, 2006). Bu yüzden sürme yalıtım uygulamalarında yüzey hazırlığında şu hususlara dikkat edilmesi gerekmektedir;
- Tij delikleri uygun malzeme ile kapatılmalıdır.
- Köşe derz bölgelerine pah çalışması yapılmalı
- kırık dökük çatlaklar onarılmalı
- taşıyıcı olmayan yüzeyler sağlamlaştırılmalı
- pürüzsüz yüzeyler pürüzlü hale getirilmeli
- tutunmayı önleyici boya, pas vb gibi tabakalar kazınmalı (Akyol, 2008:20).
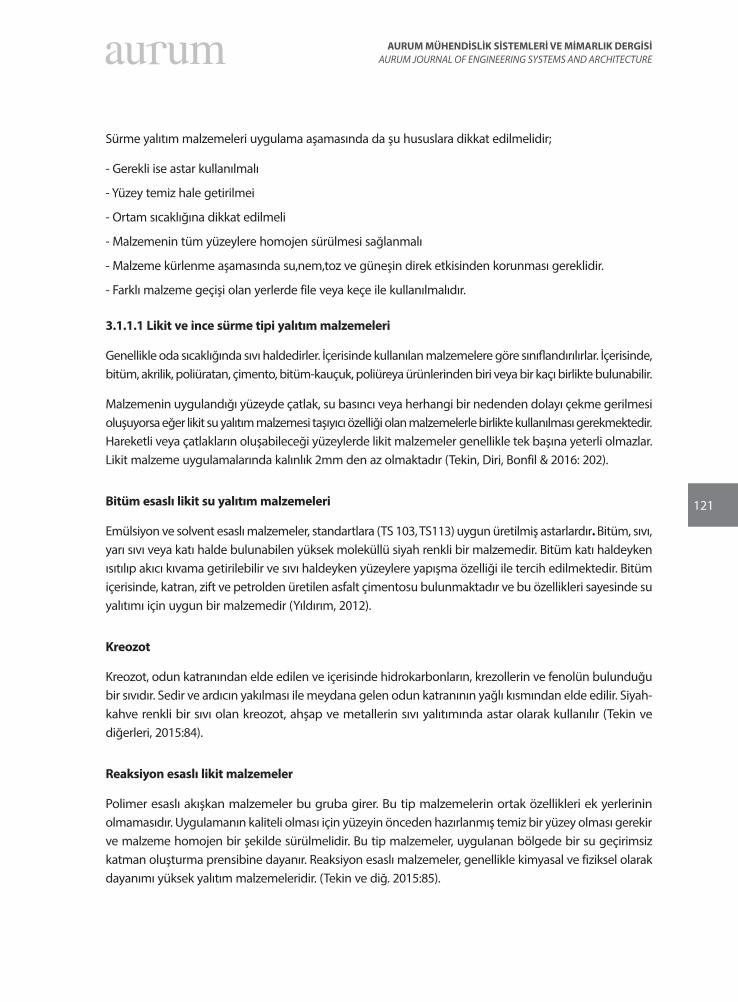
121
AURUM MÜHENDİSLİK SİSTEMLERİ VE MİMARLIK DERGİSİAURUM JOURNAL OF ENGINEERING SYSTEMS AND ARCHITECTURE
Sürme yalıtım malzemeleri uygulama aşamasında da şu hususlara dikkat edilmelidir;
- Gerekli ise astar kullanılmalı
- Yüzey temiz hale getirilmei
- Ortam sıcaklığına dikkat edilmeli
- Malzemenin tüm yüzeylere homojen sürülmesi sağlanmalı
- Malzeme kürlenme aşamasında su,nem,toz ve güneşin direk etkisinden korunması gereklidir.
- Farklı malzeme geçişi olan yerlerde file veya keçe ile kullanılmalıdır.
3.1.1.1 Likit ve ince sürme tipi yalıtım malzemeleri
Genellikle oda sıcaklığında sıvı haldedirler. İçerisinde kullanılan malzemelere göre sınıflandırılırlar. İçerisinde, bitüm, akrilik, poliüratan, çimento, bitüm-kauçuk, poliüreya ürünlerinden biri veya bir kaçı birlikte bulunabilir.
Malzemenin uygulandığı yüzeyde çatlak, su basıncı veya herhangi bir nedenden dolayı çekme gerilmesi oluşuyorsa eğer likit su yalıtım malzemesi taşıyıcı özelliği olan malzemelerle birlikte kullanılması gerekmektedir. Hareketli veya çatlakların oluşabileceği yüzeylerde likit malzemeler genellikle tek başına yeterli olmazlar. Likit malzeme uygulamalarında kalınlık 2mm den az olmaktadır (Tekin, Diri, Bonfil & 2016: 202).
Bitüm esaslı likit su yalıtım malzemeleri
Emülsiyon ve solvent esaslı malzemeler, standartlara (TS 103, TS113) uygun üretilmiş astarlardır. Bitüm, sıvı, yarı sıvı veya katı halde bulunabilen yüksek moleküllü siyah renkli bir malzemedir. Bitüm katı haldeyken ısıtılıp akıcı kıvama getirilebilir ve sıvı haldeyken yüzeylere yapışma özelliği ile tercih edilmektedir. Bitüm içerisinde, katran, zift ve petrolden üretilen asfalt çimentosu bulunmaktadır ve bu özellikleri sayesinde su yalıtımı için uygun bir malzemedir (Yıldırım, 2012).
Kreozot
Kreozot, odun katranından elde edilen ve içerisinde hidrokarbonların, krezollerin ve fenolün bulunduğu bir sıvıdır. Sedir ve ardıcın yakılması ile meydana gelen odun katranının yağlı kısmından elde edilir. Siyah-kahve renkli bir sıvı olan kreozot, ahşap ve metallerin sıvı yalıtımında astar olarak kullanılır (Tekin ve diğerleri, 2015:84).
Reaksiyon esaslı likit malzemeler
Polimer esaslı akışkan malzemeler bu gruba girer. Bu tip malzemelerin ortak özellikleri ek yerlerinin olmamasıdır. Uygulamanın kaliteli olması için yüzeyin önceden hazırlanmış temiz bir yüzey olması gerekir ve malzeme homojen bir şekilde sürülmelidir. Bu tip malzemeler, uygulanan bölgede bir su geçirimsiz katman oluşturma prensibine dayanır. Reaksiyon esaslı malzemeler, genellikle kimyasal ve fiziksel olarak dayanımı yüksek yalıtım malzemeleridir. (Tekin ve diğ. 2015:85).
122
Sepanta naİMİ, Zafer ÖZDeMİr
Çimento esaslı malzemeler
Çimento esaslı su yalıtım malzemeleri, kalın ve ince sürme tip malzemeler sınıfında da yer alır. Kristalize olan ve kristalize olmayan çimento esaslı su yalıtım malzemesi olarak 2 çeşittir. Kristalize olan malzeme, betonun içinde bulunan kimyasal malzemeler ile tepkimeye girerek betonda kristaller meydana getirir. Oluşan bu kristaller, betonda yüzeyden iç kısımlara doğru kapiler boşlukları tıkayarak, su geçirimsiz bir tabaka oluşmasını sağlar. Elastik olmadıkları için çatlaklarda bir onarım gerçekleştiremez. Kullanılacak yüzeylerde pozitif ve negatif taraftan uygulanabilir. Kullanım yerleri, temeller, bodrumlar, havuzlar ve su depoları gibi yerlerdir. Çimento esaslı malzemeler, ahşap ve çelik de kullanılmazlar. (Tekin ve diğerleri, 2015:88).
Kristalize olmayan çimento esaslı su yalıtım malzemeleri, brüt beton ve şap benzeri yüzeylerde uygulanırlar. Negatif uygulama yönü yalıtım ihtiyaçlarını karşılamayacağı için, pozitif yönden uygulanır. Bu malzemeler yarı elastik, tam elastik ve rijit olmak üzere üç çeşit üretilirler.
3.1.1.2 Kalın sürme ve kaplama tipi malzemeler
Çimento ve Bitüm esaslı malzemelerdir. Bu malzemeler fırça veya mala yardımıyla uygulanır.
Bitüm esaslı malzemeler
İki bileşenli su yalıtım malzemeleridir. Kıvamları koyu ve renkleri siyahtır. Toz ve sıvı bileşenleri vardır. Toz bileşeni modifiye çimento katkılı, sıvı bileşeni ise polimer bitüm karışımı oluşturur. Yüzeylerde su geçirmeyen sürekli bir asfalt tabaka oluşturur. Elastik seviyeleri yüksek olduğundan çatlaklara ve hareketlere karşı uyum sağlar. Kimyasal etkilere karşı ve yüksek debili sulara karşıda dayanıklıdır. Islak yüzeylerde kullanılmaz, yüzeyin az nemli veya kuru olması gerekir. Malzeme su bazlıdır kapalı alanlarda uygulanmasında bir sakınca yoktur. Uygulanan yüzeylerde aderansı yüksek olduğu için kabarma yapmaz.
Bitüm esaslı su yalıtım malzemeleri;
- Temel, bodrum ve perdelerde yeraltı su yalıtımı olarak su ve nem önleyici malzemesi olarak
- Bitümlü membran tamirlerinde
- Tuğla, taş, beton, şap vb yüzeylerin su yalıtımında
- Banyo, çatı, teras gibi bölgelerin detaylarında,
- Sürekli su sızıntısına ve basıncına maruz kalan yalıtım malzemelerinin korunmasında ve yalıtımında kullanılır.
123
AURUM MÜHENDİSLİK SİSTEMLERİ VE MİMARLIK DERGİSİAURUM JOURNAL OF ENGINEERING SYSTEMS AND ARCHITECTURE
Şekil 3.1 Bitüm esaslı sürme tip su yalıtım malzemesi (kalın).
Çimento esaslı malzemeler
Çimento esaslı su yalıtım malzemeleri, sürme tipi malzeme olarak 3’e ayrılır. Bunlar elastik, özel ürünler ve elastik olmayan malzemelerdir. Elastik malzemeler kendi içinde tam elastik, elastik ve yarı elastik olarak 3’e ayrılır. Çoğunlukla banyo, balkon, mutfak gibi seramik altında ve su deposu, havuz, teras gibi güneş ışınlarına maruz kalan veya insan geçişinin yoğun olduğu yüzeylerde yalıtım malzemesi olarak kullanılır. Çimento bazlı yerlerde kullanılabilir fakat ahşap ve çelik yüzeylerde kullanılmaz. Yapılarda negatif taraftan uygulanmaz. Güneş ışınlarına karşı dayanıklı olan malzemeler olduğu gibi, güneş ışınlarına dayanıksız olanları da vardır. Özel ürünler olarak tıkaç malzemeleri mevcuttur. Bu malzemeler, hızlı priz alma özellikleri ile basınçlı ve sızıntı sulara kısa sürede etkili çözümler sunar. Temel, bodrum perdeleri, havuz, depo ve asansör kuyularında kullanılırlar. Beton yüzeylere uygulanır, tuğla, kerpiç gibi yüzeylerde uygulanmaz.
3.2 Serme Tip Su Yalıtım Malzemeleri
Serme tipi su yalıtım malzemeleri, 3 şekildedir;
- Bitüm esaslı örtüler
- Sentetik esaslı örtüler
- Bentenit esaslı örtüler.
3.2.1 Bitüm esaslı su yalıtım örtüleri
Bitüm malzemesi, su yalıtım için kullanılan ilk malzemedir. Asfalt ve ziftden meydana gelir. Yüz yıllardır kullanılan bu malzeme, doğal yollardan elde edilen su geçirimsizliği sağlayan kaplama olarak kullanılmıştır. Bitüm, taş blokların yalıtımda kullanıldığı gibi gemi su yalıtımında da kullanılmıştır (İzoder, 2006).
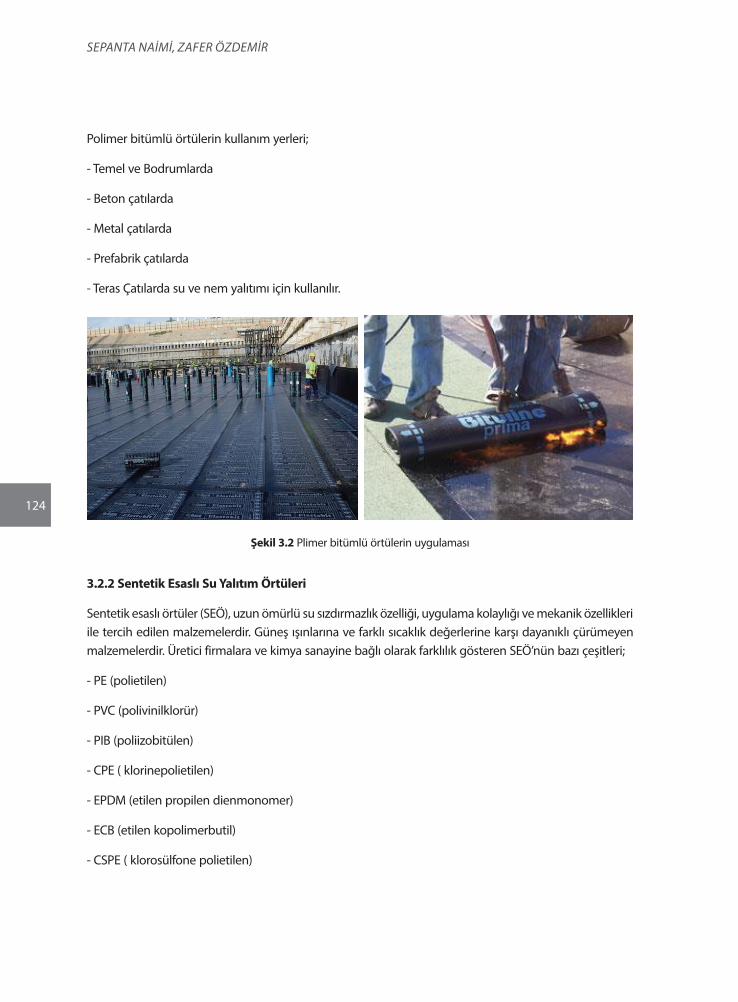
124
Sepanta naİMİ, Zafer ÖZDeMİr
Polimer bitümlü örtülerin kullanım yerleri;
- Temel ve Bodrumlarda
- Beton çatılarda
- Metal çatılarda
- Prefabrik çatılarda
- Teras Çatılarda su ve nem yalıtımı için kullanılır.
Şekil 3.2 Plimer bitümlü örtülerin uygulaması
3.2.2 Sentetik Esaslı Su Yalıtım Örtüleri
Sentetik esaslı örtüler (SEÖ), uzun ömürlü su sızdırmazlık özelliği, uygulama kolaylığı ve mekanik özellikleri ile tercih edilen malzemelerdir. Güneş ışınlarına ve farklı sıcaklık değerlerine karşı dayanıklı çürümeyen malzemelerdir. Üretici firmalara ve kimya sanayine bağlı olarak farklılık gösteren SEÖ’nün bazı çeşitleri;
- PE (polietilen)
- PVC (polivinilklorür)
- PIB (poliizobitülen)
- CPE ( klorinepolietilen)
- EPDM (etilen propilen dienmonomer)
- ECB (etilen kopolimerbutil)
- CSPE ( klorosülfone polietilen)
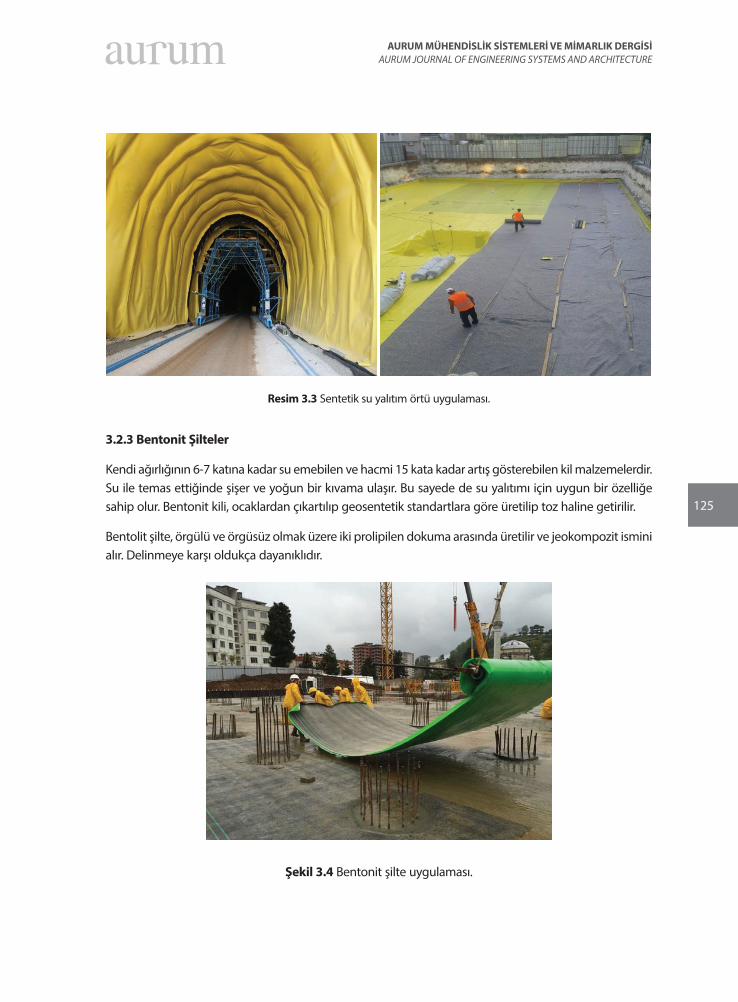
125
AURUM MÜHENDİSLİK SİSTEMLERİ VE MİMARLIK DERGİSİAURUM JOURNAL OF ENGINEERING SYSTEMS AND ARCHITECTURE
Resim 3.3 Sentetik su yalıtım örtü uygulaması.
3.2.3 Bentonit Şilteler
Kendi ağırlığının 6-7 katına kadar su emebilen ve hacmi 15 kata kadar artış gösterebilen kil malzemelerdir. Su ile temas ettiğinde şişer ve yoğun bir kıvama ulaşır. Bu sayede de su yalıtımı için uygun bir özelliğe sahip olur. Bentonit kili, ocaklardan çıkartılıp geosentetik standartlara göre üretilip toz haline getirilir.
Bentolit şilte, örgülü ve örgüsüz olmak üzere iki prolipilen dokuma arasında üretilir ve jeokompozit ismini alır. Delinmeye karşı oldukça dayanıklıdır.
Şekil 3.4 Bentonit şilte uygulaması.
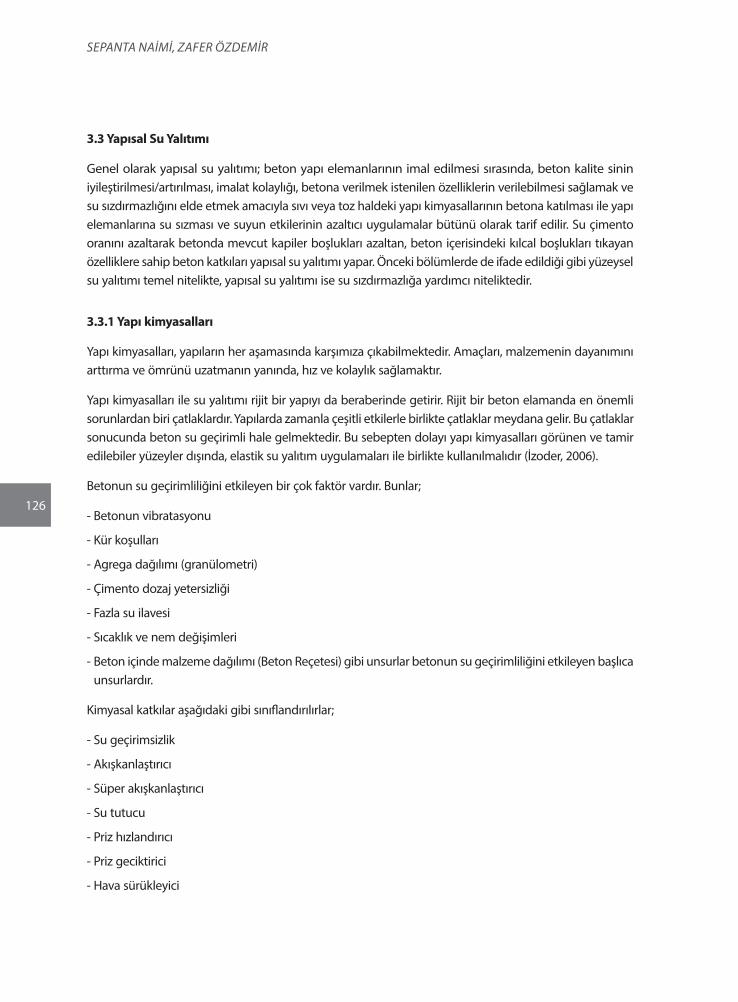
126
Sepanta naİMİ, Zafer ÖZDeMİr
3.3 Yapısal Su Yalıtımı
Genel olarak yapısal su yalıtımı; beton yapı elemanlarının imal edilmesi sırasında, beton kalite sinin iyileştirilmesi/artırılması, imalat kolaylığı, betona verilmek istenilen özelliklerin verilebilmesi sağlamak ve su sızdırmazlığını elde etmek amacıyla sıvı veya toz haldeki yapı kimyasallarının betona katılması ile yapı elemanlarına su sızması ve suyun etkilerinin azaltıcı uygulamalar bütünü olarak tarif edilir. Su çimento oranını azaltarak betonda mevcut kapiler boşlukları azaltan, beton içerisindeki kılcal boşlukları tıkayan özelliklere sahip beton katkıları yapısal su yalıtımı yapar. Önceki bölümlerde de ifade edildiği gibi yüzeysel su yalıtımı temel nitelikte, yapısal su yalıtımı ise su sızdırmazlığa yardımcı niteliktedir.
3.3.1 Yapı kimyasalları
Yapı kimyasalları, yapıların her aşamasında karşımıza çıkabilmektedir. Amaçları, malzemenin dayanımını arttırma ve ömrünü uzatmanın yanında, hız ve kolaylık sağlamaktır.
Yapı kimyasalları ile su yalıtımı rijit bir yapıyı da beraberinde getirir. Rijit bir beton elamanda en önemli sorunlardan biri çatlaklardır. Yapılarda zamanla çeşitli etkilerle birlikte çatlaklar meydana gelir. Bu çatlaklar sonucunda beton su geçirimli hale gelmektedir. Bu sebepten dolayı yapı kimyasalları görünen ve tamir edilebiler yüzeyler dışında, elastik su yalıtım uygulamaları ile birlikte kullanılmalıdır (İzoder, 2006).
Betonun su geçirimliliğini etkileyen bir çok faktör vardır. Bunlar;
- Betonun vibratasyonu
- Kür koşulları
- Agrega dağılımı (granülometri)
- Çimento dozaj yetersizliği
- Fazla su ilavesi
- Sıcaklık ve nem değişimleri
- Beton içinde malzeme dağılımı (Beton Reçetesi) gibi unsurlar betonun su geçirimliliğini etkileyen başlıca unsurlardır.
Kimyasal katkılar aşağıdaki gibi sınıflandırılırlar;
- Su geçirimsizlik
- Akışkanlaştırıcı
- Süper akışkanlaştırıcı
- Su tutucu
- Priz hızlandırıcı
- Priz geciktirici
- Hava sürükleyici
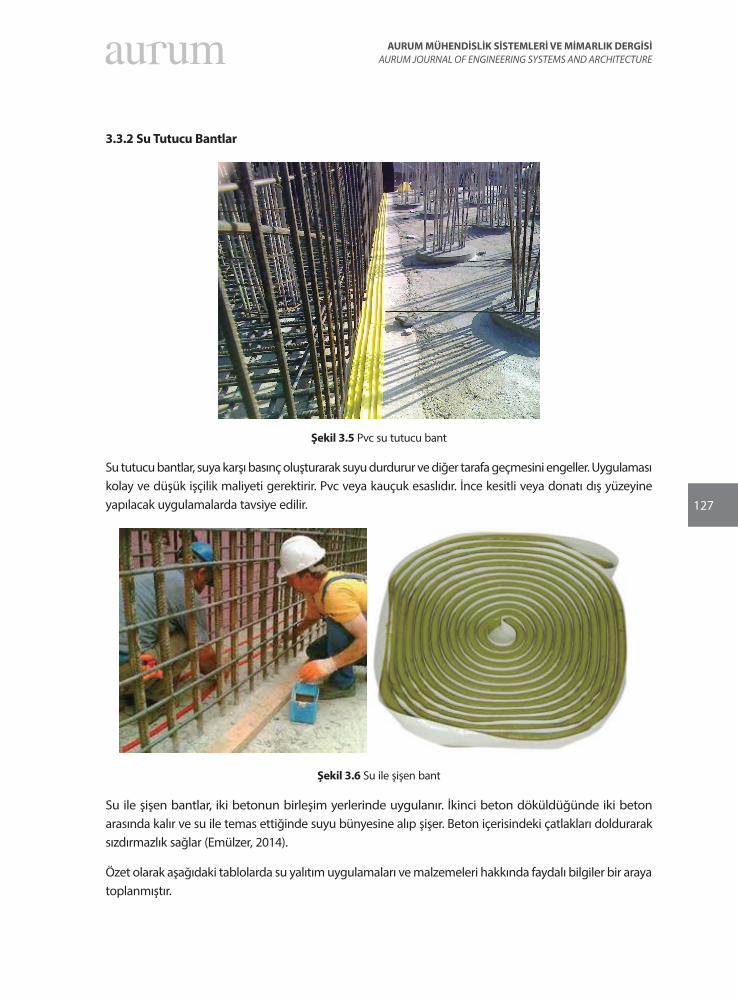
127
AURUM MÜHENDİSLİK SİSTEMLERİ VE MİMARLIK DERGİSİAURUM JOURNAL OF ENGINEERING SYSTEMS AND ARCHITECTURE
3.3.2 Su Tutucu Bantlar
Şekil 3.5 Pvc su tutucu bant
Su tutucu bantlar, suya karşı basınç oluşturarak suyu durdurur ve diğer tarafa geçmesini engeller. Uygulaması kolay ve düşük işçilik maliyeti gerektirir. Pvc veya kauçuk esaslıdır. İnce kesitli veya donatı dış yüzeyine yapılacak uygulamalarda tavsiye edilir.
Şekil 3.6 Su ile şişen bant
Su ile şişen bantlar, iki betonun birleşim yerlerinde uygulanır. İkinci beton döküldüğünde iki beton arasında kalır ve su ile temas ettiğinde suyu bünyesine alıp şişer. Beton içerisindeki çatlakları doldurarak sızdırmazlık sağlar (Emülzer, 2014).
Özet olarak aşağıdaki tablolarda su yalıtım uygulamaları ve malzemeleri hakkında faydalı bilgiler bir araya toplanmıştır.
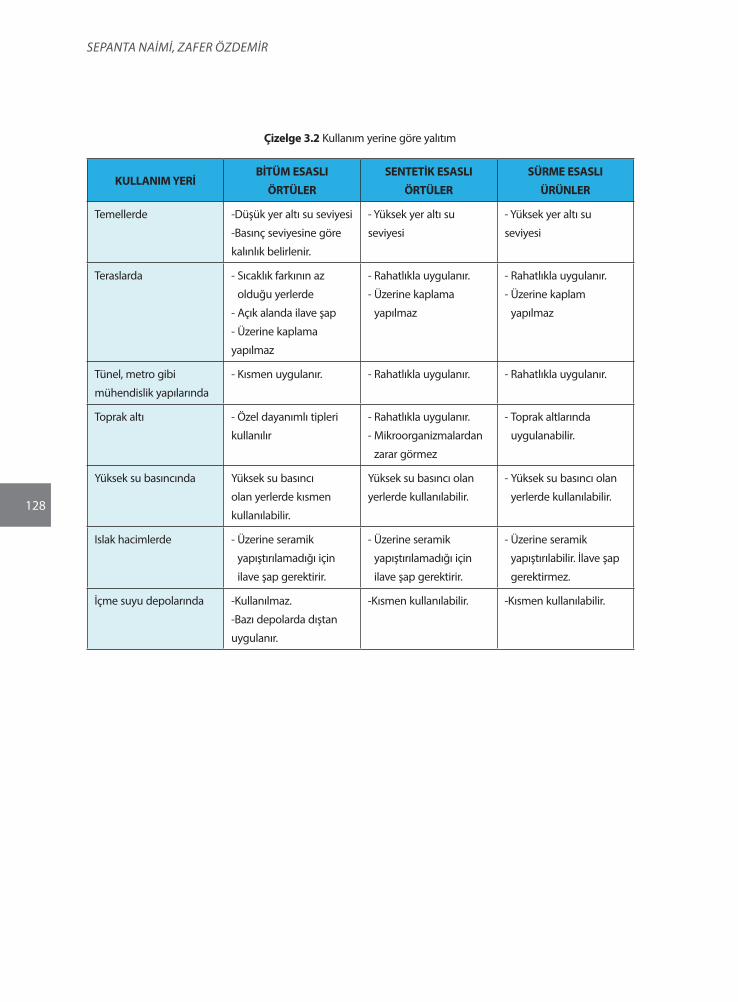
128
Sepanta naİMİ, Zafer ÖZDeMİr
Çizelge 3.2 Kullanım yerine göre yalıtım
KULLANIM YERİ BİTÜM ESASLI
ÖRTÜLER
SENTETİK ESASLI
ÖRTÜLER
SÜRME ESASLI
ÜRÜNLER
Temellerde -Düşük yer altı su seviyesi
-Basınç seviyesine göre
kalınlık belirlenir.
- Yüksek yer altı su
seviyesi
- Yüksek yer altı su
seviyesi
Teraslarda - Sıcaklık farkının az
olduğu yerlerde
- Açık alanda ilave şap
- Üzerine kaplama
yapılmaz
- Rahatlıkla uygulanır.
- Üzerine kaplama
yapılmaz
- Rahatlıkla uygulanır.
- Üzerine kaplam
yapılmaz
Tünel, metro gibi
mühendislik yapılarında
- Kısmen uygulanır. - Rahatlıkla uygulanır. - Rahatlıkla uygulanır.
Toprak altı - Özel dayanımlı tipleri
kullanılır
- Rahatlıkla uygulanır.
- Mikroorganizmalardan
zarar görmez
- Toprak altlarında
uygulanabilir.
Yüksek su basıncında Yüksek su basıncı
olan yerlerde kısmen
kullanılabilir.
Yüksek su basıncı olan
yerlerde kullanılabilir.
- Yüksek su basıncı olan
yerlerde kullanılabilir.
Islak hacimlerde - Üzerine seramik
yapıştırılamadığı için
ilave şap gerektirir.
- Üzerine seramik
yapıştırılamadığı için
ilave şap gerektirir.
- Üzerine seramik
yapıştırılabilir. İlave şap
gerektirmez.
İçme suyu depolarında -Kullanılmaz.
-Bazı depolarda dıştan
uygulanır.
-Kısmen kullanılabilir. -Kısmen kullanılabilir.
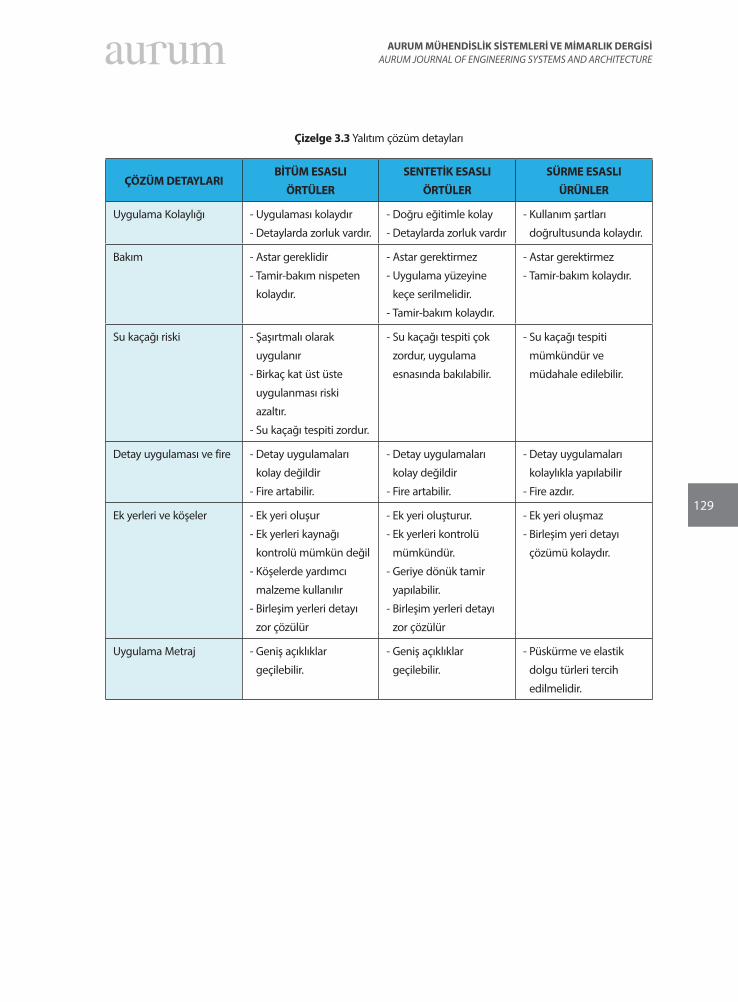
129
AURUM MÜHENDİSLİK SİSTEMLERİ VE MİMARLIK DERGİSİAURUM JOURNAL OF ENGINEERING SYSTEMS AND ARCHITECTURE
Çizelge 3.3 Yalıtım çözüm detayları
ÇÖZÜM DETAYLARIBİTÜM ESASLI
ÖRTÜLER
SENTETİK ESASLI
ÖRTÜLER
SÜRME ESASLI
ÜRÜNLER
Uygulama Kolaylığı - Uygulaması kolaydır
- Detaylarda zorluk vardır.
- Doğru eğitimle kolay
- Detaylarda zorluk vardır
- Kullanım şartları
doğrultusunda kolaydır.
Bakım - Astar gereklidir
- Tamir-bakım nispeten
kolaydır.
- Astar gerektirmez
- Uygulama yüzeyine
keçe serilmelidir.
- Tamir-bakım kolaydır.
- Astar gerektirmez
- Tamir-bakım kolaydır.
Su kaçağı riski - Şaşırtmalı olarak
uygulanır
- Birkaç kat üst üste
uygulanması riski
azaltır.
- Su kaçağı tespiti zordur.
- Su kaçağı tespiti çok
zordur, uygulama
esnasında bakılabilir.
- Su kaçağı tespiti
mümkündür ve
müdahale edilebilir.
Detay uygulaması ve fire - Detay uygulamaları
kolay değildir
- Fire artabilir.
- Detay uygulamaları
kolay değildir
- Fire artabilir.
- Detay uygulamaları
kolaylıkla yapılabilir
- Fire azdır.
Ek yerleri ve köşeler - Ek yeri oluşur
- Ek yerleri kaynağı
kontrolü mümkün değil
- Köşelerde yardımcı
malzeme kullanılır
- Birleşim yerleri detayı
zor çözülür
- Ek yeri oluşturur.
- Ek yerleri kontrolü
mümkündür.
- Geriye dönük tamir
yapılabilir.
- Birleşim yerleri detayı
zor çözülür
- Ek yeri oluşmaz
- Birleşim yeri detayı
çözümü kolaydır.
Uygulama Metraj - Geniş açıklıklar
geçilebilir.
- Geniş açıklıklar
geçilebilir.
- Püskürme ve elastik
dolgu türleri tercih
edilmelidir.
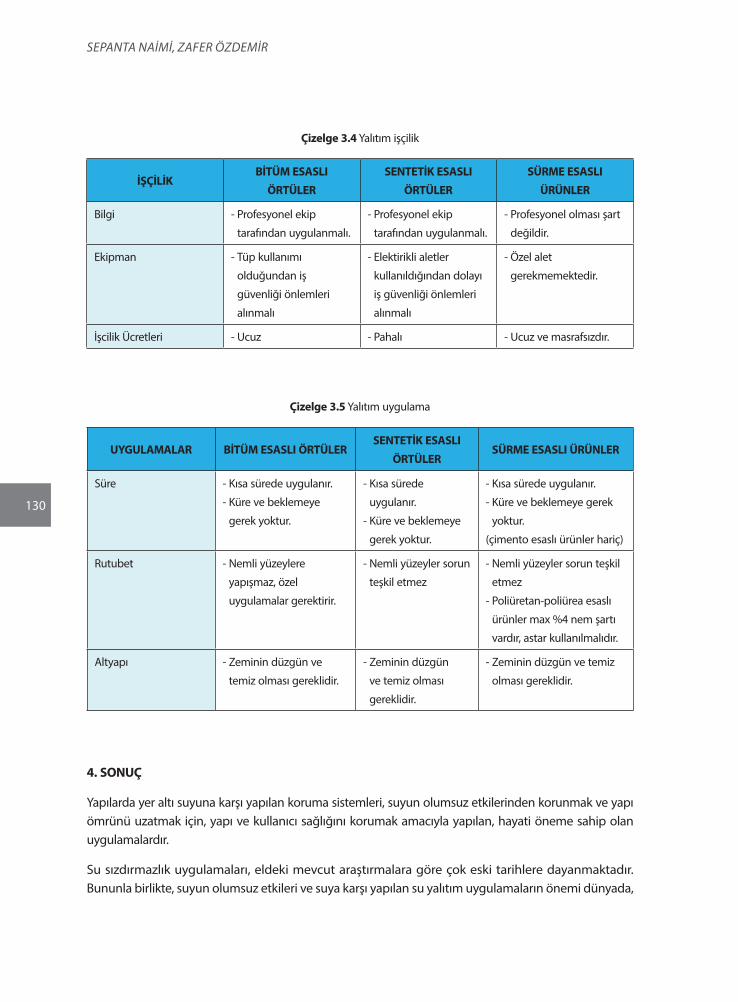
130
Sepanta naİMİ, Zafer ÖZDeMİr
Çizelge 3.4 Yalıtım işçilik
İŞÇİLİKBİTÜM ESASLI
ÖRTÜLER
SENTETİK ESASLI
ÖRTÜLER
SÜRME ESASLI
ÜRÜNLER
Bilgi - Profesyonel ekip
tarafından uygulanmalı.
- Profesyonel ekip
tarafından uygulanmalı.
- Profesyonel olması şart
değildir.
Ekipman - Tüp kullanımı
olduğundan iş
güvenliği önlemleri
alınmalı
- Elektirikli aletler
kullanıldığından dolayı
iş güvenliği önlemleri
alınmalı
- Özel alet
gerekmemektedir.
İşcilik Ücretleri - Ucuz - Pahalı - Ucuz ve masrafsızdır.
Çizelge 3.5 Yalıtım uygulama
UYGULAMALAR BİTÜM ESASLI ÖRTÜLERSENTETİK ESASLI
ÖRTÜLERSÜRME ESASLI ÜRÜNLER
Süre - Kısa sürede uygulanır.
- Küre ve beklemeye
gerek yoktur.
- Kısa sürede
uygulanır.
- Küre ve beklemeye
gerek yoktur.
- Kısa sürede uygulanır.
- Küre ve beklemeye gerek
yoktur.
(çimento esaslı ürünler hariç)
Rutubet - Nemli yüzeylere
yapışmaz, özel
uygulamalar gerektirir.
- Nemli yüzeyler sorun
teşkil etmez
- Nemli yüzeyler sorun teşkil
etmez
- Poliüretan-poliürea esaslı
ürünler max %4 nem şartı
vardır, astar kullanılmalıdır.
Altyapı - Zeminin düzgün ve
temiz olması gereklidir.
- Zeminin düzgün
ve temiz olması
gereklidir.
- Zeminin düzgün ve temiz
olması gereklidir.
4. SONUÇ
Yapılarda yer altı suyuna karşı yapılan koruma sistemleri, suyun olumsuz etkilerinden korunmak ve yapı ömrünü uzatmak için, yapı ve kullanıcı sağlığını korumak amacıyla yapılan, hayati öneme sahip olan uygulamalardır.
Su sızdırmazlık uygulamaları, eldeki mevcut araştırmalara göre çok eski tarihlere dayanmaktadır. Bununla birlikte, suyun olumsuz etkileri ve suya karşı yapılan su yalıtım uygulamaların önemi dünyada,
131
AURUM MÜHENDİSLİK SİSTEMLERİ VE MİMARLIK DERGİSİAURUM JOURNAL OF ENGINEERING SYSTEMS AND ARCHITECTURE
19.yy’da artmıştır. Türkiye’de ise su yalıtımının önemi, 1999 Gölcük depreminden sonra anlaşılmaya başlanmıştır. Gölcük depreminden sonra yapılan incelemeler sonucunda, meydana gelen yıkımların en büyük nedenlerinden birinin, su ve ısı yalıtımı olduğu ortaya konmuştur. Su ve ısı yalıtımı olmayan binalarda, betonarme elemanlar içerisindeki donatı, korozyona uğrayarak dayanımını büyük ölçüde kaybedip, deprem sırasında beklenen performansı gösteremeyerek, binaların yıkılmasına sebep olmuştur.17 Ağustos 1999 Gölcük depremi sonrası, İBB tarafından hazırlanan rapora göre, 55 bin konut incelenmiş, bu konutların %64’ünde korozyon etkisiyle hasar meydana geldiği tespit edilmiştir. Bu rapora göre, yapılarda meydana gelen hasarların en büyük nedenini korozyon oluşturmaktadır. Türkiye’nin bir deprem ülkesi olduğu gerçeği de, su yalıtım uygulamalarının ne derece hayati önem arz ettiğini göstermektedir.
Su yalıtım uygulamaları, yapıların kalıcı ve uzun ömürlü olması için yapılması gerekilen en önemli, gerekli ve zorunlu uygulamaların başında gelmektedir. Su yalıtımı, bu zorunluluğun farkında olup, sorumluluğu üstlenenlerin en temel problemlerindendir. Bu problem, yapılarda yer altı suyuna karşı yapılan koruma sistemlerinin uygulanabilirliği ve yalıtım önleminin nasıl alınması gerektiğidir.
Yapılarda yer altı suyuna karşı yapılacak koruma sistemlerin belirlenmesine, yapının proje aşamasından itibaren başlanılmalıdır. İlk olarak suyun yapıya hangi yoldan ne şekilde etki edeceği belirlenmelidir. Daha sonra su, zemin, ve yapı özellikleriyle birlikte, yapılacak olan su yalıtım uygulamasına ve kullanılacak malzemelere karar verilmelidir.
Yapılarda yer altı sularına karşı yapılan koruma sistemlerinin çeşitliliği ve malzeme türlerinin fazlalığından dolayı uygulamalarda tercih hataları da meydana gelebilmektedir. Bu yüzden su yalıtımında ilk olarak, hangi uygulamanın yapılması gerektiğin belirlenmesinde fayda vardır. Bu da, proje aşamasında yer altı suyunun oluşturabileceği problemlerin belirlenmesi ve su geçişinin hangi sistemle engelleneceğini belirlemekle mümkündür. Yer altı sularına karşı zamanında yapılamayan veya yanlış yapılan su yalıtım uygulamaları da, yapılarda geri dönüşü olmayan sorunlara neden olmaktadır.
Yer altı sularına karşı yalıtımın başarılı olabilmesi için, teşhisin doğru yapılması, malzemenin doğru seçilmesi, uygulamanın doğru yapılması ve işçiliğin kaliteli olması gerekir. Kısaca, doğru teşhis, doğru uygulama, doğru malzeme ve doğru işçilik ilkeleri benimsenmelidir. Doğru uygulama ve işçilik, uygulama standartlarının ve detaylarının iyi bilinmesi, bu doğrultuda da tecrübeli titiz bir ekip tarafından uygulanması ile mümkündür. Doğru malzeme seçimi de, malzemeleri iyi tanımakla gerçekleşebilir.
Yer altı sularına karşı söz konusu önlemler alındığında, yapılar suyun zararlı etkilerine karşı korunmuş olurlar. Böylece, bakım ve onarım maliyetlerinin düşük, kullanım ömürleri uzun olduğu yapılar meydana gelir.
KAYNAKÇA
Akıncıtürk, N. 2001.“Yapı Temellerinde su sorunu ve yalıtım uygulamaları”, TMMOB Makine Mühendisleri Odası Yalıtım Kongresi, ss.158, Eskişehir.
Aksöz, B. 1995. Yapı hasarları ve Tamirat Metodları, Yüksek Lisans Tezi, İTÜ Fen Bilimleri Enstitüsü, İstanbul
132
Sepanta naİMİ, Zafer ÖZDeMİr
Akyol, K. 2008. Su Yalıtımı ve Su Geçirimsizlik Katkı Oranlarının Beton Su Emmesine ve Basın Dayanımına Etkilerinin Araştırılması, Yüksek Lisans Tezi, ss.16-17 Sakarya Üniversitesi, Yapı Eğitimi Anabilim Dalı, Sakarya.
Avlar, E. 1999.“Binalarda Oluşan Su Sorunları ve Sonuçları” Yapıda Yalıtım Konferansında sunulan bildiri, ss.77-88, İstanbul, 11-12 Şubat.
Birinci, F. 2013. “Türkiye’nin Depremselliği ve Yapı Stoğu Yönünden Mevzuat ve Mali Politikaların Kentsel Dönüşümü Zorlaştıran Unsurları”, 2. Türkiye Deprem Mühendisliği ve Sismoloji Konferansı MKÜ, Hatay.
Coşkun, T. 2012. “İstanbul’da Deprem Sonrası Yapılan İncelemelerde Karşılaşılan Korozyon Hasarı Üzerine Bir İnceleme”, İÜ Mühendislik Fakültesi, İnşaat Mühendisliği Bölümü, İstanbul.
Ekinci, C.E., ve Yıldırım, S.T. 2004.“Betonarme Temel ve Bodrum Perdelerinde Su ve nem yalıtımının önemi”. Doğu Anadolu Bölgesi Araştırmaları, ss.11-19
Ertem, E. 2002. Yeraltı Su Seviyesi Altında Kalan Bodrum Kabuklarında Karşılaşılan Yalıtım Problemleri; Çözümüne Uygun Uygulama Teknikleri ve Yalıtım Malzemelerinin İrdelenmesi. Yüksek Lisans Tezi, Dokuz Eylül Üniversitesi Fen Bilimleri Enstitüsü, İzmir, 244.
Gel, M.K. 2003. “Betonarme Yapılarda Donatıların Korozyonu ve Su Yalıtımı”, Türkiye Mühendislik Haberleri, Sayı 427 ss.117.
Gel, M.K. 2007. Sağlıksız Yapıların İnsan Sağlığına Etkileri ve Yalıtım İcin Cözümler, İzolasyon Dünyası Dergisi, 112
İzoder. 2006. “İnşaat Teknolojisi – Su Yalıtımı”, Teknik Yayınları, İzolasyon Dunyası 64, 54-56
Naimi, S., ve Celikag, M. 2010. Problems of Reinforce Concrete Building Construction in North Cyprus. Proceedings of The 12th International Conference on Inspection Appraisal Repairs and Maintenance of Structures, Vols 1 And 2.
Oymael, S. 1997. Yapı Fiziği Ders Notları. ODE Yayınları, İstanbul.
Oymael, S. 2001. Yapı Bilgisi I-II-III., Milli Eğitim Yayınları.
Şimşek, Z. 2005. Yapı Yeraltı Kabuğunda Su ve Nem Sorunlarının Geçirimsiz Beton Malzeme ile Giderilmesinin Araştırılması, Yüksek Lisans Tezi, Uludağ Üniversitesi Fen Bilimleri Enstitüsü, Bursa
Tekin, Ç. 2010. “Deprem Güvenliğinde Temellerin Suya Karşı Yalıtımının Önemi”, Yapı Fiziği ve Sürdürülebilir Tasarım Kongresi, İstanbul.
Tekin, Ç., Diri A.C., ve Bonfil, J. 2016. Mimari Yapılarda Su Yalıtımı, Yapı Endüstri Merkezi Yayınları, 202
Tekin, Ç., Diri, A.C., ve Bonfil, J. 2015. Mimari yapılarda Su Yalıtımı (Birinci baskı). Türkiye: BTM yayınları, 18-138.

133
AURUM MÜHENDİSLİK SİSTEMLERİ VE MİMARLIK DERGİSİAURUM JOURNAL OF ENGINEERING SYSTEMS AND ARCHITECTURE
Yıldırım, M. 2012. Yapılarda Su Geçirimliliği ve Yalıtım Teknolojisi, Yüksek Lisans Tezi, Sakarya Üniversitesi Fen Bilimleri Enstitüsü, Sakarya, 43-148
İNTERNET KAYNAKLARI
Bitüder, 2014, Depreme Karşı Yalıtım Bilinci, Milliyet Gazetesi, 25 Ocak 2019, available in https://www.milliyet.com.tr/konut/depreme-karsi-yalitim-bilinci-1926043, last accessed April, 2020.
Emülzer, 2014, available in https://www.emulzer.com.tr/urun/sisen-su-tutucu-bant.html, last accessed April, 2020.

135
AURUM MÜHENDİSLİK SİSTEMLERİ VE MİMARLIK DERGİSİAURUM JOURNAL OF ENGINEERING SYSTEMS AND ARCHITECTURE
Cilt 4, Sayı 1 | Yaz 2020Volume 4, No 1 | Summer 2020, 135-152
ARAŞTIRMA MAKALESİ / RESEARCH ARTICLE
21. YÜZYIL DÜNYA FUARLARINDA (EXPO) TÜRKİYE’NİN MİMARİ TEMSİLİ
Erinç ONBAY1
1Yıldız Teknik Üniversitesi, Fen Bilimleri Enstitüsü, Mimari Tasarım Doktora Programı, İstanbul. [email protected] ORCID No: 0000-0003-0439-5858
GELİŞ TARİHİ/RECEIVED DATE: 27.01.2020 KABUL TARİHİ/ACCEPTED DATE: 27.05.2020
Özet
19. yüzyılın ortasında düzenlenmeye başlanmış olan Dünya Fuarları (Expo) mimari öğelerle desteklenen zengin iletişim tasarımı ortamlarıdır. Katılımcı ülkelerin farklı alanlardaki başarılarının uluslararası arenada sunumu görevini üstlenen bu fuarlar zamanla küresel gelişmenin de bir kaydı haline gelmişlerdir. Dünya Fuarlarında ülkeleri temsil eden ulusal pavyonlar ise ulusların kendilerini uluslararası ortamda nasıl tanımladığını görmek açısından önemli yapılardır. Dünya Fuarlarında öncelikli amaç tanıtım yoluyla geniş kitlelere ulaşmak olduğu için, mimari öğeler olarak ulusal pavyonlar hem kendileri hem de içlerinde sergilenen nesneler ve düzenlenen etkinliklerle birer imaj tasarımı olarak nitelendirilebilir. Bu çalışmanın amacı ise Türkiye Cumhuriyeti’nin 21. yüzyıl Dünya Fuarlarındaki mimari temsilini incelemek ve tasarım yaklaşımlarını değerlendirmektir. Bu kapsamda Türk Pavyonlarının mimari ve iç mimari tasarım özellikleri belirlendikten sonra konuya ilişkin mimarlık medyasında yer alan eleştirilere de değinilerek, yapıların fuarlar bağlamındaki niteliği yorumlanmaktadır. Türkiye, incelenen Dünya Fuarlarında farklı pavyon tasarımları ile yer almış olsa da tasarım yaklaşımları ve sergilenen nesneler genellikle benzer olmuştur. Pavyonlar bu açıdan Türkiye’nin imajının görselleştirildiği yapılar değil, daha çok turizme yönelik pazarlama etkinliklerin yapıldığı mekânlardır. Ülkenin fuar katılımlarında, pavyonlar sadece içi doldurulması gereken yapılar olarak ele alınmış, anlatılmak istenen asıl mesajı ziyaretçilere vermek için kavramsal arka plana dayalı bir çalışma yapılmamıştır.
Anahtar Kelimeler: Dünya Fuarı, Expo, Ulusal Pavyon, Mimari Temsil, İç Mekan Sergisi, Tasarım Yaklaşımı
ARCHITECTURAL PRESENTATION OF TURKEY IN THE 21ST CENTURY WORLD’S FAIRS (EXPO)
Abstract
Beginning from the middle of the 19th century World’s Fairs (Expo) are mediums of rich communicational design which are organized with architectural elements. Undertaking the international presentation of achievements of participant nations, these fairs also became the record of global development with time. National pavilions representing countries in the World’s Fairs are important buildings in terms of seeing how nations define themselves internationally. As the primary purpose of World’s Fairs is to reach large masses through promotion, national pavilions as architectural elements, can be described as an image design with objects and events displayed in. The aim of this study is to examine the architectural representation and evaluate the design approaches of Turkey in the 21th century World’s Fairs. In this context, after defining the
136
Erinç Onbay
architectural and interior design features of the Turkish Pavilions, also with mentioning the criticisms in the architectural media about the subject, the quality of the buildings are reviewed in the context of the fairs. Although Turkey has been featured with different pavilion designs in the examined World’s Fairs, design approaches and the exhibition objects are often similar. In this respect, the pavilions are not the buildings where the image of Turkey is visualized but are places where tourism marketing activities are performed. Turkish Pavilions are considered as buildings that need to be filled in and no study is made based on the conceptual background to give the principal message to the visitors.
Keywords: World’s Fair, Expo, National Pavilion, Architectural Representation, Interior Exhibition, Design Approach
1. GİRİŞ
150 yıldan uzun bir süredir düzenlenmekte olan Dünya Fuarları, dünyanın geleceğine yönelik projelerin sergilenmesi ve bilimsel/kültürel birikimlerin paylaşılması yoluyla yeni fikirlerin geliştirilmesini sağlayarak sosyo-kültürel gelişime evrensel boyutta katkıda bulunan etkinliklerdir. Bir anlamda dünyanın kültür, tarih ve eğitim faaliyetleri olarak değerlendirilen bu fuarlar, ülkeleri bir araya getirerek, daha iyi bir dünya için bilgi paylaşımı sağlamaktadırlar.
Dünya Fuarları teknoloji, inovasyon, çevre ile uyum gibi evrensel konulara odaklanarak ülkelerin ekonomik ve teknolojik gelişmesini göstermekle kalmayıp, yerel ve kültürel değerlerini de tanıtmaya aracılık etmektedirler. Ayrıca ülkelerin ulusal ve uluslararası ekonomisini güçlendirdikleri gibi ülkelerarası ticari ve kültürel ilişkileri de geliştirmektedirler.
Mimarlık tarihçilerine göre, Dünya Fuarları yeni mimari biçimlerin ve kompozisyonların oluşumu için bir laboratuvar niteliği taşımakta ve mimarlıkta değişen eğilimleri yansıtmalarının yanında katılımcı ülkelerin kültürel durumlarını da ortaya koymaktadırlar.
Tarihsel süreçte ekonomik, siyasal, sosyal, kültürel ve teknolojik parametrelerde yaşanan kırılmaların Dünya Fuarlarında ülkeleri temsil eden ulusal pavyonların mimari tasarımında önemli etkisi olduğu ve bu yapıların kendilerini ortaya çıkaran koşulları net bir şekilde ifade ettikleri görülmektedir. Bir anlamda mimarlığın gelişim serüvenini anlatan ulusal pavyonların aynı zamanda ülkelerin mimari alandaki dönüşümünü de gösterme potansiyeli vardır. Günümüzde ise Dünya Fuarları ülkelerin daha çok kendi ulusal kimliklerine karşılık gelen imajı ulusal pavyonları aracılığıyla geliştirmeye çalıştıkları bir platform halini almıştır.
Bu genel çerçeve içerisinde Türkiye Cumhuriyeti’nin yakın dönem Dünya Fuarlarındaki mimari temsilini incelemeyi ve tasarım yaklaşımlarını değerlendirmeyi amaçlayan araştırma, ülkenin 21. yüzyıl içerisinde katılmış olduğu tüm Dünya Fuarlarını kapsam içine almaktadır. Bunlar; 2000 Hannover-Almanya, 2010 Şangay-Çin ve 2015 Milano-İtalya fuarlarıdır.
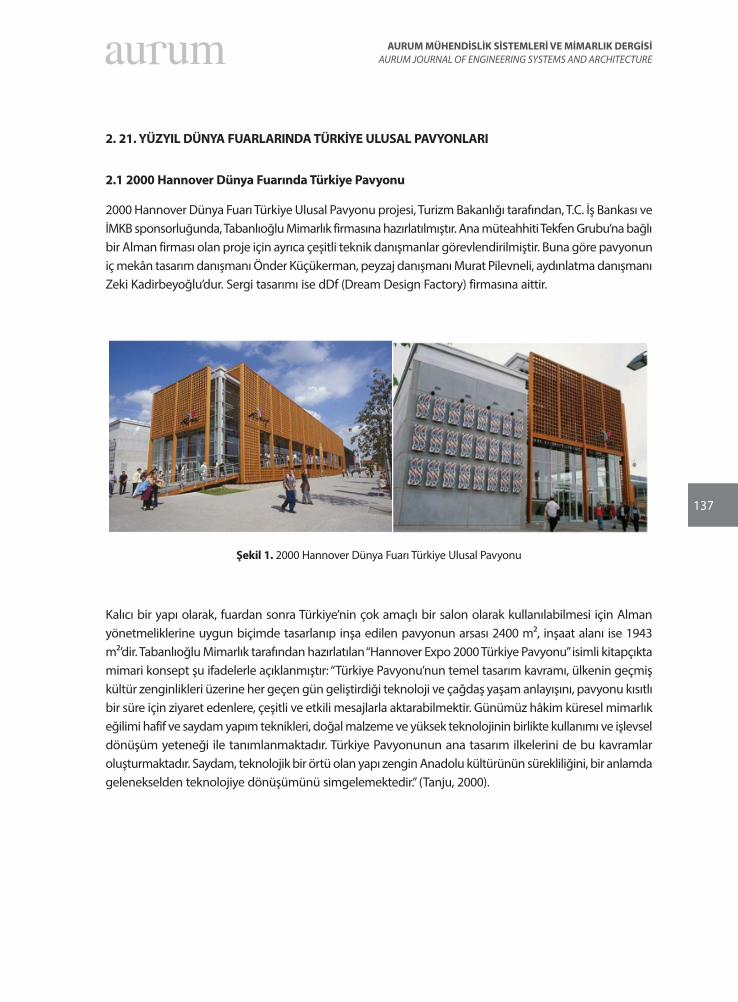
137
AURUM MÜHENDİSLİK SİSTEMLERİ VE MİMARLIK DERGİSİAURUM JOURNAL OF ENGINEERING SYSTEMS AND ARCHITECTURE
2. 21. YÜZYIL DÜNYA FUARLARINDA TÜRKİYE ULUSAL PAVYONLARI
2.1 2000 Hannover Dünya Fuarında Türkiye Pavyonu
2000 Hannover Dünya Fuarı Türkiye Ulusal Pavyonu projesi, Turizm Bakanlığı tarafından, T.C. İş Bankası ve İMKB sponsorluğunda, Tabanlıoğlu Mimarlık firmasına hazırlatılmıştır. Ana müteahhiti Tekfen Grubu’na bağlı bir Alman firması olan proje için ayrıca çeşitli teknik danışmanlar görevlendirilmiştir. Buna göre pavyonun iç mekân tasarım danışmanı Önder Küçükerman, peyzaj danışmanı Murat Pilevneli, aydınlatma danışmanı Zeki Kadirbeyoğlu’dur. Sergi tasarımı ise dDf (Dream Design Factory) firmasına aittir.
Şekil 1. 2000 Hannover Dünya Fuarı Türkiye Ulusal Pavyonu
Kalıcı bir yapı olarak, fuardan sonra Türkiye’nin çok amaçlı bir salon olarak kullanılabilmesi için Alman yönetmeliklerine uygun biçimde tasarlanıp inşa edilen pavyonun arsası 2400 m², inşaat alanı ise 1943 m²’dir. Tabanlıoğlu Mimarlık tarafından hazırlatılan “Hannover Expo 2000 Türkiye Pavyonu” isimli kitapçıkta mimari konsept şu ifadelerle açıklanmıştır: “Türkiye Pavyonu’nun temel tasarım kavramı, ülkenin geçmiş kültür zenginlikleri üzerine her geçen gün geliştirdiği teknoloji ve çağdaş yaşam anlayışını, pavyonu kısıtlı bir süre için ziyaret edenlere, çeşitli ve etkili mesajlarla aktarabilmektir. Günümüz hâkim küresel mimarlık eğilimi hafif ve saydam yapım teknikleri, doğal malzeme ve yüksek teknolojinin birlikte kullanımı ve işlevsel dönüşüm yeteneği ile tanımlanmaktadır. Türkiye Pavyonunun ana tasarım ilkelerini de bu kavramlar oluşturmaktadır. Saydam, teknolojik bir örtü olan yapı zengin Anadolu kültürünün sürekliliğini, bir anlamda gelenekselden teknolojiye dönüşümünü simgelemektedir.” (Tanju, 2000).
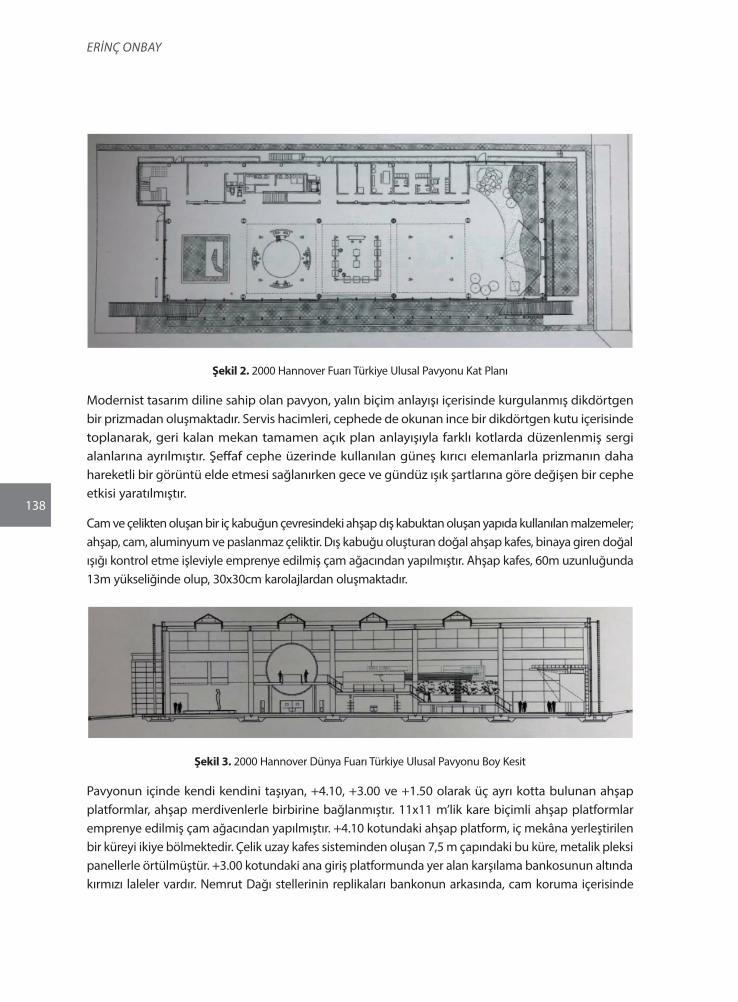
138
Erinç Onbay
Şekil 2. 2000 Hannover Fuarı Türkiye Ulusal Pavyonu Kat Planı
Modernist tasarım diline sahip olan pavyon, yalın biçim anlayışı içerisinde kurgulanmış dikdörtgen bir prizmadan oluşmaktadır. Servis hacimleri, cephede de okunan ince bir dikdörtgen kutu içerisinde toplanarak, geri kalan mekan tamamen açık plan anlayışıyla farklı kotlarda düzenlenmiş sergi alanlarına ayrılmıştır. Şeffaf cephe üzerinde kullanılan güneş kırıcı elemanlarla prizmanın daha hareketli bir görüntü elde etmesi sağlanırken gece ve gündüz ışık şartlarına göre değişen bir cephe etkisi yaratılmıştır.
Cam ve çelikten oluşan bir iç kabuğun çevresindeki ahşap dış kabuktan oluşan yapıda kullanılan malzemeler; ahşap, cam, aluminyum ve paslanmaz çeliktir. Dış kabuğu oluşturan doğal ahşap kafes, binaya giren doğal ışığı kontrol etme işleviyle emprenye edilmiş çam ağacından yapılmıştır. Ahşap kafes, 60m uzunluğunda 13m yükseliğinde olup, 30x30cm karolajlardan oluşmaktadır.
Şekil 3. 2000 Hannover Dünya Fuarı Türkiye Ulusal Pavyonu Boy Kesit
Pavyonun içinde kendi kendini taşıyan, +4.10, +3.00 ve +1.50 olarak üç ayrı kotta bulunan ahşap platformlar, ahşap merdivenlerle birbirine bağlanmıştır. 11x11 m’lik kare biçimli ahşap platformlar emprenye edilmiş çam ağacından yapılmıştır. +4.10 kotundaki ahşap platform, iç mekâna yerleştirilen bir küreyi ikiye bölmektedir. Çelik uzay kafes sisteminden oluşan 7,5 m çapındaki bu küre, metalik pleksi panellerle örtülmüştür. +3.00 kotundaki ana giriş platformunda yer alan karşılama bankosunun altında kırmızı laleler vardır. Nemrut Dağı stellerinin replikaları bankonun arkasında, cam koruma içerisinde
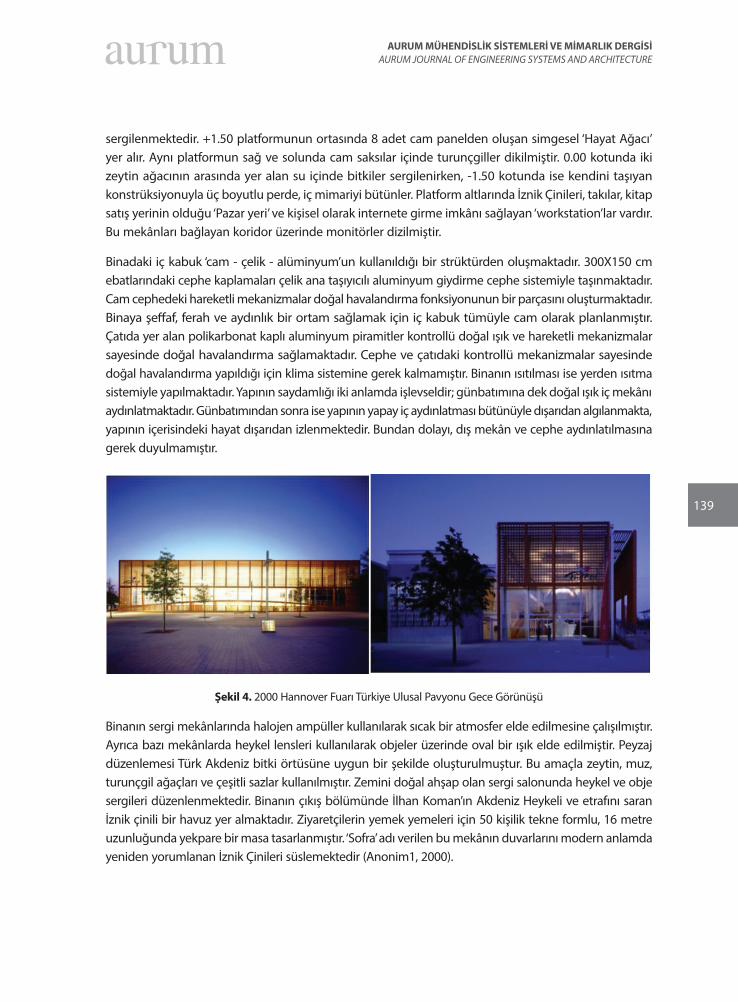
139
AURUM MÜHENDİSLİK SİSTEMLERİ VE MİMARLIK DERGİSİAURUM JOURNAL OF ENGINEERING SYSTEMS AND ARCHITECTURE
sergilenmektedir. +1.50 platformunun ortasında 8 adet cam panelden oluşan simgesel ‘Hayat Ağacı’ yer alır. Aynı platformun sağ ve solunda cam saksılar içinde turunçgiller dikilmiştir. 0.00 kotunda iki zeytin ağacının arasında yer alan su içinde bitkiler sergilenirken, -1.50 kotunda ise kendini taşıyan konstrüksiyonuyla üç boyutlu perde, iç mimariyi bütünler. Platform altlarında İznik Çinileri, takılar, kitap satış yerinin olduğu ‘Pazar yeri’ ve kişisel olarak internete girme imkânı sağlayan ‘workstation’lar vardır. Bu mekânları bağlayan koridor üzerinde monitörler dizilmiştir.
Binadaki iç kabuk ‘cam - çelik - alüminyum’un kullanıldığı bir strüktürden oluşmaktadır. 300X150 cm ebatlarındaki cephe kaplamaları çelik ana taşıyıcılı aluminyum giydirme cephe sistemiyle taşınmaktadır. Cam cephedeki hareketli mekanizmalar doğal havalandırma fonksiyonunun bir parçasını oluşturmaktadır. Binaya şeffaf, ferah ve aydınlık bir ortam sağlamak için iç kabuk tümüyle cam olarak planlanmıştır. Çatıda yer alan polikarbonat kaplı aluminyum piramitler kontrollü doğal ışık ve hareketli mekanizmalar sayesinde doğal havalandırma sağlamaktadır. Cephe ve çatıdaki kontrollü mekanizmalar sayesinde doğal havalandırma yapıldığı için klima sistemine gerek kalmamıştır. Binanın ısıtılması ise yerden ısıtma sistemiyle yapılmaktadır. Yapının saydamlığı iki anlamda işlevseldir; günbatımına dek doğal ışık iç mekânı aydınlatmaktadır. Günbatımından sonra ise yapının yapay iç aydınlatması bütünüyle dışarıdan algılanmakta, yapının içerisindeki hayat dışarıdan izlenmektedir. Bundan dolayı, dış mekân ve cephe aydınlatılmasına gerek duyulmamıştır.
Şekil 4. 2000 Hannover Fuarı Türkiye Ulusal Pavyonu Gece Görünüşü
Binanın sergi mekânlarında halojen ampüller kullanılarak sıcak bir atmosfer elde edilmesine çalışılmıştır. Ayrıca bazı mekânlarda heykel lensleri kullanılarak objeler üzerinde oval bir ışık elde edilmiştir. Peyzaj düzenlemesi Türk Akdeniz bitki örtüsüne uygun bir şekilde oluşturulmuştur. Bu amaçla zeytin, muz, turunçgil ağaçları ve çeşitli sazlar kullanılmıştır. Zemini doğal ahşap olan sergi salonunda heykel ve obje sergileri düzenlenmektedir. Binanın çıkış bölümünde İlhan Koman’ın Akdeniz Heykeli ve etrafını saran İznik çinili bir havuz yer almaktadır. Ziyaretçilerin yemek yemeleri için 50 kişilik tekne formlu, 16 metre uzunluğunda yekpare bir masa tasarlanmıştır. ‘Sofra’ adı verilen bu mekânın duvarlarını modern anlamda yeniden yorumlanan İznik Çinileri süslemektedir (Anonim1, 2000).
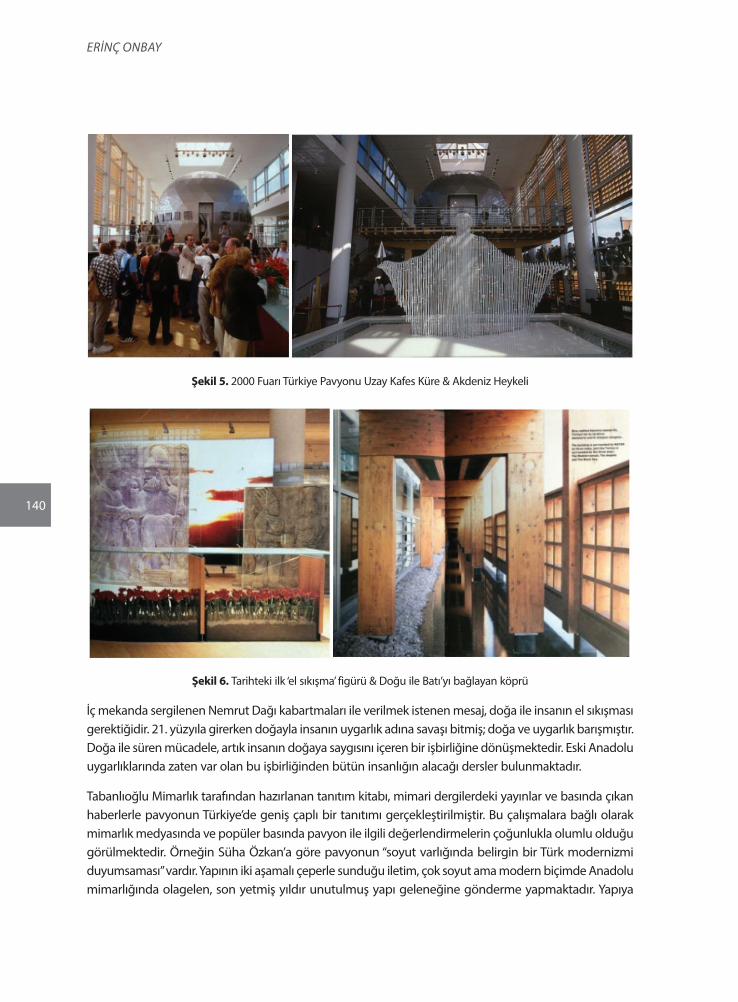
140
Erinç Onbay
Şekil 5. 2000 Fuarı Türkiye Pavyonu Uzay Kafes Küre & Akdeniz Heykeli
Şekil 6. Tarihteki ilk ‘el sıkışma’ figürü & Doğu ile Batı’yı bağlayan köprü
İç mekanda sergilenen Nemrut Dağı kabartmaları ile verilmek istenen mesaj, doğa ile insanın el sıkışması gerektiğidir. 21. yüzyıla girerken doğayla insanın uygarlık adına savaşı bitmiş; doğa ve uygarlık barışmıştır. Doğa ile süren mücadele, artık insanın doğaya saygısını içeren bir işbirliğine dönüşmektedir. Eski Anadolu uygarlıklarında zaten var olan bu işbirliğinden bütün insanlığın alacağı dersler bulunmaktadır.
Tabanlıoğlu Mimarlık tarafından hazırlanan tanıtım kitabı, mimari dergilerdeki yayınlar ve basında çıkan haberlerle pavyonun Türkiye’de geniş çaplı bir tanıtımı gerçekleştirilmiştir. Bu çalışmalara bağlı olarak mimarlık medyasında ve popüler basında pavyon ile ilgili değerlendirmelerin çoğunlukla olumlu olduğu görülmektedir. Örneğin Süha Özkan’a göre pavyonun “soyut varlığında belirgin bir Türk modernizmi duyumsaması” vardır. Yapının iki aşamalı çeperle sunduğu iletim, çok soyut ama modern biçimde Anadolu mimarlığında olagelen, son yetmiş yıldır unutulmuş yapı geleneğine gönderme yapmaktadır. Yapıya
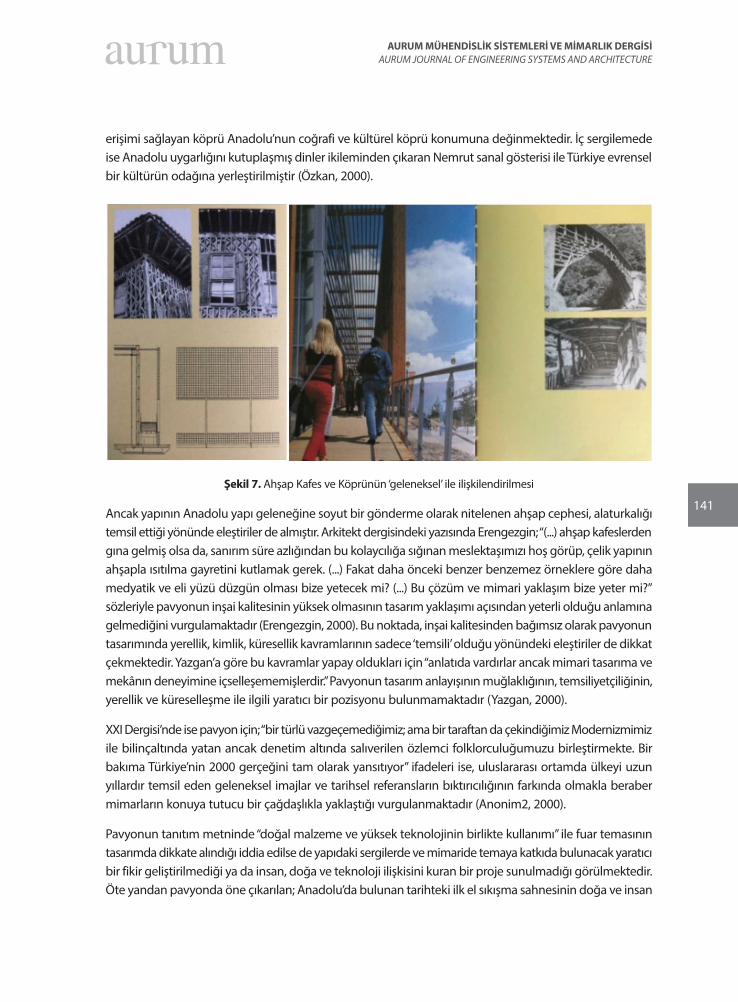
141
AURUM MÜHENDİSLİK SİSTEMLERİ VE MİMARLIK DERGİSİAURUM JOURNAL OF ENGINEERING SYSTEMS AND ARCHITECTURE
erişimi sağlayan köprü Anadolu’nun coğrafi ve kültürel köprü konumuna değinmektedir. İç sergilemede ise Anadolu uygarlığını kutuplaşmış dinler ikileminden çıkaran Nemrut sanal gösterisi ile Türkiye evrensel bir kültürün odağına yerleştirilmiştir (Özkan, 2000).
Şekil 7. Ahşap Kafes ve Köprünün ‘geleneksel’ ile ilişkilendirilmesi
Ancak yapının Anadolu yapı geleneğine soyut bir gönderme olarak nitelenen ahşap cephesi, alaturkalığı temsil ettiği yönünde eleştiriler de almıştır. Arkitekt dergisindeki yazısında Erengezgin; “(...) ahşap kafeslerden gına gelmiş olsa da, sanırım süre azlığından bu kolaycılığa sığınan meslektaşımızı hoş görüp, çelik yapının ahşapla ısıtılma gayretini kutlamak gerek. (...) Fakat daha önceki benzer benzemez örneklere göre daha medyatik ve eli yüzü düzgün olması bize yetecek mi? (...) Bu çözüm ve mimari yaklaşım bize yeter mi?” sözleriyle pavyonun inşai kalitesinin yüksek olmasının tasarım yaklaşımı açısından yeterli olduğu anlamına gelmediğini vurgulamaktadır (Erengezgin, 2000). Bu noktada, inşai kalitesinden bağımsız olarak pavyonun tasarımında yerellik, kimlik, küresellik kavramlarının sadece ‘temsili’ olduğu yönündeki eleştiriler de dikkat çekmektedir. Yazgan’a göre bu kavramlar yapay oldukları için “anlatıda vardırlar ancak mimari tasarıma ve mekânın deneyimine içselleşememişlerdir.” Pavyonun tasarım anlayışının muğlaklığının, temsiliyetçiliğinin, yerellik ve küreselleşme ile ilgili yaratıcı bir pozisyonu bulunmamaktadır (Yazgan, 2000).
XXI Dergisi’nde ise pavyon için; “bir türlü vazgeçemediğimiz; ama bir taraftan da çekindiğimiz Modernizmimiz ile bilinçaltında yatan ancak denetim altında salıverilen özlemci folklorculuğumuzu birleştirmekte. Bir bakıma Türkiye’nin 2000 gerçeğini tam olarak yansıtıyor” ifadeleri ise, uluslararası ortamda ülkeyi uzun yıllardır temsil eden geleneksel imajlar ve tarihsel referansların bıktırıcılığının farkında olmakla beraber mimarların konuya tutucu bir çağdaşlıkla yaklaştığı vurgulanmaktadır (Anonim2, 2000).
Pavyonun tanıtım metninde “doğal malzeme ve yüksek teknolojinin birlikte kullanımı” ile fuar temasının tasarımda dikkate alındığı iddia edilse de yapıdaki sergilerde ve mimaride temaya katkıda bulunacak yaratıcı bir fikir geliştirilmediği ya da insan, doğa ve teknoloji ilişkisini kuran bir proje sunulmadığı görülmektedir. Öte yandan pavyonda öne çıkarılan; Anadolu’da bulunan tarihteki ilk el sıkışma sahnesinin doğa ve insan
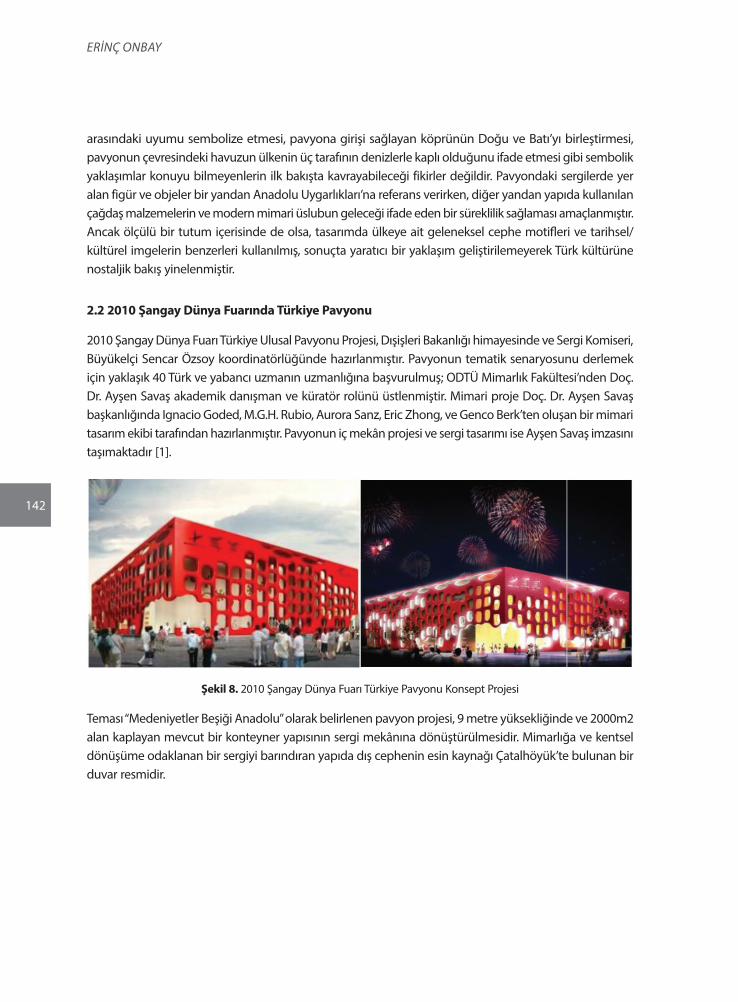
142
Erinç Onbay
arasındaki uyumu sembolize etmesi, pavyona girişi sağlayan köprünün Doğu ve Batı’yı birleştirmesi, pavyonun çevresindeki havuzun ülkenin üç tarafının denizlerle kaplı olduğunu ifade etmesi gibi sembolik yaklaşımlar konuyu bilmeyenlerin ilk bakışta kavrayabileceği fikirler değildir. Pavyondaki sergilerde yer alan figür ve objeler bir yandan Anadolu Uygarlıkları’na referans verirken, diğer yandan yapıda kullanılan çağdaş malzemelerin ve modern mimari üslubun geleceği ifade eden bir süreklilik sağlaması amaçlanmıştır. Ancak ölçülü bir tutum içerisinde de olsa, tasarımda ülkeye ait geleneksel cephe motifleri ve tarihsel/kültürel imgelerin benzerleri kullanılmış, sonuçta yaratıcı bir yaklaşım geliştirilemeyerek Türk kültürüne nostaljik bakış yinelenmiştir.
2.2 2010 Şangay Dünya Fuarında Türkiye Pavyonu
2010 Şangay Dünya Fuarı Türkiye Ulusal Pavyonu Projesi, Dışişleri Bakanlığı himayesinde ve Sergi Komiseri, Büyükelçi Sencar Özsoy koordinatörlüğünde hazırlanmıştır. Pavyonun tematik senaryosunu derlemek için yaklaşık 40 Türk ve yabancı uzmanın uzmanlığına başvurulmuş; ODTÜ Mimarlık Fakültesi’nden Doç. Dr. Ayşen Savaş akademik danışman ve küratör rolünü üstlenmiştir. Mimari proje Doç. Dr. Ayşen Savaş başkanlığında Ignacio Goded, M.G.H. Rubio, Aurora Sanz, Eric Zhong, ve Genco Berk’ten oluşan bir mimari tasarım ekibi tarafından hazırlanmıştır. Pavyonun iç mekân projesi ve sergi tasarımı ise Ayşen Savaş imzasını taşımaktadır [1].
Şekil 8. 2010 Şangay Dünya Fuarı Türkiye Pavyonu Konsept Projesi
Teması “Medeniyetler Beşiği Anadolu” olarak belirlenen pavyon projesi, 9 metre yüksekliğinde ve 2000m2 alan kaplayan mevcut bir konteyner yapısının sergi mekânına dönüştürülmesidir. Mimarlığa ve kentsel dönüşüme odaklanan bir sergiyi barındıran yapıda dış cephenin esin kaynağı Çatalhöyük’te bulunan bir duvar resmidir.
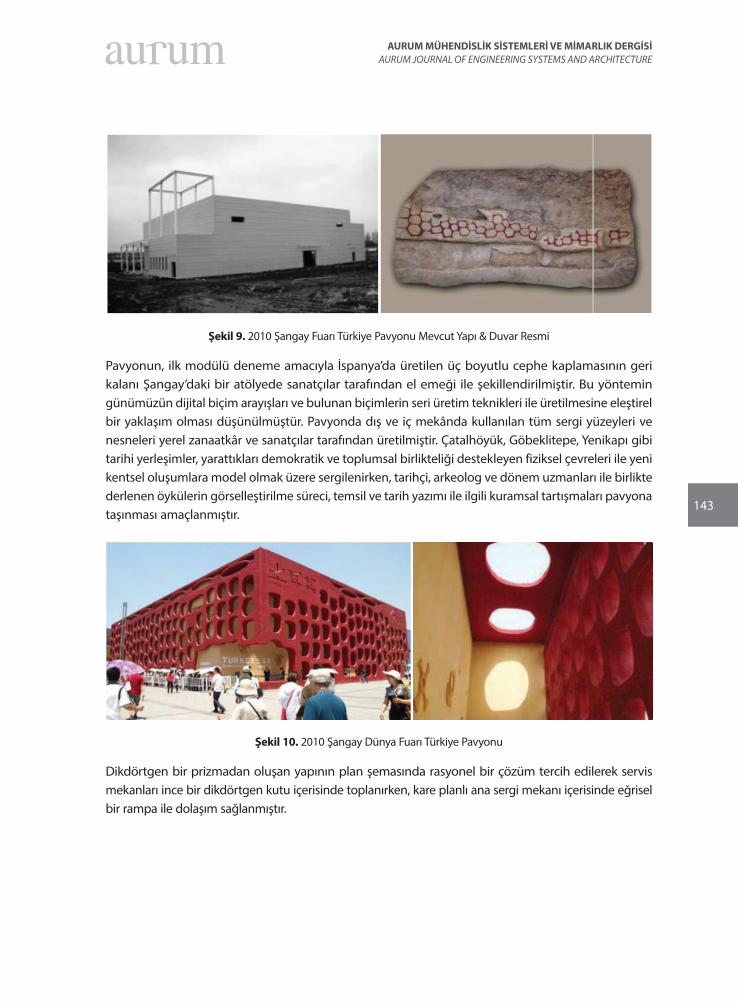
143
AURUM MÜHENDİSLİK SİSTEMLERİ VE MİMARLIK DERGİSİAURUM JOURNAL OF ENGINEERING SYSTEMS AND ARCHITECTURE
Şekil 9. 2010 Şangay Fuarı Türkiye Pavyonu Mevcut Yapı & Duvar Resmi
Pavyonun, ilk modülü deneme amacıyla İspanya’da üretilen üç boyutlu cephe kaplamasının geri kalanı Şangay’daki bir atölyede sanatçılar tarafından el emeği ile şekillendirilmiştir. Bu yöntemin günümüzün dijital biçim arayışları ve bulunan biçimlerin seri üretim teknikleri ile üretilmesine eleştirel bir yaklaşım olması düşünülmüştür. Pavyonda dış ve iç mekânda kullanılan tüm sergi yüzeyleri ve nesneleri yerel zanaatkâr ve sanatçılar tarafından üretilmiştir. Çatalhöyük, Göbeklitepe, Yenikapı gibi tarihi yerleşimler, yarattıkları demokratik ve toplumsal birlikteliği destekleyen fiziksel çevreleri ile yeni kentsel oluşumlara model olmak üzere sergilenirken, tarihçi, arkeolog ve dönem uzmanları ile birlikte derlenen öykülerin görselleştirilme süreci, temsil ve tarih yazımı ile ilgili kuramsal tartışmaları pavyona taşınması amaçlanmıştır.
Şekil 10. 2010 Şangay Dünya Fuarı Türkiye Pavyonu
Dikdörtgen bir prizmadan oluşan yapının plan şemasında rasyonel bir çözüm tercih edilerek servis mekanları ince bir dikdörtgen kutu içerisinde toplanırken, kare planlı ana sergi mekanı içerisinde eğrisel bir rampa ile dolaşım sağlanmıştır.
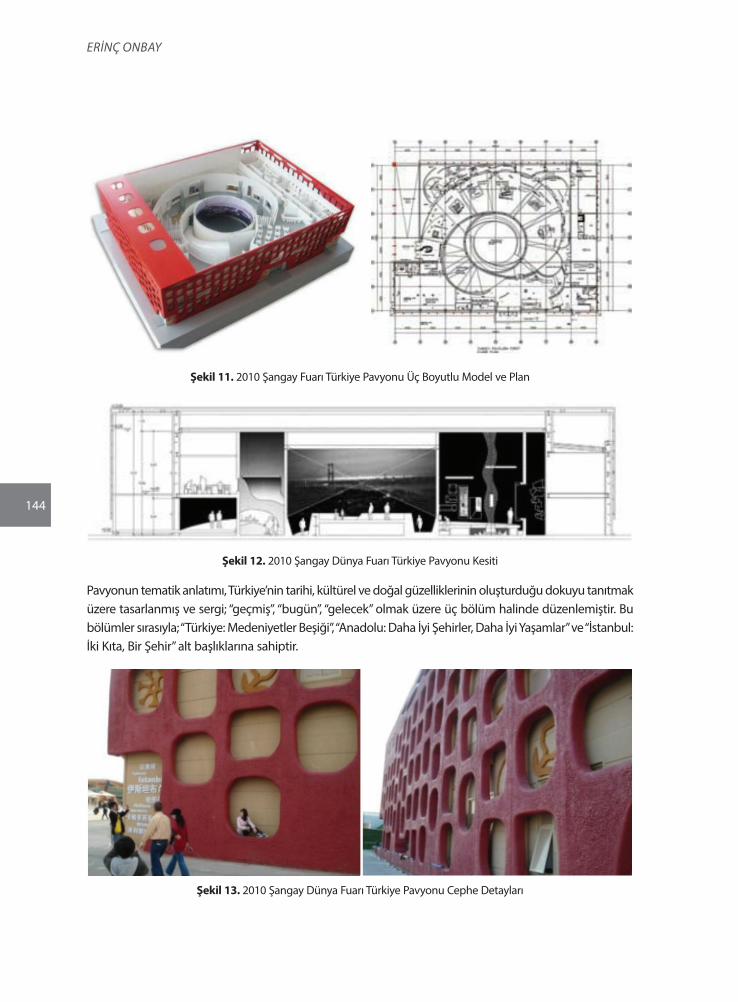
144
Erinç Onbay
Şekil 11. 2010 Şangay Fuarı Türkiye Pavyonu Üç Boyutlu Model ve Plan
Şekil 12. 2010 Şangay Dünya Fuarı Türkiye Pavyonu Kesiti
Pavyonun tematik anlatımı, Türkiye’nin tarihi, kültürel ve doğal güzelliklerinin oluşturduğu dokuyu tanıtmak üzere tasarlanmış ve sergi; “geçmiş”, “bugün”, “gelecek” olmak üzere üç bölüm halinde düzenlemiştir. Bu bölümler sırasıyla; “Türkiye: Medeniyetler Beşiği”, “Anadolu: Daha İyi Şehirler, Daha İyi Yaşamlar” ve “İstanbul: İki Kıta, Bir Şehir” alt başlıklarına sahiptir.
Şekil 13. 2010 Şangay Dünya Fuarı Türkiye Pavyonu Cephe Detayları
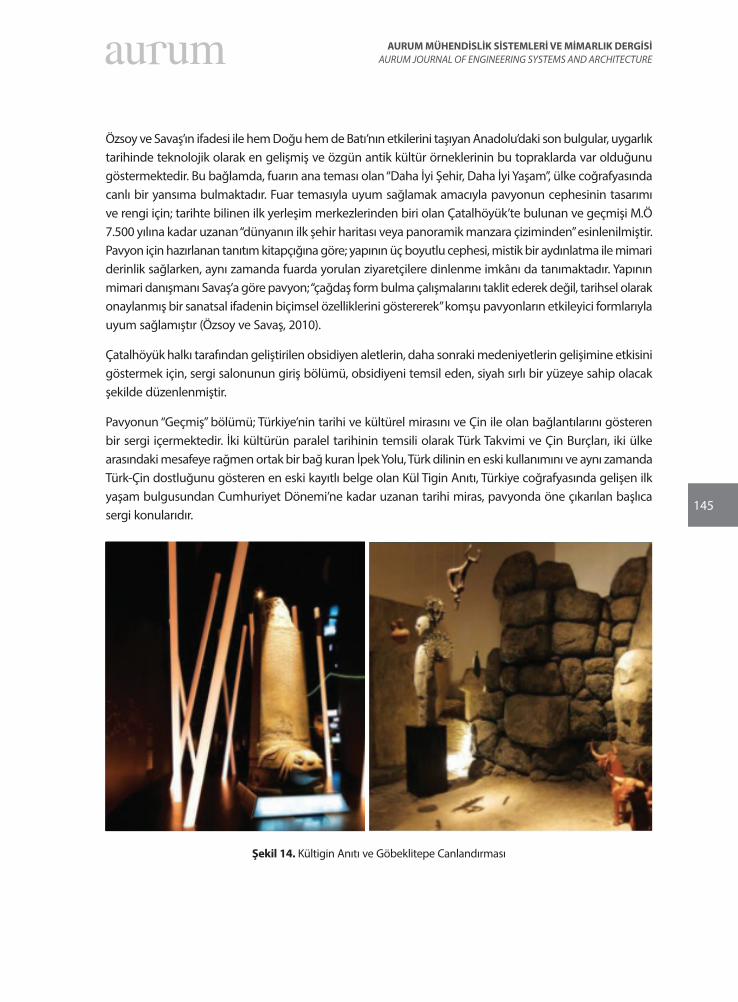
145
AURUM MÜHENDİSLİK SİSTEMLERİ VE MİMARLIK DERGİSİAURUM JOURNAL OF ENGINEERING SYSTEMS AND ARCHITECTURE
Özsoy ve Savaş’ın ifadesi ile hem Doğu hem de Batı’nın etkilerini taşıyan Anadolu’daki son bulgular, uygarlık tarihinde teknolojik olarak en gelişmiş ve özgün antik kültür örneklerinin bu topraklarda var olduğunu göstermektedir. Bu bağlamda, fuarın ana teması olan “Daha İyi Şehir, Daha İyi Yaşam”, ülke coğrafyasında canlı bir yansıma bulmaktadır. Fuar temasıyla uyum sağlamak amacıyla pavyonun cephesinin tasarımı ve rengi için; tarihte bilinen ilk yerleşim merkezlerinden biri olan Çatalhöyük’te bulunan ve geçmişi M.Ö 7.500 yılına kadar uzanan “dünyanın ilk şehir haritası veya panoramik manzara çiziminden” esinlenilmiştir. Pavyon için hazırlanan tanıtım kitapçığına göre; yapının üç boyutlu cephesi, mistik bir aydınlatma ile mimari derinlik sağlarken, aynı zamanda fuarda yorulan ziyaretçilere dinlenme imkânı da tanımaktadır. Yapının mimari danışmanı Savaş’a göre pavyon; “çağdaş form bulma çalışmalarını taklit ederek değil, tarihsel olarak onaylanmış bir sanatsal ifadenin biçimsel özelliklerini göstererek” komşu pavyonların etkileyici formlarıyla uyum sağlamıştır (Özsoy ve Savaş, 2010).
Çatalhöyük halkı tarafından geliştirilen obsidiyen aletlerin, daha sonraki medeniyetlerin gelişimine etkisini göstermek için, sergi salonunun giriş bölümü, obsidiyeni temsil eden, siyah sırlı bir yüzeye sahip olacak şekilde düzenlenmiştir.
Pavyonun “Geçmiş” bölümü; Türkiye’nin tarihi ve kültürel mirasını ve Çin ile olan bağlantılarını gösteren bir sergi içermektedir. İki kültürün paralel tarihinin temsili olarak Türk Takvimi ve Çin Burçları, iki ülke arasındaki mesafeye rağmen ortak bir bağ kuran İpek Yolu, Türk dilinin en eski kullanımını ve aynı zamanda Türk-Çin dostluğunu gösteren en eski kayıtlı belge olan Kül Tigin Anıtı, Türkiye coğrafyasında gelişen ilk yaşam bulgusundan Cumhuriyet Dönemi’ne kadar uzanan tarihi miras, pavyonda öne çıkarılan başlıca sergi konularıdır.
Şekil 14. Kültigin Anıtı ve Göbeklitepe Canlandırması
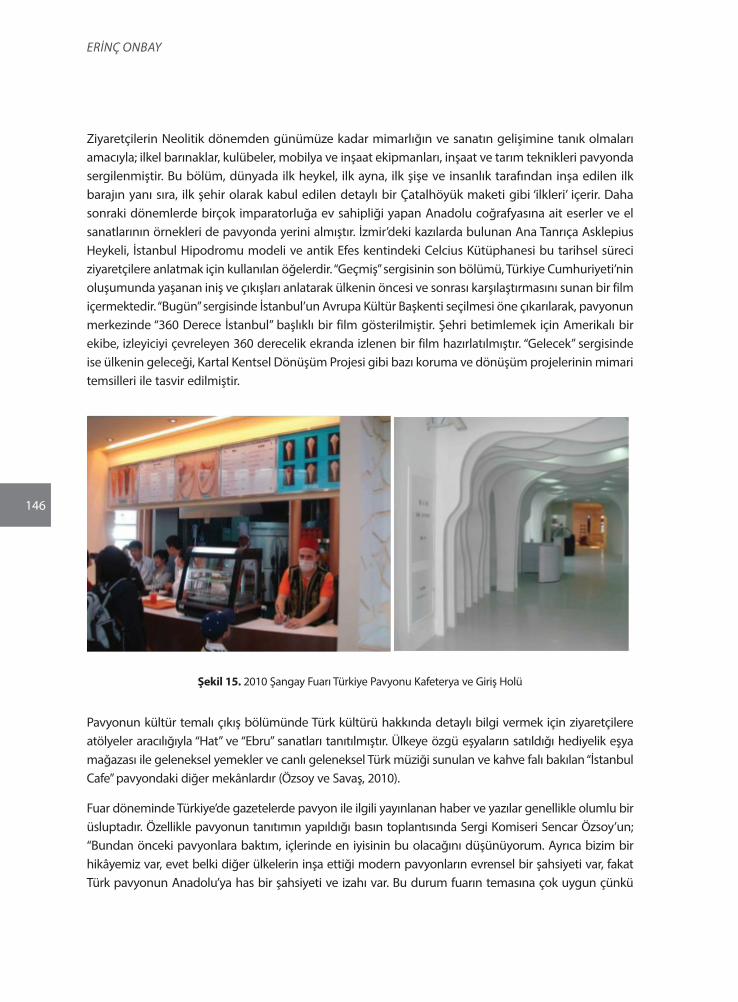
146
Erinç Onbay
Ziyaretçilerin Neolitik dönemden günümüze kadar mimarlığın ve sanatın gelişimine tanık olmaları amacıyla; ilkel barınaklar, kulübeler, mobilya ve inşaat ekipmanları, inşaat ve tarım teknikleri pavyonda sergilenmiştir. Bu bölüm, dünyada ilk heykel, ilk ayna, ilk şişe ve insanlık tarafından inşa edilen ilk barajın yanı sıra, ilk şehir olarak kabul edilen detaylı bir Çatalhöyük maketi gibi ‘ilkleri’ içerir. Daha sonraki dönemlerde birçok imparatorluğa ev sahipliği yapan Anadolu coğrafyasına ait eserler ve el sanatlarının örnekleri de pavyonda yerini almıştır. İzmir’deki kazılarda bulunan Ana Tanrıça Asklepius Heykeli, İstanbul Hipodromu modeli ve antik Efes kentindeki Celcius Kütüphanesi bu tarihsel süreci ziyaretçilere anlatmak için kullanılan öğelerdir. “Geçmiş” sergisinin son bölümü, Türkiye Cumhuriyeti’nin oluşumunda yaşanan iniş ve çıkışları anlatarak ülkenin öncesi ve sonrası karşılaştırmasını sunan bir film içermektedir. “Bugün” sergisinde İstanbul’un Avrupa Kültür Başkenti seçilmesi öne çıkarılarak, pavyonun merkezinde “360 Derece İstanbul” başlıklı bir film gösterilmiştir. Şehri betimlemek için Amerikalı bir ekibe, izleyiciyi çevreleyen 360 derecelik ekranda izlenen bir film hazırlatılmıştır. “Gelecek” sergisinde ise ülkenin geleceği, Kartal Kentsel Dönüşüm Projesi gibi bazı koruma ve dönüşüm projelerinin mimari temsilleri ile tasvir edilmiştir.
Şekil 15. 2010 Şangay Fuarı Türkiye Pavyonu Kafeterya ve Giriş Holü
Pavyonun kültür temalı çıkış bölümünde Türk kültürü hakkında detaylı bilgi vermek için ziyaretçilere atölyeler aracılığıyla “Hat” ve “Ebru” sanatları tanıtılmıştır. Ülkeye özgü eşyaların satıldığı hediyelik eşya mağazası ile geleneksel yemekler ve canlı geleneksel Türk müziği sunulan ve kahve falı bakılan “İstanbul Cafe” pavyondaki diğer mekânlardır (Özsoy ve Savaş, 2010).
Fuar döneminde Türkiye’de gazetelerde pavyon ile ilgili yayınlanan haber ve yazılar genellikle olumlu bir üsluptadır. Özellikle pavyonun tanıtımın yapıldığı basın toplantısında Sergi Komiseri Sencar Özsoy’un; “Bundan önceki pavyonlara baktım, içlerinde en iyisinin bu olacağını düşünüyorum. Ayrıca bizim bir hikâyemiz var, evet belki diğer ülkelerin inşa ettiği modern pavyonların evrensel bir şahsiyeti var, fakat Türk pavyonun Anadolu’ya has bir şahsiyeti ve izahı var. Bu durum fuarın temasına çok uygun çünkü
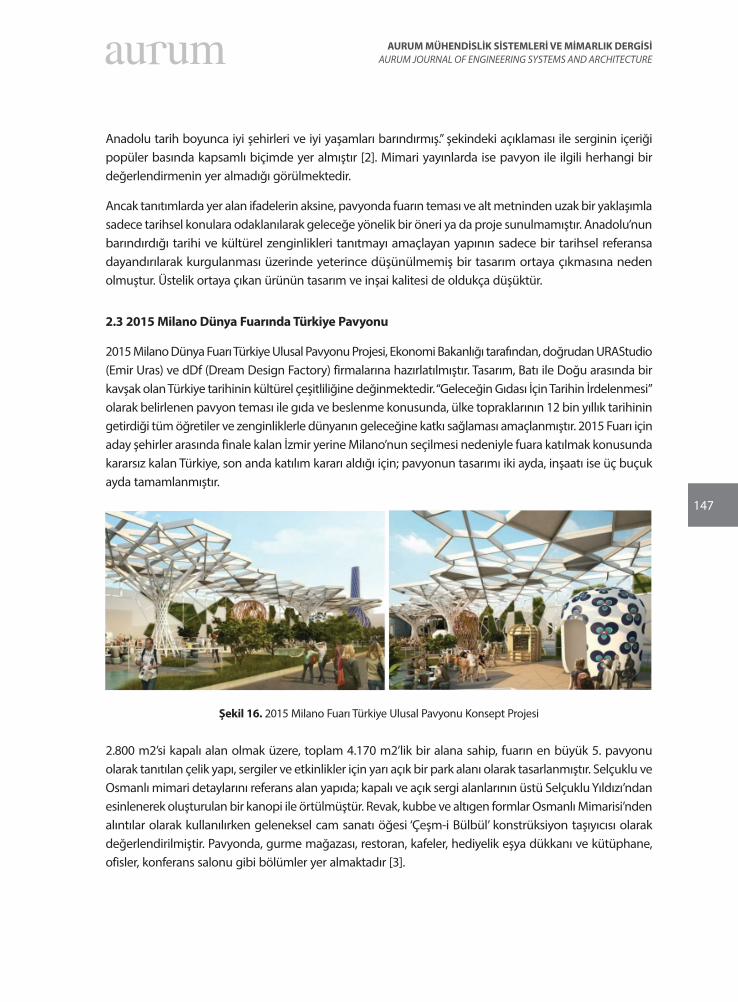
147
AURUM MÜHENDİSLİK SİSTEMLERİ VE MİMARLIK DERGİSİAURUM JOURNAL OF ENGINEERING SYSTEMS AND ARCHITECTURE
Anadolu tarih boyunca iyi şehirleri ve iyi yaşamları barındırmış.” şekindeki açıklaması ile serginin içeriği popüler basında kapsamlı biçimde yer almıştır [2]. Mimari yayınlarda ise pavyon ile ilgili herhangi bir değerlendirmenin yer almadığı görülmektedir.
Ancak tanıtımlarda yer alan ifadelerin aksine, pavyonda fuarın teması ve alt metninden uzak bir yaklaşımla sadece tarihsel konulara odaklanılarak geleceğe yönelik bir öneri ya da proje sunulmamıştır. Anadolu’nun barındırdığı tarihi ve kültürel zenginlikleri tanıtmayı amaçlayan yapının sadece bir tarihsel referansa dayandırılarak kurgulanması üzerinde yeterince düşünülmemiş bir tasarım ortaya çıkmasına neden olmuştur. Üstelik ortaya çıkan ürünün tasarım ve inşai kalitesi de oldukça düşüktür.
2.3 2015 Milano Dünya Fuarında Türkiye Pavyonu
2015 Milano Dünya Fuarı Türkiye Ulusal Pavyonu Projesi, Ekonomi Bakanlığı tarafından, doğrudan URAStudio (Emir Uras) ve dDf (Dream Design Factory) firmalarına hazırlatılmıştır. Tasarım, Batı ile Doğu arasında bir kavşak olan Türkiye tarihinin kültürel çeşitliliğine değinmektedir. “Geleceğin Gıdası İçin Tarihin İrdelenmesi” olarak belirlenen pavyon teması ile gıda ve beslenme konusunda, ülke topraklarının 12 bin yıllık tarihinin getirdiği tüm öğretiler ve zenginliklerle dünyanın geleceğine katkı sağlaması amaçlanmıştır. 2015 Fuarı için aday şehirler arasında finale kalan İzmir yerine Milano’nun seçilmesi nedeniyle fuara katılmak konusunda kararsız kalan Türkiye, son anda katılım kararı aldığı için; pavyonun tasarımı iki ayda, inşaatı ise üç buçuk ayda tamamlanmıştır.
Şekil 16. 2015 Milano Fuarı Türkiye Ulusal Pavyonu Konsept Projesi
2.800 m2’si kapalı alan olmak üzere, toplam 4.170 m2’lik bir alana sahip, fuarın en büyük 5. pavyonu olarak tanıtılan çelik yapı, sergiler ve etkinlikler için yarı açık bir park alanı olarak tasarlanmıştır. Selçuklu ve Osmanlı mimari detaylarını referans alan yapıda; kapalı ve açık sergi alanlarının üstü Selçuklu Yıldızı’ndan esinlenerek oluşturulan bir kanopi ile örtülmüştür. Revak, kubbe ve altıgen formlar Osmanlı Mimarisi’nden alıntılar olarak kullanılırken geleneksel cam sanatı öğesi ‘Çeşm-i Bülbül’ konstrüksiyon taşıyıcısı olarak değerlendirilmiştir. Pavyonda, gurme mağazası, restoran, kafeler, hediyelik eşya dükkanı ve kütüphane, ofisler, konferans salonu gibi bölümler yer almaktadır [3].
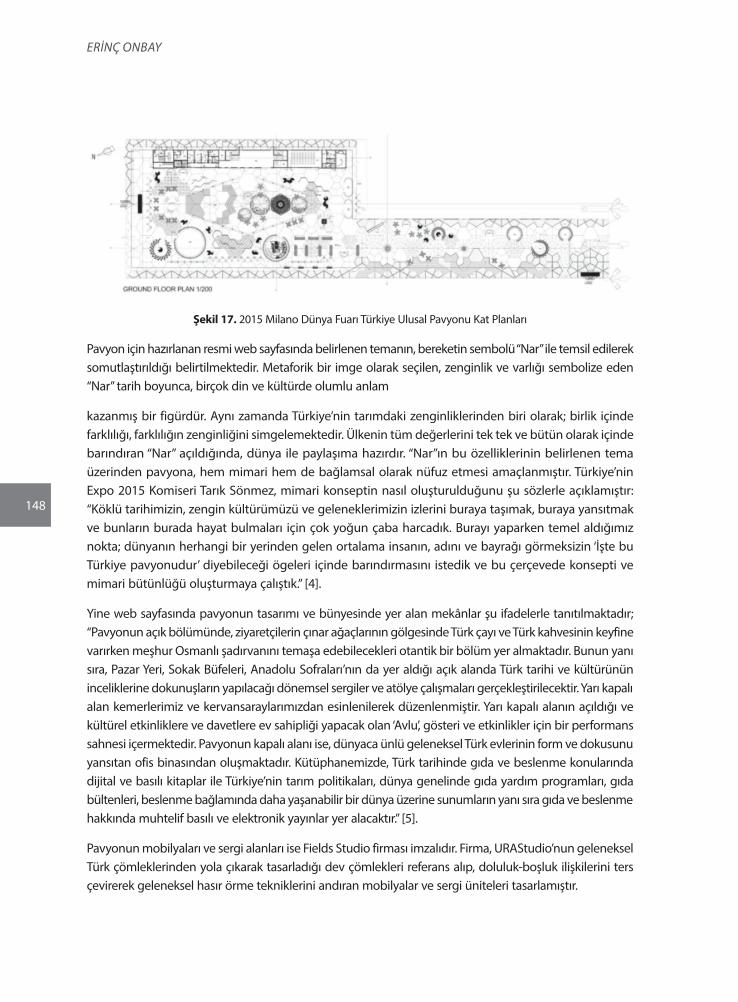
148
Erinç Onbay
Şekil 17. 2015 Milano Dünya Fuarı Türkiye Ulusal Pavyonu Kat Planları
Pavyon için hazırlanan resmi web sayfasında belirlenen temanın, bereketin sembolü “Nar” ile temsil edilerek somutlaştırıldığı belirtilmektedir. Metaforik bir imge olarak seçilen, zenginlik ve varlığı sembolize eden “Nar” tarih boyunca, birçok din ve kültürde olumlu anlam
kazanmış bir figürdür. Aynı zamanda Türkiye’nin tarımdaki zenginliklerinden biri olarak; birlik içinde farklılığı, farklılığın zenginliğini simgelemektedir. Ülkenin tüm değerlerini tek tek ve bütün olarak içinde barındıran “Nar” açıldığında, dünya ile paylaşıma hazırdır. “Nar”ın bu özelliklerinin belirlenen tema üzerinden pavyona, hem mimari hem de bağlamsal olarak nüfuz etmesi amaçlanmıştır. Türkiye’nin Expo 2015 Komiseri Tarık Sönmez, mimari konseptin nasıl oluşturulduğunu şu sözlerle açıklamıştır: “Köklü tarihimizin, zengin kültürümüzü ve geleneklerimizin izlerini buraya taşımak, buraya yansıtmak ve bunların burada hayat bulmaları için çok yoğun çaba harcadık. Burayı yaparken temel aldığımız nokta; dünyanın herhangi bir yerinden gelen ortalama insanın, adını ve bayrağı görmeksizin ‘İşte bu Türkiye pavyonudur’ diyebileceği ögeleri içinde barındırmasını istedik ve bu çerçevede konsepti ve mimari bütünlüğü oluşturmaya çalıştık.” [4].
Yine web sayfasında pavyonun tasarımı ve bünyesinde yer alan mekânlar şu ifadelerle tanıtılmaktadır; “Pavyonun açık bölümünde, ziyaretçilerin çınar ağaçlarının gölgesinde Türk çayı ve Türk kahvesinin keyfine varırken meşhur Osmanlı şadırvanını temaşa edebilecekleri otantik bir bölüm yer almaktadır. Bunun yanı sıra, Pazar Yeri, Sokak Büfeleri, Anadolu Sofraları’nın da yer aldığı açık alanda Türk tarihi ve kültürünün inceliklerine dokunuşların yapılacağı dönemsel sergiler ve atölye çalışmaları gerçekleştirilecektir. Yarı kapalı alan kemerlerimiz ve kervansaraylarımızdan esinlenilerek düzenlenmiştir. Yarı kapalı alanın açıldığı ve kültürel etkinliklere ve davetlere ev sahipliği yapacak olan ‘Avlu’, gösteri ve etkinlikler için bir performans sahnesi içermektedir. Pavyonun kapalı alanı ise, dünyaca ünlü geleneksel Türk evlerinin form ve dokusunu yansıtan ofis binasından oluşmaktadır. Kütüphanemizde, Türk tarihinde gıda ve beslenme konularında dijital ve basılı kitaplar ile Türkiye’nin tarım politikaları, dünya genelinde gıda yardım programları, gıda bültenleri, beslenme bağlamında daha yaşanabilir bir dünya üzerine sunumların yanı sıra gıda ve beslenme hakkında muhtelif basılı ve elektronik yayınlar yer alacaktır.” [5].
Pavyonun mobilyaları ve sergi alanları ise Fields Studio firması imzalıdır. Firma, URAStudio’nun geleneksel Türk çömleklerinden yola çıkarak tasarladığı dev çömlekleri referans alıp, doluluk-boşluk ilişkilerini ters çevirerek geleneksel hasır örme tekniklerini andıran mobilyalar ve sergi üniteleri tasarlamıştır.
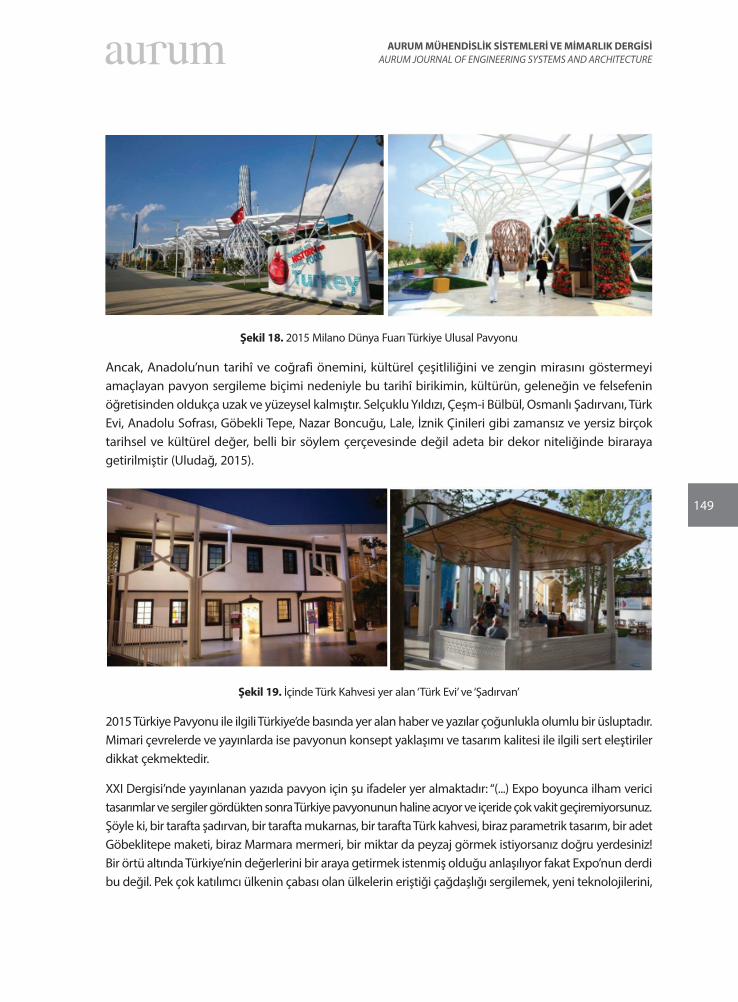
149
AURUM MÜHENDİSLİK SİSTEMLERİ VE MİMARLIK DERGİSİAURUM JOURNAL OF ENGINEERING SYSTEMS AND ARCHITECTURE
Şekil 18. 2015 Milano Dünya Fuarı Türkiye Ulusal Pavyonu
Ancak, Anadolu’nun tarihî ve coğrafi önemini, kültürel çeşitliliğini ve zengin mirasını göstermeyi amaçlayan pavyon sergileme biçimi nedeniyle bu tarihî birikimin, kültürün, geleneğin ve felsefenin öğretisinden oldukça uzak ve yüzeysel kalmıştır. Selçuklu Yıldızı, Çeşm-i Bülbül, Osmanlı Şadırvanı, Türk Evi, Anadolu Sofrası, Göbekli Tepe, Nazar Boncuğu, Lale, İznik Çinileri gibi zamansız ve yersiz birçok tarihsel ve kültürel değer, belli bir söylem çerçevesinde değil adeta bir dekor niteliğinde biraraya getirilmiştir (Uludağ, 2015).
Şekil 19. İçinde Türk Kahvesi yer alan ‘Türk Evi’ ve ‘Şadırvan’
2015 Türkiye Pavyonu ile ilgili Türkiye’de basında yer alan haber ve yazılar çoğunlukla olumlu bir üsluptadır. Mimari çevrelerde ve yayınlarda ise pavyonun konsept yaklaşımı ve tasarım kalitesi ile ilgili sert eleştiriler dikkat çekmektedir.
XXI Dergisi’nde yayınlanan yazıda pavyon için şu ifadeler yer almaktadır: “(...) Expo boyunca ilham verici tasarımlar ve sergiler gördükten sonra Türkiye pavyonunun haline acıyor ve içeride çok vakit geçiremiyorsunuz. Şöyle ki, bir tarafta şadırvan, bir tarafta mukarnas, bir tarafta Türk kahvesi, biraz parametrik tasarım, bir adet Göbeklitepe maketi, biraz Marmara mermeri, bir miktar da peyzaj görmek istiyorsanız doğru yerdesiniz! Bir örtü altında Türkiye’nin değerlerini bir araya getirmek istenmiş olduğu anlaşılıyor fakat Expo’nun derdi bu değil. Pek çok katılımcı ülkenin çabası olan ülkelerin eriştiği çağdaşlığı sergilemek, yeni teknolojilerini,
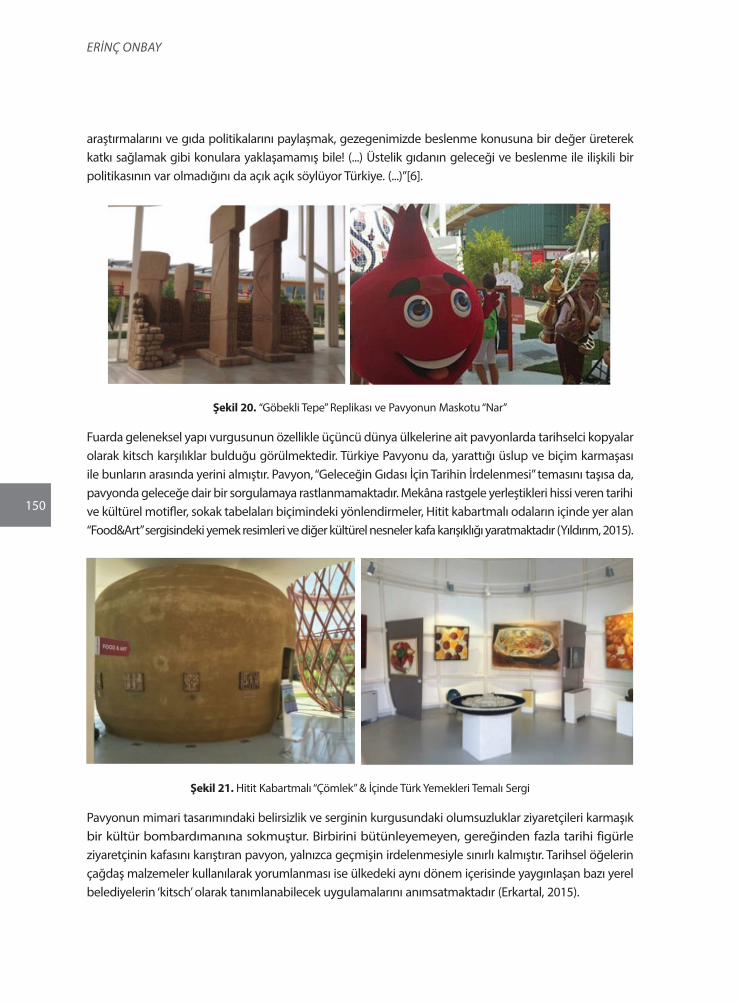
150
Erinç Onbay
araştırmalarını ve gıda politikalarını paylaşmak, gezegenimizde beslenme konusuna bir değer üreterek katkı sağlamak gibi konulara yaklaşamamış bile! (...) Üstelik gıdanın geleceği ve beslenme ile ilişkili bir politikasının var olmadığını da açık açık söylüyor Türkiye. (...)”[6].
Şekil 20. “Göbekli Tepe” Replikası ve Pavyonun Maskotu “Nar”
Fuarda geleneksel yapı vurgusunun özellikle üçüncü dünya ülkelerine ait pavyonlarda tarihselci kopyalar olarak kitsch karşılıklar bulduğu görülmektedir. Türkiye Pavyonu da, yarattığı üslup ve biçim karmaşası ile bunların arasında yerini almıştır. Pavyon, “Geleceğin Gıdası İçin Tarihin İrdelenmesi” temasını taşısa da, pavyonda geleceğe dair bir sorgulamaya rastlanmamaktadır. Mekâna rastgele yerleştikleri hissi veren tarihi ve kültürel motifler, sokak tabelaları biçimindeki yönlendirmeler, Hitit kabartmalı odaların içinde yer alan “Food&Art” sergisindeki yemek resimleri ve diğer kültürel nesneler kafa karışıklığı yaratmaktadır (Yıldırım, 2015).
Şekil 21. Hitit Kabartmalı “Çömlek” & İçinde Türk Yemekleri Temalı Sergi
Pavyonun mimari tasarımındaki belirsizlik ve serginin kurgusundaki olumsuzluklar ziyaretçileri karmaşık bir kültür bombardımanına sokmuştur. Birbirini bütünleyemeyen, gereğinden fazla tarihi figürle ziyaretçinin kafasını karıştıran pavyon, yalnızca geçmişin irdelenmesiyle sınırlı kalmıştır. Tarihsel öğelerin çağdaş malzemeler kullanılarak yorumlanması ise ülkedeki aynı dönem içerisinde yaygınlaşan bazı yerel belediyelerin ‘kitsch’ olarak tanımlanabilecek uygulamalarını anımsatmaktadır (Erkartal, 2015).
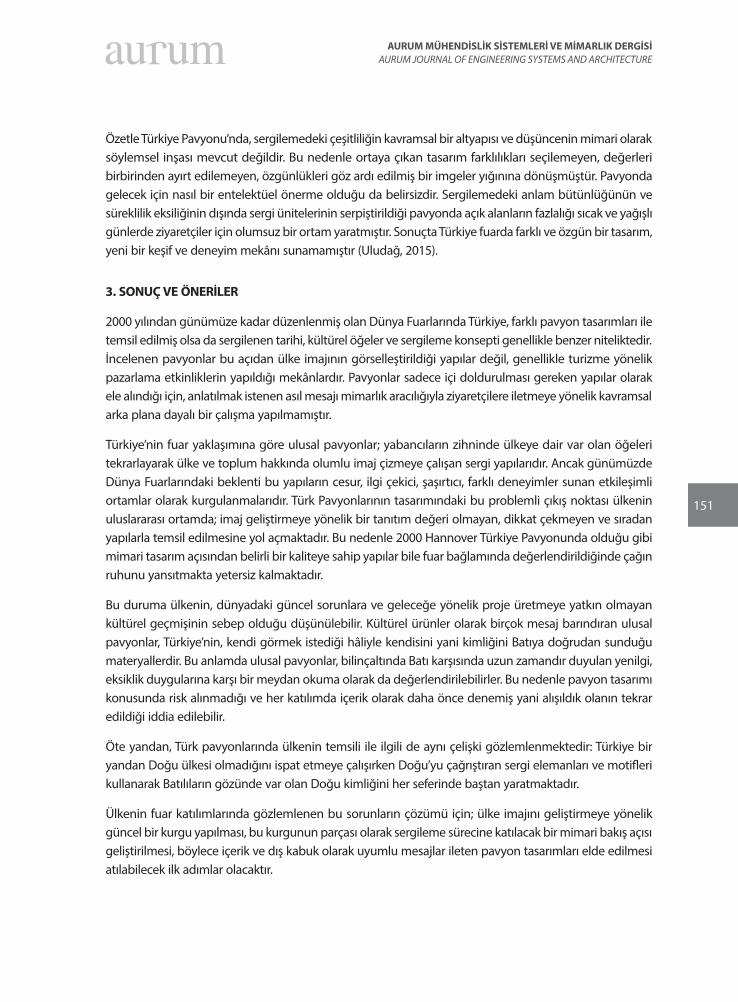
151
AURUM MÜHENDİSLİK SİSTEMLERİ VE MİMARLIK DERGİSİAURUM JOURNAL OF ENGINEERING SYSTEMS AND ARCHITECTURE
Özetle Türkiye Pavyonu’nda, sergilemedeki çeşitliliğin kavramsal bir altyapısı ve düşüncenin mimari olarak söylemsel inşası mevcut değildir. Bu nedenle ortaya çıkan tasarım farklılıkları seçilemeyen, değerleri birbirinden ayırt edilemeyen, özgünlükleri göz ardı edilmiş bir imgeler yığınına dönüşmüştür. Pavyonda gelecek için nasıl bir entelektüel önerme olduğu da belirsizdir. Sergilemedeki anlam bütünlüğünün ve süreklilik eksiliğinin dışında sergi ünitelerinin serpiştirildiği pavyonda açık alanların fazlalığı sıcak ve yağışlı günlerde ziyaretçiler için olumsuz bir ortam yaratmıştır. Sonuçta Türkiye fuarda farklı ve özgün bir tasarım, yeni bir keşif ve deneyim mekânı sunamamıştır (Uludağ, 2015).
3. SONUÇ VE ÖNERİLER
2000 yılından günümüze kadar düzenlenmiş olan Dünya Fuarlarında Türkiye, farklı pavyon tasarımları ile temsil edilmiş olsa da sergilenen tarihi, kültürel öğeler ve sergileme konsepti genellikle benzer niteliktedir. İncelenen pavyonlar bu açıdan ülke imajının görselleştirildiği yapılar değil, genellikle turizme yönelik pazarlama etkinliklerin yapıldığı mekânlardır. Pavyonlar sadece içi doldurulması gereken yapılar olarak ele alındığı için, anlatılmak istenen asıl mesajı mimarlık aracılığıyla ziyaretçilere iletmeye yönelik kavramsal arka plana dayalı bir çalışma yapılmamıştır.
Türkiye’nin fuar yaklaşımına göre ulusal pavyonlar; yabancıların zihninde ülkeye dair var olan öğeleri tekrarlayarak ülke ve toplum hakkında olumlu imaj çizmeye çalışan sergi yapılarıdır. Ancak günümüzde Dünya Fuarlarındaki beklenti bu yapıların cesur, ilgi çekici, şaşırtıcı, farklı deneyimler sunan etkileşimli ortamlar olarak kurgulanmalarıdır. Türk Pavyonlarının tasarımındaki bu problemli çıkış noktası ülkenin uluslararası ortamda; imaj geliştirmeye yönelik bir tanıtım değeri olmayan, dikkat çekmeyen ve sıradan yapılarla temsil edilmesine yol açmaktadır. Bu nedenle 2000 Hannover Türkiye Pavyonunda olduğu gibi mimari tasarım açısından belirli bir kaliteye sahip yapılar bile fuar bağlamında değerlendirildiğinde çağın ruhunu yansıtmakta yetersiz kalmaktadır.
Bu duruma ülkenin, dünyadaki güncel sorunlara ve geleceğe yönelik proje üretmeye yatkın olmayan kültürel geçmişinin sebep olduğu düşünülebilir. Kültürel ürünler olarak birçok mesaj barındıran ulusal pavyonlar, Türkiye’nin, kendi görmek istediği hâliyle kendisini yani kimliğini Batıya doğrudan sunduğu materyallerdir. Bu anlamda ulusal pavyonlar, bilinçaltında Batı karşısında uzun zamandır duyulan yenilgi, eksiklik duygularına karşı bir meydan okuma olarak da değerlendirilebilirler. Bu nedenle pavyon tasarımı konusunda risk alınmadığı ve her katılımda içerik olarak daha önce denemiş yani alışıldık olanın tekrar edildiği iddia edilebilir.
Öte yandan, Türk pavyonlarında ülkenin temsili ile ilgili de aynı çelişki gözlemlenmektedir: Türkiye bir yandan Doğu ülkesi olmadığını ispat etmeye çalışırken Doğu’yu çağrıştıran sergi elemanları ve motifleri kullanarak Batılıların gözünde var olan Doğu kimliğini her seferinde baştan yaratmaktadır.
Ülkenin fuar katılımlarında gözlemlenen bu sorunların çözümü için; ülke imajını geliştirmeye yönelik güncel bir kurgu yapılması, bu kurgunun parçası olarak sergileme sürecine katılacak bir mimari bakış açısı geliştirilmesi, böylece içerik ve dış kabuk olarak uyumlu mesajlar ileten pavyon tasarımları elde edilmesi atılabilecek ilk adımlar olacaktır.
152
Erinç Onbay
4. KAYNAKÇA
Anonim1, (Tabanlıoğlu Mimarlık ve Danışmanlık). 2000. İnsanlık Için Evrensel Bir Cümle, Domus, 6, 116-125.
Anonim2. 2000. Hannover 2000’de Türkiye, XXI, 3, 94-95.
Erengezgin, Ç. 2000. Expo 2000’den Ahşap Manzaraları, Arkitekt, 482, 16-33.
Erkartal, P.Ö. 2015. Mimarlık Aktarmalı Dünya Seyahati: Expo 2015, Tasarım Dergisi, 256, 68-72.
Yazgan, K. 2000. Mimari Tasarımda “Küreselleşme ve Yereli Tekrar Düşünmek”, Ege Mimarlık, 48, 11-13.
Özkan, S. 2000. Hannover Expo 2000 Bitti mi?, Arredamento Mimarlık, 132, 52-57.
Özsoy, S., ve Savaş, A. 2010. Expo Shangai 2010, Better City Better Life, Miki Press, Ankara.
Tanju, B. 2000. Hannover Expo 2000 Türkiye Pavyonu, Ofset Yapımevi, İstanbul.
Uludağ, Z. 2015. “Yaşam İçin Enerji” Serüveninde Mimarlık: Milano Expo 2015 Fuarı, Mimarlık Dergisi, 385, 34-36.
Yıldırım, Y. 2015. Expo’nun Düşündürdükleri, Arredamento Mimarlık Dergisi, 294, 132-144.
İNTERNET KAYNAKLARI
[1] https://archnet.org/sites/15570/media_contents/112325
[2] https://www.haberler.com/turkiye-2010-sanghay-expo-da-kultigin-ile-boy-haberi/
[3] http://www.ddf.com.tr/haber/haberdetay/259-expo_milano_2015_turkey_pavilion.html
[4] http://www.gazetevatan.com/bayragimizi-gormeden-iste-bu-turkiye-pavyonu-diyecekler--785208-ekonomi/
[5] http://www.turkeyexpo2015.com/turkiye-pavyonu.html
[6] https://xxi.com.tr/i/expo-2015-gidanin-gelecegine-soyleyecek-sozu-olan-bir-adim-one-ciksin

153
AURUM MÜHENDİSLİK SİSTEMLERİ VE MİMARLIK DERGİSİAURUM JOURNAL OF ENGINEERING SYSTEMS AND ARCHITECTURE
Cilt 4, Sayı 1 | Yaz 2020Volume 4, No 1 | Summer 2020, 153-158
SAMPLE MANUSCRPT SUBMISSION TO
AURUM - Journal of Engineering Systems and Architecture (A-JESA)
[TITLE COMES HERE]
[Author1]1, [Author2]2, [Author3]3
1 [Name of the Department, Faculty and University]2 [Name of the Department, Faculty and University]
[e-mails]
Abstract
Authors are responsible for submitting a complete manuscript, including an abstract of not more than 200 words, author affiliation(s) and contact details, and a final reference list, a list of image credits, and all diagrams, tables, figures, captions, and footnote citations.
It is not the responsibility of the editors to add material to your manuscript. If you do not provide all the necessary sections you will be asked to add any missing material prior to editing which may eventually delay publication.
Articles carry an abstract of no more than 200 words under the title. An abstract must give a sense of the focus, scope, argument and (please) conclusions of the whole paper.
Author(s) affiliation, postal address, and email included on an unnumbered note above the first footnote. The author note may also be used for any acknowledgements.
Keywords: [5 keywords should be given]
[TÜRKÇE BAŞLIK]
Özet
Türkçe özet verilecektir. İnglizce metinler için türkçe özet, türkçe metinler için inglizce özet verilmelidir.
Anahtar Kelimeler: [5 adet anahtar kelime verilmelidir]
154
A-JESA AUTHOR GUIDELINES ExAMPLE
1. INTRODUCTION
The introduction should include the objectives of the work and an adequate background. Literature sur-vey should also be a part of this section.
The authors must implicitly accept that their submission has been neither published nor submitted to another journal. If a major part of the paper has already been published, the paper cannot be accep-ted for publication in Aurum Journal of Engineering Systems. Papers that have been submitted in pro-ceedings can be accepted for publication only if substantial extensions to the original proceeding pa-per are made, and some additional methodological contributions possibly with more significant impact than the extension results are offered.
Original papers, review articles, case studies, short communications, book reviews, letters to the editors are welcome. Please ensure that you select the appropriate article type from the list of options when making your submission. Authors contributing to special issues should ensure that they select the spe-cial issue article type from this list. Any comment on or discussion of a published paper should be sub-mitted within six months of the online publication of the paper under discussion.
Submission to this journal proceeds totally online and you will be guided stepwise through the creation and uploading of your files. You may choose to submit your manuscript as a single file to be used in the refereeing process. This can be a PDF file or a Word document, in any format or layout that can be used by referees to evaluate your manuscript. It should contain high enough quality figures for refereeing. If you prefer to do so, you may still provide all or some of the source files at the initial submission.
1.1 Main Body
Main body of the text may be divided into multiple sections depending on the depth of analysis and re-sults given in the paper. This section should first extend, not repeat, the background to the article alre-ady dealt with in the Introduction and lay the foundation for the results. Then results and discussion sho-uld be presented. Results should be clear and concise.
Manuscripts should be submitted in size 12 in a readable font (Times, Arial, Calibri, etc.)(First submission). The main text and footnotes should both be double spaced and left-aligned (ragged right). Formatting the manuscript in this way is a courtesy which aids screen readability and the use of track changes and comment tools used in the editing and review process.
Short papers are encouraged since the journal pages are limited. The references should be prepared ac-cording to the journal style described below. It is the responsibility of the authors to format the referen-ces in accordance with the journal’s citation style. If you do not follow these guidelines you will be asked to reformat your paper prior to editing and this may ultimately cause publication delays.
Articles should not generally exceed 40 pages (double-spaced, 12 point Times New Roman or similar font with 2.5 cm - 1 inch margins) including the reference list.
155
AURUM MÜHENDİSLİK SİSTEMLERİ VE MİMARLIK DERGİSİAURUM JOURNAL OF ENGINEERING SYSTEMS AND ARCHITECTURE
Titles and subtitles in the article are to be capitalized sentence style (i.e., only the first word and proper nouns).
Tables, figures and images can be submitted as part of the source files with a full caption provided in an appropriate format (see below-Fig 1). With the exception of photos or screenshots, we expect that tab-les and figures are submitted in an editable format.
Digital files of images should be of the maximum size and resolution possible, with a minimum resolu-tion of 300 dpi (min. length 15 cm.), and are to be provided as separate files. Authors are responsible for acquiring their own image permissions.
Graphs, charts and tables should be provided in an editable format (either word processor or spreads-heet), not as static images. Authors are responsible for acquiring permission to use datasets and for the accuracy of the data they use.
( )rrCCD
r logloglim
0→=
(1-example of formulas)
Figure 1. [Figure title comes here/ example of figure]
1.1.1 [Third degree title]
Divide your article into clearly defined and numbered sections. Subsections should be numbered 1.1 (then 1.1.1, 1.1.2, ...), 1.2, etc. (the abstract is not included in section numbering). Use this numbering also for internal cross-referencing: do not just refer to ‘the text’. Any subsection may be given a brief heading. Each heading should appear on its own separate line.
Table1. [Example of Table caption]
RecordingsA B
Instrument Mode
x Y C D
156
A-JESA AUTHOR GUIDELINES ExAMPLE
2. CONCLUSIONS
The main conclusions of the study may be presented in this section.
If there is more than one appendix, they should be identified as A, B, etc. Formulae and equations in ap-pendices should be given separate numbering: Eq. (A.1), Eq. (A.2), etc.; in a subsequent appendix, Eq. (B.1) and so on. Similarly for tables and figures: Table A.1; Fig. A.1, etc.
Aurum Journal of Engineering Systems and Architecture publishes novel articles in English only. The pre-ferred spelling is US English, except in citations of works published in UK English. All non-English words found in an unabridged US English dictionary should be treated as English words.
In line with Chicago manual advice, Aurum follows the Merriam Webster’s Collegiate Dictionary as a so-urce for standard US spellings, including hyphenated and capitalized forms.
Aurum Journal of Engineering Systems and Architecture follows standard US capitalization practices as per the Merriam Webster’s Collegiate Dictionary (www.merriam-webster.com).
Titles of published works are always to be capitalized in headline style (i.e., all the nouns and verbs, but not the articles or prepositions unless they begin a sentence or subtitle). Aurum applies this rule to Tur-kish titles even where the original title is in sentence style, as in French or German titles. Thus:
Raiffa, H., Schlaifer, R. Applied Statistical Decision Theory. Cambridge: Harvard Business School, 1961.
Integer numbers in Arabic numerals are required for all items like equations, references, figures, tables, theorems, algorithms, proofs, notes, or any item you want to number across the paper. American sepa-rators for thousands (,) and decimals (.) are used. Thousands separators are not used for page numbers:
Every year, approximately 7,500 foreign flagged ships visit US ports, carrying the bulk of shipments into the US, including 175 billion gallons of oil and other fuels.
The transportation industry made $56 billion revenue out of port service operations, whereas federal, state, and local agencies were able to collect $ 16.1 billion of taxes.
Wein, L. M., Wilkins, A.H., Baveja, M., and Flynn, S. “Preventing the importation of illicit nuclear materials in shipping containers,” Risk Analysis, 26(3), 1377–1393, 2006.
Numbers higher than 999,999 are written out with a combination of decimal numbers and words: The market for digital games grew 8 percent from 2014 to $61 billion, according to a new
report from gaming intelligence firm SuperData Research.
In the main text, tables, charts, and figures the abbreviated symbol % for percentages may be used.
Ranges of dates or page numbers take a single en dash (–):
Gupta, N., and Kumar, S. “Stochastic comparisons of component and system redundancies with depen-dent component,” Oper. Res. Lett., 42, 284–289, 2014.
157
AURUM MÜHENDİSLİK SİSTEMLERİ VE MİMARLIK DERGİSİAURUM JOURNAL OF ENGINEERING SYSTEMS AND ARCHITECTURE
3. REFERENCES
List only those references that are cited in the text. References in the text should be cited by the author’s surname and the year of publication, for example Brown (2013). If the reference has two or three aut-hors, cite all the authors’ surnames and the year of publication, for example Brown, Kaplan and Jenkins (2004). If the reference has three or more authors, cite the first author’s surname followed by et al. and the year of publication – Brown et al. (2005)
If there is more than one reference by the same author with the same year of publication, the first ci-tation appearing in the text would read Brown (2006a), the second citation would read Brown (2006b), etc. At the end of the paper list references alphabetically by the last name of the first author. Examples are provided below. For journal articles:
Wortman, M.A., G-A. Klutke, and H. Ayhan. 1994. A maintenance strategy for systems subject to deterio-ration governed by random shocks. IEEE Transactions on Reliability (43) 3, 439-445.
For books:
Bersekas, D.P. 1999. Nonlinear Programming. Athena Scientific, Belmont.
For conference proceedings:
Bakır, N.O., and E. Kardeş. 2011. A stochastic game model on container security. Proceedings of the IEEE International Conference on Technologies for Homeland Security, Waltham, MA.
For chapters in a book:
Maybury, M.T. 2001. Intelligent user interfaces for all. In User interfaces for all: Concepts, methods and to-ols ed. C. Stephanidis. Lawrence Erlbaum Associates, Mahwah, NJ, 65-80.
For working papers:
Gehrig, T., W. Güth, and R. Levinsky. 2003. “Ultimatum offers and the role of transparency: An experi-mental study of information acquisition”. Working Paper No. 16-2003, Max-Planck Institute for Research into Economic Systems, Jena, Germany.
For technical reports:
Kwon, O.K., and R.H. Pletcher. 1981. “Prediction of the incompressible flow over a rearward-facing step”. Technical Report No. HTL-26, CFD-4, Iowa State University, Ames, IA.
For online articles:
Isidore, C. 2002. Hope in West Coast port talks. In CNN Money, available inhttp://money.cnn.com/2002/10/02/news/economy/ports/, last accessed September, 2009.
158
AURUM - Journal of Engineering Systems and Architecture (A-JESA)
COPYRIGHT TRANSFER FORM
Transfer of copyright from the Author(s) to Publisher is required for each paper in order to protect both from the consequences of unauthorized use of its contents. Consequently, as a condition to publication it is essential that aut-hors grant the AURUM - Journal of Engineering Systems and Architecture (A-JESA)published by Faculty of En-gineering and Natural Sciences of Altınbaş University - all the rights, including the subsidiary right, of their ar-ticle. However, authors retain the right to use their article without charge in any book of which they are the authors or editors, after it has appeared in the Journal.
Title of Article:
Author(s) Name(s): Date and Signature(s):
1.
2.
3.
4.
5.
6.
Whereas (A-JESA) is undertaking to publish and to broadcast via Internet the article above named http://aurum.al-tinbas.edu.tr/en/journal-of-engineering-systems-and-architecture of which the undersigned is Author, the Author grants and assigns exclusively to (A-JESA) for its use, all rights of whatsoever kind or nature now or hereafter pro-tected by the Copyright Laws (common or statutory) of the Turkey and all foreign countries in all languages in and to the below named article, including all subsidiary rights. (A-JESA), in turn, grants to the Author the right of repub-lication in any book of which he or she is the author or editor, subject only to his or her giving proper credit in the book to the original publication of the article by (A-JESA). The Author guarantees that the article furnished has not been published previously elsewhere. Otherwise, the Author guarantees that if it has been previously published in whole or in part in a copyrighted medium the Author will submit an assignment of copyright to (A-JESA) and the Author will submit the copy for credit lines with the manuscript. The author warrants that the manuscript is the author’s original work. If the work was prepared jointly, the author agrees to inform co-authors of the terms of this agreement. The author also warrants that the article contains no libelous or unlawful statements, and does not inf-ringe on the rights of others.
Please fill the “title of article”, “author(s) name”, “date” sections of this document. Then sign, scan and send this origi-nally signed document by e-mail to [email protected]
Retain a copy for your own files. For jointly authored articles, all the joint authors should sign or one of the authors should sign as an authorized agent for the others.
Related Documents