VOL.39, No.4, AUTUMN 2008 ISSN 0084-5841

Welcome message from author
This document is posted to help you gain knowledge. Please leave a comment to let me know what you think about it! Share it to your friends and learn new things together.
Transcript

VO
L.39, NO
.4, Autum
n 2008
VOL.39, No.4, AUTUMN 2008
ISSN 0084-5841

VOL.39, No.4, AUTUMN 2008
Yoshisuke Kishida, Publisher & Chief EditorContributing Editors and Cooperators
- AFRICA -Kayombo, Benedict (Botswana)Fonteh, Fru Mathias (Cameroon)
El Behery, A.A.K. (Egypt)El Hossary, A.M. (Egypt)
Pathak, B.S. (Ethiopia)Bani, Richard Jinks (Ghana)Djokoto, Israel Kofi (Ghana)
Some, D. Kimutaiarap (Kenya)Houmy, Karim (Morocco)Igbeka, Joseph C. (Nigeria)
Odigboh, E.U. (Nigeria)Oni, Kayode C. (Nigeria)
Kuyembeh, N.G. (Sierra Leone)Abdoun, Abdien Hassan (Sudan)
Saeed, Amir Bakheit (Sudan)Khatibu, Abdisalam I. (Tanzania)Baryeh, Edward A. (Zimbabwe)Tembo, Solomon (Zimbabwe)
- AMERICAS -Cetrangolo, Hugo Alfredo (Argentina)
Naas, Irenilza de Alencar (Brazil)Ghaly, Abdelkader E. (Canada)
Hetz, Edmundo J. (Chile)Valenzuela, A.A. (Chile)
Aguirre, Robert (Colombia)Ulloa-Torres, Omar (Costa Rica)Magana, S.G. Campos (Mexico)
Ortiz-Laurel, H. (Mexico)Chancellor, William J. (U.S.A.)
Goyal, Megh Raj (U.S.A.)Mahapatra, Ajit K. (U.S.A.)Philips, Allan L. (U.S.A.)
- ASIA and OCEANIA -Quick, G.R. (Australia)
Farouk, Shah M. (Bangladesh)Hussain, Daulat (Bangladesh)
Mazed, M.A. (Bangladesh)Wangchen, Chetem (Bhutan)
Wang, Wanjun (China)Illangantileke, S. (India)
Ilyas, S. M. (India)Michael, A.M. (India)
Ojha, T.P. (India)
Verma, S.R. (India)Soedjatmiko (Indonesia)
Behroozi-Lar, Mansoor (Iran)Minaei, Saeid (Iran)Sakai, Jun (Japan)
Snobar, Bassam A. (Jordan)Chung, Chang Joo (Korea)
Lee, Chul Choo (Korea)Bardaie, Muhamad Zohadie (Malaysia)
Pariyar, Madan (Nepal)Ampratwum, David Boakye (Oman)
Eldin, Eltag Seif (Oman)Chaudhry, Allah Ditta (Pakistan)
Mughal, A.Q. (Pakistan)Rehman, Rafiq ur (Pakistan)
Devrajani, Bherular T. (Pakistan)Abu-Khalaf, Nawaf A. (Palestine)Nath, Surya (Papua New Guinea)Lantin, Reynaldo M. (Philippines)Venturina, Ricardo P. (Philippines)
Al-suhaibani, Saleh Abdulrahman (Saudi Arabia)Al-Amri, Ali Mufarreh Saleh (Saudi Arabia)
Chang, Sen-Fuh (Taiwan)Peng, Tieng-song (Taiwan)
Krishnasreni, Suraweth (Thailand)Phongsupasamit, Surin (Thailand)
Rojanasaroj. C. (Thailand)Salokhe, Vilas M. (Thailand)Singh, Gajendra (Thailand)
Pinar, Yunus (Turkey)Haffar, Imad (United Arab Emirates)
Lang, Pham Van (Viet Nam)Nguyen Hay (Viet Nam)
Hazza’a, Abdulsamad Abdulmalik (Yemen)
- EUROPE -Kaloyanov, Anastas P. (Bulgaria)
Kic, Pavel (Czech)Have, Henrik (Denmark)
Müller, Joachim (Germany)Pellizzi, Giuseppe (Italy)
Hoogmoed, W.B. (Netherlands)Pawlak, Jan (Poland)
Marchenko, Oleg S. (Russia)Kilgour, John (U.K.)
Martinov, Milan (Yugoslavia)
EDITORIAL STAFF(Tel.+81-(0)3-3291-5718)
Yoshisuke Kishida, Chief EditorShinjiro Tetsuka, Managing Editor
Zachary A. Henry, Editorial Consultant
ADVERTISING(Tel.+81-(0)3-3291-3672)
Yoshito Nakajima, Manager (Head Office)Advertising Rate: 300 thousand yen per page
CIRCULATION(Tel.+81-(0)3-3291-5718)(Fax.+81-(0)3-3291-5717)
Editorial, Advertising and Circulation Headquarters7, 2-chome, Kanda Nishikicho, Chiyoda-ku, Tokyo 101-0054, Japan
URL: http://www.shin-norin.co.jpE-Mail: [email protected]
Copylight © 2008 byFARM MACHINERY INDUSTRIAL RESEACH CORP.
SHIN-NORIN Building7, 2-chome, Kanda Nishikicho, Chiyoda-ku, Tokyo 101-0054, Japan
Printed in Japan
This is the 137th issue since its maiden isue in the Spring of 1971
EDITORIAL
A record-breaking financial crisis hit the United States, the world greatest economic power. In historical view, American economy has expanded along with the development of industries, from the primary industries to the second-ary industries and further to tertiary industries. Meanwhile financial business has grown to have the mounting power even to lead the domestic and global economy. The collapse of that financial system has seriously affected the economy throughout the world.
In such insecure economic situations, we see that agricultural-related businesses maintain the economic stability be-cause they are founded on food production that is essential to our life and, therefore, reflects substantial economy.
In order to prevent further recession, the U.S. administration started to make aggressive financial input as a measure to promote domestic consumption. China, the country with the largest population in the world, is expected to make a large investment in rural areas to revitalize rural economy in the face of the expanding economic gap between urban and rural areas. The governmental aid to farm machines and facilities will be much increased. Chinese farm machin-ery industries have grown to the most extensive scale in the world. Their total output reached 150 billion Yuan in 2007. The vast farmland, a large rural population and the financial support from the government will create a further demand for farm machines in China.
India and other countries that have a large population in rural areas are going to move to a more aggressive stance with regard to the investment in agriculture. In Thailand, where more than 2 million units of tillers are now in opera-tion on farms under powerful economic growth, the demand for 4-wheel tractors is rapidly increasing and nearly 40 thousand brand-new 4-wheel tractors were sold this year. There is a good demand for rice in the international market. Since rice was sold out soon after being placed on the market, some of the farmers are trying to crop rice four times a year. Farm machines like transplanters, will be very helpful to them in saving cropping time. For farmers engaged in such intensified farming, farm machines are the highest priority items for investment.
As much more food production is needed in the world, it is expected that investment in agriculture will increase on a global basis. In the midst of financial crisis, the industries based on agriculture, especially the farm machinery indus-tries in developing countries, seem to have a bright future. We owe much to agricultural machines in raising the pro-ductivity on the limited farmland because timely and accurate farming is needed to increase land productivity.
Among all developing countries, African countries have many difficulties in promoting agricultural mechanization. In Asia, it is required that the implements be developed that are suitable for each local faming situation, which is not good enough in many Asian countries. The research and the development of, not only tractors, but of the mechaniza-tion system to cover varied local situations are now in need there. The mechanization of agriculture will not be suc-cessful unless the machines to meet each local demand are developed. In this sense, we should strengthen more spe-cific research and development on agricultural machines and develop the agricultural machinery industries based on the results from the research and development.
With much more attention being paid to agriculture, the situations involving agriculture have improved to the state that calls for new investment, which is welcomed for agricultural-related people. We have to take this excellent oppor-tunity and make the effort for the progress of new agriculture. Worldwide cooperation and communications among the experts will be more and more significant in order to move ahead with the mechanization of agriculture in the world. AMA hopes to play an active part with its readers for this objective.
Yoshisuke KishidaChief Editor
December, 2008

Yoshisuke Kishida
Jan Malaťák, Gürkan A. K. GürdilPetr Jevic, K. Çagatay Selvi
L. Fan, D. S. Jayas
S. O. Nkakini, O. Ceder
S. H. Sengar, A. K. Kurchania
B. Suthakar, K. KathirvelR. Manian, D. Manohar Jesudas
A. Yajuddin
Ali Mazin Abdul-MunaimMaysm Thamer Al-Hadidy
D. Sirisha, K. KathirvelR. Manian
U. S. Pal, K. KhanN. R. Sahoo, G. Sahoo
A. Addo, A. Bart-Plange
Ricardo F. Orge, John Eric O. Abon
Munir Ahmad, Asif A. Mirani
P. G. Patil, P. M. PadoleJ. F. Agrawal, A. B. Dahake
Surya Nath, Simon Sil
Sylvester Mpanduji, Baanda Salim
Abstracts
7
9
16
22
28
30
37
39
41
46
51
55
63
69
75
81
87
Editorial
Biomass Heat-Emission Characteristics of Energy Plants
Comparative Grain Supply Chain in Canada and China
Investigation into Farm Mechanization Practices for Cassava and Yam in Rivers State, Nigeria
Domestic Solar Geyser Cum Distiller
Leser Guided Land Leveler: Precession Leveler With Laser Technol-ogy for Land Preparation
Development and Testing of Engine Operated Pneumatic Cotton Picker
The Effect of Two Type of Plows With Four Speeds on the Field Ca-pacity and Bulk Density
Development and Evaluation of Direct Paddy Seeder for Assessing the Suitability to Rural Woman
Development and Evaluation of Farm Level Turmeric Processing Equipment
Effect of Threshing Cylinders on Seed Damage and Viability of Moongbean (Virna radiate. (L.) Wilezee)
Engineering the Application of Grain Protectants on F1 Hybrid Rice Seed: The Philippine-HRCP Experience
Development and Performance of a Solar-Cum-Gas Fired Dates Dryer
Formulation of Generalized Experimental Models for Double Roller Gint
Preservation and Storage of Perishable Fresh Fruits and Vegetables in the Lowlands of Papua New Guinea
Annual Costs of Mechanizing With Tractors in Tanzania
CONTENTS
AGRICULTURAL MECHANIZATION IN ASIA, AFRICA AND LATIN AMERICAVol.39, No.4, December 2008
Instructions to AMA Contributors .......................4Co-operating Editor ............................................90
Back Issues ..........................................................93★ ★ ★
VOL.39 NO.4 2008 AGRICULTURAL MECHANIZATION IN ASIA, AFRICA, AND LATIN AMERICA 9
Biomass Heat-Emission Characteristics of Energy Plants
AbstractBiomass makes an impor tant
potential alternative to fossil fuel by the heating process. There is no possibility of using biofuels without a judgment of their influence on en-vironment. Knowledge of biomass burning characteristics is also very important before its use. This study was mainly focused on gas emis-sions of briquette biofuels. Burned fuels were formed to brickets of a 65 mm diameter and CO2, CO, O2, NO, NO2, SO2, and HCl concentrations checked. Air surplus coefficient (n) of other values of heating character-istics were also measured. The high-est ranges of value were achieved by combustion of energy sorrel.
IntroductionUse of biomass as a renewable
source of energy has many posi-tive aspects. It also helps to solve ecological, agricultural and forestry problems (McBurney, 1995 and Malaťák, 2003). Biomass based fuel contains very little sulfide. Also, the other waste gases from phyto-fuels are more suitable in comparison with other fossil fuels. The ash re-
byJan MalatákTechnical Faculty,Czech University of Agriculture in Prague,PragueCZECH REPUBLIC
Petr JevicResearch Institute of Agricultural Engineering,PragueCZECH REPUBLIC
Gürkan A. K. GürdilFaculty of Agriculture,Ondokuz Mayis University,SamsunTURKEY
K. Çagatay SelviFaculty of Agriculture,Ondokuz Mayis University,SamsunTURKEY
maining after burning can be used as a fertilizer with a high content of calcium, magnesium, potassium and phosphorus (Sladký, 1986; Sladký and Váňa, 2002).
The share of renewable and sec-ondary sources of energy will be increased from the current 2.5 % to 3…6 % in 2010. This is also affected by entering of the Czech Republic to the EU and using of renewable sources of energy financial support. EU uses 12 % renewable sources of energy (Anonymous, 1999; Váňa, 2002).
According to current legislation, polluting substances are solid, liq-uid and gaseous that have a negative influence directly on the atmosphere or after the chemical or physical changes to the surrounded air. These substances also harm the human health and other organisms or prop-erty. The most important polluting substances are SO2, CO, CO2, NO and NOX (McBurney, 1995; Price, 1998; Pastorek et al., 1999; Hutla and Sladký, 2001; Malaťák, 2003).
Characteristics of fytomass and choosing the right type of burn-ing equipment is impor tant for biomass. Stechiometric analysis must be done for energy content. Stechiometric calculations for burn-
ing process are basic for any type of heat calculations. These calcula-tions are also important for solving the whole problem and for control-ling the burning equipment, as well (Pastorek et al., 1999 and Malaťák, 2003).
Determination of emission param-eters of chosen biofuels is done by using compressed biofuels. These might be compressed to the differ-ent shapes by applying different pressures. Biofuels require a lot of space, and this increases shipping costs and storage if they are not compressed. Compressed biofuels also permit higher quality combus-tion.
Material and MethodDuring measurement, the follow-
ing concentrations were checked: carbon di-oxide CO2, carbon mono-oxide CO, oxygen O2, nit rogen mono-oxide NO, nitrogen di-oxide NO2, sulfa di-oxide SO2, and hydro-gen chloride HCl. Measurements were obtained by using fireplace combustion equipment with an 8 kW power and briquette phytomass (65 mm diameter). The problem was basically solved by an ele-
‘

AGRICULTURAL MECHANIZATION IN ASIA, AFRICA, AND LATIN AMERICA 2008 VOL.39 NO.410
ment analysis of each element of the briquette phytomass, followed by stechiometry of the combustion processes. Their stechiometry were complemented by fuel character-istics. These are necessary for any heat concerned equation and setting of any emission concentration such as SO2, CO, CO2, NO and NOX.
The first step within any stechi-ometry calculation of fuels and a thermal work of combustion equip-ment is the element analysis of fuel (Anonymous, 1998-a and Anony-mous, 1998-b). Element analysis is very important for any stechiometry analysis, thermal effectiveness and losses of combustion equipment. It also inf luences a thermal work of combustion equipment. So-called elementary analysis is used during the detection of solid fuels. This
element analysis is for finding the weight percentage of C, H, O, S, N and all of the water content in the fuel. Final elements compositions are given in Table 1.
The main point of the research was to set each of any stechiometry calculation for analyzed biofuels. Especially, a heating value of bio-fuel (Qn) according to ČSN 44 1310 (Anonymous, 2001-b), theoretical amount of oxygen (Omin) and of the air (Lmin) for an ideal combustion, theoretical volume amount of dry waste gases (vv
spmin), percentage of volume amount of CO2, SO2, H2O, N2, O2 and theoretical weight and volume concentration of (CO2max) in dry waste gases were set by ste-chiometry calculation. Final chosen stechiometry parameter of phyto-mass is shown in Table 2, below.
GA-60 gauge was used for the setting of mass flows, emission fac-tors and characteristics of solid par-ticles by thermal use of phytomass briquettes. It is a multifunctional smoke gases analytical gauge. GA-60 gauge is also able to measure a temperature of surroundings (tok) and waste gases temperature (tsp). By these temperatures, together with the chemical parameters, the gauge provided a calculation of heating characteristics such as; flue loss (qa), thermal-technical effectiv-ity of combustion (ηkor), air surplus amount (n) and other losses (Anony-mous, 2001-a).
The measurement was focused on emissions (CO2, CO, NO, NO2, SO2, and HCl) produced by combus-tion of mixed briquette phytomass. Carbon Dioxide was determined by
Wood ships fresh poplar
Wood ships dry poplar Poplar bark
Energy sprrel (Rumex
tianschanicus)
Canary grass (Phalaris
arundinacea)Wr
t Water content, % hm. 42.73 8.86 53.57 7.95 9.12Ar
t Ash, % hm. 1.43 1.64 2.61 4.45 6.74Cr
t Carbon - C, % hm. 9.58 17.48 3.69 42.70 41.81Hr
t Hydrogen - H, % hm. 27.17 44.02 0.2 5.42 4.85Nr
t Nitrogen - N, % hm. 4.43 6.03 0.008 1.65 0.84Sr
t Sulphate - S, % hm. 0.43 0.78 19.77 0.11 0.07Or
t Oxygen - O, % hm. 0.006 0.01 0.007 37.61 36.45Clr
t Chlorine - Cl, % hm. 23.8 38.64 0.69 0.11 0.12
Table 1 Elementary analysis of burned solid phytomass
Fuels Wood ships fresh poplar
Wood ships dry poplar Poplar bark Energy
sorrelCanary grass
Qri Heating value 0.58 9.58 17.48 6.99 16.15 15.21
Qmin Theoretical quantity of oxygen for ideal combustion process
2.79 0.58 0.88 0.44 0.83 0.79
Lmin Theoretical air quantity for ideal combustion process
7.34 2.79 4.21 2.105 3.97 3.78
n Overflow of the air (O2 = 13 %) 2.63 2.63 2.63 2.63 2.63 2.63vs
spmin Theoretical cubical quantity of dry combination gas
m3N.kg-1 2.68 4.11 4.81 3.91 3.73
CO2max Theoretic cubical concentration of oxide carbonic in dry combustion gas
% 18.76 19.85 18.5 20.26 20.76
CO2 Carbon di-oxide % 5.90 6.69 5.54 6.90 7.10SO2 Sulfur di-oxide % 0.0 0.0 0.0 0.01 0.0H2O Water % 15.36 9.99 19.18 9.71 9.75N2 Nitrogen % 66.82 70.7 63.88 70.78 70.72O2 Oxygen % 11.14 11.78 10.65 11.77 11.77
Table 2 Final stechiometry parameters of phytomass
*All of the values obtain by measurement are counted to normal conditions. (Temperature t = 0 ºC and a pressure p = 101,325 kPa and for a referential amount of oxygen Or = 13 %

VOL.39 NO.4 2008 AGRICULTURAL MECHANIZATION IN ASIA, AFRICA, AND LATIN AMERICA 11
the measured concentration of oxy-gen and fuel’s characteristics with respect to thermal parameters and emission conditions the fuel was then judged as combustion equip-ment.
Operation tests were made ac-cording to ČSN EN 13229 (Built in heat consumers and open fire place inserts for solid fuels - requirements and testing methods) (Anonymous, 1998-a). A tested heat ing was equipped with a closeable furnace. In order to obtain values, the con-vection pass (these were dependent on rated power) was in a restricted limit range 12 ± 2 Pa (values of static pressure in a measured area of emissions). An average concentra-tion of Carbon Oxide during mea-surements and other gaseous emis-sions was counted to the value of 13 % (O2). By the norm mentioned above, all of the average values of Carbon Oxide have to meet limit
values for certain class of CO; the same as is mentioned in Table 3.
An efficient use of thermal energy by operation of the consumer in accordance with data provided by manufacturer and by the combus-tion of experimental fuels is judged by efficiency. Measured efficiency has to be in a accordance with limit values for certain class quoted in Table 4.
Combustion equipment was de-signed to burn any kind of wood or wooden briquettes. Its most im-portant part was a steel palette or a part of iron with a thickness of 5-8 mm. It was covered on the sides and from the top by feolit bricks. These provide an accumulation of heat and radiate for a certain time after the end of heating process. The bricks were covered by a special made and shaped insulating layer of Calcium Silicate. Doors were equipped with a ceramic glass with resistance up to
750 ºC. Emissions were conveyed to the flue way of a 150 mm diameter (Anonymous, 1998-a).
Results and DiscussionsBiofuel stechiometry, mass f low
and emission factors, along with air surplus coefficient and a total water content of biofuel are among the variable factors that influence ther-mal work of any combustion equip-ment, (McBurney, 1995; Malaťák, 2003). By the determination of basic stechiometry parameters of biofuels it is possible to effectively judge, de-sign and check a work of observed combustion equipment (Malaťák, 2003). All water contained in a bio-fuel and the air surplus coefficient are primary factors that may influ-ence thermal aspects of combustion equipment (McBurney, 1995; Pas-torek et al., 1999; Malaťák, 2003). All of the calculated stechiometry values are then used in the calcula-tion of thermal output and losses of combusting equipment.
Hydrocarbons and other incom-pletely burned products have the same characteristic features as a carbon oxide. This is an important indicator of a burning process qual-ity. By the comparison of measured
Class of CO appliances
Appliances with close doorLimiting value of class
emissions CO, % (at 13 % O2)Class 1 ≤ 0.3*
Class 2 > 0.3 ≤ 0.8*
Class 3 > 0.3 ≤ 1.0*
*1 mg.mN-3 = 0.0001 %
Table 3 Classes of CO emissions for solid fuel combustion (Anonymous, 1998-a)
ClassesAppliances with close door
Limiting value of class efficiency, %
Class 1 ≥ 70Class 2 ≥ 60 < 70Class 3 ≥ 50 < 60Class 4 ≥ 30 < 50
Table 4 Efficiency classes by ratedheat power (Anonumous, 1998-a)
0
500
1000
1500
2000
2500
3000
3500
4000
4500
5000
Canary Grass and PoplarBark in ratio 1:1 and
soft coal 15 %
Canary Grass andCakes - Hoga in ratio
1:1 and Soft Coal 15 %
Energy Sorrel and SudanGrass in ratio 3:2 and
soft coal 10 %
Energy Sorrel andCanary Grass in ratio3:2 and soft coal 10 %
Briquette - EnergySorrel
Briquette - CanaryGrass
CO (O2 = 13 %) mg.m-3
NOX (O2 = 13 %) mg.m-3
Fig. 1 Final average values of CO and NOX (mg.m-3) emissions of burned phytomassbriquettes converted to 13 % amount of oxygen contained in waste gases
AGRICULTURAL MECHANIZATION IN ASIA, AFRICA, AND LATIN AMERICA 2008 VOL.39 NO.412
and worked values of CO with emission classes of CO by ČSN EN 13229 (Anonymous, 1998-a) (Table 3) all of the fuels are meet the cri-teria of class 2 where the limit is 10,000 mg.m-3 by 13 % of referen-cial oxygen.
Values of NOX are easy to mea-sure in the case of all observed fu-els. There is no limited - restricted value of NOX because of its low heat power output. However, if a com-parison is made for the limit value of NOX (250 mg.m N-3 by 11 % O2) by the regulation nr, 13-2002 MŽP ČR with requirements to get a cer-tificate of “Ecologically safe prod-uct”, concerned with water heating boilers for central heating systems with combusting of biomass up to 0.2 MW (Anonymous, 2001-c), that limit value was not overcome by the use of any fuel.
The air surplus coefficient (n) is a very important working param-eter, which influences emissions as well as heating system efficiency. It determines the amount of oxiding parts and a furnace temperature. Optimal working temperature is possible to set for consumers of this class in a power range 1.4 ≤ n
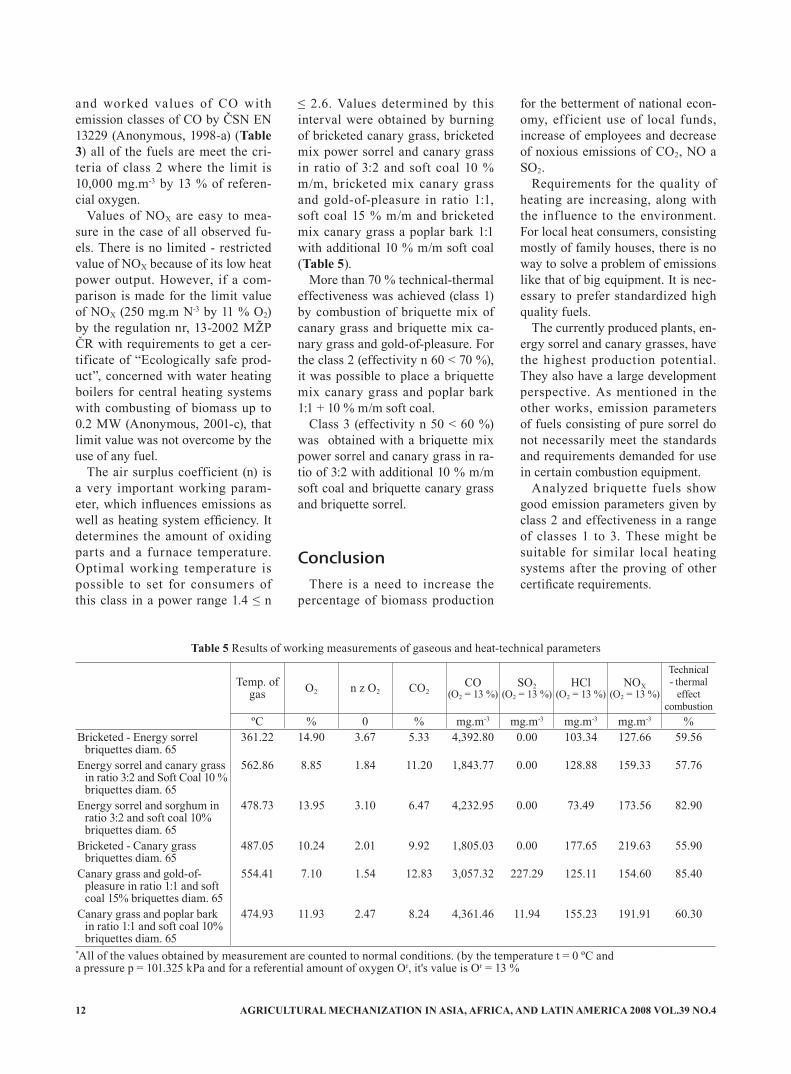
≤ 2.6. Values determined by this interval were obtained by burning of bricketed canary grass, bricketed mix power sorrel and canary grass in ratio of 3:2 and soft coal 10 % m/m, bricketed mix canary grass and gold-of-pleasure in ratio 1:1, soft coal 15 % m/m and bricketed mix canary grass a poplar bark 1:1 with additional 10 % m/m soft coal (Table 5).
More than 70 % technical-thermal effectiveness was achieved (class 1) by combustion of briquette mix of canary grass and briquette mix ca-nary grass and gold-of-pleasure. For the class 2 (effectivity n 60 < 70 %), it was possible to place a briquette mix canary grass and poplar bark 1:1 + 10 % m/m soft coal.
Class 3 (effectivity n 50 < 60 %) was obtained with a briquette mix power sorrel and canary grass in ra-tio of 3:2 with additional 10 % m/m soft coal and briquette canary grass and briquette sorrel.
ConclusionThere is a need to increase the
percentage of biomass production
for the betterment of national econ-omy, efficient use of local funds, increase of employees and decrease of noxious emissions of CO2, NO a SO2.
Requirements for the quality of heating are increasing, along with the inf luence to the environment. For local heat consumers, consisting mostly of family houses, there is no way to solve a problem of emissions like that of big equipment. It is nec-essary to prefer standardized high quality fuels.
The currently produced plants, en-ergy sorrel and canary grasses, have the highest production potential. They also have a large development perspective. As mentioned in the other works, emission parameters of fuels consisting of pure sorrel do not necessarily meet the standards and requirements demanded for use in certain combustion equipment.
Analyzed briquette fuels show good emission parameters given by class 2 and effectiveness in a range of classes 1 to 3. These might be suitable for similar local heating systems after the proving of other certificate requirements.
Temp. of gas O2 n z O2 CO2
CO(O2 = 13 %)
SO2(O2 = 13 %)
HCl(O2 = 13 %)
NOX(O2 = 13 %)
Technical - thermal
effect combustion
ºC % 0 % mg.m-3 mg.m-3 mg.m-3 mg.m-3 %Bricketed - Energy sorrel
briquettes diam. 65361.22 14.90 3.67 5.33 4,392.80 0.00 103.34 127.66 59.56
Energy sorrel and canary grass in ratio 3:2 and Soft Coal 10 % briquettes diam. 65
562.86 8.85 1.84 11.20 1,843.77 0.00 128.88 159.33 57.76
Energy sorrel and sorghum in ratio 3:2 and soft coal 10% briquettes diam. 65
478.73 13.95 3.10 6.47 4,232.95 0.00 73.49 173.56 82.90
Bricketed - Canary grass briquettes diam. 65
487.05 10.24 2.01 9.92 1,805.03 0.00 177.65 219.63 55.90
Canary grass and gold-of-pleasure in ratio 1:1 and soft coal 15% briquettes diam. 65
554.41 7.10 1.54 12.83 3,057.32 227.29 125.11 154.60 85.40
Canary grass and poplar bark in ratio 1:1 and soft coal 10% briquettes diam. 65
474.93 11.93 2.47 8.24 4,361.46 11.94 155.23 191.91 60.30
Table 5 Results of working measurements of gaseous and heat-technical parameters
*All of the values obtained by measurement are counted to normal conditions. (by the temperature t = 0 ºC anda pressure p = 101.325 kPa and for a referential amount of oxygen Or, it's value is Or = 13 %

VOL.39 NO.4 2008 AGRICULTURAL MECHANIZATION IN ASIA, AFRICA, AND LATIN AMERICA 13
REFERENCES
Anonymous. 1998-a. ČSN EN 13229: Vestavné spotřebiče k vytápění a krbové vložky na pevná paliva - Poźadavky a zkušební metody. ČNI Praha, Praha 1998, 66 s.
Anonymous. 1998-b. ČSN 83 4615: Stacionární zdroje emisí - Stano-vení hmotnostní koncentrace a hmotnostního toku tuhých částic v potrubí - Manuální gravimet-rická metoda. ČNI Praha, Praha 1998, 24 s.
Anonymous. 1999. CIGR Handbook of Agr icultural Engineer ing, Volume V. Energy and Biomass Engineering. ASAE St. Joseph, Michigan, USA, 323 s
Anonymous. 2001-a. ČSN 83 4704: Stacionární zdroje emisí - Stano-vení koncentrace emisí oxidů du-síku - Charakteristiky automati-zovaných měřících metod. Praha, s. 51-55
Anonymous. 2001-b. ČSN 44 1310: Tuhá paliva - Označování analyt-
ických ukazatelů a vzorce přepočtů výsledků na různé stavy paliva. ČNI Praha, 65 s.
Anonymous. 2001-c. Smérnice č. 13-2002 s požadavky pro propůjčení ochranné známky “Ekologicky šetrný výrobek”. Teplovodní kotle pro ústřední vytápění, na spal-ování biomasy. Praha, MŽP ČR, s. 5.
Hutla, P. and V. Sladký. 2001. Opti-mal drtiny of energetical wooden chips. Res. Agr. Eng. 47(3): 104-109.
Malaťák, J. 2003. Assessment of the Emission and Performance Characteristic at the Power Use of Solid Biomass in the Combustion Equipments with the Heat Output up to 100 KW. In.: International Congress on Information Technol-ogy in Agriculture, Food and En-vironment, Bornova - Izmir 2003, Turkey 2003, s. 633-639
McBurney, B. 1995. A Case Study of a Large Scale Wood Waste Power Generating Plant. Biologue
- Regional Biomass Energy Pro-gram Report. The Official Publi-cation of the National BioEnergy Industries Association. Vol.13. No.1, 1st Quarter 1995, s. 5-11
Pastorek, Z., J. Kára, P. Hutla, D. Andert, V. Sladký, A. Jelínek, and P. Plíva. 1999. Využití odpadní biomasy rostl inného původu. VÚZT Praha, Praha, 49 s.
Price, B. 1998. Electricity from Bio-mass. Financial Times Energy, G. Britain, 130 s.
Sladký, V. and J. Váňa. Biomasa pro vytápění v obcích i městech, 2002, příručka Státního fondu životního prostředí.
Sladký, V. Výroba sena v halových senících. Metodiky pro zavádění výsledků výzkumu do zemědělskě praxe. 1986, ÚVTIZ 16/1984, s. 74
Váňa, J. Problémy brzdící rozvoj en-ergetického využívání fytomasy, 2002, ISBN:80-86555-16-X, s. 7
■■
(Continued from page29)
Domestic Solar Geyser Cum Distiller
that the total gain in heat was about 3.02 kWh (Garg et al., 1998) and 3.40 kWh energy was required to evaporate the 5.17 kg of water. If electricity unit charge was taken as Rs. 3.00, then the cost of unit equiv-alent of electrical backup would be Rs. 19.00. Hence, per day saving of SGD would be Rs. 19.00.
Conclusions1. The maximum temperatures of
hot water in winter and summer were 48.68 ºC and 52.28 ºC, re-spectively.
2. The yield of distilled water in SGD device was 5,007 ml m -2 day-1 in winter and 5,275 ml m-2
day-1 in summer. 3. The composite unit performed
well and per day savings of SGD were Rs.19.
REFERENCES
Garg, H. P., P. Avanti, and G. Datta. 1998. Development of monogram for performance prediction of integrated collector storage (ICS) solar water heating systems. Re-newable Energy: An International Journal 14 (1-4): 11-16.
Hottel, H. C. and B. B. Woertz. 1992. Performance of flat plate so-lar heat collectors, Transaction of the American Society of Mechan-ical Enginering, 64:91 Journal of
Energy Research. 16(5): 365-372.Parampal Singh, S. S. Dhaliwal, and
Singh Sukhmeet. 2004. Evalu-ation and development of inte-grated solar water heater. Annual Report 2002-2003, Thir teenth annual workshop at spreri vallabh vidya Nagar, Gujarat, January 7-10, 2004-IV1-IV14.
Sinha, S., G. N. Tiwari, and M. S. Sodha. 1992. Techno-economic analysis of solar distillation sys-tem. International Journal of En-ergy Research. 16(5): 365-372.
Tabor, H. 1958. Radiation, Convec-tion and conduction coefficients in solar collectors, Bulletin of re-search Council of Israel, 6 C:155
■■

AGRICULTURAL MECHANIZATION IN ASIA, AFRICA, AND LATIN AMERICA 2008 VOL.39 NO.414
Comparative Grain Supply Chain in Canada and ChinabyL. FanGraduate StudentDept. of Biosystems Engineering,University of Manitoba,Winnipeg, Manitoba, R3T 5V6CANADA
D. S. JayasDistinguished ProfessorDept. of Biosystems Engineering,University of Manitoba,Winnipeg, Manitoba, R3T 5V6CANADA
AbstractAbout 50 % of Canada’s total
production of grain is moved from farm to international grain market every year. In China, a significant amount of grain movement occurs every year to transport grain from surplus areas to deficit regions. Ef-ficient grain supply chain plays an important role in grain economic development. This paper discusses and compares the current scenario of grain handling and transporta-tion systems developed in Canada and China. In Canada, there are four levels of grain storage facilities (on-farm storage, primary elevator, terminal elevator and transfer eleva-tor) that have evolved with the need to satisfy both domestic and inter-national markets. Economic factors have driven the changes in Canada’s grain supply chain. Canada’s grain industry has worked toward achiev-ing high efficiency at all levels. The grain handling and distribution sys-tem in China has developed rapidly during the last few decades. Four major grain distribution systems or grain transit corridors have been established, covering grain move-ment in the Yangtze river region, Northeast region, Southwest region, and Beijing to Tianjing region. Three major levels of grain storage facilities (primary depot, intermedi-ate depot, and port terminal) have evolved in the grain distribution net-works. The investments are aimed
to achieve a significant reduction in grain distribution costs and losses in China.
IntroductionCanada’s grain industry plays a
key role in its gross domestic prod-uct (GDP) and international trade. Canada is one of the main grain producing countries in the world. The grain export system, or the out-bound system of grain movement in Canada, has played a significant role in national economic development. Bulk grain handling and transporta-tion is practiced and has well devel-oped in Canada. Canada has four basic levels in its grain storage sys-tem: on-farm bins, primary eleva-tors, terminal elevators and transfer elevators. These share the same basic function of storing grain, but differ in the way each functions in Canada’s overall grain supply chain. There were 382 primary elevators, 17 terminal elevators, and 13 trans-fer elevators in Canada as of 2002 (Canada Grain Commission, 2004 and Geary, 2004). Canada’s primary elevator facilities create a critical interface between the farmers and world markets. The 17 terminal el-evators provide a link between land and water. The majority of grain exported from Canada is handled th rough these ter minal eleva-tors. Another link in the chain of Canada’s grain distribution system
is the 13 transfer elevators which are located along the Great Lakes/ St. Lawrence Seaway and along the Atlantic coast. Road, rail, and wa-ter modes are involved in Canada’s transportation network to deliver grain from farm to foreign or do-mestic market.
China’s bulk grain handling and distribution system has been devel-oped through the implementation of the Grain Distribution and Market-ing Project (GDMP), initiated in 1992 and completed in 1999. The major objectives of GDMP were to improve the efficiency of moving grain from surplus to deficit areas and to shift from bags to bulk han-dling. The concept of grain transit corridors was introduced to facili-tate a structured approach. Four ma-jor grain transit corridors or grain distribution networks have been established in China, namely the Yangtze river corridor, Northeast corridor, Southwest corridor, and Beijing to Tianjing corridor.
The Yangtze river grain transit corridor mainly deals with the grain inf low and outf low for provinces along the Yangtze river. Six port terminals have been constructed to handle grain movement along the Yangtze river (Dekkers et al., 1999). The Northeast grain transit corridor plays an important role in dealing with grain movement into or out of Northeast provinces. Three grain storage levels are involved in the Northeast grain transit corridor,

VOL.39 NO.4 2008 AGRICULTURAL MECHANIZATION IN ASIA, AFRICA, AND LATIN AMERICA 15
including 279 primary depots, 59 intermediate depots, and one port terminal (GDMP, 1992). Required grain in the Southwest region can be supplied via the Southwest grain transit system. One port terminal lo-cated in the Fangcheng port creates the link between the import and lo-cal consumption markets (Dekkers et al., 1999). Beijing to Tianjing grain transit corridor facilitates grain movement between these two major municipalities in China (Ap-proval Report of GDMP 1993).
The objectives of this paper are to report on current grain distribution network that have been developed in Canada and China, including: (1) to discuss classification of grain stor-age facilities and major functions of each storage level in Canada and China, (2) to analyze grain flow and how grain is moved through the grain distribution network in Can-ada and China, and (3) to discuss the major changes in Canada’s and China’s grain handling and trans-portation system.
Grain Supply Chain in CanadaAn Overview
Canada’s population, geogra-phy, and climate largely determine the nature of grain industry. The population of Canada is 31 mil-lion people and 90 % live along the border between Canada and the United States. Canada’s agricultural production is concentrated in the western prairie region and southern areas of Ontario and Quebec. The agriculture region in eastern Canada is small and the population is large. The grain production in eastern areas concentrates on supplying the domestic market. Due to the small population and large land areas in Western Canada, these prairie areas focus on growing crops for export. A high level of productivity and low population enables Canada to export grains, oilseeds, pulses, and special
crops at approximately 30 Mt each year, representing around 50 % of its total production (Agriculture and Agri-Food Canada, 2004). The ef-ficient grain supply chain is remark-able in view of physical difficulties imposed by the geography and climate of Canada and has played an important role in Canada’s grain economy. Usually the grain f lows from producer to consumer involv-ing four levels: on-farm storage, primary elevators, terminal eleva-tors, and/or transfer elevators, using various transport modes at different levels (Geary, 2004 and Westdal, 2002).
On-farm Storage FacilitiesMore grain is being stored in on-
farm storage than ever before due to the decrease in number and storage space in the Canada’s commercial elevator system. The majority of on-farm storage structures in Western Canada have an average capacity of between 50 to 200 t each, while in Eastern Canada, the capacity is from 350 to 500 t (Geary, 2004). Galvanized steel bins are now the popular type on grain farms in Canada. Many farm storages are equipped with heated air drying, and/or near-ambient air drying equipment to reduce the high mois-ture content of harvested grain and aeration equipment to eliminate temperature gradients. For export, grain is unloaded from on-farm storage into trucks, e.g. a 40 t truck (Super B train), delivered to pri-mary elevators, and through termi-nal elevators or transfer elevators to international markets.
Grain ElevatorsPrimary Elevators: Primary el-
evators play an important role in Canada’s grain supply chain and provide a link between producers and world grain markets. Accord-ing to the Canada Grain Act (2000), a primary elevator receives grain directly from producers for storing and shipping to other destinations.
The primary elevators in Canada are designed to receive grain from pro-ducer’s farm trucks, store the grain in bulk lots in separate bins accord-ing to type and grade of grain, and transfer it quickly and efficiently into railcars for shipment to port elevators for export or to domestic markets.
Several changes or modifications have been made to primary elevator design. Better utilization of facili-ties occurs by continuing to consoli-date small operations and replacing them with fewer but larger facilities in strategically located areas. Older wooden elevators are being replaced by concrete and steel elevators. Due to the great efficiency that has been achieved through economics of scale available at large facilities, and modernization of the primary eleva-tor facilities, fewer elevators are able to handle more grain than ear-lier smaller elevators (Geary, 2004 and Berry, 1993). There were 2,843 licensed primary elevators in the year 1983-1984, 1,465 in the year 1993-1994, and only 382 in the year 2003 with a total storage capacity of 5 Mt. These primary elevators are located throughout Western Canada’s vast grain production area, including 83 in Alberta, 7 in Brit-ish Columbia, 90 in Manitoba, and 202 in Saskatchewan (Canada Grain Commission, 2004). The individual storage capacity of primary eleva-tors ranges from 5,000 to 100,000 t (Geary, 2004). Most elevators are able to store many types and grades of grain at one time. Almost all primary elevators in Canada are constructed beside railway tracks (Tryon, 1993).
Terminal Elevators: In Canada, the principal uses of terminal el-evators are the receiving of grain upon or after the official inspection and official weighing of the grain, cleaning, storing, and treating of the grain before it is moved forward (Canada Grain Act, 2000). The pri-mary emphasis at terminal elevators is on grain collection and prepara-

AGRICULTURAL MECHANIZATION IN ASIA, AFRICA, AND LATIN AMERICA 2008 VOL.39 NO.416
tion for shipment to international or domestic markets. They receive grain arriving by rail from western Canada and load it into lakers or ocean going vessels destined for either export or transfer elevators in Eastern Canada. Trucks have not played an important role in moving grain to terminal elevators. Termi-nal elevators provide a link between land and water.
Grain destined for export from primary elevators moves princi-pally to four Canadian ports. As of 2002, there were a total of 17 licensed terminal elevators with a total storage capacity of about 2.7 Mt, one at Churchill, MB; one at Prince Rupert, BC; nine at Thunder Bay, ON; and six at Vancouver, BC (Geary 2004) (Fig. 1). The majority of terminal elevators range in stor-age capacity from about 100,000 to 300,000 t. Grain is shipped to foreign customers from the west coast and the port of Churchill via the Pacific Ocean and Hudson Bay, respectively. Export grain loaded on lakers at Thunder Bay moves through the Great Lake/St. Law-rence Seaway system to one of the deep-water transfer elevators along the St. Lawrence Seaway and trans-fers to a large sea-going vessel head-ing to export markets or is directly shipped by ocean-going vessel from Thunder Bay to Atlantic ocean.
Transfer Elevators: Another link in the chain of Canada’s grain distri-
bution system is the transfer eleva-tors. Transfer elevators are defined as being elevators in the eastern region (Canada Grain Act, 2000). The principal use of transfer eleva-tors is to transfer grain that has been officially inspected and officially weighed at another elevator, i.e. pri-mary or terminal elevator, as well as receiving, cleaning, and storing of eastern grain or foreign grain. In 2002, there were 13 transfer eleva-tors located along the Great Lakes/St. Lawrence Seaway system and the Atlantic Coast with total stor-age capacity of 2.3 Mt. One transfer elevator is located in Nova Scotia, six in Ontario, and six in Quebec (Geary, 2004) (Fig. 2). The storage capacity of transfer elevators ranges from 29,000 to 440,000 t. The de-sign of transfer elevators is similar to terminal elevators (Thompson, 1993). Transfer elevators provide a number of services. They service both export and domestic markets. They are used as storage facilities for cleaned grain delivered by water from terminal elevators in Thunder Bay to be loaded onto ocean ves-sels (salties) for export. Some grain shipments are moved from primary elevators by rail directly to these transfer elevators by passing the terminal elevators at Thunder Bay. The majority of transfer elevators also handle some grain from the United States. The transfer elevators located along Lake Huron are pri-
marily servicing domestic markets. They unload grain from lakers and also handle grain grown in Ontario and transfer it to domestic markets (Geary, 2004 and Tryon, 1993).
Grain TransportationRailway Transportation: Rail
transportation has played a criti-cal role in Canada’s grain industry. Once in the elevator system, West-ern Canadian grain moves forward from the production area to port ter-minals almost exclusively by rail. A smaller amount of grain is moved by rail or trucks to domestic users or into US markets. Grain destined for West Coast terminals or Churchill moves only by rail. Eastbound grain is generally unloaded and inspected at the terminals in Thunder Bay. At Thunder Bay the grain is some-times loaded into ocean vessels, but more often put into lake vessels for transport to transfer terminals along the St. Lawrence Seaway. In addi-tion, when the port of Thunder Bay is closed during the winter season, grain will be moved by rail farther down to the transfer elevators along the St. Lawrence Seaway to serve domestic and international markets (Westdal, 2004 and Transport Can-ada, 2003). For export markets, the majority of grain is transported by rail to four ports at Churchill, Prince Rupert, Thunder Bay, and Vancou-ver (Clegg, 1993). Some grain is directly transported to the transfer
Fig. 1 Terminal elevator locations in Canada (Geary, 2004) Fig. 2 Transfer elevator locations in Canada

VOL.39 NO.4 2008 AGRICULTURAL MECHANIZATION IN ASIA, AFRICA, AND LATIN AMERICA 17
elevators along the St. Lawrence Seaway (Fig. 3). Most grain move-ment is handled by two major rail companies, i.e. Canadian National (CN) and Canadian Pacific (CP). OmniTRAX handles the movement of grain to the port of Churchill (Canada Transportation Agency, 2004 and Transport Canada, 2003). Grain movement by rail from pri-mary elevators to four terminal elevators and eastern transfer eleva-tors is in covered steel hopper cars (Canadian Wheat Board, 2004a).
Great Lakes/St. Lawrence Sea-way Transportation: The move-ment of grain to eastern ports is mostly carried out by water. The Great Lakes/St. Lawrence Seaway system is one of the main transpor-tation networks serving Canada and U.S.A. The grain industry in Can-ada depends on the Great Lakes/St. Lawrence Seaway transporta-tion system to handle about one-quarter of its yearly grain export.The Canadian Seaway begins at Thunder Bay, on the northwestern shore of Lake Superior, about 3,000 km from salt water and nearly half-way across Canada (Canada Wheat Board, 2004b). One of the world’s largest concentrations of bulk grain storage is located at Thunder Bay, consisting of 9 terminals with a capacity for 1.4 Mt of grain (Geary, 2004). Each year large quantities of both domestic and export grain pass through these terminal elevators.
From Thunder Bay, grain ship-
ment is carried out through the Seaway network via natural pas-sageways and man-made canals and locks. Canals are built to provide links from Lake Superior to Lake Huron and from Lake Erie to Lake Ontar io. Grain moves th rough Lake Superior via locks at Sault Ste Marie to Lake Huron, and through locks between Lake Erie and Lake Ontario. The St. Lawrence Seaway system provides ship access from Lake Ontario to the Atlantic Ocean.
The elevators located along the Seaway Lakes system serve domes-tic and world markets. Those eleva-tors which are not serviced by rail are mainly involved in transferring export grain from lakers to ocean ships (Canada Wheat Board, 2004b and Tryon, 1993). The Great Lakes/ St. Lawrence Seaway system, link-ing Thunder Bay with the Atlantic, provides an important access route for grain movement. The movement of grain east from Thunder Bay is a significant facet of the Canada grain distribution and handling system.
Grain Handling and Dis-tribution System in ChinaAn Overview
China is characterized by high density population and vast areas with imbalance in grain produc-tion and consumption. Northeast region is a major producer of corn. The major grain outf low from the
areas along Yangtze river is rice. By comparison, the southern region of China is a major deficit region. A significant amount of grain move-ment occurs every year to transfer grain from areas of surplus to areas of high population concentration or deficit production or both. This movement requires the economical use of appropriate distribution net-works. Before the implementation of China Grain Distribution and Mar-keting Project (GDMP), which was initiated in 1992 and completed in 1999, the grain handling and trans-portation system was underdevel-oped. Insufficient capacity of grain storage facilities and inefficiency in the grain handling and distribution system were the major issues. Grain was stored, handled, and transport-ed in bags. Congestion and queuing problems were due to lack of bulk handling equipment, transporta-tion, and storage facilities. China’s GDMP had been formed because of the need to satisfy efficient grain movement. The GDMP was devel-oped following a major World Bank grain sector study. The investments allowed a major shift from bags to bulk handling and achieved a sig-nificant reduction in grain distribu-tion costs and losses. The concept of “grain transit corridors” was introduced to facilitate a structured approach in GDMP.
The four principal grain transit corridors had been planned and implemented in the Yangtze river
Fig. 3 Grain movement by rail from primaryelevators to export terminals
Fig. 4 Map of China showing the principal provinces and locations of eight port terminals involved in the GDMP
AGRICULTURAL MECHANIZATION IN ASIA, AFRICA, AND LATIN AMERICA 2008 VOL.39 NO.418
region, Northeast region, South-west region, and Beijing to Tianjing region. There are eight port grain terminals, 64 intermediate grain depots, and 279 primary depots that were constructed through GDMP.The provinces, autonomous region, and municipalities as well as loca-tions of eight port grain terminals involved in GDMP are shown in Fig. 4.
Another important period in Chi-na’s grain industry is the implemen-tation of the State Grain Reserve Facility Project, which started in 1998. There are 1,273 grain reserve depots with a total storage capacity of 45 Mt that have been constructed throughout China’s grain production area (China State Grain Adminis-tration, 2004). The grain reserve depots store grain for long periods with a focus on strategic and securi-ty purposes such as being prepared for famines, natural disasters, etc., and therefore they will have unique requirements for maintaining the quality of stored grain.
This paper mainly analyzes the grain distribution networks with focus on quick transfer purpose in China.
Yangtze River Grain Transit Cor-ridor
The Yangtze region includes five provinces (from east to west: Jiang-shu, Anhui, Jiangxi, Hubei, Hunan) and one municipality (Shanghai). This grain transit corridor, along which grain flows beside the Yang-tze river from downstream to up-stream, was set up to establish an efficient grain distribution network through the Yangtze river district.
Grain Flow: Rice, wheat, and corn are the main cereal grains grown in the Yangtze river region. The wheat produced in the Yangtze river region is soft wheat, requiring imports of hard wheat from over-seas to mix with it to produce the required products. Grain inf lows (corn, imported wheat, and soy-bean) into the provinces and major
municipalities of the Yangtze river region are for local consumption. Grain flows outwards to provinces and municipalities within and out-side the Yangtze river region.
The grain movement into and out of the provinces and major munici-palities of the Yangtze river corridor via the Yangtze river do not all have to pass through Yangtze river termi-nals. Part of these grains may go di-rectly by boat from Yangtze lakes or tributaries to out of Province or mu-nicipality destinations. Cross border grain movement is primarily taking place via the Yangtze river and also by rail. For the grain flows via the Yangtze river, Shanghai municipal-ity is the major deficit area (wheat, rice, and corn) and Anhui province is the major surplus area (wheat and rice). An overview of origins and destinations of major grain of the Yangtze river corridor is shown in Table 1 (Aalders et al., 1992).
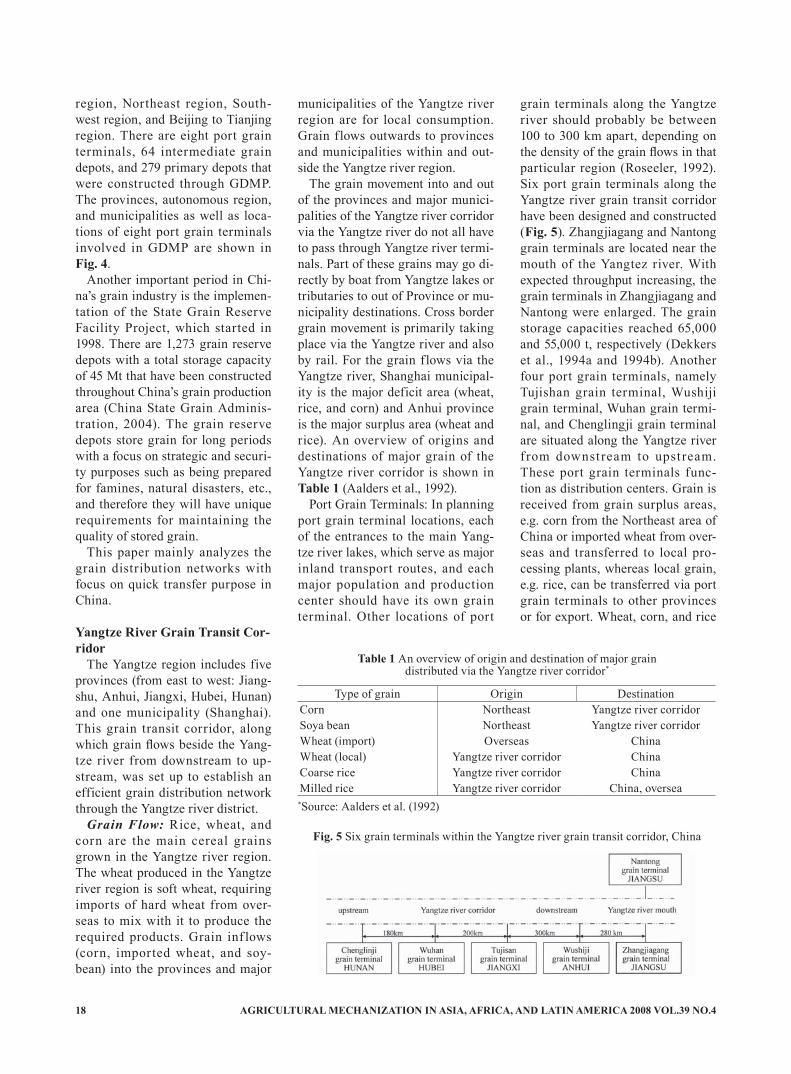
Port Grain Terminals: In planning port grain terminal locations, each of the entrances to the main Yang-tze river lakes, which serve as major inland transport routes, and each major population and production center should have its own grain terminal. Other locations of port
grain terminals along the Yangtze river should probably be between 100 to 300 km apart, depending on the density of the grain flows in that particular region (Roseeler, 1992).Six port grain terminals along the Yangtze river grain transit corridor have been designed and constructed (Fig. 5). Zhangjiagang and Nantong grain terminals are located near the mouth of the Yangtez river. With expected throughput increasing, the grain terminals in Zhangjiagang and Nantong were enlarged. The grain storage capacities reached 65,000 and 55,000 t, respectively (Dekkers et al., 1994a and 1994b). Another four port grain terminals, namely Tujishan grain terminal, Wushiji grain terminal, Wuhan grain termi-nal, and Chenglingji grain terminal are situated along the Yangtze river f rom downstream to upst ream. These port grain terminals func-tion as distribution centers. Grain is received from grain surplus areas, e.g. corn from the Northeast area of China or imported wheat from over-seas and transferred to local pro-cessing plants, whereas local grain, e.g. rice, can be transferred via port grain terminals to other provinces or for export. Wheat, corn, and rice
Type of grain Origin DestinationCorn Northeast Yangtze river corridorSoya bean Northeast Yangtze river corridorWheat (import) Overseas ChinaWheat (local) Yangtze river corridor ChinaCoarse rice Yangtze river corridor ChinaMilled rice Yangtze river corridor China, oversea
Table 1 An overview of origin and destination of major graindistributed via the Yangtze river corridor*
*Source: Aalders et al. (1992)
Fig. 5 Six grain terminals within the Yangtze river grain transit corridor, China

VOL.39 NO.4 2008 AGRICULTURAL MECHANIZATION IN ASIA, AFRICA, AND LATIN AMERICA 19
are the main cereal grains trans-ported in this corridor.
Northeast Grain Transit CorridorThe Northeast grain transit cor-
ridor covers the grain distribution and handling system in Liaoning, Jilin and Heilongjiang provinces, and Neimenggu autonomous region. The Northeast region is the major production area of corn. Each year amount of surplus corn will be moved to the other areas of China or for export. Grain inflow into the Northeast provinces for local con-sumption is mainly imported and domestic wheat.
The grain flows in the Northeast grain corridor involve three levels, i.e. primary depots, intermediate de-pots, and port terminals. There are 279 primary depots, 59 intermediate grain depots, and one port terminal that have been built in this grain transit corridor (GDMP, 1992). The port terminal, located on Dalian bay (Fig. 6), has been further modern-ized and enlarged during the pro-cess of implementation. At present, its total storage capacity reaches 1.5 Mt and annual throughput reached 10 Mt in 2003 (Dalian Beiliang Lo-gistics Services Ltd., 2004). Dalian Beiliang port terminal has played an important role in moving grain into or out the Northeast provinces and has become the biggest grain export port in China (Ministry of Commu-nication of China, 2004).
As shown in Fig. 6, the interme-diate depots are concentrated in the
Northeast region: 11 in Liaoning province, 17 in Heilongjiang prov-ince, 25 in Jiling province, and six in Nei Menggu autonomous region (GDMP, 1992). The main functions of the intermediate grain depots are the receiving of dried grain from primary depots or receiving imported grain from the port termi-nal, weighing, cleaning, and stor-ing grain in readiness for forward movement to local processing plants or to a port terminal. The primary depots are located throughout vast grain production areas in Northeast provinces. The purposes of primary depots are to receive grain from farmers, clean, weigh, dry, and store the grain in readiness to transfer it to processing plants, intermediate depots, or to Dalian port terminal destined to the other regions of China or export. Through the imple-mentation of GDMP, an effective grain distribution framework has been established in Northeast prov-inces.
Southwest Grain Transit CorridorThe Southwest grain transit cor-
ridor mainly covers the grain dis-tribution network within Guangxi autonomous region. Guangxi auton-omous region is one of major grain deficit areas in China. The major grain inf low includes wheat and corn. Before the implementation of Southeast grain transit corridor proj-ect, these grains had been moved by rail from the Northeast of China as well as by ships through the ports of
Fangcheng. Although wheat arrived at port in bulk, all transportation by rail and truck was in bags. The corn that had been moved to South by sea had been in bags for both the ship and inland transportation. The pur-pose of this corridor is to maximize the use of sea transport to the extent that is economical and to provide the physical infrastructure needed for all wheat and corn brought to the region by sea to be handled entirely in bulk to destination. Inland trans-portation was primarily by rail and truck for secondary distribution. The projected grain transit corridor includes bulk port terminal, inter-mediate depots, and small grain depots within Guangxi autonomous (Williams et al., 1992). Throughout the implementation of GDMP, one port terminal located in Fangcheng port was constructed with stor-age capacity of 50,000 t. The main function of this port terminal is to receive grain from other areas of China or from overseas by water and than transfer it to the destina-tion points in an efficient manner.Four grain depots have been built in the inland areas of Guangxi autono-mous, one each in Guilin, Liuzhou, Luzhai, and Nanning (Dekkers et al., 1999). The developed grain dis-tribution network in Southwest is shown in Fig. 7.
Beijing to Tianjing Grain Transit Corridor
To meet grain demands for the two large population municipalities, i.e. Beijing and Tianjing, one inter-mediate grain depot with a storage capacity of about 62,000 t was de-signed and constructed (Approval Report of GDMP, 1993). Grain sup-plied from other areas is distributed via this intermediate depot to pro-cessing plants located in these two municipalities.
DiscussionIn Canada, almost all the grains
Fig. 6 Locations of one port terminal and59 intermediate depots (ID) in the North-east grain transit corridor of China
Fig. 7 Locations of one port terminaland four intermediate grain depots inthe Sorthwest grain corridor, China

AGRICULTURAL MECHANIZATION IN ASIA, AFRICA, AND LATIN AMERICA 2008 VOL.39 NO.420
are handled and stored in bulk. A small amount of grain is handled in containers to meet specific customer requirements. The four levels of grain storage facilities have played different roles in the overall grain handling and transportation system. The objective is to develop an ef-ficient grain supply chain to achieve a competitive edge in international grain market. Economic factors have driven changes in Canadian grain storage facilit ies and the transportation system. In the trans-portation system, the grain move-ment from farm storage to primary elevator is handled by large truck configuration, i.e. 40 t super B train instead of 5-10 t small farmer truck. The use of commercial trucking is growing and trucking costs percent-age in the total logistics costs is also expected to rise significantly due to the consolidation of rail and pri-mary elevator network (Transport Canada, 2003).
Rail charges account to about 50 % of total grain logistics costs. This f igure might reduce due to con-solidation of primary elevator and increasing road hauling distance. However, the rail will continuously play an important role to move grain from primary elevators to foreign and domestic markets. The maximum carrying capacity of the covered hopper cars with 110 t are now popularly used in Canadian rail network. Because of their greater capacity and ease of loading and un-loading, covered hopper cars have now replaced boxcars for movement of bulk grain (Canadian Wheat Board, 2004a; Transport Canada, 2003 and Clegg, 1993).
Canadian grain handling system worked to achieve a highly efficient system using ‘elevator’ system. High volume grain moving through the primary elevator requires a quick and efficient handling system. High through put elevators are now characterized by their high han-dling efficiency and are able to load
and unload grain at same time. As in Canada’s port elevator system, computerization and mechanized operations are increasing at primary elevator level. The primary eleva-tors have been developed like inland terminals on prairies. Grain can be cleaned to meet export standard and destined to foreign market directly, e.g. the United States.
Port grain elevators are major intermodal interfaces. Highly com-plex handling system, automation and computerization represent the modern technology application in Canada’s port elevator system. An information system has become an essential part in supply chain man-agement and is applied to Canada’s grain industry. Information and computer systems allow tracking grain movement through the entire terminal system to the final con-sumers. A computerized inventory control system monitors exactly what quantity, type, and grade of grain is being received, stored, and shipped (Geary, 2004).
In comparison with Canadian grain handling and transportation system, the concept of bulk grain handling and transportation system has been applied to China’s grain industry in a relatively short period. Because there is no on-farm storage in China’s grain depot system, the function of primary depot in China is like Canada’s on-farm storage. The design of intermediate depot and port terminal in China’s grain industry is similar to Canada’s pri-mary elevator and terminal elevator, respectively. A fully mechanized and computerized system has been applied in these two levels of stor-age facilities to enable grain to be handled quickly and efficiently. By comparison, the bulk grain trans-portation system is not well devel-oped and has become a bottleneck issue in China’s grain supply chain. Currently, the small truck is com-monly used to transport grain for short distances. For long haul, 60 t
not-covered boxcars are still a popu-lar type in rail transportation. The use of large trucks and covered hop-per railcar is expected to increase significantly in the future. Because of large population and vast areas of China, significant amount of intra-provincial, inter-provincial grain movement occurs every year. The developed bulk grain network only accounts for a small part of its total volume. Grain handled in bags still represents a large proportion and will co-exist together with bulk sys-tem for a certain period.
ConclusionCanada’s grain distribution and
handling system has developed to ensure the movement of large quan-tities of grain from the prairies to international and domestic markets. Four levels of grain storages and various transport modes (road, rail, and water) are involved in Canada’s grain supply chain. The efficient bulk grain distribution and handling system is remarkable and has played an important role in Canada’s grain industry. Mechanized and comput-erized modern elevators with high throughput are the new reality in Canada’s grain distribution system.
China’s Grain Distribution and Marketing Project (GDMP) struc-tures the bulk grain supply chain in four grain transit corridors. Through the implementation of GDMP in-vestment, throughput capacity and efficiency of the grain distribution system have been improved by a change from bag to bulk grain han-dling and by upgrading storage and handling system components. The GDMP and State Grain Reserve Facility Project aimed to facilitate the bulk grain storage, handling, and distribution system and will contribute to further development of a nation-wide grain distribution network in China.

VOL.39 NO.4 2008 AGRICULTURAL MECHANIZATION IN ASIA, AFRICA, AND LATIN AMERICA 21
REFERENCES
Aalders, L., A. D. Hartog, and S. Roseeler. 1992. China grain dis-tribution and marketing project, feasibility study report on Yang-tze river corridor. Beijing, China: Ministry of Commerce.
Agriculture and Agri-Food Canada. 2004. Canada: crop production, consumption, and expor ts. In Grains & Oilseeds Handling, Marketing, and Processing, 5th edition. Winnipeg, MB: Canadian International Grains Institute.
Approval Report of GDMP. 1993. Beijing, China: Ministry of Com-merce.
Berry, A. E. 1993. Canada’s primary elevator system. In Grains & Oil-seeds Handling, Marketing, and Processing, 4th edition, ed. A.W. Tremere, 139-164. Winnipeg, MB: Canadian International Grains In-stitute.
Canada Grain Act. 2000. http://www.grainscanada.gc.ca/Regu-latory/CGCAct/2000/cgc2000- e.pdf (2004/08/07).
Canada Grain Commission. 2004. Grain Elevators. ht tp://www.grainscanada.gc.ca/fag /elevdecr-e.htm (2004/07/24).
Canada Transportation Agency. 2004. http://www.cta-otc.gc.ca/rulings-decisions/decisions/2003/R/713-R-2003-ehtml (2004/08/05).
Canada Wheat Board. 2004a. The Canadian Wheat Board market-ing system. In Grains & Oilseeds Handling, Marketing, and Pro-cessing, 5th edition. Winnipeg, MB: Canadian Inter nat ional Grains Institute.
Canada Wheat Board. 2004b. Grain and the Great Lakes Seaway Sys-tem. In Grains & Oilseeds Han-
dling, Marketing, and Processing, 5th edition. Winnipeg, MB: Ca-nadian International Grains Insti-tute.
GDMP. 1992. Feasibility study re-port on Northeast corridor. China Grain Distribution and Marketing Project. Beijing, China: Ministry of Commerce.
China State Grain Administration. 2004. Implementation News of State Grain Reserve Depots. http://www.chinagrain.goc.cn/ccyjs/ 20040721b.html (2004/07/25).
Clegg, C. 1993. Railways in Cana-da’s grain transportation system. In Grains & Oilseeds Handling, Marketing, and Processing, 4th edition, ed. A.W. Tremere, 165-180.Winnipeg, MB: Canadian International Grains Institute.
Dalian Beiliang Logistics Services Ltd. 2004. http://www.dblc.com.cn/beiliang/zn-cn (2004/08/08).
Dekkers, J., M. Philip, and L. Fan. 1994a. China Grain Distribution and Marketing Project, prelimi-nary design report on Zhangji-agang grain terminal. Rotterdam, Netherlands: GEM Consultant B.V.
Dekkers, J., M. Philip, and L. Fan. 1994b. China Grain Distribution and Marketing Project, prelimi-nary design report on Nantong grain terminal. Rotterdam, Neth-erlands: GEM Consultant B.V.
Dekkers, J., E. Cevall, and L. Fan. 1999. China Grain Distribution and Marketing Project, supervi-sion report on Southwest corridor and Yangtze river corridor. Bei-jing, China: Ministry of Domestic Trade.
Geary, A. 2004. Grain silos in Can-ada. In Grains & Oilseeds Han-dling, Marketing, and Processing,
5th edition. Winnipeg, MB: Ca-nadian International Grains Insti-tute.
Minist ry of Communication of China. 2004. http://www.moc.gov.cn/news/2004-03 (2004/07/28).
Roseeler, S. R. 1992. Technical report on Yangtze river corridor. Beijing, China: Ministry of Com-merce.
Thompson, M. R. 1993. Canada’s terminal elevator system. In Grains & Oilseeds Handling, Marketing, and Processing, 4th edition, ed. A.W. Tremere, 199-232.Winnipeg, MB: Canadian International Grains Institute.
Transpor t Canada. 2003. Grain handling and transportation sys-tem. http://www.tc.gc.ca/plo/en/Report/grainMonitoringProgram/ghts_appendix.htm (2004/11/02).
Tryon, J. T. 1993. The evolution of Canada’s grain handling and transportation system. In Grains & Oilseeds Handling, Marketing, and Processing, 4th edition, ed. A. W. Tremere, 115-139.Winni-peg, MB: Canadian International Grains Institute.
Westdal, P. 2002. Post farm food safety - strategic plan. Winnipeg, MB, Canada.
Westdal, P. 2004. Competitive wheat marketing systems. In Grains & Oilseeds Handling,
Marketing, and Processing. 5th edi-tion. Winnipeg, MB: Canadian International Grains Institute.
Williams, B. S., D. Palko, and W. Gerrish. 1992. China Grain Dis-tribution and Marketing Project, technical report on Southwest corridor. Beijing, China: Ministry of Commerce.
■■

AGRICULTURAL MECHANIZATION IN ASIA, AFRICA, AND LATIN AMERICA 2008 VOL.39 NO.422
Investigation into Farm Mechanization Practices for Cassava and Yam in Rivers State, Nigeria
byS. O. NkakiniDept. of Agricultural and Environmental Engineering,Rivers State University of Science and Technology,P.M.B. 5080, Port [email protected]
O. CederDept. of Agricultural and Environmental Engineering,Rivers State University of Science and Technology,P.M.B. 5080, Port HarcourtNIGERIA
AbstractThe present state of farm mecha-
nization practices for energy utiliza-tion in yam and cassava cultivation was assessed in Rivers State and is presented in this paper.
Field surveys were conducted in several farms, Ministry of Agricul-ture and Agricultural Development Project (ADP) in the 23 local govern-ment areas of the state. To ascertain data, a structured questionnaire, personal visits to farm and discus-sions with record holders were used. The state’s current situation for energy utilization in tractorization operations for these two crops were highlighted and compared with their traditional operations. Within the pe-riod of 1986-2004 energy utilizations in the productivity of these crops were 2,738.87 MJ and 33.5 MJ for machine power and traditional op-erations respectively. Tractorization Intensity (IT) which described the use of the tractor as the pivot of ag-ricultural mechanization in the state dropped from 0.352 hp/ha in 1986 to 0.345 hp/ha in 2004. This result was below the recommended 0.5 hp/ha (T.I) for efficient agriculture. This study identified the causes of these shortcomings and recommended that the right attitude towards use of farm machinery and the industrialization of all sectors should be encouraged.
IntroductionIn the pre-independence era, the
dominant role of agriculture in Nige-ria’s economy was taken for granted. Rivers State in the Eastern Region was not exempted. The first decade after independence, was a period when the Regional Governments were involved in direct agricultural production activities to comple-ment the output of the private sec-tor, peasant farmers and fishermen (Meshach-Hart E. T., 2000).
At this time, the main agricultural development was mainly on export crops like Cocoa, in the Western Region, groundnuts and cotton in the Northern Region, palm produce and rubber in the Eastern Region. Within this period, self-sufficiency in food production seemed not to pose any problems worthy of pub-lic attention. Two decades after independence witnessed greater involvement of government in ag-ricultural development, which was associated with rapid deterioration in the country’s and state’s agricul-tural situation. The situation was further worsened by the attention towards “Oil Boom”, which created serious migration of labour from the agricultural sector. Prior to 1971, Rivers State practiced both subsis-tence and cash crop agriculture and relied solely on human beings as
source of power and energy. Among the major crops grown in the state were rubber, oil palm, cassava, yam, cocoyam, and pepper. However, productivity was very low because as Liljedhal et al. (1979) stated, hu-man beings are limited to less than 0.1 kW continuous output and were very ineffective and inefficient as power units or engines.
To remedy this ugly situation, the practices of agricultural mecha-nization in the state started. It be-gan during the period of the first military administration (1967-1976) with the procurement of the first batch of tractors and farm imple-ments in 1971. The state established several farms and programmes in different parts of the state, including tractor-hiring units in all the local government headquarters. The state also trained the requisite manpower at the Agricultural Mechanization Training Centre in Oyo State in 1971 to handle the machinery fleet. Thereafter, the successive military and civilian administrations in the state both procured various makes and models of tractors at different time of their regimes as the need arose, up to this present time.
In the State farm, holdings were very small. They ranged between 0.25 to 5 ha with an average of about 2.63 ha. They were owned and operated by the farmers and
VOL.39 NO.4 2008 AGRICULTURAL MECHANIZATION IN ASIA, AFRICA, AND LATIN AMERICA 23
their households and were often widely dispersed spatially. A farmer and his household cultivated be-tween 2 and 4 non-contiguous farm plots in a farming season. Hectarage cultivated in such a case was given by the total hectarage of all spatially dispersed farming plots (Allison-Oguru, 1995 and Allison-Oguru et al., 1998, 1999).
Tillage and cultivation were me-chanical land preparation opera-tions, which break and stir up the soil in readiness for crop planting (Odigbo, 1991). In this period, land preparation was predominantly manual operation. Hoes were the universally accepted implements for land preparation in the state.
According to Kepner (1978), the increased production that had been realized during the past century must be credited to better crop vari-eties, the more effective use of fer-tilizers, improved cultural practices, and more essentially, the increased utilization of non-human energy and
of the more effective machines and implements.
Thus, the objectives of this paper were to investigate and collect infor-mation on the present level of farm mechanization energy utilization and assessed tractorization intensity (TI) in the state. This would assist the government in looking into her deficit for updating and encourage farmers on profitable utilization of machine power.
Materials and MethodsFor this study, the main source
of information was from the State Ministry of Agriculture, through personal visits to the farms and dis-
cussions with record holders. Field surveys were conducted in the 23 local government areas of the state and Agricultural Development Proj-ect (ADP) and farms. Further data were obtained by using a structured questionnaire to record informa-tion in agricultural mechanization practices, which covered farm sizes, cultivation practices, use of tractors and implements, labour utilization and requirements, energy utilization, timeliness of agricultural operations, availability of credit facilities, farm-ers social condition such as educa-tion, knowledge of farm machines, availability of repair facilit ies, makes, model, number, capacity and year of purchase of tractors.
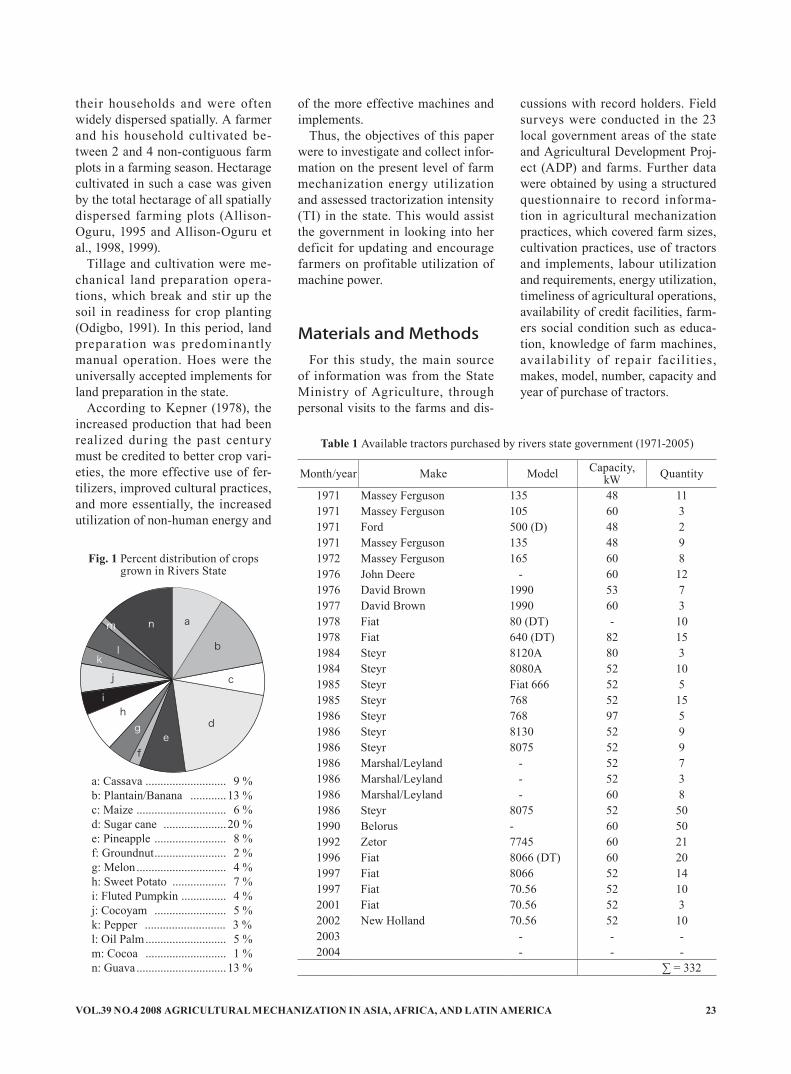
Month/year Make Model Capacity,kW Quantity
1971 Massey Ferguson 135 48 111971 Massey Ferguson 105 60 31971 Ford 500 (D) 48 21971 Massey Ferguson 135 48 91972 Massey Ferguson 165 60 81976 John Deere - 60 121976 David Brown 1990 53 71977 David Brown 1990 60 31978 Fiat 80 (DT) - 101978 Fiat 640 (DT) 82 151984 Steyr 8120A 80 31984 Steyr 8080A 52 101985 Steyr Fiat 666 52 51985 Steyr 768 52 151986 Steyr 768 97 51986 Steyr 8130 52 91986 Steyr 8075 52 91986 Marshal/Leyland - 52 71986 Marshal/Leyland - 52 31986 Marshal/Leyland - 60 81986 Steyr 8075 52 501990 Belorus - 60 501992 Zetor 7745 60 211996 Fiat 8066 (DT) 60 201997 Fiat 8066 52 141997 Fiat 70.56 52 102001 Fiat 70.56 52 32002 New Holland 70.56 52 102003 - - -2004 - - -
∑ = 332
Table 1 Available tractors purchased by rivers state government (1971-2005)
a
a: Cassava ........................... 9 %b: Plantain/Banana ............13 %c: Maize .............................. 6 %d: Sugar cane .....................20 %e: Pineapple ........................ 8 %f: Groundnut........................ 2 %g: Melon .............................. 4 %h: Sweet Potato .................. 7 %i: Fluted Pumpkin ............... 4 %j: Cocoyam ........................ 5 %k: Pepper ........................... 3 %l: Oil Palm........................... 5 %m: Cocoa ........................... 1 %n: Guava ..............................13 %
g
n
b
c
de
f
hi
jk
l
m
Fig. 1 Percent distribution of crops grown in Rivers State
AGRICULTURAL MECHANIZATION IN ASIA, AFRICA, AND LATIN AMERICA 2008 VOL.39 NO.424
Data Collection and ProcessingData collected in each of the 23
local government areas using both primary and secondary sources were analyzed. The primary data were obtained from the structured questionnaire, personal contact and oral interviews, while some physical inspections were also carried out.
By the secondary method relevant information were obtained from the agricultural documents, such as bul-letins, workshop and seminar paper, etc.
The assessment of mechanization was done in two forms: The first was the simple percentage method used to analyze the data obtained in which the current tractorization in-tensity (TI) in the state was comput-
ed by using the equation proposed by Anazodo et al. (1986), as:
T.I = Pu / Ac (hp—/ha) .....................(1)
Pu = [(N)(hp—)(% OP) / 100]
T.I = [(N)(hp—)(% OP) / 100] / Ac
hp— =
where PU = total tractor power in use
(hp)
N = no of tractors available %Op = percentage of operational
tractors Ac = total land area mechanized
(ha)hp
— = weighted average size of
tractor m = 4 group range n = no of tractors in the capacity
rangeh = corresponding average power
in the rangeThe second assessment was on the
energy basis. Suitable energy equiv-alents for human and tractor power were used to convert the man-hr and tractor-hr into (MJ) of energy (Ojha and Michael, 1998) as kWhr = 3.600 × 10⁶ J. where
0.5 hp—/ha = 0.373 kW/ha.
∴Energy = day × 24 × 0.37 kW/ha to convert to kW hr/ha.
For the important crops grown in Rivers State, the energy utilized in the various operations namely land clearing, ridging, mould making, planting, weeding, harvesting were analyzed from the gathered infor-mation.
Results and DiscussionsAn appraisal of tractor acquisi-
tion (1971-2004) revealed the tractor
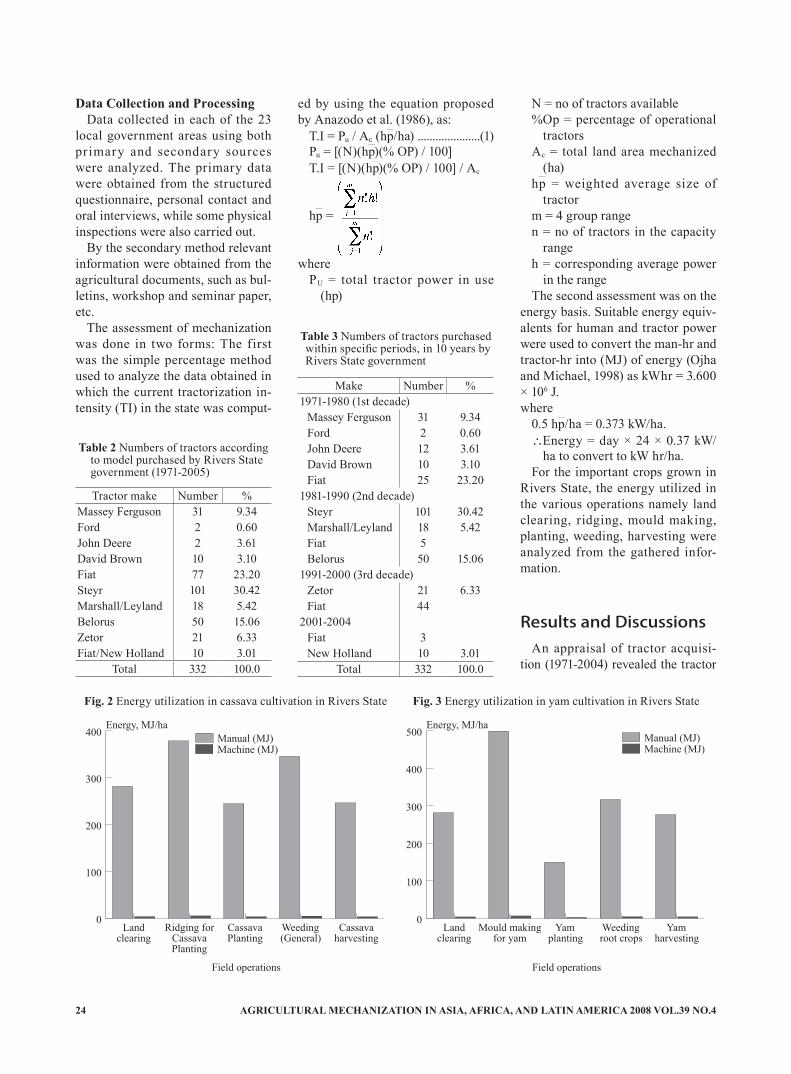
Tractor make Number %Massey Ferguson 31 9.34Ford 2 0.60John Deere 2 3.61David Brown 10 3.10Fiat 77 23.20Steyr 101 30.42Marshall/Leyland 18 5.42Belorus 50 15.06Zetor 21 6.33Fiat/New Holland 10 3.01
Total 332 100.0
Make Number %1971-1980 (1st decade)
Massey Ferguson 31 9.34Ford 2 0.60John Deere 12 3.61David Brown 10 3.10Fiat 25 23.20
1981-1990 (2nd decade)Steyr 101 30.42Marshall/Leyland 18 5.42Fiat 5Belorus 50 15.06
1991-2000 (3rd decade)Zetor 21 6.33Fiat 44
2001-2004Fiat 3New Holland 10 3.01
Total 332 100.0
Table 2 Numbers of tractors accordingto model purchased by Rivers State government (1971-2005)
Table 3 Numbers of tractors purchasedwithin specifi c periods, in 10 years by Rivers State government
Energy, MJ/ha
0
100
200
300
400
Machine
Manual
Cassavaharvesting
Weeding(General)
CassavaPlanting
Ridging forCassavaPlanting
Landclearing
Manual (MJ)Machine (MJ)
Field operations
Energy, MJ/ha
0
100
200
300
400
500
Machine
Manual
Yamharvesting
Weedingroot crops
Yamplanting
Mould makingfor yam
Landclearing
Manual (MJ)Machine (MJ)
Field operations
Fig. 2 Energy utilization in cassava cultivation in Rivers State Fig. 3 Energy utilization in yam cultivation in Rivers State

VOL.39 NO.4 2008 AGRICULTURAL MECHANIZATION IN ASIA, AFRICA, AND LATIN AMERICA 25
sources available for farming in Riv-ers State from 1971-2004, as shown in Table 1. A total of 332 tractors were procured by the state govern-ment. In the table, the variety of trac-tors by makes, model and capacity were also presented. Also from Table 1, it was observed that a total of 25 tractors were purchased in 1971 among which 22 had 48 kW while 3 had 60 kW. In 1972, 8 tractors bought were of 60 kW. There was no record of procurement of any model of tractor between 1973 and 1975.
In 1976, 1977, 1978 purchases were 12 tractors of 53 kW, 7 tractors of 53 kW and 3 tractors of 60 kW, re-spectively. The years between 1979 and 1983, no tractors was bought. In 1984, a total of 13 tractors were purchased. Among them were 3 tractors of 80 kW and 10 tractors of 25 kW. In 1985, 20 tractors of 52 kW were bought. And in 1986, a total of 41 tractors were bought, of which 5 were of 97 kW, 28 were of 52 kW, and 8 were of 60 kW. In 1987 and 1988, there were no tractors bought,
while 50 tractors, all of 52 kW, were bought in 1989. In 1990, 50 tractors all of 60 kW were bought. There was no purchase made in the years 1991, 1993, 1994, 1995 and 1988. However, 21 ZETOR, all of 60 kW, were bought 1992. In 1997, total of 24 FIAT tractors all of 52 kW were bought, while 3 and 10 tractors of 52 kW were bought in 2001 and 2002, respectively. There were no purchas-es made in the years 2003 and 2004. Table 1 further more indicated that 17 models of the tractors were used in the state.
Table 2, showed percentage dis-tribution of purchasing according to models, from where it was observed that 30.42 % were STEYR, 23.20 % FIAT, 15.00 % BELORUS and FORD. Products accounting for only 0.6 % were the least purchased, it also showed that in the state a total of 10 different tractor makes were used.
The period of tractor procurement by the state government has been grouped into three decades in Table 3, 1971-1980, as 1st decade, and 1981-
1990, 2nd decade and 1991-2000, 3rd decade. This was to assess tractor acquisition on a ten-year basis, based principally on the ten years service life of the tractor according to Culpin (1975). M ASSEY-FERGUSON products ranked highest (38.75 %) in the 1st decade (1971-1980), STEYR product ranked highest (58.05 %) in the 2nd decade (1981-1990) and FIAT products ranked highest (67.70 %) in the 3rd decade (1991-2000). In the first four years of the fourth decade, NEW HOLLAND topped with 76.90 %. In all, FIAT-Products had the widest spread because the products were bought in all the decades. With this periodic purchase analysis, a drastic drop in the third decade was observed.
In Table 4, between 1971-2004 the actual tractor availability, makes, models, number of operational trac-tors, size of farm mechanization and staff strength in some farms in the state were shown. Only 16 tractors were reported to be available, of which 25 % were operational. When
Name of farmsType of owner management
system (O.M.S.)
Size of farms mechanized,
hr
No. of tractors
availableStaff strength
No. of tractors in good
condition
No. of operational
tractorsSchool-to land authority farm, Irriiebe, Obio/Akpor L.G.A.
SGOMS 150 6 < 25 4 1
Agricultural development programme farm, Okoro-odo, Obio/Akpor L.G.A.
SGOMS 100 4 > 25 2 1
Nigeria prisons farm, Eleme, Ikwrre L.G.A.
FGOMS 80 4 > 25 1 1
Zuru farm, Rumuigbo, Odo, Obio/Akpor L.G.A.
IOMS 20 Custom service
< 10 - -
Joel Nwala farm, Omuma, Omuma L.G.A.
IOMS 30 Custom service
< 10 - -
Chief N.U. Njoku farm, Etche, Etche L.G.A.
IOMS 30 Custom service
< 20 - -
Bionu Bangha farmers, Cooperative society ltd., Bionu Bangha, Khana L.G.A.
FCMS 90 Custom service
< 10 - -
Amadi electrical/farms, Igwurata, Ikwerre L.G.A.
IOMS 20 Custom service
< 10 - -
Antail farm Atali Obio/Akpor L.G.A. SGOMS 100 2 > 25 1 1
Rupheiza farms, Atali Obio/Akpor L.G.A.
IOMS 15 Custom service
< 10 - -
Areta farm, Atali, Odo, Obio/Akpor L.G.A.
IOMS 20 Custom service
< 10 - -
Total 655 16 - 8 4
Table 4 Some farms in Rivers States and their levels of involvement in mechanization
SGOMS: State government owned management system, FGOMS: Federal government owned management system, IOMS: Individual owned management system, FCMS: Farmer's cooperative management system,

AGRICULTURAL MECHANIZATION IN ASIA, AFRICA, AND LATIN AMERICA 2008 VOL.39 NO.426
the 16 tractors were compared with a total of 57 tractors bought between 1996 and 2004 in Table 1, it became obvious that, the 16 tractors avail-able included the recent 13 tractors bought between 2001 and 2004 and perhaps 3 out of the 44 bought be-tween 1996 and 1997. This could be attributed to poor maintenance and repair facilities.
Tillage and CultivationIn the state, the major and minor
food corps cultivated by farmers, the average yield, yield and percent-
age distribution of crops are shown in Table 5. Yields for any of these crops were variable over space, the variability being influenced by fer-tility and management practices.
Table 6, shows a summary of comparison between the field opera-tion rates by farmers using hand-tools and machine power in Rivers State. This involved nine different field operations as highlighted in the table. In the table, total of mean manual and machine field work of 317.0 man-days/ha and 1.04 ma-chine days/ha, respectively were
shown. The breakdown showed that 32.6 man-days/ha manual labour were used for land preparation and 0.10 machine days/ha was used for machine power. The ridging and cassava planting field work required 0.24 machine-days/ha using manual labour and 0.24 machine-days/ha using machine power. Mould mak-ing and yam planting required 75.1 man-days/ha manual labour and 0.24 machine-days/ha. The field work, which involved weeding (gen-eral and roots), used 40.0 man-days/ha, 0.14 machine-days/ha and 36.7 man-days/ha, 0.12 machine-days/ha for manual and machine power operations, respectively. Manual field work was time-consuming and required a lot of human power and expensive human labour. This was not ideal for Rivers State farmers who were mostly hand-tool farmers.
Energy Utilization in traditional and Machine Power Agricultural Technologies
Most of the traditional production technologies practiced in Rivers State were ineffective. A few that were effective and efficient could only handle low volume of output because they depended solely on pri-mary human energy for manual op-erations. These facts were illustrated in Table 6, from which it was clear that cassava production per hectare used a total energy of about 1,467.93 MJ and 17.72 MJ of energy for man-ual and machine power, respectively. The production of yam per hectare utilized a total of about 1,524.09 MJ and 18.36 MJ for manual and ma-chine power, respectively.
Also, Fig. 2, showed about 98.8 % and 1.2 % of manual and machine efforts were used for cassava and yam, respectively. The manual la-bour energy utilization was about 83 times than that of machine. In this table, energy utilization for till-age and cultivation operations in re-gards to land preparation, weeding and harvesting, it became clear that manual labour was much greater
Crop Yields,tons/ha
Avarage yield,ton/ha
% distribution of crops grown
Cassava 10-14 12-50 31.50Plantain/Banana 10-25 17-50 46.00Maize 0.5-17 8-75 23.01Sugar cane 15-40 27-50 72.34Pineapple 8-15 11-50 30.25Groundnut 1.5-3.0 2.25 5.92Melon 3.0-8.0 5.50 14.46Sweet potato 7.0-12 9.50 24.90Fluted pumpkin 3.5-7.0 5.25 13.81Cocoyam 5.0-8.5 6.75 17.75Pepper 2.7-6.0 4.35 11.41Oil palm 4.0-10 7.00 18.41Cocoa 1.0-2.0 5.50 3.94Guava 15-20 11.50 46.03Rubber - - -Cocoa nut - - -Mango - - -Pawpaw - - -Orange - - -
Table 5 Avarage yield of selected crops cultivated in rivers state
Fields operationsMean manual
work rate man-days/ha
Mean machine field work rate machine days/ha
Total energy, MJ/ha
Manual, MJ Machine, MJ
Land clearing 32.6 0.10 281.66Riding for cassava planting 43.8 0.15 378.43 4.83Mould making for yams 57.8 0.18 499.39 5.80Cassava planting 28.3 0.09 244.51 2.90Yam planting 17.3 0.06 149.47 1.93Weeding roots crop 36.7 0.12 317.09 3.87Weeding (general) 40.0 0.14 345.60 4.51Cassava harvesting 28.5 0.09 246.24 2.90Yam harvesting 32.0 0.11 276.48 3.54
Total 317.0 1.04 2,738.8 33.5
Table 6 A comparism of the energy utilization of manual productionwith the mechanized alternative in rivers state
Source: Onuegbu and Zuofa (1999) and several rivers State ADP Annual Reports

VOL.39 NO.4 2008 AGRICULTURAL MECHANIZATION IN ASIA, AFRICA, AND LATIN AMERICA 27
than that of machine. Stout et al. (1979) reported specific
human energy consumption for bush clearing as 40 KJ/min (1,680 MJ) and 19.4 man-day to prepare a hectare of land. He further reported machine power as 0.88 MJ energy utilization and 0.019 machine-day per hectare.
Energy utilization for manual weeding was 22 KJ/min (1,320 MJ) and 2.29 MJ for machine field op-eration and 32.6 man-day/ha and 0.015 machine effort was reported by (Stout et al., 1979). Energy-relat-ed data from a number of tropical cultivation systems and products for which cassava was one of them have been collected by Jentzach (1979) and Leach (1976) as 748 KJ (0.7488 MJ) for manual labour and 48.77 KJ (0.0487 MJ) machine power. There were no data for yam harvesting.
Conclusion and Recom-mendation
The conclusion that could be drawn from this study was that farm-ers in Rivers State practiced a low level of mechanization. It was ob-served that these poor performances were due to poverty, ignorance and lack of incentive to the use of ma-chinery in agricultural practices. There is no doubt that the traditional tools were cheap, simple and easily available to the farmer. However, they were time and energy consum-ing, and, therefore, required about 98.9 % when compared to about 1.2 % of machine power. The total ener-gy utilization of the manual and ma-chine power per hectare of the same work, was therefore, 2,738.8 MJ and 33.5 MJ of energy, respectively. The energy utilization was so much for manual methods that the farmers were reduced to subsistent level and, consequently, over populated the farm with labourers.
Again the tractorization intensity (TI) decreased from 0.352 hp/ha in 1986 to 0.345 hp/ha in 2003. This reflected that agricultural activity in
the state was in recession. This was so because the 0.345 hp/ha tractor power utilization remained a far cry from the 0.5hp/ha, as recommended for efficient agriculture (Igbeka, 2002). Little wonder then that the much needed food security has con-tinued to elude the state and, by ex-tension, the entire country. Planting and harvesting of the major crops need to be mechanized in the state.
Also, there has to be a concerted effort towards standardization of the makes of tractors suited for the peculiar agro-physical and climatic conditions in the state, as this would ensure that tractors work efficiently throughout their service life. Agricul-tural lands should also be developed.
Presently, with a poverty alle-viation programme, the effects of poverty could be taken care of. The issue of ignorance and lack of incen-tives could be tackled with the Gov-ernment and Research institutions. Educating farmers on the r ight attitude towards the use of farm ma-chinery could be the right step.
Certainly, data obtained in this study indicated that cultivation of these crops (yam and cassava) in-volved more energy utilization in manual than mechanical operations.
REFERENCES
Allison-Oguru, E. A. 2001. Environ-mental Impact Assessment Report (Socio-economics sections) of Azuzuan Oil Field Development Project by Agip Oil Company Ltd. A Report Submitted to Jawura En-vironmental Service Ltd. Lagos.
Allisn-Oguru, E. A. 1995. A Report on Overview and Evaluation of Existing Data on Agronomy/Agro-economics in the Niger Delta. Report Submitted to Eurconsult, Managing Consultants, Niger Del-ta Environmental Survey, Phase 1.
Allison-Oguru, E. A., K. Zuofa, and N. A. Berepubo. 1999. “Agricul-ture” in Alagoa E. J. (ed). Land and People of Bayelsa State: Cen-
tral Niger Delta. Port Harcourt; Onyoma Research Publication. Pp 283-300.
Anazodo, U. G. N., T. O. Abinbola, and J. A. Dairo. 1986. “Agricul-tural Machinery Inventory, Type and Condition in Nigeria (1975-85)” Federal Department of Agri-culture, Nigeria.
Culpin, C. 1975. Profitable Farm Mechanization, Granada Publish-ing Co., London, 307p.
Igoni, A. H. and R. N. Okparanma. 2003. “Cost Implication of Farm Mechanization in Rivers State of Nigeria”. Journal of Science and Technology Research Press.
Igbeka J. C. 2002. Agricultural Engineering and the society: Ni-gerian Institution of Agricultural Engineers Quarterly (3) 3:3-11.
Kepner, R. A., R Bainer, and E. L. Barger. 1978. Principles of Farm Machinery (3rd edition) AVI Pub-lishing Company Inc. Connecticut.
Liljedahi, J. B., W. M. Carition, P. K. Turuguist, and D. W. Smith. 1979. Tractors and their Power Units (3rd ed). John Wiley and Sons Inc., Canada.
Meshack-Hart E. T. 2000. Mecha-nized Agriculture for Sustainable Agricultural Development for Ni-gerians in the year 2010: A Journal South East Regional Chapter of the Nigerian Institution of Agri-cultural Engineers, 2000 p 39.
McColly, H. F. and J. W. Martin. 1995. Introduction to Agricultural Engineering McGraw-Hill Book Company Inc, New York.
Odigboh E. U. 1991. “Continuing Controversies on Tillage Mecha-nization” in Nigeria, J. Agric. Sci-ence Technology 41-49.
Ojah, T. P and A. M. Michael. 1988. Principles of Agricultural Engi-neering, Vol. 1 Jain Brothers Pub-lishing Co., New Delhi. P. 623.
Stout, B. A., C.A. Myers, A. Hurand, and L. W. Faidley. 1979. Energy for World Agriculture-FAO-Agri-cultural Series No. 7, Rome.
■■

AGRICULTURAL MECHANIZATION IN ASIA, AFRICA, AND LATIN AMERICA 2008 VOL.39 NO.428
Domestic Solar Geyser Cum DistillerbyS. H. SengarResearch ScholarCollege of Technology and Engineering,Dept. of Renewable Energy Sources,Maharana Pratap University ofAgricultura and Technology,Udaipur - 313 001INDIA
A. K. KurchaniaProfessor and HeadCollege of Technology and Engineering,Dept. of Renewable Energy Sources,Maharana Pratap University ofAgricultura and Technology,Udaipur - 313 001INDIA
AbstractA solar geyser cum dist i l ler
(SGD) device, having a capacity of 100 liters was designed, developed and performance evaluated. Overall efficiency of SGD for winter and summer was 36.70 % and 27.48 %, respectively. The yields of distilled water were 5,007 ml/m2 day in win-ter and 5,275 ml/m2 day in summer. The total cost of SGD device was Rs. 8,930.
IntroductionThe first detailed study of the
performance of the flat plate collec-
tor was made by Hottel and Woertz (1942) and later modified by Tabor (1958). Many researchers have made performance evaluation as well as component-wise studies. Tiris et al. studied the storage tank and two flat plate solar collectors integrated with basin type solar still. Singh et al. made extensive performance study of integrated solar water heater having a solar collector and storage tank as separate unit.
System DescriptionThe SGD device consisted of a
flat plate collector with a net effec-tive area of 2 m2 as shown in Plate 1. It was fundamentally based on two processes; evaporation of water through the application of solar en-ergy and subsequently condensation of vapors naturally that resulted in potable water.
The SGD unit consisted of solar collector (front glazing), metallic absorber, back insulation and col-lector box, insulated storage tank, water trough and piping. Water was heated with the solar energy and
the same unit, also, distilled water. Evaporation took place from the wa-ter inside the storage tank that was heated through the solar collector. A conical cover (Plate 2) with cold water on the top of the storage tank was provided for maintaining the temperature difference for condens-ing the inside vapors of the storage tank. This temperature difference produced convection currents in the air, which was trapped inside the enclosure. These currents brought the humid air into the contact with relatively cool cover and resulted in condensation of some of the humidi-ty on the surface of cover. This con-
Acknowledgements: The authors are highly thankful to Ministry of Non-conventional Energy Sources for providing the f inancial as-sistance to carry out the research work. They are also thankful to the Department of Renewable Energy Sources, College of Technology and Engineering, Udaipur for providing all sorts of required facilities for the study.
Plate 1 Solar geyser cumdistillation unit
Plate 2 Conical water trough Plate 3 Bowl inside storage tank

VOL.39 NO.4 2008 AGRICULTURAL MECHANIZATION IN ASIA, AFRICA, AND LATIN AMERICA 29
densation slid down the slope, col-lected in the distillation bowl (Plate 3) and drained out of the enclosure through the piping depicted in Fig. 1. The collector frame was mounted on steel angle bars, grouted on the roof having 40º inclinations from the horizontal facing south.
Experimental ObservationThe study was conducted in Feb-
ruary and April 2004. Temperature corrected electronic sensors with 0.1 ºC accuracy were used to measure the water temperature at different points of the SGCD. An insolometer was used to measure the instanta-neous solar radiation on the surface of collectors. All measurements were made during the period of con-stant insolation.
Performance CalculationSolar water heater efficiency
ηoverall = m s (Tf − Ta) / Σ I Ap Δt, (Permpal Singh et al., 2004)
where, (Tf − Ta) is difference in tempera-
ture of water in the evening and am-bient temperature at the subsequent morning, m is mass of water in the storage tank and s is specific heat of water, I is solar radiation, W/m2 of aperture area, Ap is aperture area and Δt is Time.Distillation efficiency
ηdist = Qe / Qt, (Sinha et al., 1992) where,
Qe = Me × fMe = Daily output of distilled wa-
ter in kg m-2 day-1
f = Latent heat of vaporization of
water in W kg-1
Qt = Energy available, Wm-2
Results and DiscussionExperimental observations are
shown in Table 1. Variation of solar radiation on collector surface during the measurement period was noted as 234-734 W/m2 on 12 February 04 and 451-860 W/m2 on 12 April 04, respectively. Overall efficiency of SGD for winter and summer was 36.70 % and 27.48 %, respectively. Temperature coming from the tank was 15-20 ºC more than the ambient temperature. Total distilled water in 24 hours produced from SGD in February 2004 and April 2004 was
Time, hrs Ambient temp., ºC
Inlettemp., ºC
Outlet temp., ºC
Storage temp., ºC
Inolation, W/m2
SG efficiency,
%9:00 22.81 32.23 38.56 37.00 234.009:30 23.80 33.06 40.70 37.39 399.33
10:00 24.00 33.75 43.31 34.95 415.0010:30 24.13 34.33 49.65 36.99 535.18 36.7011:00 25.14 34.31 43.15 38.75 586.9111:30 26.19 34.95 42.66 40.47 638.8212:00 26.99 35.78 45.41 41.88 697.9112:30 27.45 36.53 49.13 42.63 713.8213:00 28.27 38.21 49.80 44.75 733.2713:30 28.27 39.95 51.56 46.35 711.0014:00 28.52 41.11 52.83 46.72 680.0014:30 28.79 42.75 53.91 47.69 630.0015:00 28.47 44.00 56.41 48.29 547.9115:30 27.69 44.93 58.50 48.59 494.2716:00 26.15 45.75 60.33 48.50 407.0016:30 25.09 46.33 59.00 48.00 290.1017:00 24.05 46.91 53.75 48.00 182.55
Table 1 Thermal performance of Solar Geyser (SG) in SGD for winter
5,007 ml m-2 day-1 and 5,275 ml m-2 day-1. During winter, the tempera-ture in the water trough decreased while the temperature inside storage tank was more due to insulation but in summer temperature in the water trough was more due to higher am-bient temperature. Hence, there was more condensation in February and consequently distillation was more. The output of the SGD was greater in February as shown in Fig. 2.
Electrical Energy Saved Calculation of the electrical en-
ergy, saved by the SGD, was made during the observation. Temperature of cold water in the storage tank rose by about 24 ºC, which showed
Fig. 1 Solar water geyser cum distillationFig. 2 Performance of SGD for distillation during winter
(continued on page13)

AGRICULTURAL MECHANIZATION IN ASIA, AFRICA, AND LATIN AMERICA 2008 VOL.39 NO.430
Laser Guided Land Leveler: Precession Leveler With Laser Technology for Land Preparation
byB. SuthakarResearch ScholarDept. of Farm Power and Machinery,Agricultural Engineering Collegeand Research Institute,Tamil Nadu Agricultural University,Coimbatore - 641003, [email protected]
R. ManianDeanAgricultural Engineering Collegeand Research Institute,Tamil Nadu Agricultural University,Coimbatore - 641003, INDIA
K. KathirvelProfessor and HeadDept. of Farm Power and Machinery,Agricultural Engineering Collegeand Research Institute,Tamil Nadu Agricultural University,Coimbatore - 641003, INDIA
D. Manohar JesudasProfessorDept. of Farm Power and Machinery,Agricultural Engineering Collegeand Research Institute,Tamil Nadu Agricultural University,Coimbatore - 641003, INDIA
AbstractUnevenness of fields leads to inef-
ficient use of irrigation water and also delays tillage, crop establish-ment and uneven maturing of crops, which in turn reduces the yield, grain quality and farm income. Hence, a precisely levelled field is a pre-requisite for an efficient surface irrigation system. The ac-curacy of leveling depends on skill and the judgment of the operator. But, in the laser system, the level-ing of land is done precisely with the automatic functioning of the laser-operated scraper. So, the pres-ent study was conducted to find the feasibility of tractor operated laser guided land leveller. The study was carried out in the Research farms of Tamil Nadu Agricultural Uni-versity, Coimbatore. A comparative evaluation of the laser guided land leveler with the existing system of leveling showed that the percentage reduction in standard deviation of reduced levels for before and after leveling was 92.55 % for laser level-
ing. For the conventional method, it was observed as 72.34 %, which was 20 % lower then the laser lev-eling. From contour charts, it was observed that considerably higher accuracy of grading was obtained when the fields were graded by use of laser leveler. The field capacity of the laser leveler and cost of op-eration were 0.08 ha/h and Rs 474/h and 0.098 ha/h and Rs 309/h for conventional leveler, respectively. The cost of leveling per hectare us-ing laser leveler was 5,932.50 Rs/ha and 3,151 Rs/ha for conventional levelling.
IntroductionUnevenness of the soil surface has
a major impact on the germination, stand and yield of crops through nutrient water interaction and salt and soil moisture distribution pat-tern. Land leveling is an important operation for good agronomic, soil and crop management practices. Traditional methods of leveling
land are not only more cumbersome and time-consuming but also more expensive. Most rice farmers level their fields very often under pound-ed water conditions. The other farm-ers dry level their fields and check level by pounding water. Thus, in the process of a having good level-ing in fields, a considerable amount of water is wasted. It is a common knowledge that most of the farmers apply irrigation water until all the parcels are fully wetted and covered with a thin sheet of water. Studies have indicated that a significant (20-25 %) amount of irrigation water is lost during its application at the farm due to poor farm design and unevenness of the fields. Uneven-ness of fields leads to inefficient use of irrigation water and delays tillage and crop establishment op-tions. Fields that are not level have uneven maturing of crops. All these factors tend to contribute to reduced yield and grain quality, which re-duce farm income. Land leveling saves irrigation water, facilitates field operations and increases yield
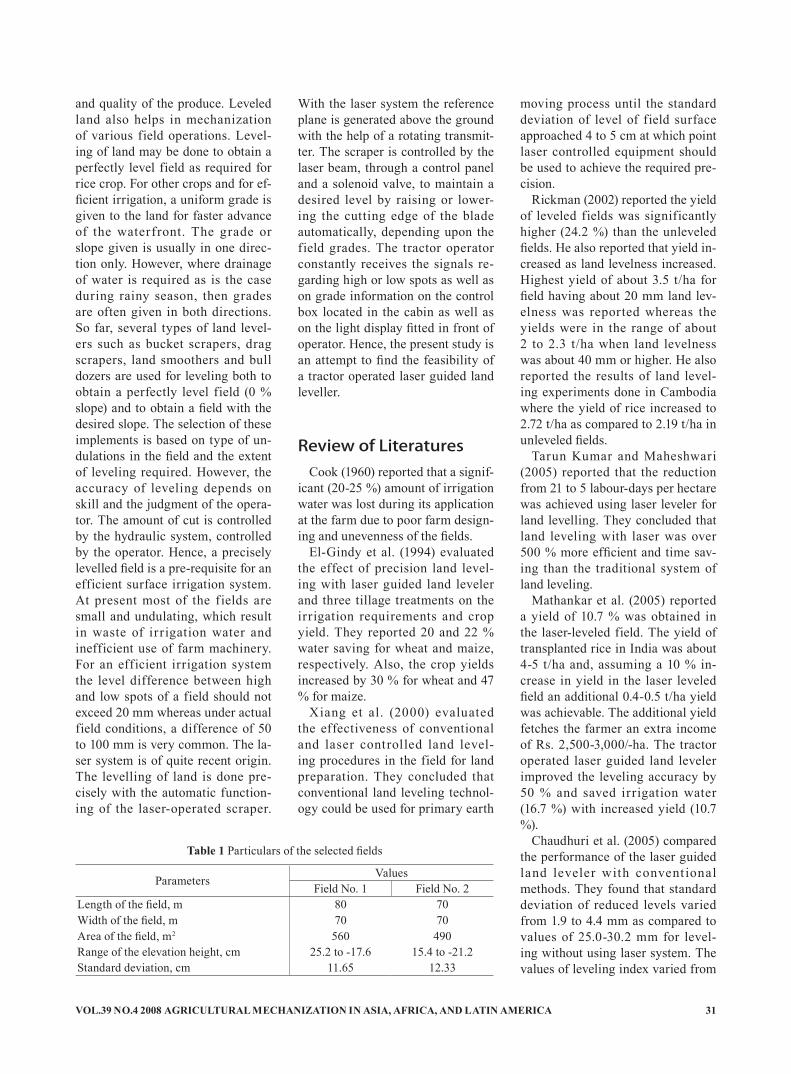
VOL.39 NO.4 2008 AGRICULTURAL MECHANIZATION IN ASIA, AFRICA, AND LATIN AMERICA 31
and quality of the produce. Leveled land also helps in mechanization of various field operations. Level-ing of land may be done to obtain a perfectly level field as required for rice crop. For other crops and for ef-ficient irrigation, a uniform grade is given to the land for faster advance of the waterfront. The grade or slope given is usually in one direc-tion only. However, where drainage of water is required as is the case during rainy season, then grades are often given in both directions. So far, several types of land level-ers such as bucket scrapers, drag scrapers, land smoothers and bull dozers are used for leveling both to obtain a perfectly level field (0 % slope) and to obtain a field with the desired slope. The selection of these implements is based on type of un-dulations in the field and the extent of leveling required. However, the accuracy of leveling depends on skill and the judgment of the opera-tor. The amount of cut is controlled by the hydraulic system, controlled by the operator. Hence, a precisely levelled field is a pre-requisite for an efficient surface irrigation system. At present most of the fields are small and undulating, which result in waste of irrigation water and inefficient use of farm machinery. For an efficient irrigation system the level difference between high and low spots of a field should not exceed 20 mm whereas under actual field conditions, a difference of 50 to 100 mm is very common. The la-ser system is of quite recent origin. The levelling of land is done pre-cisely with the automatic function-ing of the laser-operated scraper.
With the laser system the reference plane is generated above the ground with the help of a rotating transmit-ter. The scraper is controlled by the laser beam, through a control panel and a solenoid valve, to maintain a desired level by raising or lower-ing the cutting edge of the blade automatically, depending upon the field grades. The tractor operator constantly receives the signals re-garding high or low spots as well as on grade information on the control box located in the cabin as well as on the light display fitted in front of operator. Hence, the present study is an attempt to find the feasibility of a tractor operated laser guided land leveller.
Review of LiteraturesCook (1960) reported that a signif-
icant (20-25 %) amount of irrigation water was lost during its application at the farm due to poor farm design-ing and unevenness of the fields.
El-Gindy et al. (1994) evaluated the effect of precision land level-ing with laser guided land leveler and three tillage treatments on the irrigation requirements and crop yield. They reported 20 and 22 % water saving for wheat and maize, respectively. Also, the crop yields increased by 30 % for wheat and 47 % for maize.
Xiang et al. (2000) evaluated the effectiveness of conventional and laser controlled land level-ing procedures in the field for land preparation. They concluded that conventional land leveling technol-ogy could be used for primary earth
moving process until the standard deviation of level of field surface approached 4 to 5 cm at which point laser controlled equipment should be used to achieve the required pre-cision.
Rickman (2002) reported the yield of leveled fields was significantly higher (24.2 %) than the unleveled fields. He also reported that yield in-creased as land levelness increased. Highest yield of about 3.5 t/ha for field having about 20 mm land lev-elness was reported whereas the yields were in the range of about 2 to 2.3 t/ha when land levelness was about 40 mm or higher. He also reported the results of land level-ing experiments done in Cambodia where the yield of rice increased to 2.72 t/ha as compared to 2.19 t/ha in unleveled fields.
Tarun Kumar and Maheshwari (2005) reported that the reduction from 21 to 5 labour-days per hectare was achieved using laser leveler for land levelling. They concluded that land leveling with laser was over 500 % more efficient and time sav-ing than the traditional system of land leveling.
Mathankar et al. (2005) reported a yield of 10.7 % was obtained in the laser-leveled field. The yield of transplanted rice in India was about 4-5 t/ha and, assuming a 10 % in-crease in yield in the laser leveled field an additional 0.4-0.5 t/ha yield was achievable. The additional yield fetches the farmer an extra income of Rs. 2,500-3,000/-ha. The tractor operated laser guided land leveler improved the leveling accuracy by 50 % and saved irrigation water (16.7 %) with increased yield (10.7 %).
Chaudhuri et al. (2005) compared the performance of the laser guided land leveler with convent ional methods. They found that standard deviation of reduced levels varied from 1.9 to 4.4 mm as compared to values of 25.0-30.2 mm for level-ing without using laser system. The values of leveling index varied from
Parameters ValuesField No. 1 Field No. 2
Length of the field, m 80 70Width of the field, m 70 70Area of the field, m2 560 490Range of the elevation height, cm 25.2 to -17.6 15.4 to -21.2Standard deviation, cm 11.65 12.33
Table 1 Particulars of the selected fields

AGRICULTURAL MECHANIZATION IN ASIA, AFRICA, AND LATIN AMERICA 2008 VOL.39 NO.432
1.6 to 3.2 mm for laser guided grad-ing as compared to 15.7-25.4 cm for grading without using laser systems. Field capacity varied from 0.09 to 0.12 ha/h for laser leveling as com-pared to 0.11-0.15 ha/h for grading without use of laser system.
Materials and MethodsThis study was carried out in the
Research farm of Tamil Nadu Ag-ricultural University, Coimbatore. Comparative evaluation of the laser guided land leveler with the existing system of leveling was made. In or-der to eliminate differences in level-er performance due to design of the drag scraper, the same leveler was used for both studies. For evaluating conventional leveling, the laser sys-tem was not used and the hydraulic system was actuated manually.
Description of Laser Guided Land Leveler
A commercial unit of laser guided land leveler was used for the study. The laser-controlled system consist-ed of (i) Laser transmitter, (ii) Laser receiver, (iii) Laser plane receiver, (iv) Control box, (v) Twin solenoid hydraulic control valve, (vi) Drag Scrapper.i. The Laser Transmitter
The laser transmitter transmits a laser beam, which is intercepted by the laser receiver mounted on the leveling bucket. The control panel mounted on the tractor intercepts the signal from receiver and opens
or closes the hydraulic control valve, which will raise or lower the bucket in order achieve the desired level. The laser transmitter (Fig. 1) mounts on a tripod stand, which al-lows the laser beam to sweep above the tractor unobstructed. With the plane of light above the field, several tractors can work from one trans-mitter. ii. Laser Receiver
The laser receiver (Fig. 2) is a portable, battery-operated device that locates elevation of the rotating laser beam passed from the laser transmitter. This survey staff rod re-ceiver indicates its position through Liquid Crystal Display or audible tones. The existing survey rod can be attached on the receiver through
the universal clamp.iii. Laser Plane Receiver
The laser receiver is an omni-directional receiver that detects the position of the laser reference plane and transmits these signals to the control box. The receiver mounts on a manual or electric mast attached to the drag bucket. iv. The Control Box
The control box (Fig. 3) accepted and processed signals from the ma-chine mounted receiver. The control box of the laser system had multiple functions. The main function was to receive the signals from the laser system and convey it to the hydrau-lic system. The control box took power for its operation and also for operation of receiver and solenoid
Sl. No. 1 2 3 4 5 6 71 1.8 1.72 1.821 1.862 1.917 1.961 2.0082 1.682 1.721 1.828 1.864 1.89 1.973 2.023 1.65 1.62 1.638 1.816 1.826 1.862 1.9384 1.576 1.662 1.96 1.884 1.89 1.862 1.9345 1.634 1.726 1.796 1.892 1.936 1.956 26 1.69 1.741 1.784 1.89 1.894 1.884 1.9727 1.704 1.71 1.696 1.844 1.878 1.898 1.9548 1.65 1.712 1.704 1.865 1.92 1.892 1.93
Table 2 Surveyed readings in meters for the field no. 1 before leveling
Sl. No. 1 2 3 4 5 6 71 1.63 1.716 1.69 1.876 1.936 1.928 2.0282 1.72 1.724 1.719 1.892 1.905 1.952 2.053 1.716 1.72 1.728 1.868 1.866 1.93 2.0044 1.72 1.704 1.716 1.928 1.906 1.888 2.0585 1.718 1.734 1.728 1.924 1.888 1.932 2.0826 1.814 1.87 1.856 1.988 1.972 2 2.117 1.822 1.916 1.87 1.94 1.918 1.99 2.05
Table 3 Surveyed readings in meters for the field no. 2 before leveling
Fig. 1 View of laser transmitter Fig. 2 View of laser eye receiver Fig. 3 View of the control box
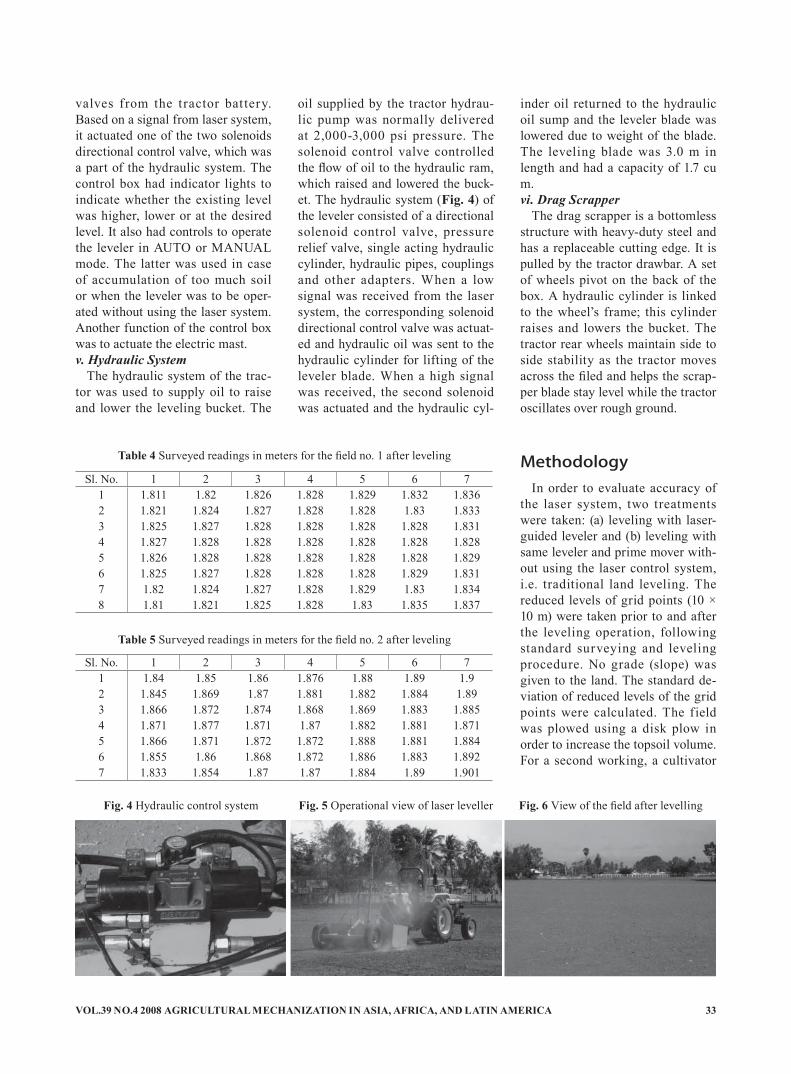
VOL.39 NO.4 2008 AGRICULTURAL MECHANIZATION IN ASIA, AFRICA, AND LATIN AMERICA 33
valves from the tractor battery. Based on a signal from laser system, it actuated one of the two solenoids directional control valve, which was a part of the hydraulic system. The control box had indicator lights to indicate whether the existing level was higher, lower or at the desired level. It also had controls to operate the leveler in AUTO or MANUAL mode. The latter was used in case of accumulation of too much soil or when the leveler was to be oper-ated without using the laser system. Another function of the control box was to actuate the electric mast. v. Hydraulic System
The hydraulic system of the trac-tor was used to supply oil to raise and lower the leveling bucket. The
oil supplied by the tractor hydrau-lic pump was normally delivered at 2,000-3,000 psi pressure. The solenoid control valve controlled the flow of oil to the hydraulic ram, which raised and lowered the buck-et. The hydraulic system (Fig. 4) of the leveler consisted of a directional solenoid control valve, pressure relief valve, single acting hydraulic cylinder, hydraulic pipes, couplings and other adapters. When a low signal was received from the laser system, the corresponding solenoid directional control valve was actuat-ed and hydraulic oil was sent to the hydraulic cylinder for lifting of the leveler blade. When a high signal was received, the second solenoid was actuated and the hydraulic cyl-
inder oil returned to the hydraulic oil sump and the leveler blade was lowered due to weight of the blade. The leveling blade was 3.0 m in length and had a capacity of 1.7 cu m.vi. Drag Scrapper
The drag scrapper is a bottomless structure with heavy-duty steel and has a replaceable cutting edge. It is pulled by the tractor drawbar. A set of wheels pivot on the back of the box. A hydraulic cylinder is linked to the wheel’s frame; this cylinder raises and lowers the bucket. The tractor rear wheels maintain side to side stability as the tractor moves across the filed and helps the scrap-per blade stay level while the tractor oscillates over rough ground.
MethodologyIn order to evaluate accuracy of
the laser system, two treatments were taken: (a) leveling with laser-guided leveler and (b) leveling with same leveler and prime mover with-out using the laser control system, i.e. traditional land leveling. The reduced levels of grid points (10 × 10 m) were taken prior to and after the leveling operation, following standard surveying and leveling procedure. No grade (slope) was given to the land. The standard de-viation of reduced levels of the grid points were calculated. The field was plowed using a disk plow in order to increase the topsoil volume. For a second working, a cultivator
Sl. No. 1 2 3 4 5 6 71 1.811 1.82 1.826 1.828 1.829 1.832 1.8362 1.821 1.824 1.827 1.828 1.828 1.83 1.8333 1.825 1.827 1.828 1.828 1.828 1.828 1.8314 1.827 1.828 1.828 1.828 1.828 1.828 1.8285 1.826 1.828 1.828 1.828 1.828 1.828 1.8296 1.825 1.827 1.828 1.828 1.828 1.829 1.8317 1.82 1.824 1.827 1.828 1.829 1.83 1.8348 1.81 1.821 1.825 1.828 1.83 1.835 1.837
Table 4 Surveyed readings in meters for the field no. 1 after leveling
Sl. No. 1 2 3 4 5 6 71 1.84 1.85 1.86 1.876 1.88 1.89 1.92 1.845 1.869 1.87 1.881 1.882 1.884 1.893 1.866 1.872 1.874 1.868 1.869 1.883 1.8854 1.871 1.877 1.871 1.87 1.882 1.881 1.8715 1.866 1.871 1.872 1.872 1.888 1.881 1.8846 1.855 1.86 1.868 1.872 1.886 1.883 1.8927 1.833 1.854 1.87 1.87 1.884 1.89 1.901
Table 5 Surveyed readings in meters for the field no. 2 after leveling
Fig. 4 Hydraulic control system Fig. 5 Operational view of laser leveller Fig. 6 View of the field after levelling

AGRICULTURAL MECHANIZATION IN ASIA, AFRICA, AND LATIN AMERICA 2008 VOL.39 NO.434
was used followed by rotovator to achieve the fine tilth of the soil to ensure smooth f low of soil in the leveler scrapper. All surface resi-dues were cut and removed to aid soil flow from the bucket.
After the filed preparation, a topo-graphic survey was conducted to record the high and low spots in the field. From the surveyed readings, the mean height of the field could then be established by taking the sum of all the readings and dividing by the number of readings taken. The laser surveying system was made up of a laser transmitter, a tripod, a measuring rod and a small laser receiver. A major advantage of laser surveying was the accuracy and simplicity of use. Also, only one person was needed.
ProcedureThe plots were divided into two
portions. In one portion, the grading operation was carried out using the laser guided land leveler, whereas, in the second portion, the control box switch was set to MANUAL and grading carried out by using judgment and skill of the tractor driver. In the latter case, for lower-ing and lifting of the leveler blade, the RAISE and LOWER switches of the control box were used. The reduced levels were taken at all grid points with the help of transmitter and the laser eye receiver at a spac-ing of 10 m × 10 m. At first, the laser beam was set at a level plane (0 % slope) in both directions and the readings taken at all grid points. The mean height of the field was determined by adding all measured points and dividing by the number of measurements. A new map was then drawn which showed the dif-ference between the mean height of the field and recorded height. The average reduced levels and standard deviation of reduced levels of the grid points were calculated.
The laser controlled bucket was positioned at a point that represents the mean height of the field and the
cutting blade should be set slightly above ground level (1-2 cm). The setting was changed to AUTO in control box. Next, the mast was moved up or down till the green light was displayed in the control box. The grading was started un-til all portions of the field showed green light. The tractor was then driven in a circular direction from the high areas to the lower areas in the field. To maximize working efficiency, as soon as the bucket was near filled with soil the opera-tor drove toward the lower area. Similarly, as soon as the bucket was near empty the tractor was driven back to the higher areas. When the whole field has been covered in the circular manner, a final leveling pass was made in long runs from the high end of the field to the lower end. After the operation, mapping of field was again carried out using the laser eye receiver. As before, the average reduced levels and standard deviation of reduced levels of the grid points were again calculated. The standard deviation was used to obtain the accuracy of the reduced level. For a subjective assessment of accuracy of leveling, contour maps were plotted before and after level-ing. The contour maps were plotted against a level field as the base. The cost of leveling per ha, for both the systems, were also calculated.
Results and DiscussionThe par ticular values such as
length and width related to the selected field for this study are fur-nished in Table 1.
From Table 1, it is seen that the standard deviation of reduced lev-els corresponding to a level plane
varied from 11.65 to 12.33 cm. The high value of standard deviation was mainly due to presence of a grade or slope in the field. The elevation height of the field at each
10 × 10 grid point for the laser leveling and conventional leveling, namely field No. 1 and field No. 2 is shown Tables 2 and 3, respectively.
The mean height was determined by adding all the measured points together and dividing by the num-ber of the measurements. From the Tables 1 and 2, mean height of the surveyed reading was 1.828 m and 1.87 m for field No. 1 and field No. 2, respectively. For the field No. 1, the drag scrapper was placed at the grid point (2, 3) having a mean height of 1.828 m and leveled using laser technology as explained. The operational view of the laser guided land leveler and the view of the field after leveling is shown Fig. 5 and Fig. 6, respectively. For field No. 2, the field was leveled with same lev-eler without using the laser technol-ogy, i.e. the control box switch was set to MANUAL and grading car-ried out by using judgment and skill of the tractor driver. The elevation height of the field observed at each 10 × 10 grid point after the laser leveling and conventional leveling is shown Tables 4 and 5, respectively.
From the Tables 4 and 5, the mean height of the surveyed reading was 1.827 m and 1.826 m for field No. 1 and field No. 2, respectively. To assess the accuracy of leveling, the standard deviation was calcu-lated for surveyed readings of the each field before and after leveling and furnished in Table 6.
From the Table 6, the standard deviation of reduced levels before leveling was 11.65 cm and after leveling is 0.87 cm, using the laser
Particular Laser(Field No. 1)
Conventional(Field No. 2)
Standard deviation of reduced levels before leveling, cm 11.65 12.33Standard deviation of reduced levels after leveling, cm 0.87 3.41
Table 6 Standard deviation of surveyed readings

VOL.39 NO.4 2008 AGRICULTURAL MECHANIZATION IN ASIA, AFRICA, AND LATIN AMERICA 35
leveler for leveling the field No. 1. The standard deviation of reduced levels before leveling was 12.33 cm and after leveling was 3.41 cm using the conventional leveler for leveling field No. 2. The 92.55 % standard deviation was reduced in the case of laser leveling, whereas, for the con-ventional method it was 72.34 %, which was 20 % lower then the laser leveling. Hence, the accuracy of leveling using laser leveler is higher with more precision than conven-tional methods since the standard deviation was less than one cm.
For a subjective assessment of accuracy of leveling, contour maps were plotted before and after lev-eling for both the fields using the SURFER 8.0 package. The latest version of the SURFER package fa-cilitates creation of three-dimension-al contour maps, which will be more useful for interpreting results. The contour maps for before and after leveling the field using laser leveler are shown in Figs. 7 and 8. The con-tour maps for before and after level-ing the field using the conventional method are shown in Figs. 9 and 10.
All contour maps are presented with a contour interval of 2 cm. These maps have been developed with respect to a level plane. From Figs. 7 and 8, it was observed that
accurate grading was possible using the laser guided land leveler as seen from parallel lines or evenness in the contour map. The grading was not so accurate at end of field since there was difficulty in effectively reaching the corners of the field due to larger turning radius. From the Figs. 9 and 10, it was observed that grading of the field without laser components was less accurate as compared to the laser system. From the contour maps it was also clear that similar trend of uneven-ness in grading was obtained in the field corners as observed in the case of laser leveled portion of the fields. However, the undulations on the filed are relatively more in conventional method. This further confirmed the results obtained from standard deviation of the surveyed readings.
The cost of operation of tractor and leveler combination was calculated both for laser guided land leveler and conventional leveler. The cost of operation of the laser guided land leveler was Rs. 474/h as compared to Rs. 309/h for the conventional lev-eler. The cost of operation was 53 % costlier for the laser guided land lev-eler as compared to the conventional leveler. The field capacity of the laser leveler was observed as 0.08 ha/h,
whereas, without using the laser sys-tem, the field capacity of the leveler was 0.098 ha/h.
The fuel consumption of the trac-tor was 3.5 l/h for operation of the laser guided land leveler. When the laser system was not used the value was similar. From the above results it may be observed that the field ca-pacity was slightly higher when the laser system was not used. This was due to the fact that there was con-tinuous movement of the tractor and the operator adjusts the depth of cut as per his judgment. However, when the laser was system is used, the tractor had to stop when the scraper bucket was full and shifted to man-ual control. The cost of leveling was considerably higher when the laser guided land leveler was used. The cost of leveling per hectare using the laser leveler was 5,932.50 Rs/ha and 3,151 Rs/ha for conventional levelling. The cost of operation in terms of per unit area was consider-ably higher when the laser systems of the leveler were in operation in contrast to grading without use of laser systems. This was due to high initial cost of the laser guided land leveler.
Conclusions• It was observed from contour
charts and from values of stan-dard deviation of reduced levels that considerably higher accu-racy of grading were observed when the fields were graded by use of laser guided land leveler in comparison to using the lev-eler without laser systems.
• The field capacity of the laser leveler was observed as 0.08 ha/h whereas, without using the la-ser system, the field capacity of the leveler was 0.098 ha/h.
• The fuel consumption of the tractor was 3.5 l/h for operation of both laser guided land leveler and conventional levelling.
• The cost of grading was con-
Fig. 7 The contour map for beforeleveling the field-using laser leveler
Fig. 8 The contour map for afterleveling the field-using laser leveler
Fig. 9 The contour map for before level-ing the field-using conventional leveler
Fig. 10 The contour map for after level-ing the field-using conventional leveler

AGRICULTURAL MECHANIZATION IN ASIA, AFRICA, AND LATIN AMERICA 2008 VOL.39 NO.436
siderably higher when the laser guided land leveler was used to grading in comparison to using the leveler without laser systems. The cost of operation of the laser guided land leveler was Rs. 474/h as compared to Rs 309/h for the conventional leveler. The cost of operation was 53 % costlier in case of laser guided land leveler as compared to the conventional leveler.
• The cost of leveling per hectare using laser leveler is 5932.50 Rs/ha whereas it was 3151 Rs/ha for conventional levelling.
REFERENCES
Cook, R. L. and F. W. Peikert. 1960. A comparison of tillage imple-ment. The Journal of American
Society of Agricultural Engineers, Vol.31: 211-214.
Chaudhuri D., S. K. Mathankar, V. V. Singh, and N. A. Shirsat. 2005. Performance evaluation of Laser guided land leveler for land grad-ing in vertisols of central india. Paper presented in the 39th annual convention of ISAE held at Acha-raya N. G. Ranga Agricultural University, Hyderabad during, 9-11, March, 2005.
El-Guindy, A. A. M, Hasan El., G. Sayd, and El-Banna Osman. 1996. Effect of precision land leveling systems on wheat and maize pro-duction. Paper presented at 2nd International Conference on laser and Applications, 16-19 Septem-ber, Cairo, Egypt
Mathankar, S. K., D. Chaudhuri, V. V. Singh, and N. A. Shirsat. 2005. Laser guided land leveling for rice crop production. Paper presented
in the 39th annual convention of ISAE held at Acharaya N.G. Ranga Agricultural University, Hyderabad during, 9-11, March, 2005.
Rickman, J. F. 2002. “Manual for laser land leveling”. Rice-Wheat Consortium Technical Bulletin Series 5. New Delhi-110 012, In-dia: Rice ?Wheat Consortium for the Indo-Gangetic Plains, 24p.
Tarun Kumar and Maheshwari. 2005. Land preparation by Laser technology. Paper presented in the 39th annual convention of ISAE held at Acharaya N.G. Ranga Ag-ricultural University, Hyderabad during, 9-11, March, 2005.
Xiang, Lu., Nong Fu, Di Xu, and Li Yi. 2000. Effectiveness evaluation and combined application of land leveling techniques. Transactions of Chinese Society of Agricultural Engineering 16(2), 50-53
■■
REFERENCES
AL-Khafaf, A. M., H. AL-Rawi. 1970. Views on Agr icultural Mechanization Assort study in the development of Agricultural Mechanization in the republic of Iraq between 1869-1969. AL-Naj-jaf publishing company, Bagdad, Iraq.
Baver, L. D., W. H. Gardner, and W. R. Gardner. 1972. Soil physics,
John Wily and sons, Inc., Fourth Edition, New York, U.S.A.
Bukhari, S. B., J. M. Baloch, and A. N. Mirani. 1989. Soil Manipu-lation with Tillage Implements. Agricultural Mechanization in Asia. Winter, Vo1. 20(1): 17-19.
Gill, W. R. 1959. Soil Compaction by traffic. Agricultural Engineer-ing. July: 392-394.
Steel, R. G. D and J. H. Torric. 1960. Principles and procedures
(Continued from page29)
The Effect of Two Type of Plows With Four Speedson the Field Capacity and Bulk Density
of Statistics McGrow-Hill Book Co., Inc. U.S.A.
■■

VOL.39 NO.4 2008 AGRICULTURAL MECHANIZATION IN ASIA, AFRICA, AND LATIN AMERICA 37
Development and Testing of Engine Operated Pneumatic Cotton Picker
byA. TajuddinProfessor (Farm Machinery)Agricultural Engineering College and Research Institute,Tamil Nadu Agricultural University,Kumulur - 621 712INDIA
AbstractA pneumatic cotton picker oper-
ated by 3.3 kW, 3000 rev/min petrol start kerosene run engine coupled with a centrifugal blower was devel-oped and tested. The pneumatic cot-ton picker developed an air suction force of 334 g. The machine could pick cotton at the rate of 3 kg/h. The machine-picked cotton required additional cleaning for removing the trash content. The break-even capacity of the machine was deter-mined to be 7.2 kg/h.
IntroductionCotton is one of the important
fibre crops grown in India and the share of cotton is about 70 percent
in the Indian textile industry (Anon., 1997). The cotton crop is cultivated in 8.87 million hectare with a pro-duction of 2.45 million tonnes at an average yield of 295 kg/ha in India (Swaminathan, 1999). India ranks third in cotton production in the world. In India, cotton is hand picked by human labourers, which is laborious and tedious work. Hand picking is ten and two times costlier as compared to irrigation and weed-ing operations, respectively. One adult person can pick only up to 70 kg of cotton per day as compared to 2180 kg/day capacity of a single row spindle type cotton picker (Prasad and Majumdar, 1999).
Manual picking of cotton is la-bour intensive, requiring 1560 man-hours per hectare (Sandhar, 1999). In recent years, labour shortage ap-
pears during peak periods of cotton harvesting. The use of a mechani-cal cotton picking machine will be useful in minimising the drudgery involved in hand picking. The me-chanical cotton picking system will also be helpful in achieving timeli-ness of operation for the next crop. Attempts have been made to pick cotton using a vacuum created by knapsack engine operated blowers. However, a field machine is yet to be developed. Cotton harvesting be-ing a selective, frequent and timely operation needs to be mechanised.
A test rig was developed to assess airflow rate required to effect pneu-matic picking of cotton. The picking force was determined for the bolls of ten cotton varieties. The 70E va-riety had the highest average pick-ing force of 307.4 g and the ‘Savitha’ variety had the lowest (251.9 g). The picking force increased in direct proportion with the boll volume. The regression analysis revealed that the volume of boll has good lin-
Fig. 1 Engine operated pneumatic cotton picker
Acknowledgement: The financial assistance provided by the Indian Council of Agricultural Research, New Delhi through the All India Coordinated Research Project on Farm Implements and Machinery to Agricultural Engineering College and Research Institute, Tamil Nadu Agricultural University, Coimbatore is gratefully acknowledged.
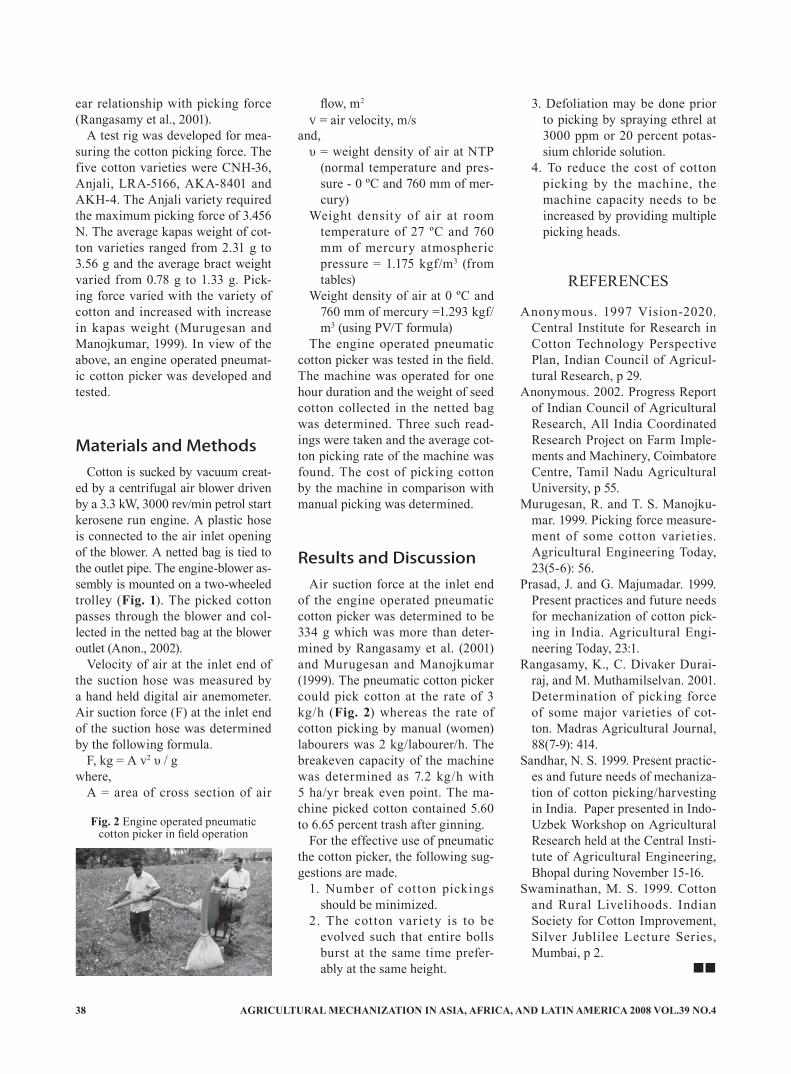
AGRICULTURAL MECHANIZATION IN ASIA, AFRICA, AND LATIN AMERICA 2008 VOL.39 NO.438
ear relationship with picking force (Rangasamy et al., 2001).
A test rig was developed for mea-suring the cotton picking force. The five cotton varieties were CNH-36, Anjali, LRA-5166, AKA-8401 and AKH-4. The Anjali variety required the maximum picking force of 3.456 N. The average kapas weight of cot-ton varieties ranged from 2.31 g to 3.56 g and the average bract weight varied from 0.78 g to 1.33 g. Pick-ing force varied with the variety of cotton and increased with increase in kapas weight (Murugesan and Manojkumar, 1999). In view of the above, an engine operated pneumat-ic cotton picker was developed and tested.
Materials and MethodsCotton is sucked by vacuum creat-
ed by a centrifugal air blower driven by a 3.3 kW, 3000 rev/min petrol start kerosene run engine. A plastic hose is connected to the air inlet opening of the blower. A netted bag is tied to the outlet pipe. The engine-blower as-sembly is mounted on a two-wheeled trolley (Fig. 1). The picked cotton passes through the blower and col-lected in the netted bag at the blower outlet (Anon., 2002).
Velocity of air at the inlet end of the suction hose was measured by a hand held digital air anemometer. Air suction force (F) at the inlet end of the suction hose was determined by the following formula.
F, kg = A v2 υ / gwhere,
A = area of cross section of air
flow, m2 v = air velocity, m/s
and,υ = weight density of air at NTP
(normal temperature and pres-sure - 0 ºC and 760 mm of mer-cury)
Weight density of air at room temperature of 27 ºC and 760 mm of mercury atmospheric pressure = 1.175 kgf/m3 (from tables)
Weight density of air at 0 ºC and 760 mm of mercury =1.293 kgf/m3 (using PV/T formula)
The engine operated pneumatic cotton picker was tested in the field. The machine was operated for one hour duration and the weight of seed cotton collected in the netted bag was determined. Three such read-ings were taken and the average cot-ton picking rate of the machine was found. The cost of picking cotton by the machine in comparison with manual picking was determined.
Results and DiscussionAir suction force at the inlet end
of the engine operated pneumatic cotton picker was determined to be 334 g which was more than deter-mined by Rangasamy et al. (2001) and Murugesan and Manojkumar (1999). The pneumatic cotton picker could pick cotton at the rate of 3 kg/h (Fig. 2) whereas the rate of cotton picking by manual (women) labourers was 2 kg/labourer/h. The breakeven capacity of the machine was determined as 7.2 kg/h with 5 ha/yr break even point. The ma-chine picked cotton contained 5.60 to 6.65 percent trash after ginning.
For the effective use of pneumatic the cotton picker, the following sug-gestions are made.
1. Number of cotton pickings should be minimized.
2. The cotton variety is to be evolved such that entire bolls burst at the same time prefer-ably at the same height.
3. Defoliation may be done prior to picking by spraying ethrel at 3000 ppm or 20 percent potas-sium chloride solution.
4. To reduce the cost of cotton picking by the machine, the machine capacity needs to be increased by providing multiple picking heads.
REFERENCES
Anonymous. 1997 Vision-2020. Central Institute for Research in Cotton Technology Perspective Plan, Indian Council of Agricul-tural Research, p 29.
Anonymous. 2002. Progress Report of Indian Council of Agricultural Research, All India Coordinated Research Project on Farm Imple-ments and Machinery, Coimbatore Centre, Tamil Nadu Agricultural University, p 55.
Murugesan, R. and T. S. Manojku-mar. 1999. Picking force measure-ment of some cotton varieties. Agricultural Engineering Today, 23(5-6): 56.
Prasad, J. and G. Majumadar. 1999. Present practices and future needs for mechanization of cotton pick-ing in India. Agricultural Engi-neering Today, 23:1.
Rangasamy, K., C. Divaker Durai-raj, and M. Muthamilselvan. 2001.Determination of picking force of some major varieties of cot-ton. Madras Agricultural Journal, 88(7-9): 414.
Sandhar, N. S. 1999. Present practic-es and future needs of mechaniza-tion of cotton picking/harvesting in India. Paper presented in Indo-Uzbek Workshop on Agricultural Research held at the Central Insti-tute of Agricultural Engineering, Bhopal during November 15-16.
Swaminathan, M. S. 1999. Cotton and Rural Livelihoods. Indian Society for Cotton Improvement, Silver Jublilee Lecture Series, Mumbai, p 2.
■■
Fig. 2 Engine operated pneumatic cotton picker in field operation

VOL.39 NO.4 2008 AGRICULTURAL MECHANIZATION IN ASIA, AFRICA, AND LATIN AMERICA 39
The Effect of Two Type of Plows With Four Speedson the Field Capacity and Bulk Density
byAli Mazin Abdul-MunaimAssitant InstructorAgric. Mechanization Dept.,College of Agriculture,University of Baghdad, BaghdadIRAQ
Maysm Thamer Al-HadidyAAssitant InstructorCivil Engineering Dept.,College of Engineering,University of Baghdad, BaghdadIRAQ
AbstractA study was performed with the
two essential types of plows most frequently used in Iraq, with four forward speeds.
The main aim of the study was to observe the effect of plow types and operational speed on field capac-ity and bulk density. The best type of plow and speed were identified along with interactions. The study used a split-plot, completely ran-domized block design in three repli-cations.
The results showed that influence of speed was significant with field capacity and bulk density but the in-fluence of type of plow had no sig-nificant influence on the field capac-ity or bulk density. The interaction between the type of plow and speed had no significant influence on the field capacity and bulk density. The highest field capacity was 0.592 ha/h at the fourth speed with the disc plow. The lowest bulk density was 1.21 g/cm3 at the first speed with the
moldboard plow.
IntroductionArcheological excavat ion in
Mesopotamia has indicated that this land was the fountain of civilization and agriculture. These excavations also indicate that the tools used at that time were highly advanced.
Many examples can be found that show the skills of Sumerians in solving the most complicated agricultural problems, such as the Sumerian plows which could per-form double functions; tillage and seeding at the same time.
The moldboard plow is considered one of the earliest modern agricul-tural plows in Iraq and is used in most middle Iraqi governorates. The disc plow is used in northern and southern governorates where it was introduced in Iraq after the mold-board plow.
Due to these considerations, the experiment was performed with two essential factors:
1. Type of plow - the two most frequently used types of plows in Iraq were used.
2. Forward speed - four speeds. The primary aim of the study
was to observe the effect of plow types and operational speed on the field capacity and bulk density. This study helped to know the best op-
erational speed and the best type of plow and whether there was interac-tion between these two factors.
Materials and MethodsAn area of land for the experi-
ment was 150 m long and 60 m wide (total area 0.9 ha). The land was plane and was not cultivated in the last season.
The field was bordered by ribbon and wedge. Samples were taken from five randomized locations in the field to depths of 5, 10, 15, 20, 25 cm in order to determine soil tex-ture by the hydrometer method. The analysis of the soil samples showed that the texture of the soil was silty clay loam.
Soil samples were taken in anoth-er five randomized locations in the field to a depth of 18 cm in order to determine the soil bulk density. The results of soil bulk density analysis (Table 1) were available before the start of the experiment.
The study was carried out in a split plot design. The two types of plows (factor A), were assigned at random to the whole plots within each block. The four speeds of op-eration (factor B), were assigned at random to the subplots within each whole plot.
The whole-plot design was a ran-domized complete block with three
Replicates Depth (0-18 cm)1 1.442 1.473 1.454 1.475 1.46
Average 1.46
Table 1 The soil bulk density (g/cm3) before the start of experiment

AGRICULTURAL MECHANIZATION IN ASIA, AFRICA, AND LATIN AMERICA 2008 VOL.39 NO.440
blocks. The two types of plows:1. Iraqi moldboard plow (112) was
manufactured by the state enter-prise for mechanical industries. The plow had three bottoms with a nominal working width of 105 cm. The overall dimen-sions were 208 cm long, 120 cm wide and 113 cm high with a mass of 300 kg.
2. Iraqi disc plow (131) was manu-factured by the state enterprise for mechanical industries. The plow had three bottoms with a nominal working width of 90 cm. The overall dimensions were 225 cm long, 115 cm wide and 135 cm high with a mass of 465 kg.
The tractor used was a CIRTA-C6806, two wheel drive with 50 kW power. The two types of plows used the same tillage depth (18 cm) and the soil moisture was fixed on 18 % during the study.
Speed of operation: Four tractor gear speeds were
used for evaluating the performance of tillage implements. The speed was determined by operating the implements between the staked dis-tances of 30.5 m. The time required to cover this distance was obtained by the use of a stop watch and speed was calculated in km/h. The width of cut was measured in meters.
Field CapacityField capacity was calculated by
the below equation: C = SWE/10 = 0.0825 SW
whereC= field capacity, ha/h.S= speed of operation, km/h.W= width of plow, m.E= field of efficiency of plows,
decimal. The time lost during the operation
of implements as assumed to be 17.5 %.
Bulk DensityBulk density is the ratio of soil
mass to volume. It is usually ex-
pressed in terms of grams per cu-bic centimeter (g/cm3). The core technique was used to find the bulk density. Compaction of the soil into a smaller volume may be measured in terms of an increase in bulk den-sity. Along with this bulk density increase, is an increase in the me-chanical strength of the soil mass. This strength must be overcome by tillage implements.
Results and DiscussionTable 2 shows the mean of ob-
tained results. The results of statistical analysis
are show in Table 3. Table 3 shows the inf luence of
type of plow and the speed on field capacity. The influence of speed is significant with field capacity. When the speed increased, it caused an increase in field capacity. The im-portance of speed as one of the es-sential factors is shown in the field capacity equation. So, when speed increases, field capacity increases.
Table 3 also shows that the type
of plow had no significant influence on the field capacity or the interac-tion between the type of plow and speed. Also, the inf luence of the speed was significant on the bulk density of the soil. Therefore, as the speed increased the bulk density in-creased. There was no significance in the type of plow on the bulk density as well as the interaction be-tween the two factors ( type of plow and speed).
Conclusion 1. When applying the moldboard
plow, the highest field capac-ity was 0.545 ha/h at the fourth speed. The lowest bulk density is 1.21 g/cm3 when the f irst speed was used.
2. When applying the disc plow, the highest field capacity was 0.592 ha /h when using the fourth speed. The lowest bulk density was 1.26 g/cm3 when the lowest speed was used.
(continued on page36)
Implements Speed, km/h Width of cut, m
Field capacity, ha/h
Soil bulk density, g/cm3
Mouldboard plow
3,08 1.008 0.274 1.213.68 1.017 0.308 1.345.47 0.975 0.439 1.396.94 0.955 0.545 1.46
Disc plow
3.15 1.007 0.261 1.263.28 1.002 0.270 1.335.91 0.989 0.480 1.407.30 0.985 0.592 1.49
Table 3 Economics of solar-cum-gas fired dates drying system
S.O.V d.f. F cal F tableField capacity, ha/h Bulk density, g/cm3 5 % 1 %
Block 2A 1 1.675n.s 6.857n.s 18.51 98.50
Error (a) 2B 3 139.033** 10.148** 3.49 5.95
AB 3 2.842n.s 0.165n.s 3.49 5.95Error (b) 12
Total 23A: Type of plow, B: Different speeds
Table 3 Statistical analysis of the field capacity and bulk density
VOL.39 NO.4 2008 AGRICULTURAL MECHANIZATION IN ASIA, AFRICA, AND LATIN AMERICA 41
Development and Evaluation of Direct Paddy Seeder for Assessing the Suitability to Rural Women
byD. SirishaResearch ScholarDept. of Farm Power and Machinery,Agricultural Engineering Collegeand Research Institute,Tamil Nadu Agricultural University,Coimbatore - 641003, [email protected]
R. ManianDeanAgricultural Engineering Collegeand Research Institute,Tamil Nadu Agricultural University,Coimbatore - 641003, INDIA
K. KathirvelProfessor and headDept. of Farm Power and Machinery,Agricultural Engineering Collegeand Research Institute,Tamil Nadu Agricultural University,Coimbatore - 641003, INDIA
AbstractTransplanting operation is per-
formed by women in upright bend-ing posture. A women has to dip her hand 6,000 to 7,000 times for transplanting paddy in standing wa-ter. This posture, when continued for years together results in Low Back Pain (LBP) and spinal disorders. This arduous operation can be made more comfortable by the use of direct pad-dy seeders. But a woman operated direct paddy seeder is non-existent. Hence three types of paddy seed-ers namely two row, three row and four row paddy seeders to reduce the drudgery of women and three types of material namely plastic galvanized iron (GI) and fiber reinforced plastic (FRP) for reducing the weight of the unit were selected for ergonomical evaluation. Ten female subjects were selected for the investigation based on the age. The parameters used for the ergonomical evaluation of the di-rect paddy seeders include heart rate and oxygen consumption rate, energy cost of operation, acceptable work load, work pulse, overall discomfort
rating, body part discomfort score and force required for the operation of direct paddy seeder. A swinging type handle was developed for pull-ing the seeder to avoid the awkward posture of farm women.
The mean values of heart rate of the ten subjects for four row, three row and two row paddy seeders with plastic, GI and FRP materials varied between 124.43 and 152.50 beats min-1 and the corresponding oxygen consumption values varied between 0.535 and 0.698 l min-1. The field capacity for the four row, three row and two row paddy seeders with plastic, GI and FRP materials varied from 0.025 to 0.0625 ha hr-1. Based on the ergonomical evaluation and field capacity, the four row paddy seeders of three materials were chosen for performance evaluation and the four-row paddy seeder with plastic material was adjudged as the best seeder for rural women folk.
IntroductionTransplanting of rice seedlings
being labour-intensive and costly method could be substituted by di-rect seeding, which could reduce la-bour needs by more than 20 percent in terms of working hours. Direct seeded rice is an age-old practice of paddy cultivation in India, particu-larly in rain fed areas, where farm-ers totally eliminate the seedling preparation in nursery and trans-planting. Drum seeder is becoming popular for wet seeding because of its less initial investment, easy op-eration, low repair and maintenance cost.
Transplanting operation is per-formed by women in upright bend-ing posture. A woman has to dip her hand 6000 to 7000 times for transplanting paddy in standing water (Vatsala, 2002). This posture, when continued for years together results in Low Back Pain and spinal disorders. This arduous operation can be made more comfortable by direct paddy seeders. But a woman operated direct paddy seeder is non-existent. There are 200 million agricultural workers of which more than 35 percent are female workers.
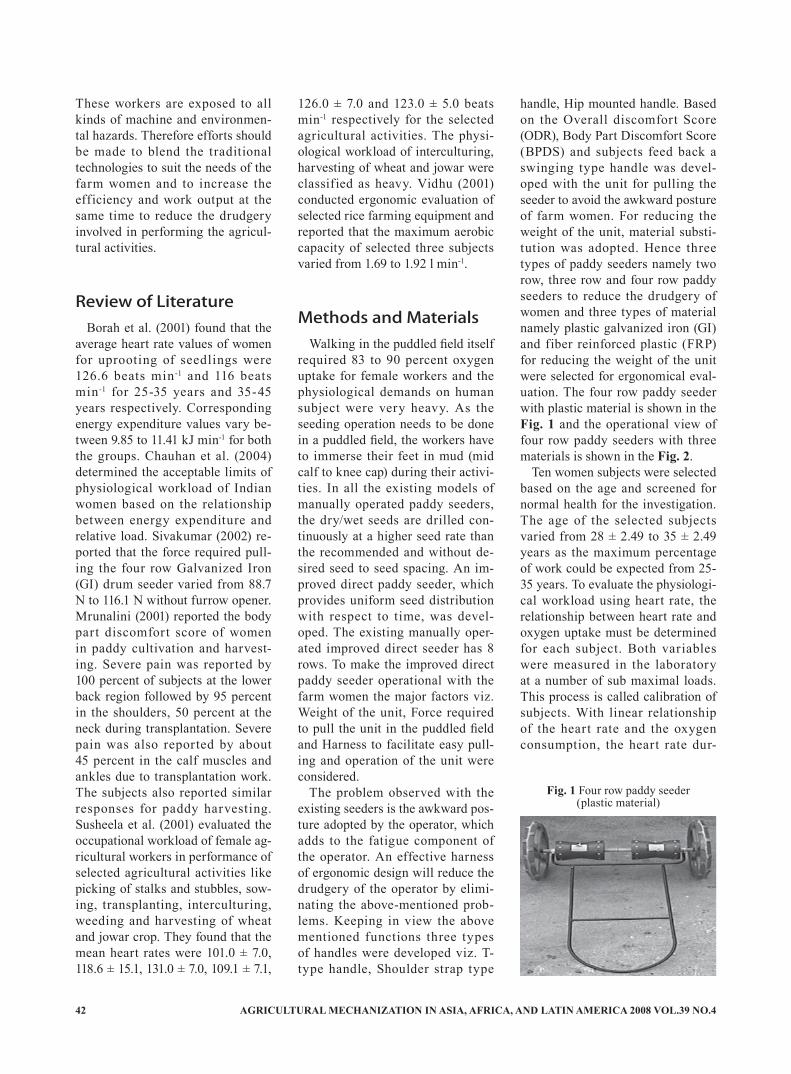
AGRICULTURAL MECHANIZATION IN ASIA, AFRICA, AND LATIN AMERICA 2008 VOL.39 NO.442
These workers are exposed to all kinds of machine and environmen-tal hazards. Therefore efforts should be made to blend the traditional technologies to suit the needs of the farm women and to increase the efficiency and work output at the same time to reduce the drudgery involved in performing the agricul-tural activities.
Review of LiteratureBorah et al. (2001) found that the
average heart rate values of women for uprooting of seedlings were 126.6 beats min-1 and 116 beats min -1 for 25-35 years and 35-45 years respectively. Corresponding energy expenditure values vary be-tween 9.85 to 11.41 kJ min-1 for both the groups. Chauhan et al. (2004) determined the acceptable limits of physiological workload of Indian women based on the relationship between energy expenditure and relative load. Sivakumar (2002) re-ported that the force required pull-ing the four row Galvanized Iron (GI) drum seeder varied from 88.7 N to 116.1 N without furrow opener. Mrunalini (2001) reported the body part discomfort score of women in paddy cultivation and harvest-ing. Severe pain was reported by 100 percent of subjects at the lower back region followed by 95 percent in the shoulders, 50 percent at the neck during transplantation. Severe pain was also reported by about 45 percent in the calf muscles and ankles due to transplantation work. The subjects also reported similar responses for paddy harvesting. Susheela et al. (2001) evaluated the occupational workload of female ag-ricultural workers in performance of selected agricultural activities like picking of stalks and stubbles, sow-ing, transplanting, interculturing, weeding and harvesting of wheat and jowar crop. They found that the mean heart rates were 101.0 ± 7.0, 118.6 ± 15.1, 131.0 ± 7.0, 109.1 ± 7.1,
126.0 ± 7.0 and 123.0 ± 5.0 beats min-1 respectively for the selected agricultural activities. The physi-ological workload of interculturing, harvesting of wheat and jowar were classified as heavy. Vidhu (2001) conducted ergonomic evaluation of selected rice farming equipment and reported that the maximum aerobic capacity of selected three subjects varied from 1.69 to 1.92 l min-1.
Methods and MaterialsWalking in the puddled field itself
required 83 to 90 percent oxygen uptake for female workers and the physiological demands on human subject were very heavy. As the seeding operation needs to be done in a puddled field, the workers have to immerse their feet in mud (mid calf to knee cap) during their activi-ties. In all the existing models of manually operated paddy seeders, the dry/wet seeds are drilled con-tinuously at a higher seed rate than the recommended and without de-sired seed to seed spacing. An im-proved direct paddy seeder, which provides uniform seed distribution with respect to time, was devel-oped. The existing manually oper-ated improved direct seeder has 8 rows. To make the improved direct paddy seeder operational with the farm women the major factors viz. Weight of the unit, Force required to pull the unit in the puddled field and Harness to facilitate easy pull-ing and operation of the unit were considered.
The problem observed with the existing seeders is the awkward pos-ture adopted by the operator, which adds to the fatigue component of the operator. An effective harness of ergonomic design will reduce the drudgery of the operator by elimi-nating the above-mentioned prob-lems. Keeping in view the above mentioned functions three types of handles were developed viz. T-type handle, Shoulder strap type
handle, Hip mounted handle. Based on the Overall discomfort Score (ODR), Body Part Discomfort Score (BPDS) and subjects feed back a swinging type handle was devel-oped with the unit for pulling the seeder to avoid the awkward posture of farm women. For reducing the weight of the unit, material substi-tution was adopted. Hence three types of paddy seeders namely two row, three row and four row paddy seeders to reduce the drudgery of women and three types of material namely plastic galvanized iron (GI) and fiber reinforced plastic (FRP) for reducing the weight of the unit were selected for ergonomical eval-uation. The four row paddy seeder with plastic material is shown in the Fig. 1 and the operational view of four row paddy seeders with three materials is shown in the Fig. 2.
Ten women subjects were selected based on the age and screened for normal health for the investigation. The age of the selected subjects varied from 28 ± 2.49 to 35 ± 2.49 years as the maximum percentage of work could be expected from 25-35 years. To evaluate the physiologi-cal workload using heart rate, the relationship between heart rate and oxygen uptake must be determined for each subject. Both variables were measured in the laboratory at a number of sub maximal loads. This process is called calibration of subjects. With linear relationship of the heart rate and the oxygen consumption, the heart rate dur-
Fig. 1 Four row paddy seeder(plastic material)

VOL.39 NO.4 2008 AGRICULTURAL MECHANIZATION IN ASIA, AFRICA, AND LATIN AMERICA 43
ing the field trials can be predicted from the calibration charts (Bridger, 1995). The heart rate was measured using Polar Vantage NV computer-ized heart rate monitor. This can be used in the field directly where the telemetry system cannot be used. This polar pacer has the following four basic components: chest belt transmitter, elastic strap, receiver unit, and interface. The oxygen con-sumption of the subjects while run-ning on the treadmill was measured using Metamax-II. The Metamax II plus is a portable metabolic stress test system, which can be used as a mobile unit to measure pulmonary gas exchange under real conditions (e.g. off-site, at the work-site, in the field) or as a stationary system in the stress lab.
Ergonomical EvaluationThe ergonomic evaluation was
carried out in puddled field of wet-land of the Department of Agron-omy, TNAU. The soil texture was 39.43, 9.2 and 51.37 percent clay, silt and sand respectively. For the ergonomic evaluation of the 2, 3 and 4 row paddy seeders, the field was disc ploughed and then it was flooded with water. The trials were conducted between 8.00 AM and 5.00 PM from the month of June to September 2004. The mean dry bulb temperature, wet bulb tem-perature and relative humidity were measured. The subjects were given information about the experimental requirements so as to enlist their
full cooperation. They were asked to report at the work site at 7.30 AM in post-absorptive stage and have a rest for 30 minutes before start-ing the trial. The seeder was filled with CO 43 variety of paddy to be sown to its half of the capacity. The subject was allowed to operate the seeder in the field at a speed of 0.70 km h-1 (Anon, 2000).
Each trial started with taking five minutes data for physiological re-sponses of the subjects while resting on a stool under shade. The direct paddy seeder when filled to its half volume at start will be completely emptied within an average time of 20 minutes. But in actual practice, the drums are filled before it is fully emptied. So a trial time of 20 min-utes was taken for the physiologi-cal measurement in 2, 3 and 4 row paddy seeders (with plastic, FRP and GI material each) operation.
Parameters Used for the Egonom-ical Evaluation
The values of heart rate at rest-ing level and 6th to 15th minute of operation were taken for calculating the physiological responses of the subjects (Tiwari and Gite, 1998). From the values of heart rate (HR) observed during the trials, the corre-sponding values of oxygen consump-tion rate (VO2) of the subjects for all the paddy seeders were predicted from the calibration chart of the sub-jects. The energy cost of operation of the implement was computed by multiplying the oxygen consumed
by the subject during the trial period with the calorific value of oxygen as 20.88 kJ l-1 (Nag et al., 1980) for all the subjects. The acceptable work-load (AWL) for Indian workers was the work consuming 35 percent of VO2 max (Saha et al., 1979). To as-certain whether the operation of all the paddy seeders is within the ac-ceptable workload (AWL), the VO2 maximum for each treatment was computed and recorded. To have a meaningful comparison of physi-ological response Δ values (Increase over resting values) for heart rate (work pulse) was calculated (Tiwari and Gite, 1998). For this, the aver-age values of the heart rate at rest level and at working condition were used. For the assessment of over-all discomfort rating a 10 - point psychophysical rating scale (0 - no discomfort, 10 - extreme discomfort) was used and a body map technique was used to asses the Body Part Dis-comfort Score which were an adop-tion of Corlett and Bishop (1976) technique. The effort required in pulling the implement was found us-ing the Novatech load cell.
Based on the ergonomical evalua-tion and field capacity, the four row paddy seeders of three materials were chosen for performance evalu-ation. The paddy seeders were eval-uated for its performance in the field in terms of agronomical parameters viz. growth attributes of rice such as plant population per square meter, number of tillers per square meter on 50 DAS and 75 DAS, yield at-
Fig. 2 Four row paddy seeder in operation
Plastic Galvanized iron FRP

AGRICULTURAL MECHANIZATION IN ASIA, AFRICA, AND LATIN AMERICA 2008 VOL.39 NO.444
tributes like productive tillers per square meter, number of grains per panicle, 1000 grain weight and grain and straw yields of rice.
Results and DiscussionThe mean values for age, status
and weight of all the ten subjects were 31.7 years, 156.4 cm and 52.2 kg, respectively. The mean dry bulb temperature, wet bulb temperature and relative humidity varied be-tween 21 to 34.2 ºC, 19.0 to 25.0 ºC and 25 to 71 percent respectively during the period of evaluation. The selected ten subjects were cali-brated in the laboratory by indirect assessment of oxygen uptake. The relationship between the heart rate and oxygen consumption of the sub-jects was found to be linear for all the subjects. The maximum aerobic capacity of the selected ten subjects varied from 1.214 to 1.386 l min-1. A swinging type handle was devel-oped with the unit for pulling the seeder to avoid the awkward posture of farm women.
The mean values of heart rate of the ten subjects for four row paddy seeders with plastic, GI and FRP material were 139.03, 152.50 and 140.21 beats min-1 and the cor-responding oxygen consumption values were 0.640, 0.743 and 0.646 l min-1. The mean values of heart rate of the ten subjects for three row paddy seeders with plastic, GI and FRP material were 131.76, 145.62
and 133.64 beats min-1 and the cor-responding oxygen consumption values were 0.585, 0.698 and 0.601 l min-1. The mean values of heart rate of the ten subjects for two row paddy seeders with plastic, GI and FRP material was 124.43, 138.89 and 125.11 beats min-1 and the cor-responding oxygen consumption values were 0.539, 0.635 and 0.535 l min-1. The energy expenditure for the operations of four row paddy seeder with plastic, GI and FRP was computed as 13.43, 15.52, 13.51 kJ min-1 and the operation of these seeders were graded as Heavy, Ex-tremely heavy and very heavy. The energy expenditure for the opera-tions of three row paddy seeder with plastic, GI and FRP was computed as 12.22, 14.43 and 12.52 kJ min-1 and the operation of these seeders were graded as Heavy, very heavy and heavy. The energy expenditure for the operations of two row paddy seeder with plastic, GI and FRP was computed as 11.06, 13.38 and 11.17 kJ min-1 and the operation of these seeders were graded as moderately heavy, heavy and heavy.
The over all discomfort rate for the four row paddy seeder with plas-tic, GI and FRP was 7.07, 8.10 and 7.15 whereas for three row paddy seeders the rating was 6.72, 7.25 and 6.87. Similarly for two row paddy seeder the rating was 6.37, 6.8 and 6.41. The body par t discomfor t score for the four row paddy seeder with plastic, GI and FRP was 47.73, 56.57 and 44.55 whereas for three
row paddy seeders the discomfort score was 40.25, 50.02 and 41.82. While for two row paddy seeder the discomfort score was 37.76, 43.84 and 39.29. The force requirement for the four row paddy seeder with plas-tic, GI and FRP was 110.34, 195.98 and 124.43 N. whereas for three row paddy seeders the force requirement was 101.36, 165.84 and 103.34 N. While for two row paddy seeder the force requirement was 91.50, 124.16 and 96.71 N. The field capacity for the four row paddy seeder with plas-tic, GI and FRP was 0.0625, 0.0426 and 0.055 ha hr-1. Whereas for three row paddy seeders the value was 0.045, 0.031 and 0.039 ha hr-1. While for two row paddy seeder the field capacity was 0.028, 0.020 and 0.025 ha hr-1. The comparative param-eters measured for the 4, 3 and 2 row paddy seeders with plastic, GI and FRP materials are presented in Table 1.
The walking in the puddled field consumes 85 percent of the energy expenditure. The farm women has to walk 25 km to cover the area of 1 ha with two row paddy seeder. Based on the ergonomical evalu-ation and subjects feed back, the four row paddy seeders with three different materials are selected for intensive field evaluation and the four-row paddy seeder with plas-tic material was adjudged as the women friendly direct paddy seeder with improved ergonomic design features.
Parameters Four row paddy seeder Three row paddy seeder Two row paddy seederPlastic GI FRP Plastic GI FRP Plastic GI FRP
Mean heart rate, beat min-1 139.03 152.50 140.21 131.76 145.62 133.64 124.43 138.89 125.11Oxygen consumption, l min-1 0.640 0.743 0.646 0.585 0.698 0.601 0.529 0.635 0.535Energy expenditure, kJ min-1 13.43 15.52 13.57 12.22 14.43 12.52 11.06 13.38 11.17Grading Heavy Extremely
heavyVery heavy
Heavy Very heavy
Heavy Moderately heavy
Heavy Heavy
ODR 7.07 8.10 7.15 6.72 7.25 6.87 6.37 6.8 6.41BPDS 47.73 56.57 44.55 40.25 50.02 41.82 37.56 43.54 39.29Force requirement, N 110.34 195.98 124.43 101.36 165.84 103.34 91.50 124.16 96.71Coverage, ha hr-1 0.0625 0.0426 0.055 0.045 0.031 0.039 0.028 0.020 0.025
Table 1 Comparison of parameters for the 4, 3 and 2 row paddy seeders with plastic, GI and FRP materials
VOL.39 NO.4 2008 AGRICULTURAL MECHANIZATION IN ASIA, AFRICA, AND LATIN AMERICA 45
ConclusionThree types of paddy seeders
namely two row, three row and four row paddy seeders to reduce the drudgery of women and three types of material namely plastic galvanized iron (GI) and fiber re-inforced plastic (FRP) for reducing the weight of the unit were selected for ergonomical evaluation. Ten fe-male subjects were selected for the investigation based on the age. The age of the selected subjects varied from 28 ± 2.49 to 35 ± 2.49 years as the maximum percentage of work could be expected from 25-35 years. The selected ten subjects were cali-brated in the laboratory by indirect assessment of oxygen uptake. The maximum aerobic capacity of the selected ten subjects varied from 1.214 to 1.386 l min-1. A swinging type handle was developed for pull-ing the seeder to avoid the awkward posture of farm women. The mean values of heart rate of the ten sub-jects for four row, three row and two row paddy seeders with plas-tic, GI and FRP materials varied between 124.43 and 152.50 beats min-1 and the corresponding oxygen consumption values varied between 0.535 and 0.698 l min-1. The over all discomfort rate for the four row, three row and two row paddy seed-
ers with plastic, GI and FRP varied from 6.37 to 8.10 .The force require-ment for the four row, three row and two row paddy seeders with plastic, GI and FRP varied in between 91.50 and 195.98 N. The field capacity for the four row, three row and two row paddy seeders with plastic, GI and FRP materials varied from 0.025 to 0.0625 ha hr-1. Based on the ergonomical evaluation and field capacity, the four row paddy seed-ers of three materials were chosen for performance evaluation and the four-row paddy seeder with plastic material was adjudged as the best seeder for rural women folk.
REFERENCES
Bridger, R. S. 1995. Introduction to Ergonomics. McGraw-Hill, Inc, New York: 205-210.
Brundke, J. 1984. Langzeitmes-sungen der Pulsfrequenz und Moglichkeiten der Aussage uber die Arbeitsbeansprunchung. In Pulsfrequenz und Arbeitsunchun-gen, Schriftenreihe Arbeitswis-senschaft und Praxis, Band 28. Berlin: Beuth- Vertrieb.
Mrunalini, A. 2001. Women in paddy transplatation and harvest-ing - Physical and Physiological stresses. Humanizing work and
work environment, 129-133.Nag, P. K. and S. K. Chatterjee.
1981. Physiological reactions of female workers in Indian agricul-tural works. Human Factors, 23: 607-614.
Sivakumar, S. S., R. Manian, and K.Kathirvel. 2002. Investigation on the performance evaluation of drum seeder as influenced by ma-chine, ergonomic and crop param-eters. Ph D Thesis. Department of Farm Machinery, Tamil Nadu Ag-ricultural University, Coimbatore, India.
Susheela P. Sawkar, M. A. Varghese, P. N. Saha, and K. V. Ashalatha. 2001. Ergonomic assessment of occupational workload and rest allowances for female agricultural labourers in Dharwad, Karnataka. Humanizing work and work envi-ronment, 140-144.
Tewari, P. S. and L. P. Gite. 1998. Human energy expenditure dur-ing power tiller operation. Paper presented at XXXIII annual con-vention of ISAE held at CIAE, Bhopal, Sept.21-23.
Vidhu, K. P. 2001. An investiga-tion on ergonomic evaluation of selected rice farming equipment. Unpublished M.E.(Ag.) Thesis, Department of Farm Machinery, Tamil Nadu Agricultural Univer-sity, Coimbatore, India.
■■
AGRICULTURAL MECHANIZATION IN ASIA, AFRICA, AND LATIN AMERICA 2008 VOL.39 NO.446
Development and Evaluation of Farm Level Turmeric Processing Equipment
byU. S. PalAssistant Process EngineerAICRP on Post Harvest Technology,College of Agricultural Engineeringand Technology,Orissa University of Agriculture and Technology,Bhubaneswar - 751003, [email protected]
N. R. SahooAssistant Food MicrobiologistAICRP on Post Harvest Technology,College of Agricultural Engineeringand Technology,Orissa University of Agriculture and Technology,Bhubaneswar - 751003, INDIA
K. KhanResearch EngineerAICRP on Post Harvest Technology,College of Agricultural Engineeringand Technology,Orissa University of Agriculture and Technology,Bhubaneswar - 751003, INDIA
G. SahooAssitant BiochemistAICRP on Post Harvest Technology,College of Agricultural Engineeringand Technology,Orissa University of Agriculture and Technology,Bhubaneswar - 751003, INDIA
AbstractThe post harvest unit operations
of turmeric, i.e. cleaning, curing, drying, polishing, grading are car-ried out manually by conventional methods which are slow, tedious and labour-intensive. Attempts have been made to develop different post harvest equipment for turmeric such as washer (capacity- 200 kg/h), curing unit (capacity- 100 kg/h), polisher (capacity- 100 kg/h) and grader (capacity- 200kg/h) to reduce drudgery, labour cost and maintain the quality of the final product. Dur-ing field testing, it was observed that all the equipment were operat-ing satisfactorily and could be used in the farm level.
IntroductionTurmeric is one of the main cash
crops of India. The whole turmeric is a unique, colourful and versatile plant product combining properties of a spice or flavouring with added features being a colourant, a cosmet-
ic and a drug useful in a number of diseases. India is the largest produc-er and exporter of turmeric with an annual production of 654,000 tonnes during 2000-01 (Vikas, 2003).
The post harvest unit operations of turmeric are cleaning, curing, drying, polishing and grading. After harvesting, turmeric is washed to remove the adhering earth from the harvested rhizomes. Then rhizomes are boiled to reduce the time of dry-ing, ensure an even distribution of colour in the rhizomes and give a better quality product by gelatinisa-tion of the starch (Purseglove et al., 1981). The boiled turmeric is dried under sun on the drying floor. Thor-oughly dried turmeric is polished to
remove the outer dirty skin, roots and soil particles and transformed into relatively smooth, bright and yellow rhizomes. Turmeric is grad-ed into bulbs and fingers in different fractions, based on their size.
Most of these farm operations are carried out manually by con-ventional methods which are slow, tedious and labour-intensive. There is a mechanization gap in the field
Acknowledgement: Authors are thankful to Indian Council of Agri-cultural Research for providing nec-essary financial support and Orissa University of Agriculture and Tech-nology, for providing the infrastruc-ture for the research work.
Physical property Primary finger, raw Primary finger, driedRange Average value Range Average value
Length, cm 8.94-9.55 9.25 5.15-7.50 6.3Diameter, cm 1.47-1.69 1.58 1.0-1.4 1.2Bulk density, kg/m3 678-710 694 470-496 483True density, kg/m3 1,295-1,317 1,306 1,136-1,164 1,150Porosity, % 46-47 46.5 57-58 57.5Angle of repose, º 30-32 31 35-37 36
Table 1 Physical properties of turmeric

VOL.39 NO.4 2008 AGRICULTURAL MECHANIZATION IN ASIA, AFRICA, AND LATIN AMERICA 47
of farm level primary processing activities of turmeric after harvest. The adaptation of mechanized and improved technique can reduce drudgery, labour cost and maintain the quality of the final product. At-tempts have been made to develop different post harvest equipments for turmeric such as washer, curing unit, polisher and grader to make the job easier and labour-saving.
The improved turmeric boiler developed at the Department of Agricultural Processing, TNAU, Coimbatore, India consists mainly of two rectangular shaped perfo-rated containers placed inside an outer metallic container provided with lid. The capacity is 150 kg per
batch with operating cost of Rs. 4/- per quintal and only two labourers for loading, unloading and fixing the container (Sreenarayanan and Viswanathan, 1989). A mechani-cal polisher for turmeric has been developed in the Agricultural Uni-versity at Andhra Pradesh, India. It consist of 880 mm diameter mild steel drum with meshes wrapped one above the other which rests on ball bearings at the two ends on a rectangular stand. It is operated by a 2 hp electrical motor. The drum speed is maintained at 30-32 rpm. It can polish about 600-700 kg/h (Sukumaran and Satyanarayana, 1999). A reciprocating type grader has been developed by the Agricul-
tural University at Andhra Pradesh, which has a capacity of 400 kg/h, with a grading efficiency of 95 %. It can grade into four grades, viz. bulbs, fingers (30 mm length and above), polishable nail (20 to 30 mm length) and un-polishable nail (less than 20 mm length) in a single pass (Varshney, 2004).
Materials and MethodsDetermination of Physical Prop-erties of Turmeric
Physical properties of turmeric such as shape, size, bulk density, true density and angle of repose were determined which are required for design of different equipment for turmeric. The length and diameter of fingers were measured by vernier calipers. The bulk density was mea-sured by weighing a known volume of turmeric and true density was measured by toluene displacement method. The angle of repose was measured by a tilting top drafting ta-ble. The dimension of turmeric was required for selecting proper sieve size required for design of turmeric grader, bulk density was required for design of drum volume of a polisher or storage structure for a given ca-pacity and angle of repose for design of the hopper and discharge chute.
Construction Features of the EquipmentHand Operated Turmeric Washer
A hand operated washer was
Fig. 1 Hand operated turmeric washer Fig. 2 Power operated turmeric/ginger washer Fig. 3 Turmeric curing unit
Name of the equipment
Pedal operated turmericwasher Tturmeric grader
Function Polishing of turmeric Washing of turmeric and gingerOverall dimension 115 × 70 × 125 cm 150 × 102 × 170 cmWeight 55 kg 86 kgCost Rs. 4,000/- Rs. 10,000/-Power source and requirement
Manual 1.0 hp single phase motor
Speed of operation 45 rpm 90 rpmRated capacity 100 kg/h 200 kg/h
Table 3 General information turmeric washer and grader
Name of the equipment
Hand operated turmericwasher
Power operated turmeric washer
Function Washing of turmeric Washing of turmeric and gingerOverall dimension 90 × 50 × 82 cm 82 × 82 × 67 cmWeight 24 kg 56 kgCost Rs. 2,000/- Rs. 12,000/-Power source and requirement
Manual 1.0 hp single phase electric motor
Speed of operation 120 rpm 120 rpmRated capacity 200 kg/h 300 kg/h
Table 2 General information on hand and power operated turmeric washer

AGRICULTURAL MECHANIZATION IN ASIA, AFRICA, AND LATIN AMERICA 2008 VOL.39 NO.448
developed which consisted of a per-forated drum (40 cm dia × 60 cm length) rested on the stand (Fig. 1). Below the drum, there was a water tank so that the bottom portion of the drum submerged inside the wa-ter in the tank. Turmeric was loaded in the perforated drum through the door provided on the drum surface. When the drum was rotated, the adhering earth on the rhizomes was washed away and collected in the water tank. After the operation, the drum was unlocked and the turmer-ic was then unloaded by opening the door. The capacity of the washer was 40 % of the volumetric capac-ity of the drum as less than half of the drum was submerged inside the water tank.
Dimensions of perforated drum: Diameter- 40 cm, Length- 60 cm
Water tank dimensions: 73 cm × 20 cm × 20 cm
Power Operated Turmeric WasherA power operated turmeric wash-
ing machine was also developed and tested in the field. It was a vertical cylindrical container having rotat-ing base (diameter 77 cm), as shown in Fig. 2, and having provision for water spray through a perforated pipe fitted at the inside surface of the container. The holding chamber height was 25 cm. It was operated by 1.0 hp motor at a speed of 240 rpm. Provision was made for load-ing the uncleaned turmeric at the top opening and discharging the washed product at the side opening of the cylindrical casing. Two pro-jections were provided on a rotating
base to impart mild mixing action of the rhizomes during operation. The water with mud was collected at the bottom through an extended pipe. The actual capacity was taken as 50 % of the inside volumetric space so as to facilitate turning of rhizomes during washing and to avoid load on the motor. The same machine could also be used for washing of ginger.
Turmeric Curing UnitThe improved low cost turmeric
curing/boiling unit consisted of two aluminium cooking containers of different size with a covering lid. The outer container was 75 cm di-ameter and 50 cm deep, whereas the inner perforated container was of 65 cm diameter and 45 cm deep (Fig. 3). The inner container was placed inside the outer container over two stands and taken out by means of
two ‘S’ shaped hooks, rope and poles. The capacity was 100 kg per batch. The outer container with water was placed over a fire. The inner container full of rhizomes was placed inside outer container and then the outer container was covered with a lid. After the curing operation the inside container was taken out. The capacity per batch of curing was generally taken as the volumetric capacity of the inside container.
Pedal Operated Turmeric PolisherA hexagonal drum having six
polishing plates of size 30 cm × 60 cm made of inner expanded wire mesh (2.5 cm × 2.5 cm) and outer oven wire mesh (0.5 cm × 0.5 cm size) rested on ball bearings at the two ends of the stand. The polishing drum was rotated by pedal through
Fig. 4 Turmeric polisher (pedal operated) Fig. 5 Hexagonal drum Fig. 6 Turmeric grader
Hand operated turmeric washer
Power operated turmeric washer
Material processed Raw turmeric Raw turmericAmount processed 200 kg 400 kgOperating time 1 h 80 minCapacity 200 kg/h 300 kg/hPower consumption Manual 0.3 kWh/qLabour requirement 1 man.h 1 man.hBreakdown of equipment - NoCost of operation Rs. 4.50/q Rs. 6.50/qTest result 12 % loss in weight due to
washing. Water consump-tion 150 l/h
16 % weig ht loss wa s observed with some peel loss. Water consumption 150 l/h
Overall performance Satisfactory SatisfactoryRemark Useful for on-farm washing
jobThis unit can be installed in the processing yard where electric power is available. This unit is also suitable for washing green ginger
Table 4 Field performance data of hand and power operated turmeric washer

VOL.39 NO.4 2008 AGRICULTURAL MECHANIZATION IN ASIA, AFRICA, AND LATIN AMERICA 49
chain and sprocket arrangement (Fig. 4). There was a seating ar-rangement for operator comfort dur-ing pedaling the polisher. Spikes in the polishing plates and baffles on the shaft were provided for thorough mixing of turmeric and imparting additional rubbing action. For load-ing and unloading of turmeric, one polishing plate was used as the door on the drum surface. Due to rotation of the drum, turmeric was rubbed against the inside expanded wire mesh surface and polishing was achieved. The outer skin rubbed off by polishing fell through the perfo-ration of the drum. The capacity of the polisher was generally 75 % of the drum volume to facilitate turn-ing and mixing of dried rhizomes during polishing.
Critical Speed of PolishingDuring rotation inside the drum,
the speed above which centrifug-
ing occurred was called the critical speed. The rpm of the polishing drum must be less than this critical speed otherwise proper polishing of the rhizomes will not take place.
From theoretical consideration:Nc = 30/π sqrt [g/(R − r)]
where,Nc = Critical speed, rpmg = acceleration due to gravity,
9.81 m/s2
R = Radius of the drum, m (For hexagonal drum ‘R’ is taken
as the average radius of circum-scribing and inscribing circle as given in Fig. 5)
r = radius of turmeric, m Since r <<<< R, hence r = 0For proper stirring, critical speed
is taken as 80 % of NcThe critical speed is calculated to
be 45 rpm.
Turmeric GraderThe grader consisted of frame,
hopper, two sets of sieves, electric motor and rocking arrangement (Fig. 6). The frame (size 102 cm × 82 cm × 115 cm) of M.S. angle housed one upper sieve of 1.2 cm dia hole and one lower sieve of 1.0 cm dia hole 100 cm × 74 cm with individual discharge outlets. The inclination of both the sieves was 13° with the horizontal. The frame reciprocated on a stand by a rock-ing mechanism. The sieve assembly was connected eccentrically to a fly wheel (25 cm) which was powered by a 1 hp electric motor through a belt and pulley arrangement. On top of the frame, a feed hopper 102 cm × 40 cm with a sliding chute was provided for uniform loading of tur-meric to the upper sieve.
Results and DiscussionDetermination of Physical Prop-erties of Turmeric
The physical properties of both raw (81 % moisture content) and dried turmeric fingers (10 % mois-ture content) were determined and given in Table 1.
Hand and Power Operated Tur-meric Washer
From field testing of the turmeric washer (Fig. 7), the capacity of the washer was 2 q/h with 20 kg per batch. The water consumption was 75 lit per 100 kg of washed tur-meric. Performance of the machine was satisfactory. This machine can be used conveniently for washing of turmeric in those regions where electricity is not available.
From the field trial of the power-operated washer, the capacity was 40 kg/batch. It took 8 min for wash-ing a batch of turmeric and 16 % of weight including peels was lost dur-ing washing. Capacity of the washer was 300 kg/h. The cost of operation of hand and power operated washer was Rs. 4.50 and Rs. 6.50 per quin-tal, respectively. The speed of the base was 120 rpm. The general in-
Fig. 7 Field testing of turmeric washer Fig. 8 Graded fractions obtainedfrom turmeric grader
Pedal operated turmeric polisher Turmeric grader
Material processed Dried turmeric Dried turmericAmount processed 100 kg 400 kgOperating time 60 min 120 minCapacity 100 kg/h 200 kg/hPower consumption Manual 0.4 kWh/qLabour requirement 1 man.h 1 man.hBreakdown of equipment Slipping of chain NoCost of operation Rs. 12.70/q Rs. 8.80/qTest result 6 % polishing achieved Discharge at the th ree
outlets were observed to be 68 % , 25 % and 7 %
Overall performance Satisfactory SatisfactoryRemark Useful for on-farm polishing
jobThis unit was appreciated by the processors
Table 5 Field performance data of turmeric polisher and grader

AGRICULTURAL MECHANIZATION IN ASIA, AFRICA, AND LATIN AMERICA 2008 VOL.39 NO.450
formation, field performance data and cost of operation of hand and power operated turmeric washer are given in Tables 2 through 4.
Turmeric Curing UnitThe improved curing unit re-
quired 50 min for curing a batch of 100 kg of rhizomes with 2 labour-ers. The improved method of curing took less time and the fuel con-sumption was also found to be less compared to the traditional method of curing due to the lid covering. The overall performance was found to be satisfactory and comfortable to the worker due to the provision of easy unloading system by means of a wooden handle. In the improved unit, the perforated inner container with turmer ic was to be l if ted leaving the hot water in the outer container which could be reused in the subsequent batches. Aluminum cooking containers of different sizes were easily available in the local market and needed no special fabrication. Only by purchasing two aluminium containers of different sizes and making perforations in the inner smaller container, these could be used for turmeric curing.
Pedal Operated Turmeric PolisherIt took 30 minutes to polish a
batch of 50 kg turmeric in the pol-isher to achieve 6 % polishing (per-
centage loss of weight). The drum was rotated below the critical speed of 45 rpm to avoid centrifuging. The cost of polishing was Rs 12.70/- per quintal. The field-test data of the turmeric polisher are given in Table 5. The farmers expressed their sat-isfaction over performance of the polishing machine.
Turmeric Grader The capacity of the grader was
200 kg/h. The turmeric was graded into 3 fractions. The output in the 3 discharge spouts was 68, 25 and 7 %, respectively (Fig. 8). The speed of vibrator was 90 rpm with stroke length of 20 cm for satisfactory operation. General information and field performance data of the tur-meric grader are given in Tables 3 and 5. The cost of operation was Rs. 8.80 per quintal of turmeric.
ConclusionThe post harvest unit operations
of turmer ic l ike cleaning, cur-ing, drying, polishing and grad-ing were carried out manually by conventional methods, which are slow, tedious and labour-intensive. Attempts were made to develop different post harvest processing equipment such as washer, curing unit, polisher and grader to reduce
drudgery, labour cost and maintain the quality of the f inal product. All the equipment developed were simple, easy to operate and techno-economically feasible for farm level processing. Performance of all the equipment was found quite satisfac-tory and,therefore, can be used for carrying out tedious post harvest operations easily.
REFERENCES
Sreenarayanan, V. V. and R. Viswa-nathan. 1989. An improved tur-meric boiler. Spices India, 2(10): 15-16.
Sukumaran, C. R. and CH. V. K. Satyanarayana. 1999. Souvenir-cum-Proceedings of the national seminar on Food Processing: Challenges and Oppurtunities, Gujrat Agricultural University, Anand.
Vikas, S. 2003. Indian Agriculture, Indian Economic Data Research Centre, New Delhi.
Purseglove, J. M., E. G. Brown, C. L. Green, and Robbin, S. R. J. 1981 Spices, Vol. 2. Longman group Ltd., London, New York.
Varshney, A. K., S. N. Garala, and S. H. Akbari. 2004. Status of post harvest technology of turmeric. Agricultural Engineering Today, 28(1-2): 13-19.
■■

VOL.39 NO.4 2008 AGRICULTURAL MECHANIZATION IN ASIA, AFRICA, AND LATIN AMERICA 51
Effect of Threshing Cylinders on Seed Damage and Viability of Moongbean (Vigna radiate. (L.) Wilezee)
byShiv Kumar LohanDept. of Seed Science and Technology,CCS Haryana Agricultural University,Hisar - [email protected]
AbstractAn experiment was conducted to
compare hammermill, spike tooth and raspbar threshing cylinders with respect to cylinder speed and concave clearance for damage free seeds, maximum threshing, high germination and less electr ical conductivity of moongbean. The minimum seed damage (1.1 %) and maximum germination (89 %) was found with the use of a raspbar threshing cylinder which resulted in less threshing efficiency (91.5 %) under lower cylinder speed (400
rpm) and higher concave clear-ance (15 mm). With the spike tooth threshing cylinder, minimum seed damage (3.6 %), maximum germi-nation (87 %) and minimum electri-cal conductivity (1.06 ms) was found under lower cylinder speed (400 rpm) and higher concave clearance (15 mm). In the hammermill cylin-der, minimum seed damage (3.8 %), maximum germination (86 %) and minimum electrical conductivity (1.02 ms) was observed under lower cylinder speed (400 rpm) and higher concave clearance (15 mm).
Introduction Threshing involves the detach-
ment of seed from the panicles/pods. It is one of the most important post-harvest operations for most of the agricultural crops especially for oilseed and pulses. Basic principles employed in threshing are shear, rubbing, impact and their combina-tion. The force applied by threshing cylinders usually results in splitting of dicot seeds, such as Chickpea (Cicer aeritinum. L), Moongbean (Vigna radiate. (L.) Wilezee) and Soybean (Glycine max. (L.) Menill) and the seed damage may go up to 20 to 25 percent, which is a big loss to the seed sector and the farm-ers (Kamble and Panwar, 1984). Threshing performance and dam-age of seeds is affected by several parameters, viz. type of threshing cylinder, moisture content of crop, cylinder speed, feed rate, concave
Hammer mill Spike tooth Raspbar
Threshing cylinder
Cylinder speed, rpm
Concave clearance,
mm
Seed damage,
%
Threshing effiiciency,
%Germin
-ation, %Electrical conducti-vity, ms-1
Hammer mill 400 15 3.8 94.7 86 1.02Spike tooth 400 15 3.6 93.8 87 1.06Raspbar 400 15 1.1 91.5 89 1.07
Table 1 Optimum combination of threshing cylinder, cylinder speed and concave clearance for minimum seed damage and maximum percent germination
Plate 1 Threshing cylinder
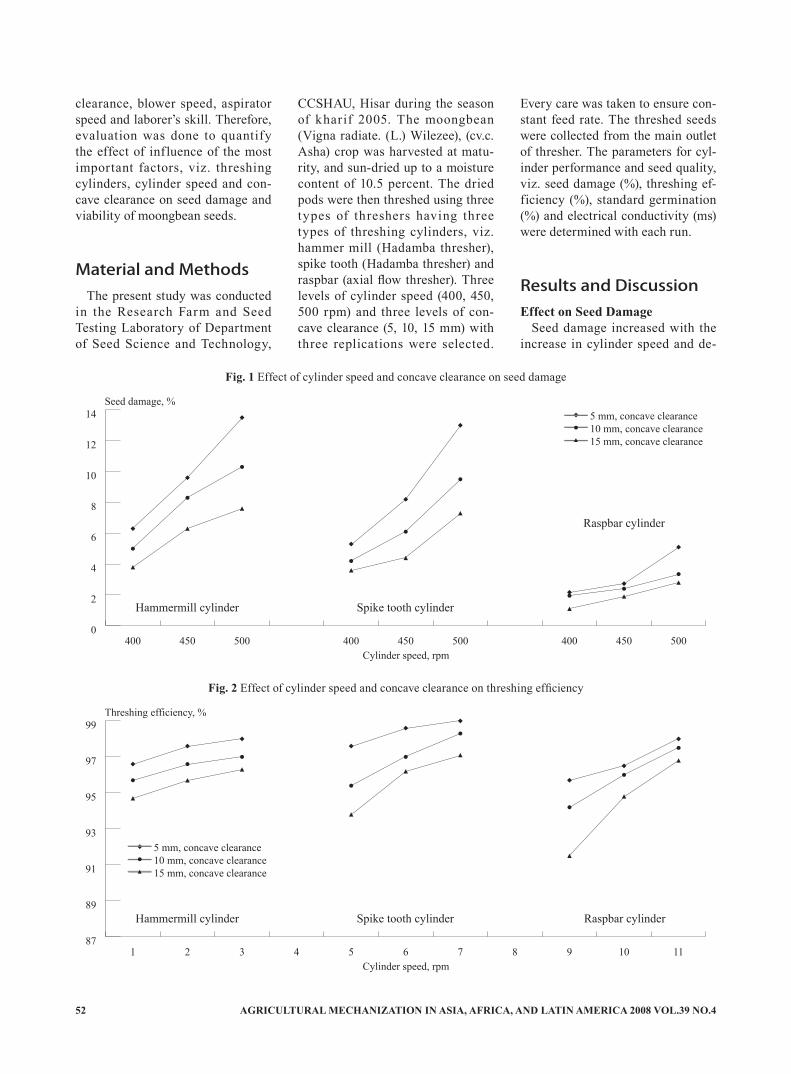
AGRICULTURAL MECHANIZATION IN ASIA, AFRICA, AND LATIN AMERICA 2008 VOL.39 NO.452
clearance, blower speed, aspirator speed and laborer’s skill. Therefore, evaluation was done to quantify the effect of influence of the most important factors, viz. threshing cylinders, cylinder speed and con-cave clearance on seed damage and viability of moongbean seeds.
Material and MethodsThe present study was conducted
in the Research Farm and Seed Testing Laboratory of Department of Seed Science and Technology,
CCSHAU, Hisar during the season of kharif 2005. The moongbean (Vigna radiate. (L.) Wilezee), (cv.c. Asha) crop was harvested at matu-rity, and sun-dried up to a moisture content of 10.5 percent. The dried pods were then threshed using three types of threshers having three types of threshing cylinders, viz. hammer mill (Hadamba thresher), spike tooth (Hadamba thresher) and raspbar (axial flow thresher). Three levels of cylinder speed (400, 450, 500 rpm) and three levels of con-cave clearance (5, 10, 15 mm) with three replications were selected.
Every care was taken to ensure con-stant feed rate. The threshed seeds were collected from the main outlet of thresher. The parameters for cyl-inder performance and seed quality, viz. seed damage (%), threshing ef-ficiency (%), standard germination (%) and electrical conductivity (ms) were determined with each run.
Results and DiscussionEffect on Seed Damage
Seed damage increased with the increase in cylinder speed and de-
87
89
91
93
95
97
99
1110987654321
5 mm, concave clearance10 mm, concave clearance15 mm, concave clearance
Cylinder speed, rpm
Hammermill cylinder Spike tooth cylinder Raspbar cylinder
Threshing efficiency, %
Fig. 2 Effect of cylinder speed and concave clearance on threshing efficiency
0
2
4
6
8
10
12
14
500450400500450400500450400
5 mm, concave clearance10 mm, concave clearance15 mm, concave clearance
Cylinder speed, rpm
Hammermill cylinder Spike tooth cylinder
Raspbar cylinder
Seed damage, %
Fig. 1 Effect of cylinder speed and concave clearance on seed damage

VOL.39 NO.4 2008 AGRICULTURAL MECHANIZATION IN ASIA, AFRICA, AND LATIN AMERICA 53
0.8
1.0
1.2
1.4
1.6
1.8
500450400500450400500450400
5 mm, concave clearance10 mm, concave clearance15 mm, concave clearance
Cylinder speed, rpm
Hammermill cylinder Spike tooth cylinder Raspbar cylinder
Electrical conductivity, ms
Fig. 4 Effect of cylinder speed and concave clearance on electrical conductivity
70
75
80
85
90
500450400500450400500450400
5 mm, concave clearance10 mm, concave clearance15 mm, concave clearance
Cylinder speed, rpm
Hammermill cylinder Spike tooth cylinder Raspbar cylinder
Germination, %
Fig. 3 Effect of cylinder speed and concave clearance on germination
creased concave clearance in all the three types of threshing cylinders. The data in Fig. 1 revealed a sig-nificant effect on extent of damage to the seed. The minimum seed damage (1.1 %) was observed with a cylinder speed of 400 rpm and concave clearance of 15 mm when the threshing was done with a rasp-bar cylinder. A maximum damage of 13.5 % and 13 % was obtained with a higher cylinder speed of 500 rpm and concave clearance of 5 mm when threshing was done by ham-mermill and spike tooth cylinder, respectively. The higher seed dam-
age at higher speed may be due to the increased effect of impact and rubbing force at higher speed (Neeaj and Singh, 1998). The results con-firmed with the findings of Anwar et al., 1991.
Effect on Threshing EfficiencyThreshing efficiency was maxi-
mum (99 %) with the use of spike tooth threshing cylinder at a cylin-der speed of 500 rpm and concave clearance of 5 mm; however, the seed damage was maximum (13 %) at this cylinder speed and concave clearance. At higher threshing ef-
ficiency, the seed damage was also higher. The rubbing effect between cylinder and concave was also re-duced which resulted in minimum seed damage and poor threshing efficiency. The threshing efficiency decreased with decreasing cylinder speed from 500 to 400 rpm and increasing the concave clearance from 5 to 15 mm (Fig. 2). This may be due to the resistance of pods, as well as decrease in impact force and frictional force.
Effect on Standard GerminationThe standard germination was

AGRICULTURAL MECHANIZATION IN ASIA, AFRICA, AND LATIN AMERICA 2008 VOL.39 NO.454
maximum (89 %) at higher con-cave clearance (15 mm) and lower cylinder speed (400 rpm) when the spike tooth cylinder was used. It decreased to 72 % as cylinder speed increased from 400 to 500 rpm with concave clearance of 5 mm with the use of hammermill threshing cylin-ders. The results shown in Fig. 3 re-vealed that the standard germination was on a decreasing trend with the increase in both cylinder speed (400 to 500 rpm) and concave clearance (5 to 15 mm) in all the three types of threshing cylinders. The minimum seed damage and maximum germi-nation was found under low cylinder speed and high concave clearance, which could be attributed to the reduced impact force to detach the seed from the pod that resulted into poor threshing efficiency (Sinha and Pandita, 2002).
Effect on Electrical ConductivityThe seed leachate electrical con-
ductivity increased as the cylinder speed increased and concave clear-ances decreased in the rasp bar type cylinder (Fig. 4). The reduction in seed leachate (electrical conductiv-ity) with increase of concave clear-ance may be because, at higher con-
cave clearance, the rubbing effect was reduced, which resulted in less invisible seed damage that resulted in low seed leachate (electrical con-ductivity).
ConclusionsThe optimum combination for
different independent variables, viz. threshing cylinder, cylinder speed and concave clearance for minimum seed damage and maximum per-cent germination are represented in Table 1. Hence, it can be concluded that the minimum seed damage (1.1 %) and maximum germination (89 %) was found under lower cylinder speed (400 rpm) and higher concave clearance (15 mm) which resulted into less threshing efficiency (91.5 %) with the use of a raspbar thresh-ing cylinder. In the spike tooth threshing cylinder, minimum seed damage (3.6 %), maximum germi-nation (87 %) and minimum electri-cal conductivity (1.06 ms) was found under lower cylinder speed (400 rpm) and higher concave clearance (15 mm). In the hammermill cylin-der, minimum seed damage (3.8 %), maximum germination (86 %) and
minimum electrical conductivity (1.02 ms) was observed under lower cylinder speed (400 rpm) and higher concave clearance (15 mm).
REFERENCES
Anwar, M. Tahir, Abdul Waheed and Nadeem Amjad. 1991. Devel-opment and field performance of a chickpea thresher. AMA 22(3): 73-78
Jagadish, G. V. and K. G. Sham-bulingappa. 1984. Relationship between seed damage and ger-minability in sunflower (Helian-thus annuus L.). Seeds & Farms 10(6): 25-27
Kamble, H.G. and J. S. Panwar. 1984. Studies on machine crop variables for threshing of moong. J. Agric. Engg. Res. 21(4): 1-7
Neeraj and Bachchan Singh. 1998. Performance and evaluation of pigeon pea threshing mechanism, J.Agric. Engg, ISAE. 25 (4) 9-17
Sinha, J. P. and V. K. Pandita. 2002. Effect of threshing methods on seed damage, germinability and seedling vigour in okra. Seed Res. 30(1): 161-163
■■

VOL.39 NO.4 2008 AGRICULTURAL MECHANIZATION IN ASIA, AFRICA, AND LATIN AMERICA 55
Engineering the Application of Grain Protectants onF1 Hybrid Rice Seeds: The Philippine-HRCP Experience
byRicardo F. OrgeSupervising Science Research Specialist/HeadSeed Production and Health Division,Philippine Rice Research Institute,Central Experiment Station,Maligaya, Science City of Muñoz, Nueva EcijaPHILIPPINES
John Eric O. AbonScience Research Specialist ISeed Production and Health Division,Philippine Rice Research Institute,Central Experiment Station,Maligaya, Science City of Muñoz, Nueva EcijaPHILIPPINES
AbstractIn 2002, when the commercializa-
tion of the hybrid rice technology in the Philippines started and was car-ried out nationwide through the Hy-brid Rice Commercialization Pro-gram (HRCP), quality deterioration of stored and distributed F1 hybrid rice seeds due to storage pest in-festation was a widely experienced problem. In order to prevent further seed quality losses, the Philippine Rice Research Institute (PhilRice), at that time being the agency in-charge of the procurement, storage and distribution of the hybrid rice seeds nationwide, decided to treat the seeds with grain protectants (in-secticides) prior to storage starting with the 2003 dry season harvest.
Although there were available information on the right kind and amount of insecticide that could ef-fectively control such kind of pest infestation, the urgent problem encountered at hand was how to accurately and uniformly apply the insecticide solution to the seeds at a recommended low volume applica-tion of 1-2 liters per ton of seeds. Low volume application was neces-sary since a significant increase in the seed moisture content could be another threat in maintaining the quality of the seeds. At that time, there was no locally available tech-
nology developed and marketed for the purpose.
The need was urgent and there was not much time available to come up with a seed t reatment technology that could be used by the HRCP. This paper presents the experiences and the process of de-veloping a low cost seed treating machine as a prompt answer to a serious need of the Program.
IntroductionThe Philippines need an increased
supply of rice because of its increas-ing population and decreasing land and water resources Realizing this fact, the Philippine government launched the Hybrid Rice Program in 1998 using hybrid rice technolo-gy as a new approach for increasing rice production, farmers’ productiv-ity, and competitiveness, to mitigate the negative effects of the El Nino phenomenon over the short term and to attain national food security over the long term (Obien, 1998). Hybrid rice is known to have a yield advantage of 15-20 % against the best commercial varieties (Barona, 2002).
In 2002, with the implementation of the Hybrid Rice Commercializa-tion Program (HRCP), commercial-ization of hybrid rice technology
became Philippine agriculture’s banner program for attaining self-sufficiency and increasing produc-tivity and profitability in rice, and generating rural employment (Re-doña, et al., 2004). Since the imple-mentation of the HRCP, more and more farmers are convinced that hybrid rice can indeed increase their yields and incomes. In Northern Lu-zon, survey showed that farmers get an average net profit that is P16,069/ha higher than what they get from inbred rice (Pablico, 2004).
However, although there had been a lot of success stories told about hybrid rice cultivation, some prob-lems were also encountered which resulted to slow adoption of hybrid rice in some areas. One of these problems was the susceptibility of hybrid rice, particularly PSB Rc72H or Mestiso I, one of the most popu-lar and widely grown hybrid rice va-rieties in the Philippines, to storage pest (rice weevil/lesser grain borer) infestation. If left uncontrolled, this infestation could cause signifi-cant damage on seeds such that the seeds’ capacity to germinate would be affected.
Because of this problem, Phil-Rice, being the agency in-charge of the procurement, storage and distribution of the hybrid rice seeds nationwide, decided to treat the seeds with insecticides (admixture

AGRICULTURAL MECHANIZATION IN ASIA, AFRICA, AND LATIN AMERICA 2008 VOL.39 NO.456
treatment) as a preventive measure against such infestation beginning with the 2003 dry season harvest. Admixture t reatment is a seed treatment procedure wherein liq-uid insecticide solution is applied uniformly at low volume and ap-propriate dosage directly to seeds. The Bureau of Postharvest Research and Extension (BPRE) conducted research on admixture treatment of paddy rice and came up with recom-mended kind and amount of active ingredients to control storage pests of rice (Appendix Table 1).
The major problem encountered at that time, however, was the need for a machine that could uniformly and accurately apply the insecticide solution at low volume application. Moreover, the machine reqyired a relatively high throughput capac-ity considering the large volume of seeds that were to be treated by PhilRice. The need was urgent such that the plan was to acquire a com-mercially available seed treating machine. However, after survey-ing the market and contacting farm equipment suppliers and manufac-turers, it was found that there was no locally available seed treating machine. If ever seed treatment was to be done, as in the case of one seed company, insecticide solu-tion at predetermined volume, was sprayed directly on seeds that are thinly scattered on the ground using a lever-operated knapsack sprayer. Even the local animal feed industry
which also suffers losses due to stor-age pest infestation had no machine technology currently for admixture treatment (Villanueva, 2005).
This was an action research con-ducted to locally develop a machine for applying insecticide solution, that satisfied certain requirements and restrictions, to F1 hybrid rice seeds.
Materials and MethodsDesign Criteria
The seed treating machine (STM) was designed to apply liquid in-secticide solution at an application rate of 1 to 2 liters per ton. A low volume requirement was strictly im-posed since some batches of seeds to be treated may have a moisture content (MC) that was already at the
borderline for safe storage and any significant increase in the MC could lead to seed quality deterioration (Cameron, 1999). The following cri-teria, adopted from Halmer (1994) and McGee (1995), were considered in the design of the machine:
1. Accuracy and uniformity of ap-plication. The machine must be able to apply the target dose of active ingredient and distribute the insecticide solution uni-formly on each individual seed;
2. Ease of operation3. Could also be used to treat oth-
er seeds or products (not only rice)
4. Allows only minimal damage to seeds
5. Easy to clean so as to prevent cross-contamination of products
6. Safe to use so that operators are protected from health hazards
Fig. 2 The basic working component (BWC) of the designed STM
1 liter/ton
2 liter/ton
3 liter/ton
Fig. 1 Relationship between droplet-seed ratio andsize of droplets at different application rates
Fig. 3 The first prototype of the STM

VOL.39 NO.4 2008 AGRICULTURAL MECHANIZATION IN ASIA, AFRICA, AND LATIN AMERICA 57
7. With relatively high throughput capacity
8. Low cost to make the machine affordable to hybrid seed grow-ers who, after the implementa-tion of the HRCP, may become its ultimate end user.
Designing Machine ComponentsThe first criterion (accuracy and
uniformity of application) was the most diff icult to satisfy, hence, design efforts were focused on the component parts that do the dis-tribution of the liquid (insecticide solution) onto the seed as well as the control of liquid and seed metering.
Distribution of the Liquid onto the Seed: This concerned the design of the applicator, the part of the STM that distributed the insecticide solution onto the seeds. To attain a
low volume and uniform applica-tion, the applicator must be able to transform the liquid into fine droplets prior to application. Two existing designs were available and considered for adoption, namely, the hydraulic nozzle such as the one accompanying a lever-operated knapsack sprayer and the spinning disc such as the one employed in the battery operated Ultra Low Volume (ULV) sprayer. Evaluation of each option led to the selection of the spinning disc because of the follow-ing reasons:
1. The spinning disc could eas-ily satisfy the low volume re-quirement unlike the hydraulic nozzle which has much higher discharge rate. Moreover, the spinning disc is not difficult to adopt since most of the hybrid seed growers, who are the ul-timate end users of the STM, also have ULV sprayers which are commonly used in applying gibberellic acid (GA3), one im-portant operation in the hybrid rice seed production.
2. The spinning disc produces finer and more uniform size of droplets as compared to the hy-draulic nozzle (Bateman, 2003). As long as operator contami-nation due to drifting droplets could be prevented, a smaller droplet size is more advanta-geous to use than the coarse one since finer droplets would also mean more droplets pro-duced per unit volume of liquid.
This relationship could be best described using Fig. 1, which shows an estimated ratio of the number of droplets available for application to each single seed at any given droplet size and application rate. The graph was constructed based on the assumption that a single seed of PSB Rc72H weighs 0.018 g (on the average) and that all of the droplets are equally distributed onto each individual seed. If a spinning disc, with an average size of droplet of approximately 100 um (Bateman, 2003) is to be used, one can assume that a single seed can get as much as 34 droplets for an application rate of 1 liter per ton of seed. If for example, a hydraulic nozzle, having an average droplet size of 150 um, is to be used, then one can only expect around 10 droplets per seed for the same application rate. One strategy to increase the droplet-seed ratio is to use a higher application rate. However, there is also a corre-sponding risk of increasing the moisture content of the seeds.
Seed Metering: The selection of the spinning disc for the applicator inf luenced the design of the seed metering and distributing mecha-nism. Using a spinning disc as the applicator required a layer of seeds flowing in a cylindrical form since the droplets generated by the spin-ning disc traveled radially, originat-ing from the spinning disc’s rim. To
Observa-tion no.
Applied volume, liters
No. of bags treated, 20kg/bag
Application rate, l/ton Variation, %
1 4.3 200 1.08 82 5.5 250 1.10 103 6.5 332 0.98 24 5.5 268 1.03 35 4.5 205 1.10 106 5.5 265 1.04 47 8 384 1.04 48 5 242 1.03 39 6.5 323 1.01 110 5 259 0.97 3
Table 1 Performance of the designed STM in terms of applying the target dose
Fig. 4 The STM'S BWC attached to the hopper of seed processing plant

AGRICULTURAL MECHANIZATION IN ASIA, AFRICA, AND LATIN AMERICA 2008 VOL.39 NO.458
attain this, a cylindrical seed deliv-ery tube paired with a cone at the base (Fig. 2) was used as the me-dium for creating a cylindrical seed curtain as the seeds were discharged from the hopper. Underneath this cone was the spinning disc where the stream of droplets were pro-duced and where the seeds were subjected to as they fell down from the base of the cone. The stopper set the outlet opening or the clearance between the seed delivery tube and the cone. The handle, on the other hand, controlled the movement of the cone during the opening and closing of this clearance, which was usually done during calibration. For best performance, the outlet open-ing should be adjusted to attain an optimum thickness of seed curtain; just enough to enable each seed to get an equal chance of being hit by the droplets. If this opening was set above the optimum, the droplets could hardly penetrate through the thickness of the seed curtain such that the seeds at the outer side re-ceived less droplets as compared to those at the inner side. On the other hand, if the opening was set below the optimum, there would be a lot of empty spaces in the seed curtain and the probability that some of the droplets would not land on target (seeds) was high.
Liquid Metering: The require-ment was to deliver the insecticide solution at an application rate not exceeding 2 liters for every ton of seeds. To attain this, the liquid (in-secticide solution) flowed by grav-ity with the flow regulated with the mechanism normally used in dex-trose application.
Performance EvaluationThe performance of the prototype
STM was evaluated in terms of its following basic functions:
a. Ability to apply the target dose: This was done by monitoring the f low rates of the seed and the insecticide solution during actual seed treatment operation;
b. Ability to uniformly apply the insecticide solution on individ-ual seeds: This was done dur-ing free time when actual seed treatment operations had been completed and enough time was already available for labora-tory testing. The purpose was to check/confirm the quality of work performed by the machine.
Results and DiscussionThe Prototype
The first prototype was fabricated in the second quarter of 2003, al-most a month after the need to come up with a STM was urgently felt. As shown in Fig. 3, it was made mostly of galvanized iron (GI) sheet, GI pipe and steel bars. It had a cylindri-cal hopper at the base of which was the BWC. Installed below the BWC was a receptacle where seeds were collected, after passing through the stream of droplets, and discharged to facilitate bagging. A GI sheet cover for the BWC was installed to protect the operator from being con-taminated by the drifting droplets. Attached at the side of the hopper was the tank for the insecticide so-lution. The prototype made use of a bucket elevator of an old batch re-circulating dryer to facilitate filling of the hopper with seeds.
During operation, seeds coming from the hopper entered the seed de-
livery tube and slid through the side of the cone. As the seeds fell, they were exposed to a stream of drop-lets coming from the spinning disc, which was installed underneath the cone. These droplets were produced by the centrifugal action as the in-secticide solution came in contact with the fast rotating (approximately 6000 rpm) spinning disc, which was driven by a direct current motor.
Because of immediate need, per-formance testing and evaluation of the prototype was done side by side with actual use. Using the prototype in actual seed treatment operation provided an opportunity to identify weak points of the design when exposed to actual operating condi-tions, thus, necessary improvements were made immediately.
The STM as an Integral Part of a Seed Processing Plant
An urgent need to fabricate ad-ditional units of the designed STM was felt because of the increasing volume of hybrid rice seeds that continued to arrive during the third quarter of 2003. However, since PhilRice-Central Experiment Sta-tion (CES) had an existing seed processing plant, the idea of fabri-cating the machine’s BWC and at-taching it on one of the hoppers of the processing plant was conceived. The idea proved feasible and since then seed treatment has become an integral component of the seed pro-cessing plant at PhilRice-CES (Fig. 4). Another unit was also fabricated and installed in the same facility in its branch station in Midsayap, Co-tabato, which also handled the seed
Fig. 5 Schematic diagram showing theeffect of the receiving funnel's placementon seeds' exposure to the spray of droplets
Fig. 6 The coop model of the STM

VOL.39 NO.4 2008 AGRICULTURAL MECHANIZATION IN ASIA, AFRICA, AND LATIN AMERICA 59
treatment operation for the Mindan-ao-produced hybrid rice seeds.
The incorporation of the STM into the seed processing facility had significantly improved PhilRice’s capability to perform seed treatment operation on all hybrid rice seeds it had procured nationwide. This had also further enhanced the quality of the distributed hybrid seeds since, by using the seed processing plant, the seeds were first cleaned (to re-move impurities and weevils in case the infestation has already started) prior to seed treatment in just one operation.
Design RefinementsAlthough the first prototype (in-
cluding the one installed in the seed processing plants) performed sat-isfactorily during actual use, some points for improvement in the over-all design of the STM were noted as follows:
a. The dext rose hose used to convey the insecticide solution from the tank to the spinning disc did not last long. The hose material reacted with the in-secticide solution and softened such that it needed replacement every after 3 days of use;
b. The discharge rate of insecti-cide solution was significantly affected by the content of the tank. Because the liquid flows by gravity, the discharge rate was relatively high when the
tank was full as compared to that when the tank was half empty. Hence during actual operation, there was a need to regularly monitor the volume of insecticide solution consumed as well as the corresponding amount of seeds being treated. As the seed treatment operation progressed, however, the opera-tors were able to acquire skill in setting the desired insecticide flow rate based on the appear-ance of the f lowing liquid as seen from the viewing chamber (enlarged portion) of the dex-trose hose.
c. Some droplets that did not hit the target (seeds) accumulated at the side of the receiving fun-nel. This caused rewetting of the seeds.
After identifying these problems, the following improvements on the design of the STM were made:
a. The delivery tube was replaced with a chemical resistant hose normally used for agricultural sprayers. This replacement however affected the choice for the flow regulator since the one commonly used for the dextrose hose was no longer applicable. After looking for and evaluat-ing other substitutes, a cut-off valve designed to control the flow of kerosene fuel in house-hold stoves was found to be ap-propriate. This valve was made
of brass material making it re-sistant to the corrosive effect of the insecticide solution.
b. To minimize the effect of the tank content on the metering of the insecticide solution, the tank’s vertical distance from the spinning disc was increased. Moreover, a simple flow indica-tor was designed and fabricated utilizing the same concept em-ployed in dextrose application. The appearance of the liquid flow when the tank was full sig-nificantly varied with that when the tank was ¾ full or less. Hence, maintaining a constant flow rate could be done by just taking note of the initial appear-ance of the liquid f low inside the device when the tank was full.
c. Improvement of the receiving funnel. Originally, the receiv-ing funnel was designed merely to perform two basic functions, namely, 1) as a shield to prevent the operator from being ex-posed to the stream of droplets, and 2) to receive the seeds and divert them into the container beneath for final bagging. How-ever, further analysis showed that, if properly designed and installed in the right location, it could further increase the seeds’ exposure to the stream of droplets, thus the possibil-ity of increasing the seeds’
Fig. 7 Relationship between outlet opening andseed flow rate of the designed STM
Fig. 8 Droplet count of seed samples representingthe inner and outer layer of the seed curtain

AGRICULTURAL MECHANIZATION IN ASIA, AFRICA, AND LATIN AMERICA 2008 VOL.39 NO.460
droplet count. The idea was to design an appropriate size and inclination of the receiving fun-nel and install it in such a way that the inclined surface would pass through a point where the stream of droplets and the flow of seeds intersect (point B, Fig. 5). Under this condition, the seeds’ exposure to the stream of droplets (time for the seed to travel from point A to point C) would be increased since each individual seed will have a bouncing point B before it final-ly exits the stream of droplets at point C.
The Coop Model of the STMThe coop model (Fig. 6) was de-
signed to fit the requirements of the hybrid rice seed growers’ coopera-tives who are the key players of the HRCP. This model was designed and fabricated after observing the performance of the first prototype as it was extensively used in the treatment of F1 hybrid seeds for al-most 2 years (2003-2004). Although the BWC was basically the same, it incorporated some solutions to the problem encountered in the first prototype. The model was equipped with a bucket elevator, which was actually an optional part (depending on the budget of the user) that fa-cilitated bagging operation after the seed treatment process.
Optimizing Machine SettingsDue to the urgent need of the
HRCP to treat thousands of bags of F1 hybrid rice seeds that already had accumulated at the time the fabrication of the first prototype was completed, there was no thor-ough laboratory testing done ex-cept calibration of the seed and the liquid metering mechanisms. The selection of the optimum size seed outlet (clearance) was purely based on the visual appearance of the seed curtain. Later a laboratory test was conducted to check and verify/confirm the optimum seed outlet opening. This was done by counting the number of droplets in each set of 20 seed samples - one set repre-senting those that were in the inner surface of the seed curtain and an-other set representing those in the outer surface. Making the droplets visible was made possible with the use of seeds that had been coated with white paint and a dye solution (approximately 20 sachets of black dye in 1 liter water) that was used as substitute for the insecticide solu-tion. Counting of droplets on each seeds sample was done with the use of a microscope.
Results of calibration tests showed that the seed flow rate and the size of the seed outlet had the following linear relationship:
y = 0.27526x − 2.032(8 ≤ x ≤ 24; r = 0.97)
where: y = seed flow rate, tons/hx = seed outlet size or the perpen-
dicular distance between the side of the cone and the base of
the seed delivery tube, mmAt 8 mm opening, occasional
clogging was observed such that manual tapping of the seed deliv-ery tube had to be done from time to time. This could have caused the slight deviation in the straight-ness of the calibration line (Fig. 7). Smooth flow of seeds was observed starting at 12 mm outlet opening.
The optimum size of the seed out-let was 20 mm. As shown in Fig. 8, it was at 20 mm opening where the highest seed flow rate and the least difference in seed droplet count between the inner and outer side of the seed curtain was observed. This opening was also the one selected based on the visual appearance of the seed curtain. At this opening, one could partially see the spinning disc even with the presence of the flowing seeds. At 24 mm, there was already a decrease in the number of droplets in seeds at the outer surface of the seed curtain. This meant that the seed curtain was already too thick such that the seeds at the outer side receive fewer droplets as com-pared to those in the inner side.
Machine PerformanceIn general, the ability of the ma-
chine to accurately and uniformly apply the insecticide solution could be evaluated by looking at the result of a separate study conducted by Abon, et al. (2005) which compared the quality of stored seeds that had been treated with insecticide solu-tion (using the machine) with that of
Fig. 9 Droplet count of 20 randomly collected seed samplestaken at the inner and outer layer of seed curtain
Fig. 10 Seed treatment cost as affected by amchine capacity (Data and assumptions in Appendix Table 3)
Obtained capacity Maximum capacity

VOL.39 NO.4 2008 AGRICULTURAL MECHANIZATION IN ASIA, AFRICA, AND LATIN AMERICA 61
the untreated seeds. Results of the study showed that treating the seeds with the recommended active ingre-dients (Appendix Table 1) provided protection against storage pest in-festation for at least six months and a reduction in pest population (rice weevil and lesser grain borer) by 71 % for one year storage under ambi-ent condition.
Ability to Apply the Target Doze: Monitoring of the actual amount of insecticide solution applied per unit weight of seeds revealed that the machine could apply the target doze at a maximum variation of 10 % or an average of 4.8 % (Table 1). This relatively low variation from the tar-get dose was made possible because of the independent control of meter-ing of the seeds and insecticide so-lution as well as regular monitoring the amount of the insecticide solu-tion to the corresponding amount of seeds being treated.
Ability to Uniformly Apply the Insecticide Solution on Individual Seed: Results of a laboratory test conducted to determine the number of droplets that are deposited on each individual seed showed that all of the 20 randomly collected seed samples taken from the inner and outer layers of the seed curtain received sufficient amount of drop-
lets (Fig. 9). For the inner layer, the number of droplets deposited on each seed ranged from 8 to 32 (an average of 16). On the other hand, those collected at the outer layer ranged from 9 to 37 (an average of 20). Because of lack of sufficient equipment, the size of droplet was not measured. As observed visu-ally, the range in size of droplets was relatively wide - the largest was approximately 10 times larger in di-ameter than the smallest.
Machine Capacity and Cost of Seed Treatment
Although the machine, based from the results of the calibration test (Fig. 7), can treat seeds up to 3.5 tons per hour, actual use of the machine from 2003 to 2005 (Ap-pendix Table 2) yielded only a ca-pacity of around 250 to 300 bags (20 kg/bag) per day, equivalent to 625-750 kg/h. This is because the hybrid seeds, which came in different loca-tions and sources, had to be treated on per lot basis so that around 25 % of the time was lost in segregat-ing seed lots. Other time was spent on the opening of the bags (12 %), closing/sewing of the bags after fill-ing with treated seeds (19 %), and piling (6 %). Actual seed treatment operation (use of machine) only accounted 38 % of the total time spent for the whole operation. It was obvious that, during that period of actual use, the machine’s maximum capacity was not attained because
the seeds being treated were not ho-mogenous.
The cost of seed treatment was highly inf luenced by machine ca-pacity (Fig. 10) and, as earlier dis-cussed, machine capacity was also highly influenced by the homogene-ity of the seeds being treated. At a capacity of 300 bags (750 kg) per day, the cost of treating the seeds using the machine was Php 5.58/bag (Php 0.28/kg). If seeds to be treated are only homogenous (i.e. coming from one source and no segregation needed) the machine could perform close to its maximum capacity thus lowering the cost of seed treatment to as low as Php3/bag.
Summary and ConclusionWith the development of the STM
in 2003, seed (admixture) treatment became an important and a prereq-uisite postharvest operation prior to storage at PhilRice. It yielded signif icant improvement on the viability of stored F1 hybrid rice seeds which resulted to more seeds utilized starting 2004 dry season planting as compared to that in the previous seasons.
Realizing these advantages, the government required the hybrid rice seed growers to treat their own hybrid seeds with the recommended active ingredients. The Depart-ment of Agriculture, through the Administrative Order No. 29 series
Active ingredient Recommended dose, g/ton seed
Pirimiphos methyl 7Deltamethrin 0.75
Appendix Table 1 Active ingredientsand their recommended dosagesfor the control of rice storage pests
Year Amount of seeds treadedBags* Tons
2003 6,552 131.042004 17,422 348.442005 11,280 225.60
Appendix Table 2 Amount of F1hybrid seeds (PSB Rc72H) treated by the designed STM from 2003-2005 at PhilRice-Central Exeriment Station
Source: PRPC, 2003
*at 20 kg/bag
Parameter ValueMachine acquisition cost, Php 10,000Life span, years 10Salvage value, % of original cost 10Repair and maintenance cost, % of acquisition cost 5Machine capacity, bags of seeds treated per day (@ 20 kg/bag) 200Number of workers involved 4Cost of labor, P/day 250Cost of insecticide
Insecticide A (with 250 g Pirimiphosemethyl/L), Php/liter 2,457.28Insecticide B (with 25 g Deltamethrin/L), Php/liter 1,435.20
Cost of treating 1 bag (20 kg/bag), Php/bag 7.26
Appendix Table 3 Assumptions used in computing for the cost ofseed treatment using the designed STM
AGRICULTURAL MECHANIZATION IN ASIA, AFRICA, AND LATIN AMERICA 2008 VOL.39 NO.462
of 2004, issued the Implementing Guidelines on Seed Treatment of F1 Hybrid Rice Seeds which was based from the experiences gained on seed treatment operations at PhilRice.
Being designed to fit to local con-ditions, particularly the requirements of our hybrid rice seed growers, the STM could be easily fabricated at local welding shops and does not require special skills to operate. With a capital of around Php 10,000, a cooperative can acquire this ma-chine for use in the treatment of its produced rice seeds, either hybrid or inbred.
The key to an accurate application of the target dose using the designed machine is regular monitoring of the seed and liquid flow rates. Any deviation in the actual dose with that of the targeted dose requires corresponding adjustment of the f low regulators and this has to be constantly monitored until this de-viation would fall within acceptable limits.
REFERENCES
Abon, J. E. O., R. F. Orge, and A. C. Ismael. 2005. Quality preservation of Mestizo I (PSB Rc72H) seeds through seed treatment and con-trolled storage. Paper presented during the 55th Philippine Society of Agricultural Engineers (PSAE) Annual National Convention held on April 18-22, 2005 at the Fam-ily Court Hotel and Conveñntion
Center, General Santos City.Baroma, L. J. 2002. The Hybrid Has
Two Faces. Office of the Alumni and Public Affairs, University of the Philippines Los Baños. Retrieved from http://www.pinoy-farmer.com/ news.cfm?id=378
Bateman, R. P. 2003. Rational Pesti-cide Use: spatially and temporally targeted application of specific products. Pages 129-157 in M. Wilson, ed. Optimizing Pesticide Use. John Wiley & Sons Ltd., UK.
Cameron, A. G. 1999. Seed Storage in the NT Tropics. In Agnote. 785. No.C35. September 1999. Agdex No.: 139/61. ISSN No. 0157-8243.
Halmer, P. 1994. The development of quality seed t reatments in commercial practice objectives and achievements. Pages 363-374 in seed treatment: Progress and Prospects Mono. 57, BCPC, Thornton Health, UK.
McGee, D .C. 1995. Advances in seed treatment technology. Paper presented at ASIAN SEED ’95. New Delhi, India, 27-29 Septem-ber 1995
Obien, S. R. 1998. Hybrid Rice Technology for Rice Self-Suffi-ciency. Pages 2-7 in E.D. Redona, ed. Advances and Challenges in Hybrid Rice Technology in the Philippines. Philippine Rice Re-search Institute. Maligaya, Mu-noz, Nueva Ecija, Philippines.
Pablico, M. S. 2004. Hybrid rice a boon to farmers in North Luzon. The Manila Times. June 21, 2004
Philippine Rice Postproduction Consortium (PRPC) and Japan Grain Inspection Association (KOKKEN). 2003. Rice postpro-duction technology - a technical reference guide. First Ed. Philip-pine Rice Postproduction Consor-tium. NFA, Quezon City.
Redoña, E. D., L. M. Perez, L. R. Hipolito, V. E. Elec, I. A. Pacada, L. M. Borines, R. O. Solis, S. A. Ordoñez, and J. Agarcio. 2005. Harnessing molecular markers in hybrid rice commercialization in the Philippines. In K. Toriyama, K.L. Heong, and B. Hardy, eds. Rice is life: scientific perspectives for the 21st century. Proceedings of the World Rice Research Confer-ence held in Tokyo and Tsukuba, Japan, 4-7 November 2004. Los Ba?os (Philippines): International Rice Research Institute, and Tsu-kuba (Japan): Japan International Research Center for Agricultural Sciences.
Sebastian, L. S. 2001. Foreword. In E. D. Redona and M. G. Gas-par, eds. Hybr id Rice in the Philippines: Progress and New Horizons. Food and Agriculture Organization of the United Na-tions (UN) and Philippine Rice Research Institute. Maligaya, Sci-ence City of Munoz, Nueva Ecija, Philippines.
Villanueva, E. 2005. Personal com-munication.
■■

VOL.39 NO.4 2008 AGRICULTURAL MECHANIZATION IN ASIA, AFRICA, AND LATIN AMERICA 63
Development and Performance of a Solar-Cum-Gas Fired Dates Dryer
byMunir AhmadPrincipal Engineer/PSOFarm Machinery Institute,National Agricultural Research Centre,Parkload, P.O. NIH, [email protected]
Asif A. MiraniAssitant Engineer/SOFarm Machinery Institute,National Agricultural Research Centre,Parkload, P.O. NIH, IslamabadPAKISTAN
Abstract Dates are the third most important
fruit of Pakistan. It is grown on an area of about 78,000 ha, and its an-nual production is 625,000 tonnes. Sun drying of dates is the common practice prevailed in Pakistan. Sun dried dates have a short life and are not free from contamination and aflatoxins. Therefore, these cannot be presented in the international market for better return. About 22 % of the total dates produced in the country are wasted every year due to unavailability of proper drying/processing, and storage facilities. To overcome these problems, a solar-cum-gas fired dates dryer was developed at the Farm Machinery Institute, National Agricultural Re-search Centre, Islamabad. It consist-ed of eight flat-plate solar collectors, a drying chamber, and an axial flow fan. A gas burning system was also developed as a supplement source of heat.
This dryer was installed and eval-uated at Mitra Abad, Dhaki, D. I. Khan in August 2003. Experimental results indicated that the system was capable of drying/processing about 544 kg of fresh dates within 5 days. The seasonal drying capacity of the dryer was predicted at about 4 tonnes, with a value addition of Rs.
72,116. It was a small scale on-farm dates drying technology, and was well suited to produce quality dates in order to present them into the in-ternational market.
IntroductionWorld date production is about
5 million tones of fruit, whereas date production in Pakistan is about 0.625 million tones. This consti-tutes about 12.5 % of the world date production. Pakistan follows Iran, Egypt, Iraq, and Saudi Arabia on the list of the top date producing countries (Quraishi and Zia, 1997). About 22 % of the total dates pro-duced in the country are wasted every year due to unavailability of the proper drying, processing and storage facilities (Iqbal, 1996).
The traditional method of dates drying is sun drying, in which dates are spread on date leaf mates. In most cases the drying yard is not properly fenced. Thus, birds, insects, and wild animals move around and contaminate the dates. Heavy losses may occur because of untimely rains. Dew accumulates on the surface of fruit and causes mold growth if the fruit is not covered properly at night. Colour change oc-curs, and drying becomes slow (Ba-
joi, 1996). Finally, the quality of the dried dates is likely to be variable with some of the dates over dried and with possible contamination by dust and infestation by insects. The dates dried in this manner have a short shelf life and may not be free from contamination and aflatoxins, thus, making these dates unhygienic from health point of view. Also, such dates can not be marketed in international markets in order to earn handsome foreign exchange.
As compared to sun drying, solar drying provides higher air tempera-ture and lower relative humidity, which are conducive to improved drying rates and lower final mois-ture contents of the dried dates (Ah-mad and Khan, 1997). As a result, the risk of spoilage is reduced, both during the actual drying process and in subsequent storage. The higher temperatures attainable are also deterrent to insect and microbial infestation. Protection against rain, dust, insects and other animals is enhanced by drying in an enclosed structure. Therefore, this research work was carried out with the fol-lowing specific objectives:
a. To develop a solar-cum-gas fired date dryer.
b. To evaluate the performance of newly developed date dryer.
c. To perform the economic analy-

AGRICULTURAL MECHANIZATION IN ASIA, AFRICA, AND LATIN AMERICA 2008 VOL.39 NO.464
sis of this dryer.
Literature ReviewThe date goes from one extreme
of moisture content (85 % at the early Kimri stage) to another (5 to 10 % in dry desert dates). In be-tween, there are several levels of importance, i.e. about 50-60 % for sweet khalal, about 35 to 4 % for rutab, around 24 % for entering the zone of self preservation, and 20 % at which a large amount of dates are marketed because they are safe to store but still retained a pliable and at t ractive texture (Internet material). Experience in most date producing countries showed that a well matured Rutab, handled with care, is one, if not the most, appreci-ated form in which the date is con-sumed and which gives the grower the highest rate of return. However, Rutab has three serious setbacks: it is produced in comparatively short periods with the tendency of pro-duction peaks; it is highly perish-able; and it is delicate, which makes handling, packaging, and transport difficult and expensive. At Tamar stage (below 25 % down to 10 %
and less), the fruit has undergone the process of ripening and drying on the palms. Fruit at the Tamar stage is ideal for marketing as “dried” dates. This fruit is used for year round consumption. It should be noted that the climatic conditions of dates growing areas of Pakistan does not allow the fruit to reach at Rutab or Tamar stage on the palms (Verbal Communication). Therefore, fruit is usually harvested at Khalal stage, and then dried to reach the Tamar stage. Artificially dried Kha-lal at 55 ºC and a relative humidity of not less than 70 % resulted in a well-ripened fruit after 72 hours (Internet material).
Three types of solar dryers have received the most attention and seem the most practical propositions (Trim, 1982).
a. Direct dryers employing natu-ral convection with the separate collector and drying chamber.
b. Direct dryers employing natu-ral convection with combined collector and drying chamber.
c. Indirect dryers employing forced convection with separate collector and drying chamber.
The di rect d ryers employing natural convection with separate
collector and drying chamber were developed at Asian Institute of Tech-nology (AIT), Bangkok, Thailand (Excell and Kornsakoo, 1978; Excell et al., 1979 and Excell, 1980). This dryer was successfully used to dry paddy in the monsoon season, but this was not tested for drying fruit and vegetable. A version of direct dryers employing natural convection with a separate collector was also developed by the New Mexico Solar Energy Association, 1978. The dry-ing chamber contained a tier of per-forated trays. Fruit, vegetable, and
Date Time Ta, ºC Tco, ºC Tdco, ºC RHa, % RHco, % Remarks20/08/03 08:30 35.0 57.0 37.5 72.0 74.0 solar + gas21/08/03 09:30 36.0 61.0 38.5 66.0 70.0 solar + gas22/08/03 10:30 36.5 66.0 40.0 64.5 68.0 solar + gas23/08/03 11:30 38.5 68.0 41.0 62.0 67.0 solar + gas24/08/03 12:30 38.0 66.0 42.0 59.0 65.0 solar
13:30 39.0 72.0 43.0 57.5 66.0 solar14:30 39.0 66.0 43.0 56.0 60.0 solar15:30 39.0 60.5 43.0 55.0 56.5 solar16:30 38.0 54.0 43.0 59.5 56.0 solar17:30 37.0 53.5 43.0 61.0 52.0 solar18:30 36.5 58.0 43.5 53.5 56.0 gas19:30 35.0 57.0 44.5 73.0 58.0 gas20:30 34.0 54.0 44.5 76.0 56.5 gas21:30 33.5 54.0 45.0 82.0 58.0 gas22:30 34.0 54.0 45.0 83.0 56.0 gas
Average 36.5 60.2 42.5 65.3 61.2
Table 1 Hourly performance of the solar-cum-gas fired dates drying system
Ta is ambient temperature, ºC, Tco is collector outlet temperature, ºC, Tdco is drying chamber outlet tempreature, ºC RHa is ambient air relative humidity, %, and RHco is chamber outlet relative humidity, %
Fig. 2 An isometric view of a flat-plate collector develoed for dates drying system
Fig. 3 A cross-section of a flat-plate collector develoed for dates drying system
All dimensions in mm
Fig. 1 Three commonly used configrations for air-type solar collectors

VOL.39 NO.4 2008 AGRICULTURAL MECHANIZATION IN ASIA, AFRICA, AND LATIN AMERICA 65
herbs could be dried in this dryer. The loading capacity of this dryer was about 20 to 25 kg. Another successful new solar tunnel dryer was designed and developed at the University of Hohenheim, Germany, to meet the drying requirement of small farmers and small co-opera-tives (Esper et al., 1994). Instead of forcing the air through a depth of crop, it was just directed over the crop spread in a thin layer. A study was conducted at AIT, Bangkok to evaluate the solar tunnel dryer for drying chillies (Mastekbayeva et al., 1998). The length of this dryer and its collector length were half of the tunnel dryer designed by the Univer-sity of Hohenheim, Germany. They loaded it with 19.5 kg of chillies at 75 % moisture content, and after
three days the moisture content of the chillies was less than 10 %. The solar tunnel dryers are being used in most of the developing countries, however their drying capacity is too low.
Under the category of direct dryer with natural convection combined collector and drying chamber, the most widely accepted is the cabinet dryer pioneered by the Brace Re-search Institute (Anonymous, 1965). The basic design consisted of a rect-angular container perfectly insulat-ed and covered with a roof of glass or clear plastic. The cabinet dryers have been found good for drying fruit and vegetable on a small scale.
Indirect dryers employing forced convection with separate collector and drying chamber have inherent tendency towards greater efficiency, as both units can be designed for optimum efficiency of their respec-tive functions. Therefore, this de-sign was selected to be incorporated in this development work.
Material and MethodsDevelopment of Solar-cum-Gas Fired Dryer
The solar-cum-gas fired date dry-
er was developed with the following key requirements:
i. Low cost construction using lo-cal material and manufacturing technology.
ii. More simple and durable.The key components of the solar-
cum-gas fired date drying system are f lat-plate solar collectors, dry-ing chamber, axial flow fan, jet gas burner and cylinder for supplement source of heat.
Development of Flat Plate Solar Collectors
Air-type solar collectors could be constructed mainly in three con-figurations (Fig. 1): (i) f low over the absorber (Type-I), (ii) f low on both sides of the absorber (Type-II), and (iii) flow under the absorber (Type-III). Each of these collector f low paths differs in thermal per-formance as well as construction requirements, construction material, and construction cost. Thermal per-formance tests of these three types of solar air-type collectors revealed that average efficiency of Type-II and Type-III collectors was slightly higher than the average efficiency of the Type-I collector (Parker et al., 1993). It was observed that the Type-II collector performed better
Date Time Ambient absolute humidity, g/kg
Chamber outlet absolute humidity,
g/kgMoisture removal,
kg/hr
20/08/03 08:30 26.3 31.0 1.8621/08/03 09:30 25.3 31.0 2.2622/08/03 10:30 25.2 32.5 2.9023/08/03 11:30 26.4 33.4 2.7724/08/03 12:30 25.0 35.5 4.15
13:30 25.2 39.9 5.8214:30 25.0 33.2 3.2515:30 27.0 31.8 1.9016:30 25.8 31.1 2.1017:30 24.9 29.1 1.6618:30 27.0 31.6 1.8219:30 27.0 35.0 3.1720:30 26.0 37.0 4.3521:30 28.0 36.1 3.2022:30 29.0 36.0 2.77
Average 26.2 33.61 2.93
Table 2 Hourly moisture removal from solar-cum-gas fired dates drying system
Fig. 4a An isometric view ofdrying chamvber
Fig. 4b Cross sectional view of the drying chamber
All dimensions in mm
Fig. 5 A typical view of solar collectors with the drying camber at Mitra Abad, Dhaki. D. I. Khan
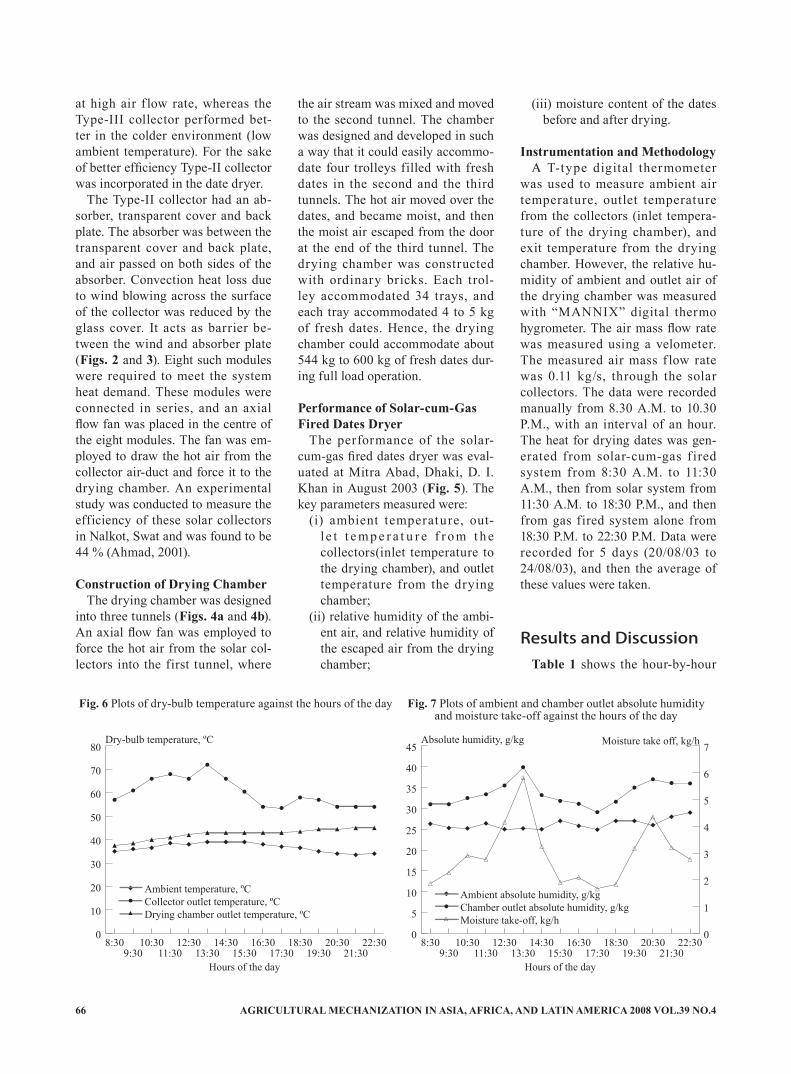
AGRICULTURAL MECHANIZATION IN ASIA, AFRICA, AND LATIN AMERICA 2008 VOL.39 NO.466
at high air f low rate, whereas the Type-III collector performed bet-ter in the colder environment (low ambient temperature). For the sake of better efficiency Type-II collector was incorporated in the date dryer.
The Type-II collector had an ab-sorber, transparent cover and back plate. The absorber was between the transparent cover and back plate, and air passed on both sides of the absorber. Convection heat loss due to wind blowing across the surface of the collector was reduced by the glass cover. It acts as barrier be-tween the wind and absorber plate (Figs. 2 and 3). Eight such modules were required to meet the system heat demand. These modules were connected in series, and an axial flow fan was placed in the centre of the eight modules. The fan was em-ployed to draw the hot air from the collector air-duct and force it to the drying chamber. An experimental study was conducted to measure the efficiency of these solar collectors in Nalkot, Swat and was found to be 44 % (Ahmad, 2001).
Construction of Drying ChamberThe drying chamber was designed
into three tunnels (Figs. 4a and 4b). An axial flow fan was employed to force the hot air from the solar col-lectors into the first tunnel, where
the air stream was mixed and moved to the second tunnel. The chamber was designed and developed in such a way that it could easily accommo-date four trolleys filled with fresh dates in the second and the third tunnels. The hot air moved over the dates, and became moist, and then the moist air escaped from the door at the end of the third tunnel. The drying chamber was constructed with ordinary bricks. Each trol-ley accommodated 34 trays, and each tray accommodated 4 to 5 kg of fresh dates. Hence, the drying chamber could accommodate about 544 kg to 600 kg of fresh dates dur-ing full load operation.
Performance of Solar-cum-Gas Fired Dates Dryer
The performance of the solar-cum-gas fired dates dryer was eval-uated at Mitra Abad, Dhaki, D. I. Khan in August 2003 (Fig. 5). The key parameters measured were:
(i) ambient temperature, out-l e t t e m p e r a t u r e f r o m t h e collectors(inlet temperature to the drying chamber), and outlet temperature from the drying chamber;
(ii) relative humidity of the ambi-ent air, and relative humidity of the escaped air from the drying chamber;
(iii) moisture content of the dates before and after drying.
Instrumentation and MethodologyA T-type digital thermometer
was used to measure ambient air temperature, outlet temperature from the collectors (inlet tempera-ture of the drying chamber), and exit temperature from the drying chamber. However, the relative hu-midity of ambient and outlet air of the drying chamber was measured with “MANNIX” digital thermo hygrometer. The air mass flow rate was measured using a velometer. The measured air mass f low rate was 0.11 kg/s, through the solar collectors. The data were recorded manually from 8.30 A.M. to 10.30 P.M., with an interval of an hour. The heat for drying dates was gen-erated from solar-cum-gas f ired system from 8:30 A.M. to 11:30 A.M., then from solar system from 11:30 A.M. to 18:30 P.M., and then from gas fired system alone from 18:30 P.M. to 22:30 P.M. Data were recorded for 5 days (20/08/03 to 24/08/03), and then the average of these values were taken.
Results and DiscussionTable 1 shows the hour-by-hour
Dry-bulb temperature, ºC
0
10
20
30
40
50
60
70
80
22:3021:30
20:3019:30
18:3017:30
16:3015:30
14:3013:30
12:3011:30
10:309:30
8:30
Ambient temperature, ºCCollector outlet temperature, ºCDrying chamber outlet temperature, ºC
Hours of the day
Absolute humidity, g/kg
0
5
10
15
20
25
30
35
40
45
22:3021:30
20:3019:30
18:3017:30
16:3015:30
14:3013:30
12:3011:30
10:309:30
8:30
Ambient absolute humidity, g/kgChamber outlet absolute humidity, g/kgMoisture take-off, kg/h
Hours of the day
0
1
2
3
4
5
6
7Moisture take off, kg/h
Fig. 6 Plots of dry-bulb temperature against the hours of the day Fig. 7 Plots of ambient and chamber outlet absolute humidityand moisture take-off against the hours of the day

VOL.39 NO.4 2008 AGRICULTURAL MECHANIZATION IN ASIA, AFRICA, AND LATIN AMERICA 67
Cost parameters ValuesPurchasing cost (PRS) 150,000Useful life (Years) 20Salvage value (5 % of purchase price, PRS) 7,500Annual fixed charges
Depreciation (SLM) 7,125Interest on average Investment (9 %) 7,088Repair & maintenance cost (2 % of purchase price per annum) 3,000
Total annual fixed cost (PRS) 17,213Annual dates drying capacity of the system (tons/year) 4Fixed cost of dates drying (PRS/ ton) 4,303Variable cost (PRS/ ton) [Labour charges etc] Electricity cost (24 kwh/ton, Rs 7/kwh) 168LPG cost (40 kg/ton, Rs 40/kg LPG) 1,600Labour cost (Rs/ton) 1,500Total variable cost (PRS/ton) 3,268Total (fixed + variable) cost of dates drying (PRS/ton) 7,571Cost of one ton of fresh dates (PRS) 15,000Cost of 0.58 ton of dried dates (PRS) 40,600Value addition per ton of fresh dates 18,029Value addition for 4 ton of (annual drying capacity) fresh dates (PRS) 72,116Sale price of the dried dates is assumed PRS 70,000/ton
Table 3 Economics of solar-cum-gas fired dates drying system
ambient temperature, collector out-let temperature, drying chamber outlet temperature, ambient relative humidity and chamber outlet rela-tive humidity. The plots of these data against hours of the day are presented in Fig. 6. When this data were taken, the drying chamber was loaded with 544 kg of dates. It can be seen from Fig. 6 that at 8:30 A.M, ambient temperature was 35 ºC, which was raised to 39 ºC at 13:30 hours and then fell to 34 ºC at 22:30 hours. The collector outlet temperature at 8:30 A.M was 57 ºC, which was raised to 72 ºC at 13:30 hours. From 8:30 A.M to 11:30 A.M both solar and gas firing systems were in operation. From 11:30 A.M to 6:30 P.M only solar system was in operation. At 6:30 P.M. again the gas firing system was switched on that remained in operation till 10:30 P.M. At 10:30 P.M. the gas firing system was switched off, because the relative humidity of the ambient air increased to 80 %, consequently the drying rate was decreased. Hence, it was not favourable to run the dryer from 10:30 P.M. to 8:30 A.M. It is also clear from Fig. 6 that
the drying chamber temperature was 37.5 ºC at 8:30 A.M, 43 ºC at noon and 45 ºC in evening hours.
It can also be seen from Table 1 that the relative humidity of the ambient air was 72 % at 8:30 A.M., which was decreased to 55 % in afternoon hours, and then again increased to above 80 % at 22:30 hrs. The chamber outlet relative humidity was 74 % at 8:30 AM, and it was about 56 % in afternoon and evening hours. On average, the ambient temperature during the test period was 36.5 ºC, the collector outlet temperature was 60.2 ºC, and drying chamber outlet temperature was 42.5 ºC. The average relative humidity of the ambient air, and chamber outlet air was 65.3 %, and 61.2 %, respectively during the test period.
Table 2 shows the hour-by-hour ambient ai r absolute humidity, chamber outlet air absolute humid-ity, and moisture take off from the drying chamber. The average absolute humidity of the ambient air was 26.2 g/kg during the test pe-riod, whereas the average absolute humidity of the chamber outlet air
was 33.61 g/kg. The average mois-ture removal was 2.93 kg of water/h. Fig. 7 shows that at 8:30 A.M the moisture removal was 1.86 kg/h, it raises to 5.82 kg/h at 13:30 hours, and then decreased to 1.82 kg/h at 18:30 hours. At 18:30 hours, again, the gas firing system was switched on and the moisture removal in-creased to 3.17 kg/h. The air f low rate used in the calculations was 0.11 kg/s. The system was shutdown at 22:30 hours. During the test period (20/8/03, 21/8/03, 22/8/03, 23/8/03, and 24/8/03) the dryer was in operation for 75 hrs. This meant the moisture removal was 219.75 kg (75 hrs × 2.93 kg/hr). This moisture removal could be improved by in-sulating the inner side of the drying chamber. The final moisture content of the dried dates was about 22 to 24 %, at the end of the drying pe-riod.
Economic Analysis of Solar-Cum-Gas Fired Dates Dryer
The economic analysis of the solar-cum-gas fired dates dryer is important, particularly for the dates processors and growers in order to understand the benefit they can gain by adopting this innovative technol-ogy. Table 3 presents the economics of the solar-cum-gas fired dates dry-er. The various assumptions and the input data to perform this economic analysis has already been presented (Ahmad and Mirani, 2005). The fixed and variable costs were pre-dicted using the methodology given by Kepner et al. (1978). The pur-chase price of the new solar-cum-gas fired dates dryer was considered to be PRS 150,000/- and the useful life of the system was assumed 20 years based on our experience. It is revealed from Table 3 that the total (fixed + variable) cost of drying one ton of fresh dates using solar-cum-gas fired dates dryer was PRS 7,571.
During the dates harvesting sea-son, the cost of one tonne of fresh

AGRICULTURAL MECHANIZATION IN ASIA, AFRICA, AND LATIN AMERICA 2008 VOL.39 NO.468
dates (dung doka) is about Rs. 15,000. After drying one tonne of fresh dates, only about 0.58 ton of dried dates can be obtained. The sale price of the 0.58 ton of dried dates is about PRS 40,600, by as-suming the sale price of the dried dates as PRS 70,000/tonne. By de-ducting the cost of drying the one tonne of fresh dates (Rs. 7,571), and the cost of fresh dates from the sale price of the 0.58 tonne of the dried date, one can easily determine the value addition in one tonne of fresh dates. This comes around PRS 18,029/tonne. The seasonal drying capacity of the dryer is 4 tonnes. Hence, one may earn about PRS 72,116/season by adopting this tech-nology.
Conclusions and Recom-mendation
A solar-cum-gas fired dates dryer has been developed at the National Agricultural Research Centre, Is-lamabad. The experimental results indicated that about 544 kg fresh dates can be loaded in a batch. The dryer takes about 75 hours to dry these dates up to moisture content of 24 %. The dryer is normally op-erated from 8:30 AM to 10:30 PM, and 5 days are required to process one batch of dates up to the desired moisture content level.
The economic analysis revealed that the cost of drying dates using solar-cum-gas fired dates dryer is Rs. 7,571 per tonne, and one may earn Rs. 72,116 per season by adopt-ing this dryer.
The solar-cum-gas fired dryer is suitable for on-farm dates drying, and there is a need to demonstrate and commercialize this technology in dates growing areas of Pakistan.
REFERENCES
Ahmad, M. and A. S. Khan. 1997. Design and construction of solar grain and fruit drying system. Agricultural Mechanization in Asia, Africa, and Latin America. 28(4): 62-66.
Ahmad, M. 2001. Performance of solar fruit drying system. Journal of Engineering and Applied Sci-ences, July-December. 20(2): 45-52.
Ahmad, M. and A. A. Mirani 2005. Development and evaluation of a solar-cum-gas fired dates dry-ing system. Research Report No. 01/2005. Farm Machinery Insti-tute, National Agricultural Re-search Centre, Islamabad.
Anonymous 1965. How to make a solar cabinet dryer for agricultural produce. Do-it-yourself, Leaf let L 6, Brace Research Institute, Ste Anne de Bellevue, Canada: 9
Bajoi, A. H. 1996. Post harvest aspects of date cultivation in Ba-luchistan. In: Proceedings of the National Conference on Post har-vest Technology of Horticultural Commodities (Edited by: W. A. Farooqi). Held at Quetta, Septem-ber 10-12.
Esper, A., O. Hensel and W. Muhl-bauer. 1994. PV-dr iven solar tunnel drier. Agricultural Engi-neering Conference, Bangkok, December: 6-9.
Excell, R. H. B. and S. Kornsakoo. 1978. A low cost solar rice dryer. Appropriate Technology, Vol. 5(1): 23-24.
Excell, R. H. B., S. Kornsakoo, and S. Thiratrakoolchai. 1979. A low cost solar rice dryer for farmers in south east Asia. Agricultural Mechanization in Asia. Autumn, 75-78.
Excell, R. H. B. 1980. Basic design
theory for a simple solar r ice dryer. Renewable Energy Review Journal. Vol. 1(2): 1-14.
Internet material. Whole dates, file://E.\Whole%20Dates.htm
Iqbal, M. 1996. Financial implica-tions of post harvest losses in hor-ticulture commodities in Pakistan. In: Proceedings of the National Conference on Post harvest Tech-nology of Horticultural Commod-ities (Edited by: W. A. Farooqi). Held at Quetta, September 10-12.
Kepner, R. A., R. Bainer, and E. L. Barger. 1978. Principles of farm machinery. AVI publishing com-pany, Inc. Westport, Connecticut.
Mastekbayeva, G. A., M. Augus-tusleon, and S. Kumar. 1998. Performance evaluation of a solar tunnel dryer for chilli drying. Paper presented at the ASEAN Seminar and Workshop on Drying Technology, held at Phitsanulok, Thailand, June 3-5.
New Mexico Solar Energy Associa-tion. 1978. How to build a solar crop dryer. Santa Fe, USA; NM-SEA: 10
Parker, B. F., M. R. Lindley, D. G. Colliver, and W. E. Murphy. 1993. Thermal performance of three solar-air heaters. Solar energy. 51(6): 467-479.
Quraishi, M. A. A. and M. A. Zia 1997. Pakistan agricultural re-sources. A-one Publishers, La-hore.
Trim, D. S. 1982. Solar crop dryers. Presented at the Arab Conference on Solar Energy Utilization in Agriculture, at Amman, Jordan, December.
Verbal Communication with Profes-sor Abdul Ghafoor, Department of Horticulture, Gomal University, D. I. Khan.
■■

VOL.39 NO.4 2008 AGRICULTURAL MECHANIZATION IN ASIA, AFRICA, AND LATIN AMERICA 69
Formulation of Generalized Experimental Models for Double Roller Gin
byP. G. PatilPh. D. Scholar (VNIT), Scientist (SG)Central Institute for Research onCotton Technology,(Indian Council of Agricultural Research)Nagpur - 440023INDIA
J. F. AgrawalWorkshop Superindendent andAssistant Professor(Prod. Engg.)Yeshwantrao Chavan College of Engineering,Nagpur - 441110INDIA
P. M. PadoleHead and Professor(Mech. Engg.)Visveswaraya National Institute of Technology,Nagpur - 440011INDIA
A. B. Dahake(Agric. Engg.)Central Institute for Research onCotton Technology,Nagpur - 440023INDIA
AbstractTo optimize the processing pa-
rameters of double roller (DR) gin for cotton ginning, it was necessary to establish the generalized models. An experimental study on perfor-mance of machine was carried out to study the inf luence of leather roller speed, beater speed, seed cot-ton moisture on ginning rate, lint quality and power consumption dur-ing ginning. Seed cotton of different staple lengths and three levels of RPM of roller for two replications were utilized for the experiment. Experiments were conducted on an especially designed experimental
setup, which recorded roller RPM, energy consumption and roller tem-perature. The highest roller speed of 120 RPM coupled with 7 % mois-ture content seed cotton showed highest ginning rate with maximum saving in electrical energy. The highest ginning rate and maximum energy saving were observed for higher staple length as compared to lower staple length. The ginning rate ranged from 8.37 to 15.75 g/m of roller length as the power require-ment varied from 2,577 to 3984 W, respectively. Roller surface tem-perature rise due to frictional heat-ing was -in the range of 0.5 to 19.6 ºC. According to Duncan’s Multiple Range Test (p > 0.05), process pa-rameters (roller and beater speed) and moisture content of cotton did not significantly affect lint quality like 2.5 % span length, micronaire, fibre tenacity, uniformity ratio, ma-turity ratio, short fibre content, neps and seed coat neps. Generalized experimental models for power, roller temperature, staple length and ginning percentage were developed using MATLAB and were validated
using students t-test.
IntroductionGinning is the process by which
seed cotton is separated into lint (fi-bres) and seed and the machine used for its separation is called a ginning machine. Thus, ginning is the first engineering activity that cotton un-dergoes on its way from cotton field to textile mills. The gin stand is the heart of the ginning plant (Wright et al., 1977). Most of major cotton producing countries like the USA, China, Uzbekistan and Australia use saw gins for ginning the cotton. In India, the third largest producer of cotton in the world, the double roller gin was used for 3.3 million tones of fiber in 2004-2005 (80 % of the total cotton production). Ginning rate in the DR gin is far less than in the saw gin but it is far gentler to the fibre and preserves the quality of lint as compared to the saw gin. However, the slow ginning rate of the roller gin has made it expensive to maintain and operate. A technical
Acknowledgements: The authors would like to acknowledge Dr. S. Sreenivasan, Director and Dr. K. M. Paralikar, Central Institute for Research on Cotton Technology (ICAR), Govt. of India for providing facilities in our experiments. The authors would also like to acknowl-edge Bajaj Steel Industries Ltd., Nagpur 440018, India for their help in experimentation.

AGRICULTURAL MECHANIZATION IN ASIA, AFRICA, AND LATIN AMERICA 2008 VOL.39 NO.470
survey (Cotton Ginning and Press-ing Factories in India: A Census Based Techno-Economic study, 2003) revealed that 43,585 gin-ning machines (4,245 single roller gin stands, 38286 double roller gin stands, and 1,054 saw gin stands) are presently working in India. The rotary knife roller gin is not used in India.
The process of ginning cotton is a complex phenomenon. In a double roller gin, two spirally grooved leather rollers, pressed against a fixed knife (stationary knife) with the help of adjustable dead loads, are made to rotate in opposite di-rections at a specific speed. The three beater arms are inserted in the beater shaft and two knives are then fixed to the beater arms with proper alignment. This is known as beater or moving knife, which oscillates by means of a crank or eccentric shaft, close to the leather roller. When the seed cotton is fed to the machine in action, fibres adhere to the rough surface of the roller and are carried in between the fixed knife and the roller such that the fibres are partial-
ly gripped between them. The oscil-lating knives beat the seeds from top and separate the fibres, which are gripped from the seed end. This process is repeated a number of times and the fibres are separated from the seeds, carried forward on the roller and dropped out of the machine. The ginned seeds drop down through the slots provided on the seed grid that is part of the beater assembly, which also oscil-lates along with the moving knife.
The ginning performance in the DR gin depends on the length and diameter of roller, speed of roller, beater oscillat ions per second, initial staple length and moisture content, which are all considered as independent variables. Power required for ginning, lint output, quality of lint, roller temperature and ginning percentage are the de-pendent variables. Indian double roller ginning machines are oper-ated at a roller speed of 100 RPM. Very few data are available on per-formance of the double roller gin with reference to factors such as roller RPM, variety (type) of cotton
and moisture content of cotton. To optimize the processing parameters in the double roller ginning ma-chine, extensive experimentation is essential. This study will also help generate design data for a more ef-ficient machine. The main objective of this research is to optimize the process parameters to improve the design of the DR gin and establish approximate generalized models for estimation of important design pa-rameters. The approach proposed by Schenck (1961) is used for planning and execution of experiment and data is validated by students t-test and Duncan’s multiple range test (DMRT) to check its significance.
Review of LiteratureLeonard and Gillum (1974) stud-
ied the effect of fibre moisture on rotary knife roller gin having 1016 mm (40 inch) wide and 381 mm (15 inch) diameter of roller and found that that the optimum range of fibre moisture content for roller ginning and lint cleaning ranged from 5 to 6 percent. Johnson et al. (1977) studied the ginning performance by varying the crank and roller speeds on Pima and SXP varieties on a 1016 mm (40 inch) roller gin. The study revealed that by increasing the speed of the crank from 650 to 840 revolutions per minute (29 %), the amount of lint ginned per hour increased from 18.2 to 22 kg (i.e. 40 to 48.3 pounds) (21 %). It was further revealed that
Independent variable Test envelope Test points Test sequenceLevel 1 Level 2
Roller length, 1,360 mm Constant Constant Constant ConstantRoller speed (RPM) 80 to 100 80, 100, 120 2, 3, 1 2, 3, 1Beater speed (OPM) 800 to 1200 800, 1000, 1200 2, 3, 1 2, 3, 1Roller diameter (Chrome leather) 170 mm 170 mm Constant ConstantStaple length Constant Constant 1, 2, 3 1, 2, 3Moisture, % 5 to 9 5, 7, 9 3, 1, 2 1, 3, 2Roller-stationery knife pressure, 10.5 kN/m2 Constant Constant Constant ConstantAcceleration due to gravity, 9.81 m/s2 Constant Constant Constant ConstantMoment of inertia, 0.9735 kg/m2 Constant Constant Constant Constant
Table 1 Test range, test points and test sequence
Fig. 1 Battery of DR gins in factory and experimental set up
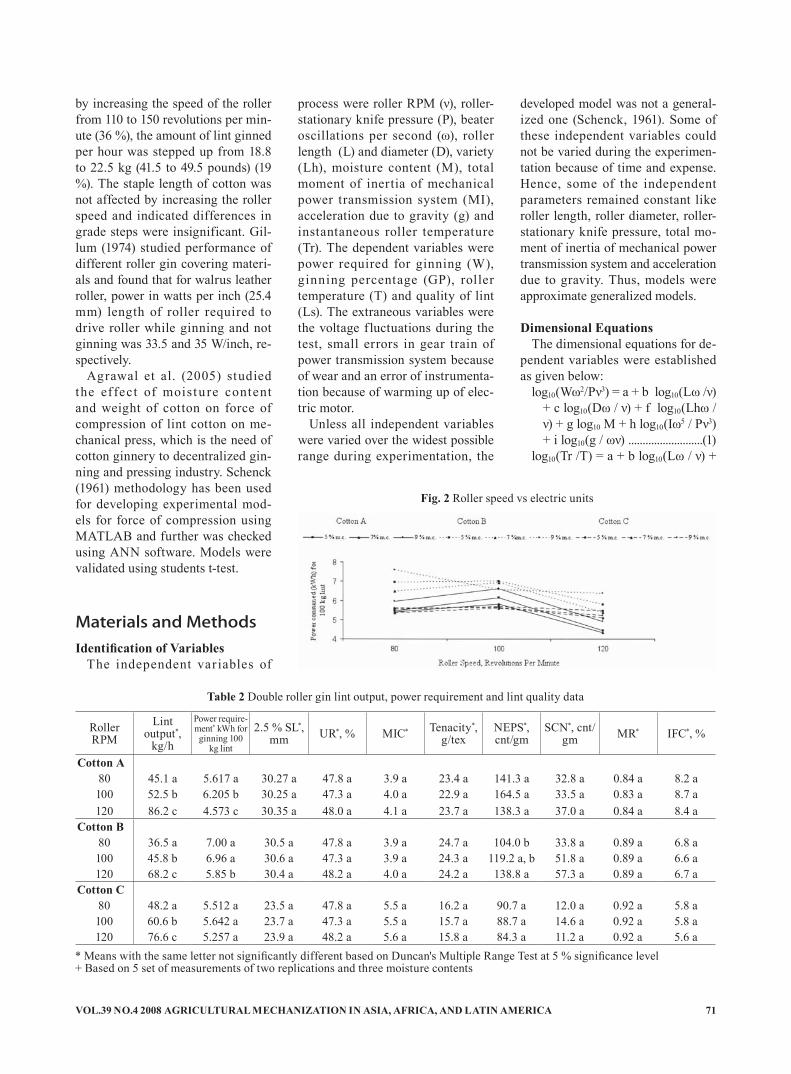
VOL.39 NO.4 2008 AGRICULTURAL MECHANIZATION IN ASIA, AFRICA, AND LATIN AMERICA 71
by increasing the speed of the roller from 110 to 150 revolutions per min-ute (36 %), the amount of lint ginned per hour was stepped up from 18.8 to 22.5 kg (41.5 to 49.5 pounds) (19 %). The staple length of cotton was not affected by increasing the roller speed and indicated differences in grade steps were insignificant. Gil-lum (1974) studied performance of different roller gin covering materi-als and found that for walrus leather roller, power in watts per inch (25.4 mm) length of roller required to drive roller while ginning and not ginning was 33.5 and 35 W/inch, re-spectively.
Agrawal et al. (2005) studied the ef fect of moistu re content and weight of cotton on force of compression of lint cotton on me-chanical press, which is the need of cotton ginnery to decentralized gin-ning and pressing industry. Schenck (1961) methodology has been used for developing experimental mod-els for force of compression using MATLAB and further was checked using ANN software. Models were validated using students t-test.
Materials and MethodsIdentification of Variables
The independent var iables of
process were roller RPM (ν), roller-stationary knife pressure (P), beater oscillations per second (ω), roller length (L) and diameter (D), variety (Lh), moisture content (M), total moment of inertia of mechanical power transmission system (MI), acceleration due to gravity (g) and instantaneous roller temperature (Tr). The dependent variables were power required for ginning (W), ginning percentage (GP), roller temperature (T) and quality of lint (Ls). The extraneous variables were the voltage fluctuations during the test, small errors in gear train of power transmission system because of wear and an error of instrumenta-tion because of warming up of elec-tric motor.
Unless all independent variables were varied over the widest possible range during experimentation, the
developed model was not a general-ized one (Schenck, 1961). Some of these independent variables could not be varied during the experimen-tation because of time and expense. Hence, some of the independent parameters remained constant like roller length, roller diameter, roller-stationary knife pressure, total mo-ment of inertia of mechanical power transmission system and acceleration due to gravity. Thus, models were approximate generalized models.
Dimensional EquationsThe dimensional equations for de-
pendent variables were established as given below:
log10(Wω2/Pν3) = a + b log10(Lω /ν) + c log10(Dω / ν) + f log10(Lhω / ν) + g log10 M + h log10(Iω5 / Pν3) + i log10(g / ων) ..........................(1)
log10(Tr /T) = a + b log10(Lω / ν) +
Roller RPM
Lint output*,
kg/h
Power require-ment* kWh for ginning 100
kg lint
2.5 % SL*, mm UR*, % MIC* Tenacity*,
g/texNEPS*, cnt/gm
SCN*, cnt/gm MR* IFC*, %
Cotton A80 45.1 a 5.617 a 30.27 a 47.8 a 3.9 a 23.4 a 141.3 a 32.8 a 0.84 a 8.2 a100 52.5 b 6.205 b 30.25 a 47.3 a 4.0 a 22.9 a 164.5 a 33.5 a 0.83 a 8.7 a120 86.2 c 4.573 c 30.35 a 48.0 a 4.1 a 23.7 a 138.3 a 37.0 a 0.84 a 8.4 a
Cotton B80 36.5 a 7.00 a 30.5 a 47.8 a 3.9 a 24.7 a 104.0 b 33.8 a 0.89 a 6.8 a100 45.8 b 6.96 a 30.6 a 47.3 a 3.9 a 24.3 a 119.2 a, b 51.8 a 0.89 a 6.6 a120 68.2 c 5.85 b 30.4 a 48.2 a 4.0 a 24.2 a 138.8 a 57.3 a 0.89 a 6.7 a
Cotton C80 48.2 a 5.512 a 23.5 a 47.8 a 5.5 a 16.2 a 90.7 a 12.0 a 0.92 a 5.8 a100 60.6 b 5.642 a 23.7 a 47.3 a 5.5 a 15.7 a 88.7 a 14.6 a 0.92 a 5.8 a120 76.6 c 5.257 a 23.9 a 48.2 a 5.6 a 15.8 a 84.3 a 11.2 a 0.92 a 5.6 a
Table 2 Double roller gin lint output, power requirement and lint quality data
* Means with the same letter not significantly different based on Duncan's Multiple Range Test at 5 % significance level+ Based on 5 set of measurements of two replications and three moisture contents
Fig. 2 Roller speed vs electric units

AGRICULTURAL MECHANIZATION IN ASIA, AFRICA, AND LATIN AMERICA 2008 VOL.39 NO.472
c log10(Dω / ν) + d log10(Lhω / ν) + g log10 M + h log10(Iω5 / Pν3) + i log10(g / ων) ..............................(2)
log10(Lsω / ν) = a + b log10(Lω / ν) + c log10(Dω / ν) + f log10(Lhω / ν) + g log10 M + h log10(Iω5 / Pν3) + i log10(g / ων) ..........................(3)
log10(GP) = a + b log10(Lω / ν) + c log10(Dω / ν) + f log10(Lhω / ν) + g log10 M + h log10 (Iω5/ Pν3) + i log10(g / ων) ................................(4)
where a, b, c, f, g, h and i are con-stants and were to be determined by MATLAB.
Test PlanningTest envelope, test points and test
sequence were decided on the ba-sis of some of the known ranges of variation of some of the independent variables and are shown in Table 1.
Experimental Set UpThe laboratory experimental set
up was specially designed to con-duct experimentation (Fig. 1). The
desired speed of roller was achieved by A.C. drive (X 4 C 40 100 C 1 P 66, 10 hp, Input volts: 380 − 460 ± 15 %, Input Ampere: 19.7/16.3, Out-put volts: 0 - 380/460, 3 phase, Out-put Ampere: 15.6/14 A) by varying frequency. The temperature of the roller was recorded by temperature sensors (DS 1621, Dallas calibrated).
Roller RPM was measured by 1 R slot sensor and recorded. The power input of the machine was measured by a specially designed system in-terface with computer through an analog digital card (20 A. 100 mA current transformer). The required hardware like V potential transform-er, current transformer, temperature sensor and software for interfacing were prepared. The experimenta-tion was conducted as per test plan. Measurements were made at 1.4 seconds interval. The measurements made during the first 200 seconds were discarded to avoid non-equilib-rium temperature of roller results.
Important fibre properties such as 2.5 % span length, micronaire, fibre tenacity and uniformity ratio were determined using High Volume Instrument HVI-900 of Uster Tech-nologies (Switzerland), and maturity ratio, short fibre content, neps and seed coat neps were determined using the Advanced Fiber Instru-mentation system (AFIS) of Uster Technologies. All these tests were performed at standard conditions of humidity and temperature (65 ± 2 % RH and 27 ± 2 ºC). The ginning rate (g/m/s) was obtained by dividing the quotient of lint weight and roller length by the ginning time.
Conduct of ExperimentDifferent levels of fibre moisture
content were obtained by moisture conditioning the seed cotton before it was ginned. The fibre moisture content at the time of ginning was intentionally varied to determine its effect upon the roller gin operation and lint quality. Seed cottons of dif-ferent staple lengths (Cotton A: 29.1-31.8 mm, Cotton B: 30-31 mm and Cotton C: 23-24 mm) were subject-ed to three levels of revolutions per minute (RPM) of roller (80, 100, and 120) and three levels of moisture contents (5, 7 and 9 %). However, it may be noted that the ratio of roller RPM and beater oscillations per minute (OPM) remained constant at 1:10. The tests were conducted and
Roller RPM
Power, Wω2/Pν3 Temperature, Tr/T Staple length, Lsω/ν Ginning percentage, GP
Model Value Experimental value Model Value Experimental
value Model Value Experimental value Model Value Experimental
valueCotton A
80 118.2 117.9 1.0376 1.0238 0.12536 0.56836 35.9455 36.0166100 119.6 120.2 1.0422 1.0227 0.78978 0.56490 35.9098 35.9833120 120.8 120.8 1.0391 1.0205 2.83081 0.56728 35.8685 35.9833
Cotton B80 118.0 118.9 1.0371 1.0421 0.12369 0.52276 36.0920 36.0166100 119.5 118.0 1.0418 1.0504 0.78036 0.57366 36.0422 35.9833120 120.7 121.9 1.0387 1.0546 2.79695 0.56915 36.0012 35.9833
Cotton C80 122.5 122.0 1.0424 1.0420 0.18296 0.44156 32.0130 31.9833100 123.9 126.3 1.0561 1.1075 1.15201 0.44410 31.9871 31.9120 125.3 123.8 1.0529 1.0672 4.1320 0.44650 31.9436 31.9666
Table 3 Model values and experimental values for the dependent pi terms
Fig. 3 Roller speed vs lint output
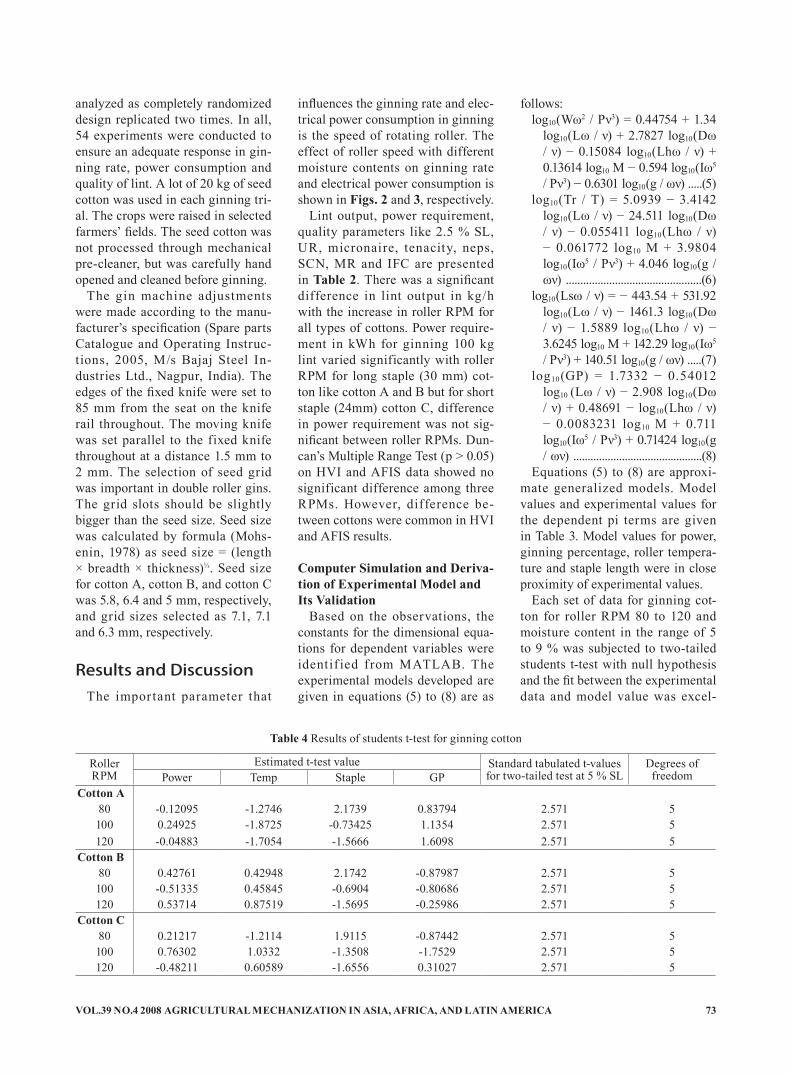
VOL.39 NO.4 2008 AGRICULTURAL MECHANIZATION IN ASIA, AFRICA, AND LATIN AMERICA 73
Roller RPM
Estimated t-test value Standard tabulated t-values for two-tailed test at 5 % SL
Degrees of freedomPower Temp Staple GP
Cotton A80 -0.12095 -1.2746 2.1739 0.83794 2.571 5100 0.24925 -1.8725 -0.73425 1.1354 2.571 5120 -0.04883 -1.7054 -1.5666 1.6098 2.571 5
Cotton B80 0.42761 0.42948 2.1742 -0.87987 2.571 5100 -0.51335 0.45845 -0.6904 -0.80686 2.571 5120 0.53714 0.87519 -1.5695 -0.25986 2.571 5
Cotton C80 0.21217 -1.2114 1.9115 -0.87442 2.571 5100 0.76302 1.0332 -1.3508 -1.7529 2.571 5120 -0.48211 0.60589 -1.6556 0.31027 2.571 5
Table 4 Results of students t-test for ginning cotton
analyzed as completely randomized design replicated two times. In all, 54 experiments were conducted to ensure an adequate response in gin-ning rate, power consumption and quality of lint. A lot of 20 kg of seed cotton was used in each ginning tri-al. The crops were raised in selected farmers’ fields. The seed cotton was not processed through mechanical pre-cleaner, but was carefully hand opened and cleaned before ginning.
The gin machine adjustments were made according to the manu-facturer’s specification (Spare parts Catalogue and Operating Instruc-tions, 2005, M/s Bajaj Steel In-dustries Ltd., Nagpur, India). The edges of the fixed knife were set to 85 mm from the seat on the knife rail throughout. The moving knife was set parallel to the fixed knife throughout at a distance 1.5 mm to 2 mm. The selection of seed grid was important in double roller gins. The grid slots should be slightly bigger than the seed size. Seed size was calculated by formula (Mohs-enin, 1978) as seed size = (length × breadth × thickness)⅓. Seed size for cotton A, cotton B, and cotton C was 5.8, 6.4 and 5 mm, respectively, and grid sizes selected as 7.1, 7.1 and 6.3 mm, respectively.
Results and DiscussionThe important parameter that
influences the ginning rate and elec-trical power consumption in ginning is the speed of rotating roller. The effect of roller speed with different moisture contents on ginning rate and electrical power consumption is shown in Figs. 2 and 3, respectively.
Lint output, power requirement, quality parameters like 2.5 % SL, UR, micronaire, tenacity, neps, SCN, MR and IFC are presented in Table 2. There was a significant difference in lint output in kg/h with the increase in roller RPM for all types of cottons. Power require-ment in kWh for ginning 100 kg lint varied significantly with roller RPM for long staple (30 mm) cot-ton like cotton A and B but for short staple (24mm) cotton C, difference in power requirement was not sig-nificant between roller RPMs. Dun-can’s Multiple Range Test (p > 0.05) on HVI and AFIS data showed no significant difference among three RPMs. However, difference be-tween cottons were common in HVI and AFIS results.
Computer Simulation and Deriva-tion of Experimental Model and Its Validation
Based on the observations, the constants for the dimensional equa-tions for dependent variables were identif ied from MATLAB. The experimental models developed are given in equations (5) to (8) are as
follows: log10(Wω2 / Pν3) = 0.44754 + 1.34
log10(Lω / ν) + 2.7827 log10(Dω / ν) − 0.15084 log10(Lhω / ν) + 0.13614 log10 M − 0.594 log10(Iω5 / Pν3) − 0.6301 log10(g / ων) .....(5)
log10(Tr / T) = 5.0939 − 3.4142 log10(Lω / ν) − 24.511 log10(Dω / ν) − 0.055411 log10(Lhω / ν) − 0.061772 log10 M + 3.9804 log10(Iω5 / Pν3) + 4.046 log10(g / ων) ...............................................(6)
log10(Lsω / ν) = − 443.54 + 531.92 log10(Lω / ν) − 1461.3 log10(Dω / ν) − 1.5889 log10(Lhω / ν) − 3.6245 log10 M + 142.29 log10(Iω5 / Pν3) + 140.51 log10(g / ων) .....(7)
log10(GP) = 1.7332 − 0.54012 log10 (Lω / ν) − 2.908 log10(Dω / ν) + 0.48691 − log10(Lhω / ν) − 0.0083231 log10 M + 0.711 log10(Iω5 / Pν3) + 0.71424 log10(g / ων) .............................................(8)
Equations (5) to (8) are approxi-mate generalized models. Model values and experimental values for the dependent pi terms are given in Table 3. Model values for power, ginning percentage, roller tempera-ture and staple length were in close proximity of experimental values.
Each set of data for ginning cot-ton for roller RPM 80 to 120 and moisture content in the range of 5 to 9 % was subjected to two-tailed students t-test with null hypothesis and the fit between the experimental data and model value was excel-
AGRICULTURAL MECHANIZATION IN ASIA, AFRICA, AND LATIN AMERICA 2008 VOL.39 NO.474
lent. The estimated t values for each set of data were within the range of standard tabulated values of t at 5 % level of significance and cor-responding degrees of freedom as shown in Table 4.
ConclusionsAn experimental database and
approximate generalized models for power, ginning percentage, roller temperature and staple length were obtained. Model values for power, ginning percentage, roller tempera-ture and staple length were in close proximity to experimental values. The models were approximate generalized and standard tabulated student’s test t-values of for two-tailed test at 5 % significance level were higher than the estimated t-values, hence models developed showed good results. Duncan’s Multiple Range Test for lint output showed that there was a significant increase in output with increase in roller RPM. Power requirement varied significantly with roller RPM for long staple (30 mm) cotton like cotton A and B. For short staple (24 mm) cotton C, power requirement
did not vary much with roller RPMs. DMRT (p > 0.05) for lint quality parameters showed that quality was not affected by increasing the roller (120 RPM) and beater speed (1200 oscillations per minute) to attain higher ginning rate.
REFERENCES
Agrawal J. F., R. D. Askhedkar, P. M. Padole, J. P. Modak. 2003. Formulation of generalized ex-perimental model for compressing lint cotton to form a bale with a view to generate design data for mechanical press. INCARF 2003, IIT Delhi, Paper No. 228, Techni-cal Session IV B.
Agrawal, J. F., S. L. Pandharipande, R. D. Askhedkar, P. M. Padole. 2006. Modeling of Compression of Lint Cotton to Form a Bale Us-ing Artificial Neural Network. Paper shortly publishing in Inter-national Journal of Advances in Modeling and simulation tech-niques in enterprises, France.
Johnson, Arvind J., J. S. Townsend, T. C. Walton. 1977. American-Egyptian Cot ton Quality and Ginning, U. S. Department of Ag-
riculture, Agriculture Handbook, 503.
Cotton Ginning and Pressing Fac-tories in India, A Census Based Techno-Economic study. 2003. Textiles Committee, Ministry of Textiles, India. 39.
Gillum, M. N. 1974. Proper ties of Roller Gin Roller Covering Materials, U. S. Department of Agriculture, Technical Bulletin No.1490, 13.
Schenck H. Jr. 1961. Theories of Engineering Experimentation” McGrew Hill Book Co., New York.
Leonard C. G. and M. N. Gillum. 1974. Effect of Fiber Moisture on Roller Ginning, Ginner’ Journal & Yearbook, 40-46.
Mohsenin, N. N. 1978. Physical properties of plant and animal materials. Gorden and Breach Sci-ence Publishers. Second Edition, New York.
Spare parts Catalogue and Operat-ing Instructions. 2005. Bajaj Steel Industries Ltd., Nagpur, India.
Wright, J .E. and V. P. Moore. 1977. Gin stands. In Cotton Ginners Handbook. U .S. Department of Agriculture, Agriculture Hand-book 503, 29-35.
■■

VOL.39 NO.4 2008 AGRICULTURAL MECHANIZATION IN ASIA, AFRICA, AND LATIN AMERICA 75
Abstract The temperature and humidity is
very high in most part of the coun-try except in the highlands. As a re-sult vegetables and fruit loose their freshness very quickly. An evapora-tive cooling system, (ECS) was de-veloped at the Agriculture Depart-ment of the Papua New Guinea Uni-versity of Technology, Lae, which is very humid with high temperature throughout the year. Three kinds of fruits namely pawpaw, banana and oranges and other vegetables like cabbage, broccoli and lettuce were stored in the ECS and subjective measurements were taken.
Chemical analysis were conducted in the lab on the stored produce to determine vitamin A and C.
The self-life of cabbage was ob-served to be nine days while brocco-li and lettuce maintained their shelf life for four and five days, respec-tively. For the samples left outside at the prevailing ambient condition, cabbage remained good for four days and broccoli and lettuce for two and three days, respectively. The ECS system maintained 2 to 5 ºC lower temperature compared to the outside temperature. A regression analy-sis showed that as the independent variable increased, the shelf life of the produce stored in the ECS was reduced. When the temperature in the model was increased to a higher
Preservation and Storage of Perishable Fresh Fruits and Vegetables in the Lowlands of Papua New Guinea
bySurya NathAssociate ProfessorDepartment of AgriculturePNG University of TechnologyPrivate Mail BagLAEPapua New Guinea
Simon SilEx-Post Graduate StudentDepartment of AgriculturePNG University of Technology Private Mail BagLAEPapua New Guinea
level, it gave a negative value. This meant that at that temperature pro-duce will loose its marketable value. The same was true for humidity. It was anticipated that if this technol-ogy was applied in rural areas at a larger scale, it would go a long way in enhancing the shelf life of fruits and vegetables in the lowlands of Papua New Guinea.
Introduction The product ion of f ruits and
vegetables has been continuously increasing in the lowlands of Papua New Guinea. The losses during post harvest operations both at the village and commercial level are extremely high in case of perishable products. The production of fruits and vegetables suffers from severe handicaps including poor harvest-ing and handling, transport, storage and marketing. The cultivation of fresh fruits and vegetables is labour intensive in PNG but quite remu-nerative for small and marginal farmers. Storage facilities at rural farmer level is nonexistent in PNG; however, if it is made available, the farmer will soon have capacity to avoid distress sale of the commodi-ties immediately after harvest.
If the losses are reduced, more commodities will be available in the market and consumers will pay less
for the same commodity. Debney, (1980) pointed out that a partial al-ternative to increased agricultural production as a means of increas-ing food availability is provided by improved storage and conservation leading to reduced post harvest loss. According to FAO (1988) the post harvest losses in fresh fruits and veg-etables among developing countries stands at 70 percent. Hence,strategy for preservation and storage of per-ishables has to be evolved so that all the farmers can reap the benefits.
Acknowledgements: Numerous individuals have helped in their own way to make this project a suc-cess and they need special mention. First of all, Australian Centre for International Agricultural Research, (ACIAR) in collaborat ion with Professor Barry Nortan of the Uni-versity of Queensland of Australia is thanked for the financial support without which this project would have not been undertaken. The sym-pathetic attitude and constructive advice of Professor Abdul Halim warrant special mention. Special thanks are also due to Mr. Cliff Wep and Mr. Kepo Yari of Lae Technical College for their help in the con-struction of the evaporative cooling system. Finally thanks are also due to Ms. Geraldine Kapipi for typing the manuscript and Mr. Frank Vidi-namo for editing the Figures.

AGRICULTURAL MECHANIZATION IN ASIA, AFRICA, AND LATIN AMERICA 2008 VOL.39 NO.476
As a result, research funded by the ACIAR (Australian Centre for In-ternational Agricultural Research) in collaboration with the University of Queensland and the University of Technology, LAE was undertaken in the agriculture department of the University of Technology, LAE, Papua New Guinea.
A small-scale evaporative cool-ing system was developed with 1 m3 space available for storage. The evaporative cooling system consist-ed of two brick-walls separated by a column of normal sand on which water was continuously sprinkled so that it provided cooling effect inside the chamber. The cover of this struc-ture was made of thatch so that cross ventilation helped lower the temper-ature inside the chamber. Wooden racks were fitted in the chamber on which baskets of fruits and vegetable were stored. Pawpaw, banana, or-ange, cabbage, broccoli and lettuce were the subjects of studies. Banana and pawpaw stored very well for seven days whereas orange stored up to nine days. Similarly, broccoli and lettuce stored well for only four and five days, respectively. Cabbage stored up to nine days. The veg-etables kept outside as control lasted only for two days. This showed that the evaporative cooling system worked and, if this technology is spread among villagers, it would go
a long way in improving the well be-ing of rural farmers in the low lands of Papua New Guinea.
Review of Literature Fruits and vegetables are impor-
tant sources of essential minerals and vitamins in the human diet. Vegetables and fruits a contain sig-nificant amount of calcium, iron and some other minerals. Vitamins are essential for the control of chemical reactions in the body. Fruits and veg-etables play major role in Papua New Guinea because subsistence farm-ers can trade it for other substances which they do not have. This, in turn, improves their living standards and nutritional status of children and people (FAO, 1988). The government of Papua New Guinea established a Food Marketing Corporation in 1976 where in the producers wish-ing to sell fruits and vegetables were helped by improving the market fa-cilities in urban centres. Now, it has been replaced by the Fresh Produce Development Agency.
Mechanical damage during har-vesting and handling can result in defects on the produce and permit invasion of microorganism causing diseases (Friedman, 1960). Produce can overheat and rapidly deteriorate during temporary storage. Accord-
ing to Jenny (2000) failure to sort or discard immature, overripe, un-dersized, misshapen, blemished or otherwise damage produce creates problem in the subsequent handling and marketing of the produce. The harvested produce, if transported on bumpy roads, will be bruised due to shaking action. The produce may become overheated at high tempera-ture if there is inadequate shade, ventilation and cooling (Irving, 1984).
Poor control of storage conditions, storage for too long and inappropri-ate storage conditions for a particu-lar commodity will also result in a poor quality product (Kalman Peleg, 1985). Fruits and vegetables are living biological systems and they deteriorate after harvest. The rate of deterioration varies greatly between individual produce depending on their overall rate of metabolism (Kader et al., 1985). On the other hand, many volatile compounds evolved by the produce may accu-mulate in the storage atmosphere. Janet and Richard (2000) stated that ethylene is the most important of these compounds and its accumula-tion above a certain critical level may reduce storage life.
Therefore, it is important to avoid storing sensitive produce with those producing high level of ethylene (Jones and Moody, 1993).
Fig. 1 Evaporative cooling system storage facility Fig. 2 The lid made of impereta cylinderica and gap filled with sand

VOL.39 NO.4 2008 AGRICULTURAL MECHANIZATION IN ASIA, AFRICA, AND LATIN AMERICA 77
Temperat u re management is one of the most important factors affecting the quality of fresh pro-duce. There is an optimum storage temperature for all products. The ideal temperature often depends on the geographical origin of the product. Most fruits from tropical regions must be stored above 12 ºC (Jenny, 2000). Another important factor in the storage of fresh fruit and vegetables is the humidity. The relative humidity in storage facil-ity should be kept at 90 to 100 % although maintaining high humidity close to 100% may cause excessive growth of micro-organisms. As the temperature is lowered, the required concentration of oxygen is also reduced. The addition of a few per-cent of carbon dioxide to the storage system can have a marked effect on respiration of the stored product. Hardenburg, et al. (1986) reported that post harvest handling is the final stage in the process of produc-ing high quality fresh produce, thus, the required type of storage could reduce high losses of fresh produce.
Evaporative cooling is a very economical way to store fresh fruits and vegetables in PNG conditions. This method is not very costly and is easy to manage. A well designed evaporative cooler produces air with a relative humidity greater than 90 percent (Thompson, 1996). Its main limitation is that it cools air only to the wet bulb temperature of the out-side air. Quality is an increasingly important factor in the production and marketing of fresh fruits and vegetables. The limit to which an evaporative cooling system can maintain the quality of product is a matter of concern because quality assessment is very subjective and depends on the individual’s view-point and preferences. According to the ISO 1900 standard, quality is defined as the totality of features and characteristics of a product or service that bear on its ability to satisfy stated or implied needs. Kader (1985) defines it for fruits
and vegetables as the combination of attributes or properties that give them value in terms of human food. Eating quality can be assessed most accurately by using taste panels, which consist of a selection of cus-tomers who are trained to assess the quality attribute being examined.
Bakker-Arkema (1999) outlined that the post harvest loss or wastage can be controlled by cultural meth-ods. No post harvest treatments or miracle chemical exist which can overcome inferior quality result-ing from poor production practices or improper handling. Quality and condition of fresh fruits and veg-etables are major factors in market inspector’s determination of grades and standards. Bruising is a major component of these factors. The key to damage reduction is simply TLC, tender loving care (Jenny, 2000). PNG’s post harvest industry has several constraints. Among others, wide economic gaps between farm-ers and businessmen has significant-ly placed a large division among the rich and poor in Papua New Guinea. Information on improved technolo-gies is not usually available to small farmers resulting in non-adoption of profitable practices in PNG.
Materials and Methods The evaporative cooling system
was built inside the screen house of the department of agriculture, Uni-versity of Technology, Lae which has an elevation of 65 m above mean sea level. The screen house had transparent plastic roofing and sidewalls made of arch mesh wire and black shade cloth to allow air ventilation. The experiment was conducted during 2005 when the produce was harvested. The stor-age facility was built with interior and exterior walls made of concrete blocks. The base of the storage was made of concrete and the interior dimensions were such that it had ap-proximately 1 m3 volume. The gap
between the exterior and interior walls was filled with ordinary sand, which was kept wet by spraying water. The dimensions are shown in Fig. 1 and interior in Fig. 2. Six-inch nail size holes were made at the base of the four interior walls for water to seep on the base floor of the storage area. A PVC pipe was laid at the base for draining excess water. There were two shelves made of dressed timber on which baskets full of produce were kept. The roof was made of a timber frame covered with Kunai grass (Imperata cylin-derica) which provided good venti-lation.
The samples of fruits and veg-etables were sprinkled with water and were allowed to cool for two hours before placing them in the basket inside the cooling system. The inside chamber was disinfected before samples were placed inside. The wet and dry bulb thermometers were placed inside and outside the storage structure. The initial weight and subjective measurements were recorded. Temperatures were re-corded at 9:00 AM and 3:00 PM on a daily basis and at 3:00 PM their weight loss and physical changes were recorded until they reached their termination point. Chemi-cal analyses of Vitamin A and C of each of the fruit and vegetable samples were made in the labora-tory before and after the storage in order to compare the vitamin A and C content of the stored samples to that of fresh samples. A regression analysis was made of the cumula-tive weight loss of each of the stored samples. The coefficient and inter-cept values from the analysed data were used to identify the expected shelf life of the samples. Thereafter, these values were substituted in the model, Y = a + bx, to estimate the effect of independent variables on the shelf life of each sample stored. The notations in the model are:
y = expressed in days (product) a = intercept, b = coefficient, and x = independent variable to mea-

AGRICULTURAL MECHANIZATION IN ASIA, AFRICA, AND LATIN AMERICA 2008 VOL.39 NO.478
Day Temper-ature, ºC
Pawpaw,%
Banana,%
Orange, %
Cabbage, %
Broccoli, %
Lettuce, %
1 0 0 0 0 0 0 02 20 0.38 3.3 0 0 6.7 10.63 21 1.9 4.4 10.8 0 10 11.14 22 2.3 4.4 10.8 0 11.7 11.35 23 2.3 5.6 11 1.1 13.3 12.96 24 3.9 5.6 11.5 1.1 15.37 25 4.2 5.6 12.5 2.28 26 5.4 6.7 11 2.29 27 10 3.3
sure.
Results and Discussion Subjective measurements: The
evaporative cooling system, ECS, storage facility gave signif icant results on the storage of perishable fresh fruits and vegetables. The environment, degree of freshness, mode of post harvest handling and bacterial and fungal infections had a significant influence on the shelf life and Vitamin A and C. Each pro-duce sample lost different amounts of weight at different days while in storage (Table 1).
Pawpaw stored well for seven days with a daily percentage weight loss of 0.38, 1.9, 2.3, 3.9, 4.2 and 5.4 %. Bananas were also stored for seven days with a percentage weight loss of 3.3, 4.4 5.6 and 6.7 % and oranges stored for nine days with a relative percentage weight loss of 10.8 % in the third day and 11, 11.5, 12.5, 11,10 and 11 %. Broccoli and lettuce stored well in the ECS storage for only four and five days, respectively. Broccoli had a percent-age weight loss of 0, 6.7, 10, 11.7 and 13.3 % and lettuce had a weight loss of 0, 10.6, 11.1, 11.3, 12.9 and 15.3 %, respectively. Oranges and cabbage stored longer than other produce, which was for Nine days,
(Fig. 3). Regarding the control samples,
banana had a h igh percentage weight loss of 24.4, 28.8 and 33.3 % in the first three days of storage in open air and pawpaw had percent-age weight loss of 1.2, 3.5 and 5.9 %. Oranges stored well for five days with a percentage weight loss of 0, 4, 13, 36, 36 and 39.2 % and cab-bage remained for five days and had a weight loss of 0, 1.2, 1.2, 3.5, 4.7 and 4.7 %. Broccoli and lettuce both
were stored in the open for only two days. Table 2 and Fig. 4 illustrate this argument.
Vitamin A and C analysisChemical analysis of vitamin A
and C were done on the samples stored in the ECS and compared with the samples purchased from the market. The analysis result of β-carotene (μg/100g) of the food sample is given in Table 3 and illus-trated in Fig. 5.
Table 1 Percentage weight loss of fruits and vegetables storedin the evaporative cooling system storage
Day Temper-ature, ºC
Pawpaw,%
Banana,%
Orange, %
Cabbage, %
Broccoli, %
Lettuce, %
0 0 0 0 0 0 0 01 24 1.2 24.4 4 1.2 3.6 13.62 25 3.5 28.8 13 1.2 34.5 30.33 26 5.9 33.3 36 3.54 27 5.9 33.3 36 4.75 28 39.2 4.7
Table 2. Percentage weight loss of fruits andvegetables stored in the open air (control)
% weight loss, gram/day
0
2
4
6
8
10
12
14
16
987654321Days of storage
Paw pawBananaOrange
CabbageBroccoliLettuce
% weight loss, gram/day
0
5
10
15
20
25
30
35
40
543210Days of storage in open air
Paw pawBananaOrange
CabbageBroccoliLettuce
Fig. 3 Percentage weight loss against days of storing Fig. 4 Percentage weight loss of produce againstdays of storing in open air
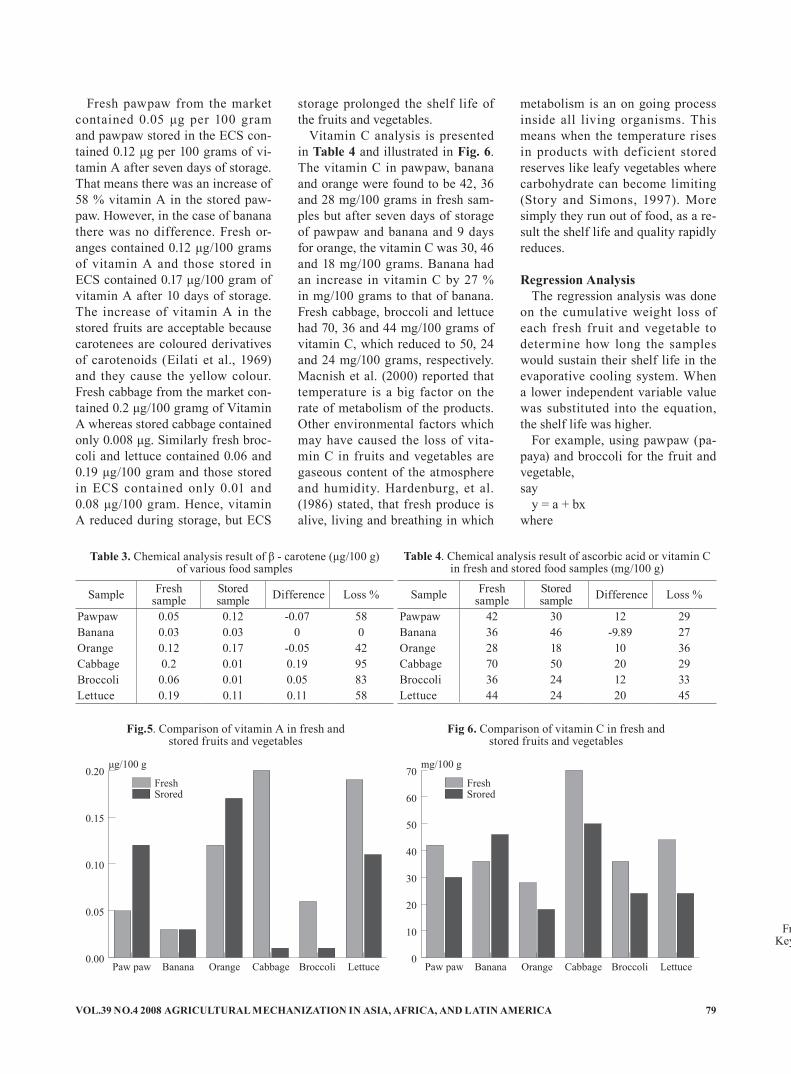
VOL.39 NO.4 2008 AGRICULTURAL MECHANIZATION IN ASIA, AFRICA, AND LATIN AMERICA 79
Sample Fresh sample
Stored sample Difference Loss %
Pawpaw 0.05 0.12 -0.07 58Banana 0.03 0.03 0 0Orange 0.12 0.17 -0.05 42Cabbage 0.2 0.01 0.19 95Broccoli 0.06 0.01 0.05 83Lettuce 0.19 0.11 0.11 58
Sample Fresh sample
Stored sample Difference Loss %
Pawpaw 42 30 12 29Banana 36 46 -9.89 27Orange 28 18 10 36Cabbage 70 50 20 29Broccoli 36 24 12 33Lettuce 44 24 20 45
Table 4. Chemical analysis result of ascorbic acid or vitamin C in fresh and stored food samples (mg/100 g)
Fresh sample(MG)/100g Stored sample (mg)/100g Key: P=pawpaw, B1=banana, O=orange, C-cabbage,
B=broccoli, L=lettuce
Table 3. Chemical analysis result of β - carotene (μg/100 g)of various food samples
Fig.5. Comparison of vitamin A in fresh andstored fruits and vegetables
Fig 6. Comparison of vitamin C in fresh andstored fruits and vegetables
Fresh pawpaw from the market contained 0.05 μg per 100 gram and pawpaw stored in the ECS con-tained 0.12 μg per 100 grams of vi-tamin A after seven days of storage. That means there was an increase of 58 % vitamin A in the stored paw-paw. However, in the case of banana there was no difference. Fresh or-anges contained 0.12 μg/100 grams of vitamin A and those stored in ECS contained 0.17 μg/100 gram of vitamin A after 10 days of storage. The increase of vitamin A in the stored fruits are acceptable because carotenees are coloured derivatives of carotenoids (Eilati et al., 1969) and they cause the yellow colour. Fresh cabbage from the market con-tained 0.2 μg/100 gramg of Vitamin A whereas stored cabbage contained only 0.008 μg. Similarly fresh broc-coli and lettuce contained 0.06 and 0.19 μg/100 gram and those stored in ECS contained only 0.01 and 0.08 μg/100 gram. Hence, vitamin A reduced during storage, but ECS
storage prolonged the shelf life of the fruits and vegetables.
Vitamin C analysis is presented in Table 4 and illustrated in Fig. 6. The vitamin C in pawpaw, banana and orange were found to be 42, 36 and 28 mg/100 grams in fresh sam-ples but after seven days of storage of pawpaw and banana and 9 days for orange, the vitamin C was 30, 46 and 18 mg/100 grams. Banana had an increase in vitamin C by 27 % in mg/100 grams to that of banana. Fresh cabbage, broccoli and lettuce had 70, 36 and 44 mg/100 grams of vitamin C, which reduced to 50, 24 and 24 mg/100 grams, respectively. Macnish et al. (2000) reported that temperature is a big factor on the rate of metabolism of the products. Other environmental factors which may have caused the loss of vita-min C in fruits and vegetables are gaseous content of the atmosphere and humidity. Hardenburg, et al. (1986) stated, that fresh produce is alive, living and breathing in which
metabolism is an on going process inside all living organisms. This means when the temperature rises in products with deficient stored reserves like leafy vegetables where carbohydrate can become limiting (Story and Simons, 1997). More simply they run out of food, as a re-sult the shelf life and quality rapidly reduces.
Regression AnalysisThe regression analysis was done
on the cumulative weight loss of each fresh fruit and vegetable to determine how long the samples would sustain their shelf life in the evaporative cooling system. When a lower independent variable value was substituted into the equation, the shelf life was higher.
For example, using pawpaw (pa-paya) and broccoli for the fruit and vegetable, say
y = a + bx where
μg/100 g
0.00
0.05
0.10
0.15
0.20
Stored
Fresh
LettuceBroccoliCabbageOrangeBananaPaw paw
FreshSrored
mg/100 g
0
10
20
30
40
50
60
70
Stored
Fresh
LettuceBroccoliCabbageOrangeBananaPaw paw
FreshSrored

AGRICULTURAL MECHANIZATION IN ASIA, AFRICA, AND LATIN AMERICA 2008 VOL.39 NO.480
y = 7 days (papaya)a = 0.05b = 0.34, then x was found to be
20 Substituting this value in the
equation y = 0.34(20) + 0.05 = 7 this means the produce remained fresh for seven days with a temperature is 23 ºC. Similarly, for broccoli when the temperature was 28 ºC, y = 0.34(28) + 0.05 = 9.57 and for Y =4 days, a =95, b = −50 and x was 1.82. By substituting this value of x, y = 4. Hence, the shelf life determined from values obtained from regres-sion analysis coincided with those recorded number of days from the experiment.
Conclusions The evaporative cooling system
facility successfully sustained the shelf life of the fresh fruits and vegetables for a prolonged period of time compared to the control, i.e. stored outside. The most important factors that control the shelf life in the lowlands of Papua New Guinea were the temperature and relative humidity. The vitamin A and C in the fruits and vegetables can remain intact for a longer period of time if they are stored in the evaporative cooling system.
Recommendations 1. The evaporative cooling system
of storage especially for fruits and vegetables should be propa-gated in the coastal areas of Papua New Guinea.
2. As there is no energy require-ment in this system, it is most suitable in the rural areas where
there is no electricity. 3. This technology translated into
a larger volumetric capacity can provide storage security for fruits and vegetables at commu-nity level.
REFERENCES
Bakker-Arkema, F. W. 1999. CIGR. Hand book of Agricultural En-gineering. Agro-processing and Engineering. The Society for Engineering in Agricultural food and biological systems, 2950 Niles Rood, St Joseph MI 49085-9659 USA.
Debney, H. G. et al., 1980. Handing and storage practices for fresh fruits and vegetables -product manual. Br ishane, Aust ralia. Australian United for fresh fruit and vegetable Association (C/O Committee of Direction of Fruit Marketing).
Eilati, S. K, S. P. Monselize, and P. Budowski. 1969. Seasonal De-velopment of External color and carotenoid content in the peel of ripening, “Snamouti” orange. Westport. USA.
FAO, Database. 1988. Food loss Prevention in Perishable Crops. FAO Agriculture Service, Bul, 43, United Nations Food and Agricul-ture Organization, Rome, Italy.
Friedman, B. A. 1960. Market dis-eases of Fresh fruits and vegeta-bles, Department of Agriculture and Hortic. University of Bristol, Long Ashton Research Station. England.
Hardenburg Robert, E., A. E. Wat-ada, and C. Y. Wang. 1986. The Commercial Storage of Fruits and Vegetables, and Florist and Nurs-ery stocks. US Department of Ag-
riculture, Agriculture Handbook - 66-16.
Irving, A. R. 1984. Transport of horticultural produce under modi-fied atmospheres Food Research Department of Hortic., College of Agriculture, Alexandria Univer-sity, Shatbi, Alexandria, Egypt.
Janet Bachmann and Richard Ear-les. 2000. Post harvest handling of fruits and vegetables. ATTRA - National Sustainable Agriculture Information Service, Fayetteville, AR. 72702.
Jenny Jobling 2000. Correct Cool Chain management is essential for all fruit and vegetables. Sydeny @http://www.postharvest. com.au/
Jones, R. and H. Moddy 1993. Ag-mendia, Department of Agricul-ture Victoria, East Melbourne, Australia.
Kader, Adel. A., Robert. F. Kashmir, F. Gorden Mitchell, Michael S. Reid, Noel F. Sommer, and James F. Thompson. 1985. Post Har-vest Technology of Horticultural Crops. Division of Agriculture and Natural Resources. University of California, Berkely. P 139-143.
Kalman Peleg. 1985. Produce Han-dling, Packaging and Distribution. Department of Agriculture Engi-neering Technion, Israel Institute of Agriculture.
Macnish, A., D. Joyce, P. Hofman, and D. Simons. 2000. Fruit, veg-etable and fresh produce storage expert system. SCIRO Publishing, Collingwood Vic, Australia.
Story, A. and D. H. Simons. 1997. Fresh produce manual. Australian United Fresh fruit and Vegetables Association, Ltd, Sydney Austra-lia.
Thompson, A. K. 1996. Post harvest Technology of fruit and vegeta-bles. Oxford. Blackwell UK.
■■
VOL.39 NO.4 2008 AGRICULTURAL MECHANIZATION IN ASIA, AFRICA, AND LATIN AMERICA 81
Annual Costs of Mechanizing With Tractors inTanzania
AbstractThe level of utilization and an-
nual costs of using 2WD and 4WD tractors under Tanzanian condi-tions were investigated using data collected from large-scale farms. The results showed- that the mean annual level of utilization of 2WD tractors was 880 hours, whilst the annual use of 4WD tractors was 640 hours. The predicted minimum annual cost of 2WD tractor utilized for 1000 hours per year was Tshs. 15,000/= per hour and for the same annual use for 4WD tractors was Tshs 23,000/= per hour. These val-ues were found to be 1.1 to 1.6 times higher than the minimum values of using a tractor in Germany.
IntroductionAgriculture in Tanzania is es-
sentially rain-fed because less than 4 % of the cultivated land is under irrigation (Kalinga, 2001). However rainfall seasons in many places are characterised to be short. This ne-cessitates that the completion of key farming tasks such as ploughing, planting and weeding to be carried out in a short time span. When us-ing hand tool technology to accom-plish these tasks only a small area of less than one ha can be handled.
Tanzania has a big potent ial in terms of available arable land (MALDC, 1991). In order for the country to use her agricultural potential, there is a need to ex-pand and improve mechanised agriculture at all levels of power application. However, agricultural mechanisation with tractors has been a controversial issue. On one hand, there is no question about the need for higher agricultural pro-duction through the increased use of mechanical power. On the other hand, the contribution of mechani-cal power in agricultural production has been observed by Tanzanian agricultural planners (mainly econ-omists) to be unreliable, costly and inefficient. These observations have caused the government in the past to adopt cautious policies regard-ing the promotion of this technol-ogy. However, when examining the
green revolution that has turned Asian countries from importers of food to exporters (IITA, 1992; An-derson, 1992), a number of reasons have been advanced for the change. Amongst other things, the increased utilisation of tractors has played an important role. The statistical data on tractor use in Asian countries in the last 50 years (Table 1) shows that the number of tractors in use in India has increased from less than 10,000 in 1950 to more than 1.4 mil-lion in 1997. Asian farmers would not be buying these tractors if they were not using them economically and making profit.
Additionally, the increase of rural to urban migration is found to be critical to the change. In Tanzania, urban population is increasing at a rate of 6.9 % per annum and dou-bling every 10 to 12 years (IBRD 2000). Since the urban dwellers rely
Year India Malaysia Morocco Tanzania1950 9,0001960 31,000 1,5001970 148,000 7,776 24,684 17,0001980 393,000 12,500 32,000 15,8981990 1,063,012 26,000 39,155 6,0001995 1,400,000 43,295 41,000 7,0001997 1,450,000 43,300 43,226 7,600
Table 1 Growth of tractor population used for agriculturalproduction in different countries (1950-1997)
bySylvester MpandujiDept. of Agricultural Engineeringand Land Planning,Sokoine University of Agriculture,P.O Box 3003, MorogoroTANZANIA
Baanda SalimDept. of Agricultural Engineeringand Land Planning,Sokoine University of Agriculture,P.O Box 3003, MorogoroTANZANIA
Source: FAO Production Year Books 1958-1997

AGRICULTURAL MECHANIZATION IN ASIA, AFRICA, AND LATIN AMERICA 2008 VOL.39 NO.482
on food supply from rural areas, this increases the pressure on the rural areas to produce even more food. However, it is the educated and young people who migrate from ru-ral to urban areas to liberate them-selves from the drudgery associated with the hand-tool technology ag-riculture leaving aged people in the villages. Data collected in 1990 in Tanzania shows that more than 50 % of heads of rural households are 45 years old or above (URT, 1992). For a country with a life expectancy of 42 years (IBRD 2000), it is in-deed facing the problem of aged rural population. The older people remaining in the rural areas cannot be expected to increase the agricul-tural productivity for the country.
According to the recommenda-tion of the World Bank, (1994), an average income of about 70 times the present annual income is needed for a family of six people in order to have their basic requirements cov-ered. All that money has to come from the farmers pocket regardless of the government contribution in social services. In that case, the farmer has to cultivate an estimated area of about 30 hectares per year for subsistence and for family devel-opment needs. A farm of that size cannot be cultivated by use of hand hoes or draft animals when using family labour. The use of animal draft technology and hired labour
for such an area will be too expen-sive. The only way to handle such an area is to use a tractor; either own or hire.
Considering all the mentioned cases, it is obvious that the area under-cultivation in Tanzania could be increased substantially if tractor technology were encouraged and promoted by the government. The user of the technology cannot be the small-scale peasant farmer who is aged as we have seen. These must be the young and educated people who can perform agricultural activi-ties as medium scale commercial farmers. This argument is also in agreement with the Tanzania Vi-sion Agriculture 2025 (URT, 1999), which states that, if agriculture in Tanzania is to be expanded, the current farming community (80 % of the population) needs to change from small peasant dominated farm-ers to commercial medium scale holder farmers.
Tractor technology is considered inappropriate in Tanzania because very subjective criteria are used to decide when and how to operate a tractor profitably. There is no data published indicating the required level of tractor utilisation in terms of hours per year or minimum farm sizes required to be cultivated per year. Additionally, the annual costs of owning and using tractors are unknown and information on how
farmers can best minimise the costs in Tanzania is unavailable. Had this information been available, the users of tractor technology could be advised accordingly based on objective facts that could help them increase the probability of utilising the technology profitably. This pa-per, therefore, intends to minimize some of the said problems.
Objectives of The StudyThe main objective of this study
was to provide the costs information for tractor use under Tanzanian con-ditions necessary for good decision management.
The specif ic objectives of the study were:
1. To determine the average level of tractors utilization in Tanza-nia.
2. To determine annual costs of 2WD and 4WD tractors for dif-ferent levels of utilisation
3. To suggest some measures to be used to reduce the annual cost of tractors.
Materials and MethodsData for this study were collected
from large-scale farms, namely Tan-ganyika Planting Company, Mringa Estate, Tanganyika Wattle Compa-
Fig. 2 Annual costs of 4WD tractors atdifferent levels of utilization
Fig. 1 Annual costs of 2WD tractors atdifferent levels of utilization

VOL.39 NO.4 2008 AGRICULTURAL MECHANIZATION IN ASIA, AFRICA, AND LATIN AMERICA 83
ny, Mwera Sisal Estate and Mtibwa farms. Data were obtained from companies’ records and files. The data collected include tractor type, model, power, initial purchase price and tractor use in terms of hours.
In total, data for 108 tractors were collected of which 2WD tractors were 83 and the remaining trac-tors were 4WD. The tractor types include Massey Ferguson, Ford and Case International. Other secondary data included bank interest rates, inflation rates, price of fuel and la-bour costs that were obtained from secondary sources.
The annual tractor use was re-corded as the performance of the tractor in hours. The annual per-formance was obtained by adding the recorded monthly tractor hours for each year under the study. In case the level of perfomance was not recorded, the estimation method was used for determination of the values The method used was either by dividing the total quantity of fuel consumed in that year with the stan-dard amount of fuel consumption of the tractor or by the average use of the tractors in the same group. It was difficult to get the exact hours of use for each separate activities carried out by the tractor because the available recorded data were for all activities done by tractors in a month.
All costs involved in the analysis were adjusted to the base year of 2002 to remove the effect of the in-flation. The real Tanzanian shillings were converted to actual Tanzanian shillings by multiplying by the fac-tor (1 + if1)(1 + if2)(1 + if3) ........(1 + ifn) for all costs before 2002 and by a deflation factor 1 / [(1 + if1)(1 + if2)(1 + if3) ........(1 + ifn)] for cost obtained
after 2002 as suggested by Morrris (1988). The year 2002 was chosen as a base year because this research work was carried out in that year.
The equation developed by Wit-ney and Saadoun (1989) was used to analyse the annual ownership cost of the tractor. However the equation was modified to include the annual costs of labour, fuel and oil. The tax component was eliminated from the equation because, in Tanzania, tractors are not directly charged tax. The final form of the equation used for determination of annual owner-ship costs was expressed as:
NAt = ∑ NPVm + NPVr − NPVs + Fc n=1
+ Co + CL
where, At = Annual ownership costNPVm = Annual repayment of
loan capital and interest NPVr = Annual repair costs and
insurance chargesNPVs = Income from selling the
tractorFc = Annual fuel costCo = Annual oil costCL = nnual labour costThe repair costs models for 2WD
and 4WD tractors developed by Mpanduji et al. (2001) were used to determine the repair costs. The resale function developed by Wit-ney and Soadoun (1989) was used for determination of salvage values because it fits more to the Tanzania situation. The bank rates used in the calculation were 10 % for the invest-ment interest rate and 22 % for the loan interest rate. The 9 % inflation rate was also used as this was the average inflation rate at the time of analysis. To simplfy the analysis, a computer software programme was developed using a quick basic lan-
guage (Q-basic).
Results and DiscussionLevel of Utilization
Table 2 shows the results of the annual tractor utilization levels in Tanzania. The level of utilization ranges from 550 hours to 1100 hours per year per tractor. These results show that the levels of utilization differ little when compared to the levels of utilization reported in other African countries. In Nigeria, for example, Kolawole (1974) reported that the annual utilization of gov-ernment tractors (hire services) was about 500 hours, while the annual use of privately owned tractors was about 786 hours.
The mean annual level of utiliza-tion of two wheel drive (2WD) trac-tors was about 880 hours per trac-tor. The average annual use of four wheel drive tractors was 640 hours. This showed that 2WD tractors were utilized more than 4WD tractors under large scale farm ownership in Tanzania. This was attributed to the fact that 2WD tractors under large scale ownership were regarded as multipurpose tractors, therefore, they were assigned frequently into a range of activities, that included ploughing, spraying, planting, and transportation, whereas the 4WD tractors were regarded as special tractors. Thus, 4WD tractors were restricted only to heavy-duty tasks, such as uprooting, sub-soiling and ploughing. On the other hand, 4WD t ractors were bigger machines than 2WD tractors, therefore, they tended to accomplish their tasks at a faster rate than their counterpart 2WD tractors. This idea is also in
Tractor group Unit Range of annual use, h
Mean annual use, h
2 WD 83 700-1,100 8804 WD 25 550-700 640
Tractor type Average tractor power, kW Purchase price, Tshs
2 WD 60 31,000,000.004 WD 90 48,000,000.00
Table 2 Annual utilization levels of tractors in Tanzania Table 3 Average purchase price of tractors in Tanzania
Note: US$ 1 = Tshs 1,020
AGRICULTURAL MECHANIZATION IN ASIA, AFRICA, AND LATIN AMERICA 2008 VOL.39 NO.484
line with the trend in agriculture in USA, where farmers tend to own bigger farms than before and use bigger 4WD tractors to complete all agricultural activities in less time.
Annual costs of tractorsThe results of the analysis of the
annual ownership cost per hour at different ownership periods were carried out for three different levels of utilization, namely, an annual use of 500, 1000 and 1200 hours. These levels were chosen because tractors in Tanzania were found to operate within these ranges (Table 2). The ownership period of tractors was considered to be to 19 years. The choice of the period was based on the information obtained from the field survey because, during data collection, it was found that some tractors had been in operation for that period. The average purchase price of the 2WD and 4WD tractors are as shown in Table 3. The dif-ference in prices were mainly influ-enced by the average power of the tractors rather than by the tractor makes.
The results of the analysis of the annual ownership cost per hour at different ownership periods for both 2WD and 4WD tractors are shown in Table 4. These results were then plotted in Fig. 1 for 2WD tractors and in Fig. 2 for 4WD tractors. The Figures demonstrate that the annual ownership costs of different trac-tors declined rapidly in the first few years but after some time the annual cost curves became f latter. When the ownership period was extended further, the total cost curves in-crease with the increased of tractor age. This kind of trend was a typi-cal result of the annual ownership costs one could expect (Herderson and Guericke,1985: Witney and Saadoun, 1989). In the early life, tractors usually experienced a de-crease in capital costs. Whereas in later stages, when the curve was on the increase, tractors were generally suffering from the increase in repair
costs due high rate of wear and tear.The results of the annual costs at
different levels of utilisation indi-cated that 2WD tractors with annual use of 500 hours have higher annual cost than 2WD tractors performing about 1000 or 1200 hours annually. However, in the case of 4WD trac-tors, the results in Figure 2 show that the annual cost of tractors used for 500 hours per year was higher within the first 10 years of owner-ship than that of tractors used for 1000 or 1200 hours. Above 10 years of ownership, 4WD tractors with annual usage of 1200 hours were found to have higher annual costs followed by tractors used for 1000 hours.
The increase of annual use from 1000 hours to 1200 hours for the tractors in the first few years of ownership decrease the annual costs. However, the decrease in cost is small with a maximum decrease of about 11 %. At later stages of tractor ownership the annual costs of tractors operated for 1200 hours per year tended to increase more
than tractors with annual usage of 1000 hours.
Therefore, these results suggested that it is more economical for most of the 2WD tractors to be used an-nually at average hours between 1000 and 1200 than to be operated below that figure. Whereas in the case of 4WD tractors it is more eco-nomical to be operated at an aver-age annual use of about 500 hours if the tractor owner intends to use the tractor for more than 10 years. But otherwise it was economical to operate the tractor at 1200 hours for 5 years of ownership and it was recommended that the tractor be utilized for 1000 hours if the owner intends to use the tractor for 10 years.
The result of the annual costs of 2WD tractors indicates that the minimum annual cost of these trac-tors is about Tshs 15,000 per hour if the tractor will be used for 1000 hours per year. The minimum an-nual ownership cost of 4WD trac-tors is about Tshs 25,000 per hour for 500 hours annual utilization and
Period of ownership
(year)
Annual hours of use of 2WD Annual hours of use of 4WD
500 h 1000 h 1200 h 500 h 1000 h 1200 h
1 27,911.25 17,055.90 15,315.30 44,402.85 26,192.70 23,182.202 24,882.30 15,856.20 14,449.95 38,550.60 23,472.45 21,060.003 23,192.10 15,271.65 14,116.95 35,125.65 22,107.60 20,167.654 21,969.90 14,890.50 13,849.20 32,667.30 21,370.50 19,901.705 21,014.10 14,620.50 13,710.15 30,801.60 21,074.85 20,102.856 20,239.20 14,425.20 13,626.45 29,355.75 21,132.90 20,700.907 19,597.50 14,283.90 13,581.45 28,229.85 21,493.35 21,652.658 19,057.95 14,182.65 13,566.15 27,357.75 22,122.45 22,928.409 18,598.50 14,113.35 13,572.90 26,690.85 22,995.90 24,506.5510 18,203.40 14,067.90 13,596.75 26,194.05 24,094.80 26,372.2511 17,860.05 14,041.80 13,633.20 25,843.05 25,404.30 28,510.6512 17,559.45 14,031.00 13,680.90 25,616.25 26,914.95 30,912.3013 17,294.85 14,031.90 13,735.35 25,498.80 28,614.60 33,567.7514 17,059.05 14,042.70 13,795.65 25,477.20 30,496.50 36,471.6015 16,848.00 14,062.05 13,860.90 25,542.00 32,555.25 39,614.4016 16,658.10 14,085.90 13,929.30 25,686.45 34,785.45 42,993.4517 16,485.75 14,116.05 14,000.40 25,901.10 37,180.35 46,602.0018 16,328.25 14,149.35 14,072.85 26,181.90 39,737.25 50,434.6519 16,185.15 14,186.70 14,146.65 26,524.80 42,452.10 54,490.05
Table 4. Annual ownership costs (Tshs/hour) of 2WD and4WD tractors at different period of ownership
VOL.39 NO.4 2008 AGRICULTURAL MECHANIZATION IN ASIA, AFRICA, AND LATIN AMERICA 85
Tshs 23,000 per hour for 1000 hours of annual use. The explanation for the difference in annual cost per hour between these two groups of tractors could be explained by the difference in the initial purchase price and repair costs regime of the tractor concerned.
The comparison of the minimum values of annual ownership costs established in this study with the annual costs of owning tractors in Germany (Table 4) showed that the annual cost of using tractors in Tanzania was higher by almost 1.1 to 1.6 times the annual costs in Ger-many.
Measures to Reduce Annual Own-ership Cost of Tractors in Tanzania
As per Table 4, it can be con-cluded that the annual costs of own-ing and using tractors in Tanzania are higher than those of a developed country. These costs can however be reduced if necessary measures can be taken by Tanzanian farmers. The measures include the possibility of using tractors of low initial pur-chase price, reducing repair costs of the tractors and avoiding unecessary ownership of the tractor after the optimum period of use.
The purchase price of the tractor has a significant effect on the annual cost. If this can be reduced then the annual ownership cost of the tractor can also be substantially decreased. In Tanzania, this can be achieved by the use of imported second hand tractors. In Morocco for example, where the mechanisation degree is still low like that of Tanzania, a considerable number of second hand tractors are used for agricultural
activities (Bourarach et al., 1999). More than 50 % of the estimated 43,000 tractor units in Morocco are imported second hand tractors. Their experience with these tractors has shown that even though modi-fications on the imported second hand tractors are carried-out at the beginning, the purchase costs of second hand tractors are far below the purchase price of the new trac-tors. This idea is also supported by Ward (1990) who suggested that second hand tractors of less than 4 years are the best option for farmers with annual use of about 400 to 900 hours.
Reducing repair costs of the trac-tor can also be another feasible mea-sure to decrease the annual costs of ownership. Actual repair costs can be reduced by maintaining a tractor carefully. This could be achieved by employing educated and well trained tractor operators in the field of tractor operations, service and maintenance. Currently in Tanza-nia, this is not the case (Mpanduji, 2000).
Another important method, which can be used to reduce the owner-ship costs is that of replacing a tractor within the optimum period of ownership. Operating a tractor above this point results in unneces-sarily additional costs that make agricultural mechanization with a tractor unattractive. As far as this study is concern, 2WD tractors used annually for 1000 hours are recom-mended to be replaced at the age of 8 years, whereas 4WD tractors are recommended to be replaced at the age of 14 years if the annual use is 500 hours. Otherwise it is very im-portant to establish the optimum re-placement time of a machine once it is bought, as there are other factors that need to be taken into account.
Conclusion and Recom-mendation
The level of utilization and annual
costs of using 2WD and 4WD trac-tors under Tanzanian condition were investigated. In total, data for 108 tractors were collected from large-scale farms. Of the data collected, 2WD tractors were 83 and the re-maining 25 tractors were 4WD. The average power rating of the 2WD tractors was 60 kW and 89 kW for the 4WD tractors.
The results showed that the level of annual tractor utilization ranged from 550 to 1100 hours. The mean annual level of utilization of 2WD tractor was 880 hours, whereas for 4WD tractor was 640 hours.
The results of the annual costs at different levels of utilisation indi-cated that 2WD tractors with annual use of 500 hours had higher annual cost than 2WD tractors performing about 1000 or 1200 hours annu-ally. However, in the case of 4WD tractors the results showed that the annual cost of tractors used for 500 hours per year was higher within the first 10 years of ownership than that of tractors used for 1000 or 1200 hours. Above 10 years of ownership, 4WD tractors with annual usage of 1200 hours were found to have high annual costs followed by tractors used for 1000 hours.
The 2WD tractor utilized for 1000 hours per year had a minimum an-nual cost of Tshs 15,000/= per hour. The minimum annual ownership cost of 4WD tractors were Tshs 25,000/= per hour for 500 hours uti-lization and Tshs 23,000/= per hour for 1000 hours of annual use and costs about Tshs. 42,000 per hour to own an 18 year old 4WD tractor.
The comparison of the minimum values of annual ownership costs established in this study with the annual costs of owning tractors in Germany showed that the annual costs of using tractors in Tanzania was higher by almost 1.1 to 1.6 times the minimum annual costs of owning tractors in Germany.
The annual costs in Tanzania could be significantly reduced if the initial purchase price of the tractor
Tractor type Tanzania Germany2WD
(60-74 kW)15,000/= 9,300/=
4WD(75-92 kW)
23,000/= 19,500/=
Table 5 Comparison of annual owner-ship costs of tractors in Germany and Tanzania
Source of Germany data: KTBL, 1999/2000
AGRICULTURAL MECHANIZATION IN ASIA, AFRICA, AND LATIN AMERICA 2008 VOL.39 NO.486
could be reduced, mainly by the use of second hand imported tractors, and through the use of trained trac-tor operators. Another measure sug-gested to reduce the cost is that of using a tractor only up to optimum period of ownership.
REFERENCES
Anderson, J. R. 1992. Difficulties in African agricultural systems enhancement? Ten hypotheses in agricultural systems 38, pp 387-409.
Bourarach, H., H. Baali, and H. Reijmil. 1999. The importation of second hand tractors in Morocco. VDI prospectus pp. 347-350.
FAO. 1958-1997. Production year books, Rome Italy, Vol. 12 (1958); Vol. 19 (1965); Vol. 25 (1971); Vol. 40 (1986); Vol. 45 (1990) Vol. 49 (1995); Vol. 51 (1997).
Henderson, H. D. and W. Guericke. 1985. Economics of tractor opera-tion in Swaziland. Agricultural Mechanization in Asia, Africa and Latin America 16(4) pp. 11-17.
IBRD. 2000. Sub-Sahara Africa: From crisis to sustainable devel-opment. A long term perspective. The World Bank Washington D.C.
IITA. 1992. Sustainable food pro-duction in Sub-Sahara Africa. IITA’s contribution. IITA Oyo Road Ibadan, Nigeria, pp 195.
Kalinga, G. 2001. Irrigation devel-opment plan. Irrigated Agriculture for Food Security and Poverty Eradication. Conference docu-ment.
Kolawole, M. I. 1974. Economic as-pects of private tractor operation in the Savannah zone of Western Nigeria. Journal of Agricultural Engineering Research 19(4) pp. 401-410.
KTBL. 1999/2000. Taschen Land-wirtschaft. Daten fuer die Be-triebskalkulation in der Land-wirtschaft, Darmstadt Germany pp. 12.
MALDC. 1991. National agricul-tural mechanization programme. Agricultural Planning and Mar-keting Division, Ministry of Ag-riculture, Livestock Development and Co-operatives, Dar es Salaam Tanzania.
Morris, J. 1988. Estimation of trac-tor repair and maintenance costs. Journal of Agricultural Engineer-ing Research, Vol. 41, pp. 191- 200.
Mpanduji, S. M. 2000. Repair costs of tractors and comparison of
mechanization strategies under Tanzanian conditions.
Mpanduji, S. M., G. Wendl, H. O. Dihenga, and E. L. Lazaro. 2001. Investigation on tractor repair costs under Tanzanian conditions. Agricultural mechanization in Asia, Africa and Latin America 32(4) pp. 71-75.
Mrema, G. C. and M. Y. Mrema. 1993. Draught animal technology and agricultural mechanization in Africa; Its potential role and con-straints. NAMA Newsletter Vol. 1 No. 2 pp 12-33.
URT. 1999. United Republic of Tanzania. Tanzania development vision 2025, Dar es Salaam Tan-zania.
Ward, S. M. 1990. Tractor owner-ship costs. Agricultural Mechani-zation in Asia, Africa and Latin America 21(1).
Witney, B. D. and T. Saadoun. 1989. Annual costs of farm machinery ownership. Journal of Agricul-tural Engineers pp 3-11.
World Bank. 1994. Adjustment in Africa; reforms, results and the Road ahead. World Bank policy research report, Oxford Univer-sity Press.
■■
VOL.39 NO.4 2008 AGRICULTURAL MECHANIZATION IN ASIA, AFRICA, AND LATIN AMERICA 87
570Tractor in Gedarif Rainfed Agriculture Eastern Sudan:
Lotfie A. Yousif, Agric. Engineering Researcher, Agric. Re-search and Technology Corporation Gedarif Res. Station Gedarif, Sudan; El Hag H. Shanto, Faculty of Agric. and En-vironmental sciences University of Gedarif, Gedarif; Rehab M. Rehan, same; Hanan I. Adam, same.
I: Current Condition, Utilization and Failure: This research work aiming at highlighting on farm tractors been used in rainfed agriculture in Gedarif area, Eastern Sudan. With special considerations to tractors make, age, usage, performance, failure and repair. A questionnaire was conducted during the 2004/2005 growing season. Seventy farmers and tractor-owners were surveyed. Trac-tor of Massey Ferguson and Ford makes were the most used tractors in the rainfed agriculture Eastern Sudan. More than fifty percent of the studied tractors were over ten years old and their current condition is below the av-erage. Tractor rehabilitation and replacement strategies are required. All tractors use drawbar power, few of them (11%) use hydraulic power and 25% use PTO. More dif-ferent implements are needed to promote tractor use effi-ciency. Seventy one percent of the tractors have different levels of break and failure. Most of the tractors repair and maintenance (71.5%) were carried out at Gedarif town and the repairing and maintenance takes many hours. The establishment of workshops and services centers near the farmer fields can save time. Spare part represents the major factor causing defect and restricts repair and maintenance. The availability of genuine spare parts at suitable cost is of great necessity. The majority of tractor drivers (96%) either illiterate or has primary education only. Educated and well-trained or skilled operators are required for efficient and safety use of tractors.
II: Repair and Spare Parts: The purpose of this re-search is to assess farm tractor being used in the rainfed area Eastern Sudan regarding repair and spare part. Two questionnaires were conducted during the 2004/2005 growing season. Forty-five persons of tractor servicemen specialist were asked about most common repair that had been done to the tractor operating system. On the other hand, 30 of spare part traders were asked about the avail-able spare part (type, makes and specifications) in their shops. In addition, they were asked about the rate and methods of sale as well as factors affecting spare part availability.
Results showed that, tractors of Massey Ferguson and Ford make were the most used tractors in the rainfed ag-riculture in Eastern Sudan. Both tractors makes received different levels of repair at different parts. Regardless of tractor make, these repairs were at Engine, Transmission
ABSTRACTSThe ABSTRACTS pages is to introduce the abstracts of the article which cannot be published in
whole contents owing to the limited publication space and so many contributions to AMA. The readers who wish to know the contents of the article more in detail are kindly requested to contact the authors.
system, Fuel pump, Atomizer, Magneto, Starter and Tire. The most troublesome parts in the engine were rings, crankshaft and piston.
The majority of the available spare parts were of com-mercial type (not genuine), and the customers have ten-dency to bay second hand type. Lack of money is the major factor restricting availability of spare parts that followed by technical and management factors. Genuine spare parts of different makes at reasonable cost are re-quired. Technical information and communication facili-ties are required to secure stable flow and rapid arrival of spare parts.
602Development and Evaluation of a Self-Feeding Wire
Loop Type Thresher for Rice: B. C.Parida, Principal Scien-tist Engineering, Division Central Rice Research Institute Cuttack, Orissa India
Mechanical threshers are widely being used for thresh-ing of paddy in eastern India, specifically Orissa. The small farmers are using pedal threshers where as farmers having electrical facility are using motorized threshers. In both the cases cleaning of grain is done separately with the help of a winnower or manually in front of a blowing wind. Of late axial flow threshers run by electric motor or tractor are being accepted as they carry out threshing and cleaning operations simultaneously. But the problem with axial flow thresher is that they cut the straw into pieces making it difficult to store. In eastern India paddy straw is used for roof thatching and for animal feed. Hence the rice straw has much economic importance in this part of the country. A need was felt for a thresher that can thresh, clean and keep the straw intact. A self feeding power thresher for rice was developed at Central Rice Research Institute, Cuttack, India which is powered by two small single phase electric motors that can do the job of thresh-ing and cleaning simultaneously. The machine keeps the straw intact so that it can be used for roof thatching, cattle feed or can be heaped for storage. The capacity of self-feeding thresher is 193 kg/hour. It requires one per-son to operate the machine. The cost of operation of the machine is $0.36/ quintal of clean rice.
611Deveopment of a Pedal Pump: Toufiq Iqbal, Dept. of
Agronomy and Agricultural Extension Faculty of Agricul-ture University of Rajshahi, Rajshahi-6205 Bangladesh.
A Pedal pump was developed in a local workshop. Two pistons of an ordinary two-cylinder treadle pump were connected with a crankshaft having a flywheel on one end and a chain sprocket on the other. The crankshaft is

AGRICULTURAL MECHANIZATION IN ASIA, AFRICA, AND LATIN AMERICA 2008 VOL.39 NO.488
powered through a chain sprocket from the pedal of the bicycle and is rotated by the foot of the operator seating on the seat. The discharge of the designed pedal pump is between 60 to 100 liters per minute, average command area is 0.50 acre for 8 hours per day operation, and it can lift water from seven-meter depth. The pedal pump was also used for lifting surface water.
619Design and Development of Hand Operated Lac
Grader: N. Prasad, Senior Scientist, Indian Lac Research Institute, Namkum, Ranchi-834010 (Jharkhand), India; B. Baboo, Director, same; S. K. Pandey, Scientist, same.
Lac encrustation separated from harvested lac crop is known as sticklac. It contains impurities and foreign mat-ters, which are removed up to a large extent in primary processing of lac. The primary processing of lac involves five major unit operations i. e. crushing, washing, dry-ing, winnowing and grading. Lac grading is an important unit operation, which is carried out at different stages i. e. before crushing, after crushing and after and after win-nowing. In small lac factories grading is mostly done by women using sieves. A woman labourer using bamboo tray (soop) and sieve, winnows and grades up to 150 kg lac in a day. In large lac processing units, grading before and after crushing is done with the help of power operat-ed sieves. However, winnowing and grading after drying is done by women labourers. The manual lac grading is a slow and tedious process. In order to improve lac grading capacity and to reduce the drudgery of women labourers, a Hand Operated Lac Grader was designed and devel-oped. The developed grader consists of a feed hopper, a fluted roller type positive feeding mechanism, a cranking mechanism, set of serves, drive mechanism and machine frame. Only one person was required to operate the grader. The developed grader was tested useing Kusmi sticklac using 10 and 30 mesh sieve-set. The capacity of the grader was found to be 50 kg/hr. The efficiencies of the 10 and 30 mesh sieves were found to be 94.8 and 86.4 per cent respectively. The grader was found useful for lac grading before and after crushing and after winnowing in primary processing of lac.
620Performance Evaluation of Self Propelled High Clear-
ance Sprayer: T. Senthilkumar, Asst. Prof., KVK, Vamban Pudukkottai - 622 303, India; R. Manian, Professor, Dept. of Farm Machinery, AEC & RI, TNAU, Coimbatore -641 003; K.Kathirvel, Professor, same.
At present to control insects and pests, insecticides and pesticides are being applied by manually operated knapsack sprayers and tractor mounted sprayers. The use of manually operated sprayer is hazardous and tiresome, in addition to non-uniform spray and low output. A self propelled high clearance sprayer was tested for spraying
cotton and sugarcane crops at laboratory level for its per-formance. To evaluate the high clearance sprayer the pa-rameters like discharge rate, spray distribution pattern are measured using experimental setup. The discharge rate of the single nozzle in the boom was tested for pressure range of 5 to 20 ksc at an interval of 5 ksc. The sprayer was tested at different pressure levels of 5, 10, 15 and 20 kg/cm2 with the engine rpm varies from 500 to 1000 rpm in steps of 100 rpm. A patternator was used to find out the spray distribution pattern. From the study conducted the following specific conclusions were made. The dis-charge rate increases with increasing pressure for all the engine speed. The maximum discharge obtained for 1000 rpm at 20 ksc pressure was 44.04 l/hr. The deposition of spray fluid was maximum at centre of the patternator and decreasing from the centre to the outer ends of the pattern. The height of operation the height increased to 40 & 50 cm the non uniformity of spray distribution pat-tern was obtained. The maximum uniformity coefficient of 86.17 % was obtained at 30 cm operating height with the operating pressure of 10 ksc. The engine speed at 800 rpm was recorded maximum uniformity of 72.87 %. The best combination of engine speed of 800 rpm and the op-erating pressure at 10 ksc gives maximum uniformity of spray distribution.
621Effect of Blade and Operational Parameters on Ener-
gy Requirement to Shred Cotton Stalks in Experimental Cotton Stalk Shredder: T. Senthilkumar, Asst. Prof., KVK, Vamban Pudukkottai - 622 303, India; R. Manian, Professor, Dept. of Farm Machinery, AEC & RI TNAU, Coimbatore - 641 003; K. Kathirvel, Professor, same.
The influence of the selected level of variables of three levels of number of blades viz. 2, 3 and 4, four levels of peripheral velocity viz. 21.52, 23.80, 26.58 and 28.60 ms-1, three levels of blade thickness of 2, 4 and 6 mm and four levels of blade rake angle of 0, 15, 30 and 45 deg on en-ergy consumption of cotton stalk was investigated. The results showed that increase in peripheral velocity from 21.52 to 28.60 ms-1 increased the requirement of energy for all the levels of number of blades. Increase in blade thickness resulted in decreased energy requirement at all the levels of peripheral velocity. The peripheral velocity of 21.52 ms-1 recorded minimum energy requirement for all the levels of variables of blade rake angle and number of blades when compared to other peripheral velocity lev-els. 2 blades and 0º blade rake angle recorded minimum energy requirement when compared to all other combi-nations of number of blades and blade rake angle. The 0º blade rake angle and 6mm blade thickness recorded minimum energy requirement. Rake angle from 0 to 45º resulted in increased energy requirement for all the levels of peripheral velocity and number of blades. The 0º blade rake angle and 21.52 ms-1 peripheral velocity recorded

VOL.39 NO.4 2008 AGRICULTURAL MECHANIZATION IN ASIA, AFRICA, AND LATIN AMERICA 89
minimum energy requirement when compared to other combinations.
623Effect of Speed on Wear Characteristics of Hard Sur-
faced Cultivator Shovels: V. K. Chahar, Research Scholar and Senior Technical Assistant, Dept. of Farm Machinery and Power Engineering, CTAE, Udaipurand, India; G. S. Ti-wari, Associate Professor, same.
In agricultural machines, wear is the most rapid and common form of damage. This is responsible for most of the idle time and maintenance, apart from heavy ex-penditure on repair and spare parts. Wear studies were conducted on cultivator shovels coated with EWAC 1002 ET surface hardening powder (Tungsten carbide base). The tests were conducted under controlled soil bin condi-tions in sandy loam soil at 9-12 % moisture content for 100 hours at three different speeds of 0.7, 1.0 and 1.3 m/s. Weight loss in each shovel due to wear was recorded at an interval of 20 h. Wear rate was found to increase by 29.41 % with increase in speed from 0.7 to 1.3 m/s.
625Alfalfa seed-bearer harvesting technology and
machinery complex in Uzbekistan: Lee A. S.,PhD on technics. The chief of the laboratory of mechanization of forage harvesting. Uzbek Scientifical Research Institute for Mechanization and Electrification of Agriculture. UzMEI. Uzbekistan; Roziyev Sh. N., P. G. S., Tashkent Institute of Ir-rigation and Melioration, TIIM.
In this article the present condition of alfalfa seed man-ufacturing is considered. The brief review of importance of alfalfa in agriculture and it`s physical-mechanical properties, the brief information about technological process of seed manufacture by a separate way and post harvest cleaning them are also given, and various alfalfa seed-bearers harvesting technologies are considered. The question of reduction of the park of machines and their rational utilization during alfalfa seed-bearer harvesting is considered. The list of used means for seed-bearer har-
vesting by separate way is given.
638Design, development and evaluation of finger millet
thresher-cum-pearler for hills: K. P. Singh, Scientist, Farm Machinery and Power Vivekananda Institute of Hill Agri-culture, (ICAR) Almora - 263 601 (UA), India; A. K. Srivastva, Principal Scientist, same; S. Kundu, Co-coordinator, Tech-nical Cell, same; H. S. Gupta, Director, same.
Hill agriculture, dominated by rainfed upland farming. Finger millet (Eleusine Coracana) is widely is a major crop under rainfed upland occupying 1.36 lakh ha area in uttaranchal hills whereas the total production is 1.74 lakh tonnes. However, its threshing and pearling involves severe drudgery for women. It is evident by arduous pro-cess of traditional threshing and pearling which needs 5 hours efforts for threshing and pearling of 100 kg of finger millet grains. A finger millet thresher cum pearler with threshing capacity of 28.5 kg/h and pearling capac-ity of 63.1 kg/h was designed on the basis of physical properties of the grain. The thresher was developed and evaluated for its performance in terms of feed rate (FR in kg/h), pearling capacity (PC in kg/h), threshing efficiency (TE in %), pearling efficiency (PC in %), cleaning ef-ficiency (CE in %), visible damage (VD in %), Germina-tion percentage (%) and Total bacterial load (cfu/g). The physical properties of finger millet such as moisture con-tent (10%), bulk density (0.71 g/cc), straw-husk-grain ratio (12: 1: 23), grain size (1.48) mm, grain strength (24.62 kg) and angle of repose (32°) were studied. The result of the test indicate that for best performance, the thresher cum pearler should be operated at a cylinder speed of 1200 rpm with cylinder concave clearance 5 mm, increased canvas width (IWC) of 2 mm, moisture content 10 % for threshing and 8 % for pearling. The threshing and pearl-ing efficiency of thresher at this combination are 98.1 and 97.9 % respectively. The power required for operating the thresher cum pearler was 0.746 kW.
■■

AGRICULTURAL MECHANIZATION IN ASIA, AFRICA, AND LATIN AMERICA 2008 VOL.39 NO.490
-AFRICA-Benedict KayomboAssociate Professor of Soil and Water Engineering, Dept. of Agric. Engineering and Land Planning, Botswana College of Agriculture, University of Bo-tswana, Private Bag 0027, Gaborone, BOTSWANA.TEL(+267)-3650125, FAX(+267)-328753E-mail: [email protected]
Mathias Fru FontehAsst. Professor and Head, Dept. of Agric. Engineer-ing, Faculty of Agriculture, University of Dschang, P.O. Box 447, Dschang, West Province, CAMEROONTEL+237-45-1701/1994, FAX+237-45-2173/1932E-mail: [email protected]
Ahmed Abdel Khalek El BeheryAgric Engineering Research Institute, Agricultural Reserch Center, Nadi El-Said St. P.O. Box 256, Dokki 12311, Giza, EGYPT
Ali Mahmoud El HossarySenior Advisor to the Ministry of Agriculture and Chairman of (AGES)-Agengineering Consulting Group, Ministry of Agriculture - P.O.Box 195 Zama-lek 11211 Cairo, EGYPTTEL00-202-335-9304, FAX00-202-3494-132
B. S. PathakProject Manager, Agric. Implements Research and Improvement Centre, Melkassa, ETHIOPIA
Richard Jinks BaniLecturer & Co-ordinator, Agric. Engineering Div., Faculty of Agriculture, University of Ghana, Legon, GHANA
Israel Kofi DjokotoSenior Lecturer, University of Science and Technol-ogy, Kumasi, GHANA
David Kimutaiarap SomeProfessor, Deputy Vice-chancellor. Moi University, P.O. Box: 2405, Eldoret, KENYA
Karim HoumyProfessor and head of the Farm Mechanization Dept., Institute of Agronomy and Velerinary Medi-cine II, Secteur 13 Immeuble 2 Hay Riad, Rabat, MOROCCO, Tel+212-7-68-05-12, Fax+212-7-775801E-mail: [email protected]
Joseph Chukwugotium IgbekaProfessor, Dept. of Agricultural Engineering, Univ. of Ibadan,, Ibadan, NIGERIATEL+234-2-8101100-4, FAX+234-281030118E-mail: [email protected]
E. U. OdigbohProfessor, Agricultural Engg Dept., Faculty of En-gineering, University of Nigeria, Nsukka, Enugu state, NIGERIA, TEL+234-042-771676, FAX042- 770644/771550, E-mail: [email protected]
Kayode C. OniDirector/Chief Executive, National Centre for Agric. Mechanization (NCAM), P.M.B.1525, Ilorin, Kwara State, NIGERIATEL+234-031-224831, FAX+234-031-226257E-mail: [email protected]
N. G. KuyembehAssociate Professor, Njala University Colle, Univer-sity of Sierra Leone, Private Mail Bag, Free Town, SIERRA LEONETEL+249-778620-780045, FAX+249-11-771779
Abdien Hassan AbdounMember of Board, Amin Enterprises Ltd., P.O. Box 1333, Khartoum, SUDAN
Amir Bakheit SaeedAssoc. Professor, Dept. of Agric. Engineering, Fac-ulty of Agriculture, University of Khartoum, 310131 Shambat, SUDAN, TEL+249-11-310131
Abdisalam I. KhatibuNational Prolect Coordinafor and Direcror, FAO Ir-rigated Rice Production, Zanzibar, TANZANIA
Edward A. BaryehProfessor, Africa University, P.O.Box 1320, Mutare, ZIMBABWE
Solomon Tembo52 Goodrington Drive, PO Mabelreign,Sunridge, Harare, ZIMBABWE
-AMERICAS-Hugo Alfredo CetrangoloFull Professor and Director of Food and Agribusi-ness Program Agronomy College Buenos Aires University, Av. San Martin4453, (1417) Capital Fed-
eral, ARGENTINATEL+54-11-4524-8041/93, FAX+54-11-4514-8737/39E-mail: [email protected]
Irenilza de Alencar NääsProfessor, Agricultural Engineering College, UNI-CAMP, Agricultural Construction Dept.,P.O. Box 6011, 13081 -Campinas- S.P.,BRAZILTEL+55-19-7881039, FAX+55-19-7881010E-mail: [email protected]
A. E. GhalyProfessor, Biological Engineering Deparment Dalhousie University, P.O. Box 1000, Halifax, Nova Scotia, B3J2X4, CANADATEL+1-902-494-6014, FAX+1-902-423-2423E-mail: [email protected]
Edmundo J. HetzProfessor, Dept. of Agric. Eng. Univ. of Concepcion, Av. V.Mendez 595, P.O. Box 537, Chillan, CHILETEL+56-42-216333, FAX+56-42-275303E-mail: [email protected]
A. A. ValenzuelaEmeritus Professor, Ag. Eng. Fac., University of Concepcion,Casilla537Chillan, CHILETEL+56-42-223613, FAX+56-42-221167
Roberto AguirreAssociate Professor, National University of Colom-bia, A.A. 237, Palmira, COLOMBIATEL+57-572-2717000, FAX+57-572-2714235E-mail: [email protected]
Omar Ulloa-TorresProfessor, Escuela de Agricultura de la Region, Tropical Humeda(EARTH), Apdo. 4442- 1000, San Jose, COSTA RICA, TEL+506-255-2000, FAX +506-255-2726, E-mail: [email protected]
S. G. Campos MaganaLeader of Agric. Engineering Dept. of the Gulf of Mexico Region of the National Institute of Forestry and Agricultural Research, Apdo. Postal 429. Vera-cruz, Ver. MEXICO
Hipolito Ortiz-LaurelHead of Agric. Engineering and Mechanization Dept./ Postgraduate College, Iturbide 73, Salinas de Hgo, S.L.P., C.P. 78600, MEXICOTEL+52-496-30448, FAX+52-496-30240
B Kayombo M F Fonteh A A KEl Behery
A MEl Hossary
B S Pathak R J Bani I K Djokoto D K Some K Houmy J C Igbeka
E U-Odigboh K C Oni N GKuyembeh
A HAbdoun
A B Saeed A I Khatibu E A Baryeh S Tembo H ACetrangolo
I de A Nääs
A E Ghaly E J Hetz A AValenzuela
R Aguirre O Ulloa-Torres S G CMagana
H Ortiz-Laurel W JChancellor
M R Goyal A KMahapatra
Co-operating Editors
VOL.39 NO.4 2008 AGRICULTURAL MECHANIZATION IN ASIA, AFRICA, AND LATIN AMERICA 91
William J. ChancellorProfessor Emeritus, Bio. and Agr. Eng. Dept., Univ. of California, Davis, CA, 95616, U.S.A.TEL+1-530-753-4292, FAX+1-530-752-2640E-mail: [email protected]
Megh R. GoyalProf./Agric & Biomedical Engineering, Univer-sity of Puerto Rico, P.O.Box 5984, Mayaguez PR, 006815984, U.S.A., TEL+1-787-265-4702E-mail: [email protected]
Ajit K. MahapatraPresent add: Agric. & Biosystems Eng. Dept., South Dakota State Univ., P.O. Box2120 Brook-ings, SD 57007-1496, U.S.A., TEL605-6885291, FAX 605-6886764, E-mail: [email protected]
-ASIA and OCEANIA-Graeme R. QuickConsulting Enginner, 83 Morrisons Road, Peaches-ter, Queensland, 4519, AUSTRALIA
Shah M. FaroukProfessor (Retd.),Farm Power & Machinery Dept., Bangladesh Agricultural University, Mymensingh 2200, BANGLADESH, TEL+880-91-5695ext.2596, FAX91-55810, E-mail: [email protected]
Daulat HussainDean, Faculty of Agric. Engineering and Tech-nology, Bangladesh Agricultural University, My-mensingh-2202, BANGLADESH, TEL+880-91-52245, FAX91-55810, E-mail: [email protected]
Mohammed A. MazedMember-Director, Bangladesh Agri. Res. Council, Farmgate, Dhaka, BANGLADESHE-mail: [email protected]
Chetem WangchenProgramme Director Agricultural Machinery Centre Ministry of Agriculture Royal Government of Bhutan, Bondey Paro Bhutan 1228, BHUTAN, E-mail: [email protected]
Wang WanjunPast Vice Director and Chief Engineer/Chinese Academy of Agricultural Mechanization Sciences, 1 Beishatan, Beijing, 100083, CHINATEL+86-(0)83-001-6488-2710, FAX001-6488-2710E-mail: [email protected]
Sarath IllangantilekeRegional Representative for South and West
Asia, International Potato Center (CIP), Regional Office for CIP-South & West Asia, IARI (Indian Ag-ric. Res. Institute) Campus, Pusa, New Delhe-12, 110002, INDIA, TEL+91-11-5719601/5731481, FAX./5731481, E-mail: [email protected]
S. M. IlyasDirector, National Academy of Agricultural Re-search Management (NAARM), Rajendranagar, Hyderabad-500030, INDIA, Tel+91-40-24015070, Fax:+91-41-24015912, E-mail: [email protected]
A. M. Michael1/64, Vattekunnam, Methanam Road, Edappally North P.O., Cochin, 682024, Kerala State, S. INDIA
Gajendra SinghProfessor, Vice Chancellor, Doon University 388/2, India Nagar, Dehradun - 248006, INDIATEL+91-989-738-4111, FAX+91-135-320-1920Email: [email protected]
T. P. OjhaDirector General(Engg.) Retd., ICAR, 110, Vineet Kung Akbarpur, Kolar Road, Bhopal, 462 023, INDIATEL+91-755-290045
S. R. VermaProf. of Agr. Eng, & Dean Eng.(Retd), 14, Good Friends Colony, Barewal Road , Via Ayoli Kalan, Lud-hiana 142027 Punjab, INDIA, TEL+91-(0)161-463096E-mail: [email protected]
SoedjatmikoPresident, MMAI(Indonesian Soc. of Agric. Eng. & Agroindustry), Menara Kadin Indonesia Lt.29 Jl. HR. Rasuna Said X-5/2-3 Jakarta, 12940, INDONESIATEL+62-(0)21-9168137/7560544, FAX(0)21-5274485/5274486/7561109
Mansoor Behroozi-LarProfessor, Agr. Machinery, Ph.D, Tehran University Faculty of Agriculture, Karaj, IRANTEL+98-21-8259240, E-mail: [email protected]
Saeid MinaeiAssistant Professor, Dept. of Agr. Machinery Eng., Tarbiat Modarres Univ., P.O.Box 14115-111, Tehran, IRANTEL+9821-6026522-3(office ext.2060, lab ext.2168)FAX+9821-6026524, E-mail: [email protected]
Jun SakaiProfessor Emeritus, Kyushu University, 2-31-1 Chi-haya, Higashi-ku, Fukuoka city, 813, JAPANTEL+81-92-672-2929, FAX+81-92-672-2929E-mail: [email protected]
Bassam A. SnobarProfessor and Vice President, Jordan University of Science and Technology, P.O.Box 3030 Irbid, 22110, JORDAN, TEL+962-2-295111, FAX+962-2-295123E-mail: [email protected]
Chang Joo ChungEmeritus Professor, Seoul National University, Ag-ricutural Engineering Department, College of Agri-culture and Life Sciences, Suwon, 441-744, KOREATEL+82-(0)331-291-8131, FAX+82-(0)331-297-7478E-mail: [email protected]
Chul Choo LeeMailing Address: Rm. 514 Hyundate Goldentel Bld. 76-3 Kwang Jin Ku,Seoul, KOREATEL+82-(0)2-446-3473, FAX+82-(0)2-446-3473E-mail: [email protected]
Muhamad Zohadie BardaieProfessor, Department of Agricultural and Biosys-tems Engineering, University Putra Malaysia, 43400 upm, Serdang, Serdangor, MALAYSIATEL+60-3-89466410Email: [email protected]
Madan P. PariyarConsultant, Rural Development through Selfhelp Promotion Lamjung Project, German Technical Cooperation. P.O. Box 1457, Kathmandu, NEPAL
David Boakye AmpratwumAssociate Professor, Dept.of Bioresource and Agri-cultural Engineering, College of Agriculture, Sultan Qaboos University, P.O. Box 34, Post Code 123, Muscat, Sultanate of Oman, OMANTEL+968-513866, FAX513866E-mail: [email protected]
EITag Seif Eldin Mailling Address: Dept. of Agric. Mechanization, College of Agriculture, P.O. Box 32484, Al-Khod, Sultan Qaboos University, Muscat, Sultanate of Oman, OMAN
Linus U. OperaAssociate Professor, Agricultural Engineering & Postharvest technology, Director, Agricultural Experiment Station, Sultan Qaboos University, Muscat, Sultanate of Oman, OMAN
Allah Ditta ChaudhryProfessor and Dean Faculty of Agric. Engineering and Technology, University of Agriculture, Faisala-bad, PAKISTAN
G R Quick S M Farouk DaoulatHussain
M A Mazed Chetem Wangchen
Wang Wanjun
S Illangantileke S M Ilyas A M Michael
T P Ojha S R Verma Soedjatmiko M Behroozi-Lar
Saeid Minaei
J Sakai B A Snorbar C J Chung C C Lee M ZBardaie
M P Pariyar D BAmpratwum
E S Eldin A DChaudhry
A Q Mughal R ur Rehmen B TDevrajani
N AAbu-Khalaf
Surya NathL U Opera
G Singh

AGRICULTURAL MECHANIZATION IN ASIA, AFRICA, AND LATIN AMERICA 2008 VOL.39 NO.492
R PVenturina
A. Q. A. MughalVice Chancellor, Sindh Agriculture University, Tan-dojam, PAKISTAN
Rafiq ur RehmanDirector, Agricultural Mechanization Reserch Insti-tute, P.O. Box No. 416 Multan, PAKISTAN
Bherulal T. DevrajaniProfessor and Chairman, Faculty of Agricultural En-gineering, Sindh Agriculture University, Tandojam, Sindh, PAKISTANTEL+92-2233-5594
Nawaf A. Abu-KhalafEngineer, the Project Directorate in Palestinian Ag-ricultural Ministry, P.O.Box 405, Hebron, PALESTINETelfax: 972-2-2227846/7E-mail: [email protected]
Surya NathAssoci. Prof., Dept. of Agriculture, Papua New Guinea University of Technology, Private Mail Basg, Lae, PAPUA NEW GUINEA, TEL+675-475-5162, FAX473-4477, E-mail: [email protected]
Reynaldo M. LantinProfessor, College of Engineering and Agro-Indus-trial Technology University of the Philippines Los Banos, Laguna 4031, PHILIPPINESTEL+63-(0)49-536-2792, FAX+63-(0)49-536-2873E-mail: [email protected]
Ricardo P. VenturinaPresident & General Manager, Rivelisa publishing House, 215 F, Angeles St. cor Taft Ave. Ext., 1300 Pasay City, Metro Manila,PHILIPPINES
Saleh Abdulrahman Al-suhaibaniProfessor, Agricultural Engineering Dept.,College of Agriculture, King Saud University,P.O. Box 2460 Riyadh 11451, SAUDI ARABIA
Ali Mufarreh Saleh Al-AmriProfessor, Dept. of Agric. Engineering, Colleg of Agricultural and Food Sciences, King Faisal Univer-sity, Al-Ahsa,SAUDI ARABIAE-Mail: [email protected],[email protected]
Sen-Fuh ChangProfessor, Agric.-Machinery Dept. National Taiwan University, Taipei, TAIWAN
Tieng-song PengDeputy Director, Taiwan Agricultural Mechaniza-tion Research and Development Center. FL. 9-6, No. 391 Sinyi Road, Sec. 4, TAIWAN
Suraweth KrishnasreniSenior Expert in Agricultural En-gineering, Depart-ment of Agricul-ture, Chatuchak, Bangkok 10900, THAILANDTel5792153,5794497,5798520,Ext.124, Fax9405791, E-mail: [email protected]
Surin PhongsupasamitPresident, Institute for Promotion of Teaching Sci-ence and Technology, 924 Sukumit Rd. Klong Toey Bangkok, THAILAND
Chanchai RojanasarojResearch and Development Engineer, Dept. of Ag-riculture, Ministry of Agriculture and Cooperatives, Gang-Khen, Bangkok 10900, THAILAND
Vilas M. SalokheProfessor, AFE Program, Asian Institute of Technol-ogy, P.O. Box 4, Klang Luang. Pathumthani 12120, THAILAND, TEL+66-2-5245479, FAX+66-2-5246200E-mail: [email protected]
Yunus PinarProfessor, and Head, Agric. Machinery Dept, Fac-ulty of Agriculture, University of Ondokuz Mayis, Kurupelit, Samsun, TURKEY
Imad HaffarAssociate Professor of Agric. Engineering, Faculty of Agricultural Sciences, United Arab Emirates Univer-sity, Al Ain, P.O. Box 17555, UAE, Tel+971-506436385, E-mail: [email protected]
Nguyen HayAssociate Professor, Dean of Faculty of Engineering, Nonglam University, Linh Trung Ward, Thu Duc Dis-trict, Ho Chi Minh City, VIET NAME-mail: [email protected]
Pham Van LangDirector, Vietnam Institute of Agricultural Engineer-ing, A2-Phuong Mai, Dong Da Hanoi, VIET NAM
Abdulsamad Abdulmalik Hazza,aProfessor and Head of Agricultural Engineering De-partment, Faculty of Agriculture, Sana,a University, P.O.Box 12355, Sana,a YEMEN, Tel+9671-407300, Fax:9671-217711, E-mail: [email protected]
-EUROPE-Anastas Petrov KaloyanovProfessor & Head, Research Laboratory of Farm Mechanization, Higher Institute of Economics, So-fia, BULGARIA
Pavel KicVice-Dean/Technical Faculty, Czech University of Agriculture Prague, 16521 Prague 6-Suchdol, CZECH, Tel+420-2-24383141, Email: [email protected]
Henrik HaveProf. of Agric. Machinery and Mechanization at In-stitute of Agric. Engineering, Royal Veterinan/- and Agricultural University, Agrovej 10DK2630 Tastrup, DENMARK
Joachim MüllerFull Professor at the University Hohenheim, Insti-tute of Agricultural Engineering, Head of Agricul-tural Engineering in the Tropics and Subtropics, University of Hohenheim, 70593 Stuttgart, GERMA-NY, Tel+0711-459-22490, E-mail: joachim.muller@ uni-hohenheim.de
Giuseppe PellizziDirector of the Institute of Agric. Engineering of the University of Milano and Professor of Agric. Machinery and Mechanization, Via G. Celoria, 2-20133 Milano, ITALY, Tel+39-02-503-16871, E-mail: [email protected]
W. B. HoogmoedUniversity Lecturer, Faculty of Lsg Agrarische Bedrii-jfstechnologie, Wangeningen University, Agrotech-nologie en Voedingswetenshappen, Bornsesteeg 59, 6700 AA, Wageningen, P.O.Box 17, NETHERLAND, E-mail: [email protected]
Jan PawlakProfessor, head of the Dept. of Economics and Utilization of Farm Machines at IBMER, Professor at the Univ. of Warmia and Mazury in Olsztyn, Fac. of Tech. Sci., POLAND
Oleg S. MarchenkoProfessor and agricultural engineer, Department Head in All-Russia Research Institute for Mechani-zation in Agriculture (VIM), 1st Institutsky proezd, 5, Moscow 109428, RUSSIA, Tel+7(095)174-8700, Fax+7(095)171-4349, E-mail: [email protected]
John KilgourSenior Lecturer in Farm Machinery Design at Silsoe College, Silsoe Campus, Silsoe, Bedford, MK45 4DT, UK
Milan MartinovFull Professor on Agricultural Machinery, Univer-sity of Novi Sad, Faculty of Engineering, Institute of mechanization and machine design, TRG D. Obra-dovica 6, 21 121 Novi Sad, PF55, YUGOSLAVIA, TEL+ 381-21-350-122(298), E-mail: [email protected]
O SMarchenko
J Kilgour M Martinov
S AAl-Suhaibani
A M SAl-Amri
S F Chang T S Peng S Krishnasreni S Phong-supasamit
C Rojanasaroj V M Salokhe
Y Pinar I Haffar P V Lang A A Hazza,a A P
KaloyanovP Kic H Have J Müller G Pellizzi
Jan Pawlak
N Hay
R M Lantin
W BHoogmoed

VOL.39 NO.4 2008 AGRICULTURAL MECHANIZATION IN ASIA, AFRICA, AND LATIN AMERICA 93
Back Issues
AGRICULTURAL MECHANIZATION IN ASIA, AFRICA AND LATIN AMERICA
(Vol.38, No.1, Winter, 2007)The Evaluation of Performance and Energy
Usage in Submersible Deep Well irrigation Pumping Plants (Sedat Çalisir) ...................
Status of Farm Mechanization in Nalanda District of Bihar (V. B. Shambhu, R. B. Ram) .............................................................
Effect of Puddling on Physical Prosperities of Soil and Rice Yield (B. K. Hehera, B. P. Varshney, S. Swain)......................................
Ground Contact Pressure and Soil Sedimen-tation Period Affecting Transplanter Sink-age and its Performance (B. K. Hehera, B. P. Varshney, S. Swain) ..................................
Development of a Reinforced Mud Silo (A. F. Alonge, A. A. Opeloyeru) ............................
Current Status, Constraints and Potentiality of Agricultural Mechanization in Fiji (M. W. Ullah, S. Anad) .......................................
Performance of some Pneumatic Tires Used in Camel Carts on Sandy Terrain (Ghan-shyam Tiwari, Ajay Kumar Sharma, K. P. Pandey) .........................................................
Feasibility of Collecting Ambient Air Mois-ture by Forced Condensation (Hamid Al-Jalil, Jumah Amayreh, Mohamad Al- Widyan) ........................................................
Energy Cost of Riding and Walking Type Power Tillers (Binisam, K. Kathirvel, R. Manian, T. Senthikumar) .............................
Vibration Mapping of Walking and Riding Type Power Tillers (K. Kathirvel, Binisam, R. Manian, T. Senthikumar) ........................
Oman Traditional Farms: Changes and Im-provement of Farms in Oman (Ahmed Al-Marshudi) .....................................................
Prospects of Maize Cultivation Mechaniza-tion in Hills of Himachal Pradesh (Sukhbir Singh, Dinesh Kumar Vatsa) .......................
Farm Mechanization in Andaman and Nico-bar Island (M. Din, P. S. Deshmukh, N. Ravisankar, S. G. Choudhuri) .....................
Current Status of Animal traction in Mexico (H. Ortiz-Laurel, D. Rössel) ........................
◇ ◇ ◇
AGRICULTURAL MECHANIZATION IN ASIA, AFRICA AND LATIN AMERICA
(Vol.38, No.2, Spring, 2007)Noise Levels in Indian Cotton Gins (V. G.
Arude) ..........................................................Evaluation of Hydraulic Energy Nozzels Suit-
able for Orchard Spraying (T. Senthilku-mar, V. J. F. Kumar) ......................................
An Innovative Vertical Axial-flow Threshing Machine Developed in China (Ji Ma) .........
Storage Stability of Selected Agricultural Grains (E. S. A. Ajisegiri, P. A. Idah) .........
Design of Tool Carrier for Tillage Studies of Disc in Field Conditions (B. K. Yadav, In-dra Mani, J. S. Panwar) ................................
Design, Development and Evaluation of Seed Cum Fertilizer Drill (Ajay Kumar Verma,
M. L. Dewangan) ..........................................Tillage Effect on Yield, Quality, Management
and Cost of Sugarbeet (Koc Mehmet Tu-grul, Ilknur Dursun) .....................................
Potential for No-Tillage Agricultural in the Pandamatenga Vertisols of Botswana (M. Tepela, B. Kayombo, F. Pule-Meulenberg) .
Development and Performance Test of a La-ser Controlled Land Levelling Machine (Lin Jianhan, Liu Gang, Wang Maohua, Si Yongsheng, Lv Qingfei, Yang Yunuo) ........
Chikpea Threshing Efficiency and Energy Consumption for Different Beater-Con-trbeater Combinations (Turhan Koyuncu, Erkut Peksen, Abdullah Sessiz, Yunus Pinar) ............................................................
Rotally Tiller Blade Surface Development (Varinder Singh, D. S. Wadhwa) .................
Present Status and Future Scope of Mechani-zation of Horticultural Crops in Mountais (Sukhbir Singh, Dinesh Kumar Vasta, S. K. Upadhaya) ................................................
Development of Solar Cabinet Dryer for Dates (D. B. Ampratwum, A. S. S. Dorvo, I. Haffer) ........................................................
Mechanical Consideration for Design and Development of Furrow Openers for Seed Cum Fertilizer Drill (Ajay Kumar Verma, M. L. Dewangan, V. V. Singh, Vineet Das)
Performance Evaluation of a Yum (Dioscorea spp.) Harvester (Issac N. Itodo, Joakim O. Daudu) ..........................................................
◇ ◇ ◇
AGRICULTURAL MECHANIZATION IN ASIA, AFRICA AND LATIN AMERICA
(Vol.38, No.3, Summer, 2007)Modification of Power Transmission Sys-
tem to the Stationary Combine Thresher (Mohamed Hassan Dahab, Hassan Elhaj Hamed Hassan, Mohamed Hassan Nayel) .
Performance Evaluation of Tractor Drawn Weeding Cum Earthing-up Equipment for Cotton (K. Kathirvel, R. Manian, T. Sent-hilkumar) .....................................................
Studies on Blending of Refined Soybean Oil and Ethanol with Diesel as Hybrid CI En-gine Fuel (Mukesh Singh, T. K. Bhattacha-rya, H. C. Joshi, T. N. Mishra) .....................
Effect of Whole Body Vibration of Riding Type Power Tiller (Binisam, K. Kathirvel, R. Manian, L. P. Gite) ..................................
Post Harvest Practices of Betel Leaves in Orissa, India (K. Rayaguru, Md. K. Khan, G. Sahoo, U. S. Pal) ......................................
Effect of Design and Operating Parameters of Performance of Inter-cultivation Sweep Vertisols (S. N. Yadav, M. M. Pandey, D. C. Saraswat) ..................................................
Development and Evaluation of a Light Weight Power Tiller Operated Seed Drill for Hilly Region (Sukhbir Singh, Dinesh Kumar Vasta) ................................................
An Air t ight Paddy Storage System for Small-scale Farmers in Sri Lanka (T. B.
Adhikarinayake, J. Müller, J. Oostdam, W. Huisman, P. Richards) ..................................
Soybean Threshing Efficiency and Power Consumption for Different Concave Mate-rials (A. Sessiz, T. Koyuncu, Y. Pinar)........
Evaluation of the Agricultural Tractor Park of Ecuador (Lizardo Reina C, Edmundo J. Hetz) .............................................................
Improvement of the Modif icated Grain Thresher for Groundnut Threshing (Sheikh El Din Abdel Gadir El-Awad, Awad El-Karim Sir-Elkhatim Abdu-Elmagid, Mo-hamed Ahmed Ali) .......................................
Design, Development and Evaluation of a Ro-tary Type Chilly Dryer (S. Kaleemullah, R. Kaliappan) .....................................................
Influence of Forward Speed and terrain Con-dition on Hand Transmitted Vibration of Power Tiller (Binisam, K. Kathirvel, R. Manian, C. R. Mehta) ...................................
Performance Evaluation of Implements for Incorporation of Cotton Stalk (T. Senthil-kumar, Aravinda Reddy, R. Manian, K. Kathirvel) .....................................................
◇ ◇ ◇
AGRICULTURAL MECHANIZATION IN ASIA, AFRICA AND LATIN AMERICA
(Vol.38, No.4, Autumn, 2007)Design and Testing of a Small-Scale Solar
Crop Dryer (Mohamad I. Al-Widyan, Shatha Amourah, Lina Hilles, Rodainah Malkawi, Ahmed Abu-Al Rangheb) ..........
Energetics and Economics in Conventional Processing of Arecanut (Areca catechu L.) in India (J. John Gunasekar, S. Kaleemul-lah, P. Doraisamy, Z. John Kennedy) ..........
Hill Agricultural Mechanization in Himachal Pradesh - A Case Study in Two Selected Districts (Sukhbir Singh) .............................
Design and Evaluation of Portable Tunnels for Summer Growth of Ornamental Plants (V. P. Sethi) ...................................................
A Simulation Program for Predicting Haulage performance of 2WD Tractor and Balanced Trailer System (R. K. Sahu, K. P. Pandey) .
Comparative Performance of Four Bullock Drawn Puddlers (A. K. Shrivastava, R. K. Datta) ............................................................
Design and Testing of a Mangosteen Fruit Sizing Machines (Bundit Jarimopas, Cho-uw Inprasit, Siam Toomsaengtong) .............
Extraction of Essencial Oil: An Appropriate Rural Technology for Minimizing Wastage of Surplus Betel Leaves (P. Guha) ...............
Effect of Operational Speed and Moisture Content of Wheat Crop on Plot Combine Harvester (S. K. Patel, B. P. Varshney) .......
Enhancing the Shelf Life of Fully Ripe Guava and Mango Fruits Using Wax Emulsions (P. Rajkumar, R. Viswanathan, R. Kailap-pan, V. Thirupathi, L. Narayanan) ..............
Development of an Aqueous Palm Oil Extrac-tion System (O. K. owolarafe, L. A. Sanni, W. A. Olosunde, O. O. Fadeyi, O. O. Aji-
(Vol.38, No.1, Winter, 2007-)
9
18
23
29
34
39
46
51
55
61
68
74
78
83
9
13
18
23
29
33
38
42
48
53
58
63
69
74
79
9
15
20
28
33
38
45
48
56
60
67
73
79
84
9
13
18
26
31
37
42
47
51
55
AGRICULTURAL MECHANIZATION IN ASIA, AFRICA, AND LATIN AMERICA 2008 VOL.39 NO.494
bola) ..............................................................The Response of Two-Sorghum Cultivars to
Conventional and Conservation Tillage Systems in Central Sudan (Moheialdeen Ahmed Abdalla, Abdelmoniem Elamin Mohamed, Elsamawal Khalil Makki) .........
Tillage and Planting Management for Im-proving the Productivity and Profitability of Rice-Wheat Cropping System (K. K. Singh, A. S. Jat, S. K. Sharma) ....................
Development of a Yam Pounding Machine (A. O. Raji, K. O. Oriola) .............................
Possession, Knowledge and Operational Status of Farm Machinery with Surveyed Farm Woman in Vindhya Plateau Agro-climatic Zone of Madhya Pradesh (S. P. Singh, Nirmal Kumar, L. P. Gite, N. Agrawal) .......................................................
◇ ◇ ◇
AGRICULTURAL MECHANIZATION IN ASIA, AFRICA AND LATIN AMERICA
(Vol.39, No.1, Winter, 2008)Performance Comparisions of Tractor Tire
Configurations on Concrete Surface (Sarp Korkut Sümer, Alaettin Sabanci) ................
Assessment of Postural Discomfort Dur-ing Power Tiller Operation (Bini Sam, K. Kathirvel) ......................................................
Agricultural Accidents - A Case Study in Etawah Districts of Uttar Pradesh in India (Sanjay Kumar Patel, M. R. Varma) ............
The Department of Biosystems Engineering (BSE) at Jordan University of Science and Technology (Adnan I. Khudair, Majed Abu-Zreiq) ....................................................
Evaluation, Constraints and Acceptability of Different Types of Vertical Conveyer Reaper for Harvesting Rice in Coastal Orissa, India (B. C. Parida) ..........................
Stracture, Management, Operation and Mechanization Possibilities of the Irriga-tion Systems in Turkey (A. Asik, H. B. Unal, M. Avci, V. Demir) .............................
Effect of Operating Parameters and Pestcide Flow Characteristics on Performance of Air Assisted Spraying (D. Dhalin, K. Kath-irvel, T. V. Job, R. Manian) ..........................
Field Application of Modified Low Cost Dry-er for Rice Seed Drying - A Case Study in West Java and Central Java, Indonesia (R. Rachmat, Sudaryono, S. Lubis, S. Nagraha, R. Thahir, J. F. Rickman, M. Gummert) .....
Under and Above Ground Storage Loss of Sorghum Grain in Eastern Hararge, Ethio-pia (Fekadu Lemessa) ...................................
Field Evaluation of Power Weeder for Rain-fed Crops in Kashmir Vally (Jagvir Dixit, Intikhab Syed) ..............................................
Ergonomic Studies on the Location and Op-erational Frequency of Controls in Indian Farm Tractor (Vinay Madan, H. S. Dhin-gra, Santokh Singh) ......................................
Performance of the Ram Press with Differ-ent Oilseeds (John M. Kamau, David K. Some).............................................................
Adaption of an Impeller Type Husker for Long Grain Rice (J. Aveyire, K. A. Dzisi, A. Bart-Plange) .............................................
Impact of Tractorization on Farming in India with Special Reference to the State of West
61
67
72
77
82
9
14
19
24
29
33
39
46
49
53
57
61
65
Bengal (Pradip Banerjee, A. K. Giri) .........The Farm Machinery Industry in Japan and
Research Actives - The Present State of Farm Machinery Industry (Shin-Norinsha Co., Ltd) ........................................................
◇ ◇ ◇
AGRICULTURAL MECHANIZATION IN ASIA, AFRICA AND LATIN AMERICA
(Vol.39, No.2, Spring, 2008)Tillage Implements Performance and Effect
on Some Soil Physical Properties (Elsa-mawal Khalil Makki, Adbelmoniem El-amin Mohamed) ...........................................
Studies on Characterization of Selected Plant Oils and Their Bio-Diesels (P. K. Gupta, Rakesh Kumar, B. S. Panesar) .....................
Efficient Utilization of Conventional Fuel Through the Improvement of Traditional Stove (Syedul Islam, Abul Quasem, Ab-dur Rahman, Mohammad Nasim, Abdul Baqui, Farah Naz Khan) ..............................
Development and Evaluation of Anaerobic Type Sprouted Rice Drum Seeder and to Ascertain the Physiologocal Load on the Operator (R. S. Devnani) .............................
Evaluation and Improvement in Design of Self Propelled Vertival Conveyer Reaper (L. P. Singh, V. R. Vagadia, K. K. Jain, A. H. Memon) ....................................................
Energy Requirement of Different Weed Management Practices for Aerobic Rice in India (V. P. Chaudhary, S. K. Sharma, D. K. Pandey) .....................................................
Effect of Selected Parameters on the Perfor-mance of Semi-automatic Vegetable Trans-planter (S. K. Satpathy, I. K. Garg) .............
Design and Construction of the Airtight Ferrocement Bin for On-farm Storage of Paddy (T. B. Adhikarinayake, J. Müller, J. oostdam) ........................................................
The Situation of Agricultural Mechanization in Sarab City - Iran (V. Rasooli Sharabi-ani) .................................................................
Development and Performance Evaluation of Mat Type Nursery Raising Device (S. C. Sharma, T. P. Singh) .....................................
Development of a Prototype Dehuller for Pre-treated Chickpea (B. Sanjeeva Reddy, V. Maruthi) ........................................................
Study on Intelligent Measurement and Analy-sis System of Soil Electric Conductivity (He Yong, Chen Yongjun, Wu Yanping) .....
Design and Development of a Machine for Aonla Seed Removal (Ambrish Ganachari, K. Thangavel, D. Manohar Jesudas, R. Viswanathan) ................................................
Agricultural Mechanization in Bangradesh (K. C. Roy, Gajendra Singh) ........................
◇ ◇ ◇
AGRICULTURAL MECHANIZATION IN ASIA, AFRICA AND LATIN AMERICA
(Vol.39, No.3, Summer, 2008)Designing a Fonio Mill; Screening an Oper-
ating Principle and Its Validation (C. Ma-rouze, P. Thaunay, G. Fliedel, J. F. Cruz)
A Model to Predict Anthropometric Dimen-sions of Farm Workers of South India (K. Kathirvel, B. Suthakar, R. Manian)
71
77
9
14
19
23
34
39
47
52
57
64
71
76
80
83
9
16
Development and Performance Evaluation of Manure Spreading Attachiment to Two Wheel Trailer (B. Suthakar, K. Kathirvel, R. Manian, D. Manohar Jesudas)
Development of Power Tiller Operated Groundnut Harvester (S. H. Suryawanshi, B. Shridar, K. Kathirvel)
Development of High Capacity Fodder Den-sification Machine (S. K. Jha, A. Singh, Adarsh Kumar, J. S. Panwar)
A Review of Draught Animal Power as a Prime Mower for Site Specific Operations (C. P. Doshi, G. Tiwari)
Studies on Storage Characteristics of Betel Leaves (K. Rayaguru, K. Khan, G. Sahoo, M. K. Panda)
Prospects of Paddy Cultivation Mechaniza-tion in Hills of Himachal Pradesh (Sukhbir Singh, D. K. Vasta, H. N. Verma)
Design, Development and Evaluation of Manual-Cum-Bullock Operated Zero-Till Seed-Cum Fertilizer Drill for Hills (K. P. Singh, Subhash Chandra, R. Bhattacharya, A. K. Srivastva, H. S. Gupta)
Performance Evaluation of Two On-farm Feed Mixers (A. Addo, A. Bart-Plage)
Design and Evaluation of Aquifer Water Thermal Control System for Greenhouse (V. P. Sethi, S.K. Sharma)
Drying of Fruits with Sorar Tunnel Dryer (A. N. Udroiu, D. G. Epure, A. Mitoroi, M. A. Helmy)
A Methodology for Performance Evaluation of Puddling Equipment (A. K. Dave, Ajay Kumar Sharma, S. K. Rartaray)
Effect of Relative of Picking Tyne, Ground Clearance and Quantity of Trash Left on Collection Efficiency of the Sugarcane Trash Colector (G. Aravindareddy, R. Ma-nian, K. Kathirvel)
■■
22
29
33
37
42
46
50
57
61
68
71
75

Please let us know your need. We shall promptly reply them. Inquire on any
catalog listed in the advertisement in this issue. We shall try our best to serve you.
We welcome articles of interest to agricultural mechanization.
FIll in the reverse side of this card and send us by sealed letter.
FARM MACHINERY INDUSTRIAL RESEARCH CORP.
7-2 Kanda nishikicho, Chiyoda-ku, Tokyo 101-0054, Japan
INQUIRY and REQUESTto AMA

ADVERTISED PRODUCYS INQUIRY
Product Advertiser Vol., No., Page
EDITORIAL REQUEST TO AMA
Your Name :Address :Occupation :

SUBSCRIPTION/ORDER FORM
AGRICULTURAL MECHANIZATION IN ASIA, AFRICA AND LATIN AMERICA ( AMA )Issued Quarterly
Subscription Rate (includes surface mail postage)
Annual (4 issues)...........................¥.6,000 Single copy.......................................¥.1,700
Back Issues (1971-75, ¥.2,000 per copy) (1976-77, ¥.1,200 per copy) (1978-80, ¥.1,500 per copy)
★ Spring, 1971 □ Vol.7 No.2, Spring, 1976 ★ Vol.9 No.4, Autumn, 1978 ★ Vol.2 Autumn, 1971 □ Vol.7 No.3, Summer, 1976 □ Vol.10 No.1, Winter, 1979 □ Vol.3 No.1, 1972 □ Vol.7 No.4, Autumn, 1976 □ Vol.10 No.2, Spring, 1979 □ Vol.3 No.2, Summer, 1972 □ Vol.8 No.1, Winter, 1977 □ Vol.10 No.3, Summer, 1979 ★ Vol.4 No.1, Spring, 1973 □ Vol.8 No.2, Spring, 1977 □ Vol.10 No.4, Autumn, 1979 □ Vol.4 No.2, Autumn, 1973 □ Vol.8 No.3, Summer, 1977 ★ Vol.11 No.1, Winter, 1980 ★ Vol.5 No.1, Summer, 1974 □ Vol.8 No.4, Autumn, 1977 ★ Vol.11 No.2, Spring, 1980 □ Vol.6 No.1, Spring, 1975 □ Vol.9 No.1, Winter, 1978 □ Vol.11 No.3, Summer, 1980 ★ Vol.6 No.2, Autumn, 1975 □ Vol.9 No.2, Spring, 1978 □ Vol.11 No.4, Autumn, 1980 □ Vol.7 No.1, Winter, 1976 ★ Vol.9 No.3, Summer, 1978 ★ : Indicates issues out of stock. □ Abstract and Index, 1971-80(Special Issue, 1983)
(Check issues and number of copies you wish to order)
Back Lssues from 1981, ¥.1,700 per copy (Vol. 12 No.1 and No.4 are out of stock)Abstract and Index, Special Issue, 1983, ¥.2,000 per copy.
Vol. No. , , copy / copies
(Check one)□ Please invoice me/us□ I/We enclose remittance for ¥.
******************************Name:
Firm:
Position:
Address: (block letters)
FARM MACHINERY INDUSTRIAL RESEARCH CORP.7-2 Kanda nishikicho, Chiyoda-ku, Tokyo 101-0054, Japan
Tel. (03)-3291-3671 ~ 4, 5718

FARMMACHINERYINDUSTRIALRESEARCHCORP. 7-2KandaNishikicho,Chiyoda-ku, Tokyo101-0054,Japan
1st FOLD HERE
2nd FOLD HERE
STAMP