© 2016 American Medical Association. All rights reserved. AMA Health Workforce Mapper Data Definitions Physician Specialties About the source, the AMA Masterfile According to the AMA: “The Physician Masterfile includes current and historical data for over 1.4 million physicians, residents, and medical students in the United States. This figure includes approximately 411,000 graduates of foreign medical schools who reside in the United States and who have met the educational and credentialing requirements necessary for recognition. A record is established when individuals enter medical schools accredited by the Liaison Committee on Medical Education (LCME), or in the case of international medical graduates, upon entry into a post-graduate residency training program accredited by the Accreditation Council for Graduate Medical Education (ACGME)… Masterfile records are never removed even in the case of a physician's death. The Physician Masterfile records include data about a physician’s specialty, address, present employment, age, and gender.” 1 The AMA is constantly working to update their data in the Masterfile through physician surveys and the collection of missing values through a variety of other sources. The Robert Graham Center completed the data processing for AMA Masterfile data, and the AMA Health Workforce Mapper currently uses Masterfile data accessed in January 2016. Data processing involved geocoding providers’ best available practice address by matching these addresses with a privatel y maintained and licensed address database. Once longitude and latitude location attributes were applied to the address data, they were joined to U.S. Census geography files for geographic boundary identifiers. The specialties included are: Taxonomy Code Physician Specialty Allergy and Immunology AI Allergy AI Allergy & Immunology ALI Clinical Laboratory Immunology IG Immunology Anesthesiology ACA Adult Cardiothoracic Anesthesiology AN Anesthesiology CCA Critical Care Medicine 1 www.ama-assn.org/ama/pub/about-ama/physician-data-resources/physician-masterfile.page

Welcome message from author
This document is posted to help you gain knowledge. Please leave a comment to let me know what you think about it! Share it to your friends and learn new things together.
Transcript
© 2016 American Medical Association. All rights reserved.
AMA Health Workforce Mapper Data Definitions
Physician Specialties
About the source, the AMA Masterfile
According to the AMA:
“The Physician Masterfile includes current and historical data for over 1.4 million physicians,
residents, and medical students in the United States. This figure includes approximately 411,000
graduates of foreign medical schools who reside in the United States and who have met the
educational and credentialing requirements necessary for recognition. A record is established when
individuals enter medical schools accredited by the Liaison Committee on Medical Education
(LCME), or in the case of international medical graduates, upon entry into a post-graduate residency
training program accredited by the Accreditation Council for Graduate Medical Education
(ACGME)… Masterfile records are never removed even in the case of a physician's death. The
Physician Masterfile records include data about a physician’s specialty, address, present employment,
age, and gender.”1
The AMA is constantly working to update their data in the Masterfile through physician surveys and the
collection of missing values through a variety of other sources.
The Robert Graham Center completed the data processing for AMA Masterfile data, and the AMA Health
Workforce Mapper currently uses Masterfile data accessed in January 2016. Data processing involved
geocoding providers’ best available practice address by matching these addresses with a privately maintained
and licensed address database. Once longitude and latitude location attributes were applied to the address
data, they were joined to U.S. Census geography files for geographic boundary identifiers.
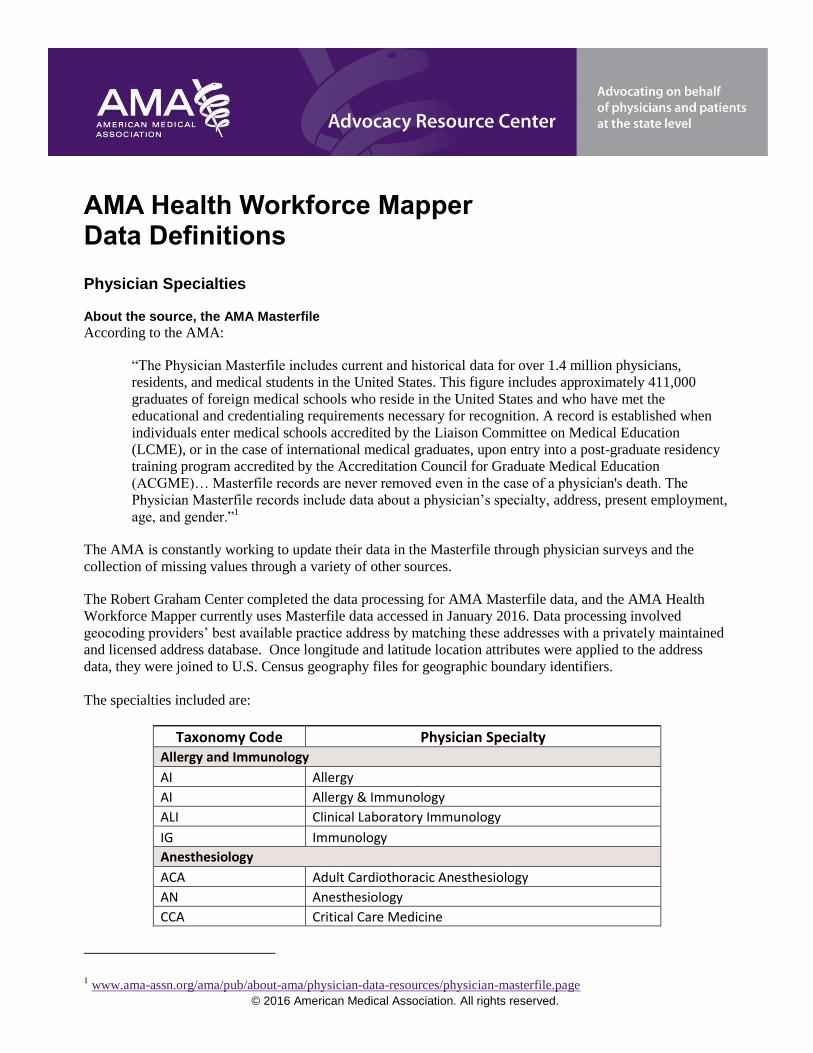
The specialties included are:
Taxonomy Code Physician Specialty Allergy and Immunology
AI Allergy
AI Allergy & Immunology
ALI Clinical Laboratory Immunology
IG Immunology
Anesthesiology
ACA Adult Cardiothoracic Anesthesiology
AN Anesthesiology
CCA Critical Care Medicine
1 www.ama-assn.org/ama/pub/about-ama/physician-data-resources/physician-masterfile.page
© 2016 American Medical Association. All rights reserved.
2
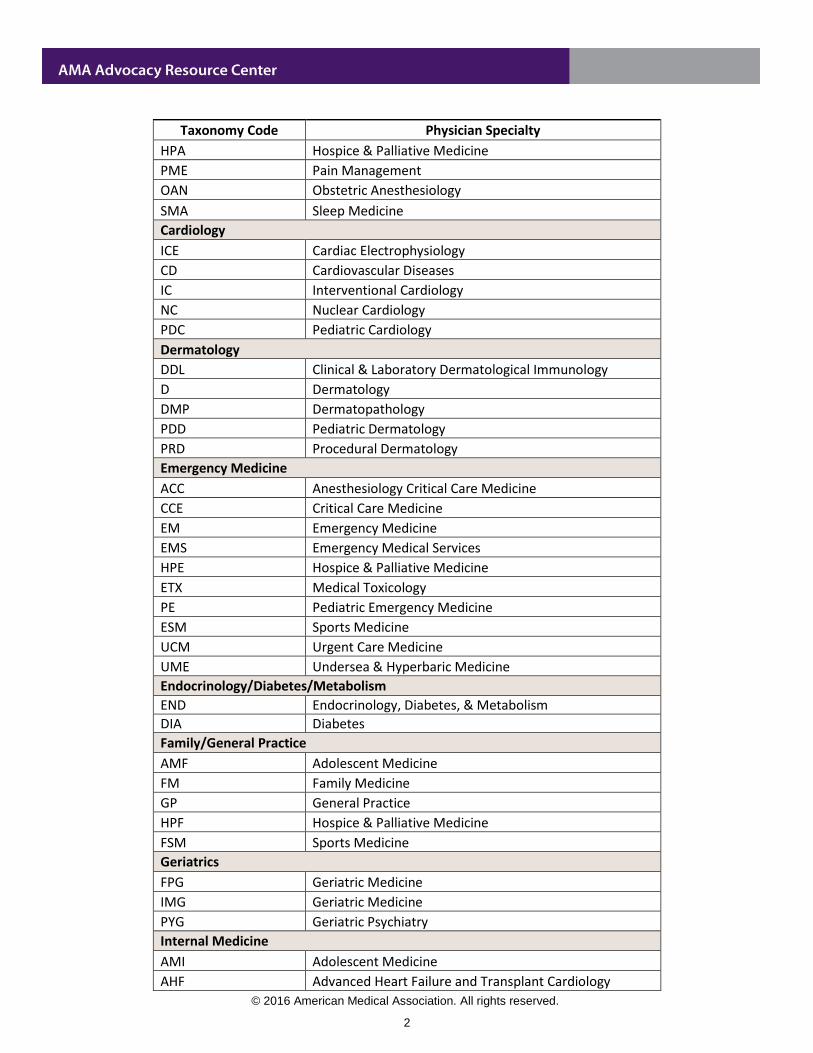
Taxonomy Code Physician Specialty
HPA Hospice & Palliative Medicine
PME Pain Management
OAN Obstetric Anesthesiology
SMA Sleep Medicine
Cardiology
ICE Cardiac Electrophysiology
CD Cardiovascular Diseases
IC Interventional Cardiology
NC Nuclear Cardiology
PDC Pediatric Cardiology
Dermatology
DDL Clinical & Laboratory Dermatological Immunology
D Dermatology
DMP Dermatopathology
PDD Pediatric Dermatology
PRD Procedural Dermatology
Emergency Medicine
ACC Anesthesiology Critical Care Medicine
CCE Critical Care Medicine
EM Emergency Medicine
EMS Emergency Medical Services
HPE Hospice & Palliative Medicine
ETX Medical Toxicology
PE Pediatric Emergency Medicine
ESM Sports Medicine
UCM Urgent Care Medicine
UME Undersea & Hyperbaric Medicine
Endocrinology/Diabetes/Metabolism
END Endocrinology, Diabetes, & Metabolism
DIA Diabetes
Family/General Practice
AMF Adolescent Medicine
FM Family Medicine
GP General Practice
HPF Hospice & Palliative Medicine
FSM Sports Medicine
Geriatrics
FPG Geriatric Medicine
IMG Geriatric Medicine
PYG Geriatric Psychiatry
Internal Medicine
AMI Adolescent Medicine
AHF Advanced Heart Failure and Transplant Cardiology
© 2016 American Medical Association. All rights reserved.
3
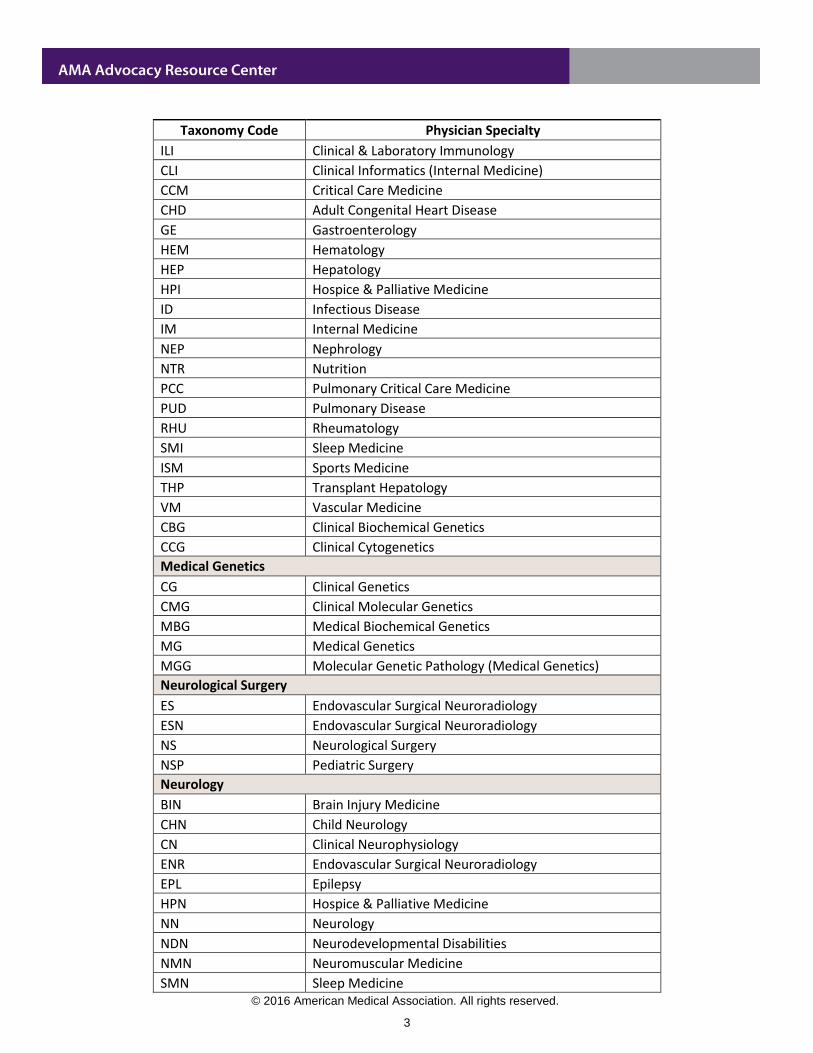
Taxonomy Code Physician Specialty
ILI Clinical & Laboratory Immunology
CLI Clinical Informatics (Internal Medicine)
CCM Critical Care Medicine
CHD Adult Congenital Heart Disease
GE Gastroenterology
HEM Hematology
HEP Hepatology
HPI Hospice & Palliative Medicine
ID Infectious Disease
IM Internal Medicine
NEP Nephrology
NTR Nutrition
PCC Pulmonary Critical Care Medicine
PUD Pulmonary Disease
RHU Rheumatology
SMI Sleep Medicine
ISM Sports Medicine
THP Transplant Hepatology
VM Vascular Medicine
CBG Clinical Biochemical Genetics
CCG Clinical Cytogenetics
Medical Genetics
CG Clinical Genetics
CMG Clinical Molecular Genetics
MBG Medical Biochemical Genetics
MG Medical Genetics
MGG Molecular Genetic Pathology (Medical Genetics)
Neurological Surgery
ES Endovascular Surgical Neuroradiology
ESN Endovascular Surgical Neuroradiology
NS Neurological Surgery
NSP Pediatric Surgery
Neurology
BIN Brain Injury Medicine
CHN Child Neurology
CN Clinical Neurophysiology
ENR Endovascular Surgical Neuroradiology
EPL Epilepsy
HPN Hospice & Palliative Medicine
NN Neurology
NDN Neurodevelopmental Disabilities
NMN Neuromuscular Medicine
SMN Sleep Medicine

© 2016 American Medical Association. All rights reserved.
4
Taxonomy Code Physician Specialty
VN Vascular Neurology
Obstetrics/Gynecology
OCC Critical Care Medicine
FPR Female Pelvic Medicine and Reconstructive Surgery
GYN Gynecology
HPO Hospice & Palliative Medicine
MFM Maternal & Fetal Medicine
OBS Obstetrics
OBG Obstetrics & Gynecology
REN Reproductive Endocrinology and Infertility
Oncology
HO Hematology/Oncology
GO Gynecological Oncology
ON Medical Oncology
OMO Musculoskeletal Oncology
PHO Pediatric Hematology/Oncology
SO Surgical Oncology
Ophthalmology
OPH Ophthalmology
OPR Ophthalmic Plastic and Reconstructive Surgery
PO Pediatric Ophthalmology
Orthopedics
HSO Hand Surgery
OAR Adult Reconstructive Orthopedics
OFA Foot & Ankle Orthopedics
ORS Orthopedic Surgery
OSS Orthopedic Surgery of the Spine
OTR Orthopedic Trauma
OP Pediatric Orthopedics
OSM Sports Medicine
Otolaryngology
NO Neurotology (Otolaryngology)
OTO Otolaryngology
PDO Pediatric Otolaryngology
PSH Plastic Surgery within the Head &Neck
PSO Plastic Surgery within the Head & Neck
SMO Sleep Medicine
Pathology
ATP Anatomic Pathology
PTH Anatomic/Clinical Pathology
BBK Blood Banking/Transfusion Medicine
PCH Chemical Pathology
© 2016 American Medical Association. All rights reserved.
5
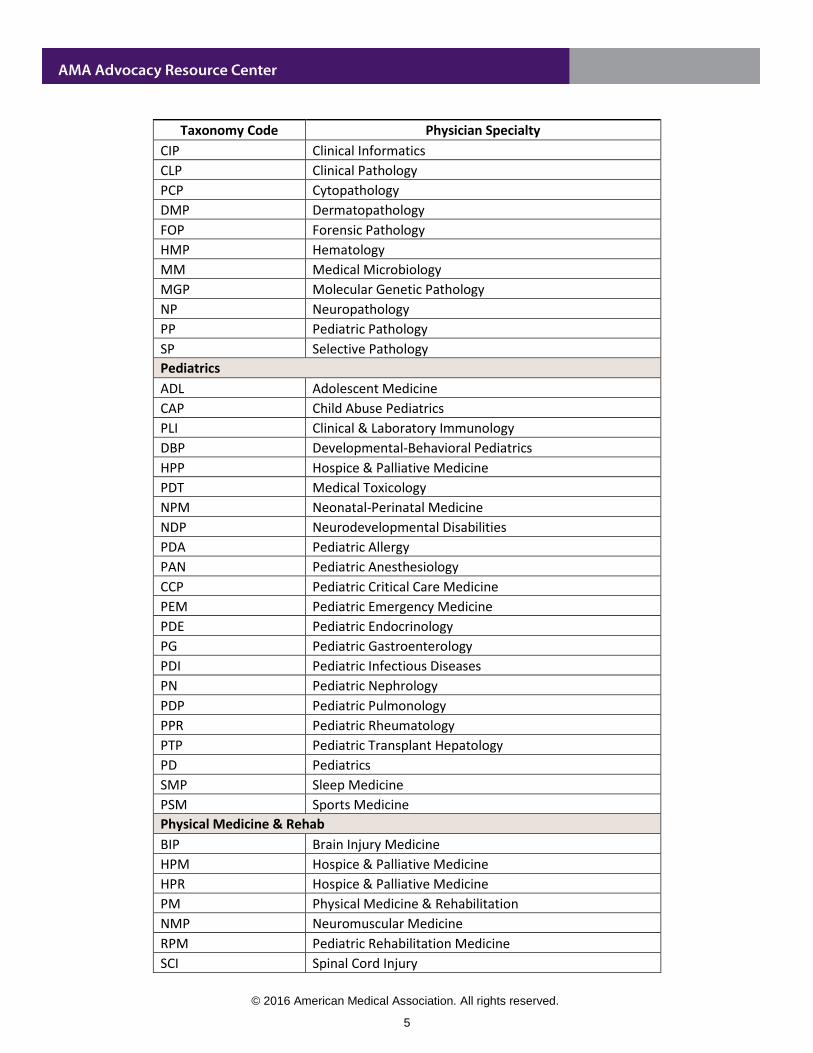
Taxonomy Code Physician Specialty
CIP Clinical Informatics
CLP Clinical Pathology
PCP Cytopathology
DMP Dermatopathology
FOP Forensic Pathology
HMP Hematology
MM Medical Microbiology
MGP Molecular Genetic Pathology
NP Neuropathology
PP Pediatric Pathology
SP Selective Pathology
Pediatrics
ADL Adolescent Medicine
CAP Child Abuse Pediatrics
PLI Clinical & Laboratory Immunology
DBP Developmental-Behavioral Pediatrics
HPP Hospice & Palliative Medicine
PDT Medical Toxicology
NPM Neonatal-Perinatal Medicine
NDP Neurodevelopmental Disabilities
PDA Pediatric Allergy
PAN Pediatric Anesthesiology
CCP Pediatric Critical Care Medicine
PEM Pediatric Emergency Medicine
PDE Pediatric Endocrinology
PG Pediatric Gastroenterology
PDI Pediatric Infectious Diseases
PN Pediatric Nephrology
PDP Pediatric Pulmonology
PPR Pediatric Rheumatology
PTP Pediatric Transplant Hepatology
PD Pediatrics
SMP Sleep Medicine
PSM Sports Medicine
Physical Medicine & Rehab
BIP Brain Injury Medicine
HPM Hospice & Palliative Medicine
HPR Hospice & Palliative Medicine
PM Physical Medicine & Rehabilitation
NMP Neuromuscular Medicine
RPM Pediatric Rehabilitation Medicine
SCI Spinal Cord Injury

© 2016 American Medical Association. All rights reserved.
6
Taxonomy Code Physician Specialty
PRS Sports Medicine
Plastic Surgery
CFS Craniofacial Surgery
FPS Facial Plastic Surgery
HSP Hand Surgery
PS Plastic Surgery
PSI Plastic Surgery – Integrated
PSP Plastic Surgery within the Head & Neck
Preventive Medicine
AM Aerospace Medicine
CIM Clinical Informatics
GPM General Preventive Medicine
PTX Medical Toxicology
OM Occupational Medicine
PHP Public Health & General Preventive Medicine
UM Undersea & Hyperbaric Medicine
Psychiatry
ADP Addiction Psychiatry
BIN Brain Injury Medicine
CHP Child and Adolescent Psychiatry
PFP Forensic Psychiatry
HPN Hospice & Palliative Medicine
NUP Neuropsychiatry
PPN Pain Medicine
P Psychiatry
PYA Psychoanalysis
PYM Psychosomatic Medicine
SMN Sleep Medicine
Radiology
AR Abdominal Radiology
CTR Cardiothoracic Radiology
DR Diagnostic Radiology
HPD Hospice & Palliative Medicine
MDP Medical Physics
MSR Musculoskeletal Radiology
RNR Neuroradiology
NR Nuclear Radiology
PDR Pediatric Radiology
RO Radiation Oncology
RP Radiological Physics
RR Radiology
VIR Vascular & Interventional Radiology
© 2016 American Medical Association. All rights reserved.
7
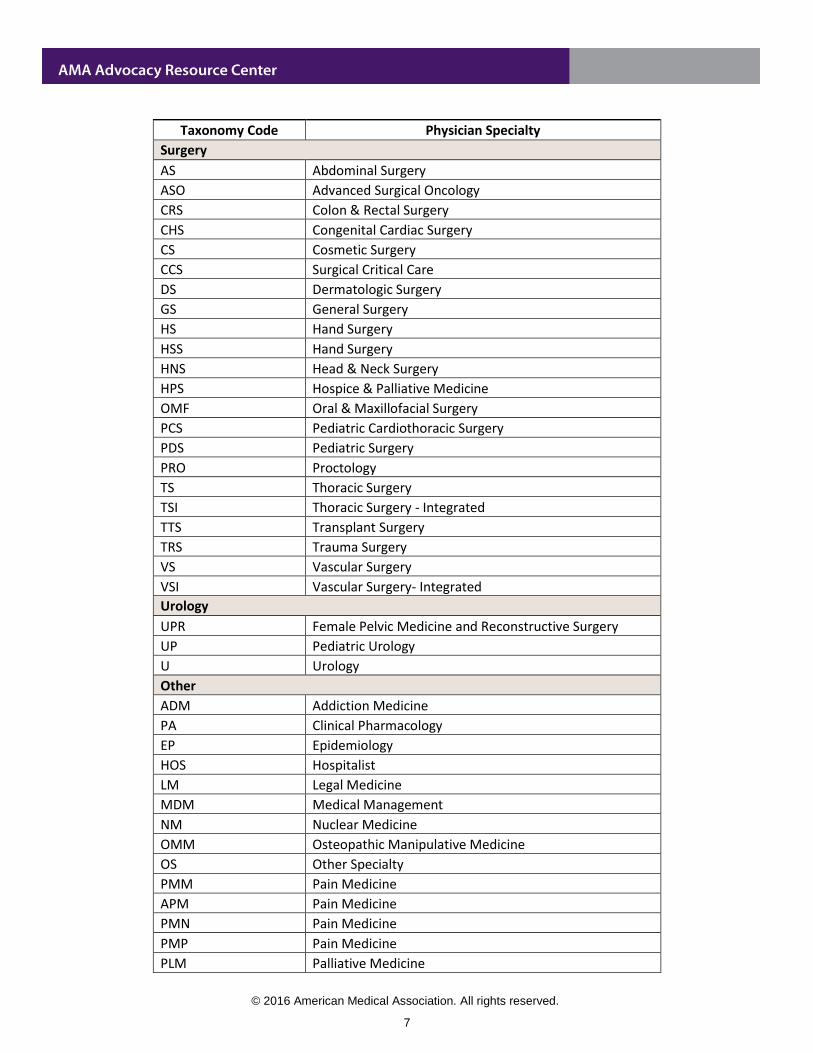
Taxonomy Code Physician Specialty
Surgery
AS Abdominal Surgery
ASO Advanced Surgical Oncology
CRS Colon & Rectal Surgery
CHS Congenital Cardiac Surgery
CS Cosmetic Surgery
CCS Surgical Critical Care
DS Dermatologic Surgery
GS General Surgery
HS Hand Surgery
HSS Hand Surgery
HNS Head & Neck Surgery
HPS Hospice & Palliative Medicine
OMF Oral & Maxillofacial Surgery
PCS Pediatric Cardiothoracic Surgery
PDS Pediatric Surgery
PRO Proctology
TS Thoracic Surgery
TSI Thoracic Surgery - Integrated
TTS Transplant Surgery
TRS Trauma Surgery
VS Vascular Surgery
VSI Vascular Surgery- Integrated
Urology
UPR Female Pelvic Medicine and Reconstructive Surgery
UP Pediatric Urology
U Urology
Other
ADM Addiction Medicine
PA Clinical Pharmacology
EP Epidemiology
HOS Hospitalist
LM Legal Medicine
MDM Medical Management
NM Nuclear Medicine
OMM Osteopathic Manipulative Medicine
OS Other Specialty
PMM Pain Medicine
APM Pain Medicine
PMN Pain Medicine
PMP Pain Medicine
PLM Palliative Medicine

© 2016 American Medical Association. All rights reserved.
8
Taxonomy Code Physician Specialty
PHM Pharmaceutical Medicine
PHL Phlebology
SME Sleep Medicine
US Unspecified
Combined Residency Training Specialties
EFM Emergency Medicine/Family Medicine
FMP Family Medicine/Preventive Medicine
MEM Internal Medicine/Emergency Medicine
IEC Internal Medicine/Emergency Medicine/Critical Care Medicine
IFP Internal Medicine/Family Medicine
IMA Internal Medicine/Anesthesiology
IMD Internal Medicine/Dermatology
MDG Internal Medicine/Medical Genetics
MN Internal Medicine/Neurology
INM Internal Medicine/Nuclear Medicine
MPD Internal Medicine/Pediatrics
MPM Internal Medicine/Physical Medicine and Rehabilitation
IPM Internal Medicine/Preventive Medicine
MP Internal Medicine/Psychiatry
NRN Neurology/Diagnostic Radiology/Neuroradiology
NNM Neurology/Nuclear Medicine
NPR Neurology/Physical Medicine and Rehabilitation
PDN Pediatrics/Anesthesiology
PDM Pediatrics/Dermatology
EMP Pediatrics/Emergency Medicine
PMG Pediatrics/Medical Genetics
CPP Pediatrics/Psychiatry/Child and Adolescent Psychiatry
PPM Pediatrics/Physical Medicine and Rehabilitation
FPP Psychiatry/Family Medicine
PYN Psychiatry/Neurology

© 2016 American Medical Association. All rights reserved.
9
Non-Physician Specialties
About the source, the CMS NPPES
The Centers for Medicare and Medicaid Services’ (CMS) National Plan and Provider Enumeration System
(NPPES) assigns a National Provider Identifier Standard (NPI) number to healthcare providers for
identification in HIPAA-compliant administrative and financial transactions. When applying for an NPI
number, providers select a Health Care Provider Taxonomy code that best describes their specialization.
NPPES data are updated on a monthly basis, but individual records are only updated when a provider logs
onto the system and makes changes.
The Robert Graham Center completed the data processing for the CMS NPPES data and the AMA Health
Workforce Mapper currently uses NPPES data accessed in January 2016. Data processing involved geocoding
providers’ best available practice address by matching these addresses with a privately maintained and
licensed address database. Once longitude and latitude location attributes were applied to the address data,
they were joined to U.S. Census geography files for geographic boundary identifiers.
Taxonomy Code Non-Physician Specialty
APRN, Certified Clinical Nurse Specialist
364S00000X Clinical Nurse Specialist, General
364SA2100X Acute Care
364SA2200X Adult Health
364SC0200X Critical Care Medicine
364SC1501X Community Health/Public Health
364SC2300X Chronic Care
364SE0003X Emergency
364SE1400X Ethics
364SF0001X Family Health
364SG0600X Gerontology
364SH0200X Home Health
364SH1100X Holistic
364SI0800X Informatics
364SL0600X Long-term Care
364SM0705X Medical-Surgical
364SN0000X Neonatal
364SN0800X Neuroscience
364SP0200X Pediatrics
364SP0807X Psychiatric/Mental Health, Child & Adolescent
364SP0808X Psychiatric/Mental Health
364SP0809X Psychiatric/Mental Health, Adult
364SP0810X Psychiatric/Mental Health, Child & Family
364SP0811X Psychiatric/Mental Health, Chronically Ill
364SP0812X Psychiatric/Mental Health, Community
364SP0813X Psychiatric/Mental Health, Geropsychiatric
364SP1700X Perinatal

© 2016 American Medical Association. All rights reserved.
10
Taxonomy Code Non-Physician Specialty
364SP2800X Perioperative
364SR0400X Rehabilitation
364SS0200X School
364ST0500X Transplantation
364SW0102X Women’s Health
364SX0106X Occupational Health
364SX0200X Oncology
364SX0204X Oncology, Pediatrics
APRN, Certified Nurse Practitioner
363L00000X Nurse Practitioner, General
363LA2100X Acute Care
363LA2200X Adult Health
363LC0200X Critical Care Medicine
363LC1500X Community Health
363LF0000X Family
363LG0600X Gerontology
363LN0000X Neonatal
363LN0005X Neonatal, Critical Care
363LP0200X Pediatrics
363LP0222X Pediatrics, Critical Care
363LP0808X Psychiatric/Mental Health
363LP1700X Perinatal
363LP2300X Primary Care
363LS0200X School
363LW0102X Women’s Health
363LX0001X Obstetrics & Gynecology
363LX0106X Occupational Health
Audiologist
231H00000X Audiologist, General
231HA2400X Audiologist, Assistive Technology Practitioner
Chiropractic
Certified Registered Nurse Anesthetist (CRNA)
Chiropractic
111N00000X Chiropractor
111NI0013X Independent Medical Examiner
111NI0900X Internist
111NN0400X Neurology
111NN1001X Nutrition
111NP0017X Pediatric Chiropractor
111NR0200X Radiology
111NR0400X Rehabilitation
111NS0005X Sports Physician

© 2016 American Medical Association. All rights reserved.
11
Taxonomy Code Non-Physician Specialty
111NT0100X Thermography
111NX0100X Occupational Medicine
111NX0800X Orthopedic
Individual Certified Prosthetist-Orthotist
222Z00000X Orthotist
224P00000X Prosthetist
Midwives
367A00000X Certified Nurse Midwife (CNM)
176B00000X Midwife
175M00000X Midwife, Lay
Occupational Therapist in Private Practice
225X00000X Occupational Therapist
225XE0001X Environmental Modification
225XE1200X Ergonomics
225XF0002X Feeding, Eating &Swallowing
225XG0600X Gerontology
225XH1200X Hand
225XH1300X Human Factors
225XL0004X Low Vision
225XM0800X Mental Health
225XN1300X Neurorehabilitation
225XP0019X Physical Rehabilitation
225XP0200X Pediatrics
225XR0403X Driving and Community Mobility
Optometry
152W00000X Optometrist
152WC0802X Corneal and Contact Management
152WL0500X Low Vision Rehabilitation
152WP0200X Pediatrics
152WS0006X Sports Vision
152WV0400X Vision Therapy
152WX0102X Occupational Vision
156FX1800X Technician
Other Service Providers
171000000X Military Health Care Provider
171100000X Acupuncturist
172V00000X Community Health Worker
174H00000X Health Educator
174N00000X Lactation Consultant, Non-RN
175F00000X Naturopath
175L00000X Homeopath
175M00000X Midwife, Lay

© 2016 American Medical Association. All rights reserved.
12
Taxonomy Code Non-Physician Specialty
176B00000X Midwife
Physical Therapist in Private Practice
225100000X Physical Therapist
2251C2600X Cardiopulmonary
2251E1200X Ergonomics
2251E1300X Electrophysiology, Clinical
2251G0304X Geriatrics
2251H1200X Hand
2251H1300X Human Factors
2251N0400X Neurology
2251P0200X Pediatrics
2251S0007X Sports
2251X0800X Orthopedic
Physician Assistant
363A00000X Physician Assistant, General
363AM0700X Physician Assistant, Medical
363AS0400X Physician Assistant, Surgical
367H00000X Anesthesiology Assistant
Podiatry
213E00000X Podiatrist
213EG0000X General Practice
213EP0504X Public Medicine
213EP1101X Primary Podiatric Medicine
213ER0200X Radiology
213ES0000X Sports Medicine
213ES0103X Foot & Ankle Surgery
213ES0131X Foot Surgery
Psychologist, Clinical
103T00000X Psychologist, General
103TA0400X Addiction (Substance Abuse Disorder)
103TA0700X Adult Development & Aging
103TB0200X Cognitive & Behavioral
103TC0700X Clinical
103TC0700X Psychologist, Clinical, non-specific
103TC1900X Counseling
103TC2200X Clinical Child & Adolescent
103TE1000X Educational
103TE1100X Exercise & Sports
103TF0000X Family
103TF0200X Forensic
103TH0004X Health
103TH0100X Health Service
© 2016 American Medical Association. All rights reserved.
13
Taxonomy Code Non-Physician Specialty
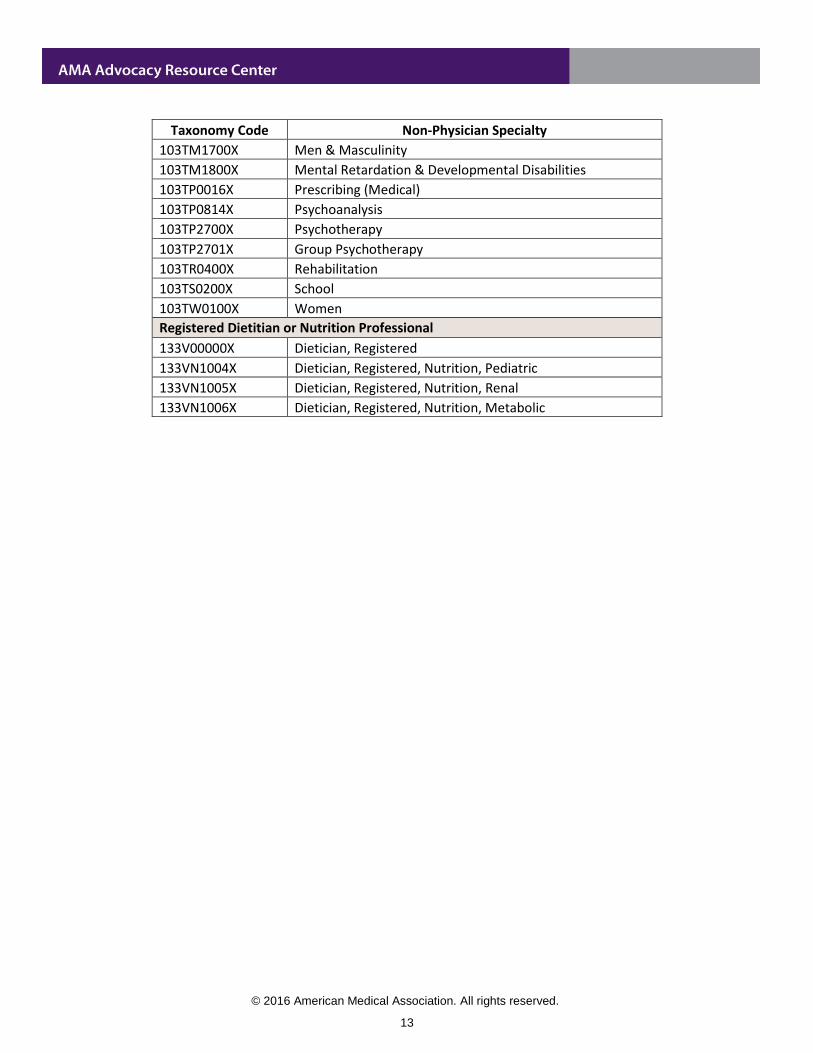
103TM1700X Men & Masculinity
103TM1800X Mental Retardation & Developmental Disabilities
103TP0016X Prescribing (Medical)
103TP0814X Psychoanalysis
103TP2700X Psychotherapy
103TP2701X Group Psychotherapy
103TR0400X Rehabilitation
103TS0200X School
103TW0100X Women
Registered Dietitian or Nutrition Professional
133V00000X Dietician, Registered
133VN1004X Dietician, Registered, Nutrition, Pediatric
133VN1005X Dietician, Registered, Nutrition, Renal
133VN1006X Dietician, Registered, Nutrition, Metabolic
© 2016 American Medical Association. All rights reserved.
14
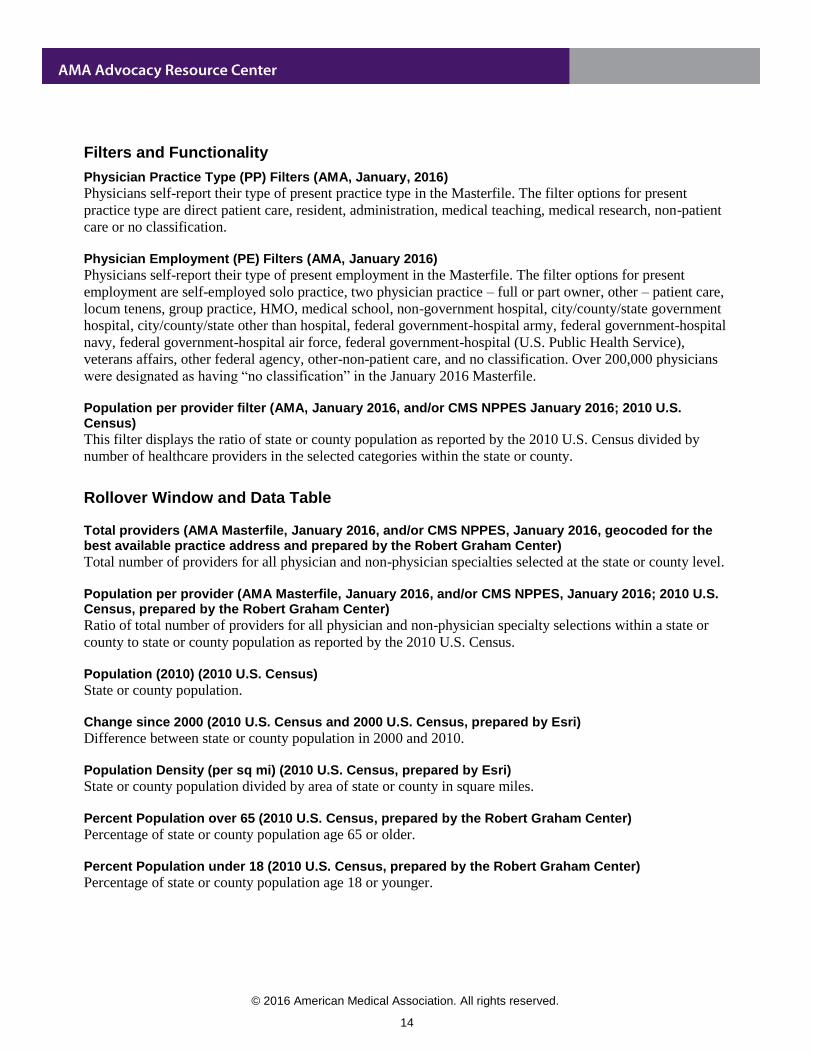
Filters and Functionality
Physician Practice Type (PP) Filters (AMA, January, 2016)
Physicians self-report their type of present practice type in the Masterfile. The filter options for present
practice type are direct patient care, resident, administration, medical teaching, medical research, non-patient
care or no classification.
Physician Employment (PE) Filters (AMA, January 2016)
Physicians self-report their type of present employment in the Masterfile. The filter options for present
employment are self-employed solo practice, two physician practice – full or part owner, other – patient care,
locum tenens, group practice, HMO, medical school, non-government hospital, city/county/state government
hospital, city/county/state other than hospital, federal government-hospital army, federal government-hospital
navy, federal government-hospital air force, federal government-hospital (U.S. Public Health Service),
veterans affairs, other federal agency, other-non-patient care, and no classification. Over 200,000 physicians
were designated as having “no classification” in the January 2016 Masterfile.
Population per provider filter (AMA, January 2016, and/or CMS NPPES January 2016; 2010 U.S. Census)
This filter displays the ratio of state or county population as reported by the 2010 U.S. Census divided by
number of healthcare providers in the selected categories within the state or county.
Rollover Window and Data Table
Total providers (AMA Masterfile, January 2016, and/or CMS NPPES, January 2016, geocoded for the best available practice address and prepared by the Robert Graham Center)
Total number of providers for all physician and non-physician specialties selected at the state or county level.
Population per provider (AMA Masterfile, January 2016, and/or CMS NPPES, January 2016; 2010 U.S. Census, prepared by the Robert Graham Center)
Ratio of total number of providers for all physician and non-physician specialty selections within a state or
county to state or county population as reported by the 2010 U.S. Census.
Population (2010) (2010 U.S. Census)
State or county population.
Change since 2000 (2010 U.S. Census and 2000 U.S. Census, prepared by Esri)
Difference between state or county population in 2000 and 2010.
Population Density (per sq mi) (2010 U.S. Census, prepared by Esri)
State or county population divided by area of state or county in square miles.
Percent Population over 65 (2010 U.S. Census, prepared by the Robert Graham Center)
Percentage of state or county population age 65 or older.
Percent Population under 18 (2010 U.S. Census, prepared by the Robert Graham Center)
Percentage of state or county population age 18 or younger.
© 2016 American Medical Association. All rights reserved.
15
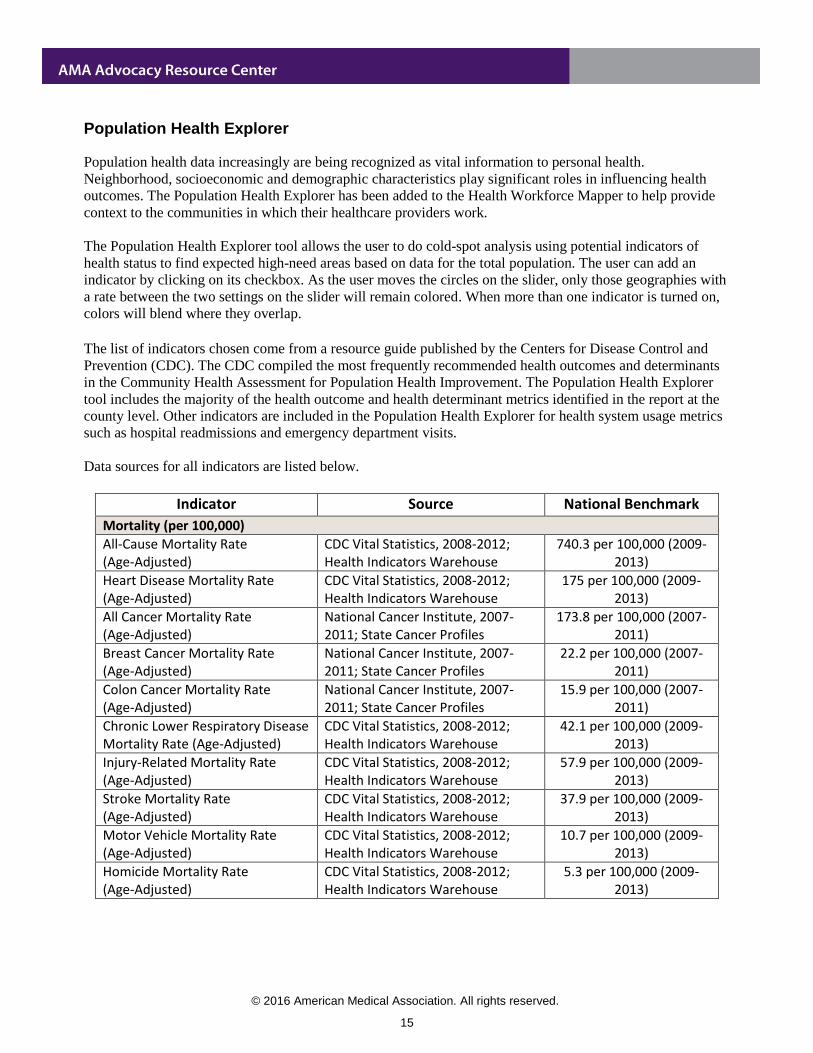
Population Health Explorer
Population health data increasingly are being recognized as vital information to personal health.
Neighborhood, socioeconomic and demographic characteristics play significant roles in influencing health
outcomes. The Population Health Explorer has been added to the Health Workforce Mapper to help provide
context to the communities in which their healthcare providers work.
The Population Health Explorer tool allows the user to do cold-spot analysis using potential indicators of
health status to find expected high-need areas based on data for the total population. The user can add an
indicator by clicking on its checkbox. As the user moves the circles on the slider, only those geographies with
a rate between the two settings on the slider will remain colored. When more than one indicator is turned on,
colors will blend where they overlap. The list of indicators chosen come from a resource guide published by the Centers for Disease Control and
Prevention (CDC). The CDC compiled the most frequently recommended health outcomes and determinants
in the Community Health Assessment for Population Health Improvement. The Population Health Explorer
tool includes the majority of the health outcome and health determinant metrics identified in the report at the
county level. Other indicators are included in the Population Health Explorer for health system usage metrics
such as hospital readmissions and emergency department visits.
Data sources for all indicators are listed below.
Indicator Source National Benchmark
Mortality (per 100,000)
All-Cause Mortality Rate (Age-Adjusted)
CDC Vital Statistics, 2008-2012; Health Indicators Warehouse
740.3 per 100,000 (2009-2013)
Heart Disease Mortality Rate (Age-Adjusted)
CDC Vital Statistics, 2008-2012; Health Indicators Warehouse
175 per 100,000 (2009-2013)
All Cancer Mortality Rate (Age-Adjusted)
National Cancer Institute, 2007-2011; State Cancer Profiles
173.8 per 100,000 (2007-2011)
Breast Cancer Mortality Rate (Age-Adjusted)
National Cancer Institute, 2007-2011; State Cancer Profiles
22.2 per 100,000 (2007-2011)
Colon Cancer Mortality Rate (Age-Adjusted)
National Cancer Institute, 2007-2011; State Cancer Profiles
15.9 per 100,000 (2007-2011)
Chronic Lower Respiratory Disease Mortality Rate (Age-Adjusted)
CDC Vital Statistics, 2008-2012; Health Indicators Warehouse
42.1 per 100,000 (2009-2013)
Injury-Related Mortality Rate (Age-Adjusted)
CDC Vital Statistics, 2008-2012; Health Indicators Warehouse
57.9 per 100,000 (2009-2013)
Stroke Mortality Rate (Age-Adjusted)
CDC Vital Statistics, 2008-2012; Health Indicators Warehouse
37.9 per 100,000 (2009-2013)
Motor Vehicle Mortality Rate (Age-Adjusted)
CDC Vital Statistics, 2008-2012; Health Indicators Warehouse
10.7 per 100,000 (2009-2013)
Homicide Mortality Rate (Age-Adjusted)
CDC Vital Statistics, 2008-2012; Health Indicators Warehouse
5.3 per 100,000 (2009-2013)

© 2016 American Medical Association. All rights reserved.
16
Suicide Mortality Rate (Age-Adjusted)
CDC Vital Statistics, 2008-2012; Health Indicators Warehouse
12.3 per 100,000 (2009-2013)
Morbidity
% Age-Adjusted Obesity CDC Diabetes Surveillance, 2012 28.3% Ages 18 & older (2013)
% Age-Adjusted Diabetes Prevalence
CDC Diabetes Surveillance, 2012 8.5% Ages 18 & older (2011)
% Low Birth Weight CDC NVSS, 2007-2011; Health Indicators Warehouse
8.1% (2009-2013)
Avoidable Hospital Utilization Rate (per 1,000 Medicare Beneficiaries)
CMS, 2013; Geographic Variation PUF
59.3 per 1,000 (2012)
All Cancer Incidence Rate (per 100,000)
National Cancer Institute, 2007-2011; State Cancer Profiles
459.8 per 100,000 (2007-2011)
Breast Cancer Incidence Rate (per 100,000)
National Cancer Institute, 2007-2011; State Cancer Profiles
122.7 per 100,000 (2007-2011)
Colon Cancer Incidence Rate (per 100,000)
National Cancer Institute, 2007-2011; State Cancer Profiles
43.3 per 100,000 (2007-2011)
% Fair or Poor Health BRFSS, 2006-2012; RWJ County Health Rankings
12.4% (2006-2012)
Chlamydia Rate (per 100,000)
CDC STD Surveillance, 2012; Health Indicators Warehouse
453.3 per 100,000 (2012)
HIV Prevalence Rate (per 100,000) National Center for HIV/AIDS, 2010; RWJ County Health Rankings
18.3 per 100,000 (2012)
Health Care (Access & Quality)
% Uninsured (Ages 18-64) SAHIE, 2013 20.4% (2013)
% Uninsured (Under Age 19) SAHIE, 2013 7.5% (2013)
Primary Care Physician Rate (per 100,000)
HRSA ARF, 2012 73.8 per 100,000 (2012)
Dentist Rate (per 100,000) HRSA ARF, 2012 60.1 per 100,000 (2012)
Hospital Readmission Rate CMS, 2013; Geographic Variation PUF
18.6% (2012)
Emergency Department Visit Rate (per 1,000 Medicare Beneficiaries)
CMS, 2013; Geographic Variation PUF
658 per 1,000 (2012)
Health Behaviors
% Smokers BRFSS, 2006-2012; RWJ County Health Rankings
18.1% (2006-2012)
% Age-Adjusted Physical Inactivity CDC Diabetes Surveillance, 2012 30% (2012)
% Lack of Fruits/Vegetables BRFSS, 2005-2009; Health Indicators Warehouse
79.2% (Median)* (2005-2009)
% Excessive Alcohol Use BRFSS, 2006-2012; RWJ County Health Rankings
15% (2006-2012)
% (Age 50 or older) Mammogram BRFSS, 2006-2010; Health Indicators Warehouse
80.4% (Median)* (2006-2010)
% (Age 50 or older) Colon Cancer Screening
BRFSS, 2006-2010; Health Indicators Warehouse
57.8% (Median)* (2006-2010)

© 2016 American Medical Association. All rights reserved.
17
Demographics
Median Age ACS, 2009-2013 21 (2009-2013)
% Age 65 or greater ACS, 2009-2013 3 (2009-2013)
Age Dependency Ratio ACS, 2009-2013 15 (2009-2013)
Male to Female Sex Ratio ACS, 2009-2013 68 (2009-2013)
% White ACS, 2009-2013 3 (2009-2013)
% Black ACS, 2009-2013 0 (2009-2013)
% Hispanic ACS, 2009-2013 0 (2009-2013)
% Asian ACS, 2009-2013 0 (2009-2013)
% Native American/Alaska Native ACS, 2009-2013 0 (2009-2013)
% Hawaiian or Pacific Islander ACS, 2009-2013 0 (2009-2013)
Social Environment
Median Household Income ACS, 2009-2013 $52,250 (2013)
% Below 50% Poverty ACS, 2009-2013 7% (2009-2013)
% Below 100% Poverty ACS, 2009-2013 15.9% (2009-2013)
% Below 200% Poverty ACS, 2009-2013 35% (2009-2013)
% High School Graduates (Highest Level of Education)
ACS, 2009-2013 28.1% (2009-2013)
% High School Graduates or Higher
ACS, 2009-2013 57% (2009-2013)
% Bachelor’s Degree or Higher ACS, 2009-2013 28.8% (2009-2013)
% Unemployed BLS, 2013 8.1% (2013)
% Disabled ACS, 2009-2013 12.1% (2009-2013)
% Foreign Born ACS, 2009-2013 12.9% (2009-2013)
% Language Other than English ACS, 2009-2013 79.3% (2009-2013)
% Single Mother Households (with children under age 18)
ACS, 2009-2013 7.3% (2009-2013)
Total Crime Arrest Rate (per 100,000)
FBI Uniform Crime Report, 2012; ICPSR
3548.8 per 100,000 (2012)
Violent Crime Arrest Rate (per 100,000)
FBI Uniform Crime Report, 2012; ICPSR
387 per 100,000 (2010-2012)
Sexual Offenses Arrest Rate (per 100,000)
FBI Uniform Crime Report, 2012; ICPSR
19.8 per 100,000 (2012)
% Social/Emotional Support
BRFSS, 2006-2010 81.7% (Median)* (2006-2010)

© 2016 American Medical Association. All rights reserved.
18
Optional Layers
U.S. & Census Geography
States: This layer displays U.S. state boundaries.
Counties: This layer displays county and county equivalent boundaries in the 50 states, the District of
Columbia, and Puerto Rico.
Population: State and county population data are from the 2010 U.S. Census.
Metro Areas: This layer displays the counties comprising a Metropolitan Statistical Area (MSA), as defined
by the Office of Management and Budget (OMB). An MSA contains a core urban area with a population of
50,000 or more and consists of the county or counties containing the core urban area, as well as any adjacent
counties that have a high degree of social and economic integration. The level of integration is measured by
patterns of commuting to work. For more information on how MSAs are defined, as well as current definition
files, see: www.census.gov/population/metro/.
ZIP Codes: This layer displays ZIP Code boundaries in the 50 states, the District of Columbia, and Puerto
Rico. ZIP Codes are defined by the U.S. Postal Service.
ZCTAs: This layer displays ZIP Code Tabulation Areas (ZCTAs), which are generalized representations of
US Postal Service ZIP Codes. Currently, each ZCTA is built by aggregating Census 2010 blocks, whose
addresses use a given ZIP Code, into a ZCTA which gets that ZIP Code assigned as its ZCTA code. While in
most instances the ZCTA code equals the ZIP Code for an area, not all ZIP Codes have their own ZCTA. For
more information, see: www.census.gov/geo/reference/zctas.html.
Census Tracts (2010): This layer displays census tracts as defined by the 2010 U.S. Census in the 50 states,
the District of Columbia, and Puerto Rico. Census tracts are small statistical subdivisions of a county defined
for Census data collection.
Census Block Groups (2010): This layer displays census block groups as defined by the 2010 U.S. Census in
the 50 states, the District of Columbia, and Puerto Rico. Block groups are clusters of blocks within census
tracts.
Transportation
All layers come from ESRI ArcGIS 10.1 Data and Maps for ArcGIS Server
Health Care Facilities
Hospitals (Data from CMS, processed and geocoded by, downloaded from, the HRSA Data Warehouse,
updated quarterly): This layer displays the location of all U.S. hospitals.
Health Center Program Grantee Sites (Data from HRSA Data Warehouse, updated quarterly): This layer
displays the locations of service access points/sites of the diverse public and non-profit organizations and
programs that are Health Center Program (HCP) grantees. HCP grantees receive federal funding under
Section 330 of the Public Health Service (PHS) Act, as amended by the Health Centers Consolidated Act of
1996 (P.L. 104-299) and the Safety Net Amendments of 2002. HCP grantee reported service access
points/sites include Community Health Centers, Migrant Health Centers, Health Care for the Homeless
Health Centers, and Primary Care Public Housing Health Centers.
HCP Look-Alikes (Data from HRSA Data Warehouse, updated quarterly): This layer displays the locations of
service access points/sites of the diverse public and non-profit organizations and programs that are Health
Center Program (HCP) look-alikes. HCP look alike service access points are health centers that operate and
© 2016 American Medical Association. All rights reserved.
19
provide services consistent with all statutory, regulatory, and policy requirements that apply to Health Center
Program grantees, but do not receive funding under section 330.
Rural Health Clinics (Data from CMS, processed and geocoded by, downloaded from, the HRSA Data
Warehouse, updated quarterly): This layer displays the location of all active Rural Health Clinics, as defined
by Title XVIII, Section 1861(aa) of the Social Security Act, regardless of whether they receive facility or
point HPSA (health professional shortage area) designation. For more information, see:
www.raconline.org/topics/rural-health-clinics.
Facility and Point HPSAs (Data from HRSA Data Warehouse, updated quarterly): This layer displays the
locations of six additional types of federally-linked provider delivery sites which have HPSA (health
professional shortage area) designation (HCP look-alikes, Rural Health Clinics, Alaskan Native Tribal
Population Facilities, Indian Health Service Facilities, Native American Tribal Population Facilities and
Comprehensive Health Centers).
Critical Access Hospital (Data from CMS, processed and geocoded by, downloaded from, the HRSA Data
Warehouse, updated quarterly): This layer displays the locations of Critical Access Hospitals. According to
CMS, “A Critical Access Hospital (CAH) is a hospital certified under a set of Medicare Conditions of
Participation (CoP), which are structured differently than the acute care hospital CoP. Some of the
requirements for CAH certification include having no more than 25 inpatient beds; maintaining an annual
average length of stay of no more than 96 hours for acute inpatient care; offering 24-hour, 7-day-a-week
emergency care; and being located in a rural area, at least a 35-mile drive away from any other hospital or
CAH (fewer in some circumstances).” 2
Health Policy
Primary Care HPSAs (Data from HRSA Data Warehouse, updated quarterly): This layer displays primary
medical care Health Professional Shortage Areas (HPSAs), which may be designated as having a shortage of
primary medical care, may be urban or rural areas, population groups, or medical or other public facilities. For
more information, see: www.hrsa.gov/shortage/.
MUA/Ps (Data from HRSA Data Warehouse, updated quarterly): This layer displays Medically Underserved
Areas/Populations (MUA/Ps), which may be a whole county or a group of contiguous counties, a group of
county or minor civil divisions, a group of urban census tracts in which residents have a shortage of personal
health services, or Exceptional/Governor designated. Medically Underserved Populations (MUPs) may
include groups of persons who face economic, cultural or linguistic barriers to health care. For more
information, see: www.hrsa.gov/shortage/mua/index.html.
Primary Care Service Areas (Dartmouth Atlas of Healthcare 2007): As defined by the Dartmouth Atlas of
Healthcare, Primary Care Service Areas are aggregates of ZIP Codes reflecting Medicare patient travel to
primary care providers.3
Hospital Referral Regions (Dartmouth Atlas of Healthcare 2010): As defined by the Dartmouth Atlas of
Healthcare, Hospital Referral Regions “represent regional healthcare markets for tertiary medical care that
generally requires the services of a major referral center.”4
114th Congressional District Boundaries (Esri): This layer displays United States House of Representatives
district boundaries for the 114th Congress (2014-present), as well as the party of each sitting representative.
2 www.hrsa.gov/healthit/toolbox/RuralHealthITtoolbox/Introduction/critical.html
3 www.dartmouthatlas.org/data/region/
4 www.dartmouthatlas.org/data/region/

© 2016 American Medical Association. All rights reserved.
20
In the traditional color scheme, red shading indicates a Republican representative and blue shading indicates a
Democratic representative.
Related Documents


