Copyright © 2022 A.M. Best Rating Services, Inc. and/or its subsidiaries. ALL RIGHTS RESERVED. No part of this report may be distributed in any electronic form or by any means, or stored in a database or retrieval system, without the prior written permission of A.M. Best Rating Services Inc. Refer to our terms of use for additional details. A.M. BEST RATING SERVICES, INC. A.M. Best Rating Services, Inc. 2021 Ratings Performance Measurement Statistics for Exhibit 1 Form NRSRO

Welcome message from author
This document is posted to help you gain knowledge. Please leave a comment to let me know what you think about it! Share it to your friends and learn new things together.
Transcript
Copyright © 2022 A.M. Best Rating Services, Inc. and/or its subsidiaries. ALL RIGHTS RESERVED. No part of this report may be distributed in any electronic form or by any means, or stored in a database or retrieval system, without the prior written permission of A.M. Best Rating Services Inc. Refer to our terms of use for additional details.
A.M. BEST RATING SERVICES, INC.
A.M. Best Rating Services, Inc.2021 Ratings Performance Measurement
Statistics for Exhibit 1 Form NRSRO
Copyright © 2022 A.M. Best Rating Services, Inc. and/or its subsidiaries. ALL RIGHTS RESERVED. No part of this report may be distributed in any electronic form or by any means, or stored in a database or retrieval system, without the prior written permission of A.M. Best Rating Services Inc. Refer to our terms of use for additional details.
2
A.M. BEST RATING SERVICES, INC.
Page Table Title Table Number3 Insurance Companies (Financial Strength Ratings) – 1-Year Transition and Default Rates Table 14 Insurance Companies (Financial Strength Ratings) – 3-Year Transition and Default Rates Table 25678
Insurance Companies (Financial Strength Ratings) – 10-Year Transition and Default Rates Insurance Companies (Issuer Credit Ratings) – 1-Year Transition and Default RatesInsurance Companies (Issuer Credit Ratings) – 3-Year Transition and Default RatesInsurance Companies (Issuer Credit Ratings) – 10-Year Transition and Default Rates
Table 3Table 4Table 5Table 6
9 Insurance Companies (Short-Term Ratings) – 1-Year Transition and Default Rates Table 710 Insurance Companies (Short-Term Ratings) – 3-Year Transition and Default Rates Table 811 Insurance Companies (Short-Term Ratings) – 10-Year Transition and Default Rates Table 912 Corporate Issuers – 1-Year Transition and Default Rates Table 1013 Corporate Issuers – 3-Year Transition and Default Rates Table 1114 Corporate Issuers – 10-Year Transition and Default Rates Table 1215 Asset-Backed Securities: RMBS – 1-Year Transition and Default Rates Table 1316 Asset-Backed Securities: RMBS – 3-Year Transition and Default Rates Table 1417 Asset-Backed Securities: RMBS – 10-Year Transition and Default Rates Table 1518 Asset-Backed Securities: CMBS – 1-Year Transition and Default Rates Table 1619 Asset-Backed Securities: CMBS – 3-Year Transition and Default Rates Table 1720 Asset-Backed Securities: CMBS – 10-Year Transition and Default Rates Table 1821 Asset-Backed Securities: CLOs – 1-Year Transition and Default Rates Table 1922 Asset-Backed Securities: CLOs – 3-Year Transition and Default Rates Table 2023 Asset-Backed Securities: CLOs – 10-Year Transition and Default Rates Table 2124 Asset-Backed Securities: CDOs – 1-Year Transition and Default Rates Table 2225 Asset-Backed Securities: CDOs – 3-Year Transition and Default Rates Table 2326 Asset-Backed Securities: CDOs – 10-Year Transition and Default Rates Table 2427 Asset-Backed Securities: ABCP – 1-Year Transition and Default Rates Table 2528 Asset-Backed Securities: ABCP – 3-Year Transition and Default Rates Table 2629 Asset-Backed Securities: ABCP – 10-Year Transition and Default Rates Table 2730 Asset-Backed Securities: Other ABS – 1-Year Transition and Default Rates Table 2831 Asset-Backed Securities: Other ABS – 3-Year Transition and Default Rates Table 2932 Asset-Backed Securities: Other ABS – 10-Year Transition and Default Rates Table 3033 Asset-Backed Securities: Other SFPs – 1-Year Transition and Default Rates Table 3134 Asset-Backed Securities: Other SFPs – 3-Year Transition and Default Rates Table 3235 Asset-Backed Securities: Other SFPs – 10-Year Transition and Default Rates Table 3336 Definitions & Credit Rating Histories N/A
Copyright © 2022 A.M. Best Rating Services, Inc. and/or its subsidiaries. ALL RIGHTS RESERVED. No part of this report may be distributed in any electronic form or by any means, or stored in a database or retrieval system, without the prior written permission of A.M. Best Rating Services Inc. Refer to our terms of use for additional details.
3
A.M. BEST RATING SERVICES, INC.
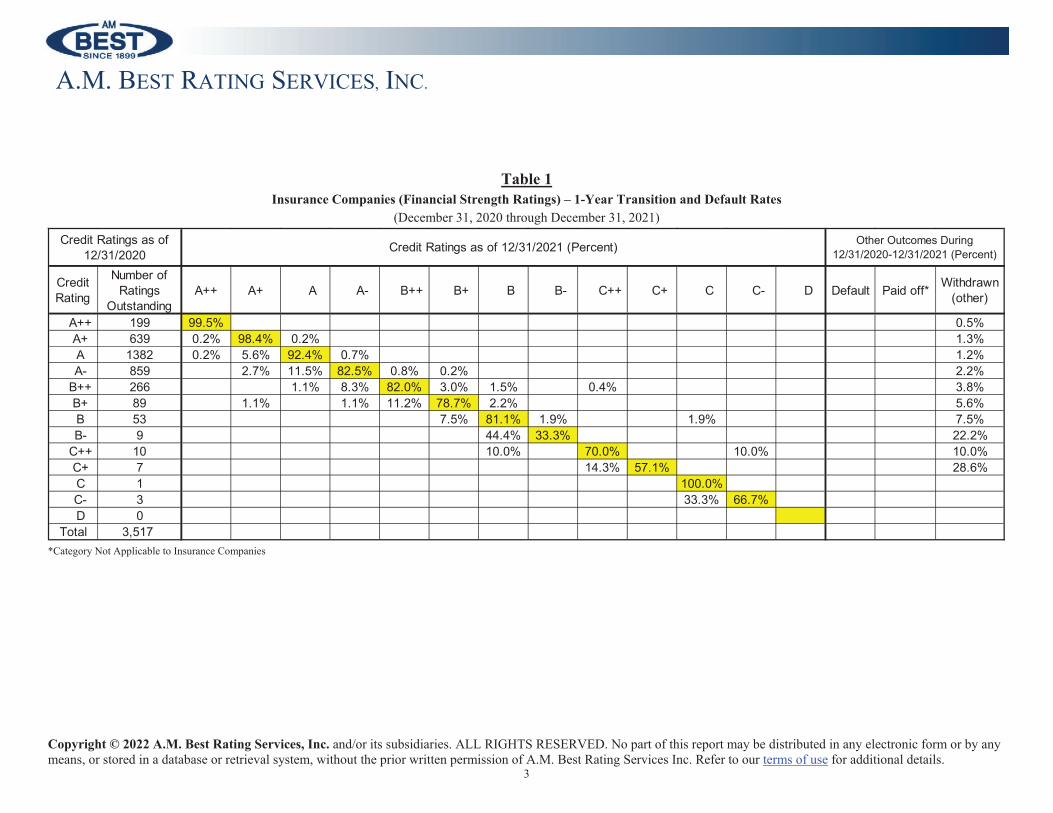
Table 1Insurance Companies (Financial Strength Ratings) – 1-Year Transition and Default Rates
(December 31, 2020 through December 31, 2021)
*Category Not Applicable to Insurance Companies
Credit Rating
Number of Ratings
OutstandingA++ A+ A A- B++ B+ B B- C++ C+ C C- D Default Paid off* Withdrawn
(other)
A++ 199 99.5% 0.5% A+ 639 0.2% 98.4% 0.2% 1.3% A 1382 0.2% 5.6% 92.4% 0.7% 1.2% A- 859 2.7% 11.5% 82.5% 0.8% 0.2% 2.2%
B++ 266 1.1% 8.3% 82.0% 3.0% 1.5% 0.4% 3.8% B+ 89 1.1% 1.1% 11.2% 78.7% 2.2% 5.6% B 53 7.5% 81.1% 1.9% 1.9% 7.5% B- 9 44.4% 33.3% 22.2%
C++ 10 10.0% 70.0% 10.0% 10.0% C+ 7 14.3% 57.1% 28.6% C 1 100.0% C- 3 33.3% 66.7% D 0Total 3,517
Credit Ratings as of 12/31/2020 Credit Ratings as of 12/31/2021 (Percent) Other Outcomes During
12/31/2020-12/31/2021 (Percent)
Copyright © 2022 A.M. Best Rating Services, Inc. and/or its subsidiaries. ALL RIGHTS RESERVED. No part of this report may be distributed in any electronic form or by any means, or stored in a database or retrieval system, without the prior written permission of A.M. Best Rating Services Inc. Refer to our terms of use for additional details.
4
A.M. BEST RATING SERVICES, INC.
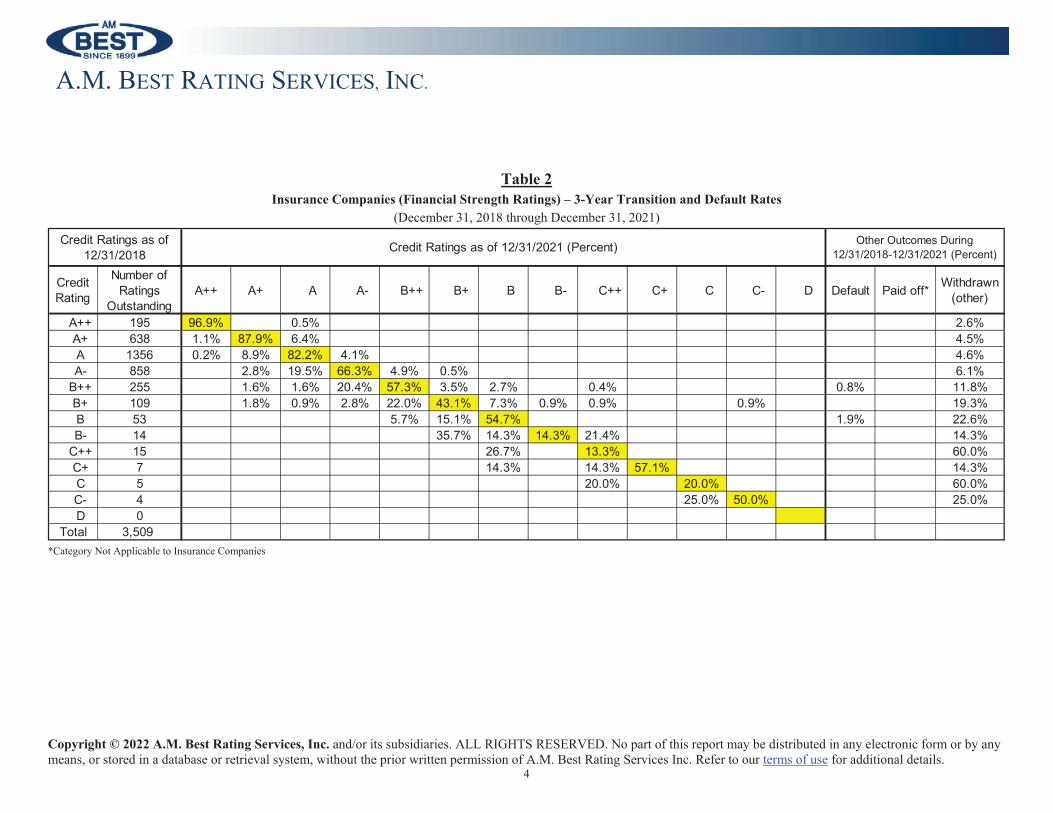
Table 2Insurance Companies (Financial Strength Ratings) – 3-Year Transition and Default Rates
(December 31, 2018 through December 31, 2021)
*Category Not Applicable to Insurance Companies
Credit Rating
Number of Ratings
OutstandingA++ A+ A A- B++ B+ B B- C++ C+ C C- D Default Paid off* Withdrawn
(other)
A++ 195 96.9% 0.5% 2.6% A+ 638 1.1% 87.9% 6.4% 4.5% A 1356 0.2% 8.9% 82.2% 4.1% 4.6% A- 858 2.8% 19.5% 66.3% 4.9% 0.5% 6.1%
B++ 255 1.6% 1.6% 20.4% 57.3% 3.5% 2.7% 0.4% 0.8% 11.8% B+ 109 1.8% 0.9% 2.8% 22.0% 43.1% 7.3% 0.9% 0.9% 0.9% 19.3% B 53 5.7% 15.1% 54.7% 1.9% 22.6% B- 14 35.7% 14.3% 14.3% 21.4% 14.3%
C++ 15 26.7% 13.3% 60.0% C+ 7 14.3% 14.3% 57.1% 14.3% C 5 20.0% 20.0% 60.0% C- 4 25.0% 50.0% 25.0% D 0Total 3,509
Other Outcomes During 12/31/2018-12/31/2021 (Percent)
Credit Ratings as of 12/31/2018 Credit Ratings as of 12/31/2021 (Percent)
Copyright © 2022 A.M. Best Rating Services, Inc. and/or its subsidiaries. ALL RIGHTS RESERVED. No part of this report may be distributed in any electronic form or by any means, or stored in a database or retrieval system, without the prior written permission of A.M. Best Rating Services Inc. Refer to our terms of use for additional details.
5
A.M. BEST RATING SERVICES, INC.
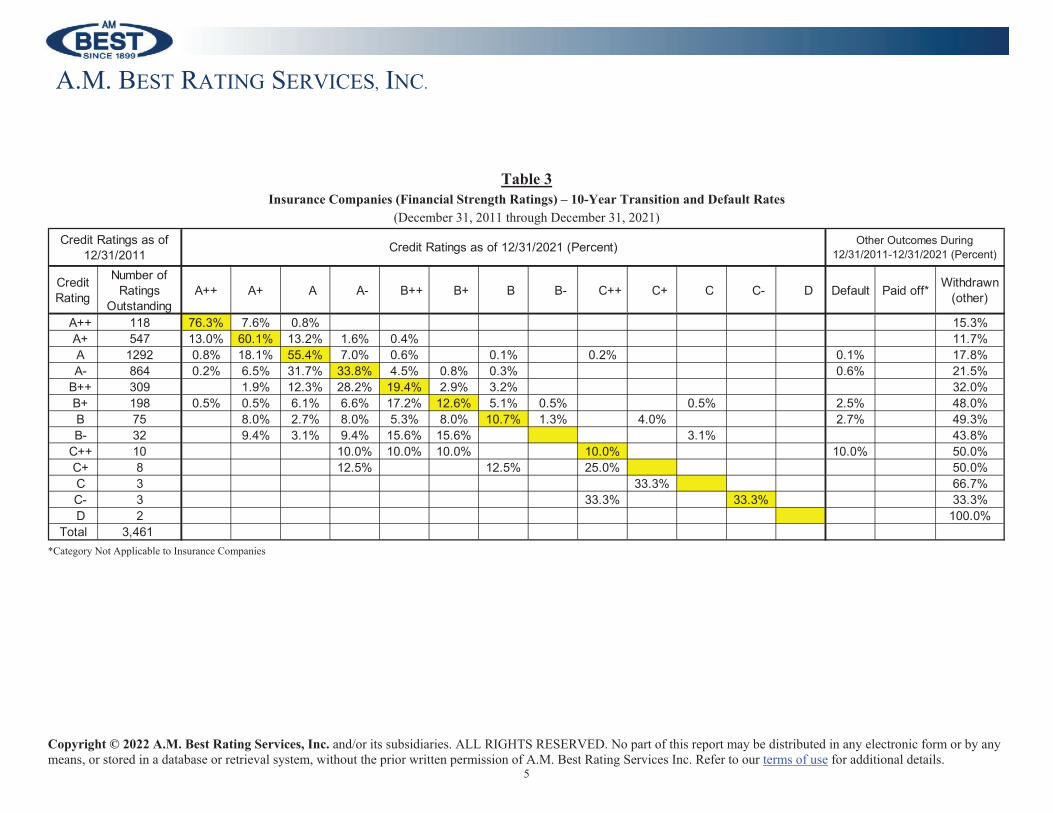
Table 3Insurance Companies (Financial Strength Ratings) – 10-Year Transition and Default Rates
(December 31, 2011 through December 31, 2021)
*Category Not Applicable to Insurance Companies
Credit Rating
Number of Ratings
OutstandingA++ A+ A A- B++ B+ B B- C++ C+ C C- D Default Paid off* Withdrawn
(other)
A++ 118 76.3% 7.6% 0.8% 15.3% A+ 547 13.0% 60.1% 13.2% 1.6% 0.4% 11.7% A 1292 0.8% 18.1% 55.4% 7.0% 0.6% 0.1% 0.2% 0.1% 17.8% A- 864 0.2% 6.5% 31.7% 33.8% 4.5% 0.8% 0.3% 0.6% 21.5%
B++ 309 1.9% 12.3% 28.2% 19.4% 2.9% 3.2% 32.0% B+ 198 0.5% 0.5% 6.1% 6.6% 17.2% 12.6% 5.1% 0.5% 0.5% 2.5% 48.0% B 75 8.0% 2.7% 8.0% 5.3% 8.0% 10.7% 1.3% 4.0% 2.7% 49.3% B- 32 9.4% 3.1% 9.4% 15.6% 15.6% 3.1% 43.8%
C++ 10 10.0% 10.0% 10.0% 10.0% 10.0% 50.0% C+ 8 12.5% 12.5% 25.0% 50.0% C 3 33.3% 66.7% C- 3 33.3% 33.3% 33.3% D 2 100.0%Total 3,461
Other Outcomes During 12/31/2011-12/31/2021 (Percent)
Credit Ratings as of 12/31/2011 Credit Ratings as of 12/31/2021 (Percent)
Copyright © 2022 A.M. Best Rating Services, Inc. and/or its subsidiaries. ALL RIGHTS RESERVED. No part of this report may be distributed in any electronic form or by any means, or stored in a database or retrieval system, without the prior written permission of A.M. Best Rating Services Inc. Refer to our terms of use for additional details.
6
A.M. BEST RATING SERVICES, INC.
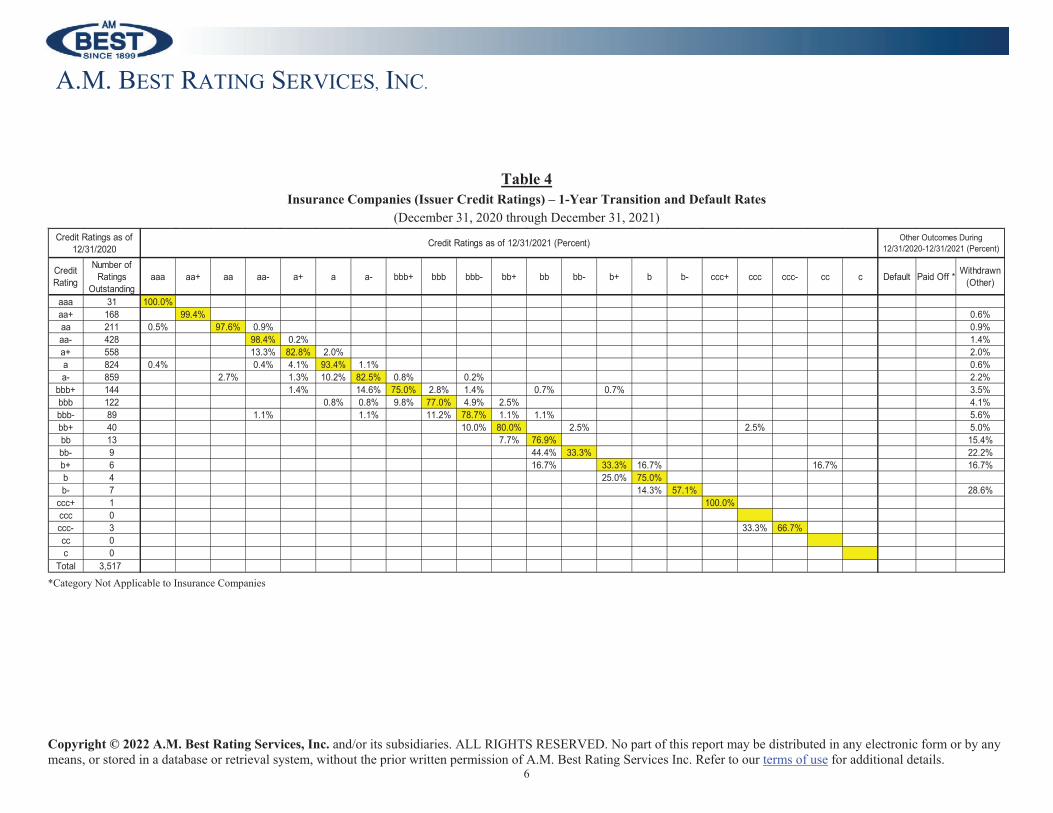
Table 4Insurance Companies (Issuer Credit Ratings) – 1-Year Transition and Default Rates
(December 31, 2020 through December 31, 2021)
*Category Not Applicable to Insurance Companies
Credit Rating
Number of Ratings
Outstandingaaa aa+ aa aa- a+ a a- bbb+ bbb bbb- bb+ bb bb- b+ b b- ccc+ ccc ccc- cc c Default Paid Off * Withdrawn
(Other)
aaa 31 100.0%aa+ 168 99.4% 0.6%aa 211 0.5% 97.6% 0.9% 0.9%aa- 428 98.4% 0.2% 1.4%a+ 558 13.3% 82.8% 2.0% 2.0%a 824 0.4% 0.4% 4.1% 93.4% 1.1% 0.6%a- 859 2.7% 1.3% 10.2% 82.5% 0.8% 0.2% 2.2%
bbb+ 144 1.4% 14.6% 75.0% 2.8% 1.4% 0.7% 0.7% 3.5%bbb 122 0.8% 0.8% 9.8% 77.0% 4.9% 2.5% 4.1%bbb- 89 1.1% 1.1% 11.2% 78.7% 1.1% 1.1% 5.6%bb+ 40 10.0% 80.0% 2.5% 2.5% 5.0%bb 13 7.7% 76.9% 15.4%bb- 9 44.4% 33.3% 22.2%b+ 6 16.7% 33.3% 16.7% 16.7% 16.7%b 4 25.0% 75.0%b- 7 14.3% 57.1% 28.6%
ccc+ 1 100.0%ccc 0ccc- 3 33.3% 66.7%cc 0c 0
Total 3,517
Credit Ratings as of 12/31/2020 Credit Ratings as of 12/31/2021 (Percent) Other Outcomes During
12/31/2020-12/31/2021 (Percent)
Copyright © 2022 A.M. Best Rating Services, Inc. and/or its subsidiaries. ALL RIGHTS RESERVED. No part of this report may be distributed in any electronic form or by any means, or stored in a database or retrieval system, without the prior written permission of A.M. Best Rating Services Inc. Refer to our terms of use for additional details.
7
A.M. BEST RATING SERVICES, INC.
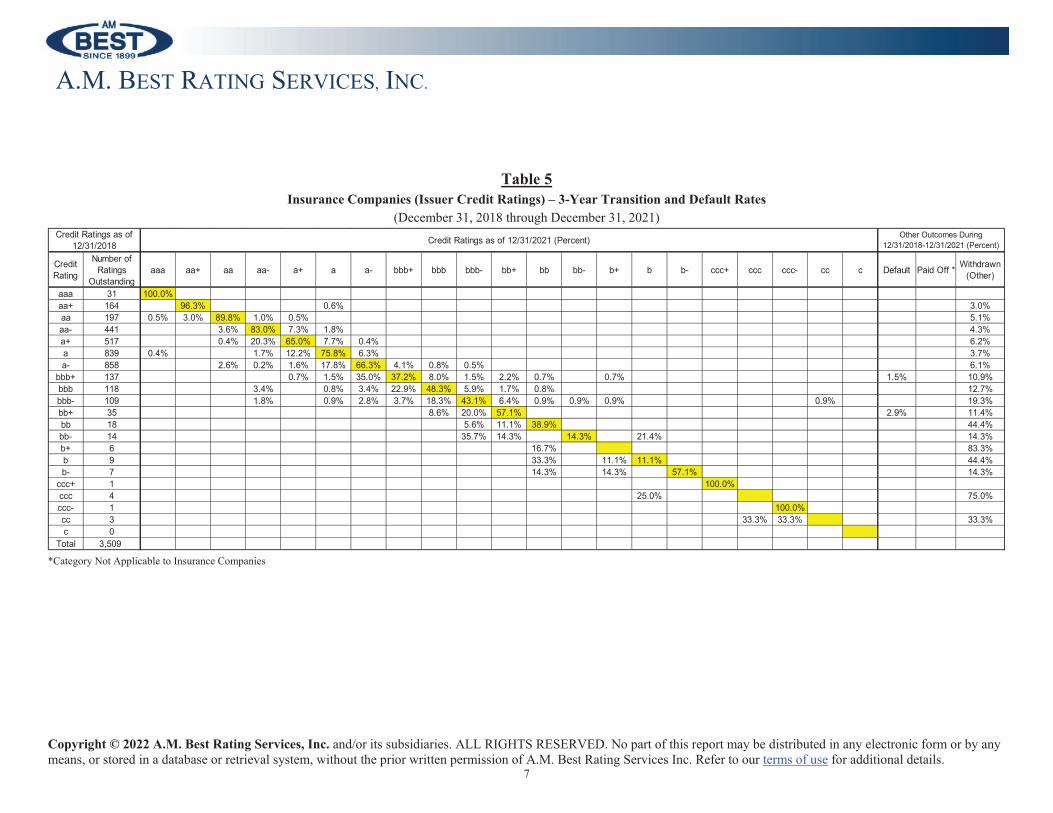
Table 5Insurance Companies (Issuer Credit Ratings) – 3-Year Transition and Default Rates
(December 31, 2018 through December 31, 2021)
*Category Not Applicable to Insurance Companies
Credit Rating
Number of Ratings
Outstandingaaa aa+ aa aa- a+ a a- bbb+ bbb bbb- bb+ bb bb- b+ b b- ccc+ ccc ccc- cc c Default Paid Off * Withdrawn
(Other)
aaa 31 100.0%aa+ 164 96.3% 0.6% 3.0%aa 197 0.5% 3.0% 89.8% 1.0% 0.5% 5.1%aa- 441 3.6% 83.0% 7.3% 1.8% 4.3%a+ 517 0.4% 20.3% 65.0% 7.7% 0.4% 6.2%a 839 0.4% 1.7% 12.2% 75.8% 6.3% 3.7%a- 858 2.6% 0.2% 1.6% 17.8% 66.3% 4.1% 0.8% 0.5% 6.1%
bbb+ 137 0.7% 1.5% 35.0% 37.2% 8.0% 1.5% 2.2% 0.7% 0.7% 1.5% 10.9%bbb 118 3.4% 0.8% 3.4% 22.9% 48.3% 5.9% 1.7% 0.8% 12.7%bbb- 109 1.8% 0.9% 2.8% 3.7% 18.3% 43.1% 6.4% 0.9% 0.9% 0.9% 0.9% 19.3%bb+ 35 8.6% 20.0% 57.1% 2.9% 11.4%bb 18 5.6% 11.1% 38.9% 44.4%bb- 14 35.7% 14.3% 14.3% 21.4% 14.3%b+ 6 16.7% 83.3%b 9 33.3% 11.1% 11.1% 44.4%b- 7 14.3% 14.3% 57.1% 14.3%
ccc+ 1 100.0%ccc 4 25.0% 75.0%ccc- 1 100.0%cc 3 33.3% 33.3% 33.3%c 0
Total 3,509
Credit Ratings as of 12/31/2018 Credit Ratings as of 12/31/2021 (Percent) Other Outcomes During
12/31/2018-12/31/2021 (Percent)
Copyright © 2022 A.M. Best Rating Services, Inc. and/or its subsidiaries. ALL RIGHTS RESERVED. No part of this report may be distributed in any electronic form or by any means, or stored in a database or retrieval system, without the prior written permission of A.M. Best Rating Services Inc. Refer to our terms of use for additional details.
8
A.M. BEST RATING SERVICES, INC.
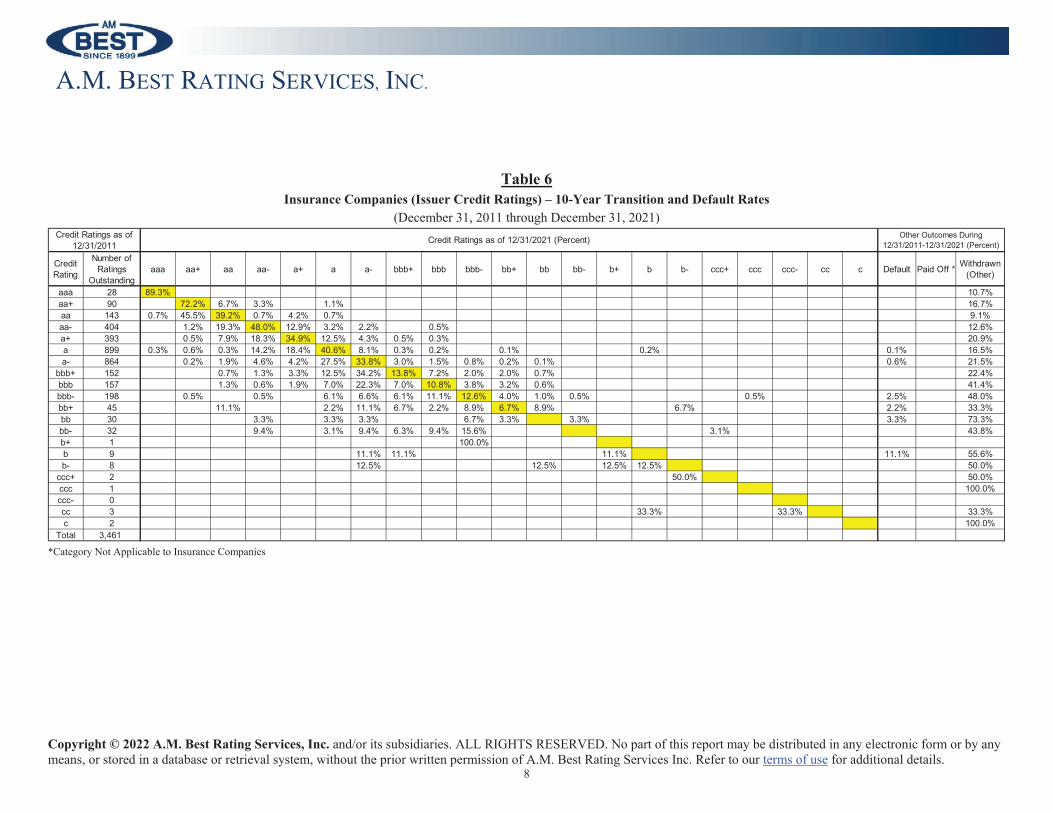
Table 6Insurance Companies (Issuer Credit Ratings) – 10-Year Transition and Default Rates
(December 31, 2011 through December 31, 2021)
*Category Not Applicable to Insurance Companies
Credit Rating
Number of Ratings
Outstandingaaa aa+ aa aa- a+ a a- bbb+ bbb bbb- bb+ bb bb- b+ b b- ccc+ ccc ccc- cc c Default Paid Off * Withdrawn
(Other)
aaa 28 89.3% 10.7%aa+ 90 72.2% 6.7% 3.3% 1.1% 16.7%aa 143 0.7% 45.5% 39.2% 0.7% 4.2% 0.7% 9.1%aa- 404 1.2% 19.3% 48.0% 12.9% 3.2% 2.2% 0.5% 12.6%a+ 393 0.5% 7.9% 18.3% 34.9% 12.5% 4.3% 0.5% 0.3% 20.9%a 899 0.3% 0.6% 0.3% 14.2% 18.4% 40.6% 8.1% 0.3% 0.2% 0.1% 0.2% 0.1% 16.5%a- 864 0.2% 1.9% 4.6% 4.2% 27.5% 33.8% 3.0% 1.5% 0.8% 0.2% 0.1% 0.6% 21.5%
bbb+ 152 0.7% 1.3% 3.3% 12.5% 34.2% 13.8% 7.2% 2.0% 2.0% 0.7% 22.4%bbb 157 1.3% 0.6% 1.9% 7.0% 22.3% 7.0% 10.8% 3.8% 3.2% 0.6% 41.4%bbb- 198 0.5% 0.5% 6.1% 6.6% 6.1% 11.1% 12.6% 4.0% 1.0% 0.5% 0.5% 2.5% 48.0%bb+ 45 11.1% 2.2% 11.1% 6.7% 2.2% 8.9% 6.7% 8.9% 6.7% 2.2% 33.3%bb 30 3.3% 3.3% 3.3% 6.7% 3.3% 3.3% 3.3% 73.3%bb- 32 9.4% 3.1% 9.4% 6.3% 9.4% 15.6% 3.1% 43.8%b+ 1 100.0%b 9 11.1% 11.1% 11.1% 11.1% 55.6%b- 8 12.5% 12.5% 12.5% 12.5% 50.0%
ccc+ 2 50.0% 50.0%ccc 1 100.0%ccc- 0cc 3 33.3% 33.3% 33.3%c 2 100.0%
Total 3,461
Credit Ratings as of 12/31/2011 Credit Ratings as of 12/31/2021 (Percent) Other Outcomes During
12/31/2011-12/31/2021 (Percent)
Copyright © 2022 A.M. Best Rating Services, Inc. and/or its subsidiaries. ALL RIGHTS RESERVED. No part of this report may be distributed in any electronic form or by any means, or stored in a database or retrieval system, without the prior written permission of A.M. Best Rating Services Inc. Refer to our terms of use for additional details.
9
A.M. BEST RATING SERVICES, INC.
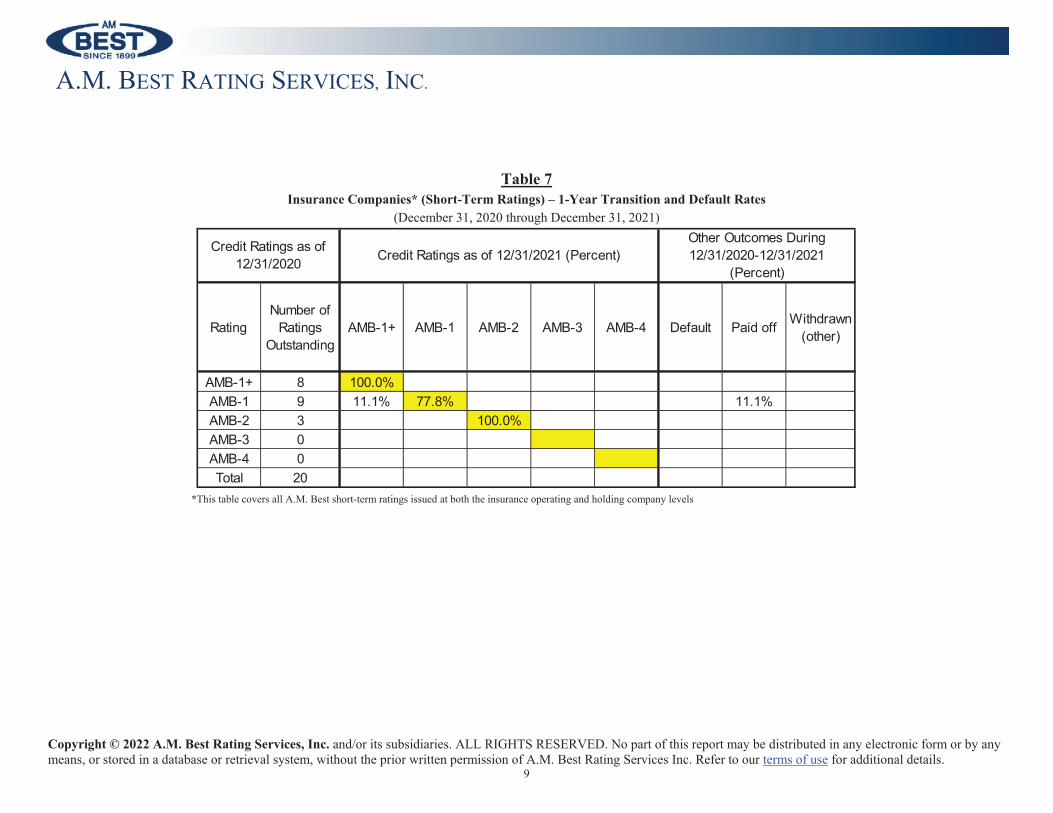
Table 7Insurance Companies* (Short-Term Ratings) – 1-Year Transition and Default Rates
(December 31, 2020 through December 31, 2021)
*This table covers all A.M. Best short-term ratings issued at both the insurance operating and holding company levels
RatingNumber of
Ratings Outstanding
AMB-1+ AMB-1 AMB-2 AMB-3 AMB-4 Default Paid off Withdrawn (other)
AMB-1+ 8 100.0%AMB-1 9 11.1% 77.8% 11.1%AMB-2 3 100.0%AMB-3 0AMB-4 0Total 20
Credit Ratings as of 12/31/2020 Credit Ratings as of 12/31/2021 (Percent)
Other Outcomes During 12/31/2020-12/31/2021
(Percent)
Copyright © 2022 A.M. Best Rating Services, Inc. and/or its subsidiaries. ALL RIGHTS RESERVED. No part of this report may be distributed in any electronic form or by any means, or stored in a database or retrieval system, without the prior written permission of A.M. Best Rating Services Inc. Refer to our terms of use for additional details.
10
A.M. BEST RATING SERVICES, INC.
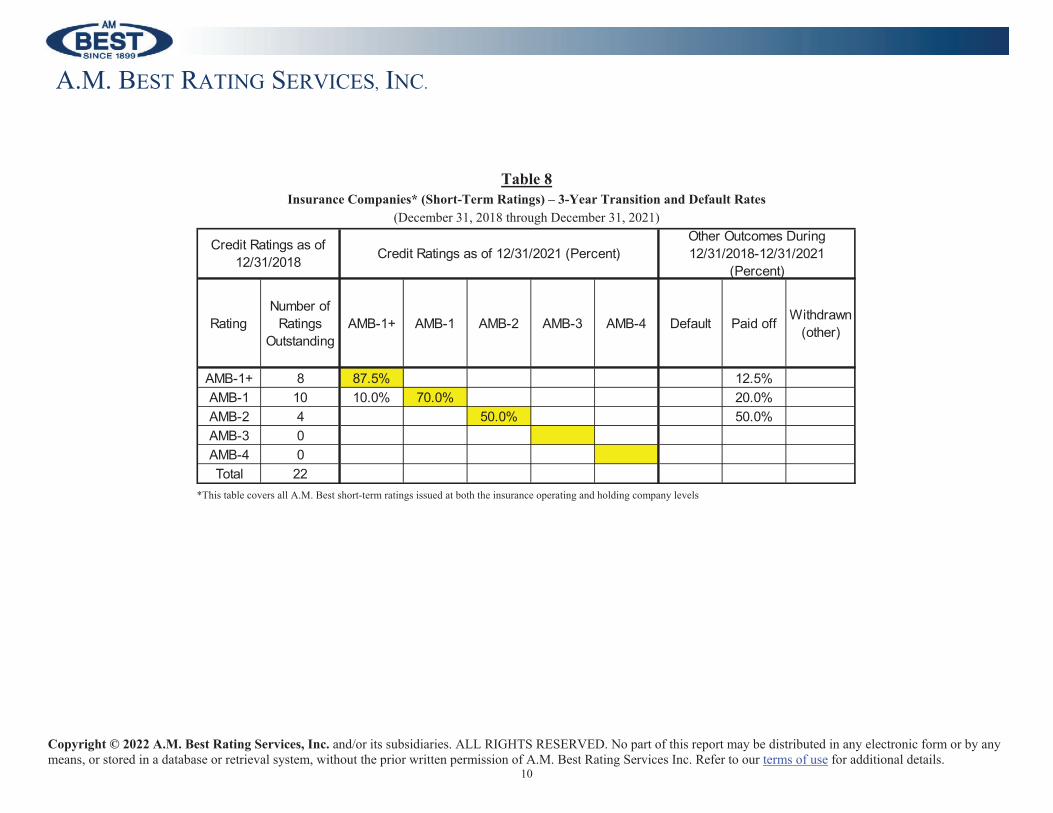
Table 8Insurance Companies* (Short-Term Ratings) – 3-Year Transition and Default Rates
(December 31, 2018 through December 31, 2021)
*This table covers all A.M. Best short-term ratings issued at both the insurance operating and holding company levels
RatingNumber of
Ratings Outstanding
AMB-1+ AMB-1 AMB-2 AMB-3 AMB-4 Default Paid off Withdrawn (other)
AMB-1+ 8 87.5% 12.5%AMB-1 10 10.0% 70.0% 20.0%AMB-2 4 50.0% 50.0%AMB-3 0AMB-4 0Total 22
Credit Ratings as of 12/31/2018 Credit Ratings as of 12/31/2021 (Percent)
Other Outcomes During 12/31/2018-12/31/2021
(Percent)

Copyright © 2022 A.M. Best Rating Services, Inc. and/or its subsidiaries. ALL RIGHTS RESERVED. No part of this report may be distributed in any electronic form or by any means, or stored in a database or retrieval system, without the prior written permission of A.M. Best Rating Services Inc. Refer to our terms of use for additional details.
11
A.M. BEST RATING SERVICES, INC.
Table 9Insurance Companies* (Short-Term Ratings) – 10-Year Transition and Default Rates
(December 31, 2011 through December 31, 2021)
*This table covers all A.M. Best short-term ratings issued at both the insurance operating and holding company levels
RatingNumber of
Ratings Outstanding
AMB-1+ AMB-1 AMB-2 AMB-3 AMB-4 Default Paid off Withdrawn (other)
AMB-1+ 7 57.1% 42.9%AMB-1 11 27.3% 45.5% 27.3%AMB-2 8 12.5% 12.5% 12.5% 62.5%AMB-3 0AMB-4 0Total 26
Credit Ratings as of 12/31/2011 Credit Ratings as of 12/31/2021 (Percent)
Other Outcomes During 12/31/2011-12/31/2021
(Percent)

Copyright © 2022 A.M. Best Rating Services, Inc. and/or its subsidiaries. ALL RIGHTS RESERVED. No part of this report may be distributed in any electronic form or by any means, or stored in a database or retrieval system, without the prior written permission of A.M. Best Rating Services Inc. Refer to our terms of use for additional details.
12
A.M. BEST RATING SERVICES, INC.
Table 10Corporate Issuers – 1-Year Transition and Default Rates
(December 31, 2020 through December 31, 2021)
*Category Applicable to Insurance-Linked Securities
Credit Rating
Number of Ratings
Outstandingaaa aa+ aa aa- a+ a a- bbb+ bbb bbb- bb+ bb bb- b+ b b- ccc+ ccc ccc- cc c Default Paid Off * Withdrawn
(Other)
aaa 2 100.0%aa+ 1 100.0%aa 0aa- 0a+ 6 100.0%a 18 100.0%a- 30 3.3% 96.7%
bbb+ 27 7.4% 88.9% 3.7%bbb 33 6.1% 84.8% 3.0% 6.1%bbb- 37 2.7% 5.4% 86.5% 5.4%bb+ 2 50.0% 50.0%bb 4 50.0% 25.0% 25.0%bb- 0b+ 2 50.0% 50.0%b 2 100.0%b- 0
ccc+ 1 100.0%ccc 0ccc- 0cc 0c 0
Total 165
Credit Ratings as of 12/31/2020 Credit Ratings as of 12/31/2021 (Percent) Other Outcomes During 12/31/2020-
12/31/2021 (Percent)
Copyright © 2022 A.M. Best Rating Services, Inc. and/or its subsidiaries. ALL RIGHTS RESERVED. No part of this report may be distributed in any electronic form or by any means, or stored in a database or retrieval system, without the prior written permission of A.M. Best Rating Services Inc. Refer to our terms of use for additional details.
13
A.M. BEST RATING SERVICES, INC.
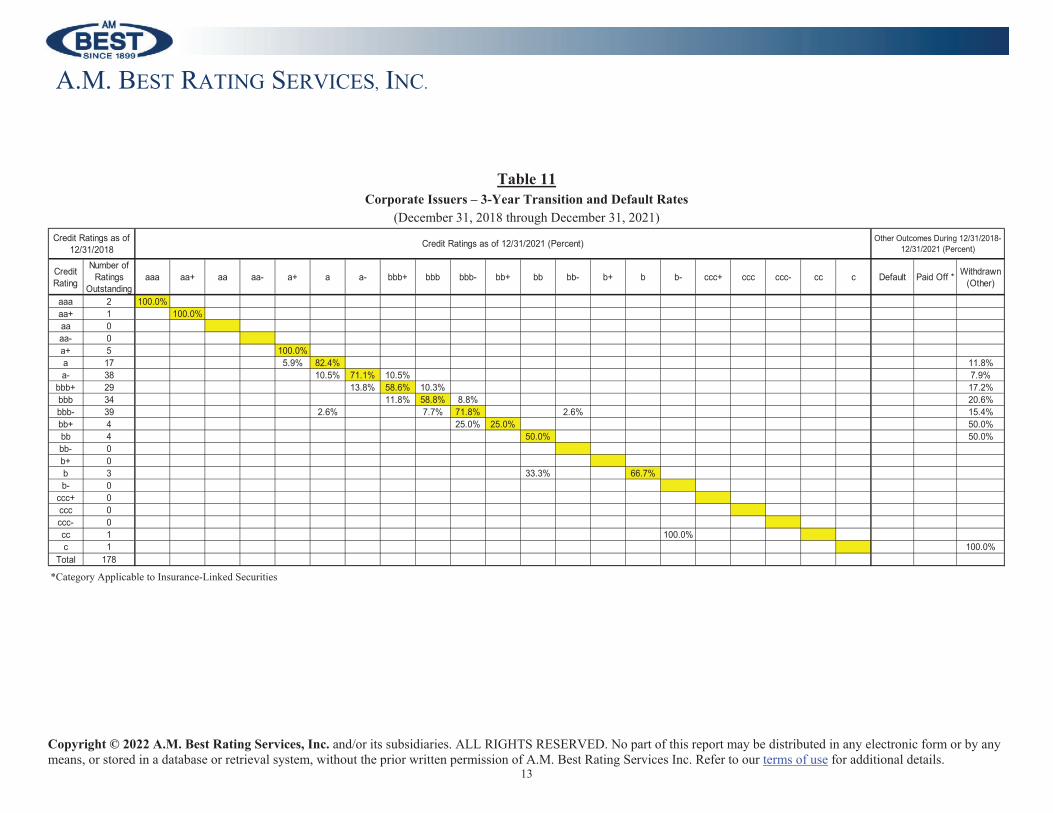
Table 11Corporate Issuers – 3-Year Transition and Default Rates
(December 31, 2018 through December 31, 2021)
*Category Applicable to Insurance-Linked Securities
Credit Rating
Number of Ratings
Outstandingaaa aa+ aa aa- a+ a a- bbb+ bbb bbb- bb+ bb bb- b+ b b- ccc+ ccc ccc- cc c Default Paid Off * Withdrawn
(Other)
aaa 2 100.0%aa+ 1 100.0%aa 0aa- 0a+ 5 100.0%a 17 5.9% 82.4% 11.8%a- 38 10.5% 71.1% 10.5% 7.9%
bbb+ 29 13.8% 58.6% 10.3% 17.2%bbb 34 11.8% 58.8% 8.8% 20.6%bbb- 39 2.6% 7.7% 71.8% 2.6% 15.4%bb+ 4 25.0% 25.0% 50.0%bb 4 50.0% 50.0%bb- 0b+ 0b 3 33.3% 66.7%b- 0
ccc+ 0ccc 0ccc- 0cc 1 100.0%c 1 100.0%
Total 178
Credit Ratings as of 12/31/2018 Credit Ratings as of 12/31/2021 (Percent) Other Outcomes During 12/31/2018-
12/31/2021 (Percent)
Copyright © 2022 A.M. Best Rating Services, Inc. and/or its subsidiaries. ALL RIGHTS RESERVED. No part of this report may be distributed in any electronic form or by any means, or stored in a database or retrieval system, without the prior written permission of A.M. Best Rating Services Inc. Refer to our terms of use for additional details.
14
A.M. BEST RATING SERVICES, INC.
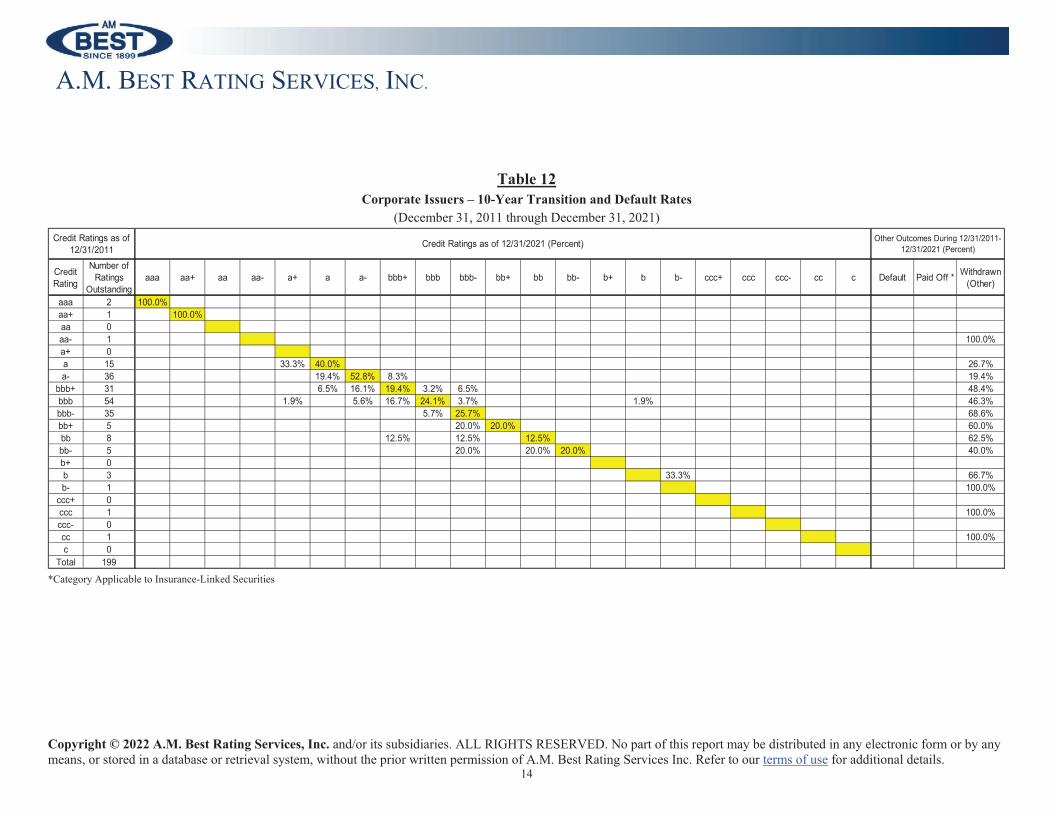
Table 12Corporate Issuers – 10-Year Transition and Default Rates
(December 31, 2011 through December 31, 2021)
*Category Applicable to Insurance-Linked Securities
Credit Rating
Number of Ratings
Outstandingaaa aa+ aa aa- a+ a a- bbb+ bbb bbb- bb+ bb bb- b+ b b- ccc+ ccc ccc- cc c Default Paid Off * Withdrawn
(Other)
aaa 2 100.0%aa+ 1 100.0%aa 0aa- 1 100.0%a+ 0a 15 33.3% 40.0% 26.7%a- 36 19.4% 52.8% 8.3% 19.4%
bbb+ 31 6.5% 16.1% 19.4% 3.2% 6.5% 48.4%bbb 54 1.9% 5.6% 16.7% 24.1% 3.7% 1.9% 46.3%bbb- 35 5.7% 25.7% 68.6%bb+ 5 20.0% 20.0% 60.0%bb 8 12.5% 12.5% 12.5% 62.5%bb- 5 20.0% 20.0% 20.0% 40.0%b+ 0b 3 33.3% 66.7%b- 1 100.0%
ccc+ 0ccc 1 100.0%ccc- 0cc 1 100.0%c 0
Total 199
Credit Ratings as of 12/31/2011 Credit Ratings as of 12/31/2021 (Percent) Other Outcomes During 12/31/2011-
12/31/2021 (Percent)
Copyright © 2022 A.M. Best Rating Services, Inc. and/or its subsidiaries. ALL RIGHTS RESERVED. No part of this report may be distributed in any electronic form or by any means, or stored in a database or retrieval system, without the prior written permission of A.M. Best Rating Services Inc. Refer to our terms of use for additional details.
15
A.M. BEST RATING SERVICES, INC.
Table 13Asset-Backed Securities: RMBS*– 1-Year Transition and Default Rates
(December 31, 2020 through December 31, 2021)
* No ratings associated with this credit rating subclass

Copyright © 2022 A.M. Best Rating Services, Inc. and/or its subsidiaries. ALL RIGHTS RESERVED. No part of this report may be distributed in any electronic form or by any means, or stored in a database or retrieval system, without the prior written permission of A.M. Best Rating Services Inc. Refer to our terms of use for additional details.
16
A.M. BEST RATING SERVICES, INC.
Table 14Asset-Backed Securities: RMBS*– 3-Year Transition and Default Rates
(December 31, 2018 through December 31, 2021)
* No ratings associated with this credit rating subclass

Copyright © 2022 A.M. Best Rating Services, Inc. and/or its subsidiaries. ALL RIGHTS RESERVED. No part of this report may be distributed in any electronic form or by any means, or stored in a database or retrieval system, without the prior written permission of A.M. Best Rating Services Inc. Refer to our terms of use for additional details.
17
A.M. BEST RATING SERVICES, INC.
Table 15Asset-Backed Securities: RMBS*– 10-Year Transition and Default Rates
(December 31, 2011 through December 31, 2021)
* No ratings associated with this credit rating subclass

Copyright © 2022 A.M. Best Rating Services, Inc. and/or its subsidiaries. ALL RIGHTS RESERVED. No part of this report may be distributed in any electronic form or by any means, or stored in a database or retrieval system, without the prior written permission of A.M. Best Rating Services Inc. Refer to our terms of use for additional details.
18
A.M. BEST RATING SERVICES, INC.
Table 16Asset-Backed Securities: CMBS*– 1-Year Transition and Default Rates
(December 31, 2020 through December 31, 2021)
* No ratings associated with this credit rating subclass
Copyright © 2022 A.M. Best Rating Services, Inc. and/or its subsidiaries. ALL RIGHTS RESERVED. No part of this report may be distributed in any electronic form or by any means, or stored in a database or retrieval system, without the prior written permission of A.M. Best Rating Services Inc. Refer to our terms of use for additional details.
19
A.M. BEST RATING SERVICES, INC.
Table 17Asset-Backed Securities: CMBS*– 3-Year Transition and Default Rates
(December 31, 2018 through December 31, 2021)
* No ratings associated with this credit rating subclass

Copyright © 2022 A.M. Best Rating Services, Inc. and/or its subsidiaries. ALL RIGHTS RESERVED. No part of this report may be distributed in any electronic form or by any means, or stored in a database or retrieval system, without the prior written permission of A.M. Best Rating Services Inc. Refer to our terms of use for additional details.
20
A.M. BEST RATING SERVICES, INC.
Table 18Asset-Backed Securities: CMBS*– 10-Year Transition and Default Rates
(December 31, 2011 through December 31, 2021)
* No ratings associated with this credit rating subclass

Copyright © 2022 A.M. Best Rating Services, Inc. and/or its subsidiaries. ALL RIGHTS RESERVED. No part of this report may be distributed in any electronic form or by any means, or stored in a database or retrieval system, without the prior written permission of A.M. Best Rating Services Inc. Refer to our terms of use for additional details.
21
A.M. BEST RATING SERVICES, INC.
Table 19Asset-Backed Securities: CLOs*– 1-Year Transition and Default Rates
(December 31, 2020 through December 31, 2021)
* No ratings associated with this credit rating subclass

Copyright © 2022 A.M. Best Rating Services, Inc. and/or its subsidiaries. ALL RIGHTS RESERVED. No part of this report may be distributed in any electronic form or by any means, or stored in a database or retrieval system, without the prior written permission of A.M. Best Rating Services Inc. Refer to our terms of use for additional details.
22
A.M. BEST RATING SERVICES, INC.
Table 20Asset-Backed Securities: CLOs*– 3-Year Transition and Default Rates
(December 31, 2018 through December 31, 2021)
* No ratings associated with this credit rating subclass

Copyright © 2022 A.M. Best Rating Services, Inc. and/or its subsidiaries. ALL RIGHTS RESERVED. No part of this report may be distributed in any electronic form or by any means, or stored in a database or retrieval system, without the prior written permission of A.M. Best Rating Services Inc. Refer to our terms of use for additional details.
23
A.M. BEST RATING SERVICES, INC.
Table 21Asset-Backed Securities: CLOs* – 10-Year Transition and Default Rates
(December 31, 2011 through December 31, 2021)
* No ratings associated with this credit rating subclass

Copyright © 2022 A.M. Best Rating Services, Inc. and/or its subsidiaries. ALL RIGHTS RESERVED. No part of this report may be distributed in any electronic form or by any means, or stored in a database or retrieval system, without the prior written permission of A.M. Best Rating Services Inc. Refer to our terms of use for additional details.
24
A.M. BEST RATING SERVICES, INC.
Table 22Asset-Backed Securities: CDOs – 1-Year Transition and Default Rates
(December 31, 2020 through December 31, 2021)
* No ratings associated with this credit rating subclass

Copyright © 2022 A.M. Best Rating Services, Inc. and/or its subsidiaries. ALL RIGHTS RESERVED. No part of this report may be distributed in any electronic form or by any means, or stored in a database or retrieval system, without the prior written permission of A.M. Best Rating Services Inc. Refer to our terms of use for additional details.
25
A.M. BEST RATING SERVICES, INC.
Table 23Asset-Backed Securities: CDOs – 3-Year Transition and Default Rates
(December 31, 2018 through December 31, 2021)
* No ratings associated with this credit rating subclass
Copyright © 2022 A.M. Best Rating Services, Inc. and/or its subsidiaries. ALL RIGHTS RESERVED. No part of this report may be distributed in any electronic form or by any means, or stored in a database or retrieval system, without the prior written permission of A.M. Best Rating Services Inc. Refer to our terms of use for additional details.
26
A.M. BEST RATING SERVICES, INC.
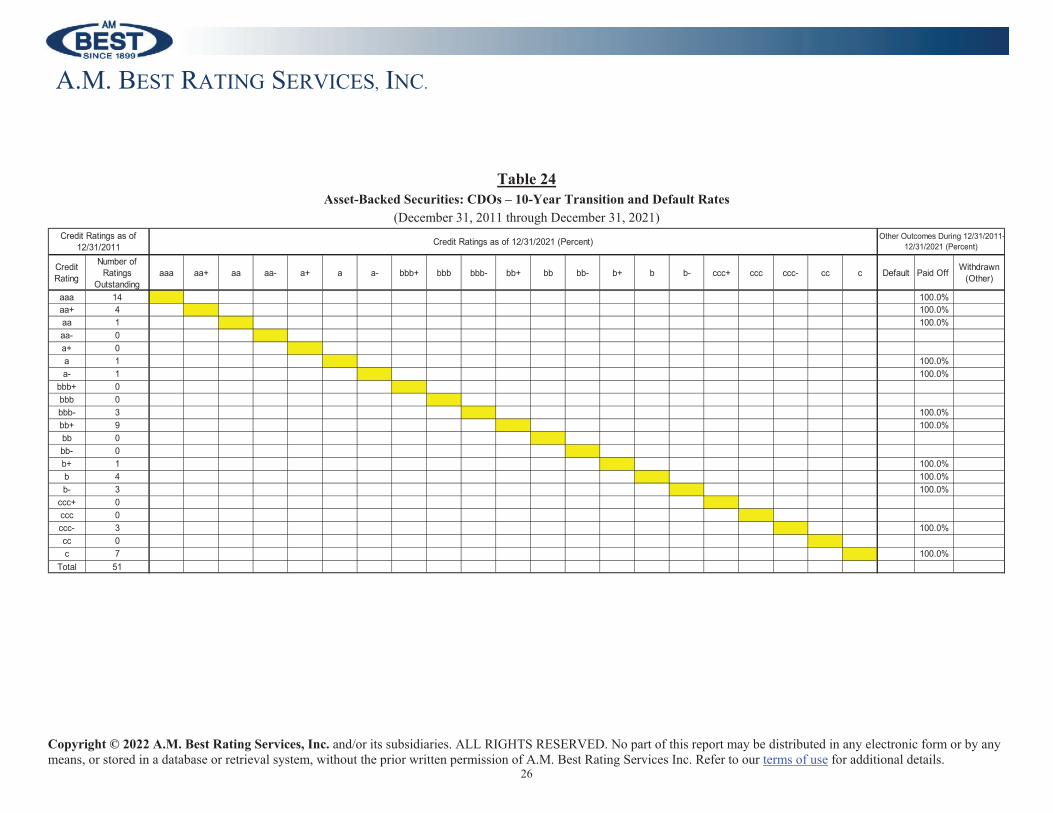
Table 24Asset-Backed Securities: CDOs – 10-Year Transition and Default Rates
(December 31, 2011 through December 31, 2021)
Credit Rating
Number of Ratings
Outstandingaaa aa+ aa aa- a+ a a- bbb+ bbb bbb- bb+ bb bb- b+ b b- ccc+ ccc ccc- cc c Default Paid Off Withdrawn
(Other)
aaa 14 100.0%aa+ 4 100.0%aa 1 100.0%aa- 0a+ 0a 1 100.0%a- 1 100.0%
bbb+ 0bbb 0bbb- 3 100.0%bb+ 9 100.0%bb 0bb- 0b+ 1 100.0%b 4 100.0%b- 3 100.0%
ccc+ 0ccc 0ccc- 3 100.0%cc 0c 7 100.0%
Total 51
Credit Ratings as of 12/31/2011 Credit Ratings as of 12/31/2021 (Percent) Other Outcomes During 12/31/2011-
12/31/2021 (Percent)

Copyright © 2022 A.M. Best Rating Services, Inc. and/or its subsidiaries. ALL RIGHTS RESERVED. No part of this report may be distributed in any electronic form or by any means, or stored in a database or retrieval system, without the prior written permission of A.M. Best Rating Services Inc. Refer to our terms of use for additional details.
27
A.M. BEST RATING SERVICES, INC.
Table 25Asset-Backed Securities: ABCP– 1-Year Transition and Default Rates*
(December 31, 2020 through December 31, 2021)
* No ratings associated with this subclass of credit ratings for this term

Copyright © 2022 A.M. Best Rating Services, Inc. and/or its subsidiaries. ALL RIGHTS RESERVED. No part of this report may be distributed in any electronic form or by any means, or stored in a database or retrieval system, without the prior written permission of A.M. Best Rating Services Inc. Refer to our terms of use for additional details.
28
A.M. BEST RATING SERVICES, INC.
Table 26Asset-Backed Securities: ABCP– 3-Year Transition and Default Rates*
(December 31, 2018 through December 31, 2021)
* No ratings associated with this subclass of credit ratings for this term

Copyright © 2022 A.M. Best Rating Services, Inc. and/or its subsidiaries. ALL RIGHTS RESERVED. No part of this report may be distributed in any electronic form or by any means, or stored in a database or retrieval system, without the prior written permission of A.M. Best Rating Services Inc. Refer to our terms of use for additional details.
29
A.M. BEST RATING SERVICES, INC.
Table 27Asset-Backed Securities: ABCP– 10-Year Transition and Default Rates*
(December 31, 2011 through December 31, 2021)
* No ratings associated with this subclass of credit ratings for this term

Copyright © 2022 A.M. Best Rating Services, Inc. and/or its subsidiaries. ALL RIGHTS RESERVED. No part of this report may be distributed in any electronic form or by any means, or stored in a database or retrieval system, without the prior written permission of A.M. Best Rating Services Inc. Refer to our terms of use for additional details.
30
A.M. BEST RATING SERVICES, INC.
Table 28Asset-Backed Securities: Other ABS*– 1-Year Transition and Default Rates
(December 31, 2020 through December 31, 2021)
* No ratings associated with this credit rating subclass

Copyright © 2022 A.M. Best Rating Services, Inc. and/or its subsidiaries. ALL RIGHTS RESERVED. No part of this report may be distributed in any electronic form or by any means, or stored in a database or retrieval system, without the prior written permission of A.M. Best Rating Services Inc. Refer to our terms of use for additional details.
31
A.M. BEST RATING SERVICES, INC.
Table 29Asset-Backed Securities: Other ABS*– 3-Year Transition and Default Rates
(December 31, 2018 through December 31, 2021)
* No ratings associated with this credit rating subclass
Copyright © 2022 A.M. Best Rating Services, Inc. and/or its subsidiaries. ALL RIGHTS RESERVED. No part of this report may be distributed in any electronic form or by any means, or stored in a database or retrieval system, without the prior written permission of A.M. Best Rating Services Inc. Refer to our terms of use for additional details.
32
A.M. BEST RATING SERVICES, INC.
Table 30Asset-Backed Securities: Other ABS*– 10-Year Transition and Default Rates
(December 31, 2011 through December 31, 2021)
* No ratings associated with this credit rating subclass

Copyright © 2022 A.M. Best Rating Services, Inc. and/or its subsidiaries. ALL RIGHTS RESERVED. No part of this report may be distributed in any electronic form or by any means, or stored in a database or retrieval system, without the prior written permission of A.M. Best Rating Services Inc. Refer to our terms of use for additional details.
33
A.M. BEST RATING SERVICES, INC.
Table 31Asset-Backed Securities: Other SFPs* – 1-Year Transition and Default Rates
(December 31, 2020 through December 31, 2021)
*The products included in this subclass relate to life settlements, annuities and structured settlements.
Credit Rating
Number of Ratings
Outstandingaaa aa+ aa aa- a+ a a- bbb+ bbb bbb- bb+ bb bb- b+ b b- ccc+ ccc ccc- cc c Default Paid Off Withdrawn
(Other)
aaa 2 100.0%aa+ 2 100.0%aa 0aa- 0a+ 0a 0a- 0
bbb+ 0bbb 1 100.0%bbb- 0bb+ 0bb 0bb- 0b+ 0b 0b- 0
ccc+ 0ccc 0ccc- 0cc 0c 0
Total 5
Other Outcomes During 12/31/2020-12/31/2021 (Percent)
Credit Ratings as of 12/31/2020 Credit Ratings as of 12/31/2021 (Percent)
Copyright © 2022 A.M. Best Rating Services, Inc. and/or its subsidiaries. ALL RIGHTS RESERVED. No part of this report may be distributed in any electronic form or by any means, or stored in a database or retrieval system, without the prior written permission of A.M. Best Rating Services Inc. Refer to our terms of use for additional details.
34
A.M. BEST RATING SERVICES, INC.
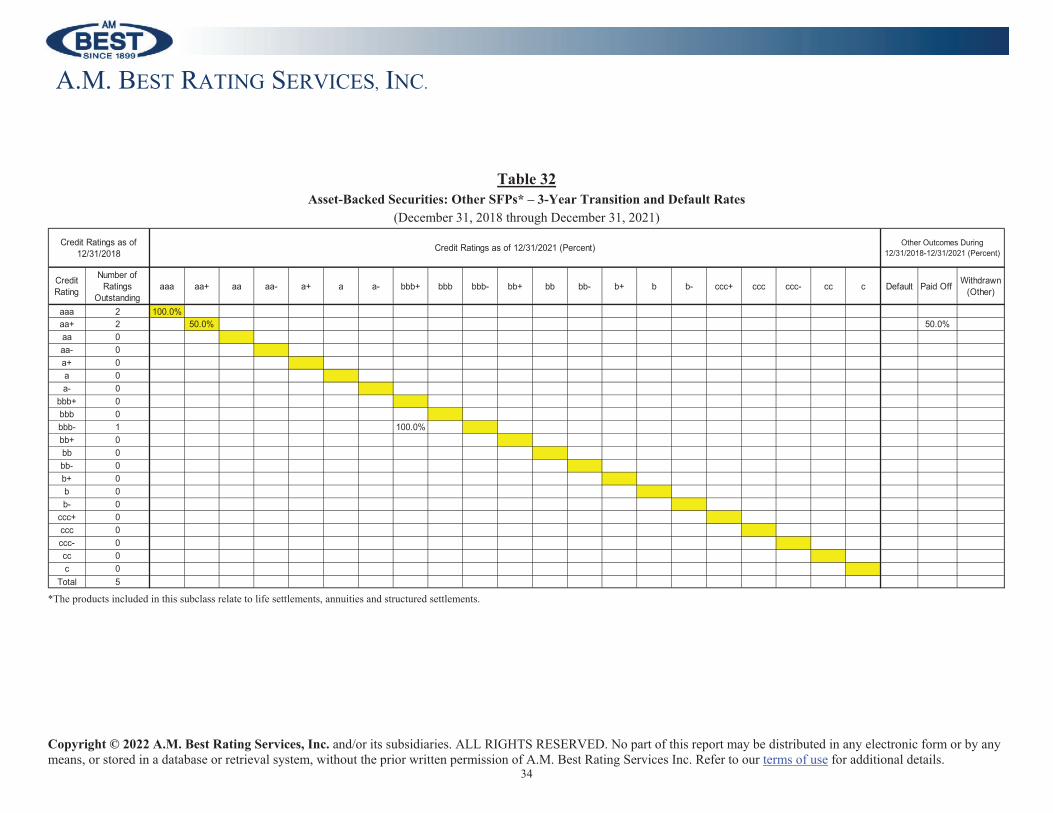
Table 32Asset-Backed Securities: Other SFPs* – 3-Year Transition and Default Rates
(December 31, 2018 through December 31, 2021)
*The products included in this subclass relate to life settlements, annuities and structured settlements.
Credit Rating
Number of Ratings
Outstandingaaa aa+ aa aa- a+ a a- bbb+ bbb bbb- bb+ bb bb- b+ b b- ccc+ ccc ccc- cc c Default Paid Off Withdrawn
(Other)
aaa 2 100.0%aa+ 2 50.0% 50.0%aa 0aa- 0a+ 0a 0a- 0
bbb+ 0bbb 0bbb- 1 100.0%bb+ 0bb 0bb- 0b+ 0b 0b- 0
ccc+ 0ccc 0ccc- 0cc 0c 0
Total 5
Credit Ratings as of 12/31/2021 (Percent) Other Outcomes During 12/31/2018-12/31/2021 (Percent)
Credit Ratings as of 12/31/2018
Copyright © 2022 A.M. Best Rating Services, Inc. and/or its subsidiaries. ALL RIGHTS RESERVED. No part of this report may be distributed in any electronic form or by any means, or stored in a database or retrieval system, without the prior written permission of A.M. Best Rating Services Inc. Refer to our terms of use for additional details.
35
A.M. BEST RATING SERVICES, INC.
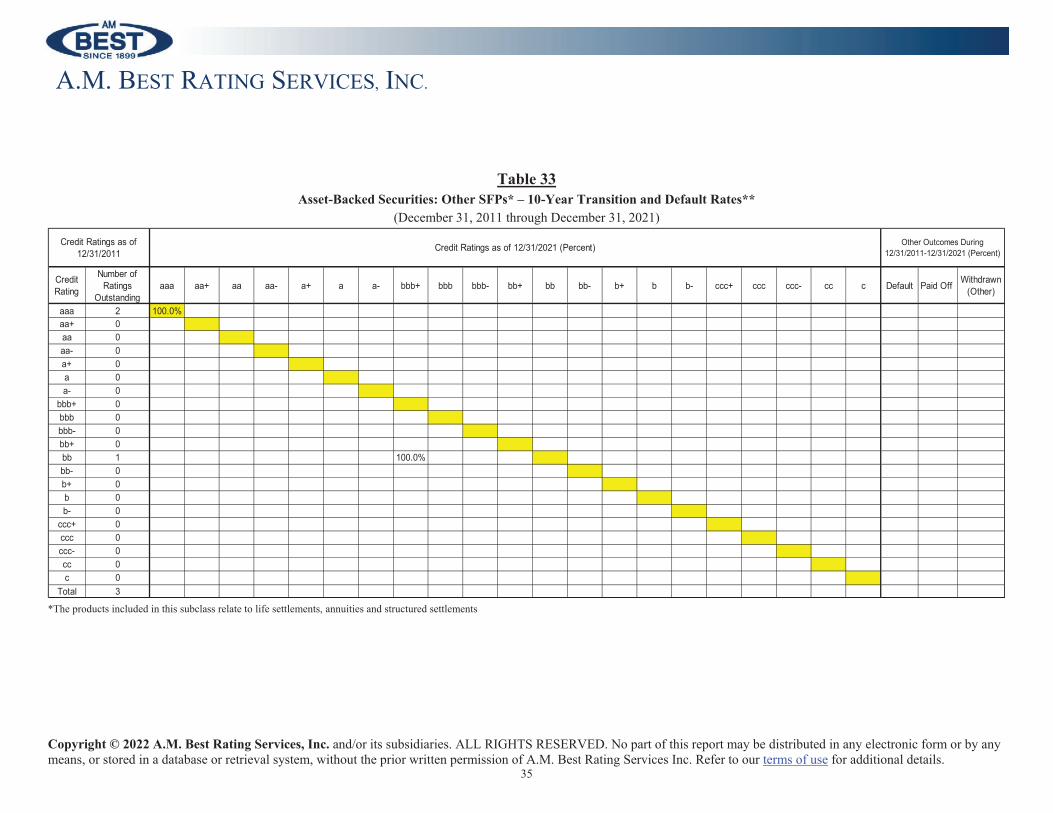
Table 33Asset-Backed Securities: Other SFPs* – 10-Year Transition and Default Rates**
(December 31, 2011 through December 31, 2021)
*The products included in this subclass relate to life settlements, annuities and structured settlements
Credit Rating
Number of Ratings
Outstandingaaa aa+ aa aa- a+ a a- bbb+ bbb bbb- bb+ bb bb- b+ b b- ccc+ ccc ccc- cc c Default Paid Off Withdrawn
(Other)
aaa 2 100.0%aa+ 0aa 0aa- 0a+ 0a 0a- 0
bbb+ 0bbb 0bbb- 0bb+ 0bb 1 100.0%bb- 0b+ 0b 0b- 0
ccc+ 0ccc 0ccc- 0cc 0c 0
Total 3
Credit Ratings as of 12/31/2011 Credit Ratings as of 12/31/2021 (Percent) Other Outcomes During
12/31/2011-12/31/2021 (Percent)
Copyright © 2022 A.M. Best Rating Services, Inc. and/or its subsidiaries. ALL RIGHTS RESERVED. No part of this report may be distributed in any electronic form or by any means, or stored in a database or retrieval system, without the prior written permission of A.M. Best Rating Services Inc. Refer to our terms of use for additional details.
36
A.M. BEST RATING SERVICES, INC.
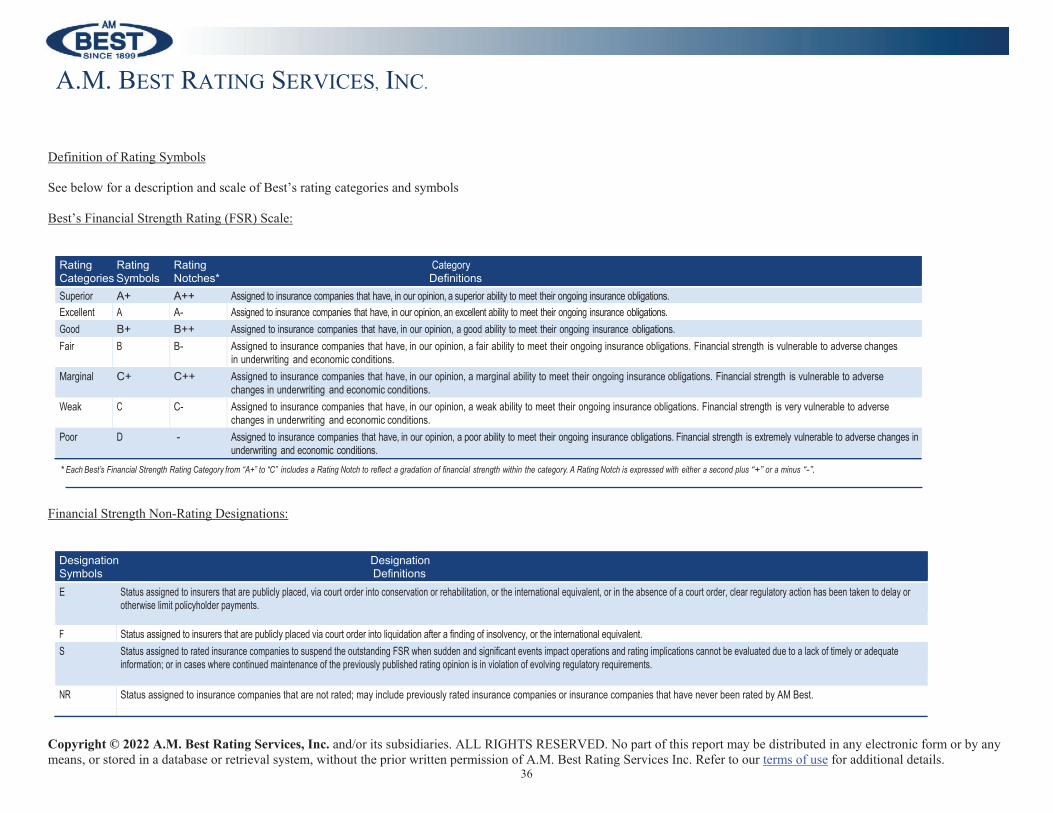
Definition of Rating Symbols
See below for a description and scale of Best’s rating categories and symbols
Best’s Financial Strength Rating (FSR) Scale:
Rating Rating Rating CategoryCategories Symbols Notches* DefinitionsSuperior A+ A++ Assigned to insurance companies that have, in our opinion, a superior ability to meet their ongoing insurance obligations.Excellent A A- Assigned to insurance companies that have, in our opinion, an excellent ability to meet their ongoing insurance obligations.Good B+ B++ Assigned to insurance companies that have, in our opinion, a good ability to meet their ongoing insurance obligations.Fair B B- Assigned to insurance companies that have, in our opinion, a fair ability to meet their ongoing insurance obligations. Financial strength is vulnerable to adverse changes
in underwriting and economic conditions.Marginal C+ C++ Assigned to insurance companies that have, in our opinion, a marginal ability to meet their ongoing insurance obligations. Financial strength is vulnerable to adverse
changes in underwriting and economic conditions.Weak C C- Assigned to insurance companies that have, in our opinion, a weak ability to meet their ongoing insurance obligations. Financial strength is very vulnerable to adverse
changes in underwriting and economic conditions.Poor D - Assigned to insurance companies that have, in our opinion, a poor ability to meet their ongoing insurance obligations. Financial strength is extremely vulnerable to adverse changes in
underwriting and economic conditions.* Each Best’s Financial Strength Rating Category from “A+” to “C” includes a Rating Notch to reflect a gradation of financial strength within the category. A Rating Notch is expressed with either a second plus “+” or a minus “-”.
Financial Strength Non-Rating Designations:
Designation DesignationSymbols DefinitionsE Status assigned to insurers that are publicly placed, via court order into conservation or rehabilitation, or the international equivalent, or in the absence of a court order, clear regulatory action has been taken to delay or
otherwise limit policyholder payments.
F Status assigned to insurers that are publicly placed via court order into liquidation after a finding of insolvency, or the international equivalent.S Status assigned to rated insurance companies to suspend the outstanding FSR when sudden and significant events impact operations and rating implications cannot be evaluated due to a lack of timely or adequate
information; or in cases where continued maintenance of the previously published rating opinion is in violation of evolving regulatory requirements.
NR Status assigned to insurance companies that are not rated; may include previously rated insurance companies or insurance companies that have never been rated by AM Best.
Copyright © 2022 A.M. Best Rating Services, Inc. and/or its subsidiaries. ALL RIGHTS RESERVED. No part of this report may be distributed in any electronic form or by any means, or stored in a database or retrieval system, without the prior written permission of A.M. Best Rating Services Inc. Refer to our terms of use for additional details.
37
A.M. BEST RATING SERVICES, INC.
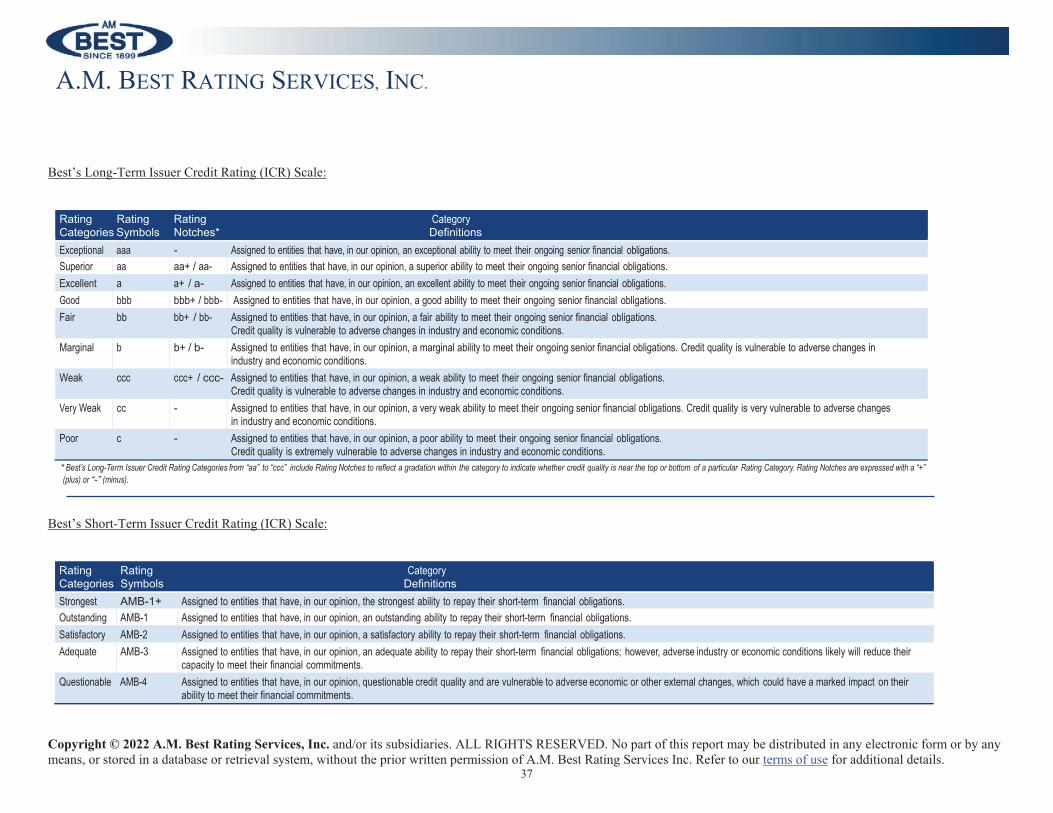
Best’s Long-Term Issuer Credit Rating (ICR) Scale:
Rating Rating Rating CategoryCategories Symbols Notches* DefinitionsExceptional aaa - Assigned to entities that have, in our opinion, an exceptional ability to meet their ongoing senior financial obligations.Superior aa aa+ / aa- Assigned to entities that have, in our opinion, a superior ability to meet their ongoing senior financial obligations.Excellent a a+ / a- Assigned to entities that have, in our opinion, an excellent ability to meet their ongoing senior financial obligations.Good bbb bbb+ / bbb- Assigned to entities that have, in our opinion, a good ability to meet their ongoing senior financial obligations.Fair bb bb+ / bb- Assigned to entities that have, in our opinion, a fair ability to meet their ongoing senior financial obligations.
Credit quality is vulnerable to adverse changes in industry and economic conditions.Marginal b b+ / b- Assigned to entities that have, in our opinion, a marginal ability to meet their ongoing senior financial obligations. Credit quality is vulnerable to adverse changes in
industry and economic conditions.Weak ccc ccc+ / ccc- Assigned to entities that have, in our opinion, a weak ability to meet their ongoing senior financial obligations.
Credit quality is vulnerable to adverse changes in industry and economic conditions.Very Weak cc - Assigned to entities that have, in our opinion, a very weak ability to meet their ongoing senior financial obligations. Credit quality is very vulnerable to adverse changes
in industry and economic conditions.Poor c - Assigned to entities that have, in our opinion, a poor ability to meet their ongoing senior financial obligations.
Credit quality is extremely vulnerable to adverse changes in industry and economic conditions.* Best’s Long-Term Issuer Credit Rating Categories from “aa” to “ccc” include Rating Notches to reflect a gradation within the category to indicate whether credit quality is near the top or bottom of a particular Rating Category. Rating Notches are expressed with a “+”(plus) or “-” (minus).
Best’s Short-Term Issuer Credit Rating (ICR) Scale:
Rating Rating CategoryCategories Symbols DefinitionsStrongest AMB-1+ Assigned to entities that have, in our opinion, the strongest ability to repay their short-term financial obligations.Outstanding AMB-1 Assigned to entities that have, in our opinion, an outstanding ability to repay their short-term financial obligations.Satisfactory AMB-2 Assigned to entities that have, in our opinion, a satisfactory ability to repay their short-term financial obligations.Adequate AMB-3 Assigned to entities that have, in our opinion, an adequate ability to repay their short-term financial obligations; however, adverse industry or economic conditions likely will reduce their
capacity to meet their financial commitments.Questionable AMB-4 Assigned to entities that have, in our opinion, questionable credit quality and are vulnerable to adverse economic or other external changes, which could have a marked impact on their
ability to meet their financial commitments.
Copyright © 2022 A.M. Best Rating Services, Inc. and/or its subsidiaries. ALL RIGHTS RESERVED. No part of this report may be distributed in any electronic form or by any means, or stored in a database or retrieval system, without the prior written permission of A.M. Best Rating Services Inc. Refer to our terms of use for additional details.
38
A.M. BEST RATING SERVICES, INC.
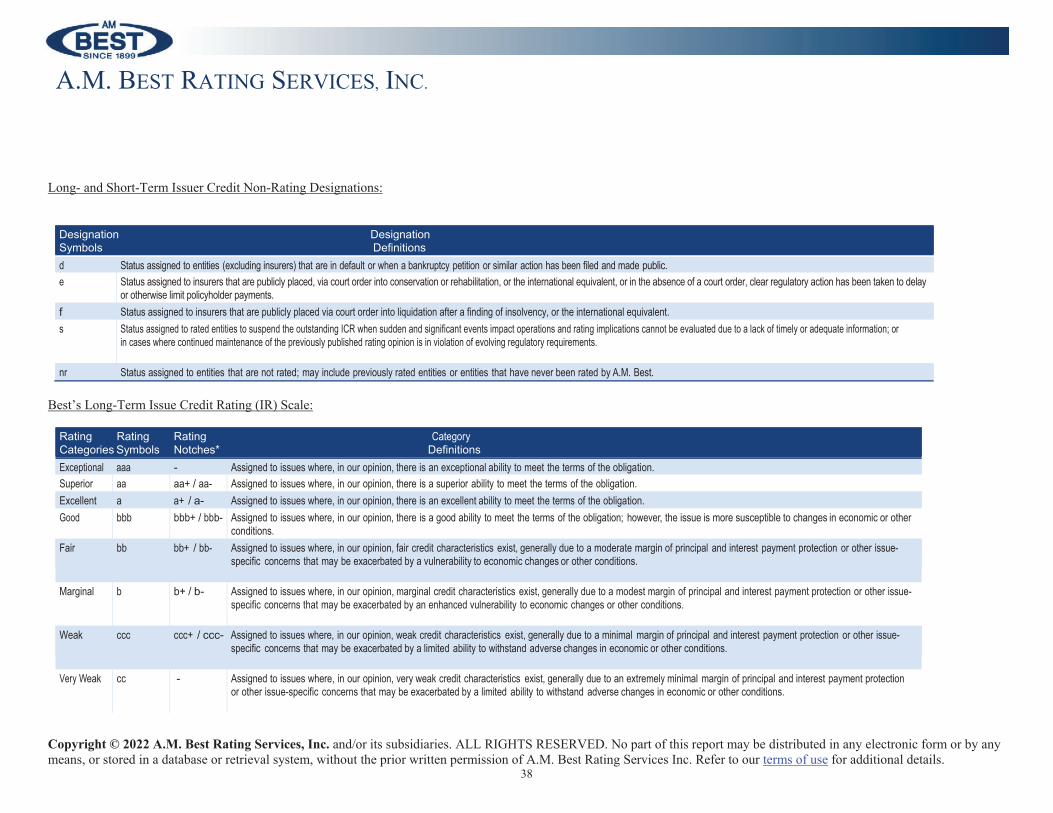
Long- and Short-Term Issuer Credit Non-Rating Designations:
Designation DesignationSymbols Definitionsd Status assigned to entities (excluding insurers) that are in default or when a bankruptcy petition or similar action has been filed and made public.e Status assigned to insurers that are publicly placed, via court order into conservation or rehabilitation, or the international equivalent, or in the absence of a court order, clear regulatory action has been taken to delay
or otherwise limit policyholder payments.f Status assigned to insurers that are publicly placed via court order into liquidation after a finding of insolvency, or the international equivalent.s Status assigned to rated entities to suspend the outstanding ICR when sudden and significant events impact operations and rating implications cannot be evaluated due to a lack of timely or adequate information; or
in cases where continued maintenance of the previously published rating opinion is in violation of evolving regulatory requirements.
nr Status assigned to entities that are not rated; may include previously rated entities or entities that have never been rated by A.M. Best.
Best’s Long-Term Issue Credit Rating (IR) Scale:
Rating Rating Rating CategoryCategories Symbols Notches* DefinitionsExceptional aaa - Assigned to issues where, in our opinion, there is an exceptional ability to meet the terms of the obligation.Superior aa aa+ / aa- Assigned to issues where, in our opinion, there is a superior ability to meet the terms of the obligation.Excellent a a+ / a- Assigned to issues where, in our opinion, there is an excellent ability to meet the terms of the obligation.Good bbb bbb+ / bbb- Assigned to issues where, in our opinion, there is a good ability to meet the terms of the obligation; however, the issue is more susceptible to changes in economic or other
conditions.Fair bb bb+ / bb- Assigned to issues where, in our opinion, fair credit characteristics exist, generally due to a moderate margin of principal and interest payment protection or other issue-
specific concerns that may be exacerbated by a vulnerability to economic changes or other conditions.
Marginal b b+ / b- Assigned to issues where, in our opinion, marginal credit characteristics exist, generally due to a modest margin of principal and interest payment protection or other issue-specific concerns that may be exacerbated by an enhanced vulnerability to economic changes or other conditions.
Weak ccc ccc+ / ccc- Assigned to issues where, in our opinion, weak credit characteristics exist, generally due to a minimal margin of principal and interest payment protection or other issue-specific concerns that may be exacerbated by a limited ability to withstand adverse changes in economic or other conditions.
Very Weak cc - Assigned to issues where, in our opinion, very weak credit characteristics exist, generally due to an extremely minimal margin of principal and interest payment protectionor other issue-specific concerns that may be exacerbated by a limited ability to withstand adverse changes in economic or other conditions.
Copyright © 2022 A.M. Best Rating Services, Inc. and/or its subsidiaries. ALL RIGHTS RESERVED. No part of this report may be distributed in any electronic form or by any means, or stored in a database or retrieval system, without the prior written permission of A.M. Best Rating Services Inc. Refer to our terms of use for additional details.
39
A.M. BEST RATING SERVICES, INC.
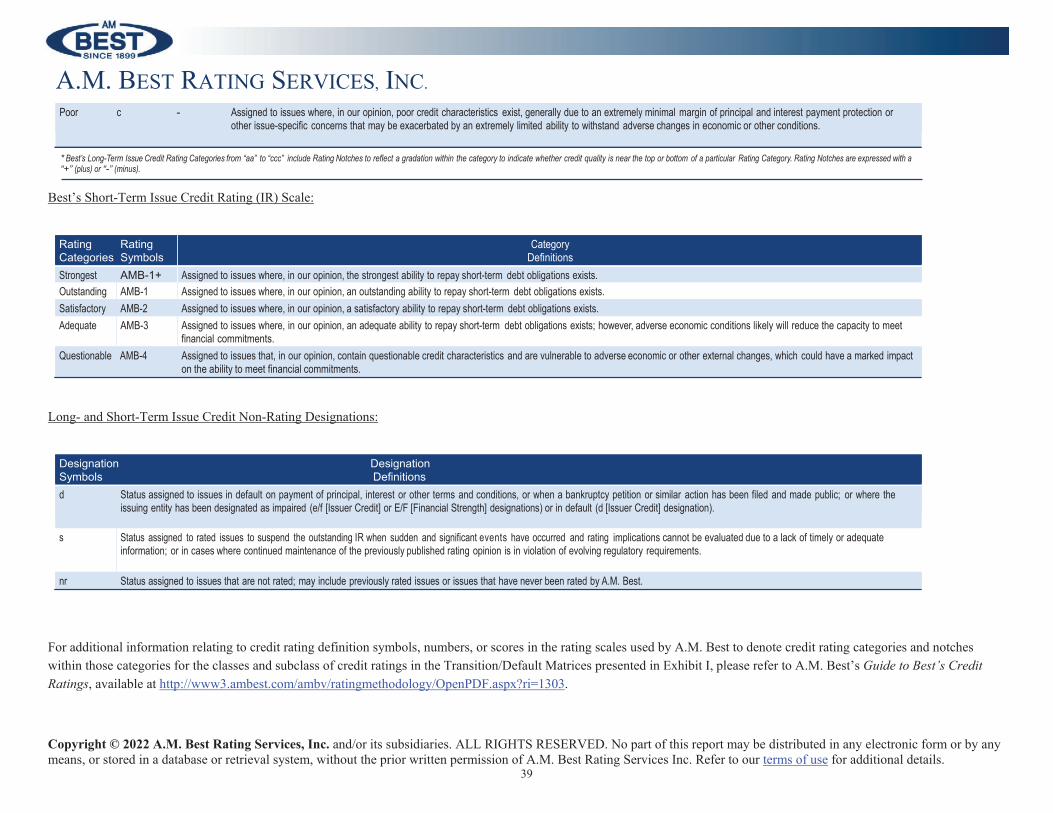
Poor c - Assigned to issues where, in our opinion, poor credit characteristics exist, generally due to an extremely minimal margin of principal and interest payment protection orother issue-specific concerns that may be exacerbated by an extremely limited ability to withstand adverse changes in economic or other conditions.
* Best’s Long-Term Issue Credit Rating Categories from “aa” to “ccc” include Rating Notches to reflect a gradation within the category to indicate whether credit quality is near the top or bottom of a particular Rating Category. Rating Notches are expressed with a “+” (plus) or “-” (minus).
Best’s Short-Term Issue Credit Rating (IR) Scale:
Rating RatingCategories Symbols
CategoryDefinitions
Strongest AMB-1+ Assigned to issues where, in our opinion, the strongest ability to repay short-term debt obligations exists.Outstanding AMB-1 Assigned to issues where, in our opinion, an outstanding ability to repay short-term debt obligations exists.Satisfactory AMB-2 Assigned to issues where, in our opinion, a satisfactory ability to repay short-term debt obligations exists.Adequate AMB-3 Assigned to issues where, in our opinion, an adequate ability to repay short-term debt obligations exists; however, adverse economic conditions likely will reduce the capacity to meet
financial commitments.Questionable AMB-4 Assigned to issues that, in our opinion, contain questionable credit characteristics and are vulnerable to adverse economic or other external changes, which could have a marked impact
on the ability to meet financial commitments.
Long- and Short-Term Issue Credit Non-Rating Designations:
Designation DesignationSymbols Definitionsd Status assigned to issues in default on payment of principal, interest or other terms and conditions, or when a bankruptcy petition or similar action has been filed and made public; or where the
issuing entity has been designated as impaired (e/f [Issuer Credit] or E/F [Financial Strength] designations) or in default (d [Issuer Credit] designation).
s Status assigned to rated issues to suspend the outstanding IR when sudden and significant events have occurred and rating implications cannot be evaluated due to a lack of timely or adequateinformation; or in cases where continued maintenance of the previously published rating opinion is in violation of evolving regulatory requirements.
nr Status assigned to issues that are not rated; may include previously rated issues or issues that have never been rated by A.M. Best.
For additional information relating to credit rating definition symbols, numbers, or scores in the rating scales used by A.M. Best to denote credit rating categories and notches within those categories for the classes and subclass of credit ratings in the Transition/Default Matrices presented in Exhibit I, please refer to A.M. Best’s Guide to Best’s Credit Ratings, available at http://www3.ambest.com/ambv/ratingmethodology/OpenPDF.aspx?ri=1303.
Copyright © 2022 A.M. Best Rating Services, Inc. and/or its subsidiaries. ALL RIGHTS RESERVED. No part of this report may be distributed in any electronic form or by any means, or stored in a database or retrieval system, without the prior written permission of A.M. Best Rating Services Inc. Refer to our terms of use for additional details.
40
A.M. BEST RATING SERVICES, INC.
The definitions of default and impairment changed as of January 2019.
Definition of Default
AM Best maintains a general impairment database and historical rating records from which long-term impairment rate studies are performed annually aimed at estimating the relative default risk (i.e., impairment) of insurers that have had interactive Best’s Financial Strength Ratings (FSR) and Best’s Issuer Credit Ratings (ICR).
AM Best, along with credit markets in general, deems a non-insurer issuer default as having occurred when an issuer misses interest or principal payments on its obligations, restructures its debt in a way that is deleterious to investors, or files for bankruptcy.
For the purposes of presenting credit ratings performance measurement statistics consisting of credit rating transition and default rates “Form NRSRO: Exhibit 1Rating Performance Measurement Statistics”(Exhibit 1), AM Best classifies an entity as in default if the entity was assigned any of the following non-rating designation symbols: (“d”); (“e” or “E”); or (“f” or “F”).
Definition of ImpairmentUpon the public placement of a company, via public court order or other international equivalent, into conservation, rehabilitation and/or insolvent liquidation it is designated by AM Best as a Financially Impaired Company (FIC). Supervisory actions undertaken by Insurance Department regulators without court order are not considered impairments for purposes of compiling Exhibit 1 statistics unless clear direction is given by the regulator to delay or limit policy or contract payments.
There are a number of regulatory oversight actions that may be taken with respect to troubled insurers in which court orders are not sought, such as required company action plans, various forms and levels of supervision, and licensure actions. Companies may be subject to these insurance department orders and actions on multiple occasions, particularly in certain jurisdictions, and while these regulatory actions suggest concern and impose constraints, they are not necessarily indicative of an insurer’s inability to meet its ongoing policy and contract obligations.
Additionally, companies that enter voluntary dissolution and are not under financial duress at that time are not counted as financially impaired.
Credit Rating Histories
The credit rating histories required to be disclosed pursuant to 17 CFR 17g-7(b) are located at www.ambest.com/nrsro/.
Related Documents