International Journal of Applied Mechanics Vol. 2, No. 1 (2010) 41–68 c Imperial College Press DOI: 10.1142/S1758825110000445 ALTERNATIVE METHODS TO EXTRACT THE HARDNESS AND ELASTIC MODULUS OF THIN FILMS FROM NANOINDENTATION LOAD-DISPLACEMENT DATA AMIT KUMAR ∗ and KAIYANG ZENG † Department of Mechanical Engineering National University of Singapore 9 Engineering Drive 1, Singapore 117576 ∗ [email protected] † [email protected] Received 20 March 2009 Accepted 22 May 2009 This paper presents alternative analysis methodologies to extract the elastic modulus and hardness of the ultra-thin films from nanoindentation load-displacement data, especially when the film thickness is only few hundred nanometers or less. At such film thickness, the conventional analysis methods for nanoindentation usually do not give accurate film properties due to the substrate effect. The new methods are capable to show how to determine the film-only properties and how the substrates affect the nanoindentation measurement, especially for ultra thin films. These methods give accurate results for nanoindentation of various metallic, ceramic and polymeric films. It also reveals the dif- ferences between the use of high-resolution nanoindentation set-up and normal nanoin- dentation set-up on the same films. The relationships between the mechanical properties and film thickness are also discussed. Keywords : Hardness; elastic modulus; thin films; nanoindentation; substrate effects. 1. Introduction Among all the experimental techniques developed during last several decades, nanoindentation is a novel, reliable and most convenient method to characterize the mechanical properties of thin films [Sneddon, 1965; Loubet et al., 1984; Doerner and Nix, 1986; Oliver and Pharr, 1992, 2004; Liu et al., 2009]. Over the last two decades nanoindentation is well developed and now it is a commonly used experi- mental technique to determine the hardness, elastic modulus and to some extent, other mechanical properties such as yield strength and strain-hardening behavior. Oliver and Pharr [1992] developed a comprehensive analysis which included the effects of elastic recovery during unloading, by carefully observing the unloading curves for numbers of materials and this method is being used extensively since † Corresponding author. 41

Welcome message from author
This document is posted to help you gain knowledge. Please leave a comment to let me know what you think about it! Share it to your friends and learn new things together.
Transcript

March 10, 2010 13:41 WSPC-255-IJAM SPI-J108 S1758825110000445
International Journal of Applied MechanicsVol. 2, No. 1 (2010) 41–68c© Imperial College PressDOI: 10.1142/S1758825110000445
ALTERNATIVE METHODS TO EXTRACTTHE HARDNESS AND ELASTIC MODULUS
OF THIN FILMS FROM NANOINDENTATIONLOAD-DISPLACEMENT DATA
AMIT KUMAR∗ and KAIYANG ZENG†
Department of Mechanical EngineeringNational University of Singapore
9 Engineering Drive 1, Singapore 117576∗[email protected]
Received 20 March 2009Accepted 22 May 2009
This paper presents alternative analysis methodologies to extract the elastic modulus andhardness of the ultra-thin films from nanoindentation load-displacement data, especiallywhen the film thickness is only few hundred nanometers or less. At such film thickness,the conventional analysis methods for nanoindentation usually do not give accurate filmproperties due to the substrate effect. The new methods are capable to show how todetermine the film-only properties and how the substrates affect the nanoindentationmeasurement, especially for ultra thin films. These methods give accurate results fornanoindentation of various metallic, ceramic and polymeric films. It also reveals the dif-ferences between the use of high-resolution nanoindentation set-up and normal nanoin-dentation set-up on the same films. The relationships between the mechanical propertiesand film thickness are also discussed.
Keywords: Hardness; elastic modulus; thin films; nanoindentation; substrate effects.
1. Introduction
Among all the experimental techniques developed during last several decades,nanoindentation is a novel, reliable and most convenient method to characterize themechanical properties of thin films [Sneddon, 1965; Loubet et al., 1984; Doernerand Nix, 1986; Oliver and Pharr, 1992, 2004; Liu et al., 2009]. Over the last twodecades nanoindentation is well developed and now it is a commonly used experi-mental technique to determine the hardness, elastic modulus and to some extent,other mechanical properties such as yield strength and strain-hardening behavior.Oliver and Pharr [1992] developed a comprehensive analysis which included theeffects of elastic recovery during unloading, by carefully observing the unloadingcurves for numbers of materials and this method is being used extensively since
†Corresponding author.
41
March 10, 2010 13:41 WSPC-255-IJAM SPI-J108 S1758825110000445
42 A. Kumar & K. Zeng
then. Furthermore, a significant development in nanoindentation experiment is theintroduction of the Continuous Stiffness Measurement (CSM) technique which mea-sures the contact stiffness of the material during the loading of the nanoindentationtest [Oliver and Pharr, 1992; Li and Bhushan, 2002]. By using CSM technique,hardness and elastic modulus can be determined from the loading data and theunloading analysis is therefore not necessary.
To determine elastic modulus, several modifications to the nanoindentationanalysis were proposed for thin films, such as using the parameters P/S2
(Load/stiffness2) and P/h2 (Load/displacement2) as functions of the indentationdepth which was normalized by film thickness [Joslin and Oliver, 1992; McGurkand Page, 1999; Malzbender et al., 2000, 2002; Hainsworth et al., 1996; Saha andNix, 2002]. Saha and Nix [2002] used P/S2 approach to determine the elastic mod-ulus and hardness of the thin films; and their analysis was also accounted for theeffective depth under the indentation tip in relation to the film thickness.
For hardness determinations, Bhattacharya and Nix [1988], Ahn and Kwon[1997] proposed models to determine the hardness variation of the thin films withrespect to depth of indentation. Furthermore, Korsunsky et al. [1998], Korsunskyand Constantinescu [2006] proposed a model for the hardness of the hard coatingon soft substrate by fitting the experimentally determined values of hardness withrespect to the ratio of the indentation depth to film thickness (defined as rela-tive indentation depth). This model proposed that the hardness values of the thinfilm/substrate system showed a sigmoidal response as the function of the relativeindentation depth.
Zeng [2009] recently showed that most of these analysis methods do not giveconsistent results for the films with the thickness of the order of few tens to hundredsnanometers or less. Some of the analyses are only suitable to one type of film systemand difficult to apply to another type of film system, if applied do not work well.It would be worth to mention here that the film system means hard-film-on-soft-substrate or soft-film-on-hard-substrate. There are some points of focus in all theanalysis mention above, such as:
(I) Most of the work is focused on determining some kind of relationships betweennanoindentation load and displacement data, while these data are purely exper-imental and highly dependent upon the testing material and indenter tip geom-etry. Materials are different for different films and also tip geometry is not fixedfor all indenter. Therefore a fixed relationship between load-displacement datawhich is suitable for all kinds of films may be difficult to find.
(II) The substrate effect in the indentation measurement is always an issue. Forthe ultra thin films (thickness of the order of few tens to hundred nanometersor less) it is very difficult to derive the film-only properties without substrateeffect; this is because of that, as the film thickness decreases indentation mea-sured properties are affected by the substrate properties even from the begin-ning of the indentation.
March 10, 2010 13:41 WSPC-255-IJAM SPI-J108 S1758825110000445
Alternative Methods to Extract the Hardness and Elastic Modulus of Thin Films 43
It is therefore necessary to develop reliable methods to extract the hardness and elas-tic modulus of the ultra-thin films from the nanoindentation data, which hopefullycan work well for all kinds of film systems and give consistent results. This studyhence aims to develop alternative analysis methods especially for nanoindentationof ultra-thin films (most likely less than 200nm in thickness), for these ultra-thinfilms nanoindentation results are always associated with the effects of substrate,surface roughness, and indenter tip roundness, therefore the film-only propertiesare difficult to be determined from the nanoindentation data. In this work, severalbulk material samples, including Silicon, Nickel, Fused Silica, Soda-Lime glass andEpoxy, and thin-film samples such as different types of ceramics films, includingAl2O3 films on Al substrate, BlackDiamondTM (BD) films on Si substrate [Yeapet al., 2008], indium-tin-oxide (ITO) and indium-zinc-oxide (IZO) films on Glasssubstrate [Zeng et al., 2003], metallic films (Al films on Si substrate) and polymericfilms on Glass substrate [Zeng et al., 2005] are being analyzed to verify the reli-ability and accuracy of the proposed methods. The purpose of choosing so manyvarieties of films of different thicknesses is to ensure the generality of the approachfor all kinds of film systems. Some of the films are tested by both the high-resolutionnanoindentation set-up (Dynamic Contact Module (DCM head), NanoindenterTM,MTS Cooperation, USA) and normal nanoindentation set-up (Nanoindenter XPhead, MTS Cooperation, USA), the purpose of this is to study which of the set-upis more effective and accurate for measurement of the ultra thin films. This workalso discusses the possible relationships between the film thickness and propertiesof the film.
2. Methodological Analysis
In this work, certain assumptions are made in order to simply the analysis. Thethin films are usually associated with interfacial or residual stresses, which affectthe indentation measured properties. These stresses are either tensile or compressivein nature and present on the surface of the films or at the interface. These additionalstresses will affect the value of measured hardness and elastic modulus of thin filmsignificantly and yield either higher or lower values.
In some materials, the volume of the material displaced during indentation maybe pushed out to the sides of the indenter and form a pile up of material making theprojected contact area larger then the cross-sectional area of the indenter at thatdepth. While in other materials, the displaced volume is accommodated mainly bythe far-field elastic displacements, producing a sink-in effect, results the contact arealess then the cross-sectional area of indenter at that depth. The effects of pile-upor sink-in will result in either over- or underestimation of the contact area, hencethe hardness and elastic modulus, these effects have been discussed by McElhaneyet al. [1997].
Together with above effects, the indentation behavior of hard-films on soft-substrate and soft-film on hard-substrate are also different from each other.
March 10, 2010 13:41 WSPC-255-IJAM SPI-J108 S1758825110000445
44 A. Kumar & K. Zeng
Substrate effect starts very early in the case of hard-film on soft-substrate com-pare to the soft-film on hard-substrate. For some the hard-films on soft-substrate,crack may initiate along the corners of indenter if the indentation load is high.
It should be noticed following:
(i) The residual and interfacial stresses in film/substrate systems are not includedin this analysis for simplicity.
(ii) The pile up and sink-in effects are also not included in this analysis. This mayintroduce errors when assuming the indenter tip is perfect. The error will bereduced when the real indenter tip function is considered.
(iii) During nanoindentation of hard-film-on-soft-substrate system, at sufficient lowload, it is assumed that there is no crack induced. At higher load, some cracksmay form at the corner of the indenter, which may be reflected as pop-in at theindentation load-displacement curves. However, in this proposed analysis, therange of the indentation depth used for extracting hardness and modulus arealways the curves before the pop-in occurs. Therefore, the possible crackingshould not affect the analysis.
2.1. Hardness (perfect Berkovich tip)
In general, hardness is a measurement of the resistance to plastic deformation orindentation. Therefore, the basic definition of hardness is the ratio of the appliedload to the indentation contact area:
H =P
Ac(1)
where P is the applied load and Ac is the indentation contact area. Equation (1)can also be written as:
P = HAc (2)
For a perfect Berkovich tip, the contact area is given as:
Ac = 24.56h2c (3)
where hc is the contact depth by indenter tip and it can be determined as [Oliverand Pharr, 1992]:
hc = h − ε
(Pmax
Sul
)(4)
where ε is a constant depends upon the tip geometry (0.75 for a Berkovich tip), h isindentation depth and Sul is the contact stiffness determined from unloading data.
Equation (4) is used for the nanoindentation with a single loading/unloadingcycle and the calculated contact depth by Eq. (4) is at the maximum depth asthe stiffness is being determined at the initial point of unloading curve, which is
March 10, 2010 13:41 WSPC-255-IJAM SPI-J108 S1758825110000445
Alternative Methods to Extract the Hardness and Elastic Modulus of Thin Films 45
again a single value. When using CSM technique during nanoindentation, hc can bedetermined at each loading step with the harmonica contact stiffness, SCSM , i.e.:
hc = h − ε
(P
SCSM
)(5)
Equation (5) can be rewritten as:
hc
h= 1 − ε
(P
SCSMh
)(6)
For a homogeneous material, hc/h ratio should be a constant value and inde-pendent of the indentation depth, this has been approved by nanoindentation ofnumbers of bulk materials. On the other hand, in the case of thin films, the hc/h
ratio may not be a constant though the indentation loading segment, it may changewith the indentation depth. The constant value of hc/h within certain indentationdepth range suggests that, within this range, the properties of the thin films maynot be affected by substrate; therefore, it should be a constant value within thisrange. However, in the case of ultra-thin films, in which of the thickness is less thanapproximately 200 nm, it could be very difficult to find the indentation depth rangewhere the ratio of hc/h is a constant.
If substituting Eq. (5) into Eq. (3), Ac can be written as:
Ac = 24.56[h − ε
(P
SCSM
)]2(7)
Equation (7) also can be rearranged as:
Ac = 24.56h2
[1 − ε
(P
SCSMh
)]2(8)
Assuming
ω = 1 − ε
(P
SCSMh
)(9)
Substituting the Eqs. (8) and (9) into Eq. (2) results:
P = H(24.56h2ω2) (10)
For ultra thin films, both H and ω may vary with the indentation depth due tothe substrate effects which may be always associated with the indentation measuredproperties. So there are two possible situations: (a) both H and ω vary with h,meaning film thickness is very small and there may be no region that ω is a constant;and (b) both H and ω are constants over certain range of displacement, meaning filmis thick enough to reveal the region of ω to be a constant. For both the conditionsEq. (10) can be differentiate twice with respective to h, case (a) gives the wayto determine the properties of extremely thin films (Appendix A) and the case(b) gives a way for the films having a range of constant ω. So in the case (b),the variation of H and ω can be avoided at least for the initial part of indentation,
March 10, 2010 13:41 WSPC-255-IJAM SPI-J108 S1758825110000445
46 A. Kumar & K. Zeng
i.e. dHdh = 0 and dω
dh = 0, therefore d2Hdh2 = 0 and d2ω
dh2 = 0. Therefore, the finalequation can be given after including all the conditions as:
d2P
dh2= 49.12Hω2 (11)
The hardness can be written as:
H =1
49.12ω2
(d2P
dh2
)(12)
where d2Pdh2 can be calculated by curve fitting of the load-displacement data followed
by secondary differentiation of the fitting function (assuming the loading curve hasthe form of P = Chn), The details of derivation of Eq. (11) is given in Appendix A.
2.2. Elastic modulus (perfect Berkovich tip)
From the elastic contact theory, the experimentally measured stiffness was givenaccording to the relation:
S =dP
dh= β
2√π
√AcEr (13)
where S is the experimentally measured stiffness at the initial of the unloadingdata, Er is the reduced elastic modulus, Ac is the contact area and β is the constantdepends upon the geometry of the indenter (1.034 for Berkovich Tip). Equation (13)is a very general relationship that applied to any axisymmetric indenter [Pharr et al.,1992; Cheng and Cheng, 1997], as well as triangle or square shape indenter [King,1987], as well as to the elastic-plastic contact [Gao and Wu, 1993; Oliver and Pharr,2004]. The reduced elastic modulus, Er is usually written as:
1Er
=1 − ν2
m
Em+
1 − ν2i
Ei(14)
where Em and νm are elastic modulus and Poisson’s ratio, respectively, of theindented specimen and Ei and νi are those of the indenter.
If substituting the Eqs. (8) and (9) into Eq. (13), one can get:
S =2β√
π
√24.56Erhω (15)
Differentiation of the Eq. (15) with respect to h, and consider both Er and ω changewith h, then:
dS
dh=
2β√π
√24.56
(Erω + Erh
dω
dh+ hω
dEr
dh
)(16)
If at the initial part of indentation, ω and Er are independent of the indentationdepth, dEr
dh = 0 and dωdh = 0, then the Eq. (16) can be written as:
dS
dh=
2β√π
√24.56Erω (17)
March 10, 2010 13:41 WSPC-255-IJAM SPI-J108 S1758825110000445
Alternative Methods to Extract the Hardness and Elastic Modulus of Thin Films 47
So the final expression for reduced elastic modulus can be given by:
Er =√
π
2β√
24.56ω
(dS
dh
)(18)
where dSdh can be calculated by the curve fitting of the stiffness-displacement data
followed by the differentiation to the fitting function (assuming the CSM loadingdata gives S = γh, in the form of Eq. (15)).
2.3. Hardness and elastic modulus for real indenter tip
In the analysis presented in the Secs. 2.1 and 2.2, the indenter tip is assumedto be perfect sharp and the contact area is calculated according to Eq. (3) andthe hardness and elastic modulus value are calculated by the Eqs. (12) and (18).However, the indenter tip can never be prefect sharp. This is even more important,if the indentation depth is small, the tip roundness will result in significant errorsin calculation the contact area using Eq. (3). It is therefore important to considerthe real indenter tip shape by using the contact area function when indenting ultra-thin films. In general, the indenter tip function can be written as [Oliver and Pharr,1992]:
Ac = 24.5h2c + C1hc + C2h
1/2c + C3h
1/4c + · · · + C8h
1/128c (19)
where C1 to C8 are the constants depends upon the indenter shape. The leading termdescribes a perfect Berkovich indenter and the others describe the deviation fromthe perfect Berkovich geometry due to the blunting at the tip. For the Berkovichindenter tip used in this study, C1 = 94.2, C2 = 0.654 and C3 = C4 = · · · = C8 = 0.
Hence, if Eq. (19) is used to replace Eq. (3), the hardness and elastic modulus canbe calculated in the same approach as in Sec. 2.1, following two expressions areobtained, the hardness is:
H =h3/2
49.12h3/2ω2 − 0.25C2ω1/2
(d2P
dh2
)(20)
and the elastic modulus is:
Er =√
π
β
(24.56h2ω2 + C1hω + C2h1/2ω1/2)1/2(
49.12hω2 + C1ω + C2
(ω4h
)1/2) dS
dh(21)
The detail derivations of these two equations are described in Appendix B. Equa-tions (20) and (21) are the final expression after considering only first two constants(C1 and C2) in Eq. (19) and assuming no variation in hardness and elastic modulusvalue with indentation depth. If more constants in Eq. (19) are used and the vari-ations of hardness and elastic modulus with indentation depth are also included,then the final expression becomes very complex. Therefore, to avoid this complexityfor calculating hardness and elastic modulus, in this work, the real contact area is
March 10, 2010 13:41 WSPC-255-IJAM SPI-J108 S1758825110000445
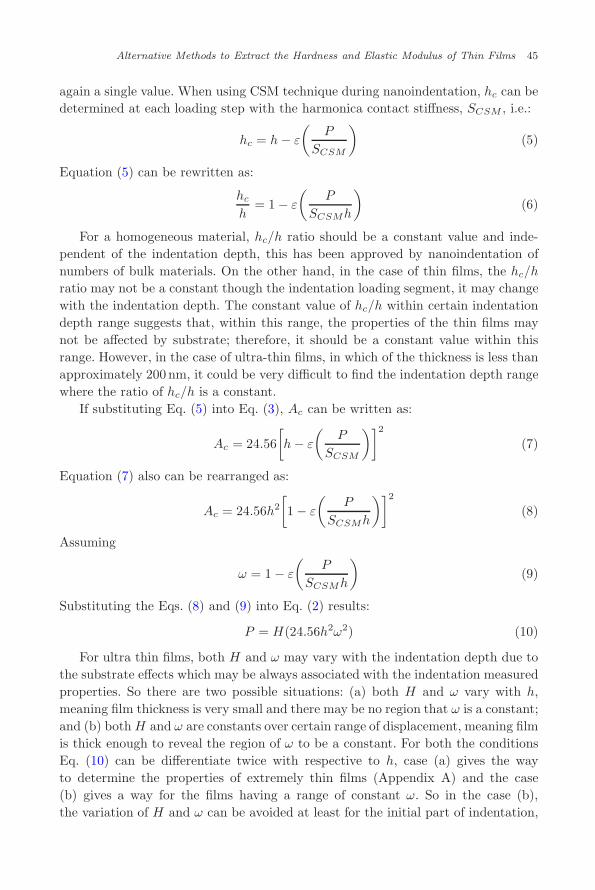
48 A. Kumar & K. Zeng
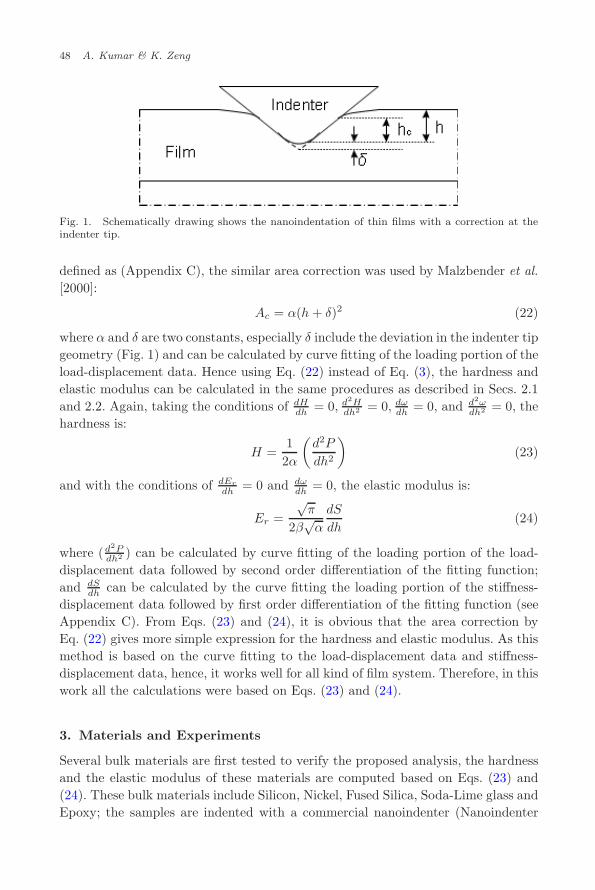
Fig. 1. Schematically drawing shows the nanoindentation of thin films with a correction at theindenter tip.
defined as (Appendix C), the similar area correction was used by Malzbender et al.[2000]:
Ac = α(h + δ)2 (22)
where α and δ are two constants, especially δ include the deviation in the indenter tipgeometry (Fig. 1) and can be calculated by curve fitting of the loading portion of theload-displacement data. Hence using Eq. (22) instead of Eq. (3), the hardness andelastic modulus can be calculated in the same procedures as described in Secs. 2.1and 2.2. Again, taking the conditions of dH
dh = 0, d2Hdh2 = 0, dω
dh = 0, and d2ωdh2 = 0, the
hardness is:
H =12α
(d2P
dh2
)(23)
and with the conditions of dEr
dh = 0 and dωdh = 0, the elastic modulus is:
Er =√
π
2β√
α
dS
dh(24)
where (d2Pdh2 ) can be calculated by curve fitting of the loading portion of the load-
displacement data followed by second order differentiation of the fitting function;and dS
dh can be calculated by the curve fitting the loading portion of the stiffness-displacement data followed by first order differentiation of the fitting function (seeAppendix C). From Eqs. (23) and (24), it is obvious that the area correction byEq. (22) gives more simple expression for the hardness and elastic modulus. As thismethod is based on the curve fitting to the load-displacement data and stiffness-displacement data, hence, it works well for all kind of film system. Therefore, in thiswork all the calculations were based on Eqs. (23) and (24).
3. Materials and Experiments
Several bulk materials are first tested to verify the proposed analysis, the hardnessand the elastic modulus of these materials are computed based on Eqs. (23) and(24). These bulk materials include Silicon, Nickel, Fused Silica, Soda-Lime glass andEpoxy; the samples are indented with a commercial nanoindenter (Nanoindenter
March 10, 2010 13:41 WSPC-255-IJAM SPI-J108 S1758825110000445
Alternative Methods to Extract the Hardness and Elastic Modulus of Thin Films 49
XP, MTS Cooperation, USA) with a standard Berkovich indenter tip and CSMtechnique to the maximum depth of 1000nm, and at least 10 indentations weremade on each sample. The indentation procedures include loading segment, holding15 s at the maximum load, unloading to 10% of the maximum load and holding forthermal draft correction and final complete unloading.
Thin film samples are deposited by Sputtering coating technique; and followingsamples are tested:
(1) Al2O3 films on Al substrate - film thickness of 100nm and 1000nm;(2) Al films on Si substrate - film thickness of 50 nm, 150 nm and 280 nm; and(3) BD films on Si substrate - film thickness of 100 nm, 300 nm, 500nm and 1000nm.
In addition, nanoindentation experiments of some other films are also analyzed bythe proposed analysis methods in order to study the generality of the approaches.These films have already been tested by nanoindentation experiment to determinehardness and elastic modulus in previous studies [Zeng et al., 2003, 2005] and thesame data sets are being re-analyzed by the new methods. These films are:
(1) Ceramic films - Indium Tin Oxide (ITO) and Indium Zinc Oxide (IZO) on Glasssubstrate - film thickness of 250nm [Zeng et al., 2003]; and
(2) Polymeric films - conjugated polymeric films on glass substrate - film thicknessof 100 nm [Zeng et al., 2005].
For the thin film samples, nanoindentation experiments are also performed by usinga nano-indenter (Nano-indenter XP, MTS Cooperation, USA) using the continuousstiffness measurement (CSM) technique at a constant strain rate. In addition, someof the film samples are tested by using two types of nanoindenter heads, one is thehigh-resolution nanoindentation using the DCM indenter head, and other one isthe normal nanoindentation using the Nanoindenter XP indenter head. The DCMindenter head has the same nano-indentation principle as the normal XP headbut with a higher resolution to recording load and displacement. Compare to thenormal nano-indenter head, the high resolution module provides more accurateload-displacement measurement at the surface-contact level, i.e. at the very first fewnanometers of indentation contacts. Therefore it is ideal for studying the initial partof indentation especially when the thickness of films is only few tens to hundredsnanometers or less. Therefore, following film samples are tested by either one orboth of the normal nanoindentation set-up (XP indenter head) and high-resolutionnanoindentation set-up (DCM indenter head):
(1) Al2O3 films on Al substrate and BD films on Si substrate are tested by normalnanoindentation;
(2) Al films on Si substrate are testes by both normal nanoindentation and highresolution nanoindentation; and
(3) ITO on glass substrate and polymeric films on glass substrate, were tested byboth high resolution and normal nanoindentation [Zeng et al., 2003, 2005]; and
March 10, 2010 13:41 WSPC-255-IJAM SPI-J108 S1758825110000445
50 A. Kumar & K. Zeng
IZO film on glass substrate were tested by the normal nanoindentation [Zenget al., 2003].
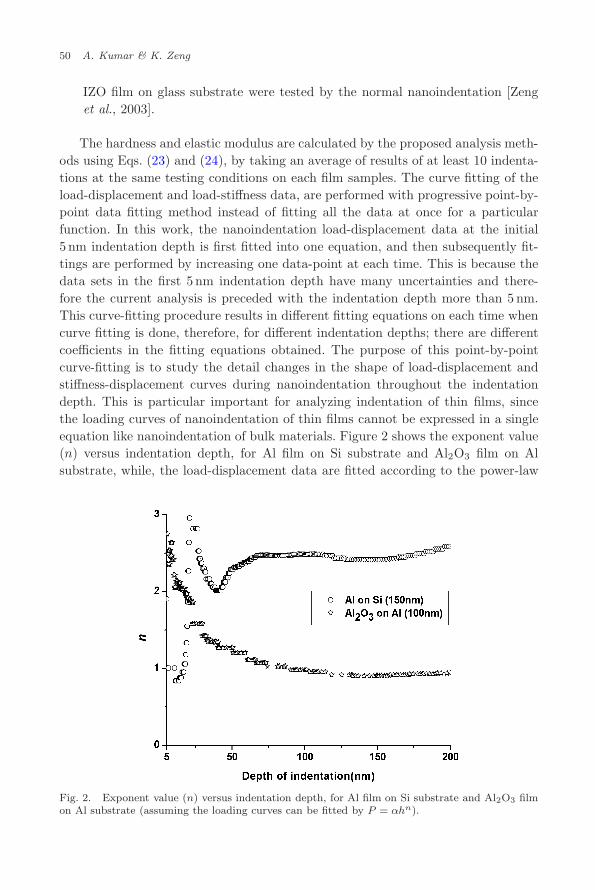
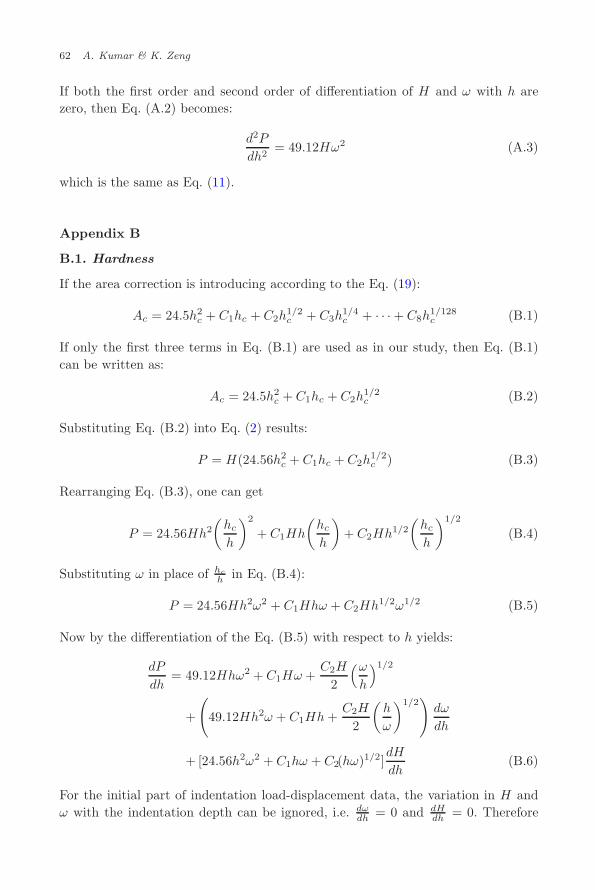
The hardness and elastic modulus are calculated by the proposed analysis meth-ods using Eqs. (23) and (24), by taking an average of results of at least 10 indenta-tions at the same testing conditions on each film samples. The curve fitting of theload-displacement and load-stiffness data, are performed with progressive point-by-point data fitting method instead of fitting all the data at once for a particularfunction. In this work, the nanoindentation load-displacement data at the initial5 nm indentation depth is first fitted into one equation, and then subsequently fit-tings are performed by increasing one data-point at each time. This is because thedata sets in the first 5 nm indentation depth have many uncertainties and there-fore the current analysis is preceded with the indentation depth more than 5 nm.This curve-fitting procedure results in different fitting equations on each time whencurve fitting is done, therefore, for different indentation depths; there are differentcoefficients in the fitting equations obtained. The purpose of this point-by-pointcurve-fitting is to study the detail changes in the shape of load-displacement andstiffness-displacement curves during nanoindentation throughout the indentationdepth. This is particular important for analyzing indentation of thin films, sincethe loading curves of nanoindentation of thin films cannot be expressed in a singleequation like nanoindentation of bulk materials. Figure 2 shows the exponent value(n) versus indentation depth, for Al film on Si substrate and Al2O3 film on Alsubstrate, while, the load-displacement data are fitted according to the power-law
Fig. 2. Exponent value (n) versus indentation depth, for Al film on Si substrate and Al2O3 filmon Al substrate (assuming the loading curves can be fitted by P = αhn).
March 10, 2010 13:41 WSPC-255-IJAM SPI-J108 S1758825110000445
Alternative Methods to Extract the Hardness and Elastic Modulus of Thin Films 51
relation (P = αhn). It is clear that the exponent value (n) is not 2 but varyingfrom 1 to 3 along the indentation depth, which indicates that the load-displacementcurve cannot be completely defined by a single function throughout the indenta-tion depth for the case of thin films. This behavior is significantly different fromnanoindentation of bulk materials.
4. Results and Discussion
4.1. Verification of results
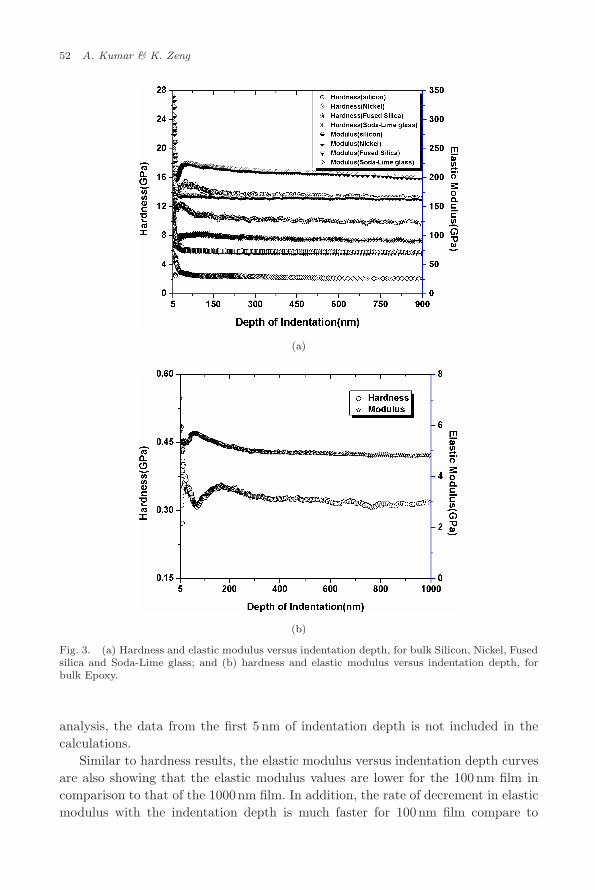
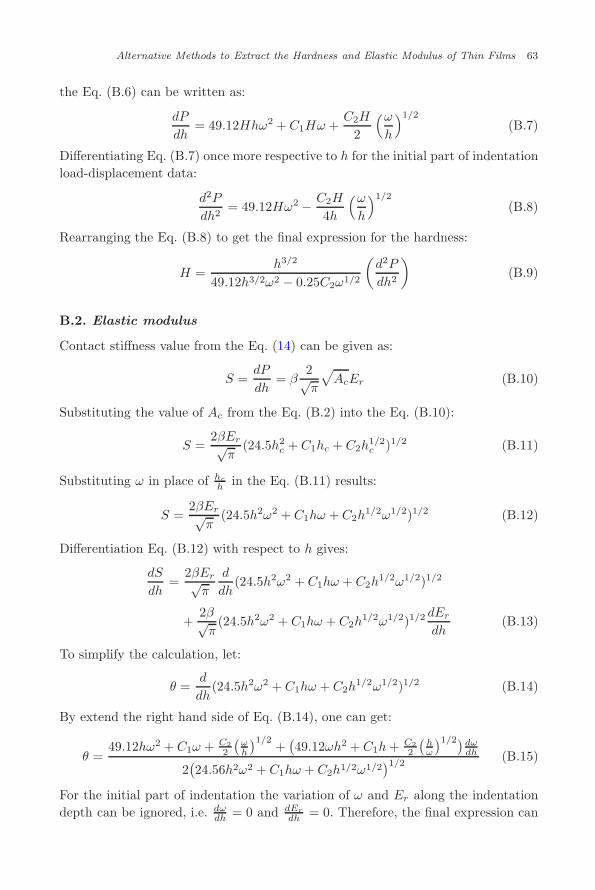
The new analysis methods are first applied to analyze the nanoindentation of thebulk materials samples to verify the validity and the accuracy of the methods.These bulk materials are tested by the normal nanoindentation set-up using CSMtechnique. The hardness and elastic modulus are calculated using the Eqs. (23) and(24). Figure 3(a) shows the hardness and elastic modulus versus indentation depthfor Silicon, Nickel, Fused Silica and Soda-Lime glass. It is clear that the hardnessand elastic modulus values for those bulk material samples are almost constantthroughout the indentation depth.
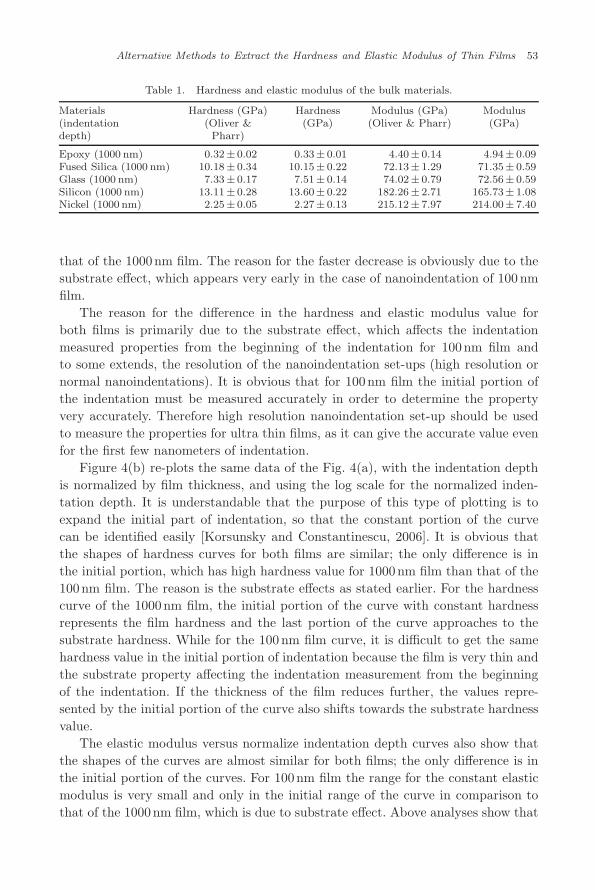
Figure 3(b) shows constant hardness and elastic modulus values versus inden-tation depth for bulk Epoxy sample. Table 1 compares the results of hardness andelastic modulus values of the bulk materials calculated by the new methods andcompared with those obtained from Oliver and Pharr’s analysis. These comparisonsshow that, for the bulk materials, there are basically no differences in the hardnessand elastic modulus values calculated by the two approaches. In other words, thevalidity of the proposed methods is approved by using the results of nanoinden-tation of bulk material samples, including metal, ceramic and polymeric material.With the confidence of the results on the bulk materials, following will present theresults of the thin films.
4.2. Al2O3 films on Al substrate
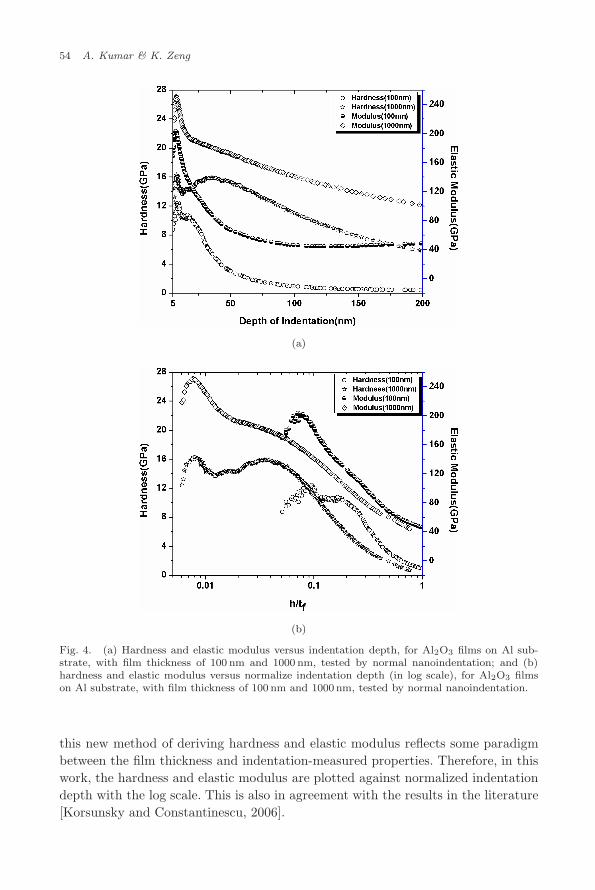
Figure 4(a) shows the hardness and elastic modulus versus indentation depth for theAl2O3 films on Al substrate with the film thickness of 100nm and 1000nm testedby normal nanoindentation. It is obvious that for 100nm film, the hardness valueincreases in the beginning of the indentation and then approaches to a constanthardness value within the indentation depth range of 5 to 10 nm (∼ 10GPa) andfollowing by decreasing hardness with the indentation depth. This is understand-able since Al2O3 film is much harder than that of the Al substrate and film is verythin, as the depth of indentation increases the substrate effect starts playing role.While as for the 1000nm film, the hardness value changes in a similar way as thatfor the 100nm film but the constant hardness value is obtained within the inden-tation range of 30–60nm (∼ 16GPa). The reason of getting some higher hardnessvalues in the beginning of the indentation may be due to several factors such astip roundness, surface roughness and limit of machine resolution. Therefore, in this
March 10, 2010 13:41 WSPC-255-IJAM SPI-J108 S1758825110000445
52 A. Kumar & K. Zeng
(a)
(b)
Fig. 3. (a) Hardness and elastic modulus versus indentation depth, for bulk Silicon, Nickel, Fusedsilica and Soda-Lime glass; and (b) hardness and elastic modulus versus indentation depth, forbulk Epoxy.
analysis, the data from the first 5 nm of indentation depth is not included in thecalculations.
Similar to hardness results, the elastic modulus versus indentation depth curvesare also showing that the elastic modulus values are lower for the 100 nm film incomparison to that of the 1000nm film. In addition, the rate of decrement in elasticmodulus with the indentation depth is much faster for 100nm film compare to
March 10, 2010 13:41 WSPC-255-IJAM SPI-J108 S1758825110000445
Alternative Methods to Extract the Hardness and Elastic Modulus of Thin Films 53
Table 1. Hardness and elastic modulus of the bulk materials.
Materials Hardness (GPa) Hardness Modulus (GPa) Modulus(indentation (Oliver & (GPa) (Oliver & Pharr) (GPa)depth) Pharr)
Epoxy (1000 nm) 0.32± 0.02 0.33± 0.01 4.40± 0.14 4.94± 0.09Fused Silica (1000 nm) 10.18± 0.34 10.15± 0.22 72.13± 1.29 71.35± 0.59Glass (1000 nm) 7.33± 0.17 7.51± 0.14 74.02± 0.79 72.56± 0.59Silicon (1000 nm) 13.11± 0.28 13.60± 0.22 182.26± 2.71 165.73± 1.08Nickel (1000 nm) 2.25± 0.05 2.27± 0.13 215.12± 7.97 214.00± 7.40
that of the 1000nm film. The reason for the faster decrease is obviously due to thesubstrate effect, which appears very early in the case of nanoindentation of 100 nmfilm.
The reason for the difference in the hardness and elastic modulus value forboth films is primarily due to the substrate effect, which affects the indentationmeasured properties from the beginning of the indentation for 100nm film andto some extends, the resolution of the nanoindentation set-ups (high resolution ornormal nanoindentations). It is obvious that for 100nm film the initial portion ofthe indentation must be measured accurately in order to determine the propertyvery accurately. Therefore high resolution nanoindentation set-up should be usedto measure the properties for ultra thin films, as it can give the accurate value evenfor the first few nanometers of indentation.
Figure 4(b) re-plots the same data of the Fig. 4(a), with the indentation depthis normalized by film thickness, and using the log scale for the normalized inden-tation depth. It is understandable that the purpose of this type of plotting is toexpand the initial part of indentation, so that the constant portion of the curvecan be identified easily [Korsunsky and Constantinescu, 2006]. It is obvious thatthe shapes of hardness curves for both films are similar; the only difference is inthe initial portion, which has high hardness value for 1000nm film than that of the100nm film. The reason is the substrate effects as stated earlier. For the hardnesscurve of the 1000nm film, the initial portion of the curve with constant hardnessrepresents the film hardness and the last portion of the curve approaches to thesubstrate hardness. While for the 100 nm film curve, it is difficult to get the samehardness value in the initial portion of indentation because the film is very thin andthe substrate property affecting the indentation measurement from the beginningof the indentation. If the thickness of the film reduces further, the values repre-sented by the initial portion of the curve also shifts towards the substrate hardnessvalue.
The elastic modulus versus normalize indentation depth curves also show thatthe shapes of the curves are almost similar for both films; the only difference is inthe initial portion of the curves. For 100nm film the range for the constant elasticmodulus is very small and only in the initial range of the curve in comparison tothat of the 1000nm film, which is due to substrate effect. Above analyses show that
March 10, 2010 13:41 WSPC-255-IJAM SPI-J108 S1758825110000445
54 A. Kumar & K. Zeng
(a)
(b)
Fig. 4. (a) Hardness and elastic modulus versus indentation depth, for Al2O3 films on Al sub-strate, with film thickness of 100 nm and 1000 nm, tested by normal nanoindentation; and (b)hardness and elastic modulus versus normalize indentation depth (in log scale), for Al2O3 filmson Al substrate, with film thickness of 100 nm and 1000 nm, tested by normal nanoindentation.
this new method of deriving hardness and elastic modulus reflects some paradigmbetween the film thickness and indentation-measured properties. Therefore, in thiswork, the hardness and elastic modulus are plotted against normalized indentationdepth with the log scale. This is also in agreement with the results in the literature[Korsunsky and Constantinescu, 2006].
March 10, 2010 13:41 WSPC-255-IJAM SPI-J108 S1758825110000445
Alternative Methods to Extract the Hardness and Elastic Modulus of Thin Films 55
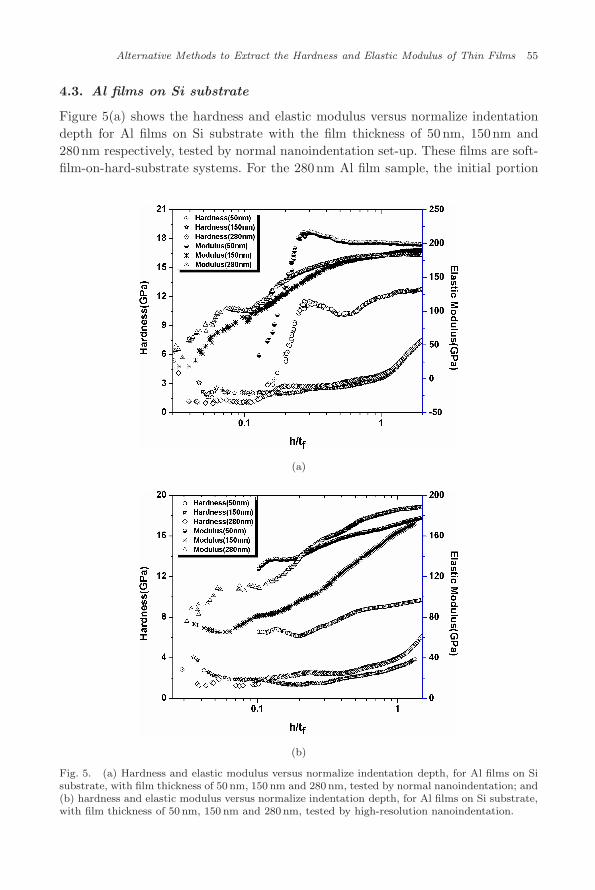
4.3. Al films on Si substrate
Figure 5(a) shows the hardness and elastic modulus versus normalize indentationdepth for Al films on Si substrate with the film thickness of 50 nm, 150nm and280nm respectively, tested by normal nanoindentation set-up. These films are soft-film-on-hard-substrate systems. For the 280nm Al film sample, the initial portion
(a)
(b)
Fig. 5. (a) Hardness and elastic modulus versus normalize indentation depth, for Al films on Sisubstrate, with film thickness of 50 nm, 150 nm and 280 nm, tested by normal nanoindentation; and(b) hardness and elastic modulus versus normalize indentation depth, for Al films on Si substrate,with film thickness of 50 nm, 150 nm and 280 nm, tested by high-resolution nanoindentation.
March 10, 2010 13:41 WSPC-255-IJAM SPI-J108 S1758825110000445
56 A. Kumar & K. Zeng
of the curves has lower hardness value (∼ 1GPa) and the last portion of the curveapproaches to the substrate hardness value. The middle portion of the curve showsgradually increasing in hardness with the indentation depth. The initial hardnessvalue for the 150 nm Al film sample (∼ 2GPa) is higher than that of the 280nm film,while for 50 nm film sample, it is quite high (∼ 10GPa). The reason is obviouslydue to the predominant substrate effect which is very significant for the 50 nm filmsample and therefore gives the hardness value which is close to the one for thesubstrate. The shape of the curves for 150nm and 280nm Al films are similar,but the curve for 50 nm Al film has shifted towards the substrate hardness valueand significant different from the other two. The elastic modulus versus normalizeindentation depth curves also show similar pattern as the hardness curves, for the150nm and 280nm films, the modulus curves are quite similar and for 50 nm film itis very different. The reasons for very different results for the 50nm Al film sampleis obviously due to the substrate effects, another factor may be that there is alwaysa thin layer of Al2O3 on Al film due to oxidation, and Al2O3 is a hard ceramicmaterial having high hardness and elastic modulus value.
Figure 5(b) shows hardness and elastic modulus versus normalize indentationdepth for the same Al films on Si substrate samples, but tested using high-resolutionnanoindentation set-up. When the same Al films are tested with the high-resolutionnanoindentation set-up, more clear changes at the beginning of the indentationcan be seen in comparison with that from the normal nanoindentation set-up. Thehardness value for 50 nm Al film is still higher but comparison to normal indentationit reduces significantly (∼ 6GPa), and for 150nm and 280 nm Al films the resultsare the same. This is due to that the high-resolution nanoindentation set-up canmeasure the initial part of the indentation more accurate, which is very importantfor the nanoindentation of ultra-thin films. In addition, the middle portions of thecurves for all the films are similar. Similarly, elastic modulus value is also reducedfor the 50 nm film significantly and for 150nm and 280 nm films almost the same.Therefore, these results suggest that the high-resolution nanoindentation set-upgives more accurate and consistent results especially for the ultra thin films.
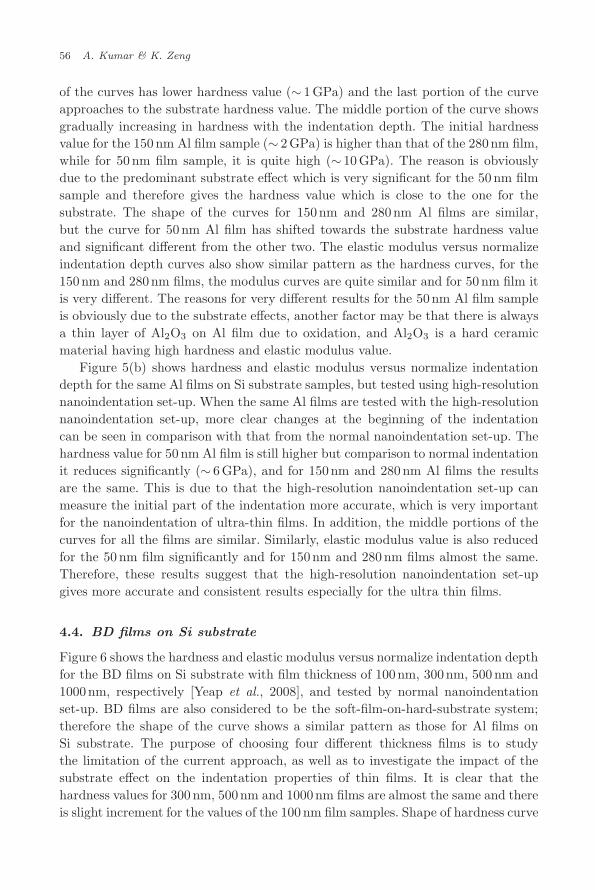
4.4. BD films on Si substrate
Figure 6 shows the hardness and elastic modulus versus normalize indentation depthfor the BD films on Si substrate with film thickness of 100nm, 300nm, 500 nm and1000nm, respectively [Yeap et al., 2008], and tested by normal nanoindentationset-up. BD films are also considered to be the soft-film-on-hard-substrate system;therefore the shape of the curve shows a similar pattern as those for Al films onSi substrate. The purpose of choosing four different thickness films is to studythe limitation of the current approach, as well as to investigate the impact of thesubstrate effect on the indentation properties of thin films. It is clear that thehardness values for 300 nm, 500nm and 1000nm films are almost the same and thereis slight increment for the values of the 100 nm film samples. Shape of hardness curve
March 10, 2010 13:41 WSPC-255-IJAM SPI-J108 S1758825110000445
Alternative Methods to Extract the Hardness and Elastic Modulus of Thin Films 57
Fig. 6. Hardness and elastic modulus versus normalize indentation depth, for BlackDiamondTM
films on Si substrate, with film thickness of 100 nm, 300 nm, 500 nm and 1000 nm, tested by normalnanoindentation.
for all the films are similar the only difference is that the 100nm film has slightlyhigher hardness value. Similar to hardness results, the shapes of the elastic moduluscurve are also similar, and for 100nm film the modulus value is slightly higher, dueto the substrate effects.
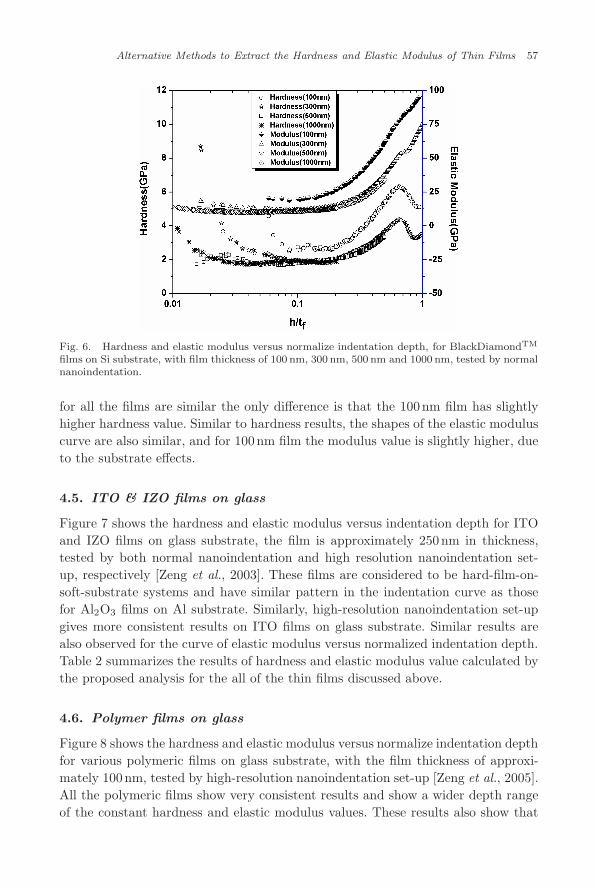
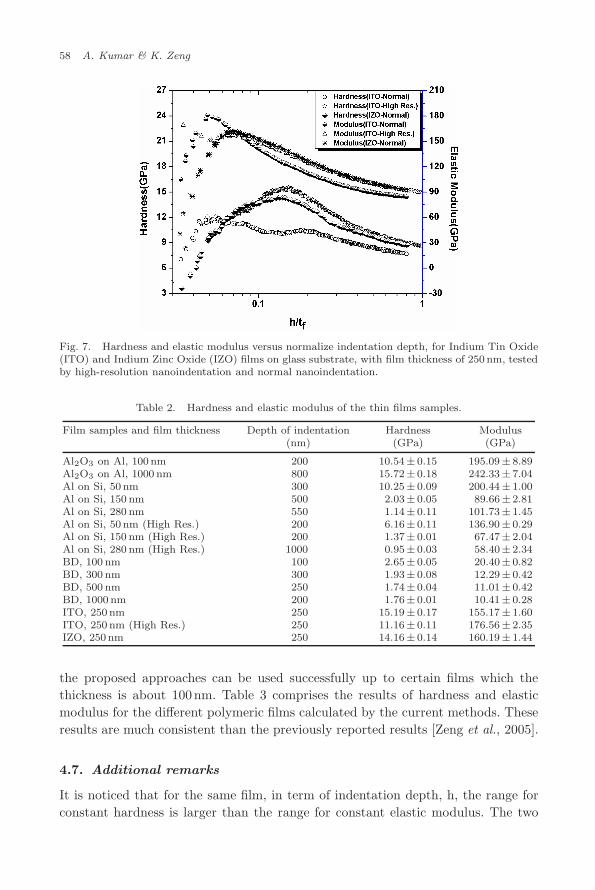
4.5. ITO & IZO films on glass
Figure 7 shows the hardness and elastic modulus versus indentation depth for ITOand IZO films on glass substrate, the film is approximately 250nm in thickness,tested by both normal nanoindentation and high resolution nanoindentation set-up, respectively [Zeng et al., 2003]. These films are considered to be hard-film-on-soft-substrate systems and have similar pattern in the indentation curve as thosefor Al2O3 films on Al substrate. Similarly, high-resolution nanoindentation set-upgives more consistent results on ITO films on glass substrate. Similar results arealso observed for the curve of elastic modulus versus normalized indentation depth.Table 2 summarizes the results of hardness and elastic modulus value calculated bythe proposed analysis for the all of the thin films discussed above.
4.6. Polymer films on glass
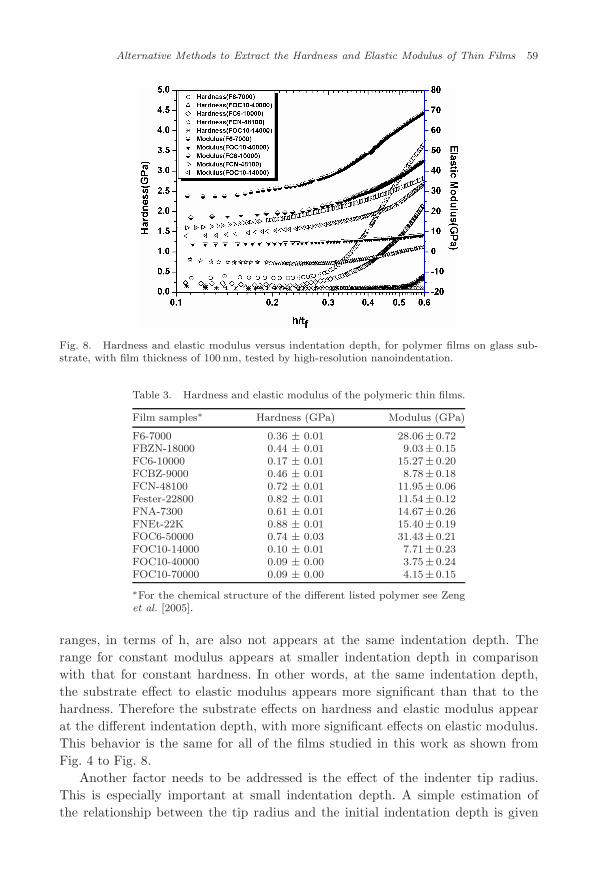
Figure 8 shows the hardness and elastic modulus versus normalize indentation depthfor various polymeric films on glass substrate, with the film thickness of approxi-mately 100nm, tested by high-resolution nanoindentation set-up [Zeng et al., 2005].All the polymeric films show very consistent results and show a wider depth rangeof the constant hardness and elastic modulus values. These results also show that
March 10, 2010 13:41 WSPC-255-IJAM SPI-J108 S1758825110000445
58 A. Kumar & K. Zeng
Fig. 7. Hardness and elastic modulus versus normalize indentation depth, for Indium Tin Oxide(ITO) and Indium Zinc Oxide (IZO) films on glass substrate, with film thickness of 250 nm, testedby high-resolution nanoindentation and normal nanoindentation.
Table 2. Hardness and elastic modulus of the thin films samples.
Film samples and film thickness Depth of indentation Hardness Modulus(nm) (GPa) (GPa)
Al2O3 on Al, 100 nm 200 10.54± 0.15 195.09± 8.89Al2O3 on Al, 1000 nm 800 15.72± 0.18 242.33± 7.04Al on Si, 50 nm 300 10.25± 0.09 200.44± 1.00Al on Si, 150 nm 500 2.03± 0.05 89.66± 2.81Al on Si, 280 nm 550 1.14± 0.11 101.73± 1.45Al on Si, 50 nm (High Res.) 200 6.16± 0.11 136.90± 0.29Al on Si, 150 nm (High Res.) 200 1.37± 0.01 67.47± 2.04Al on Si, 280 nm (High Res.) 1000 0.95± 0.03 58.40± 2.34BD, 100 nm 100 2.65± 0.05 20.40± 0.82BD, 300 nm 300 1.93± 0.08 12.29± 0.42BD, 500 nm 250 1.74± 0.04 11.01± 0.42BD, 1000 nm 200 1.76± 0.01 10.41± 0.28ITO, 250 nm 250 15.19± 0.17 155.17± 1.60ITO, 250 nm (High Res.) 250 11.16± 0.11 176.56± 2.35IZO, 250 nm 250 14.16± 0.14 160.19± 1.44
the proposed approaches can be used successfully up to certain films which thethickness is about 100nm. Table 3 comprises the results of hardness and elasticmodulus for the different polymeric films calculated by the current methods. Theseresults are much consistent than the previously reported results [Zeng et al., 2005].
4.7. Additional remarks
It is noticed that for the same film, in term of indentation depth, h, the range forconstant hardness is larger than the range for constant elastic modulus. The two
March 10, 2010 13:41 WSPC-255-IJAM SPI-J108 S1758825110000445
Alternative Methods to Extract the Hardness and Elastic Modulus of Thin Films 59
Fig. 8. Hardness and elastic modulus versus indentation depth, for polymer films on glass sub-strate, with film thickness of 100 nm, tested by high-resolution nanoindentation.
Table 3. Hardness and elastic modulus of the polymeric thin films.
Film samples∗ Hardness (GPa) Modulus (GPa)
F6-7000 0.36 ± 0.01 28.06± 0.72FBZN-18000 0.44 ± 0.01 9.03± 0.15FC6-10000 0.17 ± 0.01 15.27± 0.20FCBZ-9000 0.46 ± 0.01 8.78± 0.18FCN-48100 0.72 ± 0.01 11.95± 0.06Fester-22800 0.82 ± 0.01 11.54± 0.12FNA-7300 0.61 ± 0.01 14.67± 0.26FNEt-22K 0.88 ± 0.01 15.40± 0.19FOC6-50000 0.74 ± 0.03 31.43± 0.21FOC10-14000 0.10 ± 0.01 7.71± 0.23FOC10-40000 0.09 ± 0.00 3.75± 0.24FOC10-70000 0.09 ± 0.00 4.15± 0.15
∗For the chemical structure of the different listed polymer see Zenget al. [2005].
ranges, in terms of h, are also not appears at the same indentation depth. Therange for constant modulus appears at smaller indentation depth in comparisonwith that for constant hardness. In other words, at the same indentation depth,the substrate effect to elastic modulus appears more significant than that to thehardness. Therefore the substrate effects on hardness and elastic modulus appearat the different indentation depth, with more significant effects on elastic modulus.This behavior is the same for all of the films studied in this work as shown fromFig. 4 to Fig. 8.
Another factor needs to be addressed is the effect of the indenter tip radius.This is especially important at small indentation depth. A simple estimation ofthe relationship between the tip radius and the initial indentation depth is given
March 10, 2010 13:41 WSPC-255-IJAM SPI-J108 S1758825110000445
60 A. Kumar & K. Zeng
in Appendix D-1. It is found that the initial indentation depth, in the range of2.5 to 11 nm, for the indenter tip radius of 50 to 200nm, may follow the sphericalindentation relationship, in which is P ∼ h1.5. Therefore, current analysis, based onthe P ∼ h2 relationship, will introduce certain errors within this region and shouldnot be used. It is possible to derive a precise analysis for this initial region. However,in this proposed analysis method, we choose to ignore the first 5 nm indentationdata, and also ignore the transition from spherical tip to sharp tip. This simplifiedassumptions will induce errors in the beginning of the indentation, this is especiallysignificant for the ultra-thin films. This may also explain why this analysis was notable to provide accurate results for the ultra-thin film such as 50 nm Al film on Sisubstrate.
5. Summary and Conclusions
This paper presented alternative methods to calculate hardness and elasticity valuesfrom nanoindentation load displacement data for the thin films. From the results,following conclusions can be made:
(1) This analysis proposes certain physical meanings of the nanoindentation load-displacement curves, i.e., the hardness can be represented by the second orderdifferentiation of the nanoindentation loading curve; whereas the elastic mod-ulus can be represented by the second order differentiation of the nanoinden-tation unloading curve. Alternatively, the elastic modulus can be representedby the first order differentiation of the nanoindentation stiffness-displacementdata from loading portion of the CSM nanoindentation.
(2) For bulk materials, the hardness and elastic modulus values obtained from thisanalysis are consistent with literature values and those obtained from Oliverand Pharr’s analysis.
(3) For thin films, the results are very consistent; the slight variation in the begin-ning of the indentation could be because of several factors such as the tiproundness, surface roughness and machine resolutions.
(4) The current analysis is capable of determining film-only property for ultra-thin films. This approach is also able to determine the portion of indentationaffected by substrate.
(5) For ultra-thin films with the order of few tens to hundreds nanometers thick-ness, high-resolution nanoindentation set-up is needed to obtain consistent andreliable results.
(6) The analysis also suggest that, for ultra-thin films where the substrate mayaffect the indentation measurement from the beginning of the indentation, oneneed to consider the variation of hardness and elastic modulus with indentationdepth and also consider the variation of the ratio hc/h with indentation depth.
(7) Analysis of the nanoindentation results by this new approach for different kindof metallic, ceramic and polymeric films shows that this new method is veryeffective and can extract the hardness and elastic modules of the thin films
March 10, 2010 13:41 WSPC-255-IJAM SPI-J108 S1758825110000445
Alternative Methods to Extract the Hardness and Elastic Modulus of Thin Films 61
with the thickness on the order of 100nm and above. It is also verified thatthis method works well for both hard-film-soft-substrate and soft-film-hard-substrate.
(8) It is observed that the substrate effects to hardness and elastic modulus do notappears at the same indentation depth. The substrate effect on elastic modulusis more significant than that for hardness at the same indentation depth.
(9) During nanoindentation of thin films, a general accepted rule is that the inden-tation depth should be less than 10% of the film thickness. However, this study(Fig. 4(b) to Fig. 7) show that: (i) to determine elastic modulus of the film,the indentation depth should be less than 10% of the film thickness in general,probably around 5% of the film thickness; and (ii) to determine the hardnessof the film, the indentation depth can beyond the 10% of limit, reaches toapproximately 20% of the film thickness. This range, however, may be affectedby the indenter tip radius and therefore the analysis cannot be applied toultra-thin films (most likely the film thickness less than 100 nm) at this stage.
(10) For polymeric films, it is found that (Fig. 8): (i) to determine the elastic mod-ulus of the film, the indentation depth is indeed about 10% of film thickness;and (ii) to determine hardness, the indentation depth can reach to approxi-mately 20–50% of the film thickness. This implies that the differences in termof properties (elastic modulus or hardness) between the substrate and filmare also an important factor affecting the indentation measured mechanicalproperties. It suggests that, if the differences are large, such as polymeric filmson hard substrates, then the indentation depth can be large; and the smallerdifferences, the indentation depth should also be small.
Acknowledgement
This work is supported by Ministry of Education through National University ofSingapore under Academic Research Funds (R-265-000-190-112 and R265-000-190-133). The authors would like to thank Ms. Lu Shen at Institute of Materials Researchand Engineering (Singapore) for the help with the nanoindentation experiments.
Appendix A
Differentiate Eq. (10) with respect to h:
dP
dh= 24.56
(2Hω2h + 2Hωh2 dω
dh+ h2ω2 dH
dh
)(A.1)
Differentiate Eq. (A.1) one more time with respect to h results:
d2P
dh2= 49.12
(Hω2 + 4Hωh.
dω
dh+ 2h2ω
dH
dh
)+ 49.12
(Hωh2 d2ω
dh2+ Hh2
(dω
dh
)2)
+ 24.56(
ω2h2 d2H
dh2+ 4ωh2
(dH
dh
)(dω
dh
))(A.2)
March 10, 2010 13:41 WSPC-255-IJAM SPI-J108 S1758825110000445
62 A. Kumar & K. Zeng
If both the first order and second order of differentiation of H and ω with h arezero, then Eq. (A.2) becomes:
d2P
dh2= 49.12Hω2 (A.3)
which is the same as Eq. (11).
Appendix B
B.1. Hardness
If the area correction is introducing according to the Eq. (19):
Ac = 24.5h2c + C1hc + C2h
1/2c + C3h
1/4c + · · · + C8h
1/128c (B.1)
If only the first three terms in Eq. (B.1) are used as in our study, then Eq. (B.1)can be written as:
Ac = 24.5h2c + C1hc + C2h
1/2c (B.2)
Substituting Eq. (B.2) into Eq. (2) results:
P = H(24.56h2c + C1hc + C2h
1/2c ) (B.3)
Rearranging Eq. (B.3), one can get
P = 24.56Hh2
(hc
h
)2
+ C1Hh
(hc
h
)+ C2Hh1/2
(hc
h
)1/2
(B.4)
Substituting ω in place of hc
h in Eq. (B.4):
P = 24.56Hh2ω2 + C1Hhω + C2Hh1/2ω1/2 (B.5)
Now by the differentiation of the Eq. (B.5) with respect to h yields:
dP
dh= 49.12Hhω2 + C1Hω +
C2H
2
(ω
h
)1/2
+
(49.12Hh2ω + C1Hh +
C2H
2
(h
ω
)1/2)
dω
dh
+ [24.56h2ω2 + C1hω + C2(hω)1/2]dH
dh(B.6)
For the initial part of indentation load-displacement data, the variation in H andω with the indentation depth can be ignored, i.e. dω
dh = 0 and dHdh = 0. Therefore
March 10, 2010 13:41 WSPC-255-IJAM SPI-J108 S1758825110000445
Alternative Methods to Extract the Hardness and Elastic Modulus of Thin Films 63
the Eq. (B.6) can be written as:
dP
dh= 49.12Hhω2 + C1Hω +
C2H
2
(ω
h
)1/2
(B.7)
Differentiating Eq. (B.7) once more respective to h for the initial part of indentationload-displacement data:
d2P
dh2= 49.12Hω2 − C2H
4h
(ω
h
)1/2
(B.8)
Rearranging the Eq. (B.8) to get the final expression for the hardness:
H =h3/2
49.12h3/2ω2 − 0.25C2ω1/2
(d2P
dh2
)(B.9)
B.2. Elastic modulus
Contact stiffness value from the Eq. (14) can be given as:
S =dP
dh= β
2√π
√AcEr (B.10)
Substituting the value of Ac from the Eq. (B.2) into the Eq. (B.10):
S =2βEr√
π(24.5h2
c + C1hc + C2h1/2c )1/2 (B.11)
Substituting ω in place of hc
h in the Eq. (B.11) results:
S =2βEr√
π(24.5h2ω2 + C1hω + C2h
1/2ω1/2)1/2 (B.12)
Differentiation Eq. (B.12) with respect to h gives:
dS
dh=
2βEr√π
d
dh(24.5h2ω2 + C1hω + C2h
1/2ω1/2)1/2
+2β√
π(24.5h2ω2 + C1hω + C2h
1/2ω1/2)1/2 dEr
dh(B.13)
To simplify the calculation, let:
θ =d
dh(24.5h2ω2 + C1hω + C2h
1/2ω1/2)1/2 (B.14)
By extend the right hand side of Eq. (B.14), one can get:
θ =49.12hω2 + C1ω + C2
2
(ωh
)1/2+(49.12ωh2 + C1h + C2
2
(hω
)1/2)dωdh
2(24.56h2ω2 + C1hω + C2h1/2ω1/2
)1/2(B.15)
For the initial part of indentation the variation of ω and Er along the indentationdepth can be ignored, i.e. dω
dh = 0 and dEr
dh = 0. Therefore, the final expression can
March 10, 2010 13:41 WSPC-255-IJAM SPI-J108 S1758825110000445
64 A. Kumar & K. Zeng
be given by:
dS
dh=
βEr√π
(49.12hω2 + C1ω + C2
2
(ωh
)1/2)(24.56h2ω2 + C1hω + C2h1/2ω1/2)1/2
(B.16)
Rearranging the Eq. (B.16) to get the final expression for elasticity:
Er =√
π
β
(24.56h2ω2 + C1hω + C2h1/2ω1/2)1/2(
49.12hω2 + C1ω + C2
(ω4h
)1/2) dS
dh(B.17)
Appendix C
C.1. Hardness
Refer to Fig. 1, the real indentation measurement is h, with the contact depth ofhc, determined by Eq. (5). Assuming the tip is round, and the difference betweenthe round tip and the perfect sharp tip can be written by an additional depth δ.Then the contact area with this correction can be written as:
Ac = 24.56(h + δ)2 (C.1)
Substituting Eq. (5) into Eq. (C.1), one can get:
Ac = 24.56(
h − εP
SCSM+ δ
)2
= 24.56[1 − ε
P
SCSM (h + δ)
]2(h + δ)2
= α(h + δ)2 (C.2)
Therefore, the area correction can be written as:
Ac = α(h + δ)2 (C.3)
Substituting Eq. (C.3) into Eq. (2), one can get:
P = Hα(h + δ)2 (C.4)
The constant α in Eq. (C.3) can be estimated from Eq. (C.2) first, then curve fittingof Eq. (C.4) to the indentation load-displacement data to determine the value ofδ. Some iterations are then needed to refine the value of α and δ by inter-usingEqs. (C.4) and (C.2).
If differentiating Eq. (C.4) with respect to depth of indentation h:
dP
dh= 2αH(h + δ) + α(h + δ)2
dH
dh(C.5)
Differentiating one more time the Eq. (C.5) results:
d2P
dh2= 2αH + 4α(h + δ)
dH
dh+ α(h + δ)2
d2H
dh2(C.6)
March 10, 2010 13:41 WSPC-255-IJAM SPI-J108 S1758825110000445
Alternative Methods to Extract the Hardness and Elastic Modulus of Thin Films 65
For the initial part of indentation, the variation of hardness with indentation depthcan be ignored, i.e. dH
dh = d2Hdh2 = 0. Therefore the Eq. (C.6) becomes:
d2P
dh2= 2αH (C.7)
Rearranging the Eq. (C.7) the hardness value can be given as:
H =12α
(d2P
dh2
)(C.8)
where (d2Pdh2 ) can be calculated by curve fitting to the load-displacement data fol-
lowed by second order differentiation of the fitting function (P = λ(h + δ)2).
C.2. Elastic modulus
Again considering the Eq. (14) for stiffness
S =dP
dh= β
2√π
√AcEr (C.9)
Substituting Eq. (C.3) into Eq. (C.9):
S = β2√
α√π
Er(h + δ) (C.10)
Differentiating Eq. (C.10) respective to h:
dS
dh= β
2√
α√π
Er + β2√
α√π
(h + δ)dEr
dh(C.11)
For the initial part of the indentation variation of Er can be ignored, i.e. dEr
dh = 0.Therefore, Eq. (C.11) becomes:
dS
dh= β
2√
α√π
Er (C.12)
Thus the final expression for the elastic modulus can be given by:
Er =√
π
2β√
α
dS
dh(C.13)
where β is a constant (1.034 for Berkovich tip) depends on the indenter geometry,and dS
dh can be calculated by the curve fitting the stiffness-displacement data followedby differentiation the fitting function (S = µ(h + δ)).
Appendix D
D.1. Relationship between tip roundness and initial indentation depth
Generally for the Berkovich indenter the equivalent cone angle is considered approx-imately 70.29◦. If the radius of the tip is r (Fig. D.1), then the initial indentationdepth (x) will follow the spherical indentation relation, in which is P ∝ h3/2. From
March 10, 2010 13:41 WSPC-255-IJAM SPI-J108 S1758825110000445
66 A. Kumar & K. Zeng
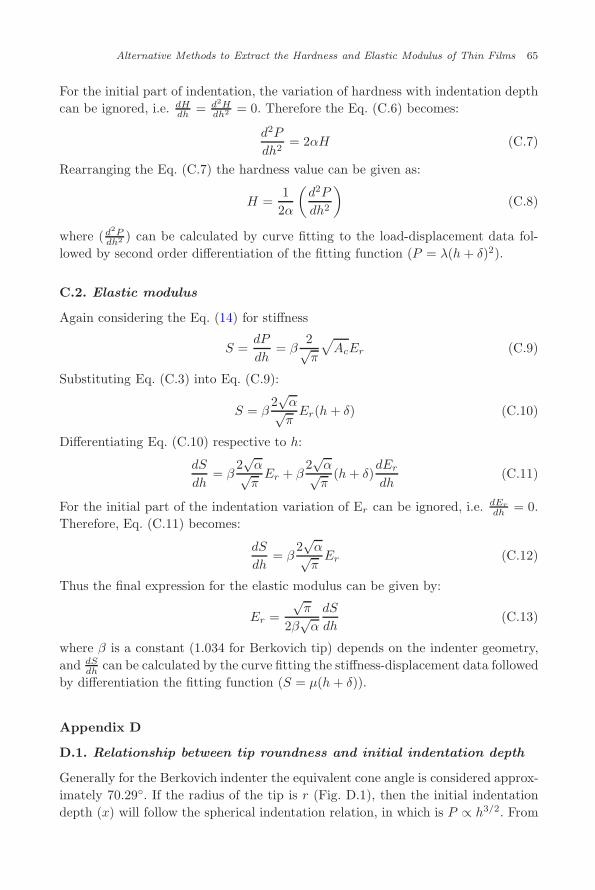
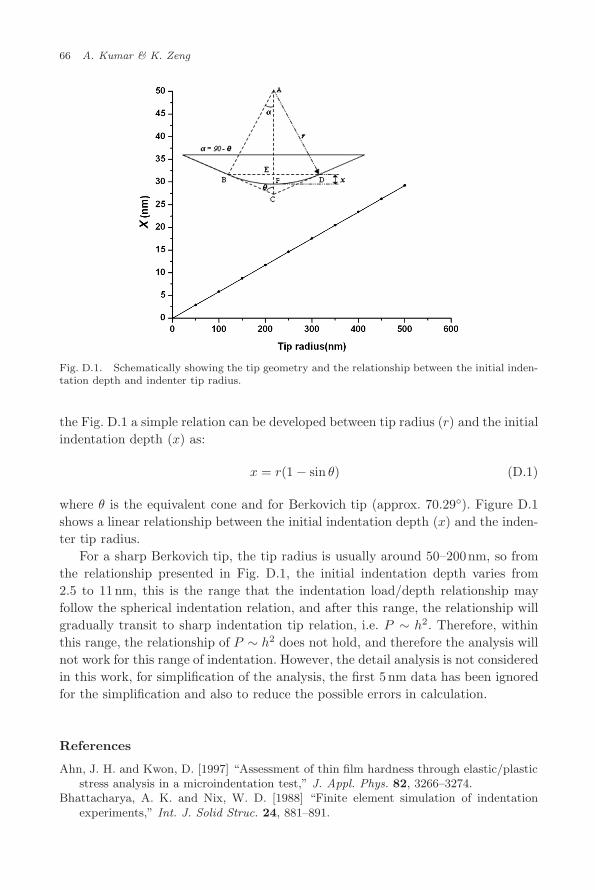
Fig. D.1. Schematically showing the tip geometry and the relationship between the initial inden-tation depth and indenter tip radius.
the Fig. D.1 a simple relation can be developed between tip radius (r) and the initialindentation depth (x) as:
x = r(1 − sin θ) (D.1)
where θ is the equivalent cone and for Berkovich tip (approx. 70.29◦). Figure D.1shows a linear relationship between the initial indentation depth (x) and the inden-ter tip radius.
For a sharp Berkovich tip, the tip radius is usually around 50–200nm, so fromthe relationship presented in Fig. D.1, the initial indentation depth varies from2.5 to 11 nm, this is the range that the indentation load/depth relationship mayfollow the spherical indentation relation, and after this range, the relationship willgradually transit to sharp indentation tip relation, i.e. P ∼ h2. Therefore, withinthis range, the relationship of P ∼ h2 does not hold, and therefore the analysis willnot work for this range of indentation. However, the detail analysis is not consideredin this work, for simplification of the analysis, the first 5 nm data has been ignoredfor the simplification and also to reduce the possible errors in calculation.
References
Ahn, J. H. and Kwon, D. [1997] “Assessment of thin film hardness through elastic/plasticstress analysis in a microindentation test,” J. Appl. Phys. 82, 3266–3274.
Bhattacharya, A. K. and Nix, W. D. [1988] “Finite element simulation of indentationexperiments,” Int. J. Solid Struc. 24, 881–891.
March 10, 2010 13:41 WSPC-255-IJAM SPI-J108 S1758825110000445
Alternative Methods to Extract the Hardness and Elastic Modulus of Thin Films 67
Cheng, C. M. and Cheng, Y. T. [1997] “On the initial unloading slope in indentation ofelastic-plastic solids by an indenter with an axisymmetric smooth profile” Appl. Phys.Lett 71, 2623–2625.
Doerner, M. F. and Nix, W. D. [1986] “A method for interpreting the data from depth-sensing indentation instruments,” J. Mater. Res. 1, 601–609.
Gao, H. and Wu, T.W. [1993] “A note on the elastic contact stiffness on a layered medium,”J. Mater. Res. 8, 3229–3232.
Hainsworth, S. V., Chandler, H. W. and Page, T. F. [1996] “Analysis of nanoindentationload-displacement loading curves,” J. Mater. Res. 11, 1987–995.
King, R. B. [1987] “Elastic analysis of some punch problems for a layered medium,” Int.J. Solid. Struc. 23, 1657–1664.
Korsunsky, A. M., McGurk, M. R. and Bull, S. J. [1998] “On the hardness of coatingsystems,” Surf. Coat. Tech. 99, 171–183.
Korsunsky, A. M. and Constantinescu, A. [2006] “Work of indentation approach to theanalysis of hardness and modulu of thin coatings,” Mater. Sci. Eng. A 423, 28–35.
Joslin, D. L. and Oliver, W. C. [1990] “A new method for analyzing data from continuousdepth-sensing microindentation tests,” J. Mater. Res. 5, 123–126.
Li, X. and Bhushan, B. [2002] “A Review of nanoindentation continuous stiffness measure-ment technique and its applications,” Mater. Charact. 48, 11–36.
Liu, Z. S., Harsono, E. and Swaddiwudhipong, S. [2009] “Material characterization basedon instrumented and simulated indentation tests,” Int. J. Appl. Mech. 1, 61–84.
Loubet, J. L., Georges, J. M., Marchesini, O. and Meille, G. [1984] “Vickers indentationcurves of Magnesium Oxide (MgO),” J. Tribology 106, 43–48.
Malzbender, J., de With, G. and den Toonder, J. [2000] “The P-h2 relationship in inden-tation,” J. Mater. Res. 15, 1209–1212.
Malzbender, J., den Toonder, J. M. J., Balkenende, A. R. and de With, G. [2002] “Measur-ing mechanical properties of coatings: A methodology applied to nano-particle-filledsol-gel coatings on glass,” Mat. Sci. Engng. R 36, 47–103.
McElhaney, K. W., Vlassak, J. J. and Nix, W. D. [1998] “Determination of indenter tipgeometry and indentation contact area for depth-sensing indentation experiments,” J.Mater. Res. 13, 1300–1306.
McGurk, M. R. and Page, T. F. [1999] “Using the P-δ2 analysis to deconvolute thenanoindentation response of hard-coated systems,” J. Mater. Res. 14, 2283–2295.
Oliver, W. C. and Pharr, G. M. [1992] “An improved technique for determining hardnessand elastic modulus using load and displacement sensing indentation experiments,” J.Mater. Res. 7, 1564–1583.
Oliver, W. C. and Pharr, G. M. [2004] “Review: Measurement of hardness and elasticmodulus by instrumented indentation: advances in understanding and refinements tomethodology,” J. Mater. Res. 19, 3–20.
Pharr, G. M., Oliver, W. C. and Brotzen, F. R. [1992] “On the generality of the relationshipamong contact stiffness, contact area, and elastic modulus during indentation,” J.Mater. Res. 7, 613–617.
Saha, R. and Nix, W. D. [2002] “Effects of the substrate on the determination of thin filmmechanical properties by nanoindentation,” Acta Mater. 50, 23–38.
Sneddon, I. N. [1965] “The relation between load and penetration in the axisymmetricboussinesq problem for a punch of arbitrary profile,” Int. J. Engng. Sci. 3, 47–57.
Yeap, K. B., Zeng, K. and Chi, D. [2008] “Determining the interfacial toughness oflow-k films on Si substrate by wedge indentation: Further studies,” Acta Mater. 56,977–984.

March 10, 2010 13:41 WSPC-255-IJAM SPI-J108 S1758825110000445
68 A. Kumar & K. Zeng
Zeng, K. [2009] “Nanoindentation of thin films and its application,” in Handbook of Nanoce-ramics and Their based Nanodevices, Eds. T. Y. Tseng and H. S. Nalwa (AmericanScientific Publisher, Los Angeles, California, USA), Chapter 55.
Zeng, K., Zhu, F., Hu, J., Shen, L., Zhang, K. and Gong, H. [2003] “Investigation ofmechanical properties of transparent conducting oxide thin films,” Thin Solid Films443, 60–65.
Zeng, K., Chen, Z. K., Shen, L. and Liu, B. [2005] “Study of mechanical properties oflight-emitting polymer films by nanoindentation technique,” Thin Solid Films 477,111–118.
Related Documents


