Applied Genetics Alternative Methods for Human Identification: Mitochondrial DNA Base Composition Profiling by ESI-TOF Mass Spectrometry Kevin Kiesler Eric Pokorak, Thomas Callaghan PhD, Peter Vallone PhD American Academy of Forensic Sciences Meeting Washington, D.C. February 22, 2013

Welcome message from author
This document is posted to help you gain knowledge. Please leave a comment to let me know what you think about it! Share it to your friends and learn new things together.
Transcript

Applied
Genetics
Alternative Methods for Human Identification:
Mitochondrial DNA Base Composition Profiling
by ESI-TOF Mass Spectrometry
Kevin Kiesler Eric Pokorak, Thomas Callaghan PhD, Peter Vallone PhD
American Academy of Forensic Sciences Meeting
Washington, D.C.
February 22, 2013

Applied
Genetics Disclaimer
This presentation will discuss the PLEX-ID ESI-TOF mass spectrometer developed by Ibis Biosciences and marketed by Abbott Molecular
The PLEX-ID has been voluntarily recalled from the market due to reliability issues reported by clinical customers
– It is being redesigned for re-release in the future
Certain commercial equipment, instruments and materials are identified in order to specify experimental procedures as completely as possible. In no case does such identification imply a recommendation or it imply that any of the materials, instruments or equipment identified are necessarily the best available for the purpose.
Points of view are those of the presenters and do not necessarily represent the official position of the Department of Commerce, the National Institute of Standards and Technology, or the U.S. Department of Justice.

Applied
Genetics Presentation Outline
• Introduction & background
• Why mass spectrometry?
• PLEX-ID mtDNA 2.0 Assay
• Concordance study
• Haplotype diversity
Applied
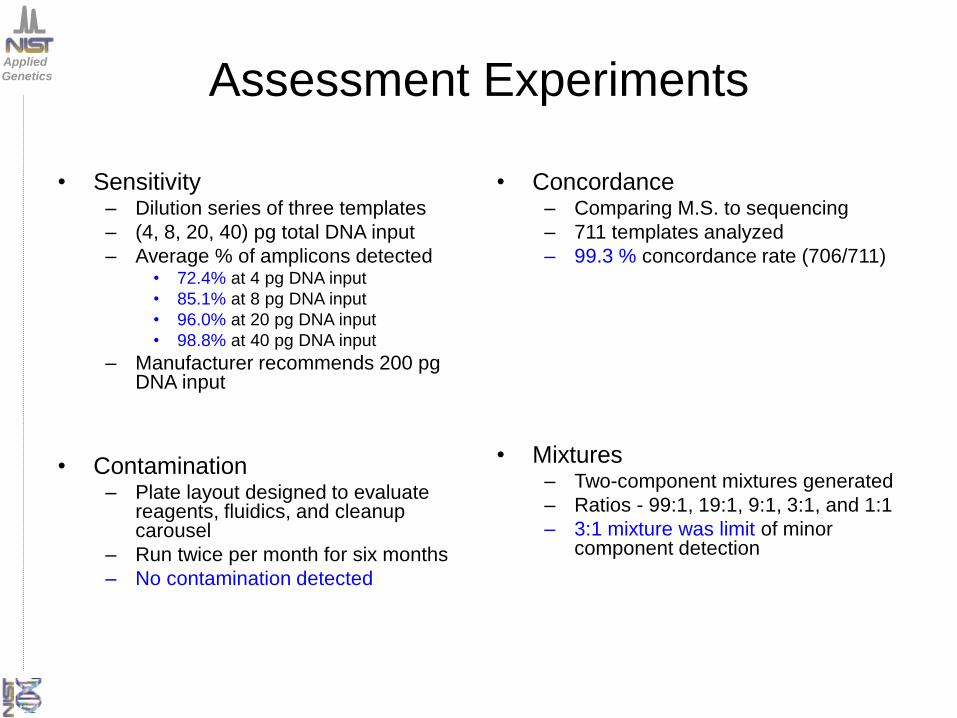
Genetics Assessment Experiments
• Sensitivity – Dilution series of three templates
– (4, 8, 20, 40) pg total DNA input
– Average % of amplicons detected • 72.4% at 4 pg DNA input
• 85.1% at 8 pg DNA input
• 96.0% at 20 pg DNA input
• 98.8% at 40 pg DNA input
– Manufacturer recommends 200 pg DNA input
• Contamination – Plate layout designed to evaluate
reagents, fluidics, and cleanup carousel
– Run twice per month for six months
– No contamination detected
• Concordance – Comparing M.S. to sequencing
– 711 templates analyzed
– 99.3 % concordance rate (706/711)
• Mixtures – Two-component mixtures generated
– Ratios - 99:1, 19:1, 9:1, 3:1, and 1:1
– 3:1 mixture was limit of minor component detection

Applied
Genetics Assessment Experiments
• Sensitivity – Dilution series of three templates
– (4, 8, 20, 40) pg total DNA input
– Average % of amplicons detected • 72.4% at 4 pg DNA input
• 85.1% at 8 pg DNA input
• 96.0% at 20 pg DNA input
• 98.8% at 40 pg DNA input
– Manufacturer recommends 200 pg DNA input
• Contamination – Plate layout designed to evaluate
reagents, fluidics, and cleanup carousel
– Run twice per month for six months
– No contamination detected
• Concordance – Comparing M.S. to sequencing
– 711 templates analyzed
– 99.3 % concordance rate (706/711)
• Mixtures – Two-component mixtures generated
– Ratios - 99:1, 19:1, 9:1, 3:1, and 1:1
– 3:1 mixture was limit of minor component detection
Applied
Genetics Full Report Available Online
• http://www.cstl.nist.gov/strbase/NISTpub.htm
Applied
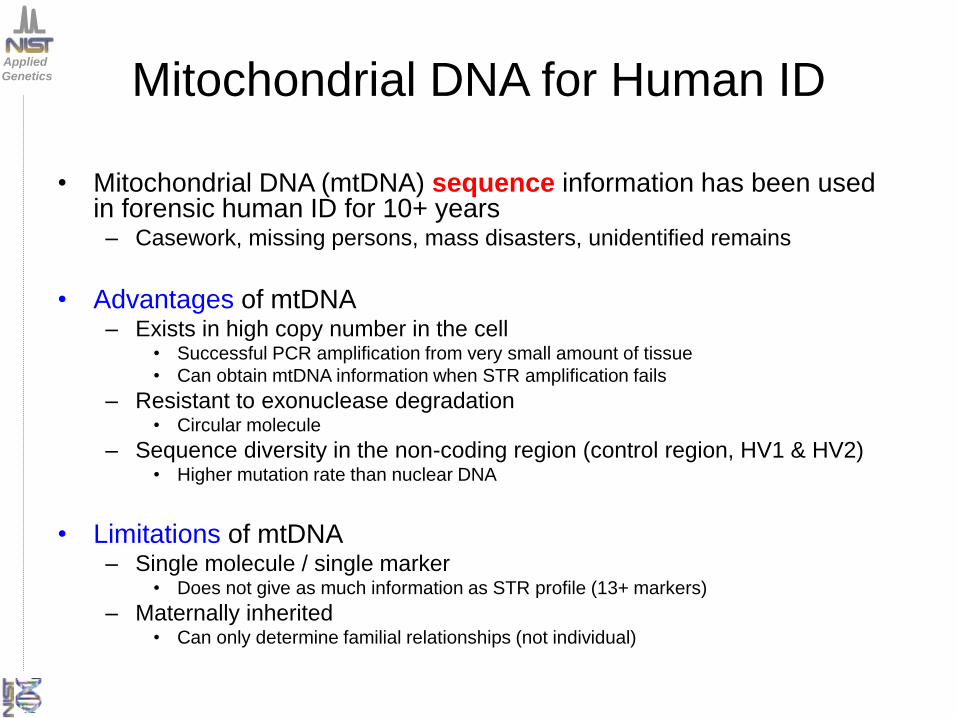
Genetics Mitochondrial DNA for Human ID
• Mitochondrial DNA (mtDNA) sequence information has been used in forensic human ID for 10+ years – Casework, missing persons, mass disasters, unidentified remains
• Advantages of mtDNA – Exists in high copy number in the cell
• Successful PCR amplification from very small amount of tissue
• Can obtain mtDNA information when STR amplification fails
– Resistant to exonuclease degradation • Circular molecule
– Sequence diversity in the non-coding region (control region, HV1 & HV2) • Higher mutation rate than nuclear DNA
• Limitations of mtDNA – Single molecule / single marker
• Does not give as much information as STR profile (13+ markers)
– Maternally inherited • Can only determine familial relationships (not individual)

Applied
Genetics Mass Spectrometry or Sequencing?
• Simplified workflow vs Sanger Sequencing – PLEX-ID: PCR product is analyzed on a fully automated system
– Reduced cost through savings in labor (wet lab and analysis)
– Faster turnaround
PLEX-ID
DNA Extraction
PCR Amplification
Mass Determination
Cleanup PCR Cleanup PCR
Sequencing Reaction
Sequencing Cleanup
Sequence Alignment
Data Review
C. E.
Data Review
Mass Spec
Cost $180
Time 4 hours
Sequencing
Cost $240+
Time 10+ hours
Example:
One sample mtDNA typing
= Automated step

Applied
Genetics Sequencing Results are Different From
Mass Spectrometry – “Base Composition”
• Sequencing gives an ordered string of bases
• Mass spectrometry only gives a mass measurement – We know the masses of nucleotides
– Base composition of a DNA molecule can be calculated
– An empirical formula of numbers of A, G, C, and T residues
– Positional information is lost
A6 G4 C5 T3 Light strand
5594.6 Daltons
A6 G4 C5 T3
Heavy strand
5617.6 Daltons
A3 G5 C4 T6
Hypothetical
example

Applied
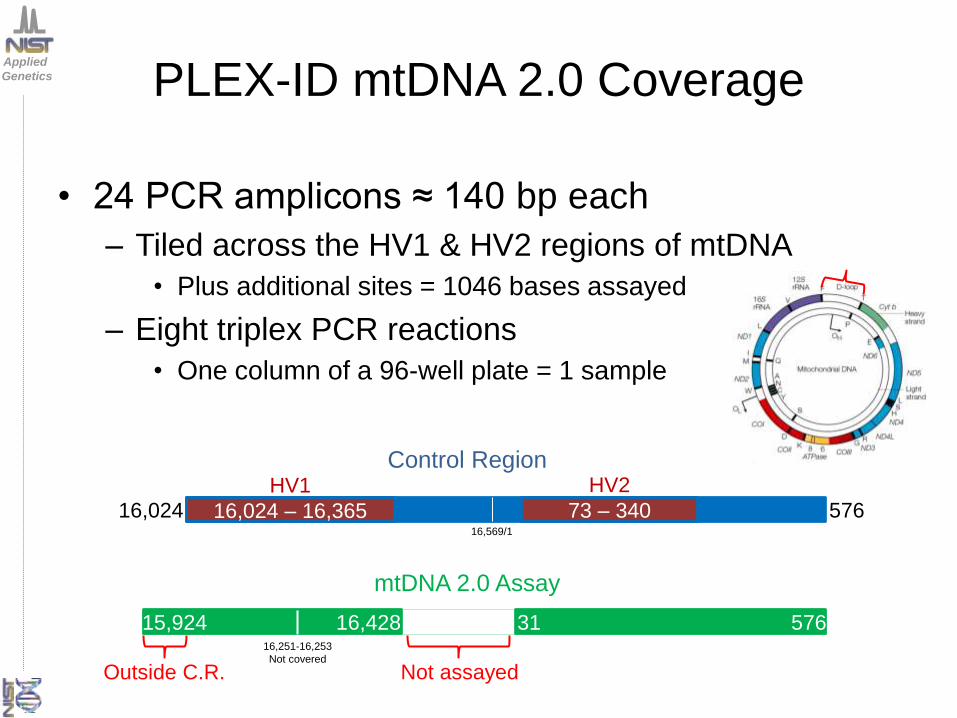
Genetics PLEX-ID mtDNA 2.0 Coverage
• 24 PCR amplicons ≈ 140 bp each
– Tiled across the HV1 & HV2 regions of mtDNA
• Plus additional sites = 1046 bases assayed
– Eight triplex PCR reactions
• One column of a 96-well plate = 1 sample
16,024
HV1
16,024 – 16,365
HV2
73 – 340 576 16,569/1
Control Region
15,924 16,428 576 16,251-16,253
Not covered
mtDNA 2.0 Assay
31
Applied
Genetics PLEX-ID mtDNA 2.0 Coverage
• 24 PCR amplicons ≈ 140 bp each
– Tiled across the HV1 & HV2 regions of mtDNA
• Plus additional sites = 1046 bases assayed
– Eight triplex PCR reactions
• One column of a 96-well plate = 1 sample
16,024
HV1
16,024 – 16,365
HV2
73 – 340 576 16,569/1
Control Region
15,924 16,428 576 16,251-16,253
Not covered
mtDNA 2.0 Assay
31
Outside C.R. Not assayed
Applied
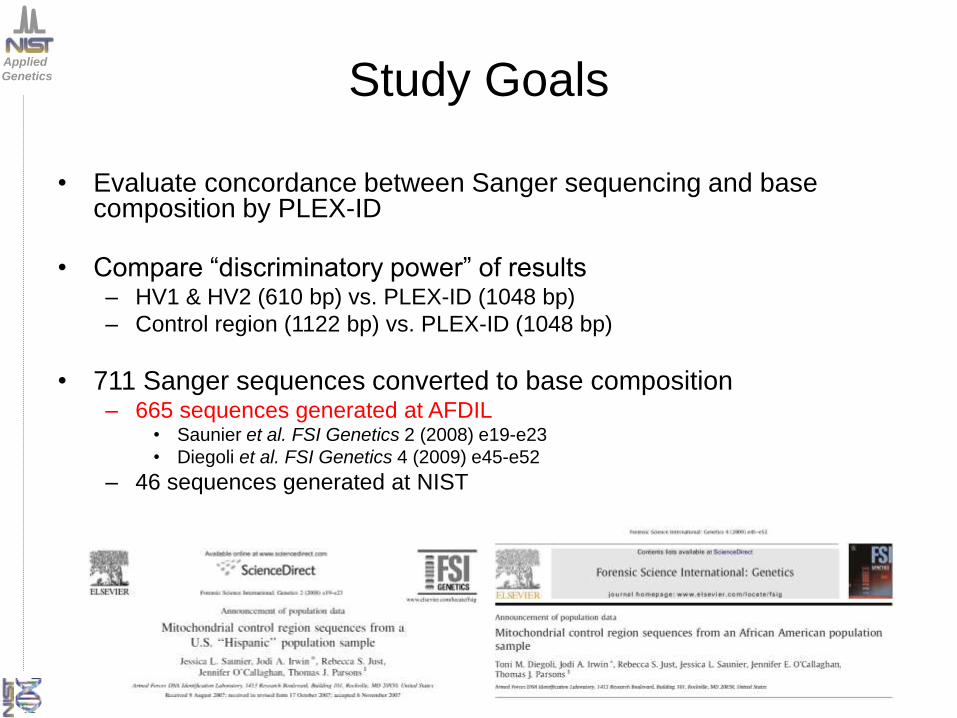
Genetics Study Goals
• Evaluate concordance between Sanger sequencing and base composition by PLEX-ID
• Compare “discriminatory power” of results – HV1 & HV2 (610 bp) vs. PLEX-ID (1048 bp)
– Control region (1122 bp) vs. PLEX-ID (1048 bp)
• 711 Sanger sequences converted to base composition – 665 sequences generated at AFDIL
• Saunier et al. FSI Genetics 2 (2008) e19-e23
• Diegoli et al. FSI Genetics 4 (2009) e45-e52
– 46 sequences generated at NIST
Applied
Genetics Experimental Method
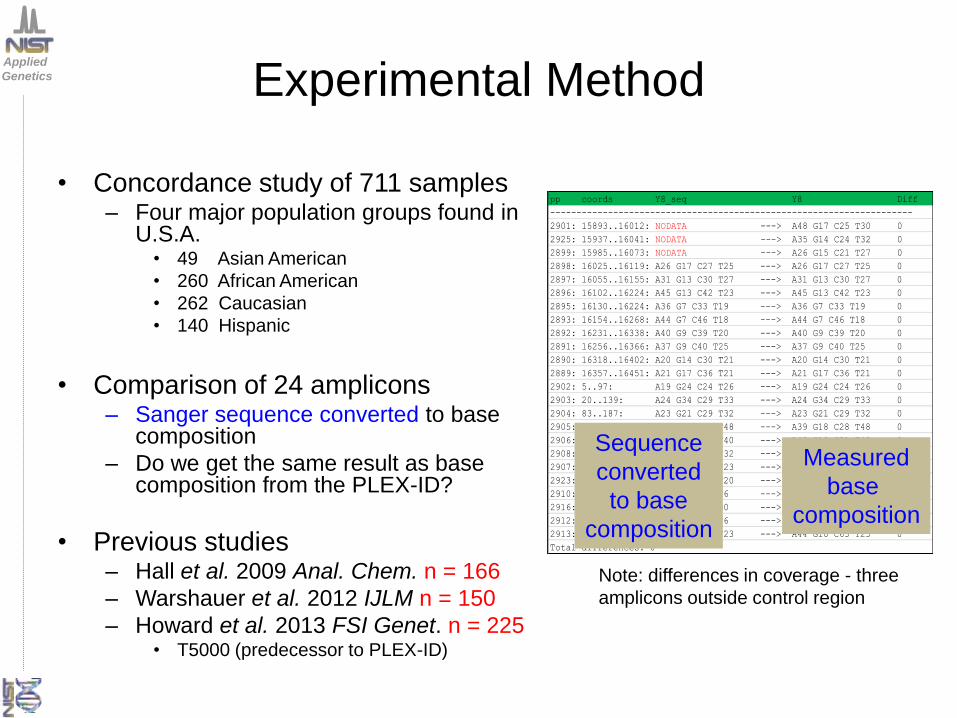
• Concordance study of 711 samples – Four major population groups found in
U.S.A. • 49 Asian American
• 260 African American
• 262 Caucasian
• 140 Hispanic
• Comparison of 24 amplicons – Sanger sequence converted to base
composition
– Do we get the same result as base composition from the PLEX-ID?
• Previous studies – Hall et al. 2009 Anal. Chem. n = 166
– Warshauer et al. 2012 IJLM n = 150
– Howard et al. 2013 FSI Genet. n = 225 • T5000 (predecessor to PLEX-ID)
Note: differences in coverage - three
amplicons outside control region
pp coords Y8_seq Y8 Diff
---------------------------------------------------------------------
2901: 15893..16012: NODATA ---> A48 G17 C25 T30 0
2925: 15937..16041: NODATA ---> A35 G14 C24 T32 0
2899: 15985..16073: NODATA ---> A26 G15 C21 T27 0
2898: 16025..16119: A26 G17 C27 T25 ---> A26 G17 C27 T25 0
2897: 16055..16155: A31 G13 C30 T27 ---> A31 G13 C30 T27 0
2896: 16102..16224: A45 G13 C42 T23 ---> A45 G13 C42 T23 0
2895: 16130..16224: A36 G7 C33 T19 ---> A36 G7 C33 T19 0
2893: 16154..16268: A44 G7 C46 T18 ---> A44 G7 C46 T18 0
2892: 16231..16338: A40 G9 C39 T20 ---> A40 G9 C39 T20 0
2891: 16256..16366: A37 G9 C40 T25 ---> A37 G9 C40 T25 0
2890: 16318..16402: A20 G14 C30 T21 ---> A20 G14 C30 T21 0
2889: 16357..16451: A21 G17 C36 T21 ---> A21 G17 C36 T21 0
2902: 5..97: A19 G24 C24 T26 ---> A19 G24 C24 T26 0
2903: 20..139: A24 G34 C29 T33 ---> A24 G34 C29 T33 0
2904: 83..187: A23 G21 C29 T32 ---> A23 G21 C29 T32 0
2905: 113..245: A39 G18 C28 T48 ---> A39 G18 C28 T48 0
2906: 154..290: A48 G18 C31 T40 ---> A48 G18 C31 T40 0
2908: 204..330: A42 G16 C39 T32 ---> A42 G16 C39 T32 0
2907: 239..363: A43 G11 C50 T23 ---> A43 G11 C50 T23 0
2923: 262..390: A47 G10 C54 T20 ---> A47 G10 C54 T20 0
2910: 331..425: A33 G9 C27 T26 ---> A33 G9 C27 T26 0
2916: 367..463: A27 G8 C32 T30 ---> A27 G8 C32 T30 0
2912: 409..521: A32 G7 C48 T26 ---> A32 G7 C48 T26 0
2913: 464..603: A44 G10 C63 T23 ---> A44 G10 C63 T23 0
Total differences: 0
Sequence
converted
to base
composition
Measured
base
composition
Applied
Genetics Concordance Rate
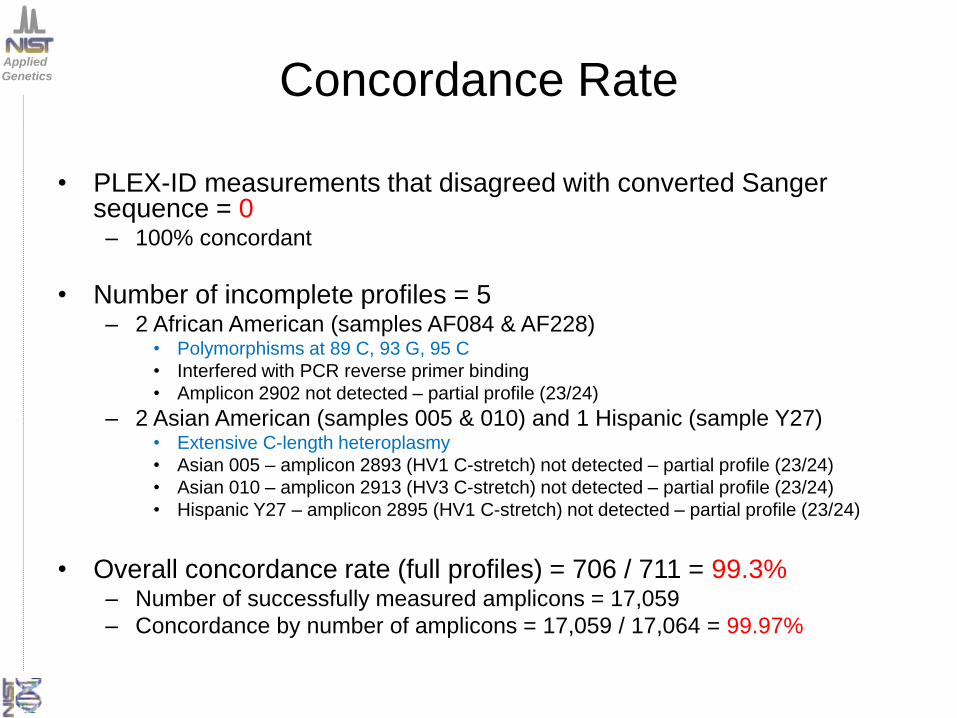
• PLEX-ID measurements that disagreed with converted Sanger sequence = 0 – 100% concordant
• Number of incomplete profiles = 5 – 2 African American (samples AF084 & AF228)
• Polymorphisms at 89 C, 93 G, 95 C
• Interfered with PCR reverse primer binding
• Amplicon 2902 not detected – partial profile (23/24)
– 2 Asian American (samples 005 & 010) and 1 Hispanic (sample Y27) • Extensive C-length heteroplasmy
• Asian 005 – amplicon 2893 (HV1 C-stretch) not detected – partial profile (23/24)
• Asian 010 – amplicon 2913 (HV3 C-stretch) not detected – partial profile (23/24)
• Hispanic Y27 – amplicon 2895 (HV1 C-stretch) not detected – partial profile (23/24)
• Overall concordance rate (full profiles) = 706 / 711 = 99.3% – Number of successfully measured amplicons = 17,059
– Concordance by number of amplicons = 17,059 / 17,064 = 99.97%

Applied
Genetics Discrimination Capacity
• How does the PLEX-ID base composition method compare with sequencing in differentiating mtDNA types?
• 706 samples with complete profiles in PLEX-ID database – Search database “against self” for identical profiles
– Assistance from Tom Hall at Abbott in creating algorithm
• Same 706 samples’ control region sequences – Create multiple sequence alignment
– Identify groups with common sequences • Limited to just HV1 & HV2
• Full control region
• Results form “common haplotype groups” of identical mito types
• Discrimination capacity (DC) = number of haplotypes observed / population size

Applied
Genetics
Mass spec .
Plex-ID HV1 & 2 16024 - 576
1 522 499 549
2 36 32 31
3 12 14 12
4 4 4 4
5 5 6 4
6 1 4 2
7 1 1 -
8 - 1 -
9 1 - -
10 - - -
11 - - 1
12 - - -
13 1 - -
14 - - -
15 - - -
16 - 1 -
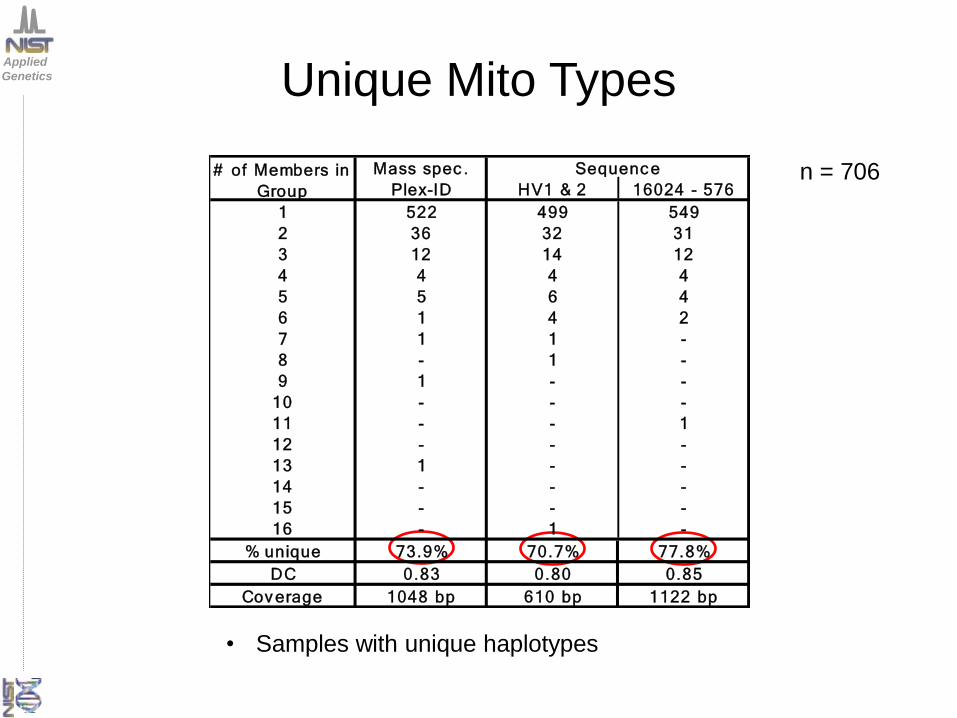
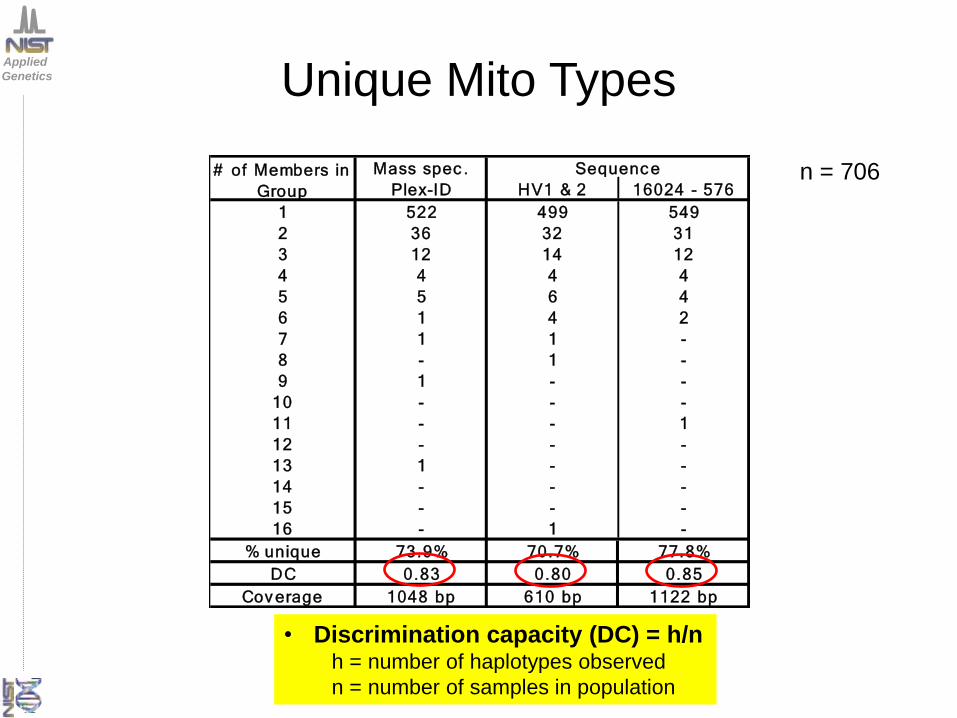
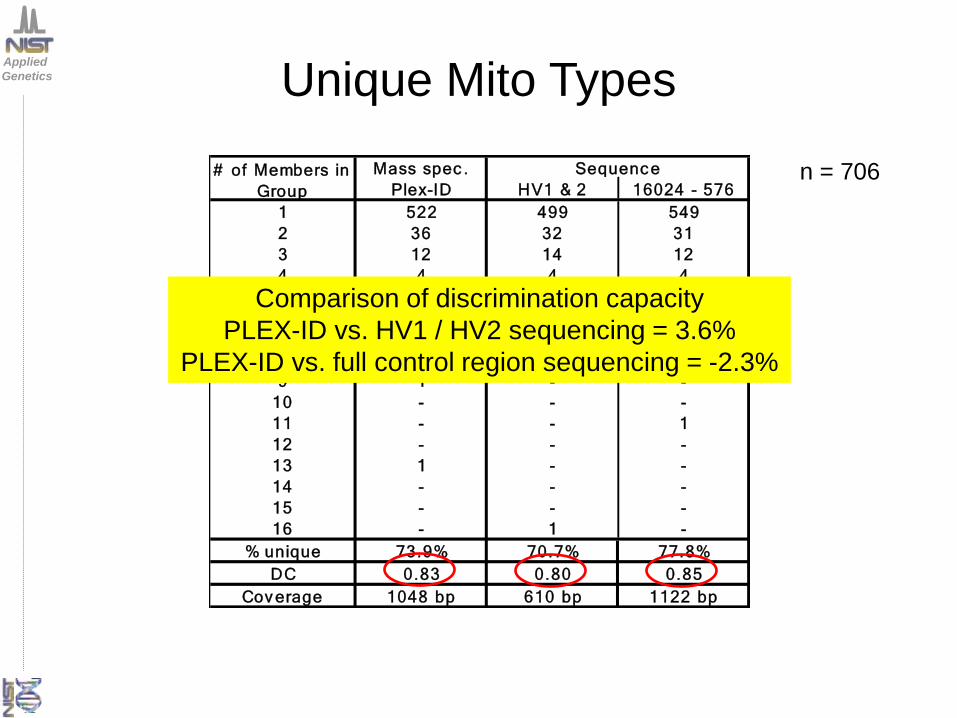
% unique 73.9% 70.7% 77.8%
DC 0.83 0.80 0.85
Cov erage 1048 bp 610 bp 1122 bp
# of Members in
Group
Sequenc e
Unique Mito Types
n = 706

Applied
Genetics Unique Mito Types
n = 706 Mass spec .
Plex-ID HV1 & 2 16024 - 576
1 522 499 549
2 36 32 31
3 12 14 12
4 4 4 4
5 5 6 4
6 1 4 2
7 1 1 -
8 - 1 -
9 1 - -
10 - - -
11 - - 1
12 - - -
13 1 - -
14 - - -
15 - - -
16 - 1 -
% unique 73.9% 70.7% 77.8%
DC 0.83 0.80 0.85
Cov erage 1048 bp 610 bp 1122 bp
# of Members in
Group
Sequenc e

Applied
Genetics Unique Mito Types
n = 706
CN_Y6
CN101
CN242
CN246
CN248
CN258
CN259
CN263
CN266
CN275
CN281
CN282
CN284
CN_Y6
CN242
CN246
CN258
CN259
CN263
CN266
CN275
CN281
CN282
CN284
• Groups of samples with common haplotypes
Mass spec .
Plex-ID HV1 & 2 16024 - 576
1 522 499 549
2 36 32 31
3 12 14 12
4 4 4 4
5 5 6 4
6 1 4 2
7 1 1 -
8 - 1 -
9 1 - -
10 - - -
11 - - 1
12 - - -
13 1 - -
14 - - -
15 - - -
16 - 1 -
% unique 73.9% 70.7% 77.8%
DC 0.83 0.80 0.85
Cov erage 1048 bp 610 bp 1122 bp
# of Members in
Group
Sequenc e

Applied
Genetics Unique Mito Types
n = 706
• Samples with unique haplotypes
Mass spec .
Plex-ID HV1 & 2 16024 - 576
1 522 499 549
2 36 32 31
3 12 14 12
4 4 4 4
5 5 6 4
6 1 4 2
7 1 1 -
8 - 1 -
9 1 - -
10 - - -
11 - - 1
12 - - -
13 1 - -
14 - - -
15 - - -
16 - 1 -
% unique 73.9% 70.7% 77.8%
DC 0.83 0.80 0.85
Cov erage 1048 bp 610 bp 1122 bp
# of Members in
Group
Sequenc e

Applied
Genetics
Mass spec .
Plex-ID HV1 & 2 16024 - 576
1 522 499 549
2 36 32 31
3 12 14 12
4 4 4 4
5 5 6 4
6 1 4 2
7 1 1 -
8 - 1 -
9 1 - -
10 - - -
11 - - 1
12 - - -
13 1 - -
14 - - -
15 - - -
16 - 1 -
% unique 73.9% 70.7% 77.8%
DC 0.83 0.80 0.85
Cov erage 1048 bp 610 bp 1122 bp
# of Members in
Group
Sequenc e
Unique Mito Types
n = 706
• Samples with unique haplotypes
Comparison of unique mito haplotypes
PLEX-ID vs. HV1 / HV2 sequencing = 4.5%
PLEX-ID vs. full control region sequencing = -5.0%
Applied
Genetics
Mass spec .
Plex-ID HV1 & 2 16024 - 576
1 522 499 549
2 36 32 31
3 12 14 12
4 4 4 4
5 5 6 4
6 1 4 2
7 1 1 -
8 - 1 -
9 1 - -
10 - - -
11 - - 1
12 - - -
13 1 - -
14 - - -
15 - - -
16 - 1 -
% unique 73.9% 70.7% 77.8%
DC 0.83 0.80 0.85
Cov erage 1048 bp 610 bp 1122 bp
# of Members in
Group
Sequenc e
Unique Mito Types
n = 706
• Discrimination capacity (DC) = h/n h = number of haplotypes observed
n = number of samples in population
Applied
Genetics
Mass spec .
Plex-ID HV1 & 2 16024 - 576
1 522 499 549
2 36 32 31
3 12 14 12
4 4 4 4
5 5 6 4
6 1 4 2
7 1 1 -
8 - 1 -
9 1 - -
10 - - -
11 - - 1
12 - - -
13 1 - -
14 - - -
15 - - -
16 - 1 -
% unique 73.9% 70.7% 77.8%
DC 0.83 0.80 0.85
Cov erage 1048 bp 610 bp 1122 bp
# of Members in
Group
Sequenc e
Unique Mito Types
n = 706
Comparison of discrimination capacity
PLEX-ID vs. HV1 / HV2 sequencing = 3.6%
PLEX-ID vs. full control region sequencing = -2.3%

Applied
Genetics Performance in Populations
• Haplotype groups separated by population
– Is there population bias?
PLEX HV1/ 2 Full C.R. PLEX HV1/ 2 Full C.R. PLEX HV1/ 2 Full C.R. PLEX HV1/ 2 Full C.R.
1 47 47 47 192 187 198 182 170 196 101 95 108
2 - - - 13 12 16 9 11 7 14 9 8
3 - - - 6 6 8 4 5 2 2 3 2
4 - - - 2 1 - 2 2 4 - 1 -
5 - - - 1 1 1 4 4 3 - 1 -
6 - - - - 2 - - 1 1 1 1 1
7 - - - - - - 1 1 - - - -
8 - - - - 1 - - - - - - -
9 - - - 1 - - - - - - - -
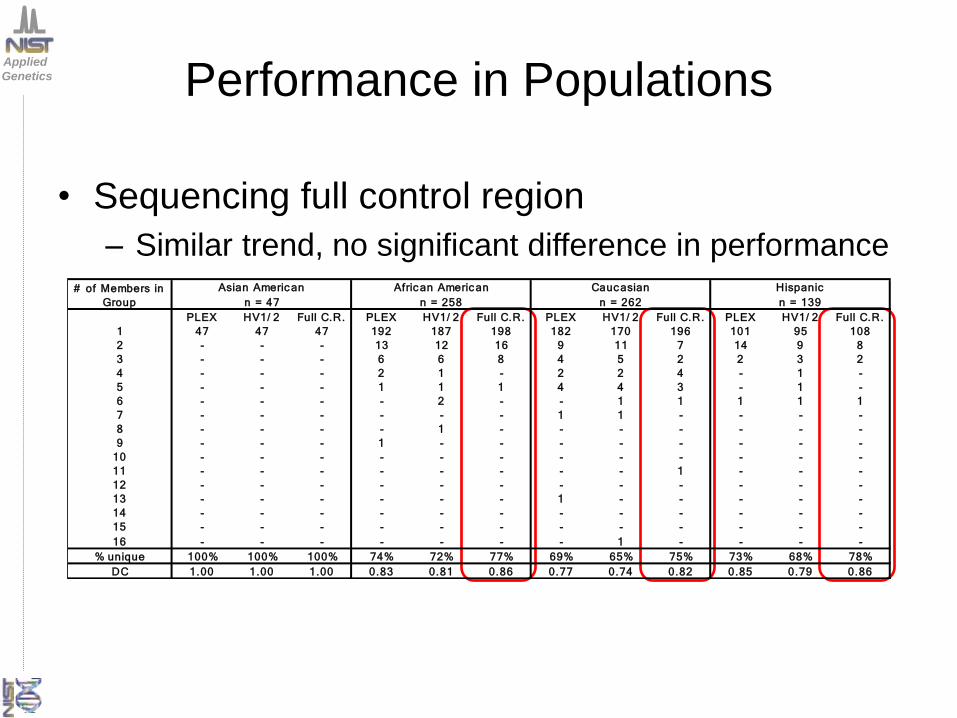
10 - - - - - - - - - - - -
11 - - - - - - - - 1 - - -
12 - - - - - - - - - - - -
13 - - - - - - 1 - - - - -
14 - - - - - - - - - - - -
15 - - - - - - - - - - - -
16 - - - - - - - 1 - - - -
% unique 100% 100% 100% 74% 72% 77% 69% 65% 75% 73% 68% 78%
DC 1.00 1.00 1.00 0.83 0.81 0.86 0.77 0.74 0.82 0.85 0.79 0.86
# of Members in
Group
Asian American Afric an Americ an Cauc asian Hispanic
n = 47 n = 258 n = 262 n = 139
Applied
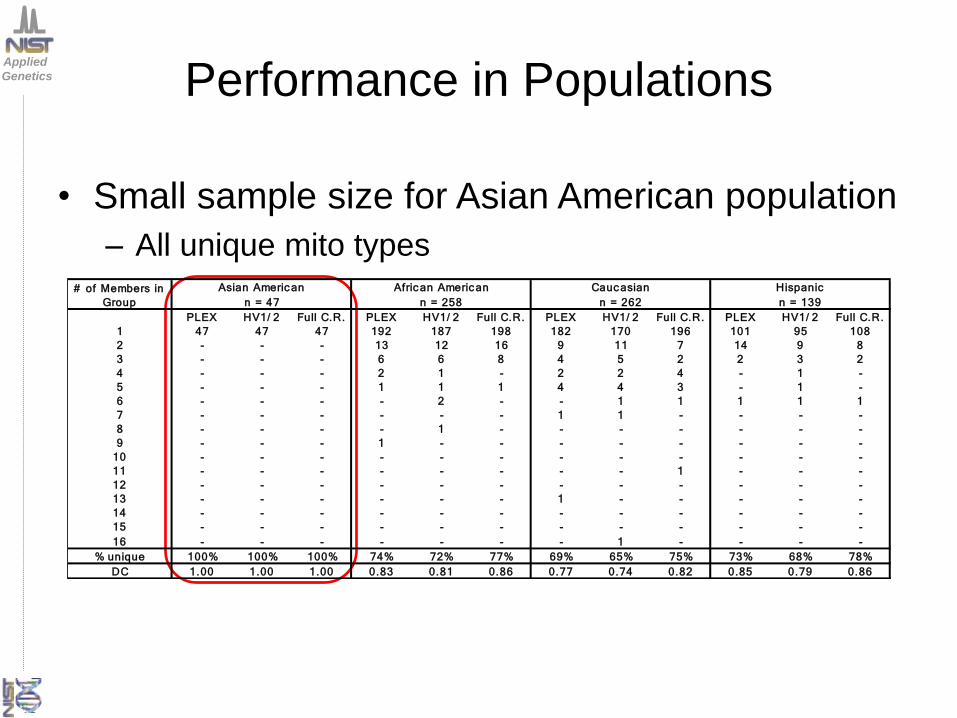
Genetics Performance in Populations
• Small sample size for Asian American population
– All unique mito types
PLEX HV1/ 2 Full C.R. PLEX HV1/ 2 Full C.R. PLEX HV1/ 2 Full C.R. PLEX HV1/ 2 Full C.R.
1 47 47 47 192 187 198 182 170 196 101 95 108
2 - - - 13 12 16 9 11 7 14 9 8
3 - - - 6 6 8 4 5 2 2 3 2
4 - - - 2 1 - 2 2 4 - 1 -
5 - - - 1 1 1 4 4 3 - 1 -
6 - - - - 2 - - 1 1 1 1 1
7 - - - - - - 1 1 - - - -
8 - - - - 1 - - - - - - -
9 - - - 1 - - - - - - - -
10 - - - - - - - - - - - -
11 - - - - - - - - 1 - - -
12 - - - - - - - - - - - -
13 - - - - - - 1 - - - - -
14 - - - - - - - - - - - -
15 - - - - - - - - - - - -
16 - - - - - - - 1 - - - -
% unique 100% 100% 100% 74% 72% 77% 69% 65% 75% 73% 68% 78%
DC 1.00 1.00 1.00 0.83 0.81 0.86 0.77 0.74 0.82 0.85 0.79 0.86
# of Members in
Group
Asian American Afric an Americ an Cauc asian Hispanic
n = 47 n = 258 n = 262 n = 139
Applied
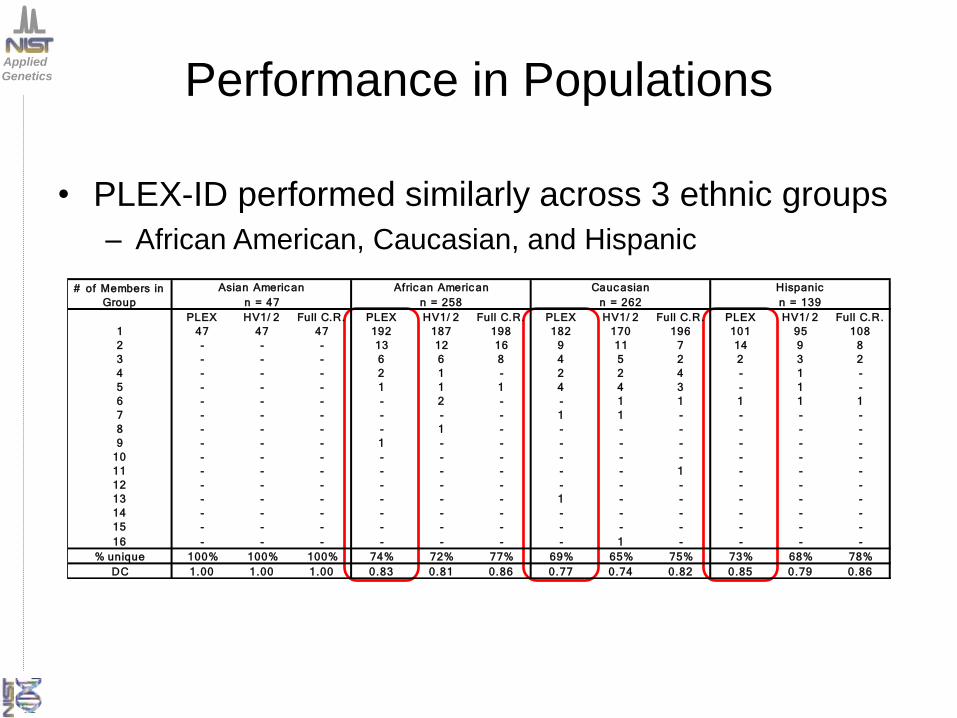
Genetics Performance in Populations
• PLEX-ID performed similarly across 3 ethnic groups
– African American, Caucasian, and Hispanic
PLEX HV1/ 2 Full C.R. PLEX HV1/ 2 Full C.R. PLEX HV1/ 2 Full C.R. PLEX HV1/ 2 Full C.R.
1 47 47 47 192 187 198 182 170 196 101 95 108
2 - - - 13 12 16 9 11 7 14 9 8
3 - - - 6 6 8 4 5 2 2 3 2
4 - - - 2 1 - 2 2 4 - 1 -
5 - - - 1 1 1 4 4 3 - 1 -
6 - - - - 2 - - 1 1 1 1 1
7 - - - - - - 1 1 - - - -
8 - - - - 1 - - - - - - -
9 - - - 1 - - - - - - - -
10 - - - - - - - - - - - -
11 - - - - - - - - 1 - - -
12 - - - - - - - - - - - -
13 - - - - - - 1 - - - - -
14 - - - - - - - - - - - -
15 - - - - - - - - - - - -
16 - - - - - - - 1 - - - -
% unique 100% 100% 100% 74% 72% 77% 69% 65% 75% 73% 68% 78%
DC 1.00 1.00 1.00 0.83 0.81 0.86 0.77 0.74 0.82 0.85 0.79 0.86
# of Members in
Group
Asian American Afric an Americ an Cauc asian Hispanic
n = 47 n = 258 n = 262 n = 139
Applied
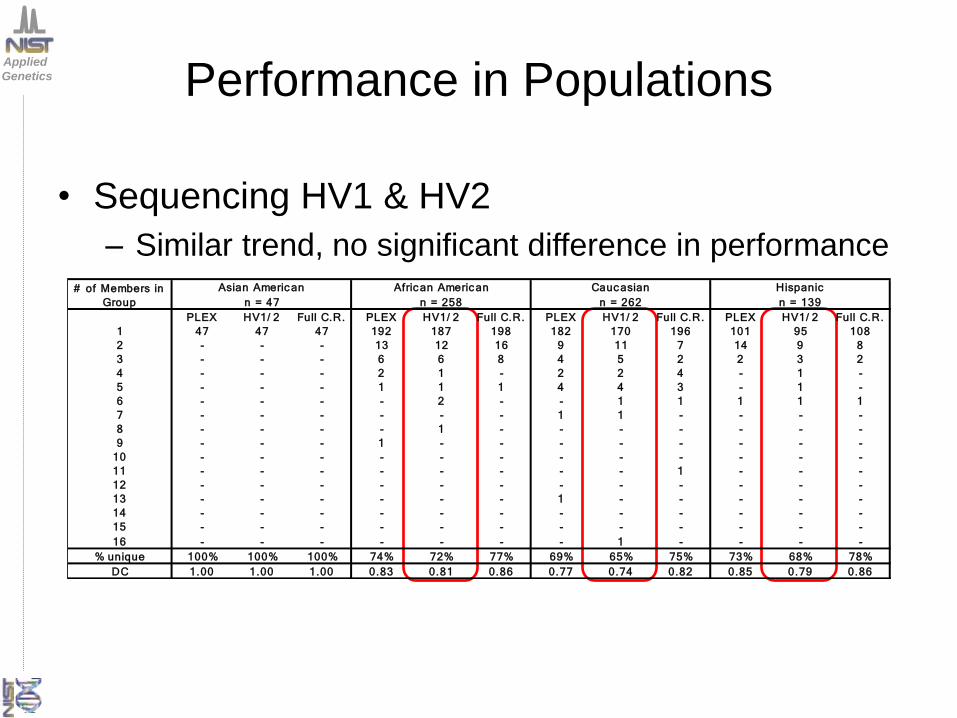
Genetics Performance in Populations
• Sequencing HV1 & HV2
– Similar trend, no significant difference in performance
PLEX HV1/ 2 Full C.R. PLEX HV1/ 2 Full C.R. PLEX HV1/ 2 Full C.R. PLEX HV1/ 2 Full C.R.
1 47 47 47 192 187 198 182 170 196 101 95 108
2 - - - 13 12 16 9 11 7 14 9 8
3 - - - 6 6 8 4 5 2 2 3 2
4 - - - 2 1 - 2 2 4 - 1 -
5 - - - 1 1 1 4 4 3 - 1 -
6 - - - - 2 - - 1 1 1 1 1
7 - - - - - - 1 1 - - - -
8 - - - - 1 - - - - - - -
9 - - - 1 - - - - - - - -
10 - - - - - - - - - - - -
11 - - - - - - - - 1 - - -
12 - - - - - - - - - - - -
13 - - - - - - 1 - - - - -
14 - - - - - - - - - - - -
15 - - - - - - - - - - - -
16 - - - - - - - 1 - - - -
% unique 100% 100% 100% 74% 72% 77% 69% 65% 75% 73% 68% 78%
DC 1.00 1.00 1.00 0.83 0.81 0.86 0.77 0.74 0.82 0.85 0.79 0.86
# of Members in
Group
Asian American Afric an Americ an Cauc asian Hispanic
n = 47 n = 258 n = 262 n = 139
Applied
Genetics Performance in Populations
• Sequencing full control region
– Similar trend, no significant difference in performance
PLEX HV1/ 2 Full C.R. PLEX HV1/ 2 Full C.R. PLEX HV1/ 2 Full C.R. PLEX HV1/ 2 Full C.R.
1 47 47 47 192 187 198 182 170 196 101 95 108
2 - - - 13 12 16 9 11 7 14 9 8
3 - - - 6 6 8 4 5 2 2 3 2
4 - - - 2 1 - 2 2 4 - 1 -
5 - - - 1 1 1 4 4 3 - 1 -
6 - - - - 2 - - 1 1 1 1 1
7 - - - - - - 1 1 - - - -
8 - - - - 1 - - - - - - -
9 - - - 1 - - - - - - - -
10 - - - - - - - - - - - -
11 - - - - - - - - 1 - - -
12 - - - - - - - - - - - -
13 - - - - - - 1 - - - - -
14 - - - - - - - - - - - -
15 - - - - - - - - - - - -
16 - - - - - - - 1 - - - -
% unique 100% 100% 100% 74% 72% 77% 69% 65% 75% 73% 68% 78%
DC 1.00 1.00 1.00 0.83 0.81 0.86 0.77 0.74 0.82 0.85 0.79 0.86
# of Members in
Group
Asian American Afric an Americ an Cauc asian Hispanic
n = 47 n = 258 n = 262 n = 139
Applied
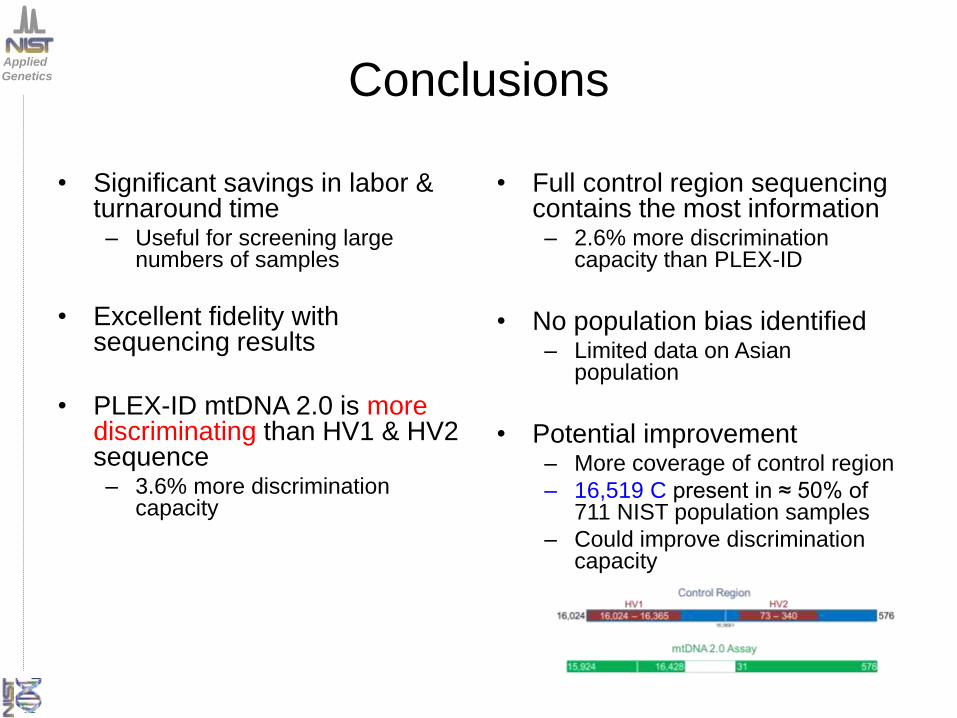
Genetics Conclusions
• Significant savings in labor & turnaround time – Useful for screening large
numbers of samples
• Excellent fidelity with sequencing results
• PLEX-ID mtDNA 2.0 is more discriminating than HV1 & HV2 sequence – 3.6% more discrimination
capacity
• Full control region sequencing contains the most information – 2.6% more discrimination
capacity than PLEX-ID
• No population bias identified – Limited data on Asian
population
• Potential improvement – More coverage of control region
– 16,519 C present in ≈ 50% of 711 NIST population samples
– Could improve discrimination capacity
Applied
Genetics Acknowledgments
Contact Info:
301-975-4306
Funding from the FBI
Biometrics Center of
Excellence ‘Forensic
DNA Typing as a
Biometric Tool’
Thank you!
Pete Vallone, John Butler
The Applied Genetics Group - NIST
Eric Pokorak and Thomas Callaghan - FBI
Tom Hall - Abbott Molecular
NIST Disclaimer: Certain commercial equipment, instruments and materials are identified in order to specify experimental procedures as
completely as possible. In no case does such identification imply a recommendation or it imply that any of the materials, instruments or
equipment identified are necessarily the best available for the purpose.
Points of view are those of the presenters and do not necessarily represent the official position of the National Institute of Standards and
Technology or the U.S. Department of Justice.
Applied
Genetics Questions?
My contact info:
email: Kevin.Kiesler@NIST
Phone: (301) 975-4306
Related Documents