Alternative investments— Insight for individual investors ■ ■ Christine M. Johnson, CFA, director of Alternative Strategy and Platform Development, DWS Investments ■ ■ Inna Okounkova, head of strategic asset allocation, QS Investors. (see page 11 for bios) CONTRIBUTORS This is a challenging time for investors, as they face the prospect of stock and bond returns lower than those of the previous 25 years. Moreover, conventional diversification and long-term growth strategies need to evolve to keep pace with the vast number of Americans who are about to retire. ALTERNATIVE FUNDS Investment products: No bank guarantee I Not FDIC insured I May lose value 10-YEAR US TREASURY YIELD (1982–2010) Source: www.treasury.gov. as of 12/31/10 These factors, though challenging, also make it an exciting time for investors as they search for new asset classes that can potentially add value to their overall asset allocation. Many institutional investors and high-net-worth individual investors have discovered alternative investments. Are individual investors next? In this paper, we will review the changing investment environment, define alternative investments, assess their potential and examine the role they can play in a portfolio positioned for new diversification and long-term growth opportunities. With this insight, you can appreciate alternative investments’ potential to help investors pursue their long-term goals. (Keep in mind that diversification and asset allocation neither assure a profit nor guarantee against loss.) THE CHANGING INVESTMENT ENVIRONMENT Heightened volatility in the equity markets and record-low bond yields have made investment success more challenging for many investors. Added to that is the fact that individual investors are shouldering greater personal responsibility for their own retirement income. The consequences of poor investment decisions could, potentially, be more severe. OUTLINE 1. The changing investment environment (page 1) 2. Alternative investments in perspective (page 3) 3. Characteristics of alternatives (page 5) 4. Insight from institutional investors (page 8) 5. Individual investors and alternative investments (page 8) 6. The role of alternatives in an investment portfolio (page 9) 7. Conclusion (page 10) The straightforward investment strategy of emphasizing US stocks and bonds that worked for previous generations of investors may not be enough going forward. It remains unclear what direction US stock and bond returns will go in the future. Is it possible that the 29-year cycle of falling interest rates that fueled US stock and bond returns from 1982 to 2010 is over? 0% 3% 6% 9% 12% 15% 2010 2006 2002 1998 1994 1990 1986 1982 How low can long-term rates go?

Welcome message from author
This document is posted to help you gain knowledge. Please leave a comment to let me know what you think about it! Share it to your friends and learn new things together.
Transcript
Alternative investments—Insight for individual investors
■■ Christine M. Johnson, CFA, director of Alternative
Strategy and Platform Development, DWS Investments
■■ Inna Okounkova, head of strategic asset allocation,
QS Investors.
(see page 11 for bios)
CONTRIBUTORS
This is a challenging time for investors, as they face the prospect of stock and bond returns lower
than those of the previous 25 years. Moreover, conventional diversification and long-term growth
strategies need to evolve to keep pace with the vast number of Americans who are about to retire.
ALTERNATIVE FUNDS
Investment products: No bank guarantee I Not FDIC insured I May lose value
10-YEAR US TREASURY YIELD (1982–2010)
Source: www.treasury.gov. as of 12/31/10
These factors, though challenging, also make it an exciting
time for investors as they search for new asset classes that can
potentially add value to their overall asset allocation. Many
institutional investors and high-net-worth individual investors have
discovered alternative investments. Are individual investors next?
In this paper, we will review the changing investment
environment, define alternative investments, assess their potential
and examine the role they can play in a portfolio positioned
for new diversification and long-term growth opportunities.
With this insight, you can appreciate alternative investments’
potential to help investors pursue their long-term goals. (Keep
in mind that diversification and asset allocation neither assure
a profit nor guarantee against loss.)
THE CHANGING INVESTMENT ENVIRONMENT
Heightened volatility in the equity markets and record-low
bond yields have made investment success more challenging
for many investors. Added to that is the fact that individual
investors are shouldering greater personal responsibility for their
own retirement income. The consequences of poor investment
decisions could, potentially, be more severe.
OUTLINE
1. The changing investment environment (page 1)
2. Alternative investments in perspective (page 3)
3. Characteristics of alternatives (page 5)
4. Insight from institutional investors (page 8)
5. Individual investors and alternative investments (page 8)
6. The role of alternatives in an investment portfolio (page 9)
7. Conclusion (page 10)
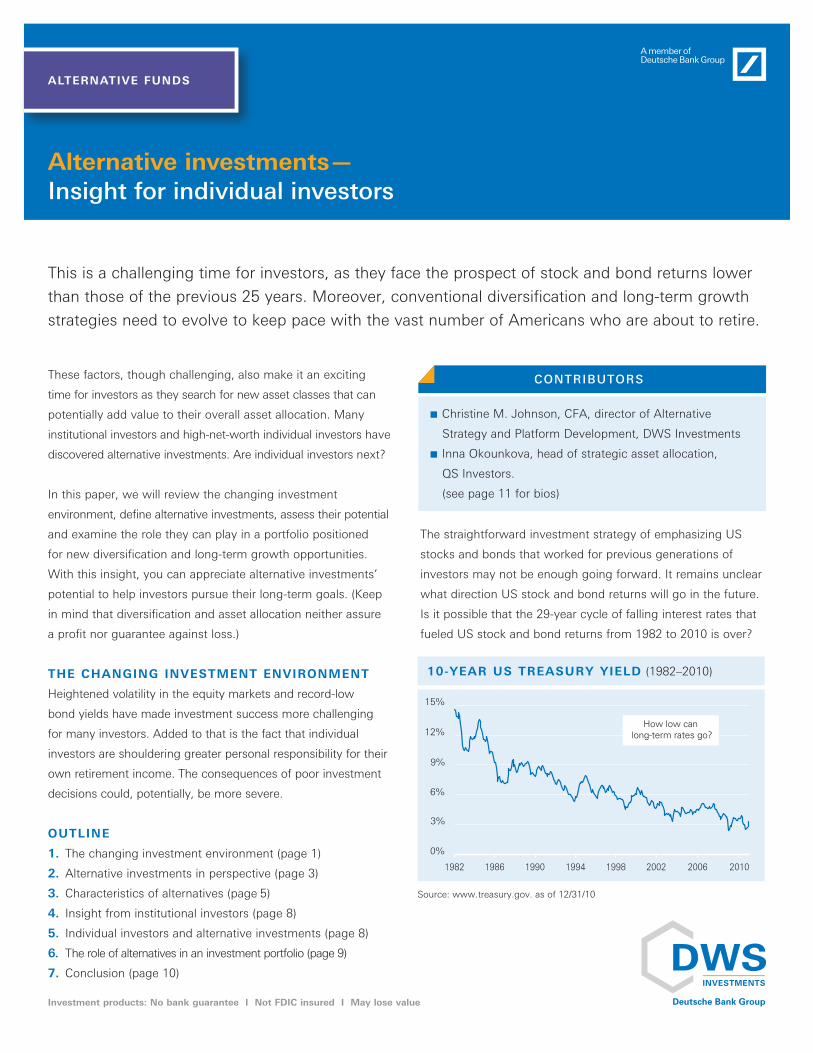
The straightforward investment strategy of emphasizing US
stocks and bonds that worked for previous generations of
investors may not be enough going forward. It remains unclear
what direction US stock and bond returns will go in the future.
Is it possible that the 29-year cycle of falling interest rates that
fueled US stock and bond returns from 1982 to 2010 is over?
0%
3%
6%
9%
12%
15%
20102006200219981994199019861982
How low can long-term rates go?
2 » Alternative investments
CORRELATION OF S&P 500 INDEX (2006-2010)
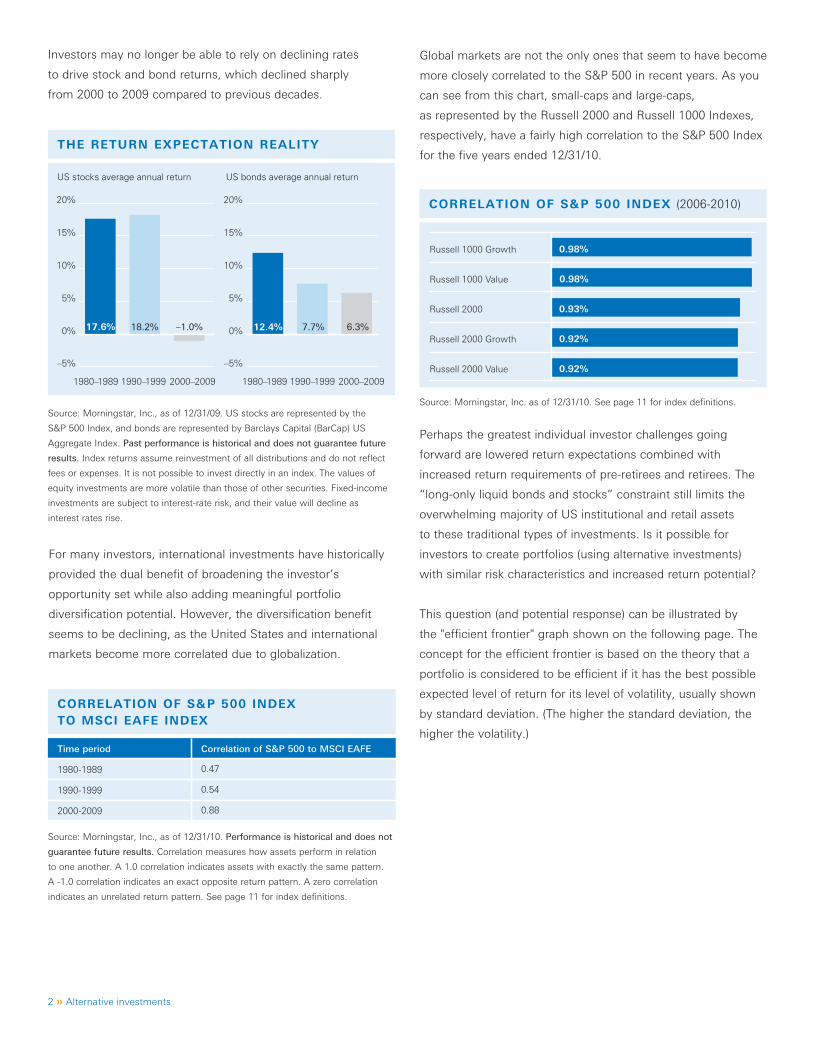
Investors may no longer be able to rely on declining rates
to drive stock and bond returns, which declined sharply
from 2000 to 2009 compared to previous decades.
Global markets are not the only ones that seem to have become
more closely correlated to the S&P 500 in recent years. As you
can see from this chart, small-caps and large-caps,
as represented by the Russell 2000 and Russell 1000 Indexes,
respectively, have a fairly high correlation to the S&P 500 Index
for the five years ended 12/31/10.
For many investors, international investments have historically
provided the dual benefit of broadening the investor’s
opportunity set while also adding meaningful portfolio
diversification potential. However, the diversification benefit
seems to be declining, as the United States and international
markets become more correlated due to globalization.
THE RETURN EXPECTATION REALITY
US stocks average annual return US bonds average annual return
Source: Morningstar, Inc., as of 12/31/09. US stocks are represented by the
S&P 500 Index, and bonds are represented by Barclays Capital (BarCap) US
Aggregate Index. Past performance is historical and does not guarantee future
results. Index returns assume reinvestment of all distributions and do not reflect
fees or expenses. It is not possible to invest directly in an index. The values of
equity investments are more volatile than those of other securities. Fixed-income
investments are subject to interest-rate risk, and their value will decline as
interest rates rise.
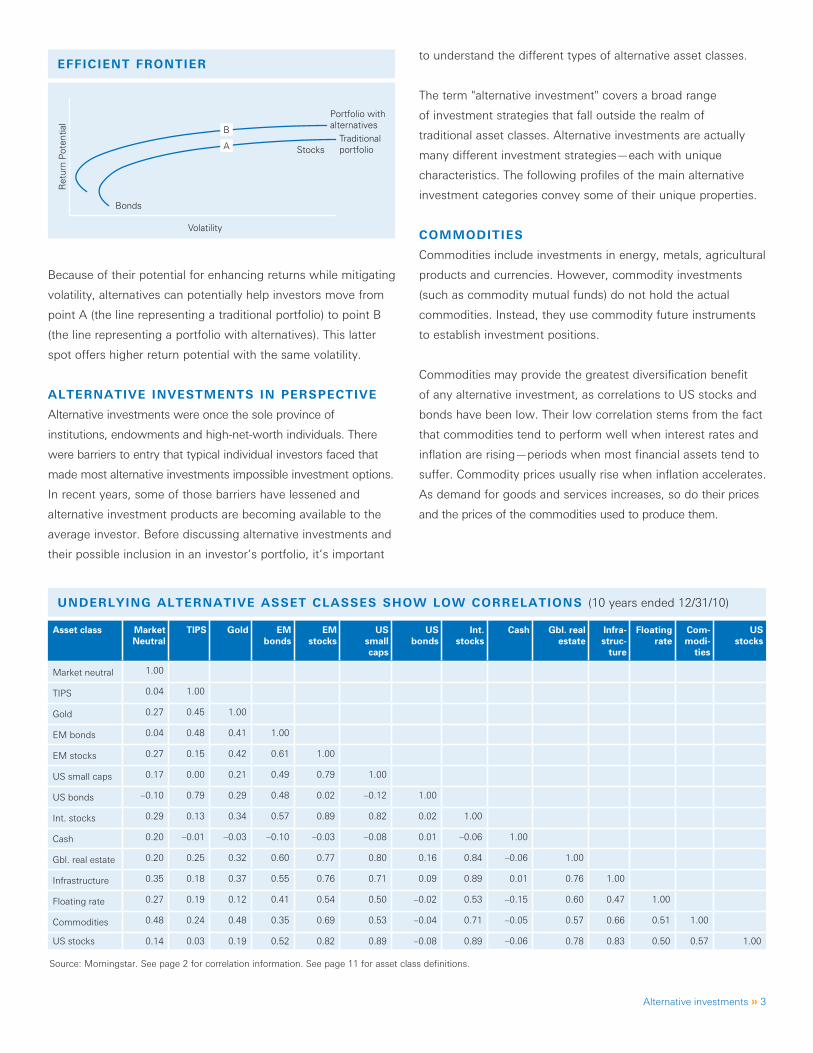
Source: Morningstar, Inc., as of 12/31/10. Performance is historical and does not
guarantee future results. Correlation measures how assets perform in relation
to one another. A 1.0 correlation indicates assets with exactly the same pattern.
A -1.0 correlation indicates an exact opposite return pattern. A zero correlation
indicates an unrelated return pattern. See page 11 for index definitions.
CORRELATION OF S&P 500 INDEX TO MSCI EAFE INDEX
Time period Correlation of S&P 500 to MSCI EAFE
1980-1989 0.47
1990-1999 0.54
2000-2009 0.88
Source: Morningstar, Inc. as of 12/31/10. See page 11 for index definitions.
Perhaps the greatest individual investor challenges going
forward are lowered return expectations combined with
increased return requirements of pre-retirees and retirees. The
“long-only liquid bonds and stocks” constraint still limits the
overwhelming majority of US institutional and retail assets
to these traditional types of investments. Is it possible for
investors to create portfolios (using alternative investments)
with similar risk characteristics and increased return potential?
This question (and potential response) can be illustrated by
the "efficient frontier" graph shown on the following page. The
concept for the efficient frontier is based on the theory that a
portfolio is considered to be efficient if it has the best possible
expected level of return for its level of volatility, usually shown
by standard deviation. (The higher the standard deviation, the
higher the volatility.)
–5%
0%
5%
10%
15%
20%
–5%
0%
5%
10%
15%
20%
1980–1989 1990–1999 2000–2009 1980–1989 1990–1999 2000–2009
17.6% 12.4% 7.7% 6.3%18.2% –1.0%
Russell 1000 Growth
Russell 1000 Value
Russell 2000
Russell 2000 Growth
Russell 2000 Value
0.98%
0.98%
0.93%
0.92%
0.92%
Alternative investments » 3
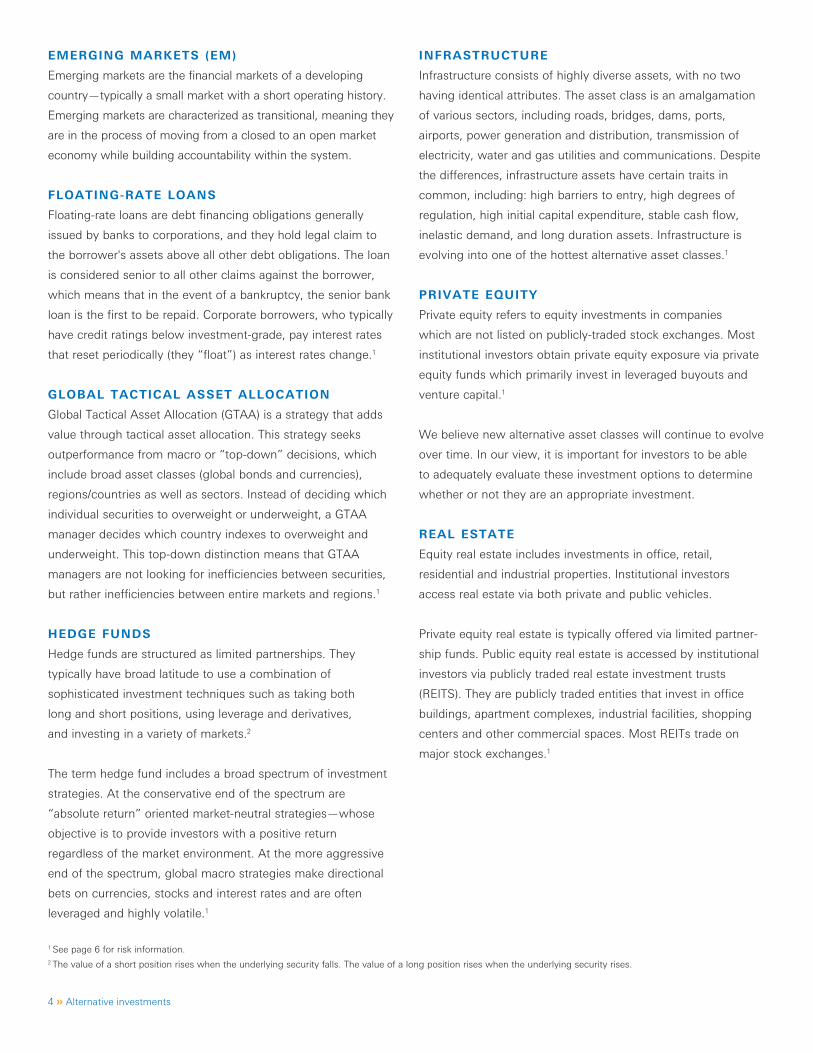
EFFICIENT FRONTIER
UNDERLYING ALTERNATIVE ASSET CLASSES SHOW LOW CORRELATIONS (10 years ended 12/31/10)
Asset class Market Neutral
TIPS Gold EMbonds
EMstocks
US small
caps
US bonds
Int.stocks
Cash Gbl. real estate
Infra-struc-
ture
Floating rate
Com-modi-
ties
US stocks
Market neutral 1.00
TIPS 0.04 1.00
Gold 0.27 0.45 1.00
EM bonds 0.04 0.48 0.41 1.00
EM stocks 0.27 0.15 0.42 0.61 1.00
US small caps 0.17 0.00 0.21 0.49 0.79 1.00
US bonds –0.10 0.79 0.29 0.48 0.02 –0.12 1.00
Int. stocks 0.29 0.13 0.34 0.57 0.89 0.82 0.02 1.00
Cash 0.20 –0.01 –0.03 –0.10 –0.03 –0.08 0.01 –0.06 1.00
Gbl. real estate 0.20 0.25 0.32 0.60 0.77 0.80 0.16 0.84 –0.06 1.00
Infrastructure 0.35 0.18 0.37 0.55 0.76 0.71 0.09 0.89 0.01 0.76 1.00
Floating rate 0.27 0.19 0.12 0.41 0.54 0.50 –0.02 0.53 –0.15 0.60 0.47 1.00
Commodities 0.48 0.24 0.48 0.35 0.69 0.53 –0.04 0.71 –0.05 0.57 0.66 0.51 1.00
US stocks 0.14 0.03 0.19 0.52 0.82 0.89 –0.08 0.89 –0.06 0.78 0.83 0.50 0.57 1.00
Source: Morningstar. See page 2 for correlation information. See page 11 for asset class definitions.
Because of their potential for enhancing returns while mitigating
volatility, alternatives can potentially help investors move from
point A (the line representing a traditional portfolio) to point B
(the line representing a portfolio with alternatives). This latter
spot offers higher return potential with the same volatility.
ALTERNATIVE INVESTMENTS IN PERSPECTIVE
Alternative investments were once the sole province of
institutions, endowments and high-net-worth individuals. There
were barriers to entry that typical individual investors faced that
made most alternative investments impossible investment options.
In recent years, some of those barriers have lessened and
alternative investment products are becoming available to the
average investor. Before discussing alternative investments and
their possible inclusion in an investor’s portfolio, it’s important
to understand the different types of alternative asset classes.
The term "alternative investment" covers a broad range
of investment strategies that fall outside the realm of
traditional asset classes. Alternative investments are actually
many different investment strategies—each with unique
characteristics. The following profiles of the main alternative
investment categories convey some of their unique properties.
COMMODITIES
Commodities include investments in energy, metals, agricultural
products and currencies. However, commodity investments
(such as commodity mutual funds) do not hold the actual
commodities. Instead, they use commodity future instruments
to establish investment positions.
Commodities may provide the greatest diversification benefit
of any alternative investment, as correlations to US stocks and
bonds have been low. Their low correlation stems from the fact
that commodities tend to perform well when interest rates and
inflation are rising—periods when most financial assets tend to
suffer. Commodity prices usually rise when inflation accelerates.
As demand for goods and services increases, so do their prices
and the prices of the commodities used to produce them.
Russell 1000 Growth
Russell 1000 Value
Russell 2000
Russell 2000 Growth
Russell 2000 Value
0.98%
0.98%
0.93%
0.92%
0.92%
Ret
urn
Pot
entia
l
Volatility
Bonds
Stocks
Portfolio withalternatives
Traditionalportfolio
B
A
4 » Alternative investments
EMERGING MARKETS (EM)
Emerging markets are the financial markets of a developing
country—typically a small market with a short operating history.
Emerging markets are characterized as transitional, meaning they
are in the process of moving from a closed to an open market
economy while building accountability within the system.
FLOATING-RATE LOANS
Floating-rate loans are debt financing obligations generally
issued by banks to corporations, and they hold legal claim to
the borrower's assets above all other debt obligations. The loan
is considered senior to all other claims against the borrower,
which means that in the event of a bankruptcy, the senior bank
loan is the first to be repaid. Corporate borrowers, who typically
have credit ratings below investment-grade, pay interest rates
that reset periodically (they “float”) as interest rates change.1
GLOBAL TACTICAL ASSET ALLOCATION
Global Tactical Asset Allocation (GTAA) is a strategy that adds
value through tactical asset allocation. This strategy seeks
outperformance from macro or “top-down” decisions, which
include broad asset classes (global bonds and currencies),
regions/countries as well as sectors. Instead of deciding which
individual securities to overweight or underweight, a GTAA
manager decides which country indexes to overweight and
underweight. This top-down distinction means that GTAA
managers are not looking for inefficiencies between securities,
but rather inefficiencies between entire markets and regions.1
HEDGE FUNDS
Hedge funds are structured as limited partnerships. They
typically have broad latitude to use a combination of
sophisticated investment techniques such as taking both
long and short positions, using leverage and derivatives,
and investing in a variety of markets.2
The term hedge fund includes a broad spectrum of investment
strategies. At the conservative end of the spectrum are
“absolute return” oriented market-neutral strategies—whose
objective is to provide investors with a positive return
regardless of the market environment. At the more aggressive
end of the spectrum, global macro strategies make directional
bets on currencies, stocks and interest rates and are often
leveraged and highly volatile.1
INFRASTRUCTURE
Infrastructure consists of highly diverse assets, with no two
having identical attributes. The asset class is an amalgamation
of various sectors, including roads, bridges, dams, ports,
airports, power generation and distribution, transmission of
electricity, water and gas utilities and communications. Despite
the differences, infrastructure assets have certain traits in
common, including: high barriers to entry, high degrees of
regulation, high initial capital expenditure, stable cash flow,
inelastic demand, and long duration assets. Infrastructure is
evolving into one of the hottest alternative asset classes.1
PRIVATE EQUITY
Private equity refers to equity investments in companies
which are not listed on publicly-traded stock exchanges. Most
institutional investors obtain private equity exposure via private
equity funds which primarily invest in leveraged buyouts and
venture capital.1
We believe new alternative asset classes will continue to evolve
over time. In our view, it is important for investors to be able
to adequately evaluate these investment options to determine
whether or not they are an appropriate investment.
REAL ESTATE
Equity real estate includes investments in office, retail,
residential and industrial properties. Institutional investors
access real estate via both private and public vehicles.
Private equity real estate is typically offered via limited partner-
ship funds. Public equity real estate is accessed by institutional
investors via publicly traded real estate investment trusts
(REITS). They are publicly traded entities that invest in office
buildings, apartment complexes, industrial facilities, shopping
centers and other commercial spaces. Most REITs trade on
major stock exchanges.1
1 See page 6 for risk information. 2 The value of a short position rises when the underlying security falls. The value of a long position rises when the underlying security rises.
Alternative investments » 5
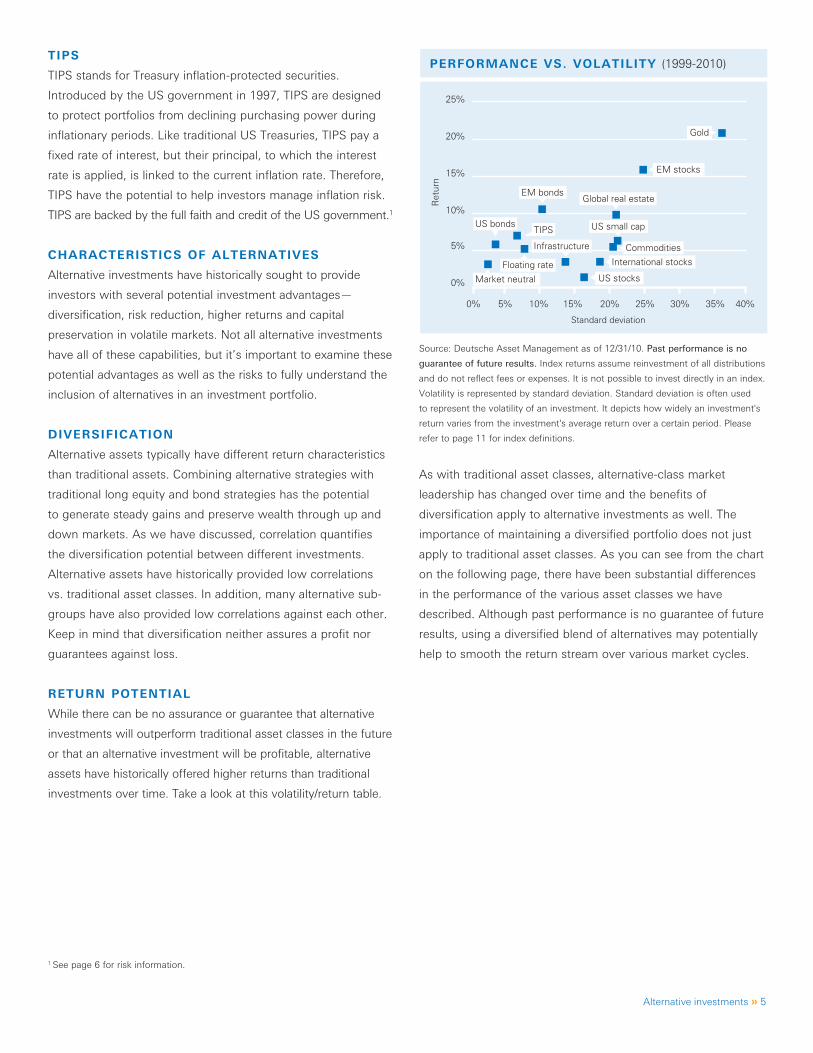
PERFORMANCE VS. VOLATILITY (1999-2010)
Source: Deutsche Asset Management as of 12/31/10. Past performance is no
guarantee of future results. Index returns assume reinvestment of all distributions
and do not reflect fees or expenses. It is not possible to invest directly in an index.
Volatility is represented by standard deviation. Standard deviation is often used
to represent the volatility of an investment. It depicts how widely an investment's
return varies from the investment's average return over a certain period. Please
refer to page 11 for index definitions.
TIPS
TIPS stands for Treasury inflation-protected securities.
Introduced by the US government in 1997, TIPS are designed
to protect portfolios from declining purchasing power during
inflationary periods. Like traditional US Treasuries, TIPS pay a
fixed rate of interest, but their principal, to which the interest
rate is applied, is linked to the current inflation rate. Therefore,
TIPS have the potential to help investors manage inflation risk.
TIPS are backed by the full faith and credit of the US government.1
CHARACTERISTICS OF ALTERNATIVES
Alternative investments have historically sought to provide
investors with several potential investment advantages—
diversification, risk reduction, higher returns and capital
preservation in volatile markets. Not all alternative investments
have all of these capabilities, but it’s important to examine these
potential advantages as well as the risks to fully understand the
inclusion of alternatives in an investment portfolio.
DIVERSIFICATION
Alternative assets typically have different return characteristics
than traditional assets. Combining alternative strategies with
traditional long equity and bond strategies has the potential
to generate steady gains and preserve wealth through up and
down markets. As we have discussed, correlation quantifies
the diversification potential between different investments.
Alternative assets have historically provided low correlations
vs. traditional asset classes. In addition, many alternative sub-
groups have also provided low correlations against each other.
Keep in mind that diversification neither assures a profit nor
guarantees against loss.
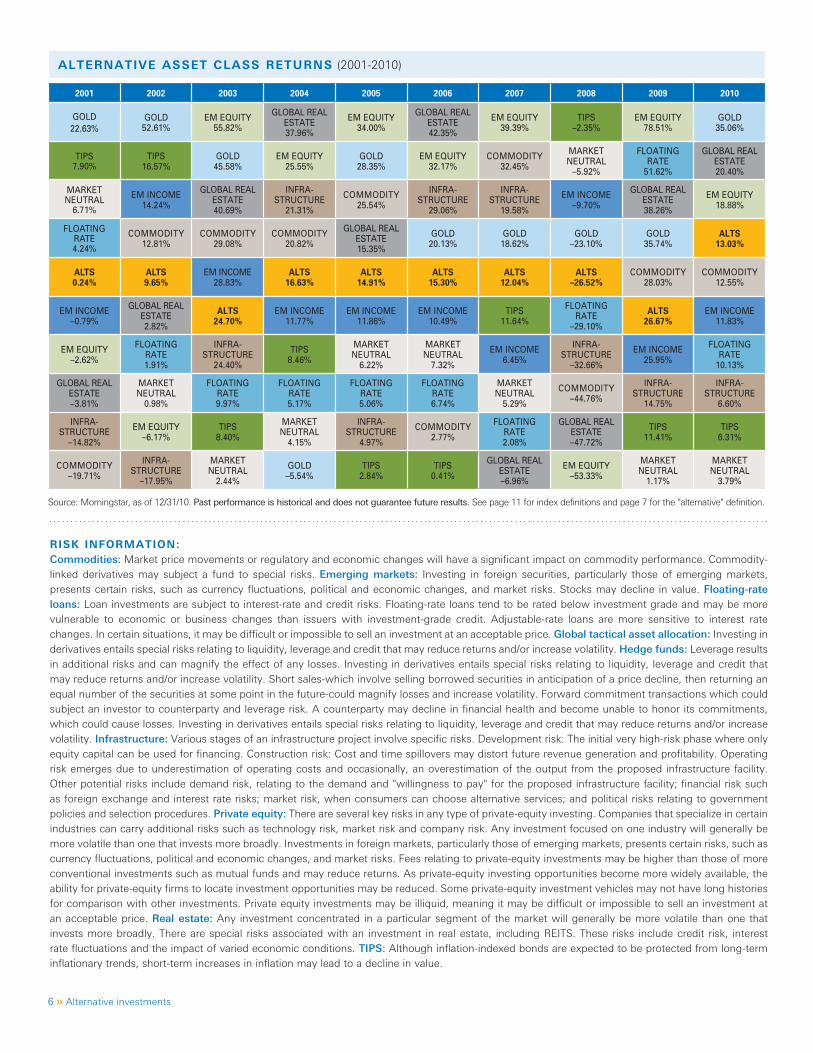
RETURN POTENTIAL
While there can be no assurance or guarantee that alternative
investments will outperform traditional asset classes in the future
or that an alternative investment will be profitable, alternative
assets have historically offered higher returns than traditional
investments over time. Take a look at this volatility/return table.
As with traditional asset classes, alternative-class market
leadership has changed over time and the benefits of
diversification apply to alternative investments as well. The
importance of maintaining a diversified portfolio does not just
apply to traditional asset classes. As you can see from the chart
on the following page, there have been substantial differences
in the performance of the various asset classes we have
described. Although past performance is no guarantee of future
results, using a diversified blend of alternatives may potentially
help to smooth the return stream over various market cycles.
1 See page 6 for risk information.
0% 5% 10% 15% 20% 25% 30% 35% 40%
0%
5%
10%
15%
20%
25%
Global real estate
International stocks
TIPS
EM bonds
US bonds
Infrastructure
Floating rate
US small cap
US stocksMarket neutral
Commodities
Gold
EM stocks
Standard deviation
Ret
urn
6 » Alternative investments
ALTERNATIVE ASSET CLASS RETURNS (2001-2010)
2001 2002 2003 2004 2005 2006 2007 2008 2009 2010
GOLD22.63%
GOLD 52.61%
EM EQUITY55.82%
GLOBAL REAL ESTATE 37.96%
EM EQUITY 34.00%
GLOBAL REAL ESTATE42.35%
EM EQUITY 39.39%
TIPS–2.35%
EM EQUITY 78.51%
GOLD 35.06%
TIPS7.90%
TIPS16.57%
GOLD45.58%
EM EQUITY 25.55%
GOLD28.35%
EM EQUITY32.17%
COMMODITY32.45%
MARKET NEUTRAL
–5.92%
FLOATING RATE
51.62%
GLOBAL REAL ESTATE20.40%
MARKET NEUTRAL
6.71%
EM INCOME14.24%
GLOBAL REAL ESTATE40.69%
INFRA-STRUCTURE
21.31%
COMMODITY25.54%
INFRA-STRUCTURE
29.06%
INFRA-STRUCTURE
19.58%
EM INCOME–9.70%
GLOBAL REAL ESTATE38.26%
EM EQUITY18.88%
FLOATING RATE4.24%
COMMODITY 12.81%
COMMODITY29.08%
COMMODITY20.82%
GLOBAL REAL ESTATE15.35%
GOLD20.13%
GOLD18.62%
GOLD–23.10%
GOLD35.74%
ALTS13.03%
ALTS0.24%
ALTS9.65%
EM INCOME 28.83%
ALTS16.63%
ALTS14.91%
ALTS15.30%
ALTS12.04%
ALTS–26.52%
COMMODITY 28.03%
COMMODITY 12.55%
EM INCOME –0.79%
GLOBAL REAL ESTATE2.82%
ALTS24.70%
EM INCOME11.77%
EM INCOME11.86%
EM INCOME 10.49%
TIPS11.64%
FLOATING RATE
–29.10%
ALTS26.67%
EM INCOME11.83%
EM EQUITY –2.62%
FLOATING RATE 1.91%
INFRA-STRUCTURE
24.40%
TIPS 8.46%
MARKET NEUTRAL
6.22%
MARKET NEUTRAL
7.32%
EM INCOME6.45%
INFRA-STRUCTURE
–32.66%
EM INCOME25.95%
FLOATING RATE
10.13%
GLOBAL REAL ESTATE–3.81%
MARKET NEUTRAL
0.98%
FLOATING RATE 9.97%
FLOATING RATE5.17%
FLOATING RATE 5.06%
FLOATING RATE6.74%
MARKET NEUTRAL
5.29%
COMMODITY –44.76%
INFRA-STRUCTURE
14.75%
INFRA-STRUCTURE
6.60%
INFRA-STRUCTURE
–14.82%
EM EQUITY–6.17%
TIPS8.40%
MARKET NEUTRAL
4.15%
INFRA-STRUCTURE
4.97%
COMMODITY 2.77%
FLOATING RATE2.08%
GLOBAL REAL ESTATE–47.72%
TIPS11.41%
TIPS6.31%
COMMODITY–19.71%
INFRA-STRUCTURE
–17.95%
MARKET NEUTRAL
2.44%
GOLD–5.54%
TIPS2.84%
TIPS0.41%
GLOBAL REAL ESTATE–6.96%
EM EQUITY–53.33%
MARKET NEUTRAL
1.17%
MARKET NEUTRAL
3.79%
Source: Morningstar, as of 12/31/10. Past performance is historical and does not guarantee future results. See page 11 for index definitions and page 7 for the "alternative" definition.
RISK INFORMATION:Commodities: Market price movements or regulatory and economic changes will have a significant impact on commodity performance. Commodity-linked derivatives may subject a fund to special risks. Emerging markets: Investing in foreign securities, particularly those of emerging markets, presents certain risks, such as currency fluctuations, political and economic changes, and market risks. Stocks may decline in value. Floating-rate loans: Loan investments are subject to interest-rate and credit risks. Floating-rate loans tend to be rated below investment grade and may be more vulnerable to economic or business changes than issuers with investment-grade credit. Adjustable-rate loans are more sensitive to interest rate changes. In certain situations, it may be difficult or impossible to sell an investment at an acceptable price. Global tactical asset allocation: Investing in derivatives entails special risks relating to liquidity, leverage and credit that may reduce returns and/or increase volatility. Hedge funds: Leverage results in additional risks and can magnify the effect of any losses. Investing in derivatives entails special risks relating to liquidity, leverage and credit that may reduce returns and/or increase volatility. Short sales-which involve selling borrowed securities in anticipation of a price decline, then returning an equal number of the securities at some point in the future-could magnify losses and increase volatility. Forward commitment transactions which could subject an investor to counterparty and leverage risk. A counterparty may decline in financial health and become unable to honor its commitments, which could cause losses. Investing in derivatives entails special risks relating to liquidity, leverage and credit that may reduce returns and/or increase volatility. Infrastructure: Various stages of an infrastructure project involve specific risks. Development risk: The initial very high-risk phase where only equity capital can be used for financing. Construction risk: Cost and time spillovers may distort future revenue generation and profitability. Operating risk emerges due to underestimation of operating costs and occasionally, an overestimation of the output from the proposed infrastructure facility. Other potential risks include demand risk, relating to the demand and "willingness to pay" for the proposed infrastructure facility; financial risk such as foreign exchange and interest rate risks; market risk, when consumers can choose alternative services; and political risks relating to government policies and selection procedures. Private equity: There are several key risks in any type of private-equity investing. Companies that specialize in certain industries can carry additional risks such as technology risk, market risk and company risk. Any investment focused on one industry will generally be more volatile than one that invests more broadly. Investments in foreign markets, particularly those of emerging markets, presents certain risks, such as currency fluctuations, political and economic changes, and market risks. Fees relating to private-equity investments may be higher than those of more conventional investments such as mutual funds and may reduce returns. As private-equity investing opportunities become more widely available, the ability for private-equity firms to locate investment opportunities may be reduced. Some private-equity investment vehicles may not have long histories for comparison with other investments. Private equity investments may be illiquid, meaning it may be difficult or impossible to sell an investment at an acceptable price. Real estate: Any investment concentrated in a particular segment of the market will generally be more volatile than one that invests more broadly. There are special risks associated with an investment in real estate, including REITS. These risks include credit risk, interest rate fluctuations and the impact of varied economic conditions. TIPS: Although inflation-indexed bonds are expected to be protected from long-term inflationary trends, short-term increases in inflation may lead to a decline in value.
Alternative investments » 7
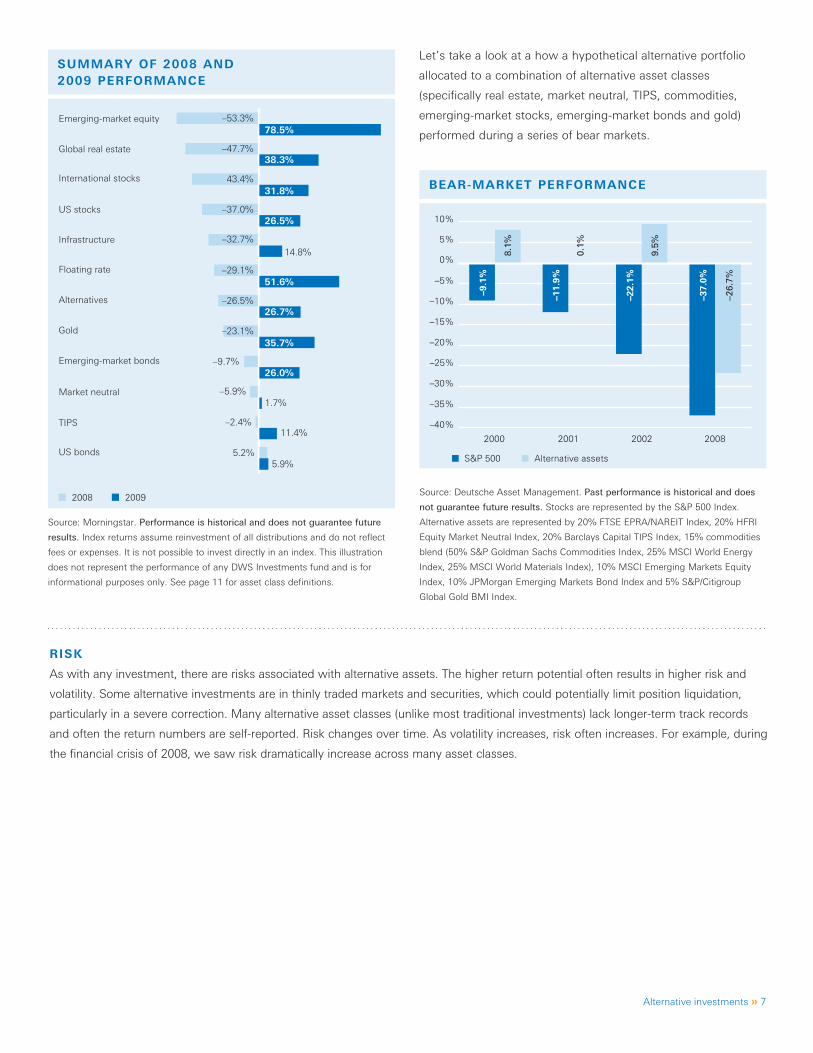
SUMMARY OF 2008 AND 2009 PERFORMANCE
BEAR-MARKET PERFORMANCE
Let’s take a look at a how a hypothetical alternative portfolio
allocated to a combination of alternative asset classes
(specifically real estate, market neutral, TIPS, commodities,
emerging-market stocks, emerging-market bonds and gold)
performed during a series of bear markets.
Source: Morningstar. Performance is historical and does not guarantee future
results. Index returns assume reinvestment of all distributions and do not reflect
fees or expenses. It is not possible to invest directly in an index. This illustration
does not represent the performance of any DWS Investments fund and is for
informational purposes only. See page 11 for asset class definitions.
Source: Deutsche Asset Management. Past performance is historical and does
not guarantee future results. Stocks are represented by the S&P 500 Index.
Alternative assets are represented by 20% FTSE EPRA/NAREIT Index, 20% HFRI
Equity Market Neutral Index, 20% Barclays Capital TIPS Index, 15% commodities
blend (50% S&P Goldman Sachs Commodities Index, 25% MSCI World Energy
Index, 25% MSCI World Materials Index), 10% MSCI Emerging Markets Equity
Index, 10% JPMorgan Emerging Markets Bond Index and 5% S&P/Citigroup
Global Gold BMI Index.
US bonds
–47.7%
43.4%
78.5%
38.3%
31.8%
26.5%
14.8%
51.6%
26.7%
35.7%
26.0%
1.7%
11.4%
5.9%
–37.0%
–29.1%
–26.5%
–23.1%
–9.7%
–5.9%
–2.4%
5.2%
–32.7%
–53.3%
2008 2009
TIPS
Market neutral
Emerging-market bonds
Gold
Alternatives
Floating rate
US stocks
Infrastructure
International stocks
Global real estate
Emerging-market equity
S&P 500 Alternative assets
RISK
As with any investment, there are risks associated with alternative assets. The higher return potential often results in higher risk and
volatility. Some alternative investments are in thinly traded markets and securities, which could potentially limit position liquidation,
particularly in a severe correction. Many alternative asset classes (unlike most traditional investments) lack longer-term track records
and often the return numbers are self-reported. Risk changes over time. As volatility increases, risk often increases. For example, during
the financial crisis of 2008, we saw risk dramatically increase across many asset classes.
–40%
–35%
–30%
–25%
–20%
–15%
–10%
–5%
0%
5%
10%
–9.1
%
8.1%
–11.
9%
0.1%
–22.
1%
9.5%
2000 2001 20082002
–26.
7%
–37.
0%
8 » Alternative investments
BNY MELLON TRUST MEDIAN PLAN RETURNS (Period ended 12/31/10)
5 years 10 years
Corporate plans 4.76% 4.97%
Endowments 5.21% 5.25%
Benchmark 3.45% 3.05%
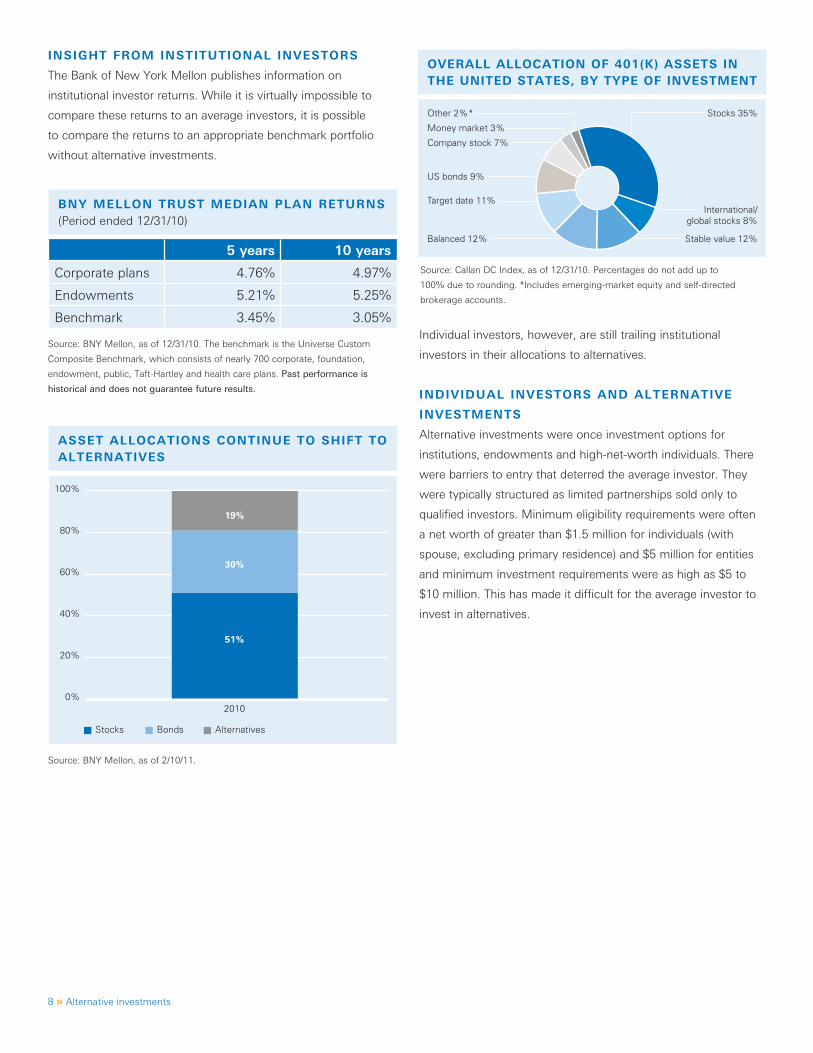
ASSET ALLOCATIONS CONTINUE TO SHIFT TO ALTERNATIVES
OVERALL ALLOCATION OF 401(K) ASSETS IN THE UNITED STATES, BY TYPE OF INVESTMENT
INSIGHT FROM INSTITUTIONAL INVESTORS
The Bank of New York Mellon publishes information on
institutional investor returns. While it is virtually impossible to
compare these returns to an average investors, it is possible
to compare the returns to an appropriate benchmark portfolio
without alternative investments.
Individual investors, however, are still trailing institutional
investors in their allocations to alternatives.
INDIVIDUAL INVESTORS AND ALTERNATIVE
INVESTMENTS
Alternative investments were once investment options for
institutions, endowments and high-net-worth individuals. There
were barriers to entry that deterred the average investor. They
were typically structured as limited partnerships sold only to
qualified investors. Minimum eligibility requirements were often
a net worth of greater than $1.5 million for individuals (with
spouse, excluding primary residence) and $5 million for entities
and minimum investment requirements were as high as $5 to
$10 million. This has made it difficult for the average investor to
invest in alternatives.
Source: BNY Mellon, as of 12/31/10. The benchmark is the Universe Custom
Composite Benchmark, which consists of nearly 700 corporate, foundation,
endowment, public, Taft-Hartley and health care plans. Past performance is
historical and does not guarantee future results.
Source: Callan DC Index, as of 12/31/10. Percentages do not add up to
100% due to rounding. *Includes emerging-market equity and self-directed
brokerage accounts.
Source: BNY Mellon, as of 2/10/11.
0%
20%
40%
60%
80%
100%
51%
30%
19%
Stocks Bonds Alternatives
2010
International/global stocks 8%
Stocks 35%
Stable value 12%Balanced 12%
Target date 11%
US bonds 9%
Company stock 7%
Other 2%*
Money market 3%
Alternative investments » 9
In addition, alternative investments may have the following
characteristics, which could make them potentially unattractive
to individual investors. They may:
■■ Involve shorting, derivatives, and/or leverage
■■ Be less liquid than traditional asset classes
■■ Have less information on valuations/pricing—reliance on
appraised value
■■ Have less transparency
■■ Not be tax-sensitive
■■ Be difficult to model within an overall asset allocation
The barriers to entry for retail investors mentioned above have
changed in recent years—as some mutual funds are now being
structured to include investments in alternative asset classes.
THE ROLE OF ALTERNATIVES IN AN
INVESTMENT PORTFOLIO
The inclusion of alternative investments in a portfolio, while
possibly reducing overall portfolio risk, can be a complicated
process. Considerable investment expertise may be required
to analyze the risk associated with differing investment styles and
to allocating to these investments. The question for individuals
and institutions alike is—what is the optimal allocation to
alternatives and what are the alternative asset classes to invest in?
ASSET ALLOCATION
Most investors recognize that a traditional asset allocation
refers to a “traditional” portfolio with an allocation to stocks
and an allocation to bonds, with these percentages being
further subdivided by style. In the past, this blend of capital
appreciation from stocks and capital preservation from bonds
seemed a reasonable solution for many investors—institutional
and individual alike. Will this hold true in the future and are there
other options aside from traditional long-only portfolios?
A new generation of portfolio construction techniques has
evolved to address many of the challenges that have existed with
alternative investments in traditional asset allocation models.
One portfolio construction technique utilizes a factor-based
model to evaluate alternative asset classes. This allows a
comparison of traditional and alternative investments on a
common footing. In addition, advanced portfolio optimization
allows an investor to evaluate the probability of achieving a
given return and incorporates downside measures of risk.
These advances in portfolio construction methodology allow
investors to evaluate the role of alternatives within their overall
investment framework.
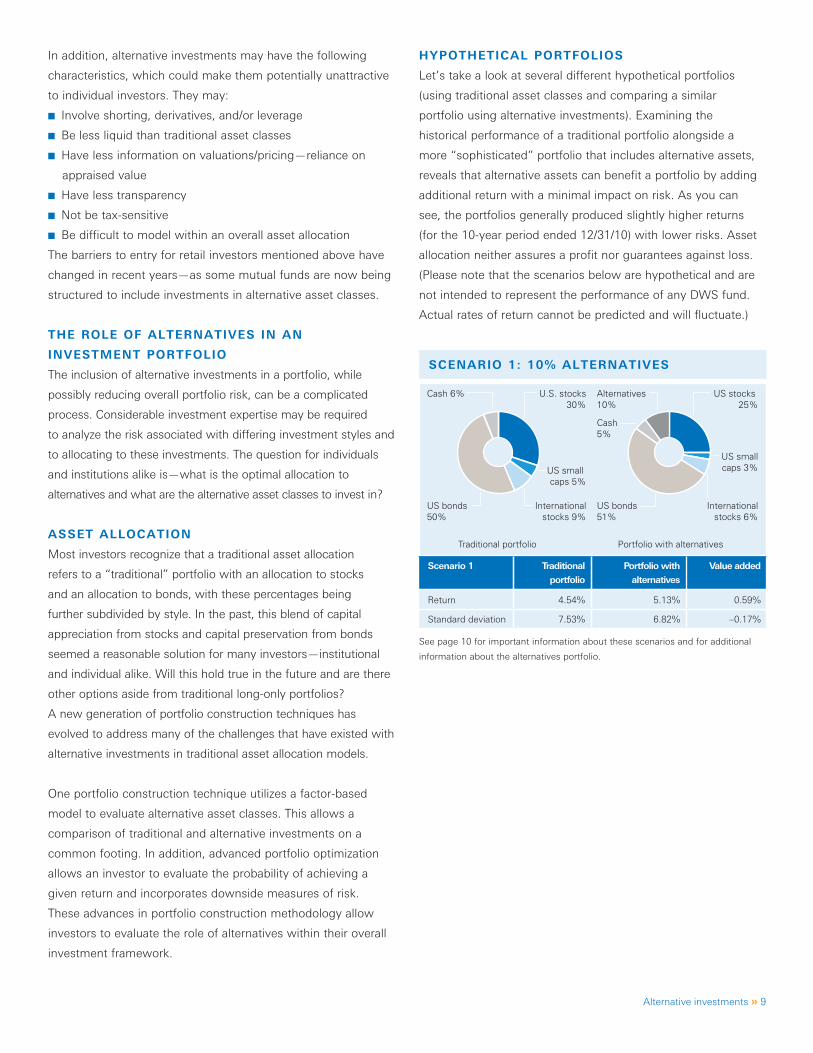
HYPOTHETICAL PORTFOLIOS
Let’s take a look at several different hypothetical portfolios
(using traditional asset classes and comparing a similar
portfolio using alternative investments). Examining the
historical performance of a traditional portfolio alongside a
more “sophisticated” portfolio that includes alternative assets,
reveals that alternative assets can benefit a portfolio by adding
additional return with a minimal impact on risk. As you can
see, the portfolios generally produced slightly higher returns
(for the 10-year period ended 12/31/10) with lower risks. Asset
allocation neither assures a profit nor guarantees against loss.
(Please note that the scenarios below are hypothetical and are
not intended to represent the performance of any DWS fund.
Actual rates of return cannot be predicted and will fluctuate.)
SCENARIO 1: 10% ALTERNATIVES
See page 10 for important information about these scenarios and for additional
information about the alternatives portfolio.
Scenario 1 Traditional
portfolio
Portfolio with
alternatives
Value added
Return 4.54% 5.13% 0.59%
Standard deviation 7.53% 6.82% –0.17%
U.S. stocks30%
US small caps 5%
Internationalstocks 9%
US bonds 50%
Cash 6% US stocks 25%
US smallcaps 3%
Internationalstocks 6%
US bonds51%
Cash5%
Alternatives10%
Traditional portfolio Portfolio with alternatives
10 » Alternative investments
CONCLUSION
In this paper, we have examined the changing investment
environment, defined key alternative asset classes, explored
advantages and disadvantages of alternative investments,
and compared the risk/return characteristics of hypothetical
traditional and non-traditional portfolios. We have discovered
how many institutional investors, leading university endowments,
and high-net-worth individuals successfully utilize alternative
investments. This leads to a vital question: is the general
investing public next?
Many individual investors faced with lower return expectations,
the increased correlation of most “traditional” asset classes,
and the need to take greater personal financial responsibility
are seeking consistent, risk-adjusted returns for future financial
needs. Following the example of institutions, numerous
individual investors are pursuing alternative investments and
many are finding that the decision-making process quickly
becomes complicated. In addition to determining the appropriate
percentage to invest in alternatives, there is selecting the asset
class for investment as well as rebalancing. These are important
and sometimes difficult decisions to make.
Typically, institutional investors have considerable expertise or
hire experts with deep experience in alternative investments.
Individual investors can also follow this model by tapping into
their financial advisors’ knowledge and fully understanding the
risks and potential benefits of alternative investments. There
are innovative funds designed to bring alternative investments
to the general investing public, and it is essential for individual
investors, intrigued by these offerings, to gain the insight and
foresight to make an informed decision.
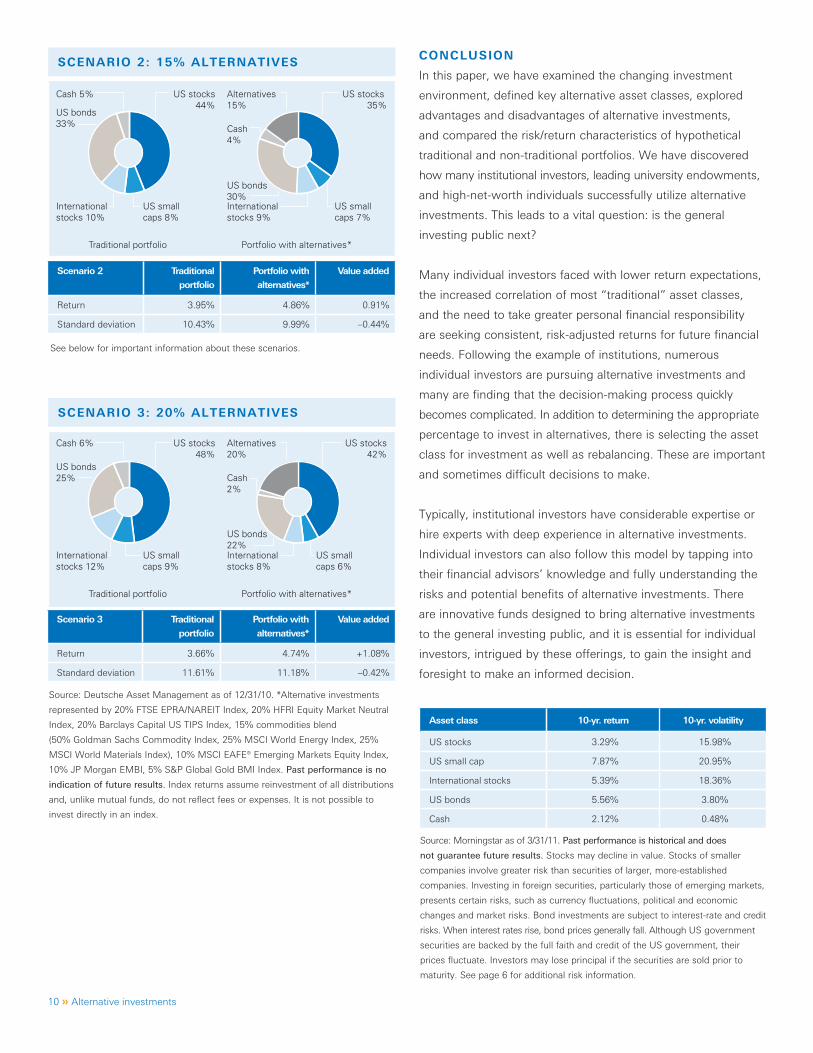
SCENARIO 2: 15% ALTERNATIVES
SCENARIO 3: 20% ALTERNATIVES
See below for important information about these scenarios.
Source: Deutsche Asset Management as of 12/31/10. *Alternative investments
represented by 20% FTSE EPRA/NAREIT Index, 20% HFRI Equity Market Neutral
Index, 20% Barclays Capital US TIPS Index, 15% commodities blend
(50% Goldman Sachs Commodity Index, 25% MSCI World Energy Index, 25%
MSCI World Materials Index), 10% MSCI EAFE® Emerging Markets Equity Index,
10% JP Morgan EMBI, 5% S&P Global Gold BMI Index. Past performance is no
indication of future results. Index returns assume reinvestment of all distributions
and, unlike mutual funds, do not reflect fees or expenses. It is not possible to
invest directly in an index.
Source: Morningstar as of 3/31/11. Past performance is historical and does
not guarantee future results. Stocks may decline in value. Stocks of smaller
companies involve greater risk than securities of larger, more-established
companies. Investing in foreign securities, particularly those of emerging markets,
presents certain risks, such as currency fluctuations, political and economic
changes and market risks. Bond investments are subject to interest-rate and credit
risks. When interest rates rise, bond prices generally fall. Although US government
securities are backed by the full faith and credit of the US government, their
prices fluctuate. Investors may lose principal if the securities are sold prior to
maturity. See page 6 for additional risk information.
Scenario 3 Traditional
portfolio
Portfolio with
alternatives*
Value added
Return 3.66% 4.74% +1.08%
Standard deviation 11.61% 11.18% –0.42%
Asset class 10-yr. return 10-yr. volatility
US stocks 3.29% 15.98%
US small cap 7.87% 20.95%
International stocks 5.39% 18.36%
US bonds 5.56% 3.80%
Cash 2.12% 0.48%
Scenario 2 Traditional
portfolio
Portfolio with
alternatives*
Value added
Return 3.95% 4.86% 0.91%
Standard deviation 10.43% 9.99% –0.44%
US stocks44%
US small caps 8%
Internationalstocks 10%
US bonds 33%
Cash 5% US stocks 35%
US small caps 7%
Internationalstocks 9%
US bonds30%
Cash4%
Alternatives15%
Traditional portfolio Portfolio with alternatives*
US stocks48%
US small caps 9%
Internationalstocks 12%
US bonds 25%
Cash 6% US stocks42%
US small caps 6%
Internationalstocks 8%
US bonds22%
Cash2%
Alternatives20%
Traditional portfolio Portfolio with alternatives*

Alternative investments » 11
AUTHOR BIOGRAPHIES
CHRISTINE M. JOHNSON
Johnson, CFA, is director of Alternative Strategy and Platform Development for DWS Investments.
She has a bachelor's degree from Pace University and a master's degree in business administration
from Fordham University.
INNA OKOUNKOVA
Okounkova is head of strategic asset allocation at QS Investors. She has a master's of science degree from
Moscow State University and a master's degree in business administration from the University of Chicago.
QS Investors was formed within Deutsche Bank in 1999 and launched as an independent firm in 2010 based
in New York City. The firm has $12.8 billion under management across and over $90 billion under
advisory as of 3/31/11.
INDEX/ASSET CLASS DEFINITIONSCash: Citigroup 3-Month US Treasury Bill Index, an unmanaged index reflecting monthly return equivalents of yield averages that are not marked to the market and are an average of the last three, three-month T-bill issues. Commodities: 50% S&P Goldman Sachs Commodity Index, which represents commodity sector returns of an unleveraged, long-term investment in commodity futures; 25% MSCI World Energy Index, which measures the performance of energy equities in developed markets; 25% MSCI World Materials Index, which measures the performance of material equities in developed markets. Emerging-market equity/stocks: MSCI Emerging Markets Equity Index, which measures equity market performance in global emerging markets. Emerging-market income/bonds: JP Morgan Emerging Market Bond Index, which tracks Brady bonds, loans, eurobonds and local-market debt traded in emerging markets. US bonds: Barclays Capital US Aggregate Index, which represents domestic, taxable investment-grade bonds with average maturities of one year or more. Floating-rate: S&P/LSTA Leveraged Loan Index, an unmanaged, market-value weighted total return index that tracks outstanding balance and current spreads over LIBOR for fully funded loan terms. Global infrastructure: UBS Global Infrastructure Index: UBS considers utilities to be a subset of infrastructure; however, due to the size and relative maturity of utilities as an asset class, UBS has chosen to identify “infrastructure” and ”utilities” separately as second-tier indices (UBS Infrastructure Index, UBS Utilities Index). The UBS Global Infrastructure & Utilities (UBS I&U) Indices are calculated based on free-float market capitalization, as defined by S&P. Global real estate: FTSE EPRA/NAREIT Developed Index, a market capitalization-weighted index based on the last trade prices of shares of all eligible companies. Gold: S&P/Citigroup Global Gold BMI Index, which represents the precious metals industry component of the S&P/Citigroup global equity family of indices. International stocks: MSCI EAFE Index, a free-float-adjusted, market-capitalization-weighted index designed to measure developed-market equity performance. Market neutral: HFRI Equity Market Neutral Index, which is designed to represent the performance of equity market neutral strategies. TIPS: Barclays Capital US TIPS Index, which tracks US Treasury inflation-linked securities. US stocks: The S&P 500 Index, which represents the US equity market in general. US small-cap stocks: Russell 2000 Index, which tracks the performance of the 2,000 smallest companies of the Russell 3000 Index. The Russell 1000 Growth Index tracks the performance of those Russell 1000 Index stocks with higher price-to-book ratios and higher forecasted growth rates. The Russell 1000 Value Index tracks the performance of those Russell 1000 Index stocks with lower price-to-book ratios and lower forecasted growth rates. The Russell 1000 Index tracks the performance of the 1,000 largest stocks in the broad Russell 3000 Index. The Russell 2000 Growth Index tracks the performance of those Russell 2000 Index stocks with higher price-to-book ratios and higher forecasted growth rates. The Russell 2000 Value Index tracks the performance of those Russell 2000 Index stocks with lower price-to-book ratios and lower forecasted growth rates. Index returns assume reinvestment of all distributions but do not reflect fees or expenses. It is not possible to invest directly in an index.
© 2011 DWS Investments Distributors, Inc. All rights reserved. PM113275 (6/11) R-17251-1 ALT-100
Investment products offered throughDWS Investments Distributors, Inc. Advisory services offered through Deutsche Investment Management Americas, Inc.
The opinions and forecasts expressed herein by the authors do not necessarily reflect those of DWS Investments, are as of 3/31/11
and may not come to pass.
DWS Investments Distributors, Inc.222 South Riverside Plaza Chicago, IL 60606-5808www.dws-investments.com [email protected] (800) 621-1148
DWS Investments is part of Deutsche Bank’s Asset Management division and, within the US, represents the retail asset management activities of Deutsche Bank AG, Deutsche Bank Trust Company Americas, Deutsche Investment Management Americas Inc. and DWS Trust Company.
IMPORTANT RISK INFORMATION Although allocation among different asset categories generally limits risk, portfolio management may favor an asset category that underperforms other assets or markets as a whole. The fund expects to invest in underlying funds that emphasize alternatives or non-traditional asset categories or investment strategies, and as a result, it is subject to the risk factors of those underlying funds. Some of those risks include stock market risk, credit and interest rate risk, volatility in commodity prices and high-yield debt securities, short sales risk and the political, general economic, liquidity and currency risks of foreign investments, which may be particularly significant for emerging markets. The fund may use derivatives, including as part of its Global Tactical Asset Allocation (GTAA) strategy. The fund expects to have direct and indirect exposure to derivatives, which may be more volatile and less liquid than traditional securities. The fund could suffer losses on its derivative positions. See the prospectus for additional risks and specific details regarding the fund's risk profile.
OBTAIN A PROSPECTUS To obtain a summary prospectus, if available, or prospectus, download one from www.dws-investments.com, talk to your financial representative or call (800) 621-1048. We advise you to carefully consider the product's objectives, risks, charges and expenses before investing. The summary prospectus and prospectus contain this and other important information about the investment product. Please read the prospectus carefully before you invest.
Related Documents