Confidential. For Qualified Investors (Art. 10 Para. 3 of the Swiss Federal Collective Investment Schemes Act (CISA)) Not for distribution/ For Professional Clients (MiFID Directive 2004/39/EC Annex II) only. Deutsche Bank Global Prime Finance Fourteenth Annual Alternative Investment Survey The road ahead: 10 key themes shaping investors’ hedge fund allocations February 2016

Welcome message from author
This document is posted to help you gain knowledge. Please leave a comment to let me know what you think about it! Share it to your friends and learn new things together.
Transcript
Confidential. For Qualified Investors (Art. 10 Para. 3 of the Swiss Federal Collective Investment Schemes Act (CISA))Not for distribution/ For Professional Clients (MiFID Directive 2004/39/EC Annex II) only.
Deutsche BankGlobal Prime Finance
Fourteenth Annual Alternative Investment SurveyThe road ahead: 10 key themes shaping investors’ hedge fund allocations
February 2016

Disclaimer
This material is for discussion purposes only and is not an offer, or solicitation of an offer, to buy or sell any security or financial instrument or to participate in any trading strategy. The information contained herein is the DB Hedge Fund Capital Group’s summary, interpretation and analysis of the assumptions, estimates, views, predictions and opinions of the investors that participated in the DB 2016 Alternative Investment Survey as of the date of this publication. No representation is made by DB that the information contained herein is accurate or complete. Any projections are based on a number of assumptions as to market conditions and there can be no guarantee that any projected results will be achieved. Past performance is not a guarantee of future results. This material is solely for informational purposes only. This material does not, nor is intended to, constitute the provision of investment advice.
This material was not produced, reviewed or edited by DB’s Research Department. Any opinions expressed herein may differ from the opinions expressed by other DB departments including the Research Department.
The distribution of this material and availability of these products and services in certain jurisdictions may be restricted by law. You may not distribute this material, in whole or in part, without our express written permission. The information contained in this material is provided on the basis that it is intended solely for your own internal use, and on the basis that you have such knowledge and experience in financial and business matters to be capable of evaluating the merits and risks associated with such information.
An investment in a hedge fund or a managed account involves a significant degree of risk, which each prospective investor must carefully consider before subscribing to purchase an interest in such a fund or agreeing to establish a managed account. Returns generated from an investment in a hedge fund or a managed account may not adequately compensate investors for the business and financial risk assumed.
Hedge funds and managed accounts are subject to those market risks common to other types of investments, including market volatility.
Furthermore, there may be restrictions on transferring hedge fund interests. In addition, certain trading techniques and strategies employed by hedge funds and managed accounts, such as the use of leverage, may increase the adverse impact to which an investment may be subject.
Investors should invest in a hedge fund or open a managed account only if they are able and prepared to bear the risk of investment losses, including the potential loss of their entire investment. Other risks associated with investments in hedge funds include, but are not limited to, the fact that hedge funds: can be highly illiquid; are not required to provide periodic pricing or valuation information to investors; may involve complex tax structures and delays in distributing important tax information; are not subject to the same regulatory requirements as mutual funds; often charge higher fees and the high fees may offset the fund’s trading profits; may have a limited operating history; can have performance that is volatile; may have a fund manager who has total trading authority over the fund and the use of a single adviser applying generally similar trading programs could mean a lack of diversification, and consequentially, higher risk; may not have a secondary market for an investor’s interest in the fund and none may be expected to develop; may have restrictions on transferring interests in the fund; and may trade a substantial portion of their trades on foreign exchanges.
“DB” means Deutsche Bank AG, its branches and affiliated companies as the context requires. DB does not provide legal, tax or accounting advice. This material was prepared solely in connection with the promotion or marketing, to the extent permitted by applicable law, of the matters addressed herein, and was not intended or written to be used, and cannot be used or relied upon, by any taxpayer for purposes of avoiding any U.S. federal tax penalties. The recipient of this material should seek advice from an independent tax advisor regarding any tax matters addressed herein based on its particular circumstances. Please visit www.db.com for more information about DB.
DB SPECIFICALLY DISCLAIMS ALL LIABILITY FOR ANY DIRECT, INDIRECT, CONSEQUENTIAL OR OTHER LOSSES OR DAMAGES INCLUDING LOSS OF PROFITS INCURRED BY YOU OR ANY THIRD PARTY THAT MAY ARISE FROM ANY RELIANCE ON THIS MATERIAL OR FOR THE RELIABILITY, ACCURACY, COMPLETENESS OR TIMELINESS THEREOF. DB is authorised under German banking law (competent authorities: European Central Bank (“ECB”) and Bundesanstalt für Finanzdienstleistungsaufsicht (“BaFin”)) and, in the U.K., by the Prudential Regulation Authority. It is subject to supervision by the European Central Bank and by the BaFin, and is subject to limited regulation in the U.K. by the Financial Conduct Authority and Prudential Regulation Authority. In the U.S., this presentation is distributed by Deutsche Bank Securities Inc., a registered broker-dealer subject to regulation by the Securities and Exchange Commission and a member of the New York Stock Exchange, the Financial Industry Regulatory Authority, the National Futures Association and the Securities Investor Corporation.
Printed in February 2016.
Deutsche Bank 2016 Alternative Investment Survey February 2016
3
Acknowledgement
The Hedge Fund Capital Group would like to thank all investors that have participated in the Deutsche Bank 2016 Alternative Investment Survey. This is now the fourteenth year that we have conducted the survey, making it one of the most comprehensive and longest running global hedge fund investor surveys available.
However, it is only with the help of our investor network that we can accomplish this and we thank these institutions for taking the time to provide us with invaluable insights into their allocation process and plans for the future.
Finally, we would like to thank our colleagues, who contributed to making this year’s report particularly insightful.
We hope you find the survey of interest and we look forward to working with you.
Anita NemesGlobal Head of Hedge Fund Capital Group
Greg BunnCo-Head of Global Prime Finance
Ashley Wilson Co-Head of Global Prime Finance
Deutsche Bank 2016 Alternative Investment Survey February 2016
4
Contents
Executive summary .....................................................................1
Methodology & investor profile .................................................5
Performance trends & predictions ............................................11
Asset flow trends & predictions ................................................29
Allocation plans ........................................................................51
Portfolio construction ................................................................69
Hedge fund fees .......................................................................79
Early stage investing & seeding ..............................................91
AIFMD ......................................................................................99

Deutsche Bank 2016 Alternative Investment Survey February 2016
1
Executive summary
1
Deutsche Bank 2016 Alternative Investment Survey February 2016
2
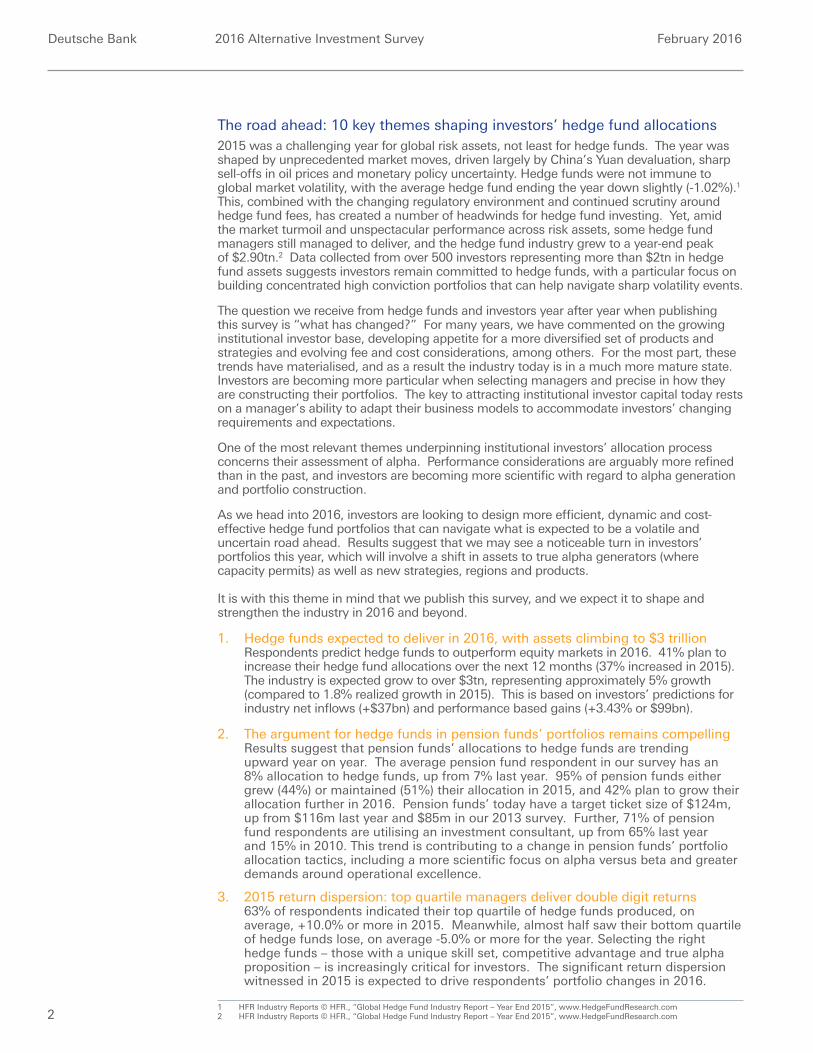
The road ahead: 10 key themes shaping investors’ hedge fund allocations2015 was a challenging year for global risk assets, not least for hedge funds. The year was shaped by unprecedented market moves, driven largely by China’s Yuan devaluation, sharp sell-offs in oil prices and monetary policy uncertainty. Hedge funds were not immune to global market volatility, with the average hedge fund ending the year down slightly (-1.02%).1 This, combined with the changing regulatory environment and continued scrutiny around hedge fund fees, has created a number of headwinds for hedge fund investing. Yet, amid the market turmoil and unspectacular performance across risk assets, some hedge fund managers still managed to deliver, and the hedge fund industry grew to a year-end peak of $2.90tn.2 Data collected from over 500 investors representing more than $2tn in hedge fund assets suggests investors remain committed to hedge funds, with a particular focus on building concentrated high conviction portfolios that can help navigate sharp volatility events.
The question we receive from hedge funds and investors year after year when publishing this survey is “what has changed?” For many years, we have commented on the growing institutional investor base, developing appetite for a more diversified set of products and strategies and evolving fee and cost considerations, among others. For the most part, these trends have materialised, and as a result the industry today is in a much more mature state. Investors are becoming more particular when selecting managers and precise in how they are constructing their portfolios. The key to attracting institutional investor capital today rests on a manager’s ability to adapt their business models to accommodate investors’ changing requirements and expectations. One of the most relevant themes underpinning institutional investors’ allocation process concerns their assessment of alpha. Performance considerations are arguably more refined than in the past, and investors are becoming more scientific with regard to alpha generation and portfolio construction. As we head into 2016, investors are looking to design more efficient, dynamic and cost-effective hedge fund portfolios that can navigate what is expected to be a volatile and uncertain road ahead. Results suggest that we may see a noticeable turn in investors’ portfolios this year, which will involve a shift in assets to true alpha generators (where capacity permits) as well as new strategies, regions and products. It is with this theme in mind that we publish this survey, and we expect it to shape and strengthen the industry in 2016 and beyond.
1. Hedge funds expected to deliver in 2016, with assets climbing to $3 trillion Respondents predict hedge funds to outperform equity markets in 2016. 41% plan to increase their hedge fund allocations over the next 12 months (37% increased in 2015). The industry is expected grow to over $3tn, representing approximately 5% growth (compared to 1.8% realized growth in 2015). This is based on investors’ predictions for industry net inflows (+$37bn) and performance based gains (+3.43% or $99bn).
2. The argument for hedge funds in pension funds’ portfolios remains compelling
Results suggest that pension funds’ allocations to hedge funds are trending upward year on year. The average pension fund respondent in our survey has an 8% allocation to hedge funds, up from 7% last year. 95% of pension funds either grew (44%) or maintained (51%) their allocation in 2015, and 42% plan to grow their allocation further in 2016. Pension funds’ today have a target ticket size of $124m, up from $116m last year and $85m in our 2013 survey. Further, 71% of pension fund respondents are utilising an investment consultant, up from 65% last year and 15% in 2010. This trend is contributing to a change in pension funds’ portfolio allocation tactics, including a more scientific focus on alpha versus beta and greater demands around operational excellence.
3. 2015 return dispersion: top quartile managers deliver double digit returns 63% of respondents indicated their top quartile of hedge funds produced, on average, +10.0% or more in 2015. Meanwhile, almost half saw their bottom quartile of hedge funds lose, on average -5.0% or more for the year. Selecting the right hedge funds – those with a unique skill set, competitive advantage and true alpha proposition – is increasingly critical for investors. The significant return dispersion witnessed in 2015 is expected to drive respondents’ portfolio changes in 2016.
1 HFR Industry Reports © HFR., “Global Hedge Fund Industry Report – Year End 2015”, www.HedgeFundResearch.com2 HFR Industry Reports © HFR., “Global Hedge Fund Industry Report – Year End 2015”, www.HedgeFundResearch.com
Deutsche Bank 2016 Alternative Investment Survey February 2016
3
4. Portfolio concentration continues: fewer managers, greater competition 53% of respondents have less than 25 direct hedge fund investments in their respective portfolios, compared to 19% just five years ago. Managers today are competing for a place amongst an average of 36 funds (median: 25) versus 60 (median: 45) in 2008. Due to a scarcity of alpha and capacity concerns, more investors are concentrating their portfolios in search of higher returns, reduced overall costs and greater portfolio efficiency.
5. Investors increasingly embrace quantitative strategies
Over two thirds of respondents invest in systematic strategies, including one in every two who plan to add to one or more quantitative sub-strategies in 2016. The largest investment consultants and pension funds are driving demand: 45% of these respondents plan to add to one or more systematic strategies, including quantitative equity market neutral, CTA, quantitative macro, quantitative equity and quantitative multi-strategy. These investors have on average approximately $10bn in hedge fund assets under management and an allocation size of more than $100m.
6. Market neutral is the new black
Those managers that have demonstrated their ability to deliver alpha on both the long and short side of the book irrespective of market directionality are well placed to benefit from increased investors flows. After a strong year of performance, equity market neutral strategies are expected to be amongst the best performers in 2016, and are also the most in-demand. On a net basis, 32% of investors are increasing their exposure to fundamental equity market neutral (versus 17% last year), and 18% to systematic equity market neutral (versus 11% last year).
7. Alternative beta / risk premia sees growing demand
20% of respondents invest in alternative beta / risk premia strategies today, up from 15% last year and 8% the year prior. 60% of these respondents plan to grow their allocation in 2016. Meanwhile, 18% of respondents do not currently invest, but are considering making an allocation this year. We are seeing some investors complement their core ‘alpha’ portfolios with more liquid and cheaper alternative beta / risk premia strategies in order to allocate risk capital more dynamically and efficiently.
8. Multi-strategy, event driven and credit distressed strategies: manager rotation
expected Multi-strategy and event driven strategies are amongst those strategies with the highest expected turnover in 2016. 16% and 20% of respondents plan to redeem from these strategies, respectively, while 9% and 18% plan to add. Credit distressed is another high expected turnover strategy, with 18% of investors planning to add and 17% planning to reduce.
9. Hedge fund fees and cost considerations move in favour of greater alignment of
interest Management and performance fees have come down marginally, however investors will pay for quality. The average management fee that investors pay remains unchanged year on year at 1.63%, whilst the average performance fee has trended downward slightly during this period from 18.03% to 17.85%. Despite continued headline pressure on fees, 42% of investors say they would allocate to a manager with fees in excess of “2&20” for a new allocation.
10. Partnership is key As their expectations and requirements change, investors are increasingly looking to align themselves with strategic partners who have the experience, expertise and resources to help them manage their own portfolios, whether that be in the form of knowledge sharing and/or tailored strategies and products. More than two thirds of all respondents placed “access to founders / CIOs / senior investment professionals” in their top three factors influencing their manager selection process. Additionally, one third of respondents today have utilised the single investment fund / fund of one approach to create more tailored solutions. Lastly, demand for non-traditional hedge fund products is on the rise, with a growing number of investors allocating to alternative UCITS strategies, alternative ’40 Act mutual funds, hybrid PE/HF vehicles, hedge fund run long-only and co-investment opportunities.

Deutsche Bank 2016 Alternative Investment Survey February 2016
4

Deutsche Bank 2016 Alternative Investment Survey February 2016
5
Methodology &investor profile
5
Deutsche Bank 2016 Alternative Investment Survey February 2016
6
Methodology & investor profileIn December 2015, the Deutsche Bank Hedge Fund Capital Group invited our global hedge fund investor network to participate in this survey, and we gathered data over the subsequent month.
The context in which investors have been answering the survey is after another year of heightened macro economic risks, market uncertainty and sharp volatility events across asset classes. The S&P 500 ended the year down -0.73% (the first negative year since 2008), suffering from repeated episodes of heightened volatility.3 Macroeconomic events in China caused upheaval in global markets throughout the year, including the sharp downturn in August. Oil prices were trading at 12-year lows after dropping approximately 70% since mid-2014 (WTI ended the year at $37.04/bbl).4 The multi-year strong USD cycle continued albeit at a more modest pace, with the dollar rising by 8.29% in 12 months.5 Lastly, the long awaited Federal Reserve Bank (“Fed”) tightening finally took place in December, much later than the markets had anticipated. By year-end very few risk assets were in positive territory.
Against this backdrop, the HFRI Fund Weighted Composite Index ended the year slightly down (-1.02%), falling short of investors’ predictions in last year’s survey (+5.22%).6 2015 performance, however, can be best characterized by the significant dispersion in hedge fund returns across strategies, and it should not go unnoticed that there were some strong outperformers. Investors remained committed to their hedge fund allocations and invested a total of $44bn in net inflows during the year, compared to the $60bn in net inflows that was predicted by our respondents in last year’s survey.7 Positive net inflows enabled industry assets to inch higher to a year-end peak of $2.90tn, representing 1.8% growth for the year.8
This publication incorporates survey responses from 504 global hedge fund allocators who collectively manage and/or advise on $42tn total assets and $2.1tn of hedge fund assets, representing over two thirds of the hedge fund industry’s assets under management (“AUM”). In the fourteen years of publishing this survey, this year marks the largest sample of respondents, both by number and by AUM. While many more investors took part in this year’s survey, we have only included in our analysis those that completed the survey in its entirety.
Our respondents comprise a wide variety of investor types from across the globe. The information that follows includes their outlook for the hedge fund industry in 2016 and beyond.
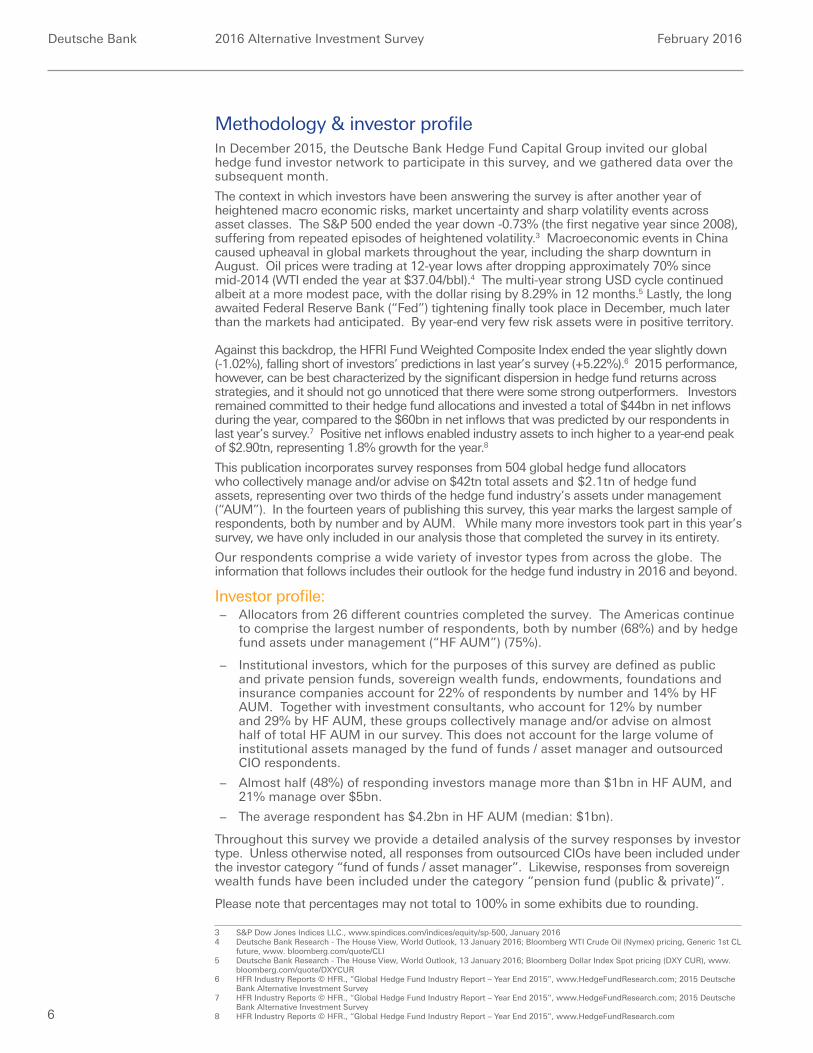
Investor profile: − Allocators from 26 different countries completed the survey. The Americas continue
to comprise the largest number of respondents, both by number (68%) and by hedge fund assets under management (“HF AUM”) (75%).
− Institutional investors, which for the purposes of this survey are defined as public and private pension funds, sovereign wealth funds, endowments, foundations and insurance companies account for 22% of respondents by number and 14% by HF AUM. Together with investment consultants, who account for 12% by number and 29% by HF AUM, these groups collectively manage and/or advise on almost half of total HF AUM in our survey. This does not account for the large volume of institutional assets managed by the fund of funds / asset manager and outsourced CIO respondents.
− Almost half (48%) of responding investors manage more than $1bn in HF AUM, and 21% manage over $5bn.
− The average respondent has $4.2bn in HF AUM (median: $1bn).
Throughout this survey we provide a detailed analysis of the survey responses by investor type. Unless otherwise noted, all responses from outsourced CIOs have been included under the investor category “fund of funds / asset manager”. Likewise, responses from sovereign wealth funds have been included under the category “pension fund (public & private)”.
Please note that percentages may not total to 100% in some exhibits due to rounding.
3 S&P Dow Jones Indices LLC., www.spindices.com/indices/equity/sp-500, January 20164 Deutsche Bank Research - The House View, World Outlook, 13 January 2016; Bloomberg WTI Crude Oil (Nymex) pricing, Generic 1st CL
future, www. bloomberg.com/quote/CLI5 Deutsche Bank Research - The House View, World Outlook, 13 January 2016; Bloomberg Dollar Index Spot pricing (DXY CUR), www.
bloomberg.com/quote/DXYCUR6 HFR Industry Reports © HFR., “Global Hedge Fund Industry Report – Year End 2015”, www.HedgeFundResearch.com; 2015 Deutsche
Bank Alternative Investment Survey7 HFR Industry Reports © HFR., “Global Hedge Fund Industry Report – Year End 2015”, www.HedgeFundResearch.com; 2015 Deutsche
Bank Alternative Investment Survey8 HFR Industry Reports © HFR., “Global Hedge Fund Industry Report – Year End 2015”, www.HedgeFundResearch.com
Deutsche Bank 2016 Alternative Investment Survey February 2016
7
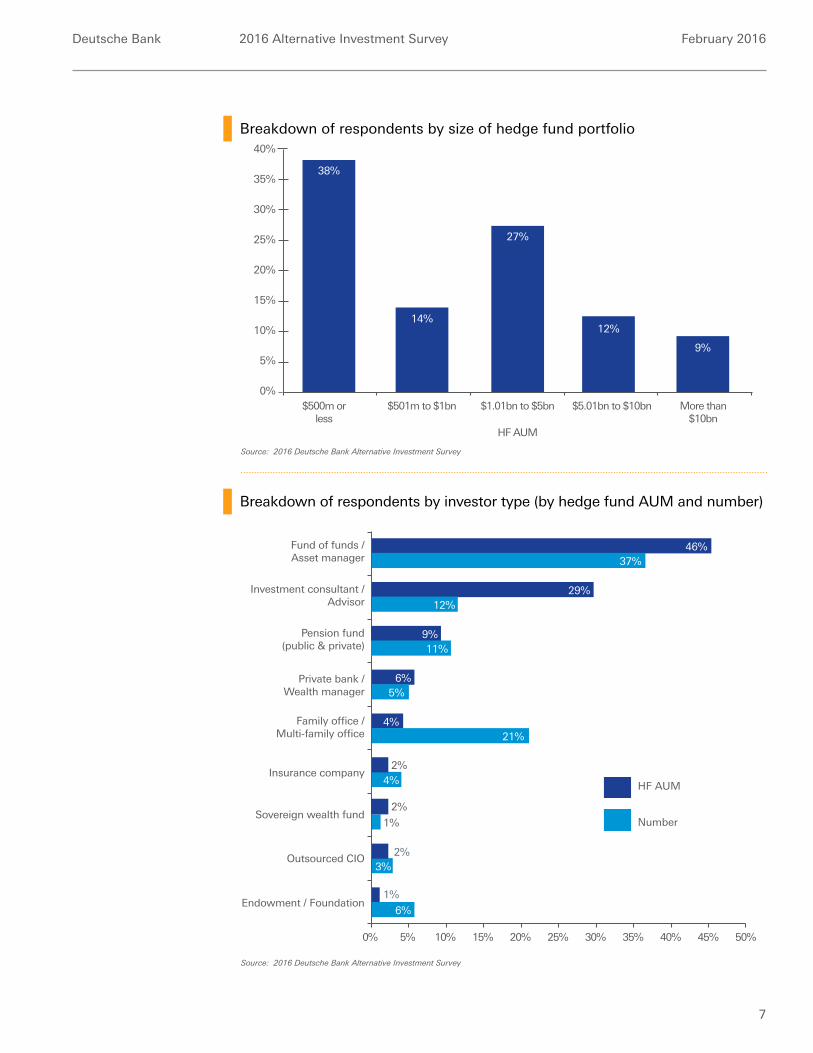
Breakdown of respondents by size of hedge fund portfolio
15%
10%
5%
0%
20%
$500m orless
$501m to $1bn $1.01bn to $5bn
HF AUM
$5.01bn to $10bn More than$10bn
38%
14%12%
9%
27%25%
30%
35%
40%
Source: 2016 Deutsche Bank Alternative Investment Survey
Breakdown of respondents by investor type (by hedge fund AUM and number)
3%
Insurance company
Endowment / Foundation
Family office /Multi-family office
Investment consultant /Advisor
Private bank /Wealth manager
Fund of funds /Asset manager
10%5% 20%15%0% 30%25% 40% 45% 50%35%
46%37%
29%12%
6%5%
4%21%
4%
1%
2%
2%
2%
1%
6%
HF AUM
Number
Outsourced CIO
Sovereign wealth fund
Pension fund(public & private)
9%11%
Source: 2016 Deutsche Bank Alternative Investment Survey
Deutsche Bank 2016 Alternative Investment Survey February 2016
8
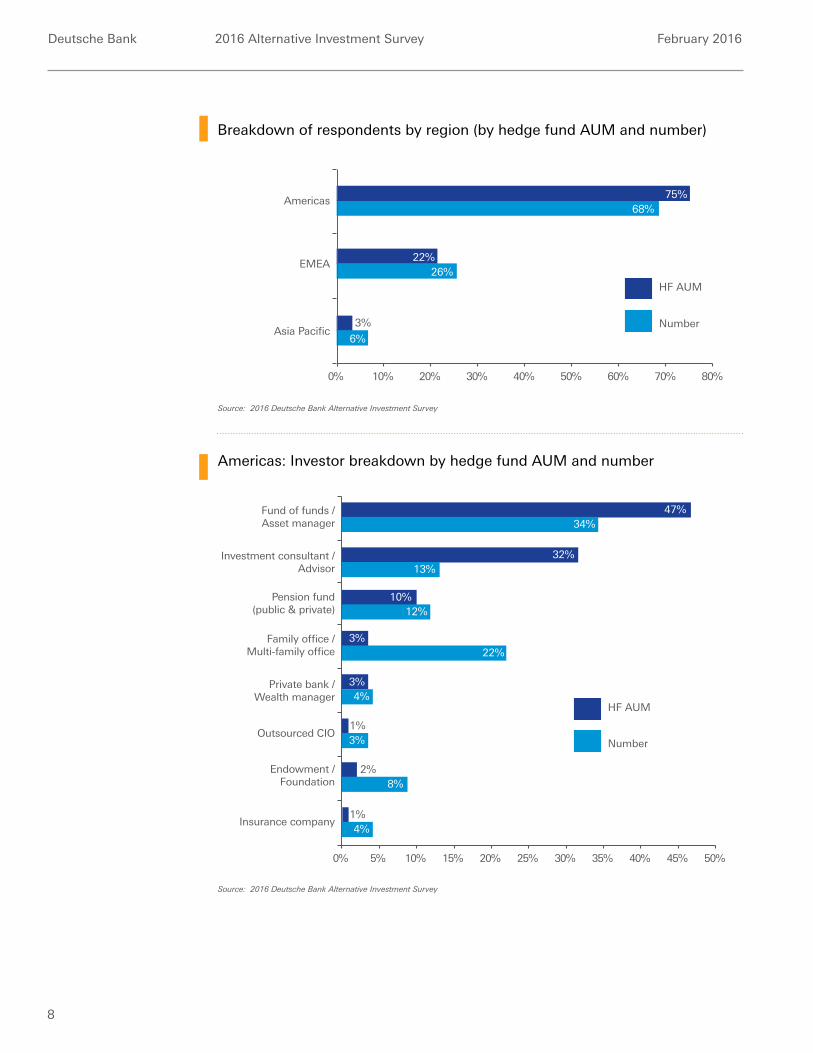
Americas: Investor breakdown by hedge fund AUM and number
Endowment /Foundation
Insurance company
Private bank /Wealth manager
Outsourced CIO
Investment consultant /Advisor
Family office /Multi-family office
Fund of funds /Asset manager
10%5% 20%15%0% 30%25% 50%45%40%35%
50%
34%
32%13%
Pension fund(public & private)
10%12%
3%22%
3%4%
1%3%
2%8%
1%4%
HF AUM
Number
47%
Source: 2016 Deutsche Bank Alternative Investment Survey
Breakdown of respondents by region (by hedge fund AUM and number)
EMEA
Asia Pacific
Americas
10% 20%0% 30% 60% 70% 80%50%40%
75%68%
22%26%
3%
6%
HF AUM
Number
Source: 2016 Deutsche Bank Alternative Investment Survey
Deutsche Bank 2016 Alternative Investment Survey February 2016
9
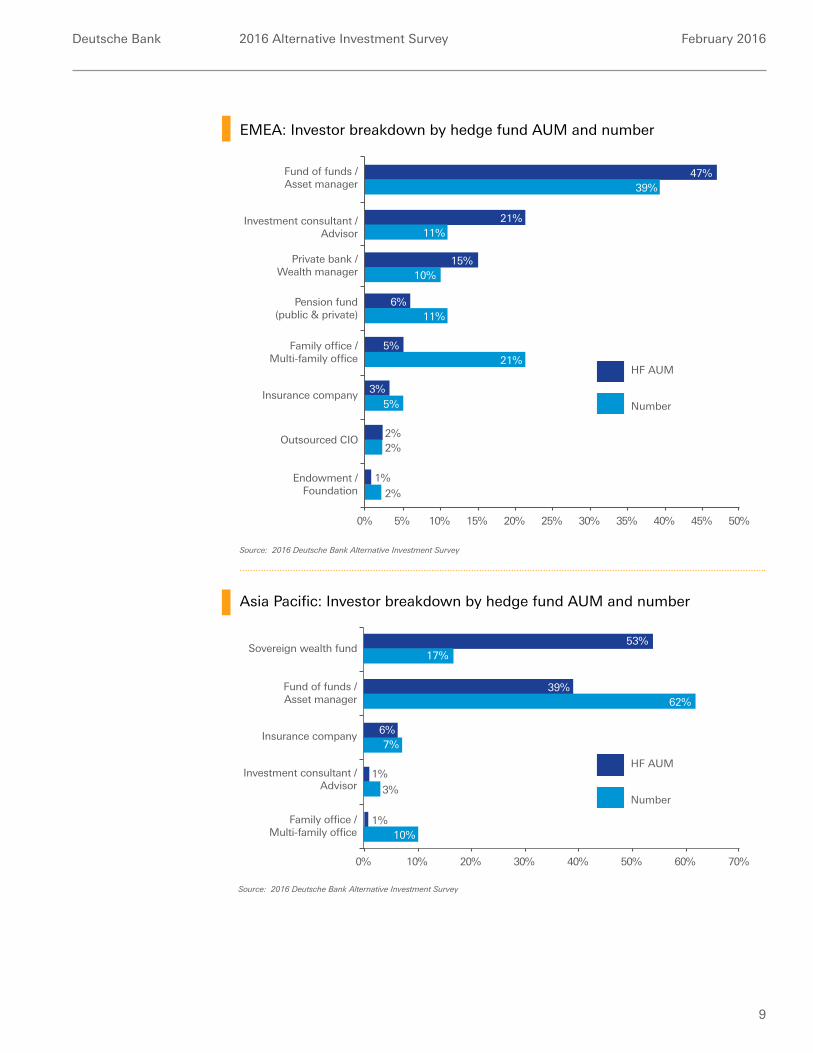
EMEA: Investor breakdown by hedge fund AUM and number
Asia Pacific: Investor breakdown by hedge fund AUM and number
10%5% 20%15%0% 30%25% 50%45%40%35%
Insurance company
Outsourced CIO
Endowment /Foundation
Investment consultant /Advisor
Fund of funds /Asset manager
Family office /Multi-family office
Pension fund(public & private)
39%
21%11%
15%10%
6%11%
5%21%
5%
2%
3%
1%
2%
HF AUM
Number
47%
2%
Private bank /Wealth manager
Investment consultant /Advisor
Family office /Multi-family office
Fund of funds /Asset manager
Sovereign wealth fund17%
39%62%
6%7%
1%
3%
1%10%
HF AUM
Number
53%
20%10% 40%30%0% 60%50% 70%
Insurance company
Source: 2016 Deutsche Bank Alternative Investment Survey
Source: 2016 Deutsche Bank Alternative Investment Survey
Deutsche Bank 2016 Alternative Investment Survey February 2016
10
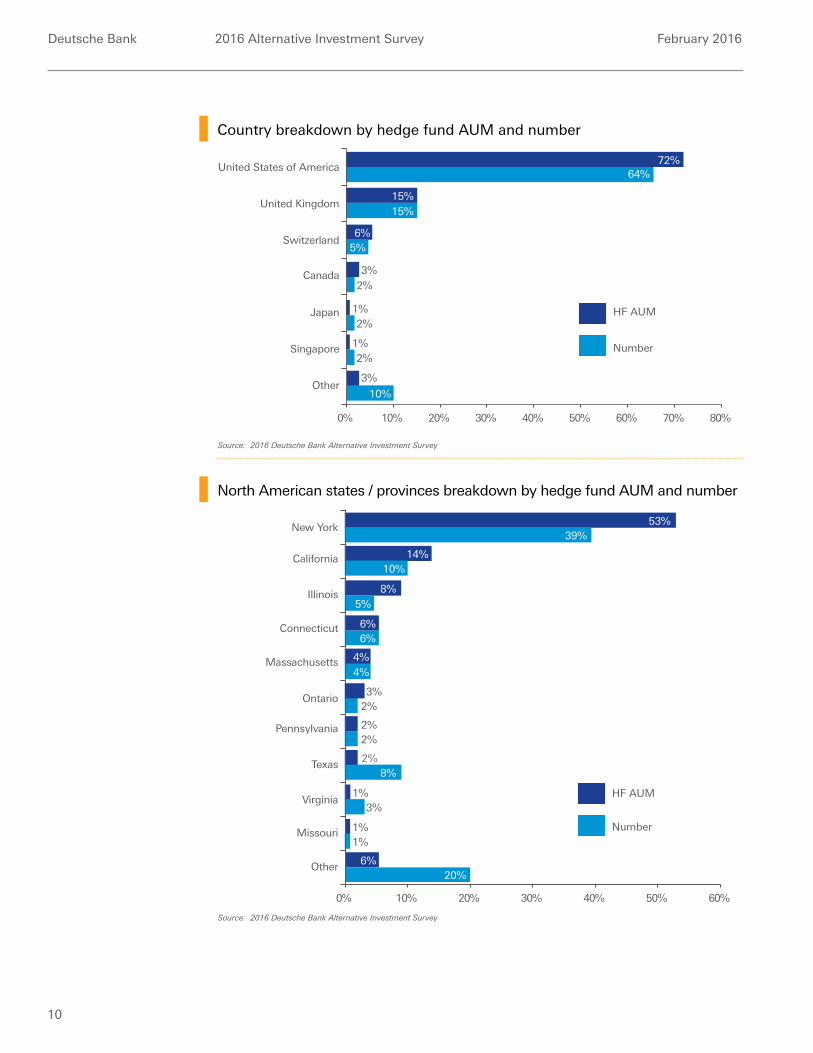
Country breakdown by hedge fund AUM and number
North American states / provinces breakdown by hedge fund AUM and number
Source: 2016 Deutsche Bank Alternative Investment Survey
Source: 2016 Deutsche Bank Alternative Investment Survey
Other
Singapore
Japan
Switzerland
United Kingdom
20%10% 40%30%0% 60%50% 70% 80%
50%
15%
6%5%
Canada 3%
3%
2%
2%1%
2%1%
10%
HF AUM
Number
15%
United States of America64%
72%
Ontario
Other
Virginia
Texas
Pennsylvania
California
Illinois
20%10% 40%30%0% 50% 60%
50%
5%
6%6%
Connecticut
Massachusetts 4%4%
3%2%
2%2%
2%8%
1%3%
6%20%
HF AUM
Number
8%
10%14%
New York39%
53%
Missouri 1%1%

Deutsche Bank 2016 Alternative Investment Survey February 2016
11
Performance trends & predictions
11
Deutsche Bank 2016 Alternative Investment Survey February 2016
12
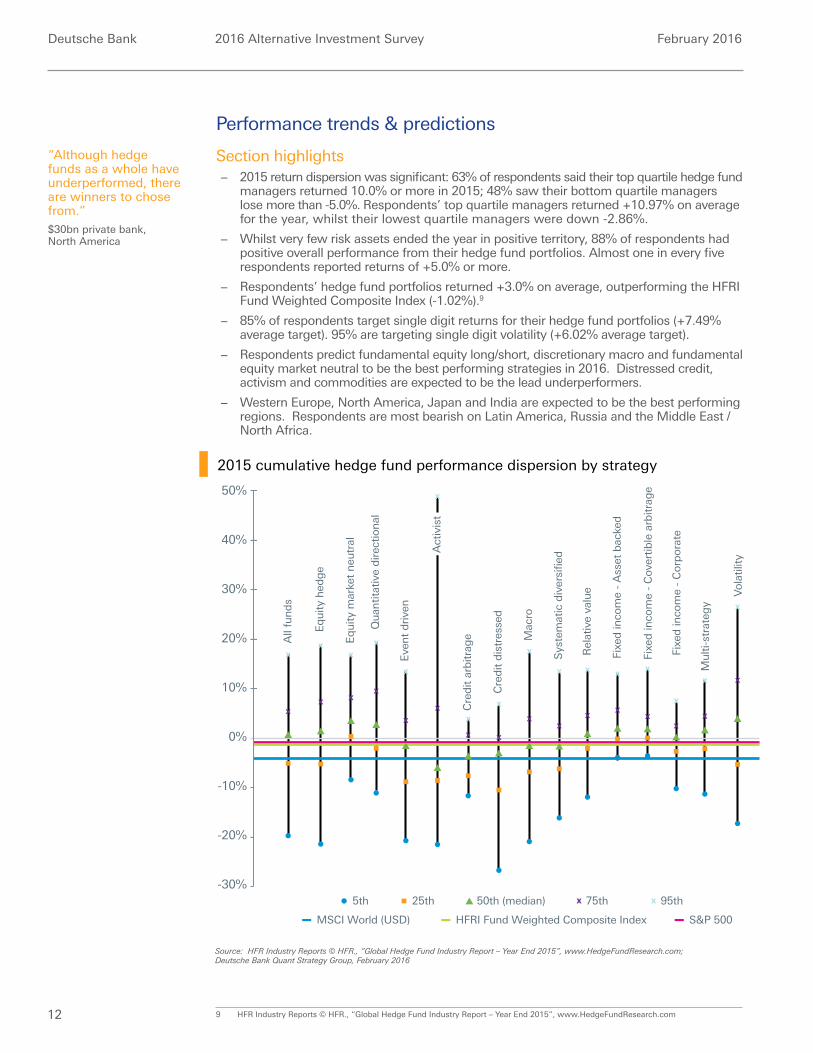
Performance trends & predictions
Section highlights − 2015 return dispersion was significant: 63% of respondents said their top quartile hedge fund
managers returned 10.0% or more in 2015; 48% saw their bottom quartile managers lose more than -5.0%. Respondents’ top quartile managers returned +10.97% on average for the year, whilst their lowest quartile managers were down -2.86%.
− Whilst very few risk assets ended the year in positive territory, 88% of respondents had positive overall performance from their hedge fund portfolios. Almost one in every five respondents reported returns of +5.0% or more.
− Respondents’ hedge fund portfolios returned +3.0% on average, outperforming the HFRI Fund Weighted Composite Index (-1.02%).9
− 85% of respondents target single digit returns for their hedge fund portfolios (+7.49% average target). 95% are targeting single digit volatility (+6.02% average target).
− Respondents predict fundamental equity long/short, discretionary macro and fundamental equity market neutral to be the best performing strategies in 2016. Distressed credit, activism and commodities are expected to be the lead underperformers.
− Western Europe, North America, Japan and India are expected to be the best performing regions. Respondents are most bearish on Latin America, Russia and the Middle East / North Africa.
9 HFR Industry Reports © HFR., “Global Hedge Fund Industry Report – Year End 2015”, www.HedgeFundResearch.com
5th 50th (median)25th 75th
MSCI World (USD) HFRI Fund Weighted Composite Index S&P 500
95th
0%
-10%
20%
10%
30%
-20%
-30%
40%
50%
Fixe
d in
com
e -
Ass
et b
acke
d
Sys
tem
atic
div
ersi
fied
Mac
ro
Qu
antit
ativ
e d
irec
tion
al
Act
ivis
t
Eve
nt
dri
ven
Cre
dit
dis
tres
sed
Cre
dit
arb
itrag
eEq
uity
mar
ket
neu
tral
Eq
uity
hed
ge
All
fun
ds
Fixe
d in
com
e -
Cov
ertib
le a
rbitr
age
Fixe
d in
com
e -
Corp
ora
te
Mu
lti-s
trat
egy
Vola
tility
Rel
ativ
e va
lue
2015 cumulative hedge fund performance dispersion by strategy
Source: HFR Industry Reports © HFR., “Global Hedge Fund Industry Report – Year End 2015”, www.HedgeFundResearch.com; Deutsche Bank Quant Strategy Group, February 2016
“Although hedge funds as a whole have underperformed, there are winners to chose from.”$30bn private bank, North America
Deutsche Bank 2016 Alternative Investment Survey February 2016
13
12.5-15%
10-12.5%
5-7.5%
Greater than 15%
7.5-10%
2.5-5%
0-2.5%
Less than 0%
13%
4%
34%
4%
45%
4%1%
4%
32%
34%
10%
16%
32%
14%
4%
12%
35%
13%
1%4%
2%
12%
30%
100%
90%
80%
70%
0%
60%
50%
40%
30%
20%
10%
Inves
tmen
t con
sulta
nt /
Adviso
r
Pens
ion fu
nd
(publi
c & pr
ivate)
All res
pond
ents
Endo
wmen
t /
Foun
datio
n
Insura
nce c
ompa
ny
Fund
of fu
nds /
Asset
man
ager
Fam
ily of
fice /
Mult
i-fam
ily of
fice
37%
18%
4%
16%
31%
31%
17%
33%
29%
15%
4%
15%
42%
19%
11%
28%
39%
22%
Private
bank
/
Wea
lth m
anag
er
17%
1%1%1% 1% 4% 4%
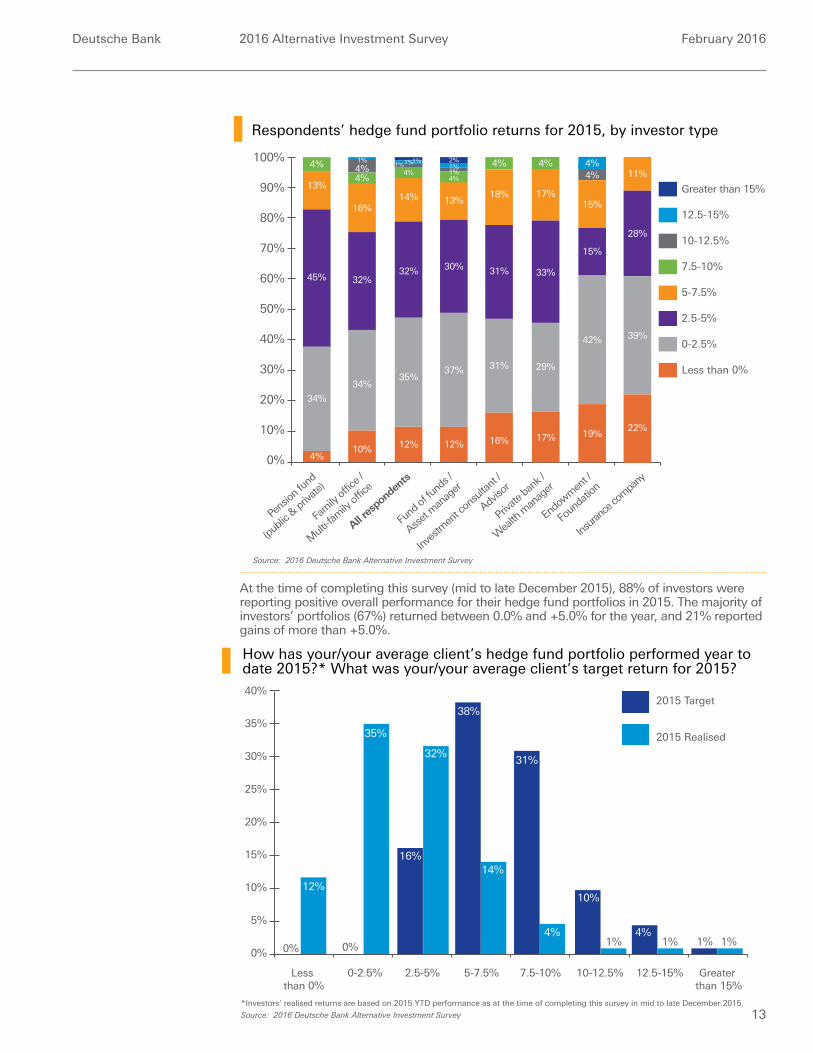
Respondents’ hedge fund portfolio returns for 2015, by investor type
Source: 2016 Deutsche Bank Alternative Investment Survey
15%
10%
5%
0%
20%
0%
12%
0%
35%
16%
32%
38%
14%
31%
4%
10%
1%
35%
30%
25%
40%
10-12.5%
4%1%
12.5-15%
1%1%
Greater than 15%
Less than 0%
0-2.5% 2.5-5% 5-7.5% 7.5-10%
2015 Target
2015 Realised
How has your/your average client’s hedge fund portfolio performed year to date 2015?* What was your/your average client’s target return for 2015?
*Investors’ realised returns are based on 2015 YTD performance as at the time of completing this survey in mid to late December 2015.
Source: 2016 Deutsche Bank Alternative Investment Survey
At the time of completing this survey (mid to late December 2015), 88% of investors were reporting positive overall performance for their hedge fund portfolios in 2015. The majority of investors’ portfolios (67%) returned between 0.0% and +5.0% for the year, and 21% reported gains of more than +5.0%.
Deutsche Bank 2016 Alternative Investment Survey February 2016
14
2015 realised return2015 target return
9%
8%
6.71%
3.22%
6.47%
2.66%
7.42%
3.06%
7.45%
3.00%
7.38%
2.73%
6.81%
1.94%
7.60%
2.69%
8.31%
3.34%
0%
7%
6%
5%
4%
3%
2%
1%
Inves
tmen
t con
sulta
nt /
Adviso
r
Insura
nce c
ompa
ny
Pens
ion fu
nd
(publi
c & pr
ivate)
All res
pond
ents
Private
bank
/
Wea
lth m
anag
er
Endo
wmen
t /
Foun
datio
n
Fund
of fu
nds /
Asset
man
ager
Fam
ily of
fice /
Mult
i-fam
ily of
fice
Ave
rag
e re
turn
(%)
349b
ps
381b
ps 43
6bp
s
445b
ps
465b
ps
487b
ps 49
1bp
s 497b
ps
Respondents’ hedge fund portfolios returned +3.00% on average in 2015 (median: +3.75%)
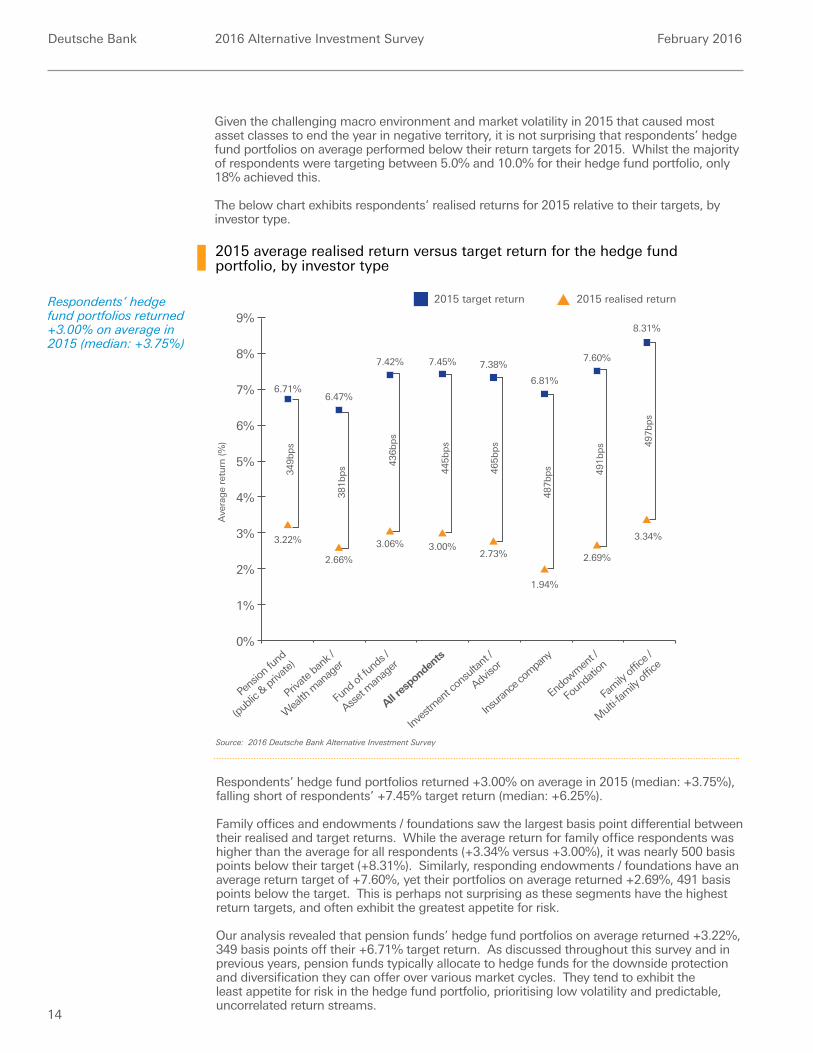
Given the challenging macro environment and market volatility in 2015 that caused most asset classes to end the year in negative territory, it is not surprising that respondents’ hedge fund portfolios on average performed below their return targets for 2015. Whilst the majority of respondents were targeting between 5.0% and 10.0% for their hedge fund portfolio, only 18% achieved this.
The below chart exhibits respondents’ realised returns for 2015 relative to their targets, by investor type.
2015 average realised return versus target return for the hedge fund portfolio, by investor type
Source: 2016 Deutsche Bank Alternative Investment Survey
Respondents’ hedge fund portfolios returned +3.00% on average in 2015 (median: +3.75%), falling short of respondents’ +7.45% target return (median: +6.25%).
Family offices and endowments / foundations saw the largest basis point differential between their realised and target returns. While the average return for family office respondents was higher than the average for all respondents (+3.34% versus +3.00%), it was nearly 500 basis points below their target (+8.31%). Similarly, responding endowments / foundations have an average return target of +7.60%, yet their portfolios on average returned +2.69%, 491 basis points below the target. This is perhaps not surprising as these segments have the highest return targets, and often exhibit the greatest appetite for risk.
Our analysis revealed that pension funds’ hedge fund portfolios on average returned +3.22%, 349 basis points off their +6.71% target return. As discussed throughout this survey and in previous years, pension funds typically allocate to hedge funds for the downside protection and diversification they can offer over various market cycles. They tend to exhibit the least appetite for risk in the hedge fund portfolio, prioritising low volatility and predictable, uncorrelated return streams.
Deutsche Bank 2016 Alternative Investment Survey February 2016
15
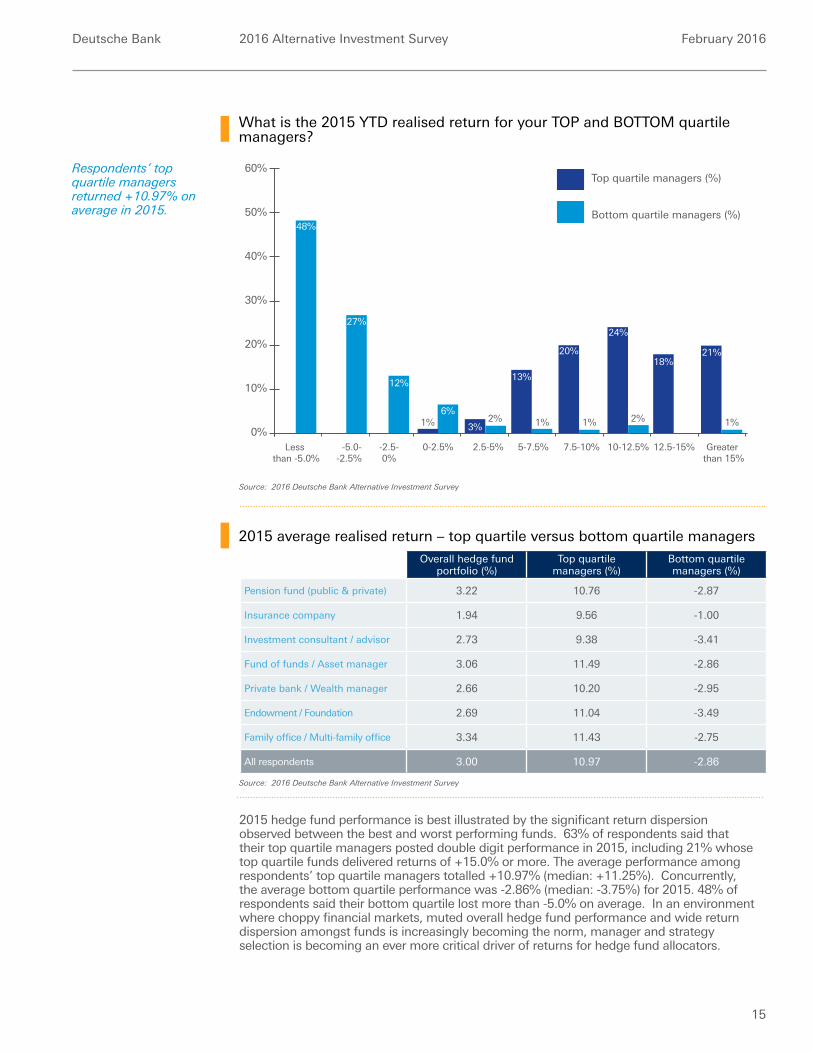
2015 average realised return – top quartile versus bottom quartile managers
Source: 2016 Deutsche Bank Alternative Investment Survey
Source: 2016 Deutsche Bank Alternative Investment Survey
What is the 2015 YTD realised return for your TOP and BOTTOM quartile managers?
Respondents’ top quartile managers returned +10.97% on average in 2015.
10%
0%
20%
12%
1% 2% 1%6%
3%
13%
20%
24%
2%
50%
40%
30%
60%
10-12.5%
18%
12.5-15%
1%
21%
Greater than 15%
-2.5-0%
0-2.5% 2.5-5% 5-7.5% 7.5-10%
48%
27%
Less than -5.0%
-5.0--2.5%
Top quartile managers (%)
Bottom quartile managers (%)
1%
Overall hedge fund portfolio (%)
Top quartile managers (%)
Bottom quartile managers (%)
Pension fund (public & private) 3.22 10.76 -2.87
Insurance company 1.94 9.56 -1.00
Investment consultant / advisor 2.73 9.38 -3.41
Fund of funds / Asset manager 3.06 11.49 -2.86
Private bank / Wealth manager 2.66 10.20 -2.95
Endowment / Foundation 2.69 11.04 -3.49
Family office / Multi-family office 3.34 11.43 -2.75
All respondents 3.00 10.97 -2.86
2015 hedge fund performance is best illustrated by the significant return dispersion observed between the best and worst performing funds. 63% of respondents said that their top quartile managers posted double digit performance in 2015, including 21% whose top quartile funds delivered returns of +15.0% or more. The average performance among respondents’ top quartile managers totalled +10.97% (median: +11.25%). Concurrently, the average bottom quartile performance was -2.86% (median: -3.75%) for 2015. 48% of respondents said their bottom quartile lost more than -5.0% on average. In an environment where choppy financial markets, muted overall hedge fund performance and wide return dispersion amongst funds is increasingly becoming the norm, manager and strategy selection is becoming an ever more critical driver of returns for hedge fund allocators.
Deutsche Bank 2016 Alternative Investment Survey February 2016
16
15%
10%
5%
0%
20%
2%7%
35%
47%
39%
29%
18%
12%
3%2%
35%
30%
25%
45%
40%
50%
10-12.5%
1%1%
12.5-15%
1%1%
Greater than 15%
0-2.5% 2.5-5% 5-7.5% 7.5-10%
Target volatility
Realised volatility
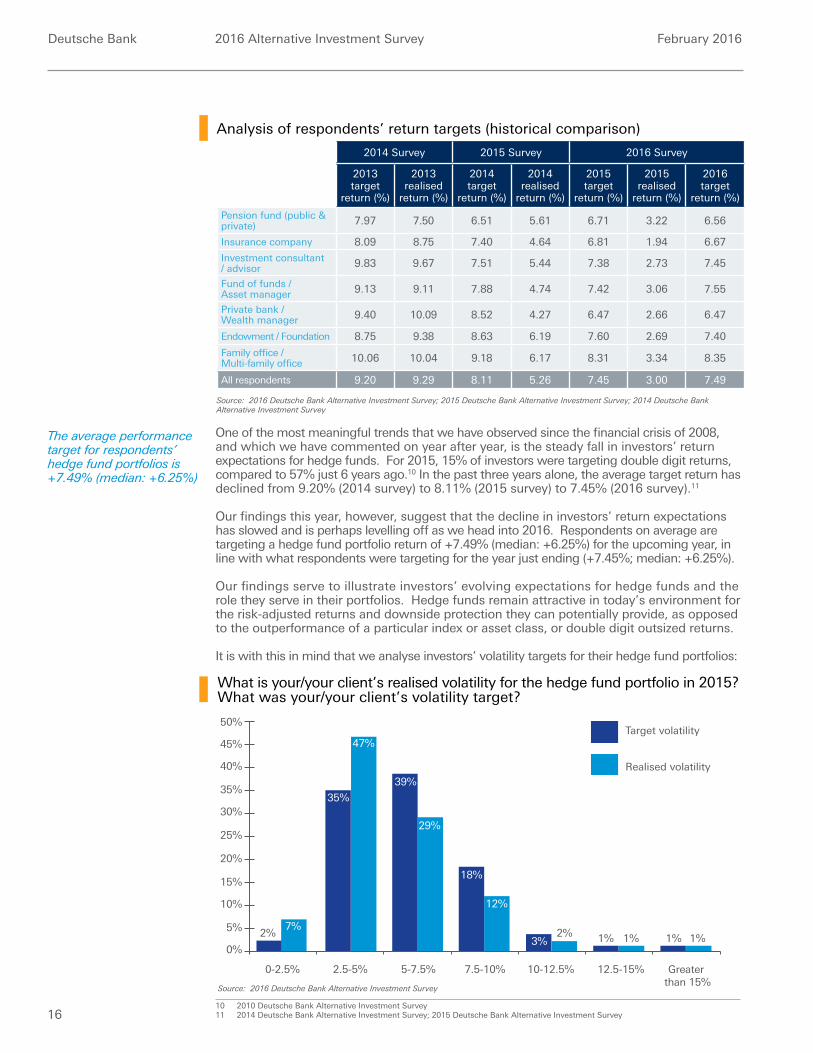
What is your/your client’s realised volatility for the hedge fund portfolio in 2015?What was your/your client’s volatility target?
Source: 2016 Deutsche Bank Alternative Investment Survey
Source: 2016 Deutsche Bank Alternative Investment Survey; 2015 Deutsche Bank Alternative Investment Survey; 2014 Deutsche Bank Alternative Investment Survey
Analysis of respondents’ return targets (historical comparison)
2014 Survey 2015 Survey 2016 Survey
2013 target
return (%)
2013 realised
return (%)
2014 target
return (%)
2014 realised
return (%)
2015 target
return (%)
2015 realised
return (%)
2016 target
return (%)
Pension fund (public & private) 7.97 7.50 6.51 5.61 6.71 3.22 6.56
Insurance company 8.09 8.75 7.40 4.64 6.81 1.94 6.67
Investment consultant / advisor 9.83 9.67 7.51 5.44 7.38 2.73 7.45
Fund of funds / Asset manager 9.13 9.11 7.88 4.74 7.42 3.06 7.55
Private bank / Wealth manager 9.40 10.09 8.52 4.27 6.47 2.66 6.47
Endowment / Foundation 8.75 9.38 8.63 6.19 7.60 2.69 7.40
Family office / Multi-family office 10.06 10.04 9.18 6.17 8.31 3.34 8.35
All respondents 9.20 9.29 8.11 5.26 7.45 3.00 7.49
One of the most meaningful trends that we have observed since the financial crisis of 2008, and which we have commented on year after year, is the steady fall in investors’ return expectations for hedge funds. For 2015, 15% of investors were targeting double digit returns, compared to 57% just 6 years ago.10 In the past three years alone, the average target return has declined from 9.20% (2014 survey) to 8.11% (2015 survey) to 7.45% (2016 survey).11
Our findings this year, however, suggest that the decline in investors’ return expectations has slowed and is perhaps levelling off as we head into 2016. Respondents on average are targeting a hedge fund portfolio return of +7.49% (median: +6.25%) for the upcoming year, in line with what respondents were targeting for the year just ending (+7.45%; median: +6.25%).
Our findings serve to illustrate investors’ evolving expectations for hedge funds and the role they serve in their portfolios. Hedge funds remain attractive in today’s environment for the risk-adjusted returns and downside protection they can potentially provide, as opposed to the outperformance of a particular index or asset class, or double digit outsized returns.
It is with this in mind that we analyse investors’ volatility targets for their hedge fund portfolios:
10 2010 Deutsche Bank Alternative Investment Survey 11 2014 Deutsche Bank Alternative Investment Survey; 2015 Deutsche Bank Alternative Investment Survey
The average performance target for respondents’ hedge fund portfolios is +7.49% (median: +6.25%)
Deutsche Bank 2016 Alternative Investment Survey February 2016
17
Target volatility (%) Realised volatility (%)
Pension fund (public & private) 5.91 4.36
Insurance company 4.67 3.88
Investment consultant / advisor 6.30 5.98
Fund of funds / Asset manager 5.59 4.97
Private bank / Wealth manager 5.45 5.49
Endowment / Foundation 7.50 7.50
Family office / Multi-family office 6.91 6.01
All respondents 6.02 5.33
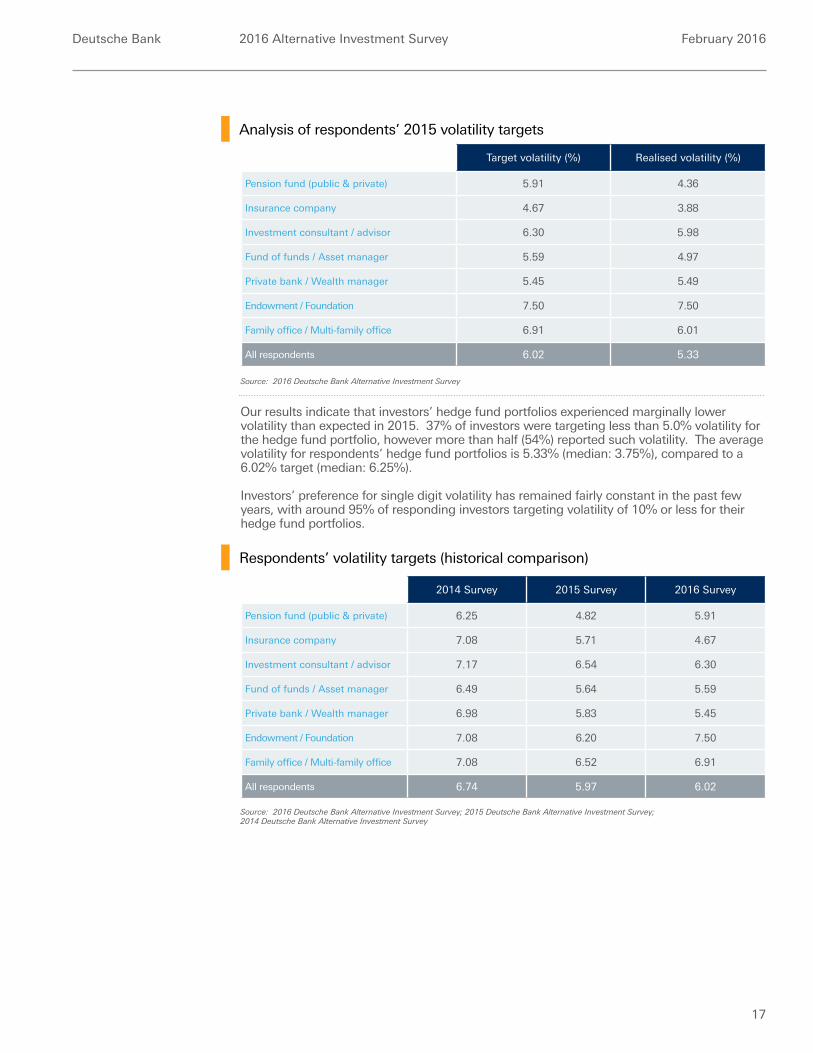
Our results indicate that investors’ hedge fund portfolios experienced marginally lower volatility than expected in 2015. 37% of investors were targeting less than 5.0% volatility for the hedge fund portfolio, however more than half (54%) reported such volatility. The average volatility for respondents’ hedge fund portfolios is 5.33% (median: 3.75%), compared to a 6.02% target (median: 6.25%).
Investors’ preference for single digit volatility has remained fairly constant in the past few years, with around 95% of responding investors targeting volatility of 10% or less for their hedge fund portfolios.
2014 Survey 2015 Survey 2016 Survey
Pension fund (public & private) 6.25 4.82 5.91
Insurance company 7.08 5.71 4.67
Investment consultant / advisor 7.17 6.54 6.30
Fund of funds / Asset manager 6.49 5.64 5.59
Private bank / Wealth manager 6.98 5.83 5.45
Endowment / Foundation 7.08 6.20 7.50
Family office / Multi-family office 7.08 6.52 6.91
All respondents 6.74 5.97 6.02
Source: 2016 Deutsche Bank Alternative Investment Survey
Source: 2016 Deutsche Bank Alternative Investment Survey; 2015 Deutsche Bank Alternative Investment Survey; 2014 Deutsche Bank Alternative Investment Survey
Analysis of respondents’ 2015 volatility targets
Respondents’ volatility targets (historical comparison)
Deutsche Bank 2016 Alternative Investment Survey February 2016
18
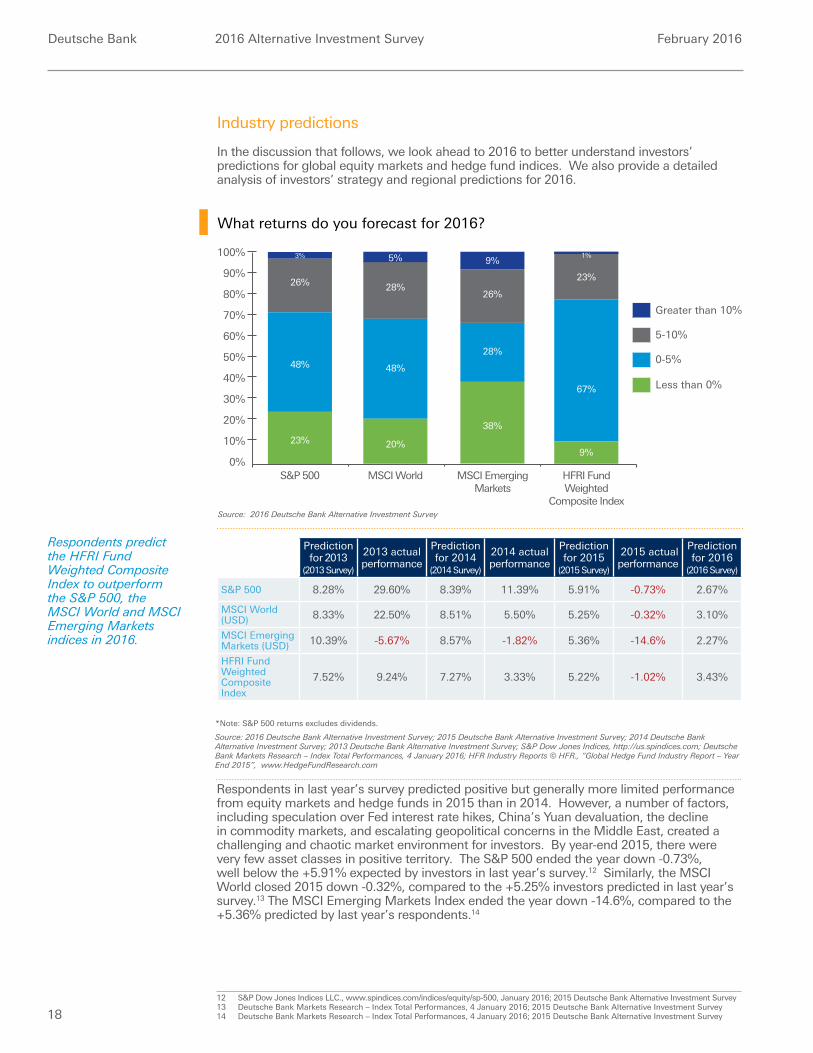
Industry predictions
In the discussion that follows, we look ahead to 2016 to better understand investors’ predictions for global equity markets and hedge fund indices. We also provide a detailed analysis of investors’ strategy and regional predictions for 2016.
Prediction for 2013
(2013 Survey)
2013 actual performance
Prediction for 2014
(2014 Survey)
2014 actual performance
Prediction for 2015
(2015 Survey)
2015 actual performance
Prediction for 2016
(2016 Survey)
S&P 500 8.28% 29.60% 8.39% 11.39% 5.91% -0.73% 2.67%
MSCI World (USD) 8.33% 22.50% 8.51% 5.50% 5.25% -0.32% 3.10%
MSCI Emerging Markets (USD) 10.39% -5.67% 8.57% -1.82% 5.36% -14.6% 2.27%
HFRI Fund Weighted Composite Index
7.52% 9.24% 7.27% 3.33% 5.22% -1.02% 3.43%
Respondents in last year’s survey predicted positive but generally more limited performance from equity markets and hedge funds in 2015 than in 2014. However, a number of factors, including speculation over Fed interest rate hikes, China’s Yuan devaluation, the decline in commodity markets, and escalating geopolitical concerns in the Middle East, created a challenging and chaotic market environment for investors. By year-end 2015, there were very few asset classes in positive territory. The S&P 500 ended the year down -0.73%, well below the +5.91% expected by investors in last year’s survey.12 Similarly, the MSCI World closed 2015 down -0.32%, compared to the +5.25% investors predicted in last year’s survey.13 The MSCI Emerging Markets Index ended the year down -14.6%, compared to the +5.36% predicted by last year’s respondents.14
12 S&P Dow Jones Indices LLC., www.spindices.com/indices/equity/sp-500, January 2016; 2015 Deutsche Bank Alternative Investment Survey13 Deutsche Bank Markets Research – Index Total Performances, 4 January 2016; 2015 Deutsche Bank Alternative Investment Survey14 Deutsche Bank Markets Research – Index Total Performances, 4 January 2016; 2015 Deutsche Bank Alternative Investment Survey
38%
Greater than 10%
5-10%
0-5%
Less than 0%
S&P 500 MSCI World HFRI FundWeighted
Composite Index
3%
26%
48%
23%
23%
67%
9%
100%
90%
80%
70%
0%
60%
50%
40%
30%
20%
10%
9%
26%
28%
MSCI EmergingMarkets
5%
28%
48%
20%
1%
What returns do you forecast for 2016?
Source: 2016 Deutsche Bank Alternative Investment Survey
Source: 2016 Deutsche Bank Alternative Investment Survey; 2015 Deutsche Bank Alternative Investment Survey; 2014 Deutsche Bank Alternative Investment Survey; 2013 Deutsche Bank Alternative Investment Survey; S&P Dow Jones Indices, http://us.spindices.com; Deutsche Bank Markets Research – Index Total Performances, 4 January 2016; HFR Industry Reports © HFR., “Global Hedge Fund Industry Report – Year End 2015”, www.HedgeFundResearch.com
*Note: S&P 500 returns excludes dividends.
Respondents predict the HFRI Fund Weighted Composite Index to outperform the S&P 500, the MSCI World and MSCI Emerging Markets indices in 2016.
Deutsche Bank 2016 Alternative Investment Survey February 2016
19
Looking ahead to 2016, weakened global growth, heightened geopolitical risk and uncertain central bank monetary policy stances suggest that the highly volatile, low return environment is set to continue. Investors appear conservative in their outlook for global equity markets, with almost half (48%) predicting returns of between 0.0% and +5.0% for the S&P 500 index and MSCI World. Investors’ 2016 performance prediction for the S&P 500 Index (+2.67%) is below the estimated +10% forecasted by Deutsche Bank for the Index in 2016.15 Respondents diverge in their outlook for emerging markets: 38% predict the MSCI Emerging Markets Index to end the year in negative territory, 28% predict moderate returns between 0.0% and 5.0%, and almost one in every ten investors expect returns in excess of +10.0%. On average, respondents predict the MSCI Emerging Markets Index to return +2.27%.
In contrast to investors’ predictions in our last three surveys, respondents this year predict hedge funds to outperform all three of the aforementioned benchmarks. Respondents expect the HFRI Fund Weighted Composite Index to return +3.43% in 2016.
If the month of January and the first few weeks of February in 2016 are anything to go by, where plummeting oil prices and events in China have driven risk assets sharply lower, financial markets in 2016 will likely continue to be dictated by significant volatility and macro uncertainty.
15 Deutsche Bank Markets Research – US Equity Insights, “A long year ahead for the S&P500”, 10 January 2016
Deutsche Bank 2016 Alternative Investment Survey February 2016
20
Multi-strategy
Credit distressed
Fundamental equity market neutral
Quant macro
Quant equity market neutral
Commodities
Sector – Healthcare
Activism
Credit structured
Sector – Energy
Sector – TMT
FX trading
Volatility trading
Credit long/short
Quant equity
Sector – Financials
Fixed income
CTA
Event driven
Fundamental equity long/short
Discretionary macro
20% 30% 40%35%10% 25%0% 5%
40%
35%
24%
23%
17%
17%
15%
14%
11%
10%
10%
10%
8%
7%
7%
6%
5%
5%
4%
Quant multi-strategy
Short only / Short bias
4%
4%
4%
3%
3%
15%
Sector – Consumer
Tail risk protection
Credit multi-strategy
Credit relative value
3%
Niche
Other
3%
2%
2%
1%
0%Convertible arbitrage
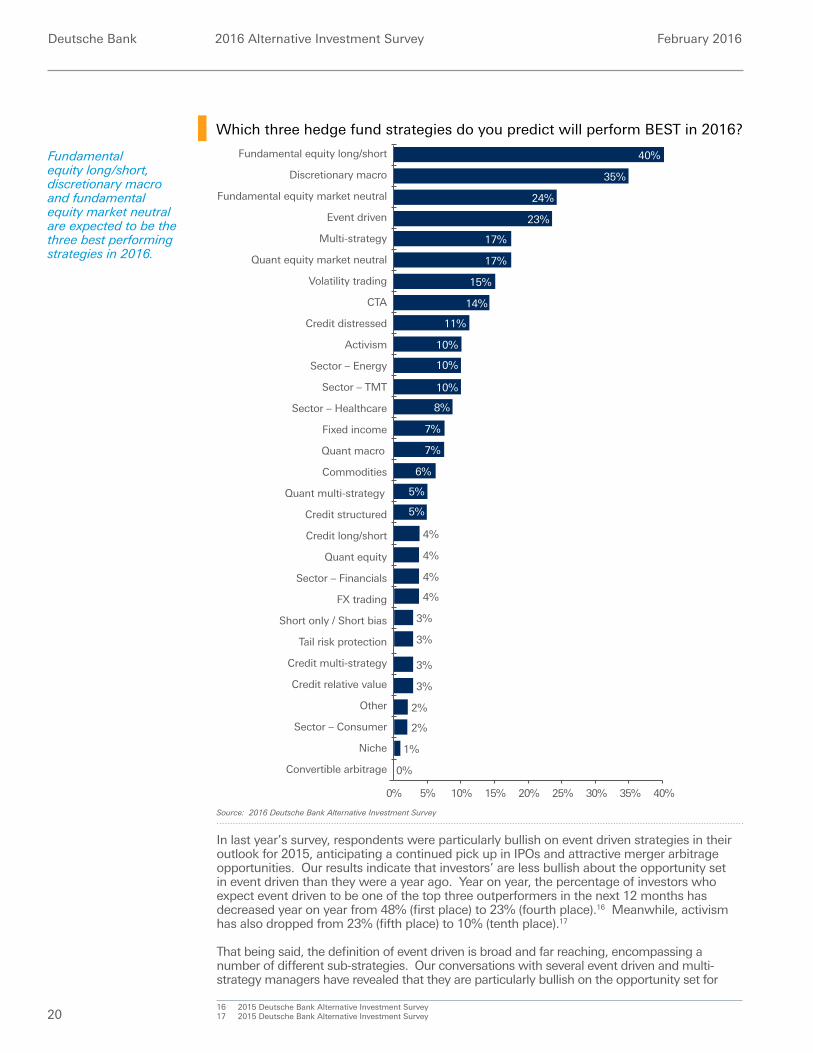
Which three hedge fund strategies do you predict will perform BEST in 2016?
Source: 2016 Deutsche Bank Alternative Investment Survey
In last year’s survey, respondents were particularly bullish on event driven strategies in their outlook for 2015, anticipating a continued pick up in IPOs and attractive merger arbitrage opportunities. Our results indicate that investors’ are less bullish about the opportunity set in event driven than they were a year ago. Year on year, the percentage of investors who expect event driven to be one of the top three outperformers in the next 12 months has decreased year on year from 48% (first place) to 23% (fourth place).16 Meanwhile, activism has also dropped from 23% (fifth place) to 10% (tenth place).17
That being said, the definition of event driven is broad and far reaching, encompassing a number of different sub-strategies. Our conversations with several event driven and multi-strategy managers have revealed that they are particularly bullish on the opportunity set for
16 2015 Deutsche Bank Alternative Investment Survey17 2015 Deutsche Bank Alternative Investment Survey
Fundamental equity long/short, discretionary macro and fundamental equity market neutral are expected to be the three best performing strategies in 2016.
Deutsche Bank 2016 Alternative Investment Survey February 2016
21
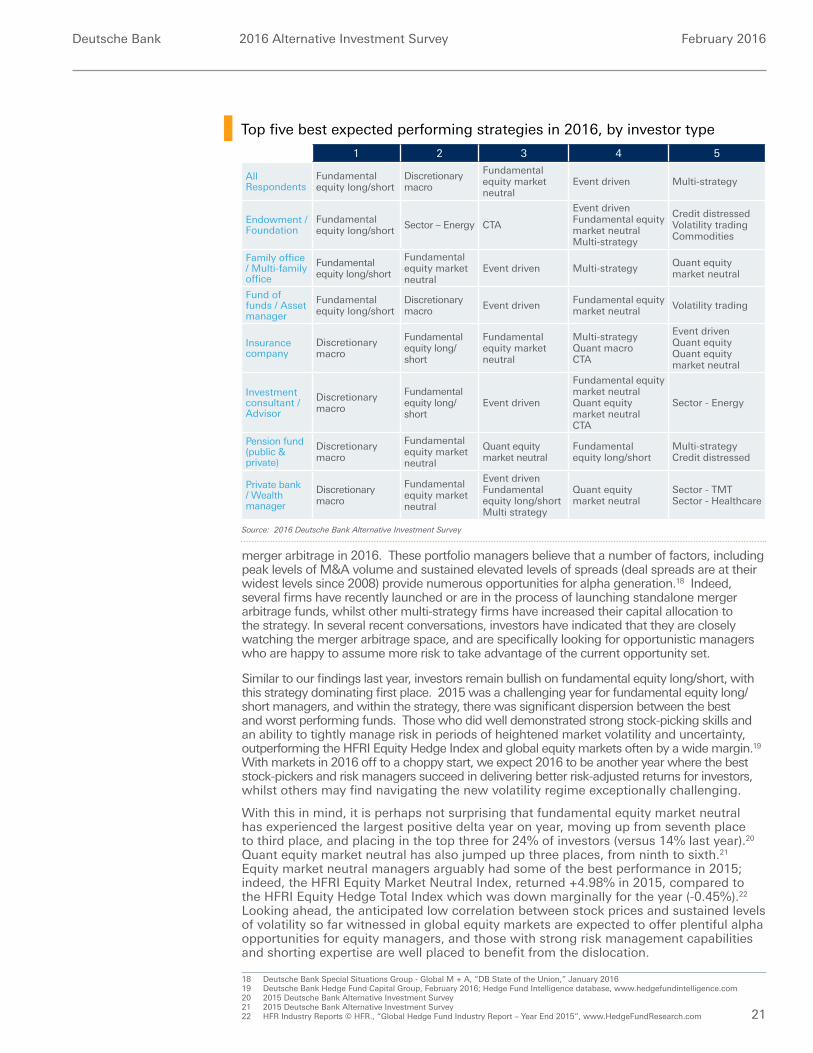
Top five best expected performing strategies in 2016, by investor type
1 2 3 4 5
All Respondents
Fundamental equity long/short
Discretionary macro
Fundamental equity market neutral
Event driven Multi-strategy
Endowment / Foundation
Fundamental equity long/short Sector – Energy CTA
Event driven Fundamental equity market neutral Multi-strategy
Credit distressed Volatility trading Commodities
Family office / Multi-family office
Fundamental equity long/short
Fundamental equity market neutral
Event driven Multi-strategy Quant equity market neutral
Fund of funds / Asset manager
Fundamental equity long/short
Discretionary macro Event driven Fundamental equity
market neutral Volatility trading
Insurance company
Discretionary macro
Fundamental equity long/short
Fundamental equity market neutral
Multi-strategy Quant macro CTA
Event driven Quant equity Quant equity market neutral
Investment consultant / Advisor
Discretionary macro
Fundamental equity long/short
Event driven
Fundamental equity market neutral Quant equity market neutral CTA
Sector - Energy
Pension fund (public & private)
Discretionary macro
Fundamental equity market neutral
Quant equity market neutral
Fundamental equity long/short
Multi-strategy Credit distressed
Private bank / Wealth manager
Discretionary macro
Fundamental equity market neutral
Event driven Fundamental equity long/short Multi strategy
Quant equity market neutral
Sector - TMT Sector - Healthcare
Source: 2016 Deutsche Bank Alternative Investment Survey
merger arbitrage in 2016. These portfolio managers believe that a number of factors, including peak levels of M&A volume and sustained elevated levels of spreads (deal spreads are at their widest levels since 2008) provide numerous opportunities for alpha generation.18 Indeed, several firms have recently launched or are in the process of launching standalone merger arbitrage funds, whilst other multi-strategy firms have increased their capital allocation to the strategy. In several recent conversations, investors have indicated that they are closely watching the merger arbitrage space, and are specifically looking for opportunistic managers who are happy to assume more risk to take advantage of the current opportunity set.
Similar to our findings last year, investors remain bullish on fundamental equity long/short, with this strategy dominating first place. 2015 was a challenging year for fundamental equity long/short managers, and within the strategy, there was significant dispersion between the best and worst performing funds. Those who did well demonstrated strong stock-picking skills and an ability to tightly manage risk in periods of heightened market volatility and uncertainty, outperforming the HFRI Equity Hedge Index and global equity markets often by a wide margin.19 With markets in 2016 off to a choppy start, we expect 2016 to be another year where the best stock-pickers and risk managers succeed in delivering better risk-adjusted returns for investors, whilst others may find navigating the new volatility regime exceptionally challenging.
With this in mind, it is perhaps not surprising that fundamental equity market neutral has experienced the largest positive delta year on year, moving up from seventh place to third place, and placing in the top three for 24% of investors (versus 14% last year).20 Quant equity market neutral has also jumped up three places, from ninth to sixth.21 Equity market neutral managers arguably had some of the best performance in 2015; indeed, the HFRI Equity Market Neutral Index, returned +4.98% in 2015, compared to the HFRI Equity Hedge Total Index which was down marginally for the year (-0.45%).22 Looking ahead, the anticipated low correlation between stock prices and sustained levels of volatility so far witnessed in global equity markets are expected to offer plentiful alpha opportunities for equity managers, and those with strong risk management capabilities and shorting expertise are well placed to benefit from the dislocation.
18 Deutsche Bank Special Situations Group - Global M + A, “DB State of the Union,” January 201619 Deutsche Bank Hedge Fund Capital Group, February 2016; Hedge Fund Intelligence database, www.hedgefundintelligence.com20 2015 Deutsche Bank Alternative Investment Survey21 2015 Deutsche Bank Alternative Investment Survey22 HFR Industry Reports © HFR., “Global Hedge Fund Industry Report – Year End 2015”, www.HedgeFundResearch.com
Deutsche Bank 2016 Alternative Investment Survey February 2016
22
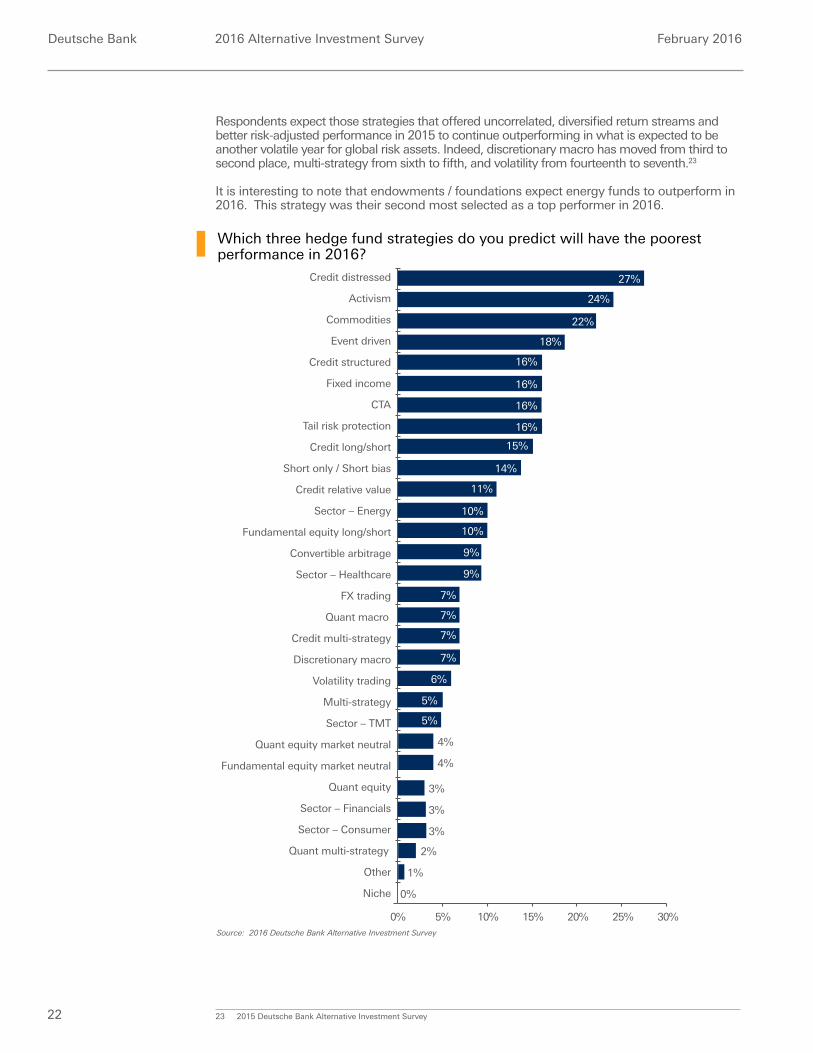
Respondents expect those strategies that offered uncorrelated, diversified return streams and better risk-adjusted performance in 2015 to continue outperforming in what is expected to be another volatile year for global risk assets. Indeed, discretionary macro has moved from third to second place, multi-strategy from sixth to fifth, and volatility from fourteenth to seventh.23
It is interesting to note that endowments / foundations expect energy funds to outperform in 2016. This strategy was their second most selected as a top performer in 2016.
23 2015 Deutsche Bank Alternative Investment Survey
Multi-strategy
Credit distressed
Fundamental equity market neutral
Fundamental equity long/short
Quant macro
Quant equity market neutral
Commodities
Sector – Healthcare
Activism
Credit structured
Sector – Energy
Sector – TMT
FX trading
Volatility trading
Credit long/short
Quant equity
Sector – Financials
Fixed income
CTA
Event driven
Discretionary macro
20% 30%10% 25%0% 5%
27%
24%
22%
18%
16%
16%
16%
16%
15%
14%
11%
10%
10%
9%
9%
7%
7%
7%
7%
Quant multi-strategy
Short only / Short bias
6%
5%
5%
4%
4%
15%
Sector – Consumer
Tail risk protection
Credit multi-strategy
Credit relative value
3%
Niche
Other
3%
3%
2%
1%
0%
Convertible arbitrage
Which three hedge fund strategies do you predict will have the poorest performance in 2016?
Source: 2016 Deutsche Bank Alternative Investment Survey
Deutsche Bank 2016 Alternative Investment Survey February 2016
23
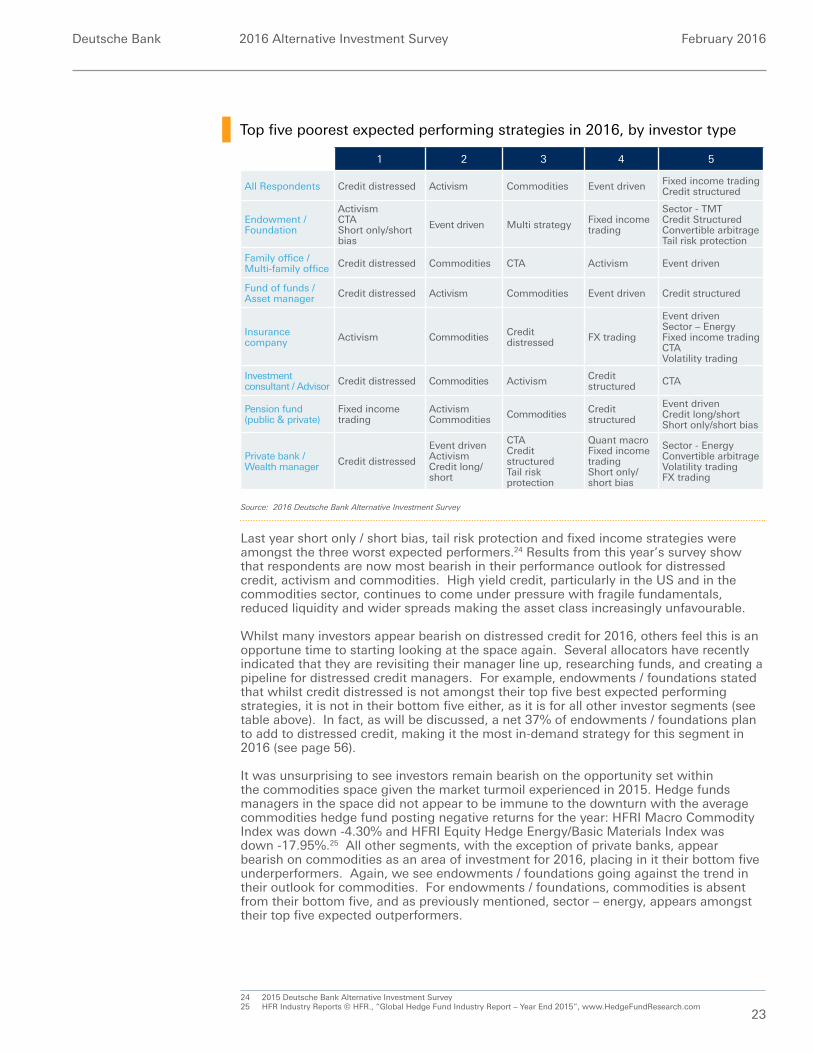
Source: 2016 Deutsche Bank Alternative Investment Survey
Top five poorest expected performing strategies in 2016, by investor type
1 2 3 4 5
All Respondents Credit distressed Activism Commodities Event driven Fixed income tradingCredit structured
Endowment / Foundation
Activism CTA Short only/short bias
Event driven Multi strategy Fixed income trading
Sector - TMT Credit StructuredConvertible arbitrageTail risk protection
Family office / Multi-family office Credit distressed Commodities CTA Activism Event driven
Fund of funds / Asset manager Credit distressed Activism Commodities Event driven Credit structured
Insurance company Activism Commodities Credit
distressed FX trading
Event driven Sector – EnergyFixed income trading CTA Volatility trading
Investment consultant / Advisor Credit distressed Commodities Activism Credit
structured CTA
Pension fund (public & private)
Fixed income trading
ActivismCommodities Commodities Credit
structured
Event driven Credit long/short Short only/short bias
Private bank / Wealth manager Credit distressed
Event driven Activism Credit long/short
CTA Credit structured Tail risk protection
Quant macro Fixed income trading Short only/short bias
Sector - Energy Convertible arbitrage Volatility trading FX trading
Last year short only / short bias, tail risk protection and fixed income strategies were amongst the three worst expected performers.24 Results from this year’s survey show that respondents are now most bearish in their performance outlook for distressed credit, activism and commodities. High yield credit, particularly in the US and in the commodities sector, continues to come under pressure with fragile fundamentals, reduced liquidity and wider spreads making the asset class increasingly unfavourable.
Whilst many investors appear bearish on distressed credit for 2016, others feel this is an opportune time to starting looking at the space again. Several allocators have recently indicated that they are revisiting their manager line up, researching funds, and creating a pipeline for distressed credit managers. For example, endowments / foundations stated that whilst credit distressed is not amongst their top five best expected performing strategies, it is not in their bottom five either, as it is for all other investor segments (see table above). In fact, as will be discussed, a net 37% of endowments / foundations plan to add to distressed credit, making it the most in-demand strategy for this segment in 2016 (see page 56).
It was unsurprising to see investors remain bearish on the opportunity set within the commodities space given the market turmoil experienced in 2015. Hedge funds managers in the space did not appear to be immune to the downturn with the average commodities hedge fund posting negative returns for the year: HFRI Macro Commodity Index was down -4.30% and HFRI Equity Hedge Energy/Basic Materials Index was down -17.95%.25 All other segments, with the exception of private banks, appear bearish on commodities as an area of investment for 2016, placing in it their bottom five underperformers. Again, we see endowments / foundations going against the trend in their outlook for commodities. For endowments / foundations, commodities is absent from their bottom five, and as previously mentioned, sector – energy, appears amongst their top five expected outperformers.
24 2015 Deutsche Bank Alternative Investment Survey25 HFR Industry Reports © HFR., “Global Hedge Fund Industry Report – Year End 2015”, www.HedgeFundResearch.com
Deutsche Bank 2016 Alternative Investment Survey February 2016
24
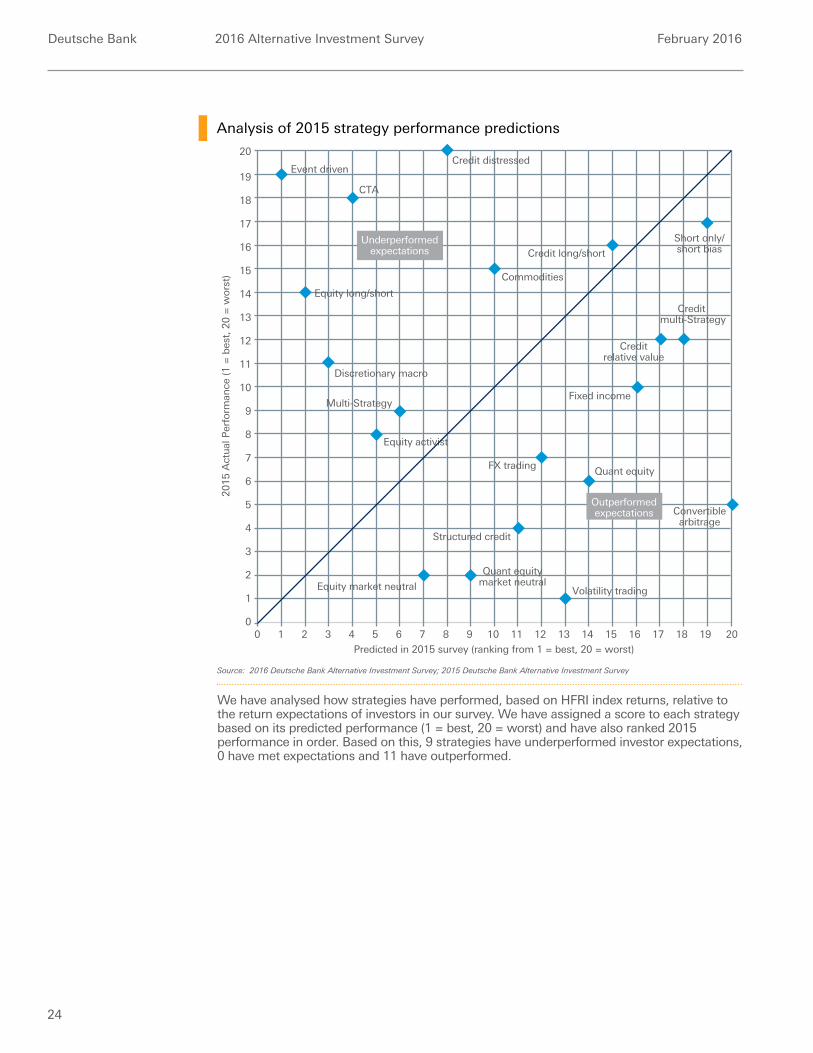
We have analysed how strategies have performed, based on HFRI index returns, relative to the return expectations of investors in our survey. We have assigned a score to each strategy based on its predicted performance (1 = best, 20 = worst) and have also ranked 2015 performance in order. Based on this, 9 strategies have underperformed investor expectations, 0 have met expectations and 11 have outperformed.
Predicted in 2015 survey (ranking from 1 = best, 20 = worst)
2015
Act
ual
Per
form
ance
(1 =
bes
t, 2
0 =
wor
st)
12
2
1
12
4
3
6
5
00
11
10
9
8
7
15
14
13
16
17
18
19
20
1110987654321 151413 16 1817 19 20
CTA
Equity activist
Equity market neutral
Convertiblearbitrage
Fixed income
Quant equity
Quant equitymarket neutral
FX trading
Outperformedexpectations
Structured credit
Credit long/short
Event driven
Equity long/short
Discretionary macro
Credit multi-Strategy
Creditrelative value
Volatility trading
Commodities
Underperformedexpectations
Credit distressed
Short only/short bias
Multi-Strategy
Analysis of 2015 strategy performance predictions
Source: 2016 Deutsche Bank Alternative Investment Survey; 2015 Deutsche Bank Alternative Investment Survey
Deutsche Bank 2016 Alternative Investment Survey February 2016
25
Eastern and Central Europe (ex-Russia)
BRIC
Sub-Saharan Africa
Russia
Asia including Japan
Western Europe
Asia ex-Japan
Japan
China
Latin America
India
United States / Canada
40% 60%20% 30%0% 10%
57%
55%
31%
21%
14%
11%
11%
11%
7%
South Africa
Middle East / North Africa
6%
6%
3%
2%
1%
50%
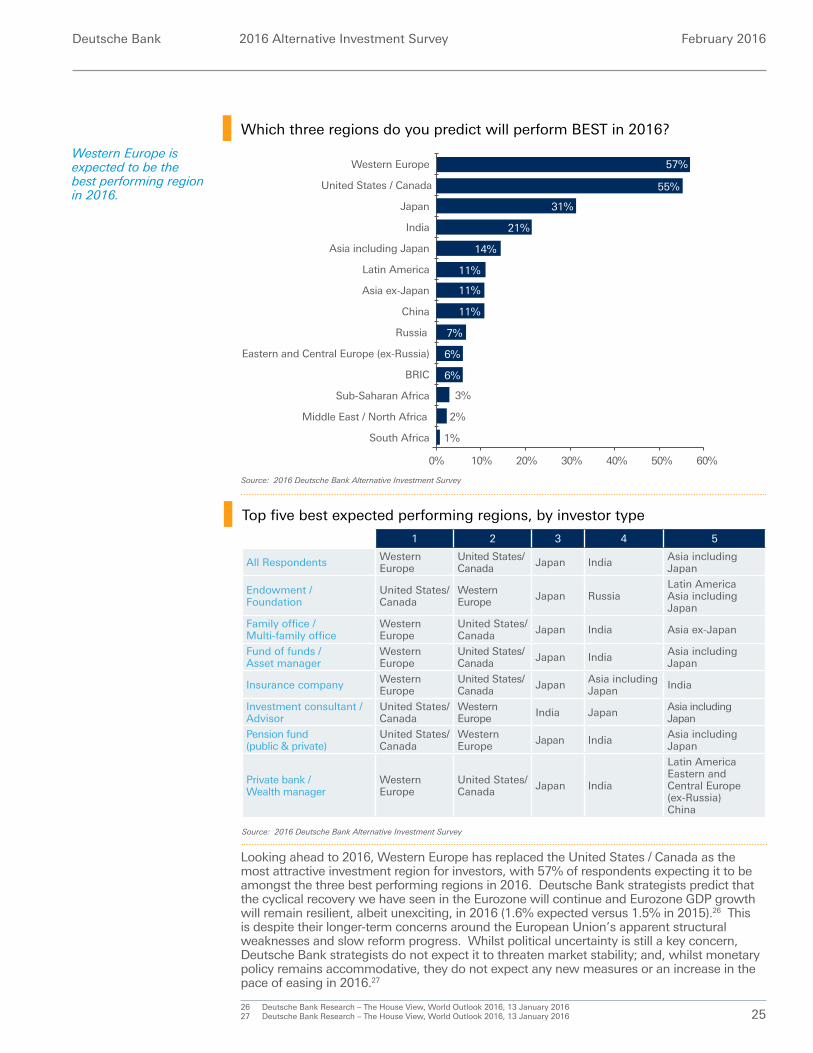
Which three regions do you predict will perform BEST in 2016?
Source: 2016 Deutsche Bank Alternative Investment Survey
Top five best expected performing regions, by investor type
1 2 3 4 5
All Respondents Western Europe
United States/Canada Japan India Asia including
Japan
Endowment / Foundation
United States/Canada
Western Europe Japan Russia
Latin AmericaAsia including Japan
Family office / Multi-family office
Western Europe
United States/Canada Japan India Asia ex-Japan
Fund of funds / Asset manager
Western Europe
United States/Canada Japan India Asia including
Japan
Insurance company Western Europe
United States/Canada Japan Asia including
Japan India
Investment consultant / Advisor
United States/Canada
Western Europe India Japan Asia including
Japan
Pension fund (public & private)
United States/Canada
Western Europe Japan India Asia including
Japan
Private bank / Wealth manager
Western Europe
United States/Canada Japan India
Latin AmericaEastern and Central Europe (ex-Russia)China
Source: 2016 Deutsche Bank Alternative Investment Survey
Looking ahead to 2016, Western Europe has replaced the United States / Canada as the most attractive investment region for investors, with 57% of respondents expecting it to be amongst the three best performing regions in 2016. Deutsche Bank strategists predict that the cyclical recovery we have seen in the Eurozone will continue and Eurozone GDP growth will remain resilient, albeit unexciting, in 2016 (1.6% expected versus 1.5% in 2015).26 This is despite their longer-term concerns around the European Union’s apparent structural weaknesses and slow reform progress. Whilst political uncertainty is still a key concern, Deutsche Bank strategists do not expect it to threaten market stability; and, whilst monetary policy remains accommodative, they do not expect any new measures or an increase in the pace of easing in 2016.27
26 Deutsche Bank Research – The House View, World Outlook 2016, 13 January 201627 Deutsche Bank Research – The House View, World Outlook 2016, 13 January 2016
Western Europe is expected to be the best performing region in 2016.

Deutsche Bank 2016 Alternative Investment Survey February 2016
26
Eastern and Central Europe (ex-Russia)
BRIC
Sub-Saharan Africa
Russia
Asia including Japan
Western Europe
Asia ex-Japan
Japan
China
Latin America
India
United States / Canada
20% 40%10% 15%0% 5%
35%
30%
29%
26%
24%
15%
14%
13%
11%
South Africa
Middle East / North Africa
9%
7%
6%
4%
2%
35%30%25%
Which three regions do you predict will have the poorest performance in 2016?
Source: 2016 Deutsche Bank Alternative Investment Survey
Investors’ outlook for Japan, India and Asia including Japan continues to be positive, with these regions, respectively, coming in third, fourth and fifth place, similar to our results from last year’s survey.28 The biggest delta year on year has been the change to investors’ outlook for China. Last year 23% of respondents placed China as one of their top three best performing regions in 2015, coming in fifth place.29 This year, that percentage has dropped to 11%, and China is now tied for sixth. The lack of transparency surrounding China’s macroeconomic policy took investors by surprise last year when policy makers devalued the national currency, impacting markets on a global scale. Although policy easing measures have been frequently administered, there are concerns that these measures will exacerbate overcapacity and raise leverage in the long term.30
Investors remain optimistic on Japan in 2016 with nearly one third of all respondents predicting that it will be one of the top three performing regions this year. Deutsche Bank strategists indicate that a combination of accommodative monetary policy, healthy nominal wage growth and the resiliency of the non-manufacturing sector are likely to spur the Japanese economy in 2016.31 In addition to this, institutional investors in the region are slowly becoming more comfortable with investing in riskier assets which could in time help prop stock markets although we expect this rotation to be slow in nature.32
India is another region which will likely receive a boost from lower commodity prices given its relatively high consumption of imported oil (approximately 85% of the oil consumed is imported).33 Expectations also remain high for Prime Minister Narendra Modi to increase the economic efficiency of the country by modernising infrastructure, reducing bureaucracy and encouraging foreign direct investment.34
28 2015 Deutsche Bank Alternative Investment Survey29 2015 Deutsche Bank Alternative Investment Survey30 Deutsche Bank Research – The House View, World Outlook 2016, 13 January 201631 Deutsche Bank Research – The House View, World Outlook 2016, 13 January 201632 Deutsche Bank Hedge Fund Capital Group, February 201633 Deutsche Bank Markets Research – Industry, India Oil & Gas, 18 August 201434 Deutsche Bank Research – The House View, World Outlook 2016, 13 January 2016
Deutsche Bank 2016 Alternative Investment Survey February 2016
27
Top five poorest expected performing regions, by investor type
Source: 2016 Deutsche Bank Alternative Investment Survey
1 2 3 4 5
All Respondents Latin America Russia Middle East/North Africa BRIC China
Endowment / Foundation Latin America Russia
United States/CanadaMiddle East/North AfricaSouth AfricaChina
Sub-Saharan AfricaJapan
Asia including Japan
Family office / Multi-family office Latin America BRIC Russia Middle East/
North Africa China
Fund of funds / Asset manager
Middle East/North Africa Latin America Russia BRIC China
Insurance company Latin America Russia
Eastern and Central Europe (ex-Russia)
China
BRICMiddle East/North AfricaSouth AfricaJapan
Investment consultant / Advisor Russia Latin America BRIC China Middle East/
North Africa
Pension fund (public & private)
Latin AmericaRussia
Middle East/North Africa China BRIC
South Africa
Eastern and Central Europe (ex-Russia)
Private bank / Wealth manager
Middle East/North Africa Latin America China BRIC Asia ex-Japan
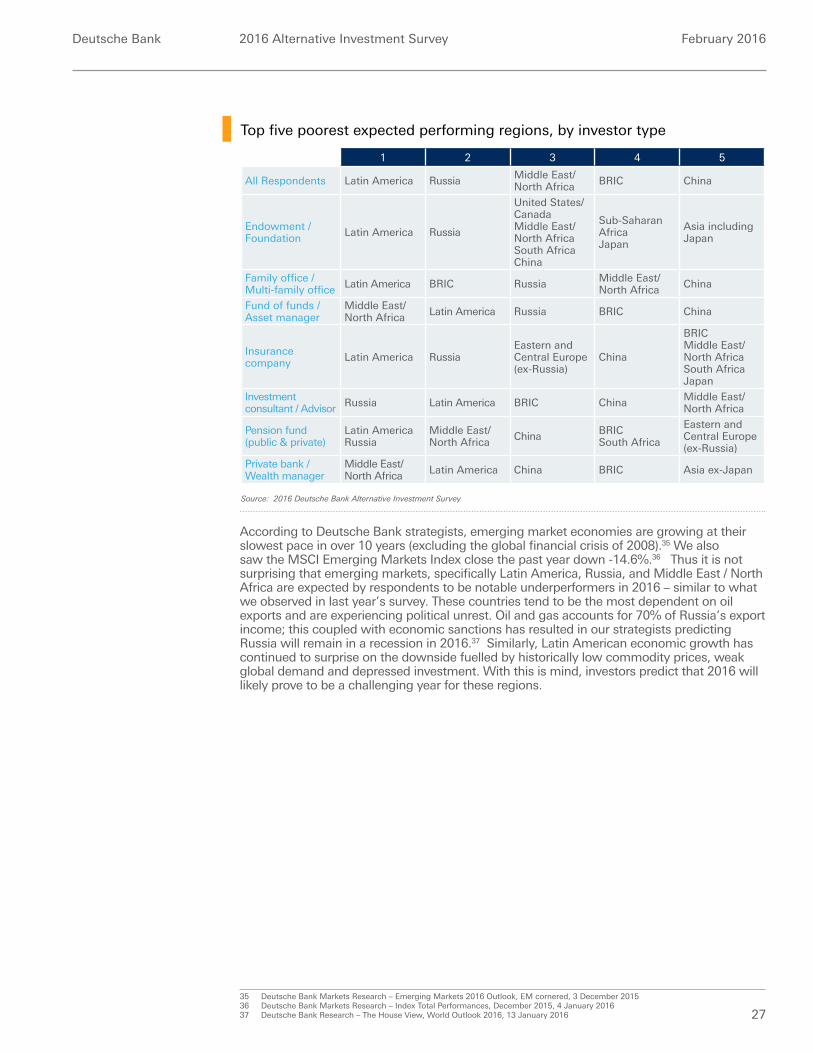
According to Deutsche Bank strategists, emerging market economies are growing at their slowest pace in over 10 years (excluding the global financial crisis of 2008).35 We also saw the MSCI Emerging Markets Index close the past year down -14.6%.36 Thus it is not surprising that emerging markets, specifically Latin America, Russia, and Middle East / North Africa are expected by respondents to be notable underperformers in 2016 – similar to what we observed in last year’s survey. These countries tend to be the most dependent on oil exports and are experiencing political unrest. Oil and gas accounts for 70% of Russia’s export income; this coupled with economic sanctions has resulted in our strategists predicting Russia will remain in a recession in 2016.37 Similarly, Latin American economic growth has continued to surprise on the downside fuelled by historically low commodity prices, weak global demand and depressed investment. With this is mind, investors predict that 2016 will likely prove to be a challenging year for these regions.
35 Deutsche Bank Markets Research – Emerging Markets 2016 Outlook, EM cornered, 3 December 201536 Deutsche Bank Markets Research – Index Total Performances, December 2015, 4 January 201637 Deutsche Bank Research – The House View, World Outlook 2016, 13 January 2016

Deutsche Bank 2016 Alternative Investment Survey February 2016
28

Deutsche Bank 2016 Alternative Investment Survey February 2016
29
Asset flow trends & predictions
29
Deutsche Bank 2016 Alternative Investment Survey February 2016
30
Asset flow trends & predictions
Section highlights − Hedge fund assets are expected to reach $3.03tn by year-end 2016, based on
respondents’ net inflow ($37bn) and performance (+3.43% or $99bn) predictions.
− Institutional investors remain bullish on alternatives and hedge funds: 50% of institutional investors plan to grow their allocation to alternatives in 2016, and 38% say the same for their hedge fund programme.
− Accessing high quality hedge funds is becoming increasingly challenging: gaining access to capacity constrained managers is considered the most important benefit of investors’ fund of funds allocations, up from third place last year and fifth place the year prior.38
− Demand for liquid alternatives is trending upward: 27% of investors continue to invest in alternative UCITS funds, with 68% of them planning to grow their allocation in 2016. 21% invest in alternative ’40 Act mutual funds (up from 15% last year), of which 65% plan to increase their investment in 2016.39
− Alternative beta strategies have seen a surge in investor interest: 20% of respondents invest today, up from 15% last year and 8% the year prior.40 60% of these respondents plan to grow their allocation in 2016. Meanwhile, 18% of investors do not currently invest, but are considering making an allocation this year.
In the section that follows, we explore investors’ growing appetite for alternative investments and hedge funds, highlighting asset flow trends from the past 12 months and investors’ predictions for 2016.
For the purposes of this survey, alternative investments include hedge funds, private equity, real assets (i.e., real estate, land, infrastructure, and intangible assets), commodities and alternative beta.
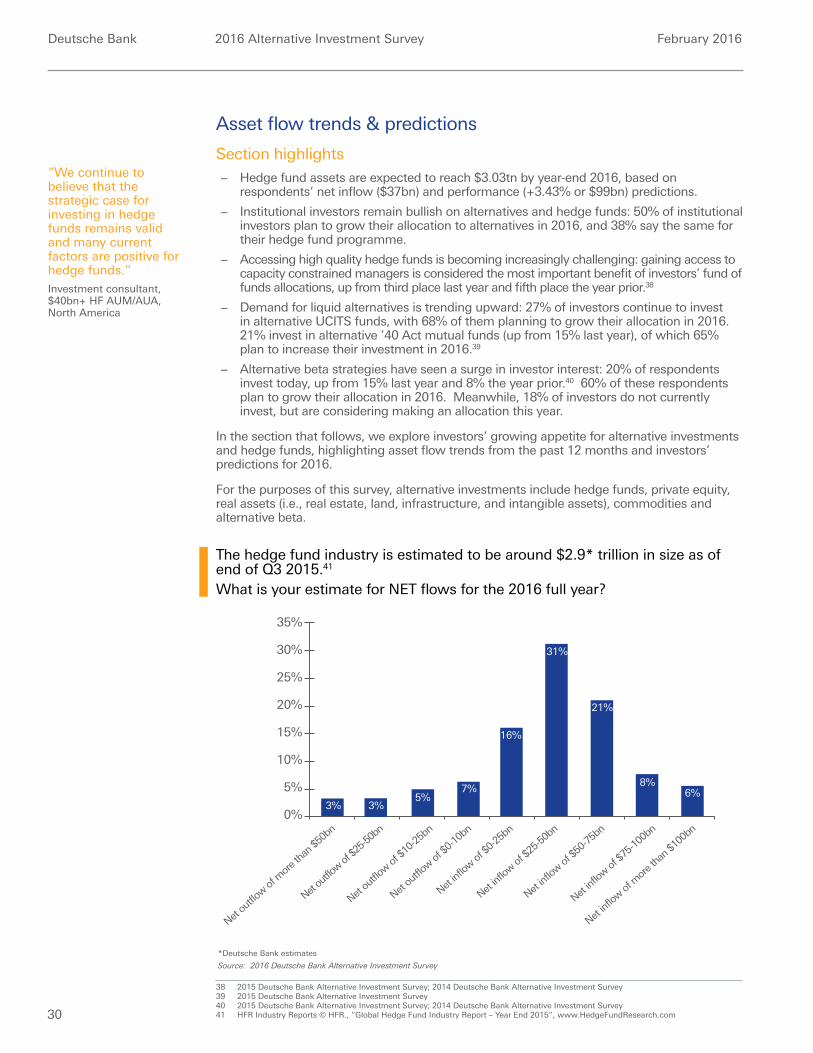
The hedge fund industry is estimated to be around $2.9* trillion in size as of end of Q3 2015.41 What is your estimate for NET flows for the 2016 full year?
38 2015 Deutsche Bank Alternative Investment Survey; 2014 Deutsche Bank Alternative Investment Survey39 2015 Deutsche Bank Alternative Investment Survey40 2015 Deutsche Bank Alternative Investment Survey; 2014 Deutsche Bank Alternative Investment Survey41 HFR Industry Reports © HFR., “Global Hedge Fund Industry Report – Year End 2015”, www.HedgeFundResearch.com
15%
10%
5%
0%
20%
Net ou
tflow of
$0-10
bn
Net inf
low of
$0-25
bn
Net inf
low of
$25-5
0bn
Net ou
tflow of
$10-2
5bn
7%
16%
21%
5%
31%
Net inf
low of
$50-7
5bn
Net inf
low of
$75-1
00bn
Net inf
low of
mor
e tha
n $10
0bn
6%8%
Net ou
tflow of
mor
e tha
n $50
bn
3%
30%
25%
35%
Net ou
tflow of
$25-5
0bn
3%
Source: 2016 Deutsche Bank Alternative Investment Survey
*Deutsche Bank estimates
“We continue to believe that the strategic case for investing in hedge funds remains valid and many current factors are positive for hedge funds.”Investment consultant, $40bn+ HF AUM/AUA, North America
Deutsche Bank 2016 Alternative Investment Survey February 2016
31
Source: 2016 Deutsche Bank Alternative Investment Survey
30%
20%
10%
0%
40%
51%50%
60%
Fam
ily O
ffice
/
Multi-
Fam
ily o
ffice
Endo
wm
ent /
Foun
datio
n
All re
spon
dent
s
Inve
stm
ent c
onsu
ltant
/
Adviso
r
Pens
ion
fund
s
(pub
lic &
priv
ate)
Priva
te b
ank /
Wea
lth m
anag
er
Insu
ranc
e co
mpa
ny
Alternatives
Hedge funds
33%
48%
23%
33%
17%20%
10%
18%
8% 8%5% 5% 1%
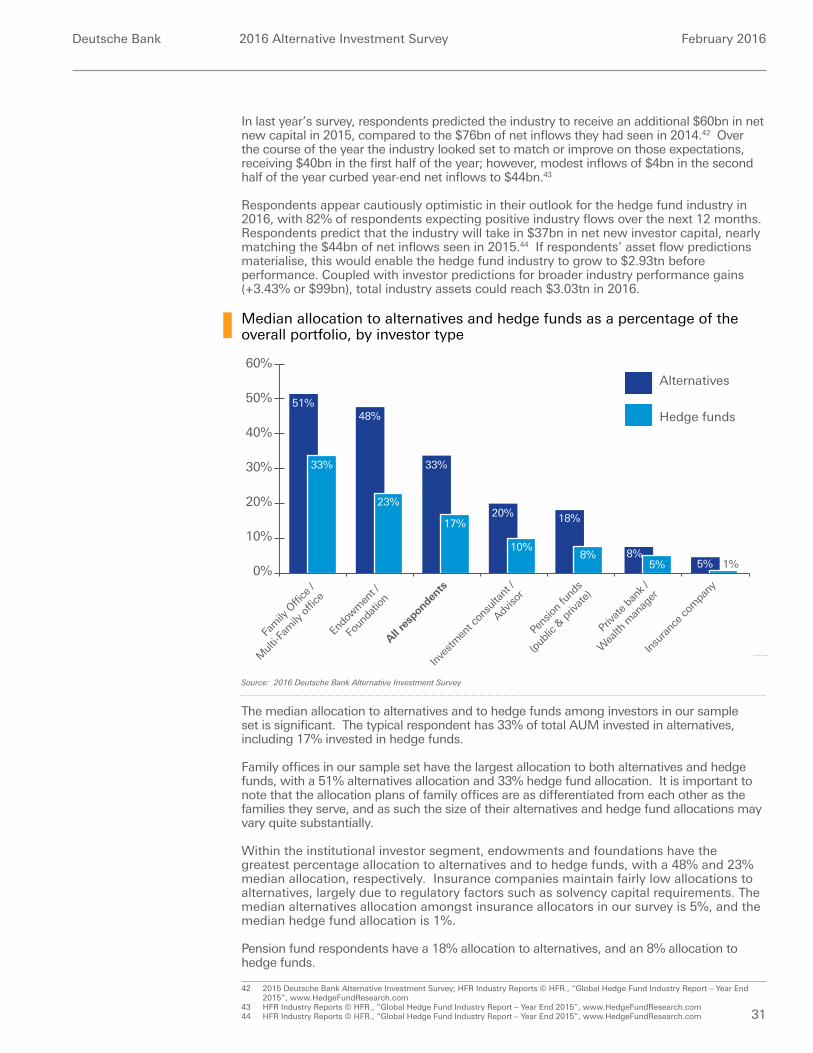
Median allocation to alternatives and hedge funds as a percentage of the overall portfolio, by investor type
In last year’s survey, respondents predicted the industry to receive an additional $60bn in net new capital in 2015, compared to the $76bn of net inflows they had seen in 2014.42 Over the course of the year the industry looked set to match or improve on those expectations, receiving $40bn in the first half of the year; however, modest inflows of $4bn in the second half of the year curbed year-end net inflows to $44bn.43
Respondents appear cautiously optimistic in their outlook for the hedge fund industry in 2016, with 82% of respondents expecting positive industry flows over the next 12 months. Respondents predict that the industry will take in $37bn in net new investor capital, nearly matching the $44bn of net inflows seen in 2015.44 If respondents’ asset flow predictions materialise, this would enable the hedge fund industry to grow to $2.93tn before performance. Coupled with investor predictions for broader industry performance gains (+3.43% or $99bn), total industry assets could reach $3.03tn in 2016.
The median allocation to alternatives and to hedge funds among investors in our sample set is significant. The typical respondent has 33% of total AUM invested in alternatives, including 17% invested in hedge funds.
Family offices in our sample set have the largest allocation to both alternatives and hedge funds, with a 51% alternatives allocation and 33% hedge fund allocation. It is important to note that the allocation plans of family offices are as differentiated from each other as the families they serve, and as such the size of their alternatives and hedge fund allocations may vary quite substantially.
Within the institutional investor segment, endowments and foundations have the greatest percentage allocation to alternatives and to hedge funds, with a 48% and 23% median allocation, respectively. Insurance companies maintain fairly low allocations to alternatives, largely due to regulatory factors such as solvency capital requirements. The median alternatives allocation amongst insurance allocators in our survey is 5%, and the median hedge fund allocation is 1%.
Pension fund respondents have a 18% allocation to alternatives, and an 8% allocation to hedge funds.
42 2015 Deutsche Bank Alternative Investment Survey; HFR Industry Reports © HFR., “Global Hedge Fund Industry Report – Year End 2015”, www.HedgeFundResearch.com
43 HFR Industry Reports © HFR., “Global Hedge Fund Industry Report – Year End 2015”, www.HedgeFundResearch.com44 HFR Industry Reports © HFR., “Global Hedge Fund Industry Report – Year End 2015”, www.HedgeFundResearch.com
Deutsche Bank 2016 Alternative Investment Survey February 2016
32
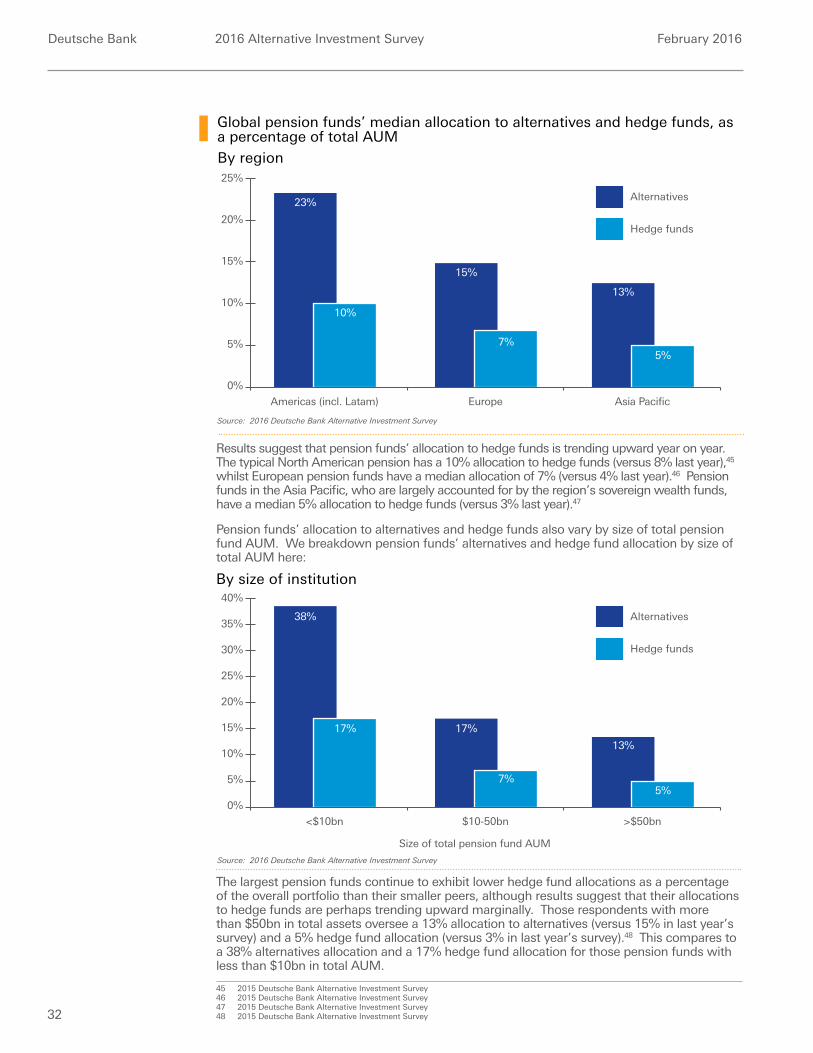
Global pension funds’ median allocation to alternatives and hedge funds, as a percentage of total AUM
By region
By size of institution
Source: 2016 Deutsche Bank Alternative Investment Survey
Source: 2016 Deutsche Bank Alternative Investment Survey
15%
10%
5%
0%
20%
23%
25%
Americas (incl. Latam)
Alternatives
Hedge funds
10%
15%
Europe
7%
13%
Asia Pacific
5%
15%
10%
5%
0%
20%
38%
25%
35%
30%
40%
<$10bn
Alternatives
Hedge funds
17% 17%
$10-50bn
7%
13%
>$50bn
5%
Size of total pension fund AUM
Results suggest that pension funds’ allocation to hedge funds is trending upward year on year. The typical North American pension has a 10% allocation to hedge funds (versus 8% last year),45 whilst European pension funds have a median allocation of 7% (versus 4% last year).46 Pension funds in the Asia Pacific, who are largely accounted for by the region’s sovereign wealth funds, have a median 5% allocation to hedge funds (versus 3% last year).47
Pension funds’ allocation to alternatives and hedge funds also vary by size of total pension fund AUM. We breakdown pension funds’ alternatives and hedge fund allocation by size of total AUM here:
The largest pension funds continue to exhibit lower hedge fund allocations as a percentage of the overall portfolio than their smaller peers, although results suggest that their allocations to hedge funds are perhaps trending upward marginally. Those respondents with more than $50bn in total assets oversee a 13% allocation to alternatives (versus 15% in last year’s survey) and a 5% hedge fund allocation (versus 3% in last year’s survey).48 This compares to a 38% alternatives allocation and a 17% hedge fund allocation for those pension funds with less than $10bn in total AUM.
45 2015 Deutsche Bank Alternative Investment Survey46 2015 Deutsche Bank Alternative Investment Survey47 2015 Deutsche Bank Alternative Investment Survey48 2015 Deutsche Bank Alternative Investment Survey
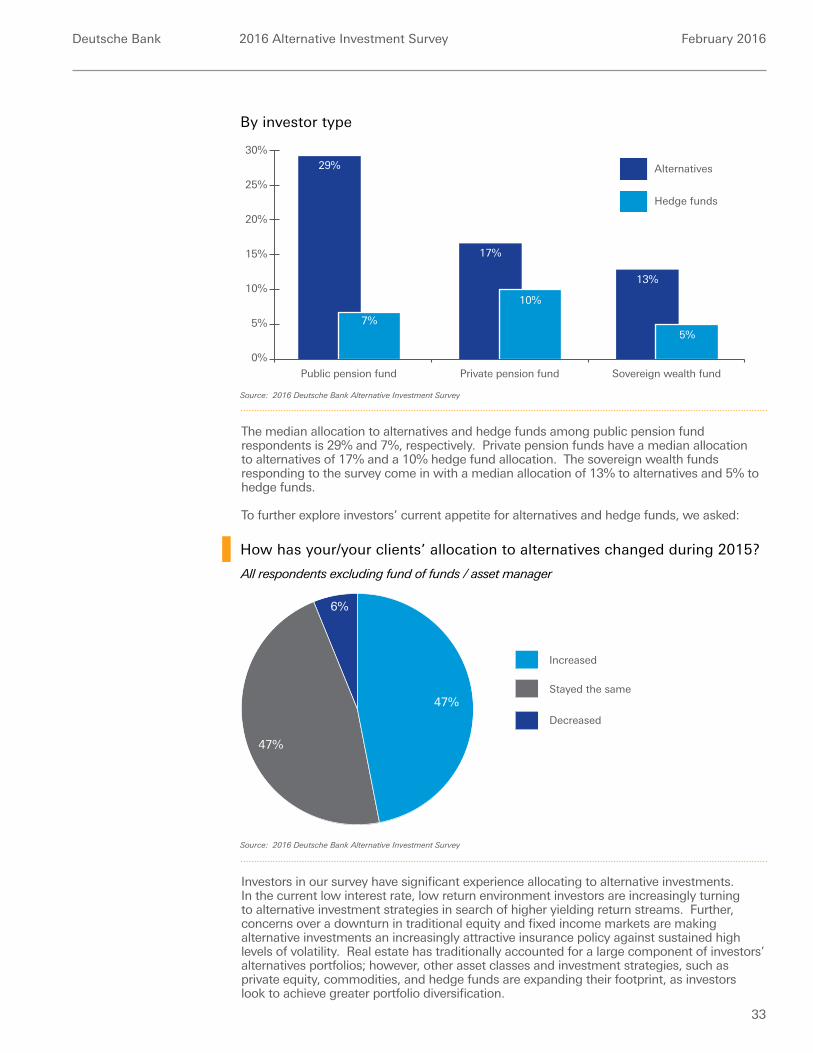
Deutsche Bank 2016 Alternative Investment Survey February 2016
33
By investor type
How has your/your clients’ allocation to alternatives changed during 2015?
Source: 2016 Deutsche Bank Alternative Investment Survey
Source: 2016 Deutsche Bank Alternative Investment Survey
15%
10%
5%
0%
20%
29%
25%
30%
Public pension fund
Alternatives
Hedge funds
7%
17%
Private pension fund
10%
13%
Sovereign wealth fund
5%
Stayed the same
Increased
Decreased
47%
47%
6%
The median allocation to alternatives and hedge funds among public pension fund respondents is 29% and 7%, respectively. Private pension funds have a median allocation to alternatives of 17% and a 10% hedge fund allocation. The sovereign wealth funds responding to the survey come in with a median allocation of 13% to alternatives and 5% to hedge funds.
To further explore investors’ current appetite for alternatives and hedge funds, we asked:
Investors in our survey have significant experience allocating to alternative investments. In the current low interest rate, low return environment investors are increasingly turning to alternative investment strategies in search of higher yielding return streams. Further, concerns over a downturn in traditional equity and fixed income markets are making alternative investments an increasingly attractive insurance policy against sustained high levels of volatility. Real estate has traditionally accounted for a large component of investors’ alternatives portfolios; however, other asset classes and investment strategies, such as private equity, commodities, and hedge funds are expanding their footprint, as investors look to achieve greater portfolio diversification.
All respondents excluding fund of funds / asset manager
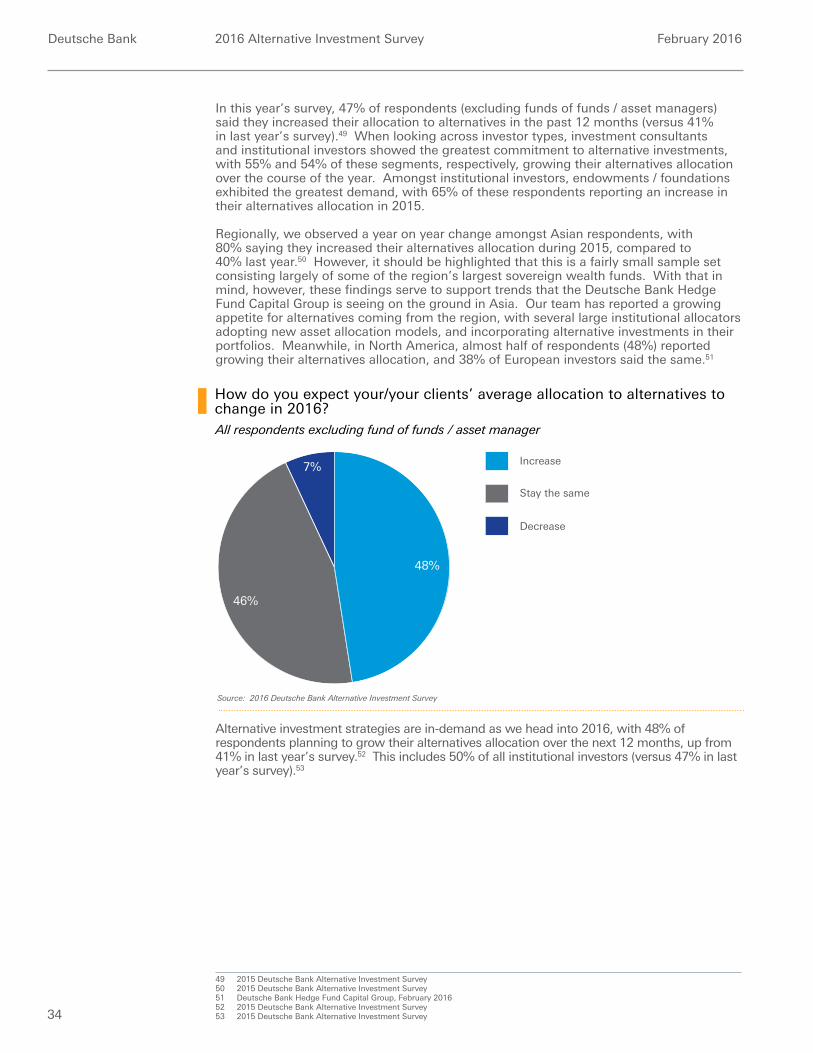
Deutsche Bank 2016 Alternative Investment Survey February 2016
34
In this year’s survey, 47% of respondents (excluding funds of funds / asset managers) said they increased their allocation to alternatives in the past 12 months (versus 41% in last year’s survey).49 When looking across investor types, investment consultants and institutional investors showed the greatest commitment to alternative investments, with 55% and 54% of these segments, respectively, growing their alternatives allocation over the course of the year. Amongst institutional investors, endowments / foundations exhibited the greatest demand, with 65% of these respondents reporting an increase in their alternatives allocation in 2015.
Regionally, we observed a year on year change amongst Asian respondents, with 80% saying they increased their alternatives allocation during 2015, compared to 40% last year.50 However, it should be highlighted that this is a fairly small sample set consisting largely of some of the region’s largest sovereign wealth funds. With that in mind, however, these findings serve to support trends that the Deutsche Bank Hedge Fund Capital Group is seeing on the ground in Asia. Our team has reported a growing appetite for alternatives coming from the region, with several large institutional allocators adopting new asset allocation models, and incorporating alternative investments in their portfolios. Meanwhile, in North America, almost half of respondents (48%) reported growing their alternatives allocation, and 38% of European investors said the same.51
Alternative investment strategies are in-demand as we head into 2016, with 48% of respondents planning to grow their alternatives allocation over the next 12 months, up from 41% in last year’s survey.52 This includes 50% of all institutional investors (versus 47% in last year’s survey).53
49 2015 Deutsche Bank Alternative Investment Survey50 2015 Deutsche Bank Alternative Investment Survey51 Deutsche Bank Hedge Fund Capital Group, February 201652 2015 Deutsche Bank Alternative Investment Survey53 2015 Deutsche Bank Alternative Investment Survey
How do you expect your/your clients’ average allocation to alternatives to change in 2016?
Source: 2016 Deutsche Bank Alternative Investment Survey
Stay the same
Decrease
Increase
46%
48%
7%
All respondents excluding fund of funds / asset manager
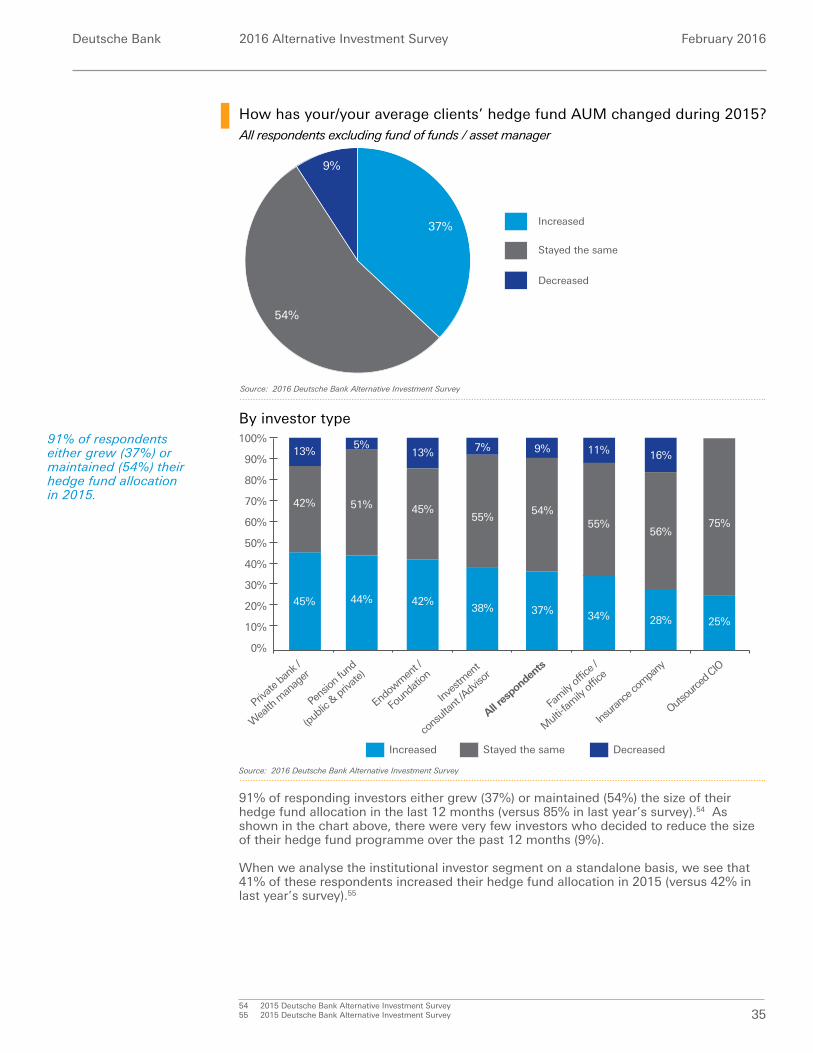
Deutsche Bank 2016 Alternative Investment Survey February 2016
35
91% of responding investors either grew (37%) or maintained (54%) the size of their hedge fund allocation in the last 12 months (versus 85% in last year’s survey).54 As shown in the chart above, there were very few investors who decided to reduce the size of their hedge fund programme over the past 12 months (9%).
When we analyse the institutional investor segment on a standalone basis, we see that 41% of these respondents increased their hedge fund allocation in 2015 (versus 42% in last year’s survey).55
54 2015 Deutsche Bank Alternative Investment Survey55 2015 Deutsche Bank Alternative Investment Survey
How has your/your average clients’ hedge fund AUM changed during 2015?
By investor type
Source: 2016 Deutsche Bank Alternative Investment Survey
Source: 2016 Deutsche Bank Alternative Investment Survey
Stayed the same
Decreased
Increased
54%
37%
9%
Increased Stayed the same Decreased
100%
90%
80%
70%
0%
60%
50%
40%
30%
20%
10%
Inves
tmen
t
cons
ultan
t /Adv
isor
Pens
ion fu
nd
(publi
c & pr
ivate)
Private
bank
/
Wea
lth m
anag
er
Endo
wmen
t /
Foun
datio
n
Fam
ily of
fice /
Mult
i-fam
ily of
fice
34% 28%37%
42%44%45%
11% 16%13%13%
55%56%
54%45%51%42%
5% 9%
All res
pond
ents
38%
7%
55%
Insura
nce c
ompa
ny
25%
75%
Outsou
rced C
IO
All respondents excluding fund of funds / asset manager
91% of respondents either grew (37%) or maintained (54%) their hedge fund allocation in 2015.
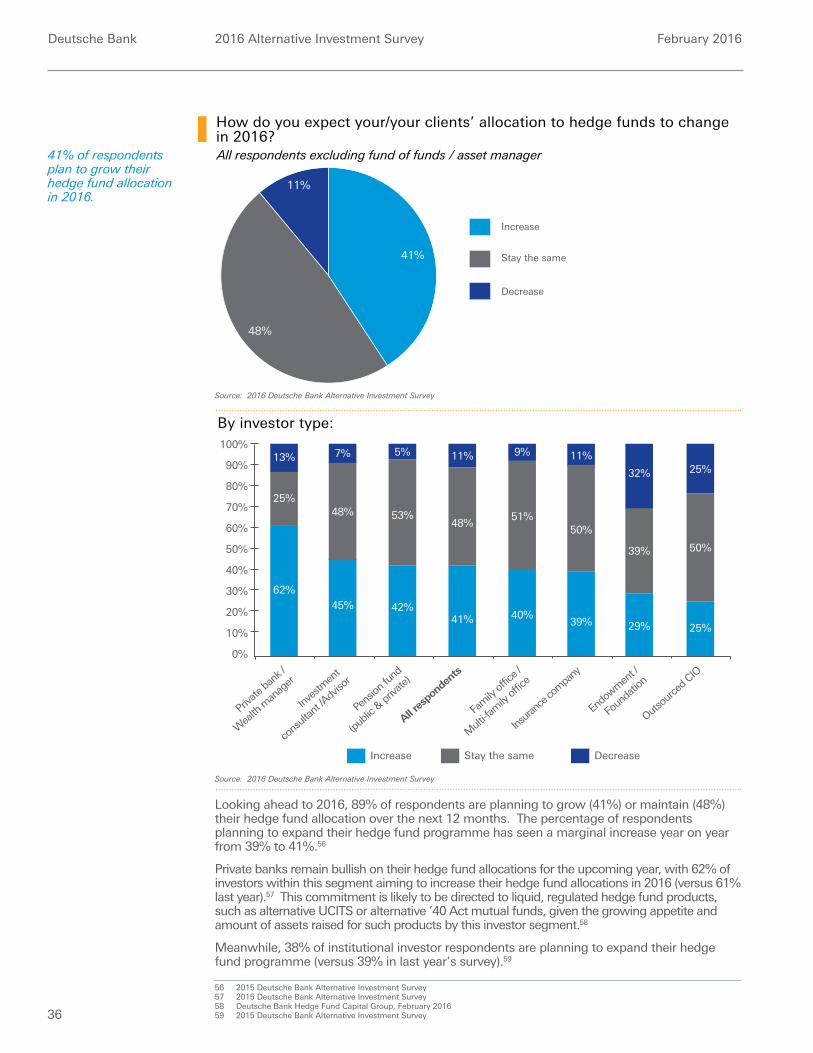
Deutsche Bank 2016 Alternative Investment Survey February 2016
36
Looking ahead to 2016, 89% of respondents are planning to grow (41%) or maintain (48%) their hedge fund allocation over the next 12 months. The percentage of respondents planning to expand their hedge fund programme has seen a marginal increase year on year from 39% to 41%.56
Private banks remain bullish on their hedge fund allocations for the upcoming year, with 62% of investors within this segment aiming to increase their hedge fund allocations in 2016 (versus 61% last year).57 This commitment is likely to be directed to liquid, regulated hedge fund products, such as alternative UCITS or alternative ’40 Act mutual funds, given the growing appetite and amount of assets raised for such products by this investor segment.58
Meanwhile, 38% of institutional investor respondents are planning to expand their hedge fund programme (versus 39% in last year’s survey).59
56 2015 Deutsche Bank Alternative Investment Survey57 2015 Deutsche Bank Alternative Investment Survey58 Deutsche Bank Hedge Fund Capital Group, February 201659 2015 Deutsche Bank Alternative Investment Survey
How do you expect your/your clients’ allocation to hedge funds to change in 2016?
Stay the same
Decrease
Increase
48%
41%
11%
All respondents excluding fund of funds / asset manager
By investor type:
Source: 2016 Deutsche Bank Alternative Investment Survey
Source: 2016 Deutsche Bank Alternative Investment Survey
Increase Stay the same Decrease
100%
90%
80%
70%
0%
60%
50%
40%
30%
20%
10%
Inves
tmen
t
cons
ultan
t /Adv
isor
Pens
ion fu
nd
(publi
c & pr
ivate)
Private
bank
/
Wea
lth m
anag
er
Endo
wmen
t /
Foun
datio
n
Insura
nce c
ompa
ny
Outso
urce
d CIO
Fam
ily of
fice /
Mult
i-fam
ily of
fice
39% 29% 25%40%
42%45%
62%
11%
32% 25%
5%13%
50%
39% 50%
51%53%48%25%
7% 9%
All res
pond
ents
41%
11%
48%
41% of respondents plan to grow their hedge fund allocation in 2016.
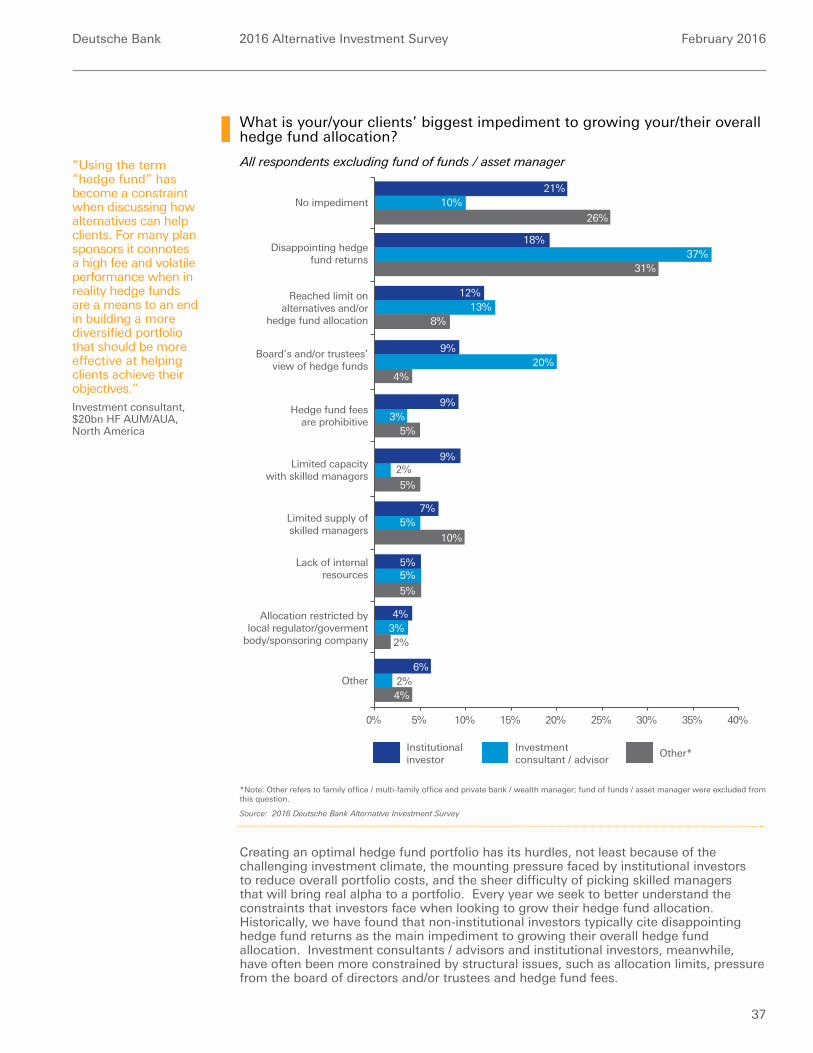
Deutsche Bank 2016 Alternative Investment Survey February 2016
37
Creating an optimal hedge fund portfolio has its hurdles, not least because of the challenging investment climate, the mounting pressure faced by institutional investors to reduce overall portfolio costs, and the sheer difficulty of picking skilled managers that will bring real alpha to a portfolio. Every year we seek to better understand the constraints that investors face when looking to grow their hedge fund allocation. Historically, we have found that non-institutional investors typically cite disappointing hedge fund returns as the main impediment to growing their overall hedge fund allocation. Investment consultants / advisors and institutional investors, meanwhile, have often been more constrained by structural issues, such as allocation limits, pressure from the board of directors and/or trustees and hedge fund fees.
What is your/your clients’ biggest impediment to growing your/their overall hedge fund allocation?
*Note: Other refers to family office / multi-family office and private bank / wealth manager; fund of funds / asset manager were excluded from this question.
Source: 2016 Deutsche Bank Alternative Investment Survey
No impediment
Allocation restricted bylocal regulator/goverment
body/sponsoring company
Lack of internalresources
Board’s and/or trustees’view of hedge funds
Hedge fund feesare prohibitive
10%5% 30%25%20%15%0% 35% 40%
Limited capacitywith skilled managers
Institutionalinvestor
Investmentconsultant / advisor
Other*
Disappointing hedgefund returns
Reached limit onalternatives and/or
hedge fund allocation
10%
26%
Limited supply ofskilled managers
21%
37%31%
18%
13%8%
12%
20%4%
9%
3%5%
9%
2%
5%
9%
5%
10%
7%
5%
5%
5%
33%
3%2%
4%
33%Other 2%
4%
6%
All respondents excluding fund of funds / asset manager“Using the term “hedge fund” has become a constraint when discussing how alternatives can help clients. For many plan sponsors it connotes a high fee and volatile performance when in reality hedge funds are a means to an end in building a more diversified portfolio that should be more effective at helping clients achieve their objectives.” Investment consultant, $20bn HF AUM/AUA, North America
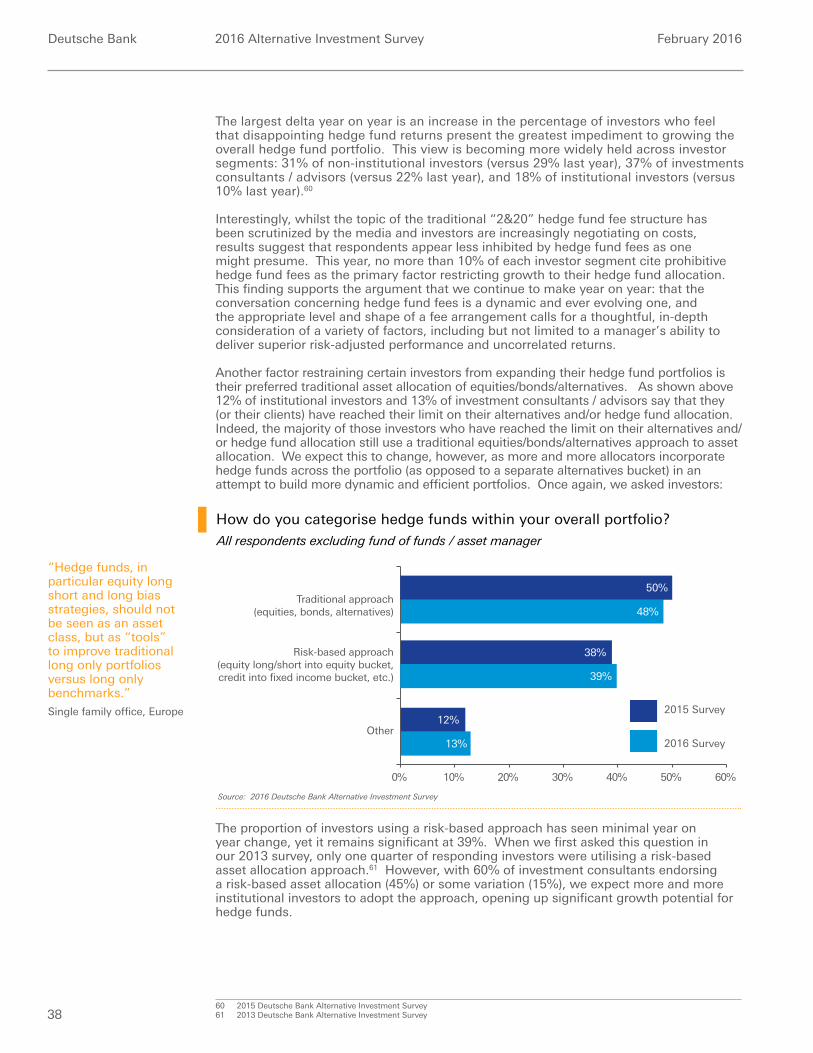
Deutsche Bank 2016 Alternative Investment Survey February 2016
38
The largest delta year on year is an increase in the percentage of investors who feel that disappointing hedge fund returns present the greatest impediment to growing the overall hedge fund portfolio. This view is becoming more widely held across investor segments: 31% of non-institutional investors (versus 29% last year), 37% of investments consultants / advisors (versus 22% last year), and 18% of institutional investors (versus 10% last year).60
Interestingly, whilst the topic of the traditional “2&20” hedge fund fee structure has been scrutinized by the media and investors are increasingly negotiating on costs, results suggest that respondents appear less inhibited by hedge fund fees as one might presume. This year, no more than 10% of each investor segment cite prohibitive hedge fund fees as the primary factor restricting growth to their hedge fund allocation. This finding supports the argument that we continue to make year on year: that the conversation concerning hedge fund fees is a dynamic and ever evolving one, and the appropriate level and shape of a fee arrangement calls for a thoughtful, in-depth consideration of a variety of factors, including but not limited to a manager’s ability to deliver superior risk-adjusted performance and uncorrelated returns.
Another factor restraining certain investors from expanding their hedge fund portfolios is their preferred traditional asset allocation of equities/bonds/alternatives. As shown above 12% of institutional investors and 13% of investment consultants / advisors say that they (or their clients) have reached their limit on their alternatives and/or hedge fund allocation. Indeed, the majority of those investors who have reached the limit on their alternatives and/or hedge fund allocation still use a traditional equities/bonds/alternatives approach to asset allocation. We expect this to change, however, as more and more allocators incorporate hedge funds across the portfolio (as opposed to a separate alternatives bucket) in an attempt to build more dynamic and efficient portfolios. Once again, we asked investors:
The proportion of investors using a risk-based approach has seen minimal year on year change, yet it remains significant at 39%. When we first asked this question in our 2013 survey, only one quarter of responding investors were utilising a risk-based asset allocation approach.61 However, with 60% of investment consultants endorsing a risk-based asset allocation (45%) or some variation (15%), we expect more and more institutional investors to adopt the approach, opening up significant growth potential for hedge funds.
60 2015 Deutsche Bank Alternative Investment Survey61 2013 Deutsche Bank Alternative Investment Survey
How do you categorise hedge funds within your overall portfolio?
Source: 2016 Deutsche Bank Alternative Investment Survey
Other
Risk-based approach(equity long/short into equity bucket,credit into fixed income bucket, etc.)
Traditional approach(equities, bonds, alternatives)
20%10% 40%30%0% 50% 60%
48%
38%
13%
12%2015 Survey
2016 Survey
39%
50%
All respondents excluding fund of funds / asset manager
“Hedge funds, in particular equity long short and long bias strategies, should not be seen as an asset class, but as “tools” to improve traditional long only portfolios versus long only benchmarks.”Single family office, Europe
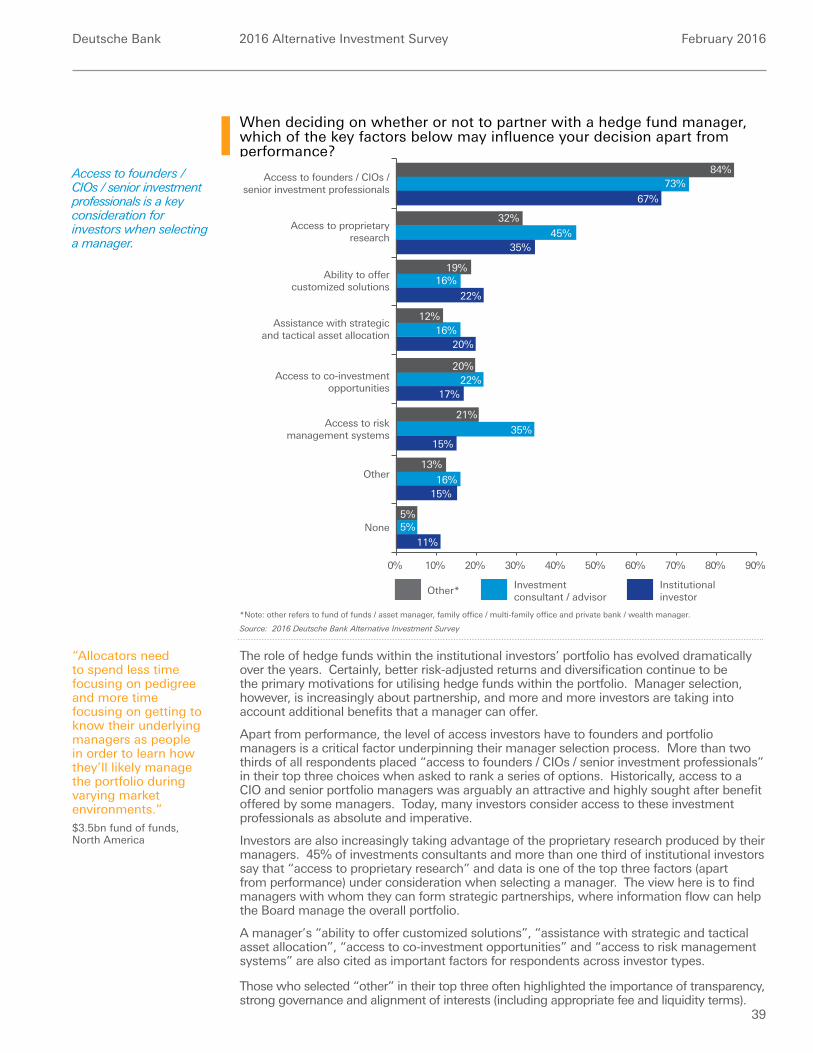
Deutsche Bank 2016 Alternative Investment Survey February 2016
39
The role of hedge funds within the institutional investors’ portfolio has evolved dramatically over the years. Certainly, better risk-adjusted returns and diversification continue to be the primary motivations for utilising hedge funds within the portfolio. Manager selection, however, is increasingly about partnership, and more and more investors are taking into account additional benefits that a manager can offer. Apart from performance, the level of access investors have to founders and portfolio managers is a critical factor underpinning their manager selection process. More than two thirds of all respondents placed “access to founders / CIOs / senior investment professionals” in their top three choices when asked to rank a series of options. Historically, access to a CIO and senior portfolio managers was arguably an attractive and highly sought after benefit offered by some managers. Today, many investors consider access to these investment professionals as absolute and imperative. Investors are also increasingly taking advantage of the proprietary research produced by their managers. 45% of investments consultants and more than one third of institutional investors say that “access to proprietary research” and data is one of the top three factors (apart from performance) under consideration when selecting a manager. The view here is to find managers with whom they can form strategic partnerships, where information flow can help the Board manage the overall portfolio. A manager’s “ability to offer customized solutions”, “assistance with strategic and tactical asset allocation”, “access to co-investment opportunities” and “access to risk management systems” are also cited as important factors for respondents across investor types. Those who selected “other” in their top three often highlighted the importance of transparency, strong governance and alignment of interests (including appropriate fee and liquidity terms).
Source: 2016 Deutsche Bank Alternative Investment Survey
*Note: other refers to fund of funds / asset manager, family office / multi-family office and private bank / wealth manager.
When deciding on whether or not to partner with a hedge fund manager, which of the key factors below may influence your decision apart from performance?
Access to founders / CIOs /senior investment professionals
None
Access to co-investmentopportunities
Assistance with strategicand tactical asset allocation
20%10% 60%50%40%30%0% 80%70% 90%
Access to riskmanagement systems
Investmentconsultant / advisor
Institutionalinvestor
Other*
Access to proprietaryresearch
Ability to offercustomized solutions
73%
67%
Other
84%
35%
32%
16%
22%
19%
16%20%
12%
22%17%
20%
35%15%
21%
16%15%
13%
5%
11%
5%
45%
Access to founders / CIOs / senior investment professionals is a key consideration for investors when selecting a manager.
“Allocators need to spend less time focusing on pedigree and more time focusing on getting to know their underlying managers as people in order to learn how they’ll likely manage the portfolio during varying market environments.”$3.5bn fund of funds, North America
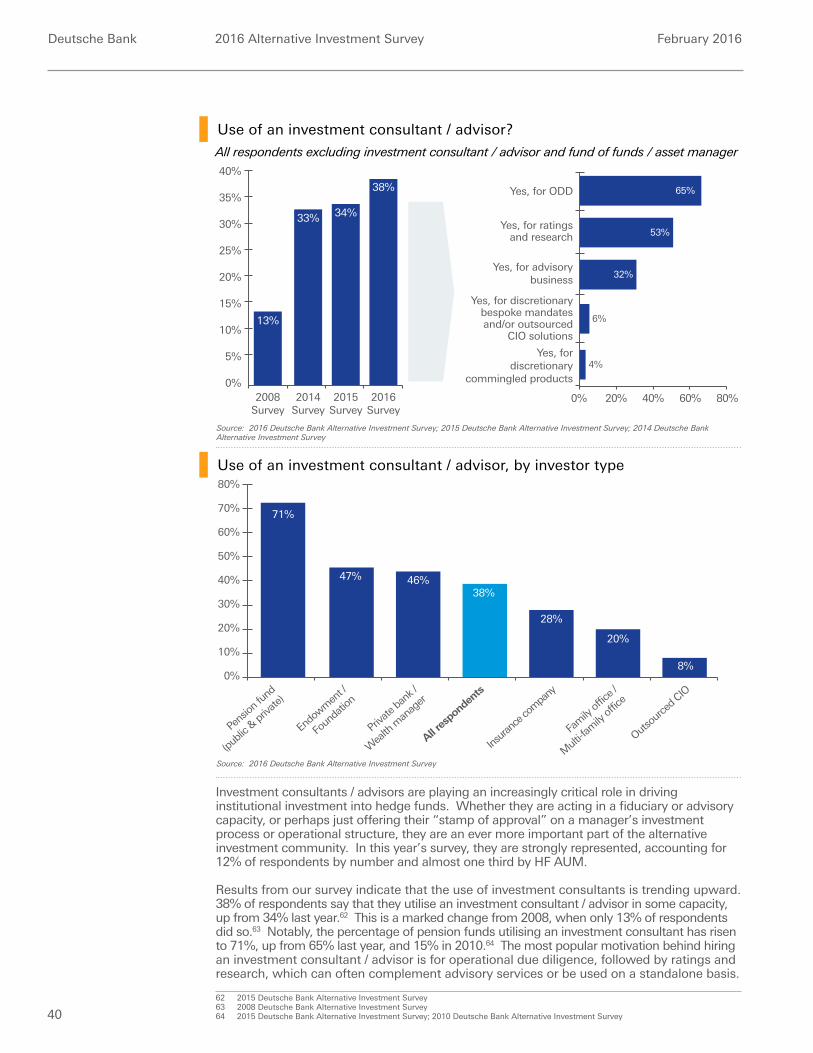
Deutsche Bank 2016 Alternative Investment Survey February 2016
40
Investment consultants / advisors are playing an increasingly critical role in driving institutional investment into hedge funds. Whether they are acting in a fiduciary or advisory capacity, or perhaps just offering their “stamp of approval” on a manager’s investment process or operational structure, they are an ever more important part of the alternative investment community. In this year’s survey, they are strongly represented, accounting for 12% of respondents by number and almost one third by HF AUM.
Results from our survey indicate that the use of investment consultants is trending upward. 38% of respondents say that they utilise an investment consultant / advisor in some capacity, up from 34% last year.62 This is a marked change from 2008, when only 13% of respondents did so.63 Notably, the percentage of pension funds utilising an investment consultant has risen to 71%, up from 65% last year, and 15% in 2010.64 The most popular motivation behind hiring an investment consultant / advisor is for operational due diligence, followed by ratings and research, which can often complement advisory services or be used on a standalone basis.
62 2015 Deutsche Bank Alternative Investment Survey63 2008 Deutsche Bank Alternative Investment Survey64 2015 Deutsche Bank Alternative Investment Survey; 2010 Deutsche Bank Alternative Investment Survey
All respondents excluding investment consultant / advisor and fund of funds / asset manager
Source: 2016 Deutsche Bank Alternative Investment Survey; 2015 Deutsche Bank Alternative Investment Survey; 2014 Deutsche Bank Alternative Investment Survey
2008Survey
13%
2014Survey
33%
2015Survey
34%
2016Survey
38%
40%
0%
35%
30%
25%
20%
15%
10%
5%
60% 80%40%20%0%
Yes, for ratingsand research
Yes, for advisorybusiness 32%
Yes, for discretionarybespoke mandatesand/or outsourced
CIO solutions
6%
65%
Yes, fordiscretionary
commingled products4%
Yes, for ODD
53%
Use of an investment consultant / advisor?
Use of an investment consultant / advisor, by investor type
30%
20%
10%
0%
40%
Pens
ion fu
nd
(publi
c & pr
ivate)
All res
pond
ents
Private
bank
/
Wea
lth m
anag
er
Endo
wmen
t /
Foun
datio
n
Insura
nce c
ompa
ny
Outso
urce
d CIO
Fam
ily of
fice /
Mult
i-fam
ily of
fice
71%
47%
38%
28%
46%
20%
8%
50%
60%
70%
80%
Source: 2016 Deutsche Bank Alternative Investment Survey
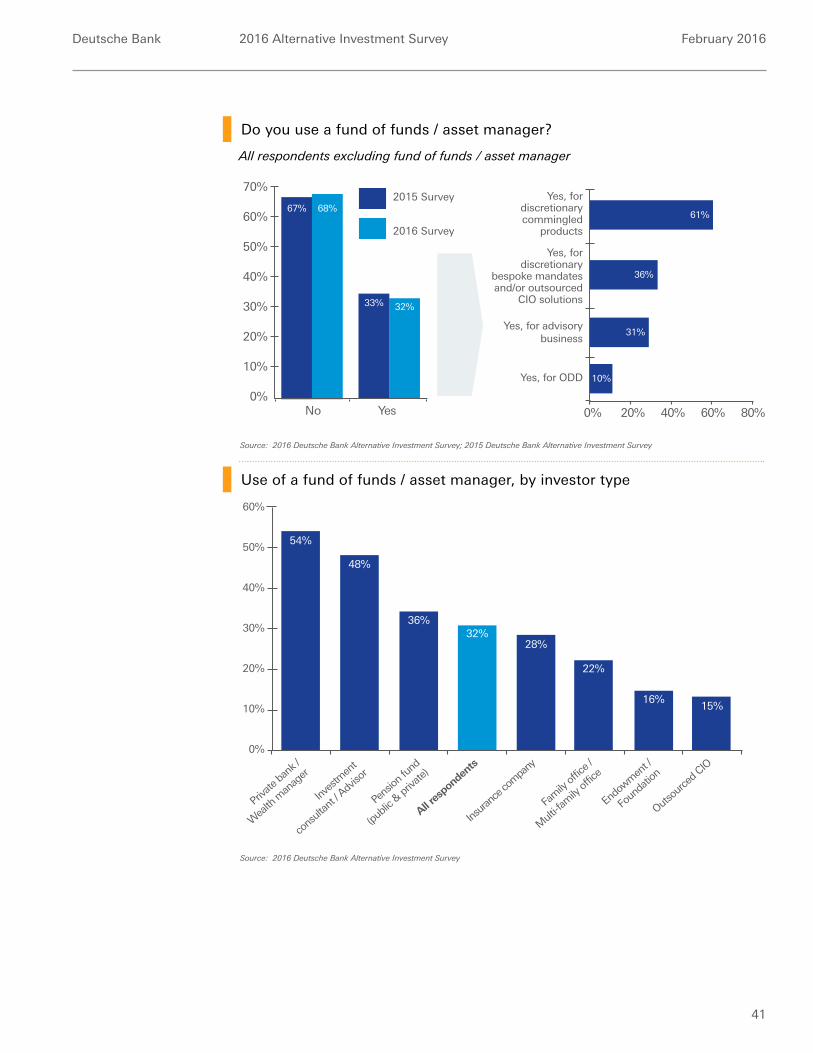
Deutsche Bank 2016 Alternative Investment Survey February 2016
41
Yes, fordiscretionarycommingled
products
Yes, fordiscretionary
bespoke mandatesand/or outsourced
CIO solutions
Yes, for advisorybusiness
Yes, for ODD
80%60%40%20%0%
61%
36%
31%
10%
All respondents excluding fund of funds / asset manager
Source: 2016 Deutsche Bank Alternative Investment Survey; 2015 Deutsche Bank Alternative Investment Survey
Source: 2016 Deutsche Bank Alternative Investment Survey
67% 68%
33% 32%
70%
0%
60%
50%
40%
30%
20%
10%
YesNo
2015 Survey
2016 Survey
Do you use a fund of funds / asset manager?
Use of a fund of funds / asset manager, by investor type
30%
20%
10%
0%
40%
Inves
tmen
t
cons
ultan
t / Adv
isor
Pens
ion fu
nd
(publi
c & pr
ivate)
All res
pond
ents
Private
bank
/
Wea
lth m
anag
er
Endo
wmen
t /
Foun
datio
n
Insura
nce c
ompa
ny
Outso
urce
d CIO
Fam
ily of
fice /
Mult
i-fam
ily of
fice
54%
48%
32%28%
36%
22%
16%15%
50%
60%
Deutsche Bank 2016 Alternative Investment Survey February 2016
42
The percentage of respondents utilising a fund of funds provider has remained fairly constant year on year at around 32%. Funds of funds still play a meaningful role in many investors’ portfolios and are being used in a variety of different capacities.
Similar to our findings last year, the majority of investors who use a fund of funds provider (61%) are doing so for their discretionary commingled offering. At first glance, the demand for commingled products seems quite high, particularly given the move of most funds of funds towards greater customization and bespoke solutions over the years. It should be noted, however, that over half of these respondents who favour commingled fund of funds products are smaller allocators (largely family offices and boutique investment consultants) with less than $1bn in HF AUM. These groups report an initial ticket size of $18m and a target allocation of under $50m.
Meanwhile, 36% of responding investors are utilising these intermediaries for bespoke, customized solutions. Of these respondents, almost three quarters have more than $1bn in HF AUM with an initial allocation of $55m and a target allocation of over $100m. These are accounted for by some of the largest pension fund allocators and investment consultants / advisors in our survey.
Almost one third are utilising funds of funds for advisory services. These responding investors represent some of the largest allocators in our survey, with over two thirds managing more than $1bn in HF AUM.
54% of private banks say they use a fund of funds provider, representing a noticeable increase from 33% last year, and we attribute this largely to the growing demand from the private banks for liquid, regulated solutions.65 A number of funds of funds / asset managers have sought to differentiate their businesses by launching alternative UCITS and/or alternative ’40 Act mutual fund products, and they have raised meaningful capital globally, particularly from the private wealth management community.66 It was also interesting to see that the percentage of pension funds employing a fund of funds provider has trended downward year on year, from 48% to 36%.
65 2015 Deutsche Bank Alternative Investment Survey66 Deutsche Bank Hedge Fund Capital Group, February 2016; Hedge Fund Intelligence, “Retail-focused liquid alternatives funds show
annual growth of 50%”, December 2015/January 2015
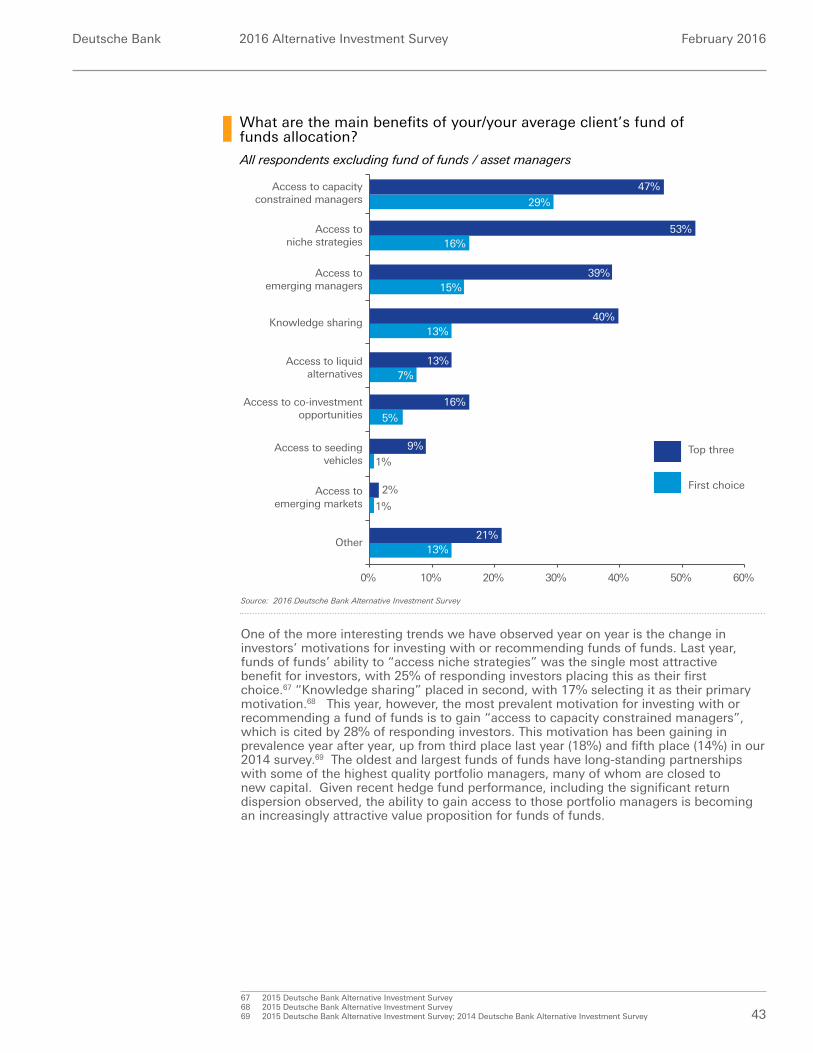
Deutsche Bank 2016 Alternative Investment Survey February 2016
43
What are the main benefits of your/your average client’s fund of funds allocation?
Source: 2016 Deutsche Bank Alternative Investment Survey
Access to co-investmentopportunities
Access to capacityconstrained managers
Knowledge sharing
20%10% 40%30%0% 50% 60%
50%
16%
39%15%
Access toemerging managers
40%13%
16%
5%
9%
1%Top three
First choice
53%Access toniche strategies
29%
47%
Other21%
13%
Access to seedingvehicles
Access toemerging markets
2%
Access to liquidalternatives
13%7%
1%
All respondents excluding fund of funds / asset managers
One of the more interesting trends we have observed year on year is the change in investors’ motivations for investing with or recommending funds of funds. Last year, funds of funds’ ability to “access niche strategies” was the single most attractive benefit for investors, with 25% of responding investors placing this as their first choice.67 “Knowledge sharing” placed in second, with 17% selecting it as their primary motivation.68 This year, however, the most prevalent motivation for investing with or recommending a fund of funds is to gain “access to capacity constrained managers”, which is cited by 28% of responding investors. This motivation has been gaining in prevalence year after year, up from third place last year (18%) and fifth place (14%) in our 2014 survey.69 The oldest and largest funds of funds have long-standing partnerships with some of the highest quality portfolio managers, many of whom are closed to new capital. Given recent hedge fund performance, including the significant return dispersion observed, the ability to gain access to those portfolio managers is becoming an increasingly attractive value proposition for funds of funds.
67 2015 Deutsche Bank Alternative Investment Survey68 2015 Deutsche Bank Alternative Investment Survey69 2015 Deutsche Bank Alternative Investment Survey; 2014 Deutsche Bank Alternative Investment Survey
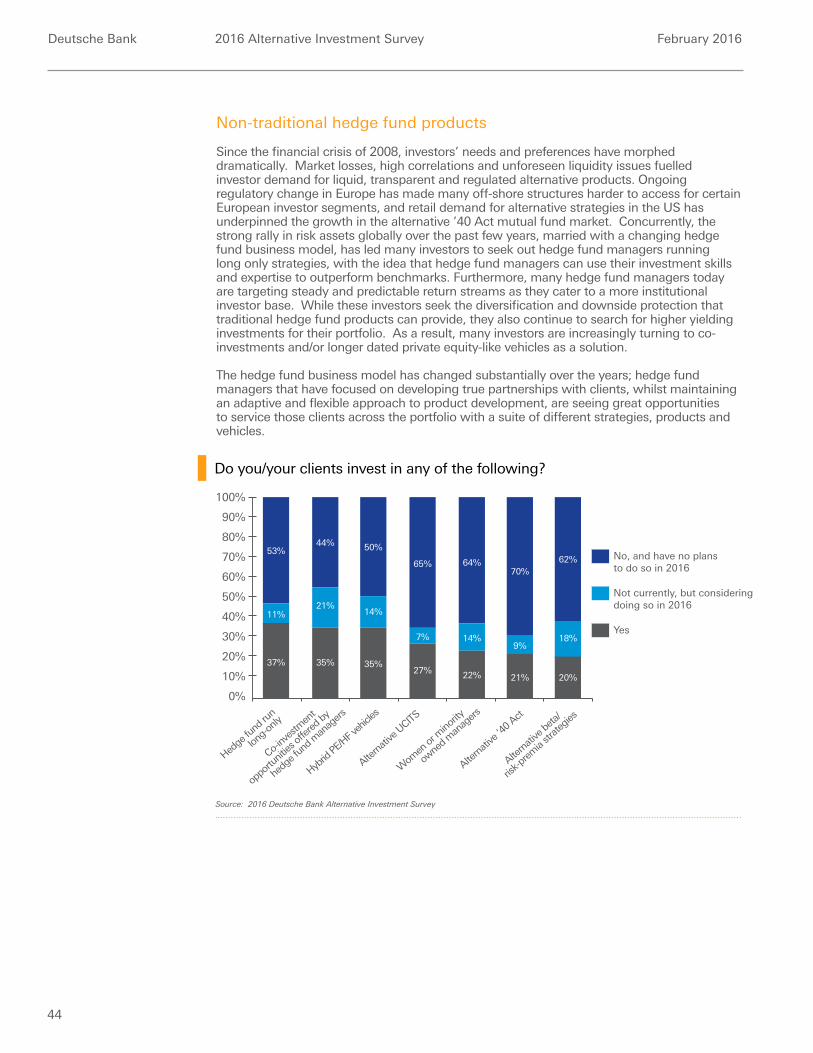
Deutsche Bank 2016 Alternative Investment Survey February 2016
44
Non-traditional hedge fund products
Since the financial crisis of 2008, investors’ needs and preferences have morphed dramatically. Market losses, high correlations and unforeseen liquidity issues fuelled investor demand for liquid, transparent and regulated alternative products. Ongoing regulatory change in Europe has made many off-shore structures harder to access for certain European investor segments, and retail demand for alternative strategies in the US has underpinned the growth in the alternative ’40 Act mutual fund market. Concurrently, the strong rally in risk assets globally over the past few years, married with a changing hedge fund business model, has led many investors to seek out hedge fund managers running long only strategies, with the idea that hedge fund managers can use their investment skills and expertise to outperform benchmarks. Furthermore, many hedge fund managers today are targeting steady and predictable return streams as they cater to a more institutional investor base. While these investors seek the diversification and downside protection that traditional hedge fund products can provide, they also continue to search for higher yielding investments for their portfolio. As a result, many investors are increasingly turning to co-investments and/or longer dated private equity-like vehicles as a solution.
The hedge fund business model has changed substantially over the years; hedge fund managers that have focused on developing true partnerships with clients, whilst maintaining an adaptive and flexible approach to product development, are seeing great opportunities to service those clients across the portfolio with a suite of different strategies, products and vehicles.
Do you/your clients invest in any of the following?
Source: 2016 Deutsche Bank Alternative Investment Survey
53%
11%
37%
44%
21%
35%
50%
14%
35%
65%
7%
27%
64%
14%
22%
70%
9%
21%
62%
18%
20%
100%
90%
80%
70%
0%
60%
50%
40%
30%
20%
10%
Wom
en or
mino
rity
owne
d man
agers
Altern
ative
beta/
risk-p
remia
strate
gies
Hedge
fund
run
long-
only
Altern
ative
‘40 A
ct
Co-inv
estm
ent
oppo
rtunit
ies of
fered
by
hedg
e fun
d man
agers
Altern
ative
UCITS
Hybrid
PE/H
F veh
icles
Not currently, but consideringdoing so in 2016
Yes
No, and have no plans to do so in 2016
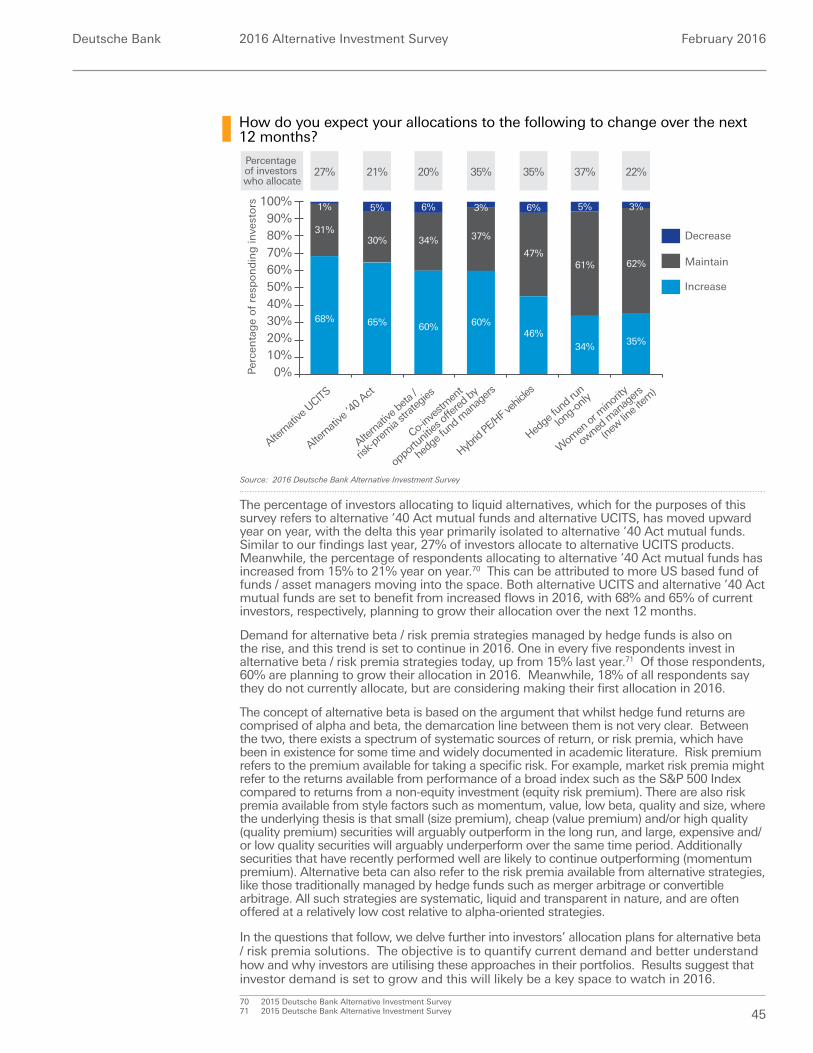
Deutsche Bank 2016 Alternative Investment Survey February 2016
45
How do you expect your allocations to the following to change over the next 12 months?
1%
31%
68%
5%
30%
65%
6%
34%
60%
37%
60%
6%
47%
46%
5%
61%
34%
3%
62%
35%
100%90%80%70%
0%
60%50%40%30%20%10%
Wom
en or
mino
rity
owne
d man
agers
(new lin
e item
)
Altern
ative
beta
/
risk-p
remia
strate
gies
Hedge
fund
run
long-
only
Altern
ative
‘40 A
ct
Co-inv
estm
ent
oppo
rtunit
ies of
fered
by
hedg
e fun
d man
agers
Altern
ative
UCITS
Hybrid
PE/H
F veh
icles
Maintain
Increase
Decrease
3%
Percentage of investors who allocate
27% 21% 20% 35% 35% 37% 22%
Per
cen
tag
e o
f re
spo
nd
ing
inve
sto
rs
The percentage of investors allocating to liquid alternatives, which for the purposes of this survey refers to alternative ’40 Act mutual funds and alternative UCITS, has moved upward year on year, with the delta this year primarily isolated to alternative ’40 Act mutual funds. Similar to our findings last year, 27% of investors allocate to alternative UCITS products. Meanwhile, the percentage of respondents allocating to alternative ’40 Act mutual funds has increased from 15% to 21% year on year.70 This can be attributed to more US based fund of funds / asset managers moving into the space. Both alternative UCITS and alternative ’40 Act mutual funds are set to benefit from increased flows in 2016, with 68% and 65% of current investors, respectively, planning to grow their allocation over the next 12 months.
Demand for alternative beta / risk premia strategies managed by hedge funds is also on the rise, and this trend is set to continue in 2016. One in every five respondents invest in alternative beta / risk premia strategies today, up from 15% last year.71 Of those respondents, 60% are planning to grow their allocation in 2016. Meanwhile, 18% of all respondents say they do not currently allocate, but are considering making their first allocation in 2016.
The concept of alternative beta is based on the argument that whilst hedge fund returns are comprised of alpha and beta, the demarcation line between them is not very clear. Between the two, there exists a spectrum of systematic sources of return, or risk premia, which have been in existence for some time and widely documented in academic literature. Risk premium refers to the premium available for taking a specific risk. For example, market risk premia might refer to the returns available from performance of a broad index such as the S&P 500 Index compared to returns from a non-equity investment (equity risk premium). There are also risk premia available from style factors such as momentum, value, low beta, quality and size, where the underlying thesis is that small (size premium), cheap (value premium) and/or high quality (quality premium) securities will arguably outperform in the long run, and large, expensive and/or low quality securities will arguably underperform over the same time period. Additionally securities that have recently performed well are likely to continue outperforming (momentum premium). Alternative beta can also refer to the risk premia available from alternative strategies, like those traditionally managed by hedge funds such as merger arbitrage or convertible arbitrage. All such strategies are systematic, liquid and transparent in nature, and are often offered at a relatively low cost relative to alpha-oriented strategies.
In the questions that follow, we delve further into investors’ allocation plans for alternative beta / risk premia solutions. The objective is to quantify current demand and better understand how and why investors are utilising these approaches in their portfolios. Results suggest that investor demand is set to grow and this will likely be a key space to watch in 2016.
70 2015 Deutsche Bank Alternative Investment Survey71 2015 Deutsche Bank Alternative Investment Survey
Source: 2016 Deutsche Bank Alternative Investment Survey
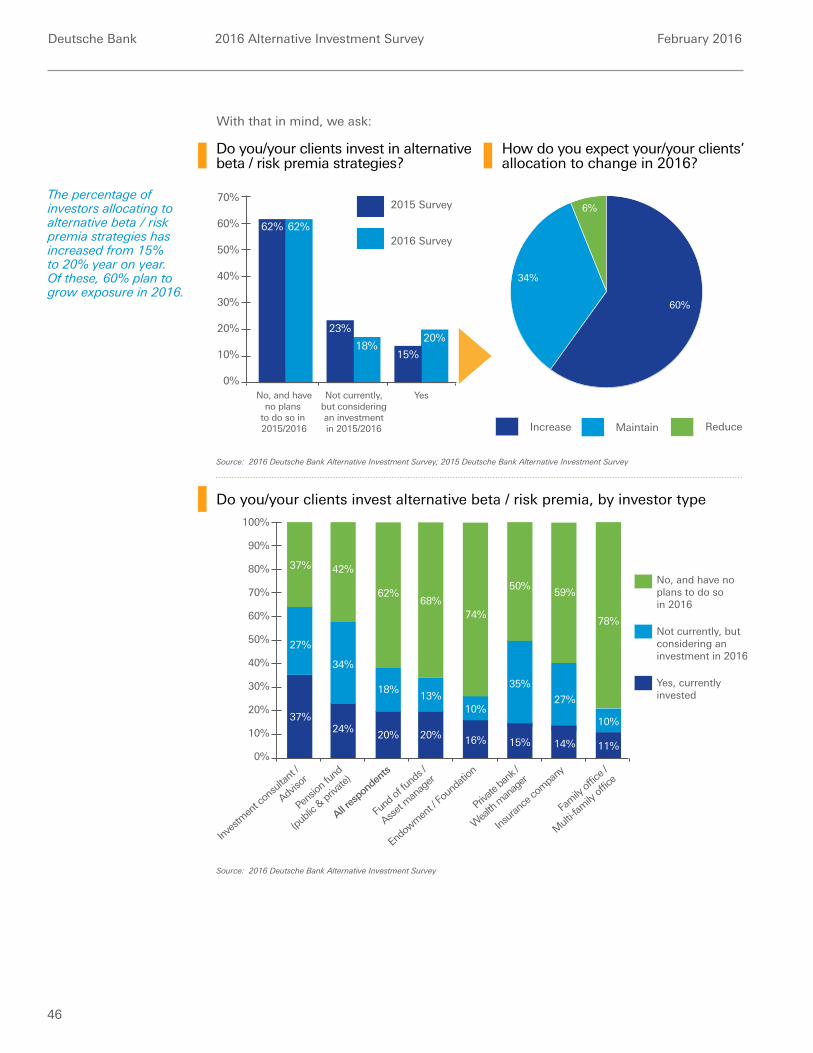
Deutsche Bank 2016 Alternative Investment Survey February 2016
46
Do you/your clients invest in alternative beta / risk premia strategies?
Do you/your clients invest alternative beta / risk premia, by investor type
How do you expect your/your clients’ allocation to change in 2016?
Source: 2016 Deutsche Bank Alternative Investment Survey; 2015 Deutsche Bank Alternative Investment Survey
Source: 2016 Deutsche Bank Alternative Investment Survey
18%
0%
70%
60%
50%
40%
30%
20%
10%
No, and haveno plans
to do so in 2015/2016
62% 62%
23%20%
15%
Not currently,but consideringan investmentin 2015/2016
Yes
2015 Survey
2016 Survey
Increase
Maintain
Reduce
34%
60%
6%
Increase
Maintain
Reduce
34%
60%
6%
Increase
Maintain
Reduce
34%
60%
6%
Increase
Maintain
Reduce
34%
60%
6%
30%
20%
10%
0%
40%
Insur
ance
com
pany
Endo
wmen
t / Fo
unda
tion
Inves
tmen
t con
sulta
nt /
Adviso
r
Pens
ion fu
nd
(publi
c & pr
ivate)
Fund
of fu
nds /
Asset
man
ager
10%
35%
50%
10%
78%
13%
68%74%
27%
59%
Fam
ily of
fice /
Mult
i-fam
ily of
fice
27%
37%
70%
60%
50%
90%
80%
100%
Priva
te ba
nk /
Wea
lth m
anag
er
34%
20%
37%24%
42%
Not currently, butconsidering an investment in 2016
Yes, currently invested
No, and have noplans to do so in 2016
16% 15% 11%14%
All res
pond
ents
18%
62%
20%
With that in mind, we ask:
The percentage of investors allocating to alternative beta / risk premia strategies has increased from 15% to 20% year on year. Of these, 60% plan to grow exposure in 2016.
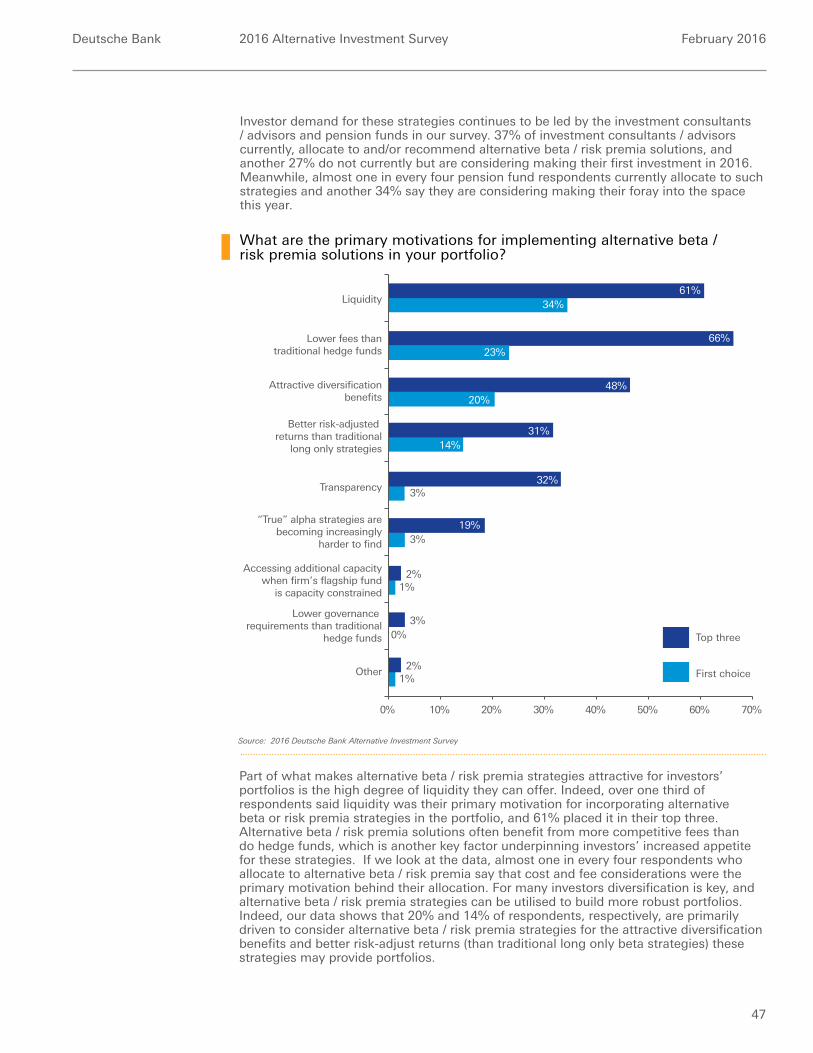
Deutsche Bank 2016 Alternative Investment Survey February 2016
47
Investor demand for these strategies continues to be led by the investment consultants / advisors and pension funds in our survey. 37% of investment consultants / advisors currently, allocate to and/or recommend alternative beta / risk premia solutions, and another 27% do not currently but are considering making their first investment in 2016. Meanwhile, almost one in every four pension fund respondents currently allocate to such strategies and another 34% say they are considering making their foray into the space this year.
What are the primary motivations for implementing alternative beta / risk premia solutions in your portfolio?
Source: 2016 Deutsche Bank Alternative Investment Survey
Lower governance requirements than traditional
hedge funds
Accessing additional capacitywhen firm’s flagship fund
is capacity constrained
Attractive diversificationbenefits
Better risk-adjusted returns than traditional
long only strategies
20%10% 60%50%40%30%0% 70%
Transparency
Top three
First choice
Liquidity
Lower fees thantraditional hedge funds
“True” alpha strategies arebecoming increasingly
harder to find
34%61%
23%66%
20%48%
14%31%
3%32%
3%19%
1%2%
1%2%
33%
0%3%
Other33%
Part of what makes alternative beta / risk premia strategies attractive for investors’ portfolios is the high degree of liquidity they can offer. Indeed, over one third of respondents said liquidity was their primary motivation for incorporating alternative beta or risk premia strategies in the portfolio, and 61% placed it in their top three. Alternative beta / risk premia solutions often benefit from more competitive fees than do hedge funds, which is another key factor underpinning investors’ increased appetite for these strategies. If we look at the data, almost one in every four respondents who allocate to alternative beta / risk premia say that cost and fee considerations were the primary motivation behind their allocation. For many investors diversification is key, and alternative beta / risk premia strategies can be utilised to build more robust portfolios. Indeed, our data shows that 20% and 14% of respondents, respectively, are primarily driven to consider alternative beta / risk premia strategies for the attractive diversification benefits and better risk-adjust returns (than traditional long only beta strategies) these strategies may provide portfolios.
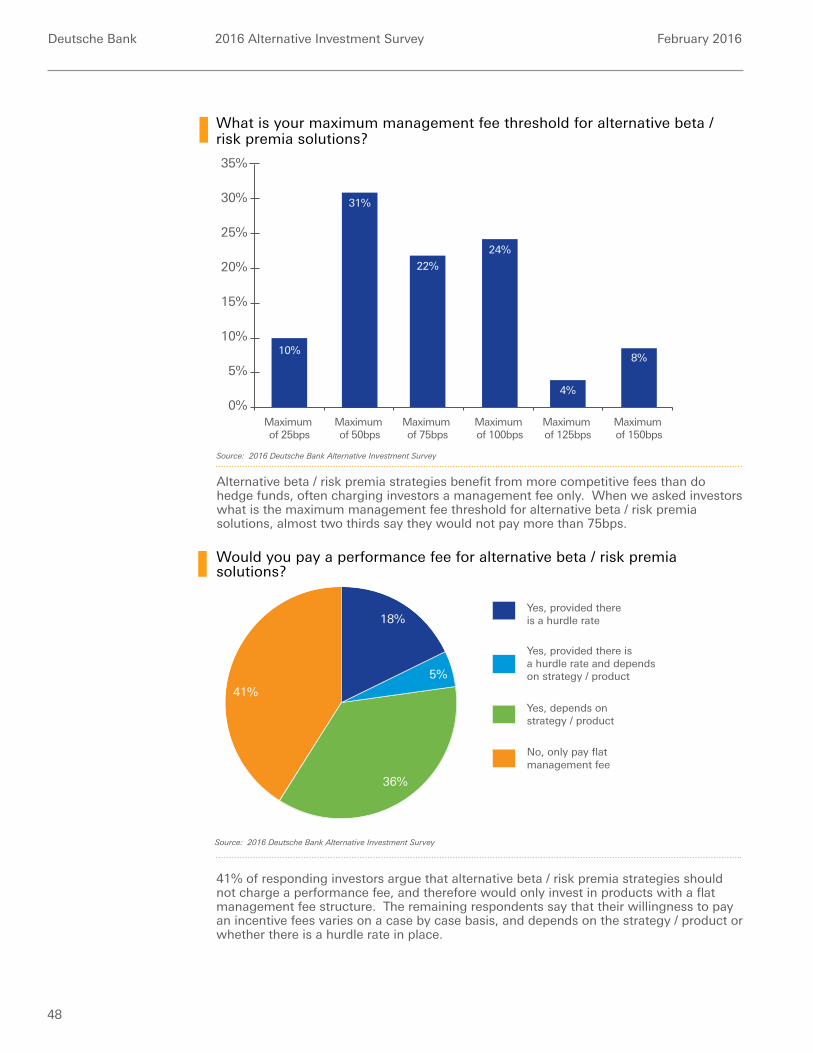
Deutsche Bank 2016 Alternative Investment Survey February 2016
48
What is your maximum management fee threshold for alternative beta / risk premia solutions?
Source: 2016 Deutsche Bank Alternative Investment Survey
15%
10%
5%
0%
20%24%
4%
22%
8%
Maximum of 25bps
Maximum of 50bps
Maximum of 75bps
Maximum of 100bps
Maximum of 125bps
Maximum of 150bps
10%
30%
25%
35%
31%
Alternative beta / risk premia strategies benefit from more competitive fees than do hedge funds, often charging investors a management fee only. When we asked investors what is the maximum management fee threshold for alternative beta / risk premia solutions, almost two thirds say they would not pay more than 75bps.
Would you pay a performance fee for alternative beta / risk premia solutions?
Source: 2016 Deutsche Bank Alternative Investment Survey
Yes, provided there isa hurdle rate and dependson strategy / product
Yes, depends on strategy / product
No, only pay flat management fee
Yes, provided thereis a hurdle rate
41%
5%
36%
18%
41%
41% of responding investors argue that alternative beta / risk premia strategies should not charge a performance fee, and therefore would only invest in products with a flat management fee structure. The remaining respondents say that their willingness to pay an incentive fees varies on a case by case basis, and depends on the strategy / product or whether there is a hurdle rate in place.
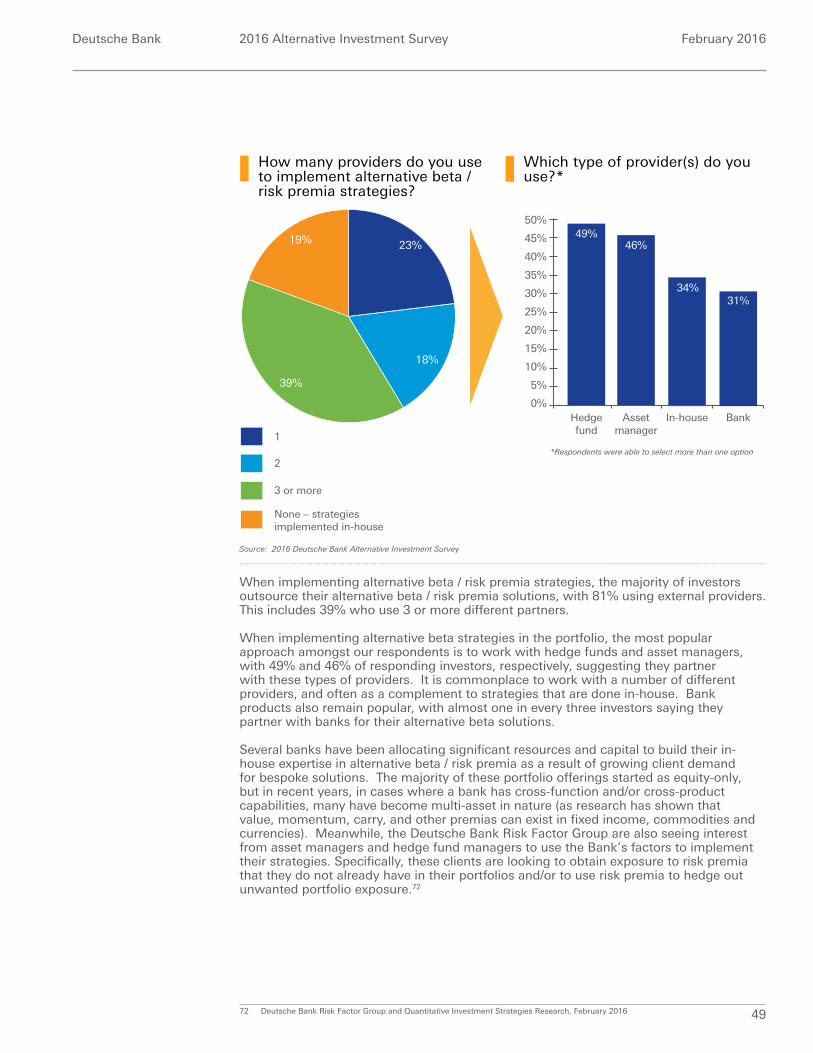
Deutsche Bank 2016 Alternative Investment Survey February 2016
49
How many providers do you use to implement alternative beta / risk premia strategies?
Which type of provider(s) do you use?*
0%
50%
45%
40%
35%
30%
25%
20%
15%
10%
5%
Hedgefund
49%
Assetmanager
46%
In-house
34%
Bank
31%
1
2
3 or more
None – strategies implemented in-house
39%
18%
19% 23%
When implementing alternative beta / risk premia strategies, the majority of investors outsource their alternative beta / risk premia solutions, with 81% using external providers. This includes 39% who use 3 or more different partners.
When implementing alternative beta strategies in the portfolio, the most popular approach amongst our respondents is to work with hedge funds and asset managers, with 49% and 46% of responding investors, respectively, suggesting they partner with these types of providers. It is commonplace to work with a number of different providers, and often as a complement to strategies that are done in-house. Bank products also remain popular, with almost one in every three investors saying they partner with banks for their alternative beta solutions.
Several banks have been allocating significant resources and capital to build their in-house expertise in alternative beta / risk premia as a result of growing client demand for bespoke solutions. The majority of these portfolio offerings started as equity-only, but in recent years, in cases where a bank has cross-function and/or cross-product capabilities, many have become multi-asset in nature (as research has shown that value, momentum, carry, and other premias can exist in fixed income, commodities and currencies). Meanwhile, the Deutsche Bank Risk Factor Group are also seeing interest from asset managers and hedge fund managers to use the Bank’s factors to implement their strategies. Specifically, these clients are looking to obtain exposure to risk premia that they do not already have in their portfolios and/or to use risk premia to hedge out unwanted portfolio exposure.72
72 Deutsche Bank Risk Factor Group and Quantitative Investment Strategies Research, February 2016
Source: 2016 Deutsche Bank Alternative Investment Survey
1
2
3 or more
None – strategies implemented in-house
39%
18%
19% 23%*Respondents were able to select more than one option
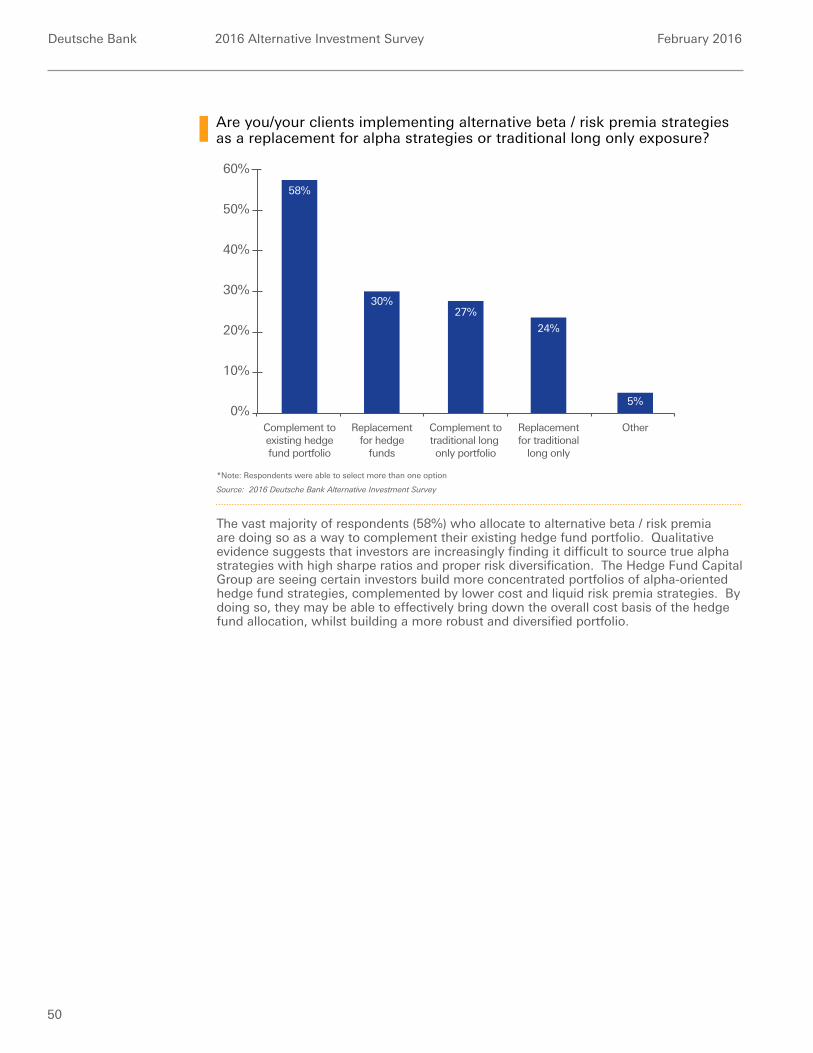
Deutsche Bank 2016 Alternative Investment Survey February 2016
50
Are you/your clients implementing alternative beta / risk premia strategies as a replacement for alpha strategies or traditional long only exposure?
Source: 2016 Deutsche Bank Alternative Investment Survey
*Note: Respondents were able to select more than one option
20%
10%
0%
30%
24%
5%
27%
Complement toexisting hedgefund portfolio
Replacementfor hedge
funds
Complement totraditional long only portfolio
Replacementfor traditional
long only
Other
58%
50%
40%
60%
30%
The vast majority of respondents (58%) who allocate to alternative beta / risk premia are doing so as a way to complement their existing hedge fund portfolio. Qualitative evidence suggests that investors are increasingly finding it difficult to source true alpha strategies with high sharpe ratios and proper risk diversification. The Hedge Fund Capital Group are seeing certain investors build more concentrated portfolios of alpha-oriented hedge fund strategies, complemented by lower cost and liquid risk premia strategies. By doing so, they may be able to effectively bring down the overall cost basis of the hedge fund allocation, whilst building a more robust and diversified portfolio.

Deutsche Bank 2016 Alternative Investment Survey February 2016
51
Allocation plans
51
Deutsche Bank 2016 Alternative Investment Survey February 2016
52
Allocation plansSection highlights:
− Fundamental equity market neutral, discretionary macro and fundamental equity long/short are the top three most sought after strategies in 2016.
− One in every three respondents is increasing their exposure to quantitative strategies in 2016. Notably, the percentage growing their allocation to quantitative equity market neutral managers has increased from 14% to 21% year on year.73
− Based on investors’ net allocation plans, credit strategies are expected to see the most net outflows in 2016.
− Western Europe and Asia Pacific have displaced United States / Canada as the most sought after investment regions for 2016.
We have observed several meaningful changes to investors’ strategy allocations plans year on year.
Increasing demand for equity market neutral:Equity market neutral strategies are now the most in-demand, following a strong year of performance (HFRI Equity Market Neutral Index returned +4.98% in 2015).74 Fundamental equity market neutral is the most requested strategy, moving up the ranks from fifth place last year.75 Concurrently, systematic equity market neutral has moved into fourth place, up from seventh last year.76 Looking ahead to 2016, respondents anticipate that reduced correlation of and increased volatility within global equity markets will create substantial alpha generation opportunities for managers on both the long and the short side. Investors appear set on finding “best in class” active equity managers that can tightly manage risk in these environments, while delivering diversified and uncorrelated returns.
Flows set to continue for systematic funds:Today, 70% of respondents allocate to quantitative strategies. Of these investors, one in every two plan to add to at least one quantitative sub-strategy in 2016 (equating to one in every three of all respondents). Notably, the percentage growing their allocation to systematic equity market neutral managers has increased from 14% to 21% year on year.77 Investment consultants and institutional investors are driving demand: 55% and 50% of these segments, respectively, plan to add to one or more quantitative strategies, including quant equity market neutral, CTA, quant macro, quant equity, and quant multi-strategy.
Rebalancing of event driven exposure:For the past two years, event driven has been the most sought after strategy among global investors.78 After 2015 saw the HFRI Event Driven index post a -2.93% decline, investors appear somewhat cautious in their outlook for the strategy: 16% feel that it is an opportune time to add to the strategy, whilst 20% are planning to reduce.79 While for some this reflects a shift in strategy allocation, for others it is part of their year-end portfolio rebalancing. A number of investors have indicated that they are planning to redeem from some underperformers and reallocate proceeds to other event driven managers, with several requests coming in for opportunistic merger arbitrage managers. With global M&A volumes at all time peak levels and deal spreads at their widest levels, a number of hedge fund managers and investors alike feel that merger arbitrage is poised to offer some of the best alpha opportunities in year ahead.80 Deutsche Bank strategists concur suggesting that a favourable macro backdrop and strong micro factors will continue to underpin strong M&A activity throughout 2016.81 This will be a key area to watch in 2016.
Continued appetite for discretionary global macro managers:Year on year, global discretionary macro has maintained its place as the second most sought after strategy amongst respondents. Over the past 12 months, we have witnessed an uptick in high profile discretionary global macro launches with significant AUM. Given the continued demand for the strategy, it is perhaps not surprisingly that these managers were able to amass significant capital within the first six months of trading from sophisticated institutional allocators.
73 2015 Deutsche Bank Alternative Investment Survey74 HFR Industry Reports © HFR., “Global Hedge Fund Industry Report – Year End 2015”75 2015 Deutsche Bank Alternative Investment Survey76 2015 Deutsche Bank Alternative Investment Survey77 2015 Deutsche Bank Alternative Investment Survey78 2015 Deutsche Bank Alternative Investment Survey; 2014 Deutsche Bank Alternative Investment Survey79 HFR Industry Reports © HFR., “Global Hedge Fund Industry Report – Year End 2015”, www.HedgeFundResearch.com80 Deutsche Bank Special Situations Group – Global M&A, “DB State of the Union”, January 2016; Deutsche Bank Hedge Fund Capital
Group, February 201681 Deutsche Bank Special Situations Group – Global M&A, “DB State of the Union”, January 2016
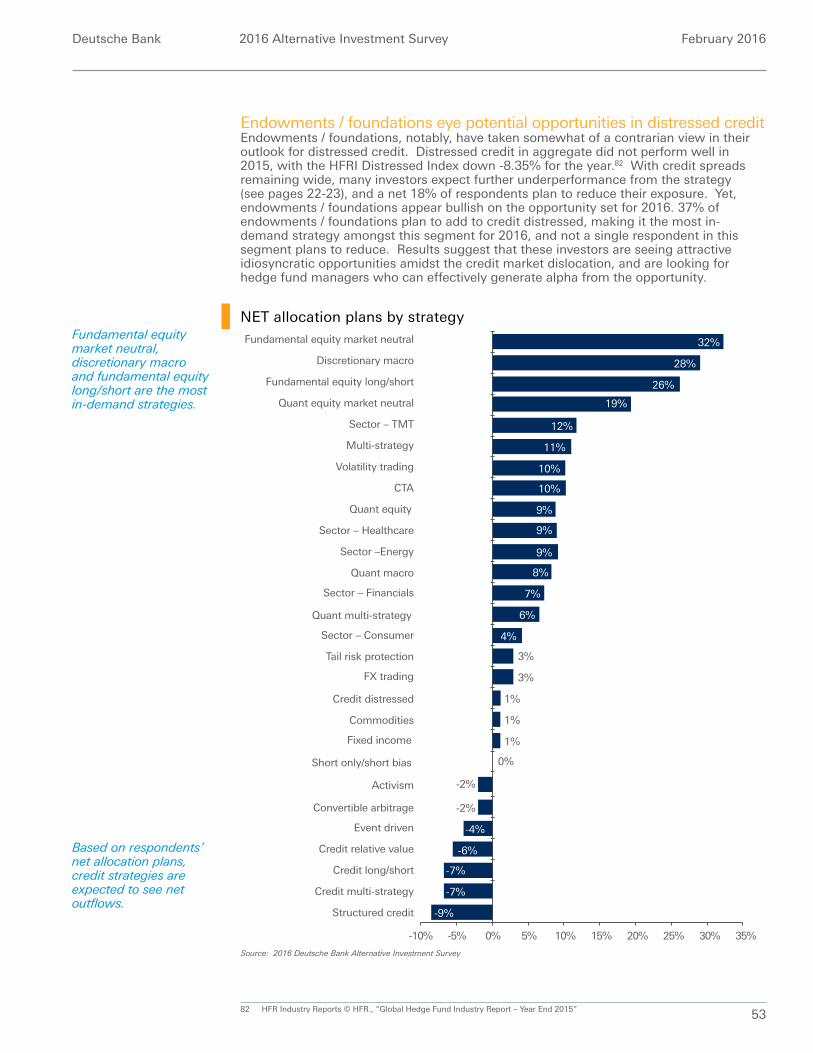
Deutsche Bank 2016 Alternative Investment Survey February 2016
53
Endowments / foundations eye potential opportunities in distressed creditEndowments / foundations, notably, have taken somewhat of a contrarian view in their outlook for distressed credit. Distressed credit in aggregate did not perform well in 2015, with the HFRI Distressed Index down -8.35% for the year.82 With credit spreads remaining wide, many investors expect further underperformance from the strategy (see pages 22-23), and a net 18% of respondents plan to reduce their exposure. Yet, endowments / foundations appear bullish on the opportunity set for 2016. 37% of endowments / foundations plan to add to credit distressed, making it the most in-demand strategy amongst this segment for 2016, and not a single respondent in this segment plans to reduce. Results suggest that these investors are seeing attractive idiosyncratic opportunities amidst the credit market dislocation, and are looking for hedge fund managers who can effectively generate alpha from the opportunity.
82 HFR Industry Reports © HFR., “Global Hedge Fund Industry Report – Year End 2015”
NET allocation plans by strategy
Source: 2016 Deutsche Bank Alternative Investment Survey
Sector – TMT
Sector – Financials
Fundamental equity market neutral
Credit multi-strategy
Quant equity
Quant equity market neutral
Sector – Healthcare
Structured credit
Quant macro
FX trading
Volatility trading
Activism
Credit long/short
Event driven
Fixed income
Short only/short bias
Credit relative value
CTA
Commodities
Credit distressed
Discretionary macro
Fundamental equity long/short
10% 25%20%15% 30% 35%5%0%-5%-10%
32%
28%
26%
19%
12%
10%
10%
9%
9%
9%
8%
7%
6%
4%
3%
3%
1%
Sector –Energy
Quant multi-strategy
Convertible arbitrage
Tail risk protection
Sector – Consumer
1%
1%
0%
-2%
-2%
-4%
-6%
-7%
-7%
-9%
Multi-strategy 11%
Fundamental equity market neutral, discretionary macro and fundamental equity long/short are the most in-demand strategies.
Based on respondents’ net allocation plans, credit strategies are expected to see net outflows.
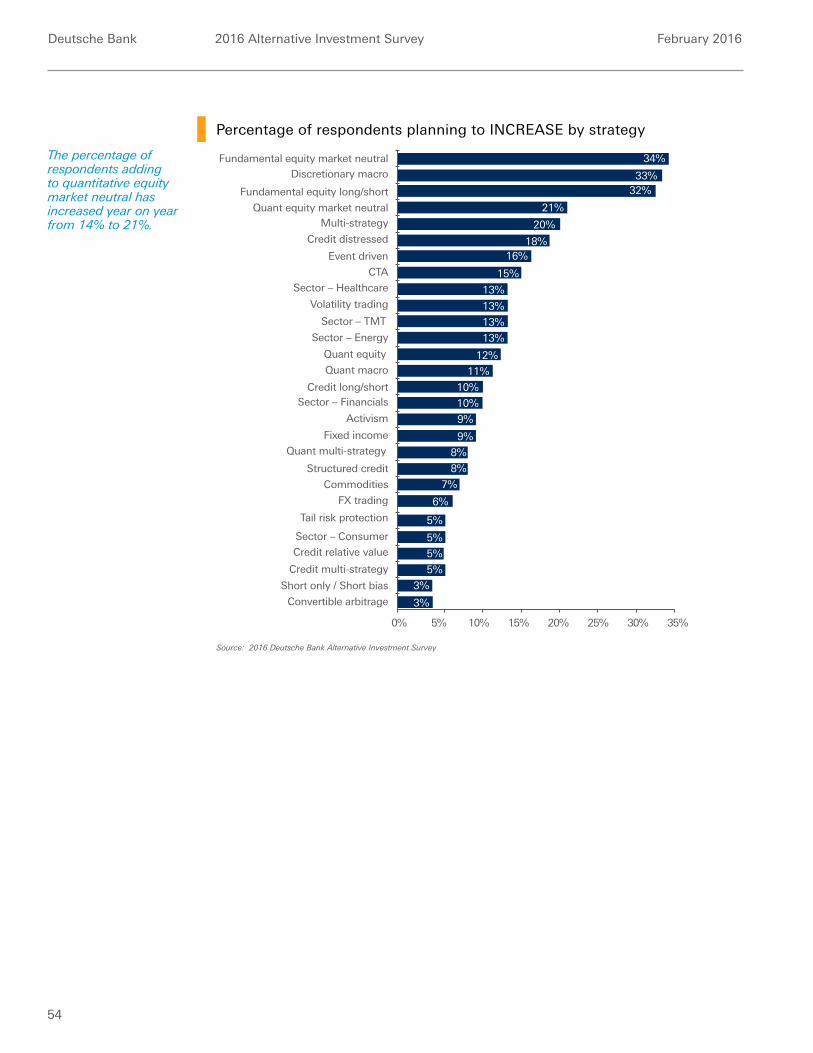
Deutsche Bank 2016 Alternative Investment Survey February 2016
54
Percentage of respondents planning to INCREASE by strategy
Source: 2016 Deutsche Bank Alternative Investment Survey
Multi-strategy
Credit distressed
Fundamental equity market neutral
Credit multi-strategy
Quant equity
Commodities
Structured credit
Quant macro
FX trading
Volatility trading
Credit long/short
Fixed income
Credit relative value
CTA
Event driven
Discretionary macro
Fundamental equity long/short
10% 25%20%15% 30% 35%5%0%
34%
33%32%
21%
20%
18%16%
15%
13%
13%
13%
13%
12%
11%
10%
10%
9%Activism
Quant multi-strategy
Short only / Short bias
Convertible arbitrage
Tail risk protection
9%
8%
8%
7%
6%
Quant equity market neutral
Sector – Healthcare
Sector – Consumer
5%
Sector – TMT
Sector – Financials
Sector – Energy
5%
5%
5%
3%
3%
The percentage of respondents adding to quantitative equity market neutral has increased year on year from 14% to 21%.
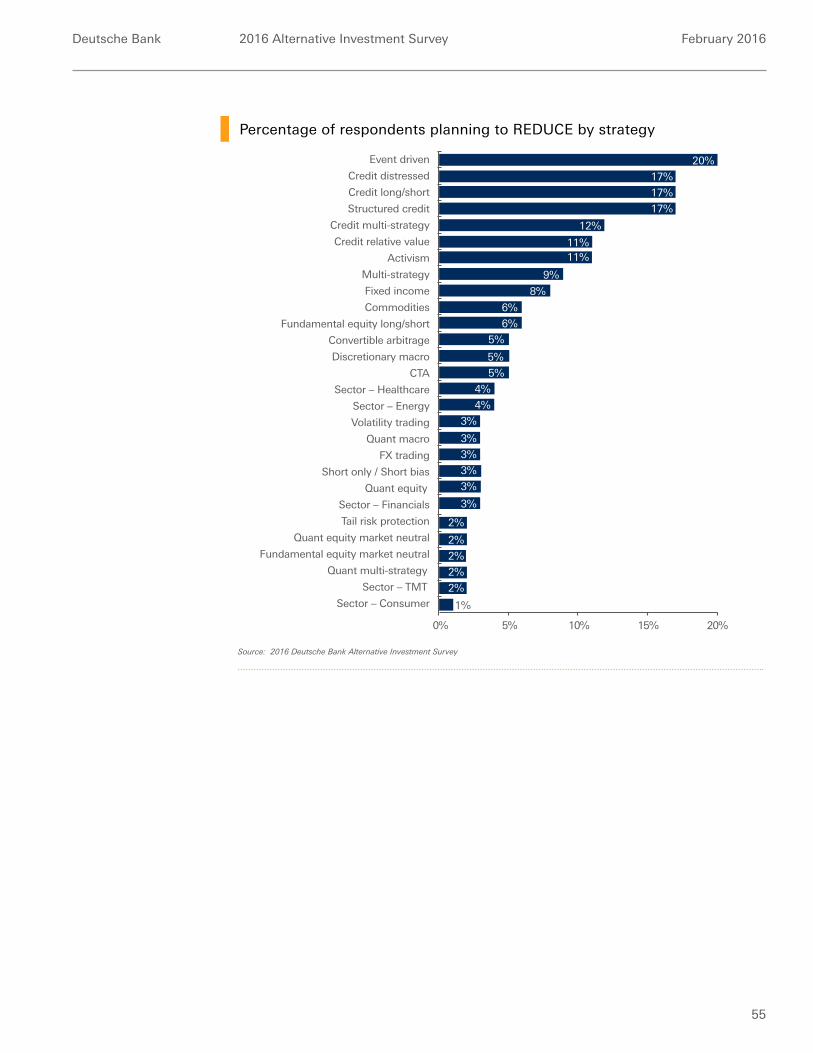
Deutsche Bank 2016 Alternative Investment Survey February 2016
55
Percentage of respondents planning to REDUCE by strategy
Source: 2016 Deutsche Bank Alternative Investment Survey
Multi-strategy
Credit distressed
Fundamental equity long/short
Credit multi-strategy
Quant equity
Commodities
Structured credit
Quant macro
FX trading
Volatility trading
Credit long/short
Fixed income
Credit relative value
CTA
Event driven
Discretionary macro
Fundamental equity market neutral
10%5% 15% 20%0%
20%
17%
17%
17%
12%
11%11%
9%
8%
6%
6%
5%
5%
5%
4%
4%
3%
Activism
Quant multi-strategy
Short only / Short bias
Convertible arbitrage
Tail risk protection
3%
3%
3%
3%
3%
Quant equity market neutral
Sector – Healthcare
Sector – Consumer
2%
Sector – TMT
Sector – Financials
Sector – Energy
2%
2%
2%
2%
1%
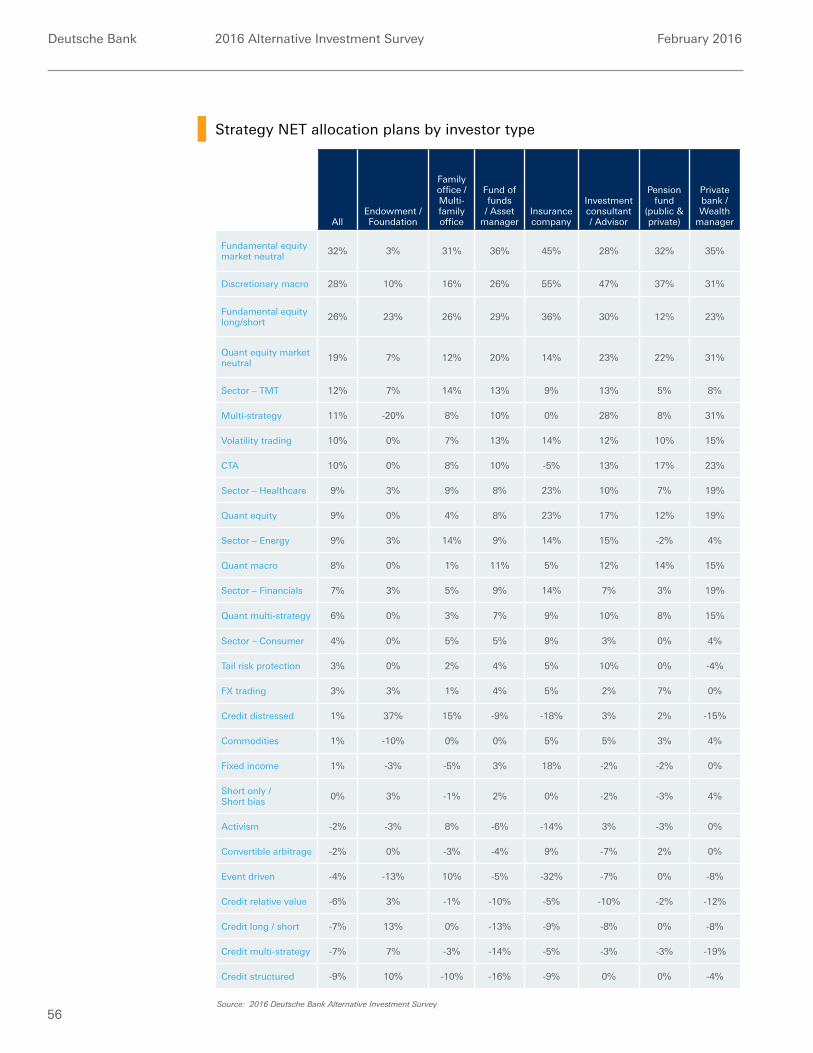
Deutsche Bank 2016 Alternative Investment Survey February 2016
56
Strategy NET allocation plans by investor type
AllEndowment / Foundation
Family office / Multi-family office
Fund of funds / Asset
managerInsurance company
Investment consultant / Advisor
Pension fund
(public & private)
Private bank / Wealth
manager
Fundamental equity market neutral 32% 3% 31% 36% 45% 28% 32% 35%
Discretionary macro 28% 10% 16% 26% 55% 47% 37% 31%
Fundamental equity long/short 26% 23% 26% 29% 36% 30% 12% 23%
Quant equity market neutral 19% 7% 12% 20% 14% 23% 22% 31%
Sector – TMT 12% 7% 14% 13% 9% 13% 5% 8%
Multi-strategy 11% -20% 8% 10% 0% 28% 8% 31%
Volatility trading 10% 0% 7% 13% 14% 12% 10% 15%
CTA 10% 0% 8% 10% -5% 13% 17% 23%
Sector – Healthcare 9% 3% 9% 8% 23% 10% 7% 19%
Quant equity 9% 0% 4% 8% 23% 17% 12% 19%
Sector – Energy 9% 3% 14% 9% 14% 15% -2% 4%
Quant macro 8% 0% 1% 11% 5% 12% 14% 15%
Sector – Financials 7% 3% 5% 9% 14% 7% 3% 19%
Quant multi-strategy 6% 0% 3% 7% 9% 10% 8% 15%
Sector – Consumer 4% 0% 5% 5% 9% 3% 0% 4%
Tail risk protection 3% 0% 2% 4% 5% 10% 0% -4%
FX trading 3% 3% 1% 4% 5% 2% 7% 0%
Credit distressed 1% 37% 15% -9% -18% 3% 2% -15%
Commodities 1% -10% 0% 0% 5% 5% 3% 4%
Fixed income 1% -3% -5% 3% 18% -2% -2% 0%
Short only / Short bias 0% 3% -1% 2% 0% -2% -3% 4%
Activism -2% -3% 8% -6% -14% 3% -3% 0%
Convertible arbitrage -2% 0% -3% -4% 9% -7% 2% 0%
Event driven -4% -13% 10% -5% -32% -7% 0% -8%
Credit relative value -6% 3% -1% -10% -5% -10% -2% -12%
Credit long / short -7% 13% 0% -13% -9% -8% 0% -8%
Credit multi-strategy -7% 7% -3% -14% -5% -3% -3% -19%
Credit structured -9% 10% -10% -16% -9% 0% 0% -4%
Source: 2016 Deutsche Bank Alternative Investment Survey
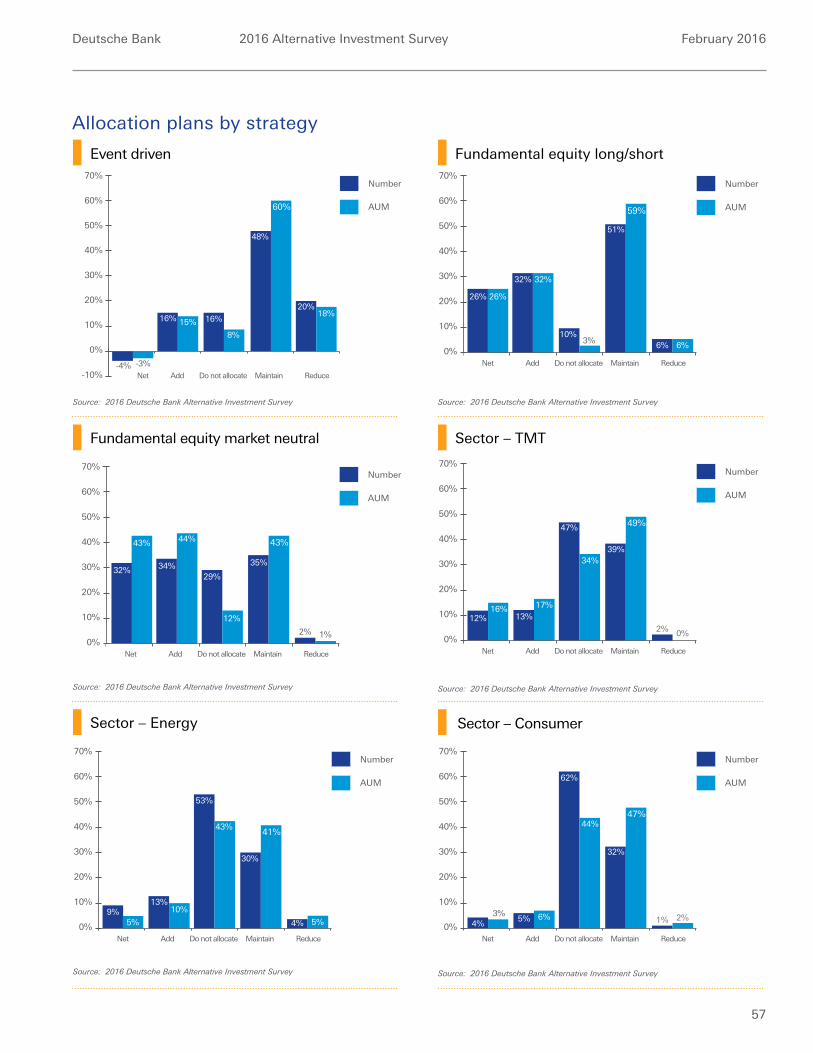
Deutsche Bank 2016 Alternative Investment Survey February 2016
57
Allocation plans by strategy
Fundamental equity long/short
Sector – TMT
Sector – Energy
Fundamental equity market neutral
Event driven
Sector – Consumer
30%
20%
10%
0%
40%
Net Add Do not allocate Maintain Reduce
26%
32% 32%
26%
10%3%
59%
51%
6% 6%
50%
60%
70%Number
AUM
30%
20%
10%
0%
40%
Net Add Do not allocate Maintain Reduce
9%13%
10%
5%
53%
43%41%
30%
4% 5%
50%
60%
70%Number
AUM
Net Add Do not allocate Maintain Reduce
32% 34%
44%43%
29%
12%
43%
35%
2% 1%
Number
AUM
30%
20%
10%
0%
40%
50%
60%
70%
30%
20%
10%
0%
-10%
40%
Net Add Do not allocate Maintain Reduce-4%
16% 15% 16%
8%
60%
48%
20%18%
50%
60%
70%Number
AUM
-3%
30%
20%
10%
0%
40%
Net Add Do not allocate Maintain Reduce
4%5% 6%3%
62%
44%47%
32%
50%
60%
70%Number
AUM
1% 2%
30%
20%
10%
0%
40%
Net Add Do not allocate Maintain Reduce
12% 13%17%16%
47%
34%
49%
39%
50%
60%
70%Number
AUM
2% 0%
Source: 2016 Deutsche Bank Alternative Investment Survey
Source: 2016 Deutsche Bank Alternative Investment Survey
Source: 2016 Deutsche Bank Alternative Investment Survey
Source: 2016 Deutsche Bank Alternative Investment Survey
Source: 2016 Deutsche Bank Alternative Investment Survey
Source: 2016 Deutsche Bank Alternative Investment Survey
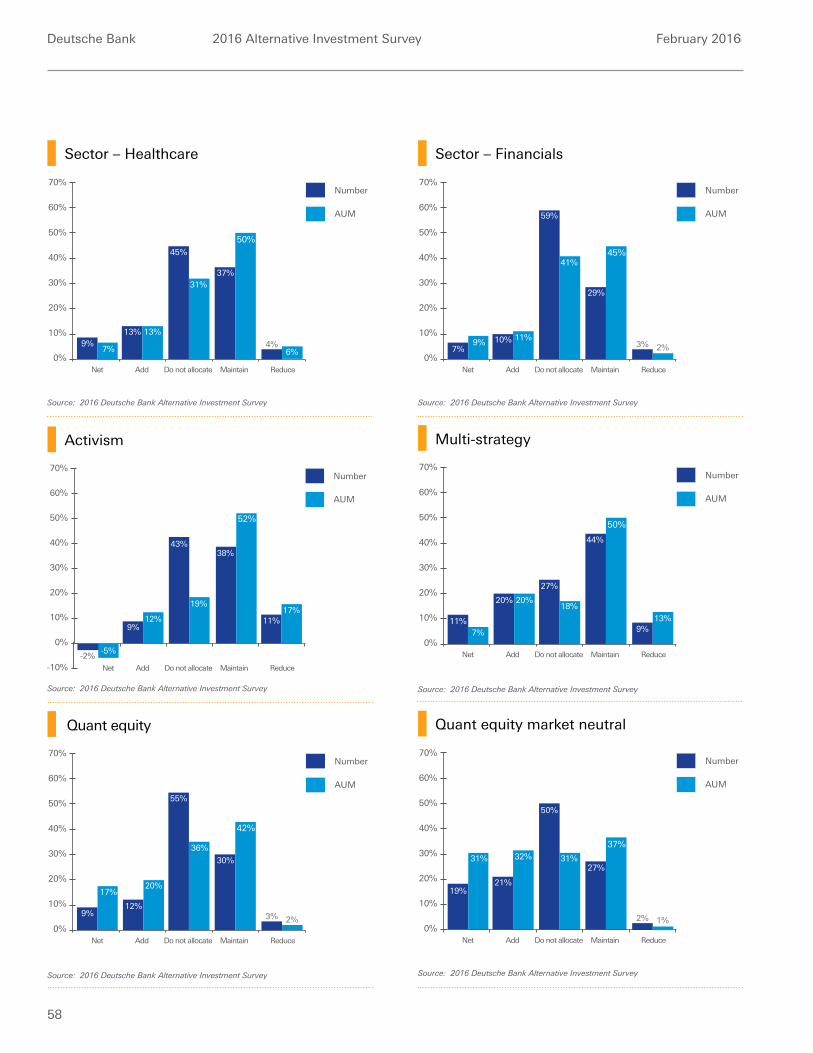
Deutsche Bank 2016 Alternative Investment Survey February 2016
58
Sector – Healthcare Sector – Financials
Quant equity market neutral
30%
20%
10%
0%
40%
Net Add Do not allocate Maintain Reduce
9%13% 13%
7%
45%
31%
50%
37%
50%
60%
70%Number
AUM
4%6%
30%
20%
10%
0%
40%
Net Add Do not allocate Maintain Reduce
7%10% 11%
9%
59%
41%45%
29%
50%
60%
70%Number
AUM
3% 2%
30%
20%
10%
0%
40%
Net Add Do not allocate Maintain Reduce
19%21%
32%31%
50%
31%
37%
27%
50%
60%
70%Number
AUM
2% 1%
Source: 2016 Deutsche Bank Alternative Investment Survey Source: 2016 Deutsche Bank Alternative Investment Survey
Source: 2016 Deutsche Bank Alternative Investment Survey
Deutsche Bank 2016 Alternative Investment Survey February 2016
Activism
30%
20%
10%
0%
-10%
40%
Net Add Do not allocate Maintain Reduce
-2%
9%12%
43%
19%
52%
38%
11%17%
50%
60%
70%Number
AUM
-5%
Source: 2016 Deutsche Bank Alternative Investment Survey
Multi-strategy
30%
20%
10%
0%
40%
Net Add Do not allocate Maintain Reduce
11%
20% 20%
7%
27%
18%
50%
44%
9%13%
50%
60%
70%Number
AUM
Source: 2016 Deutsche Bank Alternative Investment Survey
Quant equity
30%
20%
10%
0%
40%
Net Add Do not allocate Maintain Reduce
9%12%
20%17%
55%
36%
42%
30%
50%
60%
70%Number
AUM
3% 2%
Source: 2016 Deutsche Bank Alternative Investment Survey
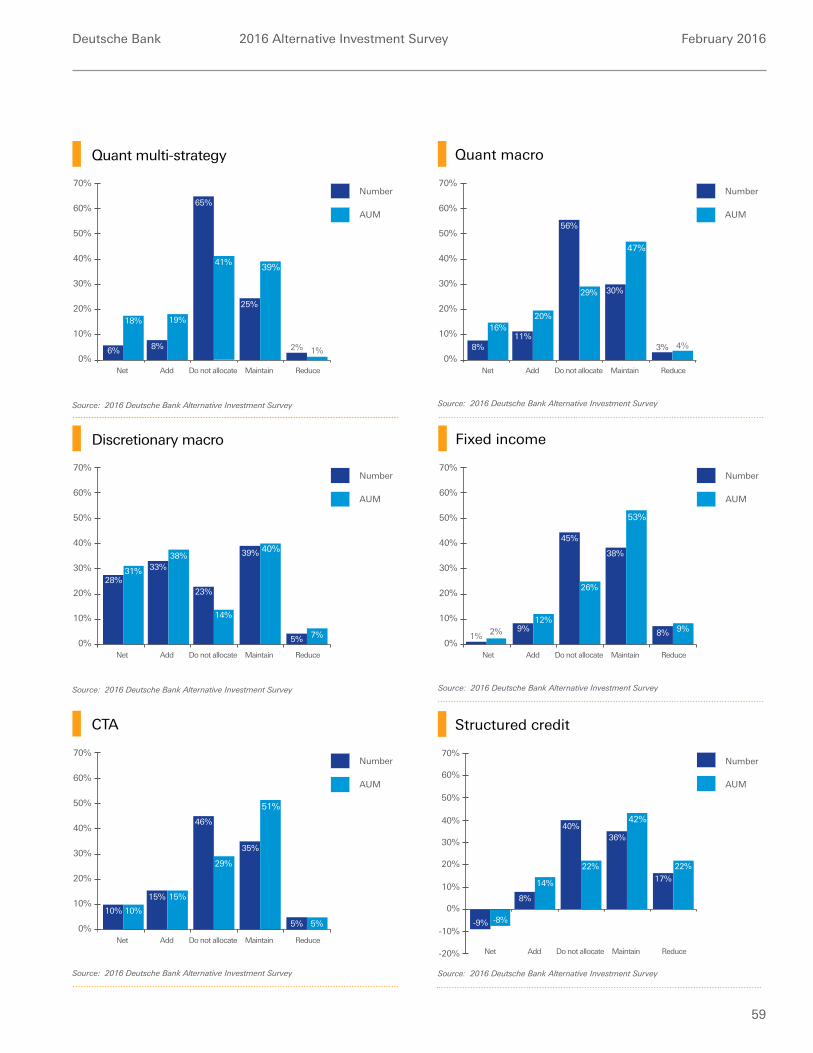
Deutsche Bank 2016 Alternative Investment Survey February 2016
59
Quant macroQuant multi-strategy
30%
20%
10%
0%
40%
Net Add Do not allocate Maintain Reduce
8%11%
20%16%
56%
29%
47%
30%
3% 4%
50%
60%
70%Number
AUM
Net Add Do not allocate Maintain Reduce
6% 8%
19%18%
65%
41%39%
25%
Number
AUM
30%
20%
10%
0%
40%
50%
60%
70%
2% 1%
Source: 2016 Deutsche Bank Alternative Investment SurveySource: 2016 Deutsche Bank Alternative Investment Survey
Structured credit
30%
20%
10%
0%
-10%
-20%
40%
Net Add Do not allocate Maintain Reduce
-9%
8%
14%
-8%
40%
22%
42%
36%
50%
60%
70%Number
AUM
17%
22%
Source: 2016 Deutsche Bank Alternative Investment Survey
Discretionary macro
Net Add Do not allocate Maintain Reduce
28%
33%38%
31%
23%
14%
40%39%
5% 7%
Number
AUM
30%
20%
10%
0%
40%
50%
60%
70%
Source: 2016 Deutsche Bank Alternative Investment Survey
Fixed income
30%
20%
10%
0%
40%
Net Add Do not allocate Maintain Reduce
2% 9%12%
1%
45%
26%
53%
38%
8% 9%
50%
60%
70%Number
AUM
Source: 2016 Deutsche Bank Alternative Investment Survey
CTA
Net Add Do not allocate Maintain Reduce
10%
15% 15%
10%
46%
29%
51%
35%
5% 5%
Number
AUM
30%
20%
10%
0%
40%
50%
60%
70%
Source: 2016 Deutsche Bank Alternative Investment Survey
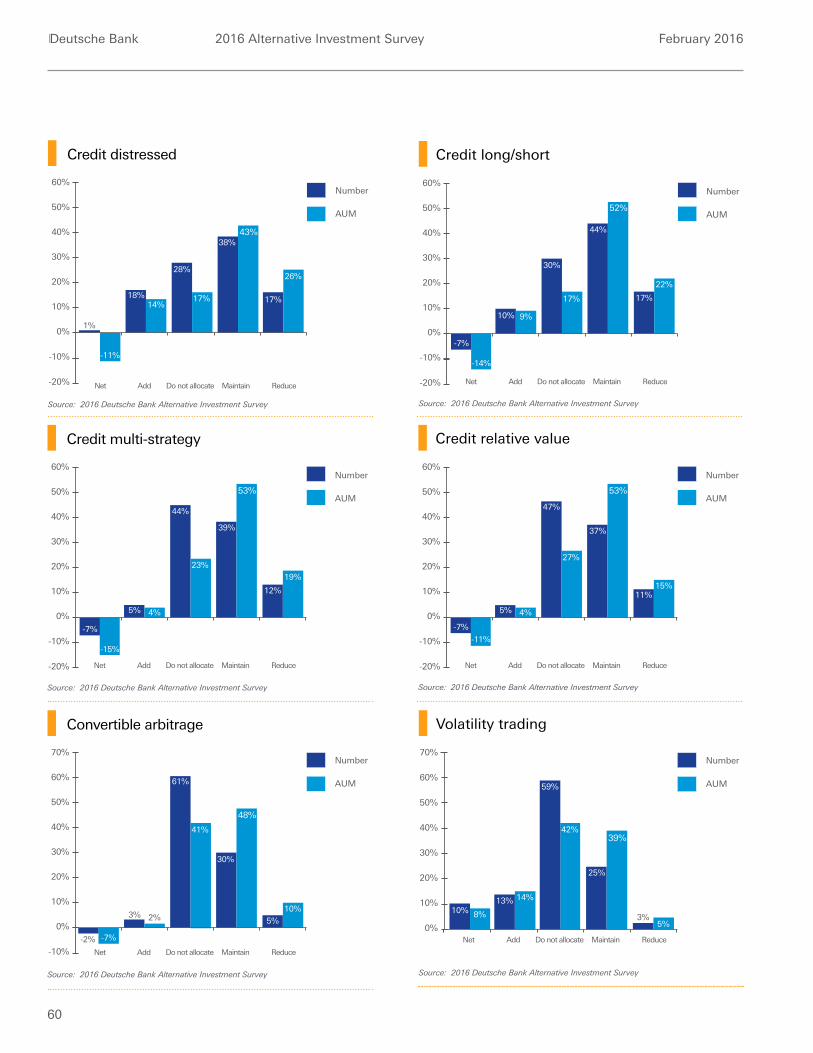
Deutsche Bank 2016 Alternative Investment Survey February 2016
60
Volatility trading
Net Add Do not allocate Maintain Reduce
10%13% 14%
8%
59%
42%39%
25%
3%5%
Number
AUM
30%
20%
10%
0%
40%
50%
60%
70%
Source: 2016 Deutsche Bank Alternative Investment Survey
Deutsche Bank 2016 Alternative Investment Survey February 2016
Credit long/short
Credit relative valueCredit multi-strategy
Convertible arbitrage
Net Add Do not allocate Maintain Reduce
-7%
10% 9%
-14%
30%
17%
52%
44%
Number
AUM
17%
22%
30%
20%
10%
0%
-10%
40%
50%
60%
-20%
Net Add Do not allocate Maintain Reduce
-7%
5% 4%
-11%
47%
27%
53%
37%
Number
AUM
11%15%
30%
20%
10%
0%
-10%
40%
50%
60%
-20%Net Add Do not allocate Maintain Reduce
-7%
5% 4%
-15%
44%
23%
53%
39%
Number
AUM
12%
19%
30%
20%
10%
0%
-10%
40%
50%
60%
-20%
30%
20%
10%
0%
-10%
40%
Net Add Do not allocate Maintain Reduce
-2%
3% 2%
-7%
61%
41%
48%
30%
5%
10%
50%
60%
70%Number
AUM
Source: 2016 Deutsche Bank Alternative Investment Survey
Source: 2016 Deutsche Bank Alternative Investment SurveySource: 2016 Deutsche Bank Alternative Investment Survey
Source: 2016 Deutsche Bank Alternative Investment Survey
Credit distressed
30%
20%
10%
0%
-10%
40%
Net Add Do not allocate Maintain Reduce
1%
18%14%
28%
17%
43%38%
17%
26%
50%
60%Number
AUM
-20%
-11%
Source: 2016 Deutsche Bank Alternative Investment Survey
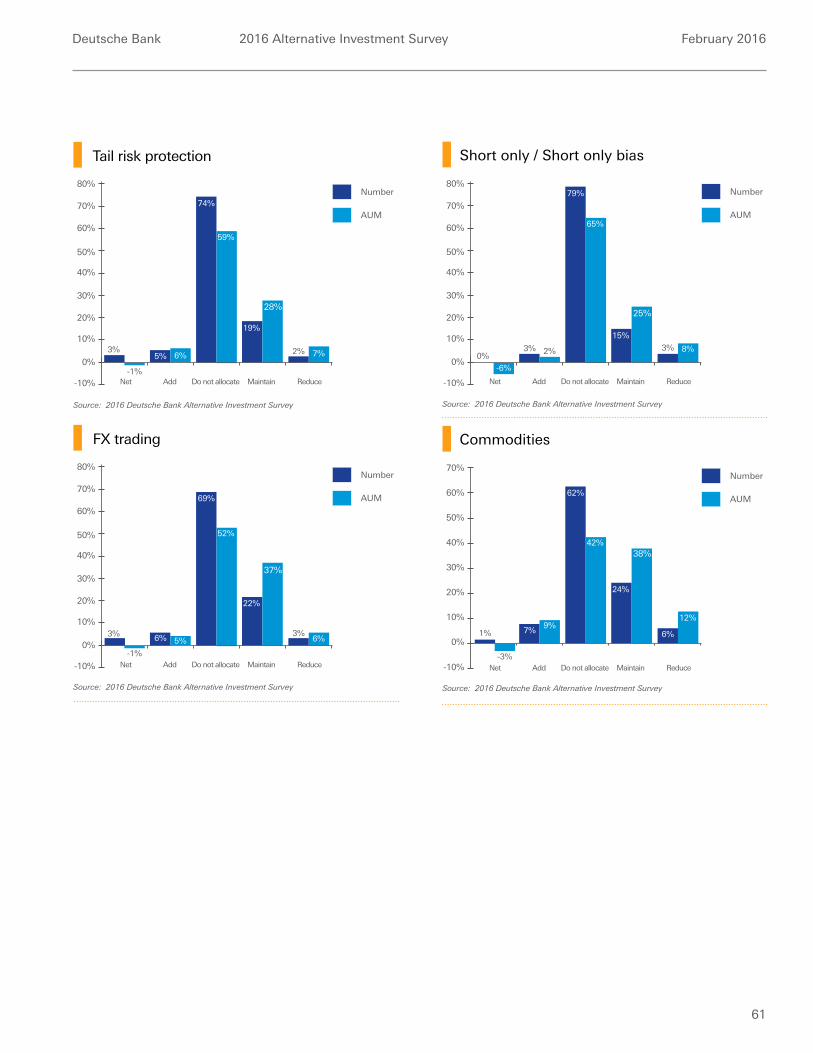
Deutsche Bank 2016 Alternative Investment Survey February 2016
61
Short only / Short only bias
Commodities
Tail risk protection
FX trading
30%
20%
10%
0%
-10%
40%
Net Add Do not allocate Maintain Reduce
0%3% 2%
-6%
79%
65%
25%
15%
3% 8%
50%
60%
70%
80%Number
AUM
30%
20%
10%
0%
-10%
40%
Net Add Do not allocate Maintain Reduce
1% 7%9%
-3%
62%
42%38%
24%
6%
12%
50%
60%
70%Number
AUM
30%
20%
10%
0%
-10%
40%
Net Add Do not allocate Maintain Reduce
3%5% 6%
-1%
74%
59%
28%
19%
2% 7%
50%
60%
70%
80%Number
AUM
30%
20%
10%
0%
-10%
40%
Net Add Do not allocate Maintain Reduce
3% 6% 5%
-1%
69%
52%
37%
22%
3%6%
50%
60%
70%
80%Number
AUM
Source: 2016 Deutsche Bank Alternative Investment Survey
Source: 2016 Deutsche Bank Alternative Investment Survey
Source: 2016 Deutsche Bank Alternative Investment Survey
Source: 2016 Deutsche Bank Alternative Investment Survey
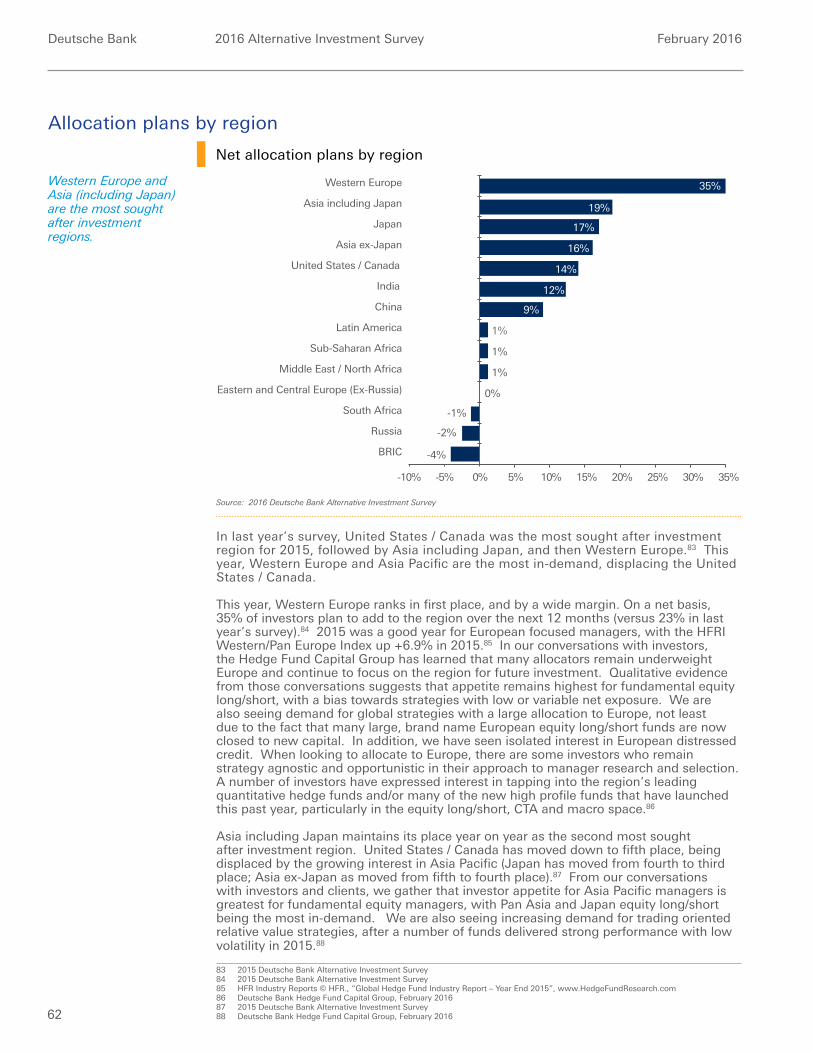
Deutsche Bank 2016 Alternative Investment Survey February 2016
62
Net allocation plans by region
Source: 2016 Deutsche Bank Alternative Investment Survey
Western Europe
Russia
Japan
Asia including Japan
BRIC
Sub-Saharan Africa
South Africa
Middle East / North Africa
35%
19%
17%
16%
14%
12%
9%
1%
1%
India
China
Latin America
Eastern and Central Europe (Ex-Russia)
Asia ex-Japan
United States / Canada
1%
0%
-1%
-2%
-4%
10% 25%20%15% 30% 35%5%0%-5%-10%
In last year’s survey, United States / Canada was the most sought after investment region for 2015, followed by Asia including Japan, and then Western Europe.83 This year, Western Europe and Asia Pacific are the most in-demand, displacing the United States / Canada.
This year, Western Europe ranks in first place, and by a wide margin. On a net basis, 35% of investors plan to add to the region over the next 12 months (versus 23% in last year’s survey).84 2015 was a good year for European focused managers, with the HFRI Western/Pan Europe Index up +6.9% in 2015.85 In our conversations with investors, the Hedge Fund Capital Group has learned that many allocators remain underweight Europe and continue to focus on the region for future investment. Qualitative evidence from those conversations suggests that appetite remains highest for fundamental equity long/short, with a bias towards strategies with low or variable net exposure. We are also seeing demand for global strategies with a large allocation to Europe, not least due to the fact that many large, brand name European equity long/short funds are now closed to new capital. In addition, we have seen isolated interest in European distressed credit. When looking to allocate to Europe, there are some investors who remain strategy agnostic and opportunistic in their approach to manager research and selection. A number of investors have expressed interest in tapping into the region’s leading quantitative hedge funds and/or many of the new high profile funds that have launched this past year, particularly in the equity long/short, CTA and macro space.86
Asia including Japan maintains its place year on year as the second most sought after investment region. United States / Canada has moved down to fifth place, being displaced by the growing interest in Asia Pacific (Japan has moved from fourth to third place; Asia ex-Japan as moved from fifth to fourth place).87 From our conversations with investors and clients, we gather that investor appetite for Asia Pacific managers is greatest for fundamental equity managers, with Pan Asia and Japan equity long/short being the most in-demand. We are also seeing increasing demand for trading oriented relative value strategies, after a number of funds delivered strong performance with low volatility in 2015.88
83 2015 Deutsche Bank Alternative Investment Survey84 2015 Deutsche Bank Alternative Investment Survey85 HFR Industry Reports © HFR., “Global Hedge Fund Industry Report – Year End 2015”, www.HedgeFundResearch.com86 Deutsche Bank Hedge Fund Capital Group, February 201687 2015 Deutsche Bank Alternative Investment Survey88 Deutsche Bank Hedge Fund Capital Group, February 2016
Allocation plans by region
Western Europe and Asia (including Japan) are the most sought after investment regions.
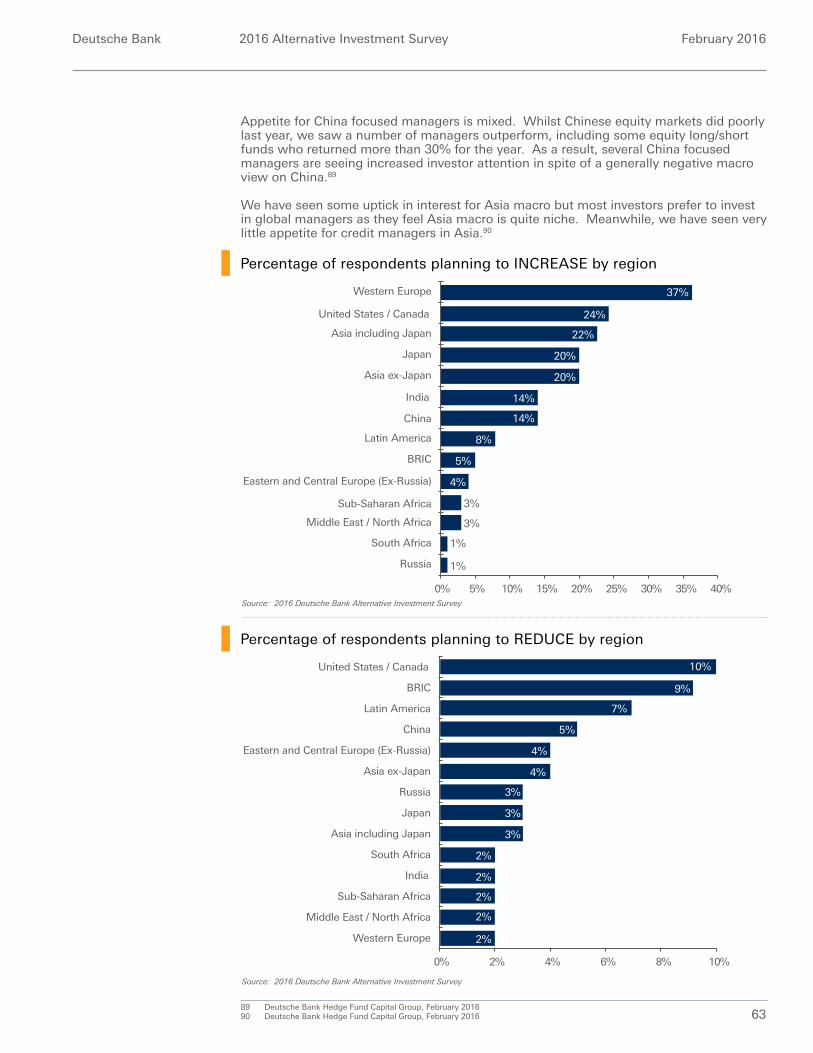
Deutsche Bank 2016 Alternative Investment Survey February 2016
63
Appetite for China focused managers is mixed. Whilst Chinese equity markets did poorly last year, we saw a number of managers outperform, including some equity long/short funds who returned more than 30% for the year. As a result, several China focused managers are seeing increased investor attention in spite of a generally negative macro view on China.89
We have seen some uptick in interest for Asia macro but most investors prefer to invest in global managers as they feel Asia macro is quite niche. Meanwhile, we have seen very little appetite for credit managers in Asia.90
89 Deutsche Bank Hedge Fund Capital Group, February 201690 Deutsche Bank Hedge Fund Capital Group, February 2016
Percentage of respondents planning to INCREASE by region
Percentage of respondents planning to REDUCE by region
Source: 2016 Deutsche Bank Alternative Investment Survey
Source: 2016 Deutsche Bank Alternative Investment Survey
Western Europe
Asia including Japan
Sub-Saharan Africa
United States / Canada
Russia
Japan
BRIC
South Africa
Middle East / North Africa
10% 25%20%15% 35%30% 40%5%0%
37%
24%
22%
20%
20%
14%
14%
8%
5%
India
China
Latin America
Eastern and Central Europe (Ex-Russia)
Asia ex-Japan
4%
3%
3%
1%
1%
Sub-Saharan Africa
United States / Canada
Russia
Asia including Japan
Japan
China
BRIC
South Africa
Middle East / North Africa
Western Europe
4% 8%6% 10%2%0%
10%
9%
7%
5%
4%
4%
3%
3%
3%
India
Latin America
Eastern and Central Europe (Ex-Russia)
Asia ex-Japan
2%
2%
2%
2%
2%
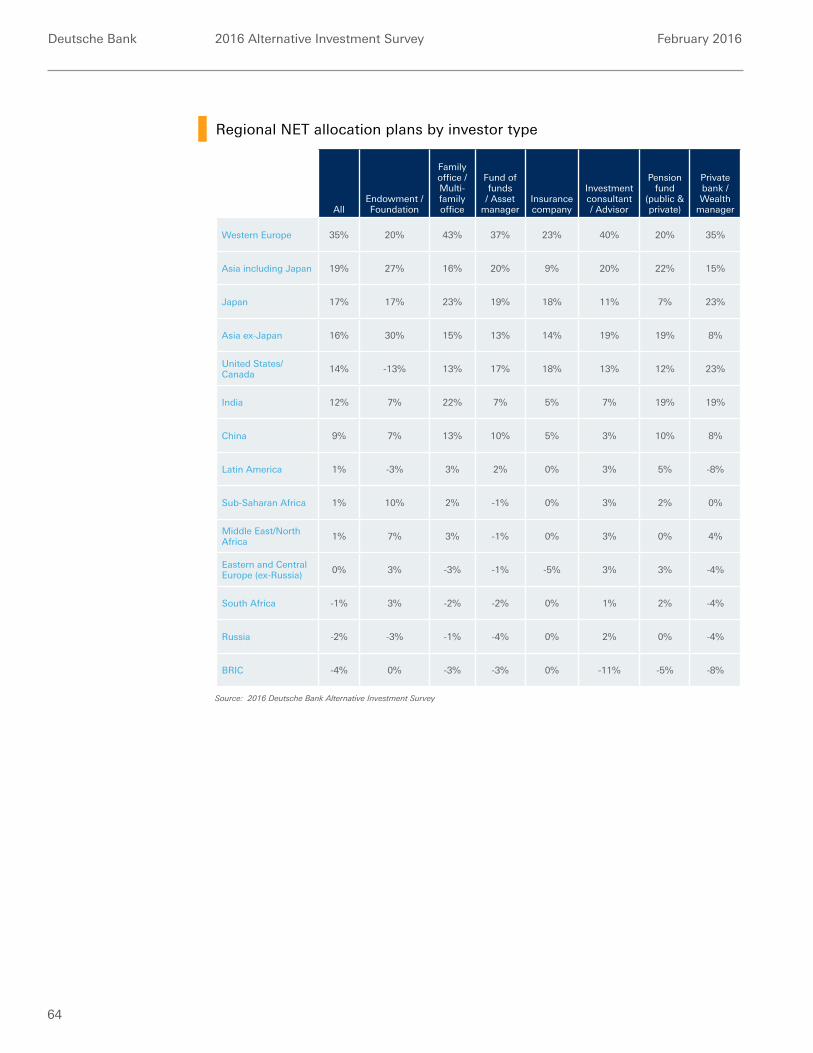
Deutsche Bank 2016 Alternative Investment Survey February 2016
64
Regional NET allocation plans by investor type
AllEndowment / Foundation
Family office / Multi-family office
Fund of funds / Asset
managerInsurance company
Investment consultant / Advisor
Pension fund
(public & private)
Private bank / Wealth
manager
Western Europe 35% 20% 43% 37% 23% 40% 20% 35%
Asia including Japan 19% 27% 16% 20% 9% 20% 22% 15%
Japan 17% 17% 23% 19% 18% 11% 7% 23%
Asia ex-Japan 16% 30% 15% 13% 14% 19% 19% 8%
United States/Canada 14% -13% 13% 17% 18% 13% 12% 23%
India 12% 7% 22% 7% 5% 7% 19% 19%
China 9% 7% 13% 10% 5% 3% 10% 8%
Latin America 1% -3% 3% 2% 0% 3% 5% -8%
Sub-Saharan Africa 1% 10% 2% -1% 0% 3% 2% 0%
Middle East/North Africa 1% 7% 3% -1% 0% 3% 0% 4%
Eastern and Central Europe (ex-Russia) 0% 3% -3% -1% -5% 3% 3% -4%
South Africa -1% 3% -2% -2% 0% 1% 2% -4%
Russia -2% -3% -1% -4% 0% 2% 0% -4%
BRIC -4% 0% -3% -3% 0% -11% -5% -8%
Source: 2016 Deutsche Bank Alternative Investment Survey
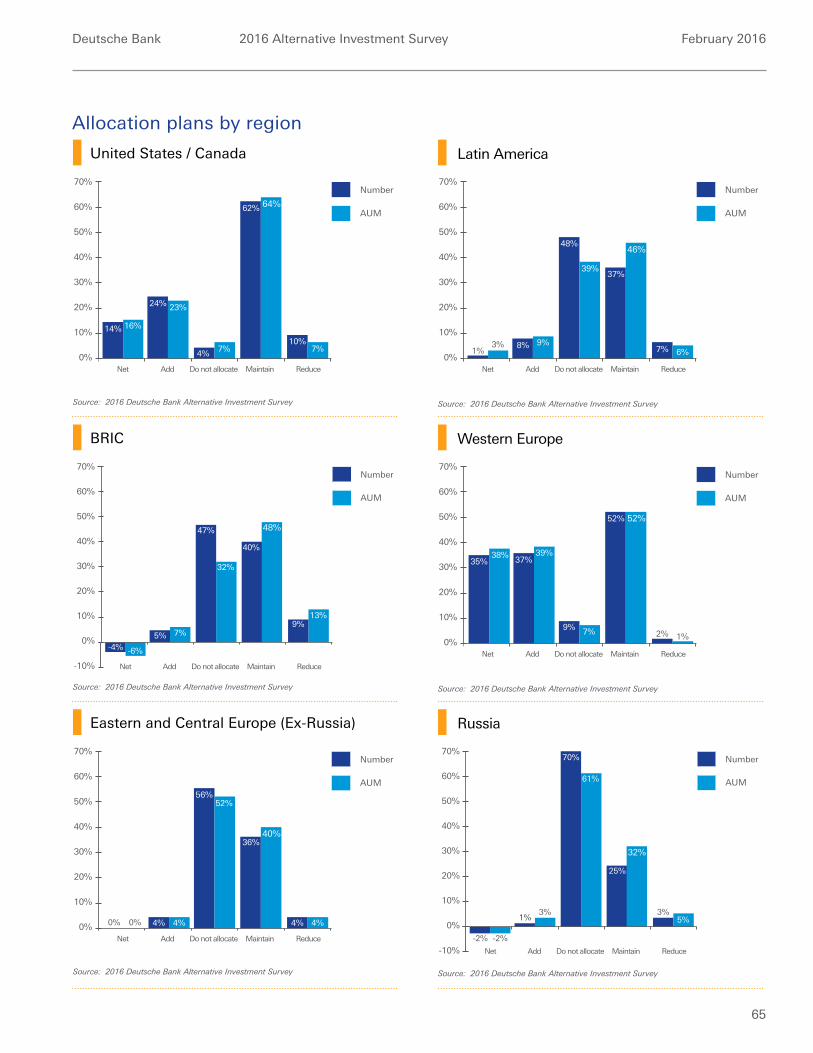
Deutsche Bank 2016 Alternative Investment Survey February 2016
65
Allocation plans by region
United States / Canada
BRIC
Eastern and Central Europe (Ex-Russia)
Latin America
Western Europe
Russia
30%
20%
10%
0%
40%
Net Add Do not allocate Maintain Reduce
14%
24% 23%
16%
4%7%
64%62%
10%7%
50%
60%
70%Number
AUM
30%
20%
10%
0%
-10%
40%
Net Add Do not allocate Maintain Reduce
-4%5% 7%
-6%
47%
32%
48%
40%
9%13%
50%
60%
70%Number
AUM
Net Add Do not allocate Maintain Reduce
0% 4% 4%0%
56%52%
40%36%
4% 4%
Number
AUM
30%
20%
10%
0%
40%
50%
60%
70%
30%
20%
10%
0%
40%
Net Add Do not allocate Maintain Reduce
1%8% 9%3%
48%
39%
46%
37%
7% 6%
50%
60%
70%Number
AUM
Net Add Do not allocate Maintain Reduce
35% 37%39%38%
9% 7%
52%52%
2% 1%
Number
AUM
30%
20%
10%
0%
40%
50%
60%
70%
30%
20%
10%
0%
-10%
40%
Net Add Do not allocate Maintain Reduce
1%
-2%
3%
-2%
70%
61%
32%
25%
3%5%
50%
60%
70%Number
AUM
Source: 2016 Deutsche Bank Alternative Investment Survey
Source: 2016 Deutsche Bank Alternative Investment Survey
Source: 2016 Deutsche Bank Alternative Investment Survey
Source: 2016 Deutsche Bank Alternative Investment Survey
Source: 2016 Deutsche Bank Alternative Investment Survey
Source: 2016 Deutsche Bank Alternative Investment Survey
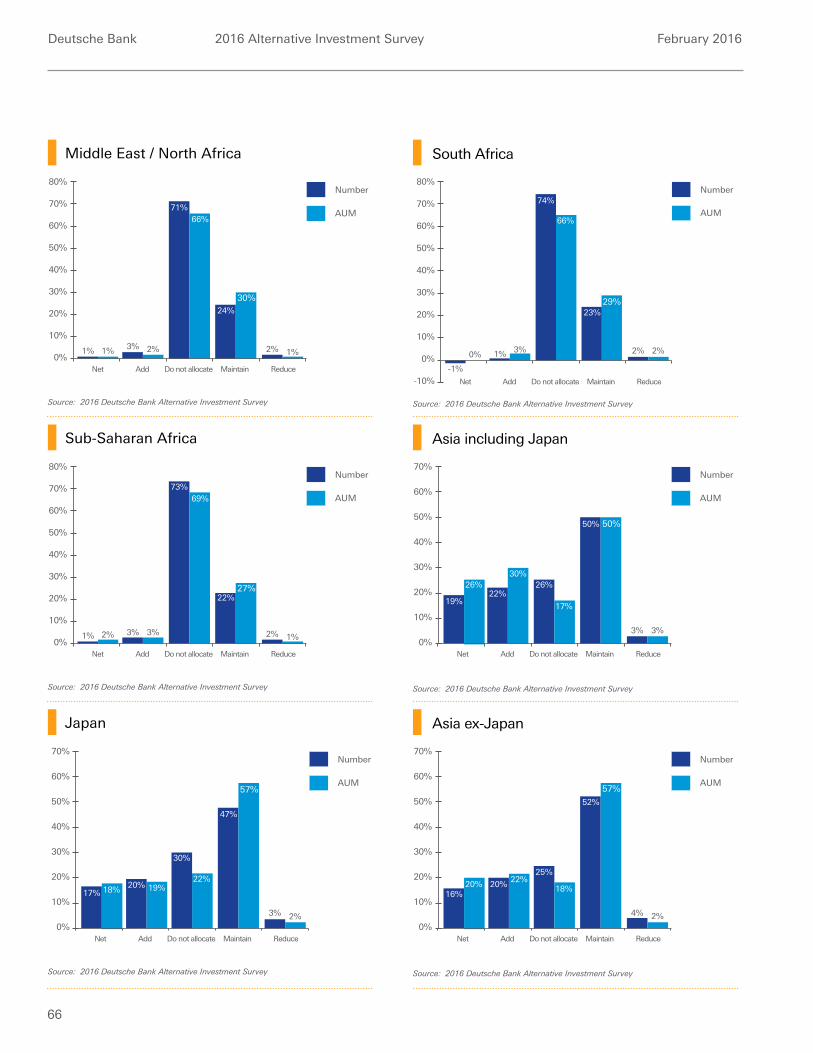
Deutsche Bank 2016 Alternative Investment Survey February 2016
66
Middle East / North Africa
Sub-Saharan Africa
Japan
South Africa
Asia including Japan
Asia ex-Japan
30%
20%
10%
0%
40%
Net Add Do not allocate Maintain Reduce
1% 3% 2%1%
71%66%
30%24%
2% 1%
50%
60%
70%
80%Number
AUM
30%
20%
10%
0%
40%
Net Add Do not allocate Maintain Reduce
1% 3% 3%2%
73%69%
27%22%
2% 1%
50%
60%
70%
80%Number
AUM
Net Add Do not allocate Maintain Reduce
17%20% 19%18%
30%
22%
57%
47%
3% 2%
Number
AUM
30%
20%
10%
0%
40%
50%
60%
70%
30%
20%
10%
0%
-10%
40%
Net Add Do not allocate Maintain Reduce
-1%
1% 3%0%
74%
66%
29%23%
2% 2%
50%
60%
70%
80%Number
AUM
Net Add Do not allocate Maintain Reduce
19%22%
30%26% 26%
17%
50%50%
3% 3%
Number
AUM
30%
20%
10%
0%
40%
50%
60%
70%
Net Add Do not allocate Maintain Reduce
16%20%
22%20%
25%
18%
57%
52%
4% 2%
Number
AUM
30%
20%
10%
0%
40%
50%
60%
70%
Source: 2016 Deutsche Bank Alternative Investment Survey
Source: 2016 Deutsche Bank Alternative Investment Survey
Source: 2016 Deutsche Bank Alternative Investment Survey
Source: 2016 Deutsche Bank Alternative Investment Survey
Source: 2016 Deutsche Bank Alternative Investment Survey
Source: 2016 Deutsche Bank Alternative Investment Survey
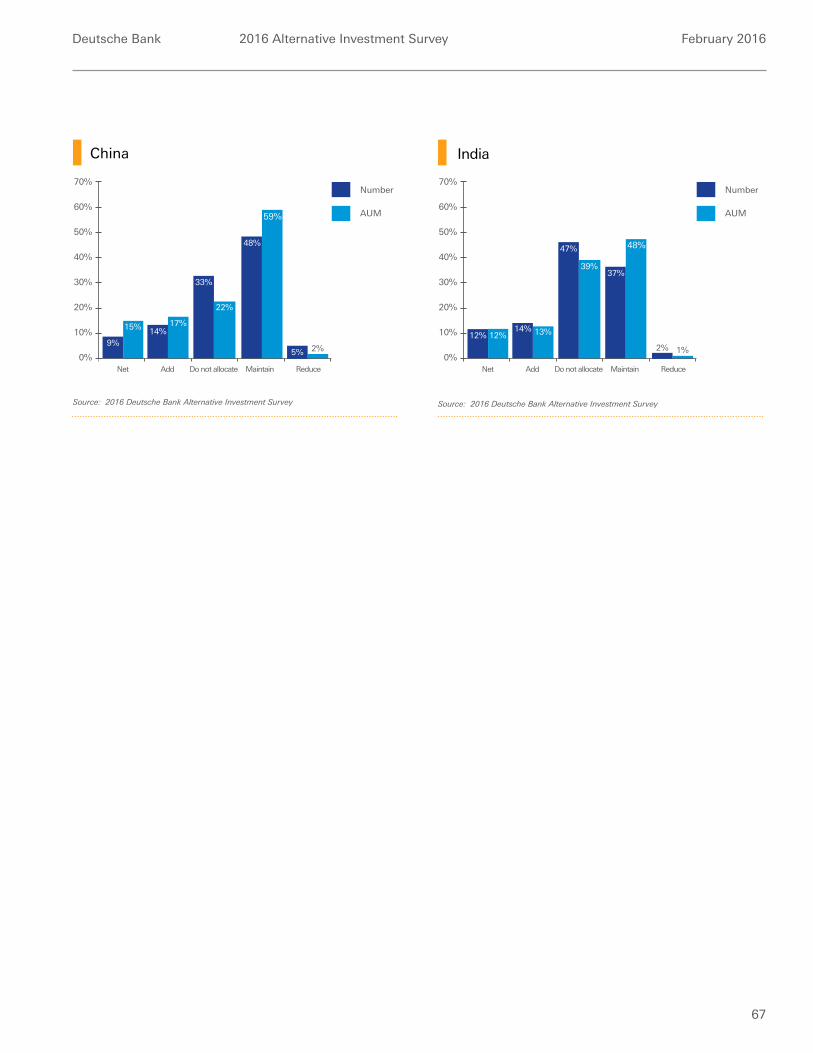
Deutsche Bank 2016 Alternative Investment Survey February 2016
67
China India
30%
20%
10%
0%
40%
Net Add Do not allocate Maintain Reduce
9%14%
17%15%
33%
22%
59%
48%
2%
50%
60%
70%Number
AUM
5%
30%
20%
10%
0%
40%
Net Add Do not allocate Maintain Reduce
12%14% 13%12%
47%
39%
48%
37%
1%
50%
60%
70%Number
AUM
2%
Source: 2016 Deutsche Bank Alternative Investment Survey Source: 2016 Deutsche Bank Alternative Investment Survey

Deutsche Bank 2016 Alternative Investment Survey February 2016
68

Deutsche Bank 2016 Alternative Investment Survey February 2016
69
Portfolio construction
69
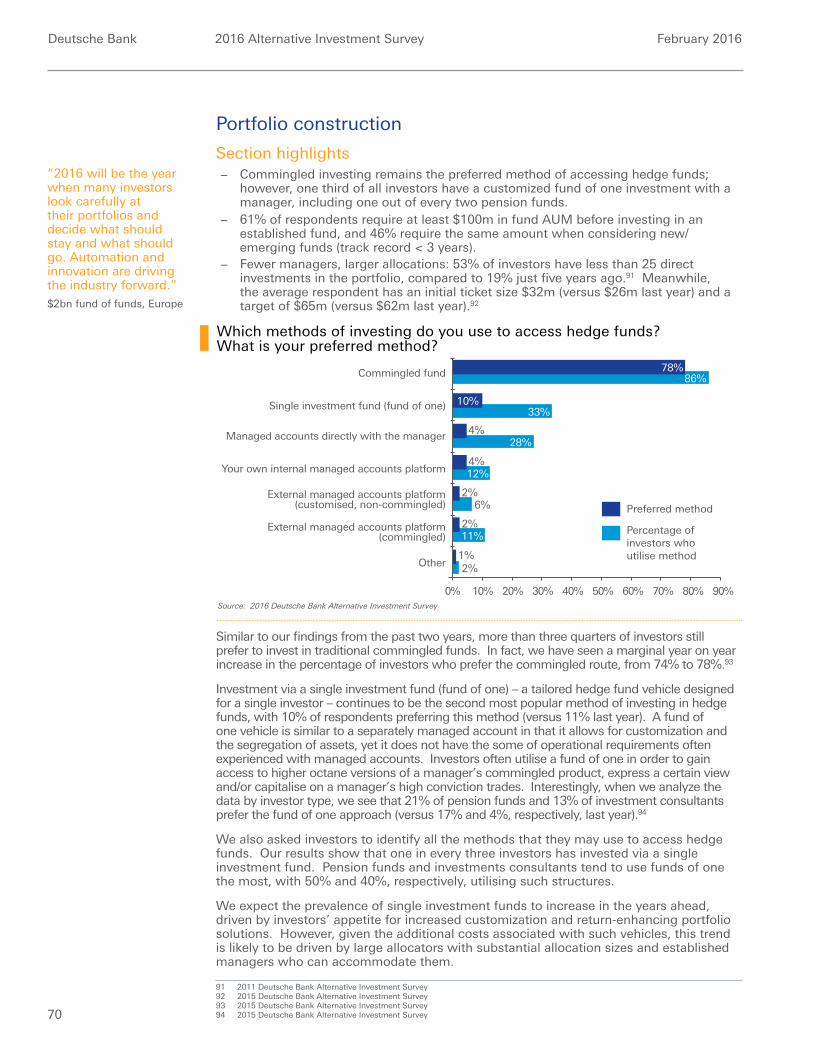
Deutsche Bank 2016 Alternative Investment Survey February 2016
70
Portfolio construction
Section highlights − Commingled investing remains the preferred method of accessing hedge funds;
however, one third of all investors have a customized fund of one investment with a manager, including one out of every two pension funds.
− 61% of respondents require at least $100m in fund AUM before investing in an established fund, and 46% require the same amount when considering new/emerging funds (track record < 3 years).
− Fewer managers, larger allocations: 53% of investors have less than 25 direct investments in the portfolio, compared to 19% just five years ago.91 Meanwhile, the average respondent has an initial ticket size $32m (versus $26m last year) and a target of $65m (versus $62m last year).92
Similar to our findings from the past two years, more than three quarters of investors still prefer to invest in traditional commingled funds. In fact, we have seen a marginal year on year increase in the percentage of investors who prefer the commingled route, from 74% to 78%.93
Investment via a single investment fund (fund of one) – a tailored hedge fund vehicle designed for a single investor – continues to be the second most popular method of investing in hedge funds, with 10% of respondents preferring this method (versus 11% last year). A fund of one vehicle is similar to a separately managed account in that it allows for customization and the segregation of assets, yet it does not have the some of operational requirements often experienced with managed accounts. Investors often utilise a fund of one in order to gain access to higher octane versions of a manager’s commingled product, express a certain view and/or capitalise on a manager’s high conviction trades. Interestingly, when we analyze the data by investor type, we see that 21% of pension funds and 13% of investment consultants prefer the fund of one approach (versus 17% and 4%, respectively, last year).94
We also asked investors to identify all the methods that they may use to access hedge funds. Our results show that one in every three investors has invested via a single investment fund. Pension funds and investments consultants tend to use funds of one the most, with 50% and 40%, respectively, utilising such structures.
We expect the prevalence of single investment funds to increase in the years ahead, driven by investors’ appetite for increased customization and return-enhancing portfolio solutions. However, given the additional costs associated with such vehicles, this trend is likely to be driven by large allocators with substantial allocation sizes and established managers who can accommodate them.
91 2011 Deutsche Bank Alternative Investment Survey92 2015 Deutsche Bank Alternative Investment Survey93 2015 Deutsche Bank Alternative Investment Survey94 2015 Deutsche Bank Alternative Investment Survey
Which methods of investing do you use to access hedge funds? What is your preferred method?
Source: 2016 Deutsche Bank Alternative Investment Survey
Single investment fund (fund of one)
Other
External managed accounts platform(commingled)
Managed accounts directly with the manager
Commingled fund
External managed accounts platform(customised, non-commingled)
Your own internal managed accounts platform
40%20% 30%0% 10% 60%50% 70% 80% 90%
78%86%
10%33%
4%28%
4%12%
2%6%
2%11%
1%2%
Percentage of investors who utilise method
Preferred method
“2016 will be the year when many investors look carefully at their portfolios and decide what should stay and what should go. Automation and innovation are driving the industry forward.”$2bn fund of funds, Europe
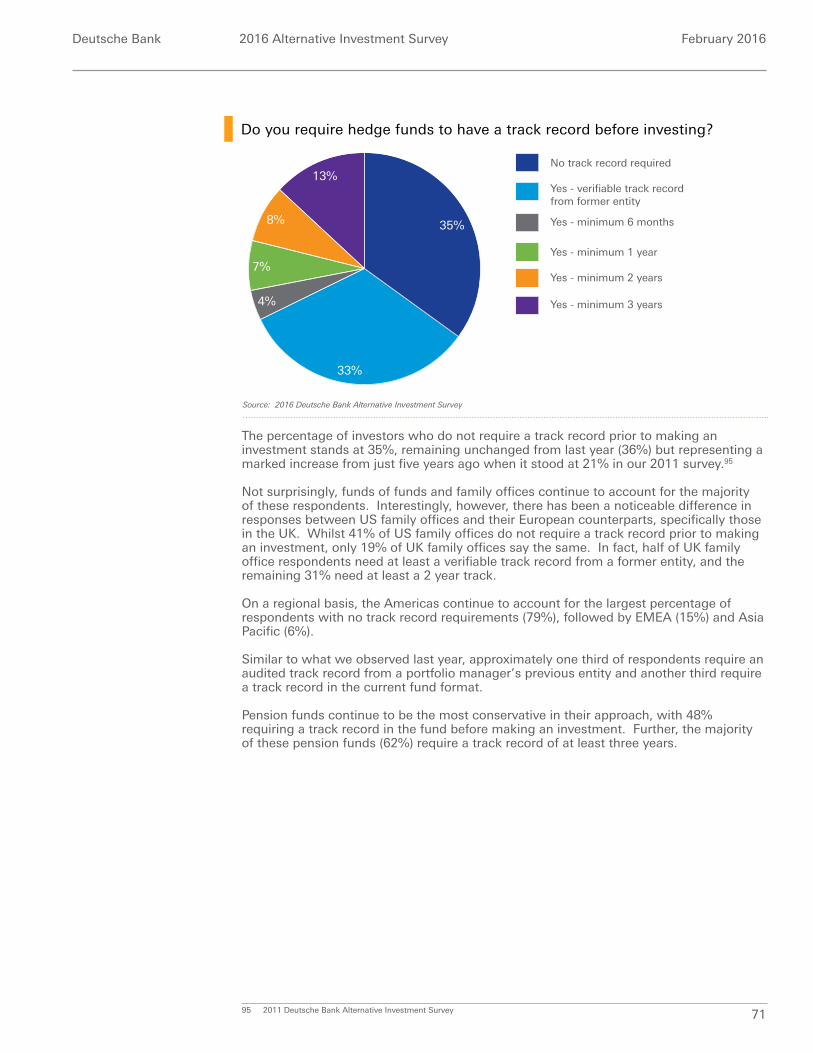
Deutsche Bank 2016 Alternative Investment Survey February 2016
71
Do you require hedge funds to have a track record before investing?
Source: 2016 Deutsche Bank Alternative Investment Survey
Yes - minimum 6 months
No track record required
Yes - verifiable track recordfrom former entity
Yes - minimum 3 years
Yes - minimum 1 year
Yes - minimum 2 years
8%
33%
4%
35%
7%
13%
The percentage of investors who do not require a track record prior to making an investment stands at 35%, remaining unchanged from last year (36%) but representing a marked increase from just five years ago when it stood at 21% in our 2011 survey.95
Not surprisingly, funds of funds and family offices continue to account for the majority of these respondents. Interestingly, however, there has been a noticeable difference in responses between US family offices and their European counterparts, specifically those in the UK. Whilst 41% of US family offices do not require a track record prior to making an investment, only 19% of UK family offices say the same. In fact, half of UK family office respondents need at least a verifiable track record from a former entity, and the remaining 31% need at least a 2 year track.
On a regional basis, the Americas continue to account for the largest percentage of respondents with no track record requirements (79%), followed by EMEA (15%) and Asia Pacific (6%).
Similar to what we observed last year, approximately one third of respondents require an audited track record from a portfolio manager’s previous entity and another third require a track record in the current fund format.
Pension funds continue to be the most conservative in their approach, with 48% requiring a track record in the fund before making an investment. Further, the majority of these pension funds (62%) require a track record of at least three years.
95 2011 Deutsche Bank Alternative Investment Survey
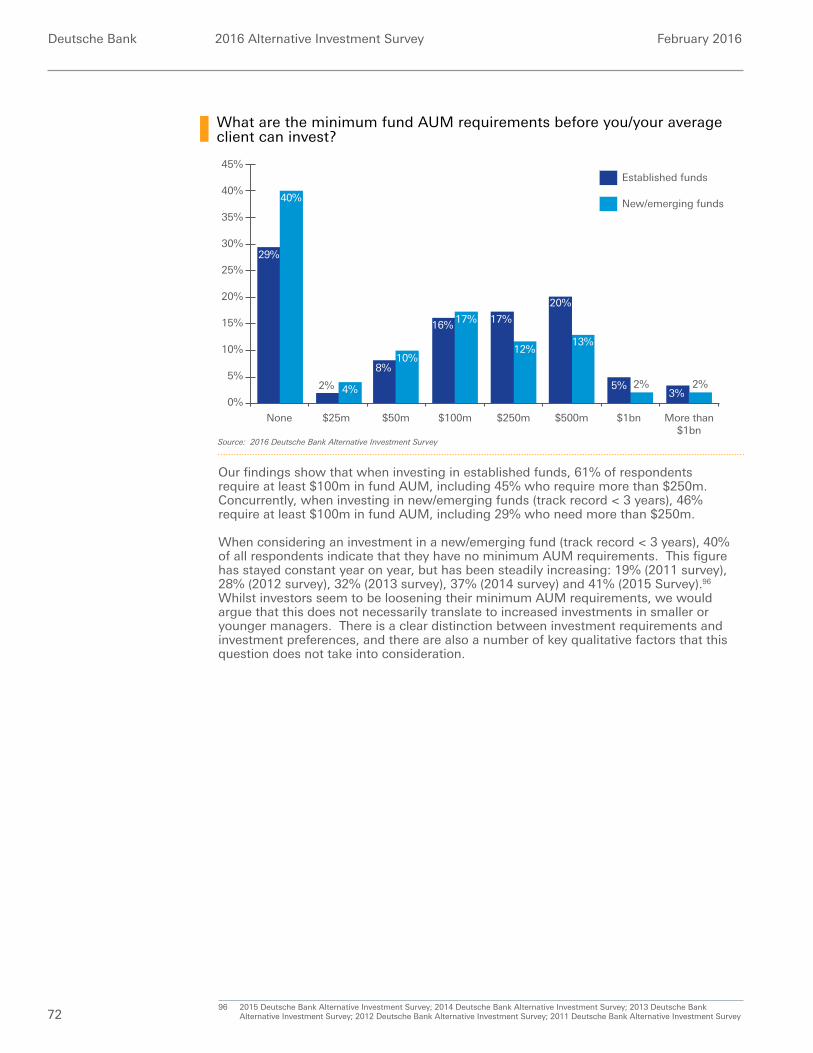
Deutsche Bank 2016 Alternative Investment Survey February 2016
72
What are the minimum fund AUM requirements before you/your average client can invest?
Source: 2016 Deutsche Bank Alternative Investment Survey
15%
10%
5%
0%
None $25m $50m $100m $250m $500m $1bn More than$1bn
20%
29%
40%
2% 4%
8%10%
16% 17% 17%
12%
20%
13%
5% 2%3%
2%
40%
35%
30%
25%
45%
New/emerging funds
Established funds
Our findings show that when investing in established funds, 61% of respondents require at least $100m in fund AUM, including 45% who require more than $250m. Concurrently, when investing in new/emerging funds (track record < 3 years), 46% require at least $100m in fund AUM, including 29% who need more than $250m.
When considering an investment in a new/emerging fund (track record < 3 years), 40% of all respondents indicate that they have no minimum AUM requirements. This figure has stayed constant year on year, but has been steadily increasing: 19% (2011 survey), 28% (2012 survey), 32% (2013 survey), 37% (2014 survey) and 41% (2015 Survey).96 Whilst investors seem to be loosening their minimum AUM requirements, we would argue that this does not necessarily translate to increased investments in smaller or younger managers. There is a clear distinction between investment requirements and investment preferences, and there are also a number of key qualitative factors that this question does not take into consideration.
96 2015 Deutsche Bank Alternative Investment Survey; 2014 Deutsche Bank Alternative Investment Survey; 2013 Deutsche Bank Alternative Investment Survey; 2012 Deutsche Bank Alternative Investment Survey; 2011 Deutsche Bank Alternative Investment Survey
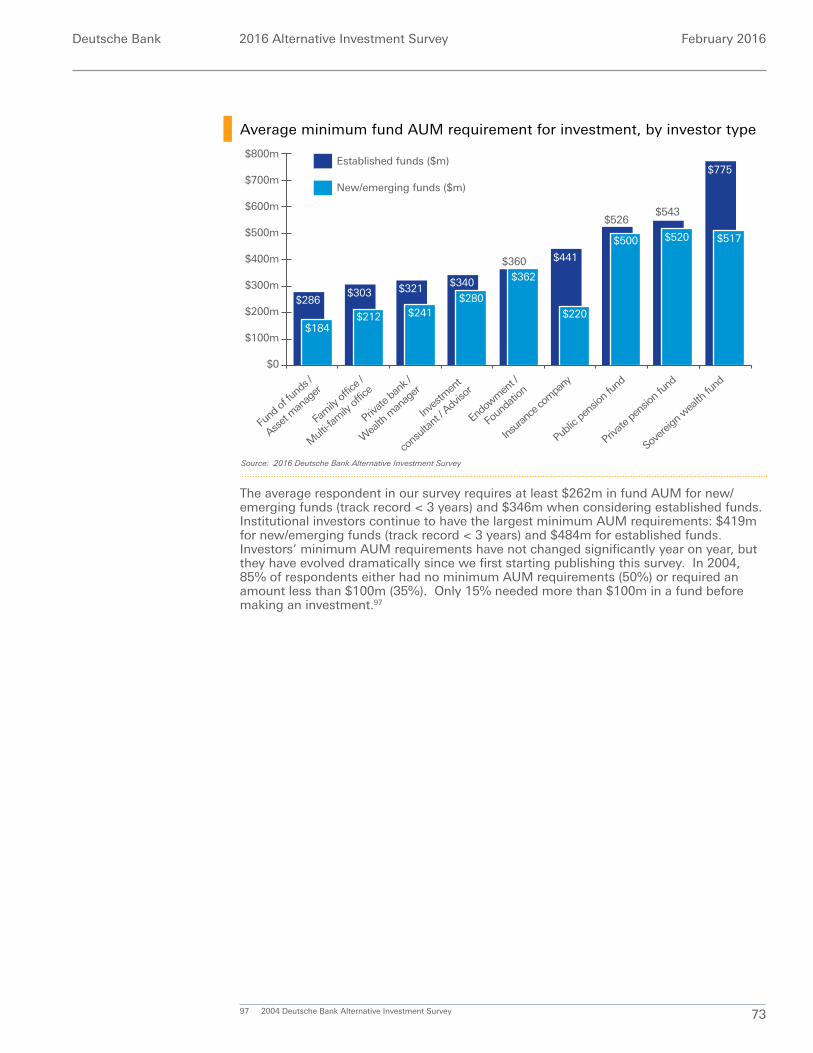
Deutsche Bank 2016 Alternative Investment Survey February 2016
73
Average minimum fund AUM requirement for investment, by investor type
Source: 2016 Deutsche Bank Alternative Investment Survey
$300m
$200m
$100m
$0
$400m
$286
$184
$303
$212
$321
$241
$340
$280
$360
$362
$441
$220
$526
$500
$543
$520
$775
$517
$700m
$600m
$500m
$800m
Inves
tmen
t
cons
ultan
t / Adv
isor
Private
pens
ion fu
nd
Public
pens
ion fu
nd
Sovere
ign w
ealth
fund
Private
bank
/
Wea
lth m
anag
er
Endo
wmen
t /
Foun
datio
n
Insura
nce c
ompa
ny
Fund
of fu
nds /
Asset
man
ager
Fam
ily of
fice /
Mult
i-fam
ily of
fice
New/emerging funds ($m)
Established funds ($m)
The average respondent in our survey requires at least $262m in fund AUM for new/ emerging funds (track record < 3 years) and $346m when considering established funds. Institutional investors continue to have the largest minimum AUM requirements: $419m for new/emerging funds (track record < 3 years) and $484m for established funds. Investors’ minimum AUM requirements have not changed significantly year on year, but they have evolved dramatically since we first starting publishing this survey. In 2004, 85% of respondents either had no minimum AUM requirements (50%) or required an amount less than $100m (35%). Only 15% needed more than $100m in a fund before making an investment.97
97 2004 Deutsche Bank Alternative Investment Survey
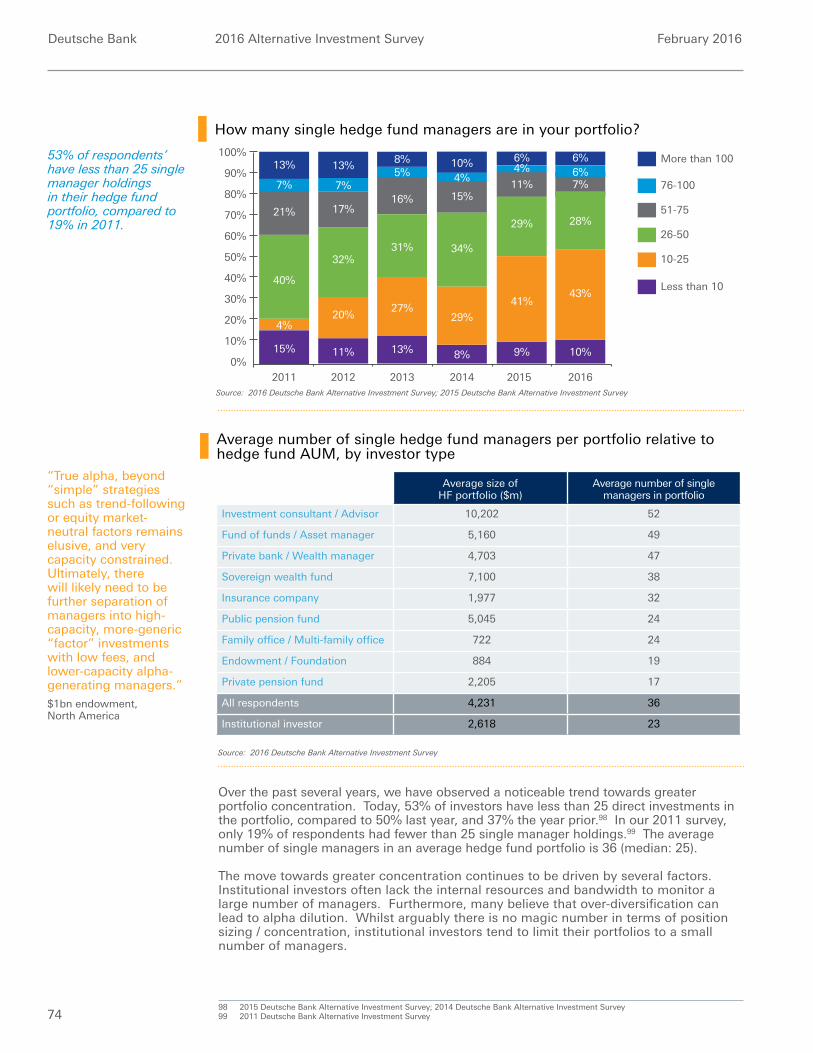
Deutsche Bank 2016 Alternative Investment Survey February 2016
74
Over the past several years, we have observed a noticeable trend towards greater portfolio concentration. Today, 53% of investors have less than 25 direct investments in the portfolio, compared to 50% last year, and 37% the year prior.98 In our 2011 survey, only 19% of respondents had fewer than 25 single manager holdings.99 The average number of single managers in an average hedge fund portfolio is 36 (median: 25).
The move towards greater concentration continues to be driven by several factors. Institutional investors often lack the internal resources and bandwidth to monitor a large number of managers. Furthermore, many believe that over-diversification can lead to alpha dilution. Whilst arguably there is no magic number in terms of position sizing / concentration, institutional investors tend to limit their portfolios to a small number of managers.
98 2015 Deutsche Bank Alternative Investment Survey; 2014 Deutsche Bank Alternative Investment Survey99 2011 Deutsche Bank Alternative Investment Survey
Average number of single hedge fund managers per portfolio relative to hedge fund AUM, by investor type
Source: 2016 Deutsche Bank Alternative Investment Survey
Average size ofHF portfolio ($m)
Average number of single managers in portfolio
Investment consultant / Advisor 10,202 52
Fund of funds / Asset manager 5,160 49
Private bank / Wealth manager 4,703 47
Sovereign wealth fund 7,100 38
Insurance company 1,977 32
Public pension fund 5,045 24
Family office / Multi-family office 722 24
Endowment / Foundation 884 19
Private pension fund 2,205 17
All respondents 4,231 36
Institutional investor 2,618 23
How many single hedge fund managers are in your portfolio?
Source: 2016 Deutsche Bank Alternative Investment Survey; 2015 Deutsche Bank Alternative Investment Survey
76-100
51-75
10-25
More than 100
26-50
Less than 10
21%
7%
13%
15%
40%
32%
20%
11%
4%
17%
31%
16%
5%8%
27%
100%
90%
80%
70%
0%
60%
50%
40%
30%
20%
10%
7%
13%
13%
2011 2012 2013
34%
15%
4%10%
29%
8%
2014
29%
11%
4%6%
41%
9%
2015 2016
28%
7%6%6%
43%
10%
53% of respondents’ have less than 25 single manager holdings in their hedge fund portfolio, compared to 19% in 2011.
“True alpha, beyond “simple” strategies such as trend-following or equity market-neutral factors remains elusive, and very capacity constrained. Ultimately, there will likely need to be further separation of managers into high-capacity, more-generic “factor” investments with low fees, and lower-capacity alpha-generating managers.”$1bn endowment, North America
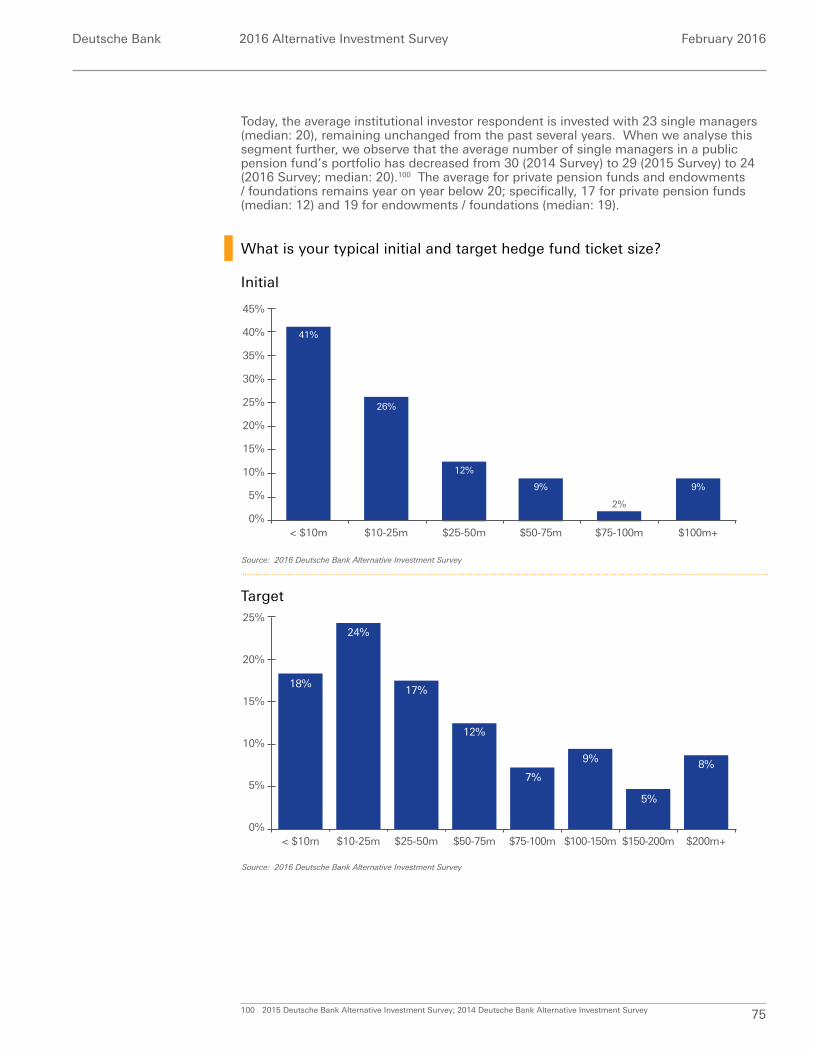
Deutsche Bank 2016 Alternative Investment Survey February 2016
75
What is your typical initial and target hedge fund ticket size?
Target
Initial
Source: 2016 Deutsche Bank Alternative Investment Survey
Source: 2016 Deutsche Bank Alternative Investment Survey
25%
0%
20%
15%
10%
5%
$50-75m< $10m
18%
12%
$200m+
8%
$150-200m$100-150m$75-100m
7%
9%
5%
$10-25m
24%
$25-50m
17%
40%
0%
35%
30%
25%
20%
15%
10%
5%
45%
$75-100m$50-75m< $10m
41%
9%
2%
$100m+
9%
$10-25m
26%
$25-50m
12%
Today, the average institutional investor respondent is invested with 23 single managers (median: 20), remaining unchanged from the past several years. When we analyse this segment further, we observe that the average number of single managers in a public pension fund’s portfolio has decreased from 30 (2014 Survey) to 29 (2015 Survey) to 24 (2016 Survey; median: 20).100 The average for private pension funds and endowments / foundations remains year on year below 20; specifically, 17 for private pension funds (median: 12) and 19 for endowments / foundations (median: 19).
100 2015 Deutsche Bank Alternative Investment Survey; 2014 Deutsche Bank Alternative Investment Survey
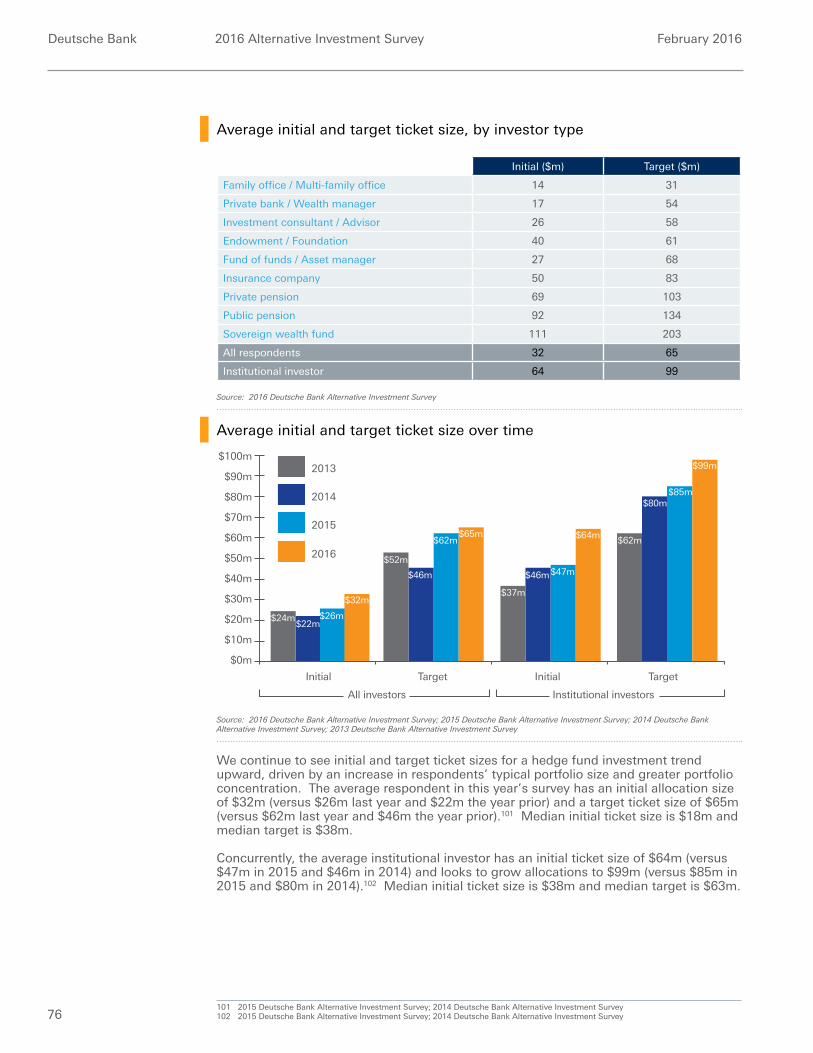
Deutsche Bank 2016 Alternative Investment Survey February 2016
76
Average initial and target ticket size, by investor type
Average initial and target ticket size over time
Source: 2016 Deutsche Bank Alternative Investment Survey
Source: 2016 Deutsche Bank Alternative Investment Survey; 2015 Deutsche Bank Alternative Investment Survey; 2014 Deutsche Bank Alternative Investment Survey; 2013 Deutsche Bank Alternative Investment Survey
Initial ($m) Target ($m)
Family office / Multi-family office 14 31
Private bank / Wealth manager 17 54
Investment consultant / Advisor 26 58
Endowment / Foundation 40 61
Fund of funds / Asset manager 27 68
Insurance company 50 83
Private pension 69 103
Public pension 92 134
Sovereign wealth fund 111 203
All respondents 32 65
Institutional investor 64 99
$30m
$20m
$10m
$0m
$40m$37m
$46m
$62m$65m
$62m
$46m$47m
$64m
$80m$85m
$99m
$52m
$24m$22m
$26m
$32m
$80m
$70m
$60m
$50m
$90m
$100m
2014
2015
2016
2013
Initial Target
All investors
Initial Target
Institutional investors
We continue to see initial and target ticket sizes for a hedge fund investment trend upward, driven by an increase in respondents’ typical portfolio size and greater portfolio concentration. The average respondent in this year’s survey has an initial allocation size of $32m (versus $26m last year and $22m the year prior) and a target ticket size of $65m (versus $62m last year and $46m the year prior).101 Median initial ticket size is $18m and median target is $38m.
Concurrently, the average institutional investor has an initial ticket size of $64m (versus $47m in 2015 and $46m in 2014) and looks to grow allocations to $99m (versus $85m in 2015 and $80m in 2014).102 Median initial ticket size is $38m and median target is $63m.
101 2015 Deutsche Bank Alternative Investment Survey; 2014 Deutsche Bank Alternative Investment Survey102 2015 Deutsche Bank Alternative Investment Survey; 2014 Deutsche Bank Alternative Investment Survey
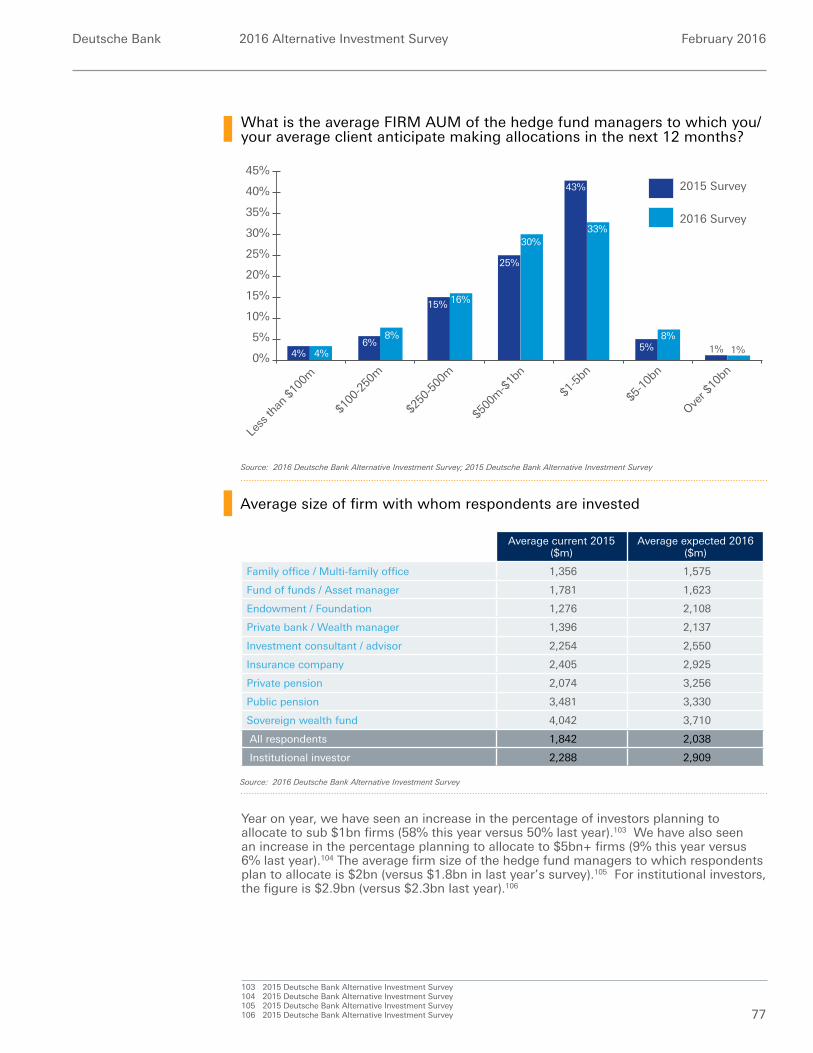
Deutsche Bank 2016 Alternative Investment Survey February 2016
77
What is the average FIRM AUM of the hedge fund managers to which you/your average client anticipate making allocations in the next 12 months?
15%
10%
5%
0%
20%
4% 4%6%
8%
15% 16%
25%
30%
43%
33%
5%8%
1% 1%
40%
35%
30%
25%
45%
Less
than
$10
0m
$1-5
bn
$100
-250
m
$250
-500
m
$500
m-$
1bn
$5-1
0bn
Over $
10bn
2015 Survey
2016 Survey
Source: 2016 Deutsche Bank Alternative Investment Survey; 2015 Deutsche Bank Alternative Investment Survey
Average size of firm with whom respondents are invested
Source: 2016 Deutsche Bank Alternative Investment Survey
Average current 2015 ($m)
Average expected 2016 ($m)
Family office / Multi-family office 1,356 1,575
Fund of funds / Asset manager 1,781 1,623
Endowment / Foundation 1,276 2,108
Private bank / Wealth manager 1,396 2,137
Investment consultant / advisor 2,254 2,550
Insurance company 2,405 2,925
Private pension 2,074 3,256
Public pension 3,481 3,330
Sovereign wealth fund 4,042 3,710
All respondents 1,842 2,038
Institutional investor 2,288 2,909
Year on year, we have seen an increase in the percentage of investors planning to allocate to sub $1bn firms (58% this year versus 50% last year).103 We have also seen an increase in the percentage planning to allocate to $5bn+ firms (9% this year versus 6% last year).104 The average firm size of the hedge fund managers to which respondents plan to allocate is $2bn (versus $1.8bn in last year’s survey).105 For institutional investors, the figure is $2.9bn (versus $2.3bn last year).106
103 2015 Deutsche Bank Alternative Investment Survey104 2015 Deutsche Bank Alternative Investment Survey105 2015 Deutsche Bank Alternative Investment Survey106 2015 Deutsche Bank Alternative Investment Survey

Deutsche Bank 2016 Alternative Investment Survey February 2016
78

Deutsche Bank 2016 Alternative Investment Survey February 2016
79
Hedge fund fees
79
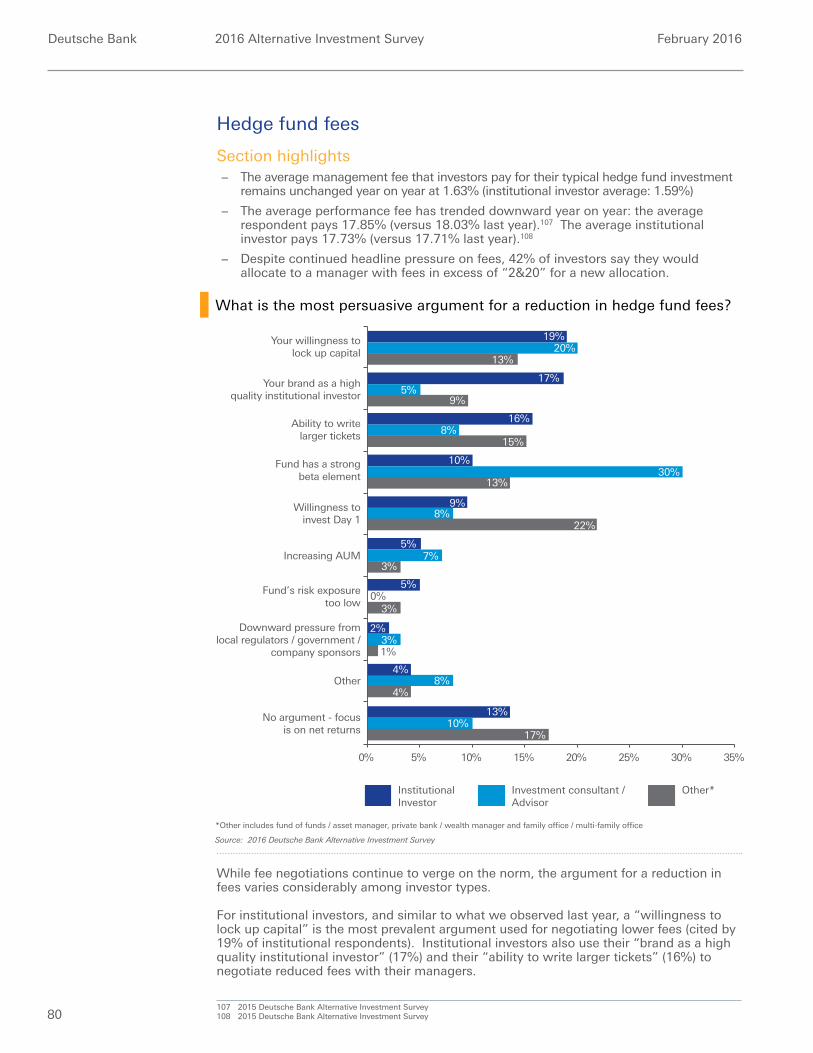
Deutsche Bank 2016 Alternative Investment Survey February 2016
80
Hedge fund fees
Section highlights − The average management fee that investors pay for their typical hedge fund investment
remains unchanged year on year at 1.63% (institutional investor average: 1.59%)
− The average performance fee has trended downward year on year: the average respondent pays 17.85% (versus 18.03% last year).107 The average institutional investor pays 17.73% (versus 17.71% last year).108
− Despite continued headline pressure on fees, 42% of investors say they would allocate to a manager with fees in excess of “2&20” for a new allocation.
While fee negotiations continue to verge on the norm, the argument for a reduction in fees varies considerably among investor types.
For institutional investors, and similar to what we observed last year, a “willingness to lock up capital” is the most prevalent argument used for negotiating lower fees (cited by 19% of institutional respondents). Institutional investors also use their “brand as a high quality institutional investor” (17%) and their “ability to write larger tickets” (16%) to negotiate reduced fees with their managers.
107 2015 Deutsche Bank Alternative Investment Survey108 2015 Deutsche Bank Alternative Investment Survey
What is the most persuasive argument for a reduction in hedge fund fees?
*Other includes fund of funds / asset manager, private bank / wealth manager and family office / multi-family office
Source: 2016 Deutsche Bank Alternative Investment Survey
4%8%
No argument - focusis on net returns
Other
Willingness toinvest Day 1
Fund’s risk exposuretoo low
Fund has a strongbeta element
10%5% 30%25%20%15%0% 35%
7%3%
5%0%
3%
Downward pressure fromlocal regulators / government /
company sponsors
2%3%1%
4%
13%10%
17%
InstitutionalInvestor
Investment consultant / Advisor
Other*
5%
Ability to writelarger tickets
Increasing AUM
8%15%
10%30%
13%
9%8%
22%
16%
Your brand as a highquality institutional investor
Your willingness tolock up capital 20%
13%
17%5%
9%
19%
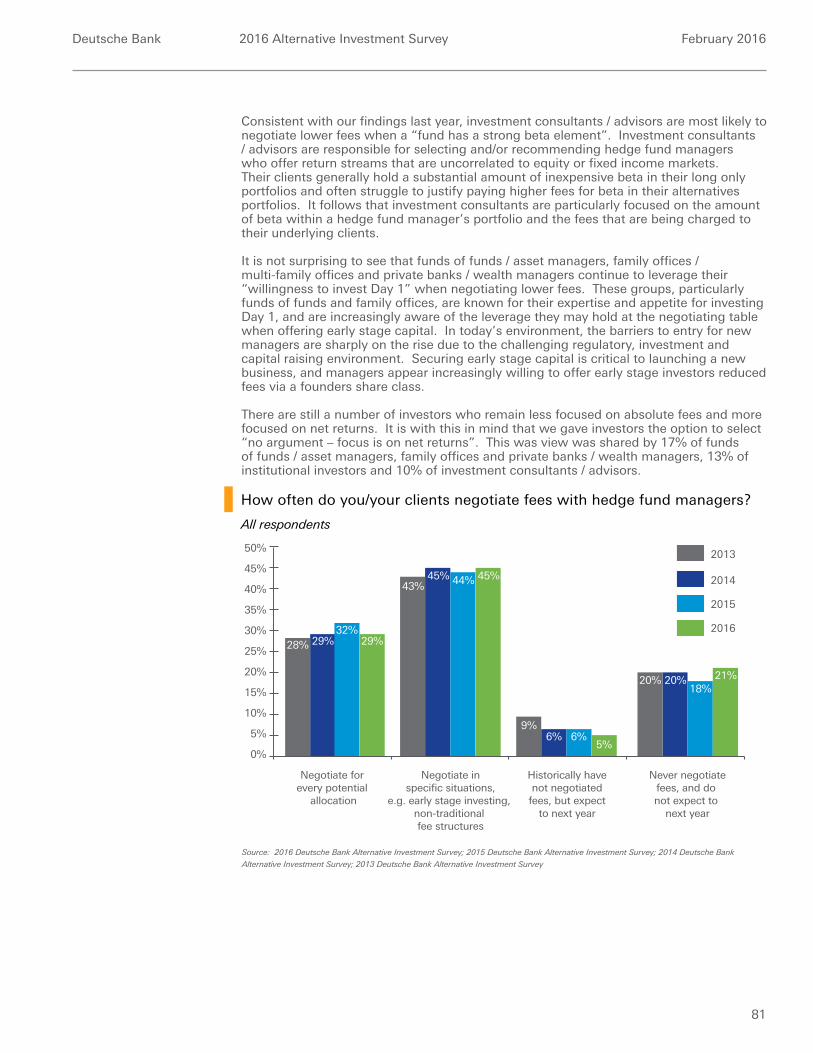
Deutsche Bank 2016 Alternative Investment Survey February 2016
81
Consistent with our findings last year, investment consultants / advisors are most likely to negotiate lower fees when a “fund has a strong beta element”. Investment consultants / advisors are responsible for selecting and/or recommending hedge fund managers who offer return streams that are uncorrelated to equity or fixed income markets. Their clients generally hold a substantial amount of inexpensive beta in their long only portfolios and often struggle to justify paying higher fees for beta in their alternatives portfolios. It follows that investment consultants are particularly focused on the amount of beta within a hedge fund manager’s portfolio and the fees that are being charged to their underlying clients.
It is not surprising to see that funds of funds / asset managers, family offices / multi-family offices and private banks / wealth managers continue to leverage their “willingness to invest Day 1” when negotiating lower fees. These groups, particularly funds of funds and family offices, are known for their expertise and appetite for investing Day 1, and are increasingly aware of the leverage they may hold at the negotiating table when offering early stage capital. In today’s environment, the barriers to entry for new managers are sharply on the rise due to the challenging regulatory, investment and capital raising environment. Securing early stage capital is critical to launching a new business, and managers appear increasingly willing to offer early stage investors reduced fees via a founders share class.
There are still a number of investors who remain less focused on absolute fees and more focused on net returns. It is with this in mind that we gave investors the option to select “no argument – focus is on net returns”. This was view was shared by 17% of funds of funds / asset managers, family offices and private banks / wealth managers, 13% of institutional investors and 10% of investment consultants / advisors.
How often do you/your clients negotiate fees with hedge fund managers?
Source: 2016 Deutsche Bank Alternative Investment Survey; 2015 Deutsche Bank Alternative Investment Survey; 2014 Deutsche Bank
Alternative Investment Survey; 2013 Deutsche Bank Alternative Investment Survey
15%
10%
5%
0%
20%
9%
45% 44% 45%
20%
6%
20%18%
21%
43%
28% 29%32%
29%
40%
35%
30%
25%
45%
50%
2014
2015
2016
2013
Negotiate for every potential
allocation
Negotiate inspecific situations,
e.g. early stage investing, non-traditional fee structures
Historically havenot negotiated
fees, but expectto next year
Never negotiatefees, and do not expect to
next year
6%5%
All respondents
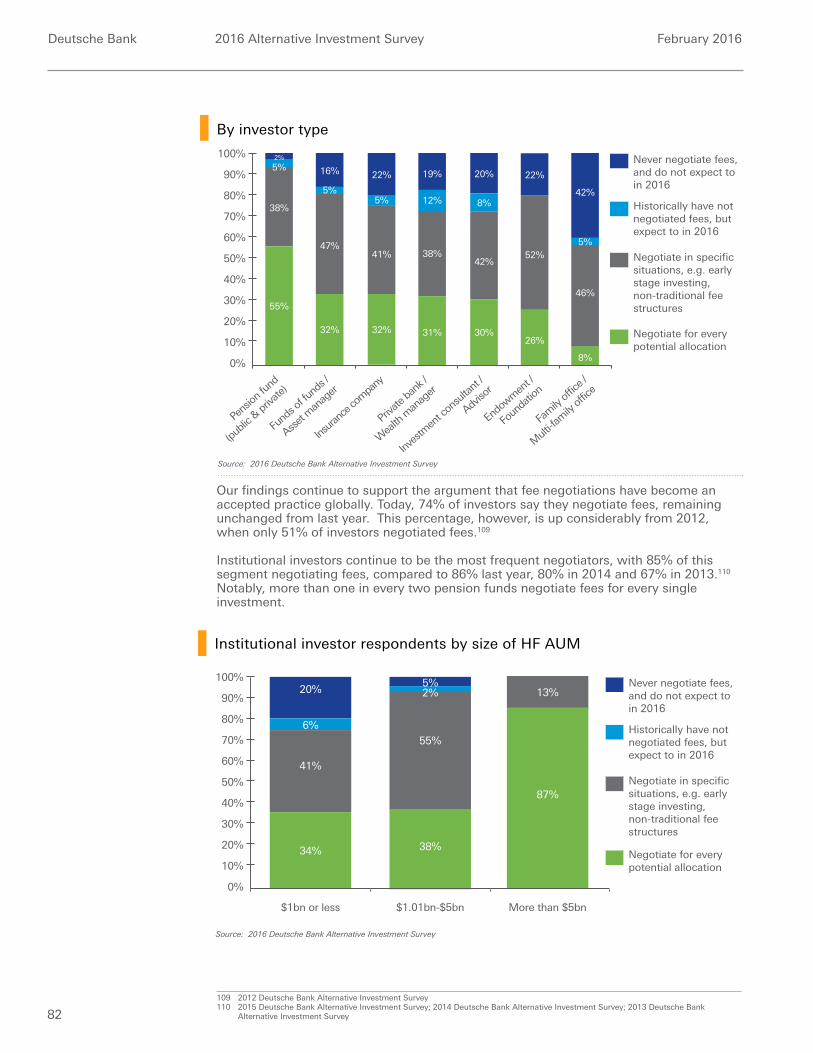
Deutsche Bank 2016 Alternative Investment Survey February 2016
82
By investor type
Source: 2016 Deutsche Bank Alternative Investment Survey
Historically have not negotiated fees, but expect to in 2016
Negotiate in specificsituations, e.g. earlystage investing,non-traditional fee structures
Never negotiate fees, and do not expect toin 2016
Negotiate for every potential allocation
2%
38%
55%
5% 16%
47%
32%
5%
30%
42%
8%
20%
32%
41%
100%
90%
80%
70%
0%
60%
50%
40%
30%
20%
10%
Inves
tmen
t con
sulta
nt /
Adviso
r
Pens
ion fu
nd
(publi
c & pr
ivate)
Endo
wmen
t /
Foun
datio
n
Insura
nce c
ompa
ny
Fund
s of f
unds
/
Asset
man
ager
Fam
ily of
fice /
Mult
i-fam
ily of
fice
22%
5%
22%
26%
52%5%
42%
46%
8%
31%
38%
12%
19%
Private
bank
/
Wea
lth m
anag
er
Our findings continue to support the argument that fee negotiations have become an accepted practice globally. Today, 74% of investors say they negotiate fees, remaining unchanged from last year. This percentage, however, is up considerably from 2012, when only 51% of investors negotiated fees.109
Institutional investors continue to be the most frequent negotiators, with 85% of this segment negotiating fees, compared to 86% last year, 80% in 2014 and 67% in 2013.110 Notably, more than one in every two pension funds negotiate fees for every single investment.
109 2012 Deutsche Bank Alternative Investment Survey110 2015 Deutsche Bank Alternative Investment Survey; 2014 Deutsche Bank Alternative Investment Survey; 2013 Deutsche Bank
Alternative Investment Survey
Institutional investor respondents by size of HF AUM
Source: 2016 Deutsche Bank Alternative Investment Survey
100%
$1bn or less $1.01bn-$5bn More than $5bn
90%
80%
70%
0%
60%
50%
40%
30%
20%
10%
46%
13%
41%
34%
6%
20% 13%
87%
55%
38%
2%5%
Historically have not negotiated fees, but expect to in 2016
Negotiate in specific situations, e.g. early stage investing,non-traditional feestructures
Never negotiate fees,and do not expect to in 2016
Negotiate for every potential allocation
Deutsche Bank 2016 Alternative Investment Survey February 2016
83
When we analyse the institutional segment by size of HF AUM, we observe that 87% of those institutional investors with more than $5bn in HF AUM negotiate for every potential allocation, compared to 38% for institutional investors with $1-5bn in HF AUM, and 34% for those with less than $1bn. This is up from 77% last year.111 It is perhaps not surprising that institutional investors with more than $5bn in HF AUM attribute their negotiating power to their large ticket sizes. Indeed, the average initial and target ticket size for institutional investors with more than $5bn in HF AUM is $150m and $217m, respectively. When we compare this to those institutional allocators with less than $5bn in HF AUM we see that the initial and target size is considerably lower: $70m (initial) and $112 (target).
We see a similar trend emerge when looking at the funds of funds / asset managers on a standalone basis. 60% of the funds of funds / asset managers with more than $5bn under management negotiate fees for every potential allocation, compared to 30% for those with $1-5bn HF AUM, and 15% for those with less than $1bn. This is expected given the typical tickets these larger funds of funds / asset managers are able to write. Indeed, the largest funds of funds / asset managers ($5bn+ HF AUM) are writing tickets of $62m (initial) and $151m (target) on average. This compares to an initial ticket size of $20m (initial) and $58m (target) for those funds of funds / asset managers managing less than $5bn in HF AUM.
111 2015 Deutsche Bank Alternative Investment Survey
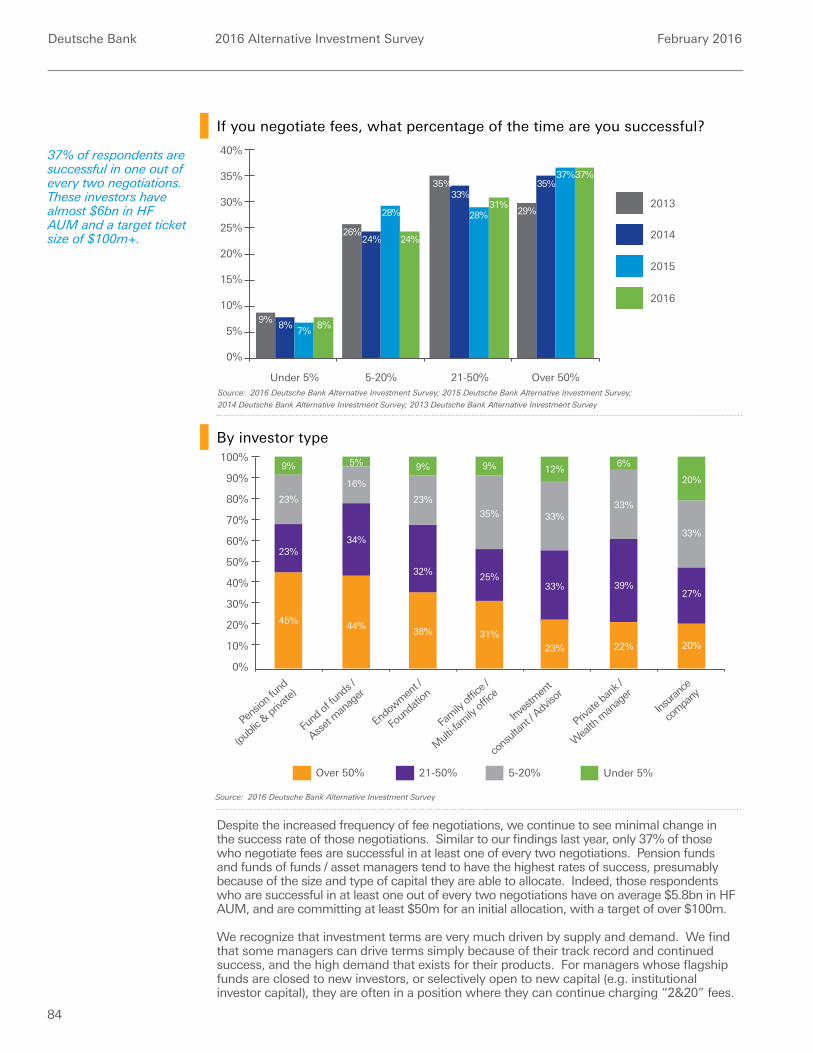
Deutsche Bank 2016 Alternative Investment Survey February 2016
84
Despite the increased frequency of fee negotiations, we continue to see minimal change in the success rate of those negotiations. Similar to our findings last year, only 37% of those who negotiate fees are successful in at least one of every two negotiations. Pension funds and funds of funds / asset managers tend to have the highest rates of success, presumably because of the size and type of capital they are able to allocate. Indeed, those respondents who are successful in at least one out of every two negotiations have on average $5.8bn in HF AUM, and are committing at least $50m for an initial allocation, with a target of over $100m.
We recognize that investment terms are very much driven by supply and demand. We find that some managers can drive terms simply because of their track record and continued success, and the high demand that exists for their products. For managers whose flagship funds are closed to new investors, or selectively open to new capital (e.g. institutional investor capital), they are often in a position where they can continue charging “2&20” fees.
Source: 2016 Deutsche Bank Alternative Investment Survey
If you negotiate fees, what percentage of the time are you successful?
By investor type
Source: 2016 Deutsche Bank Alternative Investment Survey; 2015 Deutsche Bank Alternative Investment Survey;
2014 Deutsche Bank Alternative Investment Survey; 2013 Deutsche Bank Alternative Investment Survey
15%
10%
5%
0%
20%
35%
24%
28%
24%
29%
33%
28%31%
35%37%37%
26%
9%8%
7%8%
35%
30%
25%
40%
2014
2015
2016
2013
Under 5% 5-20% 21-50% Over 50%
39%
5-20%21-50% Under 5%Over 50%
45%
23%
9%
44%
16%
5% 9%
23%
36%
9%
35%
100%
90%
80%
70%
0%
60%
50%
40%
30%
20%
10%
Inves
tmen
t
cons
ultan
t / Adv
isor
Pens
ion fu
nd
(publi
c & pr
ivate)
Private
bank
/
Wea
lth m
anag
er
Endo
wmen
t /
Foun
datio
n
Insura
nce
com
pany
Fund
of fu
nds /
Asset
man
ager
Fam
ily of
fice /
Mult
i-fam
ily of
fice
31%
12%
33%
22%
6%
33%
20%
33%
20%
34%
32%25%
33%27%
23%
23%
37% of respondents are successful in one out of every two negotiations. These investors have almost $6bn in HF AUM and a target ticket size of $100m+.
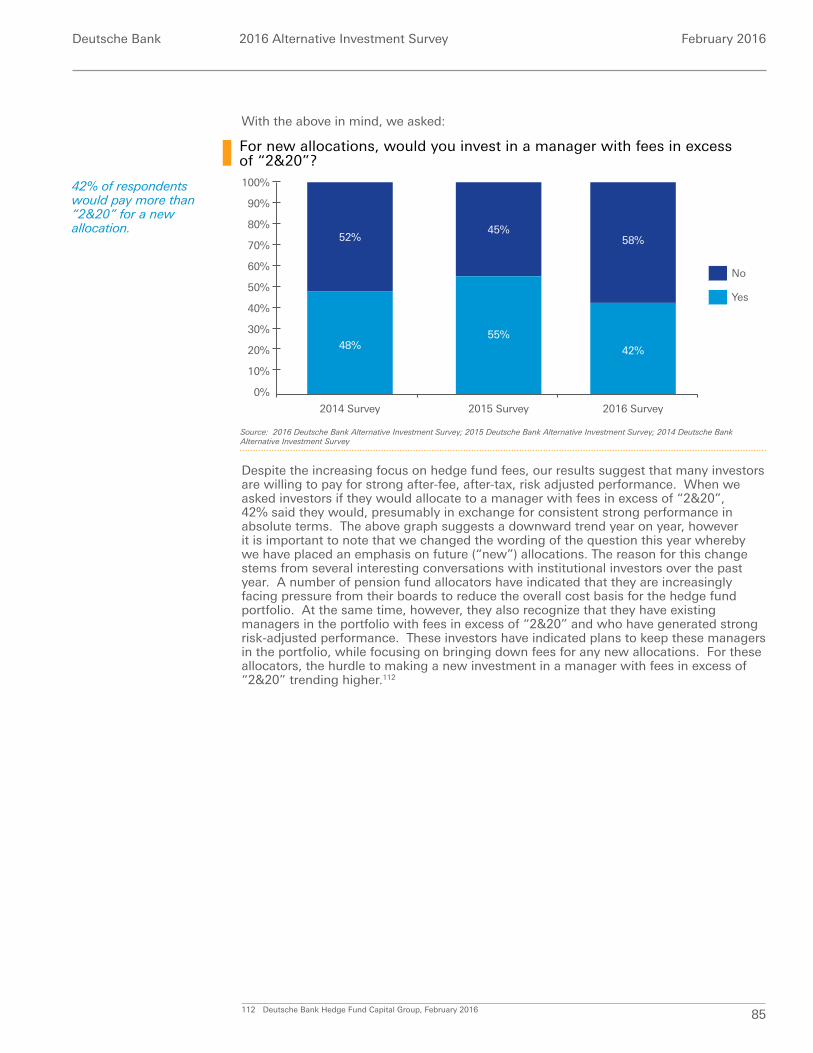
Deutsche Bank 2016 Alternative Investment Survey February 2016
85
With the above in mind, we asked:
Despite the increasing focus on hedge fund fees, our results suggest that many investors are willing to pay for strong after-fee, after-tax, risk adjusted performance. When we asked investors if they would allocate to a manager with fees in excess of “2&20”, 42% said they would, presumably in exchange for consistent strong performance in absolute terms. The above graph suggests a downward trend year on year, however it is important to note that we changed the wording of the question this year whereby we have placed an emphasis on future (“new”) allocations. The reason for this change stems from several interesting conversations with institutional investors over the past year. A number of pension fund allocators have indicated that they are increasingly facing pressure from their boards to reduce the overall cost basis for the hedge fund portfolio. At the same time, however, they also recognize that they have existing managers in the portfolio with fees in excess of “2&20” and who have generated strong risk-adjusted performance. These investors have indicated plans to keep these managers in the portfolio, while focusing on bringing down fees for any new allocations. For these allocators, the hurdle to making a new investment in a manager with fees in excess of “2&20” trending higher.112
112 Deutsche Bank Hedge Fund Capital Group, February 2016
For new allocations, would you invest in a manager with fees in excess of “2&20”?
Source: 2016 Deutsche Bank Alternative Investment Survey; 2015 Deutsche Bank Alternative Investment Survey; 2014 Deutsche Bank Alternative Investment Survey
100%
2014 Survey 2016 Survey2015 Survey
90%
80%
70%
0%
60%
50%
40%
30%
20%
10%
46%
13%
48%
52%
55%
45%
42%
58%
Yes
No
42% of respondents would pay more than “2&20” for a new allocation.
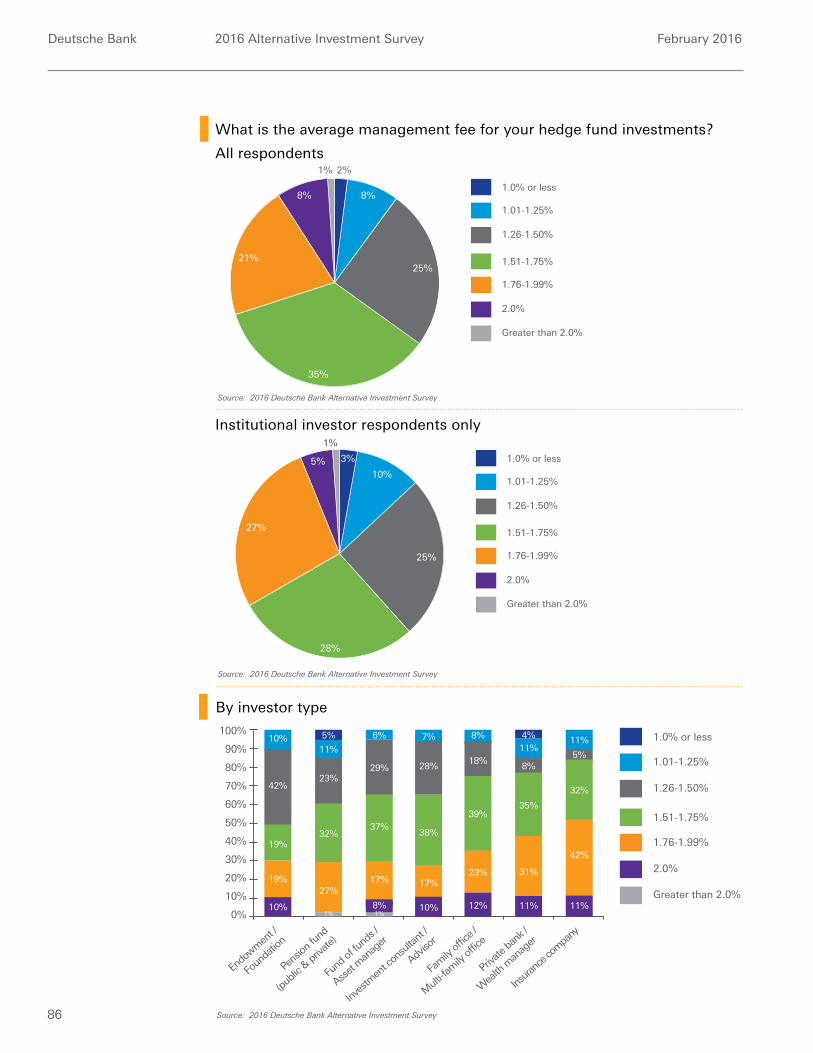
Deutsche Bank 2016 Alternative Investment Survey February 2016
86
What is the average management fee for your hedge fund investments?
All respondents
Source: 2016 Deutsche Bank Alternative Investment Survey
1.26-1.50%
1.0% or less
1.01-1.25%
2.0%
Greater than 2.0%
1.51-1.75%
1.76-1.99%
8%
35%
21%
1% 2%
25%
8%
10%
19%
11%
28%
100%
90%
80%
70%
0%
60%
50%
40%
30%
20%
10%
Inves
tmen
t con
sulta
nt /
Adviso
r
Pens
ion fu
nd
(publi
c & pr
ivate)
Private
bank
/
Wea
lth m
anag
er
Endo
wmen
t /
Foun
datio
n
Insura
nce c
ompa
ny
Fam
ily of
fice /
Mult
i-fam
ily of
fice
8%11%
39%
23%
4%
8%
35%
31%
5%
32%
42%
7%
38%
17%
14%
6%
2%
Fund
of fu
nds /
Asset
man
ager
37%32%
27%
1.26-1.50%
1.0% or less
1.01-1.25%
2.0%
Greater than 2.0%
1.51-1.75%
1.76-1.99%
1%10% 8% 10% 12% 11% 11%
17%
19%
42%23%
29%
1%
5%
14%
18%
11%
Institutional investor respondents only
1.26-1.50%
1.0% or less
1.01-1.25%
2.0%
Greater than 2.0%
1.51-1.75%
1.76-1.99%
5%
25%
27%
1%
28%
10%
3%
Source: 2016 Deutsche Bank Alternative Investment Survey
Source: 2016 Deutsche Bank Alternative Investment Survey
Source: 2016 Deutsche Bank Alternative Investment Survey
By investor type
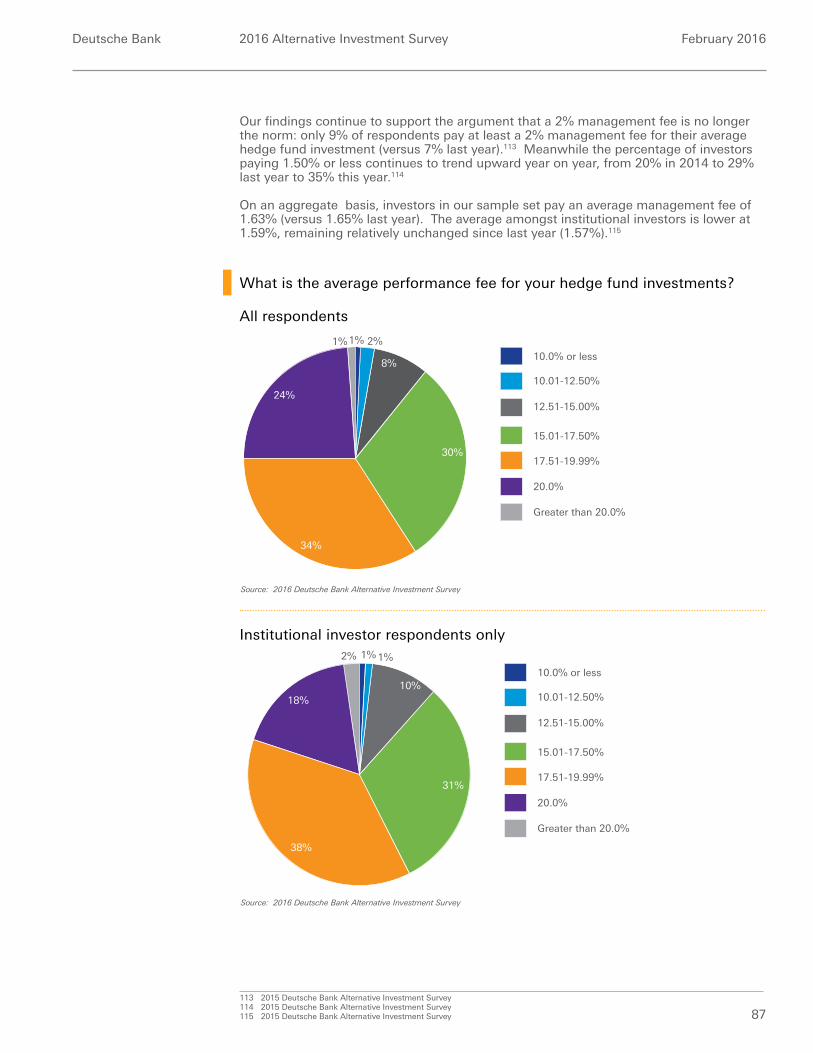
Deutsche Bank 2016 Alternative Investment Survey February 2016
87
Our findings continue to support the argument that a 2% management fee is no longer the norm: only 9% of respondents pay at least a 2% management fee for their average hedge fund investment (versus 7% last year).113 Meanwhile the percentage of investors paying 1.50% or less continues to trend upward year on year, from 20% in 2014 to 29% last year to 35% this year.114
On an aggregate basis, investors in our sample set pay an average management fee of 1.63% (versus 1.65% last year). The average amongst institutional investors is lower at 1.59%, remaining relatively unchanged since last year (1.57%).115
113 2015 Deutsche Bank Alternative Investment Survey114 2015 Deutsche Bank Alternative Investment Survey115 2015 Deutsche Bank Alternative Investment Survey
Institutional investor respondents only
18%
10%
38%
1%
31%
2% 1%
10.0% or less
10.01-12.50%
15.01-17.50%
17.51-19.99%
20.0%
Greater than 20.0%
12.51-15.00%
What is the average performance fee for your hedge fund investments?
All respondents
10.0% or less
10.01-12.50%
15.01-17.50%
17.51-19.99%
20.0%
Greater than 20.0%
24%
34%
2%1%1%
30%
8%
12.51-15.00%
Source: 2016 Deutsche Bank Alternative Investment Survey
Source: 2016 Deutsche Bank Alternative Investment Survey
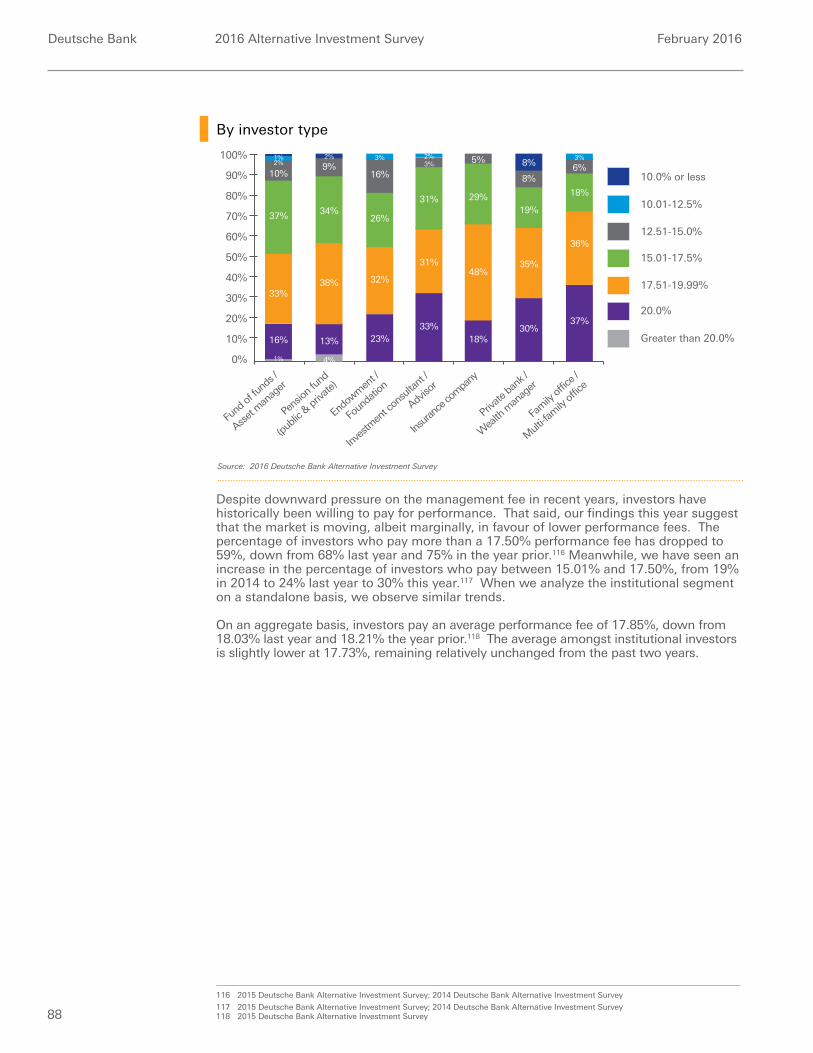
Deutsche Bank 2016 Alternative Investment Survey February 2016
88
Despite downward pressure on the management fee in recent years, investors have historically been willing to pay for performance. That said, our findings this year suggest that the market is moving, albeit marginally, in favour of lower performance fees. The percentage of investors who pay more than a 17.50% performance fee has dropped to 59%, down from 68% last year and 75% in the year prior.116 Meanwhile, we have seen an increase in the percentage of investors who pay between 15.01% and 17.50%, from 19% in 2014 to 24% last year to 30% this year.117 When we analyze the institutional segment on a standalone basis, we observe similar trends.
On an aggregate basis, investors pay an average performance fee of 17.85%, down from 18.03% last year and 18.21% the year prior.118 The average amongst institutional investors is slightly lower at 17.73%, remaining relatively unchanged from the past two years.
116 2015 Deutsche Bank Alternative Investment Survey; 2014 Deutsche Bank Alternative Investment Survey
117 2015 Deutsche Bank Alternative Investment Survey; 2014 Deutsche Bank Alternative Investment Survey118 2015 Deutsche Bank Alternative Investment Survey
Source: 2016 Deutsche Bank Alternative Investment Survey
30%
37%
10%
33%
2%
16%
34%
9%
31%
31%
3%100%
90%
80%
70%
0%
60%
50%
40%
30%
20%
10%
Inves
tmen
t con
sulta
nt /
Adviso
r
Pens
ion fu
nd
(publi
c & pr
ivate)
Private
bank
/
Wea
lth m
anag
er
Endo
wmen
t /
Foun
datio
n
Fund
of fu
nds /
Asset
man
ager
Insura
nce c
ompa
ny
Fam
ily of
fice /
Mult
i-fam
ily of
fice
48%
18%
29%
5%
35%
19%
8%
36%
18%
6%3%2%
17.51-19.99%
12.51-15.0%
10.0% or less
Greater than 20.0%
10.01-12.5%
20.0%
15.01-17.5%
32%
1%
14%
3%
1%
16%
2%
4%
13%
38%
23%
26%
33%
8%
37%
By investor type
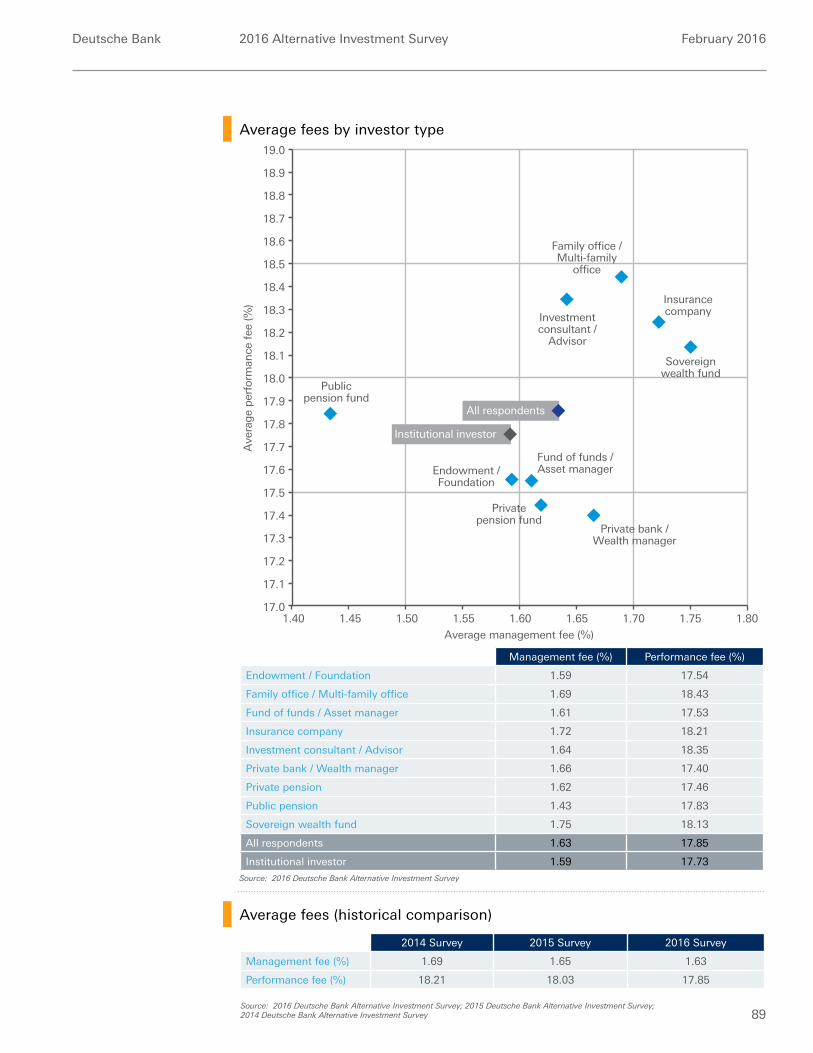
Deutsche Bank 2016 Alternative Investment Survey February 2016
89Source: 2016 Deutsche Bank Alternative Investment Survey; 2015 Deutsche Bank Alternative Investment Survey; 2014 Deutsche Bank Alternative Investment Survey
Management fee (%) Performance fee (%)
Endowment / Foundation 1.59 17.54
Family office / Multi-family office 1.69 18.43
Fund of funds / Asset manager 1.61 17.53
Insurance company 1.72 18.21
Investment consultant / Advisor 1.64 18.35
Private bank / Wealth manager 1.66 17.40
Private pension 1.62 17.46
Public pension 1.43 17.83
Sovereign wealth fund 1.75 18.13
All respondents 1.63 17.85
Institutional investor 1.59 17.73
2014 Survey 2015 Survey 2016 Survey
Management fee (%) 1.69 1.65 1.63
Performance fee (%) 18.21 18.03 17.85
Source: 2016 Deutsche Bank Alternative Investment Survey
Average management fee (%)
Ave
rag
e p
erfo
rman
ce f
ee (%
)
18.9
17.0
18.8
18.7
18.6
18.5
18.4
18.3
18.2
18.1
18.0
17.9
17.8
17.7
17.6
17.5
17.4
17.3
17.2
17.1
1.40
19.0
1.751.701.651.601.551.501.45 1.80
Publicpension fund
Privatepension fund
Endowment /Foundation
Sovereignwealth fund
Investmentconsultant /
Advisor
Institutional investor
All respondents
Fund of funds /Asset manager
Insurancecompany
Family office /Multi-family
office
Private bank /Wealth manager
Average fees by investor type
Average fees (historical comparison)

Deutsche Bank 2016 Alternative Investment Survey February 2016
90

Deutsche Bank 2016 Alternative Investment Survey February 2016
91
Early stage investing & seeding
91
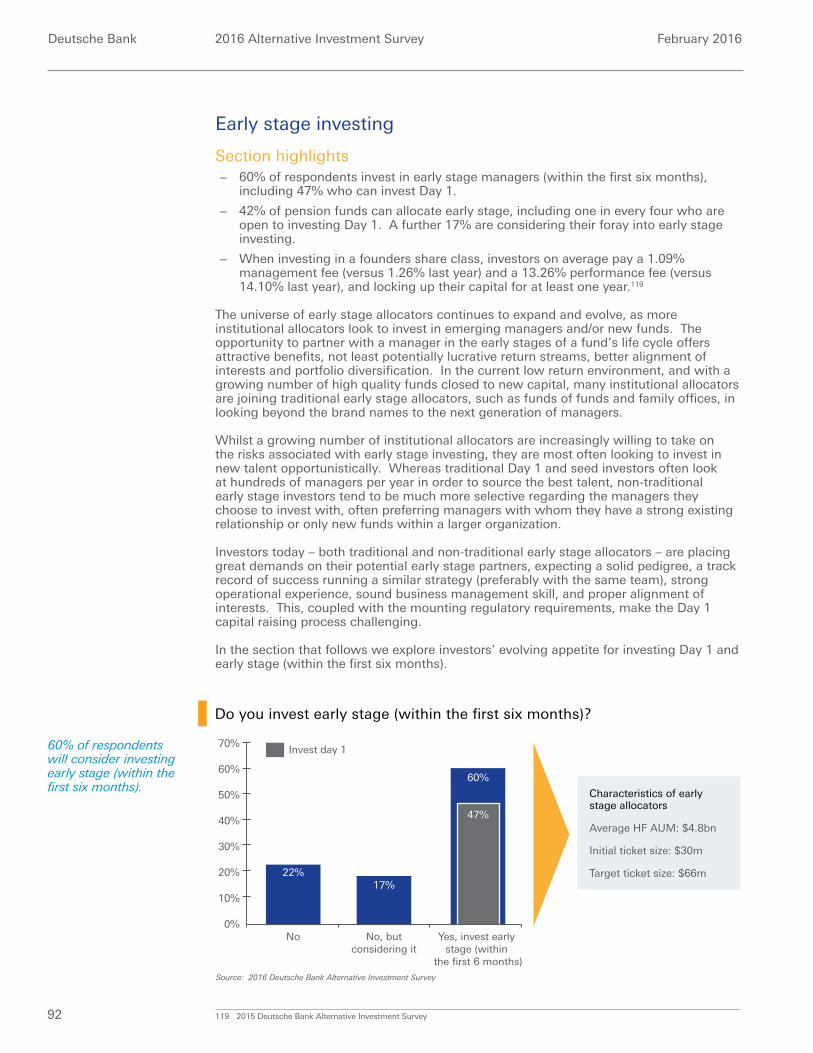
Deutsche Bank 2016 Alternative Investment Survey February 2016
92
Early stage investing
Section highlights − 60% of respondents invest in early stage managers (within the first six months),
including 47% who can invest Day 1.
− 42% of pension funds can allocate early stage, including one in every four who are open to investing Day 1. A further 17% are considering their foray into early stage investing.
− When investing in a founders share class, investors on average pay a 1.09% management fee (versus 1.26% last year) and a 13.26% performance fee (versus 14.10% last year), and locking up their capital for at least one year.119
The universe of early stage allocators continues to expand and evolve, as more institutional allocators look to invest in emerging managers and/or new funds. The opportunity to partner with a manager in the early stages of a fund’s life cycle offers attractive benefits, not least potentially lucrative return streams, better alignment of interests and portfolio diversification. In the current low return environment, and with a growing number of high quality funds closed to new capital, many institutional allocators are joining traditional early stage allocators, such as funds of funds and family offices, in looking beyond the brand names to the next generation of managers.
Whilst a growing number of institutional allocators are increasingly willing to take on the risks associated with early stage investing, they are most often looking to invest in new talent opportunistically. Whereas traditional Day 1 and seed investors often look at hundreds of managers per year in order to source the best talent, non-traditional early stage investors tend to be much more selective regarding the managers they choose to invest with, often preferring managers with whom they have a strong existing relationship or only new funds within a larger organization.
Investors today – both traditional and non-traditional early stage allocators – are placing great demands on their potential early stage partners, expecting a solid pedigree, a track record of success running a similar strategy (preferably with the same team), strong operational experience, sound business management skill, and proper alignment of interests. This, coupled with the mounting regulatory requirements, make the Day 1 capital raising process challenging.
In the section that follows we explore investors’ evolving appetite for investing Day 1 and early stage (within the first six months).
119 2015 Deutsche Bank Alternative Investment Survey
Do you invest early stage (within the first six months)?
Source: 2016 Deutsche Bank Alternative Investment Survey
0%
70%
60%
50%
40%
30%
20%
10%
22%
60%
No
17%
No, butconsidering it
Invest day 1
Yes, invest early stage (within
the first 6 months)
47%
Characteristics of early stage allocators
Average HF AUM: $4.8bn
Initial ticket size: $30m
Target ticket size: $66m
60% of respondents will consider investing early stage (within the first six months).
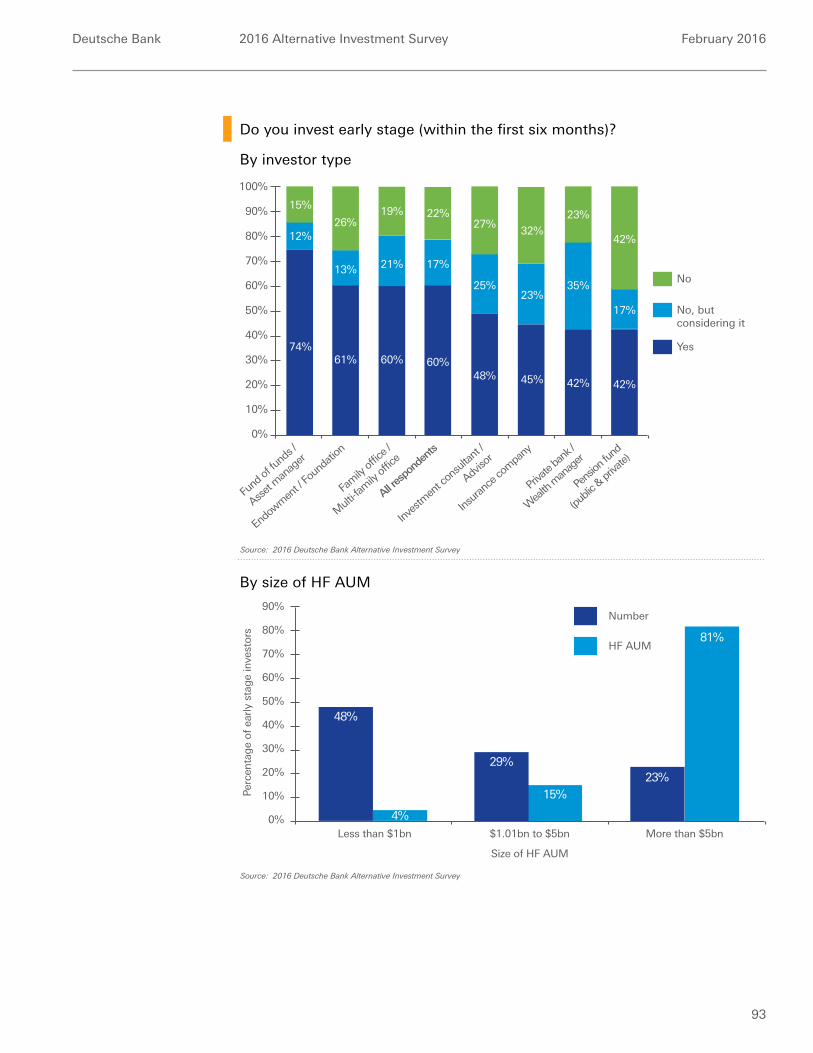
Deutsche Bank 2016 Alternative Investment Survey February 2016
93
30%
20%
10%
0%
40%
Insur
ance
com
pany
Endo
wmen
t / Fo
unda
tion
Inves
tmen
t con
sulta
nt /
Adviso
r
Fund
of fu
nds /
Asset
man
ager
17%
25%
27%
35%
23%
21%
19% 22%
23%
32%
Fam
ily of
fice /
Mult
i-fam
ily of
fice
12%
15%
70%
60%
50%
90%
80%
100%
Priva
te ba
nk /
Wea
lth m
anag
er
All res
pond
ents
13%
60%74%
61%
26%
No, but considering it
Yes
No
60%48%
42%
17%
42%
Pens
ion fu
nd
(publi
c & pr
ivate)
42%45%
By investor type
By size of HF AUM
Do you invest early stage (within the first six months)?
80%
0%
90%
29%
15%
70%
60%
50%
40%
30%
20%
10%
48%
4%
Less than $1bn $1.01bn to $5bn
Size of HF AUM
More than $5bn
23%
81%
Number
HF AUM
Perc
enta
ge
of e
arly
sta
ge
inve
stor
s
Source: 2016 Deutsche Bank Alternative Investment Survey
Source: 2016 Deutsche Bank Alternative Investment Survey
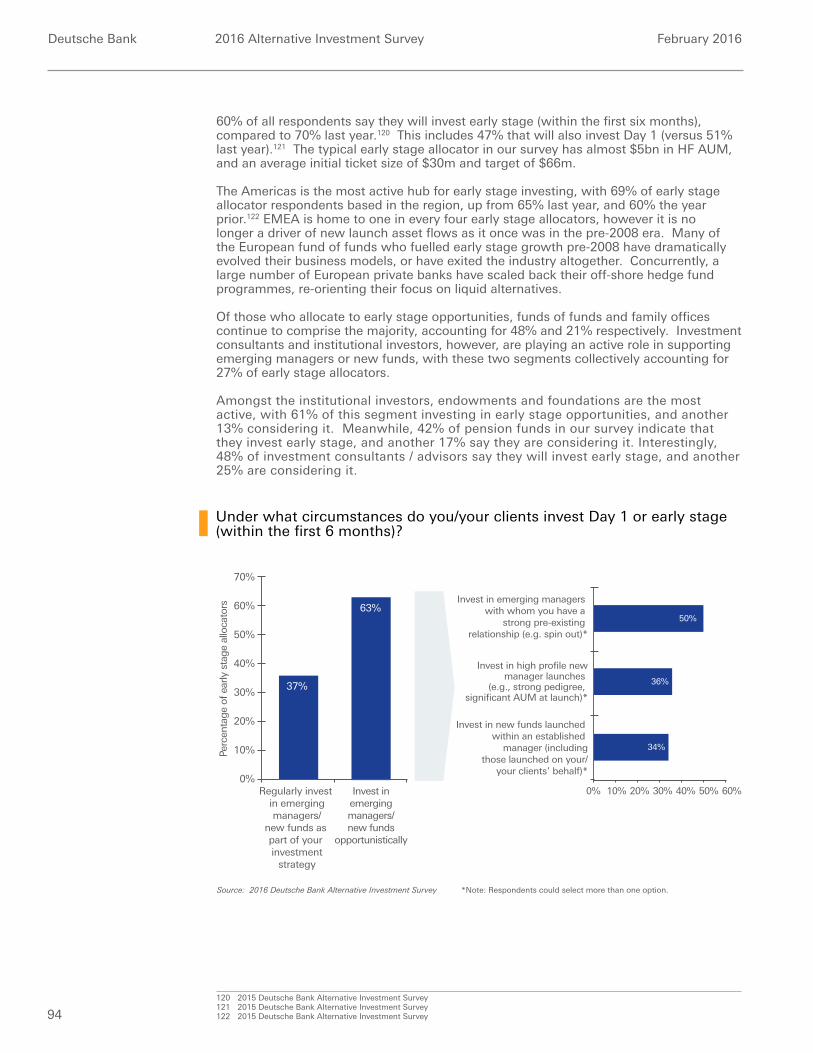
Deutsche Bank 2016 Alternative Investment Survey February 2016
94
Under what circumstances do you/your clients invest Day 1 or early stage (within the first 6 months)?
Source: 2016 Deutsche Bank Alternative Investment Survey
50% 60%40%30%20%10%0%
36%
Invest in high profile newmanager launches
(e.g., strong pedigree, significant AUM at launch)*
Invest in emerging managers with whom you have a
strong pre-existing relationship (e.g. spin out)*
50%
34%
Invest in new funds launched within an established
manager (includingthose launched on your/
your clients’ behalf)*
60% of all respondents say they will invest early stage (within the first six months), compared to 70% last year.120 This includes 47% that will also invest Day 1 (versus 51% last year).121 The typical early stage allocator in our survey has almost $5bn in HF AUM, and an average initial ticket size of $30m and target of $66m.
The Americas is the most active hub for early stage investing, with 69% of early stage allocator respondents based in the region, up from 65% last year, and 60% the year prior.122 EMEA is home to one in every four early stage allocators, however it is no longer a driver of new launch asset flows as it once was in the pre-2008 era. Many of the European fund of funds who fuelled early stage growth pre-2008 have dramatically evolved their business models, or have exited the industry altogether. Concurrently, a large number of European private banks have scaled back their off-shore hedge fund programmes, re-orienting their focus on liquid alternatives.
Of those who allocate to early stage opportunities, funds of funds and family offices continue to comprise the majority, accounting for 48% and 21% respectively. Investment consultants and institutional investors, however, are playing an active role in supporting emerging managers or new funds, with these two segments collectively accounting for 27% of early stage allocators.
Amongst the institutional investors, endowments and foundations are the most active, with 61% of this segment investing in early stage opportunities, and another 13% considering it. Meanwhile, 42% of pension funds in our survey indicate that they invest early stage, and another 17% say they are considering it. Interestingly, 48% of investment consultants / advisors say they will invest early stage, and another 25% are considering it.
120 2015 Deutsche Bank Alternative Investment Survey121 2015 Deutsche Bank Alternative Investment Survey122 2015 Deutsche Bank Alternative Investment Survey
*Note: Respondents could select more than one option.
Invest inemergingmanagers/new funds
opportunistically
Regularly invest in emergingmanagers/
new funds as part of your investment
strategy
37%
63%
70%
0%
60%
50%
40%
30%
20%
10%Perc
enta
ge o
f ear
ly s
tage
allo
cato
rs
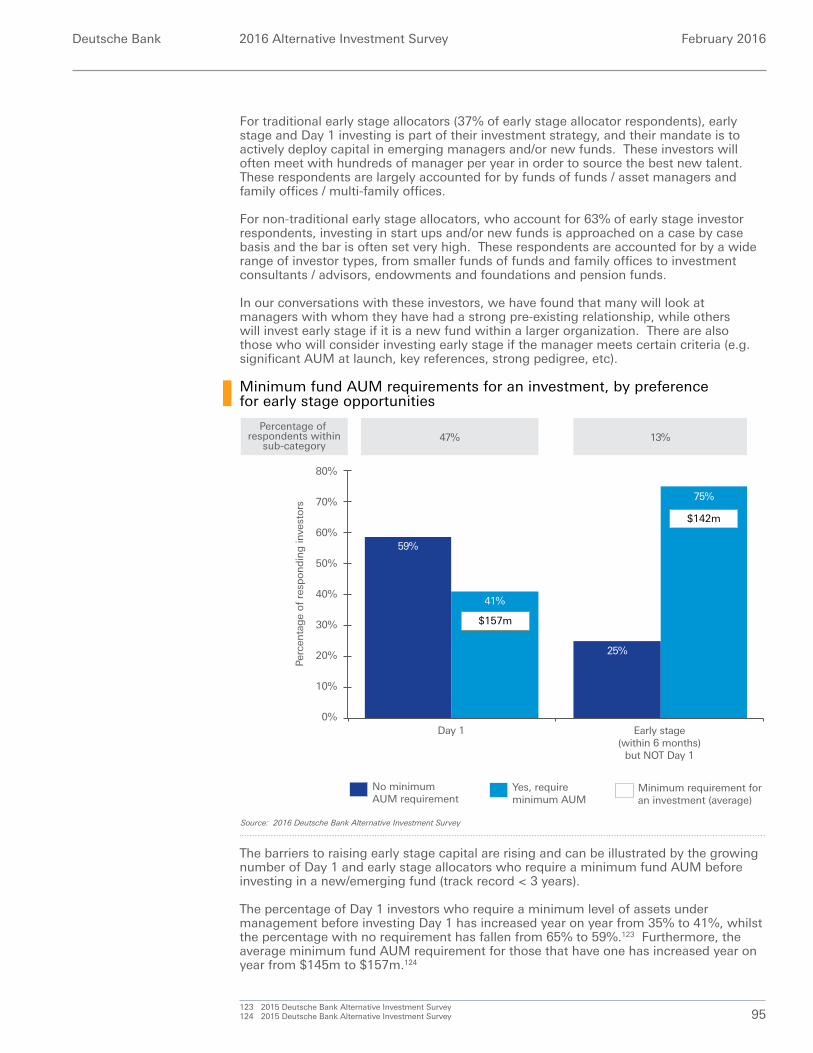
Deutsche Bank 2016 Alternative Investment Survey February 2016
95
For traditional early stage allocators (37% of early stage allocator respondents), early stage and Day 1 investing is part of their investment strategy, and their mandate is to actively deploy capital in emerging managers and/or new funds. These investors will often meet with hundreds of manager per year in order to source the best new talent. These respondents are largely accounted for by funds of funds / asset managers and family offices / multi-family offices.
For non-traditional early stage allocators, who account for 63% of early stage investor respondents, investing in start ups and/or new funds is approached on a case by case basis and the bar is often set very high. These respondents are accounted for by a wide range of investor types, from smaller funds of funds and family offices to investment consultants / advisors, endowments and foundations and pension funds.
In our conversations with these investors, we have found that many will look at managers with whom they have had a strong pre-existing relationship, while others will invest early stage if it is a new fund within a larger organization. There are also those who will consider investing early stage if the manager meets certain criteria (e.g. significant AUM at launch, key references, strong pedigree, etc).
Minimum fund AUM requirements for an investment, by preference for early stage opportunities
Source: 2016 Deutsche Bank Alternative Investment Survey
0%
80%
25%
75%70%
60%
50%
40%
30%
20%
10%
59%
41%
Day 1 Early stage(within 6 months)
but NOT Day 1
Minimum requirement for an investment (average)
Yes, require minimum AUM
No minimumAUM requirement
$157m
$142m
Percentage of respondents within
sub-category47% 13%
Perc
enta
ge
of r
esp
ond
ing
inve
stor
s
The barriers to raising early stage capital are rising and can be illustrated by the growing number of Day 1 and early stage allocators who require a minimum fund AUM before investing in a new/emerging fund (track record < 3 years).
The percentage of Day 1 investors who require a minimum level of assets under management before investing Day 1 has increased year on year from 35% to 41%, whilst the percentage with no requirement has fallen from 65% to 59%.123 Furthermore, the average minimum fund AUM requirement for those that have one has increased year on year from $145m to $157m.124
123 2015 Deutsche Bank Alternative Investment Survey124 2015 Deutsche Bank Alternative Investment Survey
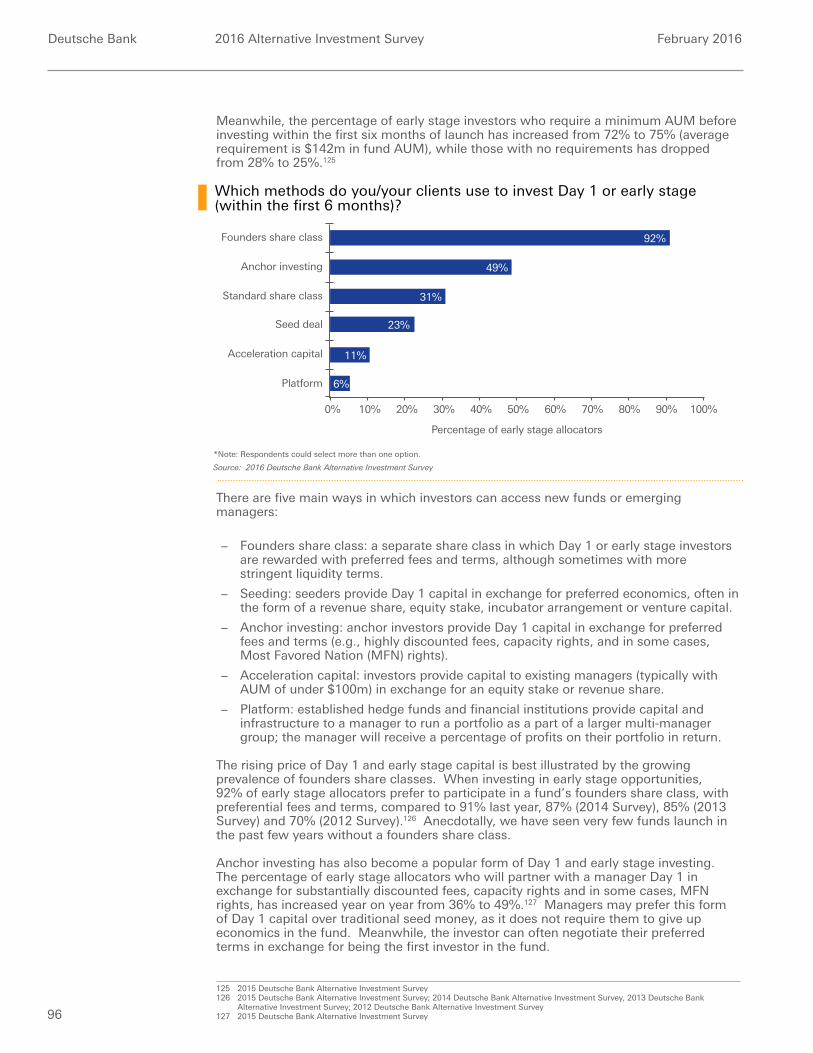
Deutsche Bank 2016 Alternative Investment Survey February 2016
96
Which methods do you/your clients use to invest Day 1 or early stage (within the first 6 months)?
Source: 2016 Deutsche Bank Alternative Investment Survey
Platform
Acceleration capital
Anchor investing
Standard share class
90%80%70%60% 100%50%40%30%20%10%0%
31%
Seed deal
49%
Founders share class 92%
23%
11%
6%
Percentage of early stage allocators
Meanwhile, the percentage of early stage investors who require a minimum AUM before investing within the first six months of launch has increased from 72% to 75% (average requirement is $142m in fund AUM), while those with no requirements has dropped from 28% to 25%.125
There are five main ways in which investors can access new funds or emerging managers:
− Founders share class: a separate share class in which Day 1 or early stage investors are rewarded with preferred fees and terms, although sometimes with more stringent liquidity terms.
− Seeding: seeders provide Day 1 capital in exchange for preferred economics, often in the form of a revenue share, equity stake, incubator arrangement or venture capital.
− Anchor investing: anchor investors provide Day 1 capital in exchange for preferred fees and terms (e.g., highly discounted fees, capacity rights, and in some cases, Most Favored Nation (MFN) rights).
− Acceleration capital: investors provide capital to existing managers (typically with AUM of under $100m) in exchange for an equity stake or revenue share.
− Platform: established hedge funds and financial institutions provide capital and infrastructure to a manager to run a portfolio as a part of a larger multi-manager group; the manager will receive a percentage of profits on their portfolio in return.
The rising price of Day 1 and early stage capital is best illustrated by the growing prevalence of founders share classes. When investing in early stage opportunities, 92% of early stage allocators prefer to participate in a fund’s founders share class, with preferential fees and terms, compared to 91% last year, 87% (2014 Survey), 85% (2013 Survey) and 70% (2012 Survey).126 Anecdotally, we have seen very few funds launch in the past few years without a founders share class.
Anchor investing has also become a popular form of Day 1 and early stage investing. The percentage of early stage allocators who will partner with a manager Day 1 in exchange for substantially discounted fees, capacity rights and in some cases, MFN rights, has increased year on year from 36% to 49%.127 Managers may prefer this form of Day 1 capital over traditional seed money, as it does not require them to give up economics in the fund. Meanwhile, the investor can often negotiate their preferred terms in exchange for being the first investor in the fund.
125 2015 Deutsche Bank Alternative Investment Survey126 2015 Deutsche Bank Alternative Investment Survey; 2014 Deutsche Bank Alternative Investment Survey, 2013 Deutsche Bank
Alternative Investment Survey; 2012 Deutsche Bank Alternative Investment Survey127 2015 Deutsche Bank Alternative Investment Survey
*Note: Respondents could select more than one option.
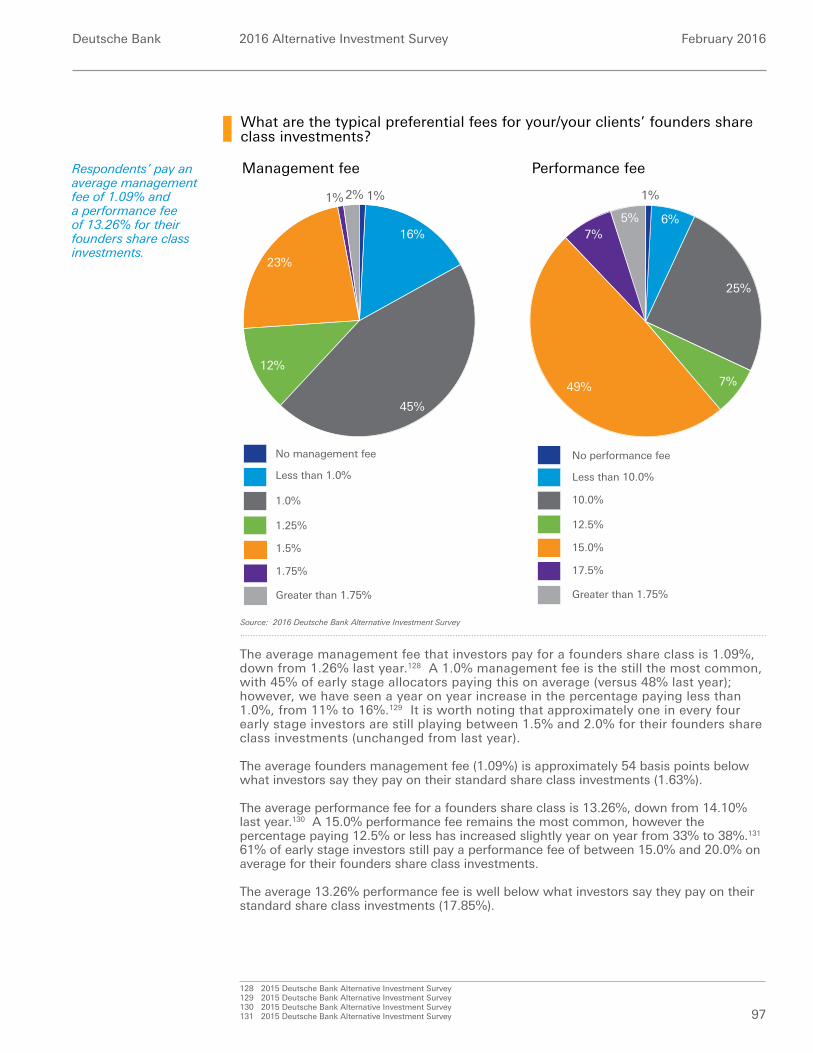
Deutsche Bank 2016 Alternative Investment Survey February 2016
97
1.0%
No management fee
Less than 1.0%
1.75%
Greater than 1.75%
1.25%
1.5%
23%
12%
1% 2% 1%
45%
16%
Management fee Performance fee
Source: 2016 Deutsche Bank Alternative Investment Survey
10.0%
No performance fee
Less than 10.0%
17.5%
Greater than 1.75%
12.5%
15.0%
7%
49%
5%
1%
6%
7%
25%
What are the typical preferential fees for your/your clients’ founders share class investments?
The average management fee that investors pay for a founders share class is 1.09%, down from 1.26% last year.128 A 1.0% management fee is the still the most common, with 45% of early stage allocators paying this on average (versus 48% last year); however, we have seen a year on year increase in the percentage paying less than 1.0%, from 11% to 16%.129 It is worth noting that approximately one in every four early stage investors are still playing between 1.5% and 2.0% for their founders share class investments (unchanged from last year).
The average founders management fee (1.09%) is approximately 54 basis points below what investors say they pay on their standard share class investments (1.63%).
The average performance fee for a founders share class is 13.26%, down from 14.10% last year.130 A 15.0% performance fee remains the most common, however the percentage paying 12.5% or less has increased slightly year on year from 33% to 38%.131 61% of early stage investors still pay a performance fee of between 15.0% and 20.0% on average for their founders share class investments.
The average 13.26% performance fee is well below what investors say they pay on their standard share class investments (17.85%).
128 2015 Deutsche Bank Alternative Investment Survey129 2015 Deutsche Bank Alternative Investment Survey130 2015 Deutsche Bank Alternative Investment Survey131 2015 Deutsche Bank Alternative Investment Survey
Respondents’ pay an average management fee of 1.09% and a performance fee of 13.26% for their founders share class investments.
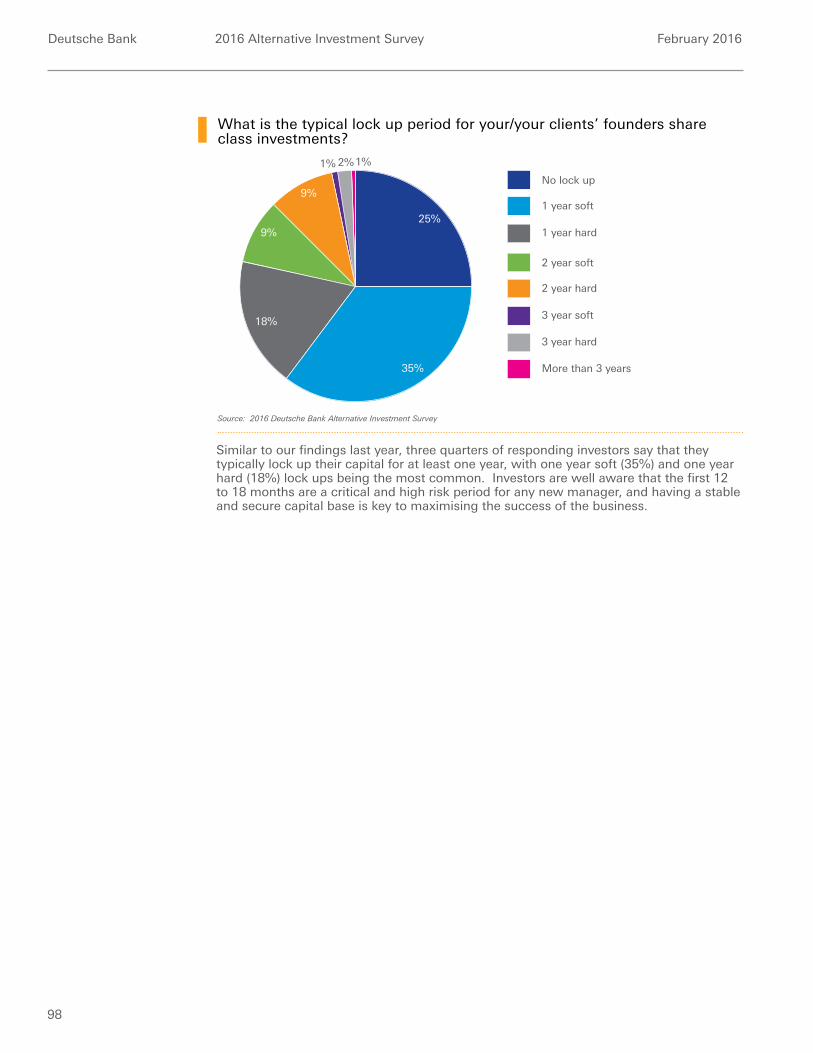
Deutsche Bank 2016 Alternative Investment Survey February 2016
98
1 year hard
No lock up
1 year soft
3 year soft
3 year hard
More than 3 years
2 year soft
2 year hard
9%
9%
18%
2%1%1%
35%
25%
What is the typical lock up period for your/your clients’ founders share class investments?
Source: 2016 Deutsche Bank Alternative Investment Survey
Similar to our findings last year, three quarters of responding investors say that they typically lock up their capital for at least one year, with one year soft (35%) and one year hard (18%) lock ups being the most common. Investors are well aware that the first 12 to 18 months are a critical and high risk period for any new manager, and having a stable and secure capital base is key to maximising the success of the business.

Deutsche Bank 2016 Alternative Investment Survey February 2016
99
AIFMD
99
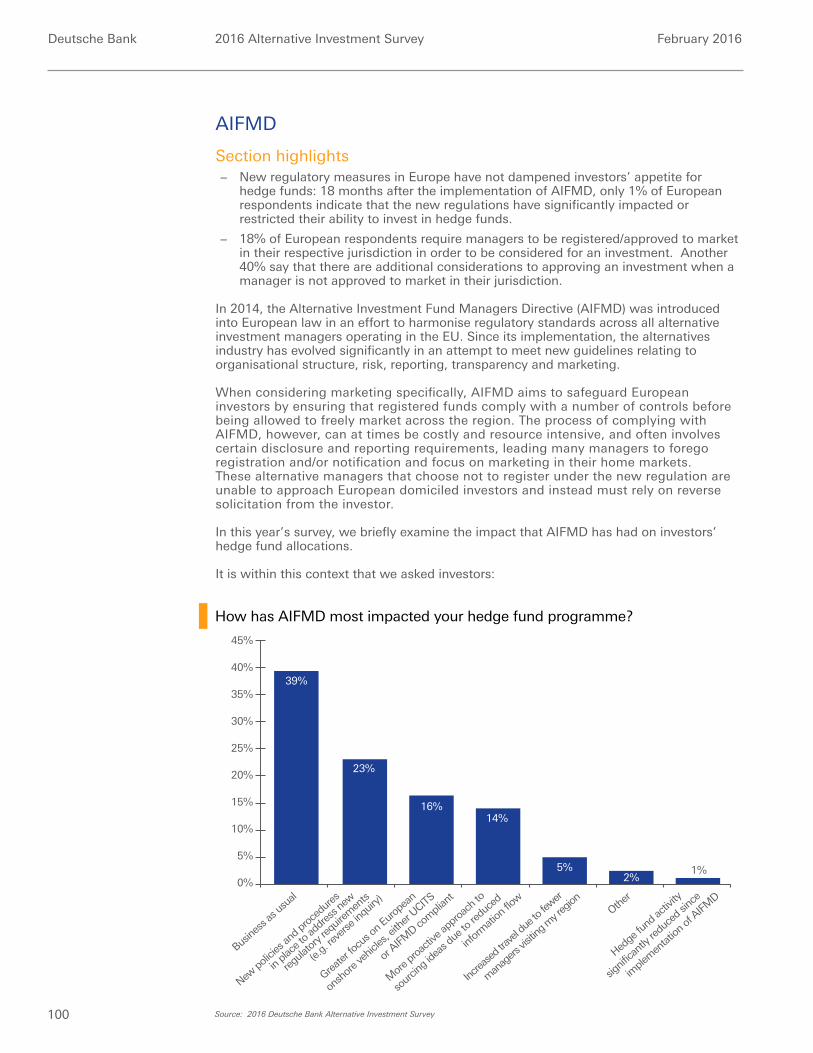
Deutsche Bank 2016 Alternative Investment Survey February 2016
100
AIFMD
Section highlights − New regulatory measures in Europe have not dampened investors’ appetite for
hedge funds: 18 months after the implementation of AIFMD, only 1% of European respondents indicate that the new regulations have significantly impacted or restricted their ability to invest in hedge funds.
− 18% of European respondents require managers to be registered/approved to market in their respective jurisdiction in order to be considered for an investment. Another 40% say that there are additional considerations to approving an investment when a manager is not approved to market in their jurisdiction.
In 2014, the Alternative Investment Fund Managers Directive (AIFMD) was introduced into European law in an effort to harmonise regulatory standards across all alternative investment managers operating in the EU. Since its implementation, the alternatives industry has evolved significantly in an attempt to meet new guidelines relating to organisational structure, risk, reporting, transparency and marketing.
When considering marketing specifically, AIFMD aims to safeguard European investors by ensuring that registered funds comply with a number of controls before being allowed to freely market across the region. The process of complying with AIFMD, however, can at times be costly and resource intensive, and often involves certain disclosure and reporting requirements, leading many managers to forego registration and/or notification and focus on marketing in their home markets. These alternative managers that choose not to register under the new regulation are unable to approach European domiciled investors and instead must rely on reverse solicitation from the investor.
In this year’s survey, we briefly examine the impact that AIFMD has had on investors’ hedge fund allocations.
It is within this context that we asked investors:
15%
10%
5%
0%
20%
Busine
ss as
usua
l
Greater
focu
s on E
urop
ean
onsh
ore v
ehicl
es, e
ither
UCITS
or A
IFMD co
mpli
ant
Mor
e pro
activ
e app
roac
h to
sour
cing i
deas
due t
o red
uced
infor
mati
on flo
w
Increa
sed t
ravel
due t
o few
er
man
agers
visit
ing m
y reg
ion
New po
licies
and p
roce
dures
in pla
ce to
addr
ess n
ew
regula
tory
requir
emen
ts
(e.g.
revers
e inq
uiry)
Hedge
fund
activ
ity
signif
icant
ly red
uced
sinc
e
imple
men
tation
of A
IFMD
Other
39%
23%
14%
5%
16%
2%1%
25%
30%
35%
40%
45%
How has AIFMD most impacted your hedge fund programme?
Source: 2016 Deutsche Bank Alternative Investment Survey
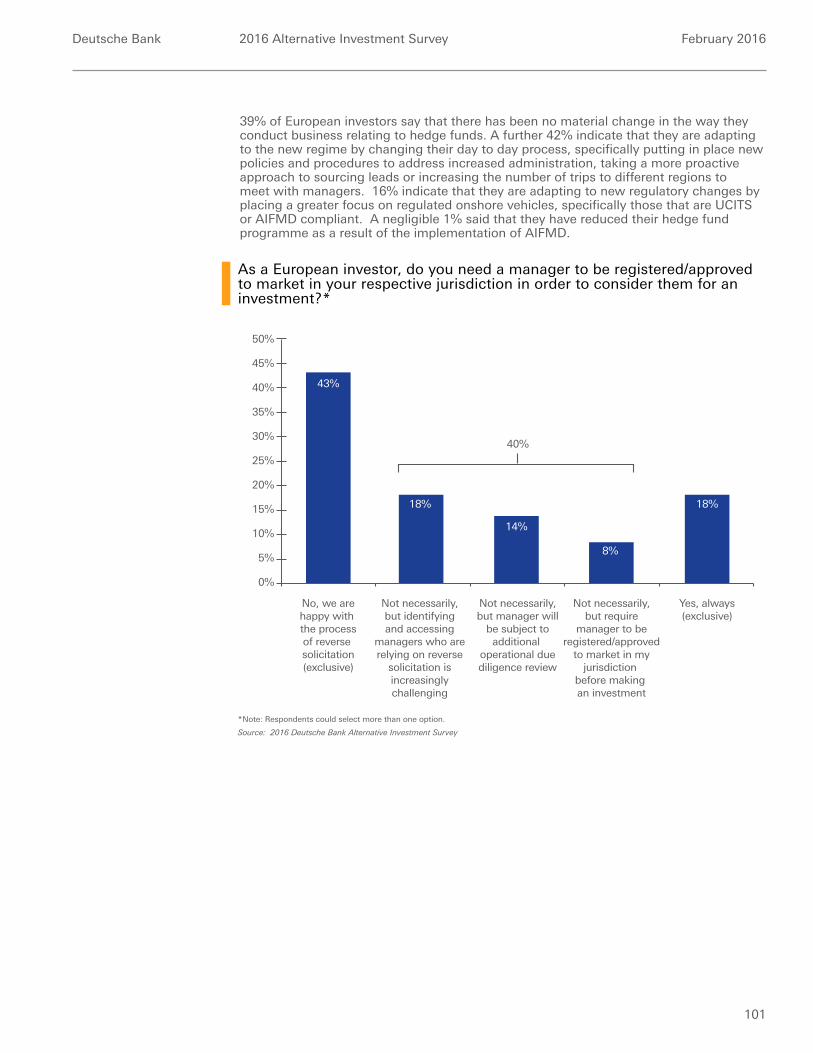
Deutsche Bank 2016 Alternative Investment Survey February 2016
101
15%
10%
5%
0%
20%
43%
18%
8%
18%
14%
40%
25%
30%
35%
40%
45%
50%
No, we arehappy with the processof reverse solicitation(exclusive)
Not necessarily,but identifyingand accessing
managers who arerelying on reverse
solicitation isincreasinglychallenging
Not necessarily,but manager will
be subject toadditional
operational duediligence review
Not necessarily,but require
manager to beregistered/approved
to market in myjurisdiction
before making an investment
Yes, always(exclusive)
As a European investor, do you need a manager to be registered/approved to market in your respective jurisdiction in order to consider them for an investment?*
Source: 2016 Deutsche Bank Alternative Investment Survey
39% of European investors say that there has been no material change in the way they conduct business relating to hedge funds. A further 42% indicate that they are adapting to the new regime by changing their day to day process, specifically putting in place new policies and procedures to address increased administration, taking a more proactive approach to sourcing leads or increasing the number of trips to different regions to meet with managers. 16% indicate that they are adapting to new regulatory changes by placing a greater focus on regulated onshore vehicles, specifically those that are UCITS or AIFMD compliant. A negligible 1% said that they have reduced their hedge fund programme as a result of the implementation of AIFMD.
*Note: Respondents could select more than one option.
Deutsche Bank 2016 Alternative Investment Survey February 2016
102
Almost one in every five European investors require a fund to be registered/approved to market within their domiciled country before considering an investment in the respective fund. These respondents were largely accounted for by private banks / wealth managers, who are generally more biased towards onshore vehicles. There were no institutional investors who responded in this manner.
A further 40% say whilst they do not necessarily need a manager to be registered/approved to market in their jurisdiction, there are increased requirements to making an investment as a result of AIFMD. This includes 18% who find sourcing the right managers increasingly challenging, and 22% who will have additional operational review on non-registered funds or require registration before making an investment.
Comparing investor responses across European countries, the United Kingdom once again proved to be the most comfortable with the AIFMD legislation, with 42% of UK respondents stating that they were happy with the process of reverse solicitation compared to 25% other European investors (excluding Switzerland). Whilst Switzerland falls outside the scope of AIFMD, we also asked this question of investors from Switzerland, where new regulations are changing the way hedge fund marketing is being conducted in the region: 68% of Swiss investors do not require managers to have approval to market in their jurisdiction (e.g. appoint a Swiss paying agent and Swiss representative), compared to 11% who did. This is largely accounted for by the fact that the majority of Swiss investors responding to our survey are regulated qualified investors, to whom the new Swiss regulations do not apply.
Hedge Fund Capital Group
EMEAAnita Nemes +44 (0)20 754-76282 [email protected]
Christina Fast +44 (0)20 754-52903 [email protected]
Jueta Kurar +44 (0)20 754-52148 [email protected]
Guillaume Mathais +44 (0)20 754-51443 [email protected]
Elie-Nathan Parienti +44 (0)20 754-52903 [email protected]
Sasha Temple-Jones +44 (0)20 754-56194 [email protected]
Caroline Worrall +44 (0)20 754-77239 [email protected]
AmericasMarlin Naidoo +1 (212) 250-4950 [email protected]
Stacy Bartolomeo +1 (212) 250-6427 [email protected]
Kelsie Blalock +1 (904) 520-5517 [email protected]
Matthew Costello +1 (415) 617-2833 [email protected]
Mike DeSantis +1 (212) 250-0820 [email protected]
Jennifer Flandina +1 (312) 537-1079 [email protected]
Jennifer Gregory +1 (212) 250-6229 [email protected]
Andrew Harvey +1 (212) 250-4950 [email protected]
Nadean Novogratz +1 (212) 250-8468 [email protected]
Matt Palmer +1 (212) 250-6747 [email protected]
Fred Shek +1 (212) 250-4379 [email protected]
Asia PacificMasa Yanagisawa +81 (3) 5156-6591 [email protected]
Damien Jasczyk +61 (2) 8258-2855 [email protected]
Michelle Lim +852 2203-6995 [email protected]
Ayako Shigezaki +81 (3) 5156 6570 [email protected]
Stephanie Chen +852 2203-6080 [email protected]
Author: Christina Fast, Hedge Fund Capital Group

This advertisement has been approved and/or communicated by Deutsche Bank AG or by its subsidiaries and/ or affiliates (“DB”) and appears as a matter of record only. Without limitation, this advertisement does not constitute an offer or a recommendation to enter into any transaction. The offer of any services and/or securities in any jurisdiction by Deutsche Bank AG or by its subsidiaries and/or affiliates will be made in accordance with appropriate local legislation and regulation. Deutsche Bank AG is authorised under German Banking Law (competent authority: European Central Bank) and, in the United Kingdom, by the Prudential Regulation Authority. It is subject to supervision by the European Central Bank and by BaFin, Germany’s Federal Financial Supervisory Authority, and is subject to limited regulation in the United Kingdom by the Prudential Regulation Authority and Financial Conduct Authority. Details about the extent of our authorisation and regulation by the Prudential Regulation Authority and regulation by the Financial Conduct Authority are available on request. Securities and investment banking activities in the United States are performed by Deutsche Bank Securities Inc., member NYSE, NASD and SIPC, and its broker-dealer affiliates. Lending and other commercial banking activities in the United States are performed by Deutsche Bank AG, and its banking affiliates. Investments are subject to investment risk, including market fluctuations, regulatory change, counterparty risk, possible delays in repayment and loss of income and principal invested. © Copyright Deutsche Bank 2016
In a consolidating market where performance is key, you need an experienced partner in Prime Brokerage that can help you navigate the opportunities and challenges ahead. The Global Prime Finance platform delivers innovative financing and prime brokerage solutions to the world’s largest and most sophisticated managers. Client service is the foundation of our model - providing seamless coverage, multi-asset financing solutions and access in markets worldwide.
www.db.com
Clients can expect more with Deutsche Bank
Deutsche Bank Global Prime Finance
Related Documents


