Altered Expression of Cellular Markers in Molecular Brain Aging by Anulika Nwakaeze A thesis submitted in conformity with the requirements for the degree of Master of Science Graduate Department of Pharmacology and Toxicology University of Toronto © Copyright by Anulika Nwakaeze 2016

Welcome message from author
This document is posted to help you gain knowledge. Please leave a comment to let me know what you think about it! Share it to your friends and learn new things together.
Transcript

Altered Expression of Cellular Markers in Molecular Brain Aging
by
Anulika Nwakaeze
A thesis submitted in conformity with the requirements for the degree of Master of Science
Graduate Department of Pharmacology and Toxicology
University of Toronto
© Copyright by Anulika Nwakaeze 2016

ii
Altered Expression of Cellular Markers in Molecular Brain Aging
Anulika Nwakaeze
Master of Science
Graduate Department of Pharmacology and Toxicology
University of Toronto
2016 ABSTRACT The molecular aging of the human brain encompasses pervasive transcriptome changes
associated with “normal” brain aging that occur in local cortical circuits comprised of GABA
neurons, pyramidal cells, and astrocytes. Cortical samples obtained from a novel postmortem
human cohort were analyzed using RT-qPCR technology to assess changes in the expression of
nine markers representative of neuropeptide signalling, synaptic function, calcium regulation,
and glial activation within cortical cellular networks that occur in congruence with a pervasive
molecular program mediating brain aging. Presynaptic interneuron markers displayed decreases
in expression in aged subjects compared to young controls, whilst postsynaptic interneuron
marker expression was increased, as was the expression of glial markers. Although changes in
extrasynaptic glutamate marker expression were not significantly different, there was a nominal
decrease in their expression in aged subjects. Altogether, these results replicate findings of
pervasive molecular changes in the aged cortex, and suggest consequences for cortical network
function.

iii
ACKNOWLEDGEMENTS
I would like to take this opportunity to express my sincere gratitude to my supervisor, Dr.
Etienne Sibille, for accepting me into his prestigious lab and for providing me with counselling
and guidance throughout my degree. Additionally, I am grateful to my advisor, Dr. Peter
McPherson, for his understanding and patience with me during difficult moments of my graduate
studies, and to my committee members for their valuable insights into my project.
I would also like to extend my appreciation to my colleagues in the Sibille lab, particularly to
Drs. Brad Rocco, Hyunjung Oh, and Yuliya Nikolova, who mentored me in this exciting project.
Their knowledge and expertise in molecular biological and data analytical techniques were
instrumental to my success in the program.
Finally, I am endlessly grateful to my parents for their unwavering support, love, and
encouragement.
iv
TABLE OF CONTENTS Abstract ........................................................................................................................................... II
Acknowledgements ....................................................................................................................... III
List of Tables ................................................................................................................................ VI
List of Figures .............................................................................................................................. VII
List of Abbreviations .................................................................................................................. VIII
List of Appendices ........................................................................................................................ IX
Chapter 1: Introduction and Background ........................................................................................ 1
Research objectives .................................................................................................................... 2
Literature review ........................................................................................................................ 2
An introduction to aging ..................................................................................................... 2
Normal brain aging ............................................................................................................. 3
Definition of normal brain aging ............................................................................ 3
Functional changes in normal brain aging .............................................................. 4
Molecular changes in normal brain aging ............................................................... 6
Altered neuropeptide gene expression in GABAergic neurons ................ 10
Altered intracellular calcium signalling in local cortical circuits ............. 12
Altered GABAergic and glutamatergic transmission across synapses ..... 14
Altered activity of glial cells ..................................................................... 16
Molecular aging of the prefrontal cortex .......................................................................... 18
Age-by-disease interaction hypothesis ............................................................................. 18
Rationale ................................................................................................................................... 20
Hypothesis ................................................................................................................................ 20

v
Predictions ................................................................................................................................ 20
Research tools ........................................................................................................................... 21
Chapter 2: Materials and Methods ................................................................................................ 22
Summary of research methods ................................................................................................. 23
RT-qPCR experimental protocol ............................................................................................... 24
Summary of RT-qPCR protocol ....................................................................................... 24
Sample collection ............................................................................................................. 25
RNA isolation and conversion to cDNA .......................................................................... 28
Primer design, preparation, and testing ............................................................................. 30
RT-qPCR program and assay ............................................................................................ 31
Fold change calculation ................................................................................................... 32
Statistical analyses ............................................................................................................ 33
Chapter 4: Results ......................................................................................................................... 34
The majority of gene expression changes are age-dependent .................................................. 35
Altered GABAergic marker expression with age ..................................................................... 35
Increased glial marker expression with age .............................................................................. 36
Unchanged glutamatergic marker expression with age ............................................................. 36
Principle component of variance in gene expression is captured by age .................................. 40
Gene expression changes in circuitry are concerted ................................................................. 41
Cell markers group together irrespective of age ....................................................................... 41
Chapter 5: Discussion ................................................................................................................... 45
Summary ................................................................................................................................... 46
Role of cell markers in GABA-mediated local circuit function ................................................ 46

vi
Role of observed changes in aging ............................................................................................ 47
Age-by-disease interaction model ............................................................................................. 49
Study limitations ...................................................................................................................... 52
Conclusions ............................................................................................................................... 53
Appendices .................................................................................................................................... 54
RNA extraction data .................................................................................................................. 54
Standardized cDNA volumes .................................................................................................... 54
Primer sequences ....................................................................................................................... 55
UNIANOVA analysis of variance ............................................................................................. 55
Correlation matrix of gene expression ...................................................................................... 56
References ..................................................................................................................................... 57

vii
LIST OF TABLES
Description Page no. Table 1:sample demographics 27
Table 2:cDNA synthesis reagent volumes
Table 3: cDNA synthesis program
28
29
Table 4:RT-qPCR program 31
viii
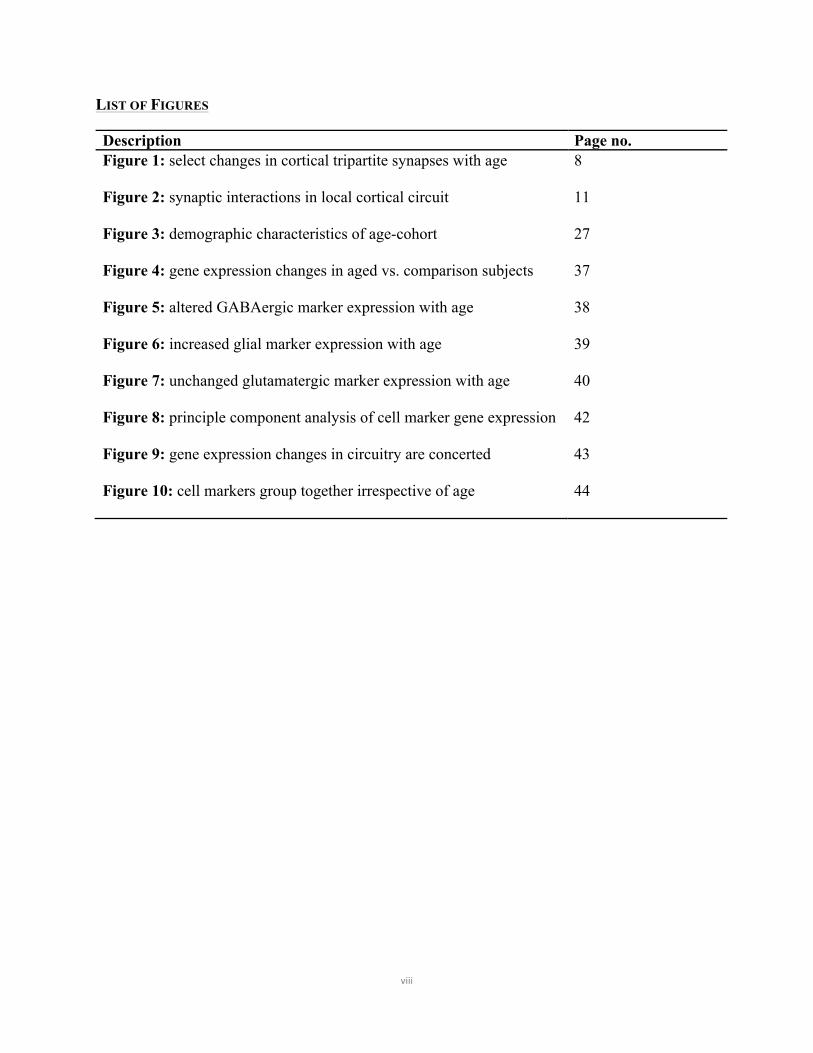
LIST OF FIGURES
Description Page no. Figure 1: select changes in cortical tripartite synapses with age
Figure 2: synaptic interactions in local cortical circuit
Figure 3: demographic characteristics of age-cohort
8
11
27
Figure 4: gene expression changes in aged vs. comparison subjects 37
Figure 5: altered GABAergic marker expression with age
Figure 6: increased glial marker expression with age
Figure 7: unchanged glutamatergic marker expression with age
Figure 8: principle component analysis of cell marker gene expression
Figure 9: gene expression changes in circuitry are concerted
Figure 10: cell markers group together irrespective of age
38
39
40
42
43
44
ix
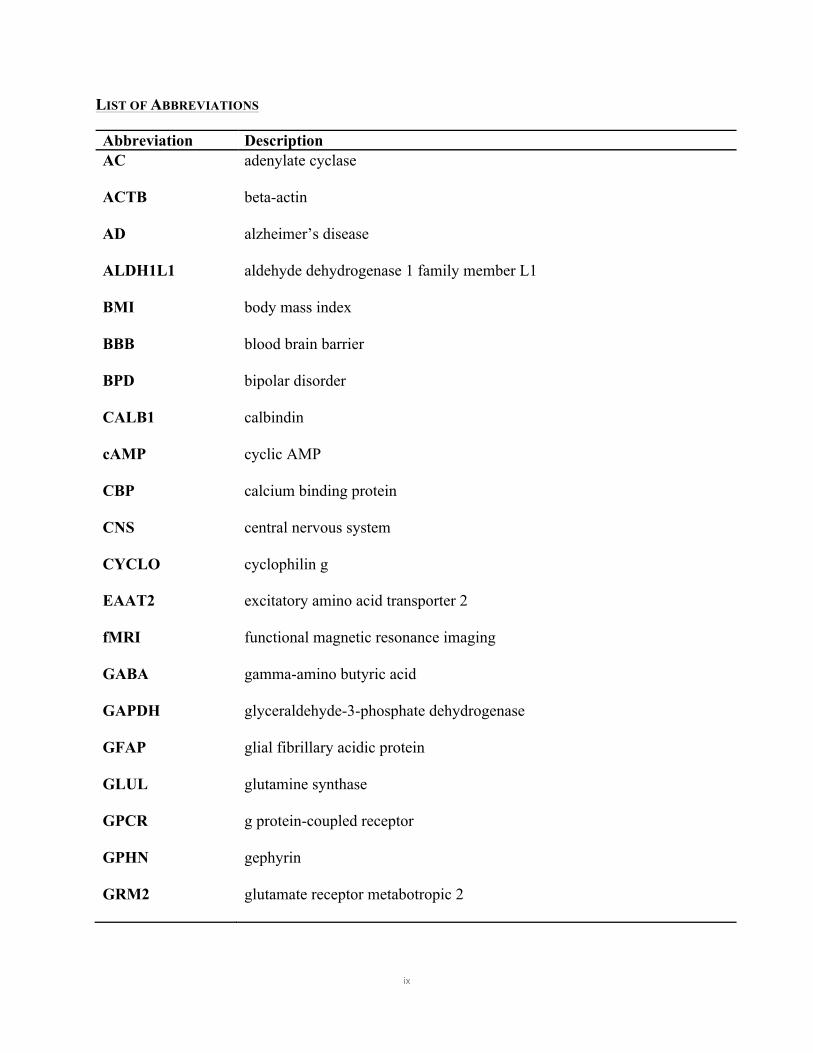
LIST OF ABBREVIATIONS
Abbreviation Description AC
ACTB
adenylate cyclase
beta-actin
AD
ALDH1L1
BMI
alzheimer’s disease
aldehyde dehydrogenase 1 family member L1
body mass index
BBB
BPD
CALB1
cAMP
CBP
CNS
blood brain barrier
bipolar disorder
calbindin
cyclic AMP
calcium binding protein
central nervous system
CYCLO
EAAT2
fMRI
GABA
GAPDH
GFAP
GLUL
GPCR
GPHN
GRM2
cyclophilin g
excitatory amino acid transporter 2
functional magnetic resonance imaging
gamma-amino butyric acid
glyceraldehyde-3-phosphate dehydrogenase
glial fibrillary acidic protein
glutamine synthase
g protein-coupled receptor
gephyrin
glutamate receptor metabotropic 2

x
GRM3
MDD
mRNA
PD
PET
PFC
PVALB
RT-qPCR
SCZ
SST
glutamate receptor metabotropic 3
major depressive disorder
messenger ribonucleic acid
parkinson’s disease
positron emission tomography
prefrontal cortex
parvalbumin
reverse-transcription quantitative polymerase chain reaction
schizophrenia
somatostatin
xi
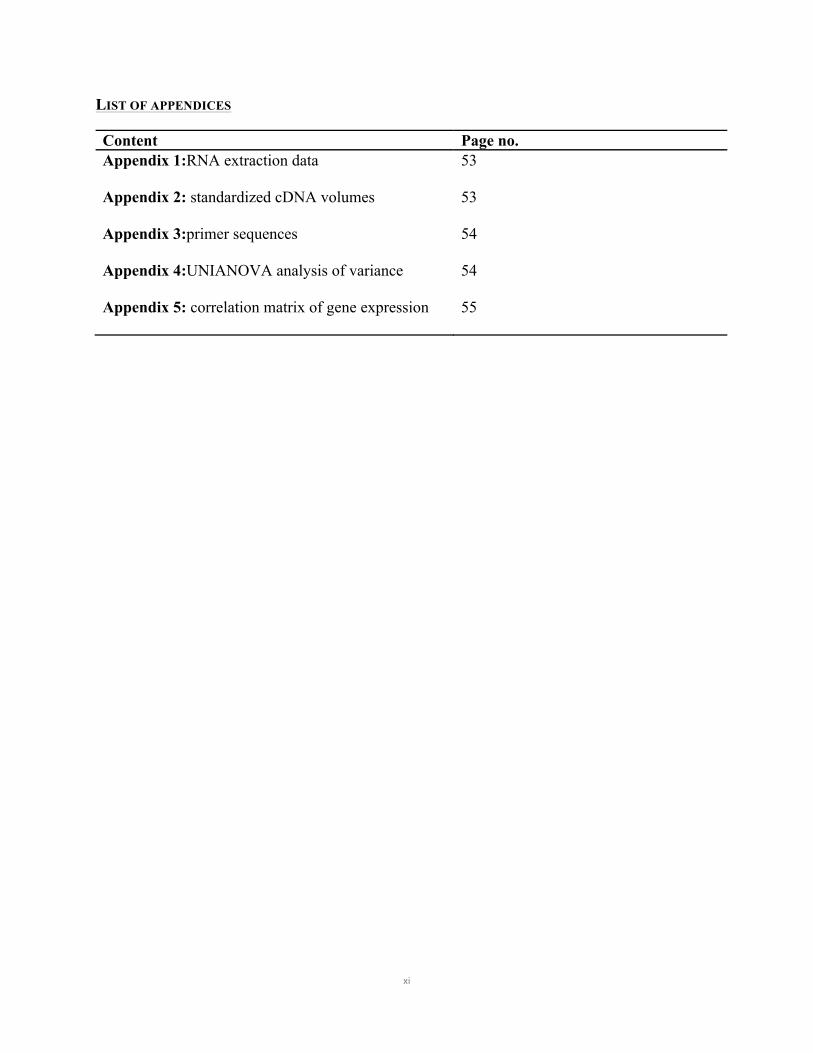
LIST OF APPENDICES
Content Page no. Appendix 1:RNA extraction data
Appendix 2: standardized cDNA volumes
53
53
Appendix 3:primer sequences 54
Appendix 4:UNIANOVA analysis of variance
Appendix 5: correlation matrix of gene expression
54
55

1
CHAPTER 1: INTRODUCTION AND BACKGROUND

2
RESEARCH OBJECTIVES
The goal of this thesis is to assess a relationship between gene expression changes of cellular
markers in the orbitoventral prefrontal cortex across aging:
Aim I: Examine age-dependent changes in the gene expression profiles of cortical
neurons (pyramidal cells and GABAergic interneurons) and glia (astrocytes).
Aim II: Examine a correlation between advancing age and the accumulation of gene
expression changes.
Aim III: Examine a concerted movement of gene expression changes that occur in
interneurons, pyramidal cells, and astrocytes.
LITERATURE REVIEW
An Introduction to Aging
Aging is broadly defined as the time-dependent functional decline that affects most living
organisms1. This deterioration is the predominant risk factor for developing human
pathologies, including neurological disease 1.The number of older persons, i.e. those aged 60
years or over, has substantially increased globally, and that growth is projected to accelerate.
This demographic is projected to grow by 56% by 2030 and to double in size by 2050,
reaching nearly 2.1 billion 2.The number of people aged 80 years or over, defined as the
“oldest-old”, is showing the fastest acceleration in growth2. The global proportion of people
aged 80 years or over is expected to rise to more than 20% in 20502. The number of older
persons is growing faster than any other age demographic worldwide 2.

3
The aging process is most advanced in urban areas and in high-income countries 2. In Canada,
the number of persons aged 65 and over outnumbered children under 15 years for the first time
in the country’s history 3. 16.1% of Canadians were aged 65 years and over 3. The share of
Canadians in this demographic is projected to account for 20.1% of the national population by
2024 3.
The global aging phenomenon is largely attributed to improvements in medical care and health
practices4. However, with the increase in longevity comes the higher risk of developing
diseases associated with aging, such as neurodegenerative and neuropsychiatric disorders5.
Thus, it is essential to extensively characterize the process of brain aging, beginning with
elucidating the molecular mechanisms and genetic underpinnings of age-related changes in the
brain and their overlap with neurological diseases.
Normal Brain Aging
Definition of Normal Brain Aging
Normal brain aging refers to the characteristic molecular changes of the central nervous system
(CNS) that occur with age in the absence of clinically diagnosed neurodegenerative and
neuropsychiatric pathology6. The aging process is associated with patterns of molecular
changes which mediate widespread effects in cognitive, motor, and mood systems that
typically occur with age6.
Normal aging of the brain is a largely understudied area of research6.Brain aging is associated
with progressive transcriptome changes regulated by molecular signals within neurons and
4
glial cells, which underlie age-related cognitive, motor, and mood changes and susceptibility to
neurological disease 6. Studies have revealed that a conserved molecular brain aging program
may contribute to functional declines along the lifespan and to gating of age-related diseases,
and is thus regarded as a framework for scientific investigation of the aging brain, and for
clinical extensions of the model.
Functional Changes in Normal Brain Aging
Normal declines in neurological function in the absence of associated diseases occur with age
and are well documented, as well as proceed in a conserved manner. Data obtained from meta-
analytical studies have highlighted significant declines in cognitive speed on the order of ~40-
60% in individuals aged 80 compared to age 20, without dementia 7. Moreover, cognitive
processes are differentially affected by aging, such that certain abilities exhibit more
pronounced declines in function compared to others7. So-called “fluid abilities” reliant on
processing speed, problem solving, inhibitory function, working and long-term memory, as
well as spatial ability, decline with age7. Conversely, “crystallized abilities” reliant on
knowledge or expertise, including world and general knowledge, implicit memory, vocabulary,
and occupational expertise have not been shown to decline, and may even improve, with age7.
Thus, the effects of the aging process on cognitive abilities have been reliably shown to affect
brain function in a distinctive manner, and in the absence of neurological disease, such that
these effects are defined as “normal”. It is important to note that functional changes in
cognitive ability may be explained by a loss of grey matter volume and molecular disturbances;
loss of dendritic arborization and transcriptomic changes in gene expression have consistently
been reported to be associated with the aging phenotype8,9.

5
In addition to cognitive indices, aging also compromises motor ability. Reaction time, speed of
movement, as well as hand and foot coordination, consistently decline with age10. This
progressive and continuous phenomenon is most likely mediated by a reduction in
dopaminergic receptor (D2) levels in the dorsal striatum of the basal ganglia and the frontal
cortex, which are correlated with both motor speed and cognitive function, respectively11.
Lastly, meta-analytical studies demonstrate that mood and affective perception are also altered
with age, in addition to cognitive and motor parametres. However, these changes are generally
more positively skewed in contrast to declining cognitive and motor function with age. Older
adults perform equally as well as younger adults in recognizing happy emotions, and are
proven to be better at recognizing disgust; although, they are worse at sad and angry emotional
recognition12. Additionally, older adults demonstrate a positivity bias in attention and memory,
recover more quickly from negative events, and are less likely to engage in destructive
interpersonal behaviours13. Thus, mood and affective perception are additional functional
indices that are altered by aging.
An important caveat to these documented changes in cognitive, motor, and mood/affective
processing is the large individual variability in the rates of age-related functional decline14. For
instance, cognitive capacity, i.e., the processing of mental information, in youth accounts for
~50% of the variance of cognitive capacity in old age15,16. Lifestyle is also a robust predictor of
cognitive ability along the lifespan. Exercise, body mass index (BMI), balanced nutrition,
higher education, cardiovascular integrity, caloric restriction, and cigarette avoidance
positively correlate with slower cognitive decline with age6.

6
Molecular Changes in Normal Brain Aging
Cellular networks comprised of interneurons, pyramidal cells, and astrocytes mediate the
transmission of brain activity in the cortex17.
Cortical interneurons are responsible for mediating GABAergic neurotransmission and possess
a varied range of molecular, structural, and electrophysiological properties18.They are
delineated into distinct subtypes that differ in their distribution across the cortical layers, as
well as in the cellular compartment with which they exert their effects on pyramidal cells. y-
aminobutyric acid (GABA) is synthesized in presynaptic terminals by glutamic acid
decarboxylase (GAD), using the neurotransmitter glutamate as a precursor19. It is packaged
into synaptic vesicles and is released in an activity-dependent manner when action potentials
depolarize the synaptic terminal, causing an influx of calcium ions and subsequent exocytosis
19. During activity-dependent synaptic release, GABA acts at chloride-permeant synaptic
receptors, as well as at extrasynaptic GABAergic receptor sites 19.Extrasynaptic ionotropic
GABAARs and metabotropic GABABRs mediate tonic inhibition19. Accumulating data
implicate tonic inhibition at GABAergic synapses as a particularly robust regulator of neuronal
activity and network dynamics in cortical circuits 19. Recent evidence highlights changes in
tonic inhibitory tone in the aged prefrontal cortex (PFC) 19. Deficits in GABAergic regulation
of excitatory cell input and output may underlie changes in cellular processing that contribute
to aging19.
In contrast to GABA, the predominant excitatory neurotransmitter in the mammalian central
nervous system is glutamate. Adequate supplies of glutamate are maintained in the CNS via the
glutamate-GABA-glutamine biochemical cycle 20. A portion of glutamate and GABA released
7
from neurons is taken up by astrocytes, which in turn release glutamine to be taken up by
neurons for use as a precursor for glutamate or GABA synthesis 20. Pyramidal cells utilize
glutamate to transmute excitatory signals across cortical layers and brain regions 21.
Astrocytes are integral components of proper cortical circuit function 22. They were originally
characterized solely as cells that provided nutritional and structural support for electrically
active neurons 22. However, it was later discovered that astrocytes also possessed intrinsic
electrical activity and were capable of releasing “gliotransmitters”, which mediated
intercellular communication via gap junctions and regulated the excitability of neurons 23,24,26.
Astrocytes are responsive to a variety of neurotransmitters released by neuronal cells and in
turn modulate the release of gliotransmitters22,23. The feedback loop between astrocytes and
neurons influences the functioning of the cortical microenvironment 23,26. They are capable of
releasing glutamate, are actively involved in its uptake, and are also responsive to calcium
transmission 23,27. Astrocytes supply the metabolic needs of neurons via contacts with blood
vessels, through which they play a vital role in the formation of the blood brain barrier (BBB)
23,28. Lastly, astrocytes secrete an array of neurotrophins, including BDNF, which are crucial
for neuronal survival, regeneration, and differentiation 23,29.

8
Genome-wide studies have identified approximately 5-10% of genes expressed in the human
brain that are regulated by age30. Data generated from gene microarray technology in human
prefrontal cortex samples identified 7.5% of tested genes exhibited age-dependent regulation31.
This set of age-dependent genes displays a high degree of conservation across cohorts and
Figure 1. Select alterations in molecular signature of interneurons, pyramidal cells and astrocytes that occur age. Synaptic interactions and signalling between interneurons, pyramidal cells, and astrocytes are altered during the aging process. Typical biological changes associated with aging are highlighted. Purple, interneuron; Blue, pyramidal cell; Orange, astrocyte. SST, somatostatin; CALB-1, calbindin; GFAP, glial fibrillary acidic protein. Adapted from Sibille, 2013. Copyright © Pergamon Press 2011.

9
cortical brain regions, regardless of different sample sizes, expression platforms, and analytical
methods30–35. The consistency and specificity of age effects on gene expression fulfill criteria
for use as biomarkers of brain aging 36. Accordingly, the predicted age of an individual is
highly correlated with chronological age, as evidenced by regression analyses of age-
dependent gene expression across the lifespan 30,31. Thus, “molecular age” can be used as a
functional assay to measure biological aging of the brain as well as to assess individual
deviations from expected trajectories 30,31.
Altogether, the conserved and restricted scope of transcript changes implies that specific
cellular populations and biological processes are selectively affected during aging 5.
Expression of genes that mediate glial inflammation, synaptic function and plasticity, calcium
regulation, and neuropeptide signalling, have consistently been shown to be affected by the
aging process across multiple studies 1,5,6,23,31,32,37,38. Overall, genes upregulated by age are
largely of glial origin, and are related to inflammation and cellular defenses, whilst
downregulated genes are mostly enriched in neuronal transcripts relating to cellular
communication and signalling (Figure 1) 30. Changes in the expression of age-regulated genes
involved in these biological processes are integral components of normal brain aging. As such,
cellular markers of neuropeptide signalling (somatostatin, SST), intracellular calcium
regulation (parvalbumin, PVALB; calbindin, CALB1), synaptic function and plasticity
(gephyrin, GPHN; metabotropic glutamate receptors 2/3, GRM2/3) and astrocyte reactivity
(glial fibrillary acidic protein, GFAP; aldehyde dehydrogenase 1 family member L1,
ALDH1L1; glutamine synthetase, GLUL), were chosen to assess the molecular correlates of
aging in a novel human postmortem cohort.

10
Altered neuropeptide gene expression in inhibitory GABAergic neurons
Neuropeptides are a large class of messenger molecules that are responsible for modulating
neuronal activity and intercellular communication 39. Neuropeptides are packaged separately
from neurotransmitters and are released by different mechanisms, including from nerve
endings, soma, and dendrites40–42. Following synaptic and extrasynaptic release, neuropeptides
exert their effects via G protein-coupled receptors (GPCRs) 39. Neuropeptides are actively
degraded by extracellular peptidases soon after being released, thereby limiting their biological
effects39. Neuropeptides differ in their regional expression, mechanism and range of action, and
excitatory/inhibitory effects on target neurons39–41. Neuropeptides transfer molecular messages
between populations of neurons and can evoke changes in network function40,41.
Somatostatin (SST)
SST is an inhibitory neuromodulatory peptide43. It is expressed in a subtype of
GABAergic neurons 43.
SST-expressing interneurons inhibit the dendritic compartments of principal excitatory
glutamatergic, i.e., pyramidal, cells, in a manner that is inversely proportional to their
intervening distance 40,41. SST cells represent ~18-20% of interneurons in the cortex,
with differential expression across cortical layers such that layer 2/3/5 SST neurons,
which send abundant projections to layer 1, inhibit pyramidal cells, whilst layer 4 SST
neurons, which do not project to layer 1, disinhibit excitatory cells 43. They are
recruited in a feedforward mechanism by activated pyramidal cells, for which they also
provide feedback inhibition42. SST+ interneurons are characterized by delayed,
sustained, and adapting electrophysiological properties 42. SST+ interneurons also
11
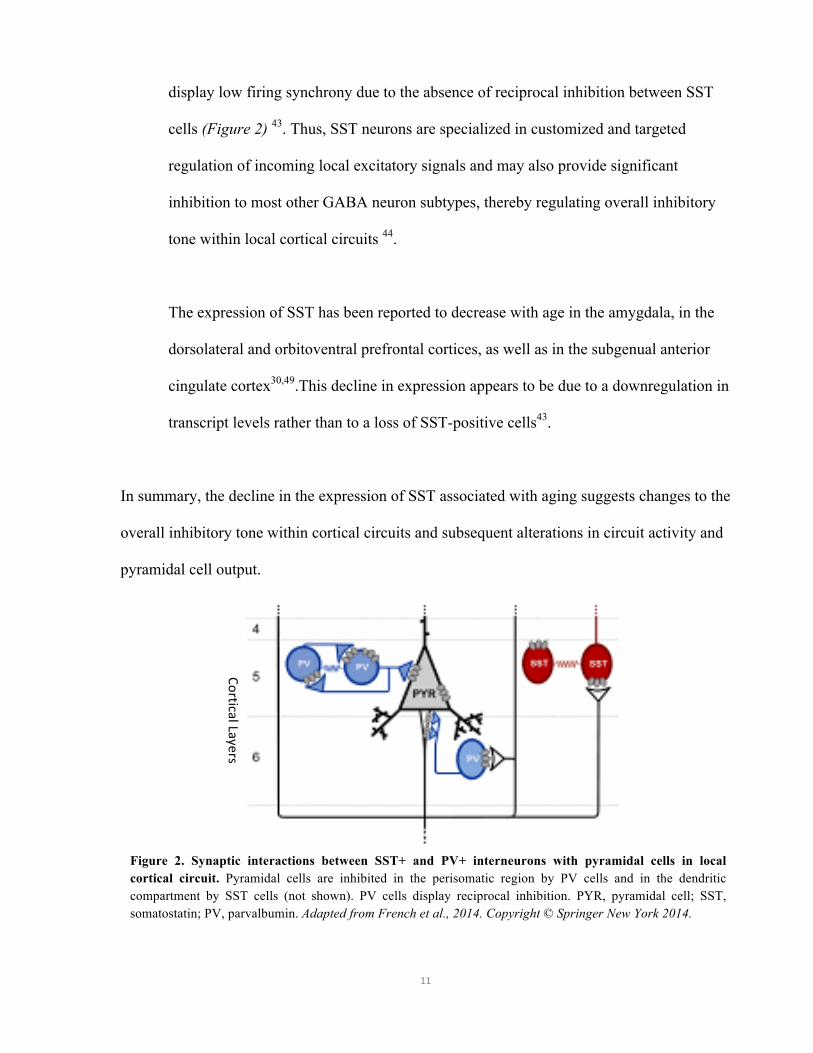
display low firing synchrony due to the absence of reciprocal inhibition between SST
cells (Figure 2) 43. Thus, SST neurons are specialized in customized and targeted
regulation of incoming local excitatory signals and may also provide significant
inhibition to most other GABA neuron subtypes, thereby regulating overall inhibitory
tone within local cortical circuits 44.
The expression of SST has been reported to decrease with age in the amygdala, in the
dorsolateral and orbitoventral prefrontal cortices, as well as in the subgenual anterior
cingulate cortex30,49.This decline in expression appears to be due to a downregulation in
transcript levels rather than to a loss of SST-positive cells43.
In summary, the decline in the expression of SST associated with aging suggests changes to the
overall inhibitory tone within cortical circuits and subsequent alterations in circuit activity and
pyramidal cell output.
Figure 2. Synaptic interactions between SST+ and PV+ interneurons with pyramidal cells in local cortical circuit. Pyramidal cells are inhibited in the perisomatic region by PV cells and in the dendritic compartment by SST cells (not shown). PV cells display reciprocal inhibition. PYR, pyramidal cell; SST, somatostatin; PV, parvalbumin. Adapted from French et al., 2014. Copyright © Springer New York 2014.
Cortical Layers
12
Altered intracellular calcium signalling in local cortical circuits
Calcium signalling is central to the function of neurons, mediating neurotransmitter and
neuropeptide release, neuronal membrane excitability, gene induction, neuronal plasticity and
growth, as well as cellular processes that underlie learning and memory 50,51. Deregulation of
calcium signalling has been suggested to play a role in brain aging as a result of an increase in
resting calcium ion concentrations and a substantial prolongation of stimulus-evoked calcium
signals 38,50,52. Calcium-binding peptides (CBPs) regulate the cytosolic concentration of
calcium ions and can function as calcium transporters or sensors53. Observations in the aging
human central nervous system imply that an increase in intracellular calcium is associated with
the phenotype 38,50.
Parvalbumin (PVALB)
PVALB is a calcium-binding peptide 21. It is expressed in a subset of GABAergic
interneurons that nonspecifically target the perisomatic compartment of pyramidal cells
in a manner dependent on the distance between the excitatory and inhibitory cell 40.
Neurons expressing PVALB are directly activated by thalamic and corticocortical
projections 44. They are characterized by fast-spiking and non-adapting
electrophysiological properties 21. In contrast to SST interneurons, PVALB+ cells are
highly synchronized through dense reciprocal inhibition (Figure 2) 49,50. Thus, PVALB-
expressing interneurons are specialized in regulating the output and synchronization of
pyramidal cells 49,50.

13
The association of PVALB expression with age is contested. Some studies indicate no
significant changes in the neuropeptide expression in aged subjects compared to young
controls, whilst others report an increase or a decrease in its expression in the
experimental group 50,56–58. These findings also appear to differ depending on the
cortical area examined. Notwithstanding, PVALB expression has been shown to
significantly decline in the ACC and in the orbitoventral PFC31.
Calbindin (CALB1)
CALB1 is a high-affinity cytosolic calcium binding protein (CBP)50,58. It is a member
of the calcium-binding superfamily that includes calmodulin and troponin C. It is
expressed in a subset of interneurons that overlap with SST expression, as well as in
pyramidal cells59–61.
CALB1 buffers the entry of calcium ions following glutamate receptor stimulation,
thereby regulating intracellular calcium concentrations in neurons 50,58. CALB1 also
protects neurons from cellular insults that induce spikes in intracellular calcium ions 50.
CALB1 expression decreases across cortical areas with age 50. These include the visual
association cortex, primary visual cortex, posterior cingulate cortex, hippocampus, and
striatum 50,58.
Altogether, the changes in calcium-binding protein expression observed with PVALB and
CALB1 may pose serious consequences for unbound intracellular calcium concentrations,

14
thereby affecting aspects of neuronal function, such as neuropeptide release and gene
expression.
Altered inhibitory GABAergic and excitatory glutamatergic transmission across synapses
The appropriate transfer of information within the brain requires a homeostatic balance
between excitatory and inhibitory transmission across synapses62. Changes in the biological
components of excitatory and inhibitory neurotransmission are hypothesized to contribute to
normal aging 5.
Gephyrin (GPHN)
GPHN encodes a neuronal assembly protein 63. It is expressed in postsynaptic
inhibitory membranes where it anchors inhibitory GABAA neurotransmitter receptors to
the postsynaptic cytoskeleton via a high-affinity binding subunit and tubulin dimers 64.
GPHN expression levels provide an indication of the total amount of GABAA receptors
present at a given time 65. GPHN expression is robust in the cortex, hippocampus, and
dorsal striatum (caudate-putamen) 66. GPHN is localized to the soma and dendrites of
pyramidal cells.
GPHN has been reported to show significant age-related increases in transcript
expression in several brain regions, including the dorsal cochlear nucleus (DCN) and
the visual cortex 67,68.

15
Metabotropic glutamate receptor 2/3 (GRM2/3)
GRM2/3 are a family of G protein-coupled receptors (GPCRs) in the metabotropic
glutamate receptor family. Metabotropic glutamate receptors are classified into three
subfamilies based on sequence homology, signal transduction mechanisms, and
pharmacologic properties69. GRM2/3 are classified into Group II of this superfamily69.
GRM2/3 inhibit cyclic AMP (cAMP) signal transduction and adenylate cyclase (AC)
activity69. GRM2/3 are expressed in pyramidal cells and in astroglia, where they
regulate the expression of the glial glutamate transporter, excitatory amino acid
transporter 2 (EAAT2), which is essential in clearing synaptic glutamate 70,71. EAAT2-
mediated glutamate reuptake is a critical component in regulating glutamate
neurotransmission 71,72.
GRM2/3 gene expression is associated with prefrontal physiology and cognition71.
Expression is also related to glial function and neuroprotection 73.
Studies report a decline of GRM2/3 expression in the prefrontal cortex across
adulthood 73,74.
Altogether, changes in the balance of excitatory and inhibitory synaptic transmission is
associated with the normal aging process and may be affected by alterations to GABAergic and
glutamatergic signalling within cellular networks.
16
Altered activity of glial cells
Astrocytes are essential contributors to the microenvironment of neuronal networks75. They are
capable of responding to neuronal health and activity and release an assortment of pro-
inflammatory cyto- and chemokines in response to cellular insult and injury 75,76. Inflammation
is a prominent feature of the aging process, which may be mediated in part by exaggerated glial
responses.
Glial fibrillary acidic protein (GFAP)
GFAP encodes an intermediate filament in astrocytes77. It is used as a marker to
distinguish astrocytes from other types of glial cells.
GFAP contributes to the modulation of astrocyte motility and shape by conferring
structural stability to astrocytic processes 23. Overexpression of GFAP results in fatal
encephalopathy in transgenic mice 23,78.
Elevated levels of GFAP during molecular brain aging lead to glial dystrophy and
inflammation48.
Aldehyde dehydrogenase 1L1 (ALDH1L1)
ALDH1L1 belongs to the aldehyde dehydrogenase family of genes79. It is expressed in
astrocytes79. It catalyzes the conversion of 10-formyltetrahydrofolate, NADP+, and
water to tetrahydrofolate, NADPH, and carbon dioxide for use in downstream
biochemical reactions79.
17
Unique functions of ALDH1L1 in the central nervous system are infrequently reported;
however, it may be linked to neural tube defects during early CNS development 79,80.
ALDH1L1 may also be responsible for regulating cell division in astrocytes 79.
Alterations of ALDH1L1 in reactive astrocytes in association with neural injury or
neurodegenerative diseases are also understudied, which is also true of molecular brain
aging research 79.
Glutamine synthetase (GLUL)
GLUL belongs to the glutamine synthetase family of genes81. It is expressed in
astrocytes81. It catalyzes the conversion of glutamate and ammonia to glutamine in an
ATP-dependent reaction for downstream biochemical reactions81. GLUL also catalyzes
the production of GABA from L-glutamate81.
Upregulation of GLUL is an indicator of astrogliosis, that is, morphological and
functional changes in astrocytes, including hypertrophy and increased proliferation 23,82.
Astrogliosis occurs with aging 23.
Thus, changes in the expression of astrocytic markers may be suggestive of an increase in
cellular reactivity and a subsequent rise in pro-inflammatory mediators that are associated with
molecular brain aging.

18
Molecular Aging of the Prefrontal Cortex
The aging process affects brain regions in a selective manner. Executive functions, such as
working memory, planning, and goal directed behaviour, most often exhibit age-related
cognitive declines before others 83. The prefrontal cortex (PFC) is primarily responsible for
effecting these complex executive functions and has thus been postulated to be particularly
vulnerable to normal aging processes; it appears that neurons and circuits of the PFC become
selectively altered across the lifespan 8,83. Functional magnetic resonance imaging (fMRI) and
positron emission tomography (PET) studies suggest that aged adults typically exhibit reduced
activation of the PFC compared to young adults84–86. Additionally, aged adults activate a
broader area of the PFC when performing executive tasks, and also activate the contralateral
hemisphere, thereby indicating a loss of hemispheric asymmetry84–86.Thus, the orbitoventral
PFC was selected for the purpose of this study because of its association with aging processes
and neurological diseases.
Age-by-Disease Interaction Hypothesis
Normal brain aging shares mechanistic similarities with disease pathways that promote
neurodegenerative and neuropsychiatric diseases 87. Age-related gene expression changes
overlap both in terms of affected genes and in direction of change, i.e. up- or downregulation,
with those observed in neurological disorders 30,31. For example, SST expression progressively
decreases in normal brain aging and is also downregulated in individuals with major depressive
disorder (MDD) 49. Furthermore, molecular age deviates from chronological age in individuals
with neurodegenerative and neuropsychiatric disorders30,31. Although normal brain aging has
been associated with positive effects in certain functional indices, such as improvements in

19
linguistic ability and emotional control, it also imposes a robust drive towards the onset and
development of many neurological diseases, including Alzheimer’s (AD) and Parkinson’s (PD)
diseases, as well as major depressive (MDD) and bipolar (BPD) disorders, and schizophrenia
(SCZ)6,88.
A framework has been suggested in which molecular aging of the brain promotes biological
changes that in turn places the system at a higher susceptibility to developing age-related
neurological diseases6,37,89.
The mechanisms underlying normal aging process and neurological disorders associated with
age are still being characterized87. The similar trends in gene expression changes common to
aging and neurological diseases suggest that the aging process elicits global transcriptome
changes that confers molecular susceptibility to developing neuropsychiatric disease, as
proposed by an age-by-disease interaction model36,89.

20
RATIONALE
A molecular program that alters the transcriptomic profile of local cortical circuits is an
emergent theory of normal brain aging. To further validate this theory, it is prudent to replicate
findings of altered cellular marker expression in the aged cortex by analyzing a novel cohort
using RT-qPCR technology.
HYPOTHESIS
Gene expression changes observed in subjects from a novel age-cohort will exhibit consistency
with previous reports due to a pervasive molecular program that mediates the aging process in
the human prefrontal cortex.
PREDICTIONS
Cellular markers of local cortical circuits are differentially affected during aging. Expression
forGABA neuron markers SST, PVALB, and CALB1 are predicted to be lower in the aged
subjects, as well as the glutamate signalling markers GRM2 and GRM3. Conversely, astrocyte
markers GFAP, ALDH1L1, and GLUL are predicted to be higher in the aged subjects.
Additionally, postsynaptic clustering peptide marker GPHN is predicted to be upregulated in
aged subjects. These expected changes are predicted based on predominant theories of altered
intracellular calcium signalling and synaptic function, reduced inhibitory tone, and increased
glial reactivity in association with aging as a result of an intrinsic molecular program that
elicits widespread effects in cortical gene expression.

21
RESEARCH TOOLS
Validating altered gene expression in a novel age-cohort using RT-qPCR
To study systematic differences in the gene expression profiles of aged postmortem subjects in
comparison to younger controls, reverse transcription quantitative polymerase chain reaction
(RT-qPCR) is a useful and powerful tool because it facilitates the quantification of nucleic acid
expression in biological samples90–92.
RT-qPCR is a molecular biology technique used to quantitatively monitor the amplification of
targeted nucleic acids in real time after each amplification cycle. Real-time detection of PCR
products is enabled by the introduction of a fluorescent reporter dye within reaction vessels,
which increases its intensity of fluorescence in proportion to increasing amounts of product
DNA.

22
CHAPTER 2: MATERIALS AND METHODS

23
SUMMARY OF RESEARCH METHODS
Ninemarkers representing neuropeptide signalling, synaptic function, calcium regulation, and
astrocyte activation in GABA neurons, pyramidal cells, and astrocyteswere selected based on
literature evidence of age-regulated expression for RT-qPCR analysis. The corresponding
genes are SST (somatostatin), parvalbumin (PVALB), calbindin (CALB1), GPHN (gephyrin),
GRM2 (glutamate receptor metabotropic 2), GRM3 (glutamate receptor, metabotropic 3),
GFAP (glial fibrillary acidic protein), ALDH1L1 (aldehyde dehydrogenase 1 family member
L1), and GLUL (glutamine synthase). Thirty samples of human grey matter from prefrontal
cortex tissue of Brodmann areas 11 and 47 (BA11 and BA47; orbitoventral prefrontal cortex)
that were obtained from the McGill University brain bank at the Douglas Institute were
processed into 100 µm thick sections using the Leica CM1950 cryostat system. Two grey
matter sections of 100 µm thickness were immersed in 350 µL of Buffer RLT (Qiagen
miRNeasy) for homogenization. Total RNA was extracted using the Qiagen RNeasy® Micro
protocol. Concentration and purity of RNA were determined by absorbance ratios at 260, 280,
and 230 nm using the Implen P360 NanoPhotometer. RNA integrity values were generated
using the Agilent 2100 BioAnalyzer microfluidics system. Subsequently, cDNA was
synthesized from 1 µg of total RNA using the Superscript VILOTM kit and gene expression was
quantified by real time polymerase chain reaction using the Bio-Rad Universal SYBR green kit
and Bio-Rad C1000 touch thermal cycler. Finally, gene enrichment was analyzed as a function
of the quantification cycle (Chq) values obtained from the real-time reaction and expression of
cellular markers were presented as a geometric mean of the ratio of the target mRNA copies to
mRNA copies of the reference genes beta-actin, GAPDH, and cyclophilin G. Data was
processed to determine differential expression of the target genes in aged vs. control subjects,
24
and to demonstrate a linear effect of age on gene expression, as well as to suggest a concerted
movement of gene expression changes with age.
RT-QPCR EXPERIMENTAL PROTOCOL
Summary of RT-qPCR technology
Fluorescence detection modules contained within the RT-qPCR instrument monitor the
fluorescence signal as amplification proceeds. The measured fluorescent signal is proportional
to the total amount of amplicon, i.e., the amplified sequence of interest. The change in
fluorescence over time is used to determine the amount of amplicon produced in each PCR
cycle. RT-qPCR allows the user to assess the initial copy number of the target sequence with
accuracy and sensitivity and without the need for gel electrophoresis.
Data generated from RT-qPCR is displayed as an amplification plot consisting of the number
of PCR cycles on the x-axis, usually ranging from 0-40 cycles, and relative fluorescence units
on the y-axis. Amplification plots are typically divided into two phases – an exponential phase,
during which the amount of PCR product approximately doubles in each cycle, and a non-
exponential phase, in which the reaction slows and reaches a plateau due to reagent exhaustion.
Initially, fluorescence remains at background levels during the exponential phase until enough
amplified product accumulates to yield a detectable fluorescence signal. The cycle number at
which fluorescence crosses past the threshold is known as the quantification cycle, or Cq. The
Cq of a reaction is largely determined by the initial amount of nucleic acid template present at
the start of the amplification. The Cq of a sample is inversely proportional to the initial amount
of template available in the reaction, such that a low, or early, Cq is indicative of larger

25
amounts of starting material present in the reaction because relatively fewer amplification
cycles are required to accumulate enough product to breach threshold and produce
fluorescence above background levels. This relationship forms the quantitative aspect of RT-
qPCR.
The RT-qPCR reagents utilized for this experiment were obtained from Bio-Rad and consisted
of the SsoAdvancedTM Universal SYBR® Green supermix, including buffer, DNA polymerase,
dNTPs, and a dsDNA-binding dye. Specific primer pairs were designed to optimize RNA
detection using the web-based Primer3Plus software, and cDNA was generated from extracted
RNA to serve as the template for the reaction. Specificity of the RT-qPCR assay was assessed
by confirming a single product peak in the melt curve analysis provided by the real-time
instrument.
Sample Collection for RT-qPCR
Fresh-frozen cortical blocks of Brodmann Areas BA11 and BA47, corresponding to the
orbitoventral prefrontal cortex (PFC), were obtained from the Douglas Institute Brain Bank
(Canada) from male subjects without a diagnosed neurodegenerative or neuropsychiatric
disorder. Thirty samples were used in this study and were previously delineated into two
groups on the basis of age, such that control subjects (n = 13) were grouped under age 45 and
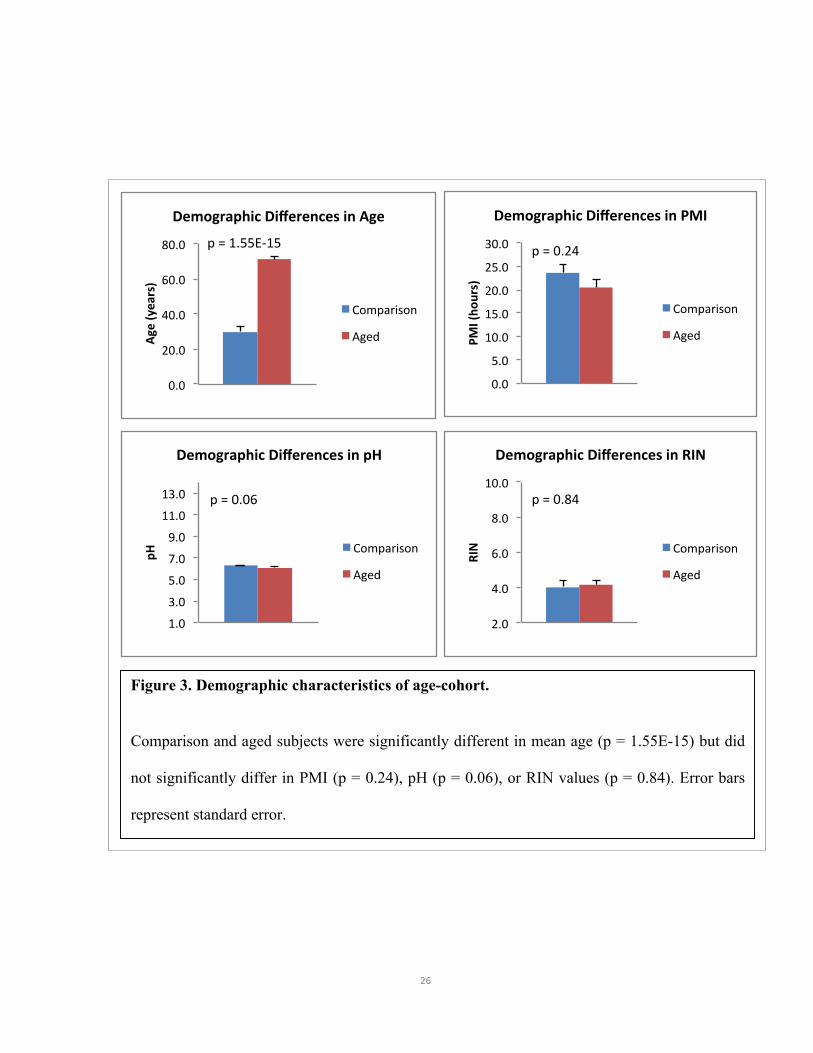
aged subjects (n = 17) were grouped above age 60. Subject groups differed in mean age (p =
1.55E-15) but did not significantly differ in other demographic parametres of postmortem
interval (PMI; p = 0.24), brain pH (p = 0.06), or RNA integrity number (RIN; p = 0.84) as
determined by UNIANOVA (Figure 2).
26
0.0#
20.0#
40.0#
60.0#
80.0#
Age#
Age$(years)$
Demographic$Differences$in$Age$
Comparison#
Aged#
p#=#1.55E915#
0.0#
5.0#
10.0#
15.0#
20.0#
25.0#
30.0#
PMI#
PMI$(ho
urs)$
Demographic$Differences$in$PMI$
Comparison#
Aged#
p#=#0.24##
1.0$
3.0$
5.0$
7.0$
9.0$
11.0$
13.0$
pH$
pH#
Demographic#Differences#in#pH#
Comparison$
Aged$
p$=$0.06$$
2.0$
4.0$
6.0$
8.0$
10.0$
RIN$
RIN$
Demographic$Differences$in$RIN$
Comparison$
Aged$
p$=$0.84$
Figure 3. Demographic characteristics of age-cohort.
Comparison and aged subjects were significantly different in mean age (p = 1.55E-15) but did
not significantly differ in PMI (p = 0.24), pH (p = 0.06), or RIN values (p = 0.84). Error bars
represent standard error.

27
Grey matter was identified in the cortical blocks on the basis of gross anatomy and was
selectively harvested into 100 µm sections using a Leica CM1950 cryostat set to -20°C in an
RNAse-free environment. Cortical blocks were approximately 1.5 cm3 in volume, thus the
dimensions for the cryosections were comparable across subjects. Two grey matter
cryosections of 100 µm thickness and approximately 0.75 cm2area were collected for each
subject and immediately immersed in 350 µL of chilled Buffer RLT (Qiagen miRNeasy) for
manual homogenization using RNase-free disposable pellet pestles (Fisherbrand™). Control
and aged samples were collected in a semi-randomized (alternating) manner to minimize order
effects in sample collection93. Following homogenization, samples were transferred on dry ice
and stored at -80°C until further processing.
Demographic and postmortem characteristics of human subjects Comparison subjects Aged subjects
Case Sex Age (yrs)
PMI (hrs) pH RIN
Cause of death Case Sex
Age (yrs)
PMI (hrs) pH RIN
Cause of death
DH1025 M 41 14.5 5.89 5 Natural DH411 M 76 10.75 5.95 4.4 COPD DH787 M 43 23.75 6.25 2.8 Thrombosis DH476 M 73 27.5 6.17 4.4 COPD S11 M 19 32 6.35 2.3 Natural
DH505 M 69 23.5 6.04 2.9 CA
S15 M 30 30 6.22 4.4 Accident
DH530 M 67 24.75 6.23 6.5 AP S16 M 28 27 6.59 3.3 Natural
DH580 M 69 34.12 5.85 4.2 N/A
S17 M 41 24 5.95 2.4 Accident
DH598 M 79 21.92 6.4 4.3 PE S173 M 20 12 6.22 2.4 Natural
DH650 M 73 10 5.46 2.4 N/A
S20 M 31 29.5 6.49 5.6 Accident
DH724 M 70 32.75 6.02 2.8 HC S215 M 43 27 6.33 6.4 Accident
DH745 M 63 16.75 6.02 5 MI
S250 M 26 12 6.75 3.2 Natural
DH776 M 70 26 5.76 2.4 N/A S31 M 21 24 6.27 4.3 Accident
DH796 M 69 27.58 5.6 4.5 MI
S36 M 27 20.5 6.18 5 Natural
DH880 M 62 6.17 6.15 4.2 VH S94 M 15 27 5.95 4.7 Natural
DH974 M 72 24.5 6.36 6.1 MI
DH988 M 66 20.5 6.09 4.3 TD
S101 M 63 13 6.84 3.9 N/A
S187 M 71 17 6.2 3.8 N/A
Table 1. Demographic and postmortem information of study sample. Total of 30 subjects divided into 13 young comparison subjects and 17 aged subjects. M, male; PMI, postmortem interval; RIN, RNA integrity number; COPD, chronic obstructive pulmonary disease; CA, cardiac arrest; AP, acute peritonitis; PE, pulmonary edema; HC, hemorrhagic colitis; MI, myocardial infarction; VH, ventricular hypertrophy; TD, thromboembolic disease; N/A, not available

28
RNA Isolation and Conversion to cDNA
Total RNA was isolated according to the Qiagen RNeasy® micro protocol. Briefly, tissue
samples were homogenized and subjected to centrifugation to separate the supernatant
containing total RNA. Genomic DNA (gDNA) was separated from the preparation using a
gDNA spin column provided in the kit. Subsequent steps purified the RNA, which was eluted
using RNase-free water. Approximately 12 µL of RNA was collected per sample.
Concentration and purity of RNA were determined using a nanospectrophotometer to assess
absorbance ratios. Samples with A260/A280 ratios greater than 1.9 were accepted for
downstream processing, as commonly acceptable A260/A280 ratios for nucleic acids is ~2.
A260/A230 ratios were lower than the commonly acceptable range of 2.0-2.2 (Appendix 1).
This may be attributed to residual RNA extraction buffers in the eluents. This did not,
however, impact the extraction of high concentration RNA to sufficiently create enough
reagents for cDNA synthesis. RNA integrity was assessed to determine the extent of RNA
degradation within the samples using an Agilent 2100 Bioanalyzer System. RNA integrity
numbers (RIN) were generated for each sample. The generally high level of degradation found
within the samples was noted for downstream measures to counteract possible processing
difficulties from degraded RNA.
1 µg of RNA per sample was used to synthesize cDNA using the Superscript VILOTM kit. The
required volumes of reagents were calculated according to the following paradigm:
Components Volume (µL) Nuclease-free water x
Reaction mix 4 Enzyme mix 2
RNA (1 µg) TOTAL 20

29
The reaction mix and the enzyme mix are set to 4 µL and 2 µL per 20 µL reaction, respectively.
The required volume of RNA that amounted to 1 µg of product was added to the reaction tube
and the volume of nuclease-free water was adjusted such that the final volume was 20 µL. A
no-reverse transcriptase control was included to control for genomic DNA (gDNA)
contamination. Reaction tubes were placed in a Bio-Rad T100 thermal cycler set to an adapted
Superscript VILOTM protocol. The program consisted of an initial incubation at 25˚C for 10
minutes, followed by incubation at 42˚C for 120 minutes to allow cDNA synthesis. Reaction
termination was set at 85˚C for 5 minutes, and the samples were held at 4˚C. The program is
summarized below.
Step Temp (˚C)
Time
Incubation 25 10 min Incubation 42 2 h
Termination 85 5 min Hold 4 ∞
Newly synthesized cDNA was diluted 1:4 with nuclease-free water by adding 80 µL into the
reaction tubes to bring the final volume to 100 µL. Samples were stored at -20˚C until further
processing.
Samples were then tested for viability with a validated in-house actin primer. Average Cq
values were calculated and standard errors less than 0.2 standard deviations from the mean of
the biological sample were used for analyses 94,95. Samples were standardized to an actin Cq
value of 20 by adding nuclease-free water according to the following formula(Appendix 2):

30
[ 2 !"!!"!"# − 1 𝑥 𝑉𝑜𝑙𝑢𝑚𝑒
Newly standardized samples were then stored at -20˚C until further processing.
RT-qPCR Primer Design, Preparation, and Testing
Primers were designed using the Primer3Plus software(Appendix 3). Primers were restricted to
80 base pairs to target short RNA fragments as a preemptive measure to account for RNA
degradation96,97. Sequences were selected that encoded the longest isoform of the transcript
variant. Optimal Tm was set to 60˚C. The first three available forward and reverse primer
sequence pairs representing non-overlapping base pairs were selected for testing and
validation.
100 µM stock solutions were prepared for all forward and reverse primers by adding the
amount of nuclease-free water equal to 10 times the nanomolar amount of the primer.
Lastly, 10 µL of the forward and 10 µL of the reverse primers were added to 980 µL of
nuclease-free water in a 1.5 mL Eppendorf tube to create a 1 mL working solution of each
primer. The working solutions were stored at -20˚C and at4˚C after thawing.
Primer sequences were tested for greatest affinity with an in-house validated actin primer and
stock human cDNA to determine which of the sequence pairs functioned most optimally. Each
primer pair was tested in triplicate to calculate an average actin Cq and standard errors less
than 0.2 standard deviations from the mean of the biological sample were used for analyses
94,95. No template controls were included to control for the presence of contaminants and
primer-dimer formation. Primer pairs that produced earlier amplifications of actin in the human

31
sample, and thus lower Cq values, and also tested negative for contaminants or primer-dimers,
were selected for downstream use.
RT-qPCR Program and Assay
The RT-qPCR program used for the Bio-Rad C1000 touch thermal cycler was set according to
the Bio-Rad Universal SYBR green protocol. The program consisted of an initial denaturation
step carried out at 95˚C for 30 seconds. This was followed by 40 qPCR cycles consisting of
denaturation at 95˚C for 15 seconds and annealing/extension at 60˚C for 30 seconds, followed
by a plate read to generate a melting curve. Lastly, a final round of denaturation at 95˚C for 30
seconds, followed by a final extension at 65˚C for 30 seconds and a hold at 20˚C for 5 minutes.
The program is summarized below.
Step Temp (˚C)
Time
Initial denaturation 95 30 sec
Denature 95 15 sec Anneal/extension 60 30 sec
Plate read Denature 95 30 sec Final extension 65 30 sec
Hold 20 5 min
Samples for aged and comparison subjects were prepared in a semi-random (alternating)
manner to minimize order effects in sample preparation and subsequent confounds in data
analysis 93. 96-well plates supplied by Bio-Rad Laboratories were used to assay the samples.
Two GABAergic markers (SST, PVALB) and one glial marker (GFAP) were chosen to pilot
the study based on evidence of robust differential expression with age 5,31. Reference genes
beta-actin (ACTN), glyceraldehyde-3-phosphate dehydrogenase (GAPDH), and cyclophilin G
40 cycles

32
(CYCLO) were chosen as internal controls 98. Each reference gene and pilot gene of interest
was tested in quadruplicate for each subject using a 96-well plate supplied by Bio-Rad
Laboratories. Average Cq values were calculated and standard errors less than 0.1 standard
deviations from the mean of the biological sample were used for analyses94,95. The remaining
cell markers (CALB1, GPHN, ALDH1L1, GLUL, GRM2, GRM3) were tested in triplicate
along with two reference genes (ACTN, GAPDH) to accommodate more biological replicates
within the plate design. CYCLO was excluded from the subsequent plate design and future
analyses because it correlated poorly with both ACTN (r = 0.7) and GAPDH (r = 0.7) gene
expression in the pilot study, whereas ACTN and GAPDH expression correlated strongly with
each other (r = 0.9).
RT-qPCR Fold Change Calculation
All RT-qPCR curves were set to a threshold of 150 RFU to standardize data analysis across
biological samples. Delta Cq values to determine the quantification cycle for each target gene
were calculated for each subject by subtracting the mean Cq value of the target gene from that
of ACTN and GAPDH. The difference in quantification cycle threshold represents the log2-
transformed expression ratio of each gene of interest to the geometric mean of the two
reference genes. Relative expression levels of the genes of interest were calculated according
to the following formula:
2!!"#$%&'
Statistical Analyses
Statistical significance threshold was set at p ≤ 0.05. Expression values were found to display
left-handed skewness and were subjected to a square root transformation to achieve a more

33
normalized distribution of values across all subjects. Expression values greater than 3 standard
deviations from the mean were considered to be outliers and were excluded from analysis
where possible, or were replaced by the mean expression value for that gene when a value was
mandated. A univariate analysis of variance (UNIANOVA) model was performed using SPSS
to identify any demographic effect of age, PMI, pH and RIN on expression level of the target
genes(Appendix 4). Results were adjusted for multiple comparisons. Age was retained as a
significant covariate for expression levels of all target genes. pH was found to be a covariate
for ALDH1L1 and GPHN expression.

34
CHAPTER 3: RESULTS

35
The Majority of Gene Expression Changes are Age-Dependent
A two-group analysis was performed to determine the main effect of age on gene
expression between aged and comparison subjects. Expression of SST was significantly
reduced in aged subjects (p = 1.95E-04), as was expression of PVALB (p = 0.021).
Expression of CALB1 showed a nominal reduction in aged subjects (p = 0.124). GPHN
expression was significantly increased in aged subjects (p = 0.008). Expression of
GRM2 (p = 0.291) and GRM3 (0.112) were not significantly reduced in aged subjects.
Expression of ALDH1L1 was significantly increased (p = 0.011) as well as the
expression of GFAP (p = 0.004). Lastly, the expression of GLUL was nominally
increased in aged subjects (p = 0.095). Altogether, the discrepancies in gene expression
between aged and comparison subjects from this novel cohort are largely consistent
with previous findings in the literature, thereby supporting the model of a conserved
and pervasive molecular program that mediates the aging process.
Altered GABAergic Marker Expression with Age
Correlation analyses were performed to reveal the linear effect of age on gene
expression levels. The expression of SST was moderately negatively correlated with
age across the lifespan (r = -0.5). Expression of PVALB was also moderately
negatively correlated with age across the lifespan (r = 0.4). CALB1 expression was
weakly negatively correlated with age across the lifespan (r = -0.3). GPHN expression
was weakly positively correlated with age across the lifespan (r = 0.3). Thus, the
expression of SST and PVALB displayed a moderate linear decrease due to the effect
of age.
36
Increased Glial Marker Expression with Age
The expression of ALDH1L1 was moderately positively correlated with age across the
lifespan (r = 0.4). Expression of GFAP was also moderately positively correlated with
age across the lifespan (r = 0.4). GLUL expression was weakly positively correlated
with age across the lifespan (r = 0.2). Thus, ALDH1L1 and GFAP exhibited moderate
linear increases in gene expression with advancing age.
Unchanged Glutamatergic Marker Expression with Age
Expression of GRM2 was weakly positively correlated with age across the lifespan (r =
-0.2), as was GRM3 expression (r = -0.3). Thus, GRM2/3 expression did not show
significant changes in linear expression across the lifespan.

37
Figure 4. Main effect of gene expression levels in aged versus comparison subjects.
Expression of SST was significantly reduced in aged subjects (p = 1.95E-04), as was
expression of PVALB (p = 0.021). Expression of CALB1 was not significantly reduced in
aged subjects (p = 0.124). GPHN expression was significantly increased (p = 0.008).
Expression of GRM2 (p = 0.291) and GRM3 (0.112) were not significantly reduced in aged
subjects. Expression of ALDH1L1 was significantly increased (p = 0.011) as well as the
expression of GFAP (p = 0.004). Lastly, the expression of GLUL was nominally increased in
aged subjects (p = 0.095). Error bars represent standard error.
0.0%
50.0%
100.0%
150.0%
200.0%
250.0%
300.0%
350.0%
Rel
ativ
e E
xpre
ssio
n (%
) Gene expression levels in aged vs. comparison subjects
Comparison
Aged *
***
***
*** ***
#
38
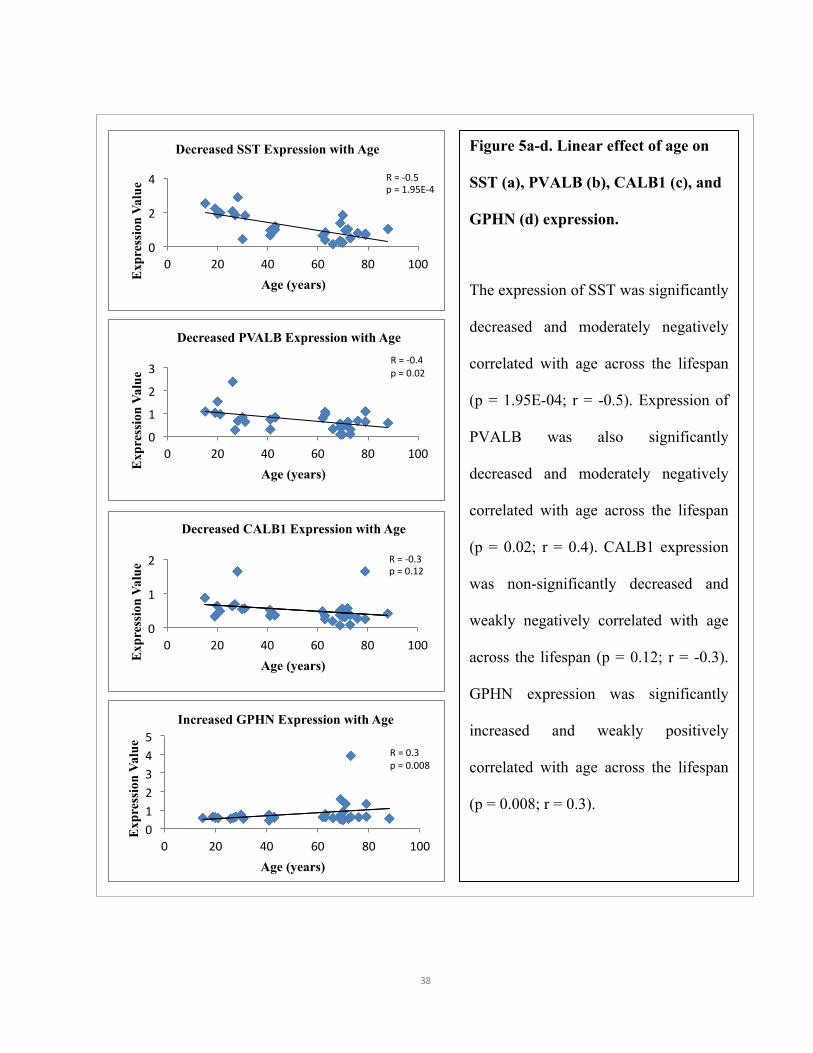
Figure 5a-d. Linear effect of age on
SST (a), PVALB (b), CALB1 (c), and
GPHN (d) expression.
The expression of SST was significantly
decreased and moderately negatively
correlated with age across the lifespan
(p = 1.95E-04; r = -0.5). Expression of
PVALB was also significantly
decreased and moderately negatively
correlated with age across the lifespan
(p = 0.02; r = 0.4). CALB1 expression
was non-significantly decreased and
weakly negatively correlated with age
across the lifespan (p = 0.12; r = -0.3).
GPHN expression was significantly
increased and weakly positively
correlated with age across the lifespan
(p = 0.008; r = 0.3).
0
2
4
0 20 40 60 80 100
Exp
ress
ion
Valu
e
Age (years)
Decreased SST Expression with Age
R = -‐0.5 p = 1.95E-‐4
0
1
2
3
0 20 40 60 80 100
Exp
ress
ion
Valu
e
Age (years)
Decreased PVALB Expression with Age R = -‐0.4 p = 0.02
0
1
2
0 20 40 60 80 100
Exp
ress
ion
Valu
e
Age (years)
Decreased CALB1 Expression with Age
R = -‐0.3 p = 0.12
0 1 2 3 4 5
0 20 40 60 80 100
Exp
ress
ion
Valu
e
Age (years)
Increased GPHN Expression with Age
R = 0.3 p = 0.008

39
Figure 6a-c. Linear effect of age on
ALDH1L1 (a), GFAP (b), and
GLUL (c) expression.
The expression of ALDH1L1 was
significantly increased and moderately
positively correlated with age across
the lifespan (p = 0.01; r = 0.4).
Expression of GFAP was also
significantly increased and moderately
positively correlated with age across
the lifespan (p = 0.04; r = 0.4). GLUL
expression was nominally increased
and weakly positively correlated with
age across the lifespan (p = 0.09; r =
0.2).
0
0.5
1
1.5
2
2.5
0 20 40 60 80 100
Exp
ress
ion
Valu
e
Age (years)
Increased ALDH1L1 Expression with Age
R = 0.4 p = 0.01
0
10
20
30
40
50
0 20 40 60 80 100
Exp
ress
ion
Valu
e
Age (years)
Increased GFAP Expression with Age R = 0.4 p = 0.04
0
20
40
60
80
100
120
0 20 40 60 80 100
Exp
ress
ion
Valu
e
Age (years)
Increased GLUL Expression with Age
R = 0.2 p = 0.09

40
Principle Component of Variance in Gene Expression is Captured by Age
A principle component analysis was performed to extract the primary variable that was
most attributable to differences in gene expression between subject groups. Principle
component 1 (PC1) was determined as the principle component of variance in gene
expression at a threshold of 40% and greater and accounted for 77.1% of the variance
in the gene expression data. Principle component 2 (PC2) accounted for 13.6% of the
variance. The distribution of genes according to PC1 largely paralleled the direction of
reported expression changes due to age and was thus attributed as the primary variable
mediating differences in gene expression between subject groups.
[CAPTION]
0
0.05
0.1
0.15
0.2
0.25
0 20 40 60 80 100
Exp
ress
ion
Valu
e
Age (years)
Unchanged GRM2 Expression with Age
R = -‐0.2 p = 0.29
0
0.5
1
1.5
2
0 20 40 60 80 100
Exp
ress
ion
Valu
e
Age (years)
Unchanged GRM3 Expression with Age
R = -‐0.3 p = 0.11
Figure 7a-b. Linear effect of age on
GRM2 (a) and GRM3 (b) expression.
Expression of GRM2 was weakly and
correlated with age across the lifespan (p
= 0.29; r = -0.2). GRM3 expression was
also weakly and non-significantly
correlated with age across the lifespan (p
= 0.11; r = -0.3).

41
Gene Expression Changes in Circuitry are Concerted
A heat map was generated for expression values to determine clustering effects of gene
expression as a function of age. Strong correlations between GLUL, GPHN,
ALDH1L1, and GFAP age-dependent expression formed a cluster group, as did strong
correlations between SST, CALB1, GRM2, PVALB, and GRM3 expression. These
cluster groups were representative of age-dependent gene expression changes in
functional units of the cortex that played a role in glial activity and in
excitatory/inhibitory/calcium transmission. These results suggest that age-regulated
genes are part of a transcriptomic program that elicits expression changes occurring in
parallel in groups of specific genes.
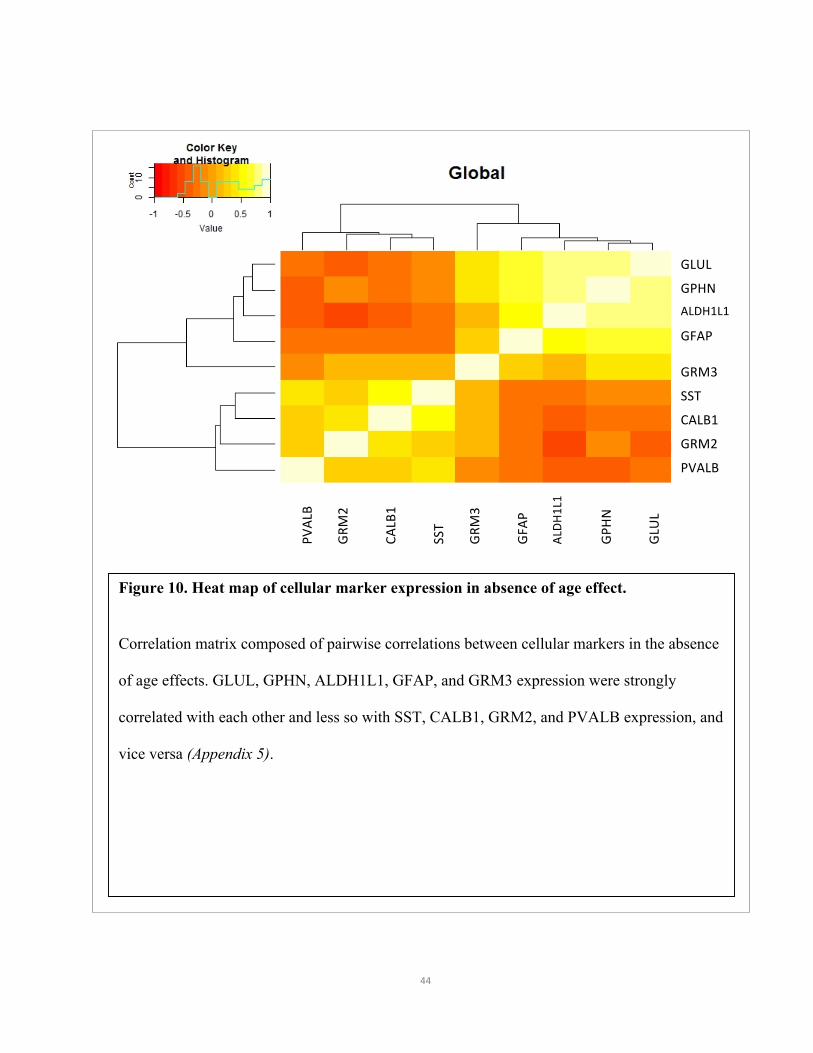
Cell Markers Group Together Irrespective of Age
A heat map was also generated to determine gene expression clustering effects in the
absence of age as a statistical covariate of the data. Strong correlations between GLUL,
GPHN, ALDH1L1, GFAP, and GRM3 expression formed a cluster group, as did SST,
CALB1, GRM2, and PVALB expression. These cluster groups were mostly similar to
those generated with age as a covariate of the expression data, which is suggestive of
intrinsic networks of cells and biological systems that are programed to undergo
concerted changes associated with the aging phenotype.

42
Figure 8. Analysis of the principle components of variance attributed to cell marker gene expression.
The principle component matrix is depicted as (PC1, PC2) values in (x, y) coordinates.
Principle component 1 (PC1) was determined as the principle component of variance in gene
expression at a threshold of 40% and greater. PC1 accounted for 77.1% of the variance in the
gene expression data. Principle component 2 (PC2) accounted for 13.6% of the variance. The
distribution of genes according to PC1 largely parallels expression changes due to result of
age.
SST
GFAP
PVALB ALDH1L1
CALB1 GLUL
GPHN GRM2
GRM3
.000
.100
.200
.300
.400
.500
.600
.700
.800
.900
-‐.800 -‐.600 -‐.400 -‐.200 .000 .200 .400 .600 .800 1.000
Principle Component Analysis of Cell Marker Gene Expression
(-‐0.588, 0.575)
(-‐0.524, 0.448) (-‐0.613, 0.411)
(-‐0.564, 0.196)
(0.083, 0.834)
(0.780, 0.472) (0.835, 0.451)
(0.737, 0.023)
(0.915, 0.113)
Principle component 1 (PC1)
Prin
cipl
e co
mpo
nent
2 (P
C2)

43
Figure 9. Heat map of cellular marker expression due to age.
Correlation matrix composed of pairwise correlations between cellular markers accounted for
by age. GLUL, GPHN, ALDH1L1, and GFAP expression were strongly correlated with each
other and less so with SST, CALB1, GRM2, PVALB, and GRM3 expression, and vice versa
(Appendix 5).
ALDH1L1
ALDH
1L1
44
Figure 10. Heat map of cellular marker expression in absence of age effect.
Correlation matrix composed of pairwise correlations between cellular markers in the absence
of age effects. GLUL, GPHN, ALDH1L1, GFAP, and GRM3 expression were strongly
correlated with each other and less so with SST, CALB1, GRM2, and PVALB expression, and
vice versa (Appendix 5).
GLUL
GPHN ALDH1L1
GFAP
GRM3
SST
CALB1
GRM2
PVALB
CALB1
GRM
2
PVAL
B
SST
GRM
3
GFA
P
ALDH
1L1
GPH
N
GLU
L

45
CHAPTER 4: DISCUSSION

46
SUMMARY
Expression of SST (somatostatin) was significantly reduced in aged subjects, as well as with
PVALB (parvalbumin) (p = 1.95E-04; p = 0.021). Expression of CALB1 (calbindin) was
nominally decreased in aged subjects (p = 0.124). Conversely, GFAP (glial fibrillary acidic
protein), ALDH1L1 (aldehyde dehydrogenase 1 family member L1), and GPHN (gephyrin)
expression were significantly upregulated in aged subjects (p = 0.004; p = 0.011; p = 0.008).
Expression of GLUL (glutamine synthase) trended towards increased expression in aged
subjects (p = 0.095).Expression of group II metabotropic glutamate receptors GRM2 and
GRM3 were nominally reduced in aged subjects (p = 0.291; p = 0.112). Altogether, these
results indicate changes in the gene expression profile of the aged prefrontal cortex in a novel
cohort that are largely consistent with previous findings.
ROLE OF CELL MARKERS IN GABA-MEDIATED LOCAL CIRCUIT FUNCTION
The significantly reduced expression of interneuron markers SST and PVALB, and the
nominal reduction of CALB1 expression observed in aged subjects suggests a disturbance, if
not a reduction, in inhibitory GABAergic tone within cortical neurocircuits. The significantly
increased expression of GPHN may be indicative of a cellular attempt to increase the density of
inhibitory receptors in postsynaptic membranes. Additionally, the significant upregulation of
glial markers GFAP and ALDH1L1, and the nominal upregulation of GLUL expression may
represent an increase in glial reactivity, which may have profound effects on the cortical
microenvironment and on circuit function due to the release of cytotoxic factors. The trend of
reduced GRM2/3 expression in aged subjects might be indicative of subtle alterations to
glutamatergic signalling within cortical neuronal populations. Ultimately, the molecular

47
changes that occur with aging may engender an imbalance between excitatory and inhibitory
drives in local cortical circuits, and thus precipitate neurological disease.
The results obtained from this study are largely consistent with previously reported data.
Inhibitory neuron markers SST, PVALB, and CALB1 have been shown to be downregulated in
older subjects compared to young controls, and in the absence of diagnosed neuropsychiatric
disorder. The postsynaptic marker GPHN exhibited an upregulation in expression during the
aging process, which is consistent with prior literature. Additionally, the change in glial marker
expression of GFAP, ALDH1L1, and GLUL were congruent with previous cohorts. Lastly,
although changes GRM2/3 expression failed to reach statistical significance, their nominal
reduction is indicative of a trend towards downregulation across the lifespan.
Altogether, these findings validate previous reports in the literature and evince the importance
of replication to support newly emerging theories in relation to the molecular correlates of
aging. Furthermore, these findings also validate the novel age-cohort as appropriate subjects
with which to investigate the molecular mechanisms of aging in future investigations.
ROLE OF OBSERVED CHANGES IN AGING
Data generated from this study support that signalling within local cortical circuits is altered
during the aging process. These alterations appear to involve altered inhibitory GABAergic
neuropeptide expression, excitatory glutamatergic signalling, and intracellular calcium
transmission, and an accompanying increase in glial reactivity. The significant downregulation
of SST and PVALB, and nominal reduction in CALB1 expression suggests reduced inhibitory
markerexpression of GABAergic interneurons in the aging cortex. Furthermore, this
48
phenomenon may pose consequences for cytosolic calcium signalling in neuronal cells, due to
the downregulation of cytosolic binding proteins PVALB and CALB1, and may alter
homeostatic levels of cellular function. An increase in the pool of unbound calcium ions could
have widespread and ultimately deleterious range of effects on cell, network, and brain,
integrity. Interestingly, the significantly increased expression of GPHN may indicate a
compensatory mechanism to increase in the density of inhibitory receptors in postsynaptic
membranes to account for a reduction in inhibitory neuropeptide transmission. The nominal
downregulation of GRM2 and GRM3suggests a decrease in glutamatergic signal transmission
within cortical circuits, possibly as a result of altered pyramidal cell function. Expression
changes in GRM2/3 may be secondary to primary deficits in inhibitory neuronal populations,
which appear to be particularly vulnerable to age effects, and would thus be less significantly
affected across the lifespan 99. The reactivity of astrocytes appears to be increased in aged
subjects, as suggested by the significant upregulation of ALDH1L1 and GFAP, and the
observed trend in GLUL. This increase in reactivity may indirectly impact the environment of
cortical circuits as well as directly affect the activity of interneurons and pyramidal cells. The
trend towards increased expression of GLUL, which mediates the metabolism of glutamate to
GABA in astrocytes, may also represent a compensatory mechanism to increase the overall
pool of GABAergic signalling within cortical circuits by increasing the catalysis GABA
biosynthesis. Overall, these results suggest that in cortical neurocircuits, altered gene
expression changes the balance between GABAergic and glutamatergic signalling, as well as
intracellular calcium transmission and the reactivity of glial cells, and is associated with the
aging phenotype.

49
These results lend credence to the theory of a transcriptomic program regulating the aging
phenotype. Analysis of the principle component of variance attributed to cellular marker
expression suggested that the magnitude and direction of gene expression change could likely
be attributed to age. The first principle component (PC1) accounted for most of the variance in
the expression data (77.1%) and resulted in a distribution that mirrored the effect of age on
gene expression of the selected markers. Additionally, the generation of heat maps highlighted
strong correlations between the gene expression of cellular markers that could be
conceptualized as a belonging to a similar functional group, such as involvement in
GABAergic/glutamate/calcium regulation or astrocyte reactivity. Furthermore, these functional
groups were primarily maintained after the contribution of age was excluded from the model,
suggesting a concerted change in neurocircuits that shifted cells towards a different pattern of
gene expression across the lifespan. In other words, the data suggests correlated plasticity
within functional cell circuits in aging.
AGE-BY-DISEASE INTERACTION MODEL
Normal molecular brain aging is an integral aspect and modulator of disease onset and
progression, ranging from late onset neurodegenerative diseases, such as AD and PD, to earlier
onset neuropsychiatric diseases, including SCZ and BPD58,59.
Molecular aging preferentially affects a large proportion of genes related to neurological
diseases60.Approximately 5-10% of genes expressed by the human genome are regulated by
age60. From this set, ~34% of age-regulated genes in the human brain have been shown to be
associated to at least one of six age-gated neurological diseases, including AD, PD, HD, ALS,
BPD, and SCZ60. Moreover, the majority of genes associated with these diseases have

50
expression levels that significantly vary with chronological age60. Additionally, the direction of
expression changes that occur in disease-related genes is almost unanimously toward pro-
disease directions along the lifespan60. These findings suggest that aging may promote
disease60.
It appears that genes related to developmental transcriptional programs may have a dual role in
promoting the aging process, especially considering that certain developmental phenomena,
such as synaptic pruning, mirror aging phenotypes (i.e., synaptic loss), and thus could be
extensions from similar biological programs6,31. This may also explain, at least in part, why a
variety of genes associated with developmental diseases, such as BPD and SCZ, are also
regulated by age6,31.
Whilst evidence suggests that normal aging may modulate disease, the converse does not
appear to be true, i.e., not all genes associated with disease susceptibility have been proven to
modulate aging6,15,102. For instance, neuronal loss, which is an integral feature of
neurodegenerative diseases, does not occur during normal aging6,103.
The remarkably consistent and selective gene expression changes that have been reported by
numerous groups using a variety of platforms could be attributed to a tightly regulated age-
gated transcriptional program6. Furthermore, alternative hypotheses, such as cellular wear and
tear and oxidative stress, only partially account for the selectivity of the observed changes in
gene expression6.

51
A robust example of this proposed age-by-disease interaction model can be found with MDD.
The etiology of MDD shares some molecular similarities with aging. For example, the
expression of SST is reduced in various brain regions in subjects with MDD, as is also true of
cortical SST expression in aging 49,87,98. Additionally, the absence of SST transmission or cell
function induces changes to behavioural emotionality in mice 18,104. Although the diagnoses of
mood disorders are not necessarily higher in the older human population, studies do
demonstrate a rise in the numbers of depressive symptoms in the elderly6,105. This
incongruence may likely suggest issues with diagnostic structure and procedure6. The
misattribution of psychomotor retardation, anhedonia, memory loss, and reduced cognitive
speed to aging per se leads to under diagnosing of depression in older adults6,106,107.
Interestingly, adults with poorer performance on cognitive tests have been shown to defer less
to positivity-bias, suggesting decreased emotional control, and thus introducing a cause-effect
confound6,13. Moreover, the presence of low mood and major depressive symptoms in the
context of AD and PD, further imply dysregulation of emotional control6,105. Altogether, it
seems that the loss of emotional regulation with age in people with more accelerated cognitive
decline may represent a major risk factor for depression in old age and is thus a robust example
of a proposed age-by-disease interaction model6.
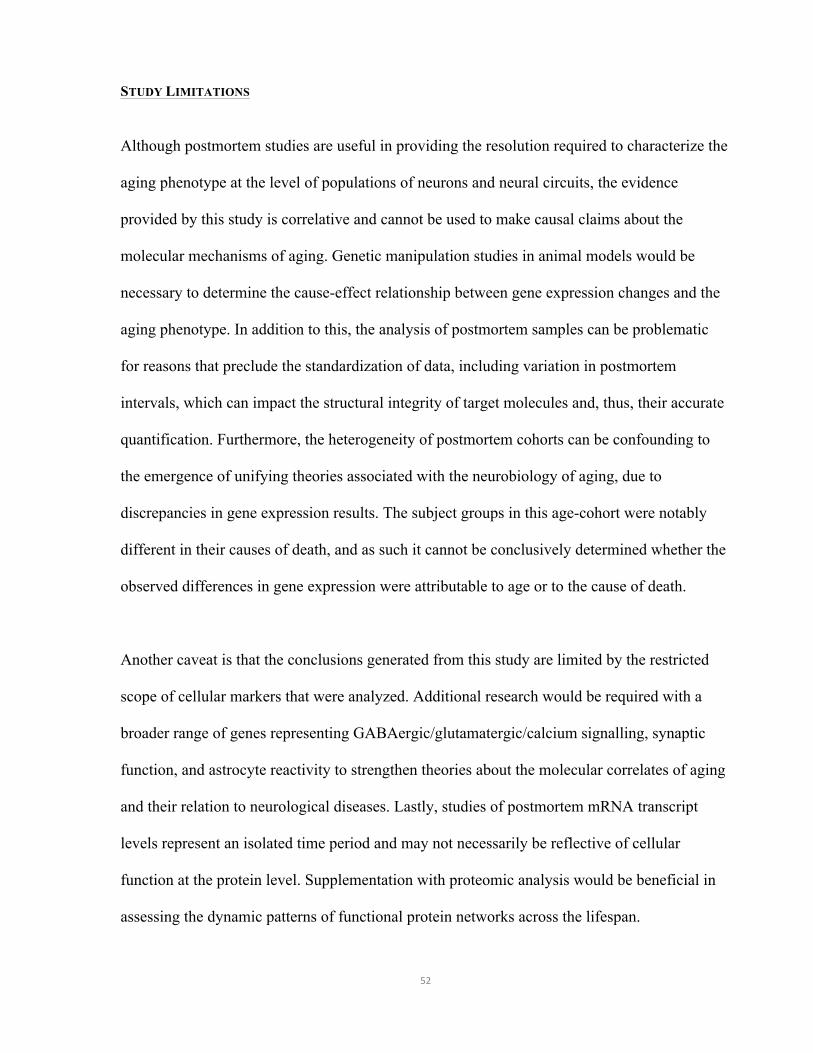
52
STUDY LIMITATIONS
Although postmortem studies are useful in providing the resolution required to characterize the
aging phenotype at the level of populations of neurons and neural circuits, the evidence
provided by this study is correlative and cannot be used to make causal claims about the
molecular mechanisms of aging. Genetic manipulation studies in animal models would be
necessary to determine the cause-effect relationship between gene expression changes and the
aging phenotype. In addition to this, the analysis of postmortem samples can be problematic
for reasons that preclude the standardization of data, including variation in postmortem
intervals, which can impact the structural integrity of target molecules and, thus, their accurate
quantification. Furthermore, the heterogeneity of postmortem cohorts can be confounding to
the emergence of unifying theories associated with the neurobiology of aging, due to
discrepancies in gene expression results. The subject groups in this age-cohort were notably
different in their causes of death, and as such it cannot be conclusively determined whether the
observed differences in gene expression were attributable to age or to the cause of death.
Another caveat is that the conclusions generated from this study are limited by the restricted
scope of cellular markers that were analyzed. Additional research would be required with a
broader range of genes representing GABAergic/glutamatergic/calcium signalling, synaptic
function, and astrocyte reactivity to strengthen theories about the molecular correlates of aging
and their relation to neurological diseases. Lastly, studies of postmortem mRNA transcript
levels represent an isolated time period and may not necessarily be reflective of cellular
function at the protein level. Supplementation with proteomic analysis would be beneficial in
assessing the dynamic patterns of functional protein networks across the lifespan.

53
CONCLUSIONS
The modulation of an array of neurological diseases by normal molecular brain aging is a
promising framework for the creation of anti-aging therapeutics. This emerging knowledge
notwithstanding, it is still largely unknown how aging gates neurological diseases, and which
elements contribute to individual variability in age of onset. A transcriptional program that
progressively constrains genes towards disease-promoting directions may represent the integral
feature of normal brain aging that is necessary for disease onset. This knowledge will be
essential in moving the field forward in that it forms the basis for a dimensional definition of
diseases that progresses beyond the traditional categorical system of neurological diseases.
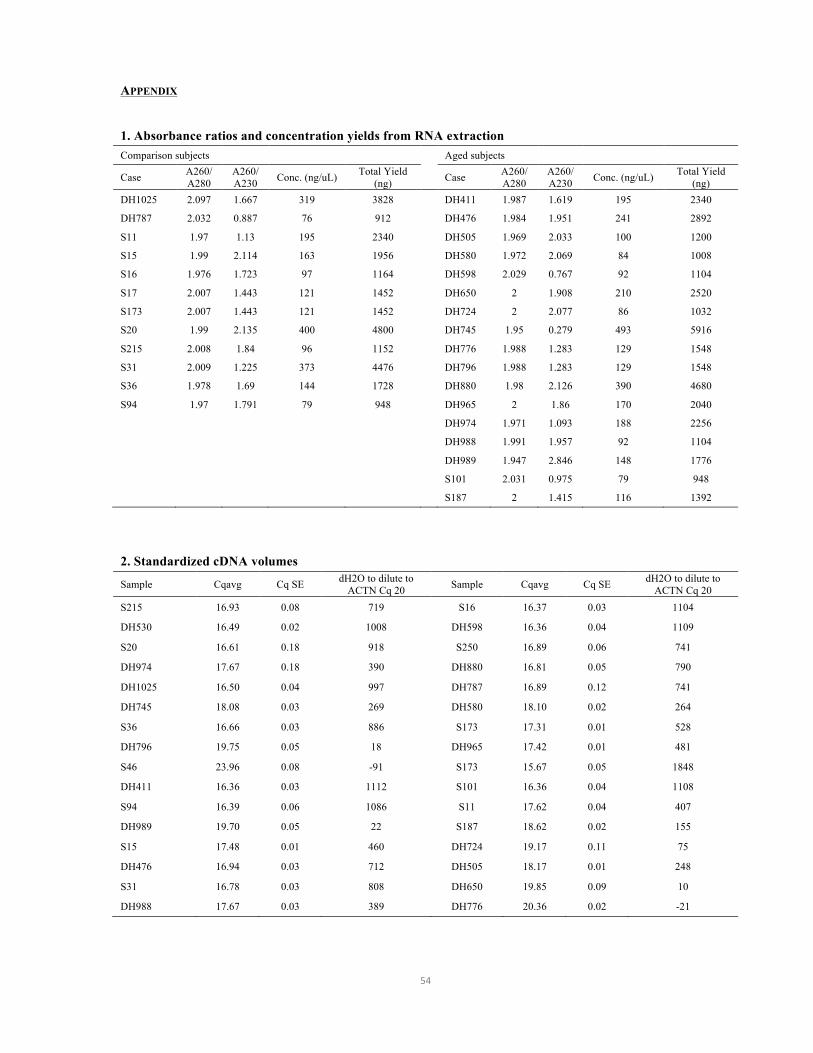
54
APPENDIX
1. Absorbance ratios and concentration yields from RNA extraction Comparison subjects Aged subjects
Case A260/A280
A260/A230 Conc. (ng/uL) Total Yield
(ng) Case A260/A280
A260/A230 Conc. (ng/uL) Total Yield
(ng) DH1025 2.097 1.667 319 3828 DH411 1.987 1.619 195 2340
DH787 2.032 0.887 76 912 DH476 1.984 1.951 241 2892
S11 1.97 1.13 195 2340 DH505 1.969 2.033 100 1200
S15 1.99 2.114 163 1956 DH580 1.972 2.069 84 1008
S16 1.976 1.723 97 1164 DH598 2.029 0.767 92 1104
S17 2.007 1.443 121 1452 DH650 2 1.908 210 2520
S173 2.007 1.443 121 1452 DH724 2 2.077 86 1032
S20 1.99 2.135 400 4800 DH745 1.95 0.279 493 5916
S215 2.008 1.84 96 1152 DH776 1.988 1.283 129 1548
S31 2.009 1.225 373 4476 DH796 1.988 1.283 129 1548
S36 1.978 1.69 144 1728 DH880 1.98 2.126 390 4680
S94 1.97 1.791 79 948 DH965 2 1.86 170 2040
DH974 1.971 1.093 188 2256
DH988 1.991 1.957 92 1104
DH989 1.947 2.846 148 1776
S101 2.031 0.975 79 948
S187 2 1.415 116 1392
2. Standardized cDNA volumes
Sample Cqavg Cq SE dH2O to dilute to ACTN Cq 20 Sample Cqavg Cq SE dH2O to dilute to
ACTN Cq 20 S215 16.93 0.08 719 S16 16.37 0.03 1104
DH530 16.49 0.02 1008 DH598 16.36 0.04 1109
S20 16.61 0.18 918 S250 16.89 0.06 741
DH974 17.67 0.18 390 DH880 16.81 0.05 790
DH1025 16.50 0.04 997 DH787 16.89 0.12 741
DH745 18.08 0.03 269 DH580 18.10 0.02 264
S36 16.66 0.03 886 S173 17.31 0.01 528
DH796 19.75 0.05 18 DH965 17.42 0.01 481
S46 23.96 0.08 -91 S173 15.67 0.05 1848
DH411 16.36 0.03 1112 S101 16.36 0.04 1108
S94 16.39 0.06 1086 S11 17.62 0.04 407
DH989 19.70 0.05 22 S187 18.62 0.02 155
S15 17.48 0.01 460 DH724 19.17 0.11 75
DH476 16.94 0.03 712 DH505 18.17 0.01 248
S31 16.78 0.03 808 DH650 19.85 0.09 10
DH988 17.67 0.03 389 DH776 20.36 0.02 -21

55
APPENDIX 3. Forward and reverse primer sequences
Gene Accession no. Sequence Start pos. (bp) Size (bp) Conc. (nmol) Prod. Size (bp) ACTB NM_001101 GCAAAGACCTGTACGCCAAC 953 20 30.8 80
CTCCTTCTGCATCCTGTCG 1032 19 26.8 GAPDH NM_002046 GGGCTCTCCAGAACATCATC 790 20 27 80
CTTCCCGTTCAGCTCAGG 869 18 29.4 CYCLO NM_004792 GTTATCGAACTCCTTCCAGATCC 1239 23 24.3 80
CATCTCTTGCCTCCAATGTG 1318 20 37 SST NM_001048 AACCCAACCAGACGGAGA 298 18 32.8 80
CTCAAGCCTCATTTCATCCTG 377 21 34.7 PVALB NM_002854 CGCTACCGACTCCTTCGAC 110 19 30.9 80
CTTCTTCACATCATCCGCACT 188 21 27.4 CALB1 NM_004929 CGAGAAGAATAAACAGGATCTGG 841 23 26.9 80
TCCCTCCATCCGACAAAG 920 18 25.2 GPHN NM_000310 TCAGAATCGCCTCGTGCT 2022 18 31.8 80
CTGCACCTGGACTGGACTTT 2101 20 31.3 GFAP NM_002055 GATGGCGCTAGGCATACAA 2360 19 28.1 80
GTCACTTCCTTAATTCCCACAATC 2439 24 30.5 ALDH1L1 XM_006713481 CATCTATCACCCGTCACTGC 398 20 27.5 80
CTTTCTTATCTCCGTGAATGAGG 477 23 26.5 GLUL NM_002065 GCGGGAGGAGAATGGTCT 1680 18 28.7 80
AGGCACGGATGTGGTACTG 1759 19 30.3 GRM2 NM_000839 CATTCCTGCCCATCTTCTATGT 2563 20 27.1 80
GCTGAGGCTGACTGACACG 2642 22 23.1 GRM3 NM_000840 TTAGTCTGTTCCTCCCTTATTTGAAG 980 26 25.7 80
GCCAATGTGTCATGCTAGTCC 1059 21 31.2
4. UNIANOVA analysis of variance SST PVALB CALB1 GPHN GFAP ALDH1L1 GLUL GRM2 GRM3 Age Pearson
Correlation -.511 -.429 -.279 .276 .383 .395 .222 -.2 -.321
Sig. (2-tailed) .000 .021 .124 .008 .004 .011 .095 .291 .112
N 30 30 30 30 30 30 30 30 30 PMI Pearson
Correlation .124 -.117 .06 -.169 -.318 -.176 -.158 .061 .134
Sig. (2-tailed) .904 .232 .550 .551 .259 .887 .541 .822 .794
N 30 30 30 30 30 30 30 30 30 pH Pearson
Correlation .164 .25 .082 .468 -.163 .179 .21 .188 .343
Sig. (2-tailed) .720 .753 .364 .002 .765 .017 .136 .780 .239
N 30 30 30 30 30 30 30 30 30 RIN Pearson
Correlation .209 -.109 .13 .114 -.154 -.042 .08 .279 .204
Sig. (2-tailed) .172 .766 .206 .958 .318 .355 .850 .156 .405
N 30 30 30 30 30 30 30 30 30
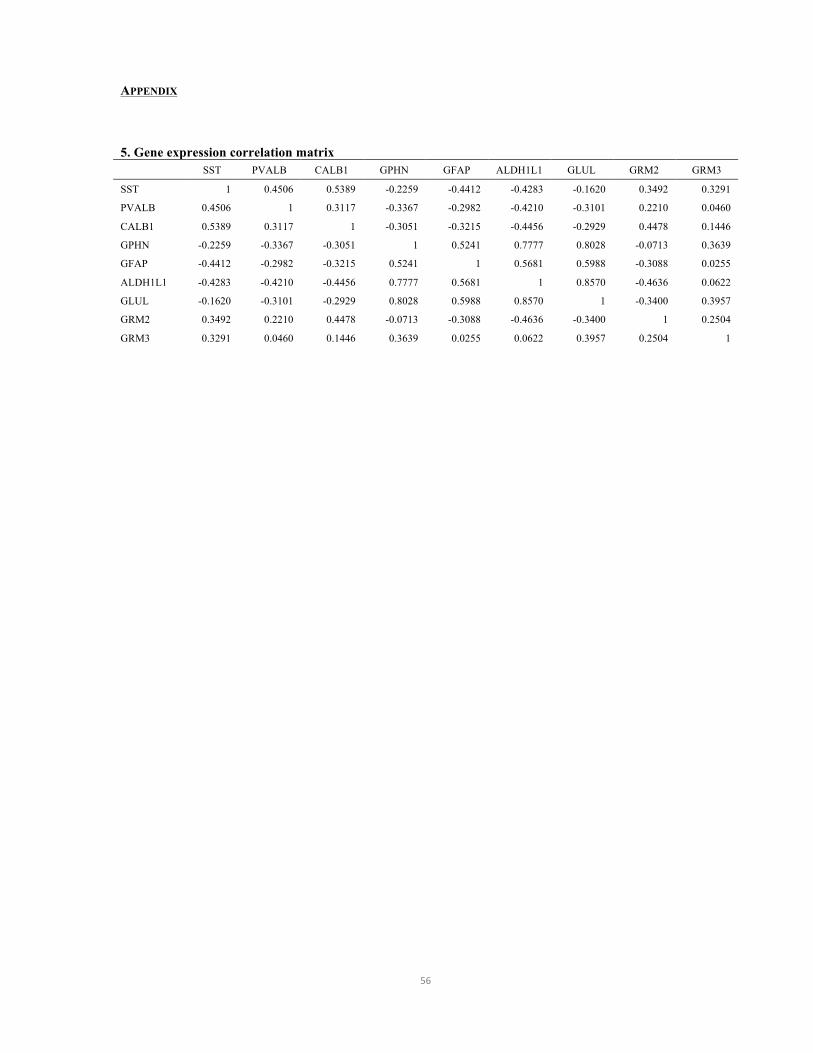
56
APPENDIX
5. Gene expression correlation matrix SST PVALB CALB1 GPHN GFAP ALDH1L1 GLUL GRM2 GRM3
SST 1 0.4506 0.5389 -0.2259 -0.4412 -0.4283 -0.1620 0.3492 0.3291
PVALB 0.4506 1 0.3117 -0.3367 -0.2982 -0.4210 -0.3101 0.2210 0.0460
CALB1 0.5389 0.3117 1 -0.3051 -0.3215 -0.4456 -0.2929 0.4478 0.1446
GPHN -0.2259 -0.3367 -0.3051 1 0.5241 0.7777 0.8028 -0.0713 0.3639
GFAP -0.4412 -0.2982 -0.3215 0.5241 1 0.5681 0.5988 -0.3088 0.0255
ALDH1L1 -0.4283 -0.4210 -0.4456 0.7777 0.5681 1 0.8570 -0.4636 0.0622
GLUL -0.1620 -0.3101 -0.2929 0.8028 0.5988 0.8570 1 -0.3400 0.3957
GRM2 0.3492 0.2210 0.4478 -0.0713 -0.3088 -0.4636 -0.3400 1 0.2504
GRM3 0.3291 0.0460 0.1446 0.3639 0.0255 0.0622 0.3957 0.2504 1

57
REFERENCES
1. López-Otín C, Blasco MA, Partridge L, Serrano M, Kroemer G. The hallmarks of aging. Cell. 2013;153(6):1194-1217. doi:10.1016/j.cell.2013.05.039.
2. World Population Ageing 2015.
3. Canada’s Population Estimates: Age and Sex.; 2015. http://www.statcan.gc.ca/daily-quotidien/150929/dq150929b-eng.htm.
4. Vaupel JW. Biodemography of Human Ageing. Nature. 2010;464(7288):536-542. doi:10.1038/nature08984.
5. Sibille E. Molecular aging of the brain, neuroplasticity, and vulnerability to depression and other brain-related disorders. Dialogues Clin Neurosci. 2013;15(1):53-65. http://www.pubmedcentral.nih.gov/articlerender.fcgi?artid=3622469&tool=pmcentrez&rendertype=abstract. Accessed January 18, 2016.
6. Glorioso C, Sibille E. Between destiny and disease: Genetics and molecular pathways of human central nervous system aging. Prog Neurobiol. 2011;93(2):165-181. doi:10.1016/j.pneurobio.2010.11.006.
7. Salthouse TA. The Processing-Speed Theory of Adult Age Differences in Cognition. Psychol Rev. 1996;103(3):403-428.
8. Dickstein DL, Kabaso D, Rocher AB, Luebke JI, Wearne SL, Hof PR. Changes in the structural complexity of the aged brain. Aging Cell. 2007;6(3):275-284. doi:10.1111/j.1474-9726.2007.00289.x.
9. Feldman ML, Dowd C. Loss of dendritic spines in aging cerebral cortex. Anat Embryol (Berl). 1975;148(3):279-301. doi:10.1007/BF00319848.
10. Kauranen K, Vanharanta H. Influences of aging, gender, and handedness on motor performance of upper and lower extremities. Percept Mot Skills. 1996;82(2):515-525. doi:10.2466/pms.1996.82.2.515.
11. Volkow N, Gur R, Wang G, et al. Association between decline in brain dopamine activity with age and. Am J Psychiatry. 1998;155(3).
12. Ruffman T, Henry JD, Livingstone V, Phillips LH. A meta-analytic review of emotion recognition and aging: Implications for neuropsychological models of aging. Neurosci Biobehav Rev. 2008;32:863-881. doi:10.1016/j.neubiorev.2008.01.001.
13. Mather M, Carstensen LL, Carstensen LL, et al. Aging and motivated cognition: the positivity effect in attention and memory. Trends Cogn Sci. 2005;9(10):496-502. doi:10.1016/j.tics.2005.08.005.
14. Wilson RS, Barnes LL, Mendes de Leon CF, et al. Depressive symptoms, cognitive decline, and risk of AD in older persons. Neurology. 2002;59(3):364-370. http://www.ncbi.nlm.nih.gov/pubmed/12177369. Accessed June 26, 2016.
15. Deary IJ, Strand S, Smith P, Fernandes C. Intelligence and educational achievement. Intelligence. 2007. doi:10.1016/j.intell.2006.02.001.

58
16. John B. Carroll. Human Cognitive Abilities. Cambridge: Cambridge University Press; 1993.
17. Araque A, Navarrete M. Glial cells in neuronal network function. Philos Trans R Soc Lond B Biol Sci. 2010;365(1551):2375-2381. doi:10.1098/rstb.2009.0313.
18. Soumier A, Sibille E. Opposing effects of acute versus chronic blockade of frontal cortex somatostatin-positive inhibitory neurons on behavioral emotionality in mice. Neuropsychopharmacology. 2014;39(9):2252-2262. doi:10.1038/npp.2014.76.
19. McQuail JA, Frazier CJ, Bizon JL. Molecular aspects of age-related cognitive decline: the role of GABA signaling. Trends Mol Med. 2015;21(7):450-460. doi:10.1016/j.molmed.2015.05.002.
20. Bak LK, Schousboe A, Waagepetersen HS. The glutamate/GABA-glutamine cycle: aspects of transport, neurotransmitter homeostasis and ammonia transfer. J Neurochem. 2006;98(3):641-653. doi:10.1111/j.1471-4159.2006.03913.x.
21. Northoff G, Sibille E. Why are cortical GABA neurons relevant to internal focus in depression? A cross-level model linking cellular, biochemical and neural network findings. Mol Psychiatry. 2014;19(9):966-977. doi:10.1038/mp.2014.68.
22. Hoogland TM, Parpura V. Editorial: The role of glia in plasticity and behavior. Front Cell Neurosci. 2015;9. doi:10.3389/fncel.2015.00356.
23. Lynch AM, Murphy KJ, Deighan BF, et al. The impact of glial activation in the aging brain. Aging Dis. 2010;1(3):262-278. http://www.pubmedcentral.nih.gov/articlerender.fcgi?artid=3295033&tool=pmcentrez&rendertype=abstract. Accessed March 1, 2016.
24. Volterra A, Meldolesi J. Astrocytes, from brain glue to communication elements: the revolution continues. Nat Rev Neurosci. 2005;6(8):626-640. doi:10.1038/nrn1722.
25. Kielian T. Glial connexins and gap junctions in CNS inflammation and disease. J Neurochem. 2008;106(3):1000-1016. doi:10.1111/j.1471-4159.2008.05405.x.
26. Halassa MM, Fellin T, Haydon PG, et al. The tripartite synapse: roles for gliotransmission in health and disease. Trends Mol Med. 2007;13(2):54-63. doi:10.1016/j.molmed.2006.12.005.
27. Ni Y, Malarkey EB, Parpura V. Vesicular release of glutamate mediates bidirectional signaling between astrocytes and neurons. J Neurochem. 2007;103(4):1273-1284. doi:10.1111/j.1471-4159.2007.04864.x.
28. Abbott NJ, Rönnbäck L, Hansson E. Astrocyte-endothelial interactions at the blood-brain barrier. Nat Rev Neurosci. 2006;7(1):41-53. doi:10.1038/nrn1824.
29. Kuno R, Yoshida Y, Nitta A, et al. The role of TNF-alpha and its receptors in the production of NGF and GDNF by astrocytes. 2006. doi:10.1016/j.brainres.2006.07.120.
30. Erraji-Benchekroun L, Underwood M, Arango V, et al. Molecular aging of human prefrontal cortex is selective and continuous throughout adult life. Biol Psychiatry. 2005. http://ac.els-cdn.com/S0006322304011187/1-s2.0-S0006322304011187-main.pdf?_tid=c5c53c64-be1a-11e5-a8e9-00000aab0f02&acdnat=1453145970_aec5df533cb3c4df2c8363736ce0c4eb. Accessed January 18, 2016.
31. Glorioso C, Oh S, Douillard GG, Sibille E. Brain molecular aging, promotion of neurological disease and modulation by Sirtuin5 longevity gene polymorphism. Neurobiol Dis. 2010.

59
doi:10.1016/j.nbd.2010.09.016.
32. Lee CK, Weindruch R, Prolla T a. Gene-expression profile of the ageing brain in mice. Nat Genet. 2000;25(3):294-297. doi:10.1038/77046.
33. Lu T, Pan Y, Kao SY, et al. Gene regulation and DNA damage in the ageing human brain. Nature. 2004;429(6994):883-891. doi:10.1038/nature02661.
34. Jiang CH, Tsien JZ, Schultz PG, Hu Y. The effects of aging on gene expression in the hypothalamus and cortex of mice. Proc Natl Acad Sci U S A. 2001;98(4):1930-1934. doi:10.1073/pnas.98.4.1930.
35. Blalock EM, Chen K-C, Sharrow K, et al. Gene microarrays in hippocampal aging: statistical profiling identifies novel processes correlated with cognitive impairment. J Neurosci. 2003;23(9):3807-3819. doi:23/9/3807 [pii].
36. McKinney B, Oh H, Sibille E. Age-by-disease biological interactions: implications for late-life depression. Front Genet. 2012. http://www.sibille.pitt.edu/Publications/2012_McKinneyOhSibille.pdf. Accessed February 9, 2016.
37. Yankner BA, Lu T, Loerch P. The Aging Brain. Annu Rev Pathol. 2008.
38. Kirischuk S, Verkhratsky A. Calcium homeostasis in aged neurones. Life Sci. 1996;59(5-6):451-459. http://www.ncbi.nlm.nih.gov/pubmed/8761333. Accessed July 5, 2016.
39. van den Pol AN. Neuropeptide transmission in brain circuits. Neuron. 2012;76(1):98-115. doi:10.1016/j.neuron.2012.09.014.
40. Leng G, Ludwig M. Neurotransmitters and peptides: whispered secrets and public announcements. J Physiol. 2008;586(Pt 23):5625-5632. doi:10.1113/jphysiol.2008.159103.
41. Ludwig M, Leng G. Dendritic peptide release and peptide-dependent behaviours. Nat Rev Neurosci. 2006;7(2):126-136. doi:10.1038/nrn1845.
42. Ludwig M, Pittman QJ. Talking back: Dendritic neurotransmitter release. Trends Neurosci. 2003;26(5):255-261. doi:10.1016/S0166-2236(03)00072-9.
43. Seney ML, Tripp A, McCune S, A. Lewis D, Sibille E. Laminar and cellular analyses of reduced somatostatin gene expression in the subgenual anterior cingulate cortex in major depression. Neurobiol Dis. 2015;73:213-219. doi:10.1016/j.nbd.2014.10.005.
44. Packer AM, McConnell DJ, Fino E, Yuste R. Axo-Dendritic Overlap and Laminar Projection Can Explain Interneuron Connectivity to Pyramidal Cells. Cereb Cortex. 2012;23(12):2790-2802. doi:10.1093/cercor/bhs210.
45. Fino E, Yuste R. Dense inhibitory connectivity in neocortex. Neuron. 2011;69(6):1188-1203. doi:10.1016/j.neuron.2011.02.025.
46. Ma Y, Hu H, Berrebi AS, Mathers PH, Agmon A. Distinct subtypes of somatostatin-containing neocortical interneurons revealed in transgenic mice. J Neurosci. 2006;26(19):5069-5082. doi:10.1523/JNEUROSCI.0661-06.2006.
47. Pfeffer CK, Xue M, He M, Huang ZJ, Scanziani M. Inhibition of inhibition in visual cortex: the logic of connections between molecularly distinct interneurons. Nat Neurosci. 2013;16(8):1068-1076. doi:10.1038/nn.3446.

60
48. Fino E, Packer AM, Yuste R. The logic of inhibitory connectivity in the neocortex. Neuroscientist. 2013;19(3):228-237. doi:10.1177/1073858412456743.
49. Tripp A, Kota RS, Lewis DA, Sibille E. Reduced somatostatin in subgenual anterior cingulate cortex in major depression. Neurobiol Dis. 2011;42(1):116-124. doi:10.1016/j.nbd.2011.01.014.
50. Bu J, Sathyendra V, Nagykery N, Geula C. Age-related changes in calbindin-D 28k , calretinin, and parvalbumin- immunoreactive neurons in the human cerebral cortex. Exp Neurol. 2002. doi:10.1016/S0014-4886(03)00094-3.
51. Ang LC, Shul DD. Peptidergic neurons of subcortical white matter in aging and Alzheimer’s brain. Brain Res. 1995;674(2):329-335. doi:10.1016/0006-8993(95)00034-N.
52. Khachaturian ZS. Diagnosis of Alzheimer’s Disease. Arch Neurol. 1985;42(11):1097-1105. doi:10.1001/archneur.1985.04060100083029.
53. Yáñez M, Gil-Longo J, Campos-Toimil M. Calcium binding proteins. Adv Exp Med Biol. 2012;740:461-482. doi:10.1007/978-94-007-2888-2_19.
54. Sohal VS, Zhang F, Yizhar O, Deisseroth K. Parvalbumin neurons and gamma rhythms enhance cortical circuit performance. Nature. 2009;459(7247):698-702. doi:10.1038/nature07991.
55. Cardin JA, Carlén M, Meletis K, et al. Driving fast-spiking cells induces gamma rhythm and controls sensory responses. Nature. 2009;459(7247):663-667. doi:10.1038/nature08002.
56. Sibille E, French B. Biological substrates underpinning diagnosis of major depression. Int J Neuropsychopharmacol. 2013. doi:10.1017/S1461145713000436.
57. Kerman IA. New insights into BDNF signaling: relevance to major depression and antidepressant action. Am J Psychiatry. 2012;169(11):1137-1140. doi:10.1176/appi.ajp.2012.12081053.
58. Kishimoto J, Tsuchiya T, Cox H, Emson PC, Nakayama Y. Age-related changes of calbindin-D28k, calretinin, and parvalbumin mRNAs in the hamster brain. Neurobiol Aging. 1998. doi:10.1016/S0197-4580(97)00166-8.
59. Rocco BR, Sweet RA, Lewis DA, Fish KN. GABA-Synthesizing Enzymes in Calbindin and Calretinin Neurons in Monkey Prefrontal Cortex. Cereb Cortex. 2015. doi:10.1093/cercor/bhv051.
60. Fung SJ, Fillman SG, Webster MJ, Weickert CS. Schizophrenia and bipolar disorder show both common and distinct changes in cortical interneuron markers. Schizophr Res. 2014;155:26-30. doi:10.1016/j.schres.2014.02.021.
61. Chow A, Erisir A, Farb C, et al. K(+) channel expression distinguishes subpopulations of parvalbumin- and somatostatin-containing neocortical interneurons. J Neurosci. 1999;19(21):9332-9345. http://www.ncbi.nlm.nih.gov/pubmed/10531438. Accessed July 27, 2016.
62. Maffei A, Nelson SB, Turrigiano GG. Selective reconfiguration of layer 4 visual cortical circuitry by visual deprivation. Nat Neurosci. 2004;7(12):1353-1359. doi:10.1038/nn1351.
63. Lionel AC, Vaags AK, Sato D, et al. Rare exonic deletions implicate the synaptic organizer Gephyrin (GPHN) in risk for autism, schizophrenia and seizures. Hum Mol Genet. 2013;22(10):2055-2066. doi:10.1093/hmg/ddt056.

61
64. Zurek AA, Kemp SWP, Aga Z, et al. α 5GABA A receptor deficiency causes autism-like behaviors. Ann Clin Transl Neurol. 2016;3(5):392-398. doi:10.1002/acn3.303.
65. Pinto L, Dan Y. Cell-Type-Specific Activity in Prefrontal Cortex during Goal-Directed Behavior. Neuron. 2015;87(2):437-450. doi:10.1016/j.neuron.2015.06.021.
66. Waldvogel HJ, Baer K, Snell RG, During MJ, Faull RLM, Rees MI. Distribution of gephyrin in the human brain: an immunohistochemical analysis. Neuroscience. 2003;116(1):145-156. doi:10.1016/S0306-4522(02)00550-X.
67. Wang H, Turner JG, Ling L, Parrish JL, Hughes LF, Caspary DM. Age-related changes in glycine receptor subunit composition and binding in dorsal cochlear nucleus. Neuroscience. 2009;160(1):227-239. doi:10.1016/j.neuroscience.2009.01.079.
68. Pinto JGA, Hornby KR, Jones DG, Murphy KM. Developmental changes in GABAergic mechanisms in human visual cortex across the lifespan. Front Cell Neurosci. 2010;4:16. doi:10.3389/fncel.2010.00016.
69. Li M-L, Hu X-Q, Li F, Gao W-J. Perspectives on the mGluR2/3 agonists as a therapeutic target for schizophrenia: Still promising or a dead end? Prog Neuro-Psychopharmacology Biol Psychiatry. 2015;60:66-76. doi:10.1016/j.pnpbp.2015.02.012.
70. Aronica E, Gorter JA, Ijlst-Keizers H, et al. Expression and functional role of mGluR3 and mGluR5 in human astrocytes and glioma cells: opposite regulation of glutamate transporter proteins. Eur J Neurosci. 2003;17(10):2106-2118. http://www.ncbi.nlm.nih.gov/pubmed/12786977. Accessed July 5, 2016.
71. Egan MF, Straub RE, Goldberg TE, et al. Variation in GRM3 affects cognition, prefrontal glutamate, and risk for schizophrenia. Proc Natl Acad Sci U S A. 2004;101(34):12604-12609. doi:10.1073/pnas.0405077101.
72. Rothstein JD, Dykes-Hoberg M, Pardo CA, et al. Knockout of glutamate transporters reveals a major role for astroglial transport in excitotoxicity and clearance of glutamate. Neuron. 1996;16(3):675-686. doi:10.1016/s0896-6273(00)80086-0.
73. Harrison PJ, Lyon L, Sartorius LJ, Burnet PWJ, Lane TA. The group II metabotropic glutamate receptor 3 (mGluR3, mGlu3, GRM3): expression, function and involvement in schizophrenia. J Psychopharmacol. 2008;22(3):308-322. doi:10.1177/0269881108089818.
74. Crook J, Akil M, Law B, Hyde T, Kleinman J. Comparative analysis of group II metabotropic glutamate receptor immunoreactivity in Brodmann’s area 46 of the dorsolateral prefrontal cortex from patients with schizophrenia and normal subjects. Mol Psychiatry. 2002;7:157-164. doi:10.1038/sj/mp/4000966.
75. Carson MJ, Thrash JC, Walter B. The cellular response in neuroinflammation: The role of leukocytes, microglia and astrocytes in neuronal death and survival. Clin Neurosci Res. 2006;6(5):237-245. doi:10.1016/j.cnr.2006.09.004.
76. Farina C, Aloisi F, Meinl E. Astrocytes are active players in cerebral innate immunity. Trends Immunol. 2007;28(3):138-145.
77. Gomes FCA, Paulin D, Moura Neto V. Glial fibrillary acidic protein (GFAP): modulation by growth factors and its implication in astrocyte differentiation. Brazilian J Med Biol Res. 1999;32(5):619-631. doi:10.1590/S0100-879X1999000500016.

62
78. Messing A, Head MW, Galles K, Galbreath EJ, Goldman JE, Brenner M. Fatal encephalopathy with astrocyte inclusions in GFAP transgenic mice. Am J Pathol. 1998;152(2):391-398. http://www.ncbi.nlm.nih.gov/pubmed/9466565. Accessed July 5, 2016.
79. Yang Y, Vidensky S, Jin L, et al. Molecular comparison of GLT1+ and ALDH1L1+ astrocytes in vivo in astroglial reporter mice. Glia. 2011;59(2):200-207. doi:10.1002/glia.21089.
80. Anthony TE, Heintz N. The folate metabolic enzyme ALDH1L1 is restricted to the midline of the early CNS, suggesting a role in human neural tube defects. J Comp Neurol. 2007;500(2):368-383. doi:10.1002/cne.21179.
81. Niciu MJ, Henter ID, Sanacora G, Zarate CA. Glial abnormalities in substance use disorders and depression: Does shared glutamatergic dysfunction contribute to comorbidity? World J Biol Psychiatry. 2014;15(1):2-16. doi:10.3109/15622975.2013.829585.
82. Colangelo AM, Alberghina L, Papa M. Astrogliosis as a therapeutic target for neurodegenerative diseases. Neurosci Lett. 2014;565:59-64. doi:10.1016/j.neulet.2014.01.014.
83. Salthouse TA, Atkinson TM, Berish DE. Executive Functioning as a Potential Mediator of Age-Related Cognitive Decline in Normal Adults. J Exp Psychol. 2003. doi:10.1037/0096-3445.132.4.566.
84. Persson J, Sylvester C-YC, Nelson JK, Welsh KM, Jonides J, Reuter-Lorenz PA. Selection requirements during verb generation: differential recruitment in older and younger adults. Neuroimage. 2004;23(4):1382-1390. doi:10.1016/j.neuroimage.2004.08.004.
85. Logan JM, Sanders AL, Snyder AZ, et al. Under-recruitment and nonselective recruitment: dissociable neural mechanisms associated with aging. Neuron. 2002;33(5):827-840. doi:10.1016/s0896-6273(02)00612-8.
86. Yankner B a, Lu T, Loerch P. The aging brain. Annu Rev Pathol. 2008;3:41-66. doi:10.1146/annurev.pathmechdis.2.010506.092044.
87. Douillard-Guilloux G, Guilloux J-P, Lewis DA, Sibille E. Anticipated brain molecular aging in major depression. Am J Geriatr Psychiatry. 2013;21(5):450-460. doi:10.1097/JGP.0b013e318266b7ad.
88. Christensen H. What cognitive changes can be expected with normal ageing? Aust N Z J Psychiatry. 2001;35(6):768-775. doi:10.1046/j.1440-1614.2001.00966.x.
89. McKinney BC, Sibille E. The age-by-disease interaction hypothesis of late-life depression. Am J Geriatr Psychiatry. 2013;21(5):418-432. doi:10.1097/JGP.0b013e31826ce80d.
90. Taylor S, Wakem M, Dijkman G, Alsarraj M, Nguyen M. A practical approach to RT-qPCR-Publishing data that conform to the MIQE guidelines. Methods. 2010;50(4):S1-S5. doi:10.1016/j.ymeth.2010.01.005.
91. Lefever S, Hellemans J, Pattyn F, et al. RDML: structured language and reporting guidelines for real-time quantitative PCR data. Nucleic Acids Res. 2009;37(7):2065-2069. doi:10.1093/nar/gkp056.
92. Bustin SA, Benes V, Garson JA, et al. The MIQE guidelines: minimum information for publication of quantitative real-time PCR experiments. Clin Chem. 2009;55(4):611-622. doi:10.1373/clinchem.2008.112797.

63
93. Altman DG, Bland JM. How to randomise. BMJ. 1999;319(7211):703-704. http://www.ncbi.nlm.nih.gov/pubmed/10480833. Accessed July 23, 2016.
94. Altman DG, Bland JM. Standard deviations and standard errors. BMJ. 2005;331(7521):903. doi:10.1136/bmj.331.7521.903.
95. Yuan JS, Reed A, Chen F, Stewart CN. Statistical analysis of real-time PCR data. BMC Bioinformatics. 2006;7:85. doi:10.1186/1471-2105-7-85.
96. Thornton B, Basu C. Real-time PCR (qPCR) primer design using free online software. Biochem Mol Biol Educ. 2011;39(2):145-154. doi:10.1002/bmb.20461.
97. Zhang J, Schindler T, Küng E, et al. Highly sensitive amplicon-based transcript quantification by semiconductor sequencing. BMC Genomics. 2014;15(1):565. doi:10.1186/1471-2164-15-565.
98. Tripp A, Oh H, Guilloux J-P, Martinowich K, Lewis DA, Sibille E. Brain-Derived Neurotrophic Factor Signaling and Subgenual Anterior Cingulate Cortex Dysfunction in Major Depressive Disorder. Am J Psychiatry. 2012;169(11):1194-1202. doi:10.1176/appi.ajp.2012.12020248.
99. Loerch PM, Lu T, Dakin KA, et al. Evolution of the Aging Brain Transcriptome and Synaptic Regulation. Orban L, ed. PLoS One. 2008;3(10):e3329. doi:10.1371/journal.pone.0003329.
100. Van Den Eeden SK, Tanner CM, Bernstein AL, et al. Incidence of Parkinson’s disease: variation by age, gender, and race/ethnicity. Am J Epidemiol. 2003;157(11):1015-1022. http://www.ncbi.nlm.nih.gov/pubmed/12777365. Accessed June 25, 2016.
101. Tohen M, Bromet E, Murphy JM, Tsuang MT. Psychiatric epidemiology. Harv Rev Psychiatry. 2000;8(3):111-125. doi:10.1191/096228098675787079.
102. Mattay VS, Goldberg TE, Sambataro F, Weinberger DR. Neurobiology of cognitive aging: insights from imaging genetics. Biol Psychol. 2008;79(1):9-22. doi:10.1016/j.biopsycho.2008.03.015.
103. Gómez-Isla T, Hollister R, West H, et al. Neuronal loss correlates with but exceeds neurofibrillary tangles in Alzheimer’s disease. Ann Neurol. 1997;41(1):17-24. doi:10.1002/ana.410410106.
104. Lin LC, Sibille E. Somatostatin, neuronal vulnerability and behavioral emotionality. Mol Psychiatry. 2015;20(3):377-387. doi:10.1038/mp.2014.184.
105. Fiske A, Wetherell JL, Gatz M. Depression in Older Adults. Annu Rev Clin Psychol. 2009. doi:10.1146/annurev.clinpsy.032408.153621.
106. Alexopoulos GS. Depression in the elderly. Lancet. 2005;365(9475):1961-1970. doi:10.1016/S0140-6736(05)66665-2.
107. Alexopoulos G, Schultz S, Lebowitz B. Late-life depression: a model for medical classification. Biol Psychiatry. 2005. http://ac.els-cdn.com/S0006322305005780/1-s2.0-S0006322305005780-main.pdf?_tid=48867c5c-be1c-11e5-afd8-00000aab0f6c&acdnat=1453146619_dfa3385d7f7f0cac6e5d7f4c901ec5e4. Accessed January 18, 2016.

64
BLANK
Related Documents