See discussions, stats, and author profiles for this publication at: https://www.researchgate.net/publication/262537623 Altered brain functional connectivity in hemodialysis patients with end-stage renal disease: a resting-state functionalMR imaging study Article in Metabolic Brain Disease · May 2014 DOI: 10.1007/s11011-014-9568-6 · Source: PubMed CITATIONS 19 READS 137 13 authors, including: Some of the authors of this publication are also working on these related projects: Separating Parietal Memory Network (PMN) From Default Mode Network (DMN) View project Neurodevelopment View project Gang Zheng Nanjing University 52 PUBLICATIONS 560 CITATIONS SEE PROFILE Jianhui Zhong University of Rochester 267 PUBLICATIONS 8,170 CITATIONS SEE PROFILE Xue Liang Shanghai University 45 PUBLICATIONS 256 CITATIONS SEE PROFILE Xiang Hong Kong Shanghai Ocean University 55 PUBLICATIONS 597 CITATIONS SEE PROFILE All content following this page was uploaded by Gang Zheng on 02 September 2014. The user has requested enhancement of the downloaded file.

Welcome message from author
This document is posted to help you gain knowledge. Please leave a comment to let me know what you think about it! Share it to your friends and learn new things together.
Transcript
See discussions, stats, and author profiles for this publication at: https://www.researchgate.net/publication/262537623
Altered brain functional connectivity in hemodialysis patients with end-stage
renal disease: a resting-state functionalMR imaging study
Article in Metabolic Brain Disease · May 2014
DOI: 10.1007/s11011-014-9568-6 · Source: PubMed
CITATIONS
19READS
137
13 authors, including:
Some of the authors of this publication are also working on these related projects:
Separating Parietal Memory Network (PMN) From Default Mode Network (DMN) View project
Neurodevelopment View project
Gang Zheng
Nanjing University
52 PUBLICATIONS 560 CITATIONS
SEE PROFILE
Jianhui Zhong
University of Rochester
267 PUBLICATIONS 8,170 CITATIONS
SEE PROFILE
Xue Liang
Shanghai University
45 PUBLICATIONS 256 CITATIONS
SEE PROFILE
Xiang Hong Kong
Shanghai Ocean University
55 PUBLICATIONS 597 CITATIONS
SEE PROFILE
All content following this page was uploaded by Gang Zheng on 02 September 2014.
The user has requested enhancement of the downloaded file.

1 23
Metabolic Brain Disease ISSN 0885-7490Volume 29Number 3 Metab Brain Dis (2014) 29:777-786DOI 10.1007/s11011-014-9568-6
Altered brain functional connectivityin hemodialysis patients with end-stagerenal disease: a resting-state functionalMRimaging study
Gang Zheng, Jiqiu Wen, Liping Zhang,Jianhui Zhong, Xue Liang, Wenwei Ke,Xiang Kong, Tiezhu Zhao, Yong He,Xinian Zuo, Song Luo, et al.

1 23
Your article is protected by copyright and all
rights are held exclusively by Springer Science
+Business Media New York. This e-offprint is
for personal use only and shall not be self-
archived in electronic repositories. If you wish
to self-archive your article, please use the
accepted manuscript version for posting on
your own website. You may further deposit
the accepted manuscript version in any
repository, provided it is only made publicly
available 12 months after official publication
or later and provided acknowledgement is
given to the original source of publication
and a link is inserted to the published article
on Springer's website. The link must be
accompanied by the following text: "The final
publication is available at link.springer.com”.
RESEARCH ARTICLE
Altered brain functional connectivity in hemodialysis patientswith end-stage renal disease: a resting-state functionalMR imaging study
Gang Zheng & Jiqiu Wen & Liping Zhang & Jianhui Zhong & Xue Liang & Wenwei Ke &
Xiang Kong & Tiezhu Zhao & Yong He & Xinian Zuo & Song Luo & Long Jiang Zhang &
Guang Ming Lu
Received: 13 February 2014 /Accepted: 12 May 2014 /Published online: 21 May 2014# Springer Science+Business Media New York 2014
Abstract The changes of whole brain functional con-nectivity in hemodialysis (HD) patients with end-stagerenal disease (ESRD) are still unclear, which may beassociated with multiple factors, such as elevated neu-rotoxins, anemia, and side effects of hemodialysis.Resting-state functional magnetic resonance imaging(rs-fMRI) data of 71 patients (43 males, 28 females;mean age, 33.4±9.4 years) and 43 age- and gender-
matched healthy volunteers (29 males, 14 females; meanage, 30.6±8.8 years) were acquired. Neuropsychologicaltests including number connection test type A (NCT-A),digit symbol test (DST), line-tracing test (LTT), serial-dotting test (SDT), self-rating depression scale (SDS)and self-rating anxiety scale (SAS) were used to evalu-ate cognitive and psychiatric conditions in all subjects.Blood biochemistry tests including serum creatininelevels, blood urea, hematocrit, and Ca2+ level weretaken in HD patients. Forty-two connections significant-ly different between HD patients with ESRD and con-trols were found (all P<0.05, Bonferroni corrected) andidentified as connectivities of interests (COIs), amongwhich 39 connections (92.9 %) were markedly de-creased in patients. Of the 39 weaker connections, 24were related to the frontal lobe regions. Widespreadweakening of cortical and subcortical network connec-tivity in ESRD patients was more directly related withneuropsychological impairments and anemia rather thanserum creatinine level, blood urea and dialysis duration.In particular, impairments in the medial prefrontal lobecould play an important role in mediating psychologicaldysfunctions.
Keywords End-stage renal disease . Hemodialysis .
Resting-state fMRI . Functional connectivity
AbbreviationsESRD End-stage renal diseaseHD HemodialysisNCT-A Number connection test type ADST Digit symbol testLTT Line-tracing testSDT Serial-dotting test
G. Zheng :X. Liang :X. Kong : S. Luo : L. J. Zhang (*) :G. M. Lu (*)Department of Medical Imaging, Jinling Hospital, Medical School ofNanjing University, Nanjing, Jiangsu 210002, Chinae-mail: [email protected]: [email protected]
G. Zheng : T. ZhaoCollege of Civil Aviation, Nanjing University of Aeronautics andAstronautics, Nanjing, Jiangsu 210016, China
J. WenResearch Institute of Nephrology, Jinling Hospital, Medical Schoolof Nanjing University, Nanjing, Jiangsu 210002, China
L. Zhang :W. KeCollege of Natural Science, Nanjing University of Aeronautics andAstronautics, Nanjing, Jiangsu 210016, China
J. ZhongDepartment of Biomedical Engineering, Zhejiang University,Hangzhou 310027, China
Y. HeState Key Laboratory of Cognitive Neuroscience and Learning,Beijing Normal University, Beijing 100875, China
X. ZuoKey Laboratory of Behavioral Science, Magnetic ResonanceImaging Research Center, Institute of Psychology, Chinese Academyof Sciences, Beijing 100101, China
Metab Brain Dis (2014) 29:777–786DOI 10.1007/s11011-014-9568-6
Author's personal copy
SDS Self-rating depression scaleSAS Self-rating anxiety scaleCOI Connectivity of interests
Introduction
End-stage renal disease (ESRD) is characterized by a glomer-ular filtration rate of<15 mL/min/1.73 m2, or the point atwhich permanent renal replacement therapy is needed (Kimet al. 2011). ESRD is becoming a substantial public healthproblem worldwide. In the United States, approximately 8 %of the population has chronic renal disease and 571,000 pa-tients receive treatment for ESRD (Collins et al. 2011). InESRD patients undergoing hemodialysis, the prevalence ofcognitive impairment has been estimated at 30–60 %(Bugnicourt et al. 2013). With life expectancy increasingand the population aging in developed and even some devel-oping countries, the cognitive disorder burden associated withESRD will be further worsened (Bugnicourt et al. 2013).However, cognitive dysfunction and dementia is oftenoverlooked in ESRD patients, and the cause andpathophysiology of cognitive disorders in ESRD patientsremain unclear.
The brain disorders of ESRD patients might be directly orindirectly associated with many risk factors, such as elevatedneurotoxins, anemia, and side effects of hemodialysis. Theuremic state of ESRD is characterized by the retention ofsolutes that are toxic in high concentration, such as creatinineand urea Meyer and Hostetter (2007). Secondary to chronicrenal failure, anemia is usually present. A marked increase inthe prevalence of anemia could develop with the decrease ofcreatinine clearance (Hsu et al. 2002). To remove toxins in theblood, hemodialysis is used as the routine renal replacementtherapy for ESRD patients. However, long-term hemodialysiscould lead to blood ion concentrations that may alter brainfunctions. For example, changes in calcium among chronichemodialysis patients resulted in vascular calcification(Kirschbaum 2004). Vascular calcification could disturb thedelivery of blood and might lead to insufficient oxygen deliv-ery. All the above factors potentially impair brain function inESRD patients. However, it is still unclear which factors aremore closely related to brain dysfunction in patients withESRD.
Multiple risk factors tend to induce widespread brain dis-orders in ESRD patients. For example, creatinine and ureacould be delivered throughout the brain. Also, low hemoglo-bin and high calcium of blood could impair all brain regionscoincided with the blood delivery. Furthermore, previousmedical imaging studies supported widespread brain disordersin ESRD patients. For example, Fazekas et al. (Fazekas et al.1996) found decreased cerebral blood flow in the frontal
cortex and thalamus and increased cerebral blood flow in theoccipital lobe in hemodialysis patients using single photonemission computed tomography (SPECT), which correlatedwith cognitive test results. Voxel-based morphometryMR canbe used to investigate focal differences in brain anatomy usingstatistical parametric mapping to locate brain atrophy.Recently, Zhang et al. reported that gray volumes of ESRDpatients were significantly decreased in the bilateral occipitallobes, precuneus and markedly increased right extranuclear,right caudate, and right thalamus (Zhang et al. 2013). Arterialspin labeling MR perfusion results showed that ESRD pa-tients’ CBFs were significantly decreased in left posteriormiddle temporal gyrus and a left inferior hypothalamic areabordering the fourth ventricle (Prohovnik et al. 2007).Diffusion tensor imaging found widespread white matter al-terations reflected by increased axial diffusivity, radial diffu-sivity, and mean diffusivity values and decreased anisotropyvalues, mostly in the corpus callosum, bilateral sagittal stra-tum, and pons (Hsieh et al. 2009; Chou et al. 2013). Recently,Liang et al. found decreased regional homogeneity values inwidespread cortical regions in ESRD patients based on bloodoxygen level dependent resting-state functional MRI (rs-fMRI) with ReHo analysis (Liang et al. 2013). These findingsregionally uncovered the neuropathological mechanisms ofESRD. The brain interconnects a large amount of neuronsand neural fibers, and the risk factors of renal diseases mightalso impair brain functions without selection. However, braindysfunctions of ESRD patients in full brain level and theircorresponding risk factors are still unclear.
Full brain functional connectivity analysis has been widelyused in fMRI studies, for neurological disorders such asAlzheimer’s disease (AD), epilepsy, schizophrenia, hepaticencephalopathy, and others (Xie and He 2012; Madhavanet al. 2013; Venkataraman et al. 2012; Rocca et al. 2010;Zhang et al. 2012). In this paper, our hypothesis was thatESRD patients could have altered brain functional connectiv-ity, which may be associated with their cognitive and psychi-atry situations. We further assumed that these disrupted func-tional connectivity were related with the blood toxins, theprevalence of anemia, and ion concentrations secondary tohemodialysis. Our goal was to use rs-fMRI to assess changesin whole brain functional connectivity in ERSD patients un-dergoing hemodialysis, and to look for the relationship be-tween these alterations, and neuropsychological tests andblood biochemistry tests.
Materials and methods
Subjects
This retrospective study was approved by the local institution-al review board and was conducted in compliance with Health
778 Metab Brain Dis (2014) 29:777–786
Author's personal copy
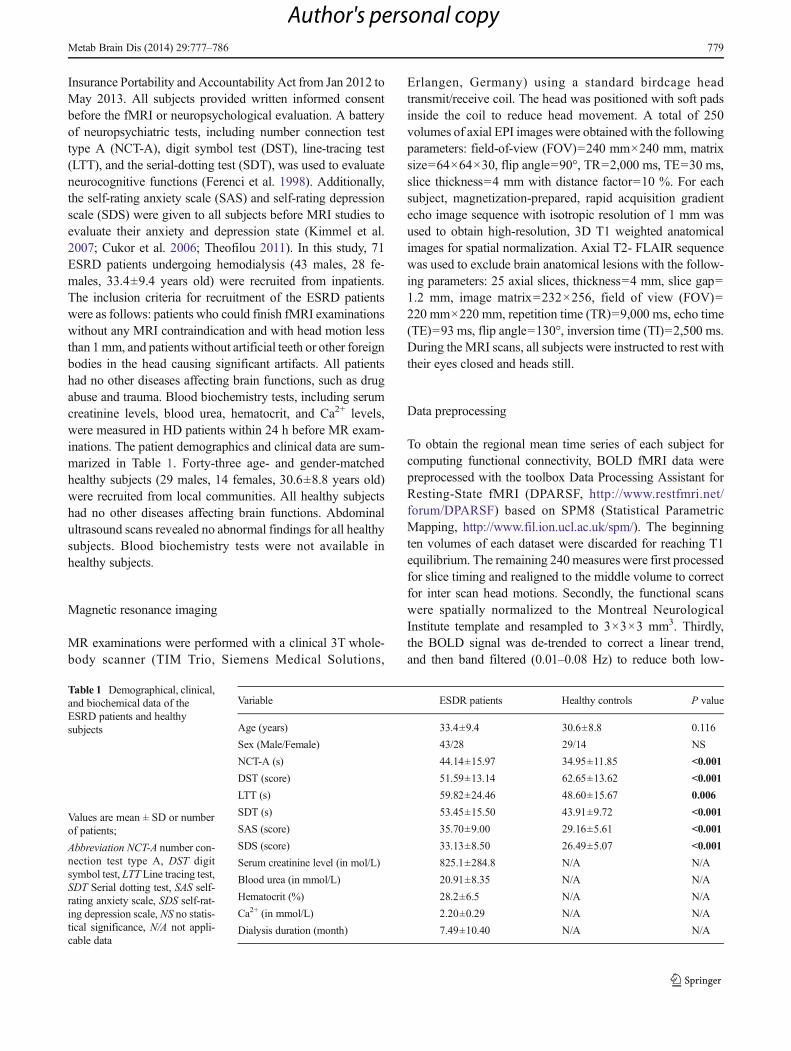
Insurance Portability and Accountability Act from Jan 2012 toMay 2013. All subjects provided written informed consentbefore the fMRI or neuropsychological evaluation. A batteryof neuropsychiatric tests, including number connection testtype A (NCT-A), digit symbol test (DST), line-tracing test(LTT), and the serial-dotting test (SDT), was used to evaluateneurocognitive functions (Ferenci et al. 1998). Additionally,the self-rating anxiety scale (SAS) and self-rating depressionscale (SDS) were given to all subjects before MRI studies toevaluate their anxiety and depression state (Kimmel et al.2007; Cukor et al. 2006; Theofilou 2011). In this study, 71ESRD patients undergoing hemodialysis (43 males, 28 fe-males, 33.4±9.4 years old) were recruited from inpatients.The inclusion criteria for recruitment of the ESRD patientswere as follows: patients who could finish fMRI examinationswithout any MRI contraindication and with head motion lessthan 1mm, and patients without artificial teeth or other foreignbodies in the head causing significant artifacts. All patientshad no other diseases affecting brain functions, such as drugabuse and trauma. Blood biochemistry tests, including serumcreatinine levels, blood urea, hematocrit, and Ca2+ levels,were measured in HD patients within 24 h before MR exam-inations. The patient demographics and clinical data are sum-marized in Table 1. Forty-three age- and gender-matchedhealthy subjects (29 males, 14 females, 30.6±8.8 years old)were recruited from local communities. All healthy subjectshad no other diseases affecting brain functions. Abdominalultrasound scans revealed no abnormal findings for all healthysubjects. Blood biochemistry tests were not available inhealthy subjects.
Magnetic resonance imaging
MR examinations were performed with a clinical 3T whole-body scanner (TIM Trio, Siemens Medical Solutions,
Erlangen, Germany) using a standard birdcage headtransmit/receive coil. The head was positioned with soft padsinside the coil to reduce head movement. A total of 250volumes of axial EPI images were obtained with the followingparameters: field-of-view (FOV)=240 mm×240 mm, matrixsize=64×64×30, flip angle=90°, TR=2,000 ms, TE=30 ms,slice thickness=4 mm with distance factor=10 %. For eachsubject, magnetization-prepared, rapid acquisition gradientecho image sequence with isotropic resolution of 1 mm wasused to obtain high-resolution, 3D T1 weighted anatomicalimages for spatial normalization. Axial T2- FLAIR sequencewas used to exclude brain anatomical lesions with the follow-ing parameters: 25 axial slices, thickness=4 mm, slice gap=1.2 mm, image matrix=232×256, field of view (FOV)=220 mm×220 mm, repetition time (TR)=9,000 ms, echo time(TE)=93 ms, flip angle=130°, inversion time (TI)=2,500 ms.During the MRI scans, all subjects were instructed to rest withtheir eyes closed and heads still.
Data preprocessing
To obtain the regional mean time series of each subject forcomputing functional connectivity, BOLD fMRI data werepreprocessed with the toolbox Data Processing Assistant forResting-State fMRI (DPARSF, http://www.restfmri.net/forum/DPARSF) based on SPM8 (Statistical ParametricMapping, http://www.fil.ion.ucl.ac.uk/spm/). The beginningten volumes of each dataset were discarded for reaching T1equilibrium. The remaining 240measures were first processedfor slice timing and realigned to the middle volume to correctfor inter scan head motions. Secondly, the functional scanswere spatially normalized to the Montreal NeurologicalInstitute template and resampled to 3×3×3 mm3. Thirdly,the BOLD signal was de-trended to correct a linear trend,and then band filtered (0.01–0.08 Hz) to reduce both low-
Table 1 Demographical, clinical,and biochemical data of theESRD patients and healthysubjects
Values are mean ± SD or numberof patients;
Abbreviation NCT-A number con-nection test type A, DST digitsymbol test, LTT Line tracing test,SDT Serial dotting test, SAS self-rating anxiety scale, SDS self-rat-ing depression scale, NS no statis-tical significance, N/A not appli-cable data
Variable ESDR patients Healthy controls P value
Age (years) 33.4±9.4 30.6±8.8 0.116
Sex (Male/Female) 43/28 29/14 NS
NCT-A (s) 44.14±15.97 34.95±11.85 <0.001
DST (score) 51.59±13.14 62.65±13.62 <0.001
LTT (s) 59.82±24.46 48.60±15.67 0.006
SDT (s) 53.45±15.50 43.91±9.72 <0.001
SAS (score) 35.70±9.00 29.16±5.61 <0.001
SDS (score) 33.13±8.50 26.49±5.07 <0.001
Serum creatinine level (in mol/L) 825.1±284.8 N/A N/A
Blood urea (in mmol/L) 20.91±8.35 N/A N/A
Hematocrit (%) 28.2±6.5 N/A N/A
Ca2+ (in mmol/L) 2.20±0.29 N/A N/A
Dialysis duration (month) 7.49±10.40 N/A N/A
Metab Brain Dis (2014) 29:777–786 779
Author's personal copy
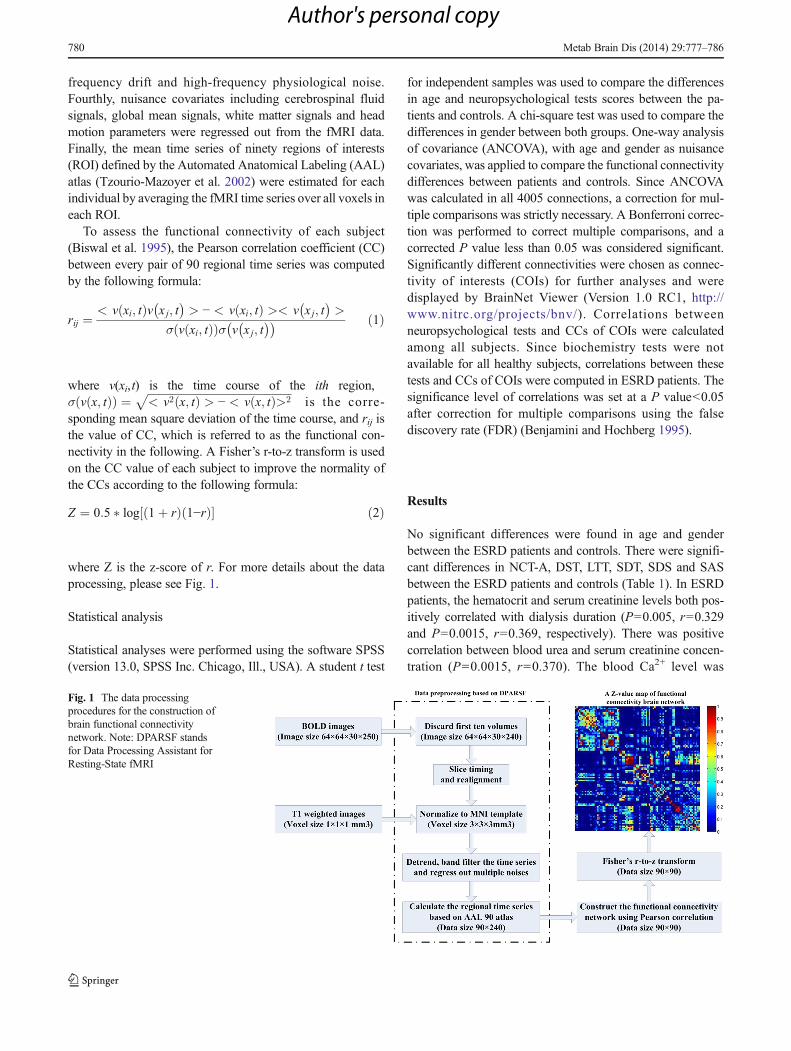
frequency drift and high-frequency physiological noise.Fourthly, nuisance covariates including cerebrospinal fluidsignals, global mean signals, white matter signals and headmotion parameters were regressed out from the fMRI data.Finally, the mean time series of ninety regions of interests(ROI) defined by the Automated Anatomical Labeling (AAL)atlas (Tzourio-Mazoyer et al. 2002) were estimated for eachindividual by averaging the fMRI time series over all voxels ineach ROI.
To assess the functional connectivity of each subject(Biswal et al. 1995), the Pearson correlation coefficient (CC)between every pair of 90 regional time series was computedby the following formula:
rij ¼< v xi; tð Þv x j; t
� �> − < v xi; tð Þ >< v x j; t
� �>
σ v xi; tð Þð Þσ v x j; t� �� � ð1Þ
where v(xi,t) is the time course of the ith region,σ v x; tð Þð Þ ¼ ffiffiffiffiffiffiffiffiffiffiffiffiffiffiffiffiffiffiffiffiffiffiffiffiffiffiffiffiffiffiffiffiffiffiffiffiffiffiffiffiffiffiffiffiffiffiffiffiffiffiffiffi
< v2 x; tð Þ > − < v x; tð Þ>2p
is the corre-sponding mean square deviation of the time course, and rij isthe value of CC, which is referred to as the functional con-nectivity in the following. A Fisher’s r-to-z transform is usedon the CC value of each subject to improve the normality ofthe CCs according to the following formula:
Z ¼ 0:5 � log 1þ rð Þ 1−rð Þ½ � ð2Þ
where Z is the z-score of r. For more details about the dataprocessing, please see Fig. 1.
Statistical analysis
Statistical analyses were performed using the software SPSS(version 13.0, SPSS Inc. Chicago, Ill., USA). A student t test
for independent samples was used to compare the differencesin age and neuropsychological tests scores between the pa-tients and controls. A chi-square test was used to compare thedifferences in gender between both groups. One-way analysisof covariance (ANCOVA), with age and gender as nuisancecovariates, was applied to compare the functional connectivitydifferences between patients and controls. Since ANCOVAwas calculated in all 4005 connections, a correction for mul-tiple comparisons was strictly necessary. A Bonferroni correc-tion was performed to correct multiple comparisons, and acorrected P value less than 0.05 was considered significant.Significantly different connectivities were chosen as connec-tivity of interests (COIs) for further analyses and weredisplayed by BrainNet Viewer (Version 1.0 RC1, http://www.nitrc.org/projects/bnv/). Correlations betweenneuropsychological tests and CCs of COIs were calculatedamong all subjects. Since biochemistry tests were notavailable for all healthy subjects, correlations between thesetests and CCs of COIs were computed in ESRD patients. Thesignificance level of correlations was set at a P value<0.05after correction for multiple comparisons using the falsediscovery rate (FDR) (Benjamini and Hochberg 1995).
Results
No significant differences were found in age and genderbetween the ESRD patients and controls. There were signifi-cant differences in NCT-A, DST, LTT, SDT, SDS and SASbetween the ESRD patients and controls (Table 1). In ESRDpatients, the hematocrit and serum creatinine levels both pos-itively correlated with dialysis duration (P=0.005, r=0.329and P=0.0015, r=0.369, respectively). There was positivecorrelation between blood urea and serum creatinine concen-tration (P=0.0015, r=0.370). The blood Ca2+ level was
Fig. 1 The data processingprocedures for the construction ofbrain functional connectivitynetwork. Note: DPARSF standsfor Data Processing Assistant forResting-State fMRI
780 Metab Brain Dis (2014) 29:777–786
Author's personal copy
positively related with hemotocrit (P=0.008, r=0.314).Correlation between neuropsychological tests and blood bio-chemistry tests was only found between blood urea and SAS(P=0.012, r=0.295).
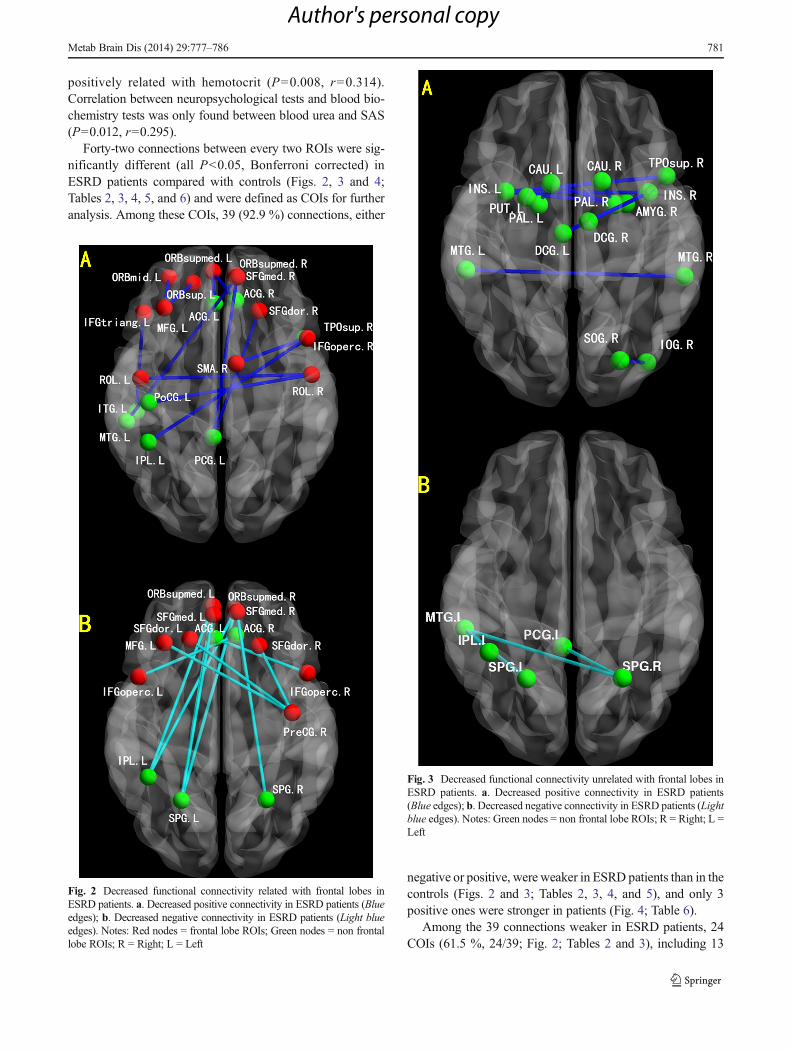
Forty-two connections between every two ROIs were sig-nificantly different (all P<0.05, Bonferroni corrected) inESRD patients compared with controls (Figs. 2, 3 and 4;Tables 2, 3, 4, 5, and 6) and were defined as COIs for furtheranalysis. Among these COIs, 39 (92.9 %) connections, either
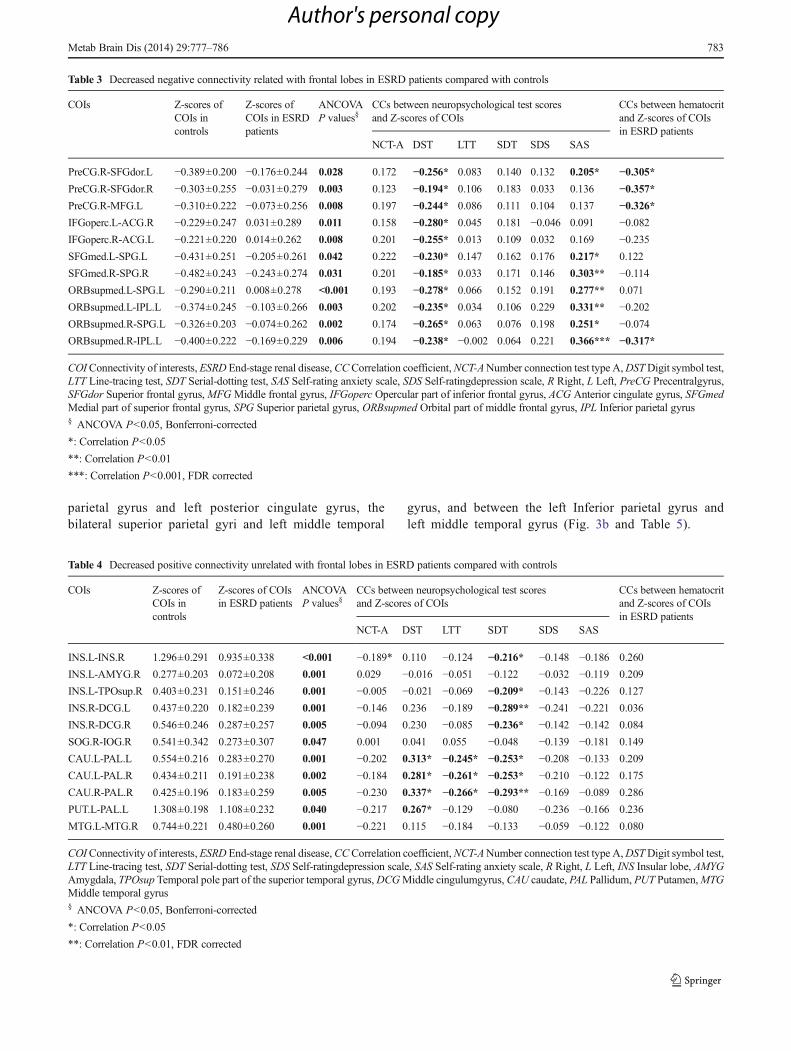
negative or positive, were weaker in ESRD patients than in thecontrols (Figs. 2 and 3; Tables 2, 3, 4, and 5), and only 3positive ones were stronger in patients (Fig. 4; Table 6).
Among the 39 connections weaker in ESRD patients, 24COIs (61.5 %, 24/39; Fig. 2; Tables 2 and 3), including 13
Fig. 2 Decreased functional connectivity related with frontal lobes inESRD patients. a. Decreased positive connectivity in ESRD patients (Blueedges); b. Decreased negative connectivity in ESRD patients (Light blueedges). Notes: Red nodes = frontal lobe ROIs; Green nodes = non frontallobe ROIs; R = Right; L = Left
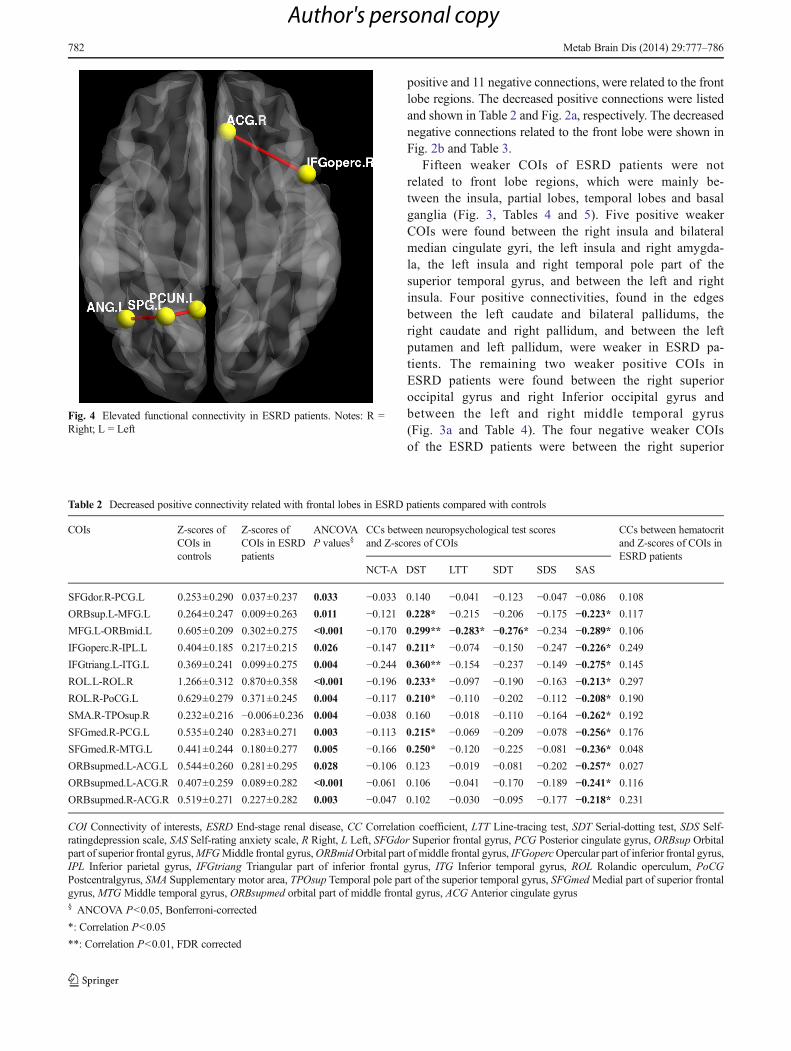
Fig. 3 Decreased functional connectivity unrelated with frontal lobes inESRD patients. a. Decreased positive connectivity in ESRD patients(Blue edges); b. Decreased negative connectivity in ESRD patients (Lightblue edges). Notes: Green nodes = non frontal lobe ROIs; R = Right; L =Left
Metab Brain Dis (2014) 29:777–786 781
Author's personal copy
positive and 11 negative connections, were related to the frontlobe regions. The decreased positive connections were listedand shown in Table 2 and Fig. 2a, respectively. The decreasednegative connections related to the front lobe were shown inFig. 2b and Table 3.
Fifteen weaker COIs of ESRD patients were notrelated to front lobe regions, which were mainly be-tween the insula, partial lobes, temporal lobes and basalganglia (Fig. 3, Tables 4 and 5). Five positive weakerCOIs were found between the right insula and bilateralmedian cingulate gyri, the left insula and right amygda-la, the left insula and right temporal pole part of thesuperior temporal gyrus, and between the left and rightinsula. Four positive connectivities, found in the edgesbetween the left caudate and bilateral pallidums, theright caudate and right pallidum, and between the leftputamen and left pallidum, were weaker in ESRD pa-tients. The remaining two weaker positive COIs inESRD patients were found between the right superioroccipital gyrus and right Inferior occipital gyrus andbetween the left and right middle temporal gyrus(Fig. 3a and Table 4). The four negative weaker COIsof the ESRD patients were between the right superior
Fig. 4 Elevated functional connectivity in ESRD patients. Notes: R =Right; L = Left
Table 2 Decreased positive connectivity related with frontal lobes in ESRD patients compared with controls
COIs Z-scores ofCOIs incontrols
Z-scores ofCOIs in ESRDpatients
ANCOVAP values§
CCs between neuropsychological test scoresand Z-scores of COIs
CCs between hematocritand Z-scores of COIs inESRD patients
NCT-A DST LTT SDT SDS SAS
SFGdor.R-PCG.L 0.253±0.290 0.037±0.237 0.033 −0.033 0.140 −0.041 −0.123 −0.047 −0.086 0.108
ORBsup.L-MFG.L 0.264±0.247 0.009±0.263 0.011 −0.121 0.228* −0.215 −0.206 −0.175 −0.223* 0.117
MFG.L-ORBmid.L 0.605±0.209 0.302±0.275 <0.001 −0.170 0.299** −0.283* −0.276* −0.234 −0.289* 0.106
IFGoperc.R-IPL.L 0.404±0.185 0.217±0.215 0.026 −0.147 0.211* −0.074 −0.150 −0.247 −0.226* 0.249
IFGtriang.L-ITG.L 0.369±0.241 0.099±0.275 0.004 −0.244 0.360** −0.154 −0.237 −0.149 −0.275* 0.145
ROL.L-ROL.R 1.266±0.312 0.870±0.358 <0.001 −0.196 0.233* −0.097 −0.190 −0.163 −0.213* 0.297
ROL.R-PoCG.L 0.629±0.279 0.371±0.245 0.004 −0.117 0.210* −0.110 −0.202 −0.112 −0.208* 0.190
SMA.R-TPOsup.R 0.232±0.216 −0.006±0.236 0.004 −0.038 0.160 −0.018 −0.110 −0.164 −0.262* 0.192
SFGmed.R-PCG.L 0.535±0.240 0.283±0.271 0.003 −0.113 0.215* −0.069 −0.209 −0.078 −0.256* 0.176
SFGmed.R-MTG.L 0.441±0.244 0.180±0.277 0.005 −0.166 0.250* −0.120 −0.225 −0.081 −0.236* 0.048
ORBsupmed.L-ACG.L 0.544±0.260 0.281±0.295 0.028 −0.106 0.123 −0.019 −0.081 −0.202 −0.257* 0.027
ORBsupmed.L-ACG.R 0.407±0.259 0.089±0.282 <0.001 −0.061 0.106 −0.041 −0.170 −0.189 −0.241* 0.116
ORBsupmed.R-ACG.R 0.519±0.271 0.227±0.282 0.003 −0.047 0.102 −0.030 −0.095 −0.177 −0.218* 0.231
COI Connectivity of interests, ESRD End-stage renal disease, CC Correlation coefficient, LTT Line-tracing test, SDT Serial-dotting test, SDS Self-ratingdepression scale, SAS Self-rating anxiety scale, R Right, L Left, SFGdor Superior frontal gyrus, PCG Posterior cingulate gyrus, ORBsup Orbitalpart of superior frontal gyrus,MFGMiddle frontal gyrus,ORBmidOrbital part of middle frontal gyrus, IFGopercOpercular part of inferior frontal gyrus,IPL Inferior parietal gyrus, IFGtriang Triangular part of inferior frontal gyrus, ITG Inferior temporal gyrus, ROL Rolandic operculum, PoCGPostcentralgyrus, SMA Supplementary motor area, TPOsup Temporal pole part of the superior temporal gyrus, SFGmedMedial part of superior frontalgyrus, MTG Middle temporal gyrus, ORBsupmed orbital part of middle frontal gyrus, ACG Anterior cingulate gyrus§ ANCOVA P<0.05, Bonferroni-corrected
*: Correlation P<0.05
**: Correlation P<0.01, FDR corrected
782 Metab Brain Dis (2014) 29:777–786
Author's personal copy
parietal gyrus and left posterior cingulate gyrus, thebilateral superior parietal gyri and left middle temporal
gyrus, and between the left Inferior parietal gyrus andleft middle temporal gyrus (Fig. 3b and Table 5).
Table 3 Decreased negative connectivity related with frontal lobes in ESRD patients compared with controls
COIs Z-scores ofCOIs incontrols
Z-scores ofCOIs in ESRDpatients
ANCOVAP values§
CCs between neuropsychological test scoresand Z-scores of COIs
CCs between hematocritand Z-scores of COIsin ESRD patients
NCT-A DST LTT SDT SDS SAS
PreCG.R-SFGdor.L −0.389±0.200 −0.176±0.244 0.028 0.172 −0.256* 0.083 0.140 0.132 0.205* −0.305*PreCG.R-SFGdor.R −0.303±0.255 −0.031±0.279 0.003 0.123 −0.194* 0.106 0.183 0.033 0.136 −0.357*PreCG.R-MFG.L −0.310±0.222 −0.073±0.256 0.008 0.197 −0.244* 0.086 0.111 0.104 0.137 −0.326*IFGoperc.L-ACG.R −0.229±0.247 0.031±0.289 0.011 0.158 −0.280* 0.045 0.181 −0.046 0.091 −0.082IFGoperc.R-ACG.L −0.221±0.220 0.014±0.262 0.008 0.201 −0.255* 0.013 0.109 0.032 0.169 −0.235SFGmed.L-SPG.L −0.431±0.251 −0.205±0.261 0.042 0.222 −0.230* 0.147 0.162 0.176 0.217* 0.122
SFGmed.R-SPG.R −0.482±0.243 −0.243±0.274 0.031 0.201 −0.185* 0.033 0.171 0.146 0.303** −0.114ORBsupmed.L-SPG.L −0.290±0.211 0.008±0.278 <0.001 0.193 −0.278* 0.066 0.152 0.191 0.277** 0.071
ORBsupmed.L-IPL.L −0.374±0.245 −0.103±0.266 0.003 0.202 −0.235* 0.034 0.106 0.229 0.331** −0.202ORBsupmed.R-SPG.L −0.326±0.203 −0.074±0.262 0.002 0.174 −0.265* 0.063 0.076 0.198 0.251* −0.074ORBsupmed.R-IPL.L −0.400±0.222 −0.169±0.229 0.006 0.194 −0.238* −0.002 0.064 0.221 0.366*** −0.317*
COIConnectivity of interests, ESRD End-stage renal disease,CCCorrelation coefficient,NCT-ANumber connection test type A,DSTDigit symbol test,LTT Line-tracing test, SDT Serial-dotting test, SAS Self-rating anxiety scale, SDS Self-ratingdepression scale, R Right, L Left, PreCG Precentralgyrus,SFGdor Superior frontal gyrus,MFGMiddle frontal gyrus, IFGoperc Opercular part of inferior frontal gyrus, ACG Anterior cingulate gyrus, SFGmedMedial part of superior frontal gyrus, SPG Superior parietal gyrus, ORBsupmed Orbital part of middle frontal gyrus, IPL Inferior parietal gyrus§ ANCOVA P<0.05, Bonferroni-corrected
*: Correlation P<0.05
**: Correlation P<0.01
***: Correlation P<0.001, FDR corrected
Table 4 Decreased positive connectivity unrelated with frontal lobes in ESRD patients compared with controls
COIs Z-scores ofCOIs incontrols
Z-scores of COIsin ESRD patients
ANCOVAP values§
CCs between neuropsychological test scoresand Z-scores of COIs
CCs between hematocritand Z-scores of COIsin ESRD patients
NCT-A DST LTT SDT SDS SAS
INS.L-INS.R 1.296±0.291 0.935±0.338 <0.001 −0.189* 0.110 −0.124 −0.216* −0.148 −0.186 0.260
INS.L-AMYG.R 0.277±0.203 0.072±0.208 0.001 0.029 −0.016 −0.051 −0.122 −0.032 −0.119 0.209
INS.L-TPOsup.R 0.403±0.231 0.151±0.246 0.001 −0.005 −0.021 −0.069 −0.209* −0.143 −0.226 0.127
INS.R-DCG.L 0.437±0.220 0.182±0.239 0.001 −0.146 0.236 −0.189 −0.289** −0.241 −0.221 0.036
INS.R-DCG.R 0.546±0.246 0.287±0.257 0.005 −0.094 0.230 −0.085 −0.236* −0.142 −0.142 0.084
SOG.R-IOG.R 0.541±0.342 0.273±0.307 0.047 0.001 0.041 0.055 −0.048 −0.139 −0.181 0.149
CAU.L-PAL.L 0.554±0.216 0.283±0.270 0.001 −0.202 0.313* −0.245* −0.253* −0.208 −0.133 0.209
CAU.L-PAL.R 0.434±0.211 0.191±0.238 0.002 −0.184 0.281* −0.261* −0.253* −0.210 −0.122 0.175
CAU.R-PAL.R 0.425±0.196 0.183±0.259 0.005 −0.230 0.337* −0.266* −0.293** −0.169 −0.089 0.286
PUT.L-PAL.L 1.308±0.198 1.108±0.232 0.040 −0.217 0.267* −0.129 −0.080 −0.236 −0.166 0.236
MTG.L-MTG.R 0.744±0.221 0.480±0.260 0.001 −0.221 0.115 −0.184 −0.133 −0.059 −0.122 0.080
COIConnectivity of interests, ESRD End-stage renal disease,CCCorrelation coefficient,NCT-ANumber connection test type A,DSTDigit symbol test,LTT Line-tracing test, SDT Serial-dotting test, SDS Self-ratingdepression scale, SAS Self-rating anxiety scale, R Right, L Left, INS Insular lobe, AMYGAmygdala, TPOsup Temporal pole part of the superior temporal gyrus,DCGMiddle cingulumgyrus, CAU caudate, PAL Pallidum, PUT Putamen,MTGMiddle temporal gyrus§ ANCOVA P<0.05, Bonferroni-corrected
*: Correlation P<0.05
**: Correlation P<0.01, FDR corrected
Metab Brain Dis (2014) 29:777–786 783
Author's personal copy
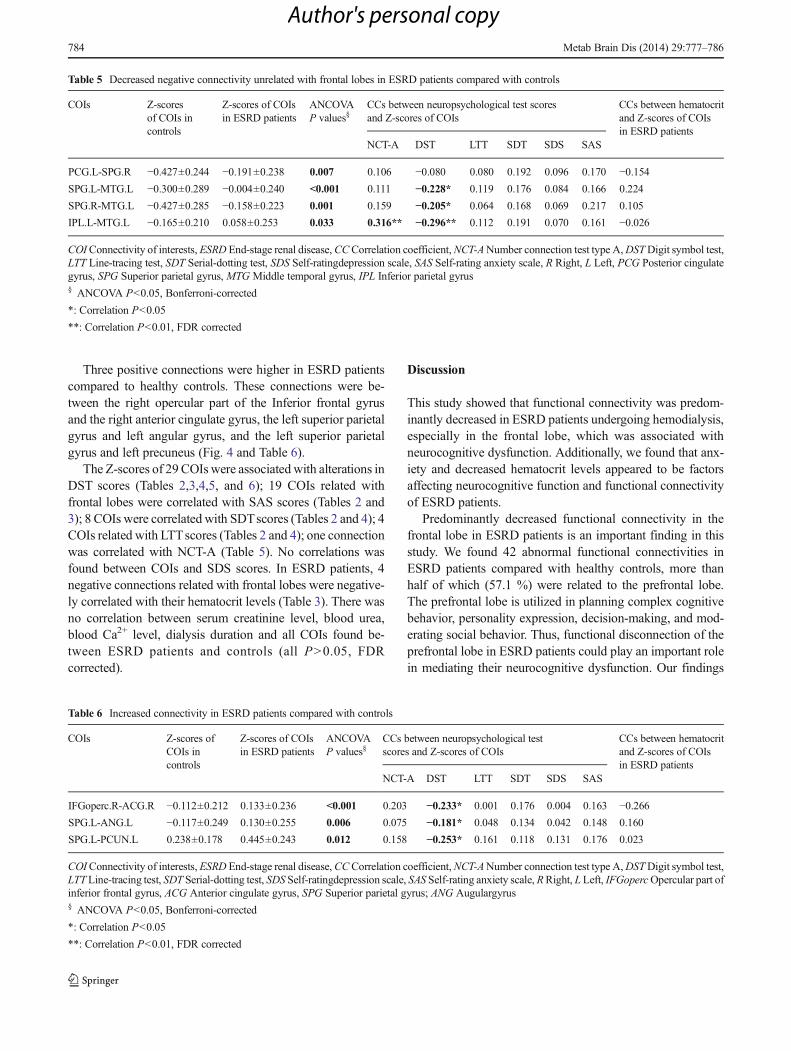
Three positive connections were higher in ESRD patientscompared to healthy controls. These connections were be-tween the right opercular part of the Inferior frontal gyrusand the right anterior cingulate gyrus, the left superior parietalgyrus and left angular gyrus, and the left superior parietalgyrus and left precuneus (Fig. 4 and Table 6).
The Z-scores of 29 COIs were associated with alterations inDST scores (Tables 2,3,4,5, and 6); 19 COIs related withfrontal lobes were correlated with SAS scores (Tables 2 and3); 8 COIs were correlated with SDTscores (Tables 2 and 4); 4COIs related with LTTscores (Tables 2 and 4); one connectionwas correlated with NCT-A (Table 5). No correlations wasfound between COIs and SDS scores. In ESRD patients, 4negative connections related with frontal lobes were negative-ly correlated with their hematocrit levels (Table 3). There wasno correlation between serum creatinine level, blood urea,blood Ca2+ level, dialysis duration and all COIs found be-tween ESRD patients and controls (all P>0.05, FDRcorrected).
Discussion
This study showed that functional connectivity was predom-inantly decreased in ESRD patients undergoing hemodialysis,especially in the frontal lobe, which was associated withneurocognitive dysfunction. Additionally, we found that anx-iety and decreased hematocrit levels appeared to be factorsaffecting neurocognitive function and functional connectivityof ESRD patients.
Predominantly decreased functional connectivity in thefrontal lobe in ESRD patients is an important finding in thisstudy. We found 42 abnormal functional connectivities inESRD patients compared with healthy controls, more thanhalf of which (57.1 %) were related to the prefrontal lobe.The prefrontal lobe is utilized in planning complex cognitivebehavior, personality expression, decision-making, and mod-erating social behavior. Thus, functional disconnection of theprefrontal lobe in ESRD patients could play an important rolein mediating their neurocognitive dysfunction. Our findings
Table 5 Decreased negative connectivity unrelated with frontal lobes in ESRD patients compared with controls
COIs Z-scoresof COIs incontrols
Z-scores of COIsin ESRD patients
ANCOVAP values§
CCs between neuropsychological test scoresand Z-scores of COIs
CCs between hematocritand Z-scores of COIsin ESRD patients
NCT-A DST LTT SDT SDS SAS
PCG.L-SPG.R −0.427±0.244 −0.191±0.238 0.007 0.106 −0.080 0.080 0.192 0.096 0.170 −0.154SPG.L-MTG.L −0.300±0.289 −0.004±0.240 <0.001 0.111 −0.228* 0.119 0.176 0.084 0.166 0.224
SPG.R-MTG.L −0.427±0.285 −0.158±0.223 0.001 0.159 −0.205* 0.064 0.168 0.069 0.217 0.105
IPL.L-MTG.L −0.165±0.210 0.058±0.253 0.033 0.316** −0.296** 0.112 0.191 0.070 0.161 −0.026
COIConnectivity of interests, ESRD End-stage renal disease,CCCorrelation coefficient,NCT-ANumber connection test type A,DSTDigit symbol test,LTT Line-tracing test, SDT Serial-dotting test, SDS Self-ratingdepression scale, SAS Self-rating anxiety scale, R Right, L Left, PCG Posterior cingulategyrus, SPG Superior parietal gyrus, MTG Middle temporal gyrus, IPL Inferior parietal gyrus§ ANCOVA P<0.05, Bonferroni-corrected
*: Correlation P<0.05
**: Correlation P<0.01, FDR corrected
Table 6 Increased connectivity in ESRD patients compared with controls
COIs Z-scores ofCOIs incontrols
Z-scores of COIsin ESRD patients
ANCOVAP values§
CCs between neuropsychological testscores and Z-scores of COIs
CCs between hematocritand Z-scores of COIsin ESRD patients
NCT-A DST LTT SDT SDS SAS
IFGoperc.R-ACG.R −0.112±0.212 0.133±0.236 <0.001 0.203 −0.233* 0.001 0.176 0.004 0.163 −0.266SPG.L-ANG.L −0.117±0.249 0.130±0.255 0.006 0.075 −0.181* 0.048 0.134 0.042 0.148 0.160
SPG.L-PCUN.L 0.238±0.178 0.445±0.243 0.012 0.158 −0.253* 0.161 0.118 0.131 0.176 0.023
COIConnectivity of interests, ESRD End-stage renal disease,CCCorrelation coefficient,NCT-ANumber connection test type A,DSTDigit symbol test,LTTLine-tracing test, SDT Serial-dotting test, SDS Self-ratingdepression scale, SAS Self-rating anxiety scale,RRight, LLeft, IFGopercOpercular part ofinferior frontal gyrus, ACG Anterior cingulate gyrus, SPG Superior parietal gyrus; ANG Augulargyrus§ ANCOVA P<0.05, Bonferroni-corrected
*: Correlation P<0.05
**: Correlation P<0.01, FDR corrected
784 Metab Brain Dis (2014) 29:777–786
Author's personal copy
were also supported by the behavioral and neuroimagingstudies (Kim et al. 2011). Previous behavioral studies havedemonstrated that ESRD patients had neuropsychologicaldeficits such as attention, speed, learning and memory, anddecision-making, typical of medial prefrontal lobe dysfunc-tions (Burn and Bates 1998; Madan et al. 2007; Elias et al.2009; Giang et al. 2011; Raphael et al. 2012). Neuroimagingstudies also indicated the medial prefrontal lobe was ofteninvolved in the ESRD patients. ERSD patients had an abnor-mally distributed perfusion pattern, which is characterized bysignificantly decreased cerebral blood flow in the frontalcortex and thalamus and increased cerebral blood flow in theoccipital lobe, which correlated with cognitive test resultssuch as the Mini Mental State Examination and MattisDementia Rating Scale (Fazekas et al. 1996). Kamata et al.indicated frontal lobe atrophy in patients on hemodialysis for10 years or more was significantly greater than in patientsdialyzed for less than 10 years (Kamata et al. 2000). Ourfindings on the predominantly decreased functional connec-tivity of medial prefrontal lobe appeared specific for ESRDpatients, which is different from other metabolic brain disease,such as hepatic encephalopathy. In one previous study ofminimal hepatic encephalopathy, functional connectivity ab-normalities of the basal ganglia-thalamocortical circuit werefound, although widespread cortical and subcortical networkconnectivity changes were observed (Zhang et al. 2012). Wedid find the disrupted functional connection of the basalganglia in ESRD patients; however, these abnormal functionalconnections are within basal ganglia rather than between basalganglia and other cortical regions. In short, decreased prefron-tal lobe connectivity could be the typical and specific meta-bolic brain disorders in patients with ESRD.
We found that altered functional connectivity in ESRDpatients was associated with neuropsychological tests results,especially the DST. The DST is widely used to evaluateattention and psychomotor speed (Bajaj et al. 2009). Bycontrast, the NCT-A is a test of visual-spatial orientation andpsychomotor speed. Our finding indicates that the DST ap-pears to be more sensitive towards predicting the cognitivedysfunction in ESRD patients. The DST was correlated with29 functional connectivities of ESRD patients, indicatingfunctional connectivity abnormality could reflectneurocognitive deficits in ESRD patients. However, it is ratherdifficult to uncover the causes of neurocognitive dysfunctionin this study because we also found that anxiety was associ-ated with functional connectivity in these ESRD patients. Thisindicates that mood can have a negative role in cognitivedysfunction (Kimmel et al. 2007; Cukor et al. 2006;Theofilou 2011).
We found hematocrit rather than serum creatinine level,blood urea, and dialysis duration were associated with alteredfunctional connectivity in ESRD patients. Decreased hemato-crit can lead to decreased brain oxygen delivery, with a
detrimental effect on brain metabolism (Pereira et al. 2005).Anemia in patients with ESRD has been associated withcognitive dysfunction, and neuropsychological and neuro-physiological tests have shown improvement with the treat-ment of anemia in ESRD patients (Radić et al. 2010). Kamataet al. reported that there was a significant negative correlationbetween brain atrophy index and hematocrit (Kamata et al.2000). Our patients had significantly decreased hematocritrelative to reference values. It is possible that decreased he-matocrit caused low oxygen delivery and altered functionalconnectivity, contributing to cognitive dysfunction.
We acknowledge several limitations in our study. First, wedid not investigate specifically whether the patients with andwithout cognitive dysfunction had different whole brain func-tional connectivity patterns because no CKD patients withoutESRD was included in current study. However, we believe adifference is expected. Second, among the battery of neuro-psychological tests we performed, none were global for theevaluation of cognitive function of ESRD patients. Detailedand comprehensive evaluation of cognitive function is need-ed. Third, although altered functional connectivity in ESRDpatients was observed in this study, we believe explorations ofthe causes of altered functional connectivity are needed infuture studies because of many coexist factors, such as anxietyand lower hematocrit level. Last, no blood tests were per-formed for our controls; thus, no available data were usedfor them.
In conclusion, our study indicated that functional connec-tivities were predominantly decreased in ESRD patients un-dergoing hemodialysis, especially for the frontal lobe, whichwas associated with neurocognitive dysfunction, anxiety, anddecreased hematocrit. It is possible to improve ESRD patients’cognitive function through mitigating anxiety and treatinganemia.
Conflict of interest The authors disclose no conflicts.
Funding Supported by grants from National Natural ScienceFoundation of China (grant No. 81101039 to G.Z., grants No.81322020, 81230032, and 81171313 to L.J.Z.), the Program for NewCentury Excellent Talents in the University (NCET-12-0260 to L.J.Z.),and China Postdoctoral Science Foundation of Jiangsu Province (grantNo. 1002083C to G.Z.).
References
Bajaj JS, Wade JB, Sanyal AJ (2009) Spectrum of neurocognitive im-pairment in cirrhosis: Implications for the assessment of hepaticencephalopathy. Hepatology 50(6):2014–2021
Benjamini Y, Hochberg Y (1995) Controlling the false discovery rate: apractical and powerful approach to multiple testing. J R Stat Soc SerB Methodol 57(1):289–300
Metab Brain Dis (2014) 29:777–786 785
Author's personal copy
Biswal B, Yetkin FZ, Haughton VM, Hyde JS (1995) Functional con-nectivity in the motor cortex of resting human brain using echo-planar MRI. Magn Reson Med 34(4):537–541
Bugnicourt JM, Godefroy O, Chillon JM, Choukroun G, Massy ZA(2013) Cognitive disorders and dementia in CKD: the neglectedkidney-brain axis. J Am Soc Nephrol 24(3):353–363
Burn DJ, Bates D (1998) Neurology and the kidney. J Neurol NeurosurgPsychiatr 65(6):810–821
Chou MC, Hsieh TJ, Lin YL, et al. (2013) Widespread white matteralterations in patients with end-stage renal disease: A voxelwisediffusion tensor imaging study. AJNR Am J Neuroradiol. Jun 20.[Epub ahead of print] PMID:23788598
Collins AJ, Foley RN, Herzog C et al (2011) US renal data system 2010annual data report. Am J Kidney Dis 57(A8):e1–e526
Cukor D, Peterson RA, Cohen SD, Kimmel PL (2006) Depression in end-stage renal disease hemodialysis patients. Nat Clin Pract Nephrol2(12):678–687
Elias MF, Elias PK, Seliger SL, Narsipur SS, Dore GA, Robbins MA(2009) Chronic kidney disease, creatinine and cognitive functioning.Nephrol Dial Transplant 24(8):2446–2452
Fazekas G, Fazekas F, Schmidt R et al (1996) Pattern of cerebral bloodflow and cognition in patients undergoing chronic haemodialysistreatment. Nucl Med Commun 17(7):603–608
Ferenci P, Lockwood A, Mullen K et al (1998) Hepatic encephalopathy–definition, nomenclature, diagnosis, and quantification: final reportof the working party at the 11th World Congresses ofGastroenterology, Vienna. Hepatology 35(3):716–721
Giang LM, Weiner DE, Agganis BT et al (2011) Cognitive function anddialysis adequacy: no clear relationship. Am J Nephrol 33(1):33–38
Hsieh TJ, Chang JM, Chuang HY et al (2009) End-stage renal disease:in vivo diffusion-tensor imaging of silent white matter damage.Radiology 252(2):518–525
Hsu CY, McCulloch CE, Curhan GC (2002) Epidemiology of anemiaassociated with chronic renal insufficiency among adults in theUnited States: results from the Third National Health and NutritionExamination Survey. J Am Soc Nephrol 13(2):504–510
Kamata T, Hishida A, Takita T et al (2000) Morphologic abnormalities inthe brain of chronically hemodialyzed patients without cerebrovas-cular disease. Am J Nephrol 20(1):27–31
Kim HS, Park JW, Bai DS et al (2011) Diffusion tensor imaging findingsin neurologically asymptomatic patients with end stage renal dis-ease. Neuro Rehabil 29(1):111–116
Kimmel PL, Cukor D, Cohen SD et al (2007) Depression in end-stagerenal disease patients: a critical review. Adv Chron Kidney Dis14(4):328–334
Kirschbaum B (2004) Effect of high bicarbonate hemodialysis on ionizedcalcium and risk of metastatic calcification. Clin Chim Acta 343(1–2):231–236
Liang X, Wen J, Ni L et al (2013) Altered pattern of spontaneous brainactivity in the patients with end-stage renal disease: a resting-statefunctional MRI study with regional homogeneity analysis. PLoSOne 8(8):e71507
Madan P, Kalra OP, Agarwal S et al (2007) Cognitive impairment inchronic kidney disease. Nephrol Dial Transplant 22(2):440–444
Madhavan D, Heinrichs-Graham E, Wilson TW (2013) Whole-brainfunctional connectivity increases with extended duration of focalepileptiform activity. Neurosci Lett 542:26–29
Meyer TW, Hostetter TH (2007) Uremia. N Engl J Med 357:1316–1325Pereira AA,Weiner DE, Scott Tet al (2005) Cognitive function in dialysis
patients. Am J Kidney Dis 45(3):448–462Prohovnik I, Post J, Uribarri J et al (2007) Cerebrovascular effects of
hemodialysis in chronic kidney disease. J Cereb Blood Flow Metab27(11):1861–1869
Radić J, Ljutić D, Radić M et al (2010) The possible impact of dialysismodality on cognitive function in chronic dialysis patients. Neth JMed 68(4):153–157
Raphael KL,Wei G, Greene Tet al (2012) Cognitive function and the riskof death in chronic kidney disease. Am J Nephrol 35(1):49–57
Rocca MA, Absinta M, Moiola L et al (2010) Functional and structuralconnectivity of the motor network in pediatric and adult-onsetrelapsing-remitting multiple sclerosis. Radiology 254(2):541–550
Theofilou P (2011) Depression and anxiety in patients with chronic renalfailure: the effect of sociodemographic characteristics. Int J Nephrol2011:514070
Tzourio-Mazoyer N, Landeau B, Papathanassiou D et al (2002)Automated anatomical labeling of activations in SPM using a mac-roscopic anatomical parcellation of the MNI MRI single-subjectbrain. NeuroImage 15(1):273–289
Venkataraman A, Whitford TJ, Westin CF et al (2012) Whole brainresting state functional connectivity abnormalities in schizophrenia.Schizophr Res 139(1–3):7–12
Xie T, He Y (2012) Mapping the Alzheimer’s brain with connectomics.Front Psychiatry 2:77
Zhang LJ, Zheng G, Zhang L et al (2012) Altered brain functionalconnectivity in patients with cirrhosis and minimal hepatic enceph-alopathy: a functional MR imaging study. Radiology 265(2):528–536
Zhang LJ,Wen J, Ni L, et al. (2013) Predominant graymatter volume lossin patients with end-stage renal disease: a voxel-based morphometrystudy. Metab Brain Dis 28(4):647–654
786 Metab Brain Dis (2014) 29:777–786
Author's personal copy
View publication statsView publication stats
Related Documents