Business Process Improvement also known as Process Mapping, Lean, Kaizen…. Ken DeVane [email protected] Quality Initiatives 1

Welcome message from author
This document is posted to help you gain knowledge. Please leave a comment to let me know what you think about it! Share it to your friends and learn new things together.
Transcript

Business Process Improvement also known as
Process Mapping, Lean, Kaizen….
Ken DeVane
Quality Initiatives 1
K. DeVane
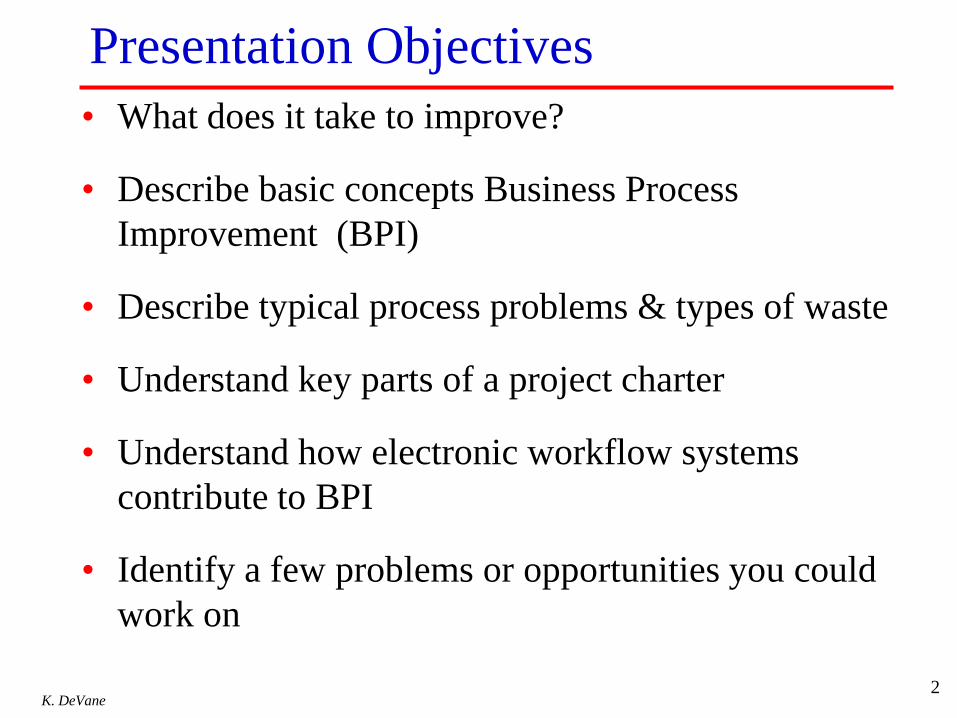
Presentation Objectives
• What does it take to improve?
• Describe basic concepts Business Process
Improvement (BPI)
• Describe typical process problems & types of waste
• Understand key parts of a project charter
• Understand how electronic workflow systems
contribute to BPI
• Identify a few problems or opportunities you could
work on
2

K. DeVane 3
Home Remodel
K. DeVane
Quiz: Home Remodel & BPI
• What does it really take to get it done?
• How many people need to be involved?
• What skills do the people need to have?
• What tools will they need?
• How long is it going to take?
4
K. DeVane 5
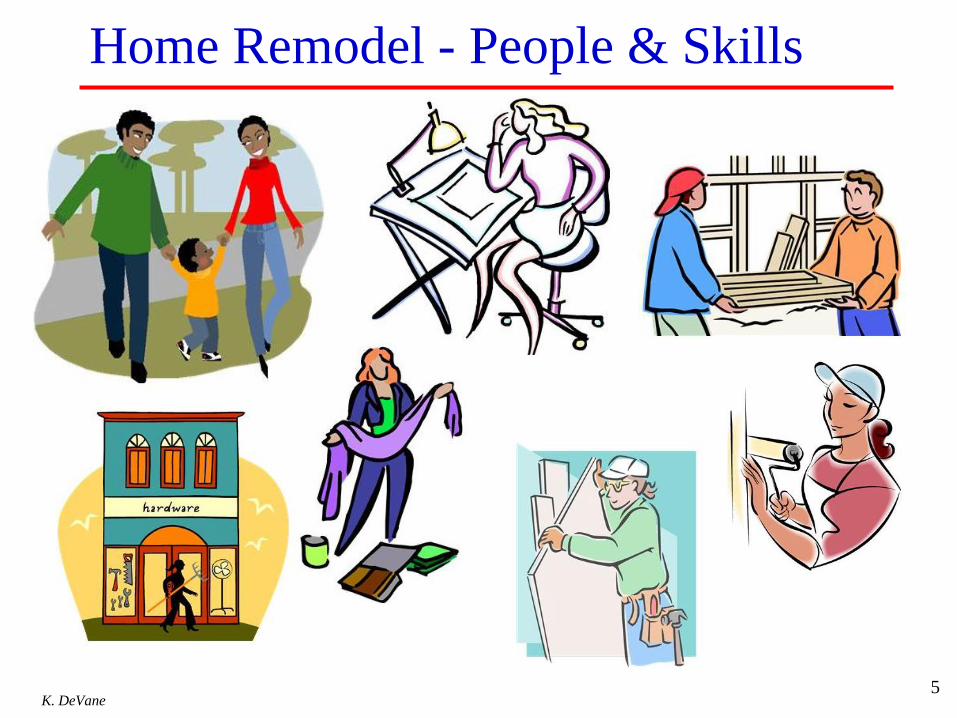
Home Remodel - People & Skills
K. DeVane
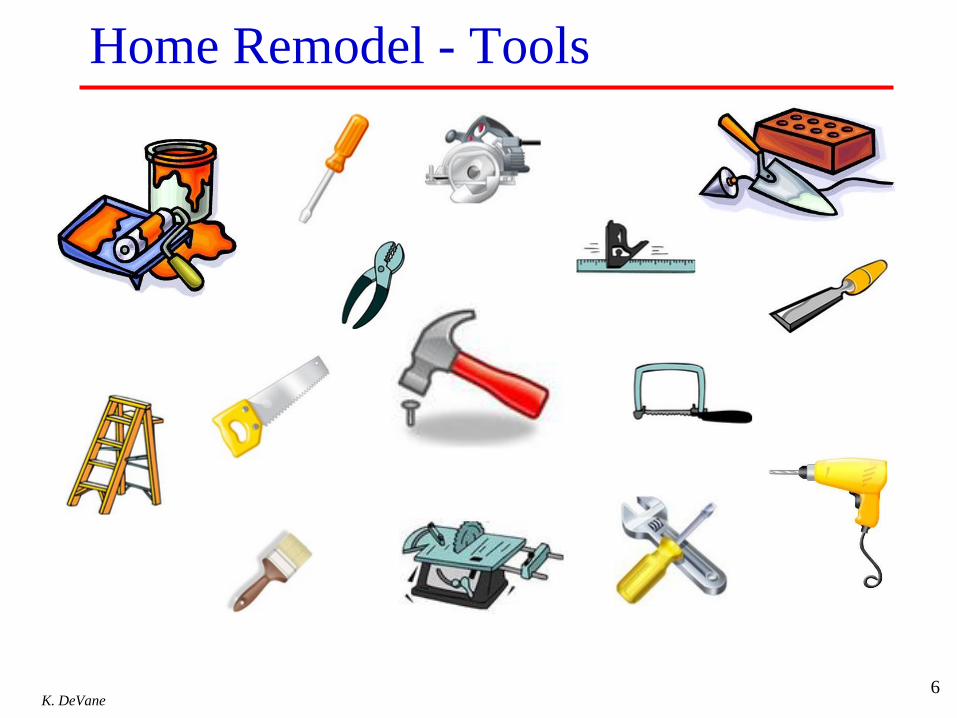
Home Remodel - Tools
6
K. DeVane
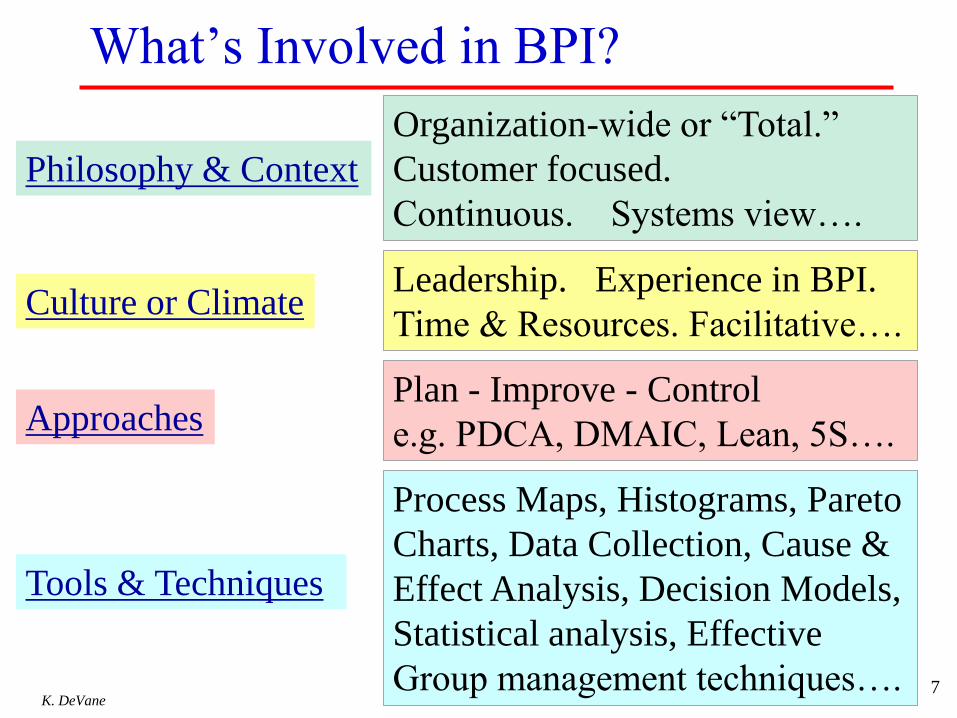
What’s Involved in BPI?
7
Philosophy & Context
Approaches
Tools & Techniques
Culture or Climate
Organization-wide or “Total.”
Customer focused.
Continuous. Systems view….
Plan - Improve - Control
e.g. PDCA, DMAIC, Lean, 5S….
Process Maps, Histograms, Pareto
Charts, Data Collection, Cause &
Effect Analysis, Decision Models,
Statistical analysis, Effective
Group management techniques….
Leadership. Experience in BPI.
Time & Resources. Facilitative….
K. DeVane
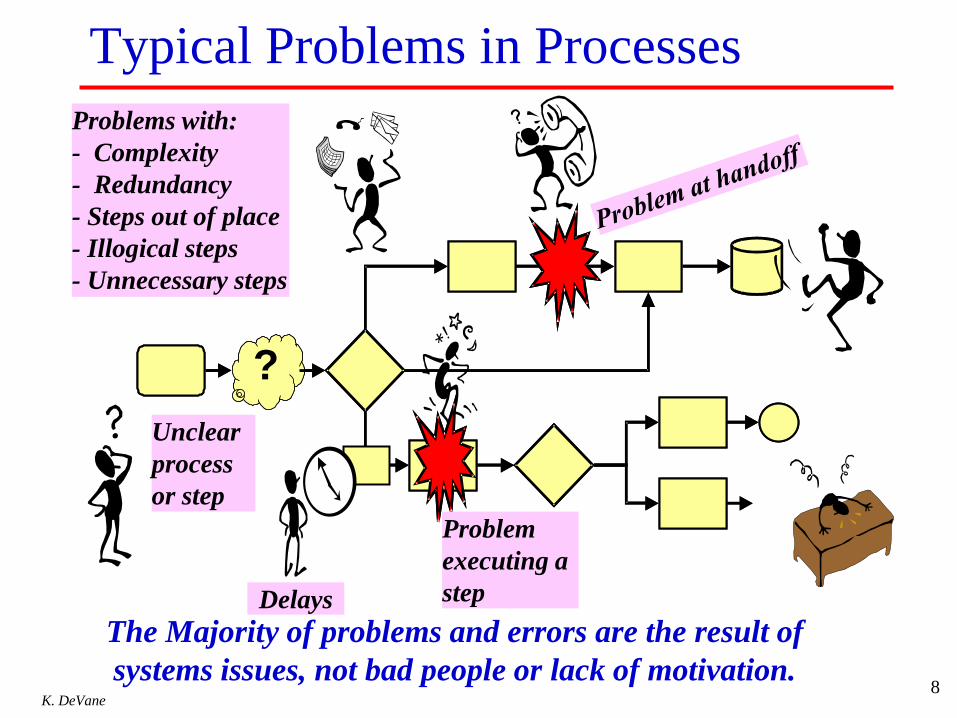
Typical Problems in Processes
8
The Majority of problems and errors are the result of
systems issues, not bad people or lack of motivation.
?
Problem
executing a
step
Unclear
process
or step
?
Delays
Problems with:
- Complexity
- Redundancy
- Steps out of place
- Illogical steps
- Unnecessary steps
K. DeVane 9
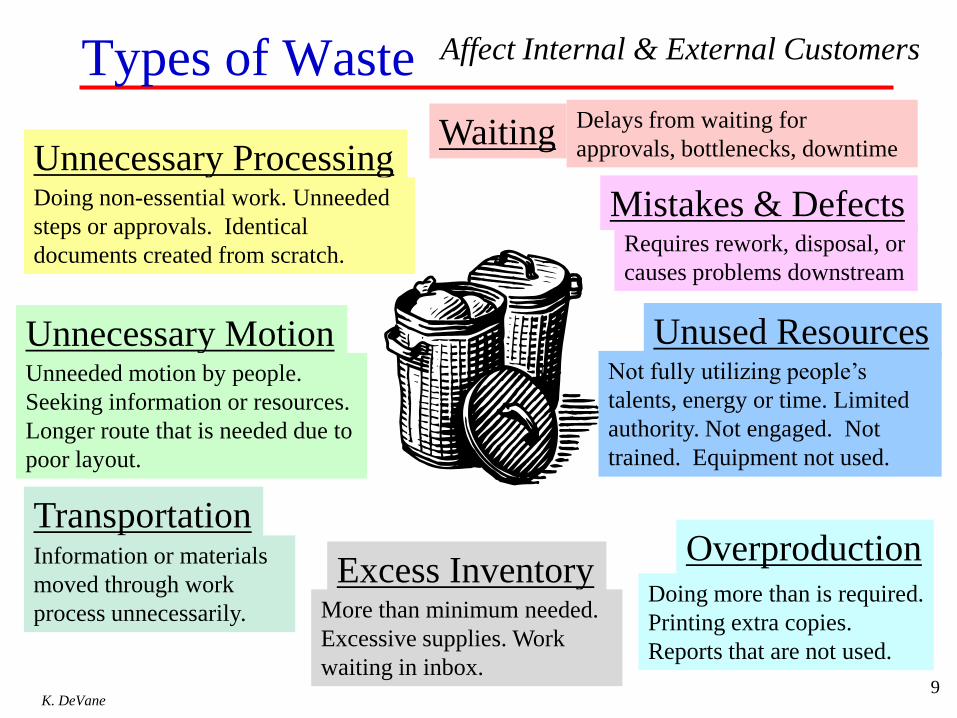
Types of Waste
Waiting
Excess Inventory
Unused Resources
Mistakes & Defects
Overproduction
Unnecessary Motion
Unnecessary Processing
Transportation
Not fully utilizing people’s
talents, energy or time. Limited
authority. Not engaged. Not
trained. Equipment not used.
Delays from waiting for
approvals, bottlenecks, downtime
More than minimum needed.
Excessive supplies. Work
waiting in inbox.
Requires rework, disposal, or
causes problems downstream
Affect Internal & External Customers
Doing non-essential work. Unneeded
steps or approvals. Identical
documents created from scratch.
Unneeded motion by people.
Seeking information or resources.
Longer route that is needed due to
poor layout.
Doing more than is required.
Printing extra copies.
Reports that are not used.
Information or materials
moved through work
process unnecessarily.
K. DeVane
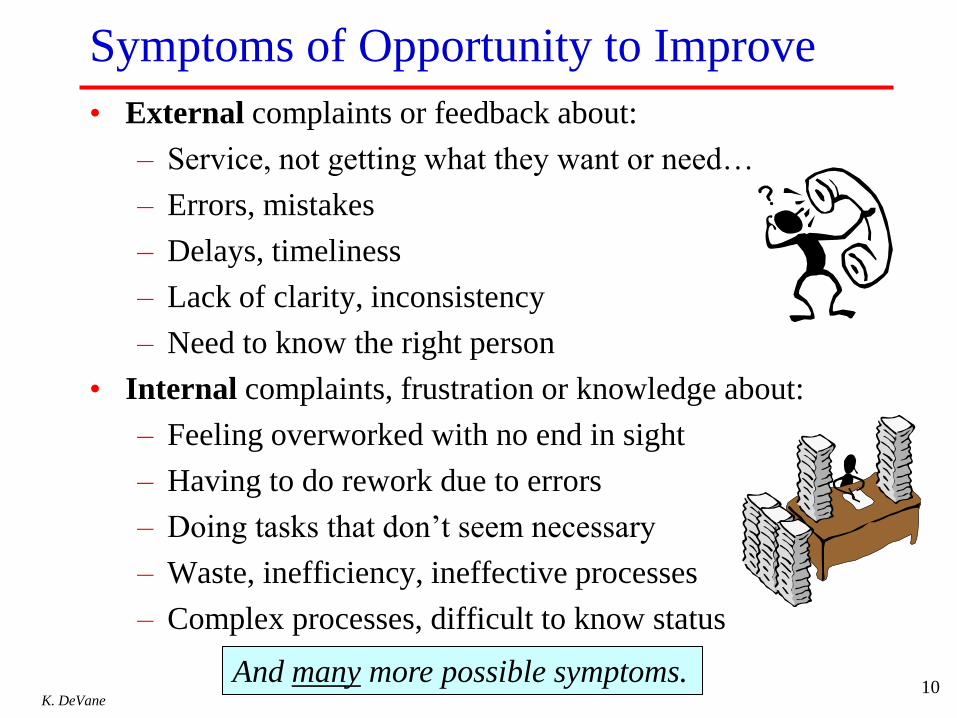
Symptoms of Opportunity to Improve
• External complaints or feedback about:
– Service, not getting what they want or need…
– Errors, mistakes
– Delays, timeliness
– Lack of clarity, inconsistency
– Need to know the right person
• Internal complaints, frustration or knowledge about:
– Feeling overworked with no end in sight
– Having to do rework due to errors
– Doing tasks that don’t seem necessary
– Waste, inefficiency, ineffective processes
– Complex processes, difficult to know status
10
And many more possible symptoms.
K. DeVane
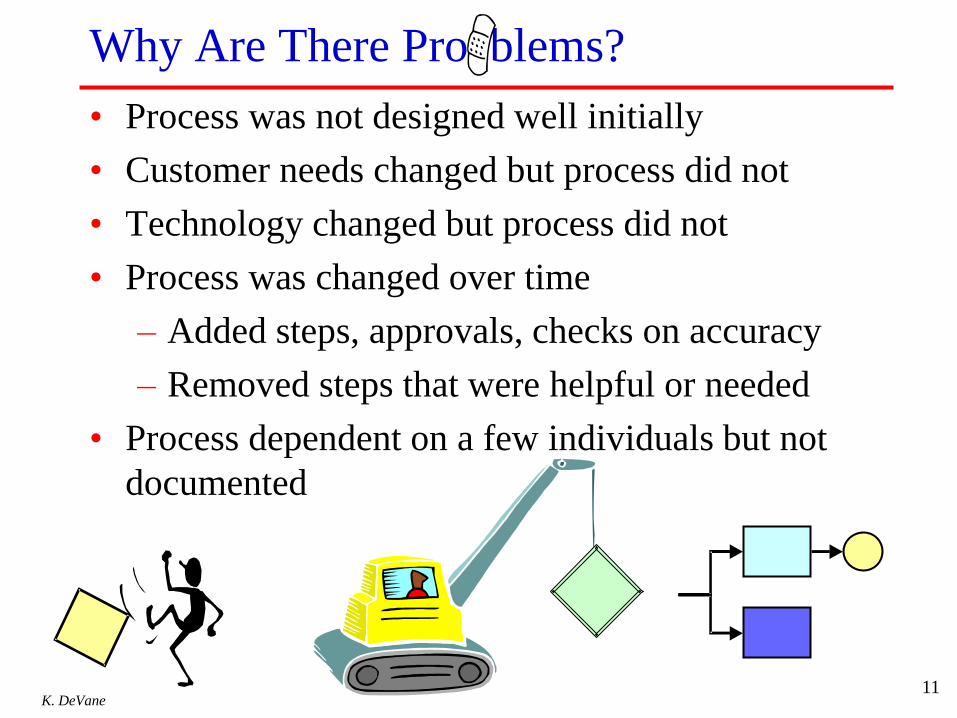
Why Are There Procblems?
11
• Process was not designed well initially
• Customer needs changed but process did not
• Technology changed but process did not
• Process was changed over time
– Added steps, approvals, checks on accuracy
– Removed steps that were helpful or needed
• Process dependent on a few individuals but not
documented
K. DeVane
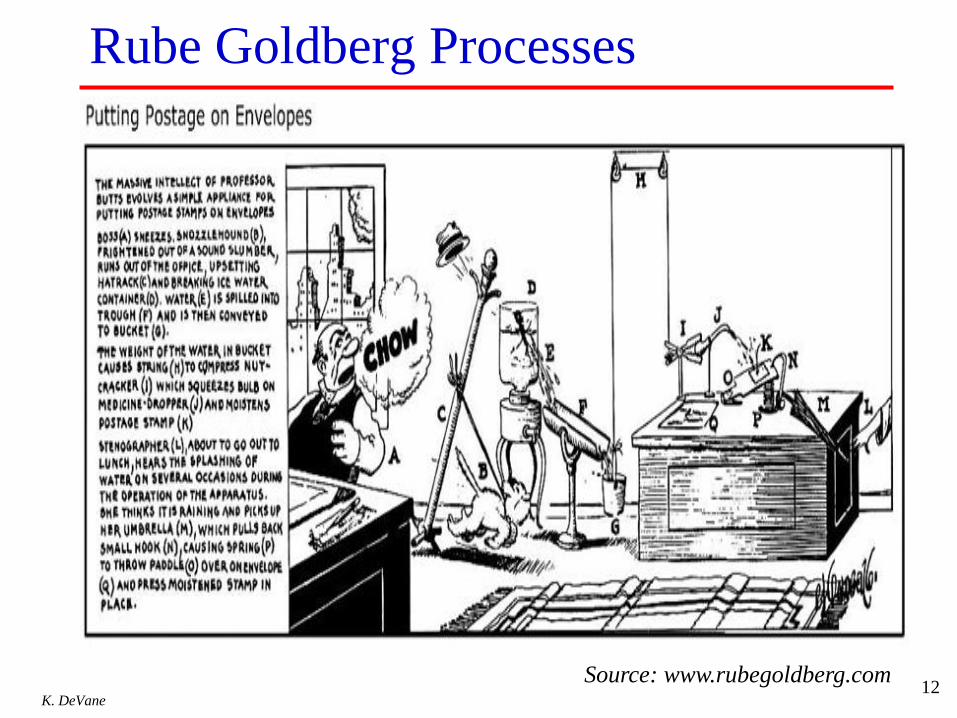
Rube Goldberg Processes
12 Source: www.rubegoldberg.com
K. DeVane
Other Opportunities
• Recognize an opportunity to further improve a
good process.
• Proactively finding ways to stay ahead.
13
You don’t need a “broken” process.
Most processes can be improved, even if working OK.
K. DeVane
How Do We Improve? • Reach agreement on an opportunity
– Sufficient levels of authority to address the issues
• Get the right people together
• Guide them through an effective improvement approach
• Help them use the appropriate tools and techniques
• Ensure they get the support they need
– Time
– Resources
– Skills
• Measure to ensure effective
• Document
• Recognition
14
15
Facilitative Leadership
Active, engaged and committed
leadership is essential to effect
process improvement.
16
Project Charter
A written document chartering a
team to address a problem or
opportunity.
K. DeVane
Charter • Describe the problem & define the purpose
• Identify the sponsors, leader, facilitator and
team
• Create a high-level map of the process steps
• List improvement targets, metrics and vision
of success
• Scope: Define the boundaries, what is in vs.
out of scope
• Describe dependencies and risks
• Create a draft project plan with milestones
and target dates
• Identify other resources needed including the
budget
17
K. DeVane 18
Identifying Roles & Responsibilities of Team
• Executive Sponsors
• Process Owner
• Project Lead
• Facilitator
• Team composed of people who know
the process being improved
K. DeVane 19
Team Members
• Team Membership should include
people with other key skills, or who
have access to other needed resources
such as:
• IT
• Data person
• Maverick
K. DeVane 20
Team Members
• Skilled facilitation is essential for team
success.
• An experienced coach or mentor
should meet regularly with new
facilitators.
21
Approach
The steps you will take, in a logical
order, to have efficient and effective
improvement and problem solving.
K. DeVane
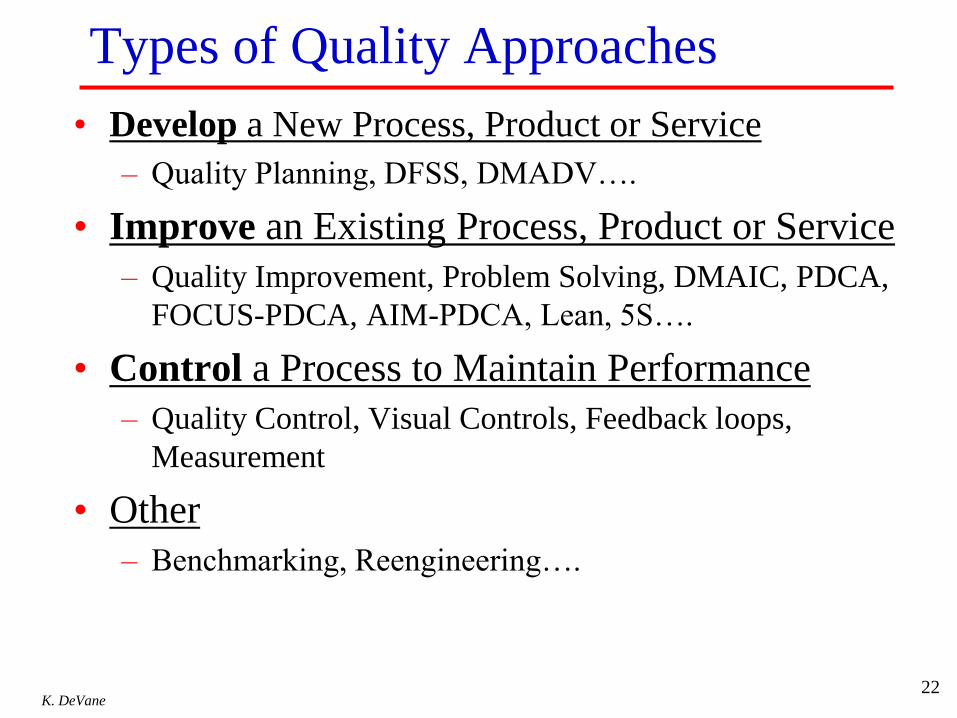
Types of Quality Approaches
• Develop a New Process, Product or Service
– Quality Planning, DFSS, DMADV….
• Improve an Existing Process, Product or Service
– Quality Improvement, Problem Solving, DMAIC, PDCA,
FOCUS-PDCA, AIM-PDCA, Lean, 5S….
• Control a Process to Maintain Performance
– Quality Control, Visual Controls, Feedback loops,
Measurement
• Other
– Benchmarking, Reengineering….
22
K. DeVane
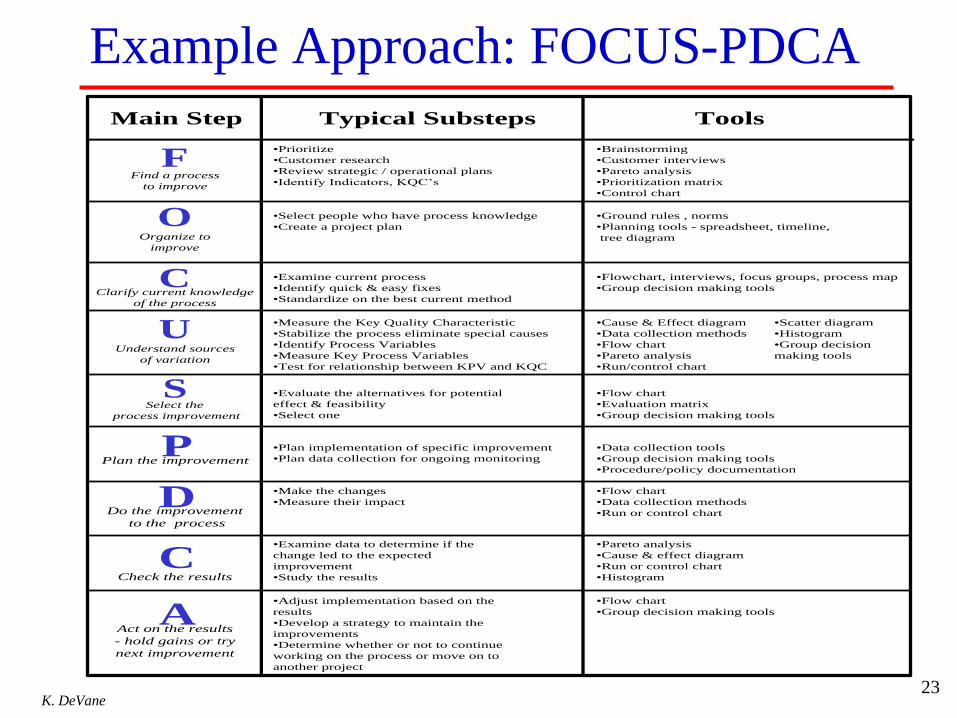
Example Approach: FOCUS-PDCA
23
Main Step Typical Substeps Tools
F
O
C
U
Find a process
to improve
Organize to
improve
Clarify current knowledge
of the process
Understand sources
of variation
SSelect the
process improvement
•Prioritize
•Customer research
•Review strategic / operational plans
•Identify Indicators, KQC’s
•Brainstorming
•Customer interviews
•Pareto analysis
•Prioritization matrix
•Control chart
•Select people who have process knowledge
•Create a project plan
•Ground rules , norms
•Planning tools - spreadsheet, timeline,
tree diagram
•Examine current process
•Identify quick & easy fixes
•Standardize on the best current method
•Flowchart, interviews, focus groups, process map
•Group decision making tools
•Measure the Key Quality Characteristic
•Stabilize the process eliminate special causes
•Identify Process Variables
•Measure Key Process Variables
•Test for relationship between KPV and KQC
•Cause & Effect diagram
•Data collection methods
•Flow chart
•Pareto analysis
•Run/control chart
•Scatter diagram
•Histogram
•Group decision
making tools
•Evaluate the alternatives for potential
effect & feasibility
•Select one
•Flow chart
•Evaluation matrix
•Group decision making tools
PPlan the improvement
DDo the improvement
to the process
CCheck the results
AAct on the results
- hold gains or try
next improvement
•Plan implementation of specific improvement
•Plan data collection for ongoing monitoring
•Data collection tools
•Group decision making tools
•Procedure/policy documentation
•Make the changes
•Measure their impact
•Flow chart
•Data collection methods
•Run or control chart
•Examine data to determine if the
change led to the expected
improvement
•Study the results
•Pareto analysis
•Cause & effect diagram
•Run or control chart
•Histogram
•Adjust implementation based on the
results
•Develop a strategy to maintain the
improvements
•Determine whether or not to continue
working on the process or move on to
another project
•Flow chart
•Group decision making tools
K. DeVane
Example Approach: DMAIC
• Define – Understand problem & objective; Voice of customer
• Measure – Create measures and collect data
• Analyze – Understand the root cause
• Improve – Make the needed changes
• Control – Maintain via work design & feedback
24
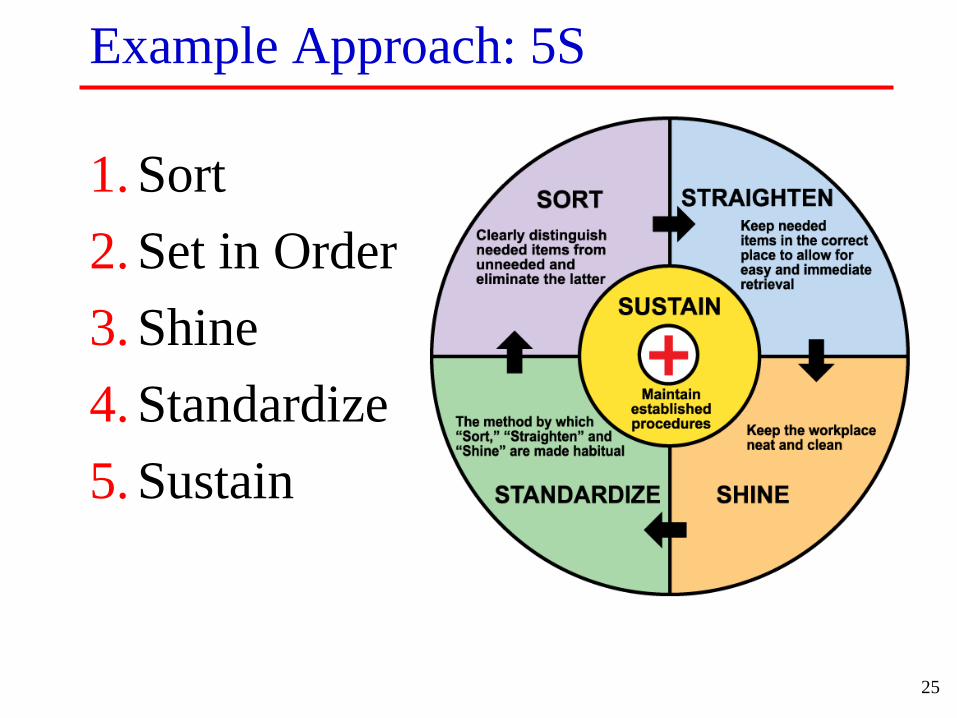
Example Approach: 5S
25
1. Sort
2. Set in Order
3. Shine
4. Standardize
5. Sustain
K. DeVane
Example Approach: Benchmarking
26
Benchmark: The “best” performance
level anywhere.
Benchmarking: Finding out “how”
they achieve that level of
performance.
K. DeVane
Typical BPI Approach
• Clarify problem & opportunity
• Understand customer needs
• Map existing process
• Review the process and ID changes
– Streamline, simplify, eliminate steps,
reorder, mistake-proof
• Implement, train, make changes
• Measure the results
27
K. DeVane
Solutions
• Make it easier, more efficient & accurate to….
• Improve the process by…
– Clarify handoffs: what’s needed by whom, when, why.
– Clarify steps that are not understood
– Remove steps that are not needed or add needed steps
– Reorder steps to be more logical
– Mistake-proof
– Minimize motion and distance traveled
– Minimize time to perform a task
– Ensure appropriate resources are used/available
– Ensure appropriate amounts are produced/worked
28
K. DeVane
Types of Solutions
• Manual – Focus on clarify, simplify, re-order/add steps
– Advantages: Easier, less costly, quicker initial improvement.
– Disadvantages: Tend to be more limited in scope, less thorough; can
slip back to old ways; more difficult to measure; more difficult to
maintain gains
• Business Process Management Software – Same focus to clarify, simplify, reorder/add steps
– Not applicable for all types of problems.
– Advantages: Framework ensures more thorough process definition;
more effective measures; more likely to hold gains and obtain lasting
benefits; higher return
– Disadvantages: Higher skill level required; higher initial cost and time
investment.
29
K. DeVane
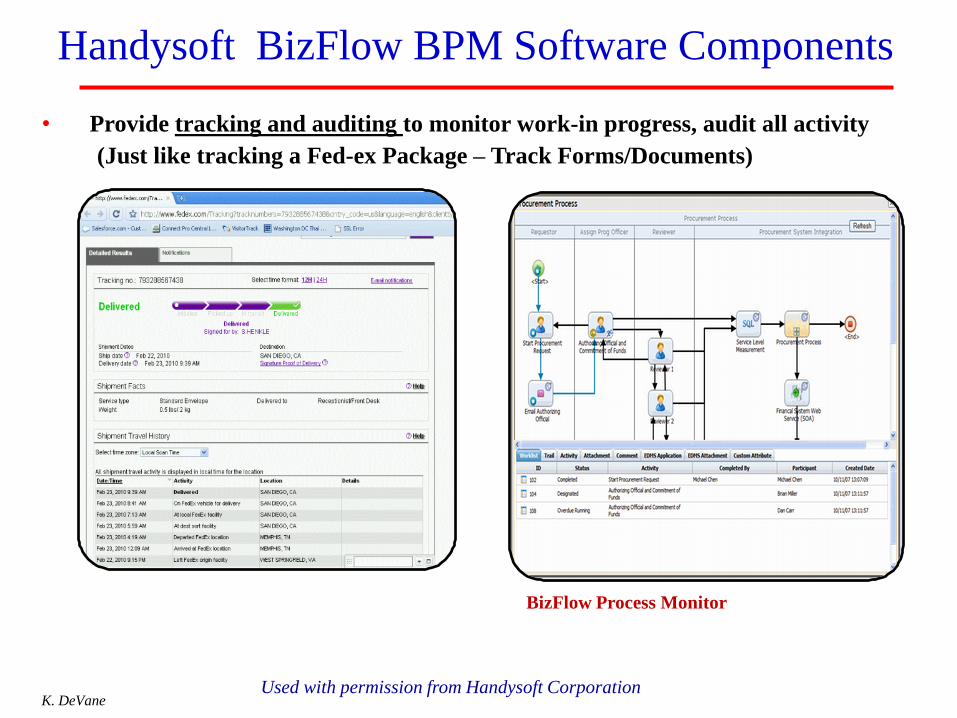
• Provide tracking and auditing to monitor work-in progress, audit all activity
BizFlow Process Monitor
(Just like tracking a Fed-ex Package – Track Forms/Documents)
Handysoft BizFlow BPM Software Components
Used with permission from Handysoft Corporation
K. DeVane
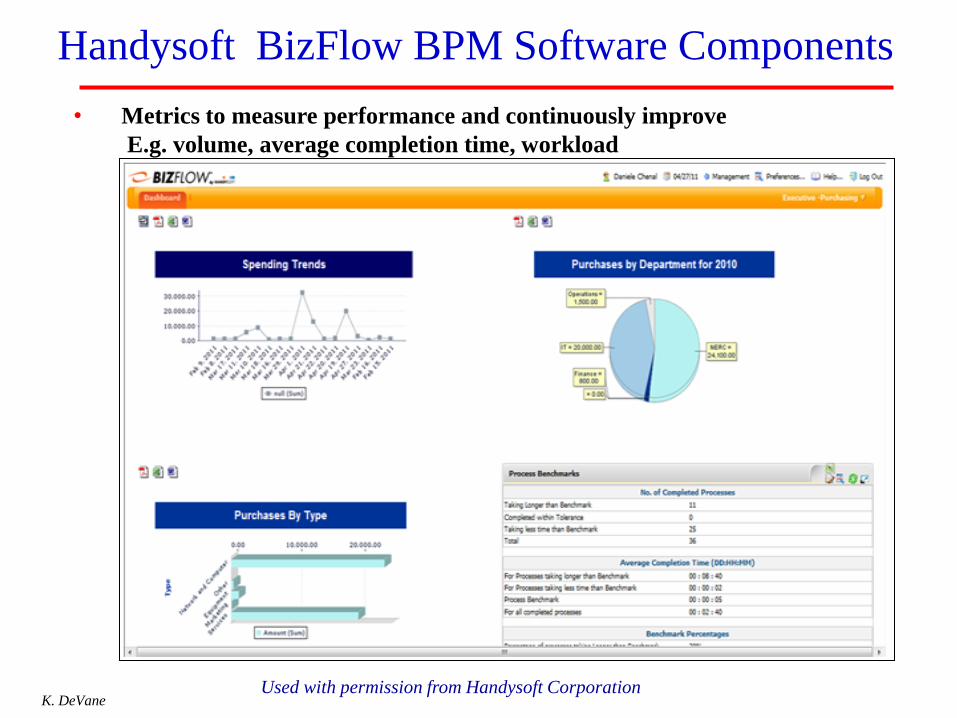
• Metrics to measure performance and continuously improve
E.g. volume, average completion time, workload
Handysoft BizFlow BPM Software Components
Used with permission from Handysoft Corporation
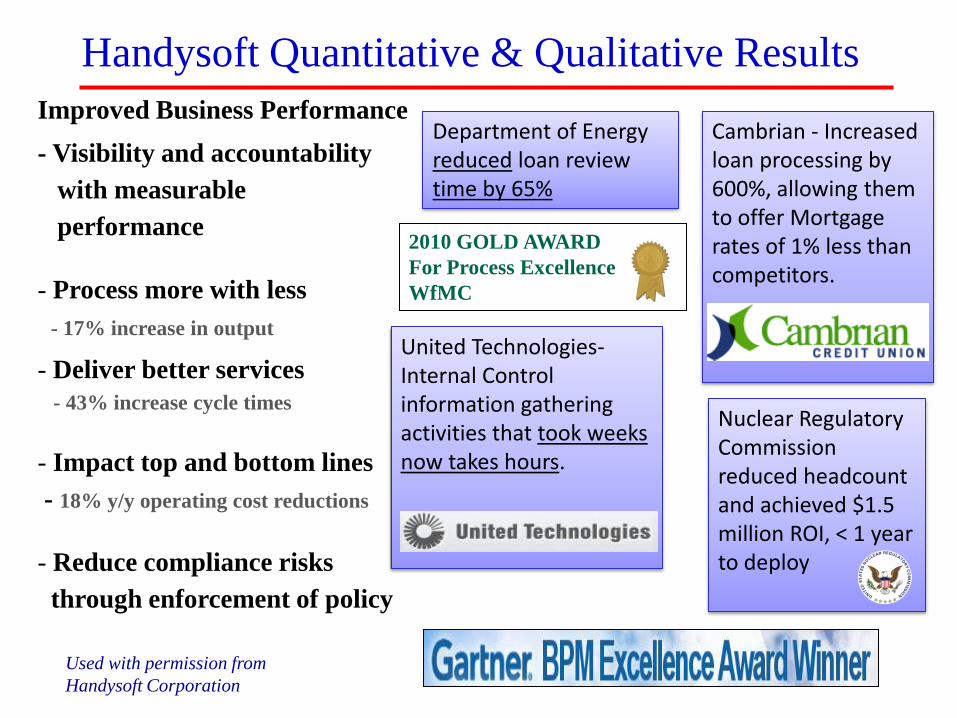
Handysoft Quantitative & Qualitative Results
32
Improved Business Performance
- Visibility and accountability
with measurable
performance
- Process more with less
- 17% increase in output
- Deliver better services
- 43% increase cycle times
- Impact top and bottom lines
- 18% y/y operating cost reductions
- Reduce compliance risks
through enforcement of policy
Department of Energy reduced loan review time by 65%
United Technologies- Internal Control information gathering activities that took weeks now takes hours.
2010 GOLD AWARD
For Process Excellence
WfMC
Cambrian - Increased loan processing by 600%, allowing them to offer Mortgage rates of 1% less than competitors.
Nuclear Regulatory Commission reduced headcount and achieved $1.5 million ROI, < 1 year to deploy
Used with permission from
Handysoft Corporation
K. DeVane
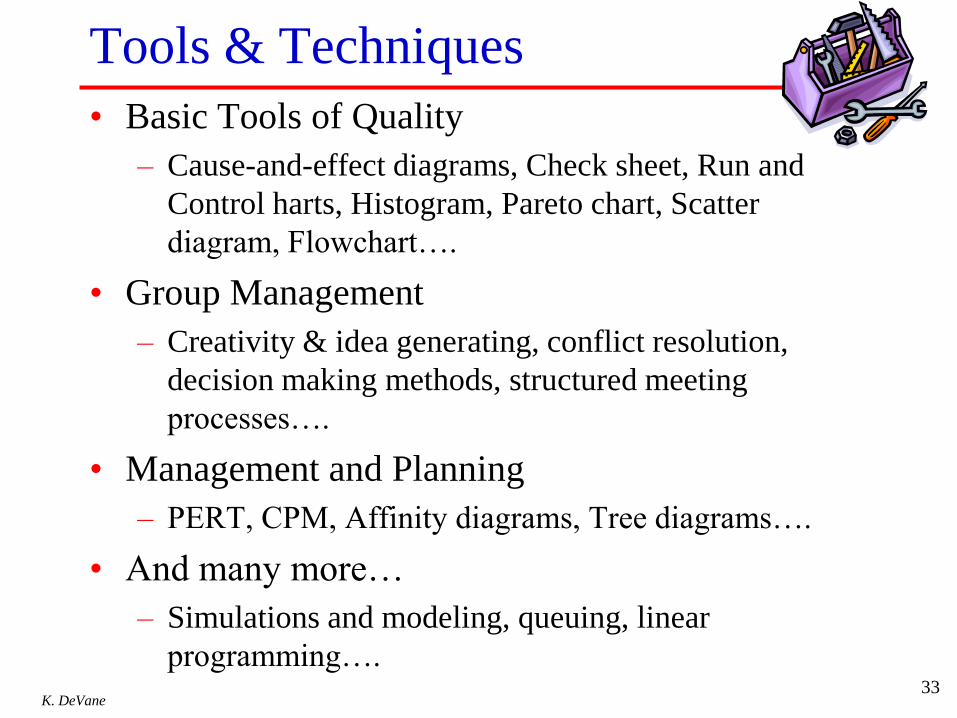
Tools & Techniques
• Basic Tools of Quality
– Cause-and-effect diagrams, Check sheet, Run and
Control harts, Histogram, Pareto chart, Scatter
diagram, Flowchart….
• Group Management
– Creativity & idea generating, conflict resolution,
decision making methods, structured meeting
processes….
• Management and Planning
– PERT, CPM, Affinity diagrams, Tree diagrams….
• And many more…
– Simulations and modeling, queuing, linear
programming….
33
K. DeVane 34
Skill with Tools
The tools of quality and performance
improvement, like any other tool, can be
misused.
Education, training, mentoring and coaching
are essential.
K. DeVane
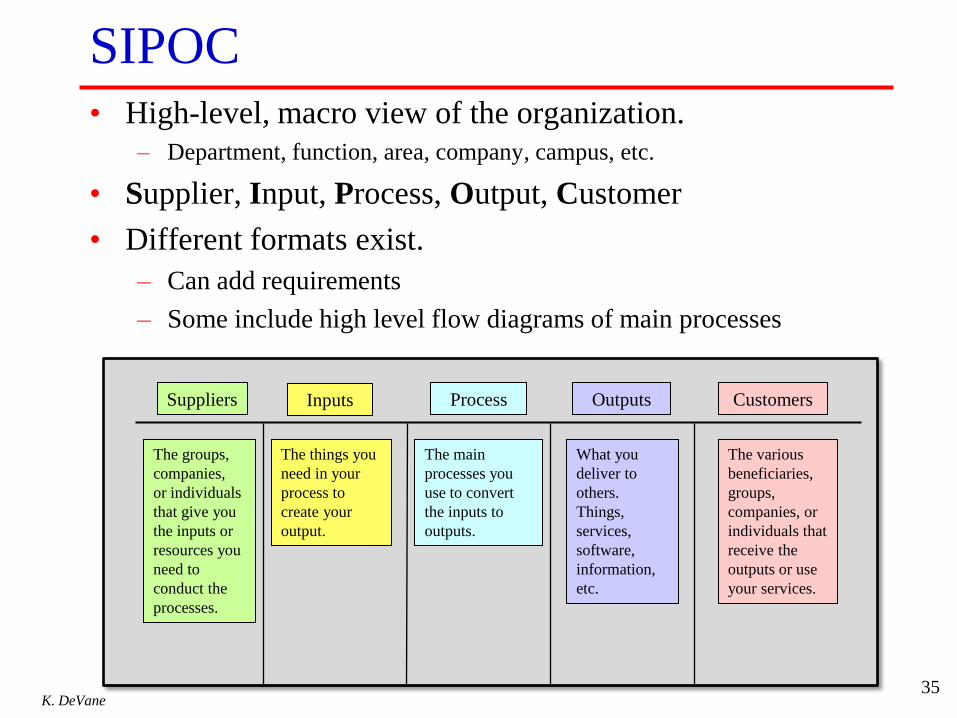
SIPOC • High-level, macro view of the organization.
– Department, function, area, company, campus, etc.
• Supplier, Input, Process, Output, Customer
• Different formats exist.
– Can add requirements
– Some include high level flow diagrams of main processes
35
Suppliers Inputs Process Outputs Customers
The groups,
companies,
or individuals
that give you
the inputs or
resources you
need to
conduct the
processes.
The things you
need in your
process to
create your
output.
The main
processes you
use to convert
the inputs to
outputs.
What you
deliver to
others.
Things,
services,
software,
information,
etc.
The various
beneficiaries,
groups,
companies, or
individuals that
receive the
outputs or use
your services.
K. DeVane
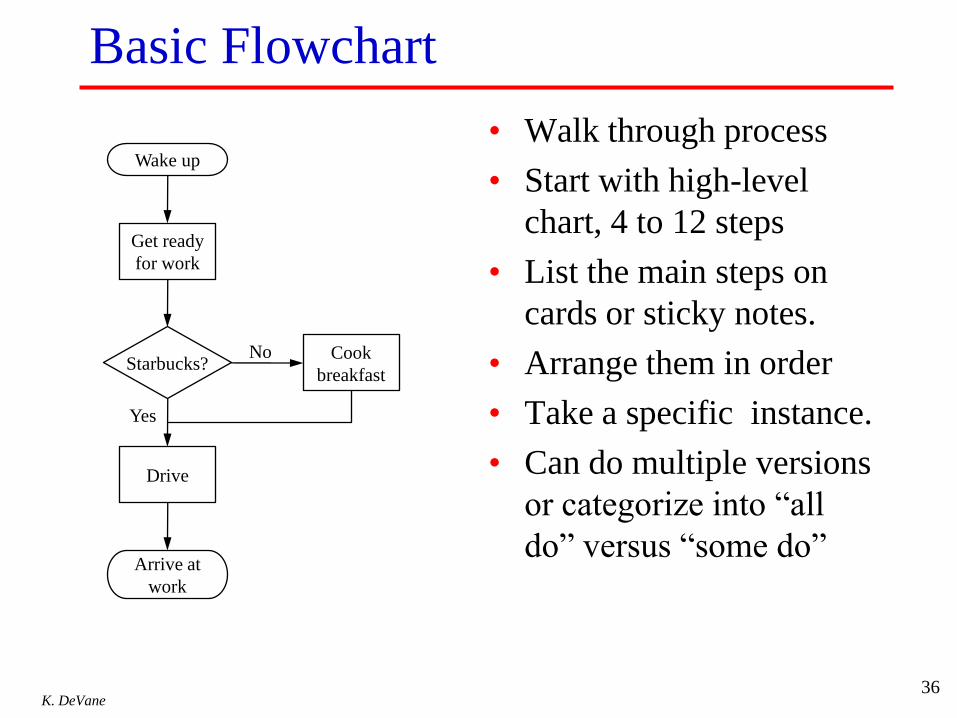
Basic Flowchart
36
• Walk through process
• Start with high-level
chart, 4 to 12 steps
• List the main steps on
cards or sticky notes.
• Arrange them in order
• Take a specific instance.
• Can do multiple versions
or categorize into “all
do” versus “some do”
Wake up
Get ready
for work
Starbucks? Cook
breakfast
Drive
Arrive at
work
No
Yes
K. DeVane
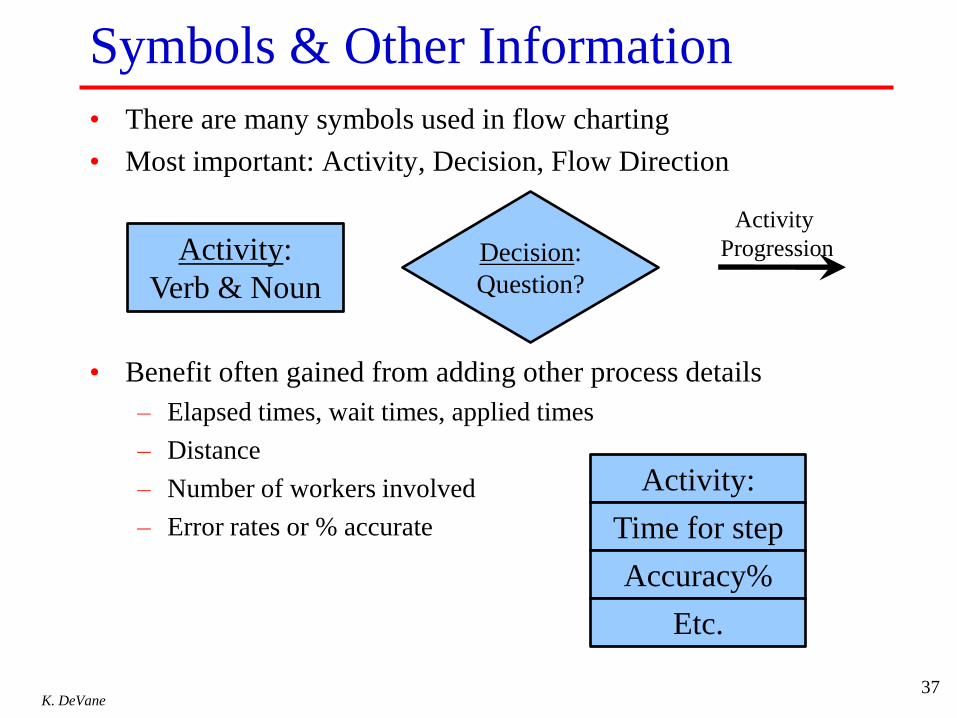
Symbols & Other Information
• There are many symbols used in flow charting
• Most important: Activity, Decision, Flow Direction
• Benefit often gained from adding other process details
– Elapsed times, wait times, applied times
– Distance
– Number of workers involved
– Error rates or % accurate
37
Activity:
Verb & Noun
Decision:
Question?
Activity
Progression
Activity:
Time for step
Accuracy%
Etc.
K. DeVane
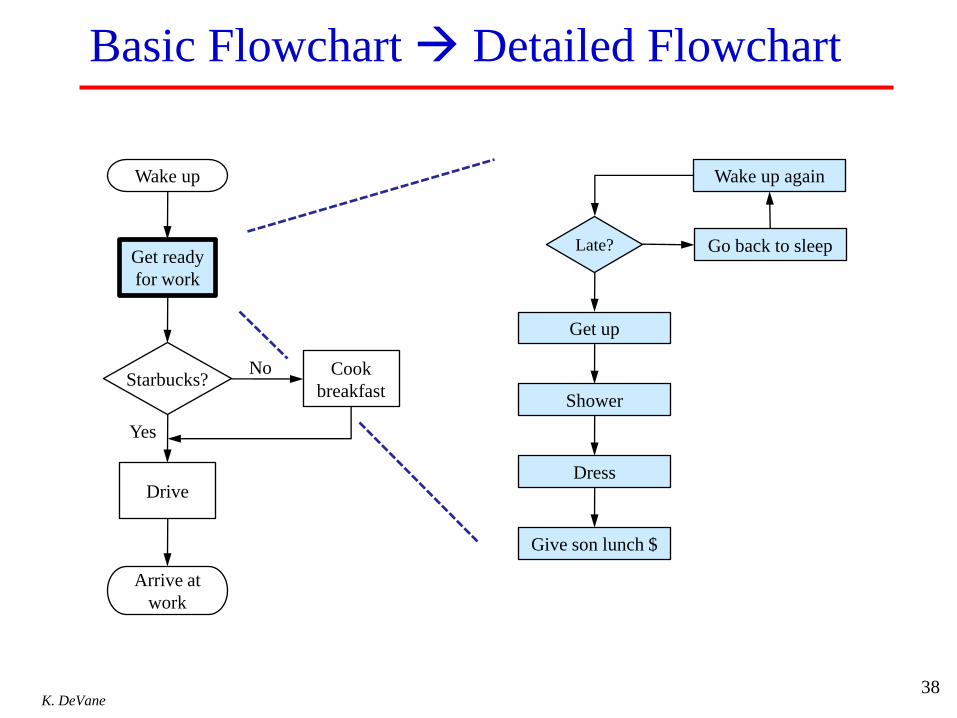
Basic Flowchart Detailed Flowchart
38
Wake up
Get ready
for work
Starbucks? Cook
breakfast
Drive
Arrive at
work
No
Yes
Late? Go back to sleep
Shower
Get up
Dress
Give son lunch $
Wake up again
K. DeVane
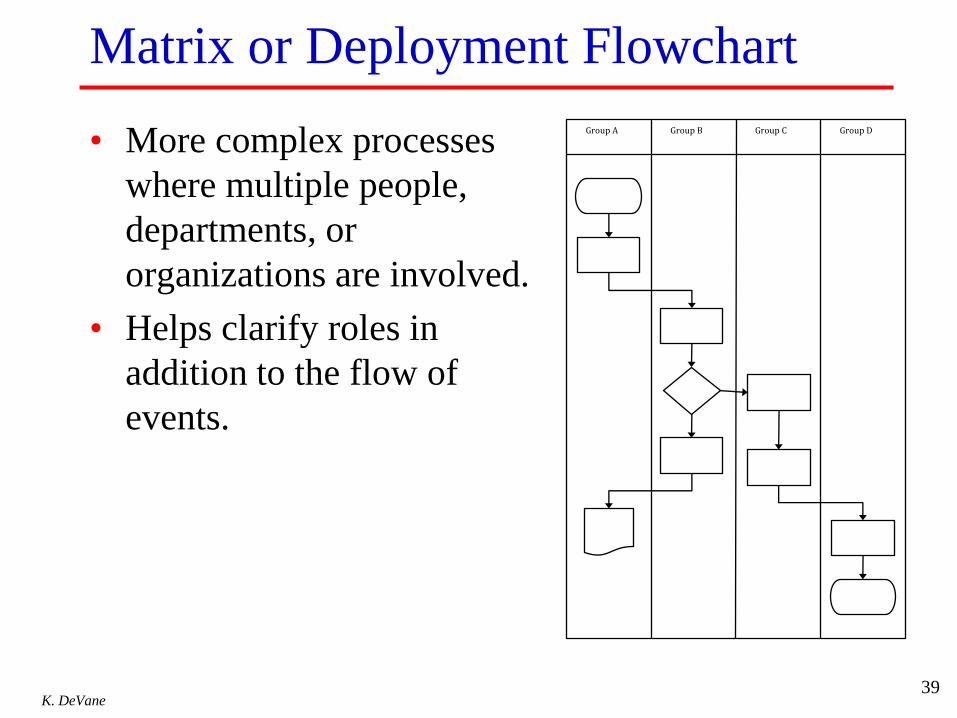
Matrix or Deployment Flowchart
• More complex processes
where multiple people,
departments, or
organizations are involved.
• Helps clarify roles in
addition to the flow of
events.
39
Group A Group B Group C Group D
40
Project Reports
• An “organizational memory”
• Different formats available
• Different lengths helpful
- Detailed notebook
- 1 to 2 page summary
- Storyboard
K. DeVane
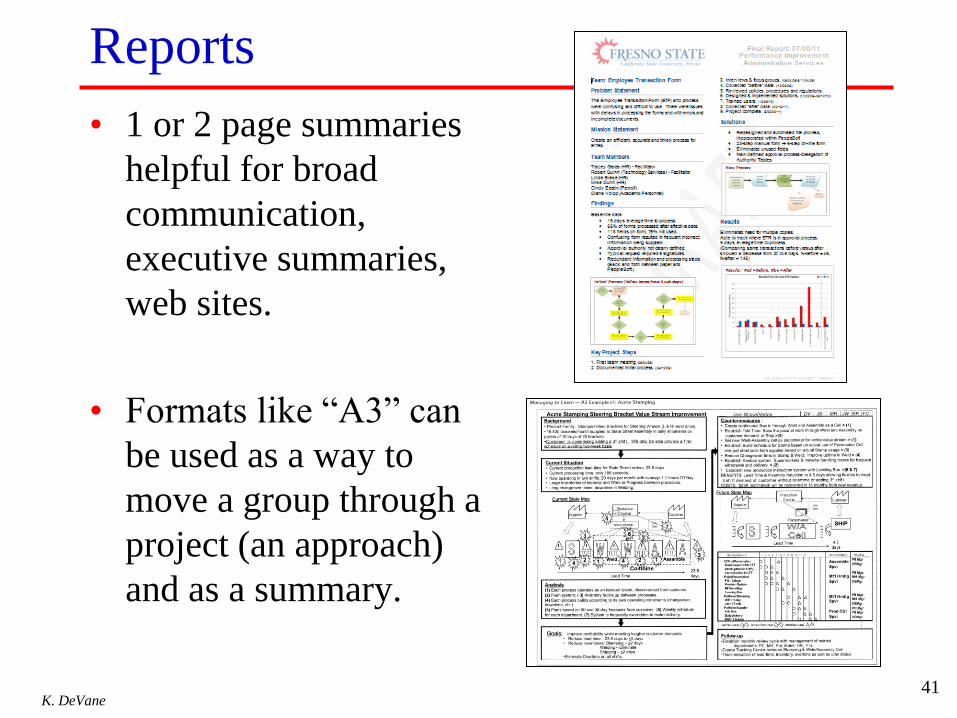
Reports
• 1 or 2 page summaries
helpful for broad
communication,
executive summaries,
web sites.
• Formats like “A3” can
be used as a way to
move a group through a
project (an approach)
and as a summary.
41
K. DeVane
Recognition
42
Don’t forget to provide appropriate
reward and recognition for
individual and group contributions!
K. DeVane
Key Success Factors
• Leadership commitment & interest
• People who know the process
• People who understand improvement & systems
• Opportunity to work as a team
• Making it a project, an event
• Appropriate tools
• Time and resources
• Support to overcome difficulties
• Measures of progress – qualitative & quantitative
• Documentation
• Reward & Recognition
43
K. DeVane
Interested in Learning More?
44
• A course is being developed
• If you would like to learn more, send an email
providing your contact information to:
Alexis Naiknimbalkar, Project Manager
Subject Line:
Interest in Process Improvement Course
Text: Please add my name to your mailing list
regarding potential training in process
improvement.
K. DeVane
What Opportunities Do You Have?
• List at up to three situations with opportunities to improve
• Describe the types of problems that occur or opportunities
you see for each
• Use concepts about problems or waste from the previous
pages.
45
Process Name: __________________
Problems/Issues
Process Name: __________________
Problems/Issues
Process Name: __________________
Problems/Issues
K. DeVane
Your Opportunity
46
• Project title
• Executive sponsor, process owner, leader, facilitator, team
• Purpose of the process
• Problem/issue description - customer & worker standpoint.
• High level process map (4 to 12 steps/blocks maximum)
• Scope: Start and end points/actions, location, customers
• Improvement targets sponsor & owner expect to achieve
• Metrics: Baseline (if known) & goals
• Vision for the future process. When working well it will….
• Resources anticipated: People, time, equipment, funds
Select one opportunity and begin to assemble information for
a project charter
K. DeVane
Aim High!
47
You won’t know what you can
accomplish until you try!
Related Documents