Australian Pipeline Ltd ACN 091 344 704 | Australian Pipeline Trust ARSN 091 678 778 | APT Investment Trust ARSN 115 585 441 Level 19, 580 George Street Sydney NSW 2000 | PO Box R41 Royal Exchange NSW 1225 Phone +61 2 9693 0000 | Fax +61 2 9693 0093 APA Group | apa.com.au Page 1 23 September 2016 ASX ANNOUNCEMENT APA Group (ASX: APA) (also for release to APT Pipelines Limited (ASX: AQH)) ANNUAL REPORT AND SUSTAINABILITY REPORT AND NEWSLETTER The following documents are attached for release to the market: • Annual Report and Sustainability Report 2016 • In the Pipeline newsletter Nevenka Codevelle Company Secretary Australian Pipeline Limited For further information please contact: Investor enquiries: Media enquiries: Yoko Kosugi Louise Watson Telephone: +61 2 9693 0049 Telephone: +61 2 8079 2970 Mob: +61 438 010 332 Mob: +61 419 185 674 Email: [email protected] Email: [email protected] About APA Group (APA) APA is Australia’s largest natural gas infrastructure business, owning and/or operating around $19 billion of energy infrastructure assets. Its gas transmission pipelines span every state and territory on mainland Australia, delivering approximately half of the nation’s gas usage. APA has direct management and operational control over its assets and the majority of its investments. APA also holds minority interests in a number of energy infrastructure enterprises including SEA Gas Pipeline, SEA Gas (Mortlake) Partnership, Energy Infrastructure Investments, GDI Allgas Gas Networks and Diamantina and Leichhardt Power Stations. APT Pipelines Limited is a wholly owned subsidiary of Australian Pipeline Trust and is the borrowing entity of APA Group. For more information visit APA’s website, apa.com.au For personal use only

Welcome message from author
This document is posted to help you gain knowledge. Please leave a comment to let me know what you think about it! Share it to your friends and learn new things together.
Transcript

Australian Pipeline Ltd ACN 091 344 704 | Australian Pipeline Trust ARSN 091 678 778 | APT Investment Trust ARSN 115 585 441 Level 19, 580 George Street Sydney NSW 2000 | PO Box R41 Royal Exchange NSW 1225
Phone +61 2 9693 0000 | Fax +61 2 9693 0093 APA Group | apa.com.au
Page 1
23 September 2016
ASX ANNOUNCEMENT
APA Group (ASX: APA) (also for release to APT Pipelines Limited (ASX: AQH))
ANNUAL REPORT AND SUSTAINABILITY REPORT AND NEWSLETTER
The following documents are attached for release to the market:
• Annual Report and Sustainability Report 2016
• In the Pipeline newsletter
Nevenka Codevelle Company Secretary Australian Pipeline Limited
For further information please contact:
Investor enquiries: Media enquiries: Yoko Kosugi Louise Watson Telephone: +61 2 9693 0049 Telephone: +61 2 8079 2970 Mob: +61 438 010 332 Mob: +61 419 185 674 Email: [email protected] Email: [email protected]
About APA Group (APA) APA is Australia’s largest natural gas infrastructure business, owning and/or operating around $19 billion of energy infrastructure assets. Its gas transmission pipelines span every state and territory on mainland Australia, delivering approximately half of the nation’s gas usage. APA has direct management and operational control over its assets and the majority of its investments. APA also holds minority interests in a number of energy infrastructure enterprises including SEA Gas Pipeline, SEA Gas (Mortlake) Partnership, Energy Infrastructure Investments, GDI Allgas Gas Networks and Diamantina and Leichhardt Power Stations.
APT Pipelines Limited is a wholly owned subsidiary of Australian Pipeline Trust and is the borrowing entity of APA Group.
For more information visit APA’s website, apa.com.au
For
per
sona
l use
onl
y

apa groupannual report. 2016
energy.connected.
For
per
sona
l use
onl
y

As a leader in energy delivery, APA will continue to play a key role in defining and delivering the future of Australian energy. We believe that natural gas provides an energy solution that will enable the world to transition to a carbon‑efficient future, whilst maintaining economic growth. From pipes to power, we’ve been connecting Australian energy since 2000 to become Australia’s largest gas infrastructure business today.
to connect Australia toour vision.
contents.FY2016 IN REVIEW
Chairman’s Report 2
Managing Director’s Report 4
APA Leadership 6
Highlights 8
AUSTRALIAN PIPELINE TRUST
Directors’ Report 10
Australian Pipeline Trust Remuneration Report 34
Consolidated Financial Statements 50
APT INVESTMENT TRUST
Directors’ Report 97
Consolidated Financial Statements 101
ADDITIONAL INFORMATION 119
FIVE YEAR SUMMARY 120
INVESTOR INFORMATION 121
SUSTAINABILITY REPORT S1
Information contained in this document is current as at 24 August 2016.
For
per
sona
l use
onl
y

its energy future.
Continuing to grow our ownership interests in transmission pipelines through further expanding the east and west coast grids
Delivering responsive, valuable solutions to our customers
Growing other energy infrastructure midstream assets
our strategy.
Maintaining financial flexibility
Leveraging APA’s asset management, development and operational capabilities
1APA Group Annual Report 2016 1
For
per
sona
l use
onl
y
APA has been able to reap the benefits of this strategy, seeing earnings come through from capital we have invested in growing our asset base through acquisitions and organic expansion. The FY2016 results include a full year of earnings from the Wallumbilla Gladstone Pipeline acquired in FY2015 and increasing revenue streams from the ongoing expansion of both the East Coast Grid and expansions and greenfields investment in Western Australia.
APA’s long term vision, strategic planning and focused execution have seen the business continue to deliver prudent distribution growth and long term market-leading increases in Securityholders’ value.
The total distributions for FY2016 of 41.5 cents per security represent a 9.2 per cent increase over FY2015. As per our distribution policy, distributions have been fully covered by operating cash flows with an appropriate amount of those cash flows retained within the business to support growth.
Your Board believes that the increase in distributions represents a prudent increase in returns for Securityholders given the current economic environment. The Board is of the view that the 41.5 cents per security represents a solid base from which to increase distributions on a sustainable basis going forward.
Long term sustainability is what APA is all about. We continue to see good opportunities for organic growth in front of us and we are mindful of ensuring that the business is in a position to fund that growth going forward. We will continue to maintain a disciplined approach to investing in growth that delivers long term value for Securityholders and positions APA securely for the future.
Despite the challenges within the global and Australian energy sector in FY2016 with volatile energy market conditions and the rebalancing of global demand and supply, we have continued the execution of APA’s long standing growth-based strategy. We have invested in enhancing our existing assets and during the year we acquired two complementary assets in the Diamantina and Leichhardt Power Stations and the Ethane Pipeline, to connect more energy resources to more markets. We continue to innovate through provision of new services that are helping our customers manage their energy needs, particularly during what have been relatively uncertain times from an economic, political and regulatory perspective.
Our sustainable business model and strong balance sheet have enabled us to navigate the current economic environment and make the most of opportunities that arise and, most importantly, position us for further growth in the years ahead.
Solid resultsThe strength of our low risk, resilient business model is reflected in APA’s FY2016 financial results. Earnings before interest, tax, depreciation and amortisation (“EBITDA”) from continuing businesses were $1,330.5 million 1 , an increase of 61.8 per cent on FY2015 normalised EBITDA of $822.3 million 2. Revenue (excluding pass-through revenue) increased by $536.7 million to $1,656.0 million, an increase of 48.0 per cent on the FY2015 result of $1,119.2 million.
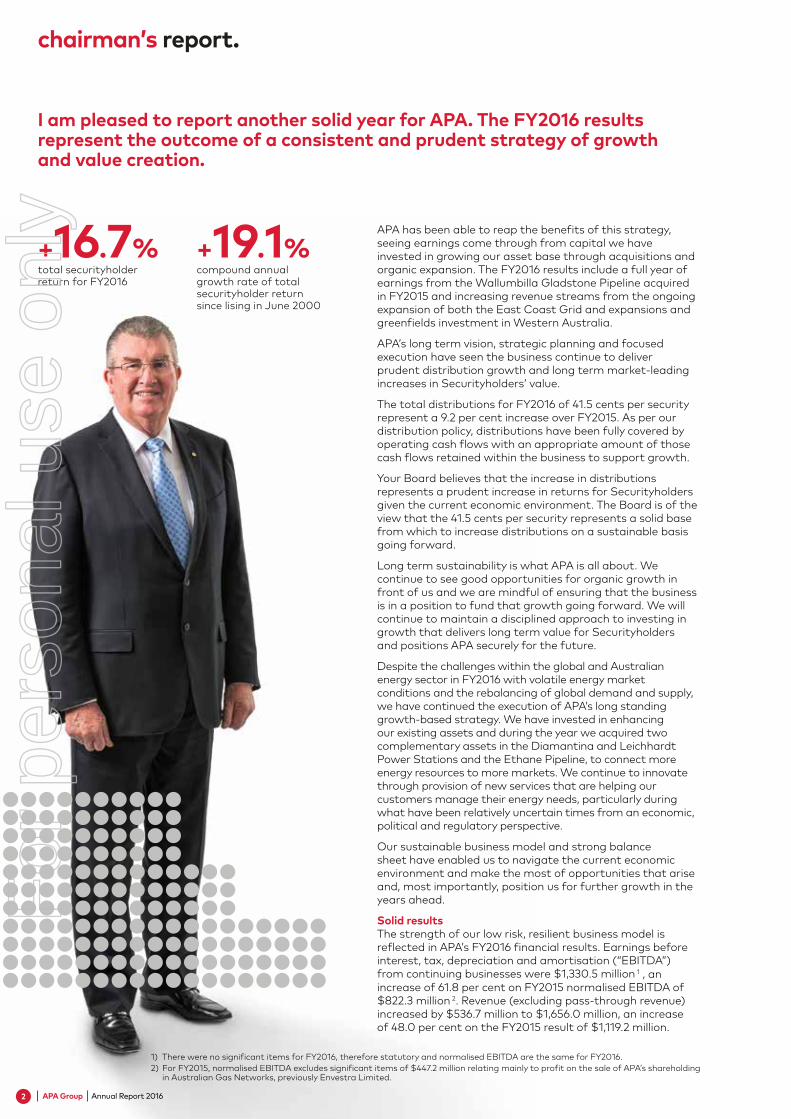
+16.7%total securityholder return for FY2016
+19.1%compound annual growth rate of total securityholder return since lising in June 2000
chairman’s report.
I am pleased to report another solid year for APA. The FY2016 results represent the outcome of a consistent and prudent strategy of growth and value creation.
1) There were no significant items for FY2016, therefore statutory and normalised EBITDA are the same for FY2016.2) For FY2015, normalised EBITDA excludes significant items of $447.2 million relating mainly to profit on the sale of APA’s shareholding
in Australian Gas Networks, previously Envestra Limited.
2 APA Group Annual Report 2016
For
per
sona
l use
onl
y

Changing fundamental regulatory settings at this time is not the answer to increasing gas supply – innovation and investment is. Increased regulation will simply stifle innovation and reduce Australia’s rise as a global energy player. APA’s East Coast Grid is an example of innovation and investment at its best. It was conceived, created and funded by APA. Without investment and innovation by the private sector over the last 16 years, Australia’s energy infrastructure would still be standalone point-to-point operations without the benefits of interconnection, reverse flow, increased capacity, or the ability to deliver customers a wide selection of variable services. Without that innovation, Australia’s vast reserves of gas would not have been brought to market as effectively as they have today. And without those reserves in production, Australia would not have enjoyed the economic contribution from the LNG exports nor the massive employment that the construction of LNG plants, pipelines and associated infrastructure have brought.
It is by enhancing market mechanisms such as improved capacity trading platforms, information transparency and capacity auctions on congested pipelines, that gas market growth and further development will be facilitated. The prospect of increased heavy handed regulation will not deliver the market efficiencies and innovation that is needed over the longer term.
GovernanceDuring the year, after completion of APA’s formal appointment and nomination process, two new Directors were appointed to your Board. These appointments added further diversity, skills and experience around the boardroom table.
Along with the Nominations Committee established during the year, your Board continues to ensure that it possesses an appropriate mix of expertise to effectively govern the business.
OutlookThe Board is confident that APA remains well placed to continue delivering sustainable and profitable growth for you, our Securityholders. The review of our growth strategy that I mentioned earlier, identified around $1.5 billion of organic opportunities in the near term, across the asset classes that are already within APA’s portfolio of transmission pipelines, renewable and generation assets and midstream complementary assets. APA is a long term business and decisions are made for the sustainable future of this business.
With this in mind, our guidance for FY2017 reflects a 7 to 8.5 per cent increase in EBITDA of $1,425 million to $1,445 million, on a normalised, continuing business basis. Total distributions per security are expected to be in the order of 43.5 cents per security, prior to the benefit of any franking credits that may arise as a result of the filing of the FY2016 tax return.
On behalf of the Board, I thank our Managing Director Mick McCormack, his leadership team and APA’s people for their contributions this year.
I also thank you, our Securityholders, for your continued support.
Len Bleasel AMChairman
The increases in EBITDA and revenue were in the main due to a full year contribution from the Wallumbilla Gladstone Pipeline that we acquired in June 2015 and the expanded East Coast Grid (South West Queensland Pipeline in particular), as expected; part-year contributions from the Diamantina and Leichhardt Power Stations and the Ethane Pipeline acquired during the last quarter of the financial year; and, the commissioning of APA’s newest greenfield project, the Eastern Goldfields Pipeline in November 2015.
Operating cash flow which is a key measure of APA’s business, increased by 58.2 per cent to $862.4 million.
Delivering valueAs we do annually, the Board and senior management recently took time out to revisit our past performance, and more importantly, look at our strategy and what we can and should be doing in the years ahead, so that we can continue to grow and deliver services to our customers and value to our Securityholders.
We have built a business that is solid and sustainable. From having the right balance sheet and risk framework in order to maintain our “license to operate”, to using our in-house operational and development expertise to deliver energy when and where it is needed. All of the initiatives and strategic actions from past investments and innovations are delivering benefits now that will continue well into the future.
Looking forward, we remain committed to providing our investors with secure and stable returns via our strategies of organic growth on assets that we own and operate, and prudent acquisitions of long life energy infrastructure that is underwritten by long term contracts with highly creditworthy counterparties.
We remain focused on growing and strengthening APA further and we concluded from our review that opportunities still remain to expand and enhance our assets, be they transmission pipelines, renewable and generation assets or midstream complementary assets. Our growth strategy will be pursued using the same sound, disciplined and prudent investment criteria that has brought us to where we are today.
As we marked 16 years as a listed company, we have not forgotten about ensuring our house is in order for the long term. During the year, APA launched the APA2020 vision; an investment in further optimising operations and improving efficiencies to bring out the best in our people and our assets. APA2020 is an ongoing project within APA that focuses on ensuring we are ready as a business to meet the challenges of the future.
Regulatory environment The Australian gas market is a substantial way through the biggest transition it is ever likely to see with the commissioning of all three LNG projects at Gladstone. The market needs time to transition and adjust, which it is doing. Our industry will continue to change and evolve, adapting to global and local market conditions.
Policy options to respond to these changes have been considered in the finalised reports from both the Australian Energy Market Commission (“AEMC”) and the Australian Competition and Consumer Commission (“ACCC”) on the east coast gas markets, culminating in the Coalition of Australian Governments (“COAG”) meeting on 19 August 2016.
APA supports the objective of developing a liquid gas market and recognises that some of the recommendations put forward by the AEMC and agreed by COAG will have operational impacts on APA. Possible impacts are discussed further in the Directors’ Report. The important point though, is that APA will remain actively engaged in these discussions and, as we have proactively facilitated the market to this point, we fully intend to be part of the ultimate solution.
3APA Group Annual Report 2016
For
per
sona
l use
onl
y

It has become even more important for APA’s national footprint of assets to be able to respond to customers’ needs to deliver energy safely, and in a timely and cost-effective manner.
Innovative solutions like APA’s multi asset and services contracts that are replacing basic point-to-point gas transportation contracts, IT systems and facilities such as our Integrated Operations Centre, coupled with in-house expertise has meant that APA has been able to support our customers through these dynamic times, whilst insulating our business from this uncertainty.
APA has maintained its low risk business model, generating stable and predictable returns for our Securityholders. Our assets are geographically diverse and can operate as interconnected infrastructure or point-to-point assets, with all major pipelines now having the ability to flow gas in dual directions. We have a mix of energy infrastructure assets and businesses including gas pipeline transportation, gas storage, gas-fired power production, electricity transmission, network operations and renewable electricity generation. The majority of the contracts that we have across these assets are long term take-or-pay contracts with investment grade counterparties in a range of diversified sectors including energy, utilities and resources sectors.
Building on sound foundationsThe FY2016 results reflect the benefits of our investments and innovation from prior years. The Wallumbilla Gladstone Pipeline’s first full year contribution has had a significant impact on our results as expected. There have also been strong and growing contributions from various investments and expansions from prior years, including the South West Queensland Pipeline and the Victoria Northern Interconnect.
During the year, a total of $673.6 million was spent on capital and investment expenditure. In Western Australia, we completed construction of the 293 kilometre Eastern Goldfields Pipeline and added another connection to it at Granny Smith in addition to AngloGold Ashanti’s mines at Tropicana and Sunrise Dam. An enhancement project at the Mondarra Gas Storage Facility was completed, increasing injection/withdrawal capacity of the facility to better respond to gas market volatility. Projects to implement two-way flow on the Moomba Sydney Pipeline and Roma Brisbane Pipeline were also completed and the market benefited significantly from this added flexibility on the East Coast Grid during the year. In the south, capacity expansion works continued on the Victorian Northern Interconnect which when complete, will expand the interconnect to 200 TJ/day allowing more gas to flow north from southern supply sources.
We are always on the lookout for complementary midstream assets where we can leverage our skills and existing assets. During FY2016, APA acquired two such energy infrastructure assets that we had previously held an investment stake in – the Diamantina and Leichhardt
managing director’s report.
It is an exciting time to be in the energy industry. The commissioning of the export LNG facilities at Gladstone have trebled the volume of gas moving around on the east coast of Australia and commodity price volatility has created new dynamics in the resources sector in the far north and western regions of the country.
Power Stations in Queensland and the Ethane Pipeline Income Fund that owns the Moomba to Sydney Ethane Pipeline. Both acquisitions were a perfect fit with APA’s growth strategy: the assets were well known to APA; they are either connected or close to our existing infrastructure; we have had operational involvement with them for some time; and both have long term contracts with creditworthy customers. Importantly, each investment is operating cash flow per security accretive from the first full year of ownership.
Since closing the financial year, in August 2016, we acquired with our SEA Gas partner REST Industry Super, the onshore pipeline supplying gas from the offshore Otway Basin to the Origin-owned Mortlake Power Station. Again, this is an asset we already know well through our ownership with REST, of the Sea Gas Pipeline.
Invest and innovate for the futureAPA has in fact, spent over $12 billion since its listing on acquiring and developing energy infrastructure assets, systems and technology. All of this investment has been undertaken for the purpose of working with our customers and assisting the growth and development of the gas and energy industries, connecting more energy supplies to energy markets and providing innovative services and solutions to encourage more gas to flow throughout Australia.
We are innovators and not simply point-to-point gas pipeline operators. We will, as we have always done, continue to evaluate new opportunities that diversify and extend our growth and footprint, as well as further develop and grow the energy industry. To this end we have been, without waiting for the final AEMC report or the COAG meeting, facilitating pipeline capacity trading enhanced by our new Integrated Operations Centre, during FY2016. At Wallumbilla and Moomba, we have commenced developing and providing hub services.
Strategically, we have been a growth oriented business since listing in 2000 and we believe in value creation which benefits not only our stakeholders, but the Australian economy as well.
The global economic consulting firm, The Brattle Group, recently estimated the direct quantifiable efficiency benefits to the market associated with formation of APA’s East Coast Grid since 2012 to be $120 to $150 million to-date, and $15 to $32 million annually going forward. That is a significant contribution for a private company to be making to industry as a whole and I am very proud of this.
We believe that natural gas provides an energy solution that will enable the world to transition to a more carbon-efficient environment, whilst maintaining economic growth. Therefore, a strong and responsive infrastructure sector is essential in allowing gas to fuel our energy future whilst investigating and pursuing renewable opportunities such as wind and solar generation.
4 APA Group Annual Report 2016
For
per
sona
l use
onl
y

Health, Safety and EnvironmentThis year, we are releasing our Sustainability Report at the same time as our annual results. Without wanting to repeat everything in that report, I do want to reiterate here that APA continues to be focused on delivering sustainability objectives and we remain mindful of the role we play within the community and the responsibility we have to all of our stakeholders – our customers, the environment, the community, our employees and investors. FY2016 is the first full year of using APA’s new incident reporting platform which has provided improved access, analysis and rigour around the reporting of incidents and injuries across the organisation and its contractors.
Safety is a priority at APA because providing safe and reliable energy delivers value for our customers and investors. Most importantly, it also ensures we fulfil our obligations to our employees and the communities and environment within which we operate, in terms of health, safety and environmental outcomes.
Please refer to the Sustainability Report contained in this report for my message and further details.
Brand refreshYou will have noticed that we have refreshed our brand and corporate logo during the year. Brands can help define a company’s culture and to this end, we have come up with something new, but something that still represents what APA and its people want to deliver.
Importantly, whilst our brand and logo have changed, our core values have remained the same. The red dot represents our continued enthusiasm for, and focus on, delivering for our stakeholders, be they sustainable returns for our investors or reliable energy supply for our customers.
Looking aheadAPA will continue to invest and innovate. As an industry leader, APA will remain an active player in helping shape the best environment for the Australian gas market, continuing to promote what we believe is best for our industry.
It is in the interests of the pipeline sector to have as much gas flowing through pipelines as possible – indeed that has always been APA’s mantra – more gas means more pipelines and midstream infrastructure and service solutions that we can offer our customers. The Australian, and indeed global, energy landscape will continue to evolve throughout the new financial year and I am confident that APA is in good shape to manage the dynamic environment ahead and that our best days continue to be in front of us.
We will maintain our focus on growing the APA business through organic expansion of our current portfolio of assets to meet our customers’ specific needs and by looking to acquire assets that meet our strategic objectives. And, most importantly, we will continue to focus on growing the business to deliver more value to our Securityholders over the long term.
I would like to thank APA’s 1,600 strong team of highly capable and dedicated employees for their enthusiasm and commitment to building our resilient and growing business.
Mick McCormackChief Executive Officer and Managing Director
~$150 mestimated direct quantifiable efficiency benefits to the market associated with the formation of APA’s East Coast Grid 1
293 kmadded to APA’s asset portfolio with the completion of the Eastern Goldfields Pipeline
1) Source: The Brattle Group Report “Benefits and Costs of Integration in Transmission/Transportation Networks” August 2016.
5APA Group Annual Report 2016
For
per
sona
l use
onl
y

apa group board.
1 Leonard Bleasel AM
FAICD FAIMIndependent Chairman
APPOINTED: 28 August 2007APPOINTED CHAIRMAN: 30 October 2007
Leonard (Len) had a long career in the energy industry before retiring from management in 2001. He started his career in AGL in 1958 and worked in a variety of roles, culminating in the position of Managing Director and CEO from 1990 to 2001.Len’s past appointments have included lead non-executive Director of QBE Insurance Group Limited and Chairman of Foodland Associated Limited, ABN AMRO Australia Holdings Pty Limited, Solaris Power, Natural Gas Corporation Holdings Ltd (New Zealand), Elgas Ltd, East Australian Pipeline Ltd, the Advisory Council for CIMB Securities International (Australia) Pty Ltd and the Taronga Conservation Society Australia. He was also a Director of St George Bank Limited, O’Connell Street Associates Pty Limited and Gas Valpo (Chile).Len was awarded an AM in the General Division of the Order of Australia for services to the Australian gas and energy industries and the community.
2 Michael McCormack
BSurv GradDipEng MBA FAICDChief Executive Officer and Managing Director
APPOINTED CEO: 1 July 2005APPOINTED MD: Appointed 1 July 2006
Michael (Mick) has over 30 years’ experience in the energy infrastructure sector in Australia, and his career has encompassed all aspects of the sector, including commercial development, design, construction, operation and management of most of Australia’s natural gas pipelines and gas distribution systems. His experience extends to gas-fired and renewable energy power generation.Mick is a former Director of Envestra (now Australian Gas Networks), the Australian Pipeline Industry Association (now Australian Pipelines and Gas Association) and the Australian Brandenburg Orchestra.
3 Steven Crane
BComm FAICD SF FinIndependent Director
APPOINTED: 1 January 2011
Steven (Steve) has over 30 years’ experience in the financial services industry. His background is in investment banking, having previously been Chief Executive Officer of ABN AMRO Australia and BZW Australia.Steve has considerable experience as a non-executive Director of listed entities. He is currently Chairman of nib holdings limited and the Taronga Conservation Society Australia.He was formerly Chairman of Adelaide Managed Funds Limited and Investa Property Group Limited, a Director of Bank of Queensland Limited, Transfield Services Limited, Adelaide Bank Limited, Foodland Associated Limited and APA Ethane Limited, the responsible entity of Ethane Pipeline Income Fund, and a member of the Advisory Council for CIMB Securities International (Australia) Pty Ltd.Steve is the Chairman of the Audit and Risk Management Committee, a member of the People and Remuneration Committee and a member of the Nomination Committee.
4 John Fletcher
BSc MBA FAICDIndependent Director
APPOINTED: 27 February 2008
John has over 35 years’ experience in the energy industry, having held a number of executive positions in AGL (including Chief Financial Officer) prior to his retirement in 2003. John has previously been a Director of Integral Energy, Natural Gas Corporation Holdings Ltd (New Zealand), Foodland Associated Limited, Sydney Water Corporation and Alinta Energy Group. He brings a wide commercial and financial practical knowledge to the Board.John was previously an AGL appointed Director of Australian Pipeline Limited from 2000 to 2005.John is the Chairman of the People and Remuneration Committee, a member of the Audit and Risk Management Committee and a member of the Nomination Committee.
5 Michael Fraser
BCom FCPA FTI MAICD
Independent Director (since 19 July 2016)
APPOINTED: 1 September 2015
Michael has more than 30 years’ experience in the Australian energy industry. He has held various executive positions at AGL Energy culminating in his role as Managing Director and Chief Executive Officer for the period of seven years until February 2015.Michael is a Director of Aurizon Holdings Limited. He is also a former Chairman of the Clean Energy Council, Elgas Limited, ActewAGL and the NEMMCo Participants Advisory Committee, as well as a former Director of Queensland Gas Company Limited, the Australian Gas Association and the Energy Retailers Association of Australia. Michael is a member of the People and Remuneration Committee, a member of the Health Safety and Environment Committee and a member of the Nomination Committee.
6 Debra Goodin BEc FCA MAICD
Independent Director
APPOINTED: 1 September 2015
Debra (Debbie) has considerable experience as a non-executive director, including as a member and Chair of Board Audit and Risk Committees. She is currently a Director of ASX-listed companies Ten Network Holdings Limited, Senex Energy Limited and oOh!media Limited, and chairs the Audit and Risk Committees of each of those Boards.Debbie also has extensive executive experience in operations and corporate development, including with engineering and professional services firms, and is a Fellow of Chartered Accountants Australia and New Zealand.Debbie is a member of the Audit and Risk Management Committee, a member of the Health Safety and Environment Committee and a member of the Nomination Committee.
7 Russell Higgins AO
BEc FAICDIndependent Director
APPOINTED: 7 December 2004
Russell has extensive experience both locally and internationally, in the energy sector and in economic and fiscal policy. He was Secretary and Chief Executive Officer of the Department of Industry, Science and Resources from 1997 to 2002 and Chairman of the Australian Government’s Energy Task Force from 2003 to 2004.Russell is a Director of Telstra Corporation Limited and Argo Investments Limited. He is a former Chairman of the Global Carbon Capture and Storage Institute, the CSIRO Energy Transformed Flagship Advisory Committee and Snowy Hydro, as well as a former Director of Leighton Holdings Limited, Ricegrowers Limited (trading as SunRice), St James Ethics Foundation, Australian Biodiesel Group Limited, EFIC and the CSIRO. He was also previously a member of the Prime Ministerial Task Group on Emissions Trading.Russell is Chairman of the Health Safety and Environment Committee, and a member of the Audit and Risk Management Committee and a member of the Nomination Committee.
8 Patricia McKenzie
LLB FAICDIndependent Director
APPOINTED: 1 January 2011
Patricia has considerable expertise and experience in energy market regulation and, as a qualified solicitor, extensive corporate legal experience. She is currently Chair of Essential Energy and Healthdirect Australia.Patricia was formerly a Director of Macquarie Generation, TransGrid and the Australian Energy Market Operator Limited (AEMO), the national energy market operator for electricity and gas, and formerly the Chief Executive Officer of Gas Market Company Limited, the market administrator for retail competition in the gas industry in New South Wales and the Australian Capital Territory.Patricia is a member of the Health Safety and Environment Committee, a member of the People and Remuneration Committee and a member of the Nomination Committee.
1
2
3
4
7
8
5
6
6 APA Group Annual Report 2016
For
per
sona
l use
onl
y

apa group senior management.
9 Nevenka Codevelle
BCom LLM MAICDCompany Secretary and General Counsel
APPOINTED: 22 October 2015
Nevenka is responsible for APA Group’s Secretariat and Legal division. The division comprises the company secretarial, legal, and group risk and compliance functions.Nevenka joined APA Group in February 2008 and has held the role of General Counsel since June 2012. In October 2015, Nevenka joined the Executive team upon becoming Company Secretary. Prior to joining APA, Nevenka had over 15 years’ experience in private legal practice in Australia and overseas as an infrastructure and regulatory lawyer, and was an energy and infrastructure access policy advisor with the National Competition Council.
10 John Ferguson
MIGEAustGroup Executive Networks
John is responsible for the operation and management of APA Group’s fully and minority owned gas distribution assets, as well as for Australian Gas Networks assets – together covering 28,424 kilometres of gas distribution pipelines and 1.3 million gas users in eastern Australia.John joined APA Group in September 2008, continuing his 39-year career in the gas infrastructure business, covering operations, network development and gas marketing.
11 Peter Fredricson
BCom CA GAICDChief Financial Officer
Peter is responsible for all financial aspects of APA Group, including accounting and financial reporting, financial compliance and governance, taxation, treasury, balance sheet management, capital strategy, insurance, investor relations and information technology.Peter joined APA Group in June 2009. He has considerable expertise in the listed energy infrastructure sector and over 20 years’ experience in senior financial roles in financial services and investment banking organisations across Australia, New Zealand and Asia.
12 Ross Gersbach
BBus MAICD Chief Executive Strategy & Development
Ross is responsible for APA Group’s, strategy, energy investments, regulatory and government affairs, environmental development, and mergers and acquisitions.He has responsibility for further enhancing APA Group’s portfolio of assets that complement the value of its infrastructure, including APA Group’s investments in gas-fired and wind power generation, and the operation and development of these assets. Ross was previously a Director of APA Group from 2004 to 2008 joining the management team in April 2008 where he was responsible for all commercial aspects of APA Group. He has over 20 years’ experience in senior positions across a range of energy related sectors, covering areas such as infrastructure investments, mergers and acquisitions and strategic developments. Additionally, Ross has extensive commercial experience and has managed a portfolio of infrastructure assets in the natural gas and electricity distribution network sector.
13 Kevin Lester
BEng(Civil) MIEAust GAICD Group Executive Infrastructure Development
Kevin is responsible for the project development, engineering, procurement and delivery of APA Group’s infrastructure expansion projects. This division also has responsibility for providing asset management services, the technical regulation of all pipeline related assets, procurement, engineering services and the provision of land, approvals and asset protection services across APA.Kevin joined APA Group in August 2012 continuing a career in the management of major infrastructure projects, including energy infrastructure.Kevin is a Director and a Past President of the Australian Pipelines and Gas Association.
14 Elise Manns
BBus CAHRIGroup Executive Human Resources
Elise is responsible for managing APA Group’s Human Resources function, which covers HR strategy, health, safety and environment and all activities relating to our people, their development and employment.Elise joined APA Group in May 2012 as General Manager Human Resources and in October 2015 joined the Executive team becoming Group Executive Human Resources. Elise has a strong background in employment relations and workplace change, organisational restructuring and business improvement. Elise has over 25 years’ human resources experience in Australia’s heavy manufacturing, engineering, steel and utilities sectors.
15 Rob Wheals
BCom CA GAICD Group Executive Transmission
Rob is responsible for the management of the commercial and operational performance of APA Group’s transmission and gas storage assets.Rob joined APA Group in September 2008 and is responsible for managing APA’s customers and revenue contracts, as well as growing APA’s gas transmission revenues. This has included the organic expansion of APA Group’s gas transmission and storage portfolio, totalling in excess of $2 billion of capital projects. Rob is also responsible for managing all operational aspects of APA’s 15,000 kilometres of owned and operated gas transmission pipelines and gas storage facilities. Prior to joining APA, Rob had over 15 years of experience in telecommunications in Australia and internationally, including roles in finance, commercial, strategy, infrastructure investments and mergers and aquisitions, as well as regulatory.
12
15
10
13
11
14
9
7APA Group Annual Report 2016
For
per
sona
l use
onl
y

highlights FY2016.
market capitalisationas at 30 June 2016
41.5¢FY2016 total distribution per security
+9.2% on FY2015
33,478new network gas connections
$673.6 mtotal capital and investment expenditure
$1,330.5 mEBITDA
+61.8% on FY2015
$862.4 moperating cash flow
+58.2% on FY2015
$1,656.0 mrevenue excluding pass‑through
+48% on FY2015
$10.3b
8 APA Group Annual Report 2016
For
per
sona
l use
onl
y
highlights FY2016. continued.
1) Normalised financial results exclude significant items.2) Pass-through revenue is revenue on which no margin is earned. Pass-through revenue arises in the asset management operations in respect of costs incurred
and passed on to Australian Gas Networks Limited (“AGN”) and GDI in respect of the operation of the AGN and GDI assets respectively.3) This amount represents current and non-current borrowings as per balance sheet and is adjusted for deferred borrowing costs, the effect of unwinding of
discount, unrealised foreign exchange differences reported in equity and deducting other financial liabilities that are reported as part of borrowings in the balance sheet.
4) Between 23 December 2014 and 28 January 2015, APA issued a total of 278,556,562 new ordinary securities, resulting in total securities on issue of 1,114,307,369. The weighted average number of securities for FY2015 has been adjusted in accordance with the accounting principles of AASB133: ‘Earnings per Share’, for the rights issue.
5) Gearing = net debt divided by net debt plus equity.6) Operating cash flow = net cash from operations after interest and tax payments.
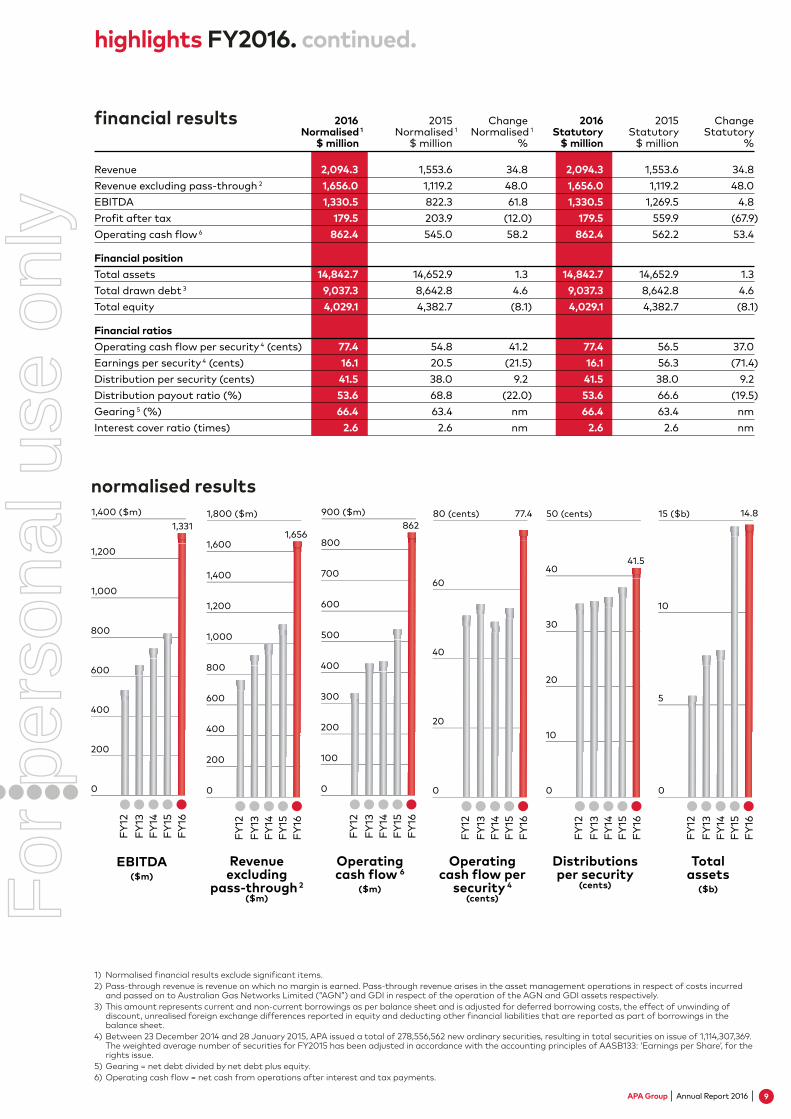
financial results 2016 2015 Change 2016 2015 Change Normalised 1 Normalised 1 Normalised 1 Statutory Statutory Statutory $ million $ million % $ million $ million %
Revenue 2,094.3 1,553.6 34.8 2,094.3 1,553.6 34.8Revenue excluding pass‑through 2 1,656.0 1,119.2 48.0 1,656.0 1,119.2 48.0EBITDA 1,330.5 822.3 61.8 1,330.5 1,269.5 4.8Profit after tax 179.5 203.9 (12.0) 179.5 559.9 (67.9)Operating cash flow 6 862.4 545.0 58.2 862.4 562.2 53.4
Financial positionTotal assets 14,842.7 14,652.9 1.3 14,842.7 14,652.9 1.3Total drawn debt 3 9,037.3 8,642.8 4.6 9,037.3 8,642.8 4.6Total equity 4,029.1 4,382.7 (8.1) 4,029.1 4,382.7 (8.1)
Financial ratiosOperating cash flow per security 4 (cents) 77.4 54.8 41.2 77.4 56.5 37.0Earnings per security 4 (cents) 16.1 20.5 (21.5) 16.1 56.3 (71.4)Distribution per security (cents) 41.5 38.0 9.2 41.5 38.0 9.2Distribution payout ratio (%) 53.6 68.8 (22.0) 53.6 66.6 (19.5)Gearing 5 (%) 66.4 63.4 nm 66.4 63.4 nmInterest cover ratio (times) 2.6 2.6 nm 2.6 2.6 nm
EBITDA ($m)
FY12
FY13
FY14
FY15
FY16
0
200
400
600
800
1,000
1,200
1,400 ($m)1,331
Operating cash flow per
security 4 (cents)
FY12
FY13
FY14
FY15
FY16
0
20
40
60
80 (cents) 77.4
normalised results
Revenue excluding
pass‑through 2 ($m)
FY12
FY13
FY14
FY15
FY16
0
200
400
600
800
1,000
1,200
1,400
1,600
1,800 ($m)
1,656
Operating cash flow 6
($m)
FY12
FY13
FY14
FY15
FY16
0
100
200
300
400
500
700
800
600
900 ($m)862
Total assets
($b)
FY12
FY13
FY14
FY15
FY16
0
5
10
15 ($b) 14.8
Distributions per security
(cents)
FY12
FY13
FY14
FY15
FY16
0
10
20
30
40
50 (cents)
41.5
9APA Group Annual Report 2016
For
per
sona
l use
onl
y
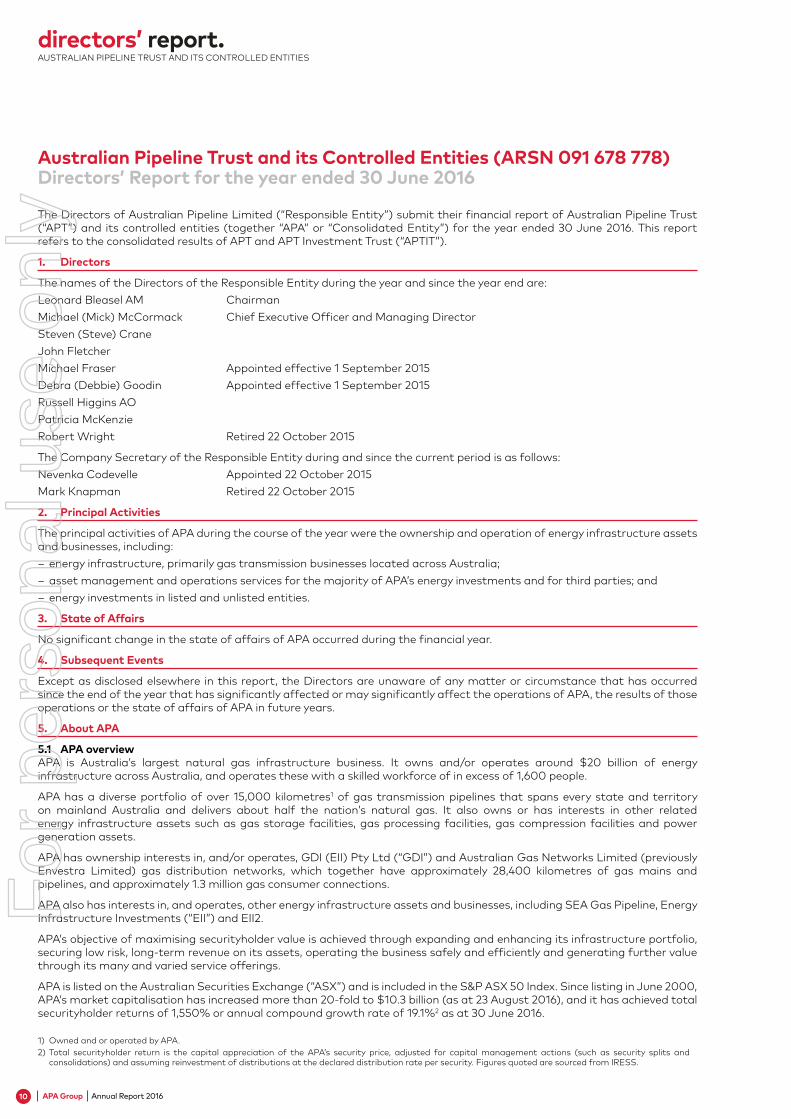
Australian Pipeline Trust and its Controlled Entities (ARSN 091 678 778)Directors’ Report for the year ended 30 June 2016
The Directors of Australian Pipeline Limited (“Responsible Entity”) submit their financial report of Australian Pipeline Trust (“APT”) and its controlled entities (together “APA” or “Consolidated Entity”) for the year ended 30 June 2016. This report refers to the consolidated results of APT and APT Investment Trust (“APTIT”).
1. Directors
The names of the Directors of the Responsible Entity during the year and since the year end are:Leonard Bleasel AM ChairmanMichael (Mick) McCormack Chief Executive Officer and Managing DirectorSteven (Steve) CraneJohn FletcherMichael Fraser Appointed effective 1 September 2015Debra (Debbie) Goodin Appointed effective 1 September 2015Russell Higgins AOPatricia McKenzieRobert Wright Retired 22 October 2015
The Company Secretary of the Responsible Entity during and since the current period is as follows:Nevenka Codevelle Appointed 22 October 2015Mark Knapman Retired 22 October 2015
2. Principal Activities
The principal activities of APA during the course of the year were the ownership and operation of energy infrastructure assets and businesses, including:
– energy infrastructure, primarily gas transmission businesses located across Australia; – asset management and operations services for the majority of APA’s energy investments and for third parties; and – energy investments in listed and unlisted entities.
3. State of Affairs
No significant change in the state of affairs of APA occurred during the financial year.
4. Subsequent Events
Except as disclosed elsewhere in this report, the Directors are unaware of any matter or circumstance that has occurred since the end of the year that has significantly affected or may significantly affect the operations of APA, the results of those operations or the state of affairs of APA in future years.
5. About APA
5.1 APA overviewAPA is Australia’s largest natural gas infrastructure business. It owns and/or operates around $20 billion of energy infrastructure across Australia, and operates these with a skilled workforce of in excess of 1,600 people.
APA has a diverse portfolio of over 15,000 kilometres1 of gas transmission pipelines that spans every state and territory on mainland Australia and delivers about half the nation’s natural gas. It also owns or has interests in other related energy infrastructure assets such as gas storage facilities, gas processing facilities, gas compression facilities and power generation assets.
APA has ownership interests in, and/or operates, GDI (EII) Pty Ltd (“GDI”) and Australian Gas Networks Limited (previously Envestra Limited) gas distribution networks, which together have approximately 28,400 kilometres of gas mains and pipelines, and approximately 1.3 million gas consumer connections.
APA also has interests in, and operates, other energy infrastructure assets and businesses, including SEA Gas Pipeline, Energy Infrastructure Investments (“EII”) and EII2.
APA’s objective of maximising securityholder value is achieved through expanding and enhancing its infrastructure portfolio, securing low risk, long-term revenue on its assets, operating the business safely and efficiently and generating further value through its many and varied service offerings.
APA is listed on the Australian Securities Exchange (“ASX”) and is included in the S&P ASX 50 Index. Since listing in June 2000, APA’s market capitalisation has increased more than 20-fold to $10.3 billion (as at 23 August 2016), and it has achieved total securityholder returns of 1,550% or annual compound growth rate of 19.1%2 as at 30 June 2016.
1) Owned and or operated by APA. 2) Total securityholder return is the capital appreciation of the APA’s security price, adjusted for capital management actions (such as security splits and
consolidations) and assuming reinvestment of distributions at the declared distribution rate per security. Figures quoted are sourced from IRESS.
directors’ report.AUSTRALIAN PIPELINE TRUST AND ITS CONTROLLED ENTITIES
10 APA Group Annual Report 2016
For
per
sona
l use
onl
y

directors’ report. continued.AUSTRALIAN PIPELINE TRUST AND ITS CONTROLLED ENTITIES
5.2 APA objectives and strategiesAPA’s objectives of providing secure and predictable returns to its investors is supported by its strategies of:
– continuing to grow our ownership interests in transmission pipelines through further expanding the East and West Coast Grids;
– growing other midstream energy infrastructure assets; – leveraging APA’s asset management, development and operational capabilities; – providing a safe, stimulating and rewarding workplace; – delivering responsive, valuable solutions to customers; – continuing to deliver an environmentally responsible, safe and essential service; – contributing to the communities APA serves; and – maintaining APA’s financial strength, flexibility and capability.
APA is an owner and operator of energy infrastructure that is underpinned by long term contracts with highly creditworthy counterparties.
This strategy has remained consistent since listing.
During the financial year, APA conducted a review of its growth opportunities. APA will continue to be focused on growing the business and has identified ample opportunities over the long term; both organic growth and potential acquisitions.
5.3 APA assets and operationsAPA is a major participant in developing, owning and operating natural gas transportation and energy infrastructure across Australia.
APA’s assets and operations are reported in three principal business segments: – Energy Infrastructure, which includes all of APA’s wholly or majority owned pipelines, gas storage assets, gas compression assets, the Emu Downs wind farm and the Diamantina and Leichhardt power stations;
– Asset Management, which provides commercial, operating services and/or asset maintenance services to its energy investments for appropriate fees; and
– Energy Investments, which includes APA’s strategic stakes in a number of investment vehicles that house energy infrastructure assets, generally characterised by long-term secure cash flows, with low ongoing capital expenditure requirements.
APA Group assets Wind farm
Gas storage facility
Gas processing plant
Gas power station
Numbers correspond with names on page 12
APA Group investments
APA managed (not owned by APA)
15 2626
26
14
28
26 6
2
4
87
3
1
528
26
28
2626
23
29
109
28
12
11
25
26
2728
24
13
17
18
16
19
21
22
20
WA
SA
NT
QLD
VIC
TAS
NSW
APA GROUP ASSETS AND OPERATIONS
11APA Group Annual Report 2016
For
per
sona
l use
onl
y

directors’ report. continued.AUSTRALIAN PIPELINE TRUST AND ITS CONTROLLED ENTITIESdirectors’ report. continued.AUSTRALIAN PIPELINE TRUST AND ITS CONTROLLED ENTITIES
Energy Infrastructure assets (numbers correspond with those on the map on page 11)
Length/Capacity Regulatory status
East Coast and Northern Territory assets1) Roma Brisbane Pipeline (including Peat Lateral) 583 km / 233 TJ/d Full regulation2) Carpentaria Gas Pipeline 944 km / 119 TJ/d Light regulation3) Berwyndale Wallumbilla Pipeline 112 km Not regulated4) South West Queensland Pipeline 936 km / 384 TJ/d Not regulated5) Wallumbilla Gladstone Pipeline (including Laterals) 556 km / 1,510 TJ/d Not regulated6) Diamantina and Leichhardt Power Stations 242 MW / 60 MW Not regulated7) Moomba Sydney Pipeline 2,029 km / 439 TJ/d Light regulation (partial)8) Ethane Pipeline 1,375 km Not regulated9) Central West Pipeline 255 km Light regulation10) Central Ranges Pipeline 295 km Full regulation11) Victorian Transmission System 1,847 km Full regulation12) Dandenong LNG Storage Facility 12,000 tonnes Not regulated13) SESA Pipeline 45 km Not regulated14) Amadeus Gas Pipeline 1,657 km Full regulation
10,634 km
West Australian assets15) Pilbara Pipeline System 249 km / 166 TJ/d Not regulated16) Goldfields Gas Pipeline (88.2%) 1,546 km / 202 TJ/d Full regulation17) Eastern Goldfields Pipeline 293 km Not regulated18) Kalgoorlie Kambalda Pipeline 44 km Light regulation19) Mid West Pipeline (50%) 362 km / 11 TJ/d Not regulated20) Parmelia Gas Pipeline 448 km / 50 TJ/d Not regulated21) Mondarra Gas Storage Facility 15 PJ Not regulated22) Emu Downs Wind Farm 80 MW Not regulated
2,942 km
Energy Investments and Asset Management (numbers correspond with those on the map on page 11)
Energy Investment Ownership interest
23) GDI 20% Gas distribution: 3,355 km of gas mains, 99,699 gas consumer connections in Qld
24) SEA Gas Pipeline 50% Gas pipeline: 687 km pipeline from Iona and Port Campbell, Victoria to Adelaide, SA
25) Mortlake Gas Pipeline
50% Gas pipeline: 83 km pipeline from Otway Gas Plant near Port Campbell to Mortlake Power Station
26) Energy Infrastructure Investments
19.9% Gas pipelines: Telfer/Nifty Gas Pipelines and lateral (488 km); Bonaparte Gas Pipeline (286 km); Wickham Point Pipeline (12 km)Electricity transmission cables: Murraylink (180 km) and Directlink (63 km)Gas-fired power stations: Daandine Power Station (33MW) and X41 Power Station (41 MW)Gas processing facilities: Kogan North (12 TJ/d); Tipton West (29 TJ/d)
27) EII2 20.2% Wind generation: North Brown Hill Wind Farm (132MW), SA
28) Australian Gas Networks
Nil 1 Gas distribution: 23,720 km of gas mains and pipelines, 1.23 million gas consumer connections, 1,124 km of pipelines in SA, Vic, NSW, Qld & NT
29) Tamworth Gas Network
100% Gas distribution: 225 km of gas mains, 3,047 gas consumer connections
1) In August 2014, APA sold its 33.05% ownership interest in Australian Gas Networks Limited (“AGN”, formerly Envestra Limited). Operating and maintenance agreements with AGN remain in place until 2027.
12 APA Group Annual Report 2016
For
per
sona
l use
onl
y

directors’ report. continued.AUSTRALIAN PIPELINE TRUST AND ITS CONTROLLED ENTITIES
6. Financial Overview
Earnings before interest and tax (“EBIT”) and EBIT before depreciation and amortisation (“EBITDA”) excluding significant items are financial measures not prescribed by Australian Accounting Standards (“AIFRS”) and represent the profit under AIFRS adjusted for specific significant items. The Directors consider these measures to reflect the core earnings of the Consolidated Entity, and these are therefore described in this report as ‘normalised’ measures.
For the financial year to 30 June 2016 APA reported EBITDA of $1,330.5 million, an increase of 61.8% or $508.3 million on the previous corresponding period normalised EBITDA of $822.3 million. 1
Revenue (excluding pass-through revenue) increased by $533.0 million to $1,656.0 million, an increase of 48.0% on the previous corresponding period (FY2015: $1,119.2 million).
Increased revenues and EBITDA were primarily attributable to: – a full year contribution from the Wallumbilla Gladstone Pipeline; – full year contribution from the expanded East Coast Grid (South West Queensland Pipeline in particular); – part-year contributions from the Ethane Pipeline and the Diamantina and Leichhardt Power Stations acquired during the year; and
– commissioning of the Eastern Goldfields Pipeline in November 2015.
These increases were partially offset by an increase in corporate costs, driven mainly by the North East Gas Interconnect project and APA’s bid for the Iona gas storage facility during the financial year. Ongoing compliance costs relating to a number of inquiries into the gas market and costs associated with an externally facilitated strategy and planning review undertaken during the year also contributed to the increase.
Depreciation, amortisation and interest costs each increased by 150.2% and 56.6% respectively, as a result of the acquisition of the Wallumbilla Gladstone Pipeline, adding further significant fixed and intangible assets that are depreciated and amortised for the full year and due to the increase in debt as part of the funding of the acquisition. This resulted in a decrease of profit after tax by 12.0% to $179.5 million (FY2015 (normalised): $203.9 million).
An important primary measure of the success of APA’s business and the execution of its strategy is that of operating cash flow, which was $862.4 million for FY2016. This represents an increase of 58.2% or $317.4 million over the previous year (FY2015 (normalised): $545.0 million), with operating cash flow per security increasing by 41.2%, or 22.6 cents, to 77.4 cents per security (FY2015 (normalised): 54.8 cents per security).
APA’s distributions in respect of the financial year total 41.5 cents per security, representing an increase of 9.2%, or 3.5 cents, over FY2015 distributions of 38.0 cents. APA maintains a sustainable distribution policy to ensure its ability to fully fund its distributions out of operating cash flows whilst also retaining appropriate levels of cash in the business to support ongoing growth. The lower distribution level in FY2016 reflects the increase in contribution from the Wallumbilla Gladstone Pipeline and APA’s guidance to investors that the payout ratio would fall somewhat following the acquisition to allow for future sustainable growth in distribution and funding of ongoing growth of the business as per APA’s current distribution policy.
The following table provides a summary of key financial data for FY2016 and includes key reconciling items between statutory results and the normalised financial measures.
1) Excluding significant items of $447.2 million relating mainly to profit on the sale of APA’s shareholding in Australian Gas Networks Limited, previously Envestra Limited.
13APA Group Annual Report 2016
For
per
sona
l use
onl
y

directors’ report. continued.AUSTRALIAN PIPELINE TRUST AND ITS CONTROLLED ENTITIES
30
Jun
e 20
16
30 J
une
2015
C
hang
es in
C
hang
es in
($0
00)
($
00
0)
Stat
utor
y ac
coun
ts
Nor
mal
ised
acc
ount
s
Sign
ifica
nt
Sign
ifica
nt
St
atut
ory
item
s N
orm
alis
ed
Stat
utor
y ite
ms 2
N
orm
alis
ed
$0
00
%
$
00
0
%
Tota
l rev
enue
2,
094,
304
– 2,
094,
304
1,553
,615
–
1,553
,615
54
0,68
9 34
.8%
54
0,68
9 34
.8%
Pass
-thr
ough
reve
nue 1
438,
330
– 43
8,33
0 43
4,38
2 –
434,
382
3,94
8 0.
9%
3,94
8 0.
9%
Tota
l rev
enue
exc
ludi
ng p
ass-
thro
ugh
1,655
,974
–
1,655
,974
1,1
19,2
33
– 1,1
19,2
33
536,
741
48.0
%
536,
741
48.0
%
EBIT
DA
1,3
30,5
43
– 1,3
30,5
43
1,269
,490
44
7,240
82
2,25
0 61
,053
4.
8%
508,
293
61.8
%D
epre
ciat
ion
and
amor
tisat
ion
expe
nses
(5
20,8
90)
– (5
20,8
90)
(208
,200
) –
(208
,200
) (3
12,6
90)
(150
.2%
) (3
12,6
90)
(150
.2%
)
EBIT
80
9,65
3 –
809,
653
1,061
,290
44
7,240
61
4,05
0 (2
51,6
37)
(23.
7%)
195,
603
31.9
%Fi
nanc
e co
sts
and
inte
rest
inco
me
(507
,658
) –
(507
,658
) (3
24,16
2)
– (3
24,16
2)
(183
,496
) (5
6.6%
) (1
83,4
96)
(56.
6%)
Prof
it be
fore
inco
me
tax
301,9
95
– 30
1,995
73
7,128
44
7,240
28
9,88
8 (4
35,13
3)
(59.
0%)
12,10
7 4.
2%In
com
e ta
x (e
xpen
se) /
ben
efit
(122
,524
) –
(122
,524
) (1
77,19
8)
(91,2
22)
(85,
976)
–
30.9
%
– (4
2.5%
)
Prof
it a
fter
inco
me
tax
179,
471
– 17
9,47
1 55
9,930
35
6,01
8 20
3,91
2 (3
80,3
07)
(67.9
%)
(24,
441)
(1
2.0%
)
Ope
ratin
g ca
sh fl
ow 3
862,
435
– 86
2,43
5 56
2,19
0 17
,201
54
4,98
9 30
0,24
5 53
.4%
31
7,446
58
.2%
Ope
ratin
g ca
sh fl
ow p
er s
ecur
ity (c
ents
) 77
.4
77
.4
56.5
54.8
20
.9
37.0
%
22.6
41
.2%
Earn
ings
per
sec
urity
(cen
ts)
16.1
16
.1 56
.3
20
.5
(40.
2)
(71.4
%)
(4.4
) (2
1.5%
)D
istrib
utio
n pe
r sec
urity
(cen
ts)
41.5
41.5
38
.0
38
.0
3.5
9.2%
3.
5 9.
2%D
istrib
utio
n pa
yout
ratio
4
53.6
%
53
.6%
66
.6%
68.8
%
(13.
0%)
(19.
5%)
(15.
1%)
(22.
0%)
Wei
ghte
d av
erag
e nu
mbe
r of s
ecur
ities
(000
) 1,1
14,3
07
1,1
14,3
07
995,
245
99
5,24
5 11
9,06
2 12
.0%
11
9,06
2 12
.0%
Not
es: N
umbe
rs in
the
tab
le m
ay n
ot a
dd u
p du
e to
roun
ding
.1)
Pas
s-th
roug
h re
venu
e is
rev
enue
on
whi
ch n
o m
argi
n is
ear
ned.
Pas
s-th
roug
h re
venu
e ar
ises
in t
he a
sset
man
agem
ent
oper
atio
ns in
res
pect
of
cost
s in
curr
ed in
, and
pas
sed
on t
o A
ustr
alia
n G
as N
etw
orks
Lim
ited
(“A
GN
”, fo
rmer
ly E
nves
tra
Lim
ited)
and
GD
I in
resp
ect
of t
he o
pera
tion
of t
he A
GN
and
GD
I ass
ets
resp
ectiv
ely.
2) S
igni
fican
t ite
ms:
20
15 re
late
s to
a n
et g
ain
real
ised
from
the
sal
e of
APA
’s in
vest
men
t in
AG
N a
s w
ell a
s th
e su
cces
sful
reco
very
of f
ees
paid
by
Has
tings
Div
ersi
fied
Util
ities
Fun
d to
Has
tings
Fun
ds M
anag
emen
t Li
mite
d.3)
Ope
ratin
g ca
sh f
low
= n
et c
ash
from
ope
ratio
ns a
fter
inte
rest
and
tax
pay
men
ts.
4) D
istr
ibut
ion
payo
ut ra
tio =
tot
al d
istr
ibut
ion
paym
ents
as
a pe
rcen
tage
of
norm
alis
ed o
pera
ting
cash
flo
w.
dire
ctor
s’ re
port
. con
tinu
ed.
AU
STR
ALI
AN
PIP
ELIN
E TR
US
T A
ND
ITS
CO
NTR
OLL
ED E
NTI
TIES
14 APA Group Annual Report 2016
For
per
sona
l use
onl
y

directors’ report. continued.AUSTRALIAN PIPELINE TRUST AND ITS CONTROLLED ENTITIES
7. Business Segment Performances and Operational Review
Statutory reported revenue and EBITDA performance of APA’s business segments is set out in the table below.
Changes
30 June 2016 30 June 2015 $000 $000 $000 %
Revenue (continuing businesses)Energy Infrastructure East Coast Grid: Queensland 939,963 388,916 551,047 141.7% East Coast Grid: NSW 143,427 137,998 5,429 3.9% East Coast Grid: Victoria 152,991 163,592 (10,601) (6.5%) East Coast Grid: South Australia 2,871 2,725 146 5.4% Northern Territory 28,843 27,877 966 3.5% Western Australia 260,481 265,972 (5,491) (2.1%)
Energy Infrastructure total 1,528,576 987,080 541,496 54.9%Asset Management 95,430 85,056 10,374 12.2%Energy Investments 28,271 21,784 6,487 29.8%
Total segment revenue 1,652,277 1,093,920 558,357 51.0%Pass-through revenue 438,330 434,382 3,948 0.9%Unallocated revenue 1 3,697 24,322 (20,625) (84.8%)Divested business 2 – 991 (991) (100.0%)
Total revenue 2,094,304 1,553,615 540,689 34.8%
EBITDA (continuing businesses)Energy Infrastructure East Coast Grid: Queensland 855,753 340,131 515,622 151.6% East Coast Grid: NSW 121,709 120,808 901 0.7% East Coast Grid: Victoria 120,583 130,170 (9,587) (7.4%) East Coast Grid: South Australia 2,536 1,940 596 30.7% Northern Territory 17,460 17,954 (494) (2.8%) Western Australia 217,558 212,604 4,954 2.3%
Energy Infrastructure total 1,335,599 823,607 511,992 62.2%Asset Management 53,858 49,448 4,410 8.9%Energy Investments 27,796 21,783 6,012 27.6%Corporate costs (86,710) (73,579) (13,131) 17.8%
Total segment EBITDA 1,330,543 821,259 509,284 62.0%Divested business 2 – 991 (991) (100.0%)
Total EBITDA before significant items 1,330,543 822,250 508,293 61.8%Significant items 3 – 447,240 (447,240) (100.0%)
Total EBITDA 1,330,543 1,269,490 61,053 4.8%
Notes: Numbers in the table may not add up due to rounding.1) Interest income is not included in calculation of EBITDA, but nets off against interest expense in calculating net interest cost.2) Investment in Australian Gas Networks Limited (“AGN”) sold in August 2014.3) Significant items: For FY2015, these relate to net proceeds realised from the sale of APA’s investment in AGN as well as successful recovery of fees paid by
Hastings Diversified Utilities Fund to Hastings Funds Management Limited.
APA’s financial performance during the financial year reflects solid operations and continued investment in our assets.
Total segment EBITDA, which is earnings from APA’s continuing businesses, increased by $509.3 million, or 62.0%, to $1,330.5 million, over FY2015 figure of $821.3 million).
APA derives its revenue through a mix of regulated revenue, long-term negotiated revenue contracts, asset management fees and investment earnings. Earnings are underpinned by solid cash flows generated from high quality, geographically diversified assets and a portfolio of highly creditworthy customers.
15APA Group Annual Report 2016
For
per
sona
l use
onl
y

directors’ report. continued.AUSTRALIAN PIPELINE TRUST AND ITS CONTROLLED ENTITIES
7.1 Energy InfrastructureThe Energy Infrastructure segment includes the interconnected energy infrastructure footprint across the mainland of Australia and includes gas transmission, gas compression and storage assets and a number of other wholly owned energy infrastructure assets. During the financial year, the Ethane Pipeline and the Diamantina and Leichhardt Power Stations were transferred into this segment from the Energy Investment segment, as APA gained full ownership of these assets. These acquisitions were in line with APA’s strategy to continue to invest in energy infrastructure that is underpinned by long term contracts from highly creditworthy counterparties.
This segment contributed 92.5% of group revenue (for continuing businesses, excluding pass-through) and 94.2% of group EBITDA (for continuing businesses and before corporate costs) during the financial year. Revenue (excluding pass-through revenue) was $1,528.6 million, an increase of 54.9% on the previous year (FY2015: $987.1 million). EBITDA (for continuing businesses, before corporate costs) increased by 62.2% on the previous year to $1,335.6 million (FY2015: $823.6 million). The majority of revenues in the Energy Infrastructure segment is derived from either regulatory arrangements or long term capacity-based contracts.
Regulatory arrangements on regulated assets are reviewed every five years. A national regulatory regime includes mechanisms for regulatory pricing and is encapsulated in the National Gas Law and National Gas Rules. The economic regulation aspects of the regime apply to most gas distribution networks and a number of gas transmission pipelines in Australia.
The regime provides for two forms of regulation based on a pipeline’s relative market power – full regulation and light regulation. For assets under full regulation, the regulator approves price and other terms of access for standard (“reference”) services as part of an access arrangement process, such that the asset owner has a reasonable opportunity to recover at least the efficient costs of owning and operating the asset to provide the reference services. Access arrangement periods usually run for five years. For assets under light regulation, contractual terms (including price) are negotiated between the service provider and customer with recourse to arbitration by the regulator in the absence of agreement.
Contracted revenues are sourced from unregulated assets and assets under light regulation as well as assets under full regulation. Contracts generally entitle customers to capacity reservation, with the majority of the revenue fixed over the term of the relevant contract. There is typically a small portion of the contract subject to throughput volume. The split between capacity charge and throughput charge differs between contracts and generally ranges from 85%/15% to 100%/0%.
During the financial year, 75% of Energy Infrastructure revenue (excluding pass-through) was from capacity reservation charges from term contracts, 6% from other contracted fixed revenues and 7% from throughput charges and other variable components. Given the dynamic east coast gas market, there were additional revenues from provision of flexible short term services, accounting for around 2.0%. The portion of APA’s revenue that is regulated has decreased to about 10% of FY2016 Energy Infrastructure revenue.
Capacity charge revenue: 75%Regulated revenue: 10%Throughput charge & other variable revenue: 7%Other contracted fixed revenue: 6%Flexible short term services: 2.0%Other: 0.3%
FY2016 REVENUES BY CONTRACT TYPE APA 1 PIPELINES BY REGULATION TYPE
Full regulation pipelines
Light regulation pipelines
Not regulated pipelines
1) Owned and/or operated by APA
The increase in FY2016 earnings for Energy Infrastructure was primarily due to the full year contribution of the Wallumbilla Gladstone Pipeline (acquired June 2015), approximately seven months’ contribution from the Eastern Goldfields Pipeline (commissioned November 2015), three months’ EBITDA contribution from the Diamantina and Leichhardt Power Stations (acquired March 2016) and approximately two and a half months’ EBITDA contribution from the Ethane Pipeline (acquisition completed June 2016) as well as contributions from various other expansions that commissioned during the period.
16 APA Group Annual Report 2016
For
per
sona
l use
onl
y

directors’ report. continued.AUSTRALIAN PIPELINE TRUST AND ITS CONTROLLED ENTITIES
ENERGY INFRASTRUCTURE REVENUE BY STATE ENERGY INFRASTRUCTURE EBITDA BY STATE
FY12 FY13 FY14 FY15 FY16QLDNSWVICSANTWA EBITDA margin
(RHS)
75%
80%
85%
90%
0
200
400
600
800
1,000
1,200
A$1,400m
FY12 FY13 FY14 FY15 FY16QLDNSWVICSANTWA
0
200
400
600
800
1,000
1,200
A$1,400m
ENERGY INFRASTRUCTURE EBITDA BY PIPELINE
FY16
FY15
FY14
FY13
FY12
A$m 0 200 400 600 800 1000 1200 1400
Wallumbilla Gladstone Pipeline South West Queensland Pipeline Roma Brisbane Pipeline
Carpentaria Gas Pipeline Other Qld assets Moomba Sydney Pipeline
Victorian Transmission System SESA Pipeline Amadeus Gas Pipeline
Goldfields Gas Pipeline Eastern Goldfields Pipeline Emu Downs wind farm
Pilbara Pipeline System Mondarra gas storage Other WA
Note:The charts above exclude discontinued operations previously accounted for within Energy Infrastructure, including earnings from Allgas Networks and Moomba to Adelaide Pipeline.
APA manages its counterparty risk in a variety of ways. One aspect is to consider customers’ credit ratings. During FY2016, around 94% of revenue was received from investment grade counterparties. Diversification of customer base is another – during FY2016, 56% from energy sector customers (includes BG Group, on the Wallumbilla Gladstone Pipeline in particular); 29% of revenue was from customers in the utility sector; 12% from resources sector customers; and 3% from industrial customers. Revenues by customer industry segment changed from the majority sourced from utility customers in FY2015 to the majority coming from energy customers in FY2016, reflecting the impact of the long term contracts on the Wallumbilla Gladstone Pipeline.
FY2016 ENERGY INFRASTRUCTURE REVENUES FY2016 ENERGY INFRASTRUCTURE REVENUESBY COUNTERPARTY CREDIT RATING BY CUSTOMER INDUSTRY SEGMENT
A- rated or better: 51%BBB & BBB+ rated: 22%BBB- rated: 21%Not rated: 3%Sub-investment grade: 3%
Energy: 56%Utility: 29%Resources: 12%Industrial: 3%
17APA Group Annual Report 2016
For
per
sona
l use
onl
y

directors’ report. continued.AUSTRALIAN PIPELINE TRUST AND ITS CONTROLLED ENTITIES
APA’s Integrated Operations Centre (“IOC”) in Brisbane is now the operations control centre for APA’s transmission pipeline assets across the country. Centralised control at APA’s IOC, which houses a multi-disciplinary team of pipeline controllers, engineers, technicians and commercial operations specialists, has enabled more agile implementation of customer needs and allows APA to ensure that gas is moved to where it is required by customers in the most timely and efficient manner. The IOC, coupled with our unique customer management system, APA Grid, allows APA to offer innovative services to customers.
Supporting LNG plant swingsOne of the LNG projects wanted to borrow a sizeable amount of gas, then repay that loan as well as park an additional quantity of gas over the following week.
APA’s team at the IOC reviewed the request in light of: – conditions at the time; – forecast operational conditions; – other customer requirements during this period; and – physical limitations of the APA Grid.
This facilitated avoidance of producers’ well turndowns, unnecessary flaring and meeting producers’ production targets.
East Coast Grid + Northern TerritoryAPA’s 7,500 plus kilometre integrated pipeline grid on the east coast of Australia has the ability to transport gas seamlessly from multiple gas production facilities to gas users across four states and the ACT, as well as to the export LNG market which has developed out of Gladstone. With the proposed construction of the Northern Gas Pipeline, APA’s Northern Territory assets will in the future be connected to the East Coast Grid.
During FY2016, APA purchased the remaining 50% stake in the Diamantina and Leichhardt Power Stations, adding further complementary assets to the East Coast Grid that will continue to enhance our service offering to our customers on the east coast of Australia.
Seamless and Flexible Services ensure continuity of energy supplyIn FY2016, the South West Queensland Pipeline changed flow direction regularly to meet changing demand patterns in southern states, driven largely by weather and electricity demand.
During the recent South Australian electricity crisis, APA helped facilitate the transportation of additional gas from the northern markets into the South Australia market to ensure gas was available for power generation.
In one instance, within 24 hours of receiving an initial inquiry, APA had concluded the commercial arrangements, implemented changes in the customer management system and was physically delivering gas for the customer.
In addition, APA’s Integrated Operations Centre anticipated an increased demand for gas in NSW and the Victorian markets and configured the pipeline grid to ensure continuity of gas supply.
Bi-directional and multi-asset services across our interconnected East Coast Grid have meant that APA is now a “one-stop shop” for many energy producers and users. Customers have the flexibility to access 40 receipt points and approximately 100 delivery points across the East Coast Grid.
APA has continued to invest in pipeline assets and services, commencing hub services at the Moomba gas hub, in addition to the Wallumbilla hub, and providing enhanced information transparency to the market via APA’s website.
FY2016 saw a material increase in earnings from assets in Queensland. This was largely driven by acquisitions (full year benefit from Wallumbilla Gladstone Pipeline and three months contribution from Diamantina and Leichhardt Power Stations). This was partially offset by a slight reduction in volumes on the Carpentaria Gas Pipeline due to reduced deliveries to power generators off the pipeline, given that the Diamantina Power Station is a more efficient power station than the previous incumbent, Mica Creek.
Contracts from phase 1 of the Victoria Northern Interconnect expansion project contributed for the full financial year. Revenue generated from these contracts was recorded across NSW and Victoria. Revenue and EBITDA in Victoria decreased in FY2016 compared to last year, partially due to weaker volumes and non-recurrence of a one-off item during FY2015.
APA also purchased the remaining 94% of the Ethane Pipeline Income Fund that it did not own during FY2016. The Ethane Pipeline now forms part of the Energy Infrastructure segment.
During the financial year, APA’s assets in the Northern Territory continued to perform to expectations.
CRP
VTS
CGP
fCurtis LNG acilities
WGP
BWP
SWQP
RBPIOC
CWP
MSP
Park + loan services
18 APA Group Annual Report 2016
For
per
sona
l use
onl
y

directors’ report. continued.AUSTRALIAN PIPELINE TRUST AND ITS CONTROLLED ENTITIES
Western AustraliaIn Western Australia, APA’s assets serve a variety of customers in the resources, industrial and utility sectors, mainly in the Perth, Pilbara and Goldfields regions.
EBITDA from APA’s western assets for the financial year was up slightly by 2.3% compared with the previous corresponding period.
Connecting Australia to reliable energyAPA’s new 293km Eastern Goldfields Pipeline enables delivery of energy to the remote mining area of eastern Goldfields, 365 days of the year.
Switching from trucked in diesel to piped natural gas as the main fuel source for the AngloAshanti mines, means there are nearly 1,500 less annual diesel transportation movements to Tropicana and Sunrise Dam from the west coast of Western Australia annually.
This means less exposure to fuel price volatility, improved safety for the mine workers, longer term fuel reliability for the mines and lower greenhouse gas emissions.
The Eastern Goldfields Pipeline (“EGP”), which was commissioned in November 2015, contributed seven months earnings from gas transportation agreements with AngloGold Ashanti. A new agreement to transport gas to the Gold Fields Limited owned Granny Smith gold mine commenced in April 2016 and contributed three months earnings. With over 1,800km of pipeline infrastructure able to securely and reliably transport gas to the Goldfields mining region, APA continues to work with interested parties on other opportunities in the region.
Further, earnings from the Mondarra Gas Storage Facility increased due to additional capacity generated through an injection/ withdrawal well enhancement project that was contracted to an existing customer. There continues to be interest from the market for gas storage services, which enables customers to manage their gas portfolios effectively.
These increases were partially offset by a reduction in revenue from the Goldfields Gas Pipeline (“GGP”) for the current period, reflecting tariff reductions contained in the final decision by the Economic Regulation Authority (“ERA”) on the access arrangement for the GGP that was announced on 30 June 2016. Whilst cash flow was not impacted during the year due to the timing of the final decision, the ultimate outcome has been provided for in the FY2016 results. Refer to section 10 for more background.
Storage capacity at APA's Mondarra Gas Storage Facility was increased during FY2016 with the completion of a new injection/withdrawal well.
19APA Group Annual Report 2016
For
per
sona
l use
onl
y

directors’ report. continued.AUSTRALIAN PIPELINE TRUST AND ITS CONTROLLED ENTITIES
7.2 Asset ManagementAPA provides asset management and operational services to the majority of its energy investments and to a number of third parties. Its main customers are Australian Gas Networks Limited (“AGN”), Energy Infrastructure Investments and GDI (EII). Asset management services are provided to these customers under long term contracts.
Revenue (excluding pass-through revenue) from asset management services increased by $10.4 million or 12.2% to $95.4 million (FY2015: $85.1 million) and EBITDA (for continuing businesses, excluding corporate costs) increased by $4.4 million or 8.9% to $53.9 million (FY2015: $49.4 million).
ASSET MANAGEMENT REVENUE ASSET MANAGEMENT EBITDA
A$100m
75
50
25
One-off Customer Contributions
0
Underlying Asset Management Revenue
FY12 FY13 FY14 FY15 FY16
A$80m
60
40
20
FY12One-off Customer Contributions
FY13 FY14 FY15 FY160
Underlying Asset Management EBITDA
This increase in revenue and EBITDA is due to organic growth, reflecting increases in connections and asset management fees. This was partially offset by low gas volumes in the second half of FY2016, mainly due to a milder winter, which affects management fees earnt.
The gas distribution businesses of the bulk of AGN and GDI have seen solid connection growth through continued investment in new housing estates and high rise apartment developments as natural gas continues to be a fuel of choice for cooking, hot water and heating in these markets.
CUSTOMER CONTRIBUTIONS
FY12
Average ~$10m p.a.
FY13 FY14 FY15 FY160
20
A$m
Customer contributions were in-line with the long term average of approximately $10 million per annum. APA continues to expect annual swings in customer contributions, as these are driven by customers’ work programmes and requirements.
APA sold its 33.05% stake in AGN in August 2014, however, the operating and maintenance agreements remain on foot until 2027.
STATISTICSNetwork assets owned and/or operated by APAGas consumersNew connections 33,478Total connections 1,335,534
Natural gas distribution networksNew pipelines 453kmReplacement pipelines 416kmTotal pipelines managed 28,424km
Gas transported 110.5PJ
Solid residential construction continues to benefit gas connection numbers. APA has secured penetration of 99% for new homes built in Victoria, and has an arrangement to connect 37k new homes in the Merrifield area of Melbourne’s northern growth corridor over the next 20 years.
FY13 FY14 FY15 FY161.2
1.3
GAS CONSUMER CONNECTIONS GROWTH ON APA OPERATED GAS NETWORK
1.4m
20 APA Group Annual Report 2016
For
per
sona
l use
onl
y
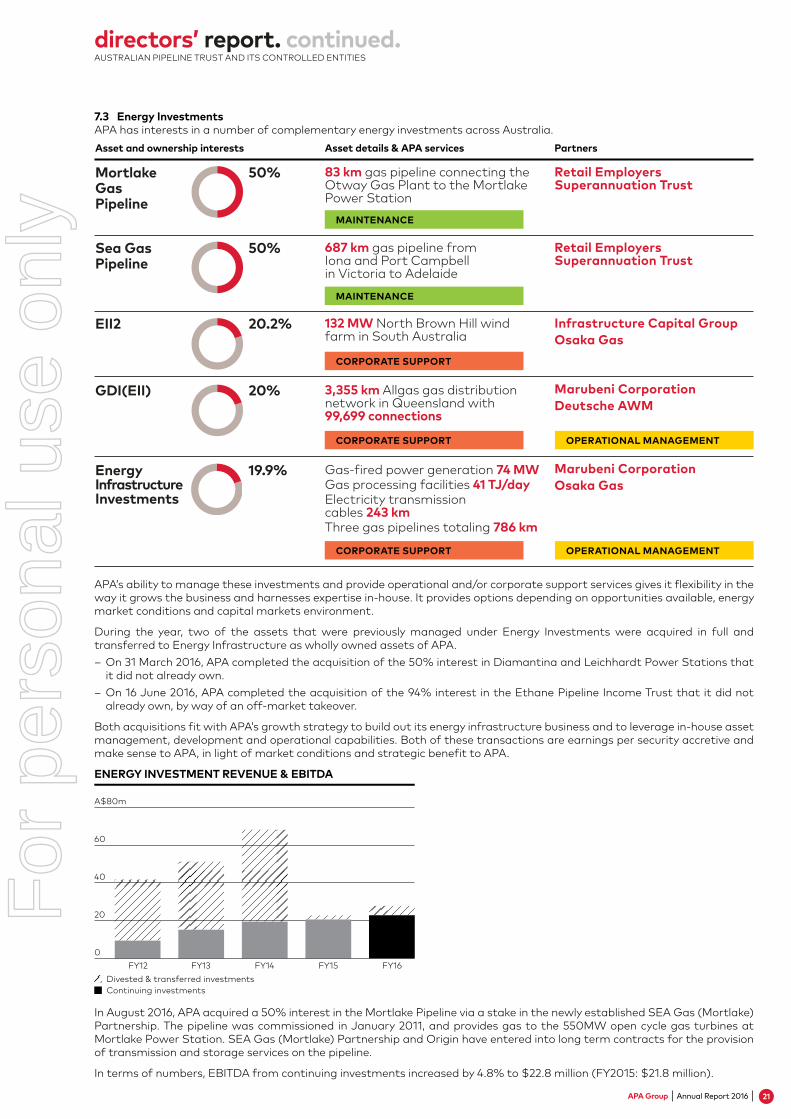
directors’ report. continued.AUSTRALIAN PIPELINE TRUST AND ITS CONTROLLED ENTITIES
7.3 Energy InvestmentsAPA has interests in a number of complementary energy investments across Australia.
Asset details & APA services PartnersAsset and ownership interests
Retail Employers Superannuation Trust
Retail Employers Superannuation Trust
Infrastructure Capital GroupOsaka Gas
Marubeni CorporationDeutsche AWM
Marubeni Corporation Osaka Gas
687 km gas pipeline from Iona and Port Campbell in Victoria to Adelaide
83 km gas pipeline connecting the Otway Gas Plant to the Mortlake Power Station
132 MW North Brown Hill wind farm in South Australia
3,355 km Allgas gas distribution network in Queensland with 99,699 connections
Gas-fired power generation 74 MWGas processing facilities 41 TJ/dayElectricity transmission cables 243 kmThree gas pipelines totaling 786 km
MAINTENANCE
MAINTENANCE
CORPORATE SUPPORT
CORPORATE SUPPORT
CORPORATE SUPPORT
50%
50%
20.2%
20%
19.9%Energy Infrastructure Investments
EII2
GDI(EII)
Sea Gas Pipeline
Mortlake Gas Pipeline
OPERATIONAL MANAGEMENT
OPERATIONAL MANAGEMENT
APA’s ability to manage these investments and provide operational and/or corporate support services gives it flexibility in the way it grows the business and harnesses expertise in-house. It provides options depending on opportunities available, energy market conditions and capital markets environment.
During the year, two of the assets that were previously managed under Energy Investments were acquired in full and transferred to Energy Infrastructure as wholly owned assets of APA.
– On 31 March 2016, APA completed the acquisition of the 50% interest in Diamantina and Leichhardt Power Stations that it did not already own.
– On 16 June 2016, APA completed the acquisition of the 94% interest in the Ethane Pipeline Income Trust that it did not already own, by way of an off-market takeover.
Both acquisitions fit with APA’s growth strategy to build out its energy infrastructure business and to leverage in-house asset management, development and operational capabilities. Both of these transactions are earnings per security accretive and make sense to APA, in light of market conditions and strategic benefit to APA.
ENERGY INVESTMENT REVENUE & EBITDA
A$80m
60
40
20
FY12Divested & transferred investments
FY13 FY14 FY15 FY160
Continuing investments
In August 2016, APA acquired a 50% interest in the Mortlake Pipeline via a stake in the newly established SEA Gas (Mortlake) Partnership. The pipeline was commissioned in January 2011, and provides gas to the 550MW open cycle gas turbines at Mortlake Power Station. SEA Gas (Mortlake) Partnership and Origin have entered into long term contracts for the provision of transmission and storage services on the pipeline.
In terms of numbers, EBITDA from continuing investments increased by 4.8% to $22.8 million (FY2015: $21.8 million).
21APA Group Annual Report 2016
For
per
sona
l use
onl
y

directors’ report. continued.AUSTRALIAN PIPELINE TRUST AND ITS CONTROLLED ENTITIES
7.4 Corporate CostsCorporate costs for the financial year increased by $13.3 million over the previous corresponding period to $86.7 million (FY2015: $73.6 million). This increase was primarily due to a number of one-off items including costs related to APA’s involvement in the Northern Territory’s NEGI process, APA’s unsuccessful bid for the Iona Gas Storage Facility, costs incurred in relation to a number of ongoing governmental enquiries into the gas market (refer below to Section 10) as well as an externally facilitated strategy and planning review undertaken during the year.
CORPORATE COSTS
A$80m
60
40
20
FY12 FY13 FY14 FY15 FY160
8. Capital and Investment Expenditure
Capital and investment expenditure for FY2016 totalled $673.6 million. Of this, investment expenditure of $339.9 million related to the acquisitions during the year of Diamantina and Leichhardt Power Stations and the Ethane Pipeline, which have been described above.
Total capital expenditure (including stay-in-business capital expenditure but excluding acquisitions and other investing cash flows) for FY2016 was $333.7 million compared with $396.3 million last year. Growth project expenditure of $281.0 million (FY2015: $343.1 million) was related to the following projects during the year:
– construction of the Eastern Goldfields Pipeline in Western Australia, which was completed during the financial year ahead of schedule;
– completion of a further connection to Granny Smith gold mine on the Eastern Goldfields Pipeline in February 2016; – completion of bi-directional projects on Moomba Sydney Pipeline and Roma Brisbane Pipeline, with the main pipelines on APA’s East Coast Grid now all bi-directional;
– continued works on the Victorian-Northern Interconnect expansion project, which will, when complete, expand the interconnect to 200 TJ/day in a northerly direction; and
– completion of an injection/withdrawal enhancement project at the Mondarra Gas Storage Facility, on the back of an extension and additional contract with an existing customer.
APA’s growth capital expenditure continues to generally be either fully underwritten through long-term contractual arrangements or have regulatory approval through a relevant access arrangement.
Capital and investment expenditure for the financial year is detailed in the table below.
Capital and investment expenditure 1 Description of major projects
30 June 2016
$ million
30 June 2015
$ million
Growth expenditureRegulated VNI looping and compression; various upgrades 130.9 136.1
Non-regulated Queensland RBP bi-directional flow, SWQP easternhaul, Wallumbilla compression 14.0 104.4 New South Wales Culcairn compressor, MSP reverse flow 4.8 12.1 Western Australia EGP, Mondarra additional well, Granny Smith metering 97.6 64.2 Other 33.7 29.0Sub-total unregulated capex 150.1 209.7Total growth capex 281.0 345.8Stay-in business capex 52.7 50.6Total capital expenditure 333.7 396.3Acquisitions WGP stamp duty, DPS, EPX 340.3 5,866.8Other investing cash flows Proceeds from sale of PP&E (0.4) 21.2Total investment expenditure 339.9 5,888.0
Total capital and investment expenditure 673.6 6,284.3
Notes: Numbers in the table may not add up due to rounding.1) The capital expenditure shown in this table represents actual cash payments as disclosed in the cash flow statement, and excludes accruals brought forward
from the prior period and carried forward to next period.
22 APA Group Annual Report 2016
For
per
sona
l use
onl
y

directors’ report. continued.AUSTRALIAN PIPELINE TRUST AND ITS CONTROLLED ENTITIES
APA’s growth strategy will continue to be considered with the same principles and criteria that APA has always adhered to: – ensure appropriate funding and capital structure; – entering into contracts with strong counterparties; – maintain appropriate risk structure; and – leverage in-house operational expertise.
APA will also continue to assess the appropriateness of international opportunities.
9. Financing Activities
9.1 Capital ManagementAs at 30 June 2016, APA had 1,114,307,369 securities on issue. This was unchanged from 30 June 2015.
During the financial year, APA extended the term to maturity on its syndicated and bilateral bank facilities by between 12 and 24 months and entered into five new bilateral bank facilities for terms of between two and five years providing $350 million of further committed debt funding. APA repaid the $185.6 million (US$122.0 million) of US Private Placement Notes that matured in September 2015. This has resulted in the reduction of the proportion of fixed or hedged interest rate exposures within APA’s drawn debt portfolio, which is outlined further below.
APA’s debt portfolio has a broad spread of maturities extending out to FY2035, with an average maturity of drawn debt of 7.4 years at 30 June 2016. APA’s gearing 1 of 66.4% at 30 June 2016 was up on the 63.4% at 30 June 2015 due primarily to the acquisition of the Ethane Pipeline and the Diamantina and Leichhardt Power Stations. APA remains well positioned to fund its planned organic growth activities from available cash and committed resources.
APA DEBT MATURITY PROFILE AND DIVERSITY OF FUNDING SOURCES
FY17 FY18 FY19 FY20 FY21 FY22 FY23 FY24 FY25 FY26 FY27 FY28 FY29 FY30 FY31 FY32 FY33 FY34 FY35
Bank borrowingsUS Private Placement NotesPublic bonds swapped into AUD(AUD, CAD, JPY, Sterling, US144A)
Public bonds swapped into USD(Euro, Sterling, US144A) 3
First call date – 60yrSubordinated Notes
0
500
1,000
1,500
A$2,000m
(2)
Notes:1) For the purpose of the calculation, drawn debt that has been kept in USD (rather than AUD) has been nominally exchanged at AUD/USD exchange rates
of 0.7772 for Euro and GBP MTN issuances and 0.7879 for US144A notes at respective inception dates. 2) USPP notes of $86m matured and were repaid in July2016.3) USD denominated obligations translated to AUD at the prevailing rate at inception (USD144A – AUD/USD=0.7879, EMTN & Sterling AUD/USD=0.7772).
CAPITAL AND INVESTMENT EXPENDITURE
FY12 FY13 FY14 FY15
6,284.4
FY16
295.5
728.2
527.8673.6
SIB capexGrowth capexAcquisitions & other investment cash flows
0
200
400
600
800
A$1,000m
As mentioned in section 5.2 previously, APA conducted an externally facilitated strategy and planning review during FY2016 and identified significant and ongoing opportunities for growth over the longer term.
As part of this review, APA has identified around $1.5 billion of organic opportunities in the near term, across pipeline extensions and expansions (circa $700 million), expansion of its renewables and generation foot print (circa $500 million) and expansion of its midstream asset foot print (circa $300 million).
23APA Group Annual Report 2016
For
per
sona
l use
onl
y

directors’ report. continued.AUSTRALIAN PIPELINE TRUST AND ITS CONTROLLED ENTITIES
As at 30 June 2016, APA had over $754 million in cash and committed undrawn facilities available to meet the continued capital growth needs of the business.
APA has a prudent treasury policy which requires conservative levels of hedging of interest rate exposures to minimise the potential impacts from adverse movements in interest rates. Other than noted below, all interest rate and foreign currency exposures on debt raised in foreign currencies have been hedged.
The majority of the revenues to be received over the next 20 years from the foundation contracts on the Wallumbilla Gladstone Pipeline will be received in USD. The US$3.7 billion of debt raised to fund that acquisition is being managed as a “designated hedge” for these revenues and therefore has been retained in USD. Net USD cash flow (after servicing the USD interest costs) that is not part of that “designated relationship” will continue to be hedged into AUD on a rolling basis for an appropriate period of time, in-line with APA’s treasury policy. To date, the following net USD cash flow hedging has been undertaken:
Period Average forward USD/AUD exchange rate
FY2017 0.7381FY2018 0.72821H FY2019 (to Dec 2018) 0.6716
A large portion of the net revenue from March 2019 is in that designated hedge relationship with the USD debt and as such, when that revenue is receivable, will be recognised in the P&L at an average rate of around 0.78.
APA also enters into interest rate hedges for a proportion of the interest rate exposure on its floating rate borrowings. As at 30 June 2016, 86.5% (30 June 2015: 94.0%) of interest obligations on gross borrowings was either hedged into or issued at fixed interest rates for varying periods extending out to 2035.
9.2 Borrowings and finance costsAs at 30 June 2016, APA had borrowings of $9,037.3 million ($8,642.8 million at 30 June 2015) from a mix of syndicated and bilateral bank debt facilities, US Private Placement Notes, Medium Term Notes in several currencies, Australian Medium Term Notes, United States 144A Notes and APA Group Subordinated Notes.
Net finance costs increased by $183.5 million, or 56.6%, to $507.7 million (FY2015: $324.2 million). The increase is primarily due to having the additional US$3.7 billion of debt issued in March 2015 to support the acquisition of the Wallumbilla Gladstone Pipeline for the full 2016 financial year. The average interest rate (including credit margins) 1 applying to drawn debt was 5.64% for the current period (FY2015: 6.76%).
APA’s interest cover ratio for the current period was 2.6 times 2 (June 2015: 2.6 times). This remains well in excess of its debt covenant default ratio of 1.1 times and distribution lock up ratio of 1.3 times.
9.3 Credit ratingsAPT Pipelines Limited, the borrowing entity of APA, maintained the following two investment grade credit ratings during this financial year:
– BBB long-term corporate credit rating (outlook Stable) assigned by Standard & Poor’s (S&P) in June 2009, and last confirmed on 18 March 2016; and
– Baa2 long-term corporate credit rating (outlook Stable) assigned by Moody’s Investors Service (Moody’s) in April 2010, and last confirmed on 15 April 2016.
9.4 Income taxIncome tax expense for the financial year of $122.5 million results in an effective income tax rate of 40.6%, compared to 24.0% for the previous corresponding period (statutory basis) and 28.2% for the previous corresponding period on a normalised basis. The increase is due to the significant amortisation charges relating to contract intangibles acquired with the Wallumbilla Gladstone pipeline which are not deductible for tax purposes.
After utilisation of all available group tax losses and partial utilisation of available transferred tax losses, an income tax provision of $13.8 million has been recognised as at 30 June 2016. APA expects to pay cash tax of $13.8 million in February 2017.
APA has provided a Tax Transparency Report which includes a reconciliation of profit to income tax payable on APA’s website at https://www.apa.com.au/investors/my-securities/tax-information/.
1) For the purpose of the calculation, drawn debt that has been kept in USD (rather than AUD) has been nominally exchanged at AUD/USD exchange rates of 0.7772 for Euro and GBP MTN issuances and 0.7879 for US144A notes at respective inception dates.
2) For the calculation of interest cover, significant items are excluded from the EBITDA used.
24 APA Group Annual Report 2016
For
per
sona
l use
onl
y
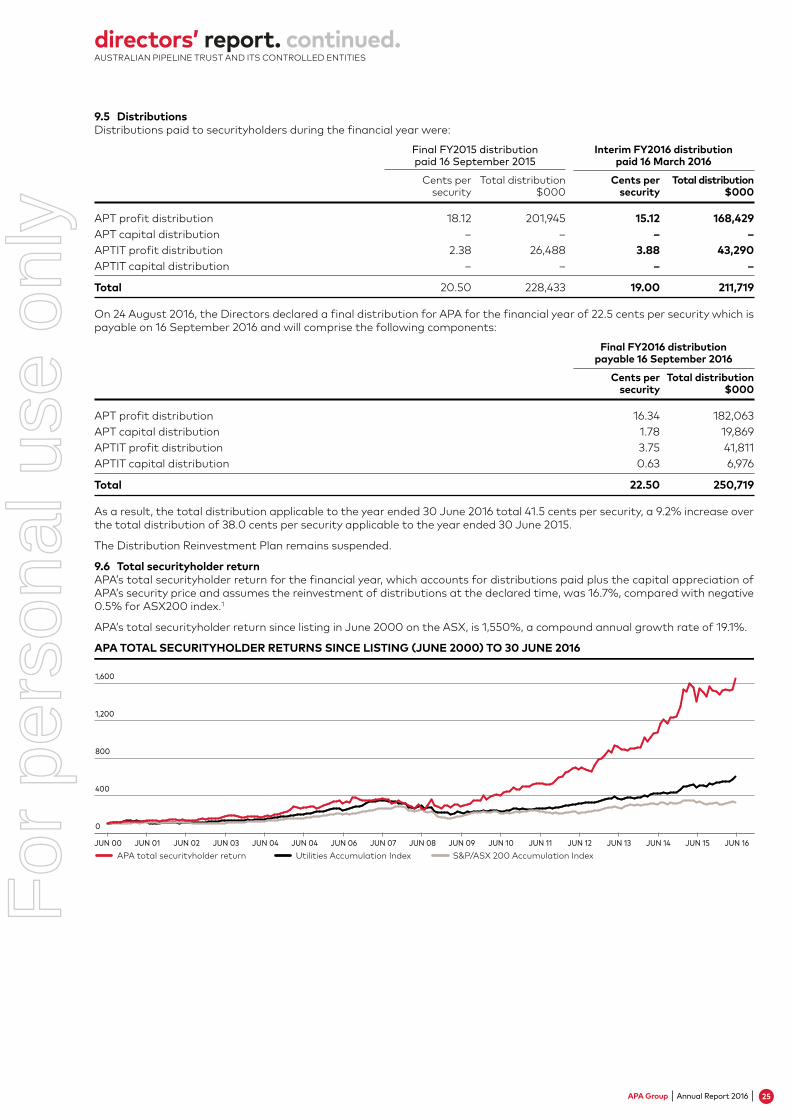
directors’ report. continued.AUSTRALIAN PIPELINE TRUST AND ITS CONTROLLED ENTITIES
9.5 DistributionsDistributions paid to securityholders during the financial year were:
Final FY2015 distribution Interim FY2016 distribution paid 16 September 2015 paid 16 March 2016
Cents per Total distribution Cents per Total distribution security $000 security $000
APT profit distribution 18.12 201,945 15.12 168,429APT capital distribution – – – –APTIT profit distribution 2.38 26,488 3.88 43,290APTIT capital distribution – – – –
Total 20.50 228,433 19.00 211,719
On 24 August 2016, the Directors declared a final distribution for APA for the financial year of 22.5 cents per security which is payable on 16 September 2016 and will comprise the following components:
Final FY2016 distribution payable 16 September 2016
Cents per Total distribution security $000
APT profit distribution 16.34 182,063APT capital distribution 1.78 19,869APTIT profit distribution 3.75 41,811APTIT capital distribution 0.63 6,976
Total 22.50 250,719
As a result, the total distribution applicable to the year ended 30 June 2016 total 41.5 cents per security, a 9.2% increase over the total distribution of 38.0 cents per security applicable to the year ended 30 June 2015.
The Distribution Reinvestment Plan remains suspended.
9.6 Total securityholder returnAPA’s total securityholder return for the financial year, which accounts for distributions paid plus the capital appreciation of APA’s security price and assumes the reinvestment of distributions at the declared time, was 16.7%, compared with negative 0.5% for ASX200 index.1
APA’s total securityholder return since listing in June 2000 on the ASX, is 1,550%, a compound annual growth rate of 19.1%.
APA TOTAL SECURITYHOLDER RETURNS SINCE LISTING (JUNE 2000) TO 30 JUNE 2016
APA total securityholder return Utilities Accumulation Index S&P/ASX 200 Accumulation IndexJUN 00 JUN 01 JUN 02 JUN 03 JUN 04 JUN 04 JUN 06 JUN 07 JUN 08 JUN 09 JUN 10 JUN 11 JUN 12 JUN 13 JUN 14 JUN 16JUN 15
0
400
800
1,200
1,600
25APA Group Annual Report 2016
For
per
sona
l use
onl
y

directors’ report. continued.AUSTRALIAN PIPELINE TRUST AND ITS CONTROLLED ENTITIES
9.7 Guidance for 2017 financial yearBased on current operating plans and available information, APA expects EBITDA for the full year to 30 June 2017 to be in a range of $1,425 million to $1,445 million. This represents an increase of approximately 7% to 8.5% on the 2016 financial year, on a normalised, continuing businesses basis.
APA has entered into forward exchange contracts for FY2017, for the net USD cashflow from the gas transportation agreements for the Wallumbilla Gladstone Pipeline (“WGP”), after servicing USD denominated debt. In forecasting the AUD equivalent EBITDA contribution from WGP, the forward exchange rates for these hedged revenues have been used.
Net interest cost is expected to be in a range of $510 million to $520 million.
Distributions per security for the 2017 financial year are expected to be in the order of 43.5 cents per security, prior to the benefit of any franking credits that may arise as a result of the filing of the FY2016 tax return.
As per current APA distribution policies, all distributions will be fully covered by operating cash flows.
FY2017 guidance FY2016 actual Change
EBITDA from continuing businesses ($ millions) 1,425 to 1,445 1,330.5 94.5 to 114.5
Net interest cost ($ millions) 510 to 520 507.7 2.3 to 12.3
Total distribution (cents per security) In the order of 41.5 cents 2.0 cents 43.5 cents
10. Regulatory Matters
Regulatory resetsThe diagram below outlines the scheduled regulatory reset dates for pipelines owned and operated by APA. During FY2016, approximately 10% of APA’s Energy Infrastructure revenues were regulated revenue.
REGULATORY RESET SCHEDULE
Roma Brisbane Pipeline
Central Ranges Pipeline
Victorian Transmission System
Central Ranges Network
Goldfields Gas Pipeline
Amadeus Gas Pipeline
Current regulatory period Next regulatory period
2016 2017 2018 2019 2020 2021
Key regulatory matters addressed during the year included:
Goldfields Gas Pipeline access arrangementIn June 2016, the Western Australian Economic Regulation Authority (“ERA”) issued a final decision on proposed revisions to the access arrangement for the Goldfields Gas Pipeline (“GGP”), which APA had submitted for approval in August 2014. The final decision by the ERA results in a reduction in the reference tariff and amendments to the access terms and conditions. The ERA proposed reduction in tariff stems mainly from: a reduction in the rate of return; a change in methodology to calculate depreciation; a change in the methodology to allocate certain operating costs between regulated and unregulated services; and a clawback of revenues arising from higher tariffs collected from 1 January 2015 to 30 June 2016 due to the ERA’s 18 month delay in reaching a decision. The tariffs determined by the ERA are payable in relation to approximately 20% of contracted shipper services. The remainder of contracted services on the Goldfields Gas Pipeline (~80%) are payable as per negotiated terms.
Amadeus Gas Pipeline access arrangementThe Australian Energy Regulator (“AER”) issued its final decision for the Amadeus Gas Access Arrangement on 26 May 2016 to apply from 1 July 2016. The final decision has had minimal impact on APA’s revenue as the vast majority of services are provided at rates determined under contract with the main shipper, Power and Water Corporation.
1) Figures quoted are sourced from IRESS and measured as at 30 June 2016.
26 APA Group Annual Report 2016
For
per
sona
l use
onl
y

directors’ report. continued.AUSTRALIAN PIPELINE TRUST AND ITS CONTROLLED ENTITIES
Gas Policy developmentsThe eastern Australian gas market has been subject to ongoing unprecedented change with the recontracting of expiring long term gas supply agreements and the commencement of production at the three LNG facilities at Gladstone. Numerous governmental reviews and inquiries have considered appropriate policy settings. APA has been an active participant in these reviews, highlighting the significant contribution through its portfolio of pipeline assets and responsive customer services that APA has made to the development of the gas market.
In August 2016, the Council of Australian Governments (“COAG”) Energy Council announced that it had agreed to a domestic energy market reform package to improve gas supply and market design, based on reports from the Australian Energy Market Commission (“AEMC”) and the Australian Competition & Consumer Commissions (“ACCC”).
The reforms will be led by a newly formed Gas Market Reform Group, and will include: – better information for trading in the market; – the creation of trading hubs in North and South; – easier access to transport infrastructure; – better pricing information; and – encouraging more gas supply and more gas suppliers, taking account of each jurisdiction’s circumstance.
COAG has also assigned the Gas Market Reform Group to examine and lead the consultation process to consider the ACCC’s recommendation for a change to the regulatory coverage test for gas pipelines.
APA will remain actively engaged as these proposed reforms enter the detailed implementation stage.
11. Health, Safety and Environment
11.1 Health and safety reportingThis financial year was the first full year of using APA’s new incident reporting platform. This platform has provided improved access, analysis and rigour around the reporting of incidents and injuries across APA and its contractors. This has been evidenced by an 18% increase in the number of incidents reported this year compared with last year and supported by audit findings that APA has a good reporting culture.
The Lost Time Injury Frequency Rate (“LTIFR”) for APA was 1.06 (for employees and contractors) for the financial year, up from 0.64 in the last financial year. There were four employee and two contractor lost time injuries during the financial year. The Total Reportable Injury Frequency Rate (TRIFR) for APA was 10.41 (for employees and contractors combined) in FY2016, an increase of 2.3 from the last financial year. Frequency rates have been impacted by a 10% drop in hours worked this financial year due largely to a reduction in the number of project-based activities compared with the historic highs in the previous year.
TOTAL REPORTABLE INJURY FREQUENCY RATE (TRIFR) LOST TIME INJURY FREQUENCY RATE (LTIFR)
80
60
40
20
FY13 FY14 FY15 FY160
65.8
34.3
8.11 10.41
FY13 FY14 FY15 FY160
1
2
3
2.1
0.8 0.64
1.06
Note: TRIFR is measured as the number of lost time and medically treated injuries sustained per million hours worked. Data includes both employees and contractors.
Note: LTIFR is measured as the number of lost time injuries per million hours worked. Data from FY14 includes both employees and contractors. Prior to that, employee data only.
APA continues to target being a zero harm workplace for its employees, contractors and the broader communities in which it operates. Whilst some injury performance targets this year were not achieved, the results are in line with overall improving trends and reporting culture. In addition to this, the performance in all lead safety indicators was positive, confirming an appropriate level of activity and focus on key risks and controls.
The Strategic Improvement Plan and initiatives for FY2016 have been achieved during the year. Focus continued on driving with the SafeDrive+ program, developing and implementing education and awareness programs targeting specific risks such as speeding and fatigue. This program has seen a reduction in vehicle incidents. Furthermore, “In Vehicle Monitoring Systems” were installed in more than 270 vehicles, enabling tracking and monitoring of driver safety. These systems are already realising the benefits of improved driver safety.
A highlight this year was the results from an independent Health and Safety Audit Program conducted across the business that resulted in a 95% compliance rating with no major non-conformance findings.
27APA Group Annual Report 2016
For
per
sona
l use
onl
y

directors’ report. continued.AUSTRALIAN PIPELINE TRUST AND ITS CONTROLLED ENTITIES
Safe Driving at APAAPA’s 750 motor vehicles cover more than 17 million kilometres a year. That’s a lot of driving that exposes APA drivers and their passengers to significant risk. Although we know driving to be a high-risk activity, and have identified it as one of our Fatal Risks, we needed the tools to help us with our Risk, Control, Assure approach to driving – that’s where SafeDrive+ comes in.
SafeDrive+ is a suite of 12 initiatives that support and guide our business driving practices. Some of the initiatives were already in place in some parts of APA; others were ready to be rolled out while others will be rolled out as they are fully developed. SafeDrive+ initiatives together address the requirements of our Risk, Control, Assure approach and apply to the majority of our driving situations. They will help APA’s employees and contractors stay safe on the road.
Some of the SafeDrive+ initiatives apply to all APA drivers, while others apply to those who drive in particular situations – one even applies to passengers.
One key feature has been the introduction of the in vehicle monitoring systems (IVMS). IVMS is a GPS enabled device which is installed in vehicles to monitor their current location. It triggers lifesaving alerts based on a vehicle’s whereabouts and thereby reduces risks for remote and rural solo workers. With this new technology the Integrated Operations Centre and HSE Managers can receive immediate alerts which increase our ability to respond more quickly to emergency events, as well as improve our overall monitoring.
In FY2017, a new three year Health, Safety and Environmental (HSE) Strategic Improvement Plan has been launched, building on the previous plan.
For further information on APA’s health and safety initiatives, please refer to the Sustainability Report (page S8 to S9), which forms part of this report.
11.2 Environmental regulationsAll pipeline, distribution and gas processing assets owned and/or operated by APA are designed, constructed, tested, operated and maintained in accordance with pipeline and distribution licences issued by the relevant State and Territory technical regulators. All licences require compliance with relevant Federal, State and Territory environmental legislation and Australian Standards.
The pipeline licences also require compliance with the Australian Standard AS 2885 “Pipelines – Gas and Liquid Petroleum”, which has specific requirements for the management of environmental matters associated with all aspects of the high pressure pipeline industry.
Construction Environmental Management Plans satisfying Section 6 of the Australian Pipeline Gas Association Code of Environmental Practice are prepared as needed. Major project construction activities are audited or inspected in accordance with Environmental Management Plan requirements. In accordance with Part 3 of AS 2885, Environmental Management Plans satisfying Section 7 of the Code are in place for applicable operating pipelines and are managed in accordance with APA’s contracts and the terms and conditions of the licences that APA has been issued.
The Safety and Operating Plan for the distribution networks in NSW that APA operates has been audited during the financial year, in accordance with technical regulatory requirements.
Senior management reviews audit report findings and any material breaches and incidents are communicated to the Board. No significant breaches have been reported during the financial year and APA has managed its assets in accordance with the relevant Environmental Management Plans.
11.3 Environmental reportingIn October 2015, APA complied with Australia’s National Greenhouse and Energy Reporting (“NGER”) obligations for FY2015. Energy reporting for FY2016 will be submitted in October 2016.
APA’s main sources of emissions are from the combustion of natural gas in compressor stations, from fugitive emissions associated with natural gas pipelines and from gas fired power stations. NGER compliance reporting applies to assets under APA’s operational control, which includes gas transmission/distribution pipelines, power generation facilities (including wind farms), gas storage, gas processing, cogeneration, electricity transmission interconnectors and corporate offices.
28 APA Group Annual Report 2016
For
per
sona
l use
onl
y

directors’ report. continued.AUSTRALIAN PIPELINE TRUST AND ITS CONTROLLED ENTITIES
APA’s summary of Scope 1 emissions and energy consumption for the 2015 financial year are set out in the following table:
FY2015 FY2014 1 Change
Scope 1 CO2 emissions (tonnes) 350,922 311,421 12.7%Energy consumption (GJ) 4,633,613 3,937,718 17.7%
1) Energy consumption figure for 2014 has been corrected since the FY2015 Directors’ report, which incorrectly stated the energy consumption figure due to an error in the Clean Energy Regulator’s online system. The figure indicated in this year’s report is the updated figure.
The variations are largely due to an increase in compressor use on the South West Queensland Pipeline and Moomba Sydney Pipeline.
11.4 Environmental StrategyIn June 2015, APA launched a two year Environment Strategy and Improvement Plan to provide a corporate governance framework for environmental management across all its operations in Australia. Key initiatives within the Plan include development of corporate environment procedures across eight workstreams, a training and awareness program, and implementation of a structured audit program.
The strategy is progressing according to schedule. Development of environment procedures is complete and the awareness program is underway, due for delivery in the first half of FY2017. There is strong engagement and involvement of the various business groups in the development and implementation of this strategy with dedicated support from a specialised team. Once fully complete, this work will ensure APA’s environmental management and compliance remains robust and comprehensive.
For further information on APA’s environmental management initiatives, please refer to the Sustainability Report (page S4 to S5), which forms part of this report.
12. Risk Overview
APA identifies risks to its business and puts in place mitigation strategies to remove or minimise the negative affect and maximise opportunity in respect of those risks. Material risks are reviewed on an ongoing basis by APA’s Executive Risk Management Committee and the Board Audit and Risk Management Committee, together with the relevant business units and both internal and where appropriate, external, experts. Further information on this process is provided in APA’s Corporate Governance Statement (refer to Principle 7) and the Sustainability Report (contained in this report).
Risk assessments consider a combination of the probability and consequence of risks occurring. Listed below are a number of key risks identified that could materially affect APA negatively. However, the risks listed may not include all risks associated with APA’s ongoing operations. The materiality of risks may change and previously unidentified risks may emerge.
Key risksEconomic regulationAPA has a number of price regulated assets and investments in its portfolio. Regulatory pricing periods generally run for five years and reflect the regulator’s determination of, amongst other matters, APA’s projected operating and capital costs, and weighted average cost of capital. The price regulation outcomes determined by the Australian Energy Regulator or Economic Regulation Authority (for Western Australia) under an access arrangement process for a full regulation asset may adversely affect APA’s revenue in respect of that asset.
A number of APA’s assets are subject to light regulation which, while not a price regulation regime, does enable the regulator to arbitrate any disputes with customers on price and other terms of access. In addition, under the National Gas Law, any person may make an application that an unregulated pipeline becomes “covered” and subject to economic regulation, which may adversely affect APA’s economic position.
In April 2016, the ACCC released a report following its inquiry into the East Coast Gas Market. That report recommended changes to the regulatory test as to which gas pipelines can be “covered” and subject to economic regulation. Such a change would require amendment to the National Gas Law.
The AEMC released its report following the East Coast Wholesale Gas Market and Pipeline Frameworks Review in July 2016 in which it recommended a number of changes to gas market design including the trading of gas pipeline capacity.
At its meeting on 19 August 2016, COAG committed to the establishment of the Gas Market Reform Group to implement a domestic gas market reform package, following industry reviews by the ACCC and the AEMC. Acceptance of some or all of the recommendations contained in those industry reviews may adversely affect APA’s financial position.
Bypass and competitive riskBypass and competitive risk occurs when a new transmission pipeline offers gas transportation services to the same end market serviced by existing pipelines. If a bypass risk eventuates, APA’s future earnings may be reduced if customers purchase gas transportation services from new pipelines rather than from APA’s existing pipelines.
Gas demand riskReduced demand for gas and increased use of gas swap contracts by customers may reduce the future demand for pipeline capacity and transportation services and may adversely affect APA’s future revenue, profits and financial position.
Gas supply riskA long-term shortage of competitively priced gas, either as a result of gas reserve depletion, allocation of gas to other markets, or the unwillingness or inability of gas production companies to produce gas, may adversely affect APA’s revenue and the carrying value of APA’s assets.
29APA Group Annual Report 2016
For
per
sona
l use
onl
y

directors’ report. continued.AUSTRALIAN PIPELINE TRUST AND ITS CONTROLLED ENTITIES
Counterparty riskThe failure of a counterparty to meet its contractual commitments to APA, whether in whole or in part, could reduce future anticipated revenue unless and until APA is able to secure an alternative customer. Counterparty risk also arises when deposits are placed, and contracts entered into for hedges, with financial institutions.
Interest rates and refinancing risksAPA is exposed to movements in interest rates where floating interest rate funds are not effectively hedged. There is a risk that adverse interest rate movements may affect APA’s earnings, both directly (through increased interest payments) and indirectly (through the impact on asset carrying values).
APA has borrowings extending through to 2035. Access to continuing financing sources to extend and/or refinance debt facilities is important. An inability to secure new debt facilities at a similar quantum and cost to existing debt facilities may adversely affect APA’s operations and/or financial position and performance.
Foreign exchange risksAPA is exposed to movements in foreign exchange rates and there is a risk that adverse AUD/USD exchange rate movements may adversely affect APA’s earnings (through reduced AUD proceeds received from the exchange of USD denominated revenues) and debt levels (through translation of USD denominated debt).
Investment riskAPA may acquire infrastructure and related assets or undertake additional or incremental investment in its existing assets. There is a risk that assumptions and forecasts used in making investment decisions may ultimately not be realised, and this may adversely impact APA’s financial position and performance.
Contract renewal riskA large part of APA’s revenues are the subject of long-term negotiated revenue contracts with end customers. Due to a range of factors, including customer demand risk, gas supply risk, counterparty risk, shorter term contracts, and bypass and competitive risk, APA may not be successful in recontracting the available pipeline capacity when it comes due for contract renewal. This may adversely affect APA’s future financial position and performance.
Operational riskAPA is exposed to a number of operational risks such as equipment failures or breakdowns, rupture of pipelines, employee or equipment shortages, contractor default, unplanned interruptions, damage by third parties, integration of acquired assets, natural hazards and other unforeseen accidents or incidents. Operational disruption, or the cost of repairing or replacing damaged assets, may adversely affect APA’s financial position and performance. Insurance policies may only provide protection for some, but not all, of the costs that may arise from unforeseen events.
Information technology risksAPA is reliant on information systems and technology (“IT”) to support its business operations. This exposes APA to a number of typical IT operational risks, including system corruption or failure, technology breakdown, skills shortages and cyber-attacks. Operational disruption, or the cost of repairing or replacing damaged or compromised systems, may adversely affect APA’s financial position and performance.
Operating licences and authorisationsAll pipeline, distribution, gas processing, storage and electricity generation assets owned and/or operated by APA require compliance with relevant laws, regulations and policies. Any changes may have an adverse impact on APA’s pricing, costs or compliance regimes, which may adversely affect APA’s operations and/or financial position and performance. Certain licences, permits or regulatory consents may not be renewed, granted, continued or such renewal, grant or continuation may be on more onerous terms or subject to loss or forfeiture, which may adversely affect APA’s operations and/or financial position and performance.
Construction and development riskAPA develops new assets and undertakes expansion of its existing assets. This involves a number of typical construction risks, including the failure to obtain necessary approvals, employee or equipment shortages, higher than budgeted construction costs and project delays, which may impact the commerciality and economics of the development or otherwise impact on APA’s other assets. If these risks materialise, this may adversely affect APA’s operations and/or financial position and performance.
Disputes and litigation risksIn the course of its operations, APA may be involved in disputes and litigation. There is a risk that material or costly disputes or litigation may adversely affect APA’s financial position and performance.
Credit rating risksThere is no assurance that any credit rating will remain in effect for a given period of time or that any credit rating will not be revised or withdrawn entirely by a credit rating agency in the future if, in the credit rating agency’s judgement, circumstances warrant. Withdrawal or review of APA’s credit ratings may adversely affect APA’s financial position and performance.
30 APA Group Annual Report 2016
For
per
sona
l use
onl
y

directors’ report. continued.AUSTRALIAN PIPELINE TRUST AND ITS CONTROLLED ENTITIES
13. Directors
13.1 Information on Directors and Company SecretarySee pages 6 to 7 for information relating to qualifications and experience on Directors and the Company Secretary.
13.2 Directorships of other listed companiesDirectorships of other listed companies held by Directors at any time in the three years immediately before the end of the financial year are as follows:
Name Company Period of directorship
Leonard Bleasel AM – –
Michael McCormack Envestra Limited July 2007 to September 2014
Steven Crane nib holdings limited Since September 2010 Transfield Services Limited February 2008 to February 2015 Bank of Queensland Limited December 2008 to January 2015
John Fletcher – –
Michael Fraser Aurizon Holdings Limited Since February 2016 AGL Energy Limited October 2007 to February 2015
Debra Goodin Senex Energy Limited Since May 2014 oOh!media Limited Since November 2014
Russell Higgins AO Telstra Corporation Limited Since September 2009 Argo Investments Limited Since September 2011 Leighton Holdings Limited June 2013 to May 2014
Patricia McKenzie – –
13.3 Directors’ meetingsDuring the financial year, 14 Board meetings, five People and Remuneration Committee meetings, four Audit and Risk Management Committee meetings, four Health Safety and Environment Committee meetings and two Nomination Committee meetings were held. The following table sets out the number of meetings attended by each Director while they were a Director or a committee member: People and Audit and Risk Health Safety Remuneration Management and Environment Nomination Board Committee Committee Committee Committee
Directors A B A B A B A B A B
Leonard Bleasel AM 1 14 14 – – – – – – 2 2Michael McCormack 14 14 – – – – – – – –Steven Crane 14 13 5 5 4 4 – – 2 2John Fletcher 14 13 5 5 4 4 – – 2 2Michael Fraser 2 12 12 3 3 – – 3 3 2 2Debra Goodin 3 12 12 – – 3 3 3 3 2 2Russell Higgins AO 14 14 – – 4 4 4 4 2 2Patricia McKenzie 14 14 5 5 – – 4 4 2 2Robert Wright 4 4 4 – – 1 1 2 2 – –
A: Number of meetings held during the time the Director held office or was a member of the committee during the financial year.B: Number of meetings attended.
1) The Chairman attended all committee meetings of People and Remuneration, Audit & Risk Management and Health, Safety & Environment ex officio.2) Michael Fraser was appointed as a Director effective 1 September 2015.3) Debra Goodin was appointed as a Director effective 1 September 2015.4) Robert Wright retired as a Director on 22 October 2015.
31APA Group Annual Report 2016
For
per
sona
l use
onl
y

directors’ report. continued.AUSTRALIAN PIPELINE TRUST AND ITS CONTROLLED ENTITIES
13.4 Directors’ securityholdingsThe aggregate number of APA securities held directly, indirectly or beneficially by Directors or their Director related entities at 30 June 2016 is 1,322,074 (2015: 1,305,883).
The following table sets out Directors’ relevant interests in APA securities as at 30 June 2016:
Fully paid Fully paid securities as at Securities Securities securities as at Directors 1 July 2015 acquired disposed 30 June 2016
Leonard Bleasel AM 614,216 – – 614,216Michael McCormack 278,120 21,880 – 300,000Steven Crane 130,000 – – 130,000John Fletcher 88,250 – – 88,250Michael Fraser 1 – 25,000 – 25,000Debra Goodin 2 – 19,000 – 19,000Russell Higgins AO 122,719 – – 122,719Patricia McKenzie 19,986 2,903 – 22,889Robert Wright 3 52,592 – – –
1,305,883 68,783 – 1,322,074
1) Michael Fraser was appointed as a Director effective 1 September 2015.2) Debra Goodin was appointed as a Director effective 1 September 2015.3) Robert Wright retired as a Director on 22 October 2015. He held 52,592 fully paid securities on retirement.
The Directors hold no other rights or options over APA securities. There are no contracts to which a Director is a party or under which the Director is entitled to a benefit and that confer a right to call for or deliver APA securities.
14. Options Granted
In this report, the term “APA securities” refers to stapled securities each comprising a unit in Australian Pipeline Trust stapled to a unit in APT Investment Trust and traded on the Australian Securities Exchange (“ASX”) under the code “APA”.
No options over unissued APA securities were granted during or since the end of the financial year, no unissued APA securities were under option as at the date of this report, and no APA securities were issued during or since the end of the financial year as a result of the exercise of an option over unissued APA securities.
15. Indemnification of Officers and External Auditor
During the financial year, the Responsible Entity paid a premium in respect of a contract insuring the Directors and Officers of the Responsible Entity and any APA Group entity against any liability incurred in performing those roles to the extent permitted by the Corporations Act 2001. The contract of insurance prohibits disclosure of the nature of the liability and the amount of the premium.
Australian Pipeline Limited, in its capacity as Responsible Entity of Australian Pipeline Trust and APT Investment Trust, indemnifies each Director and Company Secretary, and certain other executives, former executives and officers of the Responsible Entity or any APA Group entity under a range of deed polls and indemnity agreements which have been in place since 1 July 2000. The indemnity operates to the full extent allowed by law but only to the extent not covered by insurance, and is on terms the Board considers usual for arrangements of this type.
Under its constitution, Australian Pipeline Limited (in its personal capacity) indemnifies each person who is or has been a Director, Company Secretary or executive officer of that company.
The Responsible Entity has not otherwise, during or since the end of the financial year, indemnified or agreed to indemnify an officer or external auditor of the Responsible Entity or any APA Group entity against a liability incurred by such an officer or auditor.
16. Remuneration Report
The remuneration report is attached to and forms part of this report.
17. Auditor
17.1 Auditor’s independence declarationA copy of the independence declaration of the auditor, Deloitte Touche Tohmatsu (“Auditor”) as required under section 307C of the Corporations Act 2001 is included at page 94.
17.2 Non-audit servicesNon-audit services have been provided during the financial year by the Auditor. A description of those services and the amounts paid or payable to the Auditor for the services are set out in Note 30 to the financial statements.
The Board has considered those non-audit services provided by the Auditor and, in accordance with written advice from the Audit and Risk Management Committee (“Committee”), is satisfied that the provision of those services by the Auditor is compatible with the general standard of independence for auditors imposed by the Corporations Act 2001 and did not
32 APA Group Annual Report 2016
For
per
sona
l use
onl
y

directors’ report. continued.AUSTRALIAN PIPELINE TRUST AND ITS CONTROLLED ENTITIES
compromise the auditor independence requirements of the Act. The Board’s reasons for concluding that the non-audit services provided did not compromise the Auditor’s independence are:
– all non-audit services were subject to APA’s corporate governance procedures with respect to such matters and have been reviewed by the Committee to ensure they do not impact on the impartiality and objectivity of the Auditor;
– the non-audit services provided did not undermine the general principles relating to auditor independence as they did not involve reviewing or auditing the Auditor’s own work, acting in a management or decision making capacity for APA, acting as an advocate for APA or jointly sharing risks and rewards; and
– the Auditor has provided a letter to the Committee with respect to the Auditor’s independence and the Auditor’s independence declaration referred to above.
18. Information Required for Registered Schemes
Fees paid to the Responsible Entity and its associates (including Directors and Secretaries of the Responsible Entity, related bodies corporate and Directors and Secretaries of related bodies corporate) out of APA scheme property during the financial year are disclosed in Note 31 to the financial statements.
Except as disclosed in this report, neither the Responsible Entity nor any of its associates holds any APA securities.
The number of APA securities issued during the financial year, and the number of APA securities on issue at the end of the financial year, are disclosed in Note 23 to the financial statements.
The value of APA’s assets as at the end of the financial year is disclosed in the balance sheet in total assets, and the basis of valuation is disclosed in the notes to the financial statements.
19. Rounding of Amounts
APA is an entity of the kind referred to in ASIC Corporations Instrument 2016/191 and, in accordance with that Class Order, amounts in the Directors’ report and the financial report are rounded to the nearest thousand dollars, unless otherwise indicated.
20. Corporate Governance Statement
Corporate Governance Statement for the financial year is available at APA’s website on https://www.apa.com.au/about-apa/our-organisation/corporate-governance/.
21. Authorisation
The Directors’ report is signed in accordance with a resolution of the Directors of the Responsible Entity made pursuant to section 298(2) of the Corporations Act 2001.
On behalf of the Directors
Leonard Bleasel AM Steven CraneChairman Director
Sydney, 24 August 2016
33APA Group Annual Report 2016
For
per
sona
l use
onl
y

Letter from the Chairman of the People and Remuneration Committee
Dear Securityholders,
On behalf of the Board and the People and Remuneration Committee, I am pleased to present APA’s Remuneration Report for the financial year ended 30 June 2016.
FY2016 was another year of strong performance for securityholders, with APA continuing to deliver superior market returns. FY2016 has been marked by continued expansion in assets through major capital works and investments brought in-house, the completion of key business and technology projects, development of innovative and flexible services for our customers, especially on the East Coast Grid, and excellent financial returns.
People and Remuneration CommitteeDuring the reporting period the Committee’s name was changed to the People and Remuneration Committee to reflect the increasing emphasis of the work of the Committee beyond remuneration into key areas such as diversity, succession planning, talent development and organisational culture.
Executive remuneration frameworkTotal Fixed Remuneration (“TFR”) for the Chief Executive Officer and Managing Director (“CEO/MD”) and Senior Executives has increased this year as a function of consolidating APA’s position relative to other Australian Stock Exchange (ASX) listed companies. As part of our conservative management of TFR and to maintain a market competitive remuneration package, APA’s positioning policy is for the TFR quantum to be at least the median against comparable ASX listed companies.
The Board has concluded that the executive remuneration framework continues to be aligned with our business strategy and model. As mentioned in last year’s report a minimum securityholding policy for the CEO/MD, Senior Executives and all the other participants in the Long Term Incentive (“LTI”) plan has been implemented. In addition the extension of the performance measurement period for normalised Earnings Before Interest, Tax, Depreciation and Amortisation divided by Funds Employed (“EBITDA/FE”) for the LTI plan to three years has been implemented, effective from FY2016. This will strengthen the alignment of management and securityholder interests.
This year’s remuneration reportThe Board is committed to transparency and strong governance. We recognise and welcome securityholders’ interest in APA, including understanding our remuneration strategy and outcomes and have continued with the expanded format adopted last year. While, as a registered managed investment scheme listed on the ASX, APA is not covered by the remuneration reporting requirements of the Corporations Act, we have followed a similar format, as we recognise this will be familiar and understandable to many of our securityholders. We also present remuneration information on an accrual basis rather than a paid basis, to better allow securityholders to reconcile amounts awarded for the period with APA’s performance in the period.
We welcome your feedback on the report and its contents, and look forward to your attendance at our FY2016 Annual General Meeting.
John FletcherChairman of the Remuneration Committee
remuneration report. AUSTRALIAN PIPELINE TRUST AND ITS CONTROLLED ENTITIES FOR THE FINANCIAL YEAR ENDED 30 JUNE 2016
34 APA Group Annual Report 2016
For
per
sona
l use
onl
y

1. What This Report Covers
This report details the remuneration arrangements for Non-executive Directors, the Executive Director and Senior Executives, the key management personnel (“KMP”) listed below. These are the people with authority and responsibility for planning, directing and controlling the major activities of APA, directly or indirectly.
Name Role Duration of appointment
I) Non-executive DirectorsLeonard Bleasel AM Chairman of APA Group Full yearSteven Crane Chairman of Audit and Risk Management Committee From 23 October 2015 Member of People and Remuneration Committee Full yearJohn Fletcher Chairman of People and Remuneration Committee and member Full year of Audit and Risk Management Committee Russell Higgins AO Chairman of Health Safety and Environment Committee and Full year member of Audit and Risk Management Committee Patricia McKenzie Member of Health Safety and Environment Committee and Full year member of People and Remuneration Committee Debra (Debbie) Goodin Member of Audit and Risk Management Committee and Commenced 01 September 2015 member of Health Safety and Environment Committee Michael Fraser Member of Health Safety and Environment Committee and Commenced 01 September 2015 member of People and Remuneration Committee Robert Wright Chairman of Audit and Risk Management Committee and Retired 22 October 2015 member of Health Safety and Environment Committee
II) Executive directorMichael McCormack Chief Executive Officer and Managing Director (“CEO/MD”) Full year
III) Senior executivesPeter Fredricson Chief Financial Officer (“CFO”) Full yearRoss Gersbach Chief Executive Strategy and Development Full yearRobert Wheals Group Executive Transmission Full yearJohn Ferguson Group Executive Networks Full yearKevin Lester Group Executive Infrastructure Development Full yearNevenka Codevelle Company Secretary & General Counsel 1 From 31 October 2015Elise Manns Group Executive Human Resources 2 From 01 October 2015
1) Mark Knapman, Company Secretary, retired 30 October 2015.2) Peter Wallace, Group Executive Human Resources, retired 02 October 2015.
The named persons held their current positions during the financial year for the periods indicated. There have been no changes to KMP between the end of the financial year and the date this report was authorised for issue.
2. Remuneration Outcomes and APA Performance
One of the key factors in determining the remuneration position of APA executives is market relativity, and within Australia, ranking on the ASX100 on market capitalisation is the most commonly used benchmark. The APA Group has delivered strong securityholding returns, sound financial performance and significant organisational growth year on year. This, together with the Boards desire to attract and retain a first class management team, has driven commensurate growth in remuneration levels in APA.
APA MARKET CAPITALISATION RANK AGAINST ASX100
10
60
40
20
80
70
50
30
90
FY11FY10
83rd78th
52nd
39th 42nd
28th31st
FY12 FY13 FY14 FY16FY15100
remuneration report. continued.AUSTRALIAN PIPELINE TRUST AND ITS CONTROLLED ENTITIES FOR THE FINANCIAL YEAR ENDED 30 JUNE 2016
35APA Group Annual Report 2016
For
per
sona
l use
onl
y

remuneration report. continued.AUSTRALIAN PIPELINE TRUST AND ITS CONTROLLED ENTITIES FOR THE FINANCIAL YEAR ENDED 30 JUNE 2016
2.1 Executive remuneration awarded FY2016As part of our commitment to greater transparency and to better reflect the pay for performance relationship, the table below sets out remuneration earned by APA Executives in FY2016 and FY2015 on an accrual basis for the period rather than remuneration received during the period. For instance, short term incentive (“STI”) values in the table below reflect STI earned in FY2016 but are due to be paid in the next financial year. This is identical to APA’s approach in the FY2015 remuneration report.
Awarded Awarded in FY2016 in FY2015
Total Fixed Remuneration Awarded Allocated (“TFR”) STI 1 LTI 2 Other Total Total 3 4
Executive Director and Senior Executives $ $ $ $ $ $
Michael McCormackCEO/MD 1,765,000 1,814,861 1,471,679 – 5,051,540 4,792,174
Peter FredricsonCFO 835,000 604,331 464,156 – 1,903,487 2,103,250Ross GersbachChief Executive Strategy and Development 852,000 584,685 473,606 – 1,910,291 2,232,013
Robert WhealsGroup Executive Transmission 678,000 469,854 376,883 – 1,524,737 1,421,487
John FergusonGroup Executive Networks 587,000 411,194 326,299 – 1,324,493 1,261,530
Kevin LesterGroup Executive Infrastructure Development 551,000 360,767 306,287 – 1,218,054 1,134,440
Nevenka CodevelleCompany Secretary & General Counsel 413,075 270,489 205,618 – 889,182 – 3
Elise MannsGroup Executive Human Resources 387,640 247,427 199,114 – 834,181 – 4
Total 6,068,715 4,763,608 3,823,642 – 14,655,965 15,254,364 5
1) Awarded STI represents the amounts earned by the executives during the reporting period and are due to be paid in September 2016 as they are dependent on the approval by the Board and having the signed audited annual accounts.
2) Allocated LTI represents the value of reference units that were earned by the executives during the reporting period. Reference units will be allocated in August 2016 as they are dependent on the approval by the Board and the release of APA Group’s annual results to the ASX.
3) Nevenka Codevelle not KMP FY2015.4) Elise Manns not KMP FY2015.5) FY2015 Total Includes Mark Knapman & Peter Wallace and $430,666 final Retention Payments instalments.
Notes – Mark Knapman, Company Secretary, retired 30 October 2015. – Peter Wallace, Group Executive Human Resources, retired 02 October 2015.
2.2 APA performance and incentive plan outcomes FY2016Strong performance against all major metrics has been achieved again in FY2016. The Group’s superior performance led to strong at-risk remuneration outcomes. More detail on the link between APA performance and executive remuneration outcomes is provided below.
36 APA Group Annual Report 2016
For
per
sona
l use
onl
y

remuneration report. continued.AUSTRALIAN PIPELINE TRUST AND ITS CONTROLLED ENTITIES FOR THE FINANCIAL YEAR ENDED 30 JUNE 2016
2.3 Five year snapshot of APA performanceThe following table provides a summary of APA’s financial performance over the last five financial years. Included below are financial metrics related to incentive plan performance measures and additional disclosures reflecting APA’s earnings and how this impacts securityholder returns.
Normalised Financial Results 1 FY2016 FY2015 FY2014 FY2013 2 FY2012
EBITDA ($m) 1,330.5 822.3 747.3 661.9 535.5Profit after tax ($m) 179.5 203.9 199.6 172.3 140.3Operating cash flow per security (cents) 77.4 54.8 50.8 56.0 52.5Earnings per security (cents) 16.1 20.5 23.1 22.7 21.9Distribution per security (cents) 41.5 38.0 36.3 35.5 35.0Closing security price at 30 June ($) 9.24 8.24 6.89 5.99 4.99
1) Normalised financial results are the statutory financial results excluding significant items. The Directors consider these measures reflect the core earnings of APA. A reconciliation between statutory financial results and the normalised financial results is provided in section 6.
2) The balances for FY2013 have been restated for the effect of applying accounting standard AASB 119: Employee Benefits.
The chart below illustrates the movement in APA’s return index over the last five financial years against the S&P/ ASX 100 and S&P/ ASX 200 Utilities return indices. A return index reflects the theoretical growth in value of a security holding over a specified period, assuming dividends are re-invested to purchase additional units at the closing price applicable on the ex-distribution date.
PERCENTAGE CHANGE IN RETURN INDEX FROM BASE
FY12FY10 FY11 FY13 FY14 FY15 FY16S&P/ASX200 UtilitiesAPA Group S&P/ASX100
(50%)
0
50%
100%
150%
200%
250%
300%
2.4 Link between APA performance and awarded STISTI is an annual cash-settled incentive subject to 12 month financial and non-financial performance. STI funding is dependent on normalised OCFPS, a measure of the average cash amount generated by the business for each stapled security issued (typically excluding such things as significant items). This measure is directly linked to APA’s strategic goal of increasing cash flows over the medium term.
Executives are awarded an STI only if OCFPS is above the threshold level of performance set by the Board. OCFPS therefore acts as a gateway for awards under the STI plan. OCFPS is also the mechanism through which the aggregate amount available for STI payments is limited, ensuring strong alignment between individual performance and APA’s ability to pay.
STI awarded is subject to Executives satisfying their performance against a balanced scorecard of pre-determined APA business unit and personal objectives.
Executive STI Awarded FY2016 FY2015 FY2014 FY2013 FY2012
Executive Award – Maximum 97.5% 96.0% 95.0% 95.0% 96.5%Executive Award – Average 92.8% 92.6% 89.2% 87.2% 90.8%Executive Award – Minimum 87.3% 86.8% 85.3% 77.0% 77.5%OCFPS Performance as % of OCFPS target 112.8% 118.9% 113.1% 117.2% 105.6%
37APA Group Annual Report 2016
For
per
sona
l use
onl
y

remuneration report. continued.AUSTRALIAN PIPELINE TRUST AND ITS CONTROLLED ENTITIES FOR THE FINANCIAL YEAR ENDED 30 JUNE 2016
2.5 STI Performance and Executive AwardsThe chart below illustrates how Executive STI outcomes align with performance against the key business metric of OCFPS.
140%
110%
80%
FY11 FY12 FY13 FY14 FY15
50%
Executive Award – MaximumExecutive Award – AverageExecutive Award – Minimum
OCFPS Performance – Achieved as a % of OCFPS target
Executive performance Vs. KPI performance measures
2.6 STI outcomes during FY2016For FY2016, the STI outcomes for Executives, as a percentage of maximum opportunity, are set out in the table below. STI earned STI forfeited
Executives % $ % $
Michael McCormack 91.4 1,814,861 8.6 170,764Peter Fredricson 96.5 604,331 3.5 21,918Ross Gersbach 91.5 584,685 8.5 54,315Robert Wheals 92.4 469,854 7.6 38,645John Ferguson 93.4 411,194 6.6 29,056Kevin Lester 87.3 360,767 12.7 52,483Nevenka Codevelle 97.5 270,489 1 2.5 6,936Elise Manns 92.1 247,427 1 7.9 21,223
1) STI payments for Nevenka Codevelle and Elise Manns are pro-rated for period of time as KMP in FY2016
2.7 Link between APA performance and awarded LTILTI is a cash-settled incentive subject to two APA measures – Relative Total Securityholder Returns (“TSR”) (three year rolling average performance against S&P/ASX 100 companies) and growth in EBITDA/FE.
Both measures are weighted equally and are linked to building securityholder value. Relative TSR provides the most direct measure of securityholder return and reflects an investor’s choice to invest in APA or competitors. Security price growth is underpinned by earnings growth and EBITDA/FE is based on the integrity of earnings performance against funds employed which provides a measure of how efficiently the assets are being deployed.
The chart below presents APA’s TSR performance relative to S&P/ASX 100 companies (for FY2013 and FY2014 based on TSR end of year rank and for FY2015 and FY2016 based on 3 year rolling average) and EBITDA/FE as a function of improvements to historical actual.
LTI awards as a percentage of maximum opportunity.
Year EBITDA/FE TSR LTI Allocated
FY2013 100.0% 55.4% 77.7%FY2014 66.7% 53.2% 59.9%FY2015 90.8% 100.0% 95.4%FY2016 62.9% 85.3% 74.1%
38 APA Group Annual Report 2016
For
per
sona
l use
onl
y

remuneration report. continued.AUSTRALIAN PIPELINE TRUST AND ITS CONTROLLED ENTITIES FOR THE FINANCIAL YEAR ENDED 30 JUNE 2016
2.8 LTI Performance and Executive Awards
120%
80%
40%
20%
60%
100%
FY13 FY14 FY15 FY160%
EBITDA/FETSRLTI Allocated
2.9 LTI outcomes during FY2016For FY2016, the LTI outcomes for Executives are set out in the table below:
LTI earned LTI forfeited
Executives $ $
Michael McCormack 1,471,679 513,946Peter Fredricson 464,156 162,094Ross Gersbach 473,606 165,394Robert Wheals 376,883 131,617John Ferguson 326,299 113,951Kevin Lester 306,287 106,963Nevenka Codevelle 205,618 71,807Elise Manns 199,114 69,536
39APA Group Annual Report 2016
For
per
sona
l use
onl
y

remuneration report. continued.AUSTRALIAN PIPELINE TRUST AND ITS CONTROLLED ENTITIES FOR THE FINANCIAL YEAR ENDED 30 JUNE 2016
3. Executive Remuneration Arrangements
3.1 Alignment of remuneration strategy with business strategy
VISIONMaintain our ranking as Australia’s number one energy infrastructure business
Enhance our portfolio of energy infrastructure assets
— Designed to further align the interests of the executives with the long-term interests of the securityholders and to ensure excessive risk-taking is not rewarded.
— The Board at its discretion may require executives to repay some or all of any STI or LTI awarded, forfeit unvested LTI and/or forgo future STI or LTI awards if APA’s financial results have been misstated during the preceding three financial years and the misstatement may have impacted incentive plan outcomes.
— Aligning executives to securityholders through an equity-based incentive program is not practicable for APA due to our stapled trust structure and Constitution. APA recognises the benefit of its Executives holding securities in APA. As a result, to further align Executive interests with those of securityholders, in FY16, the Board has introduced a minimum securityholding requirement.
— The policy requires the CEO/MD to have a direct securityholding in APA equal to at least 100% of TFR. Senior executives are required to have a direct securityholding in APA equal to at least 50% of TFR.
— Current executives have five years (from 1 January 2016) to meet the requirement and new executives (appointed to office after 1 January 2016) will have three years following appointment to meet the requirement.
Attract and retain key talent
— Reflect market value, individual’s skills, and experience.
— Consists of base salary, and uperannuation and other salary sacrificed benefits.
— Reference market median against acomparable set of companies.
— Reward performance against specific business and personal objectives (linked to key measures of success).
— Cash-based incentive, subject to annual financial and non-financial performance.
— Only payable if target OCFPS is achieved.
— Clawback applies for three years.
— Reward Executives for creating securityholder value.
— Allocations of reference units (settled in cash).
— TSR against S&P / ASX 100 companies and EBITDA / FE performance measures.
— Tranche vesting over a four year period.— Clawback applies for three years.— Clawback applies to unvested
LTI awards.
Motivate and reward executives for superior performance
Market competitive remuneration (Position TFR/TPO at market median)
Align with securityholder interests
Align with APA business model & organisational imperatives
Comply with legal requirements and appropriate governance standards
Capture revenue and operational synergies
Query investor assets
Facilitate the development of energy related projects
Pursue opportunities which leverage our knowledge and skills base
Strengthen our financial capability
KEY MEASURES OF SUCCESS
REMUNERATION GOVERNANCE
EXECUTIVE REMUNERATION CLAWBACK POLICY
MINIMUM SECURITYHOLDING POLICY
REMUNERATION OBJECTIVES
TOTAL PACKAGE OPPORTUNITY (“TPO”)
TFR STI LTI
40 APA Group Annual Report 2016
For
per
sona
l use
onl
y

remuneration report. continued.AUSTRALIAN PIPELINE TRUST AND ITS CONTROLLED ENTITIES FOR THE FINANCIAL YEAR ENDED 30 JUNE 2016
3.2 Changes to the executive remuneration framework during FY2016The three changes highlighted in previous reports have now been fully implemented. Firstly, TSR in the long term incentive plan was extended to the three previous years to more closely reflect the long-term performance of APA. Secondly, EBITDA/FE was also extended to the three previous years to strengthen the alignment of management and securityholder interests. Thirdly, a minimum securityholding policy has been applied.
3.3 Approach to setting remunerationEach executive’s Total Package Opportunity (“TPO”) consists of TFR plus STI plus LTI and is dependent on their role in the organisation and their capacity to influence outcomes. APA’s executive remuneration is structured as a mix of fixed remuneration and ‘at risk’ components (STI and LTI). The equal emphasis on short and long-term performance (i.e., through STI and LTI awards) ensures executives are appropriately rewarded for delivering sustained APA performance. The proportion of fixed versus ‘at risk’ remuneration varies between roles within APA, reflecting the different capacity of executives to influence APA’s operational performance and returns to securityholders.
CEO/MD
40% 30% 30%
Senior Executives
50% 25% 25%
TFR as a % of TPO Target STI as a % of TPO Target LTI as a % of TPO
3.4 Remuneration componentsTFRTFR is reviewed annually and is determined by reference to independent external remuneration benchmarking information, taking into account an individual’s responsibilities, performance, qualifications and experience. APA’s policy is to position TFR at least at the median against comparable ASX listed companies.
STIThe table below sets out the key elements of the executive STI plan.
STI plan element Description
STI opportunity STI opportunity is expressed as a percentage of TPO and varies by role.
Target STI opportunities are set out in the table below. Maximum STI is 150% of target STI opportunity.
Participant Target STI as a % of TPO
CEO/MD 30%Senior executives 25%
Performance gateway OCFPS acts as a gateway for awards under the STI plan. STI opportunity is only realisable if the OCFPS threshold level of performance set by the Board is met (i.e., the “gate opens”).
Plan funding Provided the OCFPS threshold is met, the STI opportunity available may be modified based on the level of OCFPS performance achieved.
Performance measures Once the “gate opens” and the STI is funded, STI awards are subject to performance against individual KPIs based on a balanced scorecard of APA-wide, business unit and personal objectives covering:− Financial measures: cost control, revenue and cash generation and capital expenditure
management, credit ratings.− Health, Safety & Environment measures: targets against key lead and lag indicators.− Non-financial measures: strategy delivery, customer and stakeholder management, project
delivery, efficiency/improvement initiatives, leadership/talent development and reinforcement of our ethical and values-based culture.
Timing and delivery All STI awards are paid in cash, usually in September of the new financial year, following the completion of the audit of the annual accounts.
Clawback The Board in its discretion may determine that some, or all, of an executive’s STI award is forfeited in the event of misconduct or of a material misstatement in the year end financial statements in the preceding three years.
Cessation of employment
If a participant resigns or is dismissed (with or without notice), all unvested STI awards are forfeited. If an employee leaves for any other reason, an STI award will be paid out based on the proportion of the period that has passed and performance at the time of cessation (subject to Board discretion).
Change of control Subject to Board discretion, and in line with market practice, if a change of control occurs, an STI award will be paid out based on the proportion of the period that has passed at the time of change of control.
41APA Group Annual Report 2016
For
per
sona
l use
onl
y

remuneration report. continued.AUSTRALIAN PIPELINE TRUST AND ITS CONTROLLED ENTITIES FOR THE FINANCIAL YEAR ENDED 30 JUNE 2016
LTIThe table below sets out the key elements of the executive LTI plan.
LTI plan element Description
Award vehicle As a stapled security and under our Constitution, the use of actual securities in the LTI plan would not be practicable. Instead, APA operates a reference unit incentive plan to create alignment with securityholders.Reference units exactly mirror the performance of APA securities and are settled in cash. To further align executives and securityholders, APA has introduced a mandatory securityholding policy, effective from FY2016, requiring executives to hold a substantial number of securities in APA (see Section 3.2 for further detail).Reference Units are valued at allocation based on the 30 trading day volume weighted average market price (“VWAP”) of an APA security up to two days immediately preceding the announcement of APA’s annual financial results to the ASX and as published in this Report.
LTI opportunity LTI opportunities for each participant are set as a percentage of TPO, vary by role and are shown in Section 3.3. Maximum LTI is 150% of target opportunity.
Participant Target LTI as a % of TPO
CEO/MD 30%Senior executives 25%
LTI allocation The actual individual LTI allocation is determined at the completion of the financial year based on TSR performance against the S&P/ASX100 comparator group and EBITDA/FE performance.
Performance measures and targets
Awards are subject to two equally weighted measures: Relative TSR and EBITDA / FE.Relative TSR– TSR measures the percentage change in security price, plus the value of dividends or distributions
received during the period, assuming all dividends and distributions are re-invested into new securities.
– APA Group’s TSR is measured relative to a peer group comprising of S&P/ASX 100 constituents and is measured over three financial years.
– Relative TSR has been selected as a LTI performance measure as it provides the most direct measure of securityholder return and reflects an investor’s choice to invest in APA or direct competitors. Executives only derive value from the TSR component of the LTI plan if APA’s performance is at least at the median of S&P/ASX 100 companies over a three year period.
EBITDA /FE– EBITDA/FE reflects Earnings Before Interest, Tax, Depreciation and Amortisation divided by
Funds Employed. EBITDA/FE hurdle is set as a percentage growth compared to budget and is measured over three financial years. The Board determines the EBITDA/FE target each year through the rigorous budget setting process to improve the capital efficiency of the organisation.
– EBITDA/FE has been selected as an LTI performance measure as it helps determine the operating cash flow leverage being achieved based on the operating assets available to the business. It is a longer term performance measure based on the integrity of earnings performance against funds employed.
Retesting There is no retesting of the allocation. However each vesting tranche is subject to the relevant price at vesting reflecting the movement in value of APA’s securities each year.
Timing and delivery An LTI allocation vests in three equal instalments over the three financial years following the allocation, with the initial one-third vesting at the end of the first financial year following the first award, one-third at the end of the second financial year, and one-third at the end of the third financial year.Upon vesting, the LTI is delivered in cash. The cash payment is equal to the number of units vesting on the vesting date multiplied by the VWAP published in the Annual Report.From FY2016, APA will require Executives to hold a number of APA securities. Executives may apply vested LTI amounts to the purchase of securities to fulfil the securityholding requirement. Executives are currently required to purchase APA Securities ‘on market’ and in accordance with APA Securities Trading Policy and within authorised trading windows.
Restrictions LTI allocations of reference units do not entitle participants to vote at securityholders meetings nor to be paid distributions. No options or other equity instruments are issued to APA employees or Non-executive Directors under the LTI plan.
Clawback The Board in its discretion may determine that some, or all, of an executive’s current year LTI allocation is forfeited in the event of misconduct or of a material misstatement in the year end financial statements in the preceding three years.
Cessation of employment
If a participant resigns or is dismissed (with or without notice), all unvested reference units are forfeited. If an employee leaves for any other reason the Board determines the number of reference units which will lapse or are retained, subject to vesting on the original schedule.
Change of control Subject to Board discretion, and in line with market practice, if a change of control occurs, all previously allocated units will vest. A further number of units will be allocated based on the proportion of the period that has passed in the current financial year at the time of change of control and will also vest on change of control.
42 APA Group Annual Report 2016
For
per
sona
l use
onl
y

remuneration report. continued.AUSTRALIAN PIPELINE TRUST AND ITS CONTROLLED ENTITIES FOR THE FINANCIAL YEAR ENDED 30 JUNE 2016
4. Executive Contracts
4.1 Contractual arrangementsRemuneration arrangements for executives are formalised in individual employment agreements. The terms of the contractual arrangements for executives are set out in the table below:
Termination entitlement Executive Contract type Notice period (without cause)
CEO/MD Permanent 12 months 52 weeks TFRSenior Executives Permanent 6 months 13 weeks TFR
4.2 Sign-on / termination payments provided to executivesAPA did not pay any sign-on payments during FY2016. APA made the following termination payments during FY2016.
Executive Position Held TerminatedPayments at time of Termination On-going Payments
Mark Knapman Company Secretary Retired 30 October 2015
Statutory Entitlements plus 3 months TFR in lieu of notice plus pro rata STI plus pro rata LTI Allocation
Unvested reference units will vest in accordance with the original vesting schedule
Peter Wallace Group Executive Human Resources
Retired 02 October 2015
Statutory Entitlements plus 6 months TFR in lieu of notice plus pro rata STI plus pro rata LTI Allocation
Unvested reference units will vest in accordance with the original vesting schedule
5. Remuneration Governance
5.1 Role of People and Remuneration CommitteeThe People and Remuneration Committee has been established by the Board to oversee executive and Non-executive Director remuneration. The role of the People and Remuneration Committee is to ensure the provision of a robust remuneration and reward system that aligns employee and investor interests and facilitates effective attraction, retention and development of employees. The People and Remuneration Committee’s activities are governed by its Charter (a copy of the Charter is available on APA’s website).
In addition to making recommendations regarding APA’s broad remuneration strategy and policy (including diversity matters), the People and Remuneration Committee is responsible for:
– recommending the CEO/MD’s performance objectives, remuneration and appointment, retention and termination policy to the Board;
– reviewing and approving executives’ remuneration (based on recommendations from the CEO/MD); – reviewing and recommending the Remuneration Report to the Board; and – reviewing senior succession plans and talent.
5.2 Composition of People and Remuneration CommitteeThe members of the People and Remuneration Committee, all of whom are independent Non-executive Directors, are:
– John Fletcher (Chairman); – Steven Crane; – Patricia McKenzie; and – Michael Fraser.
The Chairman of the Board attends all meetings of the People and Remuneration Committee and the CEO/MD attends by invitation, where management input is required. The People and Remuneration Committee met three times during the year.
5.3 Use of external advisorsThe People and Remuneration Committee seeks external professional advice from time to time on any matter within its terms of reference. Remuneration advisors are engaged by the People and Remuneration Committee and report directly to the Committee.
During FY2016, the following remuneration information was obtained and considered by the People and Remuneration Committee:
– Ernst & Young provided remuneration benchmarking information, undertook a review of APA’s executive remuneration framework and assisted with remuneration governance;
– Egan & Associates provided fee and remuneration benchmarking information for Non-executive Director fees and certain members of the executive team, respectively; and
– Orient Capital (Link Group) provided TSR benchmarking analysis.
43APA Group Annual Report 2016
For
per
sona
l use
onl
y

remuneration report. continued.AUSTRALIAN PIPELINE TRUST AND ITS CONTROLLED ENTITIES FOR THE FINANCIAL YEAR ENDED 30 JUNE 2016
6. Non-executive Director Arrangements
6.1 Determination of Non-executive Director feesThe Board seeks to attract and retain high calibre Non-executive Directors who are equipped with diverse skills to oversee all functions of APA in an increasingly complex environment.
Selection and appointment of new Directors, Board succession and related matters were handled by the Board until December 2015 when a Nomination Committee was established comprising of APA Group’s Non-executive Directors.
The Board determines Board fees and Committee fees annually. It acts on advice from the People and Remuneration Committee which obtains external benchmark information from independent remuneration specialists. Such information includes market comparisons paid by comparable S&P/ASX 100 organisations.
Non-executive Director fees comprise: – a Board fee; – an additional fee for serving on a committee of the Board; and – statutory superannuation contributions.
Non-executive Directors do not receive incentive payments nor participate in incentive plans of any type.
One off ‘per diems’ may be paid in exceptional circumstances. No payments have been made under this arrangement in this reporting period or the prior reporting period.
The Board members are subject to a minimum securityholding requirement of 100% of annual base fees in line with the changes introduced for the CEO/MD and executives.
Superannuation is provided in accordance with the statutory requirements under with the Superannuation Guarantee Act.
Following external benchmarking and a review of APA’s performance relative to other companies, Board fees and Committee fees were increased effective 1 January 2016 (see table below).
Board and Committee fees per annum (excluding statutory superannuation) are outlined below. The Board Chairman does not receive additional fees for attending committee meetings.
Effective 1 January 2016 Effective 1 January 2015
Chairman Member Chairman Member Fees $000 $000 $000 $000
Board 440 154 400 140Audit and Risk Management Committee 42 21 38 19Health Safety and Environment Committee 35 17.5 32 16People and Remuneration Committee 35 17.5 32 16
44 APA Group Annual Report 2016
For
per
sona
l use
onl
y

remuneration report. continued.AUSTRALIAN PIPELINE TRUST AND ITS CONTROLLED ENTITIES FOR THE FINANCIAL YEAR ENDED 30 JUNE 2016
7. Additional Key Management Personnel Disclosures
7.1 Fees paid to Non-executive DirectorsThe following table sets out fees paid to Non-executive Directors in FY2015 and FY2016 in accordance with statutory rules and applicable accounting standards.
Short-term employment benefits Post-employment benefits
Retirement Salary/fees Superannuation Benefit Total Year ended 30 June $ $ $ $
Leonard Bleasel AMFY2016 420,000 39,900 – 459,900FY2015 385,000 36,100 – 421,100
Steven CraneFY2016 194,250 18,462 – 212,712FY2015 169,500 15,912 – 185,412
John FletcherFY2016 186,500 33,073 – 219,573FY2015 173,500 29,397 – 202,897
Russell Higgins AOFY2016 200,500 19,073 – 219,573FY2015 185,500 17,397 – 202,897
Patricia McKenzieFY2016 180,500 17,170 – 197,670FY2015 166,500 15,620 – 182,120
Debbie Goodin 1
FY2016 154,583 14,692 – 169,275FY2015 – – – –
Michael Fraser 2
FY2016 151,833 14,447 – 166,280FY2015 – – – –
Robert WrightFY2016 60,258 5,724 54,500 3 120,482FY2015 188,500 17,679 – 206,179
TotalFY2016 1,548,424 162,541 54,500 1,765,465FY2015 1,268,500 132,105 – 1,400,605
1) Debbie Goodin commenced 01 September 2015.2) Michael Fraser commenced 01 September 2015.3) Robert Wright retired 22 October 2015. Following changes in superannuation regulations in 2003, the Board terminated the Non-executive Directors’ retirement
benefit plan. Benefits to participating Non-executive Directors accruing up to the termination date were quantified and preserved for payment on retirement of those Non-executive Directors. Robert Wright was the only Non-executive Director entitled to a preserved benefit under the plan and this was paid on his retirement from the Board on 22 October 2015.
45APA Group Annual Report 2016
For
per
sona
l use
onl
y

remuneration report. continued.AUSTRALIAN PIPELINE TRUST AND ITS CONTROLLED ENTITIES FOR THE FINANCIAL YEAR ENDED 30 JUNE 2016
7.2 Total remuneration earned and received by executivesThe following table outlines the total remuneration earned by executives during FY2015 and FY2016, calculated in accordance with the applicable accounting standard AASB 2: Share-based Payment. This requires the three equal instalments to be accounted for over a four year period, that is, the year of service to which the allocation is awarded plus the following three year period during which vesting rights are satisfied. Post- Short-Term Employment Benefits Employment LTI Plans
Security- Non- Super- Based Other Salary/Fees STI Monetary annuation Payments 1 Payments 2 Total Year ended 30 June $ $ $ $ $ $ $
Michael McCormackFY2016 1,730,000 1,814,861 – 35,000 1,581,283 – 5,161,144FY2015 1,500,000 1,609,447 – 35,000 1,564,212 – 4,708,659
Peter FredricsonFY2016 800,000 604,331 – 35,000 543,124 – 1,982,455FY2015 745,000 561,600 – 35,000 570,885 202,000 2,114,485
Ross GersbachFY2016 805,078 584,685 11,922 35,000 576,019 – 2,012,704FY2015 792,295 589,844 11,922 18,783 622,328 228,666 2,263,838
Robert WhealsFY2016 648,000 469,854 – 30,000 384,858 – 1,532,712FY2015 560,000 408,162 – 30,000 344,570 – 1,342,732
John FergusonFY2016 552,000 411,194 – 35,000 345,605 – 1,343,799FY2015 489,000 361,560 – 35,000 318,204 – 1,203,764
Kevin LesterFY2016 516,000 360,767 – 35,000 309,242 – 1,221,009FY2015 444,000 311,757 – 35,000 215,410 – 1,006,167
Nevenka Codevelle 3
FY2016 388,367 270,489 – 24,708 51,404 4 – 734,968 4
FY2015 – – – – – – –
Elise Manns 5
FY2016 357,640 247,427 – 30,000 49,772 4 – 684,839 4
FY2015 – – – – – – –
Mark KnapmanFY2016 157,699 61,600 – 34,999 262,163 236,224 6 752,685FY2015 474,005 260,406 – 34,995 272,908 – 1,042,314
Peter WallaceFY2016 132,057 68,504 – 20,427 331,385 305,278 6 857,651FY2015 497,000 361,893 – 35,000 334,123 – 1,228,016
Total RemunerationFY2016 6,086,841 4,893,712 11,922 315,134 4,434,855 4 541,502 16,283,966 4
FY2015 5,501,300 4,464,669 11,922 258,778 4,242,640 430,666 14,909,975
1) Cash settled security-based payments. Reference units subject to Board allocation in August 2016 based on an estimated VWAP of $9.4614.2) Other payments include Loyalty Payment instalments. Refer to “Executive contracts” section for more information.3) Nevenka Codevelle, Company Secretary and General Counsel from 31 October 2015.4) This information has been corrected to rectify typographical errors contained in the version of the Remuneration Report for the year ended 30 June 2016 released
to ASX on 24 August 2016.5) Elise Manns, Group Executive Human Resources from 02 October 2015.6) Termination payment.
Note: Volume Weighted Average Price (“VWAP”) is calculated over 30 trading days and 2 days prior to the release of APA results on 24 August 2016.
46 APA Group Annual Report 2016
For
per
sona
l use
onl
y

remuneration report. continued.AUSTRALIAN PIPELINE TRUST AND ITS CONTROLLED ENTITIES FOR THE FINANCIAL YEAR ENDED 30 JUNE 2016
7.3 Outstanding LTI awardsThe following table sets out the movements in the number of LTI reference units and the number of LTI reference units that have been allocated to executives but have not yet vested or been paid, and the years in which they will vest. Reference units allocated that have not yet vested or been paid and the financial years in which they will vest 1
Units subject to Opening Closing allocation by Grant date balance at balance at the Board in Executives (financial year) 1 July 2015 Allocated Paid 30 June 2016 August 2016 2 FY2017 FY2018 FY2019 FY2020
Michael McCormack FY2012 66,077 (66,077) – – – – – FY2013 123,278 (61,639) 61,639 61,639 – – – FY2014 135,141 (45,047) 90,094 45,047 45,047 – – FY2015 188,295 188,295 62,765 62,765 62,765 – FY2016 155,544 – 51,848 51,848 51,848
Total 169,451 159,660 114,613 51,848
Peter Fredricson FY2012 26,300 (26,300) – – – – – FY2013 45,134 (22,567) 22,567 22,567 – – – FY2014 47,250 (15,750) 31,500 15,750 15,750 – – FY2015 63,954 63,954 21,318 21,318 21,318 – FY2016 49,056 – 16,352 16,352 16,352
Total 59,635 53,420 37,670 16,352
Ross Gersbach FY2012 29,772 (29,772) – – – – – FY2013 49,580 (24,790) 24,790 24,790 – – – FY2014 49,833 (16,611) 33,222 16,611 16,611 – – FY2015 67,479 67,479 22,493 22,493 22,493 – FY2016 50,055 – 16,685 16,685 16,685
Total 63,894 55,789 39,178 16,685
Robert Wheals FY2012 11,320 (11,320) – – – – – FY2013 27,954 (13,977) 13,977 13,977 – – – FY2014 31,500 (10,500) 21,000 10,500 10,500 – – FY2015 48,375 48,375 16,125 16,125 16,125 – FY2016 39,831 – 13,277 13,277 13,277
Total 40,602 39,902 29,402 13,277
John Ferguson FY2012 11,057 (11,057) – – – – – FY2013 25,800 (12,900) 12,900 12,900 – – – FY2014 28,980 (9,660) 19,320 9,660 9,660 – – FY2015 42,963 42,963 14,321 14,321 14,321 – FY2016 34,485 – 11,495 11,495 11,495
Total 36,881 35,476 25,816 11,495
1) Reference units multiplied by 30 trading days VWAP to be paid in cash September 2016.2) Reference units subject to Board allocation in August 2016 based on a VWAP $9.4614.
47APA Group Annual Report 2016
For
per
sona
l use
onl
y

remuneration report. continued.AUSTRALIAN PIPELINE TRUST AND ITS CONTROLLED ENTITIES FOR THE FINANCIAL YEAR ENDED 30 JUNE 2016
7.3 Outstanding LTI awards (continued) Reference units allocated that have not yet vested or been paid and the financial years in which they will vest 1
Units subject to Opening Closing allocation by Grant date balance at balance at the Board in Executives (financial year) 1 July 2015 Allocated Paid 30 June 2016 August 2016 2 FY2017 FY2018 FY2019 FY2020
Kevin Lester FY2013 21,190 (10,595) 10,595 10,595 – – – FY2014 26,460 (8,820) 17,640 8,820 8,820 – – FY2015 39,273 39,273 13,091 13,091 13,091 – FY2016 32,370 – 10,790 10,790 10,790
Total 32,506 32,701 23,881 10,790
Nevenka Codevelle 3 FY2016 21,732 – 7,244 7,244 7,244
Total – 7,244 7,244 7,244
Elise Manns 4 FY2016 21,042 – 7,014 7,014 7,014
Total – 7,014 7,014 7,014
Mark Knapman 5 FY2012 13,073 (13,073) – – – – FY2013 21,268 (10,634) 10,634 10,634 – – – FY2014 21,897 (7,299) 14,598 7,299 7,299 – – FY2015 30,219 30,219 10,073 10,073 10,073 – FY2016 – – – – –
Total 28,006 17,372 10,073 –
Peter Wallace 6 FY2012 13,606 (13,606) – – – – – FY2013 24,924 (12,462) 12,462 12,462 – – – FY2014 29,166 (9,722) 19,444 9,722 9,722 – – FY2015 43,620 43,620 14,540 14,540 14,540 – FY2016 – – – – –
Total 36,724 24,262 14,540 –
1) Reference units multiplied by 30 trading days VWAP to be paid in cash in September 2016.2) Reference units subject to Board allocation in August 2016 based on VWAP of $9.4614.3) Nevenka Codevelle, Company Secretary and General Counsel from 30 October 2015.4) Elise Manns, Group Executive Human Resources from 2 October 2015.5) Mark Knapman retired 30 October 2015.6) Peter Wallace, retired 02 October 2015.
48 APA Group Annual Report 2016
For
per
sona
l use
onl
y

remuneration report. continued.AUSTRALIAN PIPELINE TRUST AND ITS CONTROLLED ENTITIES FOR THE FINANCIAL YEAR ENDED 30 JUNE 2016
7.4 Loans to KMP and related partiesNo loans have been made to KMP and related parties.
7.5 SecurityholdingsThe following table sets out the relevant interests of KMP in APA securities: Closing Opening Balance at Securities Securities Balance at Year ended 30 June 1 July 2015 Acquired Disposed 30 June 2016
Non-executive DirectorsLeonard Bleasel AM 614,216 – – 614,216Steven Crane 130,000 – – 130,000John Fletcher 88,250 – – 88,250Russell Higgins AO 122,719 – – 122,719Patricia McKenzie 19,986 2,903 – 22,889Debbie Goodin – 19,000 – 19,000Michael Fraser – 25,000 – 25,000Robert Wright 52,592 1 – – –
Executive DirectorMichael McCormack 278,120 21,880 – 300,000
Senior executivesPeter Fredricson 21,788 1,212 – 23,000Ross Gersbach 485 10,000 – 10,485Robert Wheals 2,000 15,000 – 17,000John Ferguson 2,622 10,000 – 12,622Kevin Lester 7,369 12,000 – 19,369Nevenka Codevelle – 800 – 800Elise Manns – 5,900 – 5,900
1) Robert Wright retired as a director of APA Group on 22 October 2015. His Final Director’s Interest Notice (Appendix 3Z) lodged with the ASX on 22 October 2015 reflected a final holding of 52,592.
KMP are subject to APA’s Securities Trading Policy. A Director or Designated Person (as defined in this policy) with price-sensitive information relating to APA (which is not generally available) is precluded from trading in APA securities.
7.6 Other transactions with KMP of APA and the Responsible Entity and related partiesLeonard Bleasel AM holds 10,000 subordinated notes that were issued by APT Pipelines Limited, a subsidiary of APT.
Other than Non-executive Director fees, executive compensation and equity and debt holdings disclosed in this report, there are no other transactions with the KMP of APA and the Responsible Entity.
49APA Group Annual Report 2016
For
per
sona
l use
onl
y

2016 2015 Note $000 $000
Continuing operationsRevenue 5 2,077,327 1,539,694Share of net profits of associates and joint ventures using the equity method 5 16,977 13,921
2,094,304 1,553,615Net profit on sale of equity accounted investment 3 – 430,039Asset operation and management expenses (129,534) (55,053)Depreciation and amortisation expense 6 (520,890) (208,200)Other operating costs – pass-through 6 (438,330) (434,382)Finance costs 6 (511,355) (348,484)Employee benefit expense 6 (180,103) (176,174)Other expenses (12,097) (24,233)
Profit before tax 301,995 737,128Income tax expense 7 (122,524) (177,198)
Profit for the year 179,471 559,930
Other comprehensive income, net of income taxItems that will not be reclassified subsequently to profit or loss:Actuarial (loss)/gain on defined benefit plan (8,148) 18,354Income tax relating to items that will not be reclassified subsequently 2,444 (5,506)
(5,704) 12,848Items that may be reclassified subsequently to profit or loss:Gain on available-for-sale investments taken to equity 1,027 2,591Transfer of loss on cash flow hedges to profit or loss 121,922 68,960Loss on cash flow hedges taken to equity (249,150) (316,555)Loss on associate hedges taken to equity (9,429) (9,660)Recycling of reserves on disposal of available-for-sale-investments/associate 11,356 (19,416)Income tax relating to items that may be reclassified subsequently 37,136 82,520
(87,138) (191,560)Other comprehensive income for the year (net of tax) (92,842) (178,712)
Total comprehensive income for the year 86,629 381,218
Profit attributable to:Unitholders of the parent 94,520 513,581Non-controlling interest – APT Investment Trust unitholders 85,102 46,348
APA stapled securityholders 179,622 559,929Non-controlling interest – other (151) 1
179,471 559,930
Total comprehensive income attributable to:Unitholders of the parent 2,273 333,880Non-controlling interest – APT Investment Trust unitholders 84,507 47,337
APA stapled securityholders 86,780 381,217Non-controlling interest – other (151) 1
86,629 381,218
Earnings per security 2016 2015
Basic and diluted (cents per security) 8 16.1 56.3
The above consolidated statement of profit or loss and other comprehensive income should be read in conjunction with the accompanying notes.
consolidated statement of profit or loss and other comprehensive income.AUSTRALIAN PIPELINE TRUST AND ITS CONTROLLED ENTITIES FOR THE FINANCIAL YEAR ENDED 30 JUNE 2016
50 APA Group Annual Report 2016
For
per
sona
l use
onl
y

2016 2015 Note $000 $000
Current assetsCash and cash equivalents 19 84,506 411,921Trade and other receivables 10 263,232 254,940Other financial assets 22 35,140 24,789Inventories 24,891 21,290Other 13,023 8,314
Current assets 420,792 721,254
Non-current assetsCash on deposit 19 2,149 –Trade and other receivables 10 17,283 92,470Other financial assets 22 447,070 496,537Investments accounted for using the equity method 25 197,185 257,425Property, plant and equipment 12 9,189,087 8,355,193Goodwill 13 1,184,588 1,140,500Other Intangible assets 13 3,355,707 3,556,246Other 16 28,814 33,261
Non-current assets 14,421,883 13,931,632
Total assets 14,842,675 14,652,886
Current liabilitiesTrade and other payables 11 252,661 405,685Borrowings 20 409,829 164,353Other financial liabilities 22 114,674 145,815Provisions 15 93,033 85,452Unearned revenue 13,735 7,477
Current liabilities 883,932 808,782
Non-current liabilitiesTrade and other payables 11 3,007 3,261Borrowings 20 9,314,373 9,141,497Other financial liabilities 22 194,591 44,793Deferred tax liabilities 7 304,849 194,692Provisions 15 70,917 60,410Unearned revenue 41,895 16,801
Non-current liabilities 9,929,632 9,461,454
Total liabilities 10,813,564 10,270,236
Net assets 4,029,111 4,382,650
EquityAustralian Pipeline Trust equity:Issued capital 23 3,195,445 3,195,449Reserves (395,335) (308,792)Retained earnings 182,062 463,772
Equity attributable to unitholders of the parent 2,982,172 3,350,429
Non-controlling interests:APT Investment Trust:Issued capital 1,005,074 1,005,086Reserves – 595Retained earnings 41,812 26,488
Equity attributable to unitholders of APT Investment Trust 24 1,046,886 1,032,169
Other non-controlling interest 53 52
Total non-controlling interests 1,046,939 1,032,221
Total equity 4,029,111 4,382,650
The above consolidated statement of financial position should be read in conjunction with the accompanying notes.
consolidated statement of financial position.AUSTRALIAN PIPELINE TRUST AND ITS CONTROLLED ENTITIES FOR THE FINANCIAL YEAR ENDED 30 JUNE 2016
51APA Group Annual Report 2016
For
per
sona
l use
onl
y

cons
olid
ated
sta
tem
ent o
f cha
nges
in e
quit
y.A
US
TRA
LIA
N P
IPEL
INE
TRU
ST
AN
D IT
S C
ON
TRO
LLED
EN
TITI
ES F
OR
THE
FIN
AN
CIA
L YE
AR
END
ED 3
0 J
UN
E 20
16
A
ustr
alia
n Pi
pelin
e Tr
ust
APT
Inve
stm
ent
Trus
t O
ther
non
-con
trol
ling
inte
rest
Av
aila
ble-
Avai
labl
e-
fo
r-sa
le
At
trib
utab
le
fo
r-sa
le
Ass
et
Inve
stm
ent
to
ow
ner
In
vest
men
t
APT
Oth
er n
on-
Is
sued
Re
valu
atio
n Re
valu
atio
n H
edgi
ng
Oth
er
Reta
ined
of
the
Issu
ed
Reva
luat
ion
Reta
ined
In
vest
men
t Is
sued
Reta
ined
co
ntro
lling
C
apita
l Re
serv
e Re
serv
e Re
serv
e Re
serv
e ea
rnin
gs
pare
nt
Cap
ital
Rese
rve
earn
ings
Tr
ust
Cap
ital
Oth
er
earn
ings
in
tere
sts
Tota
l
$000
$0
00
$000
$0
00
$000
$0
00
$000
$0
00
$000
$0
00
$000
$0
00
$000
$0
00
$000
$0
00
Bala
nce
at 1
July
2014
1,8
16,4
60
8,66
9 36
3 (1
25,2
75)
– 20
0,97
8 1,9
01,19
5 57
6,172
(3
94)
19,4
65
595,
243
4 1
46
51
2,49
6,48
9Pr
ofit
for t
he y
ear
– –
– –
– 51
3,58
1 51
3,58
1 –
– 46
,348
46
,348
–
– 1
1 55
9,930
Oth
er c
ompr
ehen
sive
inco
me
– –
1,60
2 (2
76,6
71)
– 18
,354
(2
56,7
15)
– 98
9 –
989
– –
– –
(255
,726
)In
com
e ta
x rel
atin
g
to c
ompo
nent
s of o
ther
co
mpr
ehen
sive
inco
me
– –
(481
) 83
,001
–
(5,5
06)
77,0
14
– –
– –
– –
– –
77,0
14
Tota
l com
preh
ensiv
e
inco
me
for t
he ye
ar
– –
1,121
(1
93,6
70)
– 52
6,42
9 33
3,88
0 –
989
46,3
48
47,3
37
– –
1 1
381,2
18
Paym
ent o
f dist
ribut
ions
–
– –
– –
(263
,635
) (2
63,6
35)
– –
(39,
325)
(3
9,32
5)
– –
– –
(30
2,96
0)Se
curit
ies
issue
d un
der
entit
lem
ent o
ffer
1,4
00,
122
– –
– –
– 1,4
00,
122
438,
351
– –
438,
351
– –
– –
1,838
,473
Issu
e co
st o
f sec
uriti
es
(30,
190)
–
– –
– –
(30,
190)
(9
,437
) –
– (9
,437
) –
– –
– (3
9,62
7)Ta
x rel
atin
g to
secu
rity
issue
cos
ts
9,057
–
– –
– –
9,057
–
– –
– –
– –
– 9,0
57
Bala
nce
at
30 J
une
2015
3,1
95,4
49
8,66
9 1,4
84
(318
,945)
–
463,7
72
3,35
0,42
9 1,0
05,0
86
595
26,4
88
1,032
,169
4 1
47
52
4,38
2,65
0
Bala
nce
at 1
July
2015
3,
195,
449
8,66
9 1,4
84
(318
,945
) –
463,
772
3,35
0,42
9 1,0
05,
086
59
5 26
,488
1,0
32,16
9 4
1 47
52
4,
382,
650
Prof
it fo
r the
yea
r –
– –
– –
94,5
20
94,5
20
– –
85,10
2 85
,102
– –
(151
) (1
51)
179,
471
Oth
er c
ompr
ehen
sive
inco
me
– –
(2,12
1)
(121
,558
) –
(8,14
8)
(131
,827
) –
(595
) –
(595
) –
– –
– (1
32,4
22)
Inco
me
tax
rela
ting
to c
ompo
nent
s of
oth
er
co
mpr
ehen
sive
inco
me
– –
637
36,4
99
– 2,
444
39,5
80
– –
– –
– –
– –
39,5
80
Tota
l com
preh
ensiv
e
inco
me
for t
he y
ear
– –
(1,4
84)
(85,
059
) –
88,8
16
2,27
3 –
(595
) 85
,102
84,5
07
– –
(151
) (1
51)
86,6
29
Acqu
isitio
n of
no
n-co
ntro
lling
inte
rest
–
– –
– (1
52)
– (1
52)
– –
– –
– –
152
152
–Tr
ansf
er to
re
tain
ed e
arni
ngs
– –
– –
152
(152
) –
– –
– –
– –
– –
–Pa
ymen
t of
dist
ribut
ions
(not
e 8)
–
– –
– –
(370
,374
) (3
70,3
74)
– –
(69,
778)
(6
9,77
8)
– –
– –
(440
,152)
Issu
e co
st o
f sec
uriti
es
(6)
– –
– –
– (6
) (1
2)
– –
(12)
–
– –
– (1
8)Ta
x rel
atin
g to
se
curit
y iss
ue c
osts
2
– –
– –
– 2
– –
– –
– –
– –
2
Bala
nce
at
30 J
une
2016
3,
195,
445
8,66
9 –
(404
,004
) –
182,
062
2,98
2,17
2 1,0
05,0
74
– 41
,812
1,0
46,8
86
4 1
48
53
4,02
9,111
The
abov
e co
nsol
idat
ed s
tate
men
t of c
hang
es in
equ
ity
shou
ld b
e re
ad in
con
junc
tion
with
the
acco
mpa
nyin
g no
tes.
52 APA Group Annual Report 2016
For
per
sona
l use
onl
y

2016 2015 Note $000 $000
Cash flows from operating activitiesReceipts from customers 2,286,248 1,584,738Payments to suppliers and employees (964,879) (827,797)Receipts of Hastings Funds Management fees 3 – 17,201Dividends received from associates and joint ventures 22,186 46,526Proceeds from repayment of finance leases 3,399 4,621Interest received 9,660 30,296Interest and other costs of finance paid (493,586) (293,395)Income tax paid (593) –
Net cash provided by operating activities 862,435 562,190
Cash flows from investing activitiesPayments for property, plant and equipment (455,975) (2,814,559)Proceeds from sale of property, plant and equipment 386 876Payments for equity accounted investments – (17,383)Payments for controlled entities net of cash acquired 26 (217,340) –Payments for other assets – (18,612)Payments for intangible assets (705) (3,429,281)Loans advanced to related parties – (3,490)Proceeds from sale of finance lease asset – 8,683Proceeds from sale of equity accounted investment – 783,758
Net cash used in investing activities (673,634) (5,490,008)
Cash flows from financing activitiesProceeds from borrowings 1,110,153 5,279,188Repayments of borrowings (1,176,899) (1,429,500)Proceeds from issue of securities – 1,838,473Payment of debt issue costs (9,623) (32,398)Payments of security issue costs (77) (39,567)Proceeds from early settlement of derivatives – 19,515Release of restricted cash 20 –Distributions paid to: Unitholders of APT (370,374) (263,636) Unitholders of non-controlling interests – APTIT (69,778) (39,324)
Net cash (used)/provided by financing activities (516,578) 5,332,751
Net (decrease)/increase in cash and cash equivalents (327,777) 404,933Cash and cash equivalents at beginning of financial year 411,921 7,009Unrealised exchange gains/(losses) on cash held 362 (21)
Cash and cash equivalents at end of financial year 19 84,506 411,921
The above consolidated statement of cash flows should be read in conjunction with the accompanying notes.
consolidated statement of cash flows. AUSTRALIAN PIPELINE TRUST AND ITS CONTROLLED ENTITIES FOR THE FINANCIAL YEAR ENDED 30 JUNE 2016
53APA Group Annual Report 2016
For
per
sona
l use
onl
y

Reconciliation of profit for the year to the net cash provided by operating activities 2016 2015 Note $000 $000
Profit for the year 179,471 559,930Loss on previously held interest on obtaining control 476 –Acquisition costs from business combinations 3,387 –Loss on disposal of property, plant and equipment 447 3,337Loss on write-off of inventories 127 –Profit on sale of finance lease asset – (1,764)Share of net profits of joint ventures and associates using the equity method (16,977) (13,921)Dividends/distributions received from equity accounted investments 21,537 45,989Net profit on sale of equity accounted investment 3 – (430,039)Depreciation and amortisation expense 520,890 208,200Finance costs 12,225 21,221Unrealised foreign exchange (gain)/loss (938) 35Realised hedging loss/(gain) 7,540 (19,258)Changes in assets and liabilities: Trade and other receivables (15,742) (49,880) Inventories (3,605) (3,936) Other assets 3,195 (24,725) Trade and other payables (8,456) 65,083 Provisions 4,524 14,725 Other liabilities 32,403 9,995 Income tax balances 121,931 177,198
Net cash provided by operating activities 862,435 562,190
Cash flows are included in the statement of cash flows on a gross basis. The GST component of cash flows arising from investing and financing activities which is recoverable from, or payable to, the taxation authority is classified within operating cash flows.
consolidated statement of cash flows. continued.AUSTRALIAN PIPELINE TRUST AND ITS CONTROLLED ENTITIES FOR THE FINANCIAL YEAR ENDED 30 JUNE 2016
54 APA Group Annual Report 2016
For
per
sona
l use
onl
y

notes to the consolidated financial statements.AUSTRALIAN PIPELINE TRUST AND ITS CONTROLLED ENTITIES FOR THE FINANCIAL YEAR ENDED 30 JUNE 2016
BASIS OF PREPARATION
1. About this reportThe content and format of the financial statements is streamlined to present the financial information in a meaningful manner to securityholders. Note disclosures are grouped into six sections being Basis of Preparation, Financial Performance, Operating Assets and Liabilities, Capital Management, Group Structure and Other. Each note sets out the accounting policies applied in producing the results along with any key judgements and estimates used. The purpose of the format is to provide readers with a clear understanding of what are the key drivers of financial performance for APA Group.
Basis of Preparation
1. About this report
2. General information
3. Significant items and events
Financial Performance
4. Segment information
5. Revenue
6. Expenses
7. Income tax
8. Earnings per security
9. Distributions
Operating Assets and Liabilities
10. Receivables
11. Payables
12. Property, plant and equipment
13. Goodwill and intangibles
14. Impairment of non-financial assets
15. Provisions
16. Other non-current assets
17. Employee superannuation plans
18. Leases
Capital Management
19. Cash balances
20. Borrowings
21. Financial risk management
22. Other financial instruments
23. Issued capital
Group Structure
24. Non-controlling interests
25. Joint arrangements and associates
26. Business combinations
27. Subsidiaries
Other
28. Commitments and contingencies
29. Director and senior executive remuneration
30. Remuneration of external auditor
31. Related party transactions
32. Parent entity information
33. Adoption of new and revised Accounting Standards
34. Events occurring after reporting date
2. General informationAPA Group comprises of two trusts, Australian Pipeline Trust (“APT”) and APT Investment Trust (“APTIT”), which are registered managed investment schemes regulated by the Corporations Act 2001. APT units are “stapled” to APTIT units on a one-to-one basis so that one APT unit and one APTIT unit form a single stapled security which trades on the Australian Securities Exchange under the code “APA”.
Australian Accounting Standards require one of the stapled entities of a stapled structure to be identified as the parent entity for the purposes of preparing a consolidated financial report. In accordance with this requirement, APT is deemed to be the parent entity. The results and equity attributable to APTIT, being the other stapled entity which is not directly or indirectly held by APT, are shown separately in the financial statements as non-controlling interests.
The financial report represents the consolidated financial statements of APT and APTIT (together the “Trusts”), their respective subsidiaries and the share of joint arrangements and associates (together “APA Group”). For the purposes of preparing the consolidated financial report, APA Group is a for-profit entity.
Total comprehensive income attributable to non-controlling interests is reported as disclosed in the separate financial statements of APTIT. Comprehensive income arising from transactions between the parent (APT) group entities and the non-controlling interest (APTIT) have not been eliminated in the reporting of total comprehensive income attributable to non-controlling interests.
All intragroup transactions and balances have been eliminated on consolidation. Where necessary, adjustments are made to the assets, liabilities, and results of subsidiaries, joint arrangements, associates, and joint ventures to bring their accounting policies into line with those used by APA Group.
APT’s registered office and principal place of business is as follows:
Level 19HSBC Building580 George StreetSYDNEY NSW 2000Tel: (02) 9693 0000
55APA Group Annual Report 2016
For
per
sona
l use
onl
y

notes to the consolidated financial statements. continued.AUSTRALIAN PIPELINE TRUST AND ITS CONTROLLED ENTITIES FOR THE FINANCIAL YEAR ENDED 30 JUNE 2016
BASIS OF PREPARATION
2. General information (continued)The consolidated general purpose financial report for the year ended 30 June 2016 was authorised for issue in accordance with a resolution of the directors on 24 August 2016.
This general purpose financial report has been prepared in accordance with the requirements of the Corporations Act 2001, Australian Accounting Standards and other authoritative pronouncements of the Australian Accounting Standards Board (AIFRS) and also comply with International Financial Reporting Standards (IFRS) as issued by the International Accounting Standards Board.
The financial report has been prepared on the basis of historical cost, except for the revaluation of financial instruments. The financial report is presented in Australian dollars and all values are rounded to the nearest thousand dollars ($000) in accordance with ASIC Corporations Instrument 2016/191, unless otherwise stated.
Working capital positionThe working capital position as at 30 June 2016 for APA Group is that current liabilities exceed current assets by $463.1 million (2015: $87.5 million) primarily as a result of $114.7 million (AUD equivalent) of cash flow hedge liabilities and current borrowings of $409.8 million.
APA Group has access to sufficient available committed, un-drawn bank facilities of $672.5 million as at 30 June 2016 (2015: $1,175.0 million) to meet the repayment of current borrowings on due date.
The Directors continually monitor APA Group’s working capital position, including forecast working capital requirements and have ensured that there are appropriate refinancing strategies and adequate committed funding facilities in place to accommodate debt repayments as and when they fall due.
Foreign currency transactionsBoth the functional and presentation currency of APA Group and APT is Australian dollars (A$). All foreign currency transactions during the financial year are brought to account using the exchange rate in effect at the date of the transaction. Foreign currency monetary items at reporting date are translated at the exchange rate existing at that date and resulting exchange differences are recognised in profit or loss in the period in which they arise, unless they qualify for hedge accounting.
3. Significant items and eventsIndividually significant items included in profit after income tax expense are as follows:
2016 2015 $000 $000
Significant items impacting EBITDA Net profit on sale of equity accounted investment a – 430,039 Recovery of fees paid by HDF to Hastings Funds Management Limited b – 17,201
Total significant items impacting EBITDA – 447,240
Income tax related to significant items above – (91,222)
Profit from significant items after income tax – 356,018
a) During August 2014, APA Group sold its investment in Envestra Limited to Cheung Kong Group consortium for $1.32 per share amounting to $783.8 million in gross proceeds which realised a net pre-tax profit of $430.0 million.
b) In November 2014, APA Group successfully appealed the NSW Supreme Court decision in a matter regarding performance fees previously paid by Hastings Diversified Utilites Fund (HDF) to Hastings Funds Management Limited (HFML).
56 APA Group Annual Report 2016
For
per
sona
l use
onl
y

notes to the consolidated financial statements. continued.AUSTRALIAN PIPELINE TRUST AND ITS CONTROLLED ENTITIES FOR THE FINANCIAL YEAR ENDED 30 JUNE 2016
FINANCIAL PERFORMANCE
4. Segment informationAPA Group operates in one geographical segment, being Australia and the revenue from major products and services is shown by the reportable segments.
APA Group comprises the following reportable segments: – Energy Infrastructure, which includes all wholly or majority owned pipelines, gas storage assets, the Emu Downs Wind Farm, and the Diamantina Power Station;
– Asset Management, which provides commercial, operating services and/or asset maintenance services to APA Group’s energy investments and Australian Gas Networks Limited for appropriate fees; and
– Energy Investments, which includes APA Group’s strategic stakes in a number of investment entities that house energy infrastructure assets, generally characterised by long term secure cashflows, with low capital expenditure requirements.
Reportable segments Energy Asset Energy Infrastructure Management Investments Other Consolidated 2016 $000 $000 $000 $000 $000
Segment revenue a
External sales revenue 1,526,658 95,430 – – 1,622,088Equity accounted net profits – – 16,977 – 16,977Pass-through revenue 29,586 408,744 – – 438,330Finance lease and investment interest income 1,917 – 10,783 – 12,700Distribution – other entities – – 512 – 512
Total segment revenue 1,558,161 504,174 28,272 – 2,090,607Other interest income 3,697
Consolidated revenue 2,094,304
Segment resultEarnings before interest, tax, depreciation and amortisation (“EBITDA”) 1,333,682 53,858 36 – 1,387,576Share of net profits of joint ventures and associates using the equity method – – 16,977 – 16,977Finance lease and investment interest income 1,917 – 10,783 – 12,700Corporate costs – – – (86,710) (86,710)
Total EBITDA 1,335,599 53,858 27,796 (86,710) 1,330,543Depreciation and amortisation (508,710) (12,180) – – (520,890)
Earnings before interest and tax (“EBIT”) 826,889 41,678 27,796 (86,710) 809,653Net finance costs b (507,658)
Profit before tax 301,995Income tax expense (122,524)
Profit for the year 179,471
a) The revenue reported above represents revenue generated from external customers. Any intersegment sales were immaterial.b) Excluding finance lease and investment interest income, and any gains or losses on revaluation of derivatives included as part of EBIT for segment reporting
purposes, but including other interest income.
Energy Asset Energy Infrastructure Management Investments Consolidated 2016 $000 $000 $000 $000
Segment assets and liabilitiesSegment assets 13,873,683 213,973 17,499 14,105,155Carrying value of investments using the equity method – – 197,185 197,185Unallocated assets a 540,335
Total assets 14,842,675
Segment liabilities 319,995 63,574 – 383,569Unallocated liabilities b 10,429,995
Total liabilities 10,813,564
a) Unallocated assets consist of cash and cash equivalents, fair value of interest rate swaps, foreign exchange contracts and equity forwards.b) Unallocated liabilities consist of current and non-current borrowings, deferred tax liabilities, fair value of interest rate swaps and foreign exchange contracts.
57APA Group Annual Report 2016
For
per
sona
l use
onl
y

notes to the consolidated financial statements. continued.AUSTRALIAN PIPELINE TRUST AND ITS CONTROLLED ENTITIES FOR THE FINANCIAL YEAR ENDED 30 JUNE 2016
FINANCIAL PERFORMANCE
4. Segment information (continued)Reportable segments (continued)
Energy Asset Energy Infrastructure Management a Investments a Other Consolidated 2015 $000 $000 $000 $000 $000
Segment revenue b
External sales revenue 984,184 85,056 – – 1,069,240Equity accounted net profits – – 13,921 – 13,921Pass-through revenue 13,514 420,868 – – 434,382Finance lease and investment interest income 2,896 – 8,308 – 11,204Distribution – other entities – – 546 – 546
Total segment revenue 1,000,594 505,924 22,775 – 1,529,293
Other interest income 24,322
Consolidated revenue 1,553,615
a) During August 2014, APA Group sold its investment in Envestra Limited to a Cheung Kong Group consortium for $1.32 per share. This resulted in a $440.0 million gain in Energy Investments being the gross proceeds less the carrying value of the equity accounted investment affected by a reassessment of the carrying value of the asset management business to reflect future growth opportunities, resulting in a reduction of goodwill ($10.0 million).
b) The revenue reported above represents revenue generated from external customers. Any intersegment sales were immaterial.
Segment resultEarnings before interest, tax, depreciation and amortisation (“EBITDA”) 838,462 39,448 440,584 – 1,318,494Share of net profits of joint ventures and associates using the equity method – – 13,921 – 13,921Finance lease and investment interest income 2,896 – 8,308 – 11,204Corporate costs – – – (74,129) (74,129)
Total EBITDA 841,358 39,448 462,813 (74,129) 1,269,490Depreciation and amortisation (195,635) (12,565) – – (208,200)
Earnings before interest and tax (“EBIT”) 645,723 26,883 462,813 (74,129) 1,061,290Net finance costs b (324,162)
Profit before tax 737,128Income tax expense (177,198)
Profit for the year 559,930
Energy Asset Energy Infrastructure Management a Investments a Consolidated2015 $000 $000 $000 $000
Segment assets and liabilitiesSegment assets 13,146,538 239,798 110,874 13,497,210Carrying value of investments using the equity method – – 257,425 257,425Unallocated assets c 898,251
Total assets 14,652,886
Segment liabilities 507,565 71,521 – 579,086Unallocated liabilities d 9,691,150
Total liabilities 10,270,236
a) During August 2014, APA Group sold its investment in Envestra Limited to a Cheung Kong Group consortium for $1.32 per share. This resulted in a $440.0 million gain in Energy Investments being the gross proceeds less the carrying value of the equity accounted investment affected by a reassessment of the carrying value of the asset management business to reflect future growth opportunities, resulting in a reduction of goodwill ($10.0 million).
b) Excluding finance lease and investment interest income, and any gains or losses on revaluation of derivatives included as part of EBIT for segment reporting purposes, but including other interest income.
c) Unallocated assets consist of cash and cash equivalents, fair value of interest rate swaps, foreign exchange contracts and equity forwards.d) Unallocated liabilities consist of current and non-current borrowings, deferred tax liabilities, fair value of interest rate swaps and foreign exchange contracts.
58 APA Group Annual Report 2016
For
per
sona
l use
onl
y

notes to the consolidated financial statements. continued.AUSTRALIAN PIPELINE TRUST AND ITS CONTROLLED ENTITIES FOR THE FINANCIAL YEAR ENDED 30 JUNE 2016
FINANCIAL PERFORMANCE
4. Segment information (continued)Reportable segments (continued)
Information about major customersIncluded in revenues arising from energy infrastructure of $1,526.7 million (2015: $984.2 million) are revenues of approximately $652.0 million (2015: $437.4 million) which arose from sales to APA Group’s top three customers.
5. RevenueAn analysis of APA Group’s revenue for the year is as follows:
2016 2015 $000 $000
Energy infrastructure revenue 1,526,050 983,587Pass-through revenue 29,586 13,514
Energy infrastructure revenue 1,555,636 997,101
Asset management revenue 95,430 85,056Pass-through revenue 408,744 420,868
Asset management revenue 504,174 505,924
Operating revenue 2,059,810 1,503,025
Interest 3,697 24,322Interest income on redeemable ordinary shares (EII), redeemable preference shares (GDI) and loans to related parties (DPS) 10,783 8,308Finance lease income 1,917 2,896
Finance income 16,397 35,526
Dividends 512 546Rental income 608 597
Total revenue 2,077,327 1,539,694
Share of net profits of joint ventures and associates using the equity method 16,977 13,921
2,094,304 1,553,615
Revenue is recognised to the extent that it is probable that the economic benefits will flow to APA Group and can be reliably measured. Amounts disclosed as revenue are net of duties and taxes paid. Revenue is recognised for the major business activities as follows:
– Operating revenue, which is earned from the transportation of gas, generation of electricity and other related services and is recognised when the services are provided net of goods and services tax (“GST”), except where the amount of GST incurred is not recoverable from the taxation authority;
– Pass-through revenue, for which no margin is earned, is recognised when the services are provided and offset by corresponding pass-through costs;
– Interest revenue, which is recognised as it accrues and is determined using the effective interest method; – Dividend revenue, which is recognised when the right to receive the payment has been established; and – Finance lease income, which is allocated to accounting periods so as to reflect a constant periodic rate of return on the Group’s net investment outstanding in respect of the leases.
59APA Group Annual Report 2016
For
per
sona
l use
onl
y

notes to the consolidated financial statements. continued.AUSTRALIAN PIPELINE TRUST AND ITS CONTROLLED ENTITIES FOR THE FINANCIAL YEAR ENDED 30 JUNE 2016
FINANCIAL PERFORMANCE
6. Expenses 2016 2015 $000 $000
Depreciation of non-current assets 337,426 182,084Amortisation of non-current assets 183,464 26,116
Depreciation and amortisation expense 520,890 208,200
Gas pipeline costs 29,586 13,514Management, operating and maintenance costs 408,744 420,868
Other operating costs – pass-through 438,330 434,382
Interest on bank overdrafts and borrowings a 500,588 357,255Amortisation of deferred borrowing costs 9,227 14,978Other finance costs 5,084 14,641
514,899 386,874Less: amounts included in the cost of qualifying assets (6,157) (20,002)
508,742 366,872Gain on derivatives (698) (19,643)Unwinding of discount on non-current liabilities 3,311 1,255
Finance costs 511,355 348,484
Defined contribution plans 11,406 10,116Defined benefit plans (Note 17) 2,741 4,146
Post-employment benefits 14,147 14,262Termination benefits 2,995 2,172Cash settled security-based payments b 27,585 23,629Other employee benefits 135,376 136,111
Employee benefit expense 180,103 176,174
a) The average interest rate on funds borrowed is 5.80% p.a. (2015: 7.12% p.a.) including amortisation of borrowing costs and other finance costs.b) APA Group provides benefits to certain employees in the form of cash settled security-based payments. For cash settled security-based payments, a liability
equal to the portion of services received is recognised at the current fair value determined at each reporting date.
7. Income taxThe major components of tax expense are: 2016 2015 $000 $000
Income statement (continuing operations)Current tax expense in respect of the current year (9,076) (8,734)Adjustments recognised in the current year in relation to current tax of prior years 2,216 1,516Deferred tax expense relating to the origination and reversal of temporary differences (115,664) (169,980)
Total tax expense (122,524) (177,198)
Tax reconciliation (continuing operations)Profit before tax 301,995 737,128
Income tax expense calculated at 30% (90,599) (221,138)Non-assessable trust distribution 25,530 13,904Non deductible expenses (62,884) (13,567)Non assessable income 2,984 4,278Excess of equity accounted book value over tax base of Envestra shares – 12,149Unfranked dividends from associates – (4,530)
(124,969) (208,904)Previously unbooked losses now recognised 229 30,190Adjustment recognised in the current year in relation to the current tax of prior years 2,216 1,516
(122,524) (177,198)
60 APA Group Annual Report 2016
For
per
sona
l use
onl
y

notes to the consolidated financial statements. continued.AUSTRALIAN PIPELINE TRUST AND ITS CONTROLLED ENTITIES FOR THE FINANCIAL YEAR ENDED 30 JUNE 2016
FINANCIAL PERFORMANCE
7. Income tax (continued)Income tax expense comprises of current and deferred tax. Income tax is recognised in profit or loss except to the extent that it relates to items recognised directly in other comprehensive income, in which case it is recognised in equity. Current tax represents the expected taxable income at the applicable tax rate for the financial year, and any adjustment to tax payable in respect of previous financial years.
Income tax expense for the 2016 year is $122.5 million (2015: $177.2 million). An income tax provision of $13.8 million (2015: $7.2 million) has been recognised after utilisation of all available group tax losses and partial utilisation of available transferred tax losses (refer to Note 11).
Deferred tax balancesDeferred tax (liabilities)/assets arise from the following:
Opening Charged to Charged to Acquired/ Closing balance income equity Disposed balance 2016 $000 $000 $000 $000 $000
Gross deferred tax liabilitiesIntangible assets (2,668) 2,668 – – –Property, plant and equipment (586,107) (102,407) – (36,011) (724,525)Deferred expenses (51,669) (3,022) – 128 (54,563)Other 1,421 (2,151) – – (730)Available for sale investments (639) – 639 – –
(639,662) (104,912) 639 (35,883) (779,818)
Gross deferred tax assetsProvisions 45,051 (1,136) – 1,808 45,723Cash flow hedges 127,474 (713) 38,266 – 165,027Security issue costs 7,261 (1,820) 2 – 5,443Deferred revenue 6,729 (918) – – 5,811Investments equity accounted 10,192 (1,978) (1,769) – 6,445Defined benefit obligation (1,007) (54) 2,444 – 1,383Tax losses 249,270 (4,133) – – 245,137
444,970 (10,752) 38,943 1,808 474,969
Net deferred tax liability (194,692) (115,664) 39,582 (34,075) (304,849)
2015Gross deferred tax liabilitiesIntangible assets (3,437) 769 – – (2,668)Property, plant and equipment (486,629) (99,478) – – (586,107)Deferred expenses (49,683) (1,986) – – (51,669)Defined benefit obligation 4,328 171 (5,506) – (1,007)Available for sale investments (157) – (482) – (639)
(535,578) (100,524) (5,988) – (642,090)
Gross deferred tax assetsProvisions 37,448 7,603 – – 45,051Cash flow hedges 52,516 193 74,765 – 127,474Security issue costs 186 (1,982) 9,057 – 7,261Deferred revenue 2,465 4,264 – – 6,729Investments equity accounted (990) 2,945 8,237 – 10,192Other 32 1,389 – – 1,421Tax losses 333,138 (83,868) – – 249,270
424,795 (69,456) 92,059 – 447,398
Net deferred tax liability (110,783) (169,980) 86,071 – (194,692)
61APA Group Annual Report 2016
For
per
sona
l use
onl
y

notes to the consolidated financial statements. continued.AUSTRALIAN PIPELINE TRUST AND ITS CONTROLLED ENTITIES FOR THE FINANCIAL YEAR ENDED 30 JUNE 2016
FINANCIAL PERFORMANCE
7. Income tax (continued)Unrecognised deferred tax assets 2016 2015 $000 $000
The following deferred tax assets have not been brought to account as assets:Tax losses – capital 1,641 2,012
Deferred tax is provided using the balance sheet liability method, providing for temporary differences between the carrying amounts of assets and liabilities for financial reporting purposes and the amounts used for taxation purposes. The following temporary differences are not provided for:i) initial recognition of goodwill;ii) initial recognition of assets or liabilities that affect neither accounting nor taxable profit; andiii) differences relating to investments in wholly-owned entities to the extent that they will probably not reverse in the
foreseeable future.
Deferred tax is based on the expected manner of realisation or settlement of the carrying amount of assets and liabilities, using the appropriate tax rates at the end of the reporting period.
A deferred tax asset is recognised only to the extent that it is probable that future taxable profits will be available against which the asset can be utilised and are reduced to the extent that it is no longer probable that the related tax benefit will be realised.
Tax consolidationAPT and its wholly-owned Australian resident entities formed a tax-consolidated group with effect from 1 July 2003 and are therefore taxed as a single entity from that date. The head entity within the tax-consolidated group is APT. The members of the tax-consolidated group are identified at Note 27.
Tax expense/income, deferred tax liabilities and deferred tax assets arising from temporary differences of the members of the tax-consolidated group are recognised in the separate financial reports of the members of the tax-consolidated group using the ‘separate taxpayer within group’ approach, by reference to the carrying amounts in the separate financial reports of each entity and the tax values applying under tax consolidation.
Any current tax liabilities (or assets) and deferred tax assets arising from unused tax losses of the wholly-owned entities are assumed by the head entity in the tax-consolidated group and are recognised as amounts payable (receivable) to (from) other entities in the tax-consolidated group in conjunction with any tax funding arrangement amounts.
The head entity recognises deferred tax assets arising from unused tax losses of the tax-consolidated group to the extent that it is probable that future taxable profits of the tax-consolidated group will be available against which the assets can be utilised.
Nature of tax funding arrangement and tax sharing agreementEntities within the tax-consolidated group have entered into a tax funding arrangement and a tax sharing agreement with the head entity. Under the terms of the tax funding arrangement, each of the entities in the tax-consolidated group have agreed to pay a tax equivalent payment to or from the head entity based on the current tax liability or current tax asset of the entity. Such amounts are reflected in amounts receivable from or payable to other entities in the tax-consolidated group.
The tax sharing agreement entered into between members of the tax-consolidated group provides for the determination of the allocation of income tax liabilities between the entities should the head entity default on its tax payment obligations or if an entity should leave the tax-consolidated group. The effect of the tax sharing agreement is that each member’s liability for the tax payable by the tax-consolidated group is limited to the amount payable to the head entity under the tax funding arrangement.
62 APA Group Annual Report 2016
For
per
sona
l use
onl
y

notes to the consolidated financial statements. continued.AUSTRALIAN PIPELINE TRUST AND ITS CONTROLLED ENTITIES FOR THE FINANCIAL YEAR ENDED 30 JUNE 2016
FINANCIAL PERFORMANCE
8. Earnings per security 2016 2015 cents cents
Basic and diluted earnings per security 16.1 56.3
The earnings and weighted average number of ordinary securities used in the calculation of basic and diluted earnings per security are as follows:
2016 2015 $000 $000
Net profit attributable to securityholders for calculating basic and diluted earnings per security 179,622 559,929
2016 2015 No. of No. of securities securities 000 000
Adjusted weighted average number of ordinary securities used in the calculation of basic and diluted earnings per security 1,114,307 995,245
9. Distributions 2016 2016 2015 2015 cents per Total cents per Total security $000 security $000
Recognised amountsFinal distribution paid on 16 September 2015(2015: 10 September 2014)Profit distribution – APT a 18.12 201,945 16.42 137,239Profit distribution – APTIT a (Note 24) 2.38 26,488 2.33 19,465
20.50 228,433 18.75 156,704
Interim distribution paid on 16 March 2016(2015: 18 March 2015) b
Profit distribution – APT a 15.12 168,429 15.12 126,396Profit distribution – APTIT a (Note 24) 3.88 43,290 2.38 19,860
19.00 211,719 17.50 146,256
Total distributions recognisedProfit distributions a a 39.50 440,152 36.25 302,960
Unrecognised amountsFinal distribution payable on 16 September 2016 c
(2015: 16 September 2015)Profit distribution – APT a 16.34 182,063 18.12 201,945Capital distribution – APT 1.78 19,869 – –Profit distribution – APTIT a 3.75 41,811 2.38 26,488Capital distribution – APTIT 0.63 6,976 – –
22.50 250,719 20.50 228,433
a) Profit distributions were unfranked (2015: unfranked).b) New securities issued under the entitlement offer were not eligible for the FY2015 interim distribution.c) Record date 30 June 2016.
The final distribution in respect of the financial year has not been recognised in this financial report because the final distribution was not declared, determined or publicly confirmed prior to the end of the financial year.
2016 2015 $000 $000
Adjusted franking account balance (tax paid basis) 8,210 6,811
63APA Group Annual Report 2016
For
per
sona
l use
onl
y

notes to the consolidated financial statements. continued.AUSTRALIAN PIPELINE TRUST AND ITS CONTROLLED ENTITIES FOR THE FINANCIAL YEAR ENDED 30 JUNE 2016
OPERATING ASSETS AND LIABILITIES
10. Receivables 2016 2015 $000 $000
Trade receivables 250,875 223,806Allowance for doubtful debts (2,658) (4,411)
Trade receivables 248,217 219,395Receivables from associates and related parties 12,447 15,630Finance lease receivables (Note 18) 2,290 4,005Interest receivable 91 688Other debtors 187 15,222
Current 263,232 254,940
Finance lease receivables (Note 18) 17,283 18,968Loan receivable – related party – 73,502
Non-current 17,283 92,470
Trade receivables are non-interest bearing and are generally on 30 day terms.There are no material trade receivables past due and not provided for.
Trade receivables, loans, and other receivables that have fixed or determinable payments that are not quoted in an active market are classified as loans and receivables. Trade and other receivables are initially recognised at fair value plus any directly attributable transaction costs. Subsequent to initial recognition, they are stated at amortised cost less impairment.
11. PayablesTrade payables a 27,310 29,615Income tax payable 13,848 7,216Other payables b 211,503 368,715Payables to associates – 139
Current 252,661 405,685
Other payables 3,007 3,261
Non-current 3,007 3,261
a) Trade payables are non-interest bearing and are normally settled on 15 – 30 day terms.b) Other payables at 30 June 2015 include $137.2m of stamp duty on the acquisition of the Wallumbilla Gladstone Pipeline (formerly QCLNG Pipeline), other
expenditure accruals and external interest payable accruals.
Trade and other payables are recognised when APA Group becomes obliged to make future payments resulting from the purchase of goods and services. Trade and other payables are initially recognised at fair value plus any directly attributable transaction costs. Subsequent to initial recognition, they are stated at amortised cost.
Payables are recognised inclusive of GST, except for accrued revenue and accrued expense at balance dates which exclude GST.
The net amount of GST recoverable from, or payable to, the taxation authority is included as part of receivables or payables. GST receivable or GST payable is only recognised once a tax invoice has been issued or received.
64 APA Group Annual Report 2016
For
per
sona
l use
onl
y

notes to the consolidated financial statements. continued.AUSTRALIAN PIPELINE TRUST AND ITS CONTROLLED ENTITIES FOR THE FINANCIAL YEAR ENDED 30 JUNE 2016
OPERATING ASSETS AND LIABILITIES
12. Property, plant and equipment Freehold land Leasehold Plant and Work in and buildings improvements equipment progress – at cost – at cost – at cost – at cost Total $000 $000 $000 $000 $000
Gross carrying amountBalance at 1 July 2014 139,434 5,015 5,766,626 478,861 6,389,936Additions 78,679 – 2,501,924 386,406 2,967,009Disposals (165) (571) (17,367) (52) (18,155)Transfers 11,103 – 686,038 (697,141) –
Balance at 30 June 2015 229,051 4,444 8,937,221 168,074 9,338,790Additions – – 21,735 283,242 304,977Acquisitions through businesscombinations (Note 26) 3,234 – 852,485 11,457 867,176Disposals (651) (285) (15,323) – (16,259)Transfers 3,204 913 263,524 (267,641) –
Balance at 30 June 2016 234,838 5,072 10,059,642 195,132 10,494,684
Accumulated depreciationBalance at 1 July 2014 (21,854) (2,288) (791,313) – (815,455)Disposals 75 571 13,296 – 13,942Depreciation expense (3,257) (486) (178,341) – (182,084)
Balance at 30 June 2015 (25,036) (2,203) (956,358) – (983,597)Disposals 434 285 14,707 – 15,426Depreciation expense (7,324) (357) (329,745) – (337,426)Transfers (89) (4) 93 – –
Balance at 30 June 2016 (32,015) (2,279) (1,271,303) – (1,305,597)
Net book valueAs at 30 June 2015 204,015 2,241 7,980,863 168,074 8,355,193
As at 30 June 2016 202,823 2,793 8,788,339 195,132 9,189,087
Property, plant and equipment is stated at cost, less accumulated depreciation and impairment losses. Work in progress is stated at cost. Cost includes expenditure that is directly attributable to the acquisition or construction of the item.
Depreciation is provided on property, plant and equipment excluding land. Depreciation is calculated on either a straight-line or throughput basis depending on the nature of the asset so as to write off the net cost of each asset over its estimated useful life.
Leasehold improvements are depreciated over the period of the lease or estimated useful life, whichever is the shorter, using the straight-line method. The estimated useful lives and depreciation methods are reviewed at the end of each reporting period, with the effect of any changes recognised on a prospective basis.
Borrowing costs directly attributable to the acquisition, construction or production of qualifying assets (i.e. assets that take a substantial period of time to get ready for their intended use or sale) are added to the cost of those assets until such time as the assets are substantially ready for their intended use or sale.
All other borrowing costs are recognised in profit or loss in the period in which they are incurred.
Critical accounting judgements and key sources of estimation uncertainty – useful lives of non-current assetsAPA Group reviews the estimated useful lives of property, plant and equipment at the end of each annual reporting period. Any reassessment of useful lives in a particular year will affect the depreciation expense.
The following estimated useful lives are used in the calculation of depreciation: – buildings 30 – 50 years; – compressors 10 – 50 years; – gas transportation systems 10 – 80 years; – meters 20 – 30 years; and – other plant and equipment 3 – 20 years.
65APA Group Annual Report 2016
For
per
sona
l use
onl
y

notes to the consolidated financial statements. continued.AUSTRALIAN PIPELINE TRUST AND ITS CONTROLLED ENTITIES FOR THE FINANCIAL YEAR ENDED 30 JUNE 2016
OPERATING ASSETS AND LIABILITIES
13. Goodwill and intangibles 2016 2015 $000 $000
GoodwillBalance at beginning of financial year 1,140,500 1,150,500Acquisitions (Note 26) 44,088 –Goodwill impairment – (10,000)
Balance at end of financial year 1,184,588 1,140,500
Allocation of goodwill to cash-generating unitsGoodwill has been allocated for impairment testing purposes to individual cash-generating units.
The East Coast Grid is an interconnected pipeline network that includes, inter alia, the Wallumbilla Gladstone, Moomba Sydney, Roma Brisbane, Carpentaria Gas and South West Queensland pipelines and the Victorian Transmission System. Since the acquisition of the South West Queensland Pipeline to complete the formation of APA’s East Coast Grid in December 2012, APA has installed facilities to enable bi-directional transportation of gas to meet the demand of our major customers who now typically operate portfolios of gas supply and demand. Through the provision of multi-asset services, bi-directional transportation, capacity trading and gas storage and parking facilities, APA’s East Coast Grid delivers options for customers to choose from, and move gas between, more than 40 receipt points and over 100 delivery points on the east coast of Australia. During the year, to reflect this change in business, APA Group reassessed its cash-generating units and determined that the East Coast Grid is henceforth an individual cash-generating unit.
The carrying amount of goodwill allocated to cash-generating units that are significant individually or in aggregate is as follows:
Asset Management business 21,456 21,456Energy Infrastructure East Cost Grid 1,060,681 1,060,681 Diamantina Power Station 44,088 – Other energy infrastructure a 58,363 58,363
1,184,588 1,140,500
a) Primarily represents goodwill relating to the Pilbara Pipeline System ($32.6m) and the Goldfields Gas Pipeline ($18.5m).
Goodwill acquired in a business combination is initially measured at cost and subsequently at cost less accumulated impairment.
Contract and other intangiblesGross carrying amountBalance at beginning of financial year 3,623,011 209,286Acquisitions / additions 705 3,414,122Disposals / write-offs (19,573) (397)
Balance at end of financial year 3,604,143 3,623,011
Accumulated amortisation and impairmentBalance at beginning of financial year (66,765) (38,482)Amortisation expense (183,464) (26,116)Impairment (8,897) (2,564)Write-offs 10,690 397
Balance at end of financial year (248,436) (66,765)
3,355,707 3,556,246
APA Group holds various third party operating and maintenance contracts. The combined gross carrying amount of $3,604.1 million amortises over terms ranging from one to 20 years. Useful life is determined based on the underlying contractual terms plus estimations of renewal of up to two terms where considered probable by management. Amortisation expense is not a cash item, and is included in the line item of depreciation and amortisation expense in the statement of profit or loss and other comprehensive income.
Intangible assets acquired separately are carried at cost less accumulated amortisation and accumulated impairment losses. Intangible assets acquired in a business combination are identified and recognised separately from goodwill and are initially recognised at their fair value at the acquisition date and subsequently at cost less accumulated amortisation and accumulated impairment losses.
Amortisation is recognised on a straight-line basis over their estimated useful lives. The estimated useful life and amortisation method are reviewed at the end of each annual reporting period, with the effects of any changes in estimate being accounted for on a prospective basis.
66 APA Group Annual Report 2016
For
per
sona
l use
onl
y

notes to the consolidated financial statements. continued.AUSTRALIAN PIPELINE TRUST AND ITS CONTROLLED ENTITIES FOR THE FINANCIAL YEAR ENDED 30 JUNE 2016
OPERATING ASSETS AND LIABILITIES
14. Impairment of non-financial assetsAPA Group tests property, plant and equipment, intangibles and goodwill for impairment at least annually or whenever there is an indication that the asset may be impaired. Assets other than goodwill that have previously reported an impairment are reviewed for possible reversal of the impairment at each reporting period.
If the asset does not generate independent cash inflows and its value in use cannot be estimated to be close to its fair value, the asset is tested for impairment as part of the cash-generating unit (CGU) to which it belongs.
Assets are impaired if their carrying value exceeds their recoverable amount. The recoverable amount of an asset or CGU is determined as the higher of its fair value less costs of disposal or value-in-use.
Determining whether identifiable intangible assets and goodwill are impaired requires an estimation of the value-in-use or fair value of the cash-generating units. The calculations require APA Group to estimate the future cash flows expected to arise from cash-generating units and suitable discount rates in order to calculate the present value of cash-generating units. These estimates and assumptions are reviewed on an ongoing basis.
The recoverable amounts of cash-generating units are determined based on value-in-use calculations. These calculations use cash flow projections based on a five year financial business plan and thereafter a further 15 year financial model. This is the basis of APA Group’s forecasting and planning processes which represents the underlying long term nature of associated customer contracts on these assets.
In accordance with the requirements of AASB 136 Impairment of Assets, APA Group reviewed its CGUs for indicators of impairment at the end of the reporting period. No such indicators were identified and no impairment recognised.
Critical accounting judgements and key sources of estimation uncertainty – impairment of assetsFor fully regulated assets, cash flows have been extrapolated on the basis of existing transportation contracts and government policy settings, and expected contract renewals with a resulting average annual growth rate of 1.7% p.a. These expected cash flows are factored into the regulated asset base and do not exceed management’s expectations of the long-term average growth rate for the market in which the cash generating unit operates.
For non-regulated assets, APA has assumed no capacity expansion beyond installed and committed levels; utilisation of capacity is based on existing contracts, government policy settings and expected market outcomes.
As contracts mature, given ongoing demand for capacity, it is assumed that the majority of the capacity is resold at similar pricing levels.
Asset Management cash flow projections reflect long term agreements with assumptions of renewal on similar terms and conditions based on management’s expectations.
Cash flow projections are estimated for a period of up to 20 years, with a terminal value, recognising the long term nature of the assets. The pre-tax discount rates used are 8.25% p.a. (2015: 8.25% p.a.) for Energy Infrastructure assets and 8.25% p.a. (2015: 8.25% p.a.) for Asset Management.
These assumptions have been determined with reference to historic information, current performance and expected changes taking into account external information.
15. Provisions 2016 2015 $000 $000
Employee benefits 83,240 76,953Other 9,793 8,499
Current 93,033 85,452
Employee benefits 36,903 30,484Other 34,014 29,926
Non-current 70,917 60,410
Employee benefitsIncentives 28,401 25,556Cash settled security-based payments 9,477 10,009Leave balances 39,587 39,608Termination benefits 5,775 1,780
Current 83,240 76,953
Cash settled security-based payments 19,467 17,215Defined benefit liability (Note 17) 7,017 4,425Leave balances 10,419 8,844
Non-current 36,903 30,484
67APA Group Annual Report 2016
For
per
sona
l use
onl
y

notes to the consolidated financial statements. continued.AUSTRALIAN PIPELINE TRUST AND ITS CONTROLLED ENTITIES FOR THE FINANCIAL YEAR ENDED 30 JUNE 2016
OPERATING ASSETS AND LIABILITIES
15. Provisions (continued)A provision is recognised when there is a legal or constructive obligation as a result of a past event, it is probable that future economic benefits will be required to settle the obligation and the amount of the provision can be measured reliably.
The amount recognised as a provision is the best estimate of the consideration required to settle the present obligation at the end of the financial year, taking into account the risks and uncertainties surrounding the obligation. Where a provision is measured using the cash flows estimated to settle the present obligation, its carrying amount is the present value of those cash flows.
When some or all of the economic benefits required to settle a provision are expected to be recovered from a third party, the receivable is recognised as an asset if it is probable that recovery will be received and the amount of the receivable can be measured reliably.
Provision is made for benefits accruing to employees in respect of wages and salaries, incentives, annual leave and long service leave when it is probable that settlement will be required. Provisions made in respect of employee benefits expected to be settled within 12 months, are recognised for employee services up to reporting date at the amounts expected to be paid when the liability is settled. Provisions made in respect of employee benefits which are not expected to be wholly settled within 12 months are measured as the present value of the estimated future cash outflows using a discount rate based on the corporate bond yields in respect of services provided by employees up to reporting date.
16. Other non-current assets 2016 2015 $000 $000
Line pack gas 20,208 20,200Gas held in storage 6,010 5,085Defined benefit asset (Note 17) 2,404 7,784Other assets 192 192
28,814 33,261
17. Employee superannuation plansAll employees of APA Group are entitled to benefits on retirement, disability or death from an industry sponsored fund, or an alternative fund of their choice. APA Group has three plans with defined benefit sections (due to the acquisition of businesses) and a number of other plans with defined contribution sections. The defined benefit sections provide lump sum benefits upon retirement based on years of service. The defined contribution sections receive fixed contributions from APA Group and APA Group’s legal and constructive obligations are limited to these amounts.
The most recent actuarial valuations of plan assets and the present value of the defined benefit obligations were determined at 30 June 2016. The present value of the defined benefit obligations, and the related current service cost and past service cost, were measured using the projected unit credit method.
The following sets out details in respect of the defined benefit plans only:
Amounts recognised in the statement of profit or loss and other comprehensive incomeCurrent service cost 2,783 3,730Net interest expense (42) 416
Components of defined benefit costs recognised in profit or loss (Note 6) 2,741 4,146
Amounts recognised in the statement of financial positionFair value of plan assets 138,488 140,500Present value of benefit obligation (143,101) (137,141)
Defined benefit asset – non-current (Note 16) 2,404 7,784Defined benefit liability – non-current (Note 15) (7,017) (4,425)
Opening defined benefit obligation 137,141 144,621Current service cost 2,783 3,730Interest cost 5,807 4,909Contributions from plan participants 1,332 1,388Actuarial gains and losses arising from changes in financial assumptions 625 (9,747)Actuarial gains and losses arising from experience adjustments 3,268 (1,181)Benefits paid (7,855) (6,579)
Closing defined benefit obligation 143,101 137,141
68 APA Group Annual Report 2016
For
per
sona
l use
onl
y

notes to the consolidated financial statements. continued.AUSTRALIAN PIPELINE TRUST AND ITS CONTROLLED ENTITIES FOR THE FINANCIAL YEAR ENDED 30 JUNE 2016
OPERATING ASSETS AND LIABILITIES
17. Employee superannuation plans (continued)Movements in the present value of the plan assets in the current period were as follows: 2016 2015 $000 $000
Opening fair value of plan assets 140,500 130,195Interest income 5,849 4,493Actual return on plan assets excluding interest income (4,255) 7,426Contributions from employer 2,917 3,577Contributions from plan participants 1,332 1,388Benefits paid (7,855) (6,579)Taxes and premiums paid – –
Closing fair value of plan assets 138,488 140,500
Defined contribution plansContributions to defined contribution plans are expensed when incurred.
Defined benefit plansActuarial gains and losses and the return on plan assets (excluding interest) are recognised immediately in the statement of financial position with a charge or credit recognised in other comprehensive income in the period in which they occur. Remeasurement, comprising of actuarial gains and losses and the return on plan assets (excluding interest), is recognised in other comprehensive income and immediately reflected in retained earnings and will not be reclassified to profit or loss.
Past service cost is recognised in profit or loss in the period of a plan amendment.
The defined benefit obligation recognised in the consolidated statement of financial position represents the actual deficit or surplus in APA Group’s defined benefit plans. Any asset resulting from this calculation is limited to the present value of economic benefits available in the form of refunds and reductions in future contributions to the plan.
Key actuarial assumptions used in the determination of the defined obligation is a discount rate of 3.3%, based on the corporate bond yield curve published by Milliman, and an expected salary increase rate of 3.0%. The sensitivity analysis below has been determined based on reasonable possible changes of the respective assumptions occurring at the end of the reporting period, while holding all other assumptions constant:
– If the discount rate is 50 basis points higher (lower), the defined benefit obligation would decrease by $5,680,000 (increase by $6,373,000); and
– If the expected salary growth increases (decreases) by 0.5%, the defined benefit obligation would increase by $6,136,000 (decrease by $5,525,000).
The sensitivity analysis presented above may not be representative of the actual change in the defined benefit obligation as it is unlikely that the change in assumptions would occur in isolation of one another as some of the assumptions may be correlated.
Furthermore, in presenting the above sensitivity analysis, the present value of the defined benefit obligation has been calculated using the projected unit credit method at the end of the reporting period, which is the same as that applied in calculating the defined benefit obligation liability recognised in the statement of financial position.
APA Group expects $3.0 million in contributions to be paid to the defined benefit plans during the year ending 30 June 2017.
69APA Group Annual Report 2016
For
per
sona
l use
onl
y

notes to the consolidated financial statements. continued.AUSTRALIAN PIPELINE TRUST AND ITS CONTROLLED ENTITIES FOR THE FINANCIAL YEAR ENDED 30 JUNE 2016
OPERATING ASSETS AND LIABILITIES
18. LeasesLeases are classified as finance leases when the terms of the lease transfer substantially all the risks and rewards incidental to the ownership of the leased asset to the lessee. All other leases are classified as operating leases.
Finance lease receivables relate to the lease of a metering station, natural gas vehicle refuelling facilities and two pipeline laterals.
2016 2015 $000 $000
Finance lease receivablesNot longer than 1 year 3,933 5,317Longer than 1 year and not longer than 5 years 10,646 12,347Longer than 5 years 16,951 19,183
Minimum future lease payments receivable a, b 31,530 36,847
Gross finance lease receivables 31,530 36,847Less: unearned finance lease receivables (11,957) (13,874)
Present value of lease receivables 19,573 22,973
Included in the financial statements as part of:Current trade and other receivables (Note 10) 2,290 4,005Non-current receivables (Note 10) 17,283 18,968
19,573 22,973
a) Minimum future lease payments receivable include the aggregate of all lease payments receivable and any guaranteed residual.b) X41 power station expansion was disposed of during the 2015 financial year.
APA Group as a lessorAmounts due from a lessee under finance leases are recorded as receivables. Finance lease receivables are initially recognised at amounts equal to the present value of the minimum lease payments receivable plus the present value of any unguaranteed residual value expected to accrue at the end of the lease term. Finance lease income is allocated to accounting periods so as to reflect a constant periodic rate of return on the net investment outstanding in respect of the leases.
APA Group as a lesseeAssets held under finance leases are initially recognised at their fair value or, if lower, at amounts equal to the present value of the minimum lease payments, each determined at the inception of the lease. The corresponding liability to the lessor is included in the consolidated statement of financial position as a finance lease obligation. Lease payments are allocated between finance charges and reduction of the lease obligation so as to achieve a constant rate of interest on the remaining balance of the liability.
Finance lease assets are amortised on a straight-line basis over the estimated useful life of the asset.
Non-cancellable operating leasesOperating lease obligations are primarily related to commercial office leases and motor vehicles.
Not longer than 1 year 12,138 11,270Longer than 1 year and not longer than 5 years 35,282 29,418Longer than 5 years 25,189 21,115
72,609 61,803
Operating lease payments are recognised as an expense on a straight-line basis over the lease term, except where another systematic basis is more representative of the time patterns in which economic benefits from the leased asset are consumed. Operating lease incentives are recognised as a liability when received and released to the statement of profit or loss on a straight line basis over the lease term.
70 APA Group Annual Report 2016
For
per
sona
l use
onl
y

notes to the consolidated financial statements. continued.AUSTRALIAN PIPELINE TRUST AND ITS CONTROLLED ENTITIES FOR THE FINANCIAL YEAR ENDED 30 JUNE 2016
CAPITAL MANAGEMENT
APA Group’s objectives when managing capital are to safeguard its ability to continue as a going concern while maximising the return to securityholders through the optimisation of the debt to equity structure.
APA Group’s overall capital management strategy is to continue to target strong BBB/Baa2 investment grade ratings through maintaining sufficient flexibility to fund organic growth and investment from internally generated and retained cash flows, equity and, where appropriate, additional debt funding.
The capital structure of APA Group consists of cash and cash equivalents, borrowings and equity attributable to securityholders of APA. APA Group’s policy is to maintain balanced and diverse funding sources through borrowing locally and from overseas, using a variety of capital markets and bank loan facilities, to meet anticipated funding requirements.
Operating cash flows are used to maintain and expand APA Group’s assets, make distributions to securityholders and to repay maturing debt.
Controlled entities are subject to externally imposed capital requirements. These relate to the Australian Financial Services Licence held by Australian Pipeline Limited, the Responsible Entity of the APA Group and were adhered to for the entirety of the 2016 and 2015 periods.
APA Group’s capital risk management strategy remains unchanged from the previous period.
APA Group’s Board of Directors reviews the capital structure on a regular basis. As part of the review, the Board considers the cost of capital and the state of the markets. APA Group targets gearing in a range of 65% to 68%. Gearing is determined as the proportion of net debt to net debt plus equity. Based on recommendations of the Board, APA Group balances its overall capital structure through equity issuances, new debt or the redemption of existing debt and through a disciplined distribution payment policy.
19. Cash balancesCash and cash equivalents comprise of cash on hand, at call bank deposits and investments in money market instruments that are readily convertible to known amounts for cash. Cash and cash equivalents at the end of the financial year as shown in the statement of cash flows is reconciled to the related items in the statement of financial position as follows:
2016 2015 $000 $000
Cash and cash equivalentsCash at bank and on hand 83,389 190,834Short-term deposits 1,117 221,087
84,506 411,921
Non-current cash on depositCash on deposit a 2,149 –
a) As at 30 June 2016 Gorodok Pty Limited held $2.1 million cash on deposit to support bank guarantees in relation to various contractual arangements. APA Group had no restricted cash as at 30 June 2015.
71APA Group Annual Report 2016
For
per
sona
l use
onl
y

notes to the consolidated financial statements. continued.AUSTRALIAN PIPELINE TRUST AND ITS CONTROLLED ENTITIES FOR THE FINANCIAL YEAR ENDED 30 JUNE 2016
CAPITAL MANAGEMENT
20. BorrowingsBorrowings are recorded initially at fair value less attributable transaction costs and subsequently stated at amortised cost. Any difference between the initial recognised cost and the redemption value is recognised in the statement of profit or loss and other comprehensive income over the period of the borrowing using the effective interest method.
2016 2015 $000 $000
Unsecured – at amortised costGuaranteed senior notes a 398,058 158,134Other financial liabilities 11,771 6,219
Current 409,829 164,353
Guaranteed senior notes a 8,043,377 8,481,768Bank borrowings b 707,501 125,000Subordinated notes c 515,000 515,000Other financial liabilities 95,155 70,630
Less: unamortised borrowing costs (46,660) (50,901)
Non-current 9,314,373 9,141,497
9,724,202 9,305,850
Financing facilities availableTotal facilitiesGuaranteed senior notes a 8,441,435 8,639,902Bank borrowings b 1,380,000 1,300,000Subordinated notes c 515,000 515,000
10,336,435 10,454,902
Facilities used at balance dateGuaranteed senior notes a 8,441,435 8,639,902Bank borrowings b 707,501 125,000Subordinated notes c 515,000 515,000
9,663,936 9,279,902
Facilities unused at balance dateGuaranteed senior notes a – –Bank borrowings b 672,499 1,175,000Subordinated notes c – –
672,499 1,175,000
a) Represents USD denominated private placement notes of US$725 million, CAD MTN of C$300 million, JPY MTN of ¥10,000 million, GBP MTN of £950 million, EUR MTN of €1,350 million and USD denominated 144A notes of US$2,150 million measured at the exchange rate at reporting date, and A$315 million of AUD denominated Private Placement Notes and AUD Medium Term Notes (MTN) of A$300 million. Refer to Note 21 for details of interest rates and maturity profiles.
b) Relates to the non-current portion of long-term borrowings. Refer to Note 21 for details of interest rates and maturity profiles.c) Represents AUD denominated subordinated notes. Refer to Note 21 for details of interest rates and maturity profiles.
21. Financial risk managementThe Treasury department within Finance is responsible for the overall management of APA Group’s capital raising activities, liquidity, lender relationships and engagement, debt portfolio management, interest rate and foreign exchange hedging, credit rating maintenance and third party indemnities (bank guarantees) within risk management parameters reviewed by the Board. The Audit and Risk Management Committee approves written principles for overall risk management, as well as policies covering specific areas such as such as liquidity and funding risk, foreign currency risk, interest rate risk, credit risk, contract and legal risk and operational risk. APA Group’s Board of Directors ensures there is an appropriate Risk Management Policy for the management of treasury risk and compliance with the policy through monthly reporting from the Treasury department.
APA Group’s activities generate financial instruments comprising of cash, receivables, payables and interest bearing liabilities which expose it to various risks as summarised below:a) Market risk including currency risk, interest rate risk and price risk;b) Credit risk; andc) Liquidity risk.
72 APA Group Annual Report 2016
For
per
sona
l use
onl
y

notes to the consolidated financial statements. continued.AUSTRALIAN PIPELINE TRUST AND ITS CONTROLLED ENTITIES FOR THE FINANCIAL YEAR ENDED 30 JUNE 2016
CAPITAL MANAGEMENT
21. Financial risk management (continued)Treasury as a centralised function provides APA Group with the benefits of efficient cash utilisation, control of funding and its associated costs, efficient and effective management of aggregated financial risk and concentration of financial expertise, at an acceptable cost and manages risks through the use of natural hedges and derivative instruments. APA Group does not engage in speculative trading. All derivatives have been traded to hedge underlying or existing exposures and have adhered to the Board approved Treasury Risk Management Policy.
a) Market riskAPA Group’s market risk exposure is primarily due to changes in market prices such as interest and foreign exchange rates. APA Group enters into a variety of derivative financial instruments to manage its exposure to interest rate and foreign currency risk, including:
– forward exchange contracts to hedge the exchange rate risk arising from foreign currency cash flows, mainly US dollars, derived from revenues, interest payments and capital equipment purchases;
– cross currency interest rate swaps to manage the currency risk associated with foreign currency denominated borrowings; – foreign currency denominated borrowings to manage the currency risk associated with foreign currency denominated revenue and receivables; and
– interest rate swaps to mitigate the risk of rising interest rates.
APA Group is also exposed to price risk arising from its forward purchase contracts over listed equities.
Foreign currency riskAPA Group’s foreign exchange risk arises from future commercial transactions (including revenue, interest payments and principal debt repayments on long-term borrowings and the purchases of capital equipment), and the recognition of assets and liabilities (including foreign receivables and borrowings). Exchange rate exposures are managed within approved policy parameters utilising forward exchange contracts, cross currency swap contracts and foreign currency denominated borrowings. All foreign currency exposure was managed in accordance with the Treasury Risk Management Policy in both 2016 and 2015.
The carrying amount of APA Group’s foreign currency denominated monetary assets, monetary liabilities and derivative notional amounts at the reporting date is as follows:
Cross Foreign Net foreign Cash & cash Total currency exchange currency equivalents Receivables borrowings swaps contract position 2016 $000 $000 $000 $000 $000 $000
US Dollar a 1,068 30,691 (3,694,558) (1,277,253) 703,317 (4,236,735)Japanese yen – – (129,964) 129,964 – –Canadian dollar – – (310,555) 310,555 – –British pound – – (1,688,747) 1,688,747 – –Euro – – (2,008,378) 2,008,378 (1,392) (1,392)Swedish Krona – – – – (29,606) (29,606)
1,068 30,691 (7,832,202) 2,860,391 672,319 (4,267,733)
2015US Dollar a 1,723 38,639 (3,726,507) (1,075,496) 2,216 (4,759,425)Japanese yen – – (106,005) 106,005 – –Canadian dollar – – (311,394) 311,394 – –British pound – – (1,937,372) 1,937,372 – –Euro – – (1,950,107) 1,950,107 – –
1,723 38,639 (8,031,385) 3,229,382 2,216 (4,759,425)
a) Net US$ foreign currency position of $4,236.1 million is predominantly hedging part of the committed US$ revenue arising from the Wallumbilla Gladstone Pipeline (2015: $4,759.4 million).
Forward foreign exchange contractsTo manage foreign exchange risk arising from future commercial transactions such as forecast capital purchases, revenue and interest payments, APA Group uses forward foreign exchange contracts. Gains and losses recognised in the cash flow hedge reserve (statement of comprehensive income) on these derivatives will be released to profit or loss when the underlying anticipated transaction affects the statement of profit or loss or will be included in the carrying value of the asset or liability acquired.
It is the policy of APA Group to hedge 100% of all foreign exchange capital purchases in excess of US$1 million that are certain. Forecast foreign currency denominated revenues and interest payments will be hedged by forward exchange contracts on a rolling basis for a minimum of one year with the objective being to lock in the AUD gross cash flows and manage liquidity.
73APA Group Annual Report 2016
For
per
sona
l use
onl
y

notes to the consolidated financial statements. continued.AUSTRALIAN PIPELINE TRUST AND ITS CONTROLLED ENTITIES FOR THE FINANCIAL YEAR ENDED 30 JUNE 2016
CAPITAL MANAGEMENT
21. Financial risk management (continued)a) Market risk (continued)Forward foreign exchange contracts (continued)The following table details the forward foreign exchange currency contracts outstanding at reporting date:
Contract value
Average Foreign Cash flow hedges exchange rate currency < 1 year 1 – 2 years 2 – 5 years Fair value 2016 $ USD '000 $000 $000 $000 $000
Pay USD / receive AUDForecast revenue and associated receivable 0.7200 (507,689) 292,569 265,907 146,605 12,849
Pay AUD / receive USDForecast capital purchases 0.7666 1,353 (995) (313) (457) 71
(506,336) 291,574 265,594 146,148 12,920
Contract value
Average Foreign Cash flow hedges exchange rate currency < 1 year 1 – 2 years 2 – 5 years Fair value 2016 $ EUR '000 $000 $000 $000 $000
Pay AUD / receive EURForecast capital purchases 0.6703 933 (334) (910) (148) 48
933 (334) (910) (148) 48
Contract value
Average Foreign Cash flow hedges exchange rate currency < 1 year 1 – 2 years 2 – 5 years Fair value 2016 $ SEK '000 $000 $000 $000 $000
Pay AUD / receive SEKForecast capital purchases 6.0727 179,795 (16,309) (8,009) (5,289) (164)
179,795 (16,309) (8,009) (5,289) (164)
Contract value
Average Foreign Cash flow hedges exchange rate currency < 1 year 1 – 2 years 2 – 5 years Fair value 2015 $ USD '000 $000 $000 $000 $000
Pay USD / receive AUDForecast revenue and associated receivable 0.7574 (193,837) 255,913 – – 1,845
Pay AUD / receive USDForecast capital purchases 0.9011 1,969 (2,185) – – 371
(191,868) 253,728 – – 2,216
74 APA Group Annual Report 2016
For
per
sona
l use
onl
y
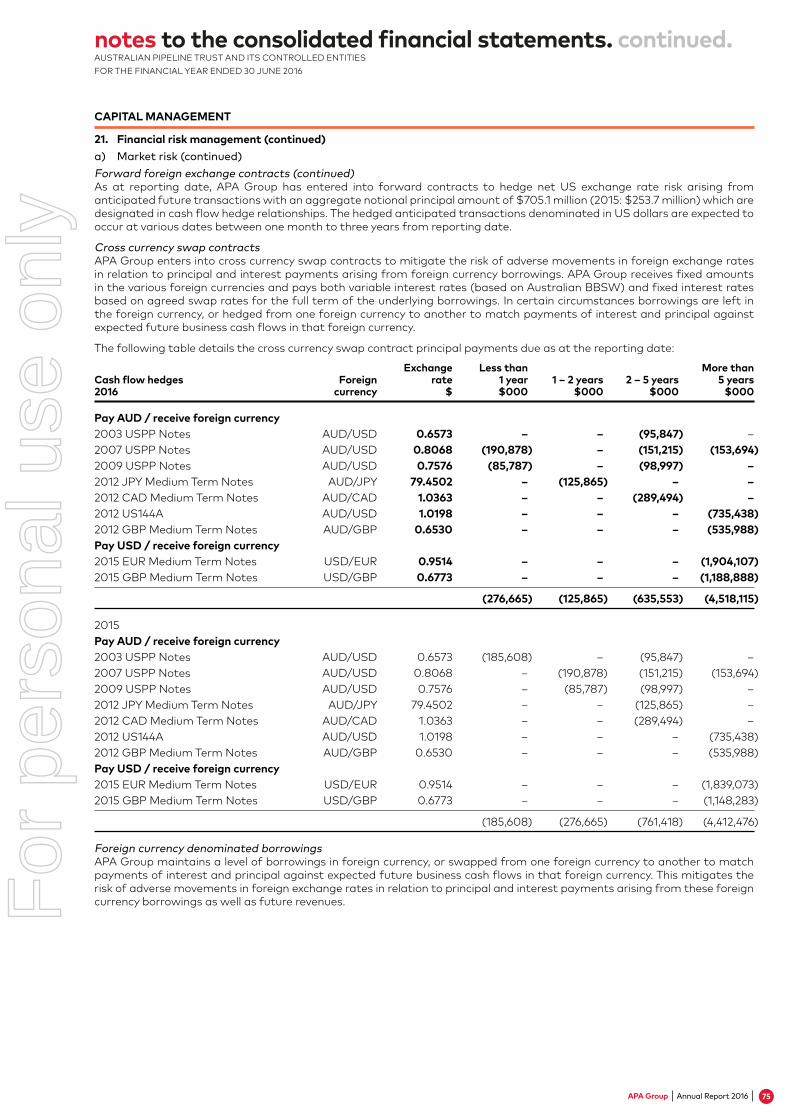
notes to the consolidated financial statements. continued.AUSTRALIAN PIPELINE TRUST AND ITS CONTROLLED ENTITIES FOR THE FINANCIAL YEAR ENDED 30 JUNE 2016
CAPITAL MANAGEMENT
21. Financial risk management (continued)a) Market risk (continued)Forward foreign exchange contracts (continued)As at reporting date, APA Group has entered into forward contracts to hedge net US exchange rate risk arising from anticipated future transactions with an aggregate notional principal amount of $705.1 million (2015: $253.7 million) which are designated in cash flow hedge relationships. The hedged anticipated transactions denominated in US dollars are expected to occur at various dates between one month to three years from reporting date.
Cross currency swap contractsAPA Group enters into cross currency swap contracts to mitigate the risk of adverse movements in foreign exchange rates in relation to principal and interest payments arising from foreign currency borrowings. APA Group receives fixed amounts in the various foreign currencies and pays both variable interest rates (based on Australian BBSW) and fixed interest rates based on agreed swap rates for the full term of the underlying borrowings. In certain circumstances borrowings are left in the foreign currency, or hedged from one foreign currency to another to match payments of interest and principal against expected future business cash flows in that foreign currency.
The following table details the cross currency swap contract principal payments due as at the reporting date:
Exchange Less than More than Cash flow hedges Foreign rate 1 year 1 – 2 years 2 – 5 years 5 years 2016 currency $ $000 $000 $000 $000
Pay AUD / receive foreign currency2003 USPP Notes AUD/USD 0.6573 – – (95,847) –2007 USPP Notes AUD/USD 0.8068 (190,878) – (151,215) (153,694)2009 USPP Notes AUD/USD 0.7576 (85,787) – (98,997) –2012 JPY Medium Term Notes AUD/JPY 79.4502 – (125,865) – –2012 CAD Medium Term Notes AUD/CAD 1.0363 – – (289,494) –2012 US144A AUD/USD 1.0198 – – – (735,438)2012 GBP Medium Term Notes AUD/GBP 0.6530 – – – (535,988)Pay USD / receive foreign currency2015 EUR Medium Term Notes USD/EUR 0.9514 – – – (1,904,107)2015 GBP Medium Term Notes USD/GBP 0.6773 – – – (1,188,888)
(276,665) (125,865) (635,553) (4,518,115)
2015Pay AUD / receive foreign currency2003 USPP Notes AUD/USD 0.6573 (185,608) – (95,847) –2007 USPP Notes AUD/USD 0.8068 – (190,878) (151,215) (153,694)2009 USPP Notes AUD/USD 0.7576 – (85,787) (98,997) –2012 JPY Medium Term Notes AUD/JPY 79.4502 – – (125,865) –2012 CAD Medium Term Notes AUD/CAD 1.0363 – – (289,494) –2012 US144A AUD/USD 1.0198 – – – (735,438)2012 GBP Medium Term Notes AUD/GBP 0.6530 – – – (535,988)Pay USD / receive foreign currency2015 EUR Medium Term Notes USD/EUR 0.9514 – – – (1,839,073)2015 GBP Medium Term Notes USD/GBP 0.6773 – – – (1,148,283)
(185,608) (276,665) (761,418) (4,412,476)
Foreign currency denominated borrowingsAPA Group maintains a level of borrowings in foreign currency, or swapped from one foreign currency to another to match payments of interest and principal against expected future business cash flows in that foreign currency. This mitigates the risk of adverse movements in foreign exchange rates in relation to principal and interest payments arising from these foreign currency borrowings as well as future revenues.
75APA Group Annual Report 2016
For
per
sona
l use
onl
y

notes to the consolidated financial statements. continued.AUSTRALIAN PIPELINE TRUST AND ITS CONTROLLED ENTITIES FOR THE FINANCIAL YEAR ENDED 30 JUNE 2016
CAPITAL MANAGEMENT
21. Financial risk management (continued)a) Market risk (continued)Foreign currency sensitivity analysisThe analysis below shows the effect on profit and total equity of retranslating cash, receivables, payables and interest-bearing liabilities denominated in USD, JPY, CAD, GBP and EUR into AUD, had the rates been 20 percent higher or lower than the relevant year end rate, with all other variables held constant, and taking into account all underlying exposures and related hedges. A sensitivity of 20 percent has been selected and represents management’s assessment of the possible change in rates taking into account the current level of exchange rates and the volatility observed both on a historical basis and on market expectations for future movements.
– There would be no impact on net profit as all foreign currency exposures are fully hedged (2015: nil); and – Equity reserves would decrease by $1,410.2 million with a 20 percent depreciation of the A$ or increase by $940.5 million with a 20 percent increase in foreign exchange rates (2015: decrease by $1,268.4 million or increase by $845.1 million respectively). The increase in sensitivity is due to the increase in the notional value of forward exchange contracts that are in a hedging relationship with highly probable forecast transactions.
Interest rate riskAPA Group’s interest rate risk is derived predominately from borrowings subject to fixed and floating interest rates. This risk is managed by APA Group by maintaining an appropriate mix between fixed and floating rate borrowings, through the use of interest rate swap contracts. Hedging activities are evaluated regularly to align with interest rate views and defined policy, ensuring appropriate hedging strategies are applied.
APA Group’s exposures to interest rate risk on financial liabilities are detailed in the liquidity risk management section of this note. Exposure to financial assets is limited to cash and cash equivalents amounting to $84.5 million as at 30 June 2016 (2015: $411.9 million).
Cross currency swap and interest rate swap contractsCross currency swap and interest rate swap contracts have the economic effect of converting borrowings from floating to fixed rates on agreed notional principal amounts enabling APA Group to mitigate the risk of cash flow exposures on variable rate debt held. The fair value of interest rate swaps at the reporting date is determined by discounting the future cash flows using the yield curves at reporting date. The average interest rate is based on the outstanding balances at the end of the financial year.
The following table details the notional principal amounts and remaining terms of the cross currency and interest rate swap contracts outstanding as at the end of the financial year: Weighted average interest rate Notional principal amount Fair value 2016 2015 2016 2015 2016 2015 % p.a. % p.a. $000 $000 $000 $000
Cash flow hedges – Pay fixed AUD interest – receive floating AUD or fixed foreign currencyLess than 1 year 8.58 7.10 276,665 185,608 17,700 (32,637)1 year to 2 years 6.80 8.58 125,865 276,665 (2,403) 7,5202 years to 5 years 7.76 7.60 635,553 761,418 10,284 (31,028)5 years and more a 5.08 5.10 4,518,115 4,412,476 116,089 352,208
5,556,198 5,636,167 141,670 296,063
a) This amount includes a notional of USD 3 billion which is subject to USD interest rate risk.
The cross currency swap and interest rate swaps settle on a quarterly or semi-annual basis. The floating rate benchmark on the interest rate swaps is Australian BBSW. APA Group will settle the difference between the fixed and floating interest rate on a net basis.
All cross currency swap and interest rate swap contracts exchanging floating rate interest amounts for fixed rate interest amounts are designated as cash flow hedges in order to reduce APA Group’s cash flow exposure on borrowings.
76 APA Group Annual Report 2016
For
per
sona
l use
onl
y

notes to the consolidated financial statements. continued.AUSTRALIAN PIPELINE TRUST AND ITS CONTROLLED ENTITIES FOR THE FINANCIAL YEAR ENDED 30 JUNE 2016
CAPITAL MANAGEMENT
21. Financial risk management (continued)a) Market risk (continued)Interest rate sensitivity analysisThe sensitivity analysis below has been determined based on the exposure to interest rates for both derivative and non-derivative instruments held. A 100 basis point increase or decrease is used and represents management’s assessment of the greatest possible change in interest rates. At reporting date, if interest rates had been 100 basis points higher or lower and all other variables were held constant, APA Group’s:
– net profit would decrease by $12,225,000 or increase by $12,225,000 (2015: decrease by $5,150,000 or increase by $5,150,000). This is mainly attributable to APA Group’s exposure to interest rates on its variable rate borrowings, including its Australian Dollar subordinated notes; and
– equity reserves would decrease by $143,644,000 with a 100 basis point decrease in interest rates or increase by $129,922,000 with a 100 basis point increase in interest rates (2015 : increase by $14,483,000 or increase by $38,594,000 respectively). This is due to the changes in the fair value of derivative interest instruments.
APA Group’s profit sensitivity to interest rates has increased during the current period due to the overall increase in the level of APA Group’s unhedged floating rate borrowings. The valuation of the increase/decrease in equity reserves is based on 1.00% p.a. increase/decrease in the yield curve at the reporting date. The increase in sensitivity in equity is due to the increase in the notional value of interest rate and cross currency swaps.
Price riskAPA Group is exposed to price risk arising from its forward purchase contracts over listed equities. The forward purchase contracts are held to meet hedging objectives rather than for trading purposes. APA Group does not actively trade these holdings.
Price risk sensitivityThe sensitivity analysis below has been determined based on the exposure to price risks at the reporting date. At the reporting date, if the prices of APA Group’s forward purchase contracts over listed equities had been 5 percent p.a. higher or lower:
– net profit would have been unaffected as there is no effect from the forwards as the corresponding exposure will offset in full (2015: $nil); and
– there is no effect on equity reserves as APA Group holds no available-for-sale investments (2015: $4,000).
APA Group’s analysis of its exposure to price risk has declined during the current period compared to the prior period. During the financial year, APA Group acquired Ethane Pipeline Income Fund. As a result, the previously held interest is no longer classified as an available-for-sale investment.
b) Credit riskCredit risk refers to the risk that a counterparty will default on its contractual obligations resulting in financial loss to APA Group. APA Group has adopted the policy of only dealing with creditworthy counterparties and obtaining sufficient collateral or bank guarantees where appropriate as a means of mitigating any risk of loss. For financial investments or market risk hedging, APA Group’s policy is to only transact with counterparties that have a credit rating of A- (Standard & Poor’s)/A3 (Moody’s) or higher unless specifically approved by the board. Where a counterparty’s rating falls below this threshold following a transaction, no other transactions can be executed with that counterparty until the exposure is sufficiently reduced or their credit rating is upgraded above APA Group’s minimum threshold. APA Group’s exposure to financial instrument and deposit credit risk is closely monitored against counterparty credit limits imposed by the Treasury Risk Management Policy approved by the Audit and Risk Management Committee. These limits are regularly reviewed by the Board.
Trade receivables consist of mainly corporate customers which are diverse and geographically spread. Most significant customers have an investment grade rating from either Standard & Poor’s or Moody’s. Ongoing credit monitoring of the financial position of customers is maintained.
The carrying amount of financial assets recorded in the financial statements, net of any allowances, represents APA Group’s maximum exposure to credit risk in relation to those assets.
Cross guaranteeIn accordance with a deed of cross guarantee, APT Pipelines Limited, a subsidiary of APA Group, has agreed to provide financial support, when and as required, to all wholly-owned controlled entities with either a deficit in shareholders’ funds or an excess of current liabilities over current assets. The fair value of the financial guarantee as at 30 June 2016 has been determined to be immaterial and no liability has been recorded (2015: $nil).
77APA Group Annual Report 2016
For
per
sona
l use
onl
y

notes to the consolidated financial statements. continued.AUSTRALIAN PIPELINE TRUST AND ITS CONTROLLED ENTITIES FOR THE FINANCIAL YEAR ENDED 30 JUNE 2016
CAPITAL MANAGEMENT
21. Financial risk management (continued)c) Liquidity riskAPA Group has a policy of dealing with liquidity risk which requires an appropriate liquidity risk management framework for the management of APA Group’s short, medium and long-term funding and liquidity management requirements. Liquidity risk is managed by maintaining adequate cash reserves and banking facilities, by monitoring and forecasting cash flow and where possible arranging liabilities with longer maturities to more closely match the underlying assets of APA Group.
Detailed in the table following are APA Group’s remaining contractual maturities for its non-derivative financial liabilities. The table is presented based on the undiscounted cash flows of financial liabilities taking account of the earliest date on which APA Group can be required to pay. The table includes both interest and principal cash flows.
The table below shows the undiscounted Australian dollar cash flows associated with the foreign currency notes, cross currency interest rate swaps and fixed interest rate swaps in aggregate.
Average Less than More than interest rate 1 year 1 – 5 years 5 years 2016 Maturity % p.a. $000 $000 $000
Unsecured financial liabilitiesTrade and other payables – 252,661 – –Unsecured bank borrowings a 2.82 19,610 762,228 –2012 Subordinated Notes 1-Oct-72 6.78 33,267 130,200 2,381,395
Denominated in A$Other financial liabilities b 7,841 31,367 42,806
Guaranteed Senior Notes c
Denominated in A$2007 Series A 15-May-17 7.33 5,367 – –2007 Series C 15-May-17 7.38 106,475 – –2007 Series E 15-May-19 7.40 5,045 78,259 –2007 Series G 15-May-22 7.45 6,002 24,008 86,5842007 Series H 15-May-22 7.45 4,617 18,468 66,6032010 AUD Medium Term Notes 22-Jul-20 7.75 23,250 381,375 –
Denominated in US$2003 Series D 9-Sep-18 6.02 6,930 106,290 –2007 Series B 15-May-17 5.89 204,864 – –2007 Series D 15-May-19 5.99 11,111 173,435 –2007 Series F 15-May-22 6.14 11,354 45,416 165,0792009 Series A 1-Jul-16 8.35 90,569 – –2009 Series B 1-Jul-19 8.86 11,761 128,286 –2012 US 144A 11-Oct-22 3.88 49,123 196,762 809,0562015 US 144A b 23-Mar-25 4.20 62,001 248,004 1,724,3892015 US 144A b 23-Mar-35 5.00 20,130 80,521 684,650
Denominated in stated foreign currency2012 JPY Medium Term Notes 22-Jun-18 1.23 8,559 134,424 –2012 CAD Medium Term Notes 24-Jul-19 4.25 19,529 338,237 –2012 GBP Medium Term Notes 26-Nov-24 4.25 39,459 157,943 674,3642015 GBP Medium Term Notes b 22-Mar-30 3.50 53,312 213,349 1,668,8982015 EUR Medium Term Notes b 22-Mar-22 1.38 36,060 144,240 1,023,2842015 EUR Medium Term Notes b 22-Mar-27 2.00 40,301 161,205 1,158,689
1,129,198 3,518,017 10,485,797
a) Facilities mature on 19 September 2017 ($311.25 million limit), 18 May 2018 ($100 million limit), 19 September 2018 ($311.25 million limit), 18 May 2019 ($50 million limit), 19 December 2019 ($100 million limit), 18 May 2020 ($50 million limit), 19 September 2020 ($207.5 million limit), 19 December 2020 ($100 million limit) and 18 May 2021 ($150 million limit).
b) Facilities are denominated in or fully swapped by way of CCIRS into US$. Cashflows represent the US$ cashflow translated at the USD/AUD spot rate as at 30 June 2016. These amounts are fully hedged by forward exchange contracts or future US$ revenues.
c) Rates shown are the coupon rate.
78 APA Group Annual Report 2016
For
per
sona
l use
onl
y

notes to the consolidated financial statements. continued.AUSTRALIAN PIPELINE TRUST AND ITS CONTROLLED ENTITIES FOR THE FINANCIAL YEAR ENDED 30 JUNE 2016
CAPITAL MANAGEMENT
21. Financial risk management (continued)c) Liquidity risk (continued) Average Less than More than interest rate 1 year 1 – 5 years 5 years 2015 Maturity % p.a. $000 $000 $000
Unsecured financial liabilitiesTrade and other payables – 405,685 – –Unsecured bank borrowings a 3.09 2,935 125,975 –2012 Subordinated Notes 1-Oct-72 7.20 34,203 148,917 2,795,775Interest rate swaps (net settled) 6.28 3,844 1,302 –
Denominated in A$Other financial liabilities b 7,574 30,296 48,918
Guaranteed Senior Notes c
Denominated in A$2007 Series A 15-May-17 7.33 367 5,367 –2007 Series C 15-May-17 7.38 7,318 106,475 –2007 Series E 15-May-19 7.40 5,045 83,304 –2007 Series G 15-May-22 7.45 6,002 24,008 92,5862007 Series H 15-May-22 7.45 4,617 18,468 71,2202010 AUD Medium Term Notes 22-Jul-20 7.75 23,250 93,000 311,625
Denominated in US$2003 Series C 9-Sep-15 5.77 192,773 – –2003 Series D 9-Sep-18 6.02 6,949 113,220 –2007 Series B 15-May-17 5.89 13,986 204,864 –2007 Series D 15-May-19 5.99 11,111 184,546 –2007 Series F 15-May-22 6.14 11,354 45,416 176,4332009 Series A 1-Jul-16 8.35 9,805 90,569 –2009 Series B 1-Jul-19 8.86 11,825 140,047 –2012 US 144A 11-Oct-22 3.88 48,989 197,031 857,9102015 US 144A b 23-Mar-25 4.20 59,883 239,533 1,725,3772015 US 144A b 23-Mar-35 5.00 19,443 77,771 680,709
Denominated in stated foreign currency2012 JPY Medium Term Notes 22-Jun-18 1.23 4,291 147,274 –2012 CAD Medium Term Notes 24-Jul-19 4.25 19,422 357,766 –2012 GBP Medium Term Notes 26-Nov-24 4.25 39,567 157,943 713,8232015 GBP Medium Term Notes b 22-Mar-30 3.50 51,894 206,081 1,663,4262015 EUR Medium Term Notes b 22-Mar-22 1.38 35,023 139,314 1,023,1632015 EUR Medium Term Notes b 22-Mar-27 2.00 39,142 155,699 1,158,040
1,076,297 3,094,186 11,319,005
a) Facilities mature on 19 September 2016 ($400 million limit), 19 September 2017 ($425 million limit), 19 December 2018 ($200 million limit), and 19 September 2019 ($275 million limit).
b) Facilities are denominated in or fully swapped by way of CCIRS into US$. Cashflows represent the US$ cashflow translated at the USD/AUD spot rate as at 30 June 2015. These amounts are fully hedged by forward exchange contracts or future US$ revenues.
c) Rates shown are the coupon rate.
79APA Group Annual Report 2016
For
per
sona
l use
onl
y

notes to the consolidated financial statements. continued.AUSTRALIAN PIPELINE TRUST AND ITS CONTROLLED ENTITIES FOR THE FINANCIAL YEAR ENDED 30 JUNE 2016
CAPITAL MANAGEMENT
21. Financial risk management (continued)Critical accounting judgements and key sources of estimation uncertainty – fair value of financial instrumentsAPA Group has financial instruments that are carried at fair value in the statement of financial position. The best evidence of fair value is quoted prices in an active market. If the market for a financial instrument is not active, APA Group determines fair value by using various valuation models. The objective of using a valuation technique is to establish the price that would be received to sell an asset or paid to transfer a liability between market participants. The chosen valuation models make maximum use of market inputs and rely as little as possible on entity specific inputs. The fair values of all positions include assumptions made as to recoverability based on the counterparty’s and APA Group’s credit risk.
Fair value measurements recognised in the statement of financial positionThe following table provides an analysis of financial instruments that are measured subsequent to initial recognition at fair value, grouped into Levels 1 to 3 based on the degree to which the fair value is observable.
– Level 1 fair value measurements are those derived from quoted prices (unadjusted) in active markets for identical assets or liabilities.
– Level 2 fair value measurements are those derived from inputs other than quoted prices included within Level 1 that are observable for the asset or liability, either directly (i.e. as prices) or indirectly (i.e. derived from prices).
– Level 3 fair value measurements are those derived from valuation techniques that include inputs for the asset or liability that are not based on observable market data (unobservable inputs).
There have been no transfers between the levels during 2016 (2015: none). Transfers between levels of the fair value hierarchy occur at the end of the reporting period. Transfers between level 1 and level 2 are triggered when there are changes to the availiability of quoted prices in active markets. Transfers into level 3 are triggered when the observable inputs become no longer observable, or vice versa for transfer out of level 3.
Fair value of the Group’s financial assets and liabilities that are measured at fair value on a recurring basisThe fair values of financial assets and financial liabilities are measured at the end of each reporting period and determined as follows:
– the fair values of available-for-sale financial assets and financial liabilities with standard terms and conditions and traded on active liquid markets are determined with reference to quoted market prices. These instruments are classified in the fair value hierarchy at level 1;
– the fair values of forward foreign exchange contracts included in hedging assets and liabilities are calculated using discounted cash flow analysis based on observable forward exchange rates at the end of the reporting period and contract forward rates discounted at a rate that reflects the credit risk of the various counterparties. These instruments are classified in the fair value hierarchy at level 2;
– the fair values of interest rates swaps, cross currency swaps, equity forwards and other derivative instruments included in hedging assets and liabilities are calculated using discounted cash flow analysis using observable yield curves at the end of the reporting period and contract rates discounted at a rate that reflects the credit risk of the various counterparties. These instruments are classified in the fair value hierarchy at level 2;
– the fair values of other financial assets and financial liabilities (excluding derivative instruments) are determined in accordance with generally accepted pricing models based on discounted cash flow analysis using prices from observable current markets discounted at a rate that reflects the credit risk of the various counterparties. These instruments are classified in the fair value hierarchy at level 2;
– the fair value of financial guarantee contracts is determined based upon the probability of default by the specified counterparty extrapolated from market-based credit information and the amount of loss, given the default. These instruments are classified in the fair value hierarchy at level 2; and
– the carrying value of financial assets and liabilities recorded at amortised cost in the financial statements approximate their fair value having regard to the specific terms of the agreements underlying those assets and liabilities.
80 APA Group Annual Report 2016
For
per
sona
l use
onl
y

notes to the consolidated financial statements. continued.AUSTRALIAN PIPELINE TRUST AND ITS CONTROLLED ENTITIES FOR THE FINANCIAL YEAR ENDED 30 JUNE 2016
CAPITAL MANAGEMENT
21. Financial risk management (continued)Fair value hierarchy Level 1 Level 2 Level 3 Total 2016 $000 $000 $000 $000
Financial assets measured at fair valueEquity forwards designated as fair value through profit or loss – 2,566 – 2,566Cross currency interest rate swaps used for hedging – 417,949 – 417,949Forward foreign exchange contracts used for hedging – 22,941 – 22,941
– 443,456 – 443,456
Financial liabilities measured at fair valueInterest rate swaps used for hedging – 8,993 – 8,993Cross currency interest rate swaps used for hedging – 267,287 – 267,287Forward foreign exchange contracts used for hedging – 10,137 – 10,137
– 286,417 – 286,417
2015Financial assets measured at fair valueAvailable-for-sale listed equity securities Ethane Pipeline Income Fund 7,162 – – 7,162Equity forwards designated as fair value through profit or loss – 5,199 – 5,199Cross currency interest rate swaps used for hedging – 461,484 – 461,484Forward foreign exchange contracts used for hedging – 4,016 – 4,016
7,162 470,699 – 477,861
Financial liabilities measured at fair valueInterest rate swaps used for hedging – 17,885 – 17,885Cross currency interest rate swaps used for hedging – 147,537 – 147,537Forward foreign exchange contracts used for hedging – 1,800 – 1,800
– 167,222 – 167,222
Fair value measurements of financial instruments measured at amortised costThe financial liabilities included in the following table are fixed rate borrowings. Other debts held by APA Group are floating rate borrowings and amortised cost as recorded in the financial statements approximate their fair values.
Carrying amount Fair value (level 2) a
2016 2015 2016 2015 $000 $000 $000 $000
Financial liabilitiesUnsecured long term Private Placement Notes 1,124,099 1,254,594 1,246,720 1,388,789Unsecured Australian Dollar Medium Term Notes 300,000 300,000 346,153 351,024Unsecured Japanese Yen Medium Term Notes 129,964 106,005 132,575 108,594Unsecured Canadian Dollar Medium Term Notes 310,555 311,394 317,912 323,954Unsecured Australian Dollar Subordinated Notes 515,000 515,000 656,141 646,661Unsecured US Dollar 144A Medium Term Notes 2,885,325 2,786,779 3,015,771 3,000,016Unsecured British Pound Medium Term Notes 1,688,747 1,937,372 1,822,352 1,864,624Unsecured Euro Medium Term Notes 2,008,378 1,950,107 1,958,596 1,872,050
8,962,068 9,161,251 9,496,220 9,555,712
a) The fair values have been determined in accordance with generally accepted pricing models based on discounted cash flow analysis using prices from observable current markets, discounted at a rate that reflects the credit risk of the various counterparties. These instruments are classified in the fair value hierarchy at level 2.
81APA Group Annual Report 2016
For
per
sona
l use
onl
y

notes to the consolidated financial statements. continued.AUSTRALIAN PIPELINE TRUST AND ITS CONTROLLED ENTITIES FOR THE FINANCIAL YEAR ENDED 30 JUNE 2016
CAPITAL MANAGEMENT
22. Other financial instruments Assets Liabilities
2016 2015 2016 2015 $000 $000 $000 $000
Derivatives at fair value: Equity forward contracts 1,864 3,527 – –
Derivatives at fair value designated as hedging instruments: Foreign exchange contracts – cash flow hedges 1,389 4,016 1,421 1,800 Interest rate swaps – cash flow hedges – – 3,925 13,003 Cross currency interest rate swaps – cash flow hedges 31,602 16,961 109,328 131,012Financial item carried at amortised cost: Redeemable preference share interest 285 285 – –
Current 35,140 24,789 114,674 145,815
Available-for-sale investments carried at fair value: Ethane Pipeline Income Fund – 7,162 – –Financial items carried at amortised cost: Redeemable ordinary shares 15,699 17,152 – – Redeemable preference shares 10,400 10,400 – –Derivatives – at fair value: Equity forward contracts 702 1,672 – –Derivatives at fair value designated as hedging instruments: Foreign currency contracts – cash flow hedges 21,552 – 8,716 – Interest rate swaps – cash flow hedges – – 6,246 8,728 Cross currency interest rate swaps – cash flow hedges 398,717 460,151 179,629 36,065
Non-current 447,070 496,537 194,591 44,793
Available-for-sale investments consist of investments in ordinary securities, and therefore have no fixed maturity date or coupon rate. The fair value of listed available-for-sale investments has been determined directly by reference to published price quotations in an active market.
Redeemable ordinary shares relate to APA Group’s 19.9% investment in Energy Infrastructure Investments Pty Ltd where APL, as responsible entity for APTIT, acquired the redeemable ordinary shares, which include a debt component.
Redeemable preference shares relate to APA Group’s 20% interest in GDI (EII) Pty Ltd. In December 2011, APA sold 80% of its gas distribution network in South East Queensland (Allgas) into an unlisted investment entity, GDI (EII) Pty Ltd. At that date GDI issued 52 million Redeemable Preference Shares (RPS) to its owners. The shares attract periodic interest payments and have a redemption date 10 years from issue.
Recognition and measurementHedge accountingAPA Group designates certain hedging instruments, which include derivatives, embedded derivatives and non-derivatives in respect of foreign currency risk, as either fair value hedges or cash flow hedges. There are no fair value hedges in the current or prior year, hedges of foreign exchange and interest rate risk are accounted for as cash flow hedges.
At the inception of the hedge relationship, APA Group formally designates and documents the hedge relationship, including the risk management strategy for undertaking the hedge. This includes identification of the hedging instrument, hedged item or transaction, the nature of the risk being hedged and how the entity will assess the hedging instrument’s effectiveness. Hedges are expected to be highly effective in achieving offsetting changes in fair value or cash flows and their effectiveness is regularly assessed to ensure they continue to be so.
Note 21 contains details of the fair values of the derivative instruments used for hedging purposes. Movements in the hedging reserve in equity are detailed in the Consolidated Statement of Changes in Equity.
Derivatives are initially recognised at fair value at the date a derivatives contract is entered into and subsequently remeasured to fair value at each reporting period. The resulting gain or loss is recognised in profit or loss immediately unless the derivative is designated and effective as a hedging instrument, in which event the timing of the recognition in profit or loss depends on the nature of the hedge relationship. A derivative with a positive fair value is recognised as a financial asset, a derivative with a negative fair value is recognised as a financial liability.
The fair value of hedging derivatives is classified as either current or non-current based on the timing of the underlying discounted cash flows of the instrument. Cash flows due within 12 months of the reporting date are classified as current and cash flows due after 12 months of the reporting date are classified as non-current.
82 APA Group Annual Report 2016
For
per
sona
l use
onl
y
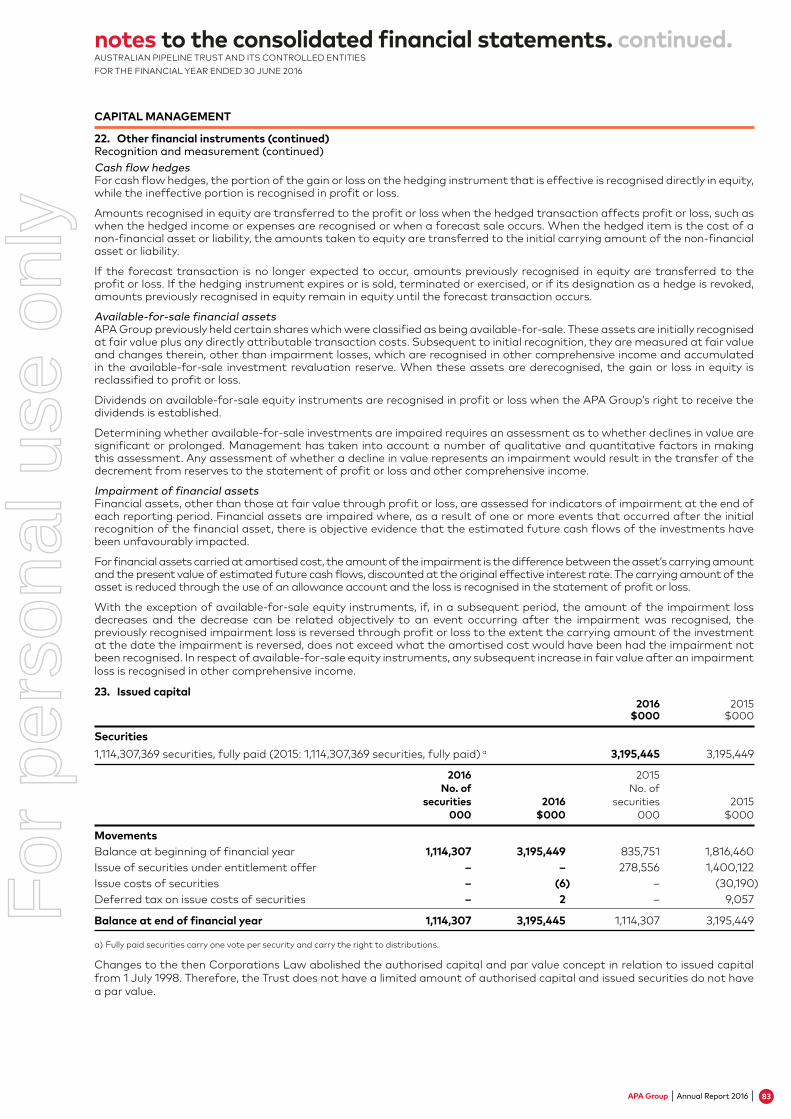
notes to the consolidated financial statements. continued.AUSTRALIAN PIPELINE TRUST AND ITS CONTROLLED ENTITIES FOR THE FINANCIAL YEAR ENDED 30 JUNE 2016
CAPITAL MANAGEMENT
22. Other financial instruments (continued)Recognition and measurement (continued)Cash flow hedgesFor cash flow hedges, the portion of the gain or loss on the hedging instrument that is effective is recognised directly in equity, while the ineffective portion is recognised in profit or loss.
Amounts recognised in equity are transferred to the profit or loss when the hedged transaction affects profit or loss, such as when the hedged income or expenses are recognised or when a forecast sale occurs. When the hedged item is the cost of a non-financial asset or liability, the amounts taken to equity are transferred to the initial carrying amount of the non-financial asset or liability.
If the forecast transaction is no longer expected to occur, amounts previously recognised in equity are transferred to the profit or loss. If the hedging instrument expires or is sold, terminated or exercised, or if its designation as a hedge is revoked, amounts previously recognised in equity remain in equity until the forecast transaction occurs.
Available-for-sale financial assetsAPA Group previously held certain shares which were classified as being available-for-sale. These assets are initially recognised at fair value plus any directly attributable transaction costs. Subsequent to initial recognition, they are measured at fair value and changes therein, other than impairment losses, which are recognised in other comprehensive income and accumulated in the available-for-sale investment revaluation reserve. When these assets are derecognised, the gain or loss in equity is reclassified to profit or loss.
Dividends on available-for-sale equity instruments are recognised in profit or loss when the APA Group’s right to receive the dividends is established.
Determining whether available-for-sale investments are impaired requires an assessment as to whether declines in value are significant or prolonged. Management has taken into account a number of qualitative and quantitative factors in making this assessment. Any assessment of whether a decline in value represents an impairment would result in the transfer of the decrement from reserves to the statement of profit or loss and other comprehensive income.
Impairment of financial assetsFinancial assets, other than those at fair value through profit or loss, are assessed for indicators of impairment at the end of each reporting period. Financial assets are impaired where, as a result of one or more events that occurred after the initial recognition of the financial asset, there is objective evidence that the estimated future cash flows of the investments have been unfavourably impacted.
For financial assets carried at amortised cost, the amount of the impairment is the difference between the asset’s carrying amount and the present value of estimated future cash flows, discounted at the original effective interest rate. The carrying amount of the asset is reduced through the use of an allowance account and the loss is recognised in the statement of profit or loss.
With the exception of available-for-sale equity instruments, if, in a subsequent period, the amount of the impairment loss decreases and the decrease can be related objectively to an event occurring after the impairment was recognised, the previously recognised impairment loss is reversed through profit or loss to the extent the carrying amount of the investment at the date the impairment is reversed, does not exceed what the amortised cost would have been had the impairment not been recognised. In respect of available-for-sale equity instruments, any subsequent increase in fair value after an impairment loss is recognised in other comprehensive income.
23. Issued capital 2016 2015 $000 $000
Securities1,114,307,369 securities, fully paid (2015: 1,114,307,369 securities, fully paid) a 3,195,445 3,195,449
2016 2015 No. of No. of securities 2016 securities 2015 000 $000 000 $000
MovementsBalance at beginning of financial year 1,114,307 3,195,449 835,751 1,816,460Issue of securities under entitlement offer – – 278,556 1,400,122Issue costs of securities – (6) – (30,190)Deferred tax on issue costs of securities – 2 – 9,057
Balance at end of financial year 1,114,307 3,195,445 1,114,307 3,195,449
a) Fully paid securities carry one vote per security and carry the right to distributions.
Changes to the then Corporations Law abolished the authorised capital and par value concept in relation to issued capital from 1 July 1998. Therefore, the Trust does not have a limited amount of authorised capital and issued securities do not have a par value.
83APA Group Annual Report 2016
For
per
sona
l use
onl
y

notes to the consolidated financial statements. continued.AUSTRALIAN PIPELINE TRUST AND ITS CONTROLLED ENTITIES FOR THE FINANCIAL YEAR ENDED 30 JUNE 2016
GROUP STRUCTURE
24. Non-controlling interestsAPT is deemed the parent entity of APA Group comprising of the stapled structure of APT and APTIT. Equity attributable to other trusts stapled to the parent is a form of non-controlling interest and represents 100% of the equity of APTIT.
Summarised financial information for APTIT is set out below, the amounts disclosed are before inter-company eliminations.
2016 2015 $000 $000
Financial positionCurrent assets 704 701Non-current assets 1,046,193 1,031,517
Total assets 1,046,897 1,032,218Current liabilities 11 49
Total liabilities 11 49
Net assets 1,046,886 1,032,169
Equity attributable to non-controlling interests 1,046,886 1,032,169
Financial performanceRevenue 85,483 46,359Expenses (381) (11)
Profit for the year 85,102 46,348Other comprehensive income (595) 989
Total comprehensive income allocated to non-controlling interests for the year 84,507 47,337
Cash flowsNet cash provided by operating activities 86,451 46,672Net cash used in investing activities (16,647) (436,276)Distributions paid to non-controlling interests (69,778) (39,324)Net cash (used in)/provided by financing activities (69,804) 389,604
The accounting policies of APTIT are the same as those applied to APA Group.
There are no material guarantees, contingent liabilities or restrictions imposed on APA Group from APTIT’s non-controlling interests.
APT Investment Trust 1,046,886 1,032,169Other non-controlling interest 53 52
1,046,939 1,032,221
APT Investment TrustIssued capital:Balance at beginning of financial year 1,005,086 576,172Issue of securities under entitlement offer – 438,351Distribution – capital return (Note 9) – –Issue costs of units (12) (9,437)
1,005,074 1,005,086
Reserves:Available-for-sale investment revaluation reserve:Balance at beginning of financial year 595 (394)Valuation loss recognised (595) 989
– 595
Retained earnings:Balance at beginning of financial year 26,488 19,465Net profit attributable to APTIT unitholders 85,102 46,348Distributions paid (Note 9) (69,778) (39,325)
41,812 26,488
Other non-controlling interestIssued capital 4 4Reserves 1 1Retained earnings 48 47
53 52
84 APA Group Annual Report 2016
For
per
sona
l use
onl
y

notes to the consolidated financial statements. continued.AUSTRALIAN PIPELINE TRUST AND ITS CONTROLLED ENTITIES FOR THE FINANCIAL YEAR ENDED 30 JUNE 2016
GROUP STRUCTURE
25. Joint arrangements and associatesThe table below lists APA Group’s interest in joint ventures and associates that are reported as part of the Energy Investments segment. APA Group provides asset management, operation and maintenance services and corporate services, in varying combinations to the majority of energy infrastructure assets housed within these entities.
Ownership interest %
Name of entity Principal activity Country of incorporation 2016 2015
Joint ventures:SEA Gas Gas transmission Australia 50.00 50.00Diamantina Power Station Power generation (gas) Australia – 50.00Energy Infrastructure Investments Unlisted energy vehicle Australia 19.90 19.90EII 2 Power generation (wind) Australia 20.20 20.20
Associates:GDI (EII) Gas distribution Australia 20.00 20.00
2016 2015 $000 $000
Investment in joint ventures and associates using the equity method 197,185 257,425
Joint VenturesAggregate carrying amount of investment 170,408 228,556APA Group’s aggregated share of: Profit from continuing operations 13,640 10,288 Other comprehensive income (8,103) (9,786)
Total comprehensive income 5,537 502
AssociatesAggregate carrying amount of investment 26,777 28,869APA Group’s aggregated share of: Profit from continuing operations 3,337 3,633 Other comprehensive income (1,327) (19,290)
Total comprehensive income 2,010 (15,657)
Investment in associatesAn associate is an entity over which APA Group has significant influence and that is neither a subsidiary nor a joint arrangement. Investments in associates are accounted for using the equity accounting method.
Under the equity accounting method the investment is recorded initially at cost to APA Group, including any goodwill on acquisition. In subsequent periods the carrying amount of the investment is adjusted to reflect APA Group’s share of the retained post-acquisition profit or loss and other comprehensive income, less any impairment.
Losses of an associate or joint venture in excess of APA Group’s interests (which includes any long-term interests, that in substance, form part of the net investment) are recognised only to the extent that there is a legal or constructive obligation or APA Group has made payments on behalf of the associate or joint venture.
Contingent liabilities and capital commitmentsAPA Group’s share of the contingent liabilities, capital commitments and other expenditure commitments of joint operations is disclosed in Note 28.
APA Group is a venturer in the following joint operations:
Output interest %
Name of venture Principal activity 2016 2015
Goldfields Gas Transmission Gas pipeline operation – Western Australia 88.2 a 88.2 a
Mid West Pipeline Gas pipeline operation – Western Australia 50.0 b 50.0 b
a) On 17 August 2004, APA acquired a direct interest in the Goldfields Gas Transmission joint operations as part of the SCP Gas Business acquisition.b) Pursuant to the joint venture agreement, APA Group receives a 70.8% share of operating income and expenses.
Interest in joint arrangementsA joint arrangement is an arrangement whereby two or more parties have joint control. Joint control is the contractually agreed sharing of control such that decisions about the relevant activities of the arrangement (those that significantly affect the returns) require the unanimous consent of the parties sharing control. APA Group has two types of joint arrangements:
Joint ventures: A joint arrangement in which the parties that share joint control have rights to the net assets of the arrangement. Joint Ventures are accounted for using the equity accounting method; and
85APA Group Annual Report 2016
For
per
sona
l use
onl
y

notes to the consolidated financial statements. continued.AUSTRALIAN PIPELINE TRUST AND ITS CONTROLLED ENTITIES FOR THE FINANCIAL YEAR ENDED 30 JUNE 2016
GROUP STRUCTURE
25. Joint arrangements and associates (continued)Interest in joint arrangements (continued)Joint operations: A joint arrangement in which the parties that share joint control have rights to the assets, and obligations for the liabilities, relating to the arrangement. In relation to its interest in a joint operation, APA Group recognises its share of assets and liabilities, revenue from the sale of its share of the output and its share of any revenue generated from the sale of the output by the joint operation and its share of expenses. These are incorporated into APA Group’s financial statements under the appropriate headings.
26. Business CombinationsAcquisitions of businesses are accounted for using the acquisition method. Under the acquisition method of accounting, the purchase consideration is allocated to the identifiable assets acquired and liabilities and contingent liabilities assumed (the identifiable net assets) on the basis of their fair value at the date of acquisition which is the date on which control is obtained.
Provisional fair values allocated at a reporting date are finalised within 12 months of the acquisition date. The excess of the consideration transferred, the amount of any non-controlling interest in the acquiree and the acquisition-date fair value of any previous equity interest in the acquiree over the fair value of the identifiable net assets acquired is recorded as goodwill. Any shortfall is immediately recognised in the statement of profit or loss.
Costs related to the acquisition of a subsidiary are expensed as incurred.
On an acquisition-by-acquisition basis, APA Group recognises any non-controlling interest in the acquiree either at the non-controlling interest’s proportionate share of the acquiree’s identifiable net assets or at fair value. Goodwill and amounts attributable to non-controlling interests will differ depending on the basis used.
Where APA Group has a previously held non-controlling interest in the acquiree, this is remeasured to fair value at the date control is gained with any gain or loss recognised in the statement of profit or loss. Amounts recognised in other comprehensive income prior to the acquisition are reclassified to profit or loss.
Subsidiaries acquired Proportion of Cost of Date of shares acquired acquisition Name of entity Principal activity Acquisition % $000
2016Diamantina Power Station Power generation (gas) 31 March 2016 50.00 151,000Ethane Pipeline Income Fund Gas transmission 18 April 2016 93.92 122,368APA Ethane Limited Trustee 15 June 2016 50.50 –
Diamantina Power StationOn 31 March 2016, APA Group acquired the remaining 50 per cent of the Diamantina Power Station (DPS) that it did not already own from AGL Energy Limited for a cash payment of $151.0 million.
The acquisition includes two power stations with shared infrastructure, the 242MW Diamantina Power Station with combined cycle gas turbines and the 60MW Leichhardt Power Station with an open cycle gas turbine. These energy assets are connected to our East Coast Grid and underwritten by two highly credit worthy counterparties.
Included in the consolidated net profit for the year is revenue of $56.3 million and earnings before interest, tax, depreciation and amortisation of $23.3 million attributable to DPS.
Had the business combination been effected at 1 July 2015, DPS would have contributed revenue of $245.5 million and earnings before interest, tax, depreciation and amortisation of $89.3 million.
Ethane Pipeline Income FundOn 7 March 2016, APA Group announced an unconditional off-market takeover offer for all remaining securities of Ethane Pipeline Income Fund (EPX) that APA did not already own at a cash only offer price of $1.88 per security. By 18 April 2016, APA Group had obtained a controlling interest of 51.01% of EPX resulting in a non-controlling interest of 48.99%. The non-controlling interest was acquired over the period 19 April to 15 June 2016 when compulsory acquisition was completed.
The non-controlling interest in EPX recognised at acquisition date was measured by reference to the fair value of the non-controlling interest and amounted to $63.8 million. The fair value was derived from a quoted price in an active market for the equity securities.
The acquisition of EPX extends and further diversifies APA Group’s investment in related energy infrastructure including expanding its footprint into transporting alternate fuels. The ethane pipeline asset has a long term customer contract in place. APA Group currently has an operating agreement over the ethane pipeline and expects to reduce costs from removal of EPX from the official list of ASX, and through economies of scale.
On 15 June 2016, APA Group acquired the remaining 50 shares in APA Ethane Limited, the Responsible Entity of Ethane Pipeline Income Fund.
Included in the consolidated net profit for the year is revenue of $4.1 million and earnings before interest, tax, depreciation and amortisation of $2.8 million attributable to EPX.
Had the business combination been effected at 1 July 2015, EPX would have contributed revenue of $20.1 million and earnings before interest, tax, depreciation and amortisation of $16.2 million.
86 APA Group Annual Report 2016
For
per
sona
l use
onl
y

notes to the consolidated financial statements. continued.AUSTRALIAN PIPELINE TRUST AND ITS CONTROLLED ENTITIES FOR THE FINANCIAL YEAR ENDED 30 JUNE 2016
GROUP STRUCTURE
26. Business Combinations (continued)Assets acquired and liabilities assumed at the date of acquisition EPX DPS Total Net assets acquired $000 $000 $000
Current assetsCash and cash equivalents 5,594 53,062 58,656Trade and other receivables 1,126 5,508 6,634Other financial assets – 347 347Inventories – 5,937 5,937Other 417 6,066 6,483
Non-current assetsCash on deposit 2,169 – 2,169Other financial assets – 597 597Property, plant & equipment 142,085 725,091 867,176Goodwill – 44,088 44,088
Current liabilitiesTrade and other payables (1,654) (26,292) (27,946)Income tax payable (365) – (365)Current borrowings – (447,051) (447,051)Other financial liabilities – (16,134) (16,134)Provisions (866) (549) (1,415)Other (18) – (18)
Non-current liabilitiesDeferred tax liabilities (16,317) (17,758) (34,075)Other financial liabilities – (28,208) (28,208)Provisions (1,882) (2,728) (4,610)
Fair value of net assets acquired 130,289 301,976 432,265
Previously held interest (7,921) (150,976) (158,897)
Cost of acquisition 122,368 151,000 273,368
Cash balances acquired (5,593) (53,062) (58,655)Dividend on securities acquired (Cum Dividend) during the takeover offer 102 – 102Transaction costs paid 2,172 353 2,525
Net cash outflow on acquisitions 119,049 98,291 217,340
The accounting for the acquisition of EPX and DPS has been provisionally determined at the reporting date.
27. SubsidiariesSubsidiaries are entities controlled by APT. Control exists where APT has power over the entities, i.e. existing rights that give it the current ability to direct the relevant activities of the entities (those that significantly affect the returns); exposure, or rights, to variable returns from its involvement with the entities; and the ability to use its power to affect those returns.
Ownership interest % Country of registrationName of entity /incorporation 2016 2015
Parent entityAustralian Pipeline Trust a
SubsidiariesAPT Pipelines Limited b, c Australia 100 100Australian Pipeline Limited b Australia 100 100Agex Pty Ltd b, c Australia 100 100Amadeus Gas Trust Australia 96 96APT Goldfields Pty Ltd b, c Australia 100 100APT Management Services Pty Limited b, c Australia 100 100APT Parmelia Holdings Pty Ltd b, c Australia 100 100APT Holdings Pty Ltd b, c Australia 100 100
87APA Group Annual Report 2016
For
per
sona
l use
onl
y

notes to the consolidated financial statements. continued.AUSTRALIAN PIPELINE TRUST AND ITS CONTROLLED ENTITIES FOR THE FINANCIAL YEAR ENDED 30 JUNE 2016
GROUP STRUCTURE
27. Subsidiaries (continued)
Ownership interest % Country of registrationName of entity /incorporation 2016 2015
APT Parmelia Trust b Cayman Islands 100 100APT Petroleum Pipelines Holdings Pty Limited b, c Australia 100 100APT Petroleum Pipelines Pty Limited b, c Australia 100 100APT Pipelines (NSW) Pty Limited b, c Australia 100 100APT Pipelines (NT) Pty Limited b, c Australia 100 100APT Pipelines (QLD) Pty Limited b, c Australia 100 100APT Pipelines (WA) Pty Limited b, c Australia 100 100APT Pipelines Investments (NSW) Pty Limited b, c Australia 100 100APT Pipelines Investments (WA) Pty Limited b, c Australia 100 100East Australian Pipeline Pty Limited b, c Australia 100 100Gasinvest Australia Pty Ltd b, c Australia 100 100Goldfields Gas Transmission Pty Ltd b Australia 100 100N.T. Gas Distribution Pty Limited b, c Australia 100 100N.T. Gas Easements Pty Limited b, c Australia 100 100N.T. Gas Pty Limited Australia 96 96Roverton Pty Ltd b, c Australia 100 100SCP Investments (No. 1) Pty Limited b, c Australia 100 100SCP Investments (No. 2) Pty Limited b, c Australia 100 100SCP Investments (No. 3) Pty Limited b, c Australia 100 100Sopic Pty Ltd b, c Australia 100 100Southern Cross Pipelines (NPL) Australia Pty Ltd b, c Australia 100 100Southern Cross Pipelines Australia Pty Limited b, c Australia 100 100Trans Australia Pipeline Pty Ltd b, c Australia 100 100Western Australian Gas Transmission Company 1 Pty Ltd b, c Australia 100 100GasNet Australia Trust b Australia 100 100APA VTS Australia (Holdings) Pty Limited b, c Australia 100 100APA VTS Australia (Operations) Pty Limited b, c Australia 100 100APA VTS A Pty Limited b, c Australia 100 100GasNet A Trust Australia 100 100APA VTS Australia (NSW) Pty Limited b, c Australia 100 100APA VTS B Pty Limited b, c Australia 100 100APA VTS Australia Pty Limited b, c Australia 100 100GasNet B Trust b Australia 100 100GasNet Australia Investments Trust Australia 100 100APA Operations Pty Limited b, c Australia 100 100APT AM Holdings Pty Limited b, c Australia 100 100APT O&M Holdings Pty Ltd b, c Australia 100 100APT O&M Services Pty Ltd b, c Australia 100 100APT O&M Services (QLD) Pty Ltd b, c Australia 100 100APT AM (Stratus) Pty Limited b, c Australia 100 100APT Facility Management Pty Limited b, c Australia 100 100APT AM Employment Pty Limited b, c Australia 100 100APT Sea Gas Holdings Pty Limited b, c Australia 100 100APT SPV2 Pty Ltd b Australia 100 100APT SPV3 Pty Ltd b Australia 100 100APT Pipelines (SA) Pty Limited b, c Australia 100 100APT (MIT) Services Pty Limited b, c Australia 100 100APA Operations (EII) Pty Limited b, c Australia 100 100Central Ranges Pipeline Pty Ltd b, c Australia 100 100APA Country Pipelines Pty Limited b, c Australia 100 100APA Facilities Management Pty Limited b, c Australia 100 100APA (NBH) Pty Limited b, c Australia 100 100APA Pipelines Investments (BWP) Pty Limited b, c Australia 100 100APA Power Holdings Pty Limited b, c Australia 100 100APA (EDWF Holdco) Pty Ltd b, c Australia 100 100APA (BWF Holdco) Pty Ltd b, c Australia 100 100EDWF Holdings 1 Pty Ltd b, c Australia 100 100
88 APA Group Annual Report 2016
For
per
sona
l use
onl
y

notes to the consolidated financial statements. continued.AUSTRALIAN PIPELINE TRUST AND ITS CONTROLLED ENTITIES FOR THE FINANCIAL YEAR ENDED 30 JUNE 2016
GROUP STRUCTURE
27. Subsidiaries (continued)
Ownership interest % Country of registrationName of entity /incorporation 2016 2015
EDWF Holdings 2 Pty Ltd b, c Australia 100 100EDWF Manager Pty Ltd b, c Australia 100 100Wind Portfolio Pty Ltd b, c Australia 100 100Griffin Windfarm 2 Pty Ltd b Australia 100 100APA AM (Allgas) Pty Limited b, c Australia 100 100APA DPS Holdings Pty Limited b, c Australia 100 100APA Power PF Pty Limited b, c Australia 100 100APA Sub Trust No 1 b Australia 100 100APA Sub Trust No 2 b Australia 100 100APA Sub Trust No 3 b Australia 100 100APA (Pilbara Pipeline) Pty Ltd b, c Australia 100 100APA (Sub No 3) International Holdings 1 Pty Ltd b, e, f Australia – 100APA (Sub No 3) International Holdings 2 Pty Ltd b, e, f Australia – 100APA (Sub No 3) International Holdings 3 Pty Ltd b, e, f Australia – 100APA (SWQP) Pty Limited b, c Australia 100 100APA (WA) One Pty Limited b, c Australia 100 100APA AIS 1 Pty Limited b, c Australia 100 100APA AIS 2 Pty Ltd b, c Australia 100 100APA AIS Pty Limited b, c Australia 100 100APA Biobond Pty Limited b, c Australia 100 100APA East One Pty Limited b, e, f Australia – 100APA East Pipelines Pty Limited b, c Australia 100 100APA EE Pty Limited b, c Australia 100 100APA EE Australia Pty Limited b, c Australia 100 100APA EE Corporate Shared Services Pty Limited b, c Australia 100 100APA EE Holdings Pty Limited b, c Australia 100 100Epic Energy East Pipelines Trust b Australia 100 100APA (NT) Pty Limited b, e, f Australia – 100APA Bid Co Pty Limited b, c Australia 100 100APA Transmission Pty Limited b, c, g Australia 100 100APA WGP Pty Limited b, c Australia 100 100APA Newco Pty Limited b, d Australia 100 –APA SEA Gas (Mortlake) Holdings Pty Ltd b, d Australia 100 –APA SEA Gas (Mortlake) Pty Ltd b, d Australia 100 –APA DPS2 Pty Limited b, d Australia 100 –Diamantina Holding Company Pty Limited b, h Australia 100 –Diamantina Power Station Pty Limited b, h Australia 100 –Ethane Pipeline Income Trust b, h Australia 100 –Ethane Pipeline Income Financing Trust b, h Australia 100 –Moomba to Sydney Ethane Pipeline Trust b, h Australia 100 –Gorodok Pty Ltd b, h Australia 100 –APA Ethane Limited b, h Australia 100 –Votraint No 1606 Pty Ltd b h Australia 100 –Votraint No 1613 Pty Ltd b h Australia 100 –EPX HoldCo Pty Ltd b d Australia 100 –APA (EPX) Pty Limited b, d Australia 100 –EPX Trust b d Australia 100 –EPX Member Pty Ltd b d Australia 100 –
a) Australian Pipeline Trust is the head entity within the APA tax-consolidated group.b) These entities are members of the APA tax-consolidated group.c) These wholly-owned subsidiaries have entered into a deed of cross guarantee with APT Pipelines Limited pursuant to ASIC Class Order 98/1418 and are relieved
from the requirement to prepare and lodge an audited financial report.d) Entity was acquired or registered during the 2016 year.e) Entity was deregistered during the 2016 year.f) Entity party to a revocation deed, in relation to the APT Pipelines Limited deed of cross guarantee, lodged with ASIC on 1 August 2014 which has taken affect
in the 2015 year and is therefore no longer a party to the deed.g) Entity previously known as “APA Holdco Pty Limited” during the 2015 year.h) Remaining shares/units acquired during the 2016 year, entity now classified as a subsidiary (refer to Note 26).
89APA Group Annual Report 2016
For
per
sona
l use
onl
y

notes to the consolidated financial statements. continued.AUSTRALIAN PIPELINE TRUST AND ITS CONTROLLED ENTITIES FOR THE FINANCIAL YEAR ENDED 30 JUNE 2016
OTHER ITEMS
28. Commitments and contingencies 2016 2015 $000 $000
Capital expenditure commitmentsAPA Group – plant and equipment 151,710 94,169APA Group’s share of jointly controlled operations – plant and equipment 4,402 5,987
156,112 100,156
Contingent liabilitiesBank guarantees 42,027 49,049
APA Group had no contingent assets as at 30 June 2016 and 30 June 2015.
29. Director and senior executive remunerationRemuneration of DirectorsThe aggregate remuneration of Directors of APA Group is set out below: 2016 2015 $ $
Short-term employment benefits 1,548,424 1,268,500Post-employment benefits 217,041 132,105
Total remuneration: Non-executive Directors 1,765,465 1,400,605
Short-term employment benefits 3,544,861 3,109,447Post-employment benefits 35,000 35,000Cash settled security-based payments 1,579,531 1,564,212
Total remuneration: Executive Director a 5,159,392 4,708,659
Total remuneration: Directors 6,924,857 6,109,264
Remuneration of senior executives a
The aggregate remuneration of senior executives of APA Group is set out below:Short-term employment benefits 10,992,475 9,977,891Post-employment benefits 856,636 258,778Cash settled security-based payments 4,429,999 4,242,640Retention award – 430,666
Total remuneration: senior executives 16,279,110 14,909,975
a) The remuneration for the Chief Executive Officer and Managing Director, Michael McCormack, is also included in the remuneration disclosure for senior executives.
30. Remuneration of external auditorAmounts received or due and receivable by Deloitte Touche Tohmatsu for:Auditing the financial report 643,000 659,500Compliance plan audit 18,500 18,000Other assurance services a 75,000 436,500
736,500 1,114,000
a) Services provided were in accordance with the external auditor independence policy. Other assurance services mainly comprise assurance services in relation to Diamantina Holding Company Pty Limited and Diamantina Power Station Pty Limited.
31. Related party transactionsa) Equity interest in related partiesDetails of the percentage of ordinary securities held in subsidiaries are disclosed in Note 27 and the details of the percentage held in joint operations, joint ventures and associates are disclosed in Note 25.
b) Responsible Entity – Australian Pipeline LimitedThe Responsible Entity is wholly owned by APT Pipelines Limited.
90 APA Group Annual Report 2016
For
per
sona
l use
onl
y

notes to the consolidated financial statements. continued.AUSTRALIAN PIPELINE TRUST AND ITS CONTROLLED ENTITIES FOR THE FINANCIAL YEAR ENDED 30 JUNE 2016
OTHER ITEMS
31. Related party transactions (continued)c) Transactions with related parties within APA GroupTransactions between the entities that comprise APA Group during the financial year consisted of:
– dividends; – asset lease rentals; – loans advanced and payments received on long-term inter-entity loans; – management fees; – operational services provided between entities; – payments of distributions; and – equity issues.
The above transactions were made on normal commercial terms and conditions. The Group charges interest on inter-entity loans from time to time.
All transactions between the entities that comprise APA Group have been eliminated on consolidation.
Refer to Note 27 for details of the entities that comprise APA Group.
Australian Pipeline LimitedManagement fees of $3,999,694 (2015: $3,451,167) were paid to the Responsible Entity as reimbursement of costs incurred on behalf of APA Group. No amounts were paid directly by APA Group to the Directors of the Responsible Entity, except as disclosed at Note 29.
Australian Pipeline Limited, in its capacity as trustee and Responsible Entity of the Trust, has guaranteed the payment of principal, interest and other amounts as provided in the senior debt facilities of APT Pipelines Limited, the principal borrowing entity of APA Group.
d) Transactions with other associates and joint venturesThe following transactions occurred with APA Group’s associates and joint ventures on normal market terms and conditions:
Dividends Purchases Amount Amount from Sales to from owed by owed to related related related related related parties parties parties parties parties 2016 $000 $000 $000 $000 $000
SEA Gas 10,523 3,371 – 10 –Energy Infrastructure Investments 3,810 35,114 157 4,344 –EII 2 3,102 725 – 45 –APA Ethane Ltd – 192 – – –Diamantina Power Station a – 950 – – –GDI (EII) 4,102 55,775 54 7,830 –
21,537 96,127 211 12,229 –
2015SEA Gas 14,164 3,733 – 181 –Energy Infrastructure Investments 3,460 27,021 139 3,074 139EII 2 3,105 661 – – –APA Ethane Ltd – 200 – – –Diamantina Power Station a – 1,608 – – –GDI (EII) 4,479 51,190 – 5,749 –
25,208 84,413 139 9,004 139
a) At year end, APA Group had no shareholder loan receivable from Diamantina Power Station (2015: $75.7 million). Following APA Group’s acquisition of the remaining 50% of Diamantina Power Station on 31 March 2016, the shareholder loan receivable from Diamantina Power Station now forms part of the inter-entity balances and is eliminated on consolidation.
91APA Group Annual Report 2016
For
per
sona
l use
onl
y

notes to the consolidated financial statements. continued.AUSTRALIAN PIPELINE TRUST AND ITS CONTROLLED ENTITIES FOR THE FINANCIAL YEAR ENDED 30 JUNE 2016
OTHER ITEMS
32. Parent entity informationThe accounting policies of the parent entity, which have been applied in determining the financial information below, are the same as those applied in the consolidated financial statements.
2016 2015 $000 $000
Financial positionAssetsCurrent assets 2,573,646 2,869,731Non-current assets 752,939 632,553
Total assets 3,326,585 3,502,284
LiabilitiesCurrent liabilities 112,169 105,763
Total liabilities 112,169 105,763
Net assets 3,214,416 3,396,521
EquityIssued capital 3,195,445 3,195,449Retained earnings 18,971 199,587Available-for-sale investment revaluation reserve – 1,485
Total equity 3,214,416 3,396,521
Financial performanceProfit for the year 186,014 449,311Other comprehensive income 2,258 1,122
Total comprehensive income 188,272 450,433
Guarantees entered into by the parent entity in relation to the debts of its subsidiariesNo guarantees have been entered into by the parent entity in relation to the debts of its subsidiaries.
Contingent liabilities of the parent entityNo contingent liabilities have been identified in relation to the parent entity.
33. Adoption of new and revised Accounting StandardsStandards and Interpretations affecting amounts reported in the current period (and/or prior periods)There has not been any new or revised Standards and Interpretations issued by the AASB that are relevant to the consolidated entity’s operations that would be effective for the current reporting period.
Standards and Interpretations issued not yet adoptedAt the date of authorisation of the financial statements, the Standards and Interpretations listed below were on issue but not yet effective.
Effective for annual Expected to be reporting periods initially applied beginning on in the financial Standard/Interpretation or after year ending
– AASB 9 ‘Financial Instruments’, and the relevant amending standards 1 January 2018 30 June 2019– AASB 15 ‘Revenue from Contracts with Customers’, 1 January 2018 30 June 2019
and AASB 2015-8 ‘Amendments to Australian Accounting Standards – Effective date of AASB 15’
– AASB 16 ‘Leases’ 1 January 2019 30 June 2020
The potential impacts of the initial application of the Standards above are yet to be determined.
34. Events occurring after reporting dateOn 24 August 2016, the Directors declared a final distribution of 22.50 cents per security ($250.7 million) for APA Group (comprising a distribution of 18.12 cents per security from APT and a distribution of 4.38 cents per security from APTIT), comprising 20.09 cents per security profit distribution (unfranked) and 2.41 cents per security capital distribution. The distribution will be paid on 16 September 2016.
Other than the events disclosed above, there have not been any events or transactions that have occurred subsequent to year end that would require adjustment to or disclosure in the accounts.
92 APA Group Annual Report 2016
For
per
sona
l use
onl
y

declaration by the directors.AUSTRALIAN PIPELINE TRUST AND ITS CONTROLLED ENTITIES
For the financial year ended 30 June 2016
The Directors declare that:a) in the Directors’ opinion, there are reasonable grounds to believe that Australian Pipeline Trust will be able to pay its debts
as and when they become due and payable;
b) in the Directors’ opinion, the attached financial statements and notes thereto are in accordance with the Corporations Act 2001, including compliance with Accounting Standards and giving a true and fair view of the financial position and performance of APA Group;
c) in the Directors’ opinion, the financial statements and notes thereto are in accordance with International Financial Reporting Standards issued by the International Accounting Standard Boards;
d) the Directors have been given the declarations by the Managing Director and Chief Financial Officer required by section 295A of the Corporations Act 2001.
Signed in accordance with a resolution of the Directors of the Responsible Entity made pursuant to section 295(5) of the Corporations Act 2001.
On behalf of the Directors
Leonard Bleasel AM Steven CraneChairman Director
Sydney, 24 August 2016
93APA Group Annual Report 2016
For
per
sona
l use
onl
y

auditor’s independence declaration.AUSTRALIAN PIPELINE TRUST AND ITS CONTROLLED ENTITIESTO AUSTRALIAN PIPELINE LIMITED AS RESPONSIBLE ENTITY FOR AUSTRALIAN PIPELINE TRUST
Liability limited by a scheme approved under Professional Standards LegislationMember of Deloitte Touche Tohmatsu Limited
24 August 2016
The DirectorsAustralian Pipeline Limited as responsible entity forAustralian Pipeline TrustHSBC BuildingLevel 19, 580 George StreetSydney NSW 2000
Dear Directors
Auditor’s Independence Declaration to Australian Pipeline Limited asresponsible entity for Australian Pipeline Trust
In accordance with section 307C of the Corporations Act 2001, I am pleased to providethe following declaration of independence to the directors of Australian Pipeline Limitedas responsible entity for Australian Pipeline Trust.
As lead audit partner for the audit of the financial statements of Australian Pipeline Trustfor the financial year ended 30 June 2016, I declare that to the best of my knowledgeand belief, there have been no contraventions of:
(i) the auditor independence requirements of the Corporations Act 2001 inrelation to the audit; and
(ii) any applicable code of professional conduct in relation to the audit.
DELOITTE TOUCHE TOHMATSU
A V GriffithsPartnerChartered AccountantsSydney, 24 August 2016
Deloitte Touche TohmatsuABN 74 490 121 060
Grosvenor Place225 George StreetSydney NSW 2000PO Box N250 Grosvenor PlaceSydney NSW 1220 Australia
DX: 10307SSETel: +61 (0) 2 9322 7000Fax: +61 (0) 2 9322 7001www.deloitte.com.au
110
Independent Auditor’s Reportto the Unitholders of Australian Pipeline Trust
Report on the Financial Report
We have audited the accompanying financial report of Australian Pipeline Trust, which comprises the statement of financial position as at 30 June 2015, the statement of profit or loss and other comprehensive income, the statement of cash flows and the statement of changes in equity for the year ended on that date, notes comprising a summary of significant accounting policies and other explanatory information, and the directors’ declaration of the consolidated entity, comprising the Trust and the entities it controlled at the year’s end or from time to time during the financial year as set out on pages 36 to 76.
Directors’ Responsibility for the Financial Report
The directors of Australian Pipeline Limited are responsible for the preparation of the financial report that gives a true and fair view in accordance with Australian Accounting Standards and the Corporations Act 2001 and for such internal control as the directors determine is necessary to enable the preparation of the financial report that gives a true and fair view and is free from material misstatement, whether due to fraud or error. In Note 2, the directors also state, in accordance with Accounting Standard AASB 101 Presentation of Financial Statements , that the financial statements comply with International Financial Reporting Standards.
Auditor’s Responsibility
Our responsibility is to express an opinion on the financial report based on our audit. We conducted our audit in accordance with Australian Auditing Standards. Those standards require that we comply with relevant ethical requirements relating to audit engagements and plan and perform the audit to obtain reasonable assurance whether the financial report is free from material misstatement.
An audit involves performing procedures to obtain audit evidence about the amounts and disclosures in the financial report. The procedures selected depend on the auditor’s judgement, including the assessment of the risks of material misstatement of the financial report, whether due to fraud or error. In making those risk assessments, the auditor considers internal control, relevant to the entity’s preparation of the financial report that gives a true and fair view, in order to design audit procedures that are appropriate in the circumstances, but not for the purpose of expressing an opinion on the effectiveness of the entity’s internal control. An audit also includes evaluating the appropriateness of accounting policies used and the reasonableness of accounting estimates made by the directors, as well as evaluating the overall presentation of the financial report.
Liability limited by a scheme approved under Professional Standards LegislationMember of Deloitte Touche Tohmatsu Limited
Deloitte Touche TohmatsuABN 74 490 121 060
Grosvenor Place225 George StreetSydney NSW 2000PO Box N250 Grosvenor PlaceSydney NSW 1220 Australia
DX: 10307SSETel: +61 (0) 2 9322 7000Fax: +61 (0) 2 9322 7001www.deloitte.com.au
94 APA Group Annual Report 2016
For
per
sona
l use
onl
y

independent auditor’s report.AUSTRALIAN PIPELINE TRUST AND ITS CONTROLLED ENTITIESTO AUSTRALIAN PIPELINE LIMITED AS RESPONSIBLE ENTITY FOR AUSTRALIAN PIPELINE TRUST
Independent Auditor’s Reportto the Unitholders of Australian Pipeline Trust
Report on the Financial Report
We have audited the accompanying financial report of Australian Pipeline Trust, which comprises the statement of financial position as at 30 June 2016, the statement of profit or loss and other comprehensive income, the statement of cash flows and the statement of changes in equity for the year ended on that date, notes comprising a summary of significant accounting policies and other explanatory information, and the directors’ declaration of the consolidated entity, comprising the Trust and the entities it controlled at the year’s end or from time to time during the financial year as set out on pages 50 to 93.
Directors’ Responsibility for the Financial Report
The directors of Australian Pipeline Limited are responsible for the preparation of the financial report that gives a true and fair view in accordance with Australian Accounting Standards and the Corporations Act 2001 and for such internal control as the directors determine is necessary to enable the preparation of the financial report that gives a true and fair view and is free from material misstatement, whether due to fraud or error. In Note 2, the directors also state, in accordance with Accounting Standard AASB 101 Presentation of Financial Statements, that the financial statements comply with International Financial Reporting Standards.
Auditor’s Responsibility
Our responsibility is to express an opinion on the financial report based on our audit. We conducted our audit in accordance with Australian Auditing Standards. Those standards require that we comply with relevant ethical requirements relating to audit engagements and plan and perform the audit to obtain reasonable assurance whether the financial report is free from material misstatement.
An audit involves performing procedures to obtain audit evidence about the amounts and disclosures in the financial report. The procedures selected depend on the auditor’s judgement, including the assessment of the risks of material misstatement of the financial report, whether due to fraud or error. In making those risk assessments, the auditor considers internal control, relevant to the entity’s preparation of the financial report that gives a true and fair view, in order to design audit procedures that are appropriate in the circumstances, but not for the purpose of expressing an opinion on the effectiveness of the entity’s internal control. An audit also includes evaluating the appropriateness of accounting policies used and the reasonableness of accounting estimates made by the directors, as well as evaluating the overall presentation of the financial report.
Liability limited by a scheme approved under Professional Standards LegislationMember of Deloitte Touche Tohmatsu Limited
Deloitte Touche TohmatsuABN 74 490 121 060
Grosvenor Place225 George StreetSydney NSW 2000PO Box N250 Grosvenor PlaceSydney NSW 1220 Australia
DX: 10307SSETel: +61 (0) 2 9322 7000Fax: +61 (0) 2 9322 7001www.deloitte.com.au
110
Independent Auditor’s Reportto the Unitholders of Australian Pipeline Trust
Report on the Financial Report
We have audited the accompanying financial report of Australian Pipeline Trust, which comprises the statement of financial position as at 30 June 2015, the statement of profit or loss and other comprehensive income, the statement of cash flows and the statement of changes in equity for the year ended on that date, notes comprising a summary of significant accounting policies and other explanatory information, and the directors’ declaration of the consolidated entity, comprising the Trust and the entities it controlled at the year’s end or from time to time during the financial year as set out on pages 36 to 76.
Directors’ Responsibility for the Financial Report
The directors of Australian Pipeline Limited are responsible for the preparation of the financial report that gives a true and fair view in accordance with Australian Accounting Standards and the Corporations Act 2001 and for such internal control as the directors determine is necessary to enable the preparation of the financial report that gives a true and fair view and is free from material misstatement, whether due to fraud or error. In Note 2, the directors also state, in accordance with Accounting Standard AASB 101 Presentation of Financial Statements , that the financial statements comply with International Financial Reporting Standards.
Auditor’s Responsibility
Our responsibility is to express an opinion on the financial report based on our audit. We conducted our audit in accordance with Australian Auditing Standards. Those standards require that we comply with relevant ethical requirements relating to audit engagements and plan and perform the audit to obtain reasonable assurance whether the financial report is free from material misstatement.
An audit involves performing procedures to obtain audit evidence about the amounts and disclosures in the financial report. The procedures selected depend on the auditor’s judgement, including the assessment of the risks of material misstatement of the financial report, whether due to fraud or error. In making those risk assessments, the auditor considers internal control, relevant to the entity’s preparation of the financial report that gives a true and fair view, in order to design audit procedures that are appropriate in the circumstances, but not for the purpose of expressing an opinion on the effectiveness of the entity’s internal control. An audit also includes evaluating the appropriateness of accounting policies used and the reasonableness of accounting estimates made by the directors, as well as evaluating the overall presentation of the financial report.
Liability limited by a scheme approved under Professional Standards LegislationMember of Deloitte Touche Tohmatsu Limited
Deloitte Touche TohmatsuABN 74 490 121 060
Grosvenor Place225 George StreetSydney NSW 2000PO Box N250 Grosvenor PlaceSydney NSW 1220 Australia
DX: 10307SSETel: +61 (0) 2 9322 7000Fax: +61 (0) 2 9322 7001www.deloitte.com.au
95APA Group Annual Report 2016
For
per
sona
l use
onl
y

independent auditor’s report. continued.AUSTRALIAN PIPELINE TRUST AND ITS CONTROLLED ENTITIESTO AUSTRALIAN PIPELINE LIMITED AS RESPONSIBLE ENTITY FOR AUSTRALIAN PIPELINE TRUST
We believe that the audit evidence we have obtained is sufficient and appropriate toprovide a basis for our audit opinion.
Auditor’s Independence Declaration
In conducting our audit, we have complied with the independence requirements of theCorporations Act 2001. We confirm that the independence declaration required by theCorporations Act 2001, which has been given to the directors of Australian PipelineLimited as responsible entity for Australian Pipeline Trust would be in the same terms ifgiven to the directors as at the time of this auditor’s report.
Opinion
In our opinion:
(a) the financial report of Australian Pipeline Trust is in accordance with the CorporationsAct 2001, including:
(i) giving a true and fair view of the consolidated entity’s financial position as at 30June 2016 and of its performance for the year ended on that date; and
(ii) complying with Australian Accounting Standards and the Corporations Regulations2001; and
(b) the financial statements also comply with International Financial Reporting Standardsas disclosed in Note 2.
Report on the Remuneration Report
We have audited the Remuneration Report included in pages 34 to 49 of the directors’ report of Australian Pipeline Limited as responsible entity for Australian Pipeline Trust for the year ended 30 June 2016. The directors have voluntarily prepared and presented the Remuneration Report in accordance with the requirements of section 300A of the Corporations Act 2001. Our responsibility is to express an opinion on the Remuneration Report, based on our audit conducted in accordance with Australian Auditing Standards.
Opinion
In our opinion the Remuneration Report of Australian Pipeline Limited for the year ended 30 June 2016, has been prepared in accordance with the requirements of section 300A of the Corporations Act 2001.
DELOITTE TOUCHE TOHMATSU
A V GriffithsPartnerChartered AccountantsSydney, 24 August 2016
110
Independent Auditor’s Reportto the Unitholders of Australian Pipeline Trust
Report on the Financial Report
We have audited the accompanying financial report of Australian Pipeline Trust, which comprises the statement of financial position as at 30 June 2015, the statement of profit or loss and other comprehensive income, the statement of cash flows and the statement of changes in equity for the year ended on that date, notes comprising a summary of significant accounting policies and other explanatory information, and the directors’ declaration of the consolidated entity, comprising the Trust and the entities it controlled at the year’s end or from time to time during the financial year as set out on pages 36 to 76.
Directors’ Responsibility for the Financial Report
The directors of Australian Pipeline Limited are responsible for the preparation of the financial report that gives a true and fair view in accordance with Australian Accounting Standards and the Corporations Act 2001 and for such internal control as the directors determine is necessary to enable the preparation of the financial report that gives a true and fair view and is free from material misstatement, whether due to fraud or error. In Note 2, the directors also state, in accordance with Accounting Standard AASB 101 Presentation of Financial Statements , that the financial statements comply with International Financial Reporting Standards.
Auditor’s Responsibility
Our responsibility is to express an opinion on the financial report based on our audit. We conducted our audit in accordance with Australian Auditing Standards. Those standards require that we comply with relevant ethical requirements relating to audit engagements and plan and perform the audit to obtain reasonable assurance whether the financial report is free from material misstatement.
An audit involves performing procedures to obtain audit evidence about the amounts and disclosures in the financial report. The procedures selected depend on the auditor’s judgement, including the assessment of the risks of material misstatement of the financial report, whether due to fraud or error. In making those risk assessments, the auditor considers internal control, relevant to the entity’s preparation of the financial report that gives a true and fair view, in order to design audit procedures that are appropriate in the circumstances, but not for the purpose of expressing an opinion on the effectiveness of the entity’s internal control. An audit also includes evaluating the appropriateness of accounting policies used and the reasonableness of accounting estimates made by the directors, as well as evaluating the overall presentation of the financial report.
Liability limited by a scheme approved under Professional Standards LegislationMember of Deloitte Touche Tohmatsu Limited
Deloitte Touche TohmatsuABN 74 490 121 060
Grosvenor Place225 George StreetSydney NSW 2000PO Box N250 Grosvenor PlaceSydney NSW 1220 Australia
DX: 10307SSETel: +61 (0) 2 9322 7000Fax: +61 (0) 2 9322 7001www.deloitte.com.au
96 APA Group Annual Report 2016
For
per
sona
l use
onl
y

The Directors of Australian Pipeline Limited (“Responsible Entity”) submit their report and the annual financial report of APT Investment Trust (“APTIT”) and its controlled entities (together “Consolidated Entity”) for the financial year ended 30 June 2016. This report refers to the consolidated results of APTIT, one of the two stapled entities of APA Group, with the other stapled entity being Australian Pipeline Trust (together “APA”).
1. Directors
The names of the Directors of the Responsible Entity during the half year period and since the half year end are:Leonard Bleasel AM ChairmanMichael (Mick) McCormack Chief Executive Officer and Managing DirectorSteven (Steve) CraneJohn FletcherMichael Fraser Appointed effective 1 September 2015Debra (Debbie) Goodin Appointed effective 1 September 2015Russell Higgins AOPatricia McKenzieRobert Wright Retired 22 October 2015
The Company Secretary of the Responsible Entity during and since the current period is as follows:Nevenka Codevelle Appointed 22 October 2015Mark Knapman Retired 22 October 2015
2. Principal Activities
The Consolidated Entity operates as an investment and financing entity within the APA stapled group.
3. State of Affairs
No significant change in the state of affairs of the Consolidated Entity occurred during the year.
4. Subsequent Events
Except as disclosed elsewhere in this report, the Directors are unaware of any matter or circumstance that has occurred since the end of the year that has significantly affected or may significantly affect the operations of the Consolidated Entity, the results of those operations or the state of affairs of the Consolidated Entity in future years.
5. Review and Results of Operations
The Consolidated Entity reported net profit after tax of $85.1 million (FY2015: $46.3 million) for the year ended 30 June 2016 and total revenue of $85.5 million (FY2015: $46.4 million).
6. Distributions
Distributions paid to securityholders during the financial year were:
Final FY 2015 distribution Interim FY 2016 distribution paid 16 September 2015 paid 16 March 2016
Total Total Total Cents per distribution distribution distribution security $000 $000 $000
APTIT profit distribution 2.38 26,488 3.88 43,290APTIT capital distribution – – – –
Total 2.38 26,488 3.88 43,290
On 24 August 2016, the Directors declared a final distribution for APTIT for the financial year of 4.38 cents per security which is payable on 16 September 2016 and will comprise the following components: Final FY 2016 distribution payable 16 September 2016
Total Cents per distribution security $000
APTIT profit distribution 3.75 41,811APTIT capital distribution 0.63 6,976
Total 4.38 48,787
Distribution information is presented on an accounting classification basis. The APA Group Annual Tax Statement and Annual Tax Return Guide (to be released in September 2016) will provide the classification of distribution components for the purposes of preparation of securityholder income tax returns.
directors’ report. APT INVESTMENT TRUST AND ITS CONTROLLED ENTITIES
APT Investment Trust and its Controlled Entities (ARSN 115 585 441)Directors’ Report for the year ended 30 June 2016
97APA Group Annual Report 2016
For
per
sona
l use
onl
y

directors’ report. continued.APT INVESTMENT TRUST AND ITS CONTROLLED ENTITIES
7. Directors
7.1 Information on Directors and Company SecretarySee pages 6 to 7 for information relating to qualifications and experience on Directors and the Company Secretary.
7.2 Directorships of other listed companiesDirectorships of other listed companies held by Directors at any time in the three years immediately before the end of the financial year are as follows:
Name Company Period of directorship
Leonard Bleasel AM – –
Michael McCormack Envestra Limited July 2007 to September 2014
Steven Crane nib holdings limited Since September 2010 Transfield Services Limited February 2008 to February 2015 Bank of Queensland Limited December 2008 to January 2015
John Fletcher – –
Michael Fraser Aurizon Holdings Limited Since February 2016 AGL Energy Limited October 2007 to February 2015
Debra Goodin Senex Energy Limited Since May 2014 oOh!media Limited Since November 2014
Russell Higgins AO Telstra Corporation Limited Since September 2009 Argo Investments Limited Since September 2011 Leighton Holdings Limited June 2013 to May 2014
Patricia McKenzie – –
7.3 Directors’ meetingsDuring the financial year, 14 Board meetings, five People and Remuneration Committee meetings, four Audit and Risk Management Committee meetings, four Health Safety and Environment Committee meetings and two Nomination Committee meetings were held. The following table sets out the number of meetings attended by each Director while they were a Director or a committee member: People and Audit and Risk Health Safety Remuneration Management and Environment Nomination Board Committee Committee Committee Committee
Directors A B A B A B A B A B
Leonard Bleasel AM 1 14 14 – – – – – – 2 2Michael McCormack 14 14 – – – – – – – –Steven Crane 14 13 5 5 4 4 – – 2 2John Fletcher 14 13 5 5 4 4 – – 2 2Michael Fraser 2 12 12 3 3 – – 3 3 2 2Debra Goodin 3 12 12 – – 3 3 3 3 2 2Russell Higgins AO 14 14 – – 4 4 4 4 2 2Patricia McKenzie 14 14 5 5 – – 4 4 2 2Robert Wright 4 4 4 – – 1 1 2 2 – –
A: Number of meetings held during the time the Director held office or was a member of the committee during the financial year.B: Number of meetings attended.
1) The Chairman attended all committee meetings of People and Remuneration, Audit & Risk Management and Health, Safety & Environment ex officio.2) Michael Fraser was appointed as a Director effective 1 September 2015.3) Debra Goodin was appointed as a Director effective 1 September 2015.4) Robert Wright retired as a Director on 22 October 2015.
98 APA Group Annual Report 2016
For
per
sona
l use
onl
y

directors’ report. continued.APT INVESTMENT TRUST AND ITS CONTROLLED ENTITIES
7.4 Directors’ securityholdingsThe aggregate number of APA securities held directly, indirectly or beneficially by Directors or their Director related entities at 30 June 2016 is 1,322,074 (2015: 1,305,883).
The following table sets out Directors’ relevant interests in APA securities as at 30 June 2016:
Fully paid Fully paid securities as at Securities Securities securities as at Directors 1 July 2015 acquired disposed 30 June 2016
Leonard Bleasel AM 614,216 – – 614,216Michael McCormack 278,120 21,880 – 300,000Steven Crane 130,000 – – 130,000John Fletcher 88,250 – – 88,250Michael Fraser 1 – 25,000 – 25,000Debra Goodin 2 – 19,000 – 19,000Russell Higgins AO 122,719 – – 122,719Patricia McKenzie 19,986 2,903 – 22,889Robert Wright 3 52,592 – – –
1,305,883 68,783 – 1,322,074
1) Michael Fraser was appointed as a Director effective 1 September 2015.2) Debra Goodin was appointed as a Director effective 1 September 2015.3) Robert Wright retired as a Director on 22 October 2015. He held 52,592 fully paid securities on retirement.
The Directors hold no other rights or options over APA securities. There are no contracts to which a Director is a party or under which the Director is entitled to a benefit and that confer a right to call for or deliver APA securities.
8. Options Granted
In this report, the term “APA securities” refers to stapled securities each comprising a unit in Australian Pipeline Trust stapled to a unit in APT Investment Trust and traded on the Australian Securities Exchange (“ASX”) under the code “APA”.
No options over unissued APA securities were granted during or since the end of the financial year, no unissued APA securities were under option as at the date of this report, and no APA securities were issued during or since the end of the financial year as a result of the exercise of an option over unissued APA securities.
9. Indemnification of Officers and External Auditor
During the financial year, the Responsible Entity paid a premium in respect of a contract insuring the Directors and officers of the Responsible Entity and any APA Group entity against any liability incurred in performing those roles to the extent permitted by the Corporations Act 2001. The contract of insurance prohibits disclosure of the nature of the liability and the amount of the premium.
Australian Pipeline Limited, in its capacity as Responsible Entity of Australian Pipeline Trust and APT Investment Trust, indemnifies each Director and Company Secretary, and certain other executives, former executives and officers of the Responsible Entity or any APA Group entity under a range of deed polls and indemnity agreements which have been in place since 1 July 2000. The indemnity operates to the full extent allowed by law but only to the extent not covered by insurance, and is on terms the Board considers usual for arrangements of this type.
Under its constitution, Australian Pipeline Limited (in its personal capacity) indemnifies each person who is or has been a Director, Company Secretary or executive officer of that company.
The Responsible Entity has not otherwise, during or since the end of the financial year, indemnified or agreed to indemnify an officer or external auditor of the Responsible Entity or any APA Group entity against a liability incurred by such an officer or auditor.
10. Information Required for Registered Schemes
Fees paid to the Responsible Entity and its associates (including directors and secretaries of the Responsible Entity, related bodies corporate and directors and secretaries of related bodies corporate) out of APA scheme property during the year are disclosed in Note 16 to the financial statements.
Except as disclosed in this report, neither the Responsible Entity nor any of its associates holds any APTIT units.
The number of APTIT units issued during the year, and the number of APTIT units at the end of the year, are disclosed in Note 11 to the financial statements.
The value of the Consolidated Entity’s assets as at the end of the year is disclosed in the balance sheet in total assets, and the basis of valuation is included in the notes to the financial statements.
99APA Group Annual Report 2016
For
per
sona
l use
onl
y

directors’ report. continued.APT INVESTMENT TRUST AND ITS CONTROLLED ENTITIES
11. Auditor’s Independence Declaration
A copy of the independence declaration of the auditor, Deloitte Touche Tohmatsu (“Auditor”) as required under section 307C of the Corporations Act 2001 is included at page 116.
12. Rounding of Amounts
The Consolidated Entity is an entity of the kind referred to in ASIC Corporations Instrument 2016/191 and, in accordance with that Class Order, amounts in the Directors’ report and the financial report are rounded to the nearest thousand dollars, unless otherwise indicated.
13. Authorisation
The Directors’ report is signed in accordance with a resolution of the Directors of the Responsible Entity made pursuant to section 298(2) of the Corporations Act 2001.
On behalf of the Directors
Leonard Bleasel AM Steven CraneChairman Director
Sydney, 24 August 2016
100 APA Group Annual Report 2016
For
per
sona
l use
onl
y

2016 2015 Note $000 $000
Continuing operationsRevenue 3 85,483 46,359Expenses 3 (381) (11)
Profit before tax 85,102 46,348Income tax expense 4 – –
Profit for the year 85,102 46,348
Other comprehensive incomeItems that may be reclassified subsequently to profit or loss:(Loss)/gain on movement and disposal of available-for-sale investments (595) 989
Other comprehensive income for the year (595) 989
Total comprehensive income for the year 84,507 47,337
Profit Attributable to:Unitholders of the parent 85,102 46,348
85,102 46,348
Total comprehensive income attributable to:Unitholders of the parent 84,507 47,337
Earnings per unit 2016 2015
Basic and diluted (cents per unit) 5 7.6 4.7
The above consolidated statement of profit or loss and other comprehensive income should be read in conjunction with the accompanying notes.
consolidated statement of profit or loss and other comprehensive income.APT INVESTMENT TRUST AND ITS CONTROLLED ENTITIES FOR THE FINANCIAL YEAR ENDED 30 JUNE 2016
101APA Group Annual Report 2016
For
per
sona
l use
onl
y

2016 2015 Note $000 $000
Current assetsReceivables 7 704 701
Non-current assetsReceivables 7 9,249 9,951Other financial assets 9 1,036,944 1,021,566
Non-current assets 1,046,193 1,031,517
Total assets 1,046,897 1,032,218
Current liabilitiesTrade and other payables 8 11 49
Total liabilities 11 49
Net assets 1,046,886 1,032,169
EquityIssued capital 11 1,005,074 1,005,086Reserves – 595Retained earnings 41,812 26,488
Total equity 1,046,886 1,032,169
The above consolidated statement of financial position should be read in conjunction with the accompanying notes.
consolidated statement of financial position.APT INVESTMENT TRUST AND ITS CONTROLLED ENTITIES AS AT 30 JUNE 2016
102 APA Group Annual Report 2016
For
per
sona
l use
onl
y

Issued Retained capital Reserves earnings Total Note $000 $000 $000 $000
Balance at 1 July 2014 576,172 (394) 19,465 595,243Profit for the year – – 46,348 46,348Other comprehensive income for the year – 989 – 989
Total comprehensive income for the year – 989 46,348 47,337Issue of capital (net of issue costs) 11 428,914 – – 428,914Distributions to unitholders 6 – – (39,325) (39,325)
Balance at 30 June 2015 1,005,086 595 26,488 1,032,169
Balance at 1 July 2015 1,005,086 595 26,488 1,032,169Profit for the year – – 85,102 85,102Other comprehensive income for the year – (595) – (595)
Total comprehensive income for the year – (595) 85,102 84,507Issue of capital (net of issue costs) 11 (12) – – (12)Distributions to unitholders 6 – – (69,778) (69,778)
Balance at 30 June 2016 1,005,074 – 41,812 1,046,886
The above consolidated statement of changes in equity should be read in conjunction with the accompanying notes.
consolidated statement of changes in equity.APT INVESTMENT TRUST AND ITS CONTROLLED ENTITIES FOR THE FINANCIAL YEAR ENDED 30 JUNE 2016
103APA Group Annual Report 2016
For
per
sona
l use
onl
y
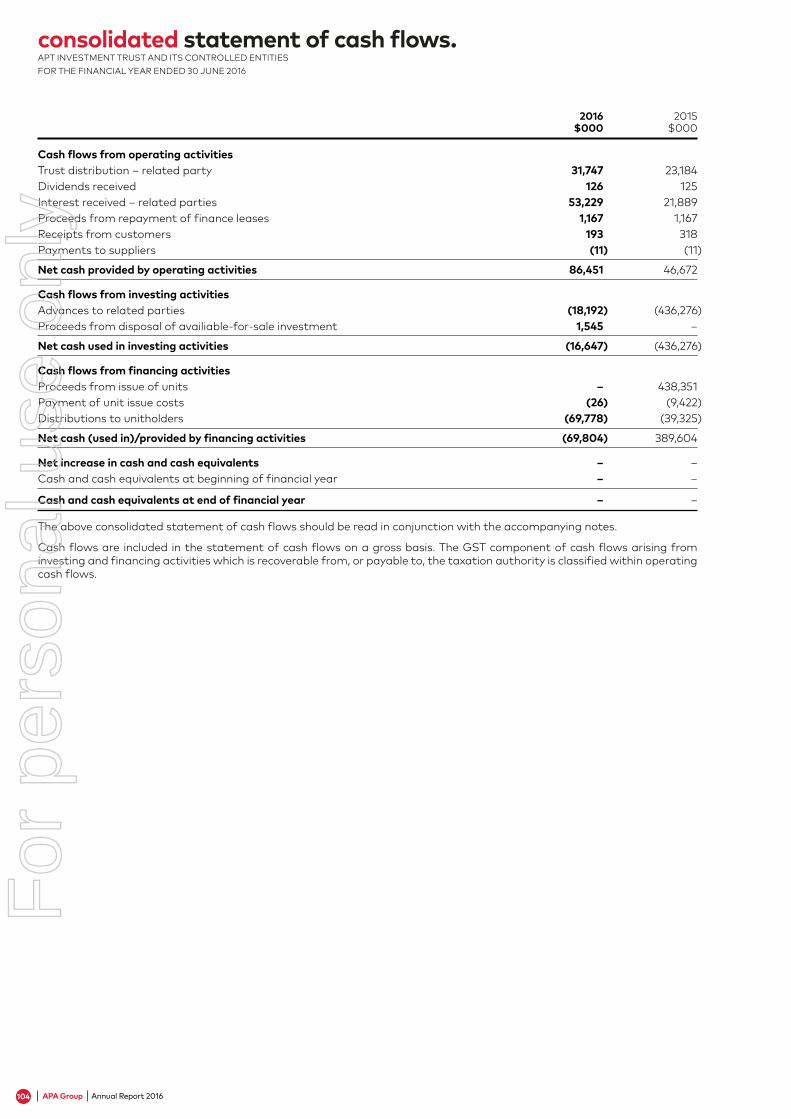
2016 2015 $000 $000
Cash flows from operating activitiesTrust distribution – related party 31,747 23,184Dividends received 126 125Interest received – related parties 53,229 21,889Proceeds from repayment of finance leases 1,167 1,167Receipts from customers 193 318Payments to suppliers (11) (11)
Net cash provided by operating activities 86,451 46,672
Cash flows from investing activitiesAdvances to related parties (18,192) (436,276)Proceeds from disposal of availiable-for-sale investment 1,545 –
Net cash used in investing activities (16,647) (436,276)
Cash flows from financing activitiesProceeds from issue of units – 438,351Payment of unit issue costs (26) (9,422)Distributions to unitholders (69,778) (39,325)
Net cash (used in)/provided by financing activities (69,804) 389,604
Net increase in cash and cash equivalents – –Cash and cash equivalents at beginning of financial year – –
Cash and cash equivalents at end of financial year – –
The above consolidated statement of cash flows should be read in conjunction with the accompanying notes.
Cash flows are included in the statement of cash flows on a gross basis. The GST component of cash flows arising from investing and financing activities which is recoverable from, or payable to, the taxation authority is classified within operating cash flows.
consolidated statement of cash flows.APT INVESTMENT TRUST AND ITS CONTROLLED ENTITIES FOR THE FINANCIAL YEAR ENDED 30 JUNE 2016
104 APA Group Annual Report 2016
For
per
sona
l use
onl
y

BASIS OF PREPARATION
1. About this reportThe content and format of the financial statements is streamlined to present the financial information in a meaningful manner to unitholders. Note disclosures are grouped into six sections being Basis of Preparation, Financial Performance, Operating Assets and Liabilities, Capital Management, Group Structure and Other. Each note sets out the accounting policies applied in producing the results along with any key judgements and estimates used. The purpose of the format is to provide readers with a clearer understanding of what are the key drivers of financial performance for the Consolidated Entity.
Basis of Preparation
1. About this report
2. General information
Financial Performance
3. Profit from operations
4. Income tax
5. Earnings per unit
6. Distributions
Operating Assets and Liabilities
7. Receivables
8. Payables
Capital Management
9. Other financial instruments
10. Financial risk management
11. Issued capital
Group Structure
12. Subsidiaries
Other
13. Commitments and contingencies
14. Director and senior executive remuneration
15. Remuneration of external auditor
16. Related party transactions
17. Parent entity information
18. Leases
19. Adoption of new and revised Accounting Standards
20. Events occurring after reporting date
2. General informationAPT Investment Trust (“APTIT” or “Trust”) is one of the two stapled trusts of APA Group, the other stapled trust being Australian Pipeline Trust (“APT”). Each of APT and APTIT are registered managed investment schemes regulated by the Corporations Act 2001. APTIT units are “stapled” to APT units on a one-to-one basis so that one APTIT unit and one APT unit form a single stapled security which trades on the Australian Securities Exchange under the code “APA”.
This financial report represents the consolidated financial statements of APTIT and its controlled entities (together the “Consolidated Entity”). For the purposes of preparing the consolidated financial report, the Consolidated Entity is a for-profit entity.
All intragroup transactions and balances have been eliminated on consolidation. Where necessary, adjustments are made to the assets, liabilities, and results of subsidiaries, joint arrangements and associates to bring their accounting policies into line with those used by the Consolidated Entity.
APTIT’s registered office and principal place of business is as follows:Level 19HSBC Building580 George StreetSYDNEY NSW 2000Tel: (02) 9693 0000
APTIT operates as an investment entity within APA Group.
The financial report for the year ended 30 June 2016 was authorised for issue in accordance with a resolution of the directors on 24 August 2016.
This general purpose financial report has been prepared in accordance with the requirements of the Corporations Act 2001, Australian Accounting Standards and other authoritative pronouncements of the Australian Accounting Standards Board (AIFRS), and also comply with International Financial Reporting Standards (IFRS) as issued by the International Accounting Standard Board.
The financial report has been prepared on the basis of historical cost, except for the revaluation of financial instruments. The financial report is presented in Australian dollars and all values are rounded to the nearest thousand dollars ($000) in accordance with ASIC Corporations Instrument 2016/191, unless otherwise stated.
notes to the consolidated financial statements. APT INVESTMENT TRUST AND ITS CONTROLLED ENTITIES FOR THE FINANCIAL YEAR ENDED 30 JUNE 2016
105APA Group Annual Report 2016
For
per
sona
l use
onl
y

notes to the consolidated financial statements. continued.APT INVESTMENT TRUST AND ITS CONTROLLED ENTITIES FOR THE FINANCIAL YEAR ENDED 30 JUNE 2016
BASIS OF PREPARATION
2. General information (continued)SubsidiariesSubsidiaries are entities controlled by APTIT. Control exists where APTIT has power over an entity, i.e. existing rights that give APTIT the current ability to direct the relevant activities of the entity (those that significantly affect the returns); exposure, or rights, to variable returns from its involvement with the entity; and the ability to use its power to affect those returns.
Segment informationThe Consolidated Entity has one reportable segment being energy infrastructure investment.
The Consolidated Entity is an investing entity within the Australian Pipeline Trust stapled group. As the Trust only operates in one segment, it has not disclosed segment information separately.
FINANCIAL PERFORMANCE
3. Profit from operationsProfit before income tax includes the following items of income and expense:
2016 2015 $000 $000
RevenueDistributionsTrust distribution – related party 31,747 23,184Other entities 95 125
31,842 23,309
Finance incomeInterest – related parties 53,684 22,157(Loss)/gain on financial asset held at fair value through profit or loss (756) 70Finance lease income – related party 497 529
53,425 22,756
Other revenueOther 216 294
Total revenue 85,483 46,359
ExpensesAudit fees (11) (11)Loss on disposal of available-for-sale investment (370) –
Total expenses (381) (11)
Revenue is recognised to the extent that it is probable that the economic benefits will flow to the Consolidated Entity and can be reliably measured. Amounts disclosed as revenue are net of duties and taxes paid. Revenue is recognised for the major business activities as follows:
– Interest revenue, which is recognised as it accrues and is determined using the effective interest method; – Distribution revenue, which is recognised when the right to receive a distribution has been established; – Dividend revenue, which is recognised when the right to receive a dividend has been established; and – Finance lease income, which is recognised when receivable.
4. Income taxIncome tax expense is not brought to account in respect of APTIT as, pursuant to Australian taxation laws, APTIT is not liable for income tax provided that its realised taxable income (including any assessable realised capital gains) is fully distributed to its unitholders each year.
106 APA Group Annual Report 2016
For
per
sona
l use
onl
y
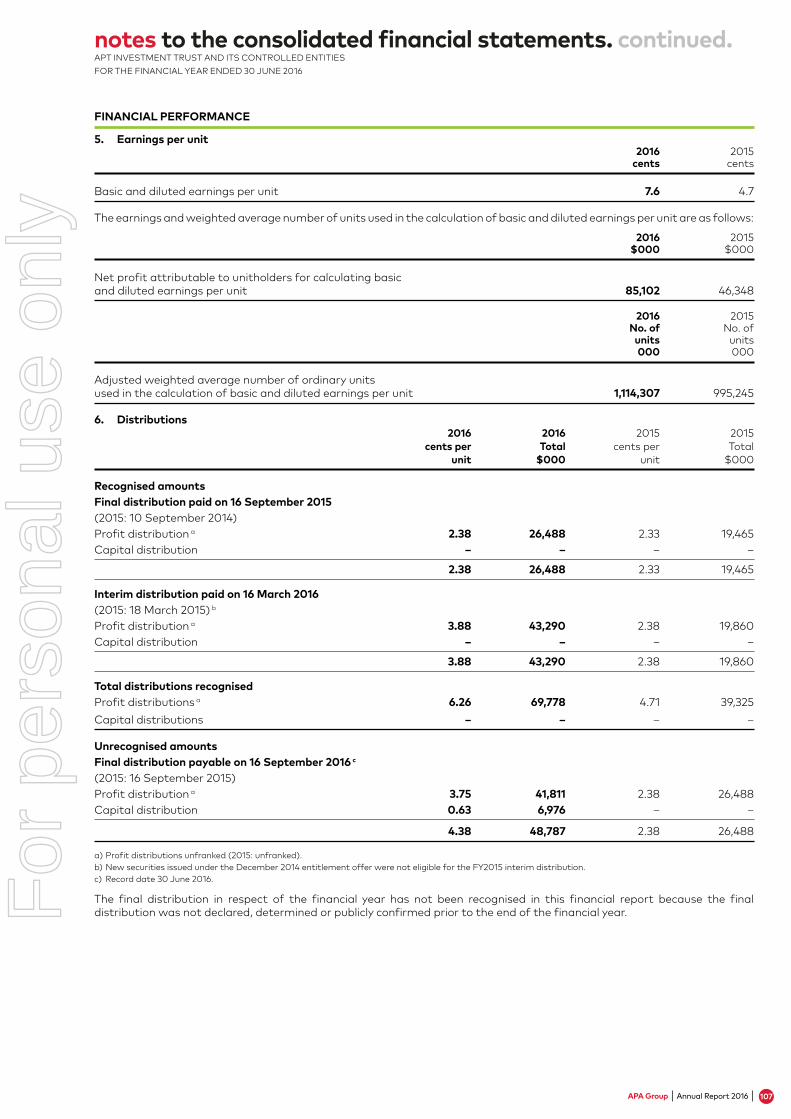
notes to the consolidated financial statements. continued.APT INVESTMENT TRUST AND ITS CONTROLLED ENTITIES FOR THE FINANCIAL YEAR ENDED 30 JUNE 2016
FINANCIAL PERFORMANCE
5. Earnings per unit 2016 2015 cents cents
Basic and diluted earnings per unit 7.6 4.7
The earnings and weighted average number of units used in the calculation of basic and diluted earnings per unit are as follows:
2016 2015 $000 $000
Net profit attributable to unitholders for calculating basic and diluted earnings per unit 85,102 46,348
2016 2015 No. of No. of units units 000 000
Adjusted weighted average number of ordinary units used in the calculation of basic and diluted earnings per unit 1,114,307 995,245
6. Distributions 2016 2016 2015 2015 cents per Total cents per Total unit $000 unit $000
Recognised amountsFinal distribution paid on 16 September 2015(2015: 10 September 2014)Profit distribution a 2.38 26,488 2.33 19,465Capital distribution – – – –
2.38 26,488 2.33 19,465
Interim distribution paid on 16 March 2016(2015: 18 March 2015) b
Profit distribution a 3.88 43,290 2.38 19,860Capital distribution – – – –
3.88 43,290 2.38 19,860
Total distributions recognisedProfit distributions a 6.26 69,778 4.71 39,325Capital distributions – – – –
Unrecognised amountsFinal distribution payable on 16 September 2016 c
(2015: 16 September 2015)Profit distribution a 3.75 41,811 2.38 26,488Capital distribution 0.63 6,976 – –
4.38 48,787 2.38 26,488
a) Profit distributions unfranked (2015: unfranked).b) New securities issued under the December 2014 entitlement offer were not eligible for the FY2015 interim distribution.c) Record date 30 June 2016.
The final distribution in respect of the financial year has not been recognised in this financial report because the final distribution was not declared, determined or publicly confirmed prior to the end of the financial year.
107APA Group Annual Report 2016
For
per
sona
l use
onl
y

notes to the consolidated financial statements. continued.APT INVESTMENT TRUST AND ITS CONTROLLED ENTITIES FOR THE FINANCIAL YEAR ENDED 30 JUNE 2016
OPERATING ASSETS AND LIABILITIES
7. Receivables 2016 2015 $000 $000
Other debtors – 31Finance lease receivable – related party (Note 18) 704 670
Current 704 701
Finance lease receivable – related party (Note 18) 9,249 9,951
Non-current 9,249 9,951
In determining the recoverability of a receivable, the Consolidated Entity considers any change in the credit quality of the receivable from the date the credit was initially granted up to the reporting date. The directors believe that there is no credit provision required.
None of the above receivables is past due.
8. PayablesOther payables 11 49
Trade and other payables are recognised when the Consolidated Entity becomes obliged to make future payments resulting from the purchase of goods and services. Trade and other payables are stated at amortised cost.
The net amount of GST recoverable from, or payable to, the taxation authority is included as part of receivables or payables. GST receivable or GST payable is only recognised once a tax invoice has been issued or received.
CAPITAL MANAGEMENT
9. Other financial instruments
Non-currentAdvance to related party 895,102 876,911Investments carried at cost:Investment in related party a 107,379 107,379
1,002,481 984,290Financial assets carried at fair value:Redeemable ordinary shares b 34,463 34,765Available-for-sale investments carried at fair value c – 2,511
1,036,944 1,021,566
a) The investment in related party reflects GasNet Australia Investments Trust’s (“GAIT”) investment in 100% of the B Class units in GasNet A Trust. The B Class units give GAIT preferred rights to the income and capital of GasNet A Trust, but hold no voting rights. The A Class unitholder may however suspend for a period or terminate all of the B Class unitholder rights to income and capital. As such, GAIT neither controls nor has a significant influence over GasNet A Trust. GasNet Australia Trust, a related party wholly owned by APA Group, owns 100% of the A Class units in GasNet A Trust and, accordingly, GasNet A Trust is included in the consolidation of the APA Group. The investment has not been measured at fair value as the units of GasNet A Trust are not available for trade on an active market and as such, the fair value of the units cannot be reliably determined. The Consolidated Entity does not intend to dispose of its interest in GasNet A Trust.
b) Financial assets carried at fair value relate to APA Group’s 19.9% investment in Energy Infrastructure Investments Pty Ltd where Australian Pipeline Limited (APL), as Responsible Entity for APTIT, acquired the redeemable ordinary shares (“Ros”). This investment is classified at fair value through profit or loss.
c) Available-for-sale investments at 30 June 2015 reflect a 6% unitholding in Ethane Pipeline Income Financing Trust. During the current financial year, the Consolidated Entity disposed of these units to APT as part of APT’s takeover of Ethane Pipeline Income Fund.
Financial assets are classified into the following specified categories: ‘available-for-sale’ financial assets, ‘loans and receivables’ and ‘fair value through profit or loss’.
The classification depends on the nature and purpose of the financial assets and is determined at the time of initial recognition.
Effective interest methodThe effective interest method is a method of calculating the amortised cost of a financial asset and of allocating interest income over the relevant period. The effective interest rate is the rate that exactly discounts estimated future cash receipts through the expected life of the financial asset, or where appropriate, a shorter period.
Fair value through profit or lossFinancial assets at fair value through profit or loss are stated at fair value, with any resultant gain or loss recognised in profit or loss. The net gain or loss recognised in profit or loss incorporates any dividend or interest earned on the financial asset.
Available-for-sale financial assetsFinancial assets classified as being available-for-sale are stated at fair value. Gains and losses arising from changes in fair value are recognised directly in the available-for-sale investment revaluation reserve.
The available-for-sale investment revaluation reserve arises on the revaluation of available-for-sale financial assets. When a revalued financial asset is sold, the portion of the reserve which relates to that financial asset is effectively realised, and is recognised in profit or loss. When a revalued financial asset is impaired, the portion of the reserve which relates to that financial asset is recognised in profit or loss.
108 APA Group Annual Report 2016
For
per
sona
l use
onl
y

notes to the consolidated financial statements. continued.APT INVESTMENT TRUST AND ITS CONTROLLED ENTITIES FOR THE FINANCIAL YEAR ENDED 30 JUNE 2016
CAPITAL MANAGEMENT
9. Other financial instruments (continued)Receivables and loansTrade receivables, loans, and other receivables that have fixed or determinable payments that are not quoted in an active market are classified as ‘loans and receivables’. Trade and other receivables are stated at their amortised cost less impairment.
Impairment of financial assetsFinancial assets are assessed for indicators of impairment at the end of each reporting date. Financial assets are impaired where, as a result of one or more events that occurred after initial recognition of the financial asset, there is objective evidence that the estimated future cash flows of the investment have been adversely impacted.
10. Financial risk managementThe Treasury department within Finance is responsible for the overall management of the Consolidated Entity’s capital raising activities, liquidity, lender relationships and engagement, debt portfolio management, interest rate and foreign exchange hedging, credit rating maintenance and third party indemnities (bank guarantees) within risk management parameters reviewed by the Board. The Audit and Risk Management Committee approves written principles for overall risk management, as well as policies covering specific areas such as liquidity and funding risk, foreign currency risk, interest rate risk, credit risk, contract and legal risk and operational risk. The Consolidated Entity’s Board of Directors ensures there is an appropriate Risk Management Policy for the management of treasury risk and compliance with the policy through monthly reporting from the Treasury department.
The Consolidated Entity’s activities generate financial instruments comprising of cash, receivables, payables and interest bearing liabilities which expose it to various risks as summarised below:a) Market risk including currency risk, interest rate risk and price risk;b) Credit risk; andc) Liquidity risk.
Treasury as a centralised function provides the Consolidated Entity with the benefits of efficient cash utilisation, control of funding and its associated costs, efficient and effective management of aggregated financial risk and concentration of financial expertise, at an acceptable cost, and minimises risks through the use of natural hedges and derivative instruments. The Consolidated Entity does not engage in speculative trading. All derivatives have been traded to hedge underlying or existing exposures and have adhered to the Board approved Treasury Risk Management Policy.
a) Market riskThe Consolidated Entity’s activities exposure is primarily to the financial risk of changes in interest rates. There has been no change to the Consolidated Entity’s exposure to market risk or the manner in which it manages and measures the risk from the previous period.
Interest rate sensitivity analysisThe sensitivity analysis below has been determined based on the exposure to interest rates on loans with related parties. A 100 basis points increase or decrease is used and represents management’s assessment of the greatest possible change in interest rates. At reporting date, if interest rates had been 100 basis points higher or lower and all other variables were constant, the Consolidated Entity’s net profit would increase by $5,963,000 or decrease by $5,883,000 (2015: increase by $3,335,000 or decrease by $1,090,000 respectively). This is mainly attributable to the Consolidated Entity’s exposure to interest rates on its variable rate inter-entity balances and the fair value movement on the ROS. The sensitivity has increased due to higher inter-entity balances resulting in interest income sensitivity which is greater than the ROS sensitivity.
b) Credit riskCredit risk refers to the risk that a counterparty will default on its contractual obligations resulting in financial loss to the Consolidated Entity. The Consolidated Entity has adopted the policy of only dealing with creditworthy counterparties and obtaining sufficient collateral or bank guarantees where appropriate as a means of mitigating any risk of loss. For financial investments or market risk hedging, the Consolidated Entity’s policy is to only transact with counter parties that have a credit rating of A- (Standard & Poors)/A3 (Moody’s) or higher unless specifically approved by the Board. Where a counterparty’s rating falls below this threshold following a transaction, no other transactions can be executed with that counterparty until the exposure is sufficiently reduced or their credit rating is upgraded above the Consolidated Entity’s minimum threshold. The Consolidated Entity’s exposure to financial instrument and deposit credit risk is closely monitored against counterparty credit limits imposed by the Treasury Risk Management Policy approved by the Board. These limits are regularly reviewed by the Board.
The carrying amount of financial assets recorded in the financial statements, net of any allowances, represents the Consolidated Entity’s maximum exposure to credit risk in relation to those assets.
c) Liquidity riskThe Consolidated Entity’s exposure to liquidity risk is limited to trade payables of $11,000 (2015: $49,000), all of which are due in less than 1 year (2015: less than 1 year).
d) Fair value of financial instrumentsThe Consolidated Entity has financial instruments that are carried at fair value in the statement of financial position. The best evidence of fair value is quoted prices in an active market. If the market for a financial instrument is not active, the Consolidated Entity determines fair value by using various valuation models. The objective of using a valuation technique is to establish the price that would be received to sell an asset or paid to transfer a liability between market participants. The chosen valuation models make maximum use of market inputs and rely as little as possible on entity specific inputs. The fair values of all positions include assumptions made as to recoverability based on the counterparty’s and the Consolidated Entity’s credit risk.
109APA Group Annual Report 2016
For
per
sona
l use
onl
y

notes to the consolidated financial statements. continued.APT INVESTMENT TRUST AND ITS CONTROLLED ENTITIES FOR THE FINANCIAL YEAR ENDED 30 JUNE 2016
CAPITAL MANAGEMENT
10. Financial risk management (continued)d) Fair value of financial instruments (continued)Fair value measurements recognised in the statement of financial positionThe following table provides an analysis of financial instruments that are measured subsequent to initial recognition at fair value, grouped into Levels 1 to 3 based on the degree to which the fair value is observable.
– Level 1 fair value measurements are those derived from quoted prices (unadjusted) in active markets for identical assets or liabilities.
– Level 2 fair value measurements are those derived from inputs other than quoted prices included within Level 1 that are observable for the asset or liability, either directly (i.e. as prices) or indirectly (i.e. derived from prices).
– Level 3 fair value measurements are those derived from valuation techniques that include inputs for the asset or liability that are not based on observable market data (unobservable inputs).
There have been no transfers between the levels during 2016 (2015: none). Transfers between levels of the fair value hierarchy occur at the end of the reporting period. Transfers between level 1 and level 2 are triggered when there are changes to the availability of quoted prices in active markets. Transfers into level 3 are triggered when the observable inputs become no longer observable, or vice versa for transfer out of level 3.
Fair value of the Consolidated Entity's financial assets and liabilities that are measured at fair value on a recurring basisThe fair values of financial assets and financial liabilities are measured at the end of each reporting period and determined as follows:Available-for-sale listed equity securities
– the fair values of available-for-sale financial assets and financial liabilities with standard terms and conditions and traded on active liquid markets are determined with reference to quoted market prices; and
– these instruments are classified in the fair value hierarchy at level 1.
Unlisted redeemable ordinary sharesThe financial statements include redeemable ordinary shares (“ROS”) held in an unlisted entity which are measured at fair value (Note 9). The fair market value of the ROS is derived from a binomial tree model, which includes some assumptions that are not able to be supported by observable market prices or rates. The model maps the different possible valuation paths of three distinct components:
– value of the debt component; – value of the ROS discretionary dividends; and – value of the option to convert to ordinary shares.
In determining the fair value, the following assumptions were used: – the risk adjusted rate for the ROS is estimated as the required rate of return based on projected cash flows to equity at issuance assuming the ROS price at issuance ($0.99) and the ordinary price at issuance ($0.01) are at their fair value;
– the risk free rate of return is 1.57% (2015: 2.13%) per annum and is based upon an interpolation of the three and five year Government bond rates at the valuation date;
– the ROS discretionary dividends are estimated based on an internal forecasted cash flow model; – the value of the option to convert is deemed to be zero (2015: zero). For conversion to occur, a number of conditions must be met. At the reporting date, it was deemed highly unlikely these conditions would occur based on an internal forecasting model; and
– these instruments are classified in the fair value hierarchy at level 3.
The fair value is impacted by the following unobservable inputs: – an increase in the discount rate will result in a decrease in the fair value; – an increase in discretionary dividends will result in a increase in the fair value; and – meeting conditions to trigger the conversion of the option would result in an increase in the fair value.
110 APA Group Annual Report 2016
For
per
sona
l use
onl
y

notes to the consolidated financial statements. continued.APT INVESTMENT TRUST AND ITS CONTROLLED ENTITIES FOR THE FINANCIAL YEAR ENDED 30 JUNE 2016
CAPITAL MANAGEMENT
10. Financial risk management (continued)Fair value hierarchy Level 1 Level 2 Level 3 Total 2016 $000 $000 $000 $000
Financial assets measured at fair valueAvailable-for-sale listed equity securities Ethane Pipeline Income Fund – – – –Unlisted redeemable ordinary shares Energy Infrastructure Investments – – 34,463 34,463
– – 34,463 34,463
2015Financial assets measured at fair valueAvailable-for-sale listed equity securities Ethane Pipeline Income Fund 2,511 – – 2,511Unlisted redeemable ordinary shares Energy Infrastructure Investments – – 34,765 34,765
2,511 – 34,765 37,276
Reconciliation of Level 3 fair value measurements of financial assets Fair value through Profit or Loss
2016 2015 $000 $000
Opening balance 34,765 34,427Total gains or losses:– in profit or loss: Interest – related parties 4,264 3,522– in profit or loss: (Loss)/gain on financial asset held at fair value through profit or loss (756) 70Distributions (3,810) (3,254)
Closing balance 34,463 34,765
11. Issued capital 2016 2015 $000 $000
Units1,114,307,369 units, fully paid (2015: 1,114,307,369 units, fully paid) a 1,005,074 1,005,086
2016 2015 No. of units 2016 No. of units 2015 000 $000 000 $000
MovementsBalance at beginning of financial year 1,114,307 1,005,086 835,751 576,172Issue of units under entitlement offer – – 278,556 438,351Capital distributions paid (Note 6) – – – –Issue cost of units – (12) – (9,437)
Balance at end of financial year 1,114,307 1,005,074 1,114,307 1,005,086
a) Fully paid units carry one vote per unit and carry the right to distributions.
Changes to the then Corporations Law abolished the authorised capital and par value concept in relation to issued capital from 1 July 1998. Therefore, the Trust does not have a limited amount of authorised capital and issued securities do not have a par value.
111APA Group Annual Report 2016
For
per
sona
l use
onl
y

notes to the consolidated financial statements. continued.APT INVESTMENT TRUST AND ITS CONTROLLED ENTITIES FOR THE FINANCIAL YEAR ENDED 30 JUNE 2016
GROUP STRUCTURE
12. Subsidiaries Ownership interest %
Name of entity Country of registration 2016 2015
Parent entityAPT Investment TrustControlled entityGasNet Australia Investments Trust Australia 100 100
OTHER
13. Commitments and contingenciesThe Consolidated Entity had no material contingent assets, liabilities and commitments as at 30 June 2016 and 30 June 2015.
14. Director and senior executive remunerationRemuneration of Directors
The aggregate remuneration of Directors of the Consolidated Entity is set out below:
2016 2015 $ $
Short-term employment benefits 1,548,424 1,268,500Post-employment benefits 217,041 132,105
Total remuneration: Non-executive Directors 1,765,465 1,400,605
Short-term employment benefits 3,544,861 3,109,447Post-employment benefits 35,000 35,000Cash settled security-based payments 1,579,531 1,564,212
Total remuneration: Executive Director a 5,159,392 4,708,659
Total Remuneration: Directors 6,924,857 6,109,264
Remuneration of senior executives a
The aggregate remuneration of senior executives of the Consolidated Entity is set out below:Short-term employment benefits 10,992,475 9,977,891Post-employment benefits 856,636 258,778Cash settled security-based payments 4,429,999 4,242,640Retention award – 430,666
Total remuneration: senior executives 16,279,110 14,909,975
a) The remuneration of the Chief Executive Officer and Managing Director, Michael McCormack, is also included in the remuneration disclosure for senior executives.
15. Remuneration of external auditorAmounts received or due and receivable by Deloitte Touche Tohmatsu for:
Auditing the financial report 5,800 5,700Compliance plan audit 5,500 5,400
11,300 11,100
16. Related party transactionsa) Equity interest in related partiesDetails of the percentage of ordinary securities held in subsidiaries are disclosed in Note 12.
b) Responsible Entity – Australian Pipeline LimitedThe Responsible Entity is wholly owned by APT Pipelines Limited (2015: 100% owned by APT Pipelines Limited).
c) Transactions with related parties within the Consolidated EntityDuring the financial year, the following transactions occurred between the Trust and its other related parties:
– loans advanced and payments received on long-term inter-entity loans; and – disposal of available-for-sale investment; and – payments of distributions.
All transactions between the entities that comprise the Consolidated Entity have been eliminated on consolidation.
Refer to Note 12 for details of the entities that comprise the Consolidated Entity.
112 APA Group Annual Report 2016
For
per
sona
l use
onl
y

notes to the consolidated financial statements. continued.APT INVESTMENT TRUST AND ITS CONTROLLED ENTITIES FOR THE FINANCIAL YEAR ENDED 30 JUNE 2016
OTHER
16. Related party transactions (continued)d) Transactions with other related partiesAPTIT and its controlled entities have a loan receivable balance with another entity in APA. This loan is repayable on agreement between the parties. Interest is recognised by applying the effective interest method, agreed between the parties at the end of each month and is determined by reference to market rates.
The following balances arising from transactions between APTIT and its other related parties are outstanding at reporting date: – current receivables totalling $704,000 are owing from a subsidiary of APT for amounts due under a finance lease arrangement (2015: $701,000);
– non-current receivables totalling $9,249,000 are owing from a subsidiary of APT for amounts due under a finance lease arrangement (2015: $9,951,000); and
– non-current receivables totalling $895,102,000 (2015: $876,911,000) are owing from a subsidiary of APT for amounts due under inter-entity loans.
Australian Pipeline LimitedManagement fees of $957,000 (2015: $820,000) were paid to the Responsible Entity as reimbursement of costs incurred on behalf of APTIT. No amounts were paid directly by APTIT to the Directors of the Responsible Entity.
Australian Pipeline TrustManagement fees of $957,000 (2015: $820,000) were reimbursed by APT.
17. Parent entity informationThe accounting policies of the parent entity, which have been applied in determining the financial information below, are the same as those applied in the consolidated financial statements.
2016 2015 $000 $000
Financial positionAssetsCurrent assets 704 701Non-current assets 1,046,193 1,031,517
Total assets 1,046,897 1,032,218
LiabilitiesCurrent liabilities 11 49
Total liabilities 11 49
Net assets 1,046,886 1,032,169
EquityIssued capital 1,005,074 1,005,086Retained earnings 41,812 26,488Reserves – 595
Total equity 1,046,886 1,032,169
Financial performanceProfit for the year 85,102 46,348Other comprehensive income (595) 989
Total comprehensive income 84,507 47,337
Guarantees entered into by the parent entity in relation to the debts of its subsidiariesNo guarantees have been entered into by the parent entity in relation to the debts of its subsidiaries.
Contingent liabilities of the parent entityNo contingent liabilities have been identified in relation to the parent entity.
113APA Group Annual Report 2016
For
per
sona
l use
onl
y

notes to the consolidated financial statements. continued.APT INVESTMENT TRUST AND ITS CONTROLLED ENTITIES FOR THE FINANCIAL YEAR ENDED 30 JUNE 2016
OTHER
18. Leases 2016 2015 $000 $000
Finance leasesLeasing arrangements – receivablesFinance lease receivables relate to the lease of a pipeline lateral.There are no contingent rental payments due.
Finance lease receivablesNot longer than 1 year 1,167 1,167Longer than 1 year and not longer than 5 years 4,669 4,669Longer than 5 years 7,004 8,171
Minimum future lease payments receivable a 12,840 14,007
Gross finance lease receivables 12,840 14,007Less: unearned finance lease receivables (2,887) (3,386)
Present value of lease receivables 9,953 10,621
Included in the financial statements as part of:Current receivables (Note 7) 704 670Non-current receivables (Note 7) 9,249 9,951
9,953 10,621
a) Minimum future lease payments receivable include the aggregate of all lease payments receivable and any guaranteed residual.
Leases are classified as finance leases when the terms of the lease transfer substantially all of the risks and rewards incidental to ownership of the leased asset to the lessee. All other leases are classified as operating leases.
Consolidated Entity as lessorAmounts due from a lessee under a finance lease are recorded as receivables. Finance lease receivables are initially recognised at the amount equal to the present value of the minimum lease payments receivable plus the present value of any unguaranteed residual value expected to accrue at the end of the lease term. Finance lease receipts are allocated between interest revenue and reduction of the lease receivable over the term of the lease in order to reflect a constant periodic rate of return on the net investment outstanding in respect of the lease.
19. Adoption of new and revised Accounting StandardsStandards and Interpretations affecting amounts reported in the current period (and/or prior periods).
There have not been any new or revised Standards and Interpretations issued by the AASB that are relevant to the consolidated entity’s operations that would be effective for the current reporting period.
Standards and Interpretations issued not yet adoptedAt the date of authorisation of the financial statements, the Standards and Interpretations listed below were on issue but not yet effective.
Effective for annual reporting Expected to be initially applied Standard/Interpretation periods beginning on or after in the financial year ending
– AASB 9 ‘Financial Instruments’, and the relevant amending standards 1 January 2018 30 June 2019– AASB 15 ‘Revenue from Contracts with Customers’, 1 January 2018 30 June 2019
and AASB 2015-8 ‘Amendments to Australian Accounting Standards – Effective date of AASB 15’
– AASB 16 ‘Leases’ 1 January 2019 30 June 2020
The potential impacts of the initial application of the Standards above are yet to be determined.
20. Events occurring after reporting dateOn 24 August 2016, the Directors declared a final distribution for the 2016 financial year of 4.38 cents per unit ($48.8 million). The distribution represents a 3.75 cents per security unfranked profit distribution and 0.63 cents per security capital distribution. The distribution will be paid on 16 September 2016.
Other than the events disclosed above, there have not been any events or transactions that have occurred subsequent to year end that would require adjustment to or disclosure in the accounts.
114 APA Group Annual Report 2016
For
per
sona
l use
onl
y

For the financial year ended 30 June 2016
The Directors declare that:a) in the Directors’ opinion, there are reasonable grounds to believe that APT Investment Trust will be able to pay its debts
as and when they become due and payable;b) in the Directors’ opinion, the attached financial statements and notes thereto are in accordance with the Corporations
Act 2001, including compliance with Accounting Standards and giving a true and fair view of the financial position and performance of the Consolidated Entity;
c) in the Directors’ opinion, the financial statements and notes thereto are in accordance with International Financial Reporting Standards issued by the International Accounting Standards Board; and
d) the Directors have been given the declarations by the Managing Director and Chief Financial Officer required by section 295A of the Corporations Act 2001.
Signed in accordance with a resolution of the Directors of the Responsible Entity made pursuant to section 295(5) of the Corporations Act 2001.
On behalf of the Directors
Leonard Bleasel AM Steven CraneChairman Director
Sydney, 24 August 2016
declaration by directors. APT INVESTMENT TRUST AND ITS CONTROLLED ENTITIES
115APA Group Annual Report 2016
For
per
sona
l use
onl
y

Liability limited by a scheme approved under Professional Standards LegislationMember of Deloitte Touche Tohmatsu Limited
24 August 2016
The DirectorsAustralian Pipeline Limited as responsible entity forAPT Investment TrustHSBC BuildingLevel 19, 580 George StreetSydney NSW 2000
Dear Directors
Auditor’s Independence Declaration to Australian Pipeline Limited asresponsible entity for APT Investment Trust
In accordance with section 307C of the Corporations Act 2001, I am pleased to providethe following declaration of independence to the directors of Australian Pipeline Limitedas responsible entity for APT Investment Trust.
As lead audit partner for the audit of the financial statements of APT Investment Trustfor the financial year ended 30 June 2016, I declare that to the best of my knowledgeand belief, there have been no contraventions of:
(i) the auditor independence requirements of the Corporations Act 2001 inrelation to the audit; and
(ii) any applicable code of professional conduct in relation to the audit.
Yours sincerely
DELOITTE TOUCHE TOHMATSU
A V GriffithsPartnerChartered AccountantsSydney, 24 August 2016
Deloitte Touche TohmatsuABN 74 490 121 060
Grosvenor Place225 George StreetSydney NSW 2000PO Box N250 Grosvenor PlaceSydney NSW 1220 Australia
DX: 10307SSETel: +61 (0) 2 9322 7000Fax: +61 (0) 2 9322 7001www.deloitte.com.au
auditor’s independence declaration.APT INVESTMENT TRUST AND ITS CONTROLLED ENTITIESTO AUSTRALIAN PIPELINE LIMITED AS RESPONSIBLE ENTITY FOR APT INVESTMENT TRUST
110
Independent Auditor’s Reportto the Unitholders of Australian Pipeline Trust
Report on the Financial Report
We have audited the accompanying financial report of Australian Pipeline Trust, which comprises the statement of financial position as at 30 June 2015, the statement of profit or loss and other comprehensive income, the statement of cash flows and the statement of changes in equity for the year ended on that date, notes comprising a summary of significant accounting policies and other explanatory information, and the directors’ declaration of the consolidated entity, comprising the Trust and the entities it controlled at the year’s end or from time to time during the financial year as set out on pages 36 to 76.
Directors’ Responsibility for the Financial Report
The directors of Australian Pipeline Limited are responsible for the preparation of the financial report that gives a true and fair view in accordance with Australian Accounting Standards and the Corporations Act 2001 and for such internal control as the directors determine is necessary to enable the preparation of the financial report that gives a true and fair view and is free from material misstatement, whether due to fraud or error. In Note 2, the directors also state, in accordance with Accounting Standard AASB 101 Presentation of Financial Statements , that the financial statements comply with International Financial Reporting Standards.
Auditor’s Responsibility
Our responsibility is to express an opinion on the financial report based on our audit. We conducted our audit in accordance with Australian Auditing Standards. Those standards require that we comply with relevant ethical requirements relating to audit engagements and plan and perform the audit to obtain reasonable assurance whether the financial report is free from material misstatement.
An audit involves performing procedures to obtain audit evidence about the amounts and disclosures in the financial report. The procedures selected depend on the auditor’s judgement, including the assessment of the risks of material misstatement of the financial report, whether due to fraud or error. In making those risk assessments, the auditor considers internal control, relevant to the entity’s preparation of the financial report that gives a true and fair view, in order to design audit procedures that are appropriate in the circumstances, but not for the purpose of expressing an opinion on the effectiveness of the entity’s internal control. An audit also includes evaluating the appropriateness of accounting policies used and the reasonableness of accounting estimates made by the directors, as well as evaluating the overall presentation of the financial report.
Liability limited by a scheme approved under Professional Standards LegislationMember of Deloitte Touche Tohmatsu Limited
Deloitte Touche TohmatsuABN 74 490 121 060
Grosvenor Place225 George StreetSydney NSW 2000PO Box N250 Grosvenor PlaceSydney NSW 1220 Australia
DX: 10307SSETel: +61 (0) 2 9322 7000Fax: +61 (0) 2 9322 7001www.deloitte.com.au
116 APA Group Annual Report 2016
For
per
sona
l use
onl
y

Independent Auditor’s Reportto the Unitholders of APT Investment Trust
We have audited the accompanying financial report of APT Investment Trust, which comprises the statement of financial position as at 30 June 2016, the statement of profit or loss and other comprehensive income, the statement of cash flows and the statement of changes in equity for the year ended on that date, notes comprising a summary of significant accounting policies and other explanatory information, and the directors’ declaration of the consolidated entity, comprising the Trust and the entities it controlled at the year’s end or from time to time during the financial year as set out on pages 101 to 115.
Directors’ Responsibility for the Financial Report
The directors of Australian Pipeline Limited are responsible for the preparation of the financial report that gives a true and fair view in accordance with Australian Accounting Standards and the Corporations Act 2001 and for such internal control as the directors determine is necessary to enable the preparation of the financial report that gives a true and fair view and is free from material misstatement, whether due to fraud or error. In Note 2, the directors also state, in accordance with Accounting Standard AASB 101 Presentation of Financial Statements, that the financial statements comply with International Financial Reporting Standards.
Auditor’s Responsibility
Our responsibility is to express an opinion on the financial report based on our audit. We conducted our audit in accordance with Australian Auditing Standards. Those standards require that we comply with relevant ethical requirements relating to audit engagements and plan and perform the audit to obtain reasonable assurance whether the financial report is free from material misstatement.
An audit involves performing procedures to obtain audit evidence about the amounts and disclosures in the financial report. The procedures selected depend on the auditor’s judgement, including the assessment of the risks of material misstatement of the financial report, whether due to fraud or error. In making those risk assessments, the auditor considers internal control, relevant to the entity’s preparation of the financial report that gives a true and fair view, in order to design audit procedures that are appropriate in the circumstances, but not for the purpose of expressing an opinion on the effectiveness of the entity’s internal control. An audit also includes evaluating the appropriateness of accounting policies used and the reasonableness of accounting estimates made by the directors, as well as evaluating the overall presentation of the financial report.
We believe that the audit evidence we have obtained is sufficient and appropriate to provide a basis for our audit opinion.
Liability limited by a scheme approved under Professional Standards LegislationMember of Deloitte Touche Tohmatsu Limited
Deloitte Touche TohmatsuABN 74 490 121 060
Grosvenor Place225 George StreetSydney NSW 2000PO Box N250 Grosvenor PlaceSydney NSW 1220 Australia
DX: 10307SSETel: +61 (0) 2 9322 7000Fax: +61 (0) 2 9322 7001www.deloitte.com.au
independent auditor’s report.APT INVESTMENT TRUST AND ITS CONTROLLED ENTITIESTO AUSTRALIAN PIPELINE LIMITED AS RESPONSIBLE ENTITY FOR APT INVESTMENT TRUST
110
Independent Auditor’s Reportto the Unitholders of Australian Pipeline Trust
Report on the Financial Report
We have audited the accompanying financial report of Australian Pipeline Trust, which comprises the statement of financial position as at 30 June 2015, the statement of profit or loss and other comprehensive income, the statement of cash flows and the statement of changes in equity for the year ended on that date, notes comprising a summary of significant accounting policies and other explanatory information, and the directors’ declaration of the consolidated entity, comprising the Trust and the entities it controlled at the year’s end or from time to time during the financial year as set out on pages 36 to 76.
Directors’ Responsibility for the Financial Report
The directors of Australian Pipeline Limited are responsible for the preparation of the financial report that gives a true and fair view in accordance with Australian Accounting Standards and the Corporations Act 2001 and for such internal control as the directors determine is necessary to enable the preparation of the financial report that gives a true and fair view and is free from material misstatement, whether due to fraud or error. In Note 2, the directors also state, in accordance with Accounting Standard AASB 101 Presentation of Financial Statements , that the financial statements comply with International Financial Reporting Standards.
Auditor’s Responsibility
Our responsibility is to express an opinion on the financial report based on our audit. We conducted our audit in accordance with Australian Auditing Standards. Those standards require that we comply with relevant ethical requirements relating to audit engagements and plan and perform the audit to obtain reasonable assurance whether the financial report is free from material misstatement.
An audit involves performing procedures to obtain audit evidence about the amounts and disclosures in the financial report. The procedures selected depend on the auditor’s judgement, including the assessment of the risks of material misstatement of the financial report, whether due to fraud or error. In making those risk assessments, the auditor considers internal control, relevant to the entity’s preparation of the financial report that gives a true and fair view, in order to design audit procedures that are appropriate in the circumstances, but not for the purpose of expressing an opinion on the effectiveness of the entity’s internal control. An audit also includes evaluating the appropriateness of accounting policies used and the reasonableness of accounting estimates made by the directors, as well as evaluating the overall presentation of the financial report.
Liability limited by a scheme approved under Professional Standards LegislationMember of Deloitte Touche Tohmatsu Limited
Deloitte Touche TohmatsuABN 74 490 121 060
Grosvenor Place225 George StreetSydney NSW 2000PO Box N250 Grosvenor PlaceSydney NSW 1220 Australia
DX: 10307SSETel: +61 (0) 2 9322 7000Fax: +61 (0) 2 9322 7001www.deloitte.com.au
117APA Group Annual Report 2016
For
per
sona
l use
onl
y
Auditor’s Independence Declaration
In conducting our audit, we have complied with the independence requirements of theCorporations Act 2001. We confirm that the independence declaration required by theCorporations Act 2001, which has been given to the directors of Australian PipelineLimited, would be in the same terms if given to the directors as at the time of thisauditor’s report.
Opinion
In our opinion:
(a) the financial report of APT Investment Trust is in accordance with the CorporationsAct 2001, including:
(i) giving a true and fair view of the consolidated entity’s financial position as at 30June 2016 and of its performance for the year ended on that date; and
(ii) complying with Australian Accounting Standards and the Corporations Regulations2001; and
(b) the financial statements also comply with International Financial Reporting Standardsas disclosed in Note 2.
DELOITTE TOUCHE TOHMATSU
A V GriffithsPartnerChartered AccountantsSydney, 24 August 2016
independent auditor’s report. continued.APT INVESTMENT TRUST AND ITS CONTROLLED ENTITIESTO AUSTRALIAN PIPELINE LIMITED AS RESPONSIBLE ENTITY FOR APT INVESTMENT TRUST
110
Independent Auditor’s Reportto the Unitholders of Australian Pipeline Trust
Report on the Financial Report
We have audited the accompanying financial report of Australian Pipeline Trust, which comprises the statement of financial position as at 30 June 2015, the statement of profit or loss and other comprehensive income, the statement of cash flows and the statement of changes in equity for the year ended on that date, notes comprising a summary of significant accounting policies and other explanatory information, and the directors’ declaration of the consolidated entity, comprising the Trust and the entities it controlled at the year’s end or from time to time during the financial year as set out on pages 36 to 76.
Directors’ Responsibility for the Financial Report
The directors of Australian Pipeline Limited are responsible for the preparation of the financial report that gives a true and fair view in accordance with Australian Accounting Standards and the Corporations Act 2001 and for such internal control as the directors determine is necessary to enable the preparation of the financial report that gives a true and fair view and is free from material misstatement, whether due to fraud or error. In Note 2, the directors also state, in accordance with Accounting Standard AASB 101 Presentation of Financial Statements , that the financial statements comply with International Financial Reporting Standards.
Auditor’s Responsibility
Our responsibility is to express an opinion on the financial report based on our audit. We conducted our audit in accordance with Australian Auditing Standards. Those standards require that we comply with relevant ethical requirements relating to audit engagements and plan and perform the audit to obtain reasonable assurance whether the financial report is free from material misstatement.
An audit involves performing procedures to obtain audit evidence about the amounts and disclosures in the financial report. The procedures selected depend on the auditor’s judgement, including the assessment of the risks of material misstatement of the financial report, whether due to fraud or error. In making those risk assessments, the auditor considers internal control, relevant to the entity’s preparation of the financial report that gives a true and fair view, in order to design audit procedures that are appropriate in the circumstances, but not for the purpose of expressing an opinion on the effectiveness of the entity’s internal control. An audit also includes evaluating the appropriateness of accounting policies used and the reasonableness of accounting estimates made by the directors, as well as evaluating the overall presentation of the financial report.
Liability limited by a scheme approved under Professional Standards LegislationMember of Deloitte Touche Tohmatsu Limited
Deloitte Touche TohmatsuABN 74 490 121 060
Grosvenor Place225 George StreetSydney NSW 2000PO Box N250 Grosvenor PlaceSydney NSW 1220 Australia
DX: 10307SSETel: +61 (0) 2 9322 7000Fax: +61 (0) 2 9322 7001www.deloitte.com.au
118 APA Group Annual Report 2016
For
per
sona
l use
onl
y

Additional information required by the Listing Rules of the Australian Securities Exchange Limited and not provided elsewhere in this report (the information is applicable as at 19 August 2016).
Twenty largest holders No. of securities %
HSBC Custody Nominees 229,842,343 20.63BNP Paribas Nominees Pty Ltd 173,090,132 15.53J P Morgan Nominees 91,358,753 8.20National Nominees Limited 71,346,982 6.40Citicorp Nominees Pty Limited 64,068,017 5.75Custodial Services Limited 21,809,218 1.96AMP Life Limited 14,156,710 1.27RBC Dexia Investor Services 12,340,695 1.11Argo Investments Limited 10,277,940 0.92Australian Foundation Investment Company Limited 6,130,000 0.55BKI Investment Company Limited 3,659,452 0.33Sandhurst Trustees Limited 2,893,705 0.26Bond Street Custodians Limited 2,761,577 0.25Investment Custodial Services Limited 2,555,996 0.23Milton Corporation Limited 2,023,727 0.18Navigator Australia Limited 1,818,941 0.16IOOF Investment Management Limited 1,439,405 0.13Invia Custodian Pty Limited 1,412,735 0.13Share Direct Nominees Pty Ltd 1,348,763 0.12Avanteos Investments Limited 1,348,413 0.12
Total for Top 20 715,683,504 64.23
Distribution of holdersRanges No. of holders % No. of securities %
100,001 and Over 181 0.22 748,851,575 67.2010,001 to 100,000 9,395 11.59 188,252,526 16.905,001 to 10,000 11,607 14.31 82,883,773 7.441,001 to 5,000 31,953 39.40 83,017,363 7.451 to 1,000 27,955 34.48 11,302,132 1.01
Total 81,091 100.00 1,114,307,369 100.00
2,005 holders hold less than a marketable parcel of securities (market value less than $500 or 56 securities based on a market price on 19 August 2016 of $9.08).
Substantial holdersBy notice dated 4 April 2016, BNP Paribas Nominees Pty Limited as Custodian for UniSuper Limited advised that it had an interest in 145,859,826 stapled securities.
Voting rightsOn a show hands, each holder has one vote.
On a poll, each holder has one vote for each dollar of the value of the total interests they have in the scheme.
On-market buy-backThere is no current on-market buy-back.
additional information.
119APA Group Annual Report 2016
For
per
sona
l use
onl
y

Financial Performance (Statutory) 2016 2015 2014 20131 2012
Revenue $m 2,094.3 1,553.6 1,396.0 1,272.3 1,060.7Revenue excluding pass-through 2 $m 1,656.0 1,119.2 992.5 919.5 758.0EBITDA $m 1,330.5 1,269.5 747.3 763.6 525.8Depreciation and amortisation expense $m (520.9) (208.2) (156.2) (130.5) (110.4)EBIT $m 809.7 1,061.3 591.1 633.2 415.4Interest expense $m (507.7) (324.2) (325.1) (290.9) (234.3)Tax (expense) / benefit $m (122.5) (177.2) 77.7 (49.9) (50.4)Profit after tax including significant items $m 179.5 559.9 343.7 295.1 130.7Significant items – after income tax $m – 356.0 144.1 120.0 (9.7)Profit after tax excluding significant items $m 179.5 203.9 199.6 172.3 140.3
Financial PositionTotal assets $m 14,842.7 14,652.9 7,972.5 7,698.9 5,496.1Total drawn debt 3 $m 9,037.3 8,642.8 4,789.4 4,412.0 3,223.6Total equity $m 4,029.1 4,382.7 2,496.5 2,513.9 1,614.0
Operating Cash FlowOperating cash flow 4 $m 862.4 562.2 431.5 374.4 335.6
Key Financial RatiosEarnings per security 5 cents 16.1 56.3 39.7 38.2 20.4Operating cash flow per security 5 cents 77.4 56.5 49.8 48.5 52.5Distribution per security cents 41.5 38.0 36.3 35.5 35.0Gearing (net debt to net debt plus equity) % 66.4 63.4 64.2 62.8 65.0Interest cover ratio times 2.6 2.6 2.3 2.3 2.5Weighted average number of securities 5 m 1,114.3 995.2 866.0 772.3 639.7
EBITDA by Segment (Excluding Significant Items)EBITDA (Continuing businesses)Energy Infrastructure East Coast Grid: Queensland $m 855.8 340.1 234.5 180.7 91.0 New South Wales $m 121.7 120.8 115.6 120.2 122.8 Victoria $m 120.6 130.2 127.6 136.9 138.3 South Australia $m 2.5 1.9 2.4 2.4 2.1 Northern Territory $m 17.5 18.0 15.2 13.5 10.6 Western Australia $m 217.6 212.6 189.0 149.4 133.9Asset Management $m 53.9 49.5 67.6 51.6 35.6Energy Investments $m 27.80 21.8 18.0 15.6 9.6Corporate costs $m (86.7) (73.6) (72.5) (64.5) (63.6)Divested businesses 6 $m – 1.0 50.1 56.2 55.2
Notes:1. The balances for June 2013 have been restated for the effect of applying AASB: 119 ‘Employee Benefits’.2. Pass-through revenue is revenue on which no margin is earned. Pass-through revenue arises in the asset management operations in respect of costs incurred and
passed on to Australian Gas Networks Limited (“AGN”) and GDI in respect of the operation of the AGN and GDI assets respectively.3. APA’s liability to repay debt at relevant due dates of the drawn facilities. This amount represents current and non-current borrowings as per balance sheet and
is adjusted for deferred borrowing costs, the effect of unwinding of discount, unrealised foreign exchange differences reported in equity and deducting other financial liabilities that are reported as part of borrowings in the balance sheet.
4. Operating cash flow = net cash from operations after interest and tax payments.5. Between 23 December 2014 and 28 January 2015, APA issued a total of 278,556,562 new ordinary securities resulting in total securities on issue as at 30 June 2015
of 1,114,307,369. The issue was offered at $6.60 per security, a discount to APA’s closing market price of $7.67 per security on 9 December 2014, the last trading day before the record date of the entitlement offer of 15 December 2014. The weighted average number of securities for FY2015 and FY2014 have been adjusted in accordance with the accounting principles of AASB 133: ‘Earnings per Share’, for the discounted rights issue.
6. Australian Gas Networks Limited sold in August 2014, Moomba Adelaide Pipeline System sold in FY2013, APA Gas Network Queensland (Allgas) was sold into GDI (EII) Pty Ltd in FY2012, with APA retaining a 20 per cent interest in GDI (EII) Pty Ltd and operates the assets under a long term asset management agreement.
five year summary.
120 APA Group Annual Report 2016
For
per
sona
l use
onl
y
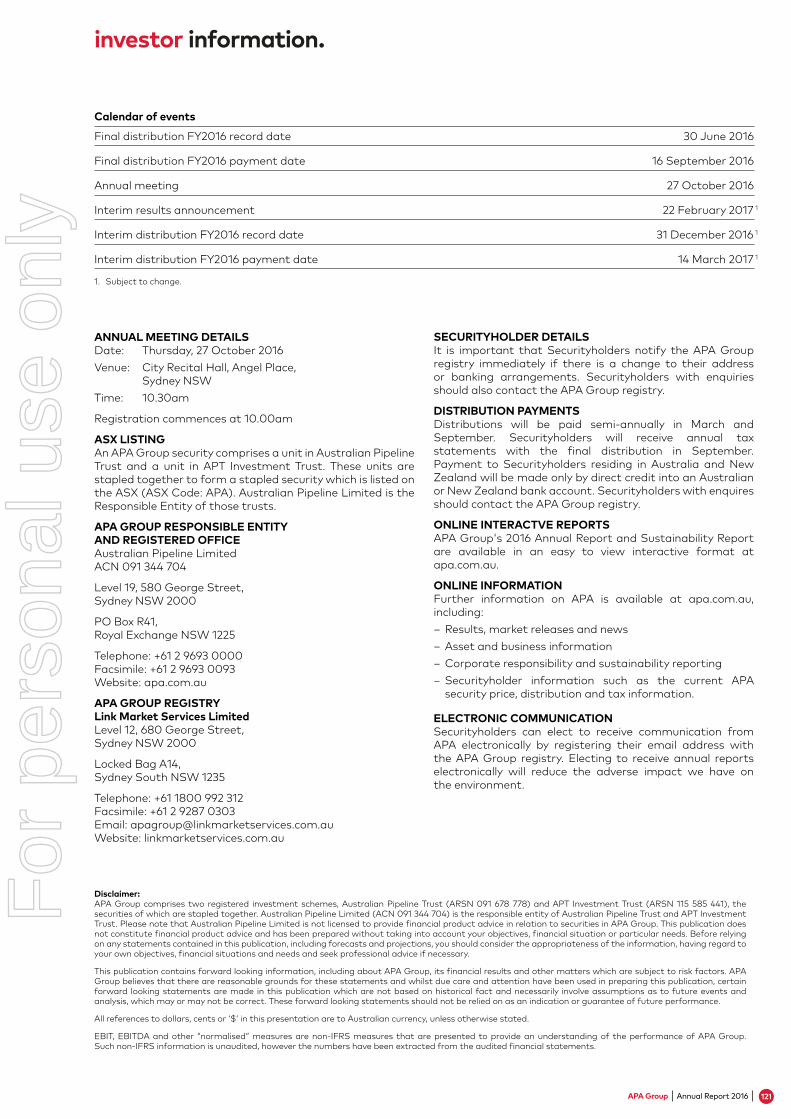
Calendar of events
Final distribution FY2016 record date 30 June 2016
Final distribution FY2016 payment date 16 September 2016
Annual meeting 27 October 2016
Interim results announcement 22 February 2017 1
Interim distribution FY2016 record date 31 December 2016 1
Interim distribution FY2016 payment date 14 March 2017 1
1. Subject to change.
ANNUAL MEETING DETAILSDate: Thursday, 27 October 2016Venue: City Recital Hall, Angel Place, Sydney NSWTime: 10.30am
Registration commences at 10.00am
ASX LISTINGAn APA Group security comprises a unit in Australian Pipeline Trust and a unit in APT Investment Trust. These units are stapled together to form a stapled security which is listed on the ASX (ASX Code: APA). Australian Pipeline Limited is the Responsible Entity of those trusts.
APA GROUP RESPONSIBLE ENTITY AND REGISTERED OFFICEAustralian Pipeline LimitedACN 091 344 704
Level 19, 580 George Street,Sydney NSW 2000
PO Box R41, Royal Exchange NSW 1225
Telephone: +61 2 9693 0000 Facsimile: +61 2 9693 0093 Website: apa.com.au
APA GROUP REGISTRYLink Market Services LimitedLevel 12, 680 George Street, Sydney NSW 2000
Locked Bag A14, Sydney South NSW 1235
Telephone: +61 1800 992 312 Facsimile: +61 2 9287 0303 Email: [email protected] Website: linkmarketservices.com.au
SECURITYHOLDER DETAILSIt is important that Securityholders notify the APA Group registry immediately if there is a change to their address or banking arrangements. Securityholders with enquiries should also contact the APA Group registry.
DISTRIBUTION PAYMENTSDistributions will be paid semi-annually in March and September. Securityholders will receive annual tax statements with the final distribution in September. Payment to Securityholders residing in Australia and New Zealand will be made only by direct credit into an Australian or New Zealand bank account. Securityholders with enquires should contact the APA Group registry.
ONLINE INTERACTVE REPORTSAPA Group's 2016 Annual Report and Sustainability Report are available in an easy to view interactive format at apa.com.au.
ONLINE INFORMATIONFurther information on APA is available at apa.com.au, including:
– Results, market releases and news – Asset and business information – Corporate responsibility and sustainability reporting – Securityholder information such as the current APA security price, distribution and tax information.
ELECTRONIC COMMUNICATIONSecurityholders can elect to receive communication from APA electronically by registering their email address with the APA Group registry. Electing to receive annual reports electronically will reduce the adverse impact we have on the environment.
Disclaimer:APA Group comprises two registered investment schemes, Australian Pipeline Trust (ARSN 091 678 778) and APT Investment Trust (ARSN 115 585 441), the securities of which are stapled together. Australian Pipeline Limited (ACN 091 344 704) is the responsible entity of Australian Pipeline Trust and APT Investment Trust. Please note that Australian Pipeline Limited is not licensed to provide financial product advice in relation to securities in APA Group. This publication does not constitute financial product advice and has been prepared without taking into account your objectives, financial situation or particular needs. Before relying on any statements contained in this publication, including forecasts and projections, you should consider the appropriateness of the information, having regard to your own objectives, financial situations and needs and seek professional advice if necessary.
This publication contains forward looking information, including about APA Group, its financial results and other matters which are subject to risk factors. APA Group believes that there are reasonable grounds for these statements and whilst due care and attention have been used in preparing this publication, certain forward looking statements are made in this publication which are not based on historical fact and necessarily involve assumptions as to future events and analysis, which may or may not be correct. These forward looking statements should not be relied on as an indication or guarantee of future performance.
All references to dollars, cents or ‘$’ in this presentation are to Australian currency, unless otherwise stated.
EBIT, EBITDA and other “normalised” measures are non-IFRS measures that are presented to provide an understanding of the performance of APA Group. Such non-IFRS information is unaudited, however the numbers have been extracted from the audited financial statements.
investor information.
121APA Group Annual Report 2016
For
per
sona
l use
onl
y

apa group sustainability report. 2016
sustainability.matters.
For
per
sona
l use
onl
y

APA Group is one of Australia’s largest companies – in fact we are Australia’s number one gas infrastructure business and as such are a leader within the energy industry, playing a key role in defining and delivering the future of Australian energy.Our reputation is important to us as we strongly believe that how we conduct our operations is key to growing a sustainable business. Infrastructure and energy needs are long term investments as is the investment we make in our five stakeholder groups – investors, customers, the environment, communities and our employees. Our vision is to connect Australia to its energy future and to do this we must connect with and respect our stakeholders.
The FY2016 Sustainability Report details APA’s financial year performance against sustainability actions for FY2016, as well as outlining the material economic, environmental and social sustainability risks and how APA mitigates those risks.
At APA we are guided by ‘Our Values’ which anchor how we act and how we make decisions. We reach for the STARS quite literally –
contents.Message from the Managing Director S1
Customers S2
Environment S4
Community S6
Employees S8
Investors S10
our sustainability approach.
AdaptableWe respond and adapt to our changing environment by innovating, modifying out behaviours and improving our processes and systems
ResultsWe meet our commitments and deliver excellent results to the benefit of our stakeholders through tenacity and perseverance Service
We are commited to high quality service delivery achieved through listening, understanding, anticipating and responding to our customers’ needs
Trustworthy We accept individual and collective responsibility for the delivery of all business outcomes. We do what we say we’re going to do
Safe We will maintain a safe environment and a professional workplace where we work collaboratively, and treat each other with respect
For
per
sona
l use
onl
y

message from the managing director.
At APA, we continue to manage and grow our business by focusing on our key sustainability objectives.
We focus on delivering sustainability initiatives while keenly aware of the role we play within the community and the responsibility we have to our stakeholders –our customers, the environment, our community, our employees and our investors. It gives me great pleasure to provide an update on some of these key sustainability initiatives in APA’s FY2016 Sustainability Report.
Our people are our greatest asset and we have continued our commitment to keep them safe through our culture of Zero Harm. While it is disappointing to report a small increase in the Lost Time Injury Frequency Rate from the prior year, we are unrelenting in our health and safety initiatives to ensure everyone is able to return home safely to their families at the end of each day.
Mindful of our responsibility to the community, we have continued our Building Brighter Futures community investment program. Established in 2010, the program includes partnering with organisations focused on supporting disadvantaged young Indigenous Australians and on supporting four employee-nominated causes. The program’s broader aims are to improve future prospects of at-risk Australians and to connect APA as a business and our people to the communities in which we operate. It has been a privilege to continue our partnerships with the Clontarf Foundation, the Rev Bill Crews Foundation and The Fred Hollows Foundation, which has included APA employee involvement in our partners’ activities.
At the core of the success of our business are our customers. It is pleasing to report that during FY2016 we completed a number of projects to further enhance our customer offerings and enable us to provide flexible and creative solutions in response to our customers’ changing needs.
We recognise the potential to impact the environment through our business activities and, with this in mind, continued to pursue a high standard of environmental management. Our purpose is not only to address risks and meet our legal obligations, but to ensure we preserve and restore the natural state of the areas we operate in, and minimise any possible impacts to flora and fauna, and their dependent habitats.
The shift towards a low carbon economy is front of mind in APA’s growth aspirations. In FY2016, we again – for the sixth time - participated in the voluntary Carbon Disclosure Project, scoring highest amongst our direct peers. We also joined the Clean Energy Council to further our knowledge of renewable energy and low carbon markets, as we continue the development of wind and solar renewable energy projects and expand our low emission generation portfolio of assets.
In FY2017 we will continue our commitment to maintaining and growing a sustainable business through several programs and initiatives that provide value to our customers, the environment, the communities, employees and investors.
Mick McCormackChief Executive Officer and Managing Director
S1APA Group Sustainability Report 2016
For
per
sona
l use
onl
y

FY2016 Performance Actions For FY2017
– New agreements negotiated to support further capacity expansion of the Victoria – Northern Interconnect.
– Completed the construction of the 293 kilometre Eastern Goldfields Pipeline ahead of schedule leading to earlier commissioning and start of gas transportation agreements with AngloAshanti Gold.
– Entered into a contract to deliver gas transportation services to a new customer using the Eastern Goldfields Pipeline.
– Completed compression and pipeline projects to provide bi-directional gas transportation services on the East Coast Grid enabling APA to provide our customers with flexible and innovative services in a dynamic gas market.
– Entered into a number of flexible agreements which incorporate multiple receipt and delivery points on the East Coast Grid, including a service for a new customer on the Wallumbilla Gladstone Pipeline servicing the Gladstone market.
– Continued to offer web-based capacity trading services to facilitate trades between buyers and sellers of capacity.
– Completed migration of APA’s gas transmission pipeline assets to the Integrated Operations Centre (“IOC”), to holistically manage day to day operations.
– Completed an enhancement to the Mondarra Gas Storage Facility, enabling greater reliability and capacity. Contracts for new services have been entered into.
– Completed construction of the new South Metro gate station off the Parmelia Gas Pipeline, enhancing gas security of supply for metropolitan Perth.
– Progress the further expansion of the Victoria – Northern Interconnect.
– Maximise use of existing assets and profitably continue to expand APA’s asset portfolio in order to meet customers’ needs.
– Continue to offer flexible transportation and storage services and innovative solutions to meet our customers’ diverse requirements across the nation.
– Implement new service offerings for capacity trading capability.
– Continue to refine the IOC and grid operations to deliver reliable supply and enhanced services.
293 kmEastern Goldfields Pipeline construction completed ahead of schedule
IOCcompleted full migration of APA’s gas transmission pipeline assets to the Integrated Operations Centre
New injection and withdrawal well completed at Mondarra Gas Storage Facility during FY2016, increasing storage capacity.
customers.We will deliver value to our customers and create responsive solutions to meet their needs by:– Providing market-leading flexible solutions to meet our customers’
changing requirements.– Ensuring the highest level of service reliability to enable customers
to manage their operations.– Delivering value to customers by efficiently and reliably utilising the
capacity of APA’s infrastructure assets.– Working with customers to provide optimal energy market solutions.
S2 APA Group Sustainability Report 2016
For
per
sona
l use
onl
y

Key Sustainability Risks Risk Management
– Demand for gas – The volume of gas that is transported by APA is dependent on end user demand. The relative price of gas and its competitive position with other energy sources (such as electricity, coals, fuel oil, renewable sources) may change demand levels for services on APA’s assets.
– Long-term agreements with strong counterparties underpin assets.
– Flexible and creative customer solutions.– Complementary investments in gas storage and power
generation and continued evaluation of emerging fuels such as wind farms.
– Supply of gas – Availability of competitively priced gas is essential for ongoing use of gas infrastructure assets.
– Long term agreements with strong counterparties underpin assets.
– Connect more gas resources with more gas markets such as:– East Coast Grid provides flexibility for customers to
manage their gas portfolios.– Expansion of interconnect between Victoria and New
South Wales.– Working with new / emerging gas producers to bring new
gas supply to market.– Provide infrastructure connectivity to existing and emerg
ing gas markets.
– Counterparty – If a counterparty is unable to meet its commitments to APA, there is risk that future anticipated revenue would be reduced unless and until APA is able to secure an alternative customer.
– Credit worthiness test applied to new customers, and ongoing monitoring.
– Appropriate customer guarantees in place.
– Operations – APA and our asset management customers are exposed to a number of operational risks such as equipment failures or breakdowns, rupture of pipelines and technological failures.
– APA operates assets in accordance with all relevant regulations and standards.
– In-house operating, maintenance and engineering expertise.
– Economic regulation – APA may be negatively impacted as a result of a change in regulatory settings.
– The regulatory test for inclusion of gas pipelines being subject to economic regulation is expected to be reviewed by the Gas Market Reform Group, newly appointed by the Council of Australian Governments (“COAG”).
– Regulatory regime is well understood and encapsulated in national law.
– The reset dates of APA’s price regulated assets are staggered, with on average one review each year.
– Composition of asset portfolio is optimised to manage exposure to regulator settings.
– Engagement with policymakers.
Mick McCormack (APA’s Managing Director), Hon Bill Marmion (WA Minister for Mines and Petroleum) and Mike Erickson (Senior VP, AngloGold Ashanti at the official opening of Eastern Goldfields Pipeline in February 2016.
S3APA Group Sustainability Report 2016
For
per
sona
l use
onl
y

environment.
FY2016 Performance Actions for FY2017
– There were no material breaches of Environmental Management Plans (or equivalent), leading to full regulatory compliance.
– Continue to apply control measures in line with APA’s environmental procedures, leading to compliance with license and regulatory requirements.
– Initiated and commenced delivery of the 2015-2017 Environment Strategy and Improvement Plan, designed to improve our corporate environmental governance framework.
– Continue to deliver initiatives according to the Plan schedule, leading to continual improvement of our Environmental Management System.
– Engaged with government to promote the role of gas in a carbon-constrained economy, directly and through industry associations. In FY2016 APA joined Clean Energy Council to gain further exposure to renewable energy and carbon markets.
– Participate in policy discussions and promote the role of gas as an important contribution to meeting Australia’s 26-28% Paris COP21 carbon reduction commitment.
– Participated for the sixth time in the Carbon Disclosure Project, a voluntary disclosure to investors on carbon emissions, liability, reduction activities, strategies and management. APA’s overall score of ranked highest amongst its direct peers.
– Maintain carbon market expertise and knowledge should energy markets shift to clean fuels such as wind, solar and gas.
– Continued to develop the wind and solar renewable energy projects at Emu Downs Wind Farm. Emu Downs Solar Farm was shortlisted in the $100 million ARENA large-scale solar program.
– Evaluate wind and solar generation opportunities now that there is greater certainty in the federal Renewable Energy Target policy.
Key Sustainability Risks Risk Management
– Significant damage to the environment and breach of environmental regulatory requirements have the potential to result in significant penalties and affect operational activities.
– The Environment Strategy and Improvement Plan seeks to apply robust controls to manage identified environmental risks and legislative obligations. Controls may include specific procedures, Environmental Management Plans, and training/awareness programs.
Environmental management at APAEnvironment Strategy and Improvement PlanAPA is committed to pursuing a high standard of environmental management. In FY2016 we initiated an Environmental Strategy and Improvement Plan, consisting of 12 initiatives for delivery between July 2015 and June 2017. The Plan is designed to improve our corporate governance framework for environmental management across all Australian operations. Key initiatives within the Plan include development of corporate environment procedures across eight work streams, and a training and awareness program.
The key focus for FY2016 was development of environment procedures to address our significant risks and legal obligations. This is now complete and the implementation
component is underway. Training and awareness will be delivered to all employees and applicable contractors through various mediums, including video, e-learning and face to face presentations.
Biodiversity and landBiodiversity preservation is a critical global issue. As an energy company that operates in diverse and ecologically sensitive locations, our activities have the potential to impact on flora, fauna and the habitats they depend on.
We are committed to preserving and restoring the long term health and viability of the natural environments in which we operate. We take care to assess environmental values prior to commencing an activity, manage habitat disturbance and restore areas as soon as practical following completion of construction or maintenance.
We will continue to deliver an environmentally responsible, safe and essential service by:– Protecting the natural environment in which we operate and managing impacts to biodiversity
and landscapes. – Conforming to the Australian Pipelines and Gas Association (“APGA”) Code of Environmental Practice.– Complying with emissions reporting obligations.– Contributing to policy and responding to climate change initiatives to promote the use of gas as
essential to a cleanerenergy mix.– Including the environment in all investment and procurement decision-making.– Evaluating complementary clean energy projects.
S4 APA Group Sustainability Report 2016
For
per
sona
l use
onl
y

Our activities are formally considered by the relevant state authority before any work commences and we conduct all work in accordance with a license specific Environmental Management Plan or equivalent.
Where some activities present more risk, specific strategies and management plans are developed and implemented.
Cultural heritageAPA understands the importance of identifying, recording and managing Aboriginal sites of significance. We have a systematic approach for determining whether significant heritage sites might be affected by projects or works and then protecting them against disturbance. If disturbance is unavoidable, we work with relevant parties (such as indigenous groups, community groups and regulatory authorities) to ascertain how best to plan and undertake activities to manage impacts.
APA takes care to prepare, implement and comply with all Aboriginal cultural heritage documentation as required by law. This may include Cultural Heritage Management Plans, Strategies or equivalent. APA also has a new Aboriginal Cultural Heritage Management Procedure which outlines the minimum management measures to be applied in the absence of site specific documentation. This procedure is being implemented across all applicable business areas in FY2017.
National greenhouse and energy reportingAPA complies with the Commonwealth National Greenhouse and Energy Reporting Act 2007 which establishes a national framework for corporations to report greenhouse emissions, energy consumption and production should specific thresholds be met.
APA’s emissions are mainly the result of power generation activities, the combustion of natural gas in compressor stations and from fugitive emissions. In financial year 2016, APA reported 350,922 tonnes of carbon dioxide equivalent (scope 1 emissions).
Carbon Disclosure ProjectAPA participated for the sixth time in the Carbon Disclosure Project, a voluntary disclosure to investors on carbon emissions, liability, reduction activities, strategies and management. APA’s score of 86 is ranked in the highest band for disclosure (>70), which states that “a company provided comprehensive information about the measurement and management of its carbon footprint, its climate change strategy and risk management processes and outcomes.” APA’s performance score of D ranked consistently with the rest of the utilities sector. APA could
improve its performance score by setting and achieving carbon emission reduction targets. However, because APA’s reduction activities rely on a strong carbon price, management will wait for further certainty on carbon legislation before committing resources to these activities. APA’s overall score of 86D ranked second in the utilities sector and highest amongst its direct peers.
Clean energy policyAPA continues to support reducing carbon emissions as a responsible risk mitigation response to climate change. APA supports technology agnostic domestic carbon abatement polices to meet Australia’s 26-28% Paris COP21 carbon reduction commitment.
In the longer term, as international and domestic carbon policy and markets mature, APA’s assets will play an important role in meeting Australia’s long-term emission reduction targets as energy consumption shifts from carbon intensive fuels, such as coal, to more carbon efficient fuels, such as natural gas.
Expanding our low emission generation portfolioAPA continues to progress the development of the 130 megawatt Badgingarra Wind Development Project adjacent to APA’s Emu Downs Wind Farm, as well as the 20 megawatt Emu Downs Solar Project, a small expansion to the wind farm. Both projects are contingent on entering into a long-term off-take agreement and meeting APA’s investment hurdles. The Emu Downs Solar Project was shortlisted by ARENA for the competitive $100 million large scale solar funding program.
APA joins the Clean Energy CouncilIn FY2016 APA joined the Clean Energy Council. The Clean Energy Council is the peak body for the clean energy industry in Australia. APA through its Corporate Membership
will gain access to extensive renewable energy industry knowledge, including market and technology developments, as well as input into the Clean Energy Council’s policy advocacy groups.
In APA’s view, gas-fired generation and renewable energy, predominately wind-powered generation and increasingly solar generation, are technologies that can meet significant emission reduction targets for Australia.
LOOKING AFTER THE ENVIRONMENTThroughout 2015, APA completed construction of the 293 km Eastern Goldfields Pipeline (EGP). The pipeline traverses a large section of previously undisturbed Great Victoria Desert, and consequently, potential habitat for several endangered species, including the endangered Sandhill Dunnart (a small, carnivorous marsupial - see photo).
In order to minimise impacts to the Dunnart and monitor the projects impact on the species, a Threatened Species Management Plan (TSMP) and a specific Sandhill Dunnart Monitoring Plan was developed.
The TSMP outlined the management measures to be applied during construction to minimise risks to the Dunnart and other endangered species. It was a success, with habitat clearing minimised and no loss of individuals during construction. The Monitoring Plan went above and beyond a basic approach and included radio-tracking to determine habitat preferences, shelter requirements, movements and activity, predation and dietary analysis.
As a result of this comprehensive management program, the Sandhill Dunnart is now known to occur across a much larger area with its range extended well to the north and north-west. New information about habitat selection and utilisation, as well as foraging times and ranges has been discovered and communicated back to relevant stakeholders.
S5APA Group Sustainability Report 2016
For
per
sona
l use
onl
y

We will positively engage with the communities within which we operate by:– Building long-term strategic community relationships to
maintain support and goodwill for APA’s activities.– Increasing employee connections with local communities
through sponsorships, employee volunteering and giving programs targeting vulnerable communities.
FY2016 Performance Actions for FY2017
– Continued APA’s Building Brighter Futures community investment program supporting the Fred Hollows Foundation, Rev Bill Crews Foundation (for Darwin Literacy Centre), and Clontarf Foundation.
– Built on APA employee involvement in Clontarf Foundation events.– Employees across APA participated in four community
fundraising events including Cancer Council (Australia’s Biggest Morning Tea and Pink Ribbon Day), Black Dog Institute and Movember.
– Maintain support of our community investment program, Building Brighter Futures, by continuing our three headline partnerships. Employee involvement will also be continued to further support our partners’ objectives.
– Continue financial support for community events .– Increase community Investment program activities
to extend the reach of APA support to include employee volunteering, and support diversity and inclusion strategies.
Key Sustainability Risks Risk Management
– Community relations – Maintaining community support and goodwill for APA’s activities.
– Encroachment – Urban encroachment around existing pipeline easements can increase the potential for damage. A change in pipeline location class may also increase compliance costs.
– Remain in touch with community interests and issues.– APA actively engages with its communities through
sponsorships.– Construct and operate infrastructure using industry
recognised standards or better.– Education and communication around APA’s activities.– Landowner liaison and community education
and support of “Dial Before You Dig” (DBYD) service. Increasing awareness of DBYD through APA presentations.
– Pipeline easement monitoring and surveillance.– Liaise with council and planning authorities to
effectively manage potential encroachment issues.– APA 2020 to roll out a new Infrastructure Protection
and Planning department with dedicated work streams for processes and assurance; urban planning; asset protection; and, access and approvals.
community.
In FY2016 APA continued its ‘Building Brighter Futures’ community investment program, including staff involvement in one of the program’s headline partners’ events. ‘Building Brighter Futures’ supports initiatives to improve the future prospects of vulnerable Australians. Established in late 2010, the program seeks to strengthen our company and employment brand and connect the APA business and people to the communities in which we live and work. The program includes corporate partnerships with three selected charities and an employee community event calendar.
In FY2017, we intend to extend the program to extend the reach of APA support to include employee volunteering, and support diversity and inclusion strategies.
Headline partnerships with three charity partnersIn FY2016 APA continued to support its three charity partners, focused on supporting disadvantaged young Indigenous Australians, under three-year commitments that were renewed or established in March 2014.
The Clontarf Foundation works to improve the education, discipline, life skills, self-esteem and employment prospects of young Aboriginal men, through a network of football academies established in partnership with local schools. APA has been working with the Clontarf Foundation since 2011.
Rev Bill Crews Foundation’s Darwin Literacy Program is an accelerated literacy program to support disadvantaged
S6 APA Group Sustainability Report 2016
For
per
sona
l use
onl
y

children with severely compromised reading ability. APA has funded three children per annum to participate in the Foundation’s Darwin program since 2011.
In Australia, the Fred Hollows Foundation provides eye treatment and health programs for Indigenous communities in remote Australia. APA has been working with the Fred Hollows Foundation to deliver its Australian program since 2014.
In addition to direct financial support, APA continued staff involvement in our headline partners’ events during FY2016. APA employee representatives participated in the experiences as part of their personal and career development and share them via APA’s employee magazine and internal conference. The events attended were:
– Clontarf Foundation’s Kimberley Experience: a three-day ‘immersion’ in the daily lives of West Kimberley Clontarf students and staff from the Broome, Derby and Fitzroy Crossing academies.
– Clontarf Foundation’s West Kimberley Academy Leadership Camp: a three-day event including two nights camping and sharing in the lives of Clontarf students and providing advice to senior Academy students as part of the Clontarf Employment Forum.
– Clontarf Foundation’s Top End Experience: a three-day event into the heart of Kakadu National Park and including visits to three Clontarf Academies.
In addition, APA hosted Clontarf Academy students’ onsite. These visits provided students opportunities to learn about work and workplaces and to interact with and present to groups in a work environment.
All experience received positive feedback from the APA employees involved.
Calendar of employee events In FY2016 APA continued to support and promote employee events across multiple company sites and matched the funds raised by employees, to a capped amount of $10,000 per event. The events were selected based on an earlier survey of employees seeking their nominations of four most worthy causes. The selected events/causes being:
– Pink Ribbon Day (Cancer Council) – Movember (Movember Foundation) – Black Dog Institute (Mental Health research) – Australia’s Biggest Morning Tea (Cancer Council) APA will continue to support and promote these events across all company sites to further engage employees and these charities in FY2017.
Sponsorship and donationsAPA continued to provide monetary and in-kind support to a number of groups or causes that achieve one or more of the following:
– Strengthen APA’s reputation in the local community.– Enhance APA’s relationships with key community
stakeholders.– Increase community awareness and understanding
of APA.– Provide positive networking opportunities with
community stakeholders.Of these, the two major sponsorships in FY2016 were for Taronga Zoo Foundation and the Australian Brandenburg Orchestra.
Roberto Ferrari, Manager Planning and Integrity (2nd from right), with Clontarf staff and students, and guests, at the Boab Prison Tree, near Derby, at the Clontarf Foundation’s Kimberley Experience.
S7APA Group Sustainability Report 2016
For
per
sona
l use
onl
y

We will continue with our commitment to provide a stimulating and rewarding working environment that strives and ensures:– Commitment to a culture of Zero Harm by continually
improving our health, safety and environmental performance in the workplace.
– Fit for purpose learning and development programs to attract, retain and develop employees.
– We encourage and foster diversity of thought and inclusion.
FY2016 Performance Actions for FY2017
– 18% increase in the number of incidents reported compared to last year with a large proportion being near miss incidents.
– Lost Time Injury Frequency Rate (LTIFR) increased from 0.64 in FY2015 to 1.06 in FY2016 – slightly above our target of <1.0. However, this is still in-line with our overall improving injury trends. Total Recordable Injury Frequency Rate (TRIFR) was 10.41.
– We achieved all of our lead Health and Safety performance measure targets.
– Final year of APA’s three-year Health, Safety and Environment (“HSE”) Strategic Improvement Plan, and each initiative has been achieved with the following key highlights:− Conducted regular Leading Zero Harm awareness
modules for our employees;− Successful implementation of the SafeDrive+ campaign
that included education and awareness for specific driving risks such as speeding and fatigue, resulting in a reduction of vehicle incidents; and
− Further enhancements to the incident reporting platform, Safeguard+ that lead to improved quality of data and better understanding of our risk exposures.
− Completed an independent Health and Safety audit program across the business achieving a 95% compliance rating with no major non-conformance findings.
– As part of SafeDrive+ program, installed In Vehicle Monitoring Systems to over 279 vehicles enabling tracking and monitoring of driver safety, and are already realising the benefits of improved driver safety.
– Continued sponsorship of health-focused activities for employees including the Global Corporate Challenge in which 351 APA employees participated across 51 teams.
– Refreshed the Talent Management framework incorporating a capability framework and encouraging greater business involvement in sponsoring and implementing development plans with employees.
– Commenced a program of leadership training and assessment designed to improve leadership climate.
– Employee Survey achieved an overall engagement score of 74%.
– Launched a new Graduate Program.
– Continue to support a reporting culture in safety to effectively manage our risk profile and take corrective measures in preventing injuries.
– Target an LTIFR of less than 1 and a TRIFR target of no more than 9.89.
– Lead safety indicators will focus on hazard reporting rates, permit reviews and management interactions.
– A new three year HSE Strategic Improvement Plan has been developed building upon the previous plan including a number of new initiatives such as Health and Wellbeing and Fitness for Work.
– Launch a Health and Wellbeing platform for all employees supported by targeted initiatives and awareness programs.
– Continue development, improvement and promotion of three fundamental programs already established within APA, being:− Fatal Risk Protocols;− Contractor Management; and− SafeDrive+ Campaign.
– Development and implementation of a Drug and Alcohol awareness program targeting ‘Fitness for Work’ for all employees.
– Provide Incident Investigation training to frontline managers to improve the quality of investigations and corrective actions.
– Continue with Leadership Climate program and associated training and workshops to improve leadership capability
– Commence project to upgrade and improve APA’s HR systems.
– Further develop and grow the Graduate Program and introduce an Intern Program for undergraduates.
– Continue work on diversity and inclusion strategy with key areas of focus being gender, age and diversity of thought.
employees.279+vehicles installed with In Vehicle Monitoring Systems
95%compliance rating in independent Health and Safety audit
S8 APA Group Sustainability Report 2016
For
per
sona
l use
onl
y

Key Sustainability Risks Risk Management
– Safety – Failure to provide a safe workplace resulting in serious or fatal injuries.
– APA maintains a comprehensive workplace HSE Management system. It is predicated on the principles of hazard and risk identification, control measures and a robust assurance framework.
– HSE training, education and awareness is a cornerstone of the HSE management system.
– As part of our assurance framework, Health and Safety audits are undertaken across all parts of the business to ensure that health and safety risks are effectively controlled.
– Potential for legal proceedings for failure to comply with Health, Safety and Environmental legislative obligations.
– Maintain and monitor compliance to APA’s HSE Management System including undertaking regular compliance monitoring through audits and workplace inspections.
– Provide all necessary Health, Safety and Environment training to managers and employees.
– Employee capability, recruitment and engagement – Failure to develop, attract and retain talented employees.
– APA maintains a number of initiatives to ensure there is a pool of talent and internal capability for now and in the future.
– These include formal succession and talent management, a diversity and inclusion strategy, as well as technical, functional, business and leadership development.
– The business has introduced a strong internal recruitment capability to ensure we identify and secure external resources as and when needed.
APA Workforce Gender Profile as at June 2016
Female Male
Non-Executive Directors 29% 71%
Workforce 26.5% 73.5%
Leadership roles 20% 80%
Technical and trades roles 1 4% 96%
Leadership roles (CEO and KMP) 25% 75%
Other Executives/General Managers 16% 84%
Senior Managers 16% 84%
Other Managers 24% 76%
Our peopleAPA values inclusiveness and encourages a safe, high performance working culture, where the contributions of our people are harnessed and developed to achieve successful outcomes for the business. We are committed to building sustainable organisational capability that enables continued growth and development of our people and supports APA’s strategic vision.
Since listing 16 years ago, our workforce has grown from six people to over 1,600 skilled people located across mainland Australia. Throughout FY2016, we continued to challenge our organisation with regards to effective and efficient organisational design and made structural and work practice changes through people, processes and systems to enhance our capability.
Attracting talentThe skilled job market that APA operates in continues to be highly competitive and our ability to attract and retain a diverse range of talent remains critical as our business continues to grow.
Talented and skilled employees are central to creating value for our stakeholders and the more diverse the thinking and skills we apply to our business, the more innovative we can be in creating value and return for them. To this end, in FY2016 we piloted an Intern Program as well as launched our first Graduate Program. Both of these programs are fundamental to APA positioning itself to grow, develop and harness talent from an early entry point and providing wide and varied career paths to enable APA to continue to build sustainable organisational capability.
Developing potentialWe continue to focus on growing and developing our people, as we recognise this is critical to our success. During FY2016, we supported the development and training requirements of our people through a range of compliance, technical, leadership and professional development programs totalling 5,277 attendances.
Our annual succession and talent review process continues to be a successful means of identifying critical role and capability requirements, as well as providing a healthy talent pool.
Diversity and inclusionIn FY2016, we continued our focus on key initiatives under our Diversity and Inclusion Strategy which was developed in 2014. Our strategy focuses on initiatives aligned to the strategic focus areas of improving diversity of thought, diversity of gender and diversity of age at APA. During the year, we achieved a number of critical initiatives to include promoting awareness and benefits of a diverse and inclusive workforce via our Diversity and Inclusion committee; facilitating career transition workshops; launching our Women In Leadership program; and new entry programs for graduates, interns and apprentices.
1) Leadership roles are defined in accordance with the Workplace Gender Equality Agency (“WGEA”, Australia and New Zealand Standard Classification of Occupations) occupational categories and comprise all levels of management (i.e. general managers, key management personnel, manager roles) excluding team leader and supervisory roles. APA’s public report to the WGEA is available at https://www.apa.com.au/careers/working-at-apa.
S9APA Group Sustainability Report 2016
For
per
sona
l use
onl
y

investors.We will continue to be a reliable and attractive investment which delivers superior returns for securityholders by:– Achieving reliable and sustainable earnings growth by focusing on
long-term revenue and reduced costs. – Maintaining a strong and robust balance sheet.– Identifying and evaluating additional attractive infrastructure style
investments in related energy businesses.
FY2016 Performance Actions for FY2017
– Total securityholder return of 16.7% for FY2016.– Delivered investors a 9.2% increase in distributions.– Maintained investment grade credit ratings (BBB/Baa2).– Extended the term to maturity on its syndicated and bilateral
bank facilities by between 12 and 24 month.– Entered into five new bilateral bank facilities for terms
of between two and five years providing $350 million of committed debt funding, which replaced maturing US Private Placement notes.
– Improved corporate costs as a proportion of business metrics, reducing the cost to EBITDA (continuing business) ratio to 6.1% in FY2016 (FY2015 8.2 %).
– $673.6 million of capital and investment expenditure.– Successfully completed 100% acquisition of Ethane Pipeline
Income Fund and Diamantina and Leichhardt Power Stations
– Progress or complete current growth capital projects underway.
– Continue to evaluate and develop additional revenue streams in related energy infrastructure businesses.
– Maintain investment grade credit rating levels.
Key Sustainability Risks Risk Management
– Debt and equity - Ensuring continued support from debt and equity markets for ongoing capital requirements. Inability to secure new debt facilities at appropriate quantum and price may adversely affect APA’s operations and/or financial position and performance.
– APA’s investment decisions are made and its balance sheet is utilised with a continuous focus on maintaining long term investment grade credit ratings.
– A diverse portfolio of long-life assets underpinned by regulated and long term bilateral agreements, underscores APA’s ability to service debt and sustain steady equity distributions.
– Maintain diversified funding base and access to deep and liquid global debt capital and banking markets.
– APA has a long term sustainable distribution policy having regard for the capital needs of the business and economic conditions. Distributions are fully covered by operating cash flow.
– Financial results and other salient developments are communicated regularly to investors in a timely manner.
As at 30 June 2016, APA had over 81,000 securityholders holding 1.1 billion securities, with the top 20 investors holding 62.5% of securities. Currently, approximately 74% of APA’s investors are based in Australian and/or New Zealand.
16.7%total securityholder return for FY2016
+9.2%increase in distributions to investors for FY2016
50
FY01 FY02 F03 FY04 FY05 FY06 FY07 FY08 FY09 FY12 FY14FY13FY10 FY11 FY15 FY160
APA’S HISTORICAL ANNUAL DISTRIBUTIONS (CENTS PER SECURITY), HAS CONTINUED TO INCREASE
41.5
S10 APA Group Sustainability Report 2016
For
per
sona
l use
onl
y

S11APA Group Sustainability Report 2016
For
per
sona
l use
onl
y

DEAR SECURITYHOLDERSI am pleased to report another solid year for APA. The FY2016 results represent the outcome of a consistent and prudent strategy of growth and value creation.APA has been able to reap the benefits of this strategy, seeing earnings come through from capital we have invested in growing our asset base through acquisitions and organic expansion. The FY2016 results include a full year of earnings from the Wallumbilla Gladstone Pipeline acquired in FY2015 and increasing revenue streams from the ongoing expansion of both the East Coast Grid and expansions and greenfields investment in Western Australia. APA’s long term vision, strategic planning and focused execution have seen the business continue to deliver prudent distribution growth and long term market-leading increases in Securityholders’ value. The total distributions for FY2016 of 41.5 cents per security represent a 9.2 per cent increase over FY2015. As per our distribution policy, distributions have been fully covered by operating cash flows with an appropriate amount of those cash flows retained within the business to support growth. Your Board believes that the increase in distributions represents a prudent increase in returns for Securityholders given the current economic environment. The Board is of the view that the 41.5 cents per security represents a solid base from which to increase distributions on a sustainable basis going forward.Long term sustainability is what APA is all about. We continue to see good opportunities for organic growth in front of us and we are mindful of ensuring that the business is in a position to fund that growth going forward. We will continue to maintain a disciplined approach to investing in growth that delivers long term value for Securityholders and positions APA securely for the future.Despite the challenges within the global and Australian energy sector in FY2016 with volatile energy market conditions and the rebalancing of global demand and supply, we have continued the execution of APA’s long standing growth-based strategy. We have invested in enhancing our existing assets and during the year we acquired two complementary assets in the Diamantina and Leichhardt Power Stations and the Ethane Pipeline, to connect more energy resources to more markets. We continue to innovate through provision of new services that are helping our customers manage their energy needs, particularly during what have been relatively uncertain times from an economic, political and regulatory perspective.
Our sustainable business model and strong balance sheet have enabled us to navigate the current economic environment and make the most of opportunities that arise and, most importantly, position us for further growth in the years ahead.Solid resultsThe strength of our low risk, resilient business model is reflected in APA’s FY2016 financial results. Earnings before interest, tax, depreciation and amortisation (“EBITDA”) from continuing businesses were $1,330.5 million 1 , an increase of 61.8 per cent on FY2015 normalised EBITDA of $822.3 million 2. Revenue (excluding pass-through revenue) increased by $536.7 million to $1,656.0 million, an increase of 48.0 per cent on the FY2015 result of $1,119.2 million. The increases in EBITDA and revenue were in the main due to a full year contribution from the Wallumbilla Gladstone Pipeline that we acquired in June 2015 and the expanded East Coast Grid (South West Queensland Pipeline in particular), as expected; part-year contributions from the Diamantina and Leichhardt Power Stations and the Ethane Pipeline acquired during the last quarter of the financial year; and, the commissioning of APA’s newest greenfield project, the Eastern Goldfields Pipeline in November 2015. Operating cash flow which is a key measure of APA’s business, increased by 58.2 per cent to $862.4 million.Delivering valueAs we do annually, the Board and senior management recently took time out to revisit our past performance, and more importantly, look at our strategy and what we can and should be doing in the years ahead, so that we can continue to grow and deliver services to our customers and value to our Securityholders.We have built a business that is solid and sustainable. From having the right balance sheet and risk framework in order to maintain our “license to operate”, to using our in-house operational and development expertise to deliver energy when and where it is needed. All of the initiatives and strategic actions from past investments and innovations are delivering benefits now that will continue well into the future. Looking forward, we remain committed to providing our investors with secure and stable returns via our strategies of organic growth on assets that we own and operate, and prudent acquisitions of long life energy infrastructure that is underwritten by long term contracts with highly creditworthy counterparties.
We remain focused on growing and strengthening APA further and we concluded from our review that opportunities still remain to expand and enhance our assets, be they transmission pipelines, renewable and generation assets or midstream complementary assets. Our growth strategy will be pursued using the same sound, disciplined and prudent investment criteria that has brought us to where we are today.As we marked 16 years as a listed company, we have not forgotten about ensuring our house is in order for the long term. During the year, APA launched the APA2020 vision; an investment in further optimising operations and improving efficiencies to bring out the best in our people and our assets. APA2020 is an ongoing project within APA that focuses on ensuring we are ready as a business to meet the challenges of the future. Regulatory environment The Australian gas market is a substantial way through the biggest transition it is ever likely to see with the commissioning of all three LNG projects at Gladstone. The market needs time to transition and adjust, which it is doing. Our industry will continue to change and evolve, adapting to global and local market conditions.Policy options to respond to these changes have been considered in the finalised reports from both the Australian Energy Market Commission (“AEMC”) and the Australian Competition and Consumer Commission (“ACCC”) on the east coast gas markets, culminating in the Coalition of Australian Governments (“COAG”) meeting on 19 August 2016. APA supports the objective of developing a liquid gas market and recognises that some of the recommendations put forward by the AEMC and agreed by COAG will have operational impacts on APA. Possible impacts are discussed further in the Directors’ Report. The important point though, is that APA will remain actively engaged in these discussions and, as we have proactively facilitated the market to this point, we fully intend to be part of the ultimate solution. Changing fundamental regulatory settings at this time is not the answer to increasing gas supply – innovation and investment is. Increased regulation will simply stifle innovation and reduce Australia’s rise as a global energy player. APA’s East Coast Grid is an example of innovation and investment at its best. It was conceived, created and funded by APA.
in the pipeline. september 2016APA Group 2016 annual results summary
energy.connected.
1) There were no significant items for FY2016, therefore statutory and normalised EBITDA are the same for FY2016.2) For FY2015, normalised EBITDA excludes significant items of $447.2 million relating mainly to profit on the sale of APA’s shareholding in Australian Gas Networks,
previously Envestra Limited.Important information and disclaimers in relation to the content of this newsletter are located overleaf.
For
per
sona
l use
onl
y

GovernanceDuring the year, after completion of APA’s formal appointment and nomination process, two new Directors were appointed to your Board. These appointments added further diversity, skills and experience around the boardroom table.Along with the Nominations Committee established during the year, your Board continues to ensure that it possesses an appropriate mix of expertise to effectively govern the business.OutlookThe Board is confident that APA remains well placed to continue delivering sustainable and profitable growth for you, our Securityholders. The review of our growth strategy that I mentioned earlier, identified around $1.5 billion of organic opportunities in the near term, across the asset classes that are already within APA’s portfolio of transmission pipelines, renewable and generation assets and midstream complementary assets.
APA is a long term business and decisions are made for the sustainable future of this business. With this in mind, our guidance for FY2017 reflects a 7 to 8.5 per cent increase in EBITDA of $1,425 million to $1,445 million, on a normalised, continuing business basis. Total distributions per security are expected to be in the order of 43.5 cents per security, prior to the benefit of any franking credits that may arise as a result of the filing of the FY2016 tax return.On behalf of the Board, I thank our Managing Director Mick McCormack, his leadership team and APA’s people for their contributions this year. I also thank you, our Securityholders, for your continued support.
Len Bleasel AMChairman
Without investment and innovation by the private sector over the last 16 years, Australia’s energy infrastructure would still be standalone point-to-point operations without the benefits of interconnection, reverse flow, increased capacity, or the ability to deliver customers a wide selection of variable services. Without that innovation, Australia’s vast reserves of gas would not have been brought to market as effectively as they have today. And without those reserves in production, Australia would not have enjoyed the economic contribution from the LNG exports nor the massive employment that the construction of LNG plants, pipelines and associated infrastructure have brought. It is by enhancing market mechanisms such as improved capacity trading platforms, information transparency and capacity auctions on congested pipelines, that gas market growth and further development will be facilitated. The prospect of increased heavy handed regulation will not deliver the market efficiencies and innovation that is needed over the longer term.
Disclaimer: APA Group comprises two registered investment schemes, Australian Pipeline Trust (ARSN 091 678 778) and APT Investment Trust (ARSN 115 585 441), the securities of which are stapled together. Australian Pipeline Limited (ACN 091 344 704) is the responsible entity of those trusts. The registered office is HSBC building, Level 19, 580 George Street, Sydney NSW 2000. Australian Pipeline Limited is not licensed to provide financial product advice in relation to securities in APA Group and this publication does not constitute such advice. Before relying on any statements in this publication, you should consider the appropriateness of the information, having regard to your own objectives, financial situation and needs, and consult an investment adviser if necessary. Certain forward looking statements made in this publication are not based on historical fact and necessarily involve assumptions as to future events and analysis, which may or may not be correct. Such statements should not be relied on as an indication or guarantee of future performance.
APA 2016 Annual Report and Sustainability Report are available on our website at apa.com.au
1) Normalised financial results exclude significant items.2) Pass-through revenue is revenue on which no margin is earned. Pass-through revenue arises in the asset management operations in respect of costs incurred
and passed on to Australian Gas Networks Limited (“AGN”) and GDI in respect of the operation of the AGN and GDI assets respectively.3) This amount represents current and non-current borrowings as per balance sheet and is adjusted for deferred borrowing costs, the effect of unwinding of
discount, unrealised foreign exchange differences reported in equity and deducting other financial liabilities that are reported as part of borrowings in the balance sheet.
4) Between 23 December 2014 and 28 January 2015, APA issued a total of 278,556,562 new ordinary securities, resulting in total securities on issue of 1,114,307,369. The weighted average number of securities for FY2015 has been adjusted in accordance with the accounting principles of AASB133: ‘Earnings per Share’, for the rights issue.
5) Gearing = net debt divided by net debt plus equity.
FINANCIAL RESULTS 2016 2015 Change 2016 2015 Change Normalised 1 Normalised 1 Normalised 1 Statutory Statutory Statutory $ million $ million % $ million $ million %
Revenue 2,094.3 1,553.6 34.8 2,094.3 1,553.6 34.8Revenue excluding pass-through2 1,656.0 1,119.2 48.0 1,656.0 1,119.2 48.0EBITDA 1,330.5 822.3 61.8 1,330.5 1,269.5 4.8Profit after tax and non-controlling interests 179.5 203.9 (12.0) 179.5 559.9 (67.9)Operating cash flow 862.4 545.0 58.2 862.4 562.2 53.4FINANCIAL POSITION Total assets 14,842.7 14,652.9 1.3 14,842.7 14,652.9 1.3Total drawn debt3 9,037.3 8,642.8 4.6 9,037.3 8,642.8 4.6Total equity 4,029.1 4,382.7 (8.1) 4,029.1 4,382.7 (8.1)FINANCIAL RATIOS Operating cash flow per security (cents) 4 77.4 54.8 41.2 77.4 56.5 37.0Earnings per security (cents)4 16.1 20.5 (21.5) 16.1 56.3 (71.4)Distribution per security (cents) 41.5 38.0 9.2 41.5 38.0 9.2Distribution payout ratio (%) 53.6 68.8 (22.0) 53.6 66.6 (19.5)Gearing (net debt plus equity) (%)5 66.4 63.4 nm 66.4 63.4 nmInterest cover ratio (times) 2.6 2.6 nm 2.6 2.6 nm
50 cents
FY01 FY02 F03 FY04 FY05 FY06 FY07 FY08 FY09 FY12 FY14FY13FY10 FY11 FY15 FY160
APA’S HISTORICAL ANNUAL DISTRIBUTIONS (CENTS PER SECURITY), HAS CONTINUED TO INCREASE
41.5For
per
sona
l use
onl
y
Related Documents


![W-APT Scored Student Writing Samples ™ Scored Student . Writing Samples. Version 2 Release 3, August 2007 . WIDA-ACCESS Placement Test W-APT ... 12_PartB_Bench_2A] Score 2: Sample](https://static.cupdf.com/doc/110x72/5b057ae27f8b9ae9628ba9ba/w-apt-scored-student-writing-samples-scored-student-writing-samples-version.jpg)