Please note that this is an author-produced PDF of an article accepted for publication following peer review. The definitive publisher-authenticated version is available on the publisher Web site 1 Tectonophysics September 2013, Volume 603, Pages 32-54 http://dx.doi.org/10.1016/j.tecto.2013.05.028 © 2013 Published by Elsevier B.V. Archimer http://archimer.ifremer.fr Along-arc segmentation and interaction of subducting ridges with the Lesser Antilles Subduction forearc crust revealed by MCS imaging Mireille Laigle a, f, *, Anne Becel a, b , Béatrice de Voogd c , Maria Sachpazi d , Gaye Bayrakci a , Jean-Frédéric Lebrun e , Mikael Evain f , the "Thales Was Right" Seismic Reflection working group a, 1 a Institut de Physique du Globe de Paris, UMR 7154 CNRS, Sorbonne Paris Cité, Paris, France b CEREGE, Aix-en-Provence, France c Laboratoire Géophysique, Univ. Pau, France d Geodynamical Institute, National Observatory of Athens, Athens, Greece e Labo. de Rech. en Géosciences, Université des Antilles et de la Guyane, Pointe à Pitre, Guadeloupe (FWI), France f Géoazur, Université Nice Sophia Antipolis, Centre National de la Recherche Scientifique, Observatoire de la Côte d’Azur, 250 av Einstein 06560 Valbonne, France 1 the "Thales Was Right" Seismic Reflection working group (M. Daignières, A. Gailler, A. Gesret, A. Hirn, D. Klaeschen, H. Kopp, J.-M. Marthelot, Y. Mazabraux, E. Roux, W. Weinzierl) *: Corresponding author : Mireille Laigle, email address : [email protected] ; [email protected] Abstract: We present the results from a new grid of deep penetration multichannel seismic (MCS) profiles over the 280-km-long north-central segment of the Lesser Antilles subduction zone. The 14 dip-lines and 7 strike-lines image the topographical variations of (i) the subduction interplate décollement, (ii) the top of the arcward subducting Atlantic oceanic crust (TOC) under the huge accretionary wedge up to 7 km thick, and (iii) the trenchward dipping basement of the deeply buried forearc backstop of the Caribbean upper plate. The four northernmost long dip-lines of this new MCS grid reveal several-kilometres-high topographic variations of the TOC beneath the accretionary wedge offshore Guadeloupe and Antigua islands. They are located in the prolongation of those mapped on the Atlantic seafloor entering subduction, such as the Barracuda Ridge. This MCS grid also provides unexpected evidences on huge along- strike topographical variation of the backstop basement and of the deformation style affecting the outer forearc crust and sediments. Their mapping clearly indicates two principal areas of active deformation in the prolongation of the major Barracuda and Tiburon ridges and also other forearc basement highs that correspond to the prolongation of smaller oceanic basement highs recently mapped on the Atlantic seafloor. Although different in detail, the two main deforming forearc domains share similarities in style. The imaged deformation of the sedimentary stratification reveals a time- and space-dependent faulting by successive warping and unwarping, which deformation can be readily attributed to the forearc

Welcome message from author
This document is posted to help you gain knowledge. Please leave a comment to let me know what you think about it! Share it to your friends and learn new things together.
Transcript
Ple
ase
note
tha
t th
is is a
n a
uth
or-
pro
du
ce
d P
DF
of
an
art
icle
acce
pte
d fo
r p
ub
lica
tio
n fo
llow
ing
pee
r re
vie
w. T
he
de
fin
itiv
e p
ublis
he
r-au
then
tica
ted
ve
rsio
n is a
va
ilab
le o
n t
he
pu
blis
her
We
b s
ite
1
Tectonophysics
September 2013, Volume 603, Pages 32-54 http://dx.doi.org/10.1016/j.tecto.2013.05.028 © 2013 Published by Elsevier B.V.
Archimer http://archimer.ifremer.fr
Along-arc segmentation and interaction of subducting ridges with the Lesser Antilles Subduction forearc crust revealed by MCS imaging
Mireille Laiglea, f,
*, Anne Becela, b
, Béatrice de Voogdc, Maria Sachpazi
d, Gaye Bayrakci
a,
Jean-Frédéric Lebrune, Mikael Evain
f, the "Thales Was Right" Seismic Reflection working group
a, 1
a Institut de Physique du Globe de Paris, UMR 7154 CNRS, Sorbonne Paris Cité, Paris, France
b CEREGE, Aix-en-Provence, France
c Laboratoire Géophysique, Univ. Pau, France
d Geodynamical Institute, National Observatory of Athens, Athens, Greece
e Labo. de Rech. en Géosciences, Université des Antilles et de la Guyane, Pointe à Pitre, Guadeloupe (FWI),
France f Géoazur, Université Nice Sophia Antipolis, Centre National de la Recherche Scientifique, Observatoire de la Côte d’Azur, 250 av Einstein 06560 Valbonne, France 1 the "Thales Was Right" Seismic Reflection working group (M. Daignières, A. Gailler, A. Gesret, A. Hirn, D.
Klaeschen, H. Kopp, J.-M. Marthelot, Y. Mazabraux, E. Roux, W. Weinzierl)
*: Corresponding author : Mireille Laigle, email address : [email protected] ; [email protected]
Abstract:
We present the results from a new grid of deep penetration multichannel seismic (MCS) profiles over the 280-km-long north-central segment of the Lesser Antilles subduction zone. The 14 dip-lines and 7 strike-lines image the topographical variations of (i) the subduction interplate décollement, (ii) the top of the arcward subducting Atlantic oceanic crust (TOC) under the huge accretionary wedge up to 7 km thick, and (iii) the trenchward dipping basement of the deeply buried forearc backstop of the Caribbean upper plate.
The four northernmost long dip-lines of this new MCS grid reveal several-kilometres-high topographic variations of the TOC beneath the accretionary wedge offshore Guadeloupe and Antigua islands. They are located in the prolongation of those mapped on the Atlantic seafloor entering subduction, such as the Barracuda Ridge. This MCS grid also provides unexpected evidences on huge along-strike topographical variation of the backstop basement and of the deformation style affecting the outer forearc crust and sediments. Their mapping clearly indicates two principal areas of active deformation in the prolongation of the major Barracuda and Tiburon ridges and also other forearc basement highs that correspond to the prolongation of smaller oceanic basement highs recently mapped on the Atlantic seafloor. Although different in detail, the two main deforming forearc domains share similarities in style.
The imaged deformation of the sedimentary stratification reveals a time- and space-dependent faulting by successive warping and unwarping, which deformation can be readily attributed to the forearc
Ple
ase
note
tha
t th
is is a
n a
uth
or-
pro
du
ce
d P
DF
of
an
art
icle
acce
pte
d fo
r p
ub
lica
tio
n fo
llow
ing
pee
r re
vie
w. T
he
de
fin
itiv
e p
ublis
he
r-au
then
tica
ted
ve
rsio
n is a
va
ilab
le o
n t
he
pu
blis
her
We
b s
ite
2
backstop sweeping over the two obliquely-oriented elongated and localized topographical ridges. The induced faulting producing vertical scarps in this transport does not require a regional arc-parallel extensional regime as proposed for the inner forearc domain, and may support a partitioned tectonic deformation such as in the case of an outer forearc sliver.
A contrasted reflectivity of the sedimentary layering at the transition between the outer forearc and accretionary domains was resolved and used to define the seaward edge of the outer forearc basement interpreted as being possibly a proxy to the updip limit of the interplate seismogenic zone. Its mapping documents along-arc variations of some tens of kilometres the subduction backstop with respect to the negative gravity anomaly commonly taken as marking the subduction trench. With the exception of the southernmost part, the newly mapped updip limit reaches 25 km closer to the trench, thus indicating a possible wider seismogenic zone over almost the whole length of the study area.
Highlights • We image the deep structure of the Lesser Antilles Subduction Zone by MCS profiles. • The complex deformation of the outer forearc crust is induced by subducting ridges. • We discuss also the effect of the subducting compressive NAM-SAM Plate-boundary. • Along-strike variations of the seaward edge of the outer forearc crust are discovered. • The updip limit proxy of the seismogenic part reaches 20 km trenchwards than believed. Keywords : Lesser Antilles Subduction Zone ; Reflection seismics ; Deep outer forearc crust ; Backstop ; Seismogenic megathrust fault

ACC
EPTE
D M
ANU
SCR
IPT
ACCEPTED MANUSCRIPT
3
1. Introduction. Geodynamical and structural context, and previous seismic surveys
1.1 Geodynamical context
The effect of the roughness of a subducting oceanic plate in convergent margins onto the
subduction seismogenesis has long been debated, as summarized by Das and Watts (2009). Once
buried at depth beneath the upper plate, these seamounts, aseismic ridges, and other large
topographical reliefs are commonly considered as playing a role in the along-strike segmentation of
the co-seismic rupture of the subduction interplate, either as acting as an asperity or as a barrier. In a
recent analysis, Wang and Bilek (2011) stress out that seamount subduction tends to be
predominantly aseismic. They proposed as a possible explanation that the complex structure and
heterogeneous stresses of the fracture network that develop around the seamount within the upper
plate backstop is a possible explanation. This might indeed provide favourable condition for aseismic
creep but unfavourable condition for the generation and propagation of large ruptures on the
interplate above the seamounts. In the Lesser Antilles subduction zone where two parallel prominent
topographical ridges are present on the subducting Atlantic lithosphere, such interpretation has long
been debated (McCann & Sykes, 1984; 1986; Stein et al., 1986) and is not yet settled. Their
interaction with the upper plate backstop has been up to now only documented locally (Bangs et al.,
2003; Christeson et al. 2003) and the possible along-strike variations of this shallow part of the
subduction zone with respect to the subducting oceanic topographic highs is thus poorly known.
The Lesser Antilles intra-oceanic subduction system with its active island arc volcanism and
which is responsible for subduction-related seismicity is located at the eastern active margin of the
Caribbean plate (Fig. 1). The latter overrides in an easterly direction the subducting Atlantic oceanic
lithosphere of both the North and South American plates. The convergence rate, which has long been
debated, was recently constrained by space geodesy to be ~20 mm/yr (Dixon and Mao, 1997; Dixon
et al., 1998; DeMets et al, 2000; Weber et al., 2001; De Mets at al., 2010).
This active subduction zone was the site in 1843 of a M~8 earthquake probably on the interplate
mega-thrust boundary, that destroyed Pointe-à-Pitre city on Guadeloupe Island (Bernard and
Lambert, 1988), which was preceded in 1839 by a M ~7.5 earthquake offshore Martinique Island.
These were the first such events in the short historical record since the settlement only two centuries
earlier. During the 20th century, only moderate events occurred, but there were not any great
subduction earthquakes. Two notable events occurred recently: the 2004 Mw6.3 Les Saintes intra-
plate shallow earthquake on the volcanic arc between Soufrière volcano in Guadeloupe and
Dominica island, and the 145 km deep, 2007 Mw7.4 Martinique intermediate-depth earthquake of the
subducted slab.
ACC
EPTE
D M
ANU
SCR
IPT
ACCEPTED MANUSCRIPT
4
The question of the seismic coupling of this subduction zone, i.e. the proportion of the relative
plate motion that occurs through earthquakes with slip on the interplate boundary, remained
unresolved since the first quantified suggestion by Molnar et al. (1979) and Dorel (1981) of a mainly
aseismic behaviour. In these estimates of reduced seismic coupling, there are various parameters that
are poorly constrained such as the magnitude, location and nature of the earthquakes considered, as
well as the completeness of the catalogue, the estimation of the repeat time for the major subduction
events, and the seismogenic zone downdip size. Because the return time of large subduction
earthquakes in this region remains unknown, as does the seismic coupling, the critical question we
need to address is the potential size of the seismogenic interplate both along-dip and along-arc. The
downdip limit has been recently constrained to reach ~45 km depth beneath the mantle wedge, thus
adding a 50 km downdip length beyond the upper plate Moho contact onto the interplate located ~ 25
km depth (Laigle et al., same issue).
Concerning the updip limit, it is usually considered to be at the contact between the upper plate
backstop and the subducting oceanic crust (Hyndman et al., 1997). But in the Lesser Antilles, it has
been up to now imaged at few locations and its possible along-strike variations with respect to the
subducting oceanic topographic highs are thus poorly known. In Tohoku, several marine
investigations have recently revealed that the coseismic rupture of the unexpected 2011 M 9.0
tsunamogenic event propagated up to the deformation front. Indeed, structural changes at the sea-
bottom have been evidenced by the repetition of multibeam bathymetry surveys (Fujiwara et al.,
2011) and of multichannel seismic profiles (Kodaira et al., 2012). This earthquake demonstrated
that in such case of millenary event, the co-seismic rupture can propagate through a 60-km-wide
accretionary prism up to the deformation front despite a damaged backstop by seamount subduction
(Tsuru et al, 2002).
In this paper we provide structural elements that allow us to better constrain the trenchward extent
of this upper plate backstop and its along-arc variations on the north-central portion of the Lesser
Antilles subduction zone. We also imaged its active crustal deformation in response to subducting
ridges.
1.2 Subducting plate ridges.
A characteristic structural peculiarity of this subduction zone is the presence of two parallel
prominent topographical ridges on the subducting Atlantic lithosphere, the Barracuda Ridge offshore
Guadeloupe Island and the Tiburon Rise offshore Martinique Island (Fig. 1). They are commonly
considered as having originated as flanking transforms at the Mid-Atlantic Ridge but are long known
to be isostically uncompensated and to have had a more recent evolution (Mueller and Smith, 1993).
ACC
EPTE
D M
ANU
SCR
IPT
ACCEPTED MANUSCRIPT
5
With new seismic and multibeam data, Patriat et al. (2011) recently constrained the nature, timing
and distribution of the deformation at the western domain of the boundary zone between NAM and
SAM plates entering subduction. They revealed that this diffuse >200-km-wide plate boundary was
affected by localized basement differential uplift and folding associated to a component of north-
south compression, such as for the Barracuda Ridge since ca. 2.3 Ma and also earlier for the Tiburon
Rise.
These ~2000 m topographic highs above the nearby oceanic floor, have been considered to
interact with the Antilles arc as suggested by the morphological expressions of their prolongation
within the accretionary domain (Bouysse and Westercamp, 1990). The mean orientations of
N 288°E for the Barracuda Ridge and N 294°E for the Tiburon Rise (Bouysse and Westercamp,
1990) are oblique with respect to both the plate boundary and to the direction of convergence
(Fig. 1). This obliquity results in a southward propagation with time of the interaction of the lower
plate ridges with the east-north-eastwards overriding Caribbean Plate. Their effect on the Caribbean
plate has been debated over these past 20 years (McCann and Sykes, 1983; Moretti and Ngokwey,
1985; Westbrook and McCann, 1986). Recent seismic investigations locally confirmed their effect
on the upper plate edge deformation (Christeson et al., 2003; Bangs et al., 2003).
1.3. Previous surveys
A number of recent surveys focused on the arc domain to improve the knowledge on the active
tectonics of the French Lesser Antilles islands of Guadeloupe, Martinique and surroundings. In the
outer forearc domain and accretionary prism, only few seismic experiments were conducted as
described hereafter. The interplate and backstop could be imaged but only at few locations along the
subduction zone.
Drilling and seismic imaging of the subduction interpate décollement has been carried out far
offshore Dominica island at the toe of the accretionary wedge on the northern flank of the Tiburon
Rise, during several legs of both the Deep Sea Drilling Project and Ocean Drilling Program (Biju-
Duval et al., 1984; Mascle et al., 1988) and by 3-D seismic surveys (Bangs et al. 1996; 1999) over
the drilling sites (Fig. 1).
A first transect of the whole subduction zone offshore Guadeloupe island (Fig. 1), around latitude
16°N has been acquired in 1985 by two alternatively shooting ships and a 48-channels streamer
(Westbrook et al., 1988). It has provided the cross-sectional shape of both the northern Barbados
accretionary wedge and deep forearc basin revealing the interplate reflections from the trench down
to the backstop seaward edge. This published structural cross-section, with a trenchward dipping
ACC
EPTE
D M
ANU
SCR
IPT
ACCEPTED MANUSCRIPT
6
forearc crust and a wide accretionary wedge contributed to the broadly used generic view of the
Antilles subduction type. The geometry of the contact zone between the subducting oceanic crust and
the backstop of the deep outer forearc crust is only known at the location of a few more recent
profiles (Christeson et al., 2003; Bangs et al., 2003).
South of Martinique Island two transects up to the deformation front, at latitudes of ~14.5°N and
~13.5°N (Bangs et al. ,1990) provide additional sampling of the décollement reflection which is
observed over the first 100 km from the deformation front but is lost well before the transition zone
with the outer forearc domain.
The location of the contact at depth between the Atlantic oceanic crust and the outer forearc crust
of the Caribbean Plate being therefore known very sparsely, the negative gravity anomaly is
commonly used to indicate its position in plane view (Fig. 1) - in a therefore smoothed version -
along the 800-km-long active margin (Bowin, 1976; Bowin,1980; Bouysse and Westercamp, 1990).
The 3-D geometry of the backstop has been constrained offshore Guadeloupe island by a local
grid of coincident seismic reflection/refraction lines over a 75-km-wide squared region (Christeson
et al., 2003; Bangs et al., 2003) (Fig. 1). This experiment added, with respect to the initial cross-
section of Westbrook et al. (1988), an along-strike view of the geometry of the backstop edge and of
the subducting oceanic crust top at the contact zone (~ at 60°W) on a 50-km-long segment around
16°N.
2. The present study: objectives, survey acquisition and processing
2.1 Objectives
In this paper, we present the main structural features imaged by the multichannel seismic (MCS)
imaging on a subset of along-dip profiles (hereafter called dip-lines) and of along-strike profiles
(hereafter called strike-lines) recently acquired during the new SISMANTILLES-2 survey as well as
from the earlier SISMANTILLES-1 survey. This grid of profiles provides new detailed information
on the seismic structure of a 280-km along-strike segment of the subduction zone, from offshore
Martinique Island in the south, up to offshore Antigua Island in the north (Fig 1).
In the northern Guadeloupe area of the 1843 major earthquake, in addition to the previous
transects in Bangs et al. (1990), our two surveys provide four transects up to the deformation front.
They also investigated from north to south the region comprising the internal part of the thick
domain of the accretionary wedge and the external part of the forearc crust, hereafter named outer
ACC
EPTE
D M
ANU
SCR
IPT
ACCEPTED MANUSCRIPT
7
forearc domain. Both domains are overthrusting the subduction interplate. The four long transects
succeeded in imaging both the subduction interplate décollement, and the top of the subducting
oceanic crust (TOC) under the accretionary wedge until the outer forearc domain.
The outer forearc domain, which trenchward edge provides the crustal backstop to the
accretionary wedge, corresponds to the deep sea-bottom region (deeper than 3500 m). This domain
has been characterized by a low vertical gradient of the seismic crustal velocities in contrast with the
inner forearc domain that is characterized by higher crustal velocities at shallower depths and
corresponds to the shallow-water part of the forearc domain (Evain et al, 2011).
The present MCS survey succeeded in mapping the position of the updip contact between the
upper plate backstop and the subducting oceanic crust. This is commonly considered as a proxy to
the updip limit of the seismogenic portion (e.g. Hyndman et al., 1997) in the absence of detailed
information on the thermal structure.
We will document all along the survey area, that several localized basement ridges can be
identified within the outer forearc domain together with sedimentary layers that are tectonized up to
the shallowest ones. They illustrate the along-arc segmentation of ongoing deformation of the outer
forearc domain. Some of these features which are located in the prolongation of Barracuda or
Tiburon Ridges are interpreted as being related to the interaction of these subducting topographic
ridges with the outer forearc crust. Other outer forearc basement highs may result from the
interaction in the recent past with subducting ridges on the Atlantic lithosphere or might be induced
or reactivated by the deformation of the subducting Atlantic lithosphere under the Caribbean upper-
plate, at the diffuse plate boundary between NAM and SAM plates at depth.
2.2 Survey and data processing
2.2.1- The SISMANTILLES 1 preliminary survey
During the French SISMANTILLES-1 preliminary survey in 2001, the IFREMER vessel N/O Le
Nadir acquired several transects of deep-penetration multichannel reflection seismic (MCS) profiles,
North and South of the previous studies. The resulting MCS dip-lines B’, H’ and I’ (Fig. 1 and 2) are
integrated here in the structural interpretation and discussion of the newly collected MCS profiles of
the SISMANTILLES 2 survey.
All the shots of the SISMANTILLES 1 survey have been simultaneously recorded by a broad but
sparse array of 37 Ocean Bottom Seismometers (OBS) that were deployed offshore Guadeloupe and
ACC
EPTE
D M
ANU
SCR
IPT
ACCEPTED MANUSCRIPT
8
Martinique islands. These data provided additional constraints on the geometry of the subducting
oceanic crust beneath the sediments of the accretionary prism, and of the seaward dipping reflections
of the forearc basement. However, the refraction profiles could not be extended over the shallow
water part of the inner forearc, since the shooting ship was not allowed to operate there, because of
security reasons of damage of fishing installations to its MCS streamer. Because of the limitation of
offsets, constraints on structure could not be obtained down to the contact of the forearc Moho on the
interplate (Roux, 2007).
2.2.2- The THALES WAS RIGHT cluster of surveys
The French SISMANTILLES-2 survey with the IFREMER vessel R/V L'Atalante is part of a
cluster of surveys and cruises which have been carried out in 2007 and coordinated under the
European Union THALES WAS RIGHT1 project based on the results of the preliminary
SISMANTILLES-1 survey. This cluster comprised also the German cruise TRAIL2 with the vessel
F/S Maria S. Merian, and the French cruise OBSANTILLES with the IRD vessel N/O Antea.
This large seismic investigation effort has been designed for the understanding of the behaviour
of the seismogenic zone and location of potential source regions of mega-thrust earthquakes in this
subduction zone. The current low level of seismic activity precludes the characterization of this
boundary by the worldwide permanent networks. Our aim is to identify and characterize the main
rupture zones of possible future major earthquakes (Laigle et al., same issue), and to the search for
transient signals of the seismic activity (Becel et al., same issue).
The two ~280-km-long, Wide-Angle-Reflection and Refraction (WARR) profiles comprise over
50 OBS, were obtained by shooting across the whole arc with F/S M. S. Merian, provided the long
offsets needed to record the real forearc Moho wide-angle reflections and refracted phases. We
constrained thus the interplate geometry beneath the outer forearc domain down to the upper-plate
Moho located at ~28 km depth (Kopp et al, 2011; Evain, 2011). A teleseismic receiver -function
profile across Guadeloupe island constrained the geometry of the slab top down to 90 km depth
beneath the inner forearc domain at 40 km from the volcanic arc axis (Laigle et al., same issue).
A hundred OBS were also deployed on nodes of this MCS grid and first arrival-time tomographic
inversion of shot recordings of the southern half is presented in the joint publication by Evain et al.
(this issue). Eighty OBS remained for several months after and continuously recorded the local
seismicity (see joint publication of Ruiz et al., this issue). The main results as well as those of this
1 Acronym for Transients in the Hellenic and Antilles Locii of Earthquakes of European Subductions: Water
Activity, Structure and seismic Risk Illuminated by Geophysical High-Technology 2 Acronym for TRansients in the AntILles

ACC
EPTE
D M
ANU
SCR
IPT
ACCEPTED MANUSCRIPT
9
study are synthetized in the overview paper of this Tectonophysics Thematic Set (Laigle et al., this
issue).
2.3 Seismic Acquisition and processing
2.3.1- Acquisition configuration
During the SISMANTILLES-2 cruise of R/V L’Atalante, the data have been collected in two
legs. The first leg was located in the westernmost area (Fig. 1) where the sea-bottom is shallower
than 2000 m and consisted of shooting towards the OBSs, without streamer recording for safety
reasons imposed by IFREMER, as for the SISMANTILLES-1 survey. During the second leg, we
collected 3375 km of MCS data with a 4.5-km-long streamer.
Based on the results of the preliminary SISMANTILLES-1 cruise, the geometry of this survey
consisted in a grid of profiles comprising 7 strike-lines (300 km long and spaced by 15 km, named
from SL-1 to SL-7 in the trenchward direction) crossed by 12 dip-lines (150 km long and spaced by
25 km, named “dip-line B” to “dip-line M” northward) along a WSW-ENE direction (Fig. 1).
The MCS data were collected by a 360-channel digital streamer with a receiver group interval of
12.5 m using an air-gun source-array operated in single-bubble mode (Avedik et al., 1996). Two
symmetrical lines of 8 airguns each plus one airgun on each side of the vessel have been used in
different configurations. The largest source used for most of the profiles was of 8865 cu.in. (145 l) at
140 bars with a GPS controlled shot interval of 150 m providing a fold-coverage of 15 with a
common mid-point (CMP) interval of 6.25 m.
2.3.2- Processing
All the profiles were processed on board with CGG-Veritas Geovecteur and Geocluster softwares
up to post-stack time-migration with constant water velocity. The processing consisted first in
writing a constant geometry (constant shooting distance) into the headers, trace editing of noisy
traces due to streamer birds or the tail buoy proximity, and FK-filtering in the shot point (SP) domain
in order to remove the water-velocity waves travelling along the streamer which amplitude becomes
significant with respect to the low-amplitude of the deep reflections (> 10 s). Velocity analyses were
performed every 2.5 km (on average) on super-CMP gathers (of 180 traces), and normal move-out
corrections were applied with the corresponding picked stacking velocities. External mutes were
picked on the NMO-corrected super-CMPs to remove the stretched portion of the signal on far-offset
traces, including the CMPs in deep waters. A Kirchhoff post-stack time migration was applied with a
ACC
EPTE
D M
ANU
SCR
IPT
ACCEPTED MANUSCRIPT
10
constant water velocity to remove the huge diffraction hyperbola of the rough sea-bottom and of the
uppermost low-velocity sedimentary layers.
Pre-stack depth migration (PSDM) processing of profiles presented in this paper has been done at
IFM-GEOMAR (Kiel, Germany) in the frame of a EU-TMR project (for the dip-lines E, G, L). For
the PSDM, we applied the same iterative approach as for the dip-line G in depth-section presented
with details on processing methodology in Kopp et al (2011), which uses focusing analyses and
common reflection point gathers to determine seismic interval velocities. PSDM pre-processing
included predictive deconvolution, spherical divergence correction and multiple attenuation
conducted in the tau-p domain.
2.4 Swath Bathymetry Acquisition
We also collected Simrad EM12Dual multibeam swath bathymetry (Fig. 2) during the Leg 2.
Navigation was achieved using differential GPS, which allows a ship position accuracy of a few
meters. The swath bathymetry data were processed onboard by the GENAVIR team (Scientific
Engineering Group which operates the National Marine Equipment) with the IFREMER Caraibes
software. The processing consisted in ping editing and validation, sound velocity corrections and
gridding at 100 m using a near-neighbour method.
The swath-bathymetry provided a more detailed view of variations in sea-bottom morphology
than what was up to now available by satellite altimetry (Smith and Sandwell, 1997). This is the case
for the topographic highs in the outer forearc and accretionary wedge domains located in the
prolongation of Barracuda Ridge and Tiburon Rise, as well as for the deep forearc depressions
located at the foot of the steep bathymetric slope towards the shallow water inner forearc domain and
on the arcward side of the forearc topographic highs.
3. Backbone of the MCS grid: the central dip-line H-H’ and strike-lines SL-3/SL-4
The architecture of the Antilles subduction zone is summarized from the two MCS E-W profiles
located offshore Guadeloupe and southern Martinique islands (Westbrook et al., 1988; Bangs et al.,
1990) (Fig. 1). These lines though are located away from the interaction domains with the
subducting Barracuda and Tiburon ridges.
Our grid of profiles is oriented with respect to the convergence direction, so that the dip-lines are
oriented ENE-WSW. The latter therefore cross the possible prolongation of the two ridges on the
ACC
EPTE
D M
ANU
SCR
IPT
ACCEPTED MANUSCRIPT
11
lower plate, at different locations and depths and will contribute to assessing the significance of these
subducting ridges in the evolution of the subduction zone including its seismogenic character.
For the first time also, tightly spaced 280-km-long strike-lines provide a full-view of the along-
margin topographical variations of the outer forearc domain acoustic basement along the
Guadeloupe-Martinique segment. The northern half of SL-3 (Fig. 11) and the southern half of SL-4
(Fig. 12), which best document these backstop topographic variations), are used as a backbone for
the description of the selected dip-lines.
We start the description of the selected dip-lines by the central dip-line H-H’(Fig. 3). This profile
extends up to the deformation front, crosses the domain spanning from the prolongation of the
Barracuda Ridge to that of the Tiburon Rise, and is the closest complete profile to that described in
Westbrook et al. (1988). The latter almost starts at the same point in the west, but strikes E-W (Fig.
1). We will then discuss in the next section the structure imaged in the northern half along the 3 main
other dip-lines which also extend up to the deformation front (dip-lines I’ , K and L). In a
subsequent section, we will discuss the structure in the southern half along shorter dip-lines which
image the outer forearc domain up to its trenchward edge (dip-lines G, E and B’).
In the following description, all the values in seconds will be TWT, two-way reflection
traveltimes. Basement highs within the outer forearc domain will be identified on the MCS section as
well as on the map of Figure 2 and labelled with the name of the nearest crosspoint (“bh.
Crosspoint_name”).
3.1 Deformation front and accretionary wedge on dip-line H’
3.1.1- Décollement and TOC reflector
Reflections from the top of the subducting oceanic crust and from the décollement can be
followed along the ~100-km-long trenchward part of dip-line H’ up to the crossing with SL-6 (Fig.
3). These two distinct reflections that are landwards dipping are imaged to 10 km depth, beneath the
entire accretionary prism, which is here up to ~5 s thick and 100 km wide. These two events are very
easily recognizable and have the same characteristics as those earlier described on previous E-W
profiles (Westbrook et al., 1988; Bangs et al., 1999).
The reflections from the top of the oceanic crust reveal a very rough topography characterized by
discontinuous short reflectors at scale lengths of hundreds of meters with vertical scarps reaching the
ACC
EPTE
D M
ANU
SCR
IPT
ACCEPTED MANUSCRIPT
12
same scale. Such features were documented some 200 km farther south offshore Dominica Island in
the 1992 3-D survey area around the DSDP-ODP drill sites (DiLeonardo et al., 2002).
In contrast, the décollement reflection clearly imaged between SP1-480 is more continuous, has a
lower amplitude and a reverse polarity with respect to the reflections from sea bottom and the top of
oceanic crust, as already observed at the two other places along the deformation front (Westbrook et
al, 1982; 1988) and in other subduction zones worldwide. This décollement, already previously
interpreted as such since it clearly separates two domains of contrasted deformation, is continuous
above the top of oceanic crust reflections, and smoothly undulating by up to 1 s (e.g. SP 190 or
SP 330). The upper part above the décollement is affected by several thrusts (SP 1-130) that
participate to the active frontal part of the accretionary wedge, and merge into this décollement level.
The thickness of the accretionary wedge is gradually increasing landwards together with a gentle
sea-bottom up-sloping and a steepening dip of the top of the oceanic crust.
At 80 km west of the deformation front, we can still follow the décollement towards greater
depths, where we lose it beneath 4 s of sediments at SP 490. Arc-dipping reflector segments (~3 km
long) may correspond to the TOC seen from place to place through 5.5 s of sediments, at the
crossing with SL-7.
3.1.2- The buried Barracuda Ridge
Dip-line H’ (Fig. 3) confirms and images better the subducted Barracuda Ridge buried beneath
the accretionary wedge than the first documented evidences of its morphological expression
described earlier by Mauffret et al. (1984) on nearby profiles. This dip-line reveals a clear structure
marking the position of its northern scarp and several possible candidates for its southern scarp. The
ridge might be ~25 km wide along the oblique strike of the dip-line as reported by Maufret et al
(1984), or ~45 km to ~55 km wide if we consider the topographic highs located more downdip as
belonging to the Barracuda Ridge (Fig. 2 and 3).
The Barracuda Ridge is imaged at the easternmost end of the dip-line H’ (Fig. 3) from SP 1-180
as a clearly shallower part of the TOC. The TOC reflection arrives ~1.5s earlier with respect to the
adjacent oceanic crust (SP 190 to SP 135). With a mean velocity of 2 km/s, this corresponds to a
~1.5-km-high ridge, which is similar to the height of the Barracuda Ridge observed on the Atlantic
seafloor (Mauffret et al., 1984) and recently confirmed by multibeam bathymetry and seismic
imaging (Patriat et al., 2011). There, the décollement is not parallel to the TOC, nor does it follow
the general dipping trend above the highest point of the rough oceanic basement. Instead, a clear
splay fault (SP 140-180), seen as a ramp-flat ramp with a backthrust pop-up on top (SP 145), locally
duplicates the décollement above the arcward (southwest) facing scarp, at 30 km from the
ACC
EPTE
D M
ANU
SCR
IPT
ACCEPTED MANUSCRIPT
13
deformation front. Locally the décollement has a steeper arcward dip, and hence a much larger
thickness of sediments (~1000 m) is subducting here than at the trench, and may be present all along
the ridge.
This ~1.5-km-high and ~ 25-km-wide topographic high on the lower plate under the accretionary
wedge imaged along this dip-line is located on map in the prolongation of the well mapped
Barracuda Ridge on the Atlantic sea-floor (Fig. 2). There is unfortunately no available detailed
bathymetric data along this SISMANTILLES-1 dip-line that could allow us to follow in this part of
the accretionary wedge any sea bottom morphology associated to this subducting topographic high.
It remains indeed difficult to conclude whether the scarp of the TOC imaged at SP 180
corresponds to the south-western flank of the ridge. At greater depth, 1-km topographic undulations
at the TOC continue another ~20 or 30 km until SP 330 or SP 390. On the map (Fig. 2), this remains
in the vicinity of the possible prolongation of the southern flank of the Barracuda ridge, which would
be locally wider than its outcropping part on the Atlantic oceanic seafloor. But these deeper
basement highs carried by the subducting oceanic crust may also correspond to other basement
highs, such as those imaged on the Atlantic Ocean sea-floor (Fig. 1, 2) at ~30 km and ~70 km south
of the Barracuda Ridge by Patriat et al. (2011).
3.2 Outer forearc domain (dip-line H) :
3.2.1- Identification of the acoustic basement
On the arcward side of dip-line H west of the crossing with SL 6, undulating parallel seismic
horizons (in orange, Fig. 3) reveal a thick sedimentary deposit within the deep outer forearc basin.
Sedimentary layers onlap onto a seaward dipping thin band of high-amplitude and discontinuous
reflectors (in green, Fig. 3). The latter strongly contrasts at some places with the underlying
comparatively transparent medium, which is interpreted as being the crystalline part of the forearc
crust (Westbrook et al, 1988). This thin reflective band of less than a second is found all over the
studied forearc region (inner or outer domains) and is interpreted as corresponding to an acoustic
basement. This interpretation is consistent with velocity measurements of 4.2-4.5 km/s obtained from
MCS velocity analysis (Roux, 2007), and from first arrival times tomographic inversion of OBS shot
recordings (Christeson et al., 2003; Kopp et al., 2011; Evain et al., 2011, this issue). These velocities
contrast with the overlying well-stratified sedimentary layers in which velocities do not exceed 3.0-
3.5 km/s in the deepest parts. This well expressed reflection on the MCS data is not clearly seen on
the coincident OBS refraction recordings. These reveal instead clear refractions with much higher
apparent velocities of ~5.7 km/s, which are consistent with the top of the crystalline part of the
ACC
EPTE
D M
ANU
SCR
IPT
ACCEPTED MANUSCRIPT
14
forearc crust located at few hundred meter below the acoustic basement. The two-way travel time of
the acoustic basement reflector, well-expressed on MCS profiles, is also always significantly smaller
than the intercept times of the refracted waves with crustal velocities. The maping of this acoustic
basement is thus relevant because the igneous part of the overriding plate is thought to control the
updip limit of the locked zone.
The nature of the acoustic basement and of the overlying sedimentary layers is not documented
since there is no deep drilling on the forearc domain to provide any stratigraphic age correlation. We
can only infer its nature based on the geodynamical context to be a possibly meta-sedimentary
basement made of volcano-clastic deposits. The forearc acoustic basement reflection is sometimes
discontinuous but is usually easily recognisable beneath the forearc sedimentary layers reflections,
providing significant along-dip and along-strike topographic variation as documented below. All the
dip- and strike-lines of the southern part have been compared with the converted tomographic results
from Evain et al. (2011, this issue) in two-way travel times. An example is shown for dip-line E
(Fig. 8) and described in section 5.2. The surprisingly good overall correspondence of the identified
acoustic forearc basement with the iso-velocity contour of 4.0 km/s from the 3-D inversion is also
consistent with the interpreted reflector as corresponding to a meta-sedimentary basement and also to
determine the value of the inverted velocity within a 3-D velocity grid as best corresponding to this
first-order discontinuity interface.
3.2.2- Indications of ongoing deformation of the forearc sedimentary layering
The sedimentary thickness increases rapidly trenchward beneath the overall flat trend of the sea-
bottom and above the dipping basement. The latter can be followed over a distance of 50 km from
the crossing with SL-3 until the crossing with SL-5. This thick sedimentary pile may be the record of
a correspondingly large amount of subsidence of the outer forearc crust. However the layers are
discontinuous, disrupted by numerous steep faults or fractures (only the main ones of the shallower
part have been interpreted in the figures) and with clear unconformities and pinching out.
Alternatively the whole sedimentary layers that onlap westward onto the basement may also be due
to the uplift of the trenchward margin of the basin by compressional deformation. This domain is
located in the prolongation of the northern flank of the Tiburon Rise and may be related to the
interaction with its ongoing subduction underneath this forearc domain (Fig. 2).
There are indeed indications of ongoing compression with thrusts outcropping at sea bottom. At
the foot of the slope of the Karukera Spur (location in Fig. 2) the sedimentary layering is locally
folded and uplifted at sea bottom (in orange, Fig. 3) with outcropping thrusts on the arcward side (at
the crossing with SL-3). However the main structure responsible for this rising anticline is not really
ACC
EPTE
D M
ANU
SCR
IPT
ACCEPTED MANUSCRIPT
15
resolved. The locally folded and uplifted sediments at sea-bottom might also result from gravity
sliding from this rising anticline. A moderate basement high (bh. H4) is detected and rises up in the
southward direction as imaged on the strike-line SL-4 between dip-lines H and G (Fig. 12) (see
section 5.1 for more details). This basement topography is also located along the prolongation of the
northern flank of the Tiburon Rise (Fig. 2) and corresponds to the northernmost part of the Ridge B
of Christeson et al. (2003).
3.3 Transition between the forearc and accretionary prism at the toe of the backstop (on dip-
line H between crossing SL-5 and SL-6)
The transition towards the accretionary wedge occurs in the region of the outer forearc high. This
transition is not really marked in the global bathymetry of Fig. 1 but is here revealed by the shallow
sedimentary layers of the outer forearc basin being locally strongly folded above the more
deformable edge of the backstop (Westbrook et al., 1988). However, at these depths the forearc
basement becomes difficult to image because of the large thickness of sediment deposits. The
identification of this transition thus helps to map the updip limit of the contact between the forearc
crust and the subducting TOC.
On dip-line H, this transition occurs between the crossing points with SL-5 and SL-6 (Fig. 3).
There, the still organised reflective layering of the sediments contrasts with the disorganized
reflectivity of the internal part of the accretionary wedge. The shallow layers are more folded and
they are uplifted by a pair of conjugate thrusts, on which activity seems to have affected the most
recent deposits. At depth, this is also where we lose the forearc basement reflector.
4. Northern Domain of the Barracuda Ridge interaction with the accretionary prism (dip-lines
I’ and K) and with the outer forearc crust (dip-line L)
4.1 Imaging the subducting Atlantic oceanic crust under the accretionary wedge
The TOC reflectivity can be followed on the three dip-lines I’, K, L (Fig. 4, 6, 7) almost up to the
crossing with SL-7, where the thickness of the sedimentary wedge reaches 4-5 s as first described for
dip-line H. The décollement reflectivity, which is nicely imaged on dip-line H (Fig. 3), is disturbed
on the profiles farther north, possibly because the thickness of the subducting sediments is also much
smaller due to the Barracuda Ridge being subducted underneath on dip-line I’(Fig. 4), and to the
passage of the latter on the dip-line K and L (Fig. 6, 7) farther north, leaving a shadow zone in its
wake.
ACC
EPTE
D M
ANU
SCR
IPT
ACCEPTED MANUSCRIPT
16
4.1.1- Trench-facing TOC scarp of the northern edge of the subducting Barracuda Ridge
The strong topography of TOC revealed on the dip-line H’ is also imaged on the two next long
dip-lines to the north (I’ and K) and is attributed to a prolongation of the Barracuda Ridge under the
accretionary wedge. At the eastern termination of dip-line I’ (Fig. 4), the ~1-km-high trench-facing
scarp of the TOC (imaged at SP 920) has a similar shape as the one imaged on the previous dip-line
H’ at SP 10.
The next dip-line K to the north (Fig. 6) has a similar ~1-km-high trench-facing scarp of the TOC
(SP 1650-1750), but in a more arcward position (at ~15 km east of the crossing with SL-7), and
where it is therefore at a much larger depth than on dip-lines H’ and I’, here under 4-5 s of
sediments. By placing these positions on a map with respect to the Barracuda ridge axis (Fig.2),
these three similar trench-facing scarps at ~50 km from one another appear to be aligned, and may
thus be interpreted to correspond to its northern flank. The latter is not observed on dip-line L
located farther north because it may be too deep to be clearly imaged, or already subducted
underneath the forearc domain as suggested on the map view (Fig. 2).
4.1.2- Arc- facing TOC scarp of the southern edge of the subducting Barracuda Ridge
At variance with the dip-line H (Fig. 3), there are no indication either of an arc-facing scarp
towards greater depths that could be associated to the southern edge of the Barracuda Ridge on these
other dip-lines I’, K and L (Fig. 4, 6, 7). This is particularly true for the dip-lines K and L on which
this feature is already deeply buried beneath the accretionary prism and the forearc crust. On the dip-
line I’ (Fig. 4), we observe a rough TOC all the way down to where we lose its continuity (SP 600)
thus not resolving its southern flank. However, on dip-line I’ we image a back-thrust cutting the
whole accretionary wedge where it merges on the TOC falling on the prolongation of the southern
flank of Barracuda Ridge. Such structure is expected to develop in front of a localized high on top of
the subducting oceanic plate like those observed in analogue modelling of subducting seamounts
(Dominguez et al., 2000).
4.1.3- Other subducting TOC highs
On dip-line L (Fig 7), an arcward facing scarp of the TOC is imaged at SP 4200 and would
correspond to the highs which are well expressed on the Atlantic oceanic sea-floor bathymetry north
of the Barracuda Ridge. On the easternmost part of dip-line I’ (Fig. 4), such an arcward facing scarp
is imaged trenchward of the trench-facing Barracuda northern flank. A similar one is imaged in
ACC
EPTE
D M
ANU
SCR
IPT
ACCEPTED MANUSCRIPT
17
Fig. 5 on the small 40-km-long strike-line transect tying with dip-line H’ above the North Atlantic
oceanic seafloor, just before the deformation front.
4.2 Forearc domain
4.2.1- Dip-line I’
With respect to dip-line H’, the topography of the acoustic basement of the outer forearc is more
disturbed on dip-line I’ (Fig. 4), and its expression is less clear in some parts, e.g. within La Désirade
Trough. Two basement highs of the outer forearc crust bh. I’1 and bh. I’5 , which are associated
with localized, moderately shallower sea-bottom positions, are imaged within La Désirade Trough
and at the trenchward rim of the deep outer forearc basin (Fig. 2).
The geometry of the 3-4 s thick sedimentary deposits with respect to the basement and sea-bottom
indicates several episodes with different deformation styles or orientations. On both side of the broad
topographic basement bh.I’1 whereas the deepest layer deposits onlap onto the basement, the
intermediate layer deposits appear to be parallel to the down-slopping sea-bottom. The uppermost
layers offlap and are possibly covered by a draping thin layer of recent sediments.
The whole trenchward dipping layering is abruptly tilted upwards against the western (arcward)
side the bh. I’1 basement high and resume on the other side their trenchward gentle deepening. The
same observation can be made for the other basement high bh. I’5, but in the way around (See
Appendix I’ for more details). This basement high bh. I’5 is located beneath the trenchward rim of
the southernmost round-shaped deep basin east of La Désirade Trough which is marked in the
bathymetry by a 300 m shallower sea-bottom and conical shapes interpreted as mud volcanoes. The
asymmetrical geometry of this broad structure may indicate that the associated thrust is arcward-
dipping, in an opposite direction with respect to the bh. I’1 basement high. East of this sea-bottom
high, there are two arcward dipping events that reach from sea-bottom down to the basement
reflection, and which may be interpreted as thrusts. But the reflectivity is more disorganized and we
do not image if they prolongate deeper within the forearc crust.
Along dip-line I’, the organised reflectivity of the outer forearc sedimentary deposits reaches out
at least to the crossing point with SL-5. Disturbed reflectors are imaged in the four first seconds
beneath the sea-bottom until the cross points with SL-7, but whether they correspond to the backstop
edge of the forearc domain or instead to the accretionary wedge is difficult to assert.
4.2.2- Dip-line K
ACC
EPTE
D M
ANU
SCR
IPT
ACCEPTED MANUSCRIPT
18
Along dip-line K (Fig.6), two other basement highs are imaged bh. K3 and bh. K5 and are also
associated with a shallower sea-bottom position. A first basement high bh. K3 is associated to the
sea-bottom narrow ridge almost parallel to the line and located at 5 km south of dip-line K as
documented on SL-3 (Fig. 11) (See Appendix K for more details).
A second basement high bh. K5 is located at the crossing with SL-5 (Fig.6). The shallower
deposits are folded and tilted abruptly arcward there, but in a less dramatic way than on the nearby
southern dip-line I’. A conical shape, possibly marking a mud-volcano can be identified here also on
the detailed sea-bottom topography map at ~10 km to the south. If this feature is associated to a
thrust at depth, the latter is not imaged. This basement high bh. K5 is located in the prolongation of
the southern flank of the Barracuda Ridge (Fig. 2) and may be associated to the ongoing deformation
of the backstop. East of the crossing with SL-5, the basement reflectivity is marked by an abrupt
termination, its interpretation farther east becomes difficult (dashed green lines Fig. 6), and is rather
associated to the trenchward dipping top of a more transparent underlying domain.
The organised reflectivity of the sedimentary layers, can be followed above this presumed outer
forearc basement up to the crossing with SL-6 and possibly farther east. This interpretation would be
consistent with the WARR basement events recorded at an OBS during the SISMANTILLES-1
survey along a profile parallel to this dip-line K, at 5 km south of the intersection with SL-5, which
confirmed there the outer forearc crust to reach up to east of the crossing with SL-6.
4.2.3- Dip-line L
The sedimentary layers and basement imaged along dip-line L (Fig. 7) in the outer forearc
domain are broadly arcward tilted like the sea-bottom, from the crossing with SL-3, up to the
crossing with SL-5. The sea-bottom rises up by 1000 m over a distance of 25 km. The forearc
basement which is roughly parallel to the sea-bottom culminates thus also beneath the sea-bottom
rise and forms a basement high bh. L5(See Appendix L for more details). On the other side of this
high, this dip-line L reveals that the sea-bottom and sedimentary layers are down-sloping, back to an
almost similar depth like on the western side, and that they are affected by numerous low-angle
normal-faults, every 1 to 2 km.
On the detailed bathymetry (insert on Fig. 7), the smooth surface of the up-sloping sea-bottom of
the western side strongly contrasts with the rough down-sloping eastern side, with east-facing scarps
~ 100-m-high on average, which alternate in some places with smaller west-facing scarps. Some of
them are parallel to the Barracuda ridge axis and others have a N300°E strike on average, which is
oblique to both the ridge axis and to the convergence orientation. This imaged intense deformation
occurs by active fault scarps at the sea-bottom and tilting at the outer forearc basement, first
ACC
EPTE
D M
ANU
SCR
IPT
ACCEPTED MANUSCRIPT
19
arcwards then trenchwards, thus providing the first evidence of the direct interaction between the
subducting prolongation of the Barracuda ridge and the overlying crust of the Caribbean plate. These
structures may result from transient deformation in time and space since the upper plate is first
buckled upwards when approaching and sweeping over the ridge, then downwards, on the other side
back to the initial depth position. As modelled in sandbox experiments of seamount subduction, the
imaged low-angle normal faults on the trenchward down-sloping sides were presumably back-thrust
in an earlier stage of uplift, and then reactivated as normal faults in response to the subsidence in the
wake of the ridge (e.g. Dominguez et al, 2000).
The detailed bathymetry chart (which unfortunately stops south of dip-line K and east of SL-7)
also reveals that this sea-bottom rise corresponds to a narrow (10-km-wide) and elongated feature.
The latter is observed over a 90-km-distance from the crossing between dip-line K and SL-7 until
north of the crossing between dip-line M and SL-3 with the same N 286°E strike. This feature which
You are right has the same orientation as the Barracuda Ridge and is located, to the first-order, in its
prolongation towards the arc confirms its location at depth on the interplate portion located
underneath the forearc crust.
5. Southern Domain of the Tiburon Rise interaction with the forearc domain (dip-lines G, E,
B’)
5.1 Dip-line G : Deformed outer forearc crust after the passage over Tiburon
The dip-line G (Fig. 8) has been processed jointly with the coincident 280-km-long refraction
transect with 44 OBSs (Kopp et al., 2011), and for which the re-stretched to time version is also
shown here.
The arcward portion of dip-line G, is located above a large width of the subducting prolongation
of the Tiburon Rise (arcward of SP 2750, Fig. 2). The OBS refraction transect does not detect such a
topographical high (Kopp et al., 2011), because the latter is expected to be located underneath the
backstop, arcwards of the crossing with SL-6 whereas the wide-angle reflections on TOC used for
constraining its topography stop trenchwards of this crossing point. The geometry of the interplate is
further downward constrained by the wide-angle reflections on top the oceanic Moho and by
assuming an overall constant thickness. Therefore, this ~2-km-topographic higher portion of TOC is
not detectable and constrainable by our WARR imaging, even if it is sampled over a ~50 km wide
portion. Along dip-line G (Fig. 8), the forearc basin deposits contrast with those of the nearby dip-
line H, since they are uplifted, folded and faulted at three different places and associated to the outer
forearc basement highs bh. G4 (the largest), bh. G5 and bh. G6. The huge bh. G4 basement high has
ACC
EPTE
D M
ANU
SCR
IPT
ACCEPTED MANUSCRIPT
20
been also previously imaged by Christeson et al. (2003), and Bangs et al. (2003), and named ridge B.
This significant basement high has been interpreted as being related to the subduction of a buoyant
ridge well before the arrival of Tiburon, and induced by the accretion of this buoyant material under
the forearc crust. We now image this bh. G4 basement high as being above an intracrustal arcward
dipping thrust from 10 to 15 km depth (Kopp et al, 2011), as initially suggested in a schematic
interpretation by Bangs et al. (2003) and now located above the subducting Tiburon Rise at depth.
A change in the geometry of recent deposits (See Appendix G for more details) may indicate a
recent increase of the crestal uplift during thrust folding with respect to the coeval sedimentation
rates. This recent faster uplift rate might be in response to the sweep of Tiburon Rise under the
forearc crust in the past ~3 Ma (60 km wide in the direction of convergence, at the rate of 20 mm/yr).
Since it is now located above the prolongation of the northern flank of Tiburon Rise, this uplift
should now decrease and even start a “subsidence” (downthrown back to its initial position). This is
what is observed on the trenchward side of bh.G4, though to a lesser extent than on dip-line L for the
case of the Barracuda Ridge. The sediments which are folded and uplifted above the subducting
prolongation of Tiburon Rise appear abruptly downthrown by faults with a normal component east
of the crossing with SL-4. This might be an indication of the ongoing vertical mobility of this
basement high bh. G4 regardless whether or not it is a previously accreted buoyant ridge.
A mud volcano is imaged at sea-bottom and on SL-4 (Fig. 12) at the north-eastern rim of the
basement high bh G4 (See Appendix G for more details). The geometrical relations between these
nearby features (basement highs, mud volcano, intracrustal thrust and subducting Tiburon Rise)
appears most probable but not proven since the architecture of these clearly 3-D structures is imaged
along 2-D lines.
There is a second smaller basement high bh G5 associated with folded sediments on top. This
deformation might be associated with a subducting topographic high similar to the one imaged 10
km north of Tiburon Rise on the Atlantic sea-floor (Patriat et al., 2011). This oceanic basement
topography is interpreted as being due to a north-south compression since ca 2.3 Ma affecting the
diffuse >200-km-wide plate boundary between NAM and SAM plates in the area.
The basement high at the backstop edge, called ridge A in Christeson et al. (2003) and Bangs et
al. (2003), is also imaged here along this dip-line G (bh. G6) as being limited to the east by a steeply
seaward dipping fault which reaches up to the sea-bottom from the backstop at depth. Bangs et al.
(2003) related this feature to the passage of Tiburon during the past 3.5 my. Similarly to bh. G5, this
may also be reactivated and associated to the interaction from a localized high of the oceanic plate
basement with the seaward edge of the backstop.
ACC
EPTE
D M
ANU
SCR
IPT
ACCEPTED MANUSCRIPT
21
5.2 Dip-line E : Evidence for the presence of subducting Tiburon Rise beneath the deep outer
forearc crust and the Arawak basin
On dip-line E (Fig. 9) the clear basement reflector documents two basement highs, one at the
crossing with SL-1 (bh. E1) indicating the southernmost extent of the Karukera Spur and the second
one at the crossing with SL-4 (bh. E4) located in the prolongation of the Tiburon Rise.
The broad basement rise bh. E1 with a thin sedimentary cover (of less than 0.5 s) (Fig. 9)
separates the sedimentary deposits of its western (arcward) side of the inner forearc domain from the
eastern (trenchward) side of the outer forearc domain. This basement rise bh. E1 is located in the
southward prolongation of the basement high of the Karukera Spur (Fig. 2). The strike-line SL-1
(shown in Evain et al, this issue) documents that the shallow basement of Karukera Spur extends
south of Marie-Galante Island (dip-line G) until dip-line E (Fig. 2), that it is southwards downthrown
by south-facing faults up to the crossing with dip-lines D, and then deepens rapidly under a 3-4 s
thick sedimentary layering (See Appendix E for more details).
A 1-km-high and a 15-km-wide basement high bh.E4 is imaged beneath the trenchward rim of
the deep Arawak basin, a deep forearc trough with an along-margin elongated shape. The 2-3 s thick
sedimentary layers are uplifted above the basement high and thus do not reveal an asymmetrical
sedimentary basin in the hangingwall of a major normal fault but an arcward tilting of the whole
outer forearc sedimentary deposits induced by an uplift of the backstop localized where the bh.E4
basement high is observed. A sudden onset of uplift with respect to the sedimentation rate may be
responsible for the observed unconformities, which are also tilted upward above the bh.E4 basement
high. The detailed bathymetry reveals that this eastern portion of the Arawak margin is also cut by a
series of narrow canyons close to each other (blow-up on Fig. 2) whose mean direction of N50°E ±
10° probably indicates the direction of the back-tilting at the crustal scale. This oblique direction
with respect to both the perpendicular to the Tiburon ridge (N 24°E) and to the direction of
convergence results probably from the oblique direction of the ridge with respect to the convergence.
The arcward fanning of the shallower sedimentary sequence against the steep sea-bottom slope from
the inner forearc domain documents that the uplift is active until the most recent clastic deposit
which form the narrow and elongated flat sea-bottom shape of the Arawak Basin.
The sedimentary layers which were continuous west of the basement topographical step are
imaged to be strongly faulted by arc-dipping low-angle faults which sometimes are imaged to cut
into the basement (Fig. 9). Some of them outcrop at the sea-bottom and produce the visible scarps on
the north-eastern margin of the Arawak Basin, with strikes ranging from that of the Tiburon Rise
axis (N 294°E) up to that of the perpendicular to the direction of the seabed canyons (N 310°E to N
330°E) (blow-up on Fig. 2). The 1-km-long minced portions are back-tilted towards the trench
ACC
EPTE
D M
ANU
SCR
IPT
ACCEPTED MANUSCRIPT
22
beneath the sea-bottom up-slope. These structures are imaged by the crossing strike-line SL-4 (Fig.
12) (See Appendix E for more details) and allow to establish a strike which is consistent with the
Tiburon Rise.
East of SL-4, above the seaward portion of the backstop edge, the highly faulted, back-tilted
portions of the sedimentary layers are overlain by deposits parallel to a trenchward dipping sea-
bottom. This actively deforming area is located in the prolongation towards the arc of the Tiburon
Rise (Fig. 2). As for the deformation imaged on dip-line L and interpreted to be induced by the
Barracuda Ridge, we propose that this uplifted region of both the sea-bottom and basement in the
north-eastern region of the Arawak Basin, and the similarly deformed trenchward part of the forearc
basin are induced by the ongoing subduction at depth of the Tiburon Rise.
The resolved structure of the Arawak Basin deposits is reminiscent of a piggy - back basin against
a broad crestal uplift under its north-eastern margin. Unfortunately we cannot assert here the
direction of the dipping structure as it could be constrained in the case of dip-line G since we do not
resolve on these two perpendicular lines (Fig. 9 and 12) the intracrustal deep rooted thrusts
responsible of this deformation of the whole forearc basin and crust.
On the next profile to the south, dip-line D (see General paper, Laigle et al., same issue, for a
complete view), the superimposition of the tomographic results onto the MCS section reveals
similarly that the edge of the backstop is being uplifted (on a 15-km-long portion east of the crossing
with SL-5) together with a possible TOC topographic high. This uplifted outer forearc basement is
also in the prolongation of the Tiburon Rise axis (between SP 1450-1550 on Fig. 2).
5.3 Dip-line B’: Early stage of the outer forearc deformation ?
A probably clearer image of the ongoing deformation of the outer forearc domain can be shown
on the dip-line B’ (Fig.10) offshore Martinique, which gathers the main structures of both dip-lines
B and C. Here the deformation of the forearc basement and sediments is taking place beneath the
arcward margin of the Arawak Basin.
The ~3s thick trenchward deepening sedimentary layers appear suddenly folded and faulted east
of the crossing with SL-2 above a 15-km-wide basement high bh.B’3. These minced portions are
also back-tilted and uplifted towards the trench as observed on dip-line E. As proposed for the dip-
line E, this deformation is reminiscent of a basement crestal uplift above a deep rooted intra-crustal
thrust which is here imaged as on dip-line G. The seismic section resolves indeed the merging of
shallow faults on top arcward dipping reflectors, which are cutting through the acoustic basement, at
ACC
EPTE
D M
ANU
SCR
IPT
ACCEPTED MANUSCRIPT
23
7-8 km east of the intersection with SL-2. The last frontal outcropping thrust is at 1.5 km east of the
intersection with SL-3, implying that the forearc portion farther east at the southern tip of the
Arawak Basin is being underthrust beneath this western side, and above the subducting oceanic crust
at depth.
The contact with the subducting oceanic crust is imaged on the dip-line at the intersection with
dip-line B. With respect to the location identified on dip-line D at the crossing with SL-5, the edge of
the backstop is here located between SL-3 and SL-4, inducing a lateral shift towards the arc on map
view by 20 km.
6. Discussion
6.1 General features
The arcward-dipping decollement and TOC are imaged on the 4 northernmost dip-lines H’, I’ K
and L from the deformation front until the crossing with SL-7, over a distance of approximately 75-
80 km. The reflection signal can be followed down to the sea-bottom multiple (6-7 s beneath the sea-
bottom reflection), that is to 12-15 km depth. The thickness of the subducting sediments varies both
along-dip and along-strike, mainly because of the presence of the oceanic basement highs and lows.
The larger thickness of sediments trapped under the décollement against the southern flank of
Barracuda as imaged on dip-line H’ may exist all along the ridge beneath the accretionary wedge and
as well under the forearc domain.
The outer forearc domain can be unambiguously identified, by its basement being a clear reflector
on each dip-line until their crossing with strike-line SL-4 (SL-3 for dip-lines B and B’). On some
dip-lines, the existence of the forearc basement backstop at depth is inferred beyond the crossing
with SL-6 from the presence of the thick stratified sedimentary deposits (dip-lines L, K, G, E),
reaching out to distances of 160-190 km from the volcanic arc, and up to 5 s beneath the sea-bottom
reflection (~7 km below sea-bottom with an average velocity of 2.7 km/s for the forearc sediments).
The thick package of sediment layers imaged above the outer forearc basement supports its existence
since several millions of years as proposed by Mascle et al. (1985). The similarly thick layered
sediments imaged in La Désirade Trough and the whole outer forearc domain suggest a probably
coeval development rather than by a more recent arc-parallel extension.
Each of these dip-lines gives a different view of the outer forearc domain and of the subducting
TOC, at the scale of one to a few tens of kilometres, revealing that a generic model of this
subduction cannot be summarized by a single cross-section, not even a few.
ACC
EPTE
D M
ANU
SCR
IPT
ACCEPTED MANUSCRIPT
24
6.2 Mapping of major topographical highs of the top of the subducting oceanic crust beneath
the accretionary wedge
The imaged top of the subducting oceanic crust under the whole accretionary wedge on the 4
northernmost dip-lines reveals topographical heterogeneity at several scales, with the largest one
corresponding to the prolongation of the subducting Barracuda Ridge. By importing the locations of
the imaged north-east facing scarp defined from the 3 seismic dip-lines K, I’ and H’ on the position
map (Fig. 2), the corresponding SPs appear to be approximately aligned with the prolongation of the
northern flank of the ridge which is now well-mapped on the Atlantic seafloor (Patriat et al., 2011).
We note that they are slightly shifted to the south with respect to the average azimuth of N288°E
of Bouysse and Westercamp (1990) (dashed-line in white on Fig 2). This can be due to the
uncertainty in identification of the position of the northern and southern flanks of the ridge, but also
to the discontinuous character of its geometry.
For the Tiburon Rise, the southern dip-lines were not long enough towards the trench to image in
a similar way the structure of its buried prolongation beneath the trenchward part of the accretionary
wedge. But here also, its now well-mapped morphology on the Atlantic seafloor (Patriat et al., 2011)
allows extrapolating the prolongation of its northern and southern flanks, though more loosely.
The forearc sea-bottom and basement highs which are well expressed along the north-eastern rim
of the Arawak basin appear located south with respect to the N 294°E average strike taken from
Bouysse and Westercamp (1990). The more discontinuous character expressed on the Atlantic
seafloor for the Tiburon Rise than for the Barracuda Ridge may exist farther arcwards and may
explain this slight southward shift at the foot of the sea-bottom slope.
6.3 Mapping of topographical variations of the outer forearc crust top
As reported on map in Figure 2, the grid of MCS profiles documents large topographical
variations of the outer forearc basement, with a wavelength that may be shorter than the grid spacing.
This can be further documented on the northern half of the strike-line SL-3 (Fig. 11) and on the
southern half of SL-4 (Fig. 12). For instance, we resolve basement highs and lows on strike-line SL-
3 (Fig. 11) that are not sampled by the crossing dip-lines such as the basement highs between dip-
ACC
EPTE
D M
ANU
SCR
IPT
ACCEPTED MANUSCRIPT
25
lines I’ and J and south of dip-line K, or as on strike-line SL-4 (Fig. 12) between dip-lines H and G
or D and C.
Over this investigated 280-km-long segment of the Lesser Antilles subduction zone, we have
found several topographical basement highs, like the two examples previously reported offshore
Guadeloupe Island (Christeson et al., 2003; Bangs et al., 2003; Kopp et al., 2011). For some of them,
we can document that they are associated to the under-thrusting of crustal sheets of the trenchward
part of the outer forearc domain along arcward dipping intra-crustal thrusts. Some of these basement
highs that rise up to a few kilometres, are associated with sea-bottom highs and are located above the
two subducting major oceanic basement ridges. For the Barracuda Ridge, this is the case for the
basement highs imaged on dip-line L (bh. L5, Fig. 7), and also on dip-line M (bh. M4,), and
possibly on dip-line K (bh. K5, Fig. 6). For the Tiburon Rise, this is clearly the case of the basement
highs imaged along the south-facing flank such as those resolved on dip-line D (bh. D5), or on dip-
line E (bh. E4, Fig. 9), and also on dip-line F (bh. F2-F4). This is also possibly the case of those
imaged along the north-facing flank such as along the strike-line SL-4 (bh. G4 and bh. H4, Fig. 7),
or perhaps on dip-line I’ (bh. I’1, Fig. 4). As discussed in the next subsection, the origin of these
basement highs may be directly related to the subduction of the Barracuda and Tiburon ridges
underneath the corresponding portions of the outer forearc domain.
There are also basement highs located far southwest of these subducting Barracuda and Tiburon
ridges. Southwest of Barracuda Ridge, basement highs associated with sea-bottom highs can indeed
be found between the deep bathymetric lows, like on dip-line I’ (bh. I’3, Fig. 4) or on profile dip-
line K (bh. K3, Fig. 6), or at the trenchward rim of these outer forearc basins, like on dip-line I’ (bh.
I’5, Fig. 4). We have not observed any associated intra-crustal structure as imaged farther south
along dip-line G (Fig. 8). At ~70 km farther southeast, the deeply buried basement highs (bh. G5 and
G6) marking the edge of the backstop have been interpreted by Bangs et al. (2003) on their E-W
profile as being associated to the passage of the Tiburon Rise in the recent past. This could be also
the case for the other basement highs (bh. I’3, bh. I’5 and bh. K3) located between the Barracuda
and Tiburon ridges, although they are located at a greater distance from Tiburon Rise than in the case
of bh. G6. In addition to the interpretation of scars left by the earlier passage of Tiburon Rise, as we
suggested for the case of the Barracuda ridge, two other interpretations may also be considered for
these forearc basements highs located between the two ridges. They could be induced or re-activated
by the deformation in front of the interacting Barracuda Ridge with the thicker inner forearc domain.
On the other hand, they could also be formed in response to the subduction of other oceanic
topographic highs similar to the smaller basement ridges imaged east of the deformation front
between the Barracuda Ridge and Tiburon Rise. On the structural interpretation map provided by
Patriat et al. (2011), they appear to be distributed with an en-échelon pattern along two main 200-
km-long stripes running parallel between the two major Barracuda and Tiburon ridges.
ACC
EPTE
D M
ANU
SCR
IPT
ACCEPTED MANUSCRIPT
26
Southwest of Tiburon Rise, the basement highs imaged along the dip-lines D (bh. D4), E (bh. E4)
and along strike-line SL-4 have been shown by the 3-D shot tomography with the southern OBS
network, to belong to a continuous basement ridge (Evain et al., this issue). The latter corresponds to
the curved sea-bottom high of the trenchward margin of the Arawak Basin. This continuity in the
basement topography may indicate that the basement high (bh. D4) located at 10 km south of the
prolongation of the southern flank of Tiburon Rise may correspond to an early stage of the
interaction between the subducting Tiburon Rise with the outer forearc crust. The basement high (bh.
B’3) imaged at the southern tip of the Arawak Basin beneath its arcward margin is located at a
significant distance from the Tiburon axis (on the order of 70 km). The shot-tomography basement
map reveals that this high does not belong to the one beneath the NE rim of Arawak basin but to
another one beneath its south-western rim. Its relation with the Tiburon Rise that would be locally
wider is thus unlikely. Alternatives are that there is an ongoing crustal interaction with another
subducting ridge or topographic high that would be located farther south, as also suggested by Evain
et al. (this issue).
The St Lucia ridge, which is concealed beneath the sediments and has been recognized by seismic
profiles south of Tiburon Rise (Bouysse and Westercamp, 1990), is located too far in the south to be
a possible candidate (at 14°N in the forearc domain on Fig 2). The study of Patriat et al. (2011) stops
at the Tiburon Rise. A north-south profile located south of Tiburon Rise at ~15 km east of the
deformation front used by Sumner and Westbrook (2001), reveals however similar 1-km-high
basement highs as those located between the Barracuda and Tiburon ridges (Fig 2). If this feature
continues beneath the accretionary prism, it might correspond to the subducting oceanic basement
highs responsible of the deformation of the forearc domain at the southernmost tip of the Arawak
basin.
6.4 Active and transient deformation of the deep outer forearc domain recorded by the
stratified sediments deposition and deformation
Together with the identified forearc basement highs, the imaged associated deformation of the
sedimentary layering provides evidence of compression and differential vertical uplift.
In analogue modelling of seamount subduction (Dominguez et al, 2000), the margin uplift is first
occurring with back-thrusts propagating upwards though the backstop and far in front of the
approaching subducting seamount. The latter are re-activated with a normal component during the
subsequent episode of subsidence behind the seamount trailing slope. Here however, with respect to
that simple case, the topographical reliefs are not points but extended structures. Their orientation is
ACC
EPTE
D M
ANU
SCR
IPT
ACCEPTED MANUSCRIPT
27
neither along-dip nor along-strike with respect to the subduction trench, so that space-time variation
of their effect on the upper plate dominates the complex deforming processes and resulting structure.
In the northern part, on dip-line L (Fig. 7), the sedimentary layers of the western half of the outer
forearc are affected up to the sea-bottom by a broad arcward tilting (from the crossings with SL-3/4
up to east of the crossing with SL-5). This occurs in the region where the prolongation of the
southern flank of the Barracuda ridge intersects the inner forearc domain (Fig. 2). This is also the
case on dip-line K for the trenchward half of the outer forearc sedimentary layers (Fig. 6, from the
crossings with SL-4/5 up to east of the crossing with SL-6), which is similarly located above the
prolongation of the southern flank of the Barracuda ridge. This tilting of both the sea-bottom and
sedimentary layers are associated with a basement crestal uplift, as above a deep-rooted intra-crustal
thrust that is not resolved on these profiles. Trenchward of the sea-bottom culmination on dip-line L
(Fig. 7), the sedimentary layers can be seen to have been downward faulted by trench-facing low-
angle normal faults as the forearc crust has been swept over the subducting oceanic basement high.
They return back to their depth level as before the uplift. This is occurring over the portion
corresponding to the prolongation of the northern flank of the Barracuda Ridge (from the crossing
with SL-5 to SL-6/7). This subsidence in the wake of the ridge results in an associated rough sea-
bottom in contrast with the smoother arcward portion being uplifted above the southern flank of the
Barracuda Ridge (Fig. 7). This downward faulting is not as clearly observed on dip-line K as on dip-
line I’ because the northern flank of the prolongation of the Barracuda ridge is still beneath the
sedimentary deposits of the accretionary wedge, and thus without a forearc crustal sliver to transmit
its brittle deformation to the sedimentary overburden.
The normal-fault scarps apparent in the bathymetric map north of the Bertrand-Falmouth Spur are
hence shown here to be not due to extensional tectonics but to successive episodes of vertical
uplifting and abrupt subsidence of sedimentary layers deposited above a brittle thin forearc crust
which underwent successive deformational episodes due to its sweeping over topographical features
of the lower plate.
In the southern part, the sedimentary layers are affected by arc-facing low-angle faults imaged on
dip-lines E and B’ (Fig. 9 et 10), which seem to be connected to an arcward-dipping deep rooted
thrust as imaged on B’ (Fig. 10). The arcward tilting of the sedimentary layers of the Arawak Basin
portion is suddenly interrupted by a major basement and sea-bottom uplift and contrast with the
smoother features imaged for the Barracuda Ridge along dip-line L (Fig. 7). The expected
subsidence above the northern edge of the Tiburon Rise is not as clearly expressed as for the
Barracuda ridge.
ACC
EPTE
D M
ANU
SCR
IPT
ACCEPTED MANUSCRIPT
28
The outer forearc backstop is thus tectonized by trench-normal (or ridge-normal) compression
and transport during convergence. Indeed sea-bottom scarps may also appear as normal-faults but
they result from the transient upwarping then downwarping of the forearc backstop while sweeping
over topographic highs and lows of the Atlantic oceanic lithosphere. The oceanic basement highs are
actively deforming in transpression as part of the NAM-SAM relative motion. Estimates of finite
shortening between North America and South America plates entering subduction depend on the
particular pole location and rate estimates considered, among the several global kinematic models,
which predict left-lateral transpression relative to the trend of the Barracuda Ridge. Patriat et al.
(2011) infer that over the recent 3 Ma period when the Barracuda Rise topographical uplift occurred,
the amount of finite strike-slip component of motion between NAM and SAM has been on the order
of 1 to 4 km parallel to Barracuda Ridge. We may remark that their component of convergence
normal to the ridge then reaches up to twice this value at the subduction front under the Caribbean
plate. Furthermore, for most estimates of the different pole location, the NAM-SAM relative motion
would increase westward, beneath the accretionary wedge and farther arcward. Such a peculiar,
recent and active deformation of the subducting Atlantic lithosphere absorbing the SAM-NAM
convergence may explain the well-expressed effects of these ridges in the peculiar forearc
deformation we document, in comparison to the subduction of an inactive topographic high of a
moderate height.
The deep structure and seabed morphology of the northern deep outer forearc domain (located
south of the Barracuda Ridge prolongation) contrasts with its analogous southern part, the Arawak
Basin (located south of the Tiburon Rise prolongation). These along-strike variations of the
deformation style affecting the outer forearc crust between the northern and southern parts might be
associated to a varying nature of the forearc crust. This could be inherited from the past history of
subducting buoyant terranes and their accretion to the Caribbean Plate's eastern margin (Bangs et al.
2003, Kopp et al., 2011, Evain et al., this issue).
The bathymetric lows of both northern and southern outer forearc domains are not randomly
distributed. They have an elongated distribution parallel to the margin and they are located south of
the intersection of the subducting ridges and the seaward edge of the inner forearc domain. The
southern end of the northern bathymetric lows (from the crossings L3-L4 to I3) lies against the
prolongation of the northern flank of the Tiburon Rise. The southern end of the southern ones (from
the crossings E2-E3 to B’2) lies against a subducting oceanic high south of Tiburon Rise. Because of
their peculiar location and internal structure, they can be seen as piggy-back basins developing in the
hanging wall of the seaward uplifting backstop in response to the oblique subduction of the ridges.
ACC
EPTE
D M
ANU
SCR
IPT
ACCEPTED MANUSCRIPT
29
6.5 Mapping the Trenchward edge of the forearc backstop (a proxy to the updip limit of the
seismogenic portion
The local minimum of the negative gravity anomaly from global data (hereafter MNGA) (Bowin,
1976; Bowin,1980; Bouysse and Westercamp, 1990), commonly taken as marking the plate
boundary under the accretionary wedge is indicated as a white line in Fig. 1, and closely follows
strike-line SL 5 except south of dip-line E where it veers towards the arc and follows a direction
tying E5 to B’4. In the following section, we discuss the evidence provided from the MCS grid
imaging that allows to define this limit of the upper plate crustal backstop of the subduction zone.
The result is materialized by a short double-line symbol across each of the MCS dip-lines on Fig. 2,
which reveals that the upper plate crust, hence the proxy of the upper limit of the interplate
seismogenic zone reaches up to 25 km farther east, east of SL 6, with significant variations along the
arc.
The clearly organized sedimentary reflectivity of the deep outer forearc basin indicates
unambiguously the presence of the forearc crust at depth. Its trenchward extent oscillates with
respect to the arc axis and may vary by up to 20 km (Fig. 2). In the northern half of the survey along
the dip-line H, the clear sedimentary layering is observed up to the crossing with SL-6 (15 km east of
MNGA). The trenchward dipping forearc basement is accordingly followed up to this position. This
remains more difficult for the dip-line I’ and nearby dip-lines I - J where the clear organized
sedimentary reflectivity stops west of the eastern rim of the deep outer forearc basins, north of the
Karukera Spur. On dip-line K and L, the forearc sedimentary reflectivity is interpreted to possibly
extend up to the crossing with SL-6 (16 km east of MNGA), above a blurred image of a possible
forearc backstop, despite the significant deformation affecting the forearc sediments on dip-line L.
In the southern half, the transition between the outer forearc crust and the accretionary wedge
occurs as a back-thrust together with folded forearc sediments and uplifted portions of the arcward
part of the accretionary prism. At variance with the northern part, the seabed morphology in the
southern part is marked by an outer forearc high, as a long and narrow ridge, whose position at the
sea-bottom corresponds approximately to the identified termination of forearc sedimentary units on
the dip-lines and then to the edge of the backstop. The latter is running along SL-6 (20 km east of
MNGA), between dip-lines G and F, and is veering into a more north-south direction from dip-lines
F to south of dip-line C, where it has been identified on SL-4. On dip-line C, the identified seaward
edge of the backstop corresponds to the MNGA. South of dip-line C, the outer forearc high might
indicate that it veers towards the east and the identified seaward edge of the backstop is here 10-15
km closer to the arc than the MNGA. The transition is more difficult to identify on dip-line D, but
this has been possible thanks to the joint interpretation with the tomographic results of 3-D inversion
of WARR data recorded by the southern OBS network (Evain et al. this issue). Further south, on dip-
ACC
EPTE
D M
ANU
SCR
IPT
ACCEPTED MANUSCRIPT
30
lines B’ (and B, C) the transition within the sediments is even less clear than on dip-line D. However
at depth, a very clear basement reflectivity and nearby TOC reflections allow to establish the
presence of the backstop seaward termination (Fig. 2). The origin of this lateral shift which is
parallel to that of the deformation front where the Tiburon Rise is entering beneath the accretionary
wedge is probably related to the deformation either induced at far distance by the Tiburon Rise or by
a buried topographical high of the subducting oceanic crust southwest of Tiburon.
According to Bangs et al. (1990) and Kopp et al. (2011), the transition at depth between the
sediments of the forearc basin and those of the internal part of the accretionary wedge corresponds to
a lateral change in the vertical velocity gradient, which decreases trenchward. For instance, the
vertical velocity gradient with velocities ranging from 3 km/s to 3.9 km/s for the lower half of the
forearc sedimentary basin (from ~9 to 12 s) is not observed in the accretionary domain where
velocities do not exceed 3.5 km/s down to the bottom of the wedge at ~12 s. Measured stacking
velocities during velocity analyses on full-fold common depth gathers (CDP) of dip-lines and
converted into interval velocities confirmed this similar observation over the study area. Earlier such
observations in the same region made by Bangs et al. (1990) led them to propose that “dewatering
remains active within the oldest regions of the complex because of thickening from continuing
deformation and possibly from contributions of pore fluids expelled from underthrust sections into
the wedge”.
The low-velocity accretionary wedge contrasts with that of the Sumatra subduction. In northern
Sumatra, the 2004 M 9.3 tsunamogenic giga-earthquake ruptured the whole interplate up to the
deformation front, including the broad accretionary wedge. There, the material on top of the
interplate is characterized by seismic velocities larger than 4.5 km/s up to the deformation front (e.g.
Dessa et al., 2009; Klingelhoefer et al., 2010) which is rather high for accreted sediments. Whatever
their interpretation might be, this high-velocity nature of this material which participated to the 2004
rupture in Sumatra make the 100-km-wide low-velocity accretionary wedge of the Antilles
mechanically very different and less likely to participate in a seismic rupture (with a coseismic slip)
up to the deformation front. Within the northern Japan Trough where there is also a low-velocity
accretionary wedge as in the Antilles (Tsuru et al., 2002), the Tohoku M 9 tsunamogenic giga-
earthquake rupture reached the deformation front at the trench with a large displacement (e.g.
Fujiwara et al., 2011). But the accretionary wedge there is only 20 km wide, the convergence rate is
four times larger than in the Lesser Antilles and the coseismic slip reached exceptionally high values,
up to 50 m.
The portion of the decollement located beneath this hydrated accretionary wedge is unlikely able
to sustain stick-slip behaviour. The location of the contact between the seaward limit of the backstop
and the subducting TOC can be therefore considered as potentially indicating the updip limit of the
ACC
EPTE
D M
ANU
SCR
IPT
ACCEPTED MANUSCRIPT
31
seismogenic portion. The reliably located offshore current seismic activity by the OBS network
confirmed that the interplate beneath the outer forearc domain remains silent during the 4 months of
recording (Ruiz et al., this issue). We cannot however rule out on the basis of these observations that
this portion is not fully locked and that it is not participating to the stress-loading of the mega-thrust
fault.
7. Conclusion
The dip-lines profiles reveal, with a significant contribution from the strike–lines profiles
- the arcward-dipping subduction decollement, resolving smooth undulations ;
- the arcward-dipping top of the oceanic crust, with localized strong topographical highs and
lows, and varying thickness of subducting sediments ;
-the basement of the outer forearc domain of the upper plate, generally trenchward-dipping, but
affected by significant highs and lows, and their along-strike extents;
- the stratification of the forearc sedimentary cover, which may resolve its deformation and
faulting ;
-localized faults within the outer forearc crust of the upper plate, which could be discussed
together with the other tectonic elements such as basement scarps ;
- the transition between the sedimentary domains of the outer forearc and of the accretionary
wedge, from their difference in internal stratification.
The several-kilometers-high topographic variations of TOC imaged beneath the accretionary
wedge offshore Guadeloupe and Antigua islands are located in the prolongation of those mapped on
the Atlantic seafloor entering subduction. This grid also reveals two areas of the outer forearc
domains deforming in response to the subduction of the Barracuda and Tiburon ridges. Although
different in details, they however share similarities in style which allows to establish a relation in
space and time between these heterogeneities imaged of the top of the subducting plate and the outer
forearc basement. The deformed stratification resolved in the forearc sediments documents their
successive warping and unwarping, which deformation indicates a space-time variation that can be
readily attributed to the forearc sweeping over obliquely oriented elongated localized topographical
reliefs. This is in particular the case of the Barracuda and Tiburon ridges which topography is still
actively growing (Patriat et al., 2011). Such a peculiar, recent and active deformation of the
subducting Atlantic lithosphere absorbing the SAM-NAM convergence may explain the well-
expressed effects of these ridges in the peculiar forearc deformation we document, in comparison to
the subduction of an inactive topographic high of a moderate height. The transient and localized
deformation documented here does not require a regional extensional normal-faulting regime in the
outer forearc domain as considered to induce a horsetail faulting manner of the inner forearc domain
ACC
EPTE
D M
ANU
SCR
IPT
ACCEPTED MANUSCRIPT
32
by Feuillet et al. (2002). This may indicate that this horsetail faulting is restricted to the 26 km thick
inner-forearc domain interpreted to be a remaining part of the Caribbean Oceanic Plateau (Kopp et
al, 2011) and that there would be an outer forearc sliver undergoing trench-normal compression and
internal deformation. This dual or partitioned tectonic deformation may therefore confirm the
existence of an outer forearc sliver as initially suggested from the misfit between convergence
direction and earthquake slip vectors (Lopez et al., 2006).
We also defined the trenchward limit of the outer forearc basement domain at depth under the
accretionary wedge. The latter is located up to 25 km trenchward of the commonly defined
subduction front by the location of the negative anomaly in the global gravity field in the northern
part (from Antigua to Dominique islands). This shallower position of this proxy to the updip limit
may indicate a wider seismogenic zone than expected and offshore Martinique island. The effect of
the roughness of a subducting oceanic plate in convergent margins onto the subduction
seismogenesis has long been debated. In a recent analysis, before the Tohoku EQ occurrence, Wang
and Bilek (2011) stress out that seamount subduction tends to be predominantly aseismic, because of
the complex structure and heterogeneous stresses of the fracture network that is expected to develop
around the seamount within the upper plate backstop. In the Lesser Antilles subduction zone, we do
image such a clearly tectonized and damaged part of the basement backstop in relation with the
ongoing subduction of oceanic basement ridges. Because of the family of numerous vertical faults
which are seen as mincing the basement and thus possibly reduce the strength of the outer forearc
backstop, they could be considered as preventing large rupture nucleation or propagation by inducing
an along-strike segmentation. In Tohoku too, several subducting seamounts have been imaged
beneath the outer forearc (Tsuru et al., 2002). The moderate magnitude events (M 7 to 8) which were
consistent with such a segmentation have been wrongly taken as being the characteristic events, as
only recently demonstrated by the rupture in a very large earthquake despite the damaged outer
forearc domain. The 2011 M9.0 Tohoku event thus demonstrated that exceptional very large rupture
may propagate through these limited features at the scale of millennia and that this possibility should
not be ignored. The question of the other, downdip, limit of the interplate seismogenic zone is not
directly addressed by our MCS profiles, since they do not reach westward enough and they do not
penetrate deep enough to image the mantle thrust. Additional views are given there by refraction
seismics and high precision location of current seismic activity described in Laigle et al. (same issue,
in revision).
Acknowledgements
We are grateful to Tim Horscroft and its invitation to participate to this Thematic Set on the Lesser
Antilles Subduction, and to Graham Westbrook and an anonymous reviewer for their careful
ACC
EPTE
D M
ANU
SCR
IPT
ACCEPTED MANUSCRIPT
33
reviews. We thank the crew and captain of the R/V L'Atalante for their efforts during
SISMANTILLES 2. This work has been funded by the European Union FP6 NEST (New and
emerging Science and Technology)-INSIGHT programme, under project “THALES WAS RIGHT”
nr. 029080, by French National Research Agency (ANR) CATTELL programme (TMR GEOMAR)
and also INSU-CNRS (missions embarquants).
The MCS data were processed with CGG-Veritas Geovecteur® and Geocluster® softwares onboard
R/V L'Atalante, the PSDM lines have been processed at GEOMAR with the Seismos® and Sirius®
software in the framework of a EU-TMR grant of IFM GEOMAR, bathymetric MNT with Caraibes
software onboard R/V L'Atalante. We would like to thank D. Klaeschen for help with the pre-stack
depth migration processing.
References
Avedik, F., Hirn, A., Renard, V., Nicolich, R., Olivet, J.l., Sachpazi, M., 1996. ” Single-bubble ”
marine source offers new perspectives for lithospheric exploration. Tectonophysics 267, 57–
71.
Bangs, N., Westbrook, G., Ladd, J., Buhl, P., 1990. Seismic Velocities From the Barbados Ridge
Complex: Indicators of High Pore Fluid Pressures in an Accretionary Complex. J. Geophys.
Res., 95, Issue B6.
Bangs, N. L., Shipley, T.H., Moore, G.F., 1996. Elevated fluid pressure and fault zone dilation
inferred from seismic models of the northern Barbados Ridge decollement. J. Geophys.
Res.,101, 627-642.
Bangs, N., Shipley, T., Moore, J., Moore, G., 1999. Fluid accumulation and channeling along the
northern Barbados Ridge decollement thrust. J. Geophys. Res., 104, Issue B9.
Bangs, N.L., Christeson, G.L., Shipley, T.H., 2003. Structure of the Lesser Antilles subduction zone
backstop and its role in a large accretionary system. J. Geophys. Res., 108, 2358.
Becel et al., same issue Bécel, Diaz, Laigle, Hirn, and the "Thales Was Right" continuous recording
group. Searching for unconventional seismic signals on a subduction zone with a submerged
forearc: OBS offshore the Lesser Antilles, Tectonophysics, in review.
Bernard, P., and Lambert, J., 1988. Subduction and seismic hazard in the Northern Lesser Antilles-
Revision of the historical seismicity. Bull. Seismol. Soc. Am. 78, 1965-1983.
Biju-Duval, B., Moore, J.C., Bergen, J.A.M., Blackinton, G., Claypool, G.E., Cowan, D.S., Davis,
D.M., Guerra, R.T., Hemleben, C.H.J., Marlow, M.S., Pudsey, C.J., Renz, G.W., Tardy, M.,
Wilson, D.S., Wright, A.W., Natland, J.H., Orlofsky, S., 1984. Site 543; oceanic reference site
east of the Barbados Ridge complex. In: Biju-Duval, B., Moore, J.C., et al. (Eds.), Initial
Reports of the Deep Sea Drilling Project 78A-78B. Texas A & M University, Ocean Drilling
Program, College Station, TX, United States, pp. 227–298. ISSN: 0080-8334 CODEN:
IDSDA6.
Bouysse, P., Westercamp, D., 1990. Subduction of Atlantic aseismic ridges and late Cenozoic
evolution of the Lesser Antilles island arc. Tectonophysics, Vol. 175, 349-380.
Bowin, C., 1976. Caribbean gravity field and plate tectonics. Special Paper - Geological Society of
America, Issue 169.
Bowin, C., 1980. Gravity and geoid anomalies of the Caribbean. Transactions of the Caribbean
Geological Conference Vol. 9, 2, 527-538.
ACC
EPTE
D M
ANU
SCR
IPT
ACCEPTED MANUSCRIPT
34
Christeson, G.L., Bangs, N.L., Shipley, T.H., 2003. Deep structure of an island arc backstop, Lesser
Antilles subduction zone. J. Geophys. Res., 108, Issue B7.
Das, S., and Watts, A.B., 2009, Effect of subducting seafloor topography on the rupture
characteristics of great subduction zone earthquakes, in Lallemand, S., and Funiciello, F., eds.,
Subduction Zone Geodynamics : Berlin, Springer-Verlag , p. 103–118.
DeMets, C., Jansuma, P.E., Mattioli, G.S., Dixon, T.H., Farina, F., Bilham, R., Calais, E., Mann, P.,
2000. GPS geodetic constraints on Caribbean-North America Plate motion. Geophys. Res.
Lett., 27, 437-440.
De Mets, C., Gordon, R. G., and D. F. Argus, 2010. Geologically current plate motions. Geophys. J.
Int., 181, 1-80.
Dessa, J.-X.,et al., 2009. Megathrust earthquakes can nucleate in the forearc mantle: Evidence from
the 2004 Sumatra event. Geology, 37, 659–662; doi: 10.1130/G25653A.
DiLeonardo, C.G., Moore, J.C., Nissen, S., Bangs, N., 2002. Control of internal structure and fluid-
migration pathways within the Barbados Ridge decollement zone by strike-slip faulting;
evidence from coherence and three-dimensional seismic amplitude imaging. Geol. Soc. Am.
Bull., 114, 51-63.
Dixon, T.H., Mao, A., 1997. A GPS estimates of relative motion between North and South America.
Geophys. Res. Lett., 103, 535-538.
Dixon, T.H., Farina, F., DeMets, C., Jansma, P.E., Mann, P., Calais, E., 1998. Relative motion
between the Caribbean and North American plates and related boundary zone deformation
from a decade of GPS observations. J. Geophys. Res. 39, 15,157-15,182.
Dominguez, S., Malavieille, J., Lallemand, S.E., 2000. Deformation of accretionary wedges in
response to seamount subduction; insights from sandbox experiments. Tectonics, 19, 182-196.
Dorel, J.,1981. Seismicity and seismic gap in the Lesser Antilles Arc and earthquake hazard in
Guadeloupe. Geophys. J. Roy. Astr. S., 67, 679-695.
Evain, M., Galve, A., Charvis, P., Laigle, M., Kopp, H., Weinzierl, W., Hirn, A., Flueh, E., Gallart,
J., and thales scientific party, 2011. Structure of the Lesser Antilles subduction forearc and
backstop from 3D seismic refraction tomography. Tectonophys.,
doi:10.1016/j.tecto.2011.09.021.
Feuillet, N., Manighetti, I., Tapponnier, P., 2001. Extension active perpendiculaire a la subduction
dans l'arc des petites Antilles (Guadeloupe, Antilles francaises). Comptes Rendus de
l'Academie des Sciences, Serie II. Sciences de la Terre et des Planetes, 333, 583-590.
Feuillet, N., Manighetti, I., Tapponnier, P., Jacques, E., 2002. Arc parallel extension and localization
of volcanic complexes in Guadeloupe, Lesser Antilles. J. Geophys. Res., 107, 2331.
Fujiwara, T., Kodaira, S., No, T., Kaiho, Y., Takahashi, N., and Y. Kaneda, 2011. The 2011 Tohoku-
Oki earthquake: displacement reaching the trench axis. Science, 334, 1240.
Hyndman, R.D., Yamano, M., and Oleskevich, D.A.,(1997), The seismogenic zone of subduction
thrust faults. The Island Arc, 6, 244-260.
Klingelhoefer et al., 2010. Limits of the seismogenic zone in the epicentral regionof the 26
December 2004 great Sumatra-Andaman earthquake: Results from seismic refraction and
wide-angle reflection surveys and thermal modelling. J. Geophys. Res., 115, B01304,
doi:10.1029/2009JB006569.
Kodaira, S., No, T., Nakamura, Y., Fujiwara, T., Kaiho, Y., Miura, S., Takahashi, N., Kaneda, Y.,
and A. Taira, 2012. Coseismic fault rupture at the trench axis during the 2011 Tohoku-oki
earthquake. Nature Geosc. , 5, 646-650, DOI: 10.1038/NGEO1547
Kopf, A.J., 2002. Significance of mud volcanism. Reviews of Geophysics, June 2002, Vol. 40,
Issue 2.
ACC
EPTE
D M
ANU
SCR
IPT
ACCEPTED MANUSCRIPT
35
Kopp, H., Weinzierl, W., Laigle, M., Becel, A., Hirn, A., Flueh, E.R., 2011. Deep structure of the
central Lesser Antilles Island Arc: relevance for the formation of continental crust. Earth
Planet. Sci. Lett., 304, 121-134.
Laigle, M., Hirn, A., Sapin, M., Bécel, A., Charvis, P., Flueh, E., Diaz, J., Lebrun, J.F., Gesret, A.,
Raffaele, R., Galve, A., Evain, M., Ruiz, M., Kopp, H., Bayrakci, G., Weinzierl, W., Hello,
Y., Lépine, J.C., Viodé, J.P., Sachpazi , M., Gallart, J., Kissling, E., and R. Nicolich. Seismic
structure and activity of the central Lesser Antilles subduction from an integrated approach:
similarities with the Tohoku forearc. Tectonophys., 2011. In review.
Lopez, A. M., Stein, S., Dixon, T., Sella, G., Calais, E., Jansma, P., Weber, J., and LaFemina, P., Is
there a northern Lesser Antilles forearc block ? Geoph. Res. Lett., 33,
doi:10.1029/2005GL025293, 2006.
Mascle, A., Cazes, M., Le Quellec, P., 1985. Structure des marges et bassins caraibes: une revue. In
Mascle, A. (Ed.), Symp. Caribbean Geodynamics: Paris (Technip.), 1-20
Mascle, A., Moore, J.C., Taylor, E., Alvarez, F., Andreieff, P., Barnes, R.O., Beck, C., Behrmann, J.,
Blanc, G., Brown, K.M., Clark, M., Dolan, J.F., Fisher, A., Gieskes, J.M., Hounslow, M.,
McLellan, P., Moran, K., Ogawa, Y., Sakai, T., Schoonmaker, J., Vrolijk, P.J., Wilkens, R.H.,
Williams, C., 1988. Synthesis of shipboard results; Leg 110 transect of the northern Barbados
Ridge. In: Mascle, A., Moore, J.C., et al. (Eds.), Proceedings of the Ocean Drilling Program,
Part A: Initial Reports 110. Texas A & M University, Ocean Drilling Program, College
Station, TX, United States, pp. 577–591. doi:10.2973/odp.proc.ir.110.111.1988. ISSN: 0884-
5883, CODEN: IDSDA6.
Mauffret, A., Westbrook, G.K., Truchan, M. and Ladd, J.W. 1984. The relief of the oceanic
basement and the structure of the front of the accretionary prism in the region of sites 541, 542
and 543. In: Biju-Duval, B., Moore, J.C. et al., Init. Repts DSDP Leg 78A, US Government
Printing Office, Washington, 49-62.
McCann, W.R., Sykes, L.R., 1984. Subduction of aseismic ridges beneath the Caribbean Plate;
implications for the tectonics and seismic potential of the northeastern Caribbean. J.
Geophys. Res., 89, 4493-4519.
McCann, W.R., Sykes, L.R., 1986. REPLY to “Comment on ‘Subduction of aseismic ridges beneath
the Caribbean Plate: Implications for the tectonics and seismic potential of the northeastern
Caribbean’ by W. R. McCann and L. R. Sykes”. J. Geophys. Res., 91, 787-791.
Molnar, P. Freedman, D., Shih, J.S.F., 1979. Lengths of intermediate and deep seismic zones and
temperatures in downgoing slabs of lithosphere. J. Roy. Astr. Soc., 56, 41-54.
Moretti, I., Ngokwey, K., 1985. Aseismic ridge subduction and vertical motion of overriding plate,
in: Mascle, A. (Ed.), Geodynamique des Caraibes, Paris (Technip). pp. 245–253.
Mueller, R.D. and Smith, W.H.F., 1993. Deformation of the oceanic crust between the North
America and South America plates. J. Geophys. Res., 93: 8275-8292.
Patriat, M., Pichot, T., Westbrook, G.K., Umber, M., Deville, E., Bénard, F., Roest, W.R., Loubrieu,
B., and the ANTIPLAC Cruise Party, 2011. Evidence for Quaternary convergence across the
North America–South America plate boundary zone, east of the Lesser Antilles. Geology,. 39,.
979–982; doi:10.1130/G32474.1
Roux, E., 2007. Reconnaissance de la Structure Sismique de la Zone de Subduction des Petites
Antilles (Guadeloupe et Martinique). Ph.D. thesis, Université Denis Diderot Paris VII.
Ruiz, M., Galve, A., Monfret, T., Sapin, M., Charvis, P., Laigle, M., Evain, M., Hirn, A., Flueh, E.,
Gallart, J., Diaz, J., Lebrun, J.F., 2011. Seismic Activity offshore Martinique and Dominica
islands (Central Lesser Antilles subduction zone) from temporary onshore and offshore
seismic networks, Tectonophysics, doi:10.1016/j.tecto.2011.08.006.
Smith, W. H. F. and Sandwell, D. T. (1997). Global seafloor topography from satellite altimetry and
ship depth soundings. Science, 277:195-196.
ACC
EPTE
D M
ANU
SCR
IPT
ACCEPTED MANUSCRIPT
36
Stein, S., Wiens, D., Engeln, J., Fujita, K., 1986. Comment on ‘Subduction of aseismic ridges
beneath the Caribbean Plate: Implications for the tectonics and seismic potential of the
northeastern Caribbean’. J. Geophys. Res., 91, 784-786.
Sumner, R.H., and Westbrook, G.K., 2001, Mud-diapirism in front of the Barbados accretionary
wedge: The influence of fracture zones and North America–South America plate motions:
Marine and Petroleum Geology, v. 18, p. 591–613, doi: 10.1016/S0264-8172(01) 00010-1.
Tsuru, T., J.-O. Park, S. Miura, S. Kodaira, Y. Kido, and T. Hayashi (2002), Along-arc structural
variation of the plate boundary at the Japan Trench margin: Implication of interplate coupling,
J. Geophys. Res., 107 (B12), 2357, doi:10.1029/2001JB001664
Wang, K., and Bilek, S., 2011. Do subducting seamounts generate or stop large earthquakes?
Geology, v. 39; no. 9; p. 819–822; doi:10.1130/G31856.1;
Weber, J.C., Dixon, T.H., DeMets, C., Ambeh, W.B., Jansma, P., Mattioli, G., Saleh, J., Sella, G.,
Bilham, R., Pérez, O., 2001. GPS estimate of relative motion between the Caribbean and
South American plates, and geologic implications for Trinidad and Venezuela. Geology, 29-1,
75-78.
Westbrook, G.K., 1982. The Barbados Ridge Complex: tectonics of a mature forearc system, in:
Leggett, J.K. (Ed.), Trench-Forearc Geology, Geological Society, London, Special
Publications, 10. pp. 275–290.
Westbrook, G.K. and McCann, W.R. 1986. Subduction of Atlantic lithosphere beneath the
Caribbean. in Vogt, P.R. and Tucholke, B.E., eds, The Geology of North America, vol. M -
The western North Atlantic region, Geol. Soc. America: Boulder, Colorado, p.341-350.
Westbrook, G.K., Ladd, J.W., Buhl, P., Bangs, N.L., Tiley, G.J., 1988. Cross section of an
accretionary wedge : Barbados Ridge complex. Geology 16, 631–635.
ACC
EPTE
D M
ANU
SCR
IPT
ACCEPTED MANUSCRIPT
37
Figure captions:
Figure 1 : Location map of the SISMANTILLES-2 MCS grid (black lines) and shot profiles (gray
lines) with additional MCS profiles of the SISMANTILLES-1 survey. The profiles shown are
indicated as thick white lines. The two long profiles (thick gray lines) are the WARR OBS seismic
profiles of the joint TRAIL survey (R/V Maria S. Merian, Kopp et al., 2011). Earlier profiles
discussed in Westbrook et al. (1988) and in Bangs et al. (1990) are shown as EW long dashed blak
lines. The survey area of Bangs et al. (2003) and Christeson et al. (2003) are in thin dashed black
lines, as well as their interpreted Ridge A and B. The DSDP/ODP drilling and seismic survey area
are indicated by a black plain rectangle. Triangles on the islands indicate the active volcanoes and
the dashed gray line, the axis of the active volcanic arc. Dashed black line indicates the deformation
front of the Lesser Antilles and dashed white line the local minimum of the negative gravity anomaly
after Bouysse and Westercamp (1990), who also derived the N 288°E strike of the Barracuda Ridge
and the N 294°E of the Tiburon Rise which are reported over the accretionary and forearc domains
as dashed black lines. Smith and Sandwell (1997) satellite-derived global bathymetry with contours
every 500 m and labelled ones every 2000 m. White arrow indicates the measured CAR/NAM
relative motion by GPS at the AVES island located 200 km west of Guadeloupe island (DeMets et
al., 2000). The determined CAR/SAM by GPS at the AVES island is of the same amplitude and
directed due East (Weber et al., 2001). MG—Marie Galante island; LD—La Désirade island; LDT—
La Désirade Trough ; KS—Karukera Spur; AB—Arawk Basin.
Figure 2: Synthesis and location of the main interpreted basement highs imaged on top the
subducting oceanic crust and within the outer forearc domain discussed in the text. Shown MCS
profiles of the SISMANTILLES-2 MCS grid are in red and of the SISMANTILLES-1 survey, in
orange. Numbers are shotpoints along shown profiles. On the Atlantic oceanic seafloor east of the
deformation front, the interpreted basement highs by Patriat et al. (2011) are reported in blue thick
lines, and the two brown areas correspond to the Barracuda Ridge and Tiburon Rise depicted in their
study by seafloor shallower than 5000 m. South of Tiburon Rise, the position of two basement highs
(ellipses) identified along a north-south seismic profile shown in Sumner and Westbrook (2001). The
N 288°E strike of the Barracuda Ridge and the N 294°E of the Tiburon Rise are indicated over the
accretionary and forearc domains as dashed white lines. Subducting oceanic basement highs imaged
along dip-lines H’, I’ and K are indicated as brown segments along the profiles. North and South of
the prolongation of the Barracuda Ridge, 2 ellipses in blue indicate additional basement highs.
Within the outer forearc domain, the imaged basement highs are shown as ellipses outlined in dark
grey and labelled in their top right corner by the nearest MCS grid crossing. The few imaged
intracrustal thrusts as well as the two normal faults are also indicated as thick black lines. The
double-black lines with green infill indicate the position of interpreted backstop edge from the along-
dip MCS profiles. Dashed blue lines indicate the interpreted location of the subducting Ridges
ACC
EPTE
D M
ANU
SCR
IPT
ACCEPTED MANUSCRIPT
38
interacting with the forearc crust (and the accretionary wedge for the Barracuda Ridge). South of
Martinique island, the dashed black line marks the approximate location of St Lucia ridge. In colour,
the bathymetry chart after the on-board processing of the collected multi-beam data along MCS
profiles. In shaded grey, the Smith and Sandwell global bathymetry with contours every 500 m and
annotated ones every 2000 m. Bottom-right : close-up for the seabed morphology of the north
eastern part of the Arawak Basin with fault scarp strike shown as thin red lines and canyon strike
shown as blue thin lines.
Figure 3: Un-interpreted (top) and interpreted (middle) dip-line H (SISMANTILLES 2), juxtaposed
to dip-line H’ (SISMANTILLES 1) with SP increasing westwards. Green line is the interpreted
forearc acoustic basement, and orange lines underline the forearc sedimentary layering, with the
yellow one corresponding to the most recent deposits. Black lines show the main faults and fractures
imaged (all of them have not been line-drawn, only the main ones of the shallower part). Blue lines
on top are for the top of the subducting oceanic crust. Interpreted decollement is indicated with
arrows and "D". The interpreted forearc basement highs reported on fig. 2 are also indicated. Blow-
ups are shown at the bottom.
Figure 4 : Un-interpreted (top) and interpreted (middle) dip-line I’ (SISMANTILLES 1) discussed
in sections 4.1 and 4.2.1. SP are increasing westwards for the western half, and eastwards for the
eastern half. Same colour code for line drawing as in Fig. 3. Blow-ups are shown at the bottom. In
the absence of OBSs to check the consistency with times of basement wide angle reflection arrivals,
we have considered for this dip-line I’ the base of the organised reflectivity as corresponding to the
acoustic basement (dashed green), rather than the deeper reflections imaged at more than 1 s later at
SP 400 to 300. A possible origin for the latter could indeed be reflections out of the vertical plane
onto the north-dipping basement of the southern north-facing scarp of the La Désirade Trough.
Figure 5 : Easternmost part of the dip-line I’ (SISMANTILLES 1) which crosses the deformation
front, followed by the small perpendicular transect which ties to the next profile in the south, and
dip-line H’ (SISMANTILLES 1) which crosses a topographic high north of the Barracuda Ridge on
the Atlantic oceanic sea-floor. Below, a close-up of the location map of figure 1 with in dark blue the
location of the basement highs interpreted to correspond to the Barracuda Ridge, and in light blue,
that corresponding to other oceanic basement high located north of the Barracuda Ridge. NBT—
North Barracuda Trough possibly imaged.
Figure 6 : Un-interpreted (top) and interpreted (middle) dip-line K (SISMANTILLES 2) discussed
in sections 4.1 and 4.2.2. Same colour code for line drawing as in Fig. 3. Blow-ups are shown at the
bottom.
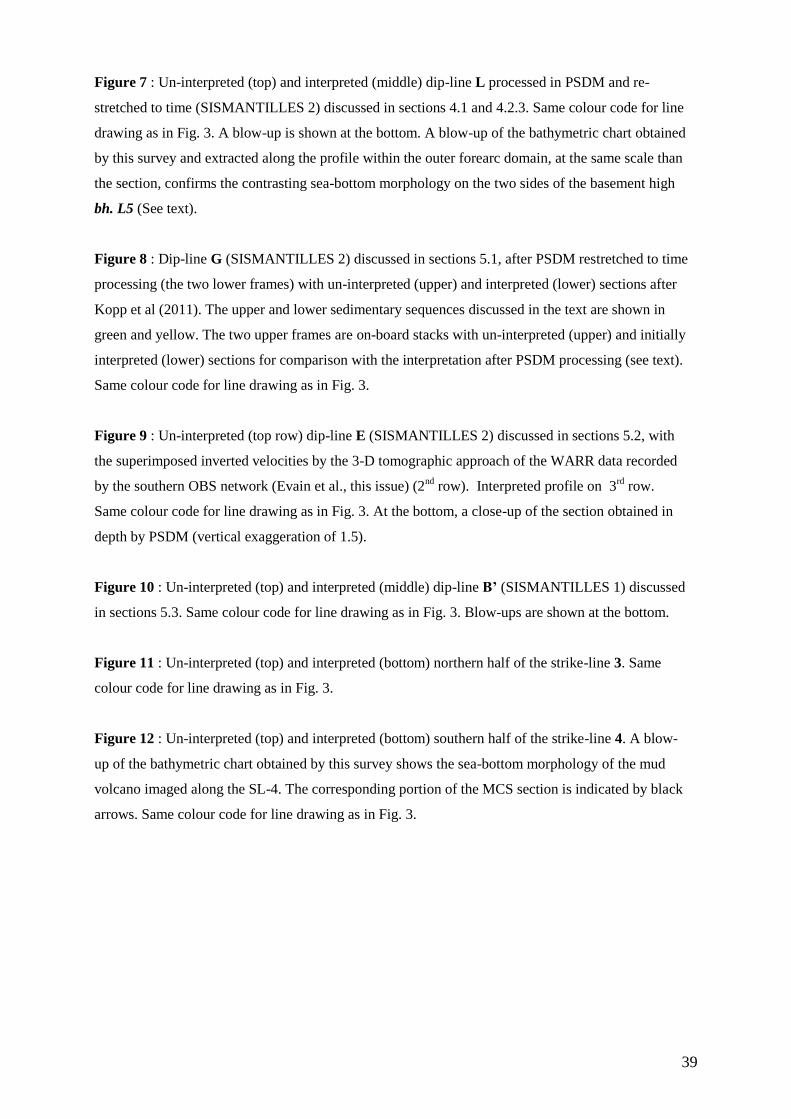
ACC
EPTE
D M
ANU
SCR
IPT
ACCEPTED MANUSCRIPT
39
Figure 7 : Un-interpreted (top) and interpreted (middle) dip-line L processed in PSDM and re-
stretched to time (SISMANTILLES 2) discussed in sections 4.1 and 4.2.3. Same colour code for line
drawing as in Fig. 3. A blow-up is shown at the bottom. A blow-up of the bathymetric chart obtained
by this survey and extracted along the profile within the outer forearc domain, at the same scale than
the section, confirms the contrasting sea-bottom morphology on the two sides of the basement high
bh. L5 (See text).
Figure 8 : Dip-line G (SISMANTILLES 2) discussed in sections 5.1, after PSDM restretched to time
processing (the two lower frames) with un-interpreted (upper) and interpreted (lower) sections after
Kopp et al (2011). The upper and lower sedimentary sequences discussed in the text are shown in
green and yellow. The two upper frames are on-board stacks with un-interpreted (upper) and initially
interpreted (lower) sections for comparison with the interpretation after PSDM processing (see text).
Same colour code for line drawing as in Fig. 3.
Figure 9 : Un-interpreted (top row) dip-line E (SISMANTILLES 2) discussed in sections 5.2, with
the superimposed inverted velocities by the 3-D tomographic approach of the WARR data recorded
by the southern OBS network (Evain et al., this issue) (2nd
row). Interpreted profile on 3rd
row.
Same colour code for line drawing as in Fig. 3. At the bottom, a close-up of the section obtained in
depth by PSDM (vertical exaggeration of 1.5).
Figure 10 : Un-interpreted (top) and interpreted (middle) dip-line B’ (SISMANTILLES 1) discussed
in sections 5.3. Same colour code for line drawing as in Fig. 3. Blow-ups are shown at the bottom.
Figure 11 : Un-interpreted (top) and interpreted (bottom) northern half of the strike-line 3. Same
colour code for line drawing as in Fig. 3.
Figure 12 : Un-interpreted (top) and interpreted (bottom) southern half of the strike-line 4. A blow-
up of the bathymetric chart obtained by this survey shows the sea-bottom morphology of the mud
volcano imaged along the SL-4. The corresponding portion of the MCS section is indicated by black
arrows. Same colour code for line drawing as in Fig. 3.
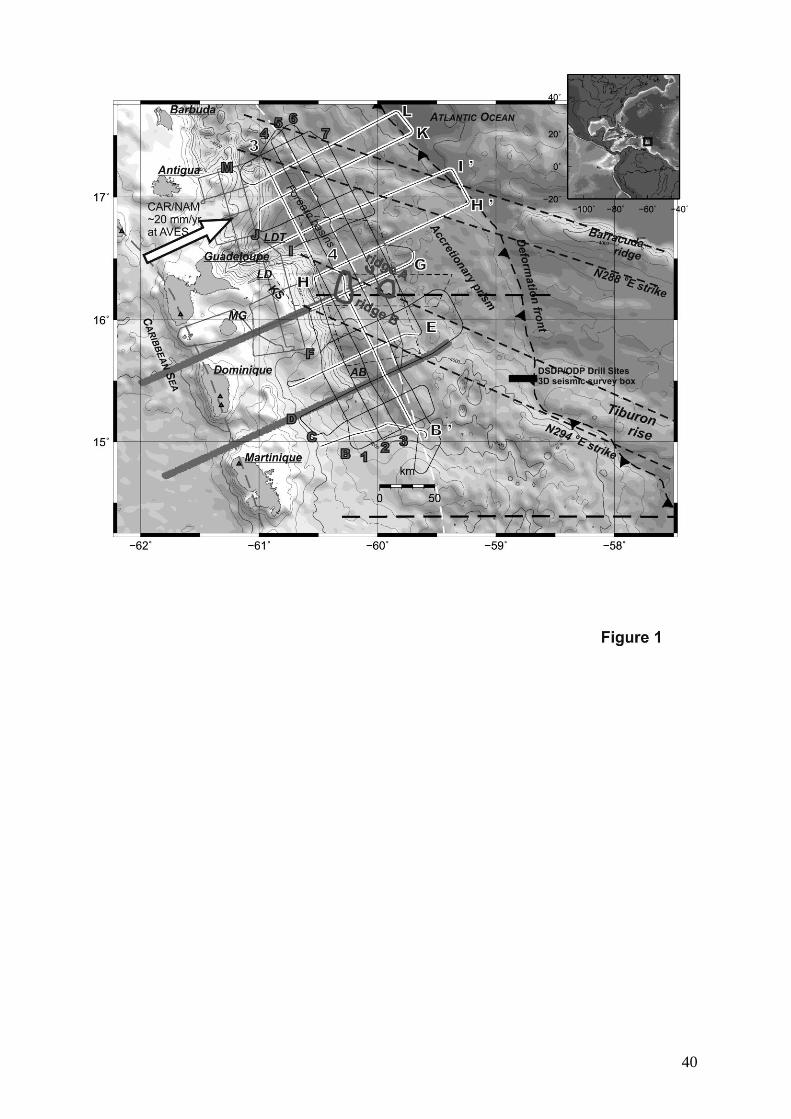
ACC
EPTE
D M
ANU
SCR
IPT
ACCEPTED MANUSCRIPT
40
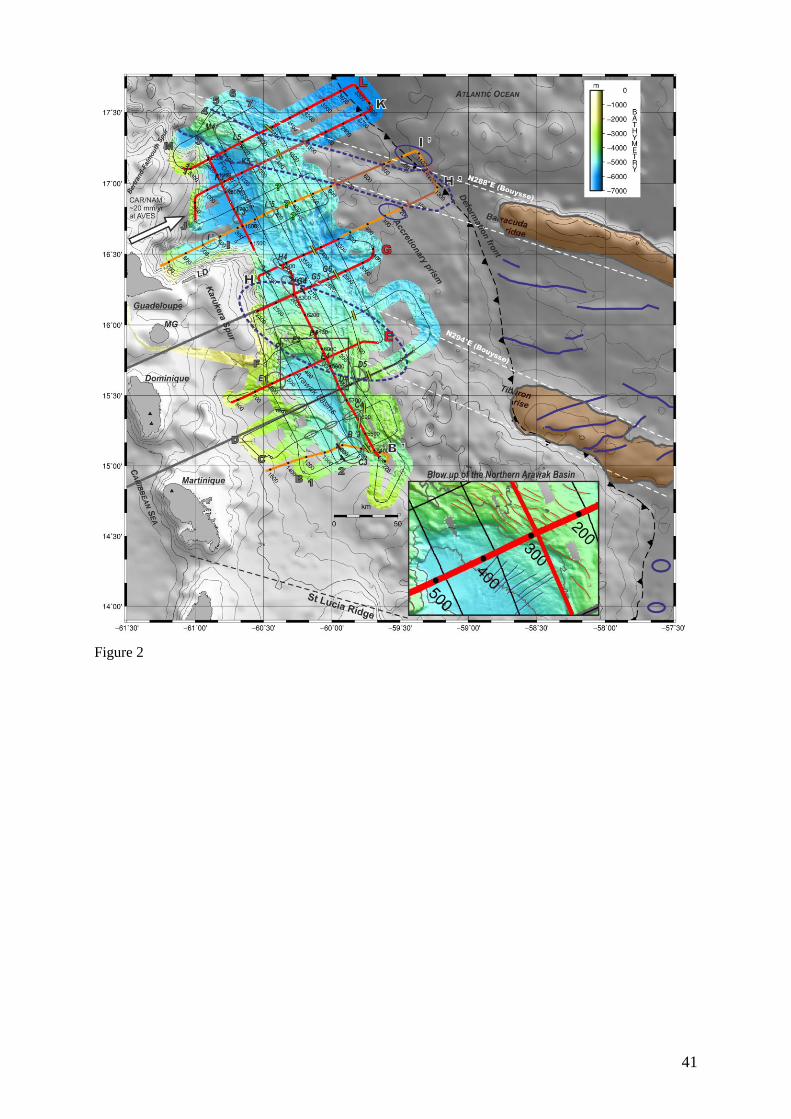
ACC
EPTE
D M
ANU
SCR
IPT
ACCEPTED MANUSCRIPT
41
Figure 2
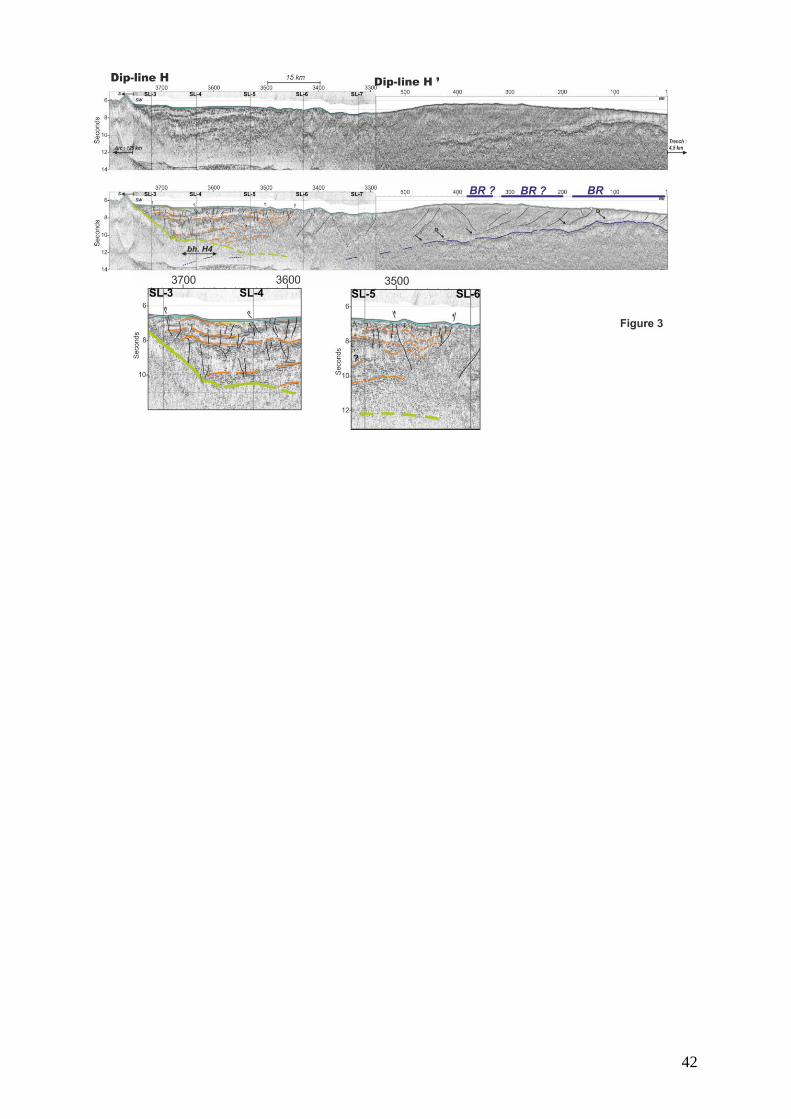
ACC
EPTE
D M
ANU
SCR
IPT
ACCEPTED MANUSCRIPT
42
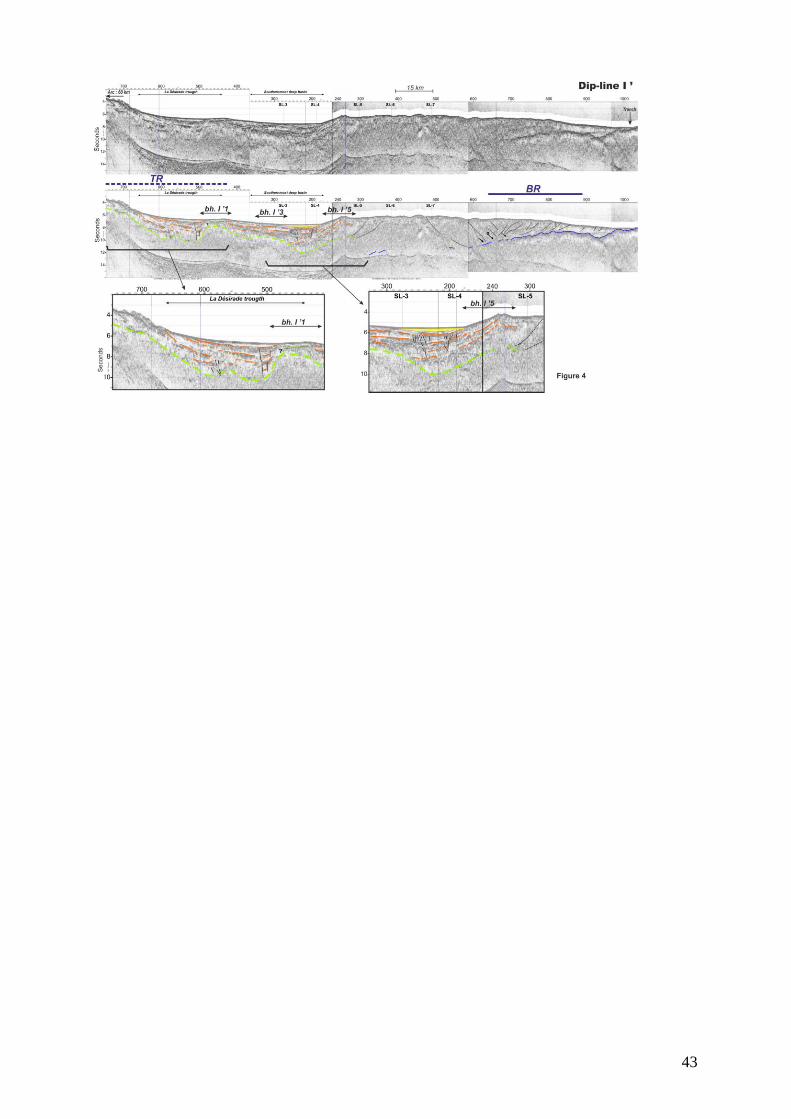
ACC
EPTE
D M
ANU
SCR
IPT
ACCEPTED MANUSCRIPT
43
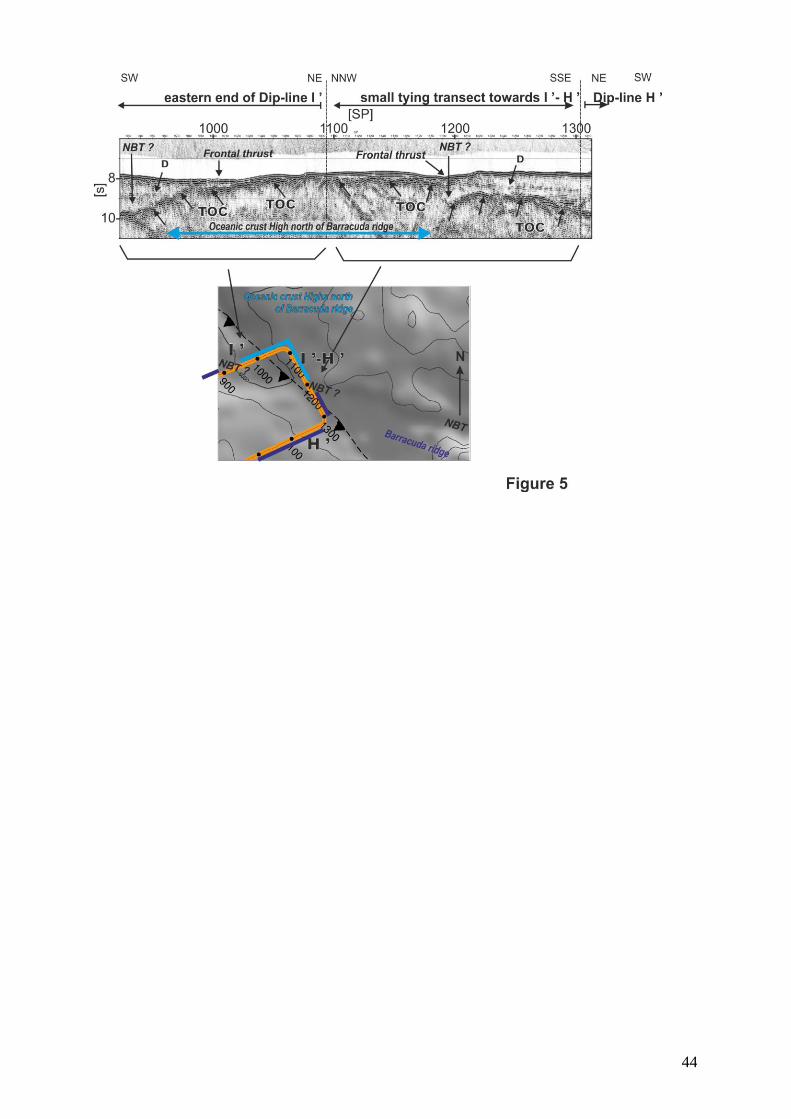
ACC
EPTE
D M
ANU
SCR
IPT
ACCEPTED MANUSCRIPT
44
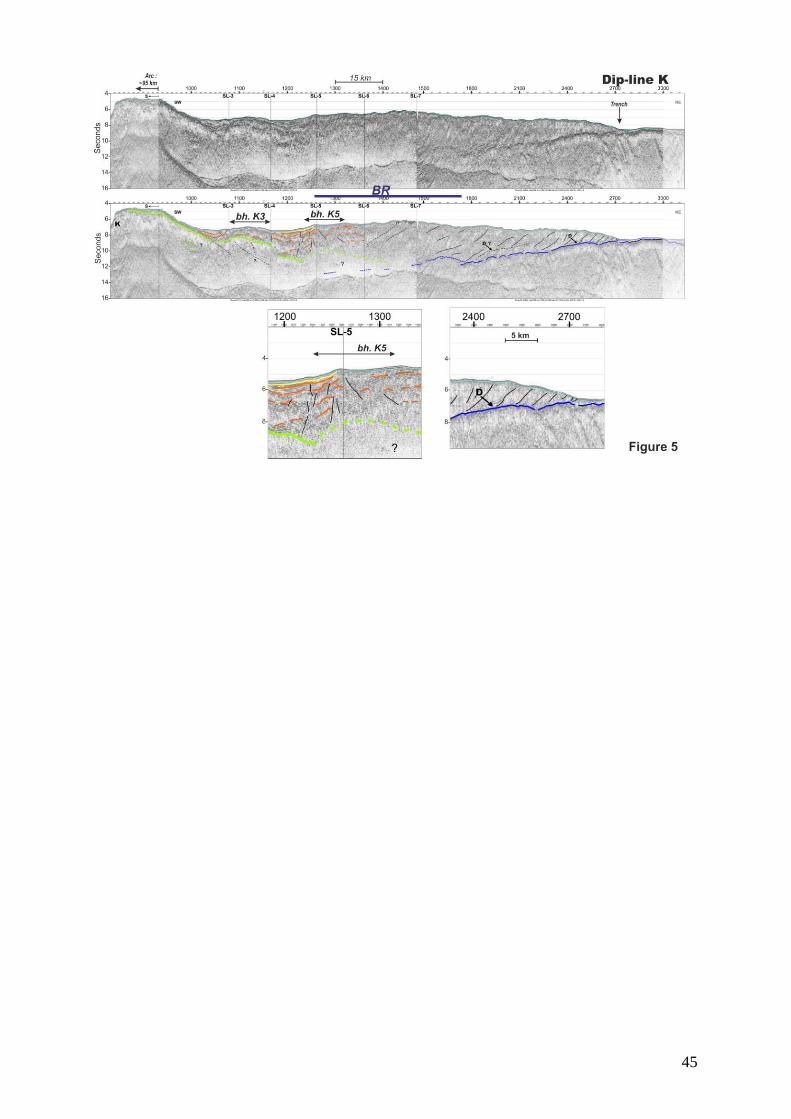
ACC
EPTE
D M
ANU
SCR
IPT
ACCEPTED MANUSCRIPT
45
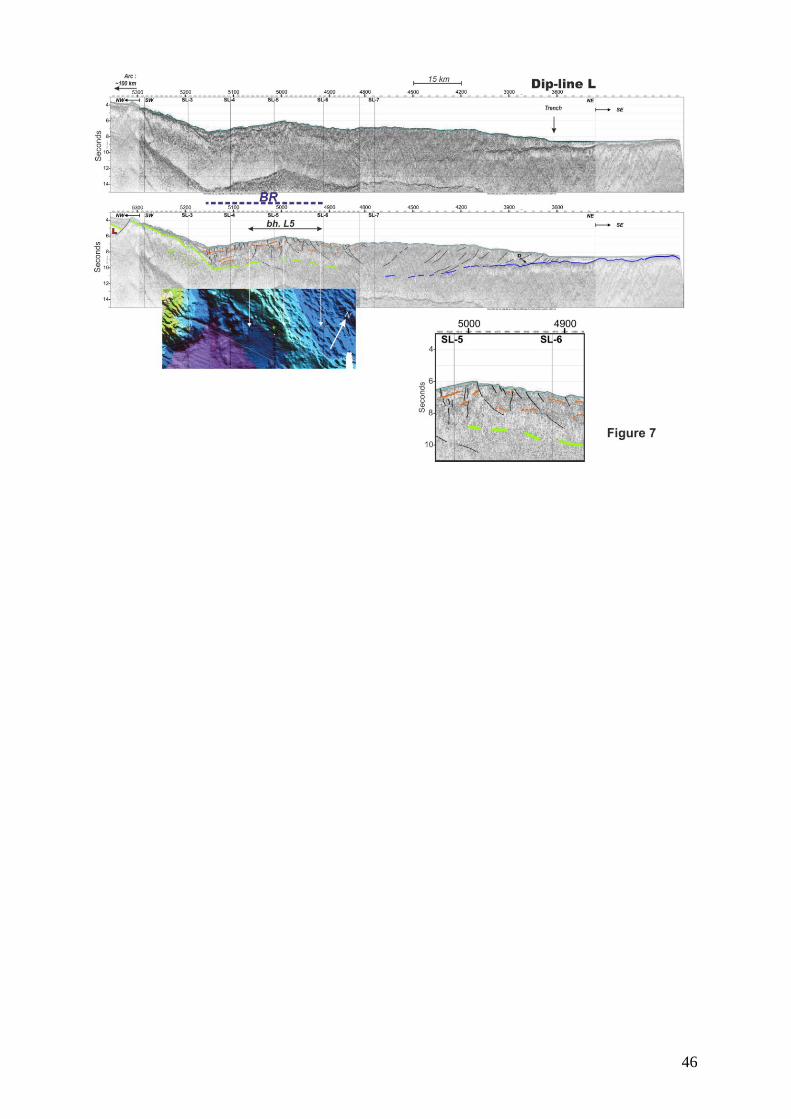
ACC
EPTE
D M
ANU
SCR
IPT
ACCEPTED MANUSCRIPT
46
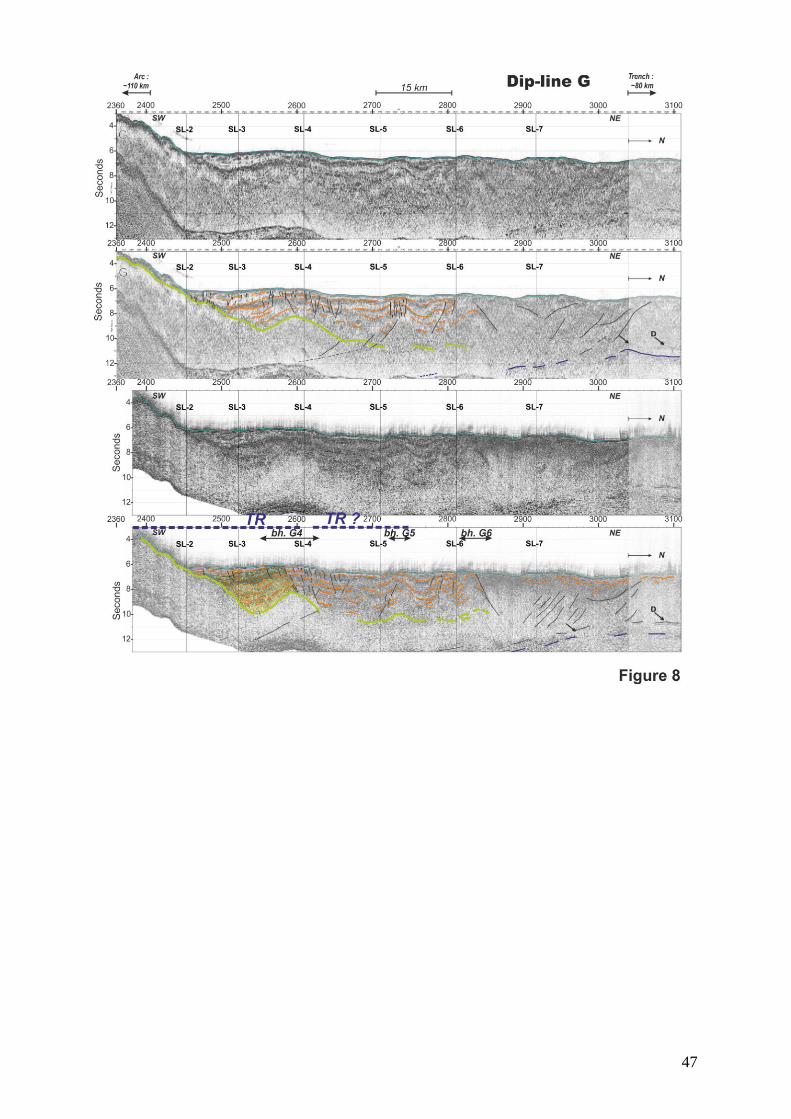
ACC
EPTE
D M
ANU
SCR
IPT
ACCEPTED MANUSCRIPT
47
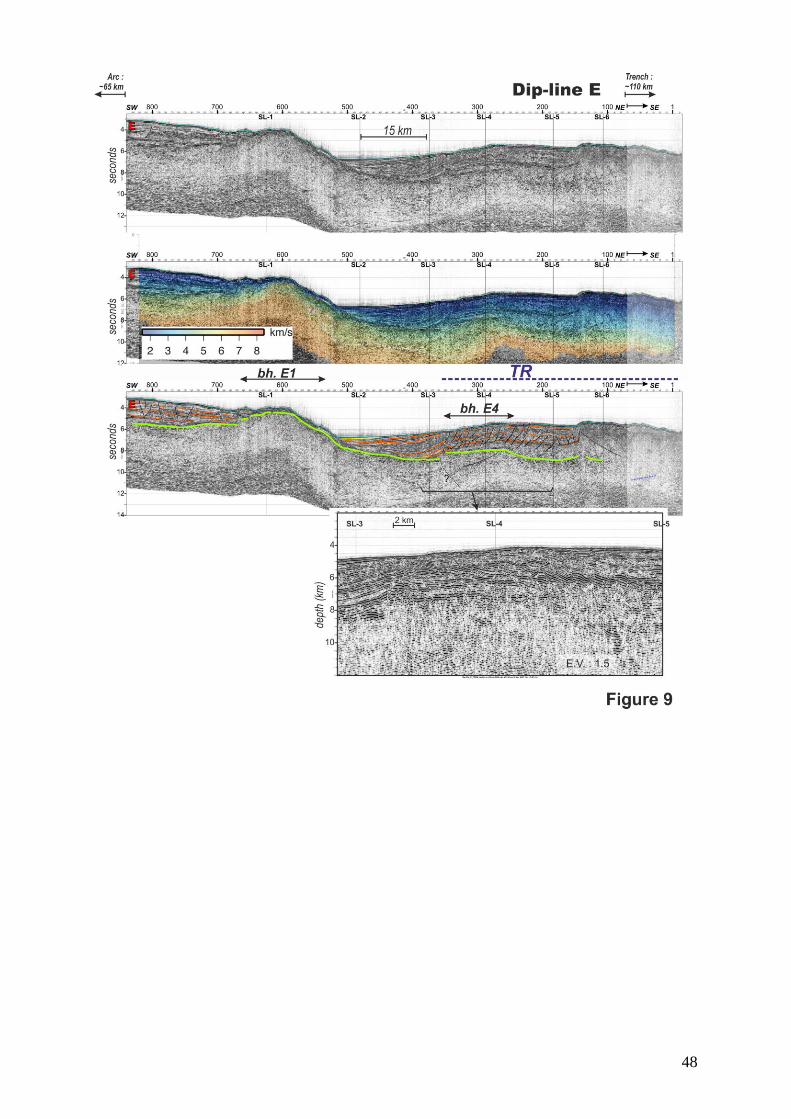
ACC
EPTE
D M
ANU
SCR
IPT
ACCEPTED MANUSCRIPT
48
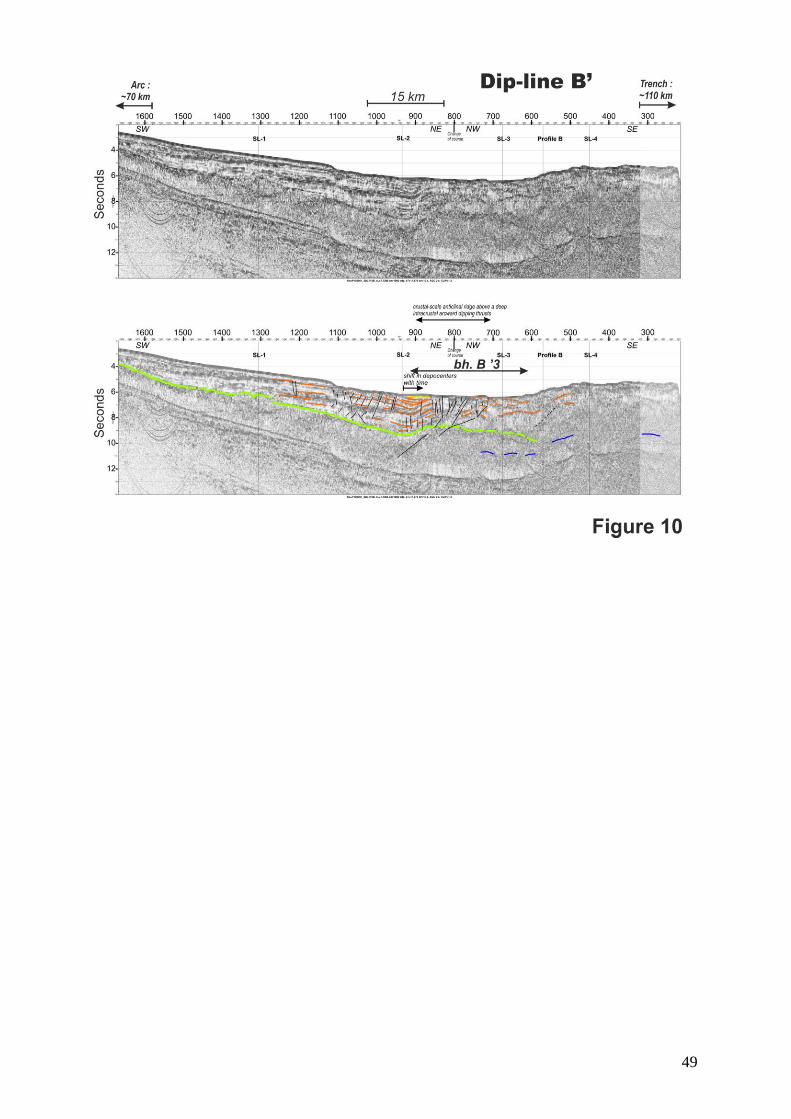
ACC
EPTE
D M
ANU
SCR
IPT
ACCEPTED MANUSCRIPT
49
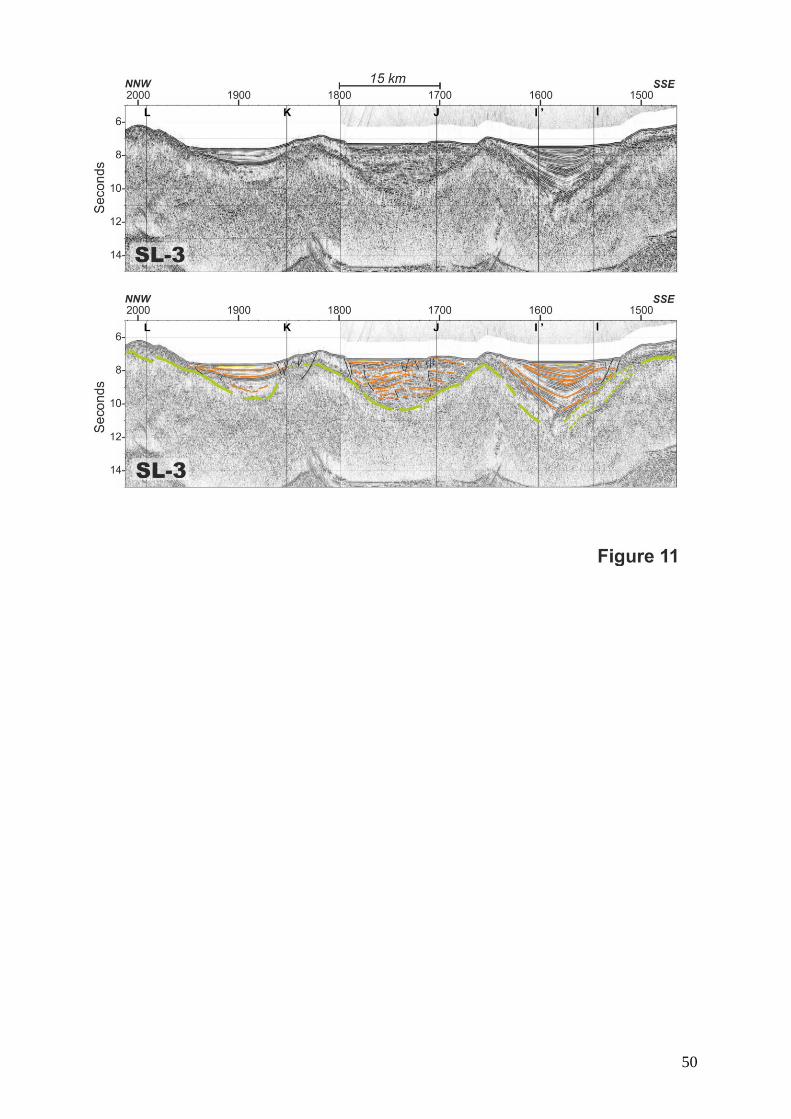
ACC
EPTE
D M
ANU
SCR
IPT
ACCEPTED MANUSCRIPT
50
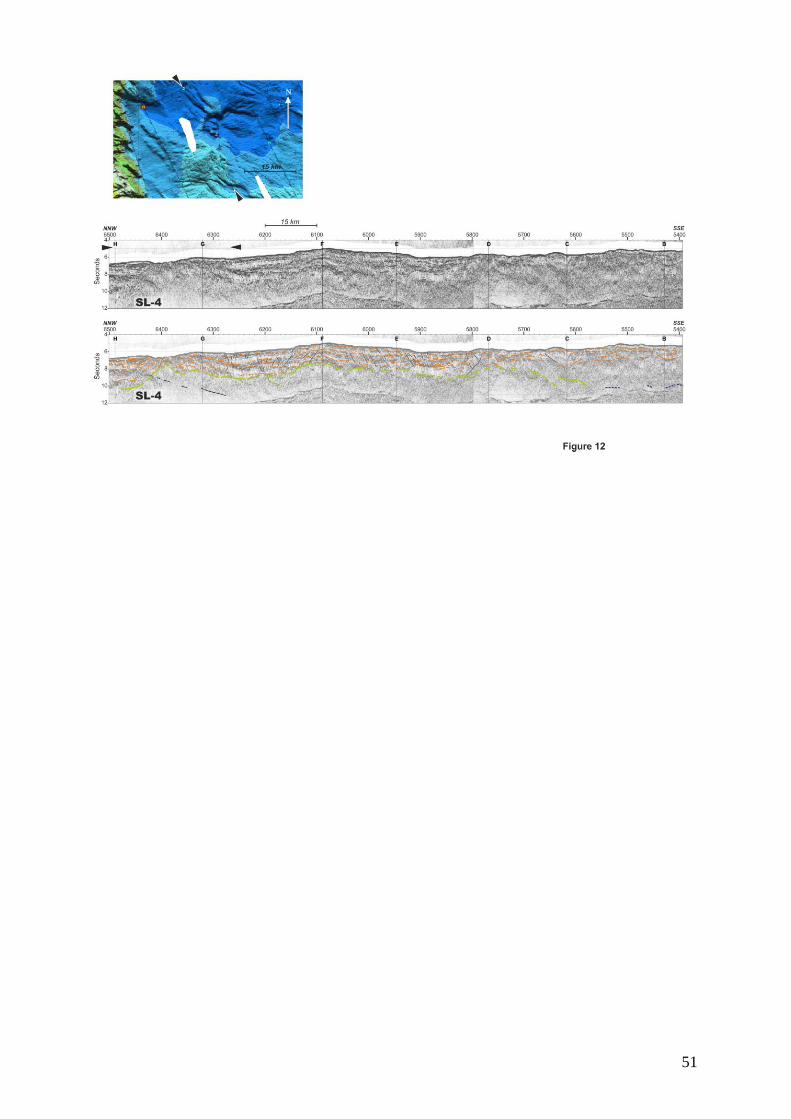
ACC
EPTE
D M
ANU
SCR
IPT
ACCEPTED MANUSCRIPT
51
Related Documents