Attendance: Using Attendance Records to Drive Interventions Allyson Christine Wilkins M.A. Candidate in School Counseling The University of San Diego

Welcome message from author
This document is posted to help you gain knowledge. Please leave a comment to let me know what you think about it! Share it to your friends and learn new things together.
Transcript

Attendance: Using Attendance
Records to Drive Interventions
Allyson Christine WilkinsM.A. Candidate in School Counseling
The University of San Diego

Tell me about Midland Elementary
🔸 Poway Unified School District 🔸 Serves K-5🔸 35% of the population qualify for
free/reduced lunches and Title I support
🔸 Population: 850 students🔸 50% Caucasian, 32% Hispanic,
7% Asian, 4% Filipino, 3% African-American, 3% Other
🔸 35% of student population are English Language Learners

What were my concerns?
🔸Midland Interview
🔸Grand Central Station
🔸Attendance History
🔸Setting the Expectations

Will attendance percentages of the class with the lowest attendance
rates on campus be improved with interventions implemented by the
school counseling intern?
Research Question

Review of Literature
“The costs and impact of chronic truancy are significant, with both short- and long-term implications for the truant youth as well as for the family, school, and community” (Maynard, B. R., McCrea, K. T., Pigott, T. D., Kelly, M. S., & Campbell, C., 2012, p. 5)
“Student absenteeism has a direct association with poor
academic performance” (Weismuller, Grasska, Alexander, White, & Kramer, 2007, p. 111-
118).
An estimated 5 to 7.5 million students miss 18 or more days of school each year, or nearly an entire month or more of
school, which puts them at significant risk of falling behind academically and failing to graduate from
high school.(U.S. Department of
Education, 2016)
A past Action Research project conducted at USD studied interventions to
combat absenteeism through discussing “the
importance of school and the students” and it was found at the end of the
program that students were motivated to come to school by incentives, they enjoyed check-ins
because they made them feel special and proud
and lastly they enjoyed the program because of it’s positive effects on their
academics simply by their increased presence
(Cole, J. F., 2011, p. 62-70).

Why Action Research?
Reflect: What can I do
for a bigger increas
e?
Plan: Modify
for cycle two
Observe:
Watch records over 4 weeks
Plan: Assess
Attendance
Records→ narrow down
Action: One
Classroom Guidance Lesson
Observe: Attendance Records
over 4 weeks
Reflect: What
worked? What
would I do
different?
Action: 4
Lunchtime Lessons

Overview of this Process
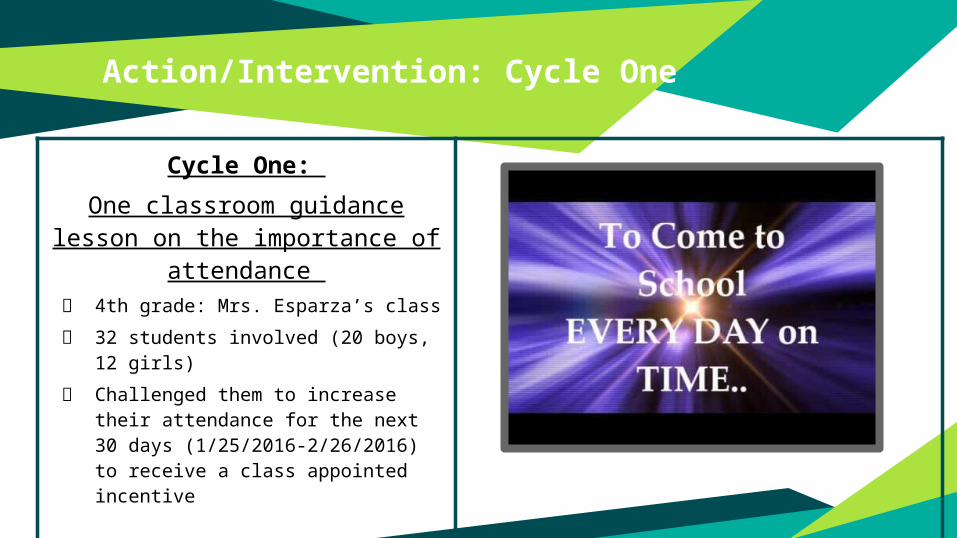
Action/Intervention: Cycle One
Cycle One: One classroom guidance lesson
on the importance of attendance 🔸 4th grade: Mrs. Esparza’s class 🔸 32 students involved (20 boys, 12
girls)🔸 Challenged them to increase their
attendance for the next 30 days (1/25/2016-2/26/2016) to receive a class appointed incentive
Quantitative Attendance Records for January 25-
February 26, 2016

Cycle One Results
Overall Attendance increased
from 94.8% to 95%
4% decreases
in days unexcused
Initial 8/19-
12/18/15
Cycle One 1/25-2/26/16
32% decrease in days
excused

Balloon Party!

Interpretations & Modifications
🔸Bigger improvement🔸More hands-on with students 🔸Reflect on past research

Action/Intervention: Cycle Two
Cycle Two: Four optional lunchtime lessons on various
attendance related topics 🔸 Attendance Review (Pizza) 🔸 How to Stay Healthy (Popsicles) 🔸 What You Miss When You Miss a Day of School
(Popcorn) 🔸 Valid & Invalid Reasons for Missing School (Nachos)
Quantitative Assessed attendance records March 21-April 22, 2016Sign-in sheets to track numbers of students in
attendance for each lunchtime lessonQualitative
Exit Cards following each lesson

“Going on a vacation
and not coming to school
is an absence“-Robby
“That touching your
eyes, mouth and nose
will get you sick” -Louise
“That staying home for no reason is not
okay” -Maryam
“Wash my hands for 30 sec”- Cylus
“I learned that if I was
absent it would count
on my permanent record
and how many days I
missed”-Cassie
“You miss a lot when you are absent”-Amanda “Go to school
and wait for summeror break”
Thomas-
🔸 Class overall attendance increased from 95% to 98.5%
🔸 Greater awareness of attendance related topics
🔸 Over 50% class attended for each optional lesson
🔸 Majority of students underestimated the total number of days they had missed throughout the year
Cycle Two Results Today I learned….

What do the numbers show?
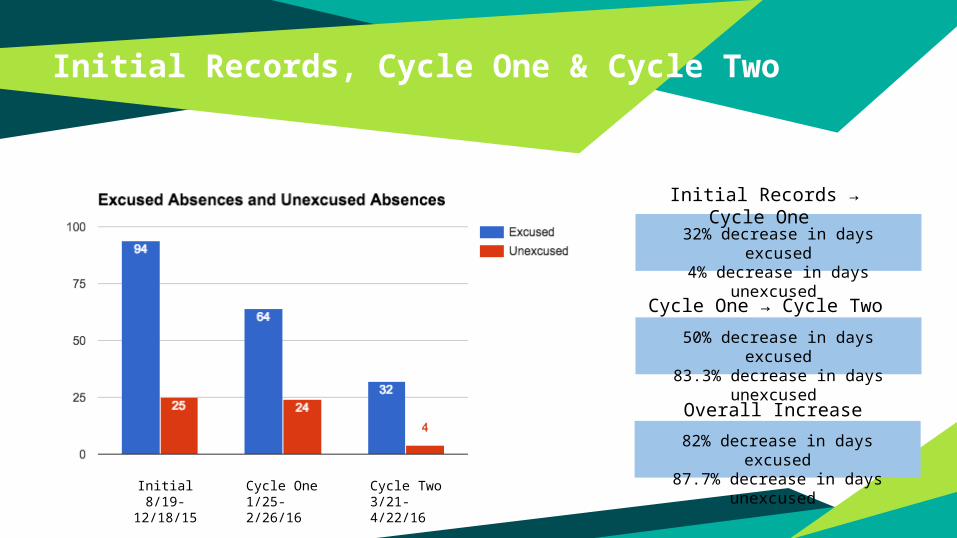
Initial Records, Cycle One & Cycle Two
Initial 8/19-12/18/15
Cycle One1/25-2/26/16
Cycle Two 3/21-4/22/16
32% decrease in days excused4% decrease in days unexcused
50% decrease in days excused83.3% decrease in days
unexcused
Initial Records → Cycle One
Cycle One → Cycle Two
Overall Increase 82% decrease in days excused
87.7% decrease in days unexcused

0.2% increaseIn the first cycle
3.5% increase In the second cycle
3.7% increase overall in just 3 months!
Lunchtime Lessons were more powerful!

Legitimacy of Knowledge Claims
🔸 Collected Quantitative data (Attendance Records)🔸 Descriptive Statistics (Exit Cards) 🔸 Prolonged Engagement 🔸 Data gathered through: 🔸 Poway Unified School District’s Synergy program 🔸 Student report (Exit Cards)
🔸 National Center for Education Statistics 🔸 Ensures data integrity and accuracy 🔸 Data collection survey and training for staff
Lincoln & Guba, 1985

Significance & Implications

Role of Evidence-Based Research
🔸 No research for Attendance Interventions that are Evidence-Based
🔸 Research about causes → minimal research on how to combat them🔸 Specific to school community
What does the future hold? ● Per Pupil
Loss=$211.20/Student/Day (SD County)
● School of 800 students who are currently at 95% attendance (760/800 attending each day)
● Missing out on $8,448 per day ○ What could these results
mean for a school’s budget? Test scores? Overall achievement?
Limitations & Recommendations
🔸 New researcher🔸 Language barriers
with parents🔸 Administrative
approval 🔸Multi-language
Flyers🔸 Communicating with
teachers🔸 Scheduling
🔸More hands-on Cycle One
🔸 Replication Cycle Two + additional topics
🔸 Parent Involvement🔸 Parent Night 🔸 Sending home
information 🔸 Resources
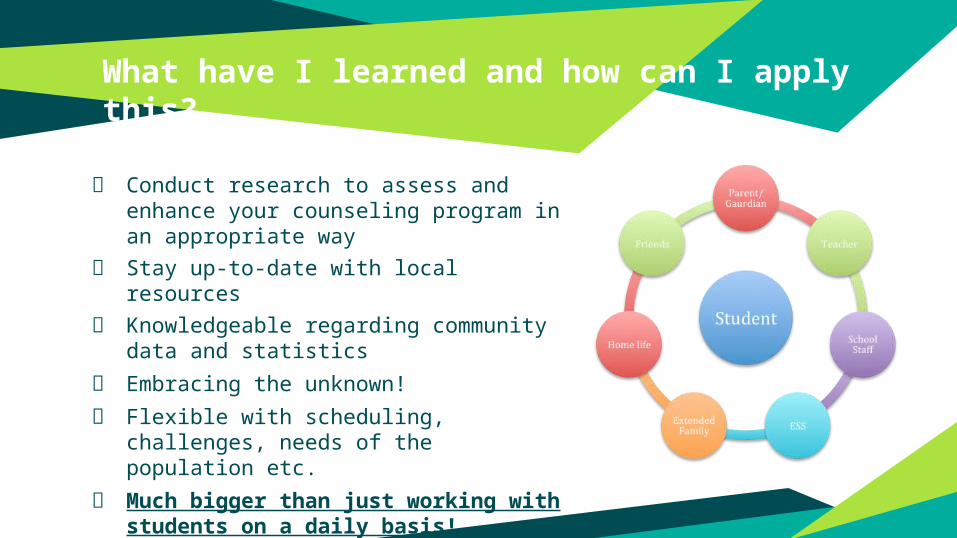
🔸 Conduct research to assess and enhance your counseling program in an appropriate way
🔸 Stay up-to-date with local resources 🔸 Knowledgeable regarding community
data and statistics 🔸 Embracing the unknown! 🔸 Flexible with scheduling, challenges,
needs of the population etc. 🔸 Much bigger than just working with
students on a daily basis!
What have I learned and how can I apply this?

“In conclusion, attendance percentages of the class with the lowest attendance rates on campus were improved with
interventions implemented by the school counseling intern!
REFERENCES
Adelman, H. & Taylor, L.(2006a). The school leader’s guide to student learning supports: New Directions for addressing barriers to learning. Thousand Oaks, CA: Corwin Press.
Chapter 1: The Economic Impact. (n.d.). Retrieved May 09, 2016, from https://oag.ca.gov/truancy/2013/ch1
Cole, J. F. (2011). Interventions to Combat the Many Facets of Absenteeism: Action Research.Georgia School Counselors Association Journal, 18(1), 62-70.
Hoffman, L. M. (n.d.). Section Three: Protecting the Privacy of Individuals during the Data Collection Process. Retrieved May 01, 2016, from https://nces.ed.gov/pubs97/p97527/Sec3_txt.asp
Lincoln and Guba's Evaluative Criteria. (n.d.). Retrieved May 01, 2016, from http://www.qualres.org/HomeLinc-3684.html Maynard, B. R., McCrea, K. T., Pigott, T. D., Kelly, M. S., & Campbell, C. (2012). Indicated
Truancy Interventions: Effects on School Attendance among Chronic Truant Students. Campbell Systematic Reviews. 2012:10.Campbell Collaboration,
U.S. Department of Education, Institute of Education Sciences, What Works Clearinghouse. (2014, September). WWC review of the report: Meeting the challenge of combating chronic absenteeism: Impact of the NYC Mayor’s Interagency Task Force on chronic absenteeism and school attendance and its implications for other cities. Retrieved from http://whatworks.ed.gov
Weismuller, P., Grasska, M., Alexander, M., White, C., & Kramer, P. (2007). Elementary school nurse interventions: attendance and health outcomes. Journal Of School Nursing (Allen Press Publishing Services Inc.), 23(2), 111-118 8p. doi:10.1177/10598405070230020901

Thank you for your time today!Any questions?
Related Documents