Provided for non-commercial research and educational use only. Not for reproduction, distribution or commercial use. This chapter was originally published in the book Advances in Ecological Research, Vol. 41, published by Elsevier, and the attached copy is provided by Elsevier for the author's benefit and for the benefit of the author's institution, for non-commercial research and educational use including without limitation use in instruction at your institution, sending it to specific colleagues who know you, and providing a copy to your institution’s administrator. All other uses, reproduction and distribution, including without limitation commercial reprints, selling or licensing copies or access, or posting on open internet sites, your personal or institution’s website or repository, are prohibited. For exceptions, permission may be sought for such use through Elsevier's permissions site at: http://www.elsevier.com/locate/permissionusematerial From: Daniel C. Reuman, Christian Mulder, Carolin Banašek-Richter, Marie-France Cattin Blandenier, Anton M. Breure, Henri Den Hollander, Jamie M. Kneitel, Dave Raffaelli, Guy Woodward and Joel E. Cohen, Allometry of Body Size and Abundance in 166 Food Webs. In Hal Caswell, editor: Advances in Ecological Research, Vol. 41, Burlington: Academic Press, 2009, pp. 1-44. ISBN: 978-0-12-374925-3 © Copyright 2009 Elsevier Inc. Academic Press.

Welcome message from author
This document is posted to help you gain knowledge. Please leave a comment to let me know what you think about it! Share it to your friends and learn new things together.
Transcript

Provided for non-commercial research and educational use only.
Not for reproduction, distribution or commercial use.
This chapter was originally published in the book Advances in Ecological Research,
Vol. 41, published by Elsevier, and the attached copy is provided by Elsevier for the
author's benefit and for the benefit of the author's institution, for non-commercial
research and educational use including without limitation use in instruction at your
institution, sending it to specific colleagues who know you, and providing a copy to
your institution’s administrator.
All other uses, reproduction and distribution, including without limitation commercial
reprints, selling or licensing copies or access, or posting on open internet sites, your
personal or institution’s website or repository, are prohibited. For exceptions,
permission may be sought for such use through Elsevier's permissions site at:
http://www.elsevier.com/locate/permissionusematerial
From: Daniel C. Reuman, Christian Mulder, Carolin Banašek-Richter, Marie-France Cattin
Blandenier, Anton M. Breure, Henri Den Hollander, Jamie M. Kneitel, Dave Raffaelli, Guy
Woodward and Joel E. Cohen, Allometry of Body Size and Abundance in 166 Food Webs.
In Hal Caswell, editor: Advances in Ecological Research, Vol. 41, Burlington:
Academic Press, 2009, pp. 1-44. ISBN: 978-0-12-374925-3
© Copyright 2009 Elsevier Inc.
Academic Press.

Author's Personal Copy
Allometry of Body Size andAbundance in 166 Food Webs
DANIEL C. REUMAN, CHRISTIAN MULDER,CAROLIN BANASEK‐RICHTER, MARIE‐FRANCE CATTIN
BLANDENIER, ANTON M. BREURE, HENRI DEN HOLLANDER,JAMIE M. KNEITEL, DAVE RAFFAELLI, GUY WOODWARD
AND JOEL E. COHEN
S
ADVAN
# 2009
Publishe
ummary . . . . . . . . . . . . . . . . . . . . . . . . . . . . . . . . . . . . . . . . . . . . . . . . .
CES IN ECOLOGICAL RESEARCH VOL. 41 0065-250
Daniel C. Reuman and co-authors. DOI: 10.1016/S0065-2504
d by Elsevier Ltd. All rights reserved
4/09
(09)0
2
I. I ntroduction . . . . . . . . . . . . . . . . . . . . . . . . . . . . . . . . . . . . . . . . . . . . . . . 3$35.0
0401-
II. T
heory . . . . . . . . . . . . . . . . . . . . . . . . . . . . . . . . . . . . . . . . . . . . . . . . . . . 5 A . T he Energetic Equivalence Hypothesis . . . . . . . . . . . . . . . . . . . . . . 5 B . T he Energetic Equivalence Hypothesis with TrophicTransfer Correction. . . . . . . . . . . . . . . . . . . . . . . . . . . . . . . . .
6 III. M ethods . . . . . . . . . . . . . . . . . . . . . . . . . . . . . . . . . . . . . . . . . . . . . . . . . . 6A
. T esting Theory . . . . . . . . . . . . . . . . . . . . . . . . . . . . . . . . . . . . . . . . . 6 B . T esting Linearity . . . . . . . . . . . . . . . . . . . . . . . . . . . . . . . . . . . . . . . 7 C . R easons for Nonlinearity and Alternative Models . . . . . . . . . . . . . 9 D . G eneral Methods . . . . . . . . . . . . . . . . . . . . . . . . . . . . . . . . . . . . . . . 11IV. D
ata . . . . . . . . . . . . . . . . . . . . . . . . . . . . . . . . . . . . . . . . . . . . . . . . . . . . . 11 V. R esults . . . . . . . . . . . . . . . . . . . . . . . . . . . . . . . . . . . . . . . . . . . . . . . . . . . 14A
. T esting Theory . . . . . . . . . . . . . . . . . . . . . . . . . . . . . . . . . . . . . . . . . 14 B . T esting Linearity . . . . . . . . . . . . . . . . . . . . . . . . . . . . . . . . . . . . . . . 18 C . R easons for Nonlinearity and Alternative Models . . . . . . . . . . . . . 19VI. D
iscussion . . . . . . . . . . . . . . . . . . . . . . . . . . . . . . . . . . . . . . . . . . . . . . . . 22 A . S lopes and Predictions of Theory . . . . . . . . . . . . . . . . . . . . . . . . . . 23 B . E xamples of Ecological Errors from Unsupported Models . . . . . . 24 C . D iscussion of Methods. . . . . . . . . . . . . . . . . . . . . . . . . . . . . . . . . . . 26 D . R ecommendations and Future Directions. . . . . . . . . . . . . . . . . . . . 28Ackno
wledgments . . . . . . . . . . . . . . . . . . . . . . . . . . . . . . . . . . . . . . . . . . . . . . . 29 Appen dix I. How and Why Linearity Tests Differ from Those of Cohen andCarpenter . . . . . . . . . . . . . . . . . . . . . . . . . . . . . . . . . . . . . . . . . . . . . . . . .
30 A . T esting the Assumption of Linearity of Conditional Expectation . 30 B . T esting the Assumption of Homoskedasticity of Residuals . . . . . . 31 C . T esting the Assumption of Normality of Residuals . . . . . . . . . . . . 32 D . T esting the Assumption of Homoskedasticity of AbsoluteResiduals . . . . . . . . . . . . . . . . . . . . . . . . . . . . . . . . . . . . . . . . .
32 Appen dix II. Testing the Composite Test of Linearity. . . . . . . . . . . . . . . . . . . 33 Appen dix III. Symmetric Linear Regression . . . . . . . . . . . . . . . . . . . . . . . . . . 35 Appen dix IV. Additional Results of Linearity Testing . . . . . . . . . . . . . . . . . . 36 Appen dix V. Abundance and Diversity of Bacteria . . . . . . . . . . . . . . . . . . . . . 37 Appen dix VI. Limitations of the Data . . . . . . . . . . . . . . . . . . . . . . . . . . . . . . . 38 Refere nces . . . . . . . . . . . . . . . . . . . . . . . . . . . . . . . . . . . . . . . . . . . . . . . . . . . . . 400
2

2 DANIEL C. REUMAN ET AL.
Author's Personal Copy
SUMMARY
The relationship between average body masses (M ) of individuals within
species and densities (N ) of populations of different species and the mechan-
isms and consequences of this relationship have been extensively studied.
Most published work has focused on collections of data for populations of
species from a single broad taxon or trophic level (such as birds or herbivo-
rous mammals), rather than on the populations of all species occurring
together in a local food web, a very different ecological context. We here
provide a systematic analysis of relationships between M and N in commu-
nity food webs (hereafter simply webs), using newly collected, taxonomically
detailed data from 166 European and North American pelagic, soil, riparian,
benthic, inquiline, and estuarine webs.
We investigated three topics. First, we compared log(N )‐versus‐log(M )
scatter plots for webs and the slope b1 of the ordinary‐least‐squares (OLS)
regression line log(N) ¼ b1 log(M ) þ a1 to the predictions of two theories
(Section V.A). The energetic equivalence hypothesis (EEH) was not originally
intended for populations within webs and is used here as a null‐model. The
second theory, which extends the EEH to webs by recognizing the inefficiency
of the transfer of energy from resources to consumers (a trophic transfer
correction, or TTC), was originally proposed for webs aggregated to trophic
levels. The EEH predicts approximate linearity of the log(N)‐versus‐log(M)
relationship, with slope�3/4 for all webs. The relationshipwas approximately
linear for most but not all webs studied here. However, for webs that were
approximately linear, the slope was not typically�3/4, as slopes varied widely
from web to web. Predictions of the EEH with TTC were also largely falsified
by our data. The EEH with TTC again predicts linearity with b1 <�3/4
always, meaning that populations of larger taxa in a web absorb less energy
from the environment than populations of smaller taxa. In the majority of the
linear webs of this study, on the contrary, b1>�3/4, indicating that popula-
tions of larger taxa absorb more energy than populations of smaller ones.
Slopes b1>�3/4 can occur without violating the conservation of energy, even
in webs that are energetically isolated above trophic level 0 (discussed later).
Second, for each web, we compared log–log scatter plots of the M and N
values of the populations of each taxon with three alternate linear statistical
models (Section V.B). Trophic relationships determined which taxa entered
the analysis but played no further role except for the Tuesday Lake and
Ythan Estuary webs. The assumptions of the model log(N) ¼ b1 log(M) þa1þ e1 (including linearity of the expectation) were widely but not universallysupported by our data. We tested and confirmed a hypothesis of Cohen and
Carpenter (2005) that the model log(N) ¼ b1 log(M) þ a1þ e1 describes webscatter plots better, in general, than the model log(M) ¼ b2 log(N) þ a2þ e2.

BODY SIZE-ABUNDANCE ALLOMETRY IN FOOD WEBS 3
Author's Personal Copy
The former model is also better than the model of symmetric linear
regression.
Third, since not all of our log–log scatter plots formed approximately linear
patterns, we explored causes of nonlinearity and examined alternative models
(Section V.C). We showed that uneven lumping of species to web nodes can
cause log(N)‐versus‐log(M) scatter plots to appear nonlinear. Attributes of
the association between N and M depended on the type of ecosystem from
which data were gathered. For instance, webs from the soil of organic farms
were much less likely to exhibit linear log(N)‐versus‐log(M) relationships
than webs from other systems. Webs with a larger range of measured log(M)
values were more likely to appear linear. Our data rejected the hypothesis that
data occupy a polygonal region in log(N)‐versus‐log(M) space.
I. INTRODUCTION
The relationship between average body masses (M) of individuals within
species and densities (N) of populations of different species and the mechan-
isms and consequences of this relationship have been extensively studied for
populations of species from a single broad taxon or trophic level such as
birds or herbivorous mammals (e.g., Colinvaux, 1978; Damuth, 1981;
Griffiths, 1992, 1998; Peters, 1983; Russo et al., 2003; reviews include
Blackburn and Gaston, 1997, 1998, 2001; Brown, 1995, p. 94; Kerr and
Dickie, 2001; LaBarbera, 1989; Leaper and Raffaelli, 1999). Data have
been gathered at scales varying from global to local, often with different
results for different scales (Brown and Maurer, 1986; Damuth, 1981;
Lawton, 1989, 1990). One theory, sometimes called Damuth’s rule or the
energetic equivalence hypothesis (EEH), predicts that when populations of
all species absorb amounts of energy from the environment, per unit habitat,
that do not vary systematically with M, the linear relationship log(N)� b1log(M) þ a1 should hold (Damuth, 1981). A linear relationship with slope b1about equal to �3/4 has been confirmed by a variety of global and regional
empirical studies (e.g., Damuth, 1981; Gaston and Lawton, 1988;Greenwood
et al., 1996; Nee et al., 1991; Peters, 1983; Peters and Wassenberg, 1983);
reinforced by recent important developments in metabolic theory (Brown
et al., 2004; Savage et al., 2004; West et al., 1997); explained using alternative
mechanisms (Blackburn and Gaston, 1993); and usefully qualified
(Blackburn and Gaston, 2001). Some studies that examined co‐occurringlocal populations of species from a single taxon rejected linearity of the
relationship and the value of the slope b1¼ �3/4 and argued instead that
data fall in a polygonal region in log(N)–log(M) space (Blackburn and

4 DANIEL C. REUMAN ET AL.
Author's Personal Copy
Gaston, 1997; Blackburn et al., 1993; Brown and Maurer, 1986, 1989;
Lawton, 1989, 1990). The statistical models
log Nð Þ ¼ b1 log Mð Þ þ a1 þ e1 ð1Þand
log Mð Þ ¼ b2 log Nð Þ þ a2 þ e2 ð2Þ(where ei is independently normally distributed with mean 0 and constant
variance) have both been used to describe data (for the former, see Damuth,
1981; Peters, 1983; for the latter, see Enquist et al., 1998, p. 164, who state
that ‘‘Plant ecologists have traditionally treated mass as the dependent
variable. . .’’; Lonsdale, 1990).Only a few studies have examined scatter plots relating log(N) and log(M)
for the populations of all or most species occurring in a local web, regardless
of taxonomy. The ecological context of such studies is very different from
that of studies of populations of species from a single taxon, and we focus
here on the web context. Web studies found approximate linear relationships
between log(N) and log(M) (Cohen et al., 2003; Cyr et al., 1997a; Jonsson
et al., 2005; Leaper and Raffaelli, 1999; Marquet et al., 1990; Mulder et al.,
2005a; Woodward et al., 2005a). Such relationships do not follow from the
EEH, since its assumptions are violated: for most webs, total energy acquired
by the local population of a species may well depend systematically on
species M, since it may depend on trophic level, which is related to M (see
Section VI; Brown et al., 2004; Cyr et al., 1997b; Jonsson et al., 2005). Some
web studies used the statistical model of Eq. 1 (Cyr et al., 1997a; Leaper and
Raffaelli, 1999; Marquet et al., 1990), while others used Eq. 2 or reported
both regressions (Cohen et al., 2003; Jonsson et al., 2005; Mulder et al.,
2005a; Woodward et al., 2005a).
We here have systematically analyzed relationships between M and N in
166 complete or substantial partial pelagic, soil, riparian, benthic, inquiline,
and estuarine webs. Of these, 146 are soil webs. We investigated three related
topics.
First, we compared log(N)‐versus‐log(M) scatter plots and regression
slopes for populations within webs to the predictions of two theories: the
EEH itself, which was not originally intended for webs and is used here for
comparison, and an extension of the EEH of Brown and Gillooly (2003) and
Brown et al. (2004) that incorporates the inefficiency of the transfer of energy
from resources to consumers (a trophic transfer correction, or TTC).
The EEH with TTC was intended forM–N data aggregated to trophic levels.
We tested how well the theory works for taxonomically resolved webs. Both
theories predict that log(N) will depend approximately linearly on log(M);
the EEH predicts a slope of �3/4 for all webs, whereas the EEH with TTC
gives a formula for slope that predicts values less than or equal to �3/4

BODY SIZE-ABUNDANCE ALLOMETRY IN FOOD WEBS 5
Author's Personal Copy
(Section II). We discuss the shortcomings of these theories and how they
might be improved.
Second, we examined log–log scatter plots of the M and N of populations
of taxa in webs using three linear statistical models: the OLS model with
independent variable log(M), the OLS model with independent variable
log(N), and the symmetric model of type II regression. With new data and
a shortage of theoretical guidance relevant to the data, it is sensible to
consider a variety of statistical perspectives.
Third, since not all of the log(N)‐versus‐log(M) scatter plots of this study
were approximately linear, we considered departures from linearity, alternative
nonlinear models, and possible causes for nonlinearity.
The practice of considering multiple types of linear regression in the same
study, as we do, is common in other fields but not widely practiced in
ecology; we justify our use of multiple models here and in Section VI.
Theoretical considerations or preliminary data analysis should usually deter-
mine the most appropriate statistical model of linear regression. The data
and theory currently available for M and N relationships in webs do not
convincingly favor one model over others. The EEH was originally proposed
for animals of determinate growth (Damuth, 1981) and implies that log(M)
should be the independent variable that predicts log(N). The self‐thinningrule (Lonsdale, 1990) was originally proposed for plants and implies that log
(N) should be the independent variable that predicts log(M). Webs contain
animals and plants. Neither theory was intended for webs, and no theory
suggests which variable is causal for webs. Estimates of the error in the M
and N measurements of this study are not available to guide the choice of a
linear model. Therefore, we fitted several models to our data, compared their
parameter estimates and tested whether their statistical assumptions were
met. Our results and discussion will inform appropriate choices of linear
models in future studies, where additional information about causality or
measurement error may also be available to guide the choice of model.
II. THEORY
We here review the EEH and the EEH with TTC.
A. The Energetic Equivalence Hypothesis
TheEEH (Damuth, 1981) assumes that populations of every species absorb the
same total energy,E, from the environment, per unit area or volume of habitat.
If the average metabolism of individuals of a species, and therefore the average
energy requirements per individual, are proportional toM3/4, then

6 DANIEL C. REUMAN ET AL.
Author's Personal Copy
N / E
M3=4ð3Þ
By taking logs:
log Nð Þ ¼ � 3
4log Mð Þ þ a ð4Þ
Therefore, the EEH predicts that: (1) log(N)‐versus‐log(M) relationships are
approximately linear; and (2) they have slope about �3/4.
B. The Energetic Equivalence Hypothesis with TrophicTransfer Correction
The EEH with TTC (Brown and Gillooly, 2003; Brown et al. 2004, especially
pp. 1785–1786 and Eq. 13) does not assume that the populations of every
species absorb the same amount of energy from the environment per unit
habitat. Here a, assumed to be roughly constant within a web, is the trophic
transfer efficiency orLindeman efficiency (the percentage of consumed biomass
converted to bodymass or reproduction), and b denotes the average consumer‐to‐resource body mass ratio in the web. The amount of energy available to
consumers ofmassM should be a times the energy available to their prey, which
havemassM/b, on average. Therefore, for every increase by a factor of b in the
average sizeM of individuals of a species in a web, the abundanceN (per unit of
habitat) of that species should be less than that expected from the EEH by a
factor of a. Hence it is predicted that: (1) log(N) and log(M) in a web will be
related linearly and (2) the slope will be �3/4 þ log(a)/log(b):
log Nð Þ ¼ log að Þlog bð Þ �
3
4
� �log Mð Þ þ a ð5Þ
In the slope, log(a)/log(b) corrects for the inefficiency of trophic transfer.
For the vast majority of webs, this formula predicts a slope less than �3/4
since log(a)/log(b) < 0 if a < 1 and b > 1.
III. METHODS
Methods are reported here in sections corresponding to the sections of
Section V below.
A. Testing Theory
The linearity prediction of the EEH and of the EEH with TTC was tested for
each web with a ‘‘quadratic coefficient F‐test’’ of whether a model quadratic
in log(M) explained significantly more variation in log(N) than a linear

BODY SIZE-ABUNDANCE ALLOMETRY IN FOOD WEBS 7
Author's Personal Copy
model, and more broadly by testing other assumptions of the statistical
model of Eq. 1 (see Section III.B.1 for details). Nonlinear webs were
considered to falsify the predictions of both theories.
To test predictions for each linear web, the slope of the OLS regression of
log(N) against log(M) (Eq. 1) was computed and compared to the prediction
�3/4 for the EEH and to the prediction log(a)/log(b)�3/4 for the EEH with
TTC. Here a was assumed to be equal to 10%. In webs where trophic links
were available, the value of log(b) was taken as the mean of log(Mc/Mr)
across all trophic links, where Mc ¼ consumer mean body mass and Mr ¼resource mean body mass. The mean of the log ratios was used instead of the
log of the mean ratios because distributions of log ratios were much more
symmetric than distributions of untransformed ratios. Computing log(b)required detailed trophic link data, which were available only for two pelagic
webs and one estuarine web (from Tuesday Lake and the Ythan Estuary,
respectively; see Section IV). For other webs, slope predictions of the EEH
with TTC were considered to be incorrect if the empirically estimated slope
was greater than �3/4. Thus, we used different methods of testing the
quantitative predictions of the EEH with TTC for the Tuesday Lake and
Ythan Estuary webs, and for the other webs.
Because the EEH and the EEH with TTC can be interpreted as predicting
N from M, we compared predicted slopes primarily to slopes from OLS
regression with independent variable log(M). The assumptions of the stan-
dard linear model with independent variable log(M) were largely met by web
data, but many assumptions of the standard linear model with independent
variable log(N) and assumptions of the symmetric linear regression model
were not met (Section V). To show whether results depend on the choice of
model I versus model II regression, we present model II results as well.
Slopes of the upper bounds of distributions of taxa plotted on log(N)‐versus‐log(M) axes were computed using a method of Blackburn et al. (1992).
The method separates populations of taxa into log(M) bins and computes the
regression slope through the taxon populations that have the maximal log(N)
values in each bin. Three to eight bins were used.
B. Testing Linearity
1. Ordinary‐Least‐Squares Regression
We tested whether the assumptions of the standard linear models Eqs. 1 and
2 held for each of the 166 webs. The units used to measureM andN varied by
community, but the analysis of linear relationships between log(M) and log(N)
was not affected by the unit. Use of dry mass or wet mass (see Section IV) did
not affect the analysis, as it was reasonable to assume a roughly constant

8 DANIEL C. REUMAN ET AL.
Author's Personal Copy
or nonsystematically varying conversion factor between dry and wet body
mass within a community.
The linear model
y ¼ bxþ aþ e ð6Þmakes five principal assumptions: linearity of the average (conditional
expectation E(y|x)) of y as a function of x, normality of the residuals from
the regression line, homoskedasticity, serial independence of the residuals,
and no (or negligible) error in the measurements of x (Cohen and Carpenter,
2005; Snedecor and Cochran, 1967). The validity of only the first four
assumptions can be tested statistically using available data; we tested them.
Cohen and Carpenter (2005) discussed the fifth assumption for Tuesday
Lake. The methods we used are similar to those of Cohen and Carpenter
(2005), but differ in a few important respects (Appendix I).
Linearity of E(y|x) was tested using the ‘‘quadratic coefficient F‐test’’: wefitted the quadratic model
y ¼ cx2 þ bxþ aþ e ð7Þto data and did an F‐test to see whether the quadratic term of the model
explained a significant amount of variation. Unless the F‐test rejected the
hypothesis that c ¼ 0 at 1% significance level, data passed the test. The qua-
dratic coefficient F‐test was also a test of the assumption of homoskedasticity
of residuals (Appendix I.B).
Normality of the residuals r from the best‐fitting line was tested in two
ways: using the Jarque–Bera test (Jarque and Bera, 1987) and the Lilliefors
test (Lilliefors, 1967). Both are composite tests of normality of unknown
mean and variance. Simulations indicated that the Lilliefors test made fewer
than 1% Type I errors at nominal 1% significance level (Appendix II).
We tested homoskedasticity of the absolute residuals |r| using the ‘‘absolute
residuals F‐test.’’ We fitted the quadratic model
j r j ¼ cy2 þ byþ aþ e ð8Þwhere y was the value of y predicted from the best‐fitting line. We then did an
F‐test to see if this model explained significantly more of the variation in |r|
than the mean of |r| did. If this F‐test was unable to reject the hypothesis of no
trend in |r| at the 99% confidence level, then data passed the absolute
residuals F‐test. We tested serial independence of the residuals using
the Durbin–Watson test, as implemented by Kanzler (2005). All methods
were encapsulated into one Matlab function which is available on request
from D.C.R. or J.E.C.
The probability of Type I errors was investigated for each of the five
component tests by simulation. The probability that all five tests passed for
simulated data generated by a model of the form y ¼ bx þ a þ e was around

BODY SIZE-ABUNDANCE ALLOMETRY IN FOOD WEBS 9
Author's Personal Copy
95–96% but appeared to depend on the number of taxon populations
simulated. We said that data (x, y) ‘‘passed the composite test with indepen-
dent variable x’’ if all five tests failed to reject their null hypotheses. These
simulation‐based significance levels for the composite test are needed because
the component tests are not independent. The probability of at least four
tests passing was above 99.8% in 100,000 simulations (see Table S1 of
Appendix II). Therefore, if data do not pass the composite test (because
one or more of the five tests fail), then the null hypothesis that the assump-
tions of the linear regression model hold can be rejected with significance
level around 4–5%. If two or more tests fail, then the same null hypothesis
can be rejected with significance level substantially below 1%.
A permissive test of linearity between log(M) and log(N) is the quadratic
coefficient F‐test alone. That test examines only whether a line describes data
at least as well as a quadratic curve. The composite test is a more stringent
measure of whether models are statistically defensible. Data must fail the
composite test if they fail the quadratic coefficient F‐test, but not conversely.
2. Symmetric Linear Regression
The assumption of bivariate normality of data, made by symmetric linear
regression methods such as reduced major axis (RMA) and major axis (MA)
regression, was tested by examining marginal distributions of data. Normal-
ity of log(M) and log(N) distributions was tested using the Jarque–Bera and
Lilliefors tests. A symmetric linear regression method recommended by Isobe
et al. (1990) was also used. The method called the OLS‐bisector, calculatesthe line bisecting the angle formed by the OLS regressions of log(N) against
log(M), and log(M) against log(N). Confidence intervals for symmetric
regressions were calculated using the formulas of Isobe et al. (1990), which
do not rely on the assumption of bivariate normality, because that assump-
tion was usually violated by the data of this study (Section V). Symmetric
regression slopes are always presented with log(M) on the horizontal axis.
C. Reasons for Nonlinearity and Alternative Models
1. Lumping of Taxa
The effects on linearity of lumping multiple taxa into a single node were
investigated by performing post hoc lumping on the soil data (see also
Martinez, 1993; Sugihara et al., 1989). Only results in Section V.C.1 were
based on artificially lumped data. For each lumped node,N was computed as
the sum of the N values of the populations of the taxa comprising the node,

10 DANIEL C. REUMAN ET AL.
Author's Personal Copy
and M was computed as the N‐weighted mean of the M values of these
populations. Two types of lumping were performed and analyzed. First,
nematodes in soil webs were artificially lumped into body‐mass categories.
Nematodes were the smallest invertebrates in the soil webs. Second, in
separate computations, all soil web taxa except bacteria were lumped to
trophic guilds which jointly described feeding behavior and broad taxonomic
group (e.g., bacterivorous nematodes, fungivorous collembolans). These two
types of lumping simulate lumping that is unevenly (the nematode lumping)
and evenly (the trophic guild lumping) applied across the range of log(M)
values measured.
2. Are Some Ecosystem Types Not Linear?
To investigate whether log(N)–log(M) linearity depends on ecosystem type,
unlumped soil webswere classified into seven types (organic farm, conventional
farm, intensive farm, super‐intensive farm, pasture, winter farm, and forest).
This classification was augmented with the categories ‘‘riparian’’ (including all
the webs from the banks of Lake Neuchatel) and ‘‘inquiline’’ (including all the
webs from Sumatra Savannah) to form a classification of 162 webs into nine
types. Pelagic, benthic, and estuarine webs were not included because
these categories had too few webs. A 9 � 2‐contingency table was created
where the rows represented the nine site types, and the columns represented
passing (Mþ) or failing (M�) the composite test with independent variable
log(M). A �2 test evaluated the null model of independence between the site
type and passing or failing the composite test. For each contingency table cell,
the Freeman–Tukey deviate (Bishop et al., 1975, p. 137) was compared to a
standard normal distribution to determine which contingency table cells were
significantly more or less than expected from the null model.
3. Testing for Polygonal Relationships
Polygonal relationships (as defined by Lawton, 1989) between log(N) and
log(M) hold for some local, co‐occurring assemblages of species from a single
broad taxon (Blackburn and Gaston, 1997; Blackburn et al., 1993; Brown
andMaurer, 1986, 1989; Lawton, 1990). Local assemblages of species from a
single taxon are ecologically different from webs. Nevertheless, we tested
whether polygonal relationships describe the data of this study. A polygonal
relationship entails heteroskedasticity; we tested for heteroskedasticity using
the absolute residuals F‐test.For a positive control, we simulated data occupying an approximately
polygonal shape in log(N)‐versus‐log(M) space to test whether the absolute

BODY SIZE-ABUNDANCE ALLOMETRY IN FOOD WEBS 11
Author's Personal Copy
residuals F‐test was capable of rejecting homoskedasticity at the 99% signifi-
cance level for truly polygonal data. The average minimum log(M) value in the
soil webs of this study was �1.51 (not including bacteria) and the average
maximum log(M) value was 3.89, so we chose simulated log(M) values ran-
domly and uniformly in this range. The mean upper‐bound slope for the soil
webs was �0.66 (Section V), so we imposed an approximate upper constraint
log Nð Þ � �0:66 log Mð Þ þ 5 ð9Þon simulated data. We imposed an approximate lower‐bound constraint
log Nð Þ � �0:1 log Mð Þ þ 1 ð10Þ(so the lower bound took value�0.1� 3.89þ 1¼ 0.611 at the top of the log(M)
range). For each simulated log(M) value, the corresponding log(N) was chosen
randomly and uniformly between 0.611 and 5. Any pair (log(M), log(N))
outside the constraints was discarded. In this way, 57 points were generated
between the constraint lines (57 points were generated because the average
number of taxa in the soil systems was 57). A normal random variable of
mean 0 and standard deviation 0.5 was added to the log(N) value of each
point, and the absolute residuals F‐test and Lilliefors test were applied to the
resulting scatter plot.
D. General Methods
All computations were done in Matlab version 6.5.0.180913a (R13) using
some functions from the Statistics Toolbox Version 4.0 (R13). All logarithms
were base 10.
IV. DATA
This study analyzes 1 benthic stream web, 2 pelagic lake webs, 8 inquiline
webs, 8 riparian webs, 146 soil webs, and 1 estuarine web. Data for each of
these 166 systems were a list of taxa (sometimes complete, sometimes not)
and the mean body mass (M) per individual and density (N) of the local
population of each taxon. The average numbers of taxa in each web varied by
community type (Table 1). The level of taxonomic resolution varied slightly
by community type. We included only highly resolved webs. Most taxa were
resolved to species or genus level. We now describe the communities studied.
The benthic web was in Broadstone Stream, a naturally acid stream in
southeast England containing no vertebrates (Woodward et al., 2005b).
All known organisms in Broadstone Stream were quantified, except those
always passing a mesh of 500 mm (permanent meiofauna). The 32 taxa
included 24 species, 3 genera, 3 families, 1 order, and 1 class. Body mass

Table 1 Number of taxa in the communities of each type
Web location Web typeNumberof webs
Meannumberof taxa
Minimalnumberof taxa
Maximalnumberof taxa
Tuesday Lake Pelagic 2 50.5 50 51Netherlands Soil 146 54.5 30 96Lake Neuchatel Riparian 8 140.25 104 175Broadstone
streamBenthic 1 32 32 32
SumatraSavannah
Inquiline 8 12.25 11 16
Ythan estuary Estuarine 1 91 91 91
Total All webs 166 56.63 11 175
The broad taxon consisting of all bacteria was not included in these counts for The Netherlands
soil webs.
12 DANIEL C. REUMAN ET AL.
Author's Personal Copy
was in milligrams dry mass per individual. Population density was in indivi-
duals per square meter of the bottom surface. Both M and N data were
obtained by direct measurement.
The twopelagicwebswere inTuesdayLake, amildly acidic lake inMichigan,
USA. The fish populations were not exploited and the drainage basin was not
developed when the data were gathered (Carpenter and Kitchell, 1993; Cohen
et al., 2003; Jonsson et al., 2005). Data for the two webs were collected in 1984
and 1986. Three fish species were removed and another fish species was intro-
duced in 1985. In both 1984 and 1986, all known taxa in the nonlittoral
epilimnion of Tuesday Lake were resolved to species and quantified except
parasites and bacteria; but only taxa connected to the webs were included for
this study (50 species in 1984, 51 in 1986). Cohen and Carpenter (2005)
conducted a similar analysis using all taxa, including six additional taxa in
each year that were not connected to the web. Body mass was measured in
kilograms fresh mass. Population density was given in individuals per cubic
meter of the nonlittoral epilimnion, where all trophic interactions occurred.
BothM and N values were obtained by direct measurement.
The eight inquiline webs were in the water‐filled leaves of eight individual
pitcher plants (Sarracenia purpurea) in Sumatra Savannah, Apalachicola
National Forest, Florida, USA (Kneitel andMiller, 2002, 2003).We included
here only webs with more than 10 taxa. All known taxa in each pitcher were
quantified. Of the 23 nonbacterial taxa in any of the pitchers, 5 were species
(such as the rotifer Habrotrocha rosa), 15 were genera (mostly protozoans),
and 2 were the broader categories ‘‘mites’’ and ‘‘flatworms.’’ Bacteria were
classified into seven ‘‘marker taxa’’ by diluting, culturing, and classifying
colonies by appearance (sensu Cochran‐Stafira and Von Ende, 1998). Units

BODY SIZE-ABUNDANCE ALLOMETRY IN FOOD WEBS 13
Author's Personal Copy
for M were milligrams dry weight, and units for N were individuals per
milliliter of water. BothM and N values were based on direct measurements,
but M values were assumed to be the same from pitcher to pitcher.
The eight riparian webs were in four meadows in the Grande Caricaie on
the south shore of Lake Neuchatel in Switzerland (Banasek‐Richter, 2004;
Cattin Blandenier, 2004). Spring and summer webs were quantified for each
meadow. Two meadows were mown and two were unmown. One mown and
one unmown meadow were dominated by Schoenus nigricans; the other two
meadows were dominated by Cladium mariscus. All known animal taxa were
quantified for each web. Plant taxa were not included in the analysis of this
study because only the total biomass (M �N) was estimated for each vegeta-
tion unit (Cattin et al., 2003); M and N were not estimated separately, so
plants could not be included in log(N)–log(M) scatter plots. Taxonomic
resolution varied in these data: most taxa were species or genera, but broader
classifications were also included. Classifications by life stage also occurred:
some species and genera were split into larvae, immatures, and adults. Body
masses in units of milligrams dry weight were estimated from the literature
for vertebrates and for arthropods too small to be weighed directly (mites
and collembolans); they were measured directly for earthworms, and derived
from other measurements of body size for other taxa. Units of N were
individuals per square meter, measured directly.
The 146 soil webs were sampled in five types of farm (organic, conventional,
intensive, super‐intensive, and pastures; see Mulder et al., 2003a), as well as
winter farms (not cultivated at the time of sampling), and unmanaged pine
plantations in The Netherlands. All taxa known to occur in the rhizosphere
were quantified except fungal mycelia and plant roots, for which M and N
estimates were difficult to obtain, and protists, which were extremely rare in
the investigated sandy soils. In prior studies, the abundances of fungi (myce-
lia) and plant roots in the rhizosphere were treated together as unity (Mulder
et al., 2005a). In the present study, these groups were omitted. Of 169
nematode, 186 microarthropod, and 17 oligochaete taxa identified in any
of the 146 soil webs, �78% of the nematodes, 83% of the microarthropods,
and 100% of the oligochaetes were genera; the rest were families. All bacterial
cells were quantified and classified as a single taxon. We usually excluded
bacteria from each web before running the composite test described in
Section III.B. Units of M were micrograms, and units of N were individuals
per square meter. Samples were taken from the top 10 cm of soil. M and N
estimates were based on direct measurement, but the meanM values for each
taxon were assumed to be the same at all sites (Mulder et al., 2005b).
The estuarine web was in the Ythan Estuary, about 20 km north of
Aberdeen, Scotland (Hall and Raffaelli, 1991). The web of the Ythan Estuary
contained 91 taxa: 1 mammal, 26 birds, 18 fish, 44 invertebrates, and the
2 broader categories of phytoplankton and macroalgae. Of these, 73 were

14 DANIEL C. REUMAN ET AL.
Author's Personal Copy
resolved to species level; most remaining taxa were genera. Body mass was
in grams fresh mass per individual; abundance was absolute numbers of
individuals in the whole estuary.
V. RESULTS
A. Testing Theory
1. Linearity and Slopes Computed from Data
Approximate linear relationships between log(M) and log(N) held often but
not universally for the webs of this study (Table 2, Figure 1). Linearity results
are presented in detail in Section V.B.
The slopes b1 of the best‐fitting parameterizations of Eq. 1 were widely
distributed. Distributions of slopes were similar with and without nonsoil
webs (Figure 2A). Distributions were similar with and without webs that
failed the composite test with independent variable log(M) (Figure 2C).
The slopes obtained by Cyr et al. (1997b) for lake webs were very different
from most slopes obtained here, further emphasizing the variability among
webs of the slopes b1. The maximum slope of Cyr et al. was �0.74; the
minimum slope was �1.10 (contrast with Figure 2A and C). Since Cyr
et al. systematically excluded rare species, their slopes may correspond more
closely to the slopes of the upper‐bounds of log(N)‐versus‐log(M) distribu-
tions for whole webs (Blackburn et al., 1992; Section III.C). But their slopes
also differed significantly from the upper‐bound slopes of this study (Wilcoxon
rank–sum test, p< 10�5): the mean upper‐bound slope for the soil webs of this
study, using four log(M) bins, was �0.66, with 5th and 95th percentiles �1.01
and �0.15. Similar results were obtained using three to eight bins.
The variability of RMA slopes and OLS‐bisector slopes was just as great asthat of the slopes b1 (standard deviations 0.17, 0.15, and 0.15, respectively).
MAslopeswere evenmorevariable (standarddeviation0.27).SeeAppendix III,
Figure S1 for histograms.
2. Comparison with the Energetic Equivalence Hypothesis
Some scatter plots were not linear on log(N)‐versus‐log(M) axes (Figure 1E
and F; Table 2, especially column 2). Neither the EEH nor the EEH with
TTC can describe these nonlinear webs.
Of the 121 webs that passed the composite test with independent variable
log(M) (and hence were linear), 99% confidence intervals for b1 contained �1
only 10 times,�3/4 only 67 times, and�2/3 only 102 times. The slopes b1 are not
universal for webs. Model II slopes also varied widely (Appendix III).
The specific slope predictions of the EEH were refuted by our data.

Table 2 Number of webs that passed each of the five tests of the assumptions of the standard linear model
Web locationIndependentvariable
Quad. coef.F‐test
J.‐B. test Lillieforstest
Abs. resids.F‐test
D.‐W.test
All fivetests Four tests
Tuesday Lake Log(M) 2 2 2 2 2 2 2Log(N) 1 2 2 2 2 1 2
Netherlands, no bacteria Log(M) 127 (87%) 146 (100%) 143 (98%) 141 (97%) 133 (91%) 110 (75%) 142 (97%)Log(N) 106 (73%) 101 (69%) 124 (85%) 70 (48%) 75 (51%) 36 (25%) 66 (45%)
Lake Neuchatel Log(M) 1 8 8 8 3 1 3Log(N) 0 8 8 4 1 0 0
Broadstone stream Log(M) 1 1 1 1 1 1 1Log(N) 0 1 1 1 1 0 1
Sumatra Savannah Log(M) 7 8 8 8 8 7 8Log(N) 8 8 8 8 8 8 8
Ythan estuary Log(M) 1 1 1 0a 1 0 1Log(N) 1 1 1 0a 1 0 1
Totals Log(M) 139 (84%) 166 (100%) 163 (98%) 160 (96%) 148 (89%) 121 (73%) 157 (95%)Log(N) 116 (70%) 121 (73%) 144 (87%) 85 (51%) 88 (53%) 45 (27%) 78 (47%)
Both log(M) and log(N) were separately used as the independent variable; 99% confidence levels were used. The tests are (Section III.B): Quad. coef. F‐test,quadratic coefficient F‐test; J.‐B. test, Jarque–Bera test; Abs. resids. F‐test, Absolute residuals F‐test; D.‐W. test, Durbin–Watson test. The column ‘‘All
five tests’’ has the number of webs that passed all five of these tests. The column ‘‘Four tests’’ has the number of webs that passed at least four of these tests.
Values in parentheses are percentages of the number of webs shown in Table 1.aPhyllodoce, a paddle worm, was an outlier on plots of log(M)‐versus‐log(N) for the Ythan Estuary. When it was removed, the p‐value for the absoluteresiduals F‐test went from 0.0097 to 0.0121 for independent variable log(M). For independent variable log(N) it went from 1.16� 10�5 to 1.7� 10�5. The
pass/fail status (1% level) of the other components of the composite test did not change with the removal of that taxon for either choice of independent
variable.
Author's Personal Copy

−1 0 1 22
3
4
5
log(M )
Soil, organic farm
−1 0 1 22
3
4
5
Soil, organic farmE F
0 2 40
2
4
6A BSoil, conventional farm
0 2 40
2
4
6
Soil, intensive farm
C D
−12 −10 −8 −6 −4
02468
log(
N)
Tuesday Lake, 1984
−5 0 50
5
10
Ythan Estuary
Figure 1 Plots of population density (N) versus average body mass (M) for taxa inlocal food webs from (A) the soil of a Dutch conventional farm (site identificationnumber 6), (B) the soil of a Dutch intensive farm (site identification number 29),(C) Tuesday Lake in 1984, (D) the Ythan Estuary, and (E, F) the soils of two Dutchorganic farms (site identification numbers 130 and 131). Approximate log‐scale linearrelationships are visible often (A–D), but not universally (E, F, which have up to twoorders of magnitude more enchytraeids than predicted by a linear fit). Solid lines areleast‐squares best fits; dashed lines have slope �1.
16 DANIEL C. REUMAN ET AL.
Author's Personal Copy
3. Comparison with the Energetic Equivalence Hypothesis with
Trophic Transfer Correction
To test the slope predictions of the EEH with TTC, we used only the 121
webs that passed the composite test. Slopes predicted by the EEH with TTC
differed from slopes calculated from Tuesday Lake and the Ythan Estuary
data (Table 3). (These webs passed the composite test with independent
variable log(M).) Confidence intervals contained theory‐predicted slopes

Figure 2 Distribution of slopes b1 of the best‐fitting lines log(N)¼ b1 log(M)þ a1 for(A) all 166 food webs and (C) all 121 webs that passed the composite test withindependent variable log(M). Distribution of inverse slopes 1/b2 for best‐fitting lineslog(M) ¼ b2 log(N) þ a2 for (B) all 166 webs and (D) all 45 webs that passed thecomposite test with independent variable log(N). Solid bars in (A, C) show Dutch soilwebs and hollow bars show all nonsoil webs. Means (vertical lines) were computed in(A, C) using all webs included in the respective panel, and appear identical due torounding; means for soil webs (solid bars) were �0.51 (A) and �0.52 (B). Standarddeviations including all webs in the respective panel were 0.15 (A), 0.99 (B), 0.14(C), and 1.16 (D).
BODY SIZE-ABUNDANCE ALLOMETRY IN FOOD WEBS 17
Author's Personal Copy
for only b1 of the Ythan Estuary. Apart from this case, these webs violated
the specific slope predictions of the EEH with TTC.
Log(a), the log assimilation efficiency, is always less than 0. Provided mean
log(b) > 0, as is almost always true, the EEH with TTC always predicts
b1¼ log(a)/log(b)�3/4 < �3/4 (Section II.B). In contrast, slopes b1 > �3/4
occurred for the vast majority of the linear webs of this study (Figure 2C).
Many RMA, MA, and OLS‐bisector slopes greater than �3/4 occurred as
well (32, 79, and 26 webs, respectively). These results falsify the slope pre-
dictions of the EEH with TTC for taxonomically resolved webs.
For Tuesday Lake, we assumed a trophic transfer efficiency a ¼ 10% and
found that predictions of the EEH with TTC did not fall within 99% confi-
dence intervals of true slopes. How sensitive were our results to the

Table 3 Comparison of slopes predicted by theory with true slopes for TuesdayLake 1984, Tuesday Lake 1986, and the Ythan Estuary
Slopes Tuesday Lake 1984 Tuesday Lake 1986 Ythan Estuary
EEH �0.75 �0.75 �0.75EEH þ TTC �1.06 �1.07 �1.06b1 �0.84 (�0.98, �0.71) �0.75 (�0.91, �0.59) �1.13 (�1.30, �0.96)RMA �0.91 (�1.01, �0.81) �0.86 (�1.02, �0.69) �1.29 (�1.43, �1.15)OLS‐bisector �0.91 (�1.01, �0.81) �0.86 (�1.03, �0.69) �1.29 (�1.43, �1.15)MA �0.90 (�1.01, �0.80) �0.84 (�1.01, �0.66) �1.33 (�1.50, �1.17)
All slopes have log(M) on the horizontal axis. Parentheses contain 99% confidence intervals.
EEH, energetic equivalence hypothesis; TTC, trophic transfer correction. b1, the slope of
ordinary least squares (OLS) regression; RMA, reduced major axis; MA, major axis.
18 DANIEL C. REUMAN ET AL.
Author's Personal Copy
assumption that a ¼ 10%? For predictions to fall barely within 99% confi-
dence intervals of true slopes, a would have to be 18.6% for Tuesday Lake
1984 and 32.0% for Tuesday Lake 1986. To fall barely within 95% confidence
intervals, a would have to be 24.0% or 42.8%, respectively. For predicted
slopes to equal true slopes, a would have to be 56.4% for Tuesday Lake 1984
and 102.9% (an impossible value) for Tuesday Lake 1986. The values of
a required for the predicted slope to fall barely within confidence intervals
around the observed slope seem high for Tuesday Lake. Our results for
Tuesday Lake suggest that an additional correction term in the slope formula
may be necessary (Section VI.A). For most soil webs of this study, no value
of a less than 1 makes the predictions of the EEH with TTC agree with true
slopes.
That b1 > �3/4 for most webs shows that larger organisms absorbed
more energy from the environment than smaller organisms. Slopes greater
than �3/4 are consistent with the conservation of energy because diversity
typically decreased with increasing M (Section VI). For 127 of the 146 soil
webs of this study, the number of taxa in the lower third of the log(M) range
of the web was greater than the number in the middle third, which was in turn
greater than the number in the upper third.
B. Testing Linearity
1. Ordinary Linear Regression
For each community type (benthic, pelagic, inquiline, riparian, soil, estua-
rine), Table 2 shows how many sites passed each of the five‐component tests
for each choice of independent variable log(M) or log(N) and how many sites
passed five tests or at least four tests.

BODY SIZE-ABUNDANCE ALLOMETRY IN FOOD WEBS 19
Author's Personal Copy
Using either standard linear model, more webs failed at least one compo-
nent (respectively, two ormore components) of the composite test than would
be expected by chance alone if the linear model held (Table S4 of Appendix
IV).However, a largemajority of webs passed the composite test using log(M)
as the independent variable, and a substantial minority passed using log(N).
Most webs passed the quadratic coefficient F‐test for independent variablelog(M), and a smaller majority passed for independent variable log(N).
About one‐third as many webs passed the composite test using log(N) as
independent variable as passed it using log(M) (Table 2). Among the webs for
which the composite test passed with one, but not both, independent vari-
ables, the assumptions of the model with independent variable log(M) were
7.3 times more likely to be satisfied (Table S5 of Appendix IV). Whether the
composite test passed with independent variable log(M) was independent of
whether it passed with independent variable log(N) (Appendix IV).
Results largely (but not completely) confirm the hypothesis that linear
relationships between log(N) and log(M) describe web data. The results
also confirm the hypothesis of Cohen and Carpenter (2005) that the assump-
tions of the statistical model of Eq. 1 are better met by (M,N) data from webs
generally than the assumptions of the model of Eq. 2.
2. Symmetric Linear Regression
Only 46 of 166 webs had log(M) and log(N) distributions that passed both the
Jarque–Bera and Lilliefors tests at the 1% level (Appendix III, Tables S2 and
S3). Assumptions of model II regression methods were usually violated; webs
were not well described by bivariate normal distributions. For this and other
reasons (Section VI), we do not rely primarily on symmetric regression results.
Our main conclusions do not depend on the choice of regression model.
C. Reasons for Nonlinearity and Alternative Models
1. Lumping of Taxa
We tested the hypothesis that lumping taxa unevenly across the range of
log(M) may have caused some violations of the assumptions of linear models.
Bacteria were highly lumped relative to other soil taxa. When the composite
test was applied to the Dutch soil webs with bacteria included, using inde-
pendent variable log(M), none of the 146 soil webs passed more than three
of the five component tests. Using log(N), none of the webs passed more
than four of the five tests, and only 30 passed four tests exactly. Inclusion
of bacteria disrupted linearity because they were much more abundant

20 DANIEL C. REUMAN ET AL.
Author's Personal Copy
than would be expected from linear regressions through soil fauna. Their
apparently excessive abundance was likely partly because they should be
considered as multiple taxa (Appendix V).
The riparian webs provide further evidence that uneven lumping may
cause violations of linear models. The riparian webs were the most unevenly
lumped webs of this study, and were also the least likely to pass the composite
test with either choice of independent variable.
When nematode taxa in the 146 soil webs were lumped post hoc (Section
III.C.1), the percent of sites passing the composite test with independent
variable log(M) decreased with increased lumping. However, more sites
passed the composite test with independent variable log(M) than passed
with independent variable log(N) for any degree of lumping, supporting the
conclusion that the model with independent variable log(M) is more likely to
describe web data than the model with independent variable log(N), even
when lumping occurs.
In contrast, lumping taxa evenly across the full range of log(M) increased
the likelihood that a soil web would pass the composite test with independent
variable log(M). Taxa in soil webs (excluding bacteria) were lumped to
trophic guilds. Of 146 unlumped webs, 110 passed the composite test while
145 lumped webs passed. The mean number of taxa in unlumped webs was
54.5, whereas the mean number of guilds in lumped webs was 16.2,
so decreased statistical power of the composite test for few data played a
role in the increased pass rate.
Violations of the assumptions of linear models are less noticeable for
smaller or more highly lumped webs. Violations of assumptions that arise
from uneven lumping can be strong enough to counterbalance this effect,
causing a net decrease in the probability that such a web will pass the
composite test. The results of this section support the hypothesis that uneven
lumping can cause nonlinearity in web log(N)–log(M) data.
2. Are Some Ecosystem Types Not Linear?
We tested the null hypothesis that the linear model Eq. 1 describes data
equally well for all ecosystem types. Webs of nine ecosystem types (organic
farm, conventional farm, intensive farm, super‐intensive farm, pasture, win-
ter farm, forest, riparian, and inquiline) were sorted into the categories
‘‘passing’’ (Mþ) and ‘‘failing’’ (M�) with respect to the composite test.
The frequency distributions in these categories differed by ecosystem type
(Table 4; �2 test, p < 10�7): organic farms were substantially less likely to
pass the composite test with independent variable log(M) than sites of other
types. The increased failure rate of organic farms suggests that linear models
relating log(M) and log(N) may be less suitable for some ecosystem types

Table 4 Pass (Mþ) and fail (M�) rates of the composite test with independentvariable log(M) by community type
Mþ M� Sum
Organic 5a 16b 21Conventional 17 2 19Intensive 18 3 21Super‐intensive 16 3 19Pasture 8 1 9Winter farm 33 5 38Forest 13 6 19Riparian 1 7 8Inquiline 7 1 8Sum 118 44 162
The first seven rows are subcategories of the Dutch soil webs (see text). A superscript a
(respectively, b) indicates that the cell was significantly less (respectively, more) than expected
from the null hypothesis of independent factors. Such cells had a Freeman–Tukey deviate that
was less than �2.58 (superscript a) or exceeded 2.58 (superscript b), corresponding to the values
at which the standard normal cumulative distribution function was less than 0.5% and exceeded
99.5%, respectively.
BODY SIZE-ABUNDANCE ALLOMETRY IN FOOD WEBS 21
Author's Personal Copy
than others (see also Figure 1E and F). In organic farms, the high availability
of nutrients from manure and other organic fertilizers enhances the popula-
tion sizes of large primary decomposers such as enchytraeids, breaking the
linear trend (Mulder et al., 2006). The results of this section reject the
hypothesis that the attributes of the association between log(N) and log(M)
in webs are independent of ecosystem type.
3. Is The Range of Log(M) Related to Linearity?
For data on species of a single broad taxon considered elsewhere, one factor
influencing whether log(N)‐versus‐log(M) relationships are linear is the range
of the log(M) values measured. Regionally or globally gathered data sets,
which typically exhibit a wider range of log(M) values, appear more likely to
be linear (Blackburn and Gaston, 1997; Lawton, 1989). To see if the range of
log(M) values and ecosystem type influenced whether a log(N)–log(M) scat-
ter plot of soil web data was well‐described by a linear model, a logistic
regression model was fitted. Each observation was one scatter plot. The
binary response variable indicated whether the scatter plot passed the com-
posite test of linearity with independent variable log(M). The range of log(M)
was a statistically significant predictor (likelihood ratio test, p ¼ 0.001).
Ecosystem type was an important predictor both alone (likelihood ratio
test, p < 0.001) and in the presence of log(M) range (likelihood ratio test,

22 DANIEL C. REUMAN ET AL.
Author's Personal Copy
p < 0.001). Models of whether a soil scatter plot passed or failed the
quadratic coefficient F‐test (with independent variable log(M)) showed similar
results. The results of this section are compatible with the hypothesis that webs
with a larger range of log(M) values are more likely to appear approximately
linear on log(N)‐versus‐log(M) axes.
4. Testing for Polygonal Relationships
Polygonal relationships did not describe the web data of this study.
A polygonal relationship entails heteroskedasticity. The webs of this study
seldom failed the absolute residuals F‐test of heteroskedasticity with indepen-
dent variable log(M) (Table 2). Our positive control (Section III.C) showed
that the test could detect polygonal relationships in simulated polygonal data.
Of 1000 simulated polygonal communities, the test rejected the hypothesis of
homoskedasticity with 99% confidence 211 times (¼ 21.1%), while only 5
of 146 soil webs (¼ 3.4%) failed the test. Of 1000 simulated polygonal
communities, 994 failed the Lilliefors test, whereas only 3 of 146 real webs
failed that test. The polygonal constraint space described our scatter plots less
accurately than the model of Eq. 1.
VI. DISCUSSION
We restate our main findings and set them in the context of prior results.
Results are broadly of two types: results about linearity of log(N)–log(M)
relationships, testing the assumptions of linear models, and the meaning of
these tests concerning allometric relationships in food webs; and results about
whether the predictions of two theories hold for taxonomically resolved webs.
In the taxa in a local web, the relationship between log(N) and log(M) can
often but not universally be described as linear. The usefulness of a linear
description varies by ecosystem type, by the range of log(M) values
measured, and by the degree of uneven lumping of species. The model of
Eq. 1 describes web data most effectively when all taxa are as well resolved
and as evenly resolved as possible. The assumptions of the linear model of
Eq. 1 are much more likely to be supported by web data than those of the
model of Eq. 2, confirming a hypothesis of Cohen and Carpenter (2005).
Assumptions of symmetric regression methods are unlikely to be met.
Previous studies found allometric relationships within a single or a few
local webs (Cohen et al., 2003; Cyr et al., 1997b; Jonsson et al., 2005;
Marquet et al., 1990; Mulder et al., 2005a; Woodward et al., 2005a). Macro-
ecological studies, empirical (Damuth, 1981; Greenwood et al., 1996; Nee
et al., 1991; Peters, 1983) and theoretical (Blackburn and Gaston, 2001),

BODY SIZE-ABUNDANCE ALLOMETRY IN FOOD WEBS 23
Author's Personal Copy
showed that allometric relationships between N and M hold for populations
of species within a single broad taxon or trophic level (Leaper and Raffaelli,
1999, p. 192). Ours may be the first study to demonstrate allometric relation-
ships in a large collection of local webs, except for Cyr et al. (1997b); they
used exclusively lake webs.
Slopes b1 vary widely by web. Most slopes differed substantially from
those observed in lake systems by Cyr et al. (1997b) and from those predicted
by the EEH and the EEH with a TTC. Whereas these hypotheses predict
slopes � �3/4, so that populations of larger taxa consumed no more energy
than populations of smaller taxa, data of this study most commonly showed
slopes greater than �3/4, so that populations of larger taxa consumed more
energy than populations of smaller taxa.
A. Slopes and Predictions of Theory
1. The Energetic Equivalence Hypothesis
The EEH assumes that the total energy used by the population of each species,
per unit habitat, does not depend systematically on average bodymasses (M) of
individuals within species (Damuth, 1981). By contrast, multiple factors influ-
ence systematically how the energy absorbed by the population of a species in a
web varies with speciesM. For example, populations of larger, higher‐trophic‐level species may have access to less energy than populations of smaller, lower‐trophic‐level species, because individuals of higher‐trophic‐level species eat
individuals of lower‐trophic‐level species, which do not convert all their
absorbed energy into production. On the other hand, populations of higher‐trophic‐level species may absorb as much energy as populations of lower‐trophic‐level species or more by a variety of mechanisms. Larger predators are
often more mobile and can feed in multiple local webs (McCann et al., 2005)
or couple multiple energy pathways (Rooney et al., 2006). External energy
subsidiesmay occur at intermediate and higher trophic levels (Pace et al., 2004).
Even in webs that are energetically isolated above trophic level 0, other
mechanisms could contribute to absorption of differing amounts of energy
by populations of species at different trophic levels. Populations of species at
trophic level n may divide the energy pool available to them into fewer (or
more) parts than populations of species at trophic level n�1 if there are fewer
(or more) species at trophic level n than at trophic level n�1 (Elton, 1927).
Trophic transfer efficiencies may depend on trophic level and hence on M.
If trophic transfer efficiencies increase with M, the increase could contribute
to the tendency for populations of larger, higher‐trophic‐level species to
absorb more energy than populations of smaller, lower‐trophic‐level species;and vice versa if trophic transfer efficiencies decrease with M.

24 DANIEL C. REUMAN ET AL.
Author's Personal Copy
The EEH is not valid generally for webs and the results of this study do not
agree with the predictions of energetic equivalence.
2. The Energetic Equivalence Hypothesis with Trophic
Transfer Correction
The EEH with TTC (Brown and Gillooly, 2003; Brown et al., 2004) had little
success predicting correct b1 slopes for most webs of this study, which were
highly resolved webs. The theory had some predictive success in communities
aggregated by trophic levels (Meehan, 2006; Meehan et al., 2006) or by body
mass categories (Jennings and Mackinson, 2003), where changes in diversity
with M are masked by aggregation. Many webs, including the soil webs of
this study (Mulder, 2006;Mulder et al., 2005a), cannot sensibly be aggregated
to trophic levels because of a high degree of omnivory or a lack of detailed
knowledge of trophic relationships.
To explain slopes of highly resolved webs, using the theory of Brown and
Gillooly (2003) and Brown et al. (2004) as a starting point, future theory
should incorporate changes in diversity and trophic generality (the number
of resource species per consumer species) withM, so that webs with different
patterns of changing diversity or trophic generality with M are predicted to
have different slopes.
To improve future data on M–N relationships in webs, the strength and
nature of external interactions should be assessed and the contribution of
external interactions to log(N)‐versus‐log(M) slope should be estimated. Web
ecologists have often studied webs that are relatively isolated, such as lake
and island webs, to justify neglect of fluxes into and out of the web. But even
apparently isolated webs sometimes interact strongly with other systems
(Knight et al., 2005; Pace et al., 2004). As pointed out in Section V.C.2,
external subsidies may have caused departures from linearity in the organic
farm soil webs of this study.
B. Examples of Ecological Errors from Unsupported Models
1. Use a Model with Supported Assumptions
Ecologically incorrect conclusions can follow from a statistical model with
assumptions not supported by data; we provide examples here using the data
of this study. Since the total biomass density of a species with average body
mass M and population density N is M � N, lines of equal biomass on
log–log plots of the relationship between N and M have slope �1. Most b1

BODY SIZE-ABUNDANCE ALLOMETRY IN FOOD WEBS 25
Author's Personal Copy
values were greater than �1, suggesting that log biomass typically increased
with increasing log(M). However, most b2 values were also greater than �1,
suggesting that log biomass typically increased with increasing log(N): the
mean of all b2 values was �0.7499, the standard deviation was 0.3039, and
only 21 of the slopes b2 were less than�1. These results appear contradictory:
since log(M) and log(N) were negatively related, it does not appear sensible
that biomass can increase both with increasing log(M) and with increasing
log(N). Which conclusion is unfounded? For each web, 99% confidence
intervals of the b1 and b2 values were computed. These confidence intervals
were statistically defensible only for the webs that passed the composite test
with independent variable log(M) for b1, and independent variable log(N) for
b2. Of the 121 webs that passed the composite test with independent variable
log(M), 111 (¼ 91.7%) had b1 99% confidence intervals that lay entirely
above �1, and none had b1 confidence intervals that lay entirely below �1.
Of 45 webs that passed the composite test with independent variable log(N),
only 24 (¼ 53.3%) b2 confidence intervals lay entirely above �1, and 6
(¼ 13.3%) lay entirely below. Of 33 webs that passed the composite test with
both log(M) and log(N), 27 had b1 confidence intervals entirely above �1 and
none had confidence intervals entirely below�1; 14 had b2 confidence intervals
entirely above �1 and 5 had b2 intervals entirely below �1. Therefore, the
conclusion that log biomass increased with log(M) was more strongly sup-
ported than the conclusion that log biomass increased with log(N), which was
based on a model with unsupported assumptions. Only testing the assump-
tions of linear models led to this understanding; reliance on only the model
with independent variable log(N), without testing its assumptions, would have
caused inaccurate conclusions.
Although the mean b2 value for the webs of this study was �0.7499,
notably close to �3/4, we attach no significance to this fact. The slopes b2are for the regression with independent variable log(N). Slopes of�0.75 have
occurred empirically and theoretically for regressions with independent
variable log(M).
2. Do Not Invert Ordinary‐Least‐Squares Slopes
The slopes b1 were very different from the inverse slopes 1/b2 (Figure 2B and
D) and the frequency distribution of b1 was very different from the distribu-
tion of 1/b2 (Wilcoxon rank–sum test, p < 10�10). For example, only the
Ythan Estuary had b1 less than �1. In contrast, only 21 (21/166 ¼ 12.6%) of
the inverses 1/b2 were greater than �1. It is well known (e.g., Snedecor and
Cochran, 1967, pp. 172, 175) that b1 � b2¼ r2 � 1, where r is the correlation
coefficient between log(M) and log(N). When b1< 0 and b2< 0, as in all of our

26 DANIEL C. REUMAN ET AL.
Author's Personal Copy
examples, then 0 > b1¼ r2/b2 � 1/b2 with strict inequality unless r2¼ 1 (which
never occurs in noisy data). Consequently, the slope b1 is systematically larger
than 1/b2. The minimum over all of our webs of b1�1/b2 was 0.0465, the mean
of b1�1/b2 was 1.0861 and the maximum was 9.5055. Algebraically solving
log(M) ¼ b2 log(N) þ a2 for log(N) would produce systematically biased
estimates of the slope of the dependence of log(N) on log(M), and can lead
to incorrect general statements about local ecological communities.
3. Connections with Population Production and Consumption
The ecologically important quantities population production (P) and popu-
lation consumption (C) can be approximated using allometric formulas
P / NM � and C / NM� (Peters, 1983). These formulas were used in models
to predict biomass or energy flux from resource species to consumer species
in a web (Reuman and Cohen, 2005). To substitute a relationship betweenM
and N into these formulas so that the result after substitution depends on
one variable only, one must express M as a function of N, or vice versa.
Only statistically defensible relationships between M and N should be
used. For webs, allometric expressions of N as a function of M are more
likely to be statistically defensible than allometric formulas of M as a func-
tion of N.
C. Discussion of Methods
1. Other Factors in the Choice of Model
Causality and relative error in variables should both affect the choice of
model. We argue that for most available web data, neither factor provides a
generally convincing argument for a particular model. Testing of model
assumptions will often be a valid reason to choose the standard linear
model with log(M) as the independent variable for webs. Improved web
data will allow empirical assessments of causation and the error in variables,
which can then guide selection of the most appropriate statistical model.
Feigelson and Babu (1992) state, ‘‘If it is known independently of the data
set under consideration that one variable physically depends on the other, . . .then there is a preference to use OLS(Y|X) with Y as the dependent variable.’’
For studies of log(M) and log(N) in webs, there is no clear reason to believe
causality in either direction, but also no clear reason to believe there is no
causal relation between log(N) and log(M). The relationship is likely

BODY SIZE-ABUNDANCE ALLOMETRY IN FOOD WEBS 27
Author's Personal Copy
complex. Animal ecologists often assume that M causes N, since M is not a
very plastic character for many animal species. However, plant ecologists
often use N as the independent variable in regressions; crowding can clearly
affect individual growth and size in plant communities (Lonsdale, 1990).
Crowding and food limitation also likely affect body size for animals of
indeterminate growth, which occur in many webs of this study. In webs
that contain plants and animals, causation does not indicate what linear
model to use.
Taper and Marquet (1996) considered several possible causal pathways
linking log(M), log(N), and log species average metabolism in communities.
By comparing data of Sugihara (1989, his Figure 2) to their theoretical
predictions, Taper andMarquet supported the hypothesis that log(M) causes
log(N) in communities of birds. Birds are animals of determinate growth; the
conclusion of Taper and Marquet may or may not apply to webs. A good
topic for future research would be to apply the methods of Taper and
Marquet (1996) and Shipley (2000) to independently measured species M,
N and average metabolism data in webs, and to investigate possible causal
pathways among these variables for webs. It may also be useful to develop
new statistical models that reflect causality from log(M) to log(N) for deter-
minate growers, and causality from log(N) to log(M) for indeterminate
growers within the same web.
The independent variable in an ordinary linear regression should be
measured without error. At a minimum, it should be measured more accu-
rately than the dependent variable. Empirical estimates of the error in the
log(M) and log(N) measurements of this study were not available, and are
rarely available for webs. Error inM is expected to be less than error inN for
mobile species, whereas N may be measured more accurately than M for
stationary taxa, and especially for plants with complex root systems. Cohen
and Carpenter (2005) discussed the relative uncertainties in estimates of M
and N in Tuesday Lake. Taper and Marquet (1996) concluded that for bird
communities, error inM is very small, but their data included no plants, and
they did not estimate error in N, which may also have been small. Since both
mobile and rooted species are often included in food webs, error in measured
variables provides no a priori argument for any model of web data. Relative
errors should be considered in future when choosing a model if the researcher
has this information.
Two additional reasons we used the OLS model with independent variable
log(M) here are, first, for comparability between our slopes and slopes of
other studies (Cyr et al., 1997b) that used OLS regression with independent
variable log(M); and second, to make our slopes appropriate for comparison
to predictions of theories (EEH and EEH with TTC) that explained N as
caused by M.

28 DANIEL C. REUMAN ET AL.
Author's Personal Copy
2. Lumping
Leaper and Raffaelli (1999) showed that taxonomic resolution can affect
log(N)‐versus‐log(M) slope in webs; they advocated using webs with evenly
resolved taxa. Uneven taxonomic resolution probably did not cause the
variability in slopes shown in Figure 2A and C because the variability
occurred among the soil webs alone, and these were all lumped according
to the same methods.
D. Recommendations and Future Directions
1. Recommendations
We offer some recommendations to researchers who study or use allometric
relationships between M and N in webs. First, to avoid unjustified infer-
ences, the assumptions of ordinary linear regression models should be
tested before using the models. Log(M) should be used as the default
independent variable for linear models. Contrary to the practice of Cohen
et al. (2003), Jonsson et al. (2005), Mulder et al. (2005a), and Woodward
et al. (2005a), log(M) should be put on the horizontal axis of scatter plots of
log(N) versus log(M) for webs unless evidence is available on causality or
relative error in variables; or the webs meet assumptions of the model with
independent variable log(N) but do not meet the assumptions of the model
with independent variable log(M); or comparison is made with a theory
that posits N as causal.
Statistical models other than ordinary linear regression models may
sometimes be necessary, for example, linear models with non‐normal resid-
ual distributions (if the Jarque–Bera or Lilliefors tests are violated); linear
models with residual distributions of nonconstant variance (if the absolute
residual F‐test is violated); or nonlinear models (if the quadratic coefficient
F‐test or the Durbin–Watson test are violated). Several authors comment
on the consequences of using models with violated assumptions, and possi-
ble alternative linear models, including Underwood (1997) andMartin et al.
(2005).
For future empirical work on M–N allometry in webs, taxa should be
resolved as evenly (and as finely) as possible. Estimates of the density of the
population of each taxon should be based on enough observations to prevent
the artifactual horizontal lines seen in Appendix VI. Estimates of the errors
from sampling or measurement inM and N should be reported. Information
about energy fluxes across the boundaries of the web should be obtained.

BODY SIZE-ABUNDANCE ALLOMETRY IN FOOD WEBS 29
Author's Personal Copy
2. Future Directions
Our results raised several questions for future research. First, what mechan-
isms cause the common linear relationships between log(N) and log(M) in
webs? The mechanisms underlying the EEH cannot be a complete explana-
tion. If total species population energy consumption C depends on M in a
web according to
log Cð Þ ¼ s log Mð Þ þ k ð11Þthen metabolic theory would suggest the linear relationship
log Nð Þ ¼ s� 3
4
� �log Mð Þ þ a1 ð12Þ
(Savage et al., 2004). The EEH with TTC claims that
s ¼ log að Þ=log bð Þ ð13ÞBut why should log(C) depend linearly on log(M)? Second, what mechanisms
cause departures from linearity on plots of log(N) versus log(M) for
webs? Third, what are the ecological causes of variation in the slope of the
log(N)–log(M) relationship when linearity holds?
Departures from linearity and variations in slope might be explained by
departures from linearity and variations in slope for log(C)‐versus‐log(M)
plots, but such an explanation, if valid, would in turn require explanation.
As pointed out by Jonsson et al. (2005) and above here, log(C) varies withM
even in a web that is energetically isolated above trophic level 0 first because
trophic transfer efficiencies are less than 100% (so the total energy pool
available to higher trophic levels is less than that available to lower trophic
levels) and second if the energy available at each level ofM is divided among
a varying number of taxon populations. The net effects of at least these two
competing factors should be systematically explored in future work.
ACKNOWLEDGMENTS
J.E.C. and D.C.R. thank Priscilla K. Rogerson for assistance. J.E.C.
thanks William T. Golden and family for hospitality during this work,
which was supported by NSF grants DEB‐9981552 and DMS‐0443803.D.C.R. thanks Ben Shoval for hospitality during this work. Ch.M. thanks
the RIVM Directorate (QERAS S860703), The Netherlands Research
School of Sedimentary Geology, and the EC Environment Programme
for continuous support. The authors thank Pablo A.Marquet, Hal Caswell,
Andrew Beckerman, and anonymous reviewers for helpful constructive
criticism.

30 DANIEL C. REUMAN ET AL.
Author's Personal Copy
APPENDIX I. HOW AND WHY LINEARITY TESTSDIFFER FROM THOSE OF COHEN AND CARPENTER
A. Testing the Assumption of Linearity of ConditionalExpectation
To test the assumption of linearity of conditional expectation E(y|x), Cohen
and Carpenter (2005) used a test based on the confidence intervals of the
quadratic term in the best‐fit of the regression model
y ¼ cx2 þ bxþ aþ e ð14ÞHere and throughout, it is assumed that e is normally distributed with mean 0
and with variance independent of the independent variable (x in this equation),
and that different realizations of e are identically and independently distributed.The test of Cohen and Carpenter (2005) was equivalent to the quadratic
coefficient F‐test (Section III.B). They also used a test based on the corrected
Akaike InformationCriterion (AICc).We prove here that their AICc‐based testcan be equivalent to the quadratic coefficient F‐test if critical values are chosento make the two tests have critical regions of equal probability.
The AICc‐based test of Cohen and Carpenter (2005) computes the quantity
AICc linearð Þ ¼ n logXni¼1
l2i =n
!þ 6n
n� 4ð15Þ
where the li are the residuals from the least‐squares best fit to data of the linear
model
y ¼ bxþ aþ e ð16Þand n is the number of data points. The quantity
AICc quadraticð Þ ¼ n logXni¼1
q2i =n
!þ 8n
n� 5ð17Þ
is also computed, where the qi are the residuals from the least‐squares best fit ofEq. 14. If the difference
D ¼ AICc linearð Þ �AICc quadraticð Þ ð18Þis much larger than zero, then linearity of conditional expectation is considered
not to hold. The AICc and this AICc‐based test do not provide information on
statistical significance; the magnitude of � provides guidance on whether to
reject linearity. We now prove that choosing the right threshold value of� for
the test makes it equivalent to the quadratic coefficient F‐test, so that the AICc‐based test is a legitimate test of a hypothesis and provides information on

BODY SIZE-ABUNDANCE ALLOMETRY IN FOOD WEBS 31
Author's Personal Copy
statistical significance. In so doing, we also show that the AICc‐based test is
redundant, which is why we have not used it in this study.
Simplifying the above expression gives
D ¼ n log
Pl2iPq2i
� �þ 6n
n� 4� 8n
n� 5
� �ð19Þ
The F‐statistic from the quadratic coefficient F‐test is
F ¼P
l2iPq2i
� �n� 3ð Þ � nþ 3 ð20Þ
so F and � are related by the formula
a1 logF � b1a2
� �þ b2 ¼ D ð21Þ
where a1, a2, b1, and b2 depend only on n, and the ai are greater than 0. So
� is a monotonically increasing function of F.
Given a threshold value �T for the AICc‐based test, there is a critical
value Fc such that � > �T if and only if F > Fc. So rejection of the null
hypothesis of linearity of conditional expectation based on the AICc‐basedtest with threshold �T is the same as the rejection of the same hypothesis
based on the quadratic coefficient F‐test with critical value Fc.
B. Testing the Assumption of Homoskedasticity of Residuals
Cohen and Carpenter (2005) tested the homoskedasticity of the residuals r
from the best‐fitting line as follows. They fitted the linear model
r ¼ byþ aþ e ð22Þand the quadratic model
r ¼ ey2 þ dyþ cþ e ð23Þwith data, and computed the 99% confidence intervals of b, e, and d. Here y
denotes the expected values of the dependent variable predicted by the best‐fitting linear model Eq. 16. If all of these confidence intervals contained
0 then the residuals were called homoskedastic, and if one or more of the
confidence intervals failed to contain 0, homoskedasticity of the residuals
was rejected. This test is equivalent to the quadratic coefficient F‐test(Section III.B). We explain the details of this equivalence.
First define the function F(r; 1; y) to take the value ‘‘pass’’ if an F‐testdoes not reject the null hypothesis that the linear coefficient in the model
Eq. 22 is zero, with 99% significance, and ‘‘fail’’ otherwise. The notation
indicates the dependent variable, r, of a model before the first semicolon; it

32 DANIEL C. REUMAN ET AL.
Author's Personal Copy
indicates the allowed independent variables in a constrained model after the
first semicolon; and it indicates an additional independent variable after the
second semicolon. An F‐test is performed to see if the model with the
additional variable included explains a significant amount of variation in
the dependent variable beyond what is explained by the constrained model.
Let F(r; 1, y; y2) be ‘‘pass’’ if an F‐test does not reject the null hypothesis thatthe quadratic term in the model Eq. 23 is zero (and ‘‘fail’’ otherwise), and let
F(r; 1, y2; y) similarly test whether the linear term in the same model is zero.
Then these three tests are equivalent to the questions of whether b, e, and d,
respectively, have 99% confidence intervals containing 0.
But F(r; 1; y), F(r; 1, y; y2), and F(r; 1, y2; y) are the same as F(r; 1; x),
F(r; 1, x; x2) and F(r; 1, x2; x), respectively, since y is a linear function of x.
The test F(r; 1; x) will always equal ‘‘pass.’’ If RSSc, RSSl, and RSSq are the
sums of squared residuals from the best‐fitting constant, linear, and quadrat-
ic models of r versus x, and if RSSq�l is the sum of squared residuals from the
best‐fitting model of the form r ¼ cx2þ a þ e, then the statistics
Fe ¼ RSSl �RSSq
RSSq= n� 3ð Þ ð24Þ
and
Fd ¼ RSSq�l �RSSq
RSSq= n� 3ð Þ ð25Þ
can be compared to the F‐distribution F(1, n�3) to find the values of F(r; 1,
x; x2) and F(r; 1, x2; x), respectively. But RSSl¼ RSSc, so RSSq�l � RSSl,
so Fd � Fe. This means that F(r; 1, x; x2) ¼ ‘‘fail’’ whenever F(r; 1, x2; x) ¼‘‘fail,’’ and F(r; 1, x2; x) ¼ ‘‘pass’’ whenever F(r; 1, x; x2) ¼ ‘‘pass.’’ So the
test of Cohen and Carpenter (2005) amounts to F(r; 1, x; x2), which is
the quadratic coefficient F‐test.
C. Testing the Assumption of Normality of Residuals
We did not use quantile–quantile plots, as Cohen and Carpenter (2005) did,
to examine visually the assumption of normally distributed residuals because
we had too many webs to present these plots for all of them.
D. Testing the Assumption of Homoskedasticity of AbsoluteResiduals
The absolute residuals F‐test (Section III.B) was not equivalent to the meth-
od Cohen and Carpenter (2005) used. They tested homoskedasticity of the
absolute values of the residuals r from the best‐fitting line as follows. They

BODY SIZE-ABUNDANCE ALLOMETRY IN FOOD WEBS 33
Author's Personal Copy
fitted the linear model
jrj ¼ byþ aþ e ð26Þand the quadratic model
jrj ¼ ey2 þ dyþ cþ e ð27Þwith data, and computed the 99% confidence intervals of b, e, and d. If all of
these confidence intervals contained 0, then the absolute residuals were called
homoskedastic, and if one or more of the confidence intervals failed to
contain 0, homoskedasticity of the absolute residuals was rejected.
To compare the test of Cohen and Carpenter to the absolute residuals
F‐test, the following simulation was run 10,000 times. One hundred indepen-
dent, uniformly distributed numbers between 0 and 1 were generated,
making values of the independent variable x. The model y ¼ 3x þ 1 þ 0.5ewas used to generate 100 corresponding y values, where e was standard
normal (mean 0, variance 1). A best‐fitting line and the absolute residuals
|r| of the simulated data from the line were generated. Homoskedasticity of
these absolute residuals was tested using the absolute residuals F‐test, and by
examining the confidence intervals of b, e, and d in Eqs. 26 and 27, and a
‘‘pass’’ or ‘‘fail’’ result was generated using each test.
Of 10,000 simulations, the absolute residuals F‐test rejected homoske-
dasticity of absolute residuals 90 times, and the test based on confidence
intervals rejected homoskedasticity 203 times. Cohen and Carpenter’s test
was more stringent, making more Type I errors (203 compared to 90). The
expected number of Type I errors in 10,000 tests when operating at 99%
confidence is 100. The number of rejections 90 is not significantly different
from 100 at the 95% level, but the number of rejections 203 is significantly
different from 100 with p< 10�10 (comparing to a binomial distribution with
parameters N ¼ 10,000 and P ¼ 0.01). On this basis, the absolute residuals
F‐test is a better test.
APPENDIX II. TESTING THE COMPOSITE TESTOF LINEARITY
To evaluate the composite tool (Section III.B) for testing the assumptions of
the linear regression model, we extracted summary information from the
data so that our evaluation would pertain to our use of the tool. For each
collection of webs separately (Tuesday Lake webs, Dutch soil webs with
bacteria excluded, Lake Neuchatel webs, the Broadstone Stream web,
Sumatra Savannah webs, and the Ythan Estuary web), for the OLS regres-
sions with log(M) as the independent variable, we computed the median
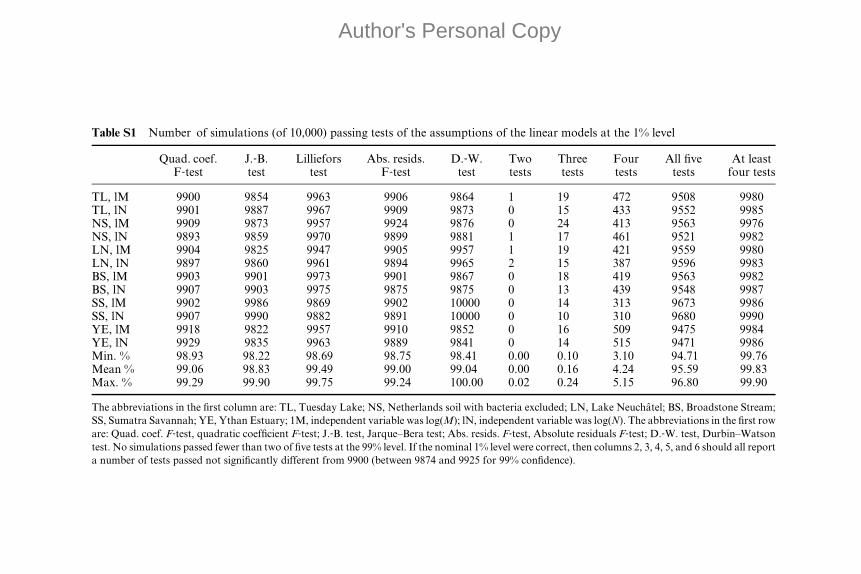
Table S1 Number of simulations (of 10,000) passing tests of the assumptions of the linear models at the 1% level
Quad. coef.F‐test
J.‐B.test
Lillieforstest
Abs. resids.F‐test
D.‐W.test
Twotests
Threetests
Fourtests
All fivetests
At leastfour tests
TL, lM 9900 9854 9963 9906 9864 1 19 472 9508 9980TL, lN 9901 9887 9967 9909 9873 0 15 433 9552 9985NS, lM 9909 9873 9957 9924 9876 0 24 413 9563 9976NS, lN 9893 9859 9970 9899 9881 1 17 461 9521 9982LN, lM 9904 9825 9947 9905 9957 1 19 421 9559 9980LN, lN 9897 9860 9961 9894 9965 2 15 387 9596 9983BS, lM 9903 9901 9973 9901 9867 0 18 419 9563 9982BS, lN 9907 9903 9975 9875 9875 0 13 439 9548 9987SS, lM 9902 9986 9869 9902 10000 0 14 313 9673 9986SS, lN 9907 9990 9882 9891 10000 0 10 310 9680 9990YE, lM 9918 9822 9957 9910 9852 0 16 509 9475 9984YE, lN 9929 9835 9963 9889 9841 0 14 515 9471 9986Min. % 98.93 98.22 98.69 98.75 98.41 0.00 0.10 3.10 94.71 99.76Mean % 99.06 98.83 99.49 99.00 99.04 0.00 0.16 4.24 95.59 99.83Max. % 99.29 99.90 99.75 99.24 100.00 0.02 0.24 5.15 96.80 99.90
The abbreviations in the first column are: TL, Tuesday Lake; NS, Netherlands soil with bacteria excluded; LN, Lake Neuchatel; BS, Broadstone Stream;
SS, Sumatra Savannah; YE, Ythan Estuary; 1M, independent variable was log(M); lN, independent variable was log(N). The abbreviations in the first row
are: Quad. coef. F‐test, quadratic coefficient F‐test; J.‐B. test, Jarque–Bera test; Abs. resids. F‐test, Absolute residuals F‐test; D.‐W. test, Durbin–Watson
test. No simulations passed fewer than two of five tests at the 99% level. If the nominal 1% level were correct, then columns 2, 3, 4, 5, and 6 should all report
a number of tests passed not significantly different from 9900 (between 9874 and 9925 for 99% confidence).
Author's Personal Copy

BODY SIZE-ABUNDANCE ALLOMETRY IN FOOD WEBS 35
Author's Personal Copy
slope, SM; median intercept, IM; median of standard deviations of residuals,
sM; and median (rounded to the nearest integer) number of taxa, TM.
Likewise, the median values SN, IN, sN, and TN¼ TM were computed for
each collection using the OLS regressions with independent variable log(N).
The set PM of all observed log(M) values was computed for each collection,
as was the set PN of all observed log(N) values in each collection. Repeats
were eliminated from the sets PM and PN.
Then, for each collection, TM x‐values were randomly chosen from PM
with replacement. Pairs of (x, y) data were generated using the model
y ¼ SMxþ IM þ e ð28Þwhere the values e were independently chosen from a normal distribution of
mean zero and standard deviation sM. The five tests (Section III.B) of the
assumptions of the standard linear model Eq. 16 were applied to these
simulated data. Pass versus fail indicators for a 1% nominal significance
level were recorded. This experiment was repeated 10,000 times for each
collection. The number of runs that passed each test at the 1% level was
recorded in Table S1, as well as the number that passed none of the five tests,
exactly one of the tests, exactly two of the tests, etc. The experiment was
repeated 10,000 more times for each collection using the values SN, IN, sN,and TN.
For each collection and each choice of independent variable, the
proportion of 10,000 runs passing all five tests was between 94.71% and
96.80%, with a mean value of 95.59%. The proportion of 10,000 runs
passing at least four tests was always between 99.76% and 99.90%, with a
mean of 99.83%.
APPENDIX III. SYMMETRIC LINEAR REGRESSION
Table S2 Number of webs (of 166) passing tests of normality of the distributions oflog(M) and log(N)
Data Test Number webs passing Percent webs passing %
Log(M) Jarque–Bera 58 35Log(M) Lilliefors 100 60Log(M) Both tests 50 30Log(N) Jarque–Bera 154 93Log(N) Lilliefors 113 68Log(N) Both tests 112 67Both marginals Both tests 46 28

Table S3 The mean and maximum differences among the three symmetric linearregression slopes
Mean Max
|RMA–OLS‐bisector| 0.02 0.22|MA–OLS‐bisector| 0.12 0.72|RMA–MA| 0.10 0.60
RMA and OLS‐bisector took similar values, but MA values differed substantially.
Figure S1 Histograms of OLS‐bisector, MA, and RMA slopes of the webs of thisstudy. (OLS, ordinary least squares; MA, major axis; RMA, reduced major axis.)Standard deviations were 0.15 for the OLS‐bisector slopes, 0.27 for the MA slopes,and 0.17 for the RMA slopes.
36 DANIEL C. REUMAN ET AL.
Author's Personal Copy
APPENDIX IV. ADDITIONAL RESULTS OFLINEARITY TESTING
Whether the composite test passed with independent variable log(M) was
independent of whether it passed with independent variable log(N) (Table S5,
R ¼ 0.006, p¼ 0.94). That the composite test with independent variable
log(M) passed independently of the composite test with independent variable
log(N) shows that intuition based on deterministic relationships does not
always carry through to statistical models. Cohen and Carpenter (2005) give
an artificial example (pp. 148–150) to illustrate how linear model assump-
tions can be violated with one choice of independent variable but not with the
other.

Table S4 Number of webs that passed multiple tests (1% level) of the assumptionsof the standard linear models
Passed all tests Failed at least one Failed at least two
Indep. var. log(M) 121 (�73%) 45 (�27%) 9 (�5%)Indep. var. log(N) 45 (�27%) 121 (�73%) 88 (�53%)Expected �158–159 (95–96%) �7–8 (4–5%) �0–1 (0–1%)
Number of webs (of 166) that passed all five tests of the assumptions of the linear regression
model (second column), failed at least one test (third column), and failed at least two tests
(fourth column). The last row shows the expected number of webs that would pass if a linear
model was true.
Table S5 Pass and fail rates of the composite test for each choice ofindependent variable
M passed M failed
N passed 33 (27.27%, 73.33%) 12 (26.67%, 26.67%)N failed 88 (72.73%, 72.73%) 33 (73.33%, 27.27%)
Number of webs (of 166) that fell into each of the four categories formed by
passing or failing the composite test with independent variables log(M) and log
(N). The first numbers in each set of parentheses sum to 100% down the columns;
the second numbers in each set of parentheses sum to 100% across the rows.
X1,12 ¼ 0.0061, p ¼ 93.8%.
BODY SIZE-ABUNDANCE ALLOMETRY IN FOOD WEBS 37
Author's Personal Copy
APPENDIX V. ABUNDANCE AND DIVERSITYOF BACTERIA
Bacteria were always much more abundant in the soil webs of this study than
would be expected from the line log(N) ¼ b1log(M) þ a1 that best fitted the
nonbacterial taxa. We conjecture this pattern was at least partly due to the
high degree of lumping of the bacteria. If log(N)b,e was the expected log
abundance of bacteria according to the regression line through the nonbac-
terial taxa, and if log(N)b was the actual log abundance of the bacteria, then
log(N)b�log(N)b,e had mean 6.59 across all 146 soil webs, with minimum
value 4.22 and maximum 10.28. Raising 10 to log(N)b�log(N)b,e values
showed that bacteria were on average (arithmetic mean) 1.88 � 108 times
more abundant than expected from the log–log regression line through the
other species populations, with minimum factor of over‐abundance 1.68 �104 and maximum factor 1.92 � 1010. Bacteria would have had to be divided

38 DANIEL C. REUMAN ET AL.
Author's Personal Copy
into between 1.88 � 102 and 2.72 � 108 equally abundant subtaxa for these
subtaxa to have residuals from the regression model Eq. 1 (based on the
nonbacterial taxa) that were not in the upper 0.5% tail of normally
distributed e. The use of 16S ribosomal ribonucleic acid sequencing to define
taxa of Archaea and Eubacteria would likely reveal 20 or more major groups
of Prokarya and thousands of taxa (Fitter et al., 2005; Noguez et al., 2005;
Torsvik et al., 2002). This level of resolution may be sufficient to bring
bacterial abundance per taxon into line with the expectation log(N)b,e, but
it might also be a finer classification than the genus or family level classifica-
tion that was used for Eukarya such as nematodes.
APPENDIX VI. LIMITATIONS OF THE DATA
Sample sizes of populations of some taxa in riparian and some soil webs were
limited. As a result, horizontal lines appeared when log(N) was plotted as a
function of log(M) because populations of many taxa had the same N value
(e.g., Figure 1F). If ni organisms of taxon ti were observed in an area of
size A, then the estimate for Ni, the population density of ti, was ni/A. If the
area A was not large, then by chance alone ni could have the same low value
for several uncommon taxa ti, causing several equal Ni estimates. Some
hyphal‐feeding nematodes in our soil webs were counted only once
(Mulder et al., 2003a, 2005c). In the riparian zone webs, the area A chosen
was adjusted to one of the three levels appropriate for the size and biology of
each of three broad taxonomic groups. This procedure led to the three visible
lines in Figure S2A, one line for each choice of A. Horizontal trends may
have affected the probability with which some scatter plots passed the
composite test for one or both choices of independent variable. Furthermore,
oversampling of larger soil invertebrates has been reported previously
(e.g., Ulrich et al., 2005).
Possible vertical lines could also affect linear regressions for some webs,
although they are not expected to do so for the data of this study. Vertical
lines correspond to multiple taxa having the same log average individual
body mass, and may result fromMmeasurements of insufficient precision, or
low‐precision M estimates derived from literature.
For soil webs, fungal mycelia and detritus were omitted from relation-
ships between log(M) and log(N). Detritus and fungi were either impossible
to define as ‘‘individuals’’ (Mulder et al., 2005a) or difficult to measure, so N
could not be measured for these taxa. The broken hyphae of fungal mycelia
(Mulder et al., 2003b) and fungal spores (Mulder et al., 2005b) were

BODY SIZE-ABUNDANCE ALLOMETRY IN FOOD WEBS 39
Author's Personal Copy
measured in other studies. Similarly, detritus was omitted from the Ythan
Estuary web.
To divide bacteria into subtaxa in inquiline communities, Cochran‐Stafira and Von Ende (1998) and Kneitel and Miller (2002, 2003) cultured
Figure S2 (continued )

Figure S2 Plots of log(N) versus log(M) for taxa from a Lake Neuchatel riparianzone unmown summer meadow web dominated by Schoenus nigricans (A), an organicDutch farm soil web, site identification number 137 (B), and a Dutch soil web from aScots pine plantation, site identification number 183 (C). The organic farm was aHolcus lanatus pasture under specific agronomic practices to enhance nitrogen fixa-tion: Holcus was mixed with the N2‐fixing legumes Trifolium repens and T. pratense.Horizontal lines are visible in the Lake Neuchatel data, and to a lesser extent in thesoil web data. Close inspection of the pine forest soil web reveals a few groups of threeor four taxa with the same log(M) values (vertical lines). These are not expected tohave affected the results of this study. In the same forest soil web, a detectionthreshold (horizontal line) is recognizable for arthropods due to extraction methods.
40 DANIEL C. REUMAN ET AL.
Author's Personal Copy
diluted bacterial samples and counted colony forming units in categories
according to colony appearance (Section IV). Bacterial abundances were
then back‐calculated according to the dilution used. The results fell near
the relationship between log(M) and log(N) expected from the other taxa.
Genetic information may resolve bacterial taxa more finely and provide
different log(N)‐versus‐log(M) scatter plots.
REFERENCES
Banasek‐Richter, C (2004) Quantitative Descriptors and Their Perspectives for Food‐Web Ecology. Doctoral dissertation, University of Neuchatel, CH.
Bishop, Y.M.M., Fienberg, S.E. and Holland, P.W. (1975) Discrete MultivariateAnalysis: Theory and Practice. The MIT Press, Cambridge, MA.

BODY SIZE-ABUNDANCE ALLOMETRY IN FOOD WEBS 41
Author's Personal Copy
Blackburn, T.M. and Gaston, K.J. (1993) Non‐metabolic explanations for the rela-tionship between body‐size and animal abundance. J. Anim. Ecol. 62, 694–702.
Blackburn, T.M. and Gaston, K.J. (1997) A critical assessment of the form of theinterspecific relationship between abundance and body size in animals. J. Anim.Ecol. 66, 233–249.
Blackburn, T.M. and Gaston, K.J. (1998) Some methodological issues in macroecol-ogy. Am. Nat. 151, 68–83.
Blackburn, T.M. and Gaston, K.J. (2001) Linking patterns in macroecology. J. Anim.Ecol. 70, 338–352.
Blackburn, T.M., Lawton, J.H. and Perry, J.N. (1992) A method of estimating theslope of upper bounds of plots of body size and abundance in natural animalassemblages. Oikos 65, 107–112.
Blackburn, T.M., Brown, V.K., Doube, B.M., Greenwood, J.J.D., Lawton, J.H. andStork, N.E. (1993) The relationship between abundance and body size in naturalanimal assemblages. J. Anim. Ecol. 62, 519–528.
Brown, J.H. (1995) Macroecology. University of Chicago Press, Chicago andLondon.
Brown, J.H. and Gillooly, J.F. (2003) Ecological food webs: High‐quality data facili-tate theoretical unification. Proc. Natl. Acad. Sci. USA 100, 1467–1468.
Brown, J.H. and Maurer, B.A. (1986) Body size, ecological dominance, and Cope’srule. Nature 324, 248–250.
Brown, J.H. and Maurer, B.A. (1989) Macroecology: The division of food and spaceamong species on continents. Science 243, 1145–1150.
Brown, J.H., Gillooly, J.F., Allen, A.P., Savage, V.M. and West, G.B. (2004) Towarda metabolic theory of ecology. Ecology 85, 1771–1789.
Carpenter, S.R. and Kitchell, J.F. (1993) The Trophic Cascade in Lakes. CambridgeUniversity Press, Cambridge, UK.
Cattin, M.‐F., Blandenier, G., Banasek‐Richter, C. and Bersier, L.‐F. (2003) Theimpact of mowing as a management strategy for wet meadows on spider (Araneae)communities. Biol. Conserv. 113, 179–188.
Cattin Blandenier, M.‐F. (2004) Models and Application to Conservation. Doctoraldissertation, University of Neuchatel, CH.
Cochran‐Stafira, D.L. and Von Ende, C.N. (1998) Integrating bacteria into foodwebs: Studies with Sarracenia purpurea inquilines. Ecology 79, 880–898.
Cohen, J.E. and Carpenter, S.R. (2005) Species average body mass and numericalabundance in a community food web: statistical questions in estimating the relation-ship. In: Dynamic Food Webs: Multispecies Assemblages, Ecosystem Development,and Environmental Change (Ed. by P.C. De Ruiter, V. Wolters and J.C. Moore),pp. 137–156. Academic Press, San Diego, CA.
Cohen, J.E., Jonsson, T. and Carpenter, S.R. (2003) Ecological community descrip-tion using the food web, species abundance, and body size. Proc. Natl. Acad. Sci.USA 100, 1781–1786.
Colinvaux, P. (1978) Why Big Fierce Animals Are Rare: An Ecologist’s Perspective.Princeton University Press, Princeton, NJ.
Cyr, H., Peters, R.H. and Downing, J.A. (1997a) Population density andcommunity size structure: Comparison of aquatic and terrestrial systems. Oikos80, 139–149.
Cyr, H., Downing, J.A. and Peters, R.H. (1997b) Density–body size relationships inlocal aquatic communities. Oikos 79, 333–346.
Damuth, J. (1981) Population density and body size in mammals. Nature 290,699–700.

42 DANIEL C. REUMAN ET AL.
Author's Personal Copy
Elton, C. (1927) Animal Ecology, Sidgwick and Jackson, London.Enquist, B.J., Brown, J.H. andWest, G.B. (1998) Allometric scaling of plant energetics
and population density. Nature 395, 163–165.Feigelson, E.D. and Babu, G.J. (1992) Linear regression in astronomy II. Astrophys. J.
397, 55–67.Fitter, A.H., Gilligan, C.A., Hollingworth, K., Kleczkowski, A., Twyman, R.M. and
Pitchford, J.W. (2005) Biodiversity and ecosystem function in soil. Funct. Ecol. 19,369–377.
Gaston, K.J. and Lawton, J.H. (1988) Patterns in the distribution and abundance ofinsect populations. Nature 331, 709–712.
Greenwood, J.J.D., Gregory, R.D., Harris, S., Morris, P.A. and Yalden, D.W. (1996)Relations between abundance, body size, and species number in British birds andmammals. Philos. Trans. R. Soc. Lond. B 351, 265–278.
Griffiths, D. (1992) Size, abundance and energy use in communities. J. Anim. Ecol. 61,307–316.
Griffiths, D. (1998) Sampling effort, regression method, and the shape and slope ofsize‐abundance relations. J. Anim. Ecol. 67, 795–804.
Hall, S.J. and Raffaelli, D. (1991) Food‐web patterns: Lessons from a species‐richweb. J. Anim. Ecol. 60, 823–842.
Isobe, T., Feigelson, E.D., Akritas, M.G. and Babu, G.J. (1990) Linear regression inastronomy I. Astrophys. J. 364, 104–113.
Jarque, C.M. and Bera, A.K. (1987) A test for normality of observations and regres-sion residuals. Int. Stat. Rev. 55, 163–172.
Jennings, S. andMackinson, S.M. (2003) Abundance–body mass relationships in size‐structured food webs. Ecol. Lett. 6, 971–974.
Jonsson, T., Cohen, J.E. and Carpenter, S.R. (2005) Food webs, body size and speciesabundance in ecological community description. Adv. Ecol. Res. 36, 1–84.
Kanzler, L. (2005) Matlab implementation of the Durbin–Watson test. http://www2.gol.com/users/kanzler/index.htm#L.%20Kanzler:%20Software.
Kerr, S.R. and Dickie, L.M. (2001) The Biomass Spectrum: A Predator–Prey Theoryof Aquatic Production. Columbia University Press, New York.
Kneitel, J.M. and Miller, T.E. (2002) Resource and top‐predator regulation in thepitcher plant (Sarracenia purpurea) inquiline community. Ecology 83, 680–688.
Kneitel, J.M. and Miller, T.E. (2003) Dispersal rates affect species composition inmetacommunities of Sarracenia purpurea inquilines. Am. Nat. 162, 165–171.
Knight, T.M., McCoy, M.W., Chase, J.M., McCoy, K.A. and Holt, R.D. (2005)Trophic cascades across ecosystems. Nature 437, 880–884.
LaBarbera, M. (1989) Analyzing body size as a factor in ecology and evolution. Annu.Rev. Ecol. Syst. 20, 97–117.
Lawton, J.H. (1989) What is the relationship between population density and bodysize in animals? Oikos 55, 429–434.
Lawton, J.H. (1990) Species richness and population dynamics of animal assem-blages. Patterns in body size: abundance space. Philos. Trans. R. Soc. Lond. B330, 283–291.
Leaper, R. and Raffaelli, D. (1999) Defining the abundance body‐size constraintspace: Data from a real food web. Ecol. Lett. 2, 191–199.
Lilliefors, H.W. (1967) On the Kolmogorov–Smirnov test for normality with meanand variance unknown. J. Am. Stat. Assoc. 62, 399–402.
Lonsdale, W.M. (1990) The self‐thinning rule: Dead or alive? Ecology 71, 1373–1388.Marquet, P.A., Navarrete, S.A. and Castilla, J.C. (1990) Scaling population density
to body size in rocky intertidal communities. Science 250, 1125–1127.

BODY SIZE-ABUNDANCE ALLOMETRY IN FOOD WEBS 43
Author's Personal Copy
Martin, R.D., Genoud,M. and Hemelrijk, C.K. (2005) Problems of allometric scalinganalysis: Examples from mammalian reproductive biology. J. Exp. Biol. 208,1731–1747.
Martinez, N.D. (1993) Effects of resolution on food web structure.Oikos 66, 403–412.McCann, K.S., Rasmussen, J.B. and Umbanhowar, J. (2005) The dynamics ofspatially coupled food webs. Ecol. Lett. 8, 513–523.
Meehan, T.D. (2006) Energy use and animal abundance in litter and soil commu-nities. Ecology 87, 1650–1658.
Meehan, T.D., Drumm, P.K., Farrar, R.S., Oral, K., Lanier, K.E., Pennington, E.A.,Pennington, L.A., Stafurik, I.T., Valore, D.V. and Wylie, A.D. (2006) Energeticequivalence in a soil arthropod community from an aspen‐conifer forest. Pedobio-logia 50, 307–312.
Mulder, Ch. (2006) Driving forces from soil invertebrates to ecosystem functioning:The allometric perspective. Naturwissenschaften 93, 467–479.
Mulder, Ch., De Zwart, D., Van Wijnen, H.J., Schouten, A.J. and Breure, A.M.(2003a) Observational and simulated evidence of ecological shifts within the soilnematode community of agroecosystems under conventional and organic farming.Funct. Ecol. 17, 516–525.
Mulder, Ch., Breure, A.M. and Joosten, J.H.J. (2003b) Fungal functional diversityinferred along Ellenberg’s abiotic gradients: Palynological evidence from differentsoil microbiota. Grana 42, 55–64.
Mulder, Ch., Cohen, J.E., Setala, H., Bloem, J. and Breure, A.M. (2005a) Bacterialtraits, organism mass, and numerical abundance in the detrital soil food web ofDutch agricultural grasslands. Ecol. Lett. 8, 80–90.
Mulder, Ch., Van Wijnen, H.J. and Van Wezel, A.P. (2005b) Numerical abundanceand biodiversity of below‐ground taxocenes along a pH gradient across TheNether-lands. J. Biogeogr. 32, 1775–1790.
Mulder, Ch., Dijkstra, J.B. and Setala, H. (2005c) Nonparasitic nematoda provideevidence for a linear response of functionally important soil biota to increasinglivestock density. Naturwissenschaften 92, 314–318.
Mulder, Ch., Den Hollander, H., Schouten, T. and Rutgers, M. (2006) Allometry,biocomplexity, and web topology of hundred agro‐environments in The Nether-lands. Ecol. Complex. 3, 219–230.
Nee, S., Read, A.F., Greenwood, J.J.D. and Harvey, P.H. (1991) The relationshipbetween abundance and body size in British birds. Nature 351, 312–313.
Noguez, A.M., Arita, H.T., Escalante, A.E., Forney, L.J., Garcia‐Oliva, F. andSouza, V. (2005) Microbial macroecology: Highly structured prokaryotic soilassemblages in a tropical deciduous forest. Global Ecol. Biogeogr. 14, 241–248.
Pace, M.L., Cole, J.J., Carpenter, S.R., Kitchell, J.F., Hodgson, J.R., Van deBogert, M.C., Bade, D.L., Kritzberg, E.S. and Bastviken, D. (2004) Whole‐lakecarbon‐13 additions reveal terrestrial support of aquatic food webs. Nature 427,240–243.
Peters, R.H. (1983) The Ecological Implications of Body Size. Cambridge UniversityPress, New York.
Peters, R.H. andWassenberg, K. (1983) The effect of body size on animal abundance.Oecologia 60, 89–96.
Reuman, D.C. and Cohen, J.E. (2005) Estimating relative energy fluxes using the foodweb, species abundance, and body size. Adv. Ecol. Res. 36, 137–182.
Reuman, D.C., Mulder, Ch., Raffaelli, D., and Cohen, J.E. (2008) Three allometricrelations of population density to body mass: Theoretical integration and empiricaltests in 149 food webs. Ecol. Lett. 11, 1216–1228.

44 DANIEL C. REUMAN ET AL.
Author's Personal Copy
Rooney, N., McCann, K., Gelner, G. and Moore, J.C. (2006) Structural asymmetryand the stability of diverse food webs. Nature 442, 265–269.
Russo, S.E., Robinson, S.K. and Terborgh, J. (2003) Size–abundance relationships inan Amazonian bird community: Implications for the energetic equivalence rule.Am. Nat. 161, 267–283.
Savage, V.M., Gillooly, J.F., Brown, J.H., West, G.B. and Charnov, E.L. (2004)Effects of body size and temperature on population growth.Am. Nat. 163, 429–441.
Shipley, B. (2000) Cause and Correlation in Biology: A User’s Guide to Path Analysis,Structural Equations, and Causal Inference, pp. 172–175. Cambridge UniversityPress, New York.
Snedecor, G.W. and Cochran, W.G. (1967) Statistical Methods, 6th edn. Iowa StateUniversity Press, Ames, IA.
Sugihara, G. (1989) How do species divide resources? Am. Nat. 133, 458–463.Sugihara, G., Schoenly, K. and Trombla, A. (1989) Scale invariance in food web
properties. Science 245, 48–52.Taper, M.L. and Marquet, P.A. (1996) How do species really divide resources? Am.
Nat. 147, 1072–1086.Torsvik, V., Øvreas, L. and Thingstad, T.F. (2002) Prokaryotic diversity—Magnitude,
dynamics, and controlling factors. Science 296, 1064–1066.Ulrich, W., Buszko, J. and Czarnecki, A. (2005) The local interspecific abundance–
body weight relationship of ground beetles: A counterexample to the commonpattern. Pol. J. Ecol. 53, 585–589.
Underwood, A.J. (1997) Experiments in Ecology: Their Logical Design and Interpre-tation Using Analysis of Variance. Cambridge University Press, New York.
West, G.B., Brown, J.H. and Enquist, B.J. (1997) A general model for the origin ofallometric scaling laws in biology. Science 276, 122–126.
Woodward, G., Ebenman, B., Emmerson, M., Montoya, J.M., Olesen, J.M.,Valido, A. and Warren, P.H. (2005a) Body size in ecological networks. TrendsEcol. Evol. 20, 402–409.
Woodward, G., Speirs, D.C. and Hildrew, A.G. (2005b) Quantification and resolu-tion of a complex, size‐structured food web. Adv. Ecol. Res. 36, 85–136.
Related Documents


