i

Welcome message from author
This document is posted to help you gain knowledge. Please leave a comment to let me know what you think about it! Share it to your friends and learn new things together.
Transcript
i
i
13TH INTERNATIONAL RESEARCH CONFERENCE
HOLISTIC APPROACH TO NATIONAL GROWTH AND SECURITY
ALLIED HEALTH SCIENCES
PROCEEDINGS
General Sir John Kotelawala Defence University
Ratmalana, Sri Lanka
ii
©General Sir John Kotelawala Defence University All rights reserved
This book contains the Conference Proceedings of the Allied Health Sciences Sessions of the 13th
International Research Conference of General Sir John Kotelawala Defence University, Ratmalana,
Sri Lanka held on 15th and 16th of October 2020. No part of this publication may be reproduced,
stored in a retrieval system or transmitted in any form, without prior permission of General Sir John
Kotelawala Defence University, Ratmalana, Sri Lanka.
Published by
General Sir John Kotelawala Defence University, Ratmalana, Sri Lanka
Tel: +94-71-021-9425
e-Mail: [email protected]
Website: https://www.kdu.ac.lk/irc2020
ISBN 978-624-5574-18-6
Other Proceedings of the Conference:
Defence and Strategic Studies : ISBN 978-624-5574-12-4
Medicine : ISBN 978-624-5574-13-1
Engineering: ISBN 978-624-5574-14-8
Law : ISBN 978-624-5574-15-5
Management, Social Sciences and Humanities : ISBN 978-624-5574-16-2
Built Environment and Spatial Sciences: ISBN 978-624-5574-19-3
Computing : ISBN 978-624-5574-17-9
Basic and Applied Sciences : ISBN 978-624-5574-20-9
Published on
15th October 2020
Cover page designed by Malith Ileperuma
e-Book Version
Platinum Sponsors
Co Sponsor
iii
Patron, Conference Steering Committee
Maj Gen MP Peiris RWP RSP USP ndc psc, Vice Chancellor
President, Steering Committee
Brig N Hathurusinghe psc IG Hdmc
Conference Chair
Dr L Pradeep Kalansooriya
Conference Secretariat
Dr Sanath de Silva
Ms NKK Mudalige
Dr (Ms) NS Fernando
Capt DDGR Karunarathne
Steering Committee
Brig RGU Rajapakshe RSP psc Prof MHJ Ariyarathne
Cmde JU Gunaseela psc Snr Prof SRD Alwis Senevirathne
Col ULJS Perera RSP USP psc Snr Prof JR Lucas
Col WMNKD Bandara RWP RSP USP psc Snr Prof ALS Mendis
Capt (S) WM Senevirathna Snr Prof ND Warnasuriya
Lt Col AK Peiris RSP Snr Prof RN Pathirana
Squadron Leader WNI Yalagama Snr Prof SSSBDAA Jayawardane
Prof CL Goonasekara
Mr VD Kithsiri
Dr UG Rajapaksha
Dr KMGP Premadasa
Dr (Ms) ADM Gunasekara
Dr JMKB Jayasekara
Mr MPC Wijesooriya
Ms ND Ranasinghe
iv
Editorial Committee
Mr. WAAK Amaratunga – President
Cmde JU Gunaseela USP psc Snr Prof Amal Jayawardane
Col ULJS Perera RSP USP psc Prof W Abeywickreme
Capt (E) MCP Dissanayaka Dr US Rahubadda
Maj (Dr) WMMS Bandara Mr PDDD Wickramasinghe
Dr HL Premaratne
Dr S Fernando
Ms BDK Anandawansa
Dr DDTK Kulathunga
Dr R Vijitha
Ms Lakshani Willarachchi
v
Panel of Reviewers
Mrs JI Abegoonawardana Maj JPWK Abeyawickrama Dr RMTB Abeyratne Dr Bandula Abeysinghe Dr Ujitha Abeywickrama Dr MPKW Abhayasinghe Dr De Alvis Mr WM Amaradasa Dr AATD Amarasekara Dr Niranga Amarasinghe Mr WAAK Amaratunga Dr KR Ambepitiya Ms BDK Anandawansa Dr Anuradha Ariyarathne Dr Kusalika Ariyarathne Prof MHJ Ariyarathne Mrs Iresha Ariyasingha LCdr RDS Arunapriya Prof Bandunee Athapattu Dr Iresha Attanayake Dr ME Balasooriya Mr DN Balasuriya Col (Prof) Aindralal Balasuriya Mr Ravimal Bandara Dr Wasala Bandara Dr RMPS Bandara Dr AWMKK Bandara Mr KPSPK Bandara Dr Yapa Mahinda Bandara Lt Col (Dr) WMMS Bandara Eng Prabath Buddika Dr Thushara Chaminda Dr SP Chaminda Dr KVDS Chathuranga Dr Senarath Colombage Dr Amali Dalpadadu Eng SU Dampage Dr Damayanthi Dasanayake Dr WAR De Mel Ms LM De Silva Dr Sara De Silva Mr KSC De Silva Prof Nelun de Silva Dr Dulantha de Silva Dr Darshan de Silva Dr Seneetha de Silva Mrs MMKOK de Silva Dr Anjula De Silva Mrs SCM de S Sirisuriya Ms R Devi Mr HKA Dharmasiri Mrs Umanda Dikwatta Capt MCP Dissanayaka Ms AA Edirisinghe Sqn Ldr Dinusha Edirisinghe Dr EATA Edirisuriya Dr Chamira Edusooriya Dr CD Ekanayake Dr Ruwan Ferdinando Dr Sithara Fernando Dr TGI Fernando Cdr Sarath Fernando Dr Lakshitha Fernando Snr Prof PR Fernando Dr Neil Fernando Dr NS Fernando Snr Prof Rohini Fernandopulle
Ms Madushika W.K Gamage Dr AU Gamage Mrs Anjalee Gamage Archt DWK Gayantha Dr Ayantha Gomes Dr Kishara Goonerathne Dr BGDS Govindapala Prof DMA Gunaratna Dr NK Gunasekara Dr ADAI Gunasekara Prof CL Gunasekara Mr GP Gunasinghe Dr MDEK Gunathilaka Dr HRWP Gunathilake Mr MMLC Gunathilake Dr Buddhika Gunawardana Prof Sampath Gunawardena Dr SHNP Gunawickrama Prof KBS Gunawickrama Dr ADAI Gunesekera Dr GN Duminda Guruge Mr SMB Harshanath Miss Ayesha Herath Mr HMN Herath Dr R Herath Dr Janith Hettiarachchi Dr B Hettige Dr Kanthi Hettigoda Mr Dulitha Hewadikaram Dr Asiri Hewamalage Dr IMPS Ilankoon Dr RP Illeperuma Ms WMKS Ilmini Dr B Indrarathne Ms JAD Jayakody Dr JMKB Jayasekara Dr Priyamali Jayasekara Ms BKM Jayasekera Dr SD Jayasooriya Dr WJABN Jayasuriya Mrs JADUN Jayasuriya Dr MRS Jayathilake Snr Prof Amal Jayawardane Dr MM Jayawardena Dr Kaushalya Jayaweera Dr Janathanan Jeyakumar Dr Kasun Jinasena Ms Gayanthi John Maj (Dr) Darshitha Jothipala Dr Thilini Kananke Ms SU Kankanamge Dr GD Kapila Kumara Capt DDGR Karunarathne Dr AMDS Karunaratna Dr PPCR Karunasekara Mr RDN Karunathilake Mr RPS Kathriarachchi Dr Gnanaselvam Kisokanth Dr Saman Koswatte Dr DU Kottahachchi Mr DMR Kulasekara Dr DDTK Kulathunga Dr RP Kumanayake Mr PPNV Kumara Archt WAPS Kumara Dr KMN Kumarasinghe Dr KDKP Kumari
vi
Dr GP Lakraj Ms Esther Liyanage Dr Mrs LS Liyanage Dr Indika Liyanage Dr Sanka Liyange Ms DD Lokuge Prof Rohan Lucas Mr Pasan Maduranga Brig (Dr) PTR Makuloluwa Dr Lasanthi Malaviarachchi Dr Sarath Malawipathirana Dr Kritsada Mamat Mr KP Manuranga Dr MKDL Meegoda Ms WDH Mel Dr Thushini Mendis Snr Prof Susirith Mendis Ms Samanthi Menike Dr TP Miyanwala Dr Nasmia Mubarak Ms NKK Mudalige Dr IUK Mudalige Dr Dulini Mudunkouwa Dr Janake Munasighe Ms MRIK Munasinghe Mrs Priyanga Munidasa Dr Dilini Nakkawita Dr Chandrika M Nanayakkara Dr Vauna Navarathna Mr SC Padmakumara Dr HR Pasindu Snr Prof RN Pathirana LCdr KGC Pathmal Mrs WPJ Pemarathne Dr Janaka Perera Dr Loshaka Perera Dr Ranjan Perera Mr CJSAH Perera Eng Randika Perera Ms GAD Perera Ms ADP Perera Dr Namal Perera Ms DR Perera Dr KS Perera Dr PKDD Pitigala Mr ALI Prasanna Dr Wuditha Premadasa Dr Prasanna Premadasa Dr GAS Premakumara Dr HL Premarathna Archt MLNH Premarathne Dr WMAGHA Premarathne Mr JMW Premarathne Dr S Premaratne Lt Col (Dr) Prasad H Premaratne Dr DSP Pulleperuma Dr Malinda Punchimudiyanse Dr KSR Pushpakumara Dr US Rahubadda Mrs RMNP Rajapakse Ms Prasadi Rajapaksha Dr UG Rajapaksha Dr Prabath Ranasinghe Snr Plnr CP Ranawaka Ms RBWMH Rathnamalala Dr Vishaka Rathnamalala Dr Sarath Rathnayaka Dr RMKT Rathnayaka
Maj RMRKK Rathnayake Dr RMKT Rathnayake Maj RMM Pradeep Dr (Mrs) KKNP Rathnayake Dr (Mrs) RMCLK Rathnayake Dr AJIS Rathnayake Dr Saman Renuka Dr Thusitha Rodrigo Dr GD Ishani Rodrigo Dr Nilan Rodrigo Dr HSR Rosairo Dr AR Rupasinghe Dr Methsiri Samarakoon Mrs PWGDP Samarasekara Mr Rangajeewa Samarathunga Mrs W Samaraweera Dr Thisara Samarawickrema Ms KUJ Sandamali Dr MS Sandanayake Ms Niruka Sanjeewani Ms NA Sanjeewani Mr S Satheesmohan Dr G Senanayake Dr SP Senanayake Dr Asela Senanayake Ms Bhagya Senaratne Dr Thamarasi Senaratne Mr Asantha Senavirathna Dr Niroshan Senevirathna Ms SMKS Senevirathne Dr DMKN Seneviratna Snr Prof SRDA Seneviratne Snr Prof Rizvi Sheriff Mr ARN Silva Dr Sanjeewani Silva Dr (Mrs) RMNT Sirisoma Mr MA Siriwardhene Mrs Tina Solomons Dr KA Sriyani Ms RDUP Sugathapala Prof Athula Sumathipala Dr S M T D Sundarapperuma Mrs Wasana Uduwela Mrs DU Vidanagama Dr HR Vidanage Dr R Vijitha Dr Meththika Vithanage Mr WADGI Wanasinghe Dr SSP Warnakulasuriya Snr Prof Narada Warnasuriya Mrs ID Wattuhewa Mrs N Wedasinghe Dr BS Weerakoon Snr Prof TR Weerasooriya Prof DBM Wickramaratne Dr Wasantha Wickramasinghe Dr Thiwanka Wickramasooriya Dr Ranga Wickremarachchi Sqn Ldr (Rtd) Uditha Wicramarathna Mr RD Widanagamage Dr Sanika Wijesekara Mr WLPK Wijesinghe Dr Namal Wijesinghe Ms MPC Wijesooriya Mrs AI Wijethunga Mrs MTN Wijetunge Ms L Willarachchi Dr Trilicia Withanawasam
13th International Research Conference
General Sir John Kotelawala Defence University
Allied Health Sciences Sessions
vii
Session Coordinators
Defence and Strategic Studies
Brig RGU Rajapaksha RSP psc
Col ULJS Perera RSP USP psc
Maj RMS Rathnayake RSP
Maj TVN de Saa RSP psc
Ms Niruka Sanjeewani
Medicine Gp Cpt (Dr) RANK Wijesinghe
Dr KSR Pushpakumara
Dr TI Withanawasam
Dr BCIJ Nanayakkara
Engineering Capt (Rtd) Eng SU Dampage
Dr WTS Rodrigo
Mr SD Karunarathna
Capt SAAAK Athukorala
Management, Social Sciences and Humanities Mr WAAK Amaratunga
Ms HMAGK Ekanayake
Ms P Lankeshwara
Ms T Kotelawala
Law Mr WS Wijesinghe
Ms MRIK Munasinghe
Ms AA Edirisinghe
Allied Health Sciences Dr DU Kottahachchi
Dr SP Senanayake
Mr ARN Silva
Ms UDH Kanchana
Built Environment and Spatial Sciences Dr AR Rupasinghe
Ms KS Dinusha
Ms NDI Vithana
Mr HDS Asoka
Computing Cmde JU Gunaseela USP psc
Ms WPJ Pemarathne
Mr DMR Kulasekara
Mr GIF de Silva
Basic and Applied Sciences Dr SHNP Gunawickrama
13th International Research Conference
General Sir John Kotelawala Defence University
Allied Health Sciences Sessions
viii
Table of Contents
Welcome Address .................................................................................................. 1
Major General Milinda Peiris RWP RSP USP ndc psc
Chief Guest Speech ................................................................................................ 3
Prof. GL Peiris
Keynote Speech ...................................................................................................... 8
Prof. Kapila Perera
Vote of Thanks ..................................................................................................... 12
Dr. L Pradeep Kalansooriya
Multiple Intelligence and Academic Performance among BSc.
Nursing Undergraduates in Kotelawala Defence University, Sri
Lanka; A Correlational Study ......................................................................... 15
WGC Kumara, KGG Priyangika, WS Sudusinghe
Quantitative Analysis of the Additional Radiation Burden due to
Electronic Collimation in Digital Radiography ........................................ 19
DM Satharasinghe, WMNMB Wanninayake, AS Pallewatte and J Jeyasugiththan
Parenting-related Stress In Mothers OF Toddlers (1-3 Years) at
Piliyandala MOH Area ....................................................................................... 23
HCC Sewwandika, SJ De Silva, BMKS Rathnayake, DMKU Dissanayake , LNL Kulasena, KGG
Priyangika and TH Solomans
Occupational Engagement In Prisons: an evaluation of time-use in
Sri Lankan correctional settings. .................................................................. 26
GPC Gunarathne, MDA Rodrigo, and TSS Mendis
Estimation of Radiation Dose to the Eye during
Radiopharmaceutical Preparation and scan procedures at a selected
private hospital in Sri Lanka .......................................................................... 31
RAIU De Silva, HMPNB Mawathagama, P Sathyathas and JMC Udugama
Prevalence of forward head posture and its’ relationship with neck
pain among sewing machine operators in two selected garment
factories in Kaluthara district ........................................................................ 37
DT Wagachchi, MS Jayamanne, AMLUK Adikari, IDL Kodagoda, YT Mudalige, GAD Perera
Prevalence Of Urinary Incontinence And Its Association With Risk
Factors In Three Months Postpartum Women Attending MOH Clinics
Registered Under Colombo Municipal Council During September
And October 2019 .............................................................................................. 44
KMR Ranasinghe, MAN Madhurangi, IS Samarasinghe, NAVW Yapa, JI Widanagamage, VS
Ruwandika, and GAD Perera
13th International Research Conference
General Sir John Kotelawala Defence University
Allied Health Sciences Sessions
ix
Antimicrobial Susceptibility Patterns Of Blood Culture Isolates From
Cancer Patients After Anti-Cancer Therapy. ............................................. 51
#RM Flemin , SAR Thakshala, SP Gunasekara, AK Chandana and UTN Senaratne
Learning style preferences and academic performance of
undergraduate physiotherapy students .................................................... 57
#WNI Kularathne, EMIA Bandara, and ALI Prasanna
Effect of CT Bore size on Radiation Dose during Head CT Acquisition.
................................................................................................................................... 64
T Amalraj, DM Satharasinghe, A. Ramalingam, AS Pallewatte and J Jeyasugiththan
Gastroprotective Activity Of Vishnukarnthi Chewable Granular
Dosage Form Formulated Using Evolvulus Alsinoides And Its
Accelerated Stability Studies .......................................................................... 67
TDMTS Kumara, HUV Hettiarachchi, WJABN Jayasuriya, LDAM Arawwawala and TS Suresh
Comparative Study Of Range Of Motion After Conventional
Physiotherapy In Adhesive Capsulitis Of Shoulder Joint Among
Diabetic And Non-Diabetic Patients At Teaching Hospital Batticaloa.
................................................................................................................................... 73
R Rakunaraj
A Study On The Assessment Of Perceived Stress, Self-Efficacy And
Associated Socio-Demographic Factors Among Undergraduates In A
Higher Educational Institution In Sri Lanka ............................................. 79
SS Wadduwage, PJ Wijekumar, LH Walpola, NDK Ranadeva, S Chackrewarthy
Investigation Of In-Vitro Antiurolithiatic Activity Of Passiflora
Foetida And Stachytarpheta Indica On Experimentally Prepared
Calcium Oxalate Crystals. ................................................................................ 85
WDPA Jeewananda, HHND Priyankara, NM Thilakaratne, RN Pathirana, BLC Samanmali
In Vitro Evaluation Of Sun Screen Activity And Phytochemical
Screening Of Methanolic Leaf Extract Of Magnolia Figo ....................... 90
PMKT Dharmatilake, TRL Peiris, BLC Samanmali, RN Pathirana and WD Ratnasooriya
Association Between Perceived Stress And Obesity Among Female
Undergraduate Students In The University Of Peradeniya................. 95
EHMRK Ekanayake , RM Mudiyanse
Evaluation of Anti-inflammatory and Antibacterial activities of the
extracts of leaves, roots and combination of leaves and roots of
plant Magnolia figo. ........................................................................................ 105
AMAU Abeykoon, GMCP De Silva, KTSS Karunathilake, ARN Silva, AWMKK Bandara and RN
Pathirana
13th International Research Conference
General Sir John Kotelawala Defence University
Allied Health Sciences Sessions
x
Determination of Gender using Measurements of the Mandible
taken from Orthopantomogram and Cephalogram ............................ 111
MDR Munasinghe, LPN Madhavee, LHMIM Herath and RP Illeperuma
Correlation between Liver Fat Indices and Ultrasonography to
determine NAFLD among Diabetic patients. ......................................... 116
KKDSD Kannangara, MR Dehigolla, CMJU Gunathilake, RS Maddumage, GDS Dulshika, WAC
Karunarathne, WA Epa, Uditha Bulugahapititya, and JMKB Jayasekara
Correlation between Hemoglobin Concentration and Absolute
Reticulocyte count of adolescent female iron deficient patients at
Colombo north teaching hospital. ............................................................. 120
R.M.D.K Rathnayaka, R.M.D Seneviratne, D. Kottahachchi and Y. Costa
Effect of Lidocaine Spray in the Enhancement of the Quality of Intra-
Oral Periapical Radiograph when Imaging Lower Third Molar Teeth
................................................................................................................................ 124
GK Dharmaratne, DBP Rupasinghe, EMTH Ekanayake, RD Jayasinghe
Health Promoting Lifestyle and Its Associated Factors Among
Undergraduate Students in Faculty of Allied Health Sciences,
University of Peradeniya, Sri Lanka ......................................................... 129
NGGS Chandana, HMRKG Nandasena, TS Amarasinghe
Evaluation of Physicochemical Properties of Starch from Two
Modified Sri Lankan Rice Varieties to Be Used as Excipients in the
Pharmaceutical Industry .............................................................................. 134
LMH Piyumini, KWDC Lalindra, HSAM Premathilake, SU Kankanamge, TS Suresh, P Danthanarayana
and WJABN Jayasuriya
Health Related Quality of Life among Patients with Chronic Kidney
Disease in Sri Lanka; a Review ................................................................... 141
KIP Prabani, HDWT Damayanthi, H Takahashi, U Shimizu
Knowledge And Practices Regarding Open-System Endotracheal
Suctioning Among Intensive Care Unit Nurses At The National
Hospital Of Sri Lanka ...................................................................................... 148
BPRW Balasooriya and SMKS Seneviratne
Prevalence of Unintentional Home Injuries and Awareness of Child
Safety among the Parents of Inpatient Children at Sirimavo
Bandaranayake Specialized Children’s Hospital Peradeniya ......... 153
S Senthuran and ML Pathirathna
13th International Research Conference
General Sir John Kotelawala Defence University
Allied Health Sciences Sessions
xi
Relationship Between Hip Abductor Muscle Strength And Flatfoot
Deformity Among Undergraduates At Faculty Of Allied Health
Sciences, General Sir John Kotelawala Defence University .............. 159
GAA Ransimala, DRM Fernando, DYRS Madhuwanthi, ADT Nawakshana, HLDKND Rathnasiri, NH
Wickramasinghe, SADCS Senavirathna and UTN Senaratne
Family Members Experiences Related to Organ Donation of their
Brain Death Patient ........................................................................................ 164
LND Amarasinghe, SKR Senadheera, BATN Buathsinghala, AKA Madhuwanthi, RAND Ranaweera and
BSS De Silva
Investigation of Nasal Colonization of Methicillin-Resistant
Staphylococcus aureus Among Nursing Students at a University in Sri
Lanka .................................................................................................................... 170
Pathiraja P.A.C.P, Gamage C.D., Dissanayake B.N
Manual Immature Reticulocyte Fraction: a reliable marker to assess
post traumatic blood loss. ............................................................................ 176
J.K.D. Wijegunawardena, K.A.C. Wickramaratne
Awareness on Prevention of Common Oral Diseases Among ......... 180
Non – Dental Undergraduate Students of University of Peradeniya
................................................................................................................................ 180
NT Wijesinghe, BMHSK Bannaheka, TS Amarasinghe
Behavioural and Psychological Impact of Covid-19 on a Group of
Youth and Young Adults Repatriated Back to Sri lanka from the uk: a
qualitative study .............................................................................................. 185
K Abhayasinghe, N Weerasinghe, TN Karunaratne, L Dissanayake, K Jayasinghe, M Hewamulla, GND
Guruge, A Sumathipala
Usefulness of Timed Up and Go test, Berg Balance Scale and Six
Minute Walk Test as fall risk predictors in post stroke adults
attending Rehabilitation Hospital Ragama ............................................ 192
KMT Bandara, UK Ranawaka, and A Pathmeswaran
Formulation development for a herbal cream incorporating the
extracts of Curcuma zedoaria rhizome .................................................... 199
SMDU Silva, AS Malshi, DN Kaluthanthri, BLC Samanmali, HMDR Herath, and WJABN Jayasuriya
Association of quadriceps and hamstring muscle strengths with low
back pain due to non-contact injuries among fast bowlers aged
between 15 – 19 years in division 1 boys’ schools in Colombo ...... 204
HWUS Jayasinghe, TIS Swaris, DS Weerasooriya, NVD Maura, IMS Bandara, DMKH Disanayake and
ADP Perera
13th International Research Conference
General Sir John Kotelawala Defence University
Allied Health Sciences Sessions
xii
Does learning environment differ in BSc. Nursing degree
programmes in Sri Lankan state universities? ..................................... 210
JAVPD Jayaweera, MRAS Thilakarathna, WDT Shashikala, RMLM Rathnayaka, JARJ Arachchige, RDN
Karunathilaka and AATD Amarasekara
Effects of Exposure to Digital Screens in Children and Adolescence
................................................................................................................................ 219
Arosha Rajapakse, Dilshara Wijenayake
Knowledge on disaster preparedness and associated work related
factors among allied health professionals at Teaching hospital,
Jaffna .................................................................................................................... 223
Pirasanth Niruja, P. A. Dinesh Coonghe, and S. T. Sarma
The relationship between static foot posture and chronic bilateral
knee osteoarthritis among the patients attending Department of
Rheumatology and Rehabilitation (General), National hospital, Sri
Lanka .................................................................................................................... 229
Gunawardana GEE , Kandegedara WMST , Perera AY , Ramdina MDL , Rathnayake RMVS , Thilsath
MHM , Praveena T , Balasuriya A
Knowledge and practice of pre-hospital care after a road traffic
injury among three-wheel drivers and associated factors in selected
police areas in Colombo district. ............................................................... 236
Nawarathna SNAM, Goonewardena CSE
Knowledge On Usage Of Thyroxin Tablet Among Primary
Hypothyroidism Patients Attending Endocrinology Clinic At
Teaching Hospital Jaffna ............................................................................... 257
R Tharsan, M Aravinthan, PAD Coonghe, and P Kalki
Knowledge On Diet Among The Ischemic Heart Disease Patients
Attending Cardiology Clinic At Teaching Hospital Jaffna .................. 262
U Yanuthy, PAD Coonghe, M Guruparan and L Kamalarupan
Assessment of the Awareness in Management of Chemotherapy
Related Adverse Effects Experienced by Cancer Patients at Apeksha
Hospital, Maharagama, Sri Lanka .............................................................. 268
JMAD Jayalath, GNDDZ Wikramarathne, DMNPK Doranegoda, NA Sanjeewani, MA Siriwardhene and
KASJ Balawardhene
Prevalence And Association Of Overweight With Major Non-
Communicable Diseases Among Elderly People Living In Kesbewa
Secretariat Division, Colombo, Sri Lanka ............................................... 277
HATM Wijesekara, BGH Sanjeewani, BADN Sandeepani, HA Samarasinghe, AWA Sathsarani, GRL
Godamulla, HSMSK Wijesiri and Sudath SP Warnakulasuriya
13th International Research Conference
General Sir John Kotelawala Defence University
Allied Health Sciences Sessions
xiii
The association between physical activities and overweight/obesity
among adolescent girls in three provincial girls’ schools in
Piliyandala Educational Zone, Colombo, Sri Lanka. ............................ 280
KPNP Karunarathna, HKLJ Karunarathne, EMP Jayathilaka, DMWS Dissanayake, OLPA Lekamge,
RDUP Sugathapala , D Vidanage and MKDL Meegoda
Knowledge And Attitude Regarding Adverse Drug Reaction
Reporting And Associated Factors Among State Pharmacist In
Northern Province, Srilanka........................................................................ 285
ML. Kaluarachchi, S. Thuvaragan, PAD.Coonghe, and SN. Thihahiny
Effectiveness of an awareness programme on burn prevention and
first aid among grade 10 students of type 1 and 2 schools in
Kesbewa Divisional area, Piliyandala educational zone, Colombo
District, Sri Lanka ............................................................................................ 290
RAKP Jayarathna, BPD Silva, GASS Gamasinghearachchi, DBI Chamaleen, MBDT Rajawardhana,
DVDM Samarasinghe, RDUP Sugathapala
Knowledge and Awareness regarding Human Papilloma Virus (HPV)
infection and vaccination among adolescents aged 14 – 16 years in
selected mixed Government Schools in Kesbewa Educational
Division, Sri Lanka. ......................................................................................... 295
HLC Ushara , HMRR Wijesimghe, V Vysnavy, GGCR Malalagama, MGCH Jayasekara, MN
Priyadarshanie and Dr. GDI Rodrigo
Expectations Of Patients Who Underwent Chemotherapy For Breast
Cancers In Apeksha Hospital Maharagama ............................................ 307
AAA Dushmanthi, WASM Wijesooriya, JPTSW Jayalath, HPMD Thilakarathna, MGR Malkanthi, DMND
Senevirathna and AN Senanayaka
Knowledge, Attitudes And Practices On Antibiotic Therapy Among
Parents Of Children Admitted To A Specialized Children’s Hospital
In Sri Lanka ........................................................................................................ 312
Occupational risk factors related to Cutaneous Leishmaniasis: A
descriptive study ............................................................................................. 319
WAMSD Abeysinghe, WS Nilmini, GGCN Sandarekha, HT Illangasingha, KIDF Senanayake, N Liyanage
and KGPK Munidasa
Exploration Of The Door To Needle Time Gap Of Administering Anti-
Venom Serum (AVS) And Its Determinants: A Mixed-Method Study
................................................................................................................................ 324
RAM Ritigahapola, NSD Wijesingha, JPMH Jayalath, HPM Karunarathna, ACW Madanayaka, HMP
Herath, A Silva and S Siribaddana
13th International Research Conference
General Sir John Kotelawala Defence University
Allied Health Sciences Sessions
xiv
Dietary Adherence With Guideline Recommendations In Patients
Undergoing Continuous Ambulatory Peritoneal Dialysis ................ 328
DRTS Dasanayake, AMSD Pathiranage and N Nanayakkara
Evaluation Of Efficacy & Efficiency In Implementing Knee Ankle Foot
Orthosis (KAFO) As A Functionally Assistive Indoor Ambulatory
Device For Motor Complete Thoracic Level (T10 –T12) Spinal Cord
Injury In Males .................................................................................................. 333
WGTN Gamage and DTD Warnakulasuriya
Psychological Experiences of Parents having a Child with Cleft Lip
and Palate ........................................................................................................... 337
SMT Laksrini, WAD Dilrukshika, YMJM Yapa, AAI Sirimanna, MAR Saumika, N Liyanage and KGPK
Munidasa
13th International Research Conference
General Sir John Kotelawala Defence University
Allied Health Sciences Sessions
1
Welcome Address
Major General Milinda Peiris RWP RSP USP ndc psc
Vice Chancellor, General Sir John Kotelawala Defence University
Honurable Minister of Education, Professor G
L Peiris, the Chief Guest , Keynote Speaker,
Secretary to the Ministry of Education,
Professor Kpila Perera, Secretary to the
Ministry of Foreign Affairs, Admiral Prof.
Jayanath Colombage, Deputy Vice Chancellor
(Def & Admin) Brig. Nanda Hathurusinghe,
Deputy Vice Chancellor (Academic) Prof.
Jayantha Ariyarathne, Deans of the
respective Faculties, Directors of Centres,
Academics, Senior Military Officers,
Administrative Staff, Students and all
distinguished guests who are connected with
us in the cyber space.
First and foremost, let me very warmly
welcome our chief guest, Hon Professor GL
Peiris, Minister of Education for very kindly
accepting our invitation and for gracing this
occasion as the chief guest of this inaugural
session of our international research
conference 2020.
Sir, we consider your presence here this
morning, as one of the most renowned
scholars the country has ever produced in
the field of Law, as a great honour to KDU. Let
me also warmly welcome our keynote
speaker, Prof Kapila Perera, Secretary to the
Ministry of Education, who is having a very
close affinity with KDU as an illustrious
member of our alumni association.
Then I also welcome Admiral Professor
Jayanath Colombage, Secretary to the
Ministry of Foreign Affairs, and other
distinguished guests and invitees
participating on line as well. KDU, from its
inception, was instrumental in handing down
the core values of security to the
development paradigm in Sri Lanka.
This year’s theme ‘Holistic Approach to
National Growth and Security” highlights the
importance of maintaining a harmonious
blend in security and development in all
national projects. As you are aware, this
year’s conference is taking place amidst very
challenging circumstances, so much so that,
it becomes a landmark event of KDU in terms
of its resolution to ensure the continuity of
events at KDU even under the most trying
circumstances. And this conference is also
significant because the year 2020 marks 40
years of existence of KDU since its inception
in 1980.
KDU, initially established as a tri-service
academy known then as KDA or Kotelawala
Defence Academy, marked a significant
diversion in 2008 with its renaming as
General Sir John Kotelawala Defence
University. Since then, with the guidance and
vision of His Excellency the President
Gotabaya Rajapakse, as the then Secretary to
the Ministry of Defence and the Chairman of
our Board of Management, KDU kept a giant
leap forward to become a fully-fledged
university with nine academic faculties and a
University Hospital with state-of-the-art
facilities. With this phenomenal change, KDU
began expanding its horizon to provide its
high-quality higher educational
opportunities to civilian students, thereby
reducing the burden on other state
universities of the country in supplying for
the higher educational demand in the
country. Today, the University is ready to
march forward steadfastly contributing to
the national needs combining the national
security domain with higher educational
needs of the country.
13th International Research Conference
General Sir John Kotelawala Defence University
Allied Health Sciences Sessions
2
Ladies and gentlemen, KDU international
research conference has been attracting local
and foreign presenters, participants and
more importantly renowned scholars and
professionals of the highest caliber both
locally and internationally. However, in this
year, the global pandemic situation has
restricted having them physically present at
KDU. But many of our invitees will join us on
line to enrich the deliberations through this
novel experience of having the conference on
a virtual platform.
I reckon that this is a blessing in disguise for
us to travel on untrodden paths for new
discoveries. KDU IRC has been instrumental
in establishing and strengthening the much
needed research culture not only at KDU but
also in the whole country.
We have been attracting papers from almost
all universities, from many research
institutions and other organizations
representing even Batticaloa and Jaffna,
which I reckon is a very encouraging sign.
And the impact of the growing research
culture was evident during the first breakout
of Covid 19 earlier this year, where our staff
and students were researching day and night
for creating various products and inventions
of our own to help the fight against Corona.
So, it is heartening to note that in this year’s
conference, there are many research papers
reaching the conference secretariat, which
involve the student community of our nine
faculties.
Therefore, we are proud that we have
created a platform for emerging researchers
and scientists for showcasing their research
outcomes at KDU research conference. And it
is our fervent belief that inculcating and
fostering the research culture and enhancing
the quality and quantity of research in
various disciplines in the country can raise
the resilience levels of society and the nation
as a whole.
This year’s conference has attracted six
hundred and fifty plus paper submissions,
which I believe is a very clear indication of
the right enthusiasm growing in the country
towards research, particularly in
development and security domains. So we
are proud as a university to be able to stand
up resolutely to fulfill the needs of the nation,
especially at a time when such efforts are
very much needed. I believe the efforts of
security-based education aiming at
strengthening national development should
be more cooperative in the future and KDU
has always facilitated any research efforts
that strengthens the national security of our
nation. We urge the academic community of
Sri Lanka to join hands with us in all our
future endeavours to support the nation
especially through productive research in
diverse disciplines.
The organizers of the KDU international
research conference intend to set the tone to
initiate more collaborative research at
national and global levels. This research
conference is an ideal platform to make
connections. I hope that authors of KDU and
various other local and international
universities will take the opportunity to
interact and develop friendly relationships,
establish networks and to explore win-win
situations.
I wish all the very best for the presenters and
hope you will enjoy every moment of this
academic fusion taking place on two whole
days.
Finally, let me once again welcome our chief
guest and the keynote speaker on behalf of all
KDU staff. I wish that presenters and
participants would have all the courage to
continue their pursuits with determination
to link up with the international community
and work towards national growth and
development through their research.
Thank you.
13th International Research Conference
General Sir John Kotelawala Defence University
Allied Health Sciences Sessions
3
Chief Guest Speech
Prof. GL Peiris
Honourable Minister of Education, Government of Sri Lanka
Major General Milinda Peiris, Vice Chanceller
of the Sir John Kotelawala Defence University
of Sri Lanka, Admiral Professor Jayanath
Colombage, Secretary to the Ministry of
Foreign Affairs, Professor Kapila Perera,
Secretary to the Ministry of Education,
Deputy Vice Chancellors, Deans of Faculties,
Heads of Department, members of the staff
and students of this university, friends well
wishers, ladies and gentlemen. I am delighted
to be present with you on this occasion for
the 13th International Research Conference.
I am no stranger to these surroundings. I
have been consistently associated with your
work during the progress of your university
until you have reached the stature that we all
are proud of at this time. There is no doubt
that with the nine fully-fledged faculties that
you already have and your plans further to
expand this university particularly bearing in
mind the priorities of this country at this
moment. I am particularly happy about your
plans for the establishment of a Faculty of
Criminal Justice. I think that is certainly an
area that is worthy of focus and attention. So
you have always assessed, evaluated very
accurately the needs and priorities of our
country in the field of Higher Education. And
you have been very quick to respond to those
needs. That innovative approach is much to
be admired. And these are among the reasons
why I have particular pleasure in joining you
in these deliberations. There is one another
matter that I would like to mention. It is this
that you are having this conference for the
13th consecutive time. It is our experience in
this country that many good things are
planned and inaugurated. It is much more
difficult to follow through. So the fact that
you have been able to do this without
interruptions for 13 years adding to your
expertise as you go alone improving and
expanding towards what you are attempting.
It is greatly to be admired the sense of
perseverance and determination that is
greatly required in this country at this
moment and your performance is an
inspiring example of what we all need to
carry the country forward to even greater
heights.
Now the theme that you have chosen for this
13th International Conference is extremely
appropriate from many points of view. You
have heard representation from many
countries as Major General Milinda Peiris,
Vice Chancellor explained a moment ago. You
are holding this conference in exceedingly
challenging circumstances. Again you have
been to adapt to difficult circumstances.You
are resorting to modern technology to
include and involve foreign participants in
these deliberations even though they are
unable to present with us physically on this
occasion. The topic that you have chosen is
the holistic approach to national growth and
security. I think that is extremely relevant to
present day needs in Sri Lanka today.
The first point I would like to make is that
there is an intimate connection between
national growth and security. It is fanciful to
talk of any kind of national growth without
the assurance of security. Security is a
necessary and indispensable foundation.
Without security it is impossible to achieve
growth in any sector of the economy. The
celebrated Political Scientist the late
Professor Harold Laski of the London School
of Economics said that the basic duty of a
state is to provide security for its people.
That is the ultimate reason for the existence
of the nation state. The theory of the Social
13th International Research Conference
General Sir John Kotelawala Defence University
Allied Health Sciences Sessions
4
Contract which has been developed by
writers like Lock and Rousseau emphasizes
the fact that the public have given the
authority to state principally for the reason
to create conditions in which life can go on in
an orderly and frank manner so that the
citizens of that state can realize their fullest
potential as human beings, develop
themselves and develop the community in
which they live. In order to do this the
essential condition is security. Without it
nothing at all can be accomplished. Now we
have seen empirical evidence of this in the
recent past of our country through the 30-
year conflict with the Liberation Tigers of
Tamil Eelam. It was impossible to attract
substantial investment into this country.
Every facet of Sri Lanka’s economy suffered
grievously during that period. How can you
attract investors into a country which has
been thrown asunder by a ferocious war?
Investment, international trade all this was
affected by the ongoing conflict. I would also
like to make a reference to the concept of
reconciliation which became very relevant
and important after the end of the war in
2009. There was then naturally the feeling
that we have to leave the pain and anguish of
the war behind us. We have to emphasize
unity and the solidarity and bring together all
the people of our cherished land irrespective
of caste, creed, ethnic or religious identity to
emphasize the oneness of the nation. That
was the pith and substance of the concept of
reconciliation. But it all went wrong during
the Yahapalana administration of 2015 to
2019. And it is worth examining in an
objective spirit the reasons why that
endeavour failed so miserably. I think the
basic reason is that the authorities at that
time forgot the sentiments, the feelings and
aspirations of the majority community.
Reconciliation of course bases emphasis on
minority aspirations to make them
comfortable, to convey to them in definite
terms the impression, the conviction that
they are very much part of the country. They
belong, the sense of belonging so that
confidence should be imparted to minorities,
and at the same time, it is absolutely
necessary to carry the majority community
with you. If you lead them behind if you
engender in the lines of the majority
community that they are not important, they
can be sidelined, they do not matter, such an
exercise in reconciliation is doomed to
failure as empirical experience in those 4
years convincingly demonstrated. What
happened during that period? I think the
most alarming spectacle that we are seeing in
this country today is evidence that is
transpiring in daily basis before the
Presidential Commission that is going into
the catastrophic phenomenon of the Easter
Sunday Attack. Evidence has been given by
one witness after another, the Inspector
General of Police, the Secretary to President,
the Secretary of Defence, all these people.
Their evidence emphasizes the total
breakdown of this security apparatus in the
country. It is not mere debilitation or
weakening of security apparatus it was total
collapse of it. There was no security
apparatus functioning in this country at all in
any realistic sense. So it led to the loss of 265
valuable lives of this country and crippling of
many other citizens of our land. Why did this
happen?
When the present President, His Excellency
Gotabaya Rajapaksa was Secretary to the
Ministry of Defense, there was a very close
collaboration between the intelligence arm
and immigration. Whenever an application
was made by a foreign preacher somebody
who wants to come and teach in this country,
when visa was requested a very thorough
background check was done. As Admiral
Professor Jayanath Colombage would bear
witness the antecedent of the person
applying for the visa was thoroughly
examined. And if there was anything
unsavory in the past of that person, if he has
been involved in any activity which led to
13th International Research Conference
General Sir John Kotelawala Defence University
Allied Health Sciences Sessions
5
disharmony among communities, then the
immigration authority in close consultation
with the intelligence arm would turn down
such a request for visa in this country. That
whole apparatus was consciously and
deliberately dismantled. It did not happen
unwittingly or inadvertently. It was
deliberate government policy. So intelligence
personnel were made to feel that they were
in embarrassment. The less that heard from
them, the less they were seen the better. That
was the environment which prevailed at that
time.
Surely, if you are talking of national growth
and security, the first thing to ensure is that
funds that are coming from abroad had to be
brought into the country through proper
channels. We have in this country such an
established conduit. The conduit is the
External Resources Department of the
Central Bank of Sri Lanka. Of course
resources are welcome. But they must come
through the External Resources Department.
We must know the source, the origin of these
fundsand where are these funds coming
from? We must know the purpose for which
these resources are going to be applied, who
is going to manage these resources? There
must be an auditor accounts. All of these
were dispensed. You had a situation where a
university was built. What is the purpose for
a university to come up in Kattankudy. The
facilities, the buildings that are constructed,
they are better than the buildings that you
have here at the Kotelawala Defence
University. They are superior to the quality of
the infrastructure in the universities of
Colombo and Peradeniya. If you go to
Kattankudy blindfolded if the blindfold is
taken off when you get there, you will feel
that you were in the Middle East. The
Palmyra trees, the architecture the overall
environment. The sums of money involved
are colossal. There is no exposure, visibility
or accountability. It is that brought about a
situation that culminated in the total collapse
of this security establishment. Madrasas can
be all over the country. There are no Sunday
Schools. They are providing many of them on
daily basis. Nobody examines the curricula.
There is no regulatory mechanism at all. So
the seeds of racial hatred are sown by those
institutions. Of course there must be
freedom with regard to imparting
instruction. But clearly there must be some
supervision, some control, some regulation.
That was totally lacking. So the country then
paid the supreme price for the neglect of
security in pursuit of narrow and particent
and political objectives to placate aggressive
minorities, not law abiding members of
minority communities, but people who were
intent on the destruction of the very social
fabric of the country. So that was our sad
experience.
This is true not only within the country, but
also in the conduct of our foreign relations.
What happened there? Sri Lanka is unique
among the nations of this world in
committing to a resolution in 2015 in the UN
Human Rights Council. Sri Lanka became a
co-sponsor of a resolution in condemning its
own armed forces accusing its armed forces
of the gravest crimes under international law
and under the international humanitarian
law because the preamble to resolution 13/1
of the 1st of September 2015 acknowledged
with appreciation the report of the High
Commissioner for Human Rights. And the
High Commissioner’s report makes the most
damaging allegations against the armed
forces of this country. And the government of
Sri Lanka endorsed all of them and called for
a thorough investigation at the international
level. The resolution gave responsibility to
the Human Rights Council and to the
Commissioner for Human Rights to keep Sri
Lanka under constant review. So here was a
government which consciously, voluntarily,
deliberately submitted the country to
adjudication and assessment in respect of its
armed forces to international tribunals
13th International Research Conference
General Sir John Kotelawala Defence University
Allied Health Sciences Sessions
6
where justice considered the inanity of what
happened. There were pledges given. In
resolution 13/1 and 34/1 which are clearly
contrary to the highest law of this country,
the constitution of Sri Lanka operating para 6
of the first resolution 13/1 recommended
that foreign judges of Commonwealth and
other foreign judges should be entrusted
with the task of judging our armed forces and
of course, members of the civilian
population. This is not possible under Sri
Lanka’s constitution because foreigners
cannot exercise judicial power in respect of
our citizens. And then the High
Commissioner for Human Rights, Prince
Hussein publicly conceded that in respect no
other country has a Human Rights Council
based in Geneva adopted so intrusive
approach – so intrusive, interfering directly
with domestic policy in that country. To what
extent did this go? The resolutions involved
matters which are clearly within the domain
of the Sri Lanka’s parliament not the business
of foreigners. It called for constitutional
reform. It called for devolution of greater
powers to provincial councils. It called for
thorough overhaul of Sri Lanka’s armed
forces and the police. It called for the repeal
of the prevention of terrorism Act and its
replacement by alternative legislation.
Members of the Sri Lankan armed forces and
the Sri Lankan police force were to be
subjected to special criteria when they
applied to join UN Peacekeeping forces
abroad and even to enroll for programmes of
training. So this is the extent to which
national dignity and pride was compromised
in order to placate foreign interests whose
aims and objectives were incompatible with
the well-being of this nation.
So this attitude which destroyed the very
foundations of our national security
manifested itself both in respect to domestic
policy and the conduct of country’s foreign
relations during that period 2015 to 2019. In
such a situation you cannot possibly have
national growth. You cannot have economic
advancement because security has broken
down entirely.
Just one another point I want to make before
I conclude, and that is the reference to
militarization in the current political
discourse. Non-governmental organizations
and elements of the opposition as well as
some prejudiced and biased foreign
commentators are finding fault with the role
of the military in the conduct of national
affairs in Sri Lanka at this time. But no
objective observer of the Sri Lankan scene
can doubt the fact. When it came to the
control of COVID-19, this country could not
possibly have achieved what it did without
the vigorous involvement and cooperation of
the armed forces, particularly the
intelligence arm. We were able to control the
pandemic because the armed forces were
able to identify those who have been
infected, first the immediate circle and then
the outer periphery. That is still being done,
yesterday today it is being done. And the role
of the armed forces is indispensable. Without
them the situation would be far worse than it
is. Why is there this kind of hostile attitude
towards armed forces? I think people who
subscribe to that point of view failed to
distinguish between the culture of east and
west in this regard. Cultural attitudes,
assumptions and values are in critical
significance in this area. The attitude in this
country, the attitude of the public, of
ordinary people, to the armed forces is not
what prevails in some western countries. The
armed forces are not looked upon with fear.
They are not regarded as instruments of
oppression. On the contrary, after the war
ended in 2009, it is in effect the armed forces,
they got involved very intimately, very
vigorously in uplifting the social conditions
in the people affected in areas. They built
houses. They made water available. They
played a role in restoration of agriculture.
And I know personally because I have seen in
13th International Research Conference
General Sir John Kotelawala Defence University
Allied Health Sciences Sessions
7
my own eyes that armed forces of this
country even helped in the constructions of
latrines, of toilets in that part of the country.
These are not regular functions of the armed
forces. But because of the culture of our
country the social morals the value system
based upon empathy and compassion which
is the hallmark of Sri Lanka’s culture. That
was the nature of the role that was
performed by the Sri Lankan military. It is
this fundamental fact that is not taken into
account. In critiques of the present scene
who find fault with the armed forces forget
their involvement in national activity on
broader scale.
So these are some of the remarks that I would
like to make to you on this occasion. I am very
happy that you are having this 13th
International Research Conference. I am
very happy that you have chosen a topic that
is extremely appropriate. You have chosen a
more relevant topic for this time. As the
Minister of Education also with the
responsibility for higher education in this
country, I am very proud of the achievements
of your institution, what you have been able
to accomplish within so brief a time span.
The needs of higher education in this country
are very urgent when more people are
clammaering for access to higher education,
in our ministry, with the active system of
Professor Kapila Perera who is rendering a
yeoman service in that regard, we are trying
to bridge the gap between education and
employment opportunity. We are talking to
the major Chambers of Commerce they
provide the jobs in the private sector to
ascertain from them the employment
opportunities that will be available in their
institutions during next three or four years,
what are the skills which we are looking for?
Because they are telling me it is not that we
do not have jobs to offer. We have jobs. But
when we interview people we find that they
don’t have the skills which we want in our
institutions. So we don’t want to enhance a
reservoir of angry and frustrated young
people. We want to ensure that there is a co-
relation between the education that is
imparted in our institutions and the skills for
which there is an identifiable demand in the
market place. So these are some of the
adventures that we have embarked upon. We
are also looking critically at our curricula
which are obsolete and anachronistic. They
have not been revisited for a very long
period. There must be in line with the needs
of our society methods of teaching. There is
far too much emphasis on rote learning in
memory that students have required to
commit their notes to memory, retain in the
memory and reproduce it at the examination
that is antithetic of the education. Education
comes from Latin words ‘educate’ which is
draw out not to force in vast volume of actual
material into mind of the students. So
purpose of the education is to develop the
analytical and the critical faculty of the
student to encourage him or her to think for
himself or herself and apply that volume of
knowledge to face the challenges of life. So in
the midst of all of this, in confronting the
formidable challenges, I am very confident
that your institution, Sir John Kotelawala
Defence University will render an invaluable
service. So I congratulate to you on your
achievements of the past and I wish you well
for the future. I know that you will continue
to do your country proud. And I thank you
sincerely for the honour that you have
bestowed upon me by inviting me as the
Chief Guest for these deliberations.
Thank you
13th International Research Conference
General Sir John Kotelawala Defence University
Allied Health Sciences Sessions
8
Keynote Speech
Prof. Kapila Perera
Secretary, Ministry of Education, Government of Sri Lanka
Ayubowan! Wanakkam! Assalamu Alaikum!
The Vice Chancellor of General Sir John
Kotelawala Defence University, Major
General Milinda Peiris, the Chief Guest today
my honorable Minister, Ministry of
Education, honorable Professor G.L. Peiris,
Deputy Vice Chancellors, Deans of the
Faculties, Heads of the departments, the
Secretary to the Ministry of Foreign Affairs,
Professor Admiral Jayanath Colombage, all
the foreign participants who are joining this
13th International Research Conference at
KDU, all the presenters, moderators, session
chairs and all the distinguished invitees.
Thank you very much for inviting me to
deliver the Keynote Speech under the theme
‘Holistic Approach to National Growth and
Security.’ I am indeed honored and
privileged to be here having witnessed the
very first one 13 years ago, and it happened
to be General Milinda Peiris who was the Vice
Chancellor then as Major General and we
witnessed the presence of the Chief Guest as
the Ministry of Higher Education, Ministry of
Research and Technology.
I would like to start with this quote from the
Chief Guest, “We do not want to have a
reservoir of angry uncontented people.” I
was one who had gone through in 1971, of
course not in the country in 1988 -1989 and
then in then 1983 as a university student, and
many times during my academic career
where there were disruptions to education,
holding back the desire to fulfill or acquire
knowledge with my colleagues, peers and the
rest of the people due to the lack of security.
I know how I felt then as a student. I think I
was in grade 4 in 1971, and then in 1983 in
my second year at this very same premises,
the education of ours were disrupted. And
the feeling of those delays due to the lack of
security, and the Cheif Guest elaborated in
deep sense of comprehension how security is
important for the national growth. If I look at
what is this traditional approach that is often
based on defensive security policies as we
had during my time at different ages. We had
always defensive security policies. However,
the persistence of strong security measures
generates inecure feelings. I hope you agree
with me. If there are strong security
measures that generate insecure feeling as it
reveals the presence of threats. So these are
some of the things that people quote. Then
again the democracy, well-being and
freedom are some of the elements that we
feel that we reduce this feeling of insecurity
by reducing both threats and activities that
we feel. Even if you take a house if you feel
this insecureness due to lack of security this
might not allow you to think, generate
analytical skills. You are always worried
about the security. How to provide security
to your children and for yourself? And then it
hinders and it slows down entire process of
nurturing, acquiring knowledge. And then
that it is halting the growth. so you start from
the small households or individuals then if
you take as a whole family, a village, a
township and then provinces as a country, it
basically retards the national growth. So,
therefore, we need to have this thinking of
holistic approach to national growth and as
you and I understand there are necessary
and essential conditions when we learn
mathematics for certain things. The Cheif
Guest emphasized repeatedly the essential
elements and in our academic mathematics
there are sufficient and necessary conditions
or essential conditions for forming
mathematical theories there are certain
13th International Research Conference
General Sir John Kotelawala Defence University
Allied Health Sciences Sessions
9
things. Likewise, it is essential to have
security for national growth.
When it comes to economics, always and
even for decades, the GDP strongly criticizes
the measure of development. Still the role of
economic systems neglecting the goal of
global capabilities and expansion holds this
economic growth or national growth. But the
concession of development based on the
glorification of individual success and the
pushed capital accumulation hardly allows
reducing insecurity and increasing freedom.
So security becomes an individual good and
relies upon ineffective defensive policies that
we have practiced in the past unlike in the
present. So development, well-being,
security and freedom are strictly
interrelated. Individual capabilities imply
collective capabilities. Even in free market
economies often human needs such as food,
housing, employment, health care, family
policies, fresh water, security and safety can
be put in a market under regulation or
collective governance, and those things even
the Chief Guest highlighted. The need for
water, need for food, how the security-- food
security and water security ensure the
getting this national security when you
combine all these types of security the
national growth under war conditions. So
these goods are often under political debate
as they are critical for development and
social cohesion. The more they are shared
among the large part of the population the
less we experience social conflict and
political instability. Security hardly is
achievable individually. It is the result of
more holistic thinking. Individual security
and freedom implies the security and
freedom of all. As I mentioned before these
are interrelated. And if you look at or if you
study research and in future research all
these studies can help in understanding
human capabilities and pathways towards
collective security and enhance
development. So instances of participation in
definition of security needs would make
citizens able to feel at the center of
development goals. So therefore, unlike in
the past where we did not think holistically
and the interrelations between the security
and the national growth. Then we will fail.
Even the theories in the literature highlights
this one.
As far as Sri Lanka is concerned the
contemporary security concerns that we face
as an Indian Ocean country are broader and
more complex, that need not be elaborated,
than any state in our history. This will
continue to exist. We can’t say that this will
stop today, tomorrow, next year or in ten
years’ time because the geopolitics and the
race for the arms business and economic
development, all these things will continue to
grow, sometimes exponentialy. So therefore,
national security cannot be neglected and
cannot be just let it go as the Cheif Guest
mentioned, even in a fraction of a second, it is
very important. Otherwise there won’t be
any growth. As the Secretary to the
Education, in the present context the role
played by ensuring a secure environment for
the student to go and sit the examination.
They are not in a position to concentrate on
answering the questions if the place is not
secure. So if we are not able to hold the exams
and continue to postpone, then we cannot
achieve and we cannot predict national
growth. So in this context the role played by
the national security is to be commended as
the Ministry of Education. I know personally
the quick response to ensure secure
examination centers for all of us for the
future of Sri Lanka. Under these conditions
even the identification of COVID origin in the
recent past, you have to have peace of mind
to concentrate on everything. That is
basically if you only think of one place, one
center out of 2,646 examination centers, then
there will be lack of security in different
centers. So therefore, you have to think
holistically. Only the one aspect of securing
13th International Research Conference
General Sir John Kotelawala Defence University
Allied Health Sciences Sessions
10
one place will not enable for us to continue
this one and therefore the results will come
in future in terms of national growth. So the
range that concerns arise from threats to
system that allows society to control
intergroup and interpersonal conflict to
more recently reorganized concerns
associated with threats to social and
economic systems. Once these events start to
influence the policy and the economy of a
country with a national resilience, that
country will perish. One way of addressing
this emerging situation is by promoting more
and more research and development.
KDU, boasting with diverse nine faculties and
through two new faculties to come, the
Faculty of Criminal Law and the Faculty of
Technology, is going to expand and provide
opportunities and platforms for you to think,
ponder in a military environment and
inviting day-scholars giving the signal that is
very important for you to mix each other
understand the role of the military or
security for the civilians, 22 million people in
this country, how important the national
security and the training in a military set up
to achieve the common goal of national
growth. So the KDU is at the forefront of
researching the development and security
related problems holistically. A holistic
approach is needed to understand
contemporary complex situations and
circumstances. University education could
inculcate co-values of security and
development such as human dignity,
integrity, democratic participation,
sustainable development, economic equity,
mutual understanding and respect and
equality of opportunity. The three flags that
are behind bring all three forces together,
thanks to the KDA then, and how important
this mutual understanding in the war was
understood and it helped to coordinate
things in a better manner. You trained officer
cadets together and they understand the
security roles in the air, at sea, on land. I am
sure that it could have been the catalyst then.
Now you bring the third aspect the day-
scholars. So this is holistic thinking. Like I
started at the beginning it was not there then.
We had three academies that did not know
each other, but how had it come during the
time when the national security was at risk.
So ultimately the beneficiary is national
growth. The honorable Minister, the Cheif
Guest mentioned how difficult it was for Sri
Lanka to attract foreign direct investments.
As I think Minister of Enterprise
Development, Foreign Minister, Foreign
Secretary. If you don’t have security and
thrust, nobody would come. But when you
train together military and civilians with
hand and hand, it would provide an ideal
platform. The importance of civil-military
relations and how KDU is instrumental in
developing the above mentioned areas is to
be commended. By promoting civil-military
relations through education, a country could
raise the resilience levels, like I mentioned, of
communities. Honorable Minister spoke at
length and elaborated that you have to have
a strong commitment and the political will to
ensure the security of this country. If these
elements, instruments fail, the first thing that
is going to effect is the education of the future
generations. Even for me, the Oxford
graduate, Rohdes scholar, I am a pupil. And
this has provided opportunities and the
responsibility to the government to ensure
the security. So all spheres of activity will
simultaneously grow ultimately culminating
in national growth.
These are the few thoughts that I have to
share with you. I would like to extend my
gratitude on behalf of the Ministry of
Education for having me and inviting me to
deliver the Keynote address and set the
platform for the next two day deliberations.
And I wish all the success in the deliberations
and creating more networks and have future
directions for years to come in this context of
national security that you have chosen today.

13th International Research Conference
General Sir John Kotelawala Defence University
Allied Health Sciences Sessions
11
Whatever that you are going to do, base
national security at the forefront. So divided
we lose together we win. And I wish all the
very best and thank you very much for all the
participants and the people who have
submitted papers, presenters, moderators,
and session chairs. You are plying a very
important role in this context of national
security and the national growth.
Thank you very much!
13th International Research Conference
General Sir John Kotelawala Defence University
Allied Health Sciences Sessions
12
Vote of Thanks
Dr. L Pradeep Kalansooriya
Conference Chair, 13th International Research Conference,
General Sir John Kotelawala Defence University
It is with deep appreciation and gratitude
that I present this vote of thanks on behalf of
the organizing committee of the 13th
International Research Conference of the
General Sir John Kotelawala Defence
University.
First of all, I convey my heartiest thanks to
Professor G.L. Peiris the Minister of
Education, a distinguished academic who
spared his valuable time with us on this
occasion. Sir, your gracious presence amidst
busy schedules is truly an encouragement
and it certainly added the glamour and value
to this important event.
Professor Kapila Perera, the Secretary to the
ministry of Education, also a distinguishable
academic and a senior military officer is a
proud product from our own institute. Sir, I
greatly appreciate your willingness without
any hesitation to be our Keynote speaker
today.
I would also like to take this opportunity to
extend my appreciation and gratitude to the
Vice Chancellor, Maj. General Milinda Peiris
for all his guidance and assistance provided
throughout the event and this event wouldn’t
have been a reality and a great success
without your courageous leadership under
the current challenging situation today.
I would be falling my duties if I don’t mention
the exceptional support and assistance
provided by the two Deputy Vice Chancellors
who were there behind the team guiding us
through a difficult time. I also would like to
thank the Deans of all the faculties who
shared the responsibilities and guided their
staff amidst their very busy schedules.
This year’s conference has attracted six
hundred and fifty plus paper submissions,
which is a very clear indication of the right
enthusiasm growing in the country towards
research, particularly in development and
security domains. I take this opportunity to
thanks all authors share their studies on
National Growth and Security in our
conference. I also greatly appreciate our
panel of reviewers on the valuable time spent
to review this large number of papers. I’m
sure that your valuable resnses would
tremendeously supports to authors on
enhancing their research studies.
Ladies and Gentlemen, as you witnessed, this
was a new experience in the new normal,
after the present pandemic, and therefore it
was huge challenge to organize, coordinate
and conduct research conference of this
magnitude on virtual platform enabling a
wider participation of both local and foreign
participants. I thank all our participants
attending the conference online despite
numerous difficulties encountered due to the
present situation.
Further, it is with great pleasure that I
acknowledge the tremendous support and
assistance provided by academic staff of all
the faculties with all the Heads of
Departments going beyond their regular
duties to make this event a success. Similarly,
I take this opportunity to appreciate the
contribution of the administrative and non-
academic staff whose commitment was
essentially required in achieving the overall
success.
Our sponsors, the financial support given by
our Platinum Sponsors, People’s Bank and
13th International Research Conference
General Sir John Kotelawala Defence University
Allied Health Sciences Sessions
13
Bank of Ceylon and Co-sponsor, Abans
Private Limited is highly appreciated.
Last but not least the officer cadets and day
scholars who formed a very virtual
component of the organizing teams in every
sphere and I believe that it was a great
learning experience and exposure which
would help them tremendously in similar
undertakings in the future.
Finally, I have no doubt that all of those
attending the two days seminar will make the
best use of the opportunity to enhance their
horizons and establish new bonds and
networking while sharing their own
knowledge and experience in a friendly
learning environment.
In conclusion, let me take this opportunity to
profusely thank my co secretaries, who stood
alongside me throughout extending
unexplainable support and assistance with
exceptional commitment.
Thank you so much. I wish you good luck and
all the best.
13th International Research Conference
General Sir John Kotelawala Defence University
Allied Health Sciences Sessions
14
T
Technical Sessions
13th International Research Conference
General Sir John Kotelawala Defence University
Allied Health Sciences Sessions
15
Multiple Intelligence and Academic Performance among BSc.
Nursing Undergraduates in Kotelawala Defence University, Sri
Lanka; A Correlational Study
WGC Kumara1#, KGG Priyangika1, WS Sudusinghe2
1Faculty of Allied Health Sciences, KDU, Sri Lanka 2Faculty of Graduate Studies (MA Candidate), University of Kelaniya, Sri Lanka
Abstract: Multiple Intelligence (MI) is a major
determinant of academic performance among
undergraduates. A descriptive correlational
study was conducted to assess the types of MIs
and to determine the correlation between MI
and Academic performance among BSc. Nursing
Undergraduates of four academic years in
Kotelawala Defence University. The McKenzie’s
MI Inventory was used to assess the types of MI
while the Semester Grade Point Average (SGPA)
was used as the measure of academic
performance. The Pearson Correlation was used
to evaluate the correlation between MI and
Academic Performance, and one-way ANOVA
was used to assess the mean differences of MI
among batches. The response rate of the
participants was 69.6% (n=126), and the mean
(±SD) age of the participants was 23.65 (±3.82)
years. When considering the mean (±SD) values
of MI, Interpersonal Intelligence scored the
highest (7.94±2.24), and Verbal Intelligence
scored the lowest (6.51±2.23). Naturalistic (p=
0.000), Musical (p=0.041), Existential (p=0.026)
and Visual (p=0.022) intelligences had
significant mean differences among the four
batches. There was no significant correlation
between SGPA and types of MIs among first- and
second-year undergraduates. However, SGPA of
third-year undergraduates had a significant
positive correlation with Interpersonal
intelligence (p= 0.045, r=0.422) and significant
negative correlation with Intrapersonal
Intelligence (p=0.018, r=-0.488). Further, SGPA
of fourth-year undergraduates had a significant
positive correlation with Naturalistic (p=0.041,
r=0.404) and Existential (p=0.008, r=0.512)
intelligences. It was recommended to make
nursing undergraduates aware regarding their
MIs and do necessary changes in the nursing
curricula and to evaluate its effectiveness in
future research.
Keywords: Multiple Intelligence, Academic
Performance, Nursing Undergraduates
Introduction
In the twentieth century, the traditional
education system was revolutionized with the
increasing significance given to the learner-
centred mechanism of teaching (Bakić-Mirić,
2010). Nurse educators try their best to create
learning opportunities that are interactive and
applicable to the requirements of various
students (Amerson, 2006). However, it is
identified that the academic performance of the
students is dependent upon several
determinants, including MI (Hernandez Suarez
et al., 2019).
Intelligence can be defined as a general mental
ability for reasoning, problem-solving, and
learning and it mixes various cognitive
functions, such as perception, attention,
memory, and language (Colom et al.). According
to Gardner (Gardner, 1983), intelligence cannot
be termed as general intelligence, and it is
multifactorial. As per the Multiple intelligence
theory, every person possesses the capacity for
all the nine dimensions of intelligence such as
linguistic, mathematical, Spatial Intelligence,
Bodily-Kinesthetic Intelligence, Naturalist
Intelligence, Interpersonal Intelligence, Musical
Intelligence and Intrapersonal Intelligence
(Sternberg, 2012).
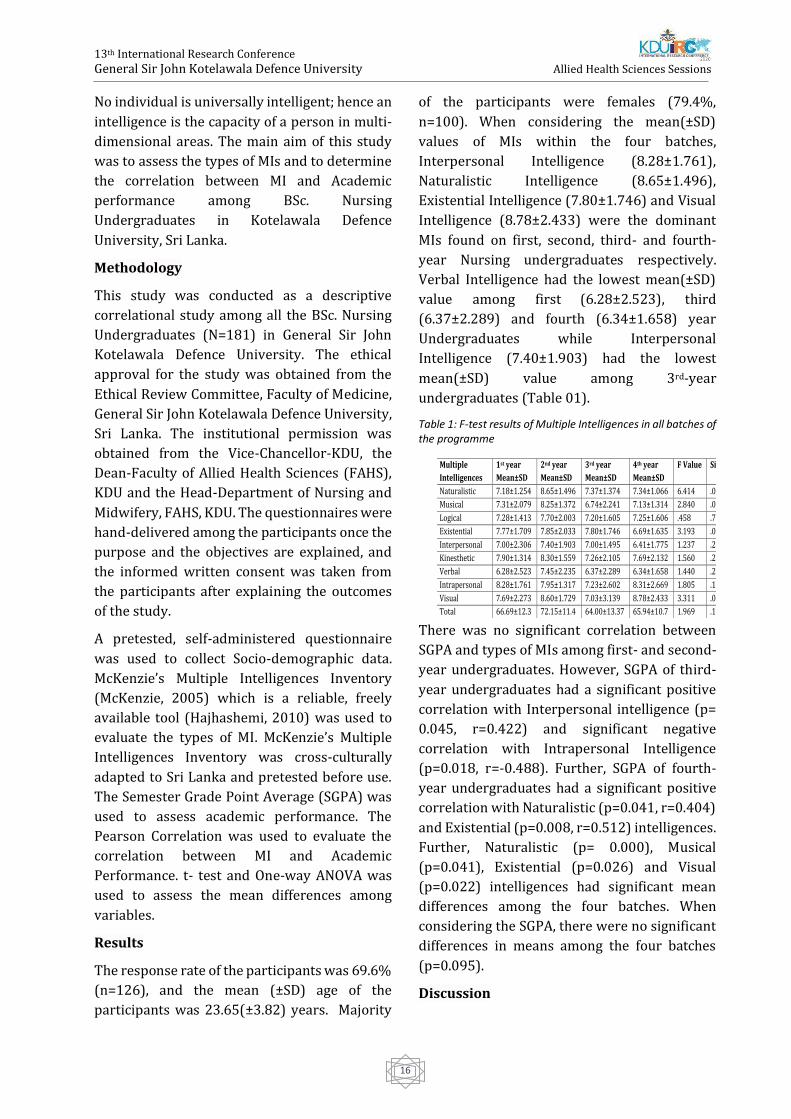
13th International Research Conference
General Sir John Kotelawala Defence University
Allied Health Sciences Sessions
16
No individual is universally intelligent; hence an
intelligence is the capacity of a person in multi-
dimensional areas. The main aim of this study
was to assess the types of MIs and to determine
the correlation between MI and Academic
performance among BSc. Nursing
Undergraduates in Kotelawala Defence
University, Sri Lanka.
Methodology
This study was conducted as a descriptive
correlational study among all the BSc. Nursing
Undergraduates (N=181) in General Sir John
Kotelawala Defence University. The ethical
approval for the study was obtained from the
Ethical Review Committee, Faculty of Medicine,
General Sir John Kotelawala Defence University,
Sri Lanka. The institutional permission was
obtained from the Vice-Chancellor-KDU, the
Dean-Faculty of Allied Health Sciences (FAHS),
KDU and the Head-Department of Nursing and
Midwifery, FAHS, KDU. The questionnaires were
hand-delivered among the participants once the
purpose and the objectives are explained, and
the informed written consent was taken from
the participants after explaining the outcomes
of the study.
A pretested, self-administered questionnaire
was used to collect Socio-demographic data.
McKenzie’s Multiple Intelligences Inventory
(McKenzie, 2005) which is a reliable, freely
available tool (Hajhashemi, 2010) was used to
evaluate the types of MI. McKenzie’s Multiple
Intelligences Inventory was cross-culturally
adapted to Sri Lanka and pretested before use.
The Semester Grade Point Average (SGPA) was
used to assess academic performance. The
Pearson Correlation was used to evaluate the
correlation between MI and Academic
Performance. t- test and One-way ANOVA was
used to assess the mean differences among
variables.
Results
The response rate of the participants was 69.6%
(n=126), and the mean (±SD) age of the
participants was 23.65(±3.82) years. Majority
of the participants were females (79.4%,
n=100). When considering the mean(±SD)
values of MIs within the four batches,
Interpersonal Intelligence (8.28±1.761),
Naturalistic Intelligence (8.65±1.496),
Existential Intelligence (7.80±1.746) and Visual
Intelligence (8.78±2.433) were the dominant
MIs found on first, second, third- and fourth-
year Nursing undergraduates respectively.
Verbal Intelligence had the lowest mean(±SD)
value among first (6.28±2.523), third
(6.37±2.289) and fourth (6.34±1.658) year
Undergraduates while Interpersonal
Intelligence (7.40±1.903) had the lowest
mean(±SD) value among 3rd-year
undergraduates (Table 01).
Table 1: F-test results of Multiple Intelligences in all batches of the programme
There was no significant correlation between
SGPA and types of MIs among first- and second-
year undergraduates. However, SGPA of third-
year undergraduates had a significant positive
correlation with Interpersonal intelligence (p=
0.045, r=0.422) and significant negative
correlation with Intrapersonal Intelligence
(p=0.018, r=-0.488). Further, SGPA of fourth-
year undergraduates had a significant positive
correlation with Naturalistic (p=0.041, r=0.404)
and Existential (p=0.008, r=0.512) intelligences.
Further, Naturalistic (p= 0.000), Musical
(p=0.041), Existential (p=0.026) and Visual
(p=0.022) intelligences had significant mean
differences among the four batches. When
considering the SGPA, there were no significant
differences in means among the four batches
(p=0.095).
Discussion
Multiple
Intelligences
1st year
Mean±SD
2nd year
Mean±SD
3rd year
Mean±SD
4th year
Mean±SD
F Value Sig.
Naturalistic 7.18±1.254 8.65±1.496 7.37±1.374 7.34±1.066 6.414 .000
Musical 7.31±2.079 8.25±1.372 6.74±2.241 7.13±1.314 2.840 .041
Logical 7.28±1.413 7.70±2.003 7.20±1.605 7.25±1.606 .458 .712
Existential 7.77±1.709 7.85±2.033 7.80±1.746 6.69±1.635 3.193 .026
Interpersonal 7.00±2.306 7.40±1.903 7.00±1.495 6.41±1.775 1.237 .299
Kinesthetic 7.90±1.314 8.30±1.559 7.26±2.105 7.69±2.132 1.560 .203
Verbal 6.28±2.523 7.45±2.235 6.37±2.289 6.34±1.658 1.440 .234
Intrapersonal 8.28±1.761 7.95±1.317 7.23±2.602 8.31±2.669 1.805 .150
Visual 7.69±2.273 8.60±1.729 7.03±3.139 8.78±2.433 3.311 .022
Total 66.69±12.3 72.15±11.4 64.00±13.37 65.94±10.7 1.969 .122
13th International Research Conference
General Sir John Kotelawala Defence University
Allied Health Sciences Sessions
17
Modern context reveals that the process of
assessing the students’ MI and applying them in
the teaching methodology as an essential
technique in improving the learning (Sternberg
et al., 2008). Grounded upon the above
discrepancy and as a means to building upon the
critical discourse, this study was conducted to
test the hypotheses that there is no relationship
between Nursing undergraduates’ academic
performance with their MI types. Further, the
results of the research bring into line with the
previous research (Yaghoob and Hossein, 2016)
specified that every individual possesses
diverse types of intelligence with different
levels of each. Further, Interpersonal
Intelligence had the highest mean score, and
verbal intelligence had the lowest mean score
when considering the MIs among all the BSc.
Nursing Undergraduates. Having a dominant
Interpersonal intelligence is essential since it
will support the students to gain educational
experience by working with the patients, staff
nurses and other professionals. A similar study
conducted in Iran among medical, nursing and
midwifery students stated that the nursing
students had a highest in the existential
intelligence and scored lowest in the musical
Intelligence (Poursaberi and Mohammadi,
2017).
Most of the MIs had no significant correlations
with SGPA except the negative correlation found
with Interpersonal Intelligence. A similar study
conducted in Zambia also found that MI types
showed no significant relationship with
academic performance (Katowa-Mukwato et al.,
2017). However, a study conducted among
medical, nursing and midwifery students in Iran
suggested that verbal Intelligence and
existential Intelligence are associated with the
students’ academic performance with a
statistical significance (Poursaberi and
Mohammadi, 2017).
Conclusion
In this study, the relationship of academic
performance with the types of MIs was
evaluated and found significant results.
Continuous assessment of MIs of the Nursing
undergraduates should be planned, and
relevant changes in the nursing curricula should
be made accordingly. Further, experimental
studies regarding MI should be implemented to
evaluate the effectiveness of new teaching
interventions.
References
Amerson, R., 2006. Energizing the nursing lecture:
Application of the Theory of Multiple Intelligence
Learning. Nurs Educ Perspect 27, 194–196.
Bakić-Mirić, N., 2010. Implementation of Multiple
Intelligences Theory in the English Language Course
Syllabus at the University of Niš Medical School. Srp
Arh Celok Lek. 6.
Colom, R., Karama, S., Jung, R.E., Haier, R.J., 2010.
Human intelligence and brain networks. Dialogues
Clin Neurosci 12, 489–501.
Gardner, H., 1983. Frames of mind: the theory of
multiple intelligences. Basic Books, New York.
Hajhashemi, K., 2010. Intelligences Inventory to
Measure Profiles of Pre-University 18, 13.
Hernandez Suarez, C.A., Núñez, R., Rincón, G., 2019.
Multiple intelligences and academic performance in
basic education students: An analysis of main
components. Journal of Physics: Conference Series
1388, 012047. https://doi.org/10.1088/1742-
6596/1388/1/012047
Katowa-Mukwato, P., Chapima, F., Nambala-
Sianchapa, B., Mwiinga-Kalusopa, V., 2017. Learning
styles and intelligence types versus academic
performance of nursing students of the University of
Zambia. Journal of Nursing Education and Practice 7,
83. https://doi.org/10.5430/jnep.v7n10p83
McKenzie, W., 2005. Multiple Intelligences and
Instructional Technology. ISTE (Interntl Soc Tech
Educ.
Poursaberi, R., Mohammadi, M.M., 2017. Gardner’s
Multiple-Intelligences Profile and Its Relationship
with Academic Performance (Students of Tabriz
University of Medical Sciences/Academic Year 2014-
2015). Future of Medical Education Journal 7, 29–33.
https://doi.org/10.22038/fmej.2017.25077.1157
Sternberg, R.J., 2012. Intelligence. Dialogues Clin
Neurosci 14, 19–27.

13th International Research Conference
General Sir John Kotelawala Defence University
Allied Health Sciences Sessions
18
Sternberg, R.J., Grigorenko, E.L., Zhang, L.-F., 2008.
Styles of Learning and Thinking Matter in Instruction
and Assessment. Perspect Psychol Sci 3, 486–506.
https://doi.org/10.1111/j.1745-6924.2008.00095.x
Yaghoob, R.A., Hossein, Z.P., 2016. The correlation of
multiple intelligences for the achievements of
secondary students. Educ. Res. Rev. 11, 141–145.
https://doi.org/10.5897/ERR2015.2532
13th International Research Conference
General Sir John Kotelawala Defence University
Allied Health Sciences Sessions
19
Quantitative Analysis of the Additional Radiation Burden due to
Electronic Collimation in Digital Radiography
DM Satharasinghe1,2#, WMNMB Wanninayake2, AS Pallewatte3 and J Jeyasugiththan1
1Department of Nuclear Science, Faculty of Science, University of Colombo, Sri Lanka. 2Horizon Campus, Malabe, Sri Lanka.
3Department of Radiology, National Hospital of Sri Lanka
Abstract: In recent years, the conventional
film-screen radiography technique is replaced
with the novel invention of digital radiography.
This digital technology provides prompt image
readout with reduced radiation exposure. The
image can be post processed to adjust the
spatial resolution and contrast. However, the
inappropriate use of the background masking
tool during post processing degrades the
outcomes of the digital technology. Although
this tool is intended to eliminate the ambient
light around an image to improve the quality of
the displayed image, contrary it is used as a
substitute for insufficient pre-exposure
collimation of the irradiated field resulting in
unnecessary overexposure. The present study
aimed at evaluating additional radiation dose
due to electronic cropping in digital
radiography facility for the first time in Sri
Lanka. A sample of 194 X-ray images under
nine different projections was evaluated and
the average areas of pre and post-exposure
collimation were measured. The difference of
the mean areas was calculated and presented
as a percentage of the area of the whole
radiation field. The percentage of overexposed
area due to improper collimation was found to
be over 50% in cervical spine, shoulder and
sinus projections (in 44.4% of study sample).
The lateral projection of cervical spine showed
the highest overexposed percentage (55%).
Therefore, it is within the scope of practice of a
radiologic technologist to use appropriate pre-
exposure collimation. The electronic masking
should be only utilized to eliminate the
interfering brightness in the image and the
technologists should be clinically competent to
adopt the above concept.
Keywords: Electronic collimation, Digital
Radiography, Background masking, Radiation
exposure.
Introduction:
Almost after 90 years of the invention of X-rays
by Roentgen, a new era of radiography began
with the transition of film-screen to digital
radiography in 1987. Following this enormous
invention of Computed Radiography (CR) by
Fuji, film-screen system became obsolete.
Almost two decades after the introduction of
CR, a new technology launched with the label
“Digital Radiography
(DR)”. This technique facilitates the digital
achieving of the radiographic image with
enhanced image quality. Moreover, the
radiation dose can reduced without
compromising the image quality due to its
digital detector system [1].
However, DR also has potential drawbacks
where the operator should pay extreme
attention to avoid unnecessary over exposure.
Although the dynamic range provides benefits
during under exposure to provide a viewable
image, with over exposures the amount of
radiation delivered to the patient will be ten or
more times higher before the occurrence of
signal saturation and loss of information. This
would happen without the knowledge of the
operator [2]. Moreover, the capability of
electronic post processing and collimation of
under collimated images are another potential
pitfall. Accordingly, the electronic collimation
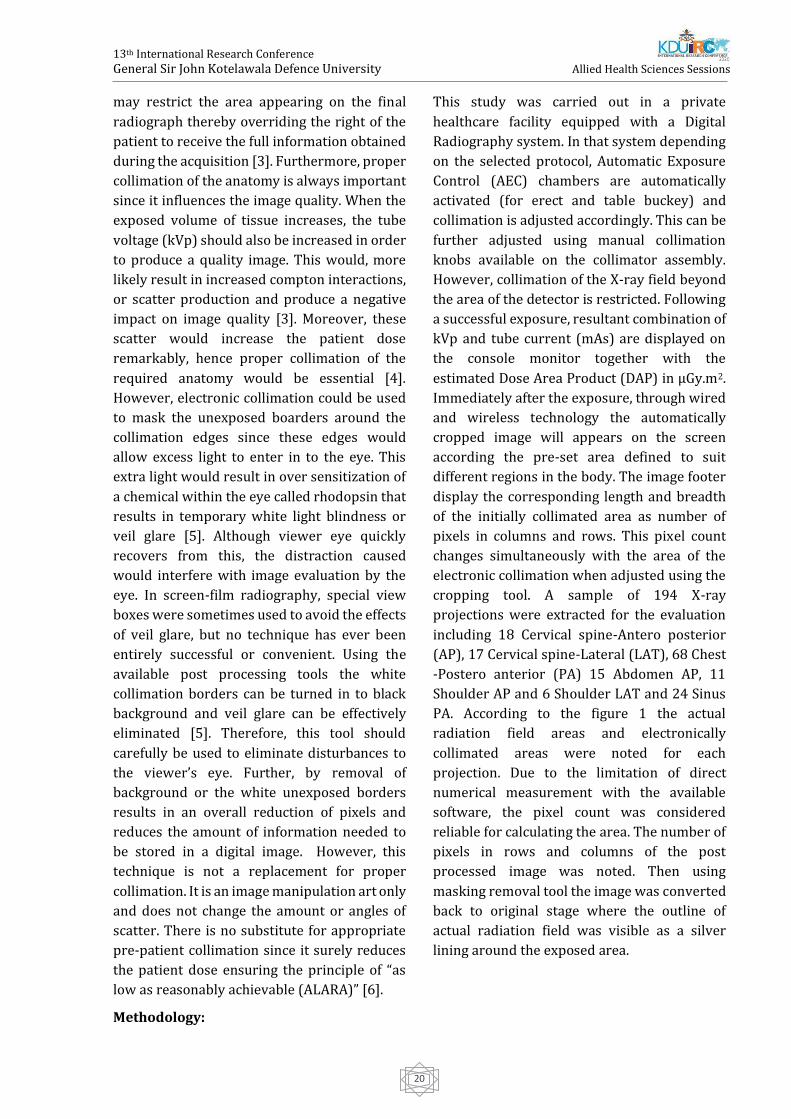
13th International Research Conference
General Sir John Kotelawala Defence University
Allied Health Sciences Sessions
20
may restrict the area appearing on the final
radiograph thereby overriding the right of the
patient to receive the full information obtained
during the acquisition [3]. Furthermore, proper
collimation of the anatomy is always important
since it influences the image quality. When the
exposed volume of tissue increases, the tube
voltage (kVp) should also be increased in order
to produce a quality image. This would, more
likely result in increased compton interactions,
or scatter production and produce a negative
impact on image quality [3]. Moreover, these
scatter would increase the patient dose
remarkably, hence proper collimation of the
required anatomy would be essential [4].
However, electronic collimation could be used
to mask the unexposed boarders around the
collimation edges since these edges would
allow excess light to enter in to the eye. This
extra light would result in over sensitization of
a chemical within the eye called rhodopsin that
results in temporary white light blindness or
veil glare [5]. Although viewer eye quickly
recovers from this, the distraction caused
would interfere with image evaluation by the
eye. In screen-film radiography, special view
boxes were sometimes used to avoid the effects
of veil glare, but no technique has ever been
entirely successful or convenient. Using the
available post processing tools the white
collimation borders can be turned in to black
background and veil glare can be effectively
eliminated [5]. Therefore, this tool should
carefully be used to eliminate disturbances to
the viewer’s eye. Further, by removal of
background or the white unexposed borders
results in an overall reduction of pixels and
reduces the amount of information needed to
be stored in a digital image. However, this
technique is not a replacement for proper
collimation. It is an image manipulation art only
and does not change the amount or angles of
scatter. There is no substitute for appropriate
pre-patient collimation since it surely reduces
the patient dose ensuring the principle of “as
low as reasonably achievable (ALARA)” [6].
Methodology:
This study was carried out in a private
healthcare facility equipped with a Digital
Radiography system. In that system depending
on the selected protocol, Automatic Exposure
Control (AEC) chambers are automatically
activated (for erect and table buckey) and
collimation is adjusted accordingly. This can be
further adjusted using manual collimation
knobs available on the collimator assembly.
However, collimation of the X-ray field beyond
the area of the detector is restricted. Following
a successful exposure, resultant combination of
kVp and tube current (mAs) are displayed on
the console monitor together with the
estimated Dose Area Product (DAP) in µGy.m2.
Immediately after the exposure, through wired
and wireless technology the automatically
cropped image will appears on the screen
according the pre-set area defined to suit
different regions in the body. The image footer
display the corresponding length and breadth
of the initially collimated area as number of
pixels in columns and rows. This pixel count
changes simultaneously with the area of the
electronic collimation when adjusted using the
cropping tool. A sample of 194 X-ray
projections were extracted for the evaluation
including 18 Cervical spine-Antero posterior
(AP), 17 Cervical spine-Lateral (LAT), 68 Chest
-Postero anterior (PA) 15 Abdomen AP, 11
Shoulder AP and 6 Shoulder LAT and 24 Sinus
PA. According to the figure 1 the actual
radiation field areas and electronically
collimated areas were noted for each
projection. Due to the limitation of direct
numerical measurement with the available
software, the pixel count was considered
reliable for calculating the area. The number of
pixels in rows and columns of the post
processed image was noted. Then using
masking removal tool the image was converted
back to original stage where the outline of
actual radiation field was visible as a silver
lining around the exposed area.
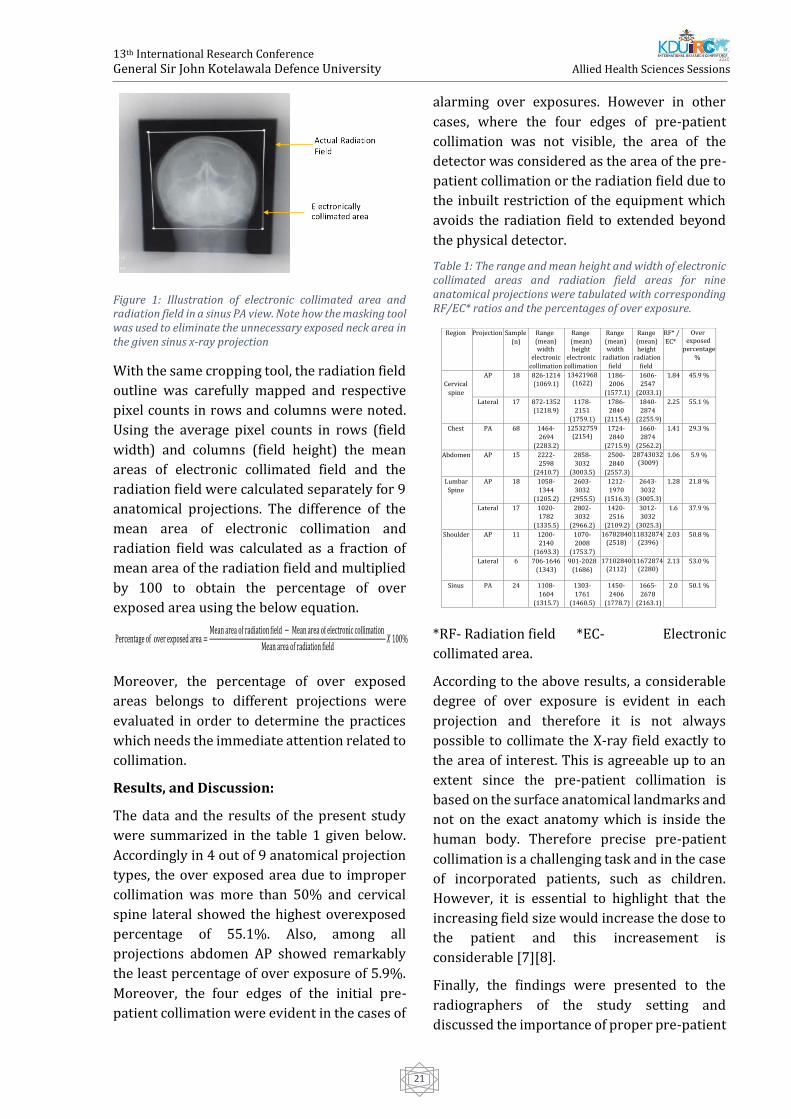
13th International Research Conference
General Sir John Kotelawala Defence University
Allied Health Sciences Sessions
21
Figure 1: Illustration of electronic collimated area and radiation field in a sinus PA view. Note how the masking tool was used to eliminate the unnecessary exposed neck area in the given sinus x-ray projection
With the same cropping tool, the radiation field
outline was carefully mapped and respective
pixel counts in rows and columns were noted.
Using the average pixel counts in rows (field
width) and columns (field height) the mean
areas of electronic collimated field and the
radiation field were calculated separately for 9
anatomical projections. The difference of the
mean area of electronic collimation and
radiation field was calculated as a fraction of
mean area of the radiation field and multiplied
by 100 to obtain the percentage of over
exposed area using the below equation.
Moreover, the percentage of over exposed
areas belongs to different projections were
evaluated in order to determine the practices
which needs the immediate attention related to
collimation.
Results, and Discussion:
The data and the results of the present study
were summarized in the table 1 given below.
Accordingly in 4 out of 9 anatomical projection
types, the over exposed area due to improper
collimation was more than 50% and cervical
spine lateral showed the highest overexposed
percentage of 55.1%. Also, among all
projections abdomen AP showed remarkably
the least percentage of over exposure of 5.9%.
Moreover, the four edges of the initial pre-
patient collimation were evident in the cases of
alarming over exposures. However in other
cases, where the four edges of pre-patient
collimation was not visible, the area of the
detector was considered as the area of the pre-
patient collimation or the radiation field due to
the inbuilt restriction of the equipment which
avoids the radiation field to extended beyond
the physical detector.
Table 1: The range and mean height and width of electronic collimated areas and radiation field areas for nine anatomical projections were tabulated with corresponding RF/EC* ratios and the percentages of over exposure.
*RF- Radiation field *EC- Electronic
collimated area.
According to the above results, a considerable
degree of over exposure is evident in each
projection and therefore it is not always
possible to collimate the X-ray field exactly to
the area of interest. This is agreeable up to an
extent since the pre-patient collimation is
based on the surface anatomical landmarks and
not on the exact anatomy which is inside the
human body. Therefore precise pre-patient
collimation is a challenging task and in the case
of incorporated patients, such as children.
However, it is essential to highlight that the
increasing field size would increase the dose to
the patient and this increasement is
considerable [7][8].
Finally, the findings were presented to the
radiographers of the study setting and
discussed the importance of proper pre-patient
Percentage of over exposed area =Mean area of radiation field − Mean area of electronic collimation
Mean area of radiation field𝑋 100%
Region Projection Sample
(n)
Range (mean) width
electronic
collimation
Range (mean) height
electronic
collimation
Range (mean) width
radiation
field
Range (mean) height
radiation
field
RF* /
EC*
Over exposed
percentage
%
Cervical
spine
AP
18 826-1214
(1069.1)
13421968 (1622)
1186-
2006
(1577.1)
1606-
2547
(2033.1)
1.84 45.9 %
Lateral 17 872-1352
(1218.9)
1178-
2151
(1759.1)
1786-
2840
(2115.4)
1840-
2874
(2255.9)
2.25 55.1 %
Chest PA 68 1464-
2694
(2283.2)
12532759 (2154)
1724-
2840
(2715.9)
1660-
2874
(2562.2)
1.41 29.3 %
Abdomen AP 15 2222-
2598
(2410.7)
2858-
3032
(3003.5)
2500-
2840
(2557.3)
28743032 (3009)
1.06 5.9 %
Lumbar
Spine
AP 18 1058-
1344
(1205.2)
2603-
3032
(2955.5)
1212-
1970
(1516.3)
2643-
3032
(3005.3)
1.28 21.8 %
Lateral 17 1020-
1782
(1335.5)
2802-
3032
(2966.2)
1420-
2516
(2109.2)
3012-
3032
(3025.3)
1.6 37.9 %
Shoulder AP 11 1200-
2140
(1693.3)
1070-
2008
(1753.7)
16782840 (2518)
11832874 (2396)
2.03 50.8 %
Lateral 6 706-1646
(1343)
901-2028
(1686)
17102840 (2112)
11672874 (2280)
2.13 53.0 %
Sinus PA 24 1108-
1604
(1315.7)
1303-
1761
(1460.5)
1450-
2406
(1778.7)
1665-
2678
(2163.1)
2.0 50.1 %
13th International Research Conference
General Sir John Kotelawala Defence University
Allied Health Sciences Sessions
22
collimation instead of post processing
electronic cropping. All of them agreed with the
findings and conclusions of the present study.
Hence, they noticed the urgent requirement to
optimize the current practice of pre patient
collimation in order to reduce the radiation
dose to the patient. Here after the term “over
exposed “in this context is referred to as the
unnecessary exposed area due to poor
collimation practices.
Conclusion:
The main purpose of this study was to provide
evidence to support the existence of potential
over exposure in digital systems due to the
electronic collimation. Therefore, special
attention is required to avoid suboptimal
collimation practices and pre-patient
collimation should be used in maximum effort
in all cases unless otherwise not possible to do
so. Furthermore, shuttering should only be
used as a post processing tool to mask the
ambient light around an image for improving
the quality of the displayed image. It should not
be used as a substitute for insufficient
collimation of the irradiated field. Also, it
should not be used to alter the appearance of an
obtained projection or to reproduce a different
projection. Moreover, the appropriate
determination and use of pre-exposure
collimation is an important role of the
radiologic technologist to comply with ALARA.
Accordingly, continuous training related to
collimation practice and radiation protection is
essential for radiologic technologists to ensure
the best collimation practices and to eliminate
misconducts. Furthermore, evaluation of the
collimation practices should be conducted as a
part of the quality audit by the relevant
authorities to ensure optimization of the
radiation protection within the country. Also, in
future a follow-up will be done in order to
evaluate the impact of the study findings on the
current collimation practices and to study its
influence on the reduction of the patient dose.
Acknowledge: This study was supported by
the by the project “Accelerating Higher
Education Expansion and Development
(AHEAD)” which is a World Bank funded Sri
Lankan government operation to support the
higher education sector (AHEAD 6026-
LK/8743-LK).
References:
Markus Korner .et al, “Advances in Digital
Radiography : Physical,” pp. 675–686, 2007.
J. A. Seibert, “Digital radiography: Image quality and
radiation dose,” Health Phys., vol. 95, no. 5, pp. 586–
598, 2008, doi:
10.1097/01.HP.0000326338.14198.a2.
J. Bomer, L. Wiersma-Deijl, and H. C. Holscher,
“Electronic collimation and radiation protection in
paediatric digital radiography: Revival of the silver
lining,” Insights Imaging, vol. 4, no. 5, pp. 723–727,
2013, doi: 10.1007/s13244-013-0281-5.
J. B. Robinson, R. M. Ali, A. K. Tootell, and P. Hogg,
“Does collimation affect patient dose in antero-
posterior thoraco-lumbar spine?,” Radiography, vol.
23, no. 3, pp. 211–215, 2017, doi:
10.1016/j.radi.2017.03.012.
C. E. Carter and B. L. Vealé, Digital Radiograpnhy and
PACS. 2010.
C. E. Willis and T. L. Slovis, “The ALARA concept in
pediatric CR and DR: Dose reduction in pediatric
radiographic exams - A white paper conference
Executive Summary,” Pediatr. Radiol., vol. 34, no.
SUPPL. 3, pp. 162–164, 2004, doi: 10.1007/s00247-
004-1264y.
R. Oosthuizen and A. Conrade, “The effect of
collimation on the radiation dose received by
neonates,” Phys. Medica, vol. 31, p. S9, 2015, doi:
10.1016/j.ejmp.2015.07.116.
J. L. Haybittle, “The effect of field size on the dose to
the patient in diagnostic radiology.,” Br. J. Radiol.,
vol. 30, no. 360, pp. 663–665, 1957, doi:
10.1259/0007-1285-30-360-663.
13th International Research Conference
General Sir John Kotelawala Defence University
Allied Health Sciences Sessions
23
Parenting-related Stress In Mothers OF Toddlers (1-3 Years) at
Piliyandala MOH Area
HCC Sewwandika1#, SJ De Silva1, BMKS Rathnayake1, DMKU Dissanayake1 , LNL Kulasena1,
KGG Priyangika1 and TH Solomans2
1Department of Nursing and Midwifery, Faculty of Allied Health Sciences, General Sir John Kotelawala
Defence University, Sri Lanka 2Faculty of Medicine, General Sir John Kotelawala Defence University, Sri Lanka
Abstract: Parents of toddlers are at risk of
increased parenting-related stress as
toddlerhood is considered as a period with
challenging behaviors due to significant
physical and emotional development of the
child. This descriptive cross-sectional study
aims to examine the parenting-related stress
levels and identify the factors affecting stress
in mothers of toddlers (n=423) registered at
Child Welfare Clinics of Piliyandala MOH
area. The validated version of the Parental
Stress Scale (PSS) was used as the data
collection tool and a systematic random
sampling technique was used. A Chi-square
test was used to assess the associations
between categorical variables. The mean age
of the mothers was 30.62 (±4.77) years and
29.8% (n = 126) were employed. According
to the subscales of PSS, the mean score of the
Parental Stress (PS) subscale of mothers was
28.72 (Scale;15- 49) and 51.3% (n=217)
were reported with a higher level of stress.
The mean of Lack of Parental Satisfaction
(LPS) subscale was 11.30 (Scale; 8-23) and
nearly 40% (n=170) were reported with a
higher LPS score which is above the mean.
Further, parental stress was significantly
associated when the age of the toddler is
between 1-2 years (p = 0.03), having more
than one child (p = 0.00), the toddler is being
in the second or higher ordinal position (p =
0.02), unemployed mothers (p = 0.00)
husband educated up to O/L or less (p =
0.02), temporary residence (p =0.03) and
husband being alcoholic (p = 0.01). In
conclusion, the majority of the mothers of
toddlers showed a higher level of parental
stress and a considerable percentage is
having a lack of parental satisfaction.
Keywords: Parenting, stress level, mothers
of toddlers
Introduction:
Parents of toddlers are at risk of increased
parenting-related stress as toddlerhood is
considered as a period with challenging
behaviours due to significant physical and
emotional development of the child. Higher
parental stress is usually associated with the
poor adjustment outcomes in children,
including insecure attachment and
behaviour problems (McQuillan and Bates,
2017). Therefore, early identification of
higher parental stress is essential to enhance
effective parenting practices. The objectives
of the study are to assess the perceived
parental stress of mothers with toddlers
registered at the Piliyandala MOH area and
assess the association of perceived parental
stress level with sociodemographic
variables.
Methodology:
A community based, descriptive cross
sectional quantitative study was conducted
to assess the perceived parental stress level
among mothers with toddlers attending child
welfare clinics in the Piliyandala MOH area. A
systematic random sampling technique was
used as the sampling technique, and
interviewer-administered questionnaires
were used for data collection. Perceived
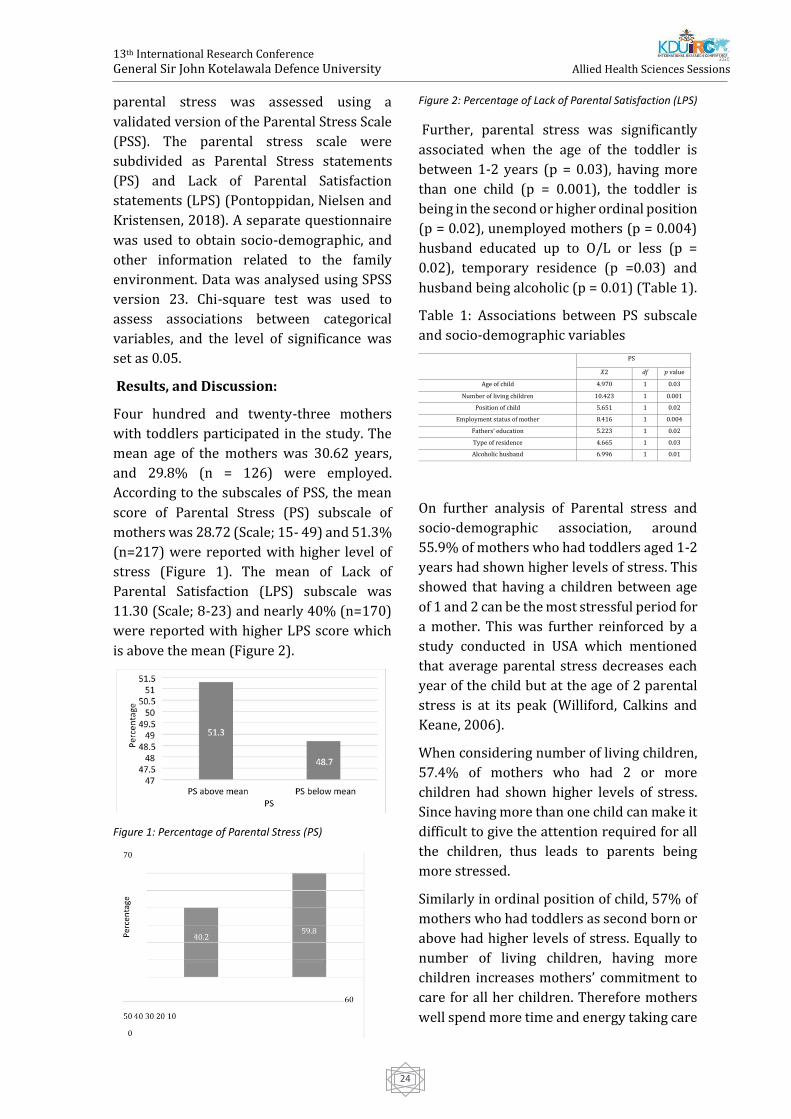
13th International Research Conference
General Sir John Kotelawala Defence University
Allied Health Sciences Sessions
24
parental stress was assessed using a
validated version of the Parental Stress Scale
(PSS). The parental stress scale were
subdivided as Parental Stress statements
(PS) and Lack of Parental Satisfaction
statements (LPS) (Pontoppidan, Nielsen and
Kristensen, 2018). A separate questionnaire
was used to obtain socio-demographic, and
other information related to the family
environment. Data was analysed using SPSS
version 23. Chi-square test was used to
assess associations between categorical
variables, and the level of significance was
set as 0.05.
Results, and Discussion:
Four hundred and twenty-three mothers
with toddlers participated in the study. The
mean age of the mothers was 30.62 years,
and 29.8% (n = 126) were employed.
According to the subscales of PSS, the mean
score of Parental Stress (PS) subscale of
mothers was 28.72 (Scale; 15- 49) and 51.3%
(n=217) were reported with higher level of
stress (Figure 1). The mean of Lack of
Parental Satisfaction (LPS) subscale was
11.30 (Scale; 8-23) and nearly 40% (n=170)
were reported with higher LPS score which
is above the mean (Figure 2).
Figure 1: Percentage of Parental Stress (PS)
Figure 2: Percentage of Lack of Parental Satisfaction (LPS)
Further, parental stress was significantly
associated when the age of the toddler is
between 1-2 years (p = 0.03), having more
than one child (p = 0.001), the toddler is
being in the second or higher ordinal position
(p = 0.02), unemployed mothers (p = 0.004)
husband educated up to O/L or less (p =
0.02), temporary residence (p =0.03) and
husband being alcoholic (p = 0.01) (Table 1).
Table 1: Associations between PS subscale
and socio-demographic variables
On further analysis of Parental stress and
socio-demographic association, around
55.9% of mothers who had toddlers aged 1-2
years had shown higher levels of stress. This
showed that having a children between age
of 1 and 2 can be the most stressful period for
a mother. This was further reinforced by a
study conducted in USA which mentioned
that average parental stress decreases each
year of the child but at the age of 2 parental
stress is at its peak (Williford, Calkins and
Keane, 2006).
When considering number of living children,
57.4% of mothers who had 2 or more
children had shown higher levels of stress.
Since having more than one child can make it
difficult to give the attention required for all
the children, thus leads to parents being
more stressed.
Similarly in ordinal position of child, 57% of
mothers who had toddlers as second born or
above had higher levels of stress. Equally to
number of living children, having more
children increases mothers’ commitment to
care for all her children. Therefore mothers
well spend more time and energy taking care
PS
𝑋2 df 𝑝 value
Age of child 4.970 1 0.03
Number of living children 10.423 1 0.001
Position of child 5.651 1 0.02
Employment status of mother 8.416 1 0.004
Fathers’ education 5.223 1 0.02
Type of residence 4.665 1 0.03
Alcoholic husband 6.996 1 0.01
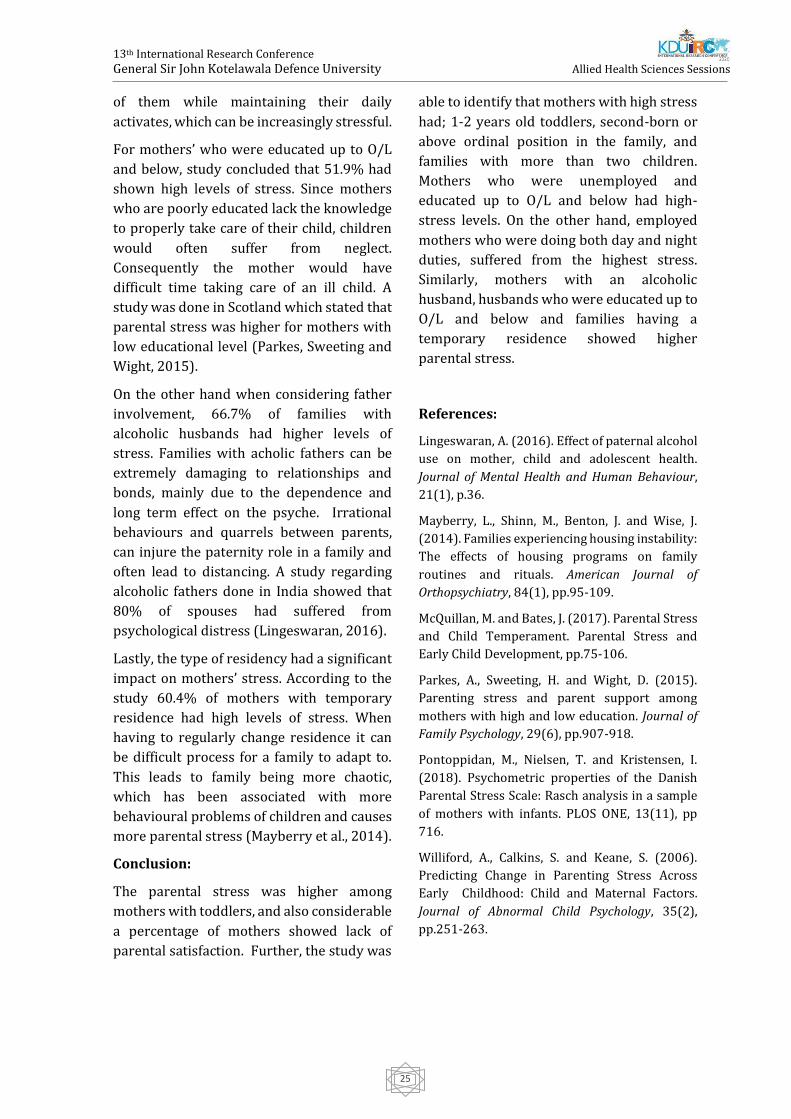
13th International Research Conference
General Sir John Kotelawala Defence University
Allied Health Sciences Sessions
25
of them while maintaining their daily
activates, which can be increasingly stressful.
For mothers’ who were educated up to O/L
and below, study concluded that 51.9% had
shown high levels of stress. Since mothers
who are poorly educated lack the knowledge
to properly take care of their child, children
would often suffer from neglect.
Consequently the mother would have
difficult time taking care of an ill child. A
study was done in Scotland which stated that
parental stress was higher for mothers with
low educational level (Parkes, Sweeting and
Wight, 2015).
On the other hand when considering father
involvement, 66.7% of families with
alcoholic husbands had higher levels of
stress. Families with acholic fathers can be
extremely damaging to relationships and
bonds, mainly due to the dependence and
long term effect on the psyche. Irrational
behaviours and quarrels between parents,
can injure the paternity role in a family and
often lead to distancing. A study regarding
alcoholic fathers done in India showed that
80% of spouses had suffered from
psychological distress (Lingeswaran, 2016).
Lastly, the type of residency had a significant
impact on mothers’ stress. According to the
study 60.4% of mothers with temporary
residence had high levels of stress. When
having to regularly change residence it can
be difficult process for a family to adapt to.
This leads to family being more chaotic,
which has been associated with more
behavioural problems of children and causes
more parental stress (Mayberry et al., 2014).
Conclusion:
The parental stress was higher among
mothers with toddlers, and also considerable
a percentage of mothers showed lack of
parental satisfaction. Further, the study was
able to identify that mothers with high stress
had; 1-2 years old toddlers, second-born or
above ordinal position in the family, and
families with more than two children.
Mothers who were unemployed and
educated up to O/L and below had high-
stress levels. On the other hand, employed
mothers who were doing both day and night
duties, suffered from the highest stress.
Similarly, mothers with an alcoholic
husband, husbands who were educated up to
O/L and below and families having a
temporary residence showed higher
parental stress.
References:
Lingeswaran, A. (2016). Effect of paternal alcohol
use on mother, child and adolescent health.
Journal of Mental Health and Human Behaviour,
21(1), p.36.
Mayberry, L., Shinn, M., Benton, J. and Wise, J.
(2014). Families experiencing housing instability:
The effects of housing programs on family
routines and rituals. American Journal of
Orthopsychiatry, 84(1), pp.95-109.
McQuillan, M. and Bates, J. (2017). Parental Stress
and Child Temperament. Parental Stress and
Early Child Development, pp.75-106.
Parkes, A., Sweeting, H. and Wight, D. (2015).
Parenting stress and parent support among
mothers with high and low education. Journal of
Family Psychology, 29(6), pp.907-918.
Pontoppidan, M., Nielsen, T. and Kristensen, I.
(2018). Psychometric properties of the Danish
Parental Stress Scale: Rasch analysis in a sample
of mothers with infants. PLOS ONE, 13(11), pp
716.
Williford, A., Calkins, S. and Keane, S. (2006).
Predicting Change in Parenting Stress Across
Early Childhood: Child and Maternal Factors.
Journal of Abnormal Child Psychology, 35(2),
pp.251-263.
13th International Research Conference
General Sir John Kotelawala Defence University
Allied Health Sciences Sessions
26
Occupational Engagement In Prisons: an evaluation of time-use in
Sri Lankan correctional settings.
GPC Gunarathne#, MDA Rodrigo1, and TSS Mendis2
1Faculty of Medicine, University of Kelaniya, Ragama, Sri Lanka 2Teaching Hospital, Karapitiya, Sri Lanka
Abstract: Sri Lankan prison system has
shown marked overcrowding for decades. It
is a common issue worldwide which
contributes poor care, loss of privacy, limited
resources and occupational deprivation. A
lack of access to basic human occupations
can lead to occupational deprivation. In penal
settings, occupational deprivation has been
suggested as a contributing factor in prison
riots, prison suicides, recidivism, episodic
disorientation and psychosis among inmates.
Therefore, it is important to observe the
current Sri Lankan prison system concerning
the occupational deprivation among prison
inmates. A cross-sectional descriptive study
was carried out in Welikada prison (male
section) situated in Colombo 09, aiming to
explore the time-use and occupational
engagement among sentenced prisoners
detained and to suggest suitable actions to be
taken to improve the correctional process. A
Purposive sample of 30 inmates between 18
and 55 years old was selected for the study.
Data collected via an informal semi-
structured interview based on Occupational
questionnaire (Smith, et al., 1986) and
analyzed using qualitative and quantitative
methods. An overall time-use in a typical day
among participants were evaluated using
simple statistical methods under five
domains; work, daily living works,
recreation, leisure and sleep. Qualitative data
summarized under three main themes;
occupational choice and autonomy,
motivation for occupation and values of
occupation. The overall findings suggest that
the incarcerated environment promotes
occupational imbalance, passivity and
negativism, which shows an occupational
deprivation among the prison population.
The findings are suggestive of a need for an
occupational therapy intervention to the
prison institutions at large or individual and
group basis.
Keywords: penal settings, occupational
therapy, engagement, time use, correctional
settings
Introduction:
Occupational engagement has been
presented as a core construct in occupational
therapy (Kennedy & Davis, 2017).
Occupational engagement describes the
extent to which a person has a balanced
rhythm of activity and rest, a variety and
range of meaningful occupations and
routines, and the ability to move around in
society and interact socially, implying that
occupational engagement occurs over time.
Moreover, occupational engagement
involves interpretation and comprehension
emanating from experience (Bejerholm &
Eklund, 2006b).
Occupational deprivation is considered
external to the individual. Whiteford (2000)
defines occupational deprivation as; ‘A state
of preclusion from engagement in
occupations of necessity and/or meaning
due to factors that stand outside the
immediate control of the individual’.
Incarceration itself limits occupational
engagement among prison inmates as they
have limited choice for occupations such as
leisure and recreation. The limited
occupational choices make prison inmates
dependent on the detaining authorities in
everyday activities (Mukiza, 2014). Helbig
13th International Research Conference
General Sir John Kotelawala Defence University
Allied Health Sciences Sessions
27
(2003a) found that limited choices and
autonomy often led to poor motivation and
inactivity over time.
Sri Lankan prison system has shown marked
overcrowding for decades. Globally, there
are overcrowded prison systems that
contribute to poor care, loss of privacy,
limited resources and occupational
deprivation. There were 8,853 of a daily
average of convicted prisoners were
detained in Sri Lankan prisons in the year
2016 while the authorized capacity was
6,728. It is 131.6% of the capacity
(Department of Prisons, 2017).
In penal setting occupational deprivation has
been suggested as a contributing factor in
prison riots, prison suicides, recidivism,
episodic disorientation and psychosis among
inmates (Molineux & Whiteford, 1999). The
Welikada prison experienced a recent riot on
09th November 2012, which left 27 people
dead and 43 injured (Haviland, 2012).
Hypothesis
The inmates who are detained in Sri Lankan
prisons experience occupational deprivation
which limits their engagement in purposeful
and balanced occupations.
Aim of the study
This study aimed to study explore the time-
use and occupational engagement among
convicted male prisoners between 18 and 55
years old at Welikada prison complex,
Colombo 09.
Methodology:
Participants
This study was conducted in Welikada prison
(male section) situated in Colombo 09. As the
sample was to be selected from a limited and
restricted population, the purposive
sampling method was used. Thirty (30)
convicted prisoners aged over 18 years,
currently serving a prison sentence and have
served for at least 6 months in Welikada
prison at the time of recruitment to the study
were selected. All the necessary means were
taken to ensure selecting a heterogeneous
sample of persons from various work
stations. The sections where there is high
security were excluded.
Data collection
Qualitative and quantitative methods of data
collection were used in this study. Three data
collection tools were used in this study. Two
of them were standardized tools and the
demographic information sheet is non-
standardized. All three tools were
interviewer-administered and had
translated into Sinhalese.
Kessler 6 interviewer administrated
questionnaire [K6]
Occupational Questionnaire [OQ]
Demographic information sheet
Ethical considerations
Ethical approval for this study was gained
from the Research Ethics Committee of the
Faculty of Medicine of the University of
Kelaniya. The whole process of the study
from participant selection to publication was
designed to protect the confidentiality,
autonomy and voluntary participation.
Data analysis:
Quantitative data
Data gathered from the OQ were analysed to
determine the time distribution among five
domains, work, daily living work, recreation,
rest and sleep. Time-use was calculated by
collecting each half-hour intervals under
each domain of each participant. The time-
use under each domain of all the participants
were collated and mean time-use was
calculated to achieve an overall score.
Qualitative data
The interview data recorded in data
collection sheets were categorized into three
themes using the principles of thematic
analysis methodology. The raw data were
coded and developed themes in each
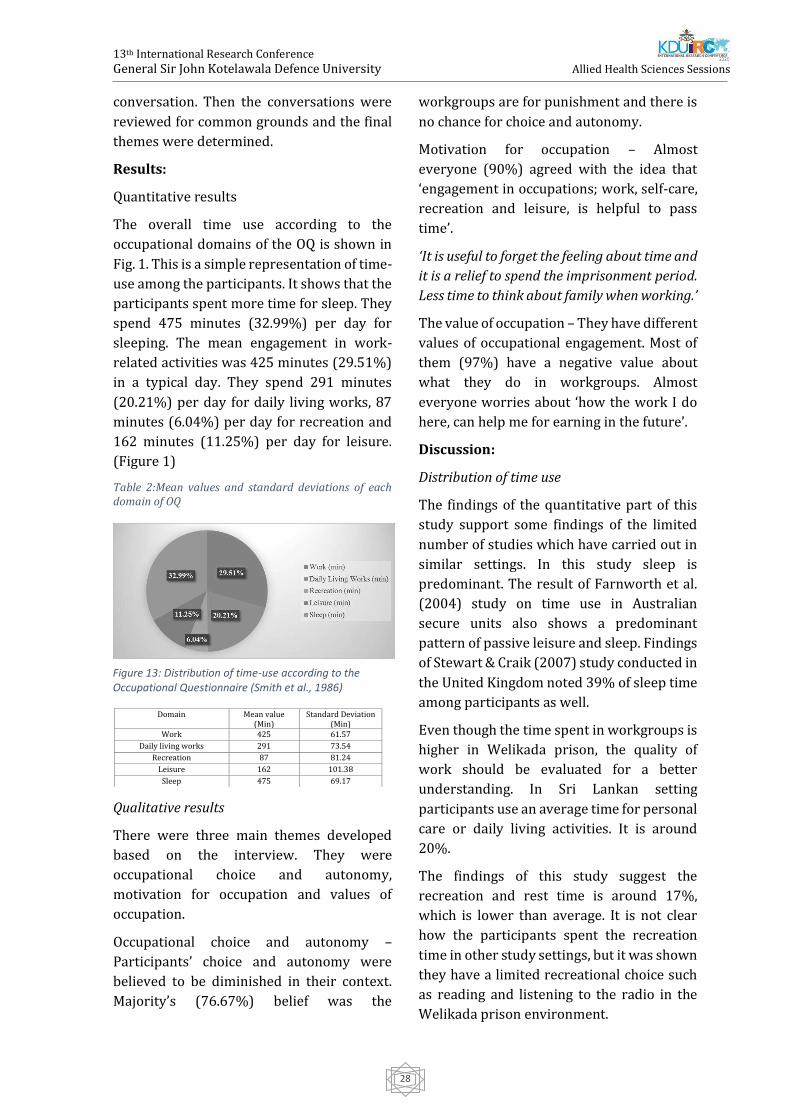
13th International Research Conference
General Sir John Kotelawala Defence University
Allied Health Sciences Sessions
28
conversation. Then the conversations were
reviewed for common grounds and the final
themes were determined.
Results:
Quantitative results
The overall time use according to the
occupational domains of the OQ is shown in
Fig. 1. This is a simple representation of time-
use among the participants. It shows that the
participants spent more time for sleep. They
spend 475 minutes (32.99%) per day for
sleeping. The mean engagement in work-
related activities was 425 minutes (29.51%)
in a typical day. They spend 291 minutes
(20.21%) per day for daily living works, 87
minutes (6.04%) per day for recreation and
162 minutes (11.25%) per day for leisure.
(Figure 1)
Table 2:Mean values and standard deviations of each domain of OQ
Qualitative results
There were three main themes developed
based on the interview. They were
occupational choice and autonomy,
motivation for occupation and values of
occupation.
Occupational choice and autonomy –
Participants’ choice and autonomy were
believed to be diminished in their context.
Majority’s (76.67%) belief was the
workgroups are for punishment and there is
no chance for choice and autonomy.
Motivation for occupation – Almost
everyone (90%) agreed with the idea that
‘engagement in occupations; work, self-care,
recreation and leisure, is helpful to pass
time’.
‘It is useful to forget the feeling about time and
it is a relief to spend the imprisonment period.
Less time to think about family when working.’
The value of occupation – They have different
values of occupational engagement. Most of
them (97%) have a negative value about
what they do in workgroups. Almost
everyone worries about ‘how the work I do
here, can help me for earning in the future’.
Discussion:
Distribution of time use
The findings of the quantitative part of this
study support some findings of the limited
number of studies which have carried out in
similar settings. In this study sleep is
predominant. The result of Farnworth et al.
(2004) study on time use in Australian
secure units also shows a predominant
pattern of passive leisure and sleep. Findings
of Stewart & Craik (2007) study conducted in
the United Kingdom noted 39% of sleep time
among participants as well.
Even though the time spent in workgroups is
higher in Welikada prison, the quality of
work should be evaluated for a better
understanding. In Sri Lankan setting
participants use an average time for personal
care or daily living activities. It is around
20%.
The findings of this study suggest the
recreation and rest time is around 17%,
which is lower than average. It is not clear
how the participants spent the recreation
time in other study settings, but it was shown
they have a limited recreational choice such
as reading and listening to the radio in the
Welikada prison environment.
Domain Mean value (Min)
Standard Deviation (Min)
Work 425 61.57
Daily living works 291 73.54
Recreation 87 81.24
Leisure 162 101.38
Sleep 475 69.17
Figure 13: Distribution of time-use according to the Occupational Questionnaire (Smith et al., 1986)
13th International Research Conference
General Sir John Kotelawala Defence University
Allied Health Sciences Sessions
29
Therefore, these findings suggest the
incarcerated environment promotes
occupational imbalance, passivity and
negativism, which lead to an occupational
deprivation among the prison population.
Occupational choice, autonomy, motivation
and value
The findings of this study suggest a marked
deprivation from occupational choice and
autonomy among the participants. Almost
everyone was allocated into workgroups
without their own choice
or interest. In this study, participants’
motivation is to occupy is to pass time, which
doesn’t show a personal meaning or value.
These findings indicate features suggestive
of occupational deprivation among the
participants, which would have been a
contributing factor for recidivism,
overcrowding and recent prison riot.
Conclusion:
Summery
Despite the limitations occurred, the overall
findings are 1) there is a marked
occupational imbalance found in the prison
population studied, 2) there are indications
that are suggestive of occupational
deprivation among the population studied.
As supported by these findings as well as
related literature, it is indicated a need for an
occupational therapy intervention to the
prison institutions at large or individual and
group basis.
Limitations:
The OQ does not differentiate rest and sleep
in data form. Stewart & Craik (2007) had
incorporated sleep into the assessment
based on a validated French version of OQ
used by Aubin et al., (1999) (cited in Stewart
& Craik, 2007). The same method used in this
study as well.
There was limited literature regarding the
specific research question worldwide. The
participants of available studies also were
diagnosed to have mental illnesses most of
the time. Therefore, the researcher was
unable to compare the findings with other
similar studies which are an important part
of the research.
References:
Bejerholm, U., & Eklund, M. (2006b). Engagement
in occupations among men and women with
schizophrenia. Occupational Therapy
International, 100-121.
Department of Prisons. (2017). Prison Statistics of
Sri Lanka. Colombo : Department of Prisons.
Farnworth, L., Nikitin, L., & Fossey, E. (2004).
Being on a secure forensic psychiatric unit: Every
day is exactly the same, killing time or making the
most of it. British Journal of Occupational Therapy,
430-438.
Haviland, C. (2012, 11 10). Sri Lanka's Welikada
prison clash leaves 27 dead. Retrieved from BBC
News: http://www.bbc.com/news/world-asia-
20267735
Helbig, K. (2003a). Perceptions of meaningful
activity amongst male patients in a high secure
forensic addictive behaviours unit. Mental Health
Occupational Therapy, 77-81.
Kennedy, J., & Davis, J. (2017). Clarifying the
Construct of Occupational Engagement for
Occupational Therapy Practice. The Occupational
Therapy Journal of Research, 98-108.
Molineux, M., & Whiteford, G. (1999). Prisons:
From Occupational deprivation to occupational
enrichment. Journal of Occupational Science, 124-
130.
Mukiza, F. (2014). Physical Activity and
Prisoner's Health (Master's thesis in Public Health
ed.). University of Tromsø: Tromsø, Norway.
Smith, N., Kielhofner, G. & Watts, J., 1986. The
relationships between volition, activity pattern,
and life satisfaction in the elderly. American
Journal of Occupational Therapy, Volume 40, pp.
278-283.
Stewart, P., & Craik, C. (2007). Occupation, mental
illness and medium security: exploring time-use
in forensic regional secure units. British Journal of
Occupational Therapy, 416-425.

13th International Research Conference
General Sir John Kotelawala Defence University
Allied Health Sciences Sessions
30
Whiteford, G. (2000). Occupational Deprivation:
Global Challenge in New Millenium. British
Journal of Occupational Therapy, 200-204.
13th International Research Conference
General Sir John Kotelawala Defence University
Allied Health Sciences Sessions
31
Estimation of Radiation Dose to the Eye during
Radiopharmaceutical Preparation and scan procedures at a selected
private hospital in Sri Lanka
RAIU De Silva1#, HMPNB Mawathagama2, P Sathyathas3 and JMC Udugama4
1,2,3Department of Radiography &Radiotherapy, Faculty of Allied Health Sciences, General Sir John
Kotelawala Defence University, Werehera, Sri Lanka 4Department of Nuclear Medicine, Lanka Hospital PLC, Sri Lanka
Abstract: Radiopharmaceuticals are
radioactive compounds used in nuclear
imaging procedures. The purpose of this
study was to estimate the average equivalent
dose to the eye. This study was conducted at
the nuclear medicine department of Lanka
hospitals PLC, Sri Lanka. A total number of
137 procedures were selected: bone, renal
(DTPA - Diethylenetriamine pentaacetic
acid) and whole body iodine (WBI), and dose
was measured during the
radiopharmaceutical preparation.
Measurement of eye dose need to be done
using Hp(3) type dosimeter, but due to
unavailability of that dosimeter, Hp(10) type
electronic pocket dosimeter was used for
measurements. The dosimeter (Brand-
POLIMASTER and model-PM1610) was
placed in between the eyes during the dose
measurement with the help of custom made
head band. The highest estimated average
equivalent eye dose of 6.93 (± 5.36) µSv was
received by the technician during 1st week
from newly installed radio nuclide generator.
Annual estimated equivalent eye dose have
received by personals involved in dose
administration, and patient handling were
0.34 (± 0.24) mSvy-1 and 0.08 (± 0.01) mSvy-1
respectively. A strong positive correlation
(r=1.0000) was found between total
equivalent eye dose and eye dose received by
the technician during radiolabeling. Further,
the total equivalent eye dose during DTPA
procedures and the dose received by eye
during DTPA dose withdrawal (preparation
of dose vials for each patient from total dose
volume) have shown a positive correlation
(r=0.9980). This study concluded that the
estimated annual radiation dose to the eye of
personals involves in dose administration
and patient handling were far below than the
ICRP recommended equivalent dose limits.
Keywords: radiopharmaceutical, eye dose,
equivalent dose
Introduction
In both diagnostic and therapeutic nuclear
medicine patient becomes a source of
radiation which causes for own exposure and
also for staff, caregivers and the general
public. It remains until the radioactive
material has decayed or is excreted from the
body (Mattsson and Hoeschen, 2013). It was
reported that the workers expose to nuclear
medicine occupational exposure during the
preparation of radiopharmaceuticals in hot
lab and administration, higher than the
exposure during imaging procedures
(Delacroix et al., 2002). It is due to the staff is
working closer to relatively large amounts of
radioactivity while preparing
radiopharmaceuticals and when
administering, radiopharmaceuticals flow
out of the shielding material into the patient.
But during imaging workers spend only a few
minutes closer to the patient (Kollaard et al.,
2018).
The International Commission on
Radiological Protection (ICRP) has revised
that the human eye lenses have become more
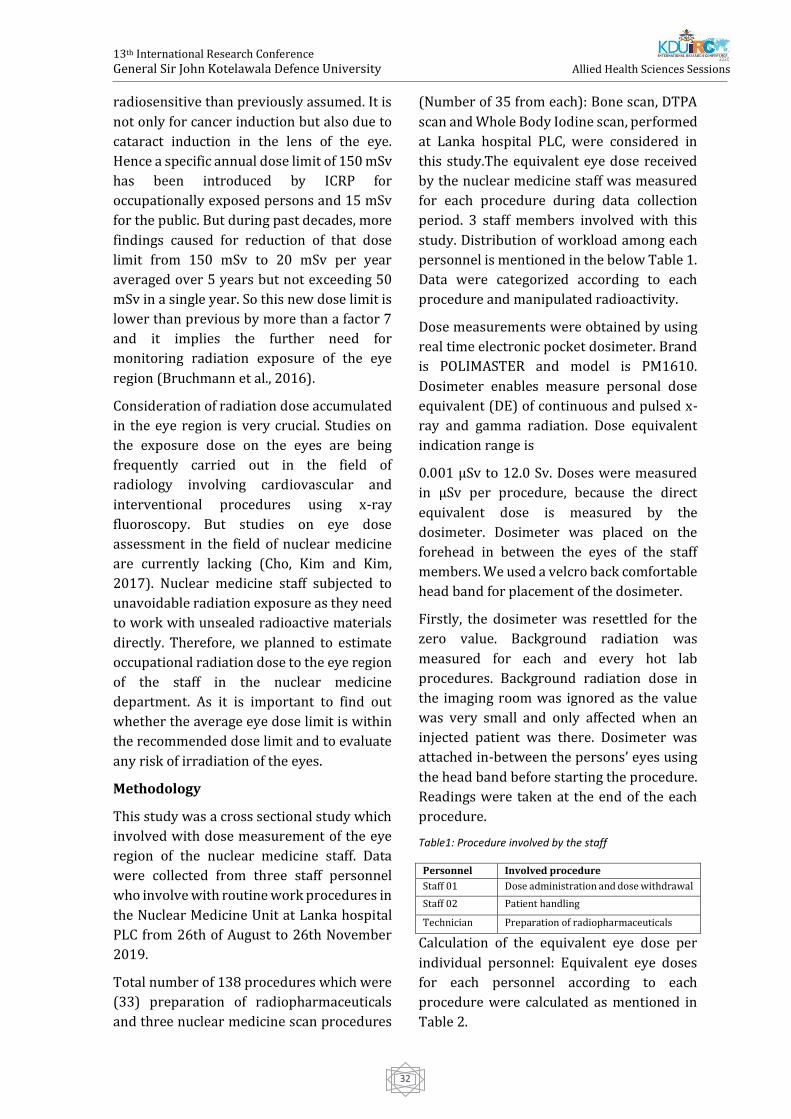
13th International Research Conference
General Sir John Kotelawala Defence University
Allied Health Sciences Sessions
32
radiosensitive than previously assumed. It is
not only for cancer induction but also due to
cataract induction in the lens of the eye.
Hence a specific annual dose limit of 150 mSv
has been introduced by ICRP for
occupationally exposed persons and 15 mSv
for the public. But during past decades, more
findings caused for reduction of that dose
limit from 150 mSv to 20 mSv per year
averaged over 5 years but not exceeding 50
mSv in a single year. So this new dose limit is
lower than previous by more than a factor 7
and it implies the further need for
monitoring radiation exposure of the eye
region (Bruchmann et al., 2016).
Consideration of radiation dose accumulated
in the eye region is very crucial. Studies on
the exposure dose on the eyes are being
frequently carried out in the field of
radiology involving cardiovascular and
interventional procedures using x-ray
fluoroscopy. But studies on eye dose
assessment in the field of nuclear medicine
are currently lacking (Cho, Kim and Kim,
2017). Nuclear medicine staff subjected to
unavoidable radiation exposure as they need
to work with unsealed radioactive materials
directly. Therefore, we planned to estimate
occupational radiation dose to the eye region
of the staff in the nuclear medicine
department. As it is important to find out
whether the average eye dose limit is within
the recommended dose limit and to evaluate
any risk of irradiation of the eyes.
Methodology
This study was a cross sectional study which
involved with dose measurement of the eye
region of the nuclear medicine staff. Data
were collected from three staff personnel
who involve with routine work procedures in
the Nuclear Medicine Unit at Lanka hospital
PLC from 26th of August to 26th November
2019.
Total number of 138 procedures which were
(33) preparation of radiopharmaceuticals
and three nuclear medicine scan procedures
(Number of 35 from each): Bone scan, DTPA
scan and Whole Body Iodine scan, performed
at Lanka hospital PLC, were considered in
this study.The equivalent eye dose received
by the nuclear medicine staff was measured
for each procedure during data collection
period. 3 staff members involved with this
study. Distribution of workload among each
personnel is mentioned in the below Table 1.
Data were categorized according to each
procedure and manipulated radioactivity.
Dose measurements were obtained by using
real time electronic pocket dosimeter. Brand
is POLIMASTER and model is PM1610.
Dosimeter enables measure personal dose
equivalent (DE) of continuous and pulsed x-
ray and gamma radiation. Dose equivalent
indication range is
0.001 μSv to 12.0 Sv. Doses were measured
in µSv per procedure, because the direct
equivalent dose is measured by the
dosimeter. Dosimeter was placed on the
forehead in between the eyes of the staff
members. We used a velcro back comfortable
head band for placement of the dosimeter.
Firstly, the dosimeter was resettled for the
zero value. Background radiation was
measured for each and every hot lab
procedures. Background radiation dose in
the imaging room was ignored as the value
was very small and only affected when an
injected patient was there. Dosimeter was
attached in-between the persons’ eyes using
the head band before starting the procedure.
Readings were taken at the end of the each
procedure.
Table1: Procedure involved by the staff
Personnel Involved procedure
Staff 01 Dose administration and dose withdrawal
Staff 02 Patient handling
Technician Preparation of radiopharmaceuticals
Calculation of the equivalent eye dose per
individual personnel: Equivalent eye doses
for each personnel according to each
procedure were calculated as mentioned in
Table 2.
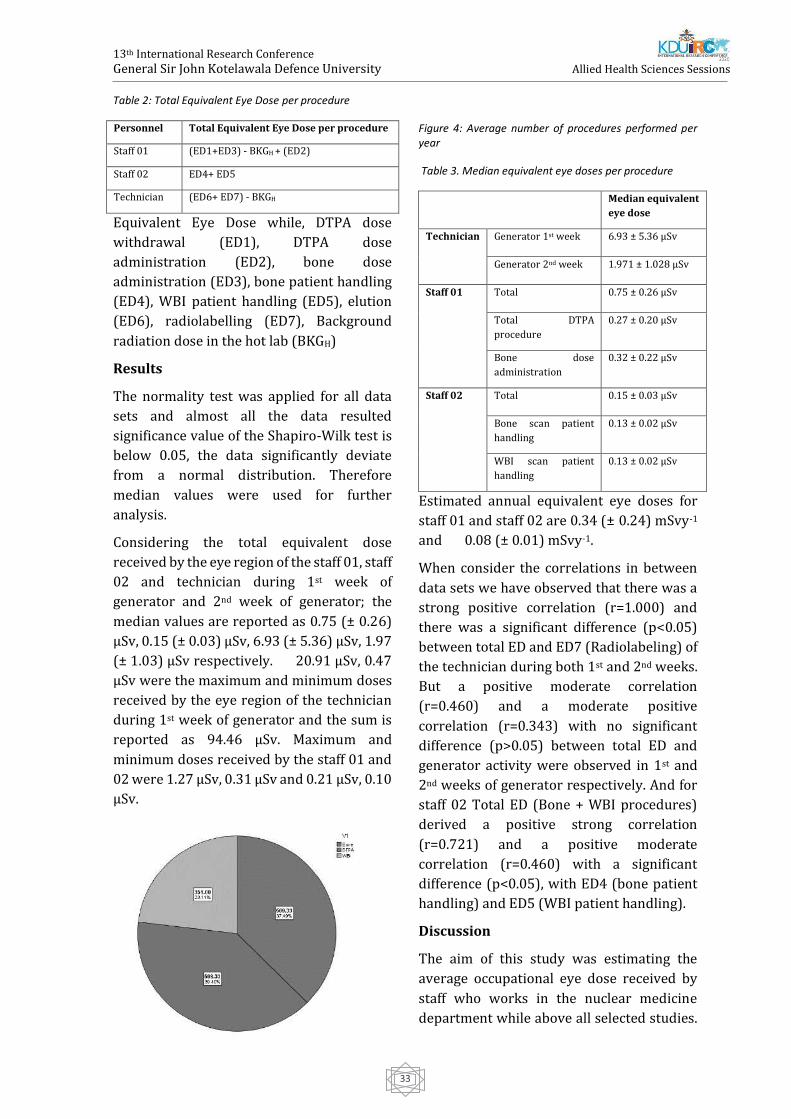
13th International Research Conference
General Sir John Kotelawala Defence University
Allied Health Sciences Sessions
33
Table 2: Total Equivalent Eye Dose per procedure
Personnel Total Equivalent Eye Dose per procedure
Staff 01 (ED1+ED3) - BKGH + (ED2)
Staff 02 ED4+ ED5
Technician (ED6+ ED7) - BKGH
Equivalent Eye Dose while, DTPA dose
withdrawal (ED1), DTPA dose
administration (ED2), bone dose
administration (ED3), bone patient handling
(ED4), WBI patient handling (ED5), elution
(ED6), radiolabelling (ED7), Background
radiation dose in the hot lab (BKGH)
Results
The normality test was applied for all data
sets and almost all the data resulted
significance value of the Shapiro-Wilk test is
below 0.05, the data significantly deviate
from a normal distribution. Therefore
median values were used for further
analysis.
Considering the total equivalent dose
received by the eye region of the staff 01, staff
02 and technician during 1st week of
generator and 2nd week of generator; the
median values are reported as 0.75 (± 0.26)
µSv, 0.15 (± 0.03) µSv, 6.93 (± 5.36) µSv, 1.97
(± 1.03) µSv respectively. 20.91 µSv, 0.47
µSv were the maximum and minimum doses
received by the eye region of the technician
during 1st week of generator and the sum is
reported as 94.46 µSv. Maximum and
minimum doses received by the staff 01 and
02 were 1.27 µSv, 0.31 µSv and 0.21 µSv, 0.10
µSv.
Figure 4: Average number of procedures performed per year
Table 3. Median equivalent eye doses per procedure
Median equivalent
eye dose
Technician Generator 1st week 6.93 ± 5.36 µSv
Generator 2nd week 1.971 ± 1.028 µSv
Staff 01 Total 0.75 ± 0.26 µSv
Total DTPA
procedure
0.27 ± 0.20 µSv
Bone dose
administration
0.32 ± 0.22 µSv
Staff 02 Total 0.15 ± 0.03 µSv
Bone scan patient
handling
0.13 ± 0.02 µSv
WBI scan patient
handling
0.13 ± 0.02 µSv
Estimated annual equivalent eye doses for
staff 01 and staff 02 are 0.34 (± 0.24) mSvy-1
and 0.08 (± 0.01) mSvy-1.
When consider the correlations in between
data sets we have observed that there was a
strong positive correlation (r=1.000) and
there was a significant difference (p<0.05)
between total ED and ED7 (Radiolabeling) of
the technician during both 1st and 2nd weeks.
But a positive moderate correlation
(r=0.460) and a moderate positive
correlation (r=0.343) with no significant
difference (p>0.05) between total ED and
generator activity were observed in 1st and
2nd weeks of generator respectively. And for
staff 02 Total ED (Bone + WBI procedures)
derived a positive strong correlation
(r=0.721) and a positive moderate
correlation (r=0.460) with a significant
difference (p<0.05), with ED4 (bone patient
handling) and ED5 (WBI patient handling).
Discussion
The aim of this study was estimating the
average occupational eye dose received by
staff who works in the nuclear medicine
department while above all selected studies.
13th International Research Conference
General Sir John Kotelawala Defence University
Allied Health Sciences Sessions
34
Nuclear medicine staff maintained good
radiation protection while the procedure
such as lead apron, thyroid collar, lead
shielding etc.
As the normality test results derived the not
normal distribution of our data set, median
values were utilized for further analysis. The
highest estimated equivalent occupational
eye dose is received by the technician who
involved in radiopharmaceutical
preparations, 6.93 (± 5.36) µSv and
1.971 (± 1.028) µSv for 1st and 2nd weeks of
radionuclide generator. Average eye dose
received by technical staff who direct contact
with radiopharmaceuticals was 3.5 (± 0.3)
µSvGBq-1 according to Szumska,
Budzanowski and Kopeć, (2014). Those
values can’t be compared as the investigated
workloads involved by the staff members are
different. As well as estimated median
equivalent eye doses during assessed
number of procedures for staff 01 and staff
02 were 0.75 (± 0.26) µSv, 0.15 (± 0.03) µSv
respectively.
Annual median equivalent eye doses are
estimated as 0.34 (± 0.24) mSvy-1 for the
personnel who involved with radiation dose
administration and 0.08 (± 0.01) mSvy-1 for
the personnel who involved in patient
handling. The estimated results are well
below the dose limit (20 mSv) for the eye
region according to the ICRP
recommendations. Summers et al., (2013)
have concluded that 1.85 mSv was the annual
dose to the eye during 99mTc
radiopharmaceuticals administration. The
expected results from our study are lower
than but approximately similar to value
mentioned above. It should be mentioned
that the investigations were conducted in
selected number of procedures which
expected to be provided a significant dose to
the eye region of staff. The excluded
procedures were which the staff didn’t
involve routinely making difficult to take
measurements, impracticalities to wearing
pocket dosimeter and used very low
radiation activities. Those procedures also
would be a reason for further increasing the
dose received.
Estimated absorbed dose rate of eye lenses
by Cho, Kim and Kim, (2017) was 1.228 µSvh-
1. Measurements were very sensitive as they
used a phantom and Hp(3) dosimeter instead
of using POLIMASTER dosimeter in the
present study. So the expected results may be
more accurate if used a Thermo
Luminescence Dosimeter (TLD) for dose
measurements and increase the number of
procedures investigated.
Our study results demonstrated significant
association between total equivalent eye
dose and the eye dose during radiolabeling
by the technician (p<0.05), Total equivalent
eye dose during DTPA procedures and eye
dose during DTPA dose withdrawal (p<0.05)
and weak correlation between generator
activity and eye dose during elution of 99mTc
radionuclide during 2nd week of generator
and moderate during 1st week of generator. It
elaborates manipulations of high activities
for a considerable time increases the
radiation dose received. But Dabin et al.,
(2016) results displayed no significant
correlation with the manipulated activities
reminding that associations are limited by
the measurement uncertainty. We observed
that total equivalent eye dose received by the
staff 02 correlates strong and moderate
positively with eye dose received during
patient handling in bone scan and WBI
procedures. We consider that noticeable
time taken for patient handling in bone scan,
assigns the above correlation.
Conclusion
The estimated annual equivalent eye dose
received by selected nuclear medicine staff
for this study conducted at nuclear
medicine department Lanka
hospital, Sri Lanka were
0.34 (± 0.24) mSvy-1, 0.08 (± 0.01) mSvy-1 for
the personnel who involved in dose
administration and patient handling
13th International Research Conference
General Sir John Kotelawala Defence University
Allied Health Sciences Sessions
35
respectively. Average median equivalent eye
doses received by the technician were the
highest among average values; 6.93 (± 5.36)
µSv and 1.971 (± 1.028) µSv for 1st and 2nd
weeks of radionuclide generator. During the
1st week of the radionuclide generator, there
was a moderate positive correlation with the
generator activity and the total eye dose of
the technician. The entire resulted annual
occupational radiation doses to the eye
region of staff in the studied place are far
below than the ICRP recommended value of
20 mSv. Therefore, optimum radiation safety
is maintained in this hospital.
References
Ahasan, M. M. (2004) ‘Assesment of radiation
dose in nuclear medicine hot lab’, Iranian Journal
of Radiation Research, 2(2), pp. 75–78. Albiniak, Ł.
et al. (2018) ‘Is eye lens dosimetry needed in
nuclear medicine?’, pp. 1–17. doi:
https://doi.org/10.1088/1361-6498/aabef5.
Allehyani, S. H. A. and Hassan, R. A. (2016)
‘Measurements of Fingers Doses to Nuclear
Medicine Staff’, International Journal of Science
and Research (IJSR), 5(6), pp. 1480–1483. doi:
10.21275/v5i6.nov164451.
Bolus, N. E. (2008) ‘Review of common
occupational hazards and safety concerns for
nuclear medicine technologists’, Journal of
Nuclear Medicine Technology, 36(1), pp. 11–17.
doi: 10.2967/jnmt.107.043869.
Bruchmann, I. et al. (2016) ‘Impact of radiation
protection means on the dose to the lens of the
eye while handling radionuclides in nuclear
medicine’, Zeitschrift fur Medizinische Physik.
Elsevier B.V., 26(4), pp. 298–303. doi:
10.1016/j.zemedi.2015.07.002.
Cantone, M. C. et al. (2012) ‘IRPA guideline
protocol for eye dose monitoring and eye
protection of workers’, Irpa, (April 2011), pp. 2–
7.
Cho, Y. I., Kim, J. M. and Kim, J. H. (2017) ‘Ocular
organ dose assessment of nuclear medicine
workers handling diagnostic radionuclides’,
Radiation Protection Dosimetry, 175(2), pp. 209–
216. doi: 10.1093/rpd/ncw287.
Cho, Y. I., Kim, J. M. and Kim, J. H. (2017b) ‘Ocular
organ dose assessment of nuclear medicine
workers handling diagnostic radionuclides’,
Radiation Protection Dosimetry, 175(2). doi:
10.1093/rpd/ncw287.
Dabin, J. et al. (2016) ‘Eye lens doses in nuclear
medicine: A multicentric study in Belgium and
Poland’, Radiation Protection Dosimetry, 170(1–
4), pp. 297–301. doi: 10.1093/rpd/ncv538.
Dash, A. et al. (2012) ‘Development of a
99Mo/99mTc generator using alumina
microspheres for industrial radiotracer
applications’, Applied Radiation and Isotopes.
Elsevier, 70(1), pp. 51–58. doi:
10.1016/j.apradiso.2011.07.012.
Delacroix, D. et al. (2002) ‘RADIONUCLIDE AND
RADIATION PROTECTION HANDBOOK’,
RADIATION PROTECTION DOSIMETRY, 98.
Ehrlich, R. A. and Daly, J. A. (2009) Patient Care in
Radiography with an Introduction to Medical
Imaging.
Eng Ng, D. C., Chuen Lam, W. W. and Whatt Goh, A.
S. (2015) Nuclear medicine imaging. 6th edn,
Pitfalls in Diagnostic Radiology. 6th edn. doi:
10.1007/978-3-662-44169-5_4.
Forshier, S. (2009) Essentials of radiation biology
and protection, Delmar.
Kollaard, R. P. et al. (2018) ‘Guidelines for
Radiation Protection and Dosimetry of the Eye
Lens’, (May). doi: 10.25030/ncs-031.
Mattsson, S. and Hoeschen, C. (2013) Radiation
protection in nuclear medicine, Radiation
Protection in Nuclear Medicine. doi: 10.1007/978-
3-642-31167-3.
Nikodemov, D. (2011) ‘Consequences of the New
Eye Lens Limits’, (3), pp. 247–252.
Summers, E. C. et al. (2013) ‘Eye doses to staff in
a nuclear medicine department’, Nuclear Medicine
Communications, 33(5), pp. 112–117. doi:
10.1097/MNM.0b013e3283510a8f.
Szermerski, B. et al. (2016) ‘Dose rate constants
for the quantity Hp(3) for frequently used
radionuclides in nuclear medicine’, Zeitschrift fur
Medizinische Physik. Elsevier B.V., 26(4), pp. 304–
310. doi: 10.1016/j.zemedi.2015.11.003.
Szumska, A., Budzanowski, M. and Kopeć, R.
(2014) ‘Occupational exposure to the whole body,

13th International Research Conference
General Sir John Kotelawala Defence University
Allied Health Sciences Sessions
36
extremities and to the eye lens in interventional
radiology in Poland, as based on personnel
dosimetry records at IFJ PAN’, Radiation Physics
and Chemistry. doi: 10.1016/j.radphyschem.
2014.04.039.
Vano, E. et al. (2010) ‘Radiation Cataract Risk in
Interventional Cardiology Personnel’, Radiation
Research, 174(4), pp. 490–495. doi:
10.1667/rr2207.1.
13th International Research Conference
General Sir John Kotelawala Defence University
Allied Health Sciences Sessions
37
Prevalence of forward head posture and its’ relationship with neck
pain among sewing machine operators in two selected garment
factories in Kaluthara district
DT Wagachchi, MS Jayamanne, AMLUK Adikari, IDL Kodagoda, YT Mudalige, GAD Perera#
Department of Physiotherapy, General Sir John Kotelawala Defence University, Sri Lanka.
Abstract: Neck pain is one of the very
common musculoskeletal symptoms among
sewing machine operators. Sewing machine
operation which is carried out in a forward
inclined position over prolonged period
makes them liable to develop faulty postures
like Forward Head Posture (FHP) and the
occurrence of neck pain. The objective of this
study was to determine the prevalence of
FHP among sewing machine operators in two
selected garment factories in Kalutara
district and to study the association of
Craniovertebral angle (CVA) with neck pain
intensity among sewing machine operators.
A cross sectional study was carried out with
a total of 167 sewing machine operators (156
females, 11 males) who worked in the sitting
position. An interviewer administered
questionnaire including Numerical Pain
Rating Scale was used to assess the neck pain
while photogrammetry was used to measure
the CVA using KINOVEA app which is a
motion analysis software. The mean values
and the SD of age, BMI and work experience
was 37.6 years ± 13.4, 23.7 kgm-2 ± 4.9 and
10.0 years ± 8.7 respectively. Out of the study
sample, 64.67 % of sewing machine
operators presented with FHP while the
prevalence of FHP among sewing machine
operators with neck pain were recorded as
77.45%. The test results revealed a
significant weak negative correlation
between CVA and neck pain intensity (p=
0.036, r= -0.208). This study concluded a
high prevalence of FHP among sewing
machine operators and a significant weak
negative correlation between CVA and neck
pain intensity.
Key Words: Forward Head Posture, Neck
pain, Sewing machine operators
Introduction:
Neck pain is one of the very common
musculoskeletal conditions in the general
population (Fejer, Kyvik & Hartvigsen,
2006). Neck pain can vary from a small
discomfort to severe disabling pain making it
one of the major health problems that carries
important economic costs (Mohankumar,
2018). Less severe neck pains occur due to
poor posture, neck strains, occupational and
sport injuries and mental state such as
anxiety and depression, while mechanical
and degenerative factors are more likely to
develop chronic neck pain (Binder, 2007).
Forward head posture (FHP) is the most
common postural deformity seen in the
sagittal plane (Lee, Chung & Park, 2016). It
can be defined as any alignment in which the
external auditory meatus is positioned
anterior to the plumb line through the
shoulder joint (Kendall et al, 2005). In FHP,
head moves anteriorly and the peak of the
increased cervical lordotic curve is a
noticeable distance away from center of
gravity. FHP gradually leads to abnormal
compression of zygapophyseal joint,
posterior vertebral disks, narrowed
intervertebral foramina and shortened
posterior zygapophyseal joint capsule
causing nerve root compression.
Furthermore, functional changes occur in
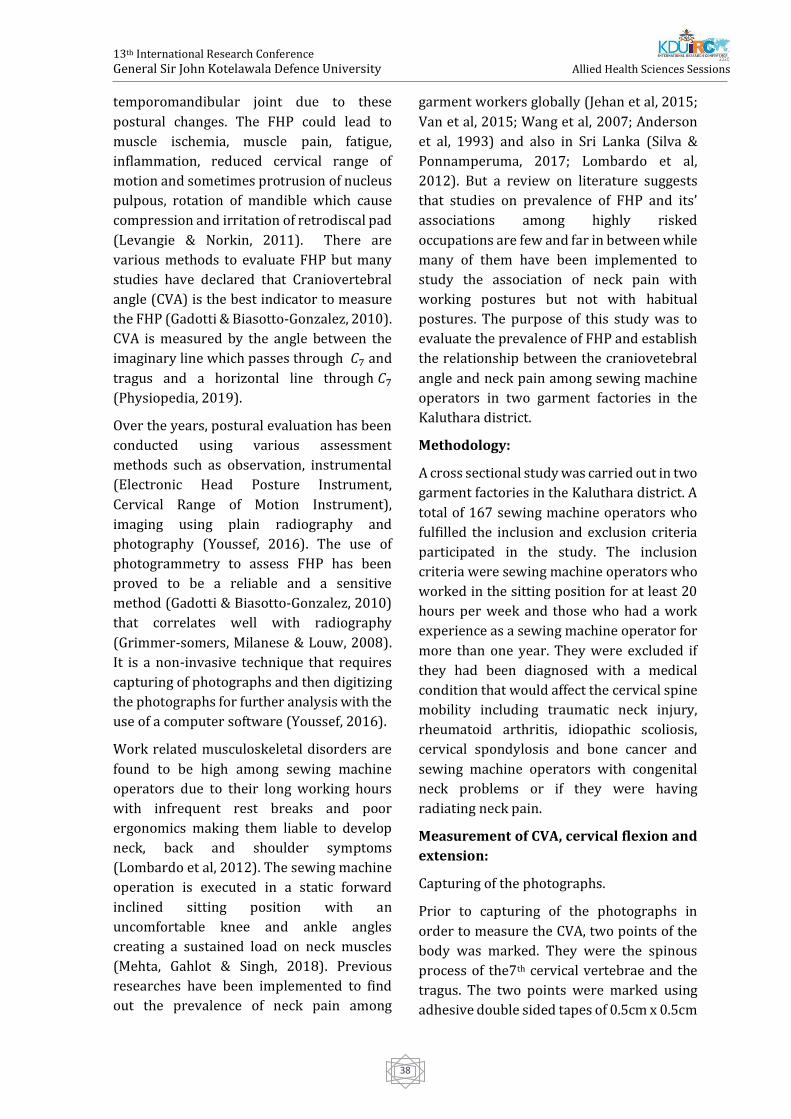
13th International Research Conference
General Sir John Kotelawala Defence University
Allied Health Sciences Sessions
38
temporomandibular joint due to these
postural changes. The FHP could lead to
muscle ischemia, muscle pain, fatigue,
inflammation, reduced cervical range of
motion and sometimes protrusion of nucleus
pulpous, rotation of mandible which cause
compression and irritation of retrodiscal pad
(Levangie & Norkin, 2011). There are
various methods to evaluate FHP but many
studies have declared that Craniovertebral
angle (CVA) is the best indicator to measure
the FHP (Gadotti & Biasotto-Gonzalez, 2010).
CVA is measured by the angle between the
imaginary line which passes through 𝐶7 and
tragus and a horizontal line through 𝐶7
(Physiopedia, 2019).
Over the years, postural evaluation has been
conducted using various assessment
methods such as observation, instrumental
(Electronic Head Posture Instrument,
Cervical Range of Motion Instrument),
imaging using plain radiography and
photography (Youssef, 2016). The use of
photogrammetry to assess FHP has been
proved to be a reliable and a sensitive
method (Gadotti & Biasotto-Gonzalez, 2010)
that correlates well with radiography
(Grimmer-somers, Milanese & Louw, 2008).
It is a non-invasive technique that requires
capturing of photographs and then digitizing
the photographs for further analysis with the
use of a computer software (Youssef, 2016).
Work related musculoskeletal disorders are
found to be high among sewing machine
operators due to their long working hours
with infrequent rest breaks and poor
ergonomics making them liable to develop
neck, back and shoulder symptoms
(Lombardo et al, 2012). The sewing machine
operation is executed in a static forward
inclined sitting position with an
uncomfortable knee and ankle angles
creating a sustained load on neck muscles
(Mehta, Gahlot & Singh, 2018). Previous
researches have been implemented to find
out the prevalence of neck pain among
garment workers globally (Jehan et al, 2015;
Van et al, 2015; Wang et al, 2007; Anderson
et al, 1993) and also in Sri Lanka (Silva &
Ponnamperuma, 2017; Lombardo et al,
2012). But a review on literature suggests
that studies on prevalence of FHP and its’
associations among highly risked
occupations are few and far in between while
many of them have been implemented to
study the association of neck pain with
working postures but not with habitual
postures. The purpose of this study was to
evaluate the prevalence of FHP and establish
the relationship between the craniovetebral
angle and neck pain among sewing machine
operators in two garment factories in the
Kaluthara district.
Methodology:
A cross sectional study was carried out in two
garment factories in the Kaluthara district. A
total of 167 sewing machine operators who
fulfilled the inclusion and exclusion criteria
participated in the study. The inclusion
criteria were sewing machine operators who
worked in the sitting position for at least 20
hours per week and those who had a work
experience as a sewing machine operator for
more than one year. They were excluded if
they had been diagnosed with a medical
condition that would affect the cervical spine
mobility including traumatic neck injury,
rheumatoid arthritis, idiopathic scoliosis,
cervical spondylosis and bone cancer and
sewing machine operators with congenital
neck problems or if they were having
radiating neck pain.
Measurement of CVA, cervical flexion and
extension:
Capturing of the photographs.
Prior to capturing of the photographs in
order to measure the CVA, two points of the
body was marked. They were the spinous
process of the7th cervical vertebrae and the
tragus. The two points were marked using
adhesive double sided tapes of 0.5cm x 0.5cm
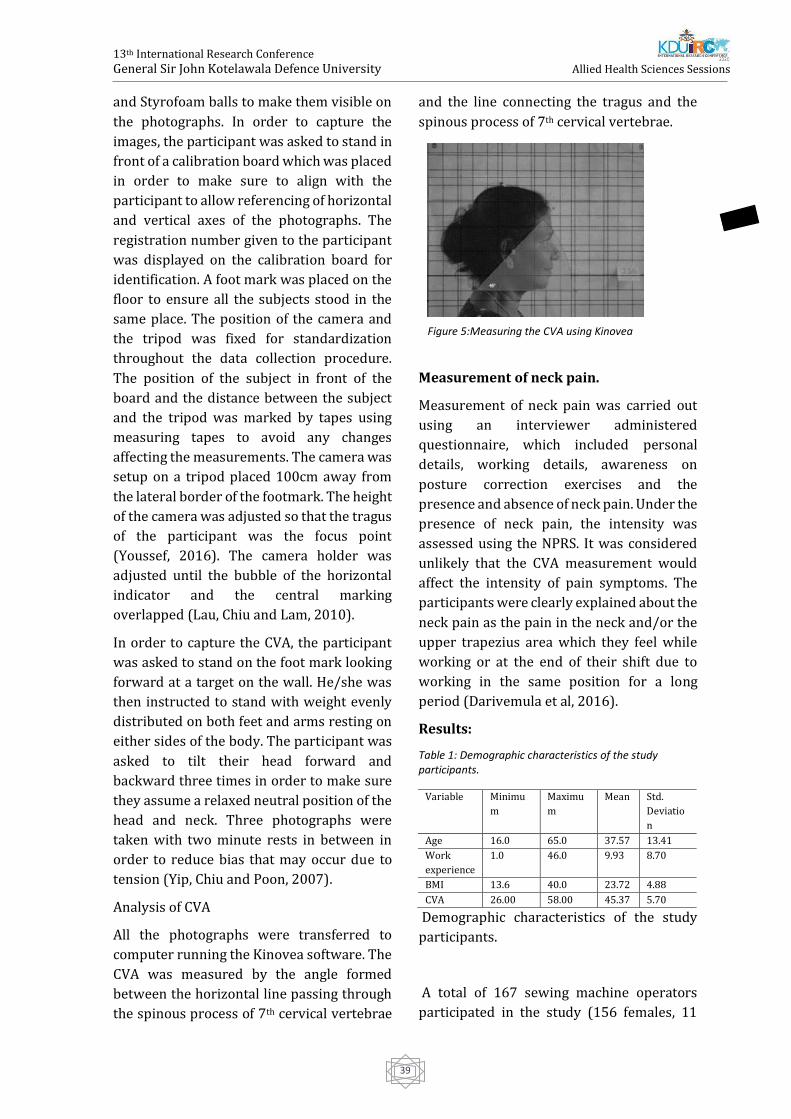
13th International Research Conference
General Sir John Kotelawala Defence University
Allied Health Sciences Sessions
39
and Styrofoam balls to make them visible on
the photographs. In order to capture the
images, the participant was asked to stand in
front of a calibration board which was placed
in order to make sure to align with the
participant to allow referencing of horizontal
and vertical axes of the photographs. The
registration number given to the participant
was displayed on the calibration board for
identification. A foot mark was placed on the
floor to ensure all the subjects stood in the
same place. The position of the camera and
the tripod was fixed for standardization
throughout the data collection procedure.
The position of the subject in front of the
board and the distance between the subject
and the tripod was marked by tapes using
measuring tapes to avoid any changes
affecting the measurements. The camera was
setup on a tripod placed 100cm away from
the lateral border of the footmark. The height
of the camera was adjusted so that the tragus
of the participant was the focus point
(Youssef, 2016). The camera holder was
adjusted until the bubble of the horizontal
indicator and the central marking
overlapped (Lau, Chiu and Lam, 2010).
In order to capture the CVA, the participant
was asked to stand on the foot mark looking
forward at a target on the wall. He/she was
then instructed to stand with weight evenly
distributed on both feet and arms resting on
either sides of the body. The participant was
asked to tilt their head forward and
backward three times in order to make sure
they assume a relaxed neutral position of the
head and neck. Three photographs were
taken with two minute rests in between in
order to reduce bias that may occur due to
tension (Yip, Chiu and Poon, 2007).
Analysis of CVA
All the photographs were transferred to
computer running the Kinovea software. The
CVA was measured by the angle formed
between the horizontal line passing through
the spinous process of 7th cervical vertebrae
and the line connecting the tragus and the
spinous process of 7th cervical vertebrae.
Measurement of neck pain.
Measurement of neck pain was carried out
using an interviewer administered
questionnaire, which included personal
details, working details, awareness on
posture correction exercises and the
presence and absence of neck pain. Under the
presence of neck pain, the intensity was
assessed using the NPRS. It was considered
unlikely that the CVA measurement would
affect the intensity of pain symptoms. The
participants were clearly explained about the
neck pain as the pain in the neck and/or the
upper trapezius area which they feel while
working or at the end of their shift due to
working in the same position for a long
period (Darivemula et al, 2016).
Results:
Table 1: Demographic characteristics of the study participants.
Demographic characteristics of the study
participants.
A total of 167 sewing machine operators
participated in the study (156 females, 11
Variable Minimu
m
Maximu
m
Mean Std.
Deviatio
n
Age 16.0 65.0 37.57 13.41
Work
experience
1.0 46.0 9.93 8.70
BMI 13.6 40.0 23.72 4.88
CVA 26.00 58.00 45.37 5.70
Figure 5:Measuring the CVA using Kinovea
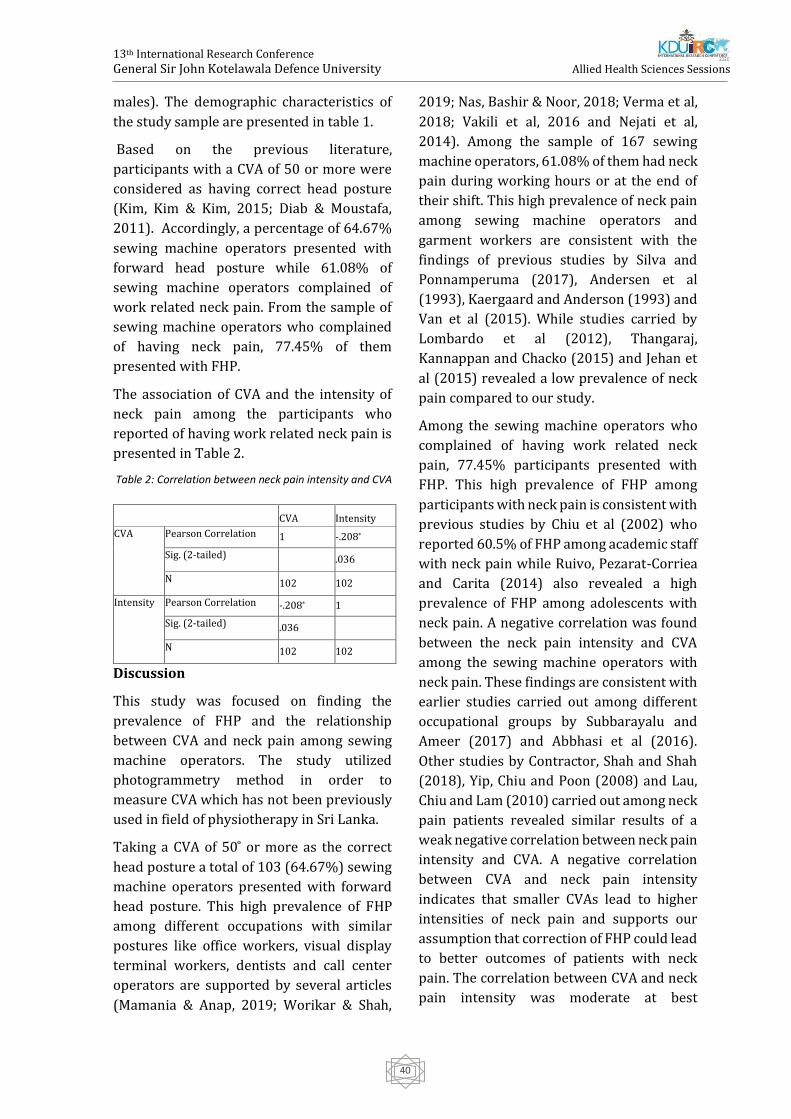
13th International Research Conference
General Sir John Kotelawala Defence University
Allied Health Sciences Sessions
40
males). The demographic characteristics of
the study sample are presented in table 1.
Based on the previous literature,
participants with a CVA of 50 or more were
considered as having correct head posture
(Kim, Kim & Kim, 2015; Diab & Moustafa,
2011). Accordingly, a percentage of 64.67%
sewing machine operators presented with
forward head posture while 61.08% of
sewing machine operators complained of
work related neck pain. From the sample of
sewing machine operators who complained
of having neck pain, 77.45% of them
presented with FHP.
The association of CVA and the intensity of
neck pain among the participants who
reported of having work related neck pain is
presented in Table 2.
Table 2: Correlation between neck pain intensity and CVA
Discussion
This study was focused on finding the
prevalence of FHP and the relationship
between CVA and neck pain among sewing
machine operators. The study utilized
photogrammetry method in order to
measure CVA which has not been previously
used in field of physiotherapy in Sri Lanka.
Taking a CVA of 50 ̊ or more as the correct
head posture a total of 103 (64.67%) sewing
machine operators presented with forward
head posture. This high prevalence of FHP
among different occupations with similar
postures like office workers, visual display
terminal workers, dentists and call center
operators are supported by several articles
(Mamania & Anap, 2019; Worikar & Shah,
2019; Nas, Bashir & Noor, 2018; Verma et al,
2018; Vakili et al, 2016 and Nejati et al,
2014). Among the sample of 167 sewing
machine operators, 61.08% of them had neck
pain during working hours or at the end of
their shift. This high prevalence of neck pain
among sewing machine operators and
garment workers are consistent with the
findings of previous studies by Silva and
Ponnamperuma (2017), Andersen et al
(1993), Kaergaard and Anderson (1993) and
Van et al (2015). While studies carried by
Lombardo et al (2012), Thangaraj,
Kannappan and Chacko (2015) and Jehan et
al (2015) revealed a low prevalence of neck
pain compared to our study.
Among the sewing machine operators who
complained of having work related neck
pain, 77.45% participants presented with
FHP. This high prevalence of FHP among
participants with neck pain is consistent with
previous studies by Chiu et al (2002) who
reported 60.5% of FHP among academic staff
with neck pain while Ruivo, Pezarat-Corriea
and Carita (2014) also revealed a high
prevalence of FHP among adolescents with
neck pain. A negative correlation was found
between the neck pain intensity and CVA
among the sewing machine operators with
neck pain. These findings are consistent with
earlier studies carried out among different
occupational groups by Subbarayalu and
Ameer (2017) and Abbhasi et al (2016).
Other studies by Contractor, Shah and Shah
(2018), Yip, Chiu and Poon (2008) and Lau,
Chiu and Lam (2010) carried out among neck
pain patients revealed similar results of a
weak negative correlation between neck pain
intensity and CVA. A negative correlation
between CVA and neck pain intensity
indicates that smaller CVAs lead to higher
intensities of neck pain and supports our
assumption that correction of FHP could lead
to better outcomes of patients with neck
pain. The correlation between CVA and neck
pain intensity was moderate at best
CVA Intensity
CVA Pearson Correlation 1 -.208*
Sig. (2-tailed) .036
N 102 102
Intensity Pearson Correlation -.208* 1
Sig. (2-tailed) .036
N 102 102
13th International Research Conference
General Sir John Kotelawala Defence University
Allied Health Sciences Sessions
41
according to our results which suggests it
could be one of the factors related to neck
pain and the other factors needs to be
addressed through further studies. As this
was a cross sectional study we were unable
to establish the cause and effect relationship
between head posture and neck pain and
self-report of inclusion and exclusion criteria
may not be the most ideal. We did not
exclude or screen for psychological stress,
balance disorders or visual deficiencies
which may affect the head posture.
Furthermore, we did not analyze the
characteristics of the entire spine. This needs
to be addressed in future studies as the
changes in lumbar and thoracic spine may
affect the head posture.
Conclusion:
In conclusion, the results of our study
revealed a high prevalence of FHP and neck
pain among sewing machine operators and a
high percentage of participants with FHP
among sewing machine operators with neck
pain. The study revealed a significant weak
negative correlation of CVA with neck pain
intensity. Our study results reinforce the
importance of developing better ergonomics
in the work place as well as introducing
sessions of posture correction and relaxation
exercises among sewing machine operators
during the rest breaks. The results also
support the importance of assessing the
cervical posture in patients with neck pain in
the clinical setup and including posture
correction exercises along with conventional
treatments in the clinical set up for the
treatment of neck pain.
References:
Abbasi, A.H., Aslam, M., Ashraf, T. & Malik, A.N.
(2016) Evaluation of the Forward Head Posture ,
its association with Neck Pain & Quality of life of
Female DPT Students. Journal of Rphah College of
Rehabilitation Sciences. [online] 4(2), pp. 59–64.
Available from:
http://www.scopemed.org/?jid=130 [Accessed
March 19 2019].
Andersen, J.H. & Gaardboe, O. (1993) Prevalence
of Persistent Neck and Upper Limb Pain in a
Historical Cohort of Sewing Machine Operators.
American Journal of Industrial Medicine. [online]
687, 677–687.
Binder, A. (2008) Neck pain. BMJ Clinical
Evidence. [online] 2008:1103
Chaiklieng, S. & Krusun, M. (2015) Health risk
assessment and incidence of shoulder pain
among office workers. Procedia Manufacturing.
[online] Available from:
https://sciencedirect.com/science/article/pii/S
235197891500637X [Accessed February 21
2019].
Chiu, T.T.W., Ku, W.Y., Lee, M.H., Sum, W.K., Wan,
M.P., Wong, Y.C. & Yuen,C.K. (2002) A Study on
the Prevalence of and Risk Factors for Neck Pain
Among University Academic Staff in Hong Kong.
Journal of Occupational Rehabilitation. [online]
12(2), 77–91.
Contractor, E.S., Shah, S. & Shah, S.J. (2018) To
study correlation between neck pain and cranio-
vertebral angle in young adults. International
Archives of Intergrated Medicine. [online] 5(4),
81–86. Available from: http://iaimjoural.com/
[Accessed March 19 2019].
Darivemula, S.B., Goswami, K., Gupta, S.K., Salve,
H., Singh, U., & Goswami, A.K. (2016) Work-
related Neck Pain Among Desk Job Workers of
Tertiary Care Hospital in New Delhi, India:
Burden and Determinants. Indian journal of
community medicine: official publication of Indian
Association of Preventive & Social Medicine.
[online] 41(1), 50–54. Available from:
https://doi.org/10.4103/0970-0218.170967
[Accessed March 17 2019].
Fejer, R., Kyvik, K. & Hartvigsen, J. (2006) The
prevalence of neck pain in the world population:
A systematic critical review of the literature.
European Spine Journal. [online] 15(6), 834–848.
Available from:
https://www.ncbi.nlm.nih.gov/pmc/articles/PM
C3489448 [Accessed March 3 2019].
Gadotti, I.C. & Biasotto-Gonzalez, D.A. (2010)
Sensitivity of clinical assessments of sagittal head
posture. Journal of Evaluation in Clinical Practice.
[online] 16,(1). Available from: doi:
10.1111/j.1365-2753.2009.01137.x
13th International Research Conference
General Sir John Kotelawala Defence University
Allied Health Sciences Sessions
42
Grimmer-somers, K., Milanese, S. & Louw, Q.
(2008)Measurement of cercical posture in the
sagittal plane. Journal of manipulative and
physiological therapeutics. 31, 509–517. Available
from: doi: 10.1016/j.jmpt.2008.08.005
Jahan, N., Das, M., Mondal, R., Saha, T., Akthar, R.,
Khan, A.M., Banik, P.C. & Paul, S. (2015)
Prevalence of Musculoskeletal Disorders among
the Bangladeshi Garments Workers. SMU Medical
Journal. [online] 2(1).
Keargaard, A. & Andersen, J.H. (2000)
Musculoskeletal disorders of the neck and
shoulders in female sewing machine operators:
prevalence, incidence, and prognosis.
Occupational environmental medicine. [online]
Available from:
https://www.ncbi.nih.gov/pmc/articles/PMC17
0005/ [Accessed March 19 2019].
Kendall, F.P. (1993) Muscle Testing and Function.
[online] Baltimore, Maryland USA: Williams and
Wilkins.
Kim, E.K. & Kim, J.S. (2016) Correlation between
rounded shoulder posture, neck disability
indices, and degree of forward head posture.
Journal of Physical Therapy Science. [online]
28(10), 2929–2932. Available from: doi:
10.1589/jpts.28.2929
Lau, H.M.C., Chiu, T.T.W. & Lam, T.H. (2010)
Measurement of craniovertibral angle with
Electronic Head Posture Instrument: Criterian
Validity. Journal of Rehabilitation Research &
Development. [online] 47(9), 911–918. Available
from: doi:10.1682/JRRD.2010.010001 [Accessed
February 8 2019].
Lee, H., Chung, H. & Park, S. (2016) The Analysis
of severity of forward head posture with
observation and photographic method. Journal of
the Korean Society of Physical Medicine. [online]
10, (3), 9–17. Available from: doi:
10.13066/kspm.2015.10.3.9. [Accessed January
16 2019].
Levangie, P.K., Norkin, C.C. & Lewek, M.D. (2011)
Joint structure & function: a comprehensive
analysis. [online] 5th edn. Philadelphia: F. A. Davis
Company.
Lombardo, S.R., Silva, P.V., Lipscomb, H.J. &
Ostbye, T. (2012) Musculoskeletal symptoms
among female garment factory workers in Sri
Lanka. International Journal of Occupational and
Environmental Health. [online] 18(3). Available
from: doi: 10.1179/1077352512Z.00000000029
[Accessed January 30 2019].
Mamania, J. & Anap, D. (2019) Prevalence of
Forward Head Posture amongst Physiotherapy
Students: A Cross-sectional Study. International
Journal of Education and Research in Health
Sciences. [online] 1(4), 125– 127. Available from:
doi: 10.5005/jp-journals-10056-0105 [Accessed
March 25 2019].
Mehta, M., Gahlot, N., & Singh, K. (2018)
Assessment of Postural Discomfort among
Female Sewing Machine Operators. International
Journal of Bio-resource and Stress Management.
[online] 7(1), 115–118. Available from: doi:
10.23910/ijbsm/2016.7.1.1387a [Accessed
January 23 2019].
Mohankumar, P. (2018) Head and Neck Posture
in Young Adults with Chronic Neck Pain.
International Journal of Recent Advances in
Multidisciplinary Research. [online] 4(11), 2946-
2951.
Naz, A., Bashir, M.S. & Noor, R. (2018) Prevalance
of forward head posture among university
students. Rawal Medical Journal, [online] 43(2),
260–262. Available from:
https://www.researchgate.net/publication/325
581945_Prevalance_of_forward_head_posture_a
mong_university_students [Accessed April 2
2019].
Nejati, P., Lotfian, S., Moezy, A. & Nejati, M. (2015)
The study if correlation between forwardhead
posture and neck pain Iranian office workers.
International Journal of Occupational Medicine
and Environmental Health. [online] Available
from: http://ijomeh.eu/The-study-of-
correlation-between-forward-head-posture-and-
neck-pain-in-iranian-office-
workrs,1962,0,2.html [Accessed February 12
2019].
Physio-pedia.com. (2020) Physiopedia - universal
access to physiotherapy and physical therapy
knowledge, [online] Available from:
https://www.physio-pedia.com/home [Accessed
March 9 2019].
Ruivo, R.M., Pezarat-correia, P. & Carita, A.I.
(2014) Cervical and shoulder postural
13th International Research Conference
General Sir John Kotelawala Defence University
Allied Health Sciences Sessions
43
assessment of adolescents between 15 and 17
years old and association with upper quadrant
pain. Brazillian Journal of Physical Therapy.
[online] 18(4), 364-371, Available from:
http://dx.doi.org/10.1590/bjpt-rbf.2014.0027
[Accessed March 17 2019].
Silva, M.D.C. & Ponnamperuma, G.G. (2013)
Association between subjective neckpain and
characteristics of the neck region among female
sewing machiine operators. International Jpurnal
of Advanced Research. [online] 5(7), 2388-2395,
Available from:
http://dx.doi.org/10.21474/IJAR01/4984
[Accessed February 19 2019].
Subbarayalu, A.V. & Ameer, M.A. (2017)
Relationships among head posture, pain
intensity, disability and deep cervical flexor
muscle performance in subjects with postural
neck pain. Journal of Taibah University Medical
Sciences. [online] 3(7), Available from:
http://dx.doi.org/10.1016/j.jtumed.2017.07.001
[Accessed March 17 2019].
Thangaraj, P., Kannappan, S. & Chacko, T. (2019)
Occupation-Related Health Status of Women
Textile Workers in Tamil Nadu. International
Journal of Preventive Curattive Community
Medicine. [online] 1(4).
Vakili, L., Halabchi, F., Mansournia, M.A., Khami,
M.R., Irandoost, M. & Alizadeh, Z. (2016)
Prevalence of Common Postural Disorders
Among Academic Dental Staff. Asian ajournal of
Sports Medicine. [online] 7(2). Available from:
doi: 10.5812/asjsm.29631
Van, L., Chaiear, N., Sumananont, C. & Kannarath,
C. (2016) Prevalence of musculoskeletal
symptoms among garment workers in Kandal
province , Cambodia. Journal of Occupational
Health. [online] 58, 107–117.
Verma, S.L., Shaikh, J., Mahato, R.K. & Sheth, M.S.
(2018) Prevalence of forward head posture
among 12 – 16-year-old school going students —
A cross-sectional study. [online] 4(2), 18–21.
Available from: doi:
10.5455/amr.20180805064752
Wang, P.C., Rempel, D.M., Harrison, R.J., Chan, J. &
Ritz, B.R. (2007) Work-organizational and
personal factors associated with upper body
musculoskeletal disorders among sewing
machine operators. Occupational and
environmental medicine. [online] Available from:
https://www.ncbi.nlm.nih.gov/pmc/articles/PM
C2095384/ [Accessed March 19 2019].
Worlikar, A.N. & Shah, M.R. (2019) Incidence of
forward head posture and associated problems
among desktop users. International Journal of
Health Sciences and Research. 9(2), 96–100.
Yip, C.H.T., Chiu, T.T.W. & Poon, A.T.K. (2008) The
relationship between head posture and severity
and disability of patients with neck pain. Manual
Therapy. [online] 13(2), 148–154. Available from:
doi: 10.1016/j.math.2006.11.002
Youssef, A.R. (2016) Photogrammetric
quantification of forward head posture is side
dependant in haelthy participants and patients
with mechanical neck pain. International Journal
of Physiotherapy. [online] 3(3), 326-331 Available
from:
https://www.researchgate.net/publication/303
827063_Photogrammetric_Quantification_Of_For
ward_Head_Posture_Is_Side_Dependant_In_Haelt
hy_Participants_And_Patients_With_Mechanical_
Neck_Pain [Accessed January 24 2019].
13th International Research Conference
General Sir John Kotelawala Defence University
Allied Health Sciences Sessions
44
Prevalence Of Urinary Incontinence And Its Association With Risk
Factors In Three Months Postpartum Women Attending MOH Clinics
Registered Under Colombo Municipal Council During September And
October 2019
KMR Ranasinghe, MAN Madhurangi, IS Samarasinghe, NAVW Yapa, JI Widanagamage, VS
Ruwandika, and #GAD Perera
Department of Physiotherapy, Faculty of Allied Health Sciences, General Sir John Kotelawala Defence University,
Ratmalana, Sri Lanka.
Abstract: Urinary incontinence (UI) is a
common symptom after pregnancy causing
distress, embarrassment among women and
is often under reported due to misbelieves,
unawareness and shame. This study is aimed
to determine the prevalence and risk factors
of UI among three months postpartum
women attending Maternity and Child
Healthcare centres, registered under
Colombo Municipal Council. A descriptive
cross sectional study was carried out among
three months postpartum women of age 18 -
45 who were recruited consecutively until
the sample size of 420 was achieved. A
questionnaire including demographic data
and obstetric history was given and the
“Questionnaire for Urinary Incontinence
Diagnosis” (QUID) was given to diagnose the
type of UI. The prevalence of UI out of the 420
participants was identified as 17.4%, stress
urinary incontinence (SUI) as 6.0%, urge
urinary incontinence (UUI) as 7.9% and
mixed urinary incontinence (MUI) as 3.6%.
The results of the Multinomial Logistic
Regression test revealed that parity
(p=0.002), first birth (p=0.014) and
episiotomy (p=0.004) had a significant
association with UI whereas head
circumference (p=0.016), parity (p=0.053)
and first birth (p=0.023) had a significant
association with SUI. Parity (p=0.002) and
the number of normal vaginal deliveries
(p=0.034) had a significant association with
UUI while BMI (p=0.027), first birth
(p=0.016), episiotomy (p=0.047) and
gestational DM (p=0.030) had a significant
association with MUI. The prevalence of UI
among three months postpartum women
was 17.4% and UUI was the most prevalent.
Parity, first birth and episiotomy were the
risk factors that had a significant association
with UI.
KeyWords: prevalence, urinary
incontinence, risk factors
Introduction:
Urinary incontinence is a common
stigmatizing condition among females
which has a devastating impact on the
quality of life this affecting their physical,
psychological, social and economic wellbeing
(Hunskar et al, 2004). A systematic review
that was conducted among 33 population
based studies concluded the global
prevalence of UI in three months postpartum
women to be 33% (Thom & Rortveit, 2010).
Even though UI has social and cultural
implications, limited studies have been
conducted in Asian countries moreover this
kind of a study has not been conducted in Sri
Lanka. The aim of this study was to find out
the prevalence of Urinary Incontinence and
its association with risk factors for Urinary
Incontinence among population.
Methodology
This research was a descriptive cross
sectional study conducted among all eligible
13th International Research Conference
General Sir John Kotelawala Defence University
Allied Health Sciences Sessions
45
three months’ postpartum mothers who
attended MOH clinics registered under the
Colombo Municipal Council during
September and October 2019.Three months
postpartum women within the age range 18-
45 years who were able to read and write
were included in the study sample while
three months postpartum mothers who
suffered from urinary tract infections at the
time of data collection and who had UI prior
to pregnancy were excluded. Sample size was
calculated using a standardised equation for
sample size calculation as stated by Arifin
(2013). Accordingly 420 three months
postpartum mothers were recruited
consecutively until the sample size was
achieved.
Data were collected from two interviewer
administered questionnaires. Initially a
questionnaire inquiring demographic and
clinical data was given; the validity of the
questionnaire was assessed by three
specialists experienced in Obstetrics and
gynaecology. A Questionnaire for Urinary
Incontinence Diagnosis (QUID) was used to
diagnosed the type of UI, the questionnaire
was validated by Bradely et al (2010) and
translated by language specialists to
Sinhala and Tamil and rechecked by subject
professionals and was back translated. A pre-
test was done for both questionnaires on ten
three months postpartum women who
attended the Kuppiyawatta MOH. All
investigators were trained to interview the
participants and one investigator was
trained to measure the height and weight.
Data were entered into Statistical package
for Social Sciences (SPSS) version 23-
computer software and analysed
accordingly. Risk factors were analysed using
Multi-nominal logistic regression (MLR).
Results
Descriptive details (mean, standard
deviation, median, mode, minimum and
maximum) of mother’s age, mother’s BMI,
newborn’s birth weight and head
circumference are shown in table 1. In
reference to the descriptive statistics, the
sample consisted of three months
postpartum mothers between ages 18 to 42
years.
Table 1: Descriptive Details
Prevalence of UI, SUI, UUI
The prevalence of UI among the 420 three
months postpartum mothers was 17.4% of
which 6.0% (n= 25) was SUI, 7.9% (n=33)
was UUI and 3.6% (n=15) was MUI. The
prevalence of three types of urinary
incontinence as a percentage of the
diagnosed women was 34.2% of SUI, 45.2%
of UUI and 20.5% of MUI. Multinomial logistic
regression was performed on the current
study to model the relationship between
types of UI (SUI, UUI, MUI) and its association
with risk factors.
Parity ( p=0.002), First Birth ( p=0.014) and
Episiotomy (p=0.004) were noted as the risk
factors that had a significant association with
UI.
Table 2: Parameter Estimates of the significant risk factors relative to the type of urinary incontinence
Characteristics Mean ± SD Median Mode Max Min
Age 28.01 ±5.79 27.00 26 42 18
BMI 25.79 ±5.00 25.75 24 51.3 14.8
Birth weight 2.90 ± 0.49 2.90 2.9 4.82 1.00
Head
Circumference
32.78± 1.94 32.88 33 45 24
Type Risk factors B Sig.
SUI Head circumference .342 .016
Parity:
Primiparous
Multiparous
-1.189
0b
.050
First birth:
LSCS
NVD
-3.034
0b
0.23
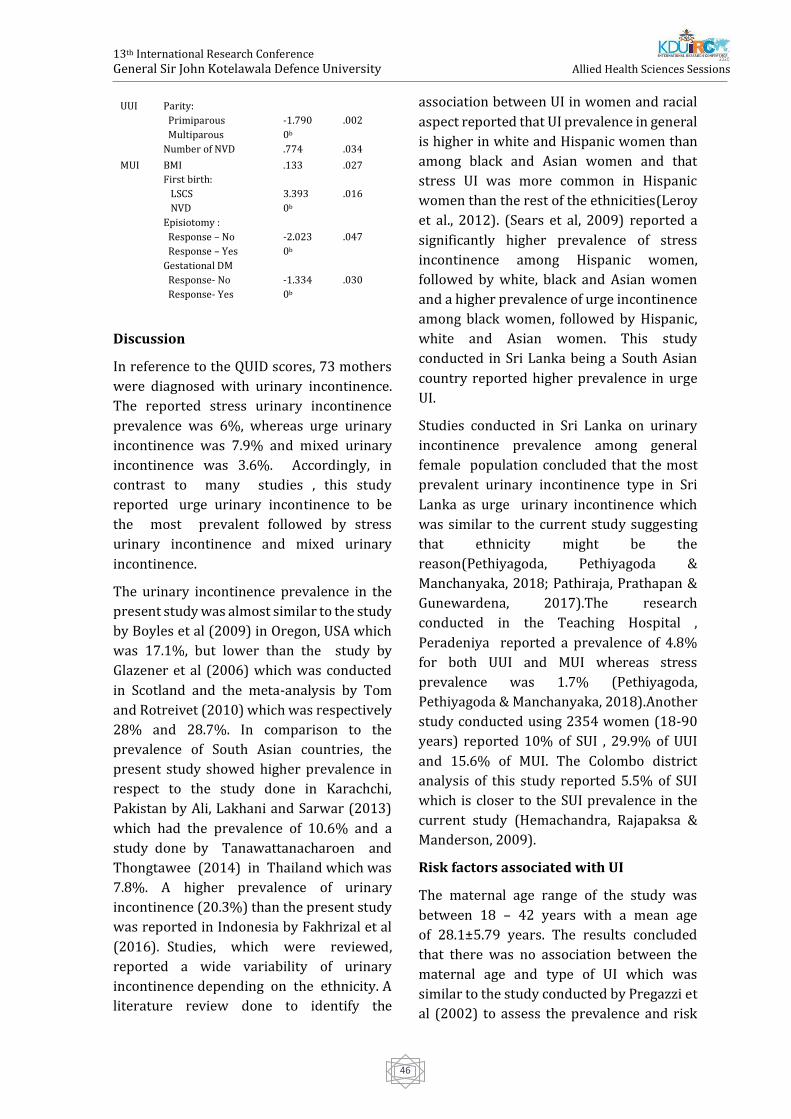
13th International Research Conference
General Sir John Kotelawala Defence University
Allied Health Sciences Sessions
46
Discussion
In reference to the QUID scores, 73 mothers
were diagnosed with urinary incontinence.
The reported stress urinary incontinence
prevalence was 6%, whereas urge urinary
incontinence was 7.9% and mixed urinary
incontinence was 3.6%. Accordingly, in
contrast to many studies , this study
reported urge urinary incontinence to be
the most prevalent followed by stress
urinary incontinence and mixed urinary
incontinence.
The urinary incontinence prevalence in the
present study was almost similar to the study
by Boyles et al (2009) in Oregon, USA which
was 17.1%, but lower than the study by
Glazener et al (2006) which was conducted
in Scotland and the meta-analysis by Tom
and Rotreivet (2010) which was respectively
28% and 28.7%. In comparison to the
prevalence of South Asian countries, the
present study showed higher prevalence in
respect to the study done in Karachchi,
Pakistan by Ali, Lakhani and Sarwar (2013)
which had the prevalence of 10.6% and a
study done by Tanawattanacharoen and
Thongtawee (2014) in Thailand which was
7.8%. A higher prevalence of urinary
incontinence (20.3%) than the present study
was reported in Indonesia by Fakhrizal et al
(2016). Studies, which were reviewed,
reported a wide variability of urinary
incontinence depending on the ethnicity. A
literature review done to identify the
association between UI in women and racial
aspect reported that UI prevalence in general
is higher in white and Hispanic women than
among black and Asian women and that
stress UI was more common in Hispanic
women than the rest of the ethnicities(Leroy
et al., 2012). (Sears et al, 2009) reported a
significantly higher prevalence of stress
incontinence among Hispanic women,
followed by white, black and Asian women
and a higher prevalence of urge incontinence
among black women, followed by Hispanic,
white and Asian women. This study
conducted in Sri Lanka being a South Asian
country reported higher prevalence in urge
UI.
Studies conducted in Sri Lanka on urinary
incontinence prevalence among general
female population concluded that the most
prevalent urinary incontinence type in Sri
Lanka as urge urinary incontinence which
was similar to the current study suggesting
that ethnicity might be the
reason(Pethiyagoda, Pethiyagoda &
Manchanyaka, 2018; Pathiraja, Prathapan &
Gunewardena, 2017).The research
conducted in the Teaching Hospital ,
Peradeniya reported a prevalence of 4.8%
for both UUI and MUI whereas stress
prevalence was 1.7% (Pethiyagoda,
Pethiyagoda & Manchanyaka, 2018).Another
study conducted using 2354 women (18-90
years) reported 10% of SUI , 29.9% of UUI
and 15.6% of MUI. The Colombo district
analysis of this study reported 5.5% of SUI
which is closer to the SUI prevalence in the
current study (Hemachandra, Rajapaksa &
Manderson, 2009).
Risk factors associated with UI
The maternal age range of the study was
between 18 – 42 years with a mean age
of 28.1±5.79 years. The results concluded
that there was no association between the
maternal age and type of UI which was
similar to the study conducted by Pregazzi et
al (2002) to assess the prevalence and risk
UUI Parity:
Primiparous
Multiparous
-1.790
0b
.002
Number of NVD .774 .034
MUI BMI .133 .027
First birth:
LSCS
NVD
3.393
0b
.016
Episiotomy :
Response – No
Response – Yes
-2.023
0b
.047
Gestational DM
Response- No
Response- Yes
-1.334
0b
.030
13th International Research Conference
General Sir John Kotelawala Defence University
Allied Health Sciences Sessions
47
factors of three months postpartum women
within the age range 19 – 44 years? Helena
and Moraes (2016) concluded another study
among mothers within the age range 13 – 45
(mean 25.9±7.7 years) which also reported a
similar outcome. In contrast to all above
studies, Zhu et al (2012) and Macarthur et al
(2015) have both concluded that the increase
of maternal age increased the risk of having
UI.
Next, the current study identified the mean
BMI of three months postpartum mothers to
be 25.79±5.00 kgm-2, which had no
association with the types of UI. Helena and
Moraes (2016) also had reported similar
results in their studies, while Macarthur et al
(2015) and Eftekhar et al (2006) reported
controversial results, showing an association
between BMI and UI. A case control study
by Helena and Moraes (2016), Boyles et al
(2009) and Tanawattanacharoen and
Thongtawee (2014) stated that there was no
association between the birth weight of the
newborn and the prevalence of UI which
supported the results of the current study
(mean birth weight 2.9±0.49kg), but
Glazener et al (2006) concluded that the
baby’s birth weight had a significant
association with UI which was a contentious
result for the current study.
Another factor analysed in the present study
was head circumference of the newborn
baby which had a mean of 32.78 ± 1.94, the
results revealed a significant association
with SUI which was consistent with the study
by Vikrupt (1992) but controversial with
EPINCOT a study by Rortveit et al (2003)
which showed a significant association with
UUI. However,Pregazzi et al (2002) and
Burgio et al (2003) interpreted a completely
different outcome concluding that the head
circumference had no association with UI.
Parity had been a significant risk factor that
associated with UI Macarthur et al (2015),
Helena and Moraes (2016) and Lin et al
(2018) concluded parity as a significant
determinant of SUI. This was compatible
with the findings of the current study, which
reported a significant association between
SUI and UUI in three months postpartum
women. Pregazzi et al (2002) also reported
similar results. In contrast,
Tanawattanacharoen and Thongtawee
(2014) concluded that the parity had no
relationship with UI.
The current study also found that most of the
mothers suffering from UI stated NVD as the
mode of delivery of their first pregnancy
which revealed that NVD being the mode
of delivery of the first pregnancy to have a
significant association with SUI and MUI
which was supported in the EPINCOT study
by Rortveit et al (2001). A longitudinal
cohort study by Viktrup, Rortveit and Lose
(2007) concluded that mode of delivery of
the first pregnancy being LSCS seemed to
reduce the risk of long term while Eason et al
(2004) concluded that first birth being NVD
as a risk to develop SUI.
Another factor that was analysed in the
study was GDM, which showed no
association with SUI or UUI but showed an
association with MUI. A longitudinal cohort
study by Chuang et al (2012) stated that
GDM was a risk factor for postpartum UI
irrespective of the type compared to women
who didn’t have GDM, but a few studies
stated that there was no association between
UI and GDM (Lin et al, 2018).
A case control study by Helena and Moraes
(2016) assessed the risk factors, identified
that women who had undergone vaginal
delivery were at higher risk of developing UI
than women who were submitted to LSCS.
Burgio et al (2003) concluded that
experiencing a NVD, doubled the risk of
developing UI in the postpartum period and
studies have also proposed that LSCS
prevented muscular and nerve damage to the
pelvic floor reduced the risk of developing
SUI compared to NVD (Snooks et al, 1990).
Many more studies have reported similar
13th International Research Conference
General Sir John Kotelawala Defence University
Allied Health Sciences Sessions
48
outcomes in their conclusions. The current
study was also in line with these results
presenting and association between the
number of NVD and UUI.
Finally, the results of the present study
showed a significant association between
episiotomy and MUI. Zhu et al (2012)
concluded that episiotomy had a significant
association with UI but in contrast, the study
by Helena and Moraes, (2016) concludes that
there is no association between MUI and
episiotomy.
Conclusion
In conclusion, the present study identified
the prevalence of UI as 17.4%, SUI as 6.0%,
UUI as 7.9% and MUI as 3.6% .The most
prevalent type of UI was UUI. The risk factors
that had a significant association with UI
were identified as Parity, First Birth and
Episiotomy. SUI had a significant association
with head circumference, parity and first
birth whereas number of vaginal deliveries
and parity showed a significant association
with UUI while first birth, episiotomy and
gestational DM showed a significant
association with MUI.
References:
Ali, H.S., Lakhani, N.A. & Sarwar, N. G. (2013)
Urinary incontinence three months after
delivery; prevalence and risk factors. Professional
Med J. [Online] 20(4), 530-536.
Available from:
http://www.theprofesional.com/index.php/tpm
j/article/download/1095/848 [Accessed 10th
April 2019].
Arifin, W. (2013) Introduction to sample size
calculation. Education in Medicine Journal.
[Online] 5(2). Available from: doi:
10.5959/eimj.v5i2.130 [Accessed 10th May 2019]
Boyles, S. H., Li, H., Mori, T. & Boyles, H. (2009)
Effect of mode of delivery on the
incidence of urinary incontinence in primiparous.
Obstet Gynecol. [Online] 113(1),134–
141. Available from: doi:
10.1097/AOG.0b013e318191bb37 [Accessed
17th March 2019].
Bradley, C., Rahn, D., Nygaard, I., Barber, M.,
Nager, C., Kenton, K., Siddiqui, N., Abel,
R., Spino, C. & Richter, H. (2010) the questionnaire
for urinary incontinence diagnosis
(QUID): validity and responsiveness to change in
women undergoing non-surgical
therapies for treatment of stress predominant
urinary incontinence. Neurourology and
Urodynamics.[Online] 29(5), 727-734. Available
from: doi 10.1002/nau [Accessed 20th June 2019].
Burgio, K. L., Zyczynski, H., Locher, J. L., Richter, H.
E., Redden, D. T. & Wright, K. C.
(2003) Urinary Incontinence in the 12-Month
Postpartum Period.Obstetrics &
Gynecology.[Online]102(6), 30–32. Available
from:
https://doi.org/10.1016/j.obstetgynecol.2003.0
9.013 [Accessed 25th March 2019
Chuang, C., Lin, I., Horng, H., Hsiao, Y., Shyu, I. &
Chou, P. (2012) The impact of
gestational diabetes mellitus on postpartum
urinary incontinence : a longitudinal cohort
study on singleton pregnancies. An International
Journal of Obstetrics and
Gynaecology.[Online] 119(11), 1–10. Available
from: doi: 10.1111/j.1471-0528.2012.03468.x
[Accessed 10th December 2019]
Eason, E., Labrecque, M., Marcoux, S. & Mondor, M.
(2004) Effects of carrying a
pregnancy and of method of delivery on urinary
incontinence: A prospective cohort
study.BMC Pregnancy and Childbirth.[Online] 4
(1),1–6. Available from: 10.1186/1471-2393-4-4
[Accessed 20th May 2019].
Eftekhar, T., Hajibaratali, B., Ramezanzadeh, F. &
Shariat, M. (2006) Postpartum
evaluation of stress urinary incontinence among
primiparas. International Journal of
13th International Research Conference
General Sir John Kotelawala Defence University
Allied Health Sciences Sessions
49
Gynaecology and Obstetrics.[Online] 94(2), 14–
118. Available from:doi:10.1016/j.ijgo.
2006.04.042 [Accessed 20th July 2019]
Fakhrizal, E., Priyatini, T., Santoso, B. I., Moegni, F.,
Djusad, S., Hakim, S. & Maryuni,
S. W. (2016) Clinical Research Prevalence and
risk factors of persistent stress urinary
incontinence at three months postpartum in
Indonesian women.Medical Journal of
Indonesia. [Online] 25(3),163–170. Available
from: doi: 10.13181/mji.v25i3.1407 [Accessed
13th March 2019].
Glazener, C. M. A., Herbison, G. P., Macarthur, C.,
Lancashire, R., Mcgee, M. A. &
Grant, A. M. (2006) New postnatal urinary
incontinence : obstetric and other risk factors
in primiparae. An International Journal of
Obstetrics and Gynaecology.[Online]
113(2),208–217. Available from:
10.1111/j.1471-0528.2005.00840.x [Accessed
29th April 2019].
Helena, M. & Moraes, B. De (2016) Risk factors for
postpartum urinary
incontinence.Journal of School of
Nursing,USP.[Online]50(2) ,200–207.Available
from:doi: 10.1590/S0080-
623420160000200004 [Accessed 13th May
2019].
Hemachandra, N., Rajapaksa, L. & Manderson, L.
(2009) A “usual occurrence:” stress
incontinence among reproductive aged women in
Sri Lanka. Social Science & Medicine.
[Online] 69(9), 1395-1401.Available from:
doi:10.1016/j.socscimed.2009.08.019
[Accessed 25th February 2019].
Hunskaar, S., Lose, G., Sykes, D. & Voss, S. (2004)
The prevalence of urinary
incontinence in women in four European
countries. BJU International.[Online]
93(3),324–330.Available from:
doi:10.1111/j.1464-410X.2004.04609.x
[Accessed 10th April 2019].
Leroy, L. da S., Lopes, M. H. B. de M. and Shimo, A. K.
K. (2012) Urinary incontinence in women and
racial aspects: A literature review.Texto e Contexto
Enfermagem.[Online] 21(3), 692–701. Available
from: https://doi.org/10.1590/S0104-
07072012000300026[Accessed 12th April 2019].
Lin, Y., Chang, S., Hsieh, W. & Chang, Y. (2018)
Persistent stress urinary incontinence
during pregnancy and one year after delivery ; its
prevalence , risk factors and impact on
quality of life in Taiwanese women : An
observational cohort study. Taiwanese Journal
of Obstetrics & Gynecology.[Online]57(3) ,340–
345. Available from:
doi:10.1016/j.tjog.2018.04.003 [Accessed 18th
February 2019].
Macarthur, C., Wilson, D., Herbison, P., Lancashire,
R. J., Hagen, S., Toozs-hobson, P. &
Dean, N. (2015) Urinary incontinence persisting
after childbirth : extent , delivery history
, and effects in a 12 – year longitudinal cohort
study.An International Journal of
Obstetrics & Gynaecology.[Online] 123(6),1–
8.Available from: doi: 10.1111/1471-0528.13395
[Accessed 1st April 2019].
Pathiraja, R., Prathapan, S. and Gunewardena, S.
(2017) Impact of urinary incontinence
on quality of life of women in a community
sample in three districts of Sri Lanka – a
cross sectional study. Sri Lanka Journal of
Obstetrics and Gynaecology. [Online] 39(3),
43. Available from: doi:
10.4038/sljog.v39i3.7817 [Accessed 15th July
2019].
Pethiyagoda, A. (2019) Prevalence of urinary
incontinence in women; experience of
single tertiary referral centre in Sri Lanka.
European Journal of Biomedical and
Pharmaceutical Sciences. [Online] 5(12),1–5.
Available from: https://www.ejbps.com
[Accessed 25th February].
Pregazzi, R., Sartore, A., Troiano, L., Grimaldi, E.,
Bortoli, P., Siracusano, S. &
13th International Research Conference
General Sir John Kotelawala Defence University
Allied Health Sciences Sessions
50
Guaschino, S. (2002) Postpartum urinary
symptoms : prevalence and risk factors.
Uropean Journal of Obstetrics & Gynecology and
Reproductive Biology.
[Online]103(2),179–182. Available from: doi:
10.1016/s0301-2115(02)00045-3
[Accessed 10th April 2019].
Rortveit, G., Daltveit, A., Hannestad, Y. &
Hunskaar, S. (2003) Vaginal delivery
parameters and urinary incontinence: The
Norwegian EPINCONT stuy. American
Journal of Obstetrics and Gynecology. [Online]
189(5), 1268-1274. Available from: doi:
10.1067/s0002-9378(03)00588-x [Accessed 5th
October 2019].
Rortveit, G., Hannestad, Y. S., Daltveit, A. K. &
Hunskaar, S. (2001) Age- and TypeDependent
Effects of Parity on Urinary Incontinence.
Obstetrics & Gynecology.[Online]
98(6), 1004–1010. Available from: doi:
10.1097/00006250-200112000-00004
[Accessed 24th May 219].
Sears, C., Wright, J., O'Brien, J., Jezior, J.,
Hernandez, S., Albright, T., Siddique, S. & Fischer,
J., (2009) The Racial Distribution of Female Pelvic
Floor Disorders in an Equal Access Health Care
System. Journal of Urology.[Online] 181(1),187-
192. Available from: doi:
10.1016/j.juro.2008.09.035 [Accessed 26th May
2019].
Snooks, S. J., Swash, M., Mathers, S. E. & Henry, M.
M. (1990) Effect of vaginal
delivery on the pelvic floor: A 5‐year follow‐up.
British Journal of Surgery.
[Online]77(12), 1358–1360. Available from: doi:
10.1002/bjs.1800771213 [Accessed 25th July
2019].
Tanawattanacharoen, S. & Thongtawee, S. (2014)
Prevalence of urinary incontinence
during the late third trimester and three months
postpartum period in King Chulalongkorn
Memorial Hospital. Journal of the Medical
Association of Thailand.[Online] 96(2), 144-9.
Available from:
https://www.ncbi.nlm.nih.gov/pubmed/239369
78 [Accessed 26th February 2019].
Thom, D. H. & Rortveit, G. (2010) Prevalence of
postpartum urinary incontinence: A
systematic review. Acta Obstetricia et
Gynecologica Scandinavica.[Online]
89(12),1511–
1522. Available from:doi:
10.3109/00016349.2010.526188 [Accessed 11th
March 2019].
Viktrup, L., Lose, G., Rolff, M. & Barfoed, K. (1992)
The symptom of stress
incontinence caused by pregnancy or delivery in
primiparas. Obstet Gynecol. [Online]
79(6), 945-9499.Available from:
https://europepmc.org/article/med/1579319
[Accessed
10th March 2019].
Viktrup, L., Rortveit, G. & Lose, G. (2007) Risk of
stress urinary incontinence twelve
years after the first pregnancy and delivery.
Obstetrical & Gynecological Survey.
[Online] 62(5), 305-306. Available from: doi:
10.1097/01.ogx.0000261649.71135.63
[Accessed 14th February 2019].
Zhu, L., Li, L., Lang, J. & Xu, T. (2012) Prevalence
and risk factors for peri- and
postpartum urinary incontinence in primiparous
women in China: a prospective
longitudinal study. International Urogynecology
Journal. [Online] 23(5), 563-572.
Available from: doi: 10.1007/s00192-011-1640-
8 [Accessed 14th February 2019].
13th International Research Conference
General Sir John Kotelawala Defence University
Allied Health Sciences Sessions
51
Antimicrobial Susceptibility Patterns Of Blood Culture Isolates From
Cancer Patients After Anti-Cancer Therapy.
#RM Flemin , SAR Thakshala, SP Gunasekara, AK Chandana and UTN Senaratne
Department of Medical Laboratory sciences, Faculty of Allied Health Sciences, General Sir John
Kotelawala Defence University, Sri Lanka.
National Cancer Institute, Sri Lanka
Department of Multi-disciplinary sciences, Faculty of Allied Health Sciences, General Sir John Kotelawala
Defence University, Sri Lanka.
Abstract: Blood stream infections (BSI) have
a major impact on cancer patients.
Antimicrobial patterns in pathogens should
be analyzed by routine surveillance since
they vary among different healthcare
facilities and geographical area. This study
focuses on epidemiology, clinical features,
and antimicrobial profiles of cancer patients
with BSI after anticancer therapy. A
Descriptive cross-sectional study was
conducted within a period of 4 months. The
causative agents and antibiotic profiles were
studied according to Clinical Laboratory
Standards institutes (CLSI) and VITEK
automated system. Antibiotic profiles of
organisms and antibiotic resistance patterns
were analyzed in terms of frequency. The
prevalence of BSI was 11.75%. Gram
negative bacilli (GNB) were higher than gram
positive cocci (GPC). Among GNB the most
prevalent was Klebsiella pneumoniae and
among GPC it was, Staphylococcus aureus.
Prevalence of multi-drug resistance (MDR)
was 78.8%. High resistance to Erythromycin
was seen in patients with hematological
cancers while high resistance to Benzyl
penicillin was seen in patients with solid
cancers. Chemotherapy had no significant
impact on presence of multi-drug resistance
while the association between CRP with ANC
and presence of fever was not significant.
Among different antibiotic resistant groups,
ESBL and Carbapenem resistances were
noted. According to our study high
prevalence of antimicrobial resistance in
Gram-negative isolates and emergence of
MDR pathogens is alarming. Investigation of
novel antibiotics, usage of combination
therapy and usage according to the standard
antimicrobial susceptibility testing may help
to decrease or prevent the emergence of
antibiotic resistance.
Keywords: - Cancer, Blood-stream
infections, Antimicrobial resistance.
Introduction:
Blood stream infections (BSI) have a
significant impact on cancer patients. It is the
most common complication seen in patients
with hematological malignancies such as
lymphomas, leukemia, multiple myeloma
and febrile neutropenia (Trecarichi et al.,
2009) and in patients with oncological
malignancies such as solid tumors. The
prevalence of BSI lies between 11 to 38%
while mortality reaches 40% (Montassier et
al., 2013).
Cancer patients have a high risk of infection
due to prolong neutropenic conditions,
damages caused due to cytotoxic agents and
altered gut flora due to antibiotic usage
(Saghir et al.,2009). Apart from surgical
operations, radiation therapy, myelo-
suppressive cytotoxic chemotherapy,
frequent use of invasive procedures such as
central venous catheters and
immunosuppression status caused by the
13th International Research Conference
General Sir John Kotelawala Defence University
Allied Health Sciences Sessions
52
malignancy itself will make the patients
more vulnerable to BSI.(Marin et al.,2014,
Rolston,2017). Previous studies have mostly
focused on BSI due to hematological
malignancies, but patients with solid cancers
that undergo surgery too possess a high
potential in acquiring BSI. It could be
acquired endogenously such as normal flora
near operative sites or exogenously via
hospital environment such as air, medical
staff and equipment (Homsi et al.,2000,
Nurain et al.,2015).
The development of BSI hinders the ongoing
anticancer therapies such as chemotherapy
and radiation therapy by delaying its
administration and by reducing the dosage
that can be applied. This will also lead to
lengthening of hospital stay (Marin et
al.,2014, Montassier et al.,2013) and increase
costs related to patient care while
significantly increasing morbidity and
mortality (Rani et al.,2017).
A previous study (Chandrasiri et al.,2013)
carried out in Sri Lanka stated that adult
leukemia was the most frequent (15%)
clinical condition that supported BSI while
contribution of solid tumor was 9.7%.
Centers for disease control and prevention
(CDC) in USA has estimated that out of the
patients who undergo chemotherapy about
10% are subjected to infections (Telliant et
al.,2015).
Fever is considered as the principle indicator
and sometimes the only clinical presentation
of BSI. But it may also be shown as part of the
flu like syndrome in cancer patients
receiving chemical and biological therapy.
Therefore, attention should be given for
cancer patients with fever since it serves as
an indicator of early diagnosis (Nejad et
al.,2010). CRP is a statistically significant
predictor for BSI in adults (Al-Mulla et
al.,2014). Neutropenia refers to Absolute
Neutrophil Count (ANC) less than 500
cells/mm3 and it also plays a significant role
in BSI. It is considered as a risk factor in up to
25% of cancer patients with death rates
extending to 24% in high income countries
and 33% in low middle-income countries
(Lubwama et al., 2019). All these clinical data
play a significant role as indicators of BSI.
Recent studies show that gram negative
bacilli (GNB) are common in BSI in cancer
patients during aggressive therapy (Saghir et
al.,2009). According to (Marin et al.,2014)
the shift from gram positive to gram negative
is dependent on the geographical area. In US
Latin America gram negatives have been
found to be frequent while in Europe it was
gram positive. When considering gram
positive bacteria Genus staphylococcus were
more frequently isolated while Klebsiella
pneumoniae , E.coli and Pseudomonas
aeruginosa were isolated as gram negative
bacilli (Fentie et al.,2018).
Antimicrobial patterns in pathogens should
be analyzed by routine surveillance since
they vary among different healthcare
facilities and geographical area and also due
to the increase of Antimicrobial resistance
(AMR) in bacterial agents. BSI requires
immediate antibiotic treatment. Empiric
antibiotic therapy is used as the standard
practice until culture results are available.
This Empiric therapy is developed based on
knowledge of institution specific patterns of
microbial prevalence and resistances. Thus,
such studies are required to assist
antimicrobial therapy and control of
infections at different institutions.
(Lubwama et al.,2019). According to
previous studies information on BSI in solid
cancer patients is scarce and comparative
studies are also limited (Marin et al.,2014).
Therefore, this study focuses on
epidemiology, associations between clinical
features, causative organisms of BSI,
antimicrobial resistance between two
populations namely oncological and
hematological malignancies of cancer
patients with BSI and the association
13th International Research Conference
General Sir John Kotelawala Defence University
Allied Health Sciences Sessions
53
between chemotherapy and antimicrobial
resistance.
Methodology:
A descriptive Cross-sectional prospective
study was conducted at National cancer
institute Maharagama from August 2019 to
December 2019. Ethical clearance was
obtained from the Ethical review committee,
Faculty of Medicine, General Sir John
Kotelawala Defense University, Rathmalana
and Informed consent was taken from
National Cancer Institute, Maharagama. The
total number of 309 positive blood cultures
that met the inclusion criteria was examined.
Information on age, sex, clinical data, (White
Blood Count, Absolute Neutrophil Count, C-
Reactive Protein, Fever, Anticancer therapy,
Antibiotics given prior to culture and blood
collection site for each patient was recorded.
Samples sent to the Microbiology laboratory
for routine diagnosis were used for the
project. All positive blood culture samples
were detected by BD BACTECTM FX
Automated blood culture analyzer. Microbial
identification was performed using the
biochemical tests following Laboratory
Manual in Microbiology, 2011 and VITEK 2
compact automated system. Hematological
reports were assorted under hospital
permission. Full blood count was done using
Sysmex XN - 1000 hematology analyzer and
Absolute neutrophil count was obtained
from full blood count report. Nine antibiotic
classes named Penicillin, Aminoglycosides,
Cephalosporins, Carbapenems,
Fluoroquinolones, Macrolides,
Lincosamides, Glycopeptides, Beta-lactam
inhibitors were considered in this study.
Antibiotic susceptibility was tested using
disc diffusion method following Clinical
Laboratory Standard Institute (CLSI)
guidelines and VITEK 2 – compact automated
system. According to the CLSI
recommendations, the screening of
Methicillin- Resistant Staphylococcus aureus
(MRSA), ESBL production, Vancomycin
Resistant Enterococci (VRE) and
Carbapenem Resistant Enterobacteriaceae
(CRE) was conducted. In this study we
considered Carbapenem resistant
Enterobacteriaceae (CRE), extended
spectrum beta lactamase (ESBL) regarding
gram negative isolates and Methicillin
Resistant Staphylococcus aureus (MRSA) and
Vancomycin Resistant
Enterococci/Staphylococci regarding gram
positive isolates.
All data was analyzed using descriptive and
inferential statistics by IBM SPSS Statistics
20 software. Antibiotic profiles of organisms
and antibiotic resistance patterns were
analyzed in terms of Frequency. Correlation
between CRP-Fever, ANC–CRP, & MDR
organisms and No. Of chemotherapy drugs
were analyzed respectively by using
Regression, Pearson correlation & Cochran’s
Mantel – Haenzel test respectively.
Results:
The prevalence of Blood stream infections
(BSI) among cancer patients was 11.75%.
The number of positive blood cultures
examined in this study was 309. The study
population consisted of patients aging from 2
months to 82 years. The majority of BSI
occurred in hematological malignancies
(57.9%) while BSI in patients with solid
tumors were lower (42.1%).
An extended range of 41 species of causative
agents were isolated. Majority of the
organisms isolated were gram negative
bacilli (60.1%) out of which Klebsiella
pneumoniae (n=41, 12.5%) was dominant
followed by, Escherichia coli (n=38, 11.6%),
Acinetobacter baumannii (n=19, 5.8%)
37.8% gram positive cocci and 2.1% gram
positive bacilli were also isolated.
Predominant gram positive cocci were
Staphylococcus aureus (n=28, 8.5%) followed
by Staphylococcus hominis (n=18, 5.5%),
Coagulase negative Staphylococcus (n=17,
13th International Research Conference
General Sir John Kotelawala Defence University
Allied Health Sciences Sessions
54
5.2%) and Staphylococcus hemolyticus (n=15,
4.6%). The prevalence of poly-microbial
bacteremia was 6.1% (n= 19). Some of the
rare species named Achromobater
xylosoxidans, Bordetella hinzii, Burkholderia
cepacia, Elizabethkingia meningoseptica,
Alcologens faecalis, Ochrobactrum anthropic
were also isolated.
Gram negative organisms were predominant
over gram positive organisms among both
solid and hematological malignancies. In our
study, antimicrobial resistance was high in
hematological malignancies than solid
tumors. Among hematological malignancy
patients, GNB’s such as Enterobacter cloacae,
Acinetobacter baumannii, group named as LF
other(Lactose fermenting),
Escherichia coli and Klebsiella pneumoniae
and GPC’s such as Staphylococcus
hemolyticus, Staphylococcus hominis,
Streptococcus spp. and Diptheroids showed
high rate of resistance to most of the
antibiotics. Among solid tumor patients,
GNB’s such as Escherichia coli, Klebsiella
pneumoniae and group named as LF other
and GPC’s such as Coagulase Negative
Staphylococcus, Staphylococcus spp. and
Staphylococcus hemolyticus showed high
rate of resistance to most of the antibiotics.
In this study, for gram negative organisms,
Extended spectrum beta-lactamase (ESBL),
Carbapenem resistant Enterobacteriaceae
(CRE) and for gram positive organisms,
Methicillin resistant Staphylococcus aureus
(MRSA), Vancomycin resistant Enterococci
(VRE) were considered as antimicrobial
resistance patterns. Overall, 28.57% gram
negative organisms were positive for ESBL.
Rate of occurrence of ESBL was tested in
Klebsiella pneumoniae (24.4%) and
Escherichia coli (34.5%). But both were less
than 50%. CRE was considered with regard
to Imipenem and Meropenem. The highest
resistance to Imipenem was showed by
Enterobacter spp.
(53.3%) while Klebsiella pneumoniae showed
73.2% against Meropenem. When
considering VRE, Enterococci spp. showed no
resistance to Vancomycin (100% sensitive)
but 12.8% Vancomycin resistant
Staphylococcus spp. were isolated. Only 4
cases (14.3%) of MRSA was observed. In our
study, the total prevalence of MDR organisms
was 218 (78.7%).
The total prevalence of MDR organisms was
78.7%. Majority was MDR gram negative
lactose fermenting organisms (90.90%)
followed by MDR gram positive organisms
(73.73%) and nonlactose fermenting
organisms (61.40%).
No significant association was found
(p=0.562) between number of chemotherapy
drugs given to the patient and the presence
of MDR bacteria. Furthermore, no
association was noted between absolute
neutrophil count and C-reactive protein
values (p=0.154). A regression model was
developed to find the association between C-
reactive protein value and presence of fever.
The model was insignificant (p=0.376)
indicating that no significant association
between the two variables.
Polymyxin B is the most effective drug for
gram negative organisms while most
effective drugs for GPC are Fusidic acid and
Teicoplanin.
Discussion:
The overall prevalence of BSI among cancer
patients in this study was 11.75%. This
finding is in line with many other studies
which indicated a prevalence between 11-
38% (Montassier et al., 2013, Fentie et
al.,2018, Rani et al.,2017).
In this study patients ranging from 2 months
to 82 years were considered. Associations
between certain clinical features such as CRP,
fever and ANC were assessed in this study.
No significant association was observed in
13th International Research Conference
General Sir John Kotelawala Defence University
Allied Health Sciences Sessions
55
the present study though literature review
indicated otherwise.
When considering the bacterial profiles
majority of the organisms isolated in this
study were gram negative bacilli (GNB)
(60.1%) while gram positive cocci and gram
positive bacilli were 37.8% and 2.1%
respectively. Our results were in accordance
with many other studies. (Lubwama et
al.,2019, Gudiol et al.,2014 and Montassier et
al.,2013).
In a previous study, lower MDR prevalence
was recorded (20) (46.5%) while 5 (11.6%)
organisms were sensitive to all tested
antibiotic classes and no organism was
resistant to all tested antibiotic classes
(Fentie, A. et al.,2018). Very high antibiotic
resistance in our setting may be due to
several reasons. The calculation of MDR
prevalence changes according to the MDR
definition as different research groups have
followed different definitions. Patients
taking antibiotics over the counter without a
proper prescription and also the irrational
use of antibiotics in our setting may also have
played a role in high rates of MDR. A high
degree of resistance to Cephalosporins
among Enterobacteriaceae in the present
study could be because Cephalosporins are
one of the most used antibiotics for
inpatients as well as for outpatients in
developing countries. Papanicolas et al.,2017
has proposed a model stating that
chemotherapy is a contributing factor for
emergence of antibiotic resistant bacteria in
gut. It is also mentioned that chemotherapy
together with antibiotics has the potential to
promote pathogen overgrowth and cause
translocation into the blood stream. In our
study this fact was taken into consideration
and we attempted to find out any association
between number of chemotherapy drugs
given to a patient and the presence of multi
drug resistant bacteria, however the
association obtained was insignificant
(p=0.562).
Conclusion:
In conclusion, this study provides
information on antibiotic resistance of blood
isolates which may be a useful guide for
physicians initiating empirical therapy.
According to our study high prevalence of
antimicrobial resistance in Gram-negative
isolates and emergence of MDR pathogens is
alarming. This highlights the importance of
investigating novel antibiotics to overcome
the issue. Furthermore, evaluation of
Minimum inhibitory concentration (MIC) of
effective antibiotics could be performed
since it depicts the extent of resistance and
possibility of using the drug at a higher
dosage for treatment.
Routine surveillance of baseline resistance,
formulation of hospital antibiotic policy,
usage of combination therapy and usage
according to the standard antimicrobial
susceptibility testing may help to decrease or
prevent the emergence of antibiotic
resistance. We also suggest that the
association between chemotherapy and
multi-drug resistant pathogens to be further
investigated with a large sample size and a
control group with similar characteristics
such as age, gender etc. for better
understanding.
References:
Chandrasiri, P, Elwitigala, J, Nanayakkara, G,
Chandrasiri, S, Patabendige, G, Karunanayaka,
L,Perera, J, Somaratne, P, and Jayathilleke, K
(2013):A multi centre laboratory study of Gram
negative bacterial blood stream infections in Sri
Lanka, Ceylon Medical Journal, 58(2), p.56.
D, R. R, and Chaitanya, S (2017):Retrospective
Analysis of Blood Stream Infections andAntibiotic
Susceptibility Pattern of Gram Negative Bacteria
in a Tertiary Care Cancer Hospital, International
Journal of Medical Research & Health Sciences,
6(12): pp. 19–26.
Fentie, A, Wondimeneh, Y, Balcha, A, Amsalu, A
and Adankie, B (2018) :Bacterial profile,antibiotic
resistance pattern and associated factors among
cancer patients at
13th International Research Conference
General Sir John Kotelawala Defence University
Allied Health Sciences Sessions
56
University of Gondar Hospital, Northwest
Ethiopia, Infection and Drug Resistance, Volume
11, pp.2169-2178
Gudiol, C, and Carratalà, J (2014):Antibiotic
resistance in cancer patients, Expert Review
ofAnti-infective Therapy, 12(8), pp.1003-1016.
Homsi, J, Walsh, D, Panta, R, Lagman, R, Nelson,
KA, Longworth, DL (2000):
Infectiouscomplications of advanced cancer,
Support Care Cancer,8(6),pp.487–492.
Lubwama, M, Phipps, W, Najjuka, C, Kajumbula, H,
Ddungu, H, Kambugu, J and Bwanga,
F(2019):Bacteremia in febrile cancer patients in
Uganda, BMC Research Notes, 12(1).
Marin, M, Gudiol, C, Ardanuy, C, Garcia-Vidal, C,
Calvo, M, Arnan, M and Carratalà,
J(2014):Bloodstream infections in neutropenic
patients with cancer: Differences between
patients with hematological malignancies and
solid tumors, Journal of Infection, 69(5),pp.417-
423.
Montassier, E, Batard, E, Gastinne, T, Potel, G, and
Cochetière, M (2013):Recent changes
inbacteremia in patients with cancer: a
systematic review of epidemiology and antibiotic
resistance, European Journal of Clinical
Microbiology & Infectious Diseases, 32(7),
pp.841-850.
Nejad, ZE, Ghafouri, E, Farahmandi-Nia, Z,
Kalantari, B and Saffari, F (2010):
Isolation,Identification, and Profile of Antibiotic
Resistance of Bacteria in Patients with Cancer,
Iran Journal of Medical Sciences,35(2),109–115.
Nurain, AM, Bilal, NE and Ibrahim, ME (2015):The
frequency and antimicrobial resistancepatterns
of nosocomial pathogens recovered from cancer
patients and hospital environments, Asian Pacific
Journal Tropical Biomedicine, (12),1055–1059.
Papanicolas, L, Gordon, D, Wesselingh, S and
Rogers, G (2018):Not Just Antibiotics: Is
CancerChemotherapy Driving Antimicrobial
Resistance,Trends in Microbiology, 26(5),
pp.393-400.
Rolston, KV, Yadegarynia, D and Kontoyiannis, DP
(2006):The spectrum of
Grampositivebloodstream infections in patients
with hematologic malignancies, and the in vitro
activity of various quinolones against Gram-
positive bacteria isolated from cancer patients,
International Journal of Infectious Disease, 10,pp.
223-30
Saghir, S, Faiz, M, Saleem, M, Younus, A and Aziz,
H (2009):Characterization and anti microbial
susceptibility of gram - negative bacteria isolated
from bloodstream infections of cancer patients on
chemotherapy in pakistan, Indian Journal of
Medical Microbiology, 27(4), p.341.
Teillant, A, Gandra, S, Barter, D, Morgan, D and
Laxminarayan, R (2015):Potential burden
ofantibiotic resistance on surgery and cancer
chemotherapy antibiotic prophylaxis in the USA:
a literature review and modelling study,The
Lancet Infectious Diseases, 15(12), pp.1429-
1437.
Trecarichi, E, Tumbarello, M, Spanu, T, Caira, M,
Fianchi, L, Chiusolo, P, Fadda, G, Leone, G,Cauda, R
and Pagano, L (2009):Incidence and clinical
impact of extendedspectrum-β-lactamase (ESBL)
production and fluoroquinolone resistance in
bloodstream infections caused by Escherichia coli
in patients with hematological
malignancies,Journal of Infection, 58(4), pp.299-
307.
13th International Research Conference
General Sir John Kotelawala Defence University
Allied Health Sciences Sessions
57
Learning style preferences and academic performance of
undergraduate physiotherapy students
#WNI Kularathne, EMIA Bandara, and ALI Prasanna
Department of Physiotherapy, Faculty of Allied Health Sciences, University of Peradeniya.
Abstract: University level education of
physiotherapy is fairly new in Sri Lanka.
Hence students’ satisfaction of the
curriculum and learning environment has
not been thoroughly studied. Different
learning preferences have been reported
among various undergraduate populations.
understanding of various learning
preferences can be used to enhance their
learning experiences. Cross sectional study
was conducted among physiotherapy
undergraduates from the Department of
Physiotherapy, Faculty of Allied Health
Sciences, University of Peradeniya, Sri
Lanka .This study aimed to; ⅰ. Identify the
different learning preference among
physiotherapy undergraduates, ⅱ. Assess the
variations of learning preferences according
to the gender and academic year, ⅲ. Find out
whether there is any relationship between
learning preferences and academic
performances. Learning preferences were
assessed by Honey and Mumford’s learning
style questionnaire (LSQ). Academic
performances were measured by semester
cumulative grade point average (CGPA). Chi-
square test was used to assess the
association between categorical variables.
Relationship between learning preferences
and academic performances was measured
using Pearson correlation coefficient. Eighty
six undergraduates successfully responded
to the questionnaire. Majority (51.2%) of the
physiotherapy undergraduates preferred
activist learning style. Chi-square value for
the associations of learning preferences with
gender (χ=5.961) and academic year
(χ=14.399) were insignificant.
Undergraduates who reported multiple
preferred learning styles had relatively high
CGPA. However, there was no significant
different of mean CGPA among
undergraduates with different preferred
learning styles. Pragmatist learning
preference strength was significantly and
negatively correlated with the CGPA (r =
0.381). Encouraging pragmatists to improve
their preferences to other styles and
including more learning activities related to
pragmatists may improve their academic
performance. Teaching and learning
activities with wide variety may improve the
overall academic performances of
undergraduates.
Keywords: Learning Preferences, Academic
Performances, Physiotherapy
Undergraduates
Introduction:
Learning styles of individuals are different
according to the learners’ cognitive
processing [Marcy, 2001]. According to some
educational researchers, disparity between
learning content and mode of delivery of
instruction may result in the learners’
frustration with curriculum [Bertolami,
2001]. Educational researchers assume that
improved learning outcomes may be
obtained though addressing individual
learning preferences [Silberman &Auerbach,
2006]. Educators have introduced various
theories describing the learning preferences
which aimed to understand the learning
process better [Arthurs, 2007]. David A. Kolb
introduced Kolb’s experiential learning
theory in 1984 which was widely discussed
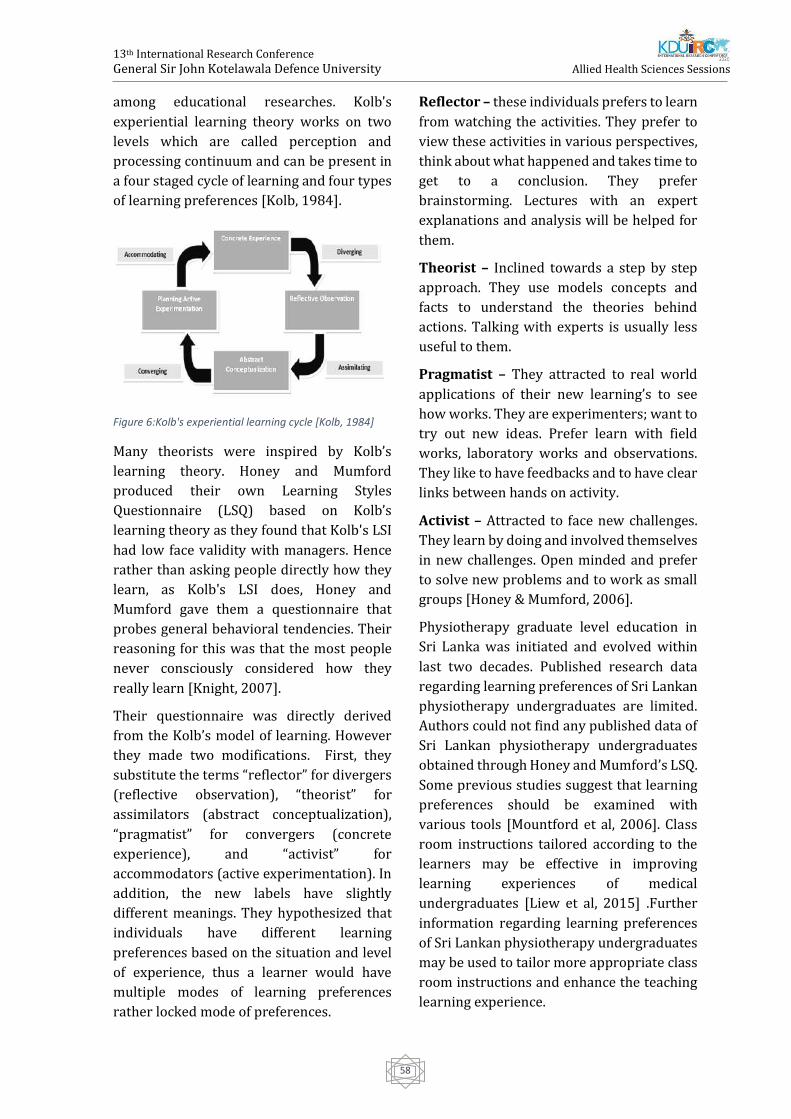
13th International Research Conference
General Sir John Kotelawala Defence University
Allied Health Sciences Sessions
58
among educational researches. Kolb's
experiential learning theory works on two
levels which are called perception and
processing continuum and can be present in
a four staged cycle of learning and four types
of learning preferences [Kolb, 1984].
Figure 6:Kolb's experiential learning cycle [Kolb, 1984]
Many theorists were inspired by Kolb’s
learning theory. Honey and Mumford
produced their own Learning Styles
Questionnaire (LSQ) based on Kolb’s
learning theory as they found that Kolb's LSI
had low face validity with managers. Hence
rather than asking people directly how they
learn, as Kolb's LSI does, Honey and
Mumford gave them a questionnaire that
probes general behavioral tendencies. Their
reasoning for this was that the most people
never consciously considered how they
really learn [Knight, 2007].
Their questionnaire was directly derived
from the Kolb’s model of learning. However
they made two modifications. First, they
substitute the terms “reflector” for divergers
(reflective observation), “theorist” for
assimilators (abstract conceptualization),
“pragmatist” for convergers (concrete
experience), and “activist” for
accommodators (active experimentation). In
addition, the new labels have slightly
different meanings. They hypothesized that
individuals have different learning
preferences based on the situation and level
of experience, thus a learner would have
multiple modes of learning preferences
rather locked mode of preferences.
Reflector – these individuals prefers to learn
from watching the activities. They prefer to
view these activities in various perspectives,
think about what happened and takes time to
get to a conclusion. They prefer
brainstorming. Lectures with an expert
explanations and analysis will be helped for
them.
Theorist – Inclined towards a step by step
approach. They use models concepts and
facts to understand the theories behind
actions. Talking with experts is usually less
useful to them.
Pragmatist – They attracted to real world
applications of their new learning’s to see
how works. They are experimenters; want to
try out new ideas. Prefer learn with field
works, laboratory works and observations.
They like to have feedbacks and to have clear
links between hands on activity.
Activist – Attracted to face new challenges.
They learn by doing and involved themselves
in new challenges. Open minded and prefer
to solve new problems and to work as small
groups [Honey & Mumford, 2006].
Physiotherapy graduate level education in
Sri Lanka was initiated and evolved within
last two decades. Published research data
regarding learning preferences of Sri Lankan
physiotherapy undergraduates are limited.
Authors could not find any published data of
Sri Lankan physiotherapy undergraduates
obtained through Honey and Mumford’s LSQ.
Some previous studies suggest that learning
preferences should be examined with
various tools [Mountford et al, 2006]. Class
room instructions tailored according to the
learners may be effective in improving
learning experiences of medical
undergraduates [Liew et al, 2015] .Further
information regarding learning preferences
of Sri Lankan physiotherapy undergraduates
may be used to tailor more appropriate class
room instructions and enhance the teaching
learning experience.
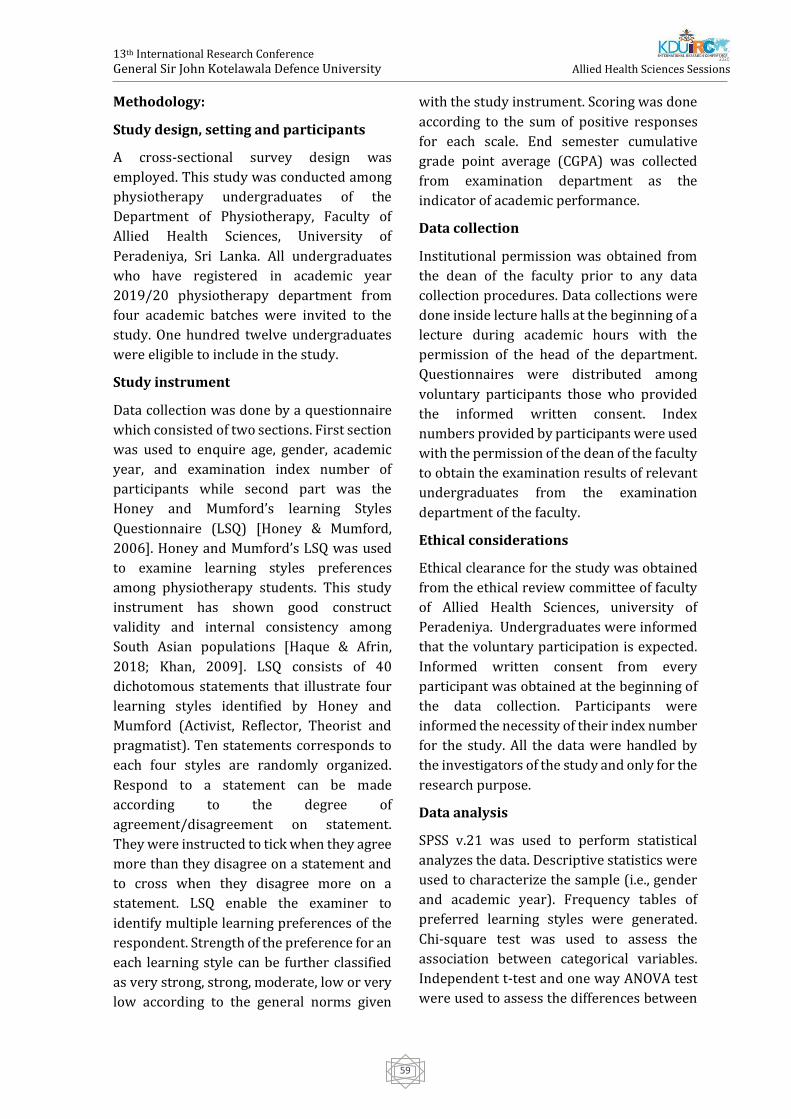
13th International Research Conference
General Sir John Kotelawala Defence University
Allied Health Sciences Sessions
59
Methodology:
Study design, setting and participants
A cross-sectional survey design was
employed. This study was conducted among
physiotherapy undergraduates of the
Department of Physiotherapy, Faculty of
Allied Health Sciences, University of
Peradeniya, Sri Lanka. All undergraduates
who have registered in academic year
2019/20 physiotherapy department from
four academic batches were invited to the
study. One hundred twelve undergraduates
were eligible to include in the study.
Study instrument
Data collection was done by a questionnaire
which consisted of two sections. First section
was used to enquire age, gender, academic
year, and examination index number of
participants while second part was the
Honey and Mumford’s learning Styles
Questionnaire (LSQ) [Honey & Mumford,
2006]. Honey and Mumford’s LSQ was used
to examine learning styles preferences
among physiotherapy students. This study
instrument has shown good construct
validity and internal consistency among
South Asian populations [Haque & Afrin,
2018; Khan, 2009]. LSQ consists of 40
dichotomous statements that illustrate four
learning styles identified by Honey and
Mumford (Activist, Reflector, Theorist and
pragmatist). Ten statements corresponds to
each four styles are randomly organized.
Respond to a statement can be made
according to the degree of
agreement/disagreement on statement.
They were instructed to tick when they agree
more than they disagree on a statement and
to cross when they disagree more on a
statement. LSQ enable the examiner to
identify multiple learning preferences of the
respondent. Strength of the preference for an
each learning style can be further classified
as very strong, strong, moderate, low or very
low according to the general norms given
with the study instrument. Scoring was done
according to the sum of positive responses
for each scale. End semester cumulative
grade point average (CGPA) was collected
from examination department as the
indicator of academic performance.
Data collection
Institutional permission was obtained from
the dean of the faculty prior to any data
collection procedures. Data collections were
done inside lecture halls at the beginning of a
lecture during academic hours with the
permission of the head of the department.
Questionnaires were distributed among
voluntary participants those who provided
the informed written consent. Index
numbers provided by participants were used
with the permission of the dean of the faculty
to obtain the examination results of relevant
undergraduates from the examination
department of the faculty.
Ethical considerations
Ethical clearance for the study was obtained
from the ethical review committee of faculty
of Allied Health Sciences, university of
Peradeniya. Undergraduates were informed
that the voluntary participation is expected.
Informed written consent from every
participant was obtained at the beginning of
the data collection. Participants were
informed the necessity of their index number
for the study. All the data were handled by
the investigators of the study and only for the
research purpose.
Data analysis
SPSS v.21 was used to perform statistical
analyzes the data. Descriptive statistics were
used to characterize the sample (i.e., gender
and academic year). Frequency tables of
preferred learning styles were generated.
Chi-square test was used to assess the
association between categorical variables.
Independent t-test and one way ANOVA test
were used to assess the differences between
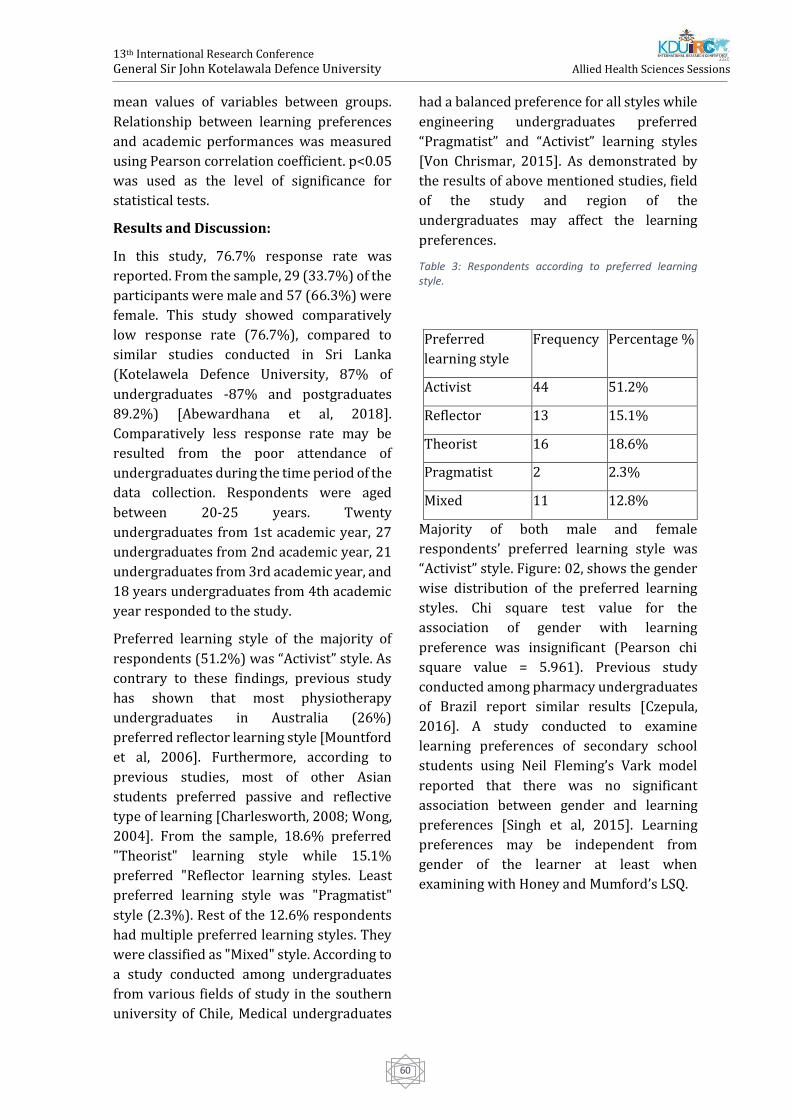
13th International Research Conference
General Sir John Kotelawala Defence University
Allied Health Sciences Sessions
60
mean values of variables between groups.
Relationship between learning preferences
and academic performances was measured
using Pearson correlation coefficient. p<0.05
was used as the level of significance for
statistical tests.
Results and Discussion:
In this study, 76.7% response rate was
reported. From the sample, 29 (33.7%) of the
participants were male and 57 (66.3%) were
female. This study showed comparatively
low response rate (76.7%), compared to
similar studies conducted in Sri Lanka
(Kotelawela Defence University, 87% of
undergraduates -87% and postgraduates
89.2%) [Abewardhana et al, 2018].
Comparatively less response rate may be
resulted from the poor attendance of
undergraduates during the time period of the
data collection. Respondents were aged
between 20-25 years. Twenty
undergraduates from 1st academic year, 27
undergraduates from 2nd academic year, 21
undergraduates from 3rd academic year, and
18 years undergraduates from 4th academic
year responded to the study.
Preferred learning style of the majority of
respondents (51.2%) was “Activist” style. As
contrary to these findings, previous study
has shown that most physiotherapy
undergraduates in Australia (26%)
preferred reflector learning style [Mountford
et al, 2006]. Furthermore, according to
previous studies, most of other Asian
students preferred passive and reflective
type of learning [Charlesworth, 2008; Wong,
2004]. From the sample, 18.6% preferred
"Theorist" learning style while 15.1%
preferred "Reflector learning styles. Least
preferred learning style was "Pragmatist"
style (2.3%). Rest of the 12.6% respondents
had multiple preferred learning styles. They
were classified as "Mixed" style. According to
a study conducted among undergraduates
from various fields of study in the southern
university of Chile, Medical undergraduates
had a balanced preference for all styles while
engineering undergraduates preferred
“Pragmatist” and “Activist” learning styles
[Von Chrismar, 2015]. As demonstrated by
the results of above mentioned studies, field
of the study and region of the
undergraduates may affect the learning
preferences.
Table 3: Respondents according to preferred learning style.
Majority of both male and female
respondents’ preferred learning style was
“Activist” style. Figure: 02, shows the gender
wise distribution of the preferred learning
styles. Chi square test value for the
association of gender with learning
preference was insignificant (Pearson chi
square value = 5.961). Previous study
conducted among pharmacy undergraduates
of Brazil report similar results [Czepula,
2016]. A study conducted to examine
learning preferences of secondary school
students using Neil Fleming’s Vark model
reported that there was no significant
association between gender and learning
preferences [Singh et al, 2015]. Learning
preferences may be independent from
gender of the learner at least when
examining with Honey and Mumford’s LSQ.
Preferred
learning style
Frequency Percentage %
Activist 44 51.2%
Reflector 13 15.1%
Theorist 16 18.6%
Pragmatist 2 2.3%
Mixed 11 12.8%
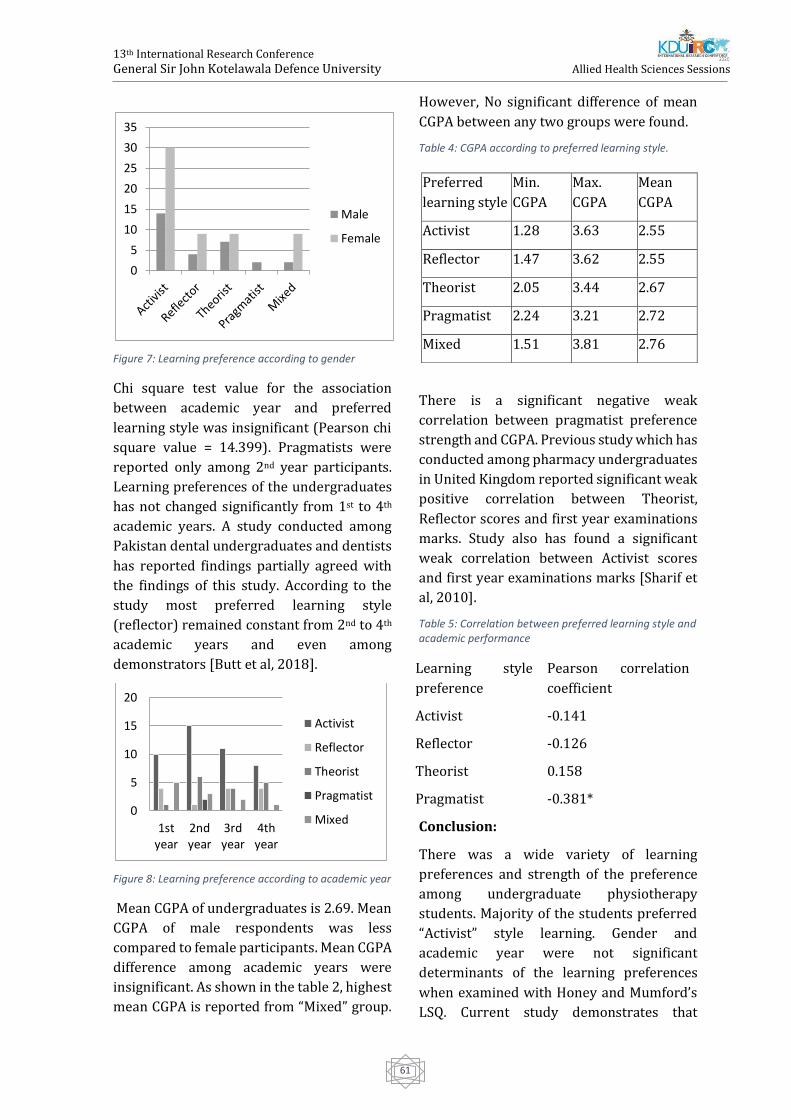
13th International Research Conference
General Sir John Kotelawala Defence University
Allied Health Sciences Sessions
61
Figure 7: Learning preference according to gender
Chi square test value for the association
between academic year and preferred
learning style was insignificant (Pearson chi
square value = 14.399). Pragmatists were
reported only among 2nd year participants.
Learning preferences of the undergraduates
has not changed significantly from 1st to 4th
academic years. A study conducted among
Pakistan dental undergraduates and dentists
has reported findings partially agreed with
the findings of this study. According to the
study most preferred learning style
(reflector) remained constant from 2nd to 4th
academic years and even among
demonstrators [Butt et al, 2018].
Figure 8: Learning preference according to academic year
Mean CGPA of undergraduates is 2.69. Mean
CGPA of male respondents was less
compared to female participants. Mean CGPA
difference among academic years were
insignificant. As shown in the table 2, highest
mean CGPA is reported from “Mixed” group.
However, No significant difference of mean
CGPA between any two groups were found.
Table 4: CGPA according to preferred learning style.
There is a significant negative weak
correlation between pragmatist preference
strength and CGPA. Previous study which has
conducted among pharmacy undergraduates
in United Kingdom reported significant weak
positive correlation between Theorist,
Reflector scores and first year examinations
marks. Study also has found a significant
weak correlation between Activist scores
and first year examinations marks [Sharif et
al, 2010].
Table 5: Correlation between preferred learning style and academic performance
Conclusion:
There was a wide variety of learning
preferences and strength of the preference
among undergraduate physiotherapy
students. Majority of the students preferred
“Activist” style learning. Gender and
academic year were not significant
determinants of the learning preferences
when examined with Honey and Mumford’s
LSQ. Current study demonstrates that
0
5
10
15
20
25
30
35
Male
Female
0
5
10
15
20
1styear
2ndyear
3rdyear
4thyear
Activist
Reflector
Theorist
Pragmatist
Mixed
Preferred
learning style
Min.
CGPA
Max.
CGPA
Mean
CGPA
Activist 1.28 3.63 2.55
Reflector 1.47 3.62 2.55
Theorist 2.05 3.44 2.67
Pragmatist 2.24 3.21 2.72
Mixed 1.51 3.81 2.76
Learning style
preference
Pearson correlation
coefficient
Activist -0.141
Reflector -0.126
Theorist 0.158
Pragmatist -0.381*
13th International Research Conference
General Sir John Kotelawala Defence University
Allied Health Sciences Sessions
62
multiple preferences may beneficial towards
academic performance. Although
Pragmatists had relatively higher mean
CGPA, strength of the preference to the
“pragmatist” style in general has influenced
negatively on academic performance.
Recommendations:
Teaching and learning activities with wide
range of activities based on undergraduates’
preferences may enhance the learning
experience and improve academic
performances.
Reference:
Abewardhana, A., Seneviratne, G., And Kumara, P.,
2018 ‘Learning styles of military learners’, 11th
KDU International Research Conference, General
Sir John Kotelawela Defense University, 13-14
September, 2018, pp. 46-50.
Arthurs, J., 2007. A juggling act in the classroom:
Managing different learning styles. Teaching and
Learning in Nursing, 2(1), pp.2-7.
Bertolami, C., 2001. Rationalizing the Dental
Curriculum in Light of Current Disease
Prevalence and Patient Demand for Treatment:
Form vs. Content. Journal of Dental Education,
65(8), pp.725-735.
Butt, F., Iqbal, M. and Khan, K., 2018. Learning
Style and Preferences Among Students and
Dentists in Various Dental Colleges of Karachi.
Journal of The Pakistan Dental Association, 27(1),
pp.27-31.
Charlesworth, Z., 2008. Learning styles across
cultures: suggestions for educators. Education &
Training, 50(2), pp.115-127.
Czepula, A., Bottacin, W., Hipólito Jr, E., Baptista,
D., Pontarolo, R. and Correr, C., 2016.
Predominant learning styles among pharmacy
students at the Federal University of Paraná,
Brazil. Pharmacy Practice, 14(1), pp.650-650.
Haque, M. and Afrin, S., 2018. Adaptation of the
Learning Style Questionnaire (LSQ) in
Bangladesh Context. EC Psychology and
Psychiatry, 7(2), pp.73-81.
Honey, P. and Mumford, A. (2006) ‘The learning
styles helper's guide’, in. Maidenhead: Peter
Honey Publications.
Khan, Z., 2009. Differences between learning
Styles in Professional Courses at University Level.
Journal of Social Sciences, 5(3), pp.236-238.
Knight, K. (2007) ‘Book Reviews : The Manual of
Learning Styles Peter Honey and Alan Mumford’,
Management Education and Development. Sage
Publications, 14(2), pp. 147–150. doi:
10.1177/135050768301400209.
Kolb, D. A. (1984) ‘Experiential Learning:
Experience as the Source of Learning and
Development’, in. Englewood Cliffs: Prentice Hall,
pp. 20–38. Available at:
https://www.researchgate.net/publication/235
701029_Experiential_Learning_Experience_As_T
he_Source_Of_Learning_and_Development
Liew, S., Sidhu, J. and Barua, A., 2015. The
relationship between learning preferences
(styles and approaches) and learning outcomes
among pre-clinical undergraduate medical
students. BMC Medical Education, 15(1).
Marcy, V., 2001. Adult Learning Styles: How the
VARK© Learning Style Inventory Can Be Used to
Improve Student Learning. The Journal of
Physician Assistant Education, 12(2), pp.117-120.
Mountford, H., Jones, S. and Tucker, B., 2006.
Learning styles of entry-level physiotherapy
students. Advances in Physiotherapy, 8(3),
pp.128-136.
Sharif, S., Gifford, L., Morris, G. And Barber, J.,
2010. The Relationship between Learning Styles,
Attendance and Academic Performance of
Pharmacy Undergraduates. Pharmacy Education,
10(2), pp.138-143.
Silberman, M. and Auerbach, C., 2006. Active
Training. San Francisco, CA: Pfeiffer.
Singh, L., Govil, P. and Rani, R., 2015. LEARNING
STYLE PREFERENCES AMONG SECONDARY
SCHOOL STUDENTS. International Journal of
Recent Scientific Research, 6(5), pp.3924-3928.
Von Chrismar, A. (2005). Identificación de los
estilos de aprendizaje y propuesta de orientación
pedagógica para estudiantes de la Universidad
Austral de Chile. Universidad Austral de Chile

13th International Research Conference
General Sir John Kotelawala Defence University
Allied Health Sciences Sessions
63
[UACH], Facultad de Ciencias de la Ingeniería,
Valdivia.
Wong, J., 2004. Are the learning styles of Asian
international students culturally or contextually
based? International Education Journal, 4(4),
pp.154-166.
13th International Research Conference
General Sir John Kotelawala Defence University
Allied Health Sciences Sessions
64
Effect of CT Bore size on Radiation Dose during Head CT Acquisition.
T Amalraj, DM Satharasinghe, A. Ramalingam, AS Pallewatte and #J Jeyasugiththan
Department of Nuclear Science, Faculty of Science, University of Colombo, Sri Lanka.
Horizon Campus, Malabe, Sri Lanka.
Department of Radiology, National Hospital of Sri Lanka, Colombo, Sri Lanka.
Cancer Treatment Centre, Tellippalai Base Hospital, Jaffna, Sri Lanka.
Abstract: With the development of
technology, the use of CT extended beyond
the diagnostic purposes and made a room for
complex radiotherapy treatment planning.
As the traditional diagnostic CT scanners
have small bore-size (typically 65–70 cm)
and curved patient couch which is not
suitable for virtual simulation with
immobilised devices. Therefore wide-bore
CT scanners with increased bore size (80-
100 cm) were introduced for radiotherapy
treatment planning. These virtual simulation
CT scanners are further equipped with an
external patient positioning laser system, flat
patient couch and specialized visualization
software. Due to the unavailability of
traditional CT scanner, theses wide (or
large)-bore CT simulators are used for
routine diagnostic procedures. The main
purpose of this study was to compare the
patient doses delivered by a wide (LB) and a
small-bore (AQ1) CT scanners to ensure the
safe use of wide-bore simulator for
diagnostic purpose. A standard head CT
phantom (16 cm diameter and 15 cm length)
made out of Polymethyl methacrylate
(PMMA) was positioned at the iso-centre and
100 cm pencil ionizing chamber was
positioned at the centre and periphery of the
phantom. The phantom was scanned under
different combinations of tube voltages (80,
100, 120, 135 kVp) and tube currents
(100,150, 200, 300, 400 mA) and the Dose
Length Product (DLP) in cGy were measured
for each location of the ion chamber using an
electrometer. The pitch and scan lengths
(0.813, 15 cm) were kept constant for each
measurement. Our study confirmed that the
wide-bore is delivering considerably more
dose than observed in AQ1 for head CT with
the same exposure parameters. This
increasement is more pronounced in
exposures above 200 mA and 120 kVp.
Therefore, the use of wide-bore simulator for
routine diagnostic CT examinations is safer
for lower kVp and mA but not encouraged for
all the routine diagnostic purpose without
further study.
Keywords: Computed Tomography, Wide
bore CT, CT dose, CT simulator, Gantry size.
Introduction:
The gantry or the ring-shaped part of the
computed tomography (CT) scanner houses
major components necessary to generate the
CT image. It is considered as the most
important part of the scanner and vary in
total size as well as in the diameter of the
opening, or aperture. The range of aperture
size is typically 70 to 90 cm [3]. Traditional
diagnostic CT units provide a maximum scan
field-of-view (SFOV) diameter of 50 cm and a
limited bore size of approximately 70 cm,
which cannot accommodate a larger patients
or an extended simulation setup in radiation
therapy (RT) [1]. Therefore until the late
1990s, imaging prior to radiotherapy
treatment planning was satisfied with an
acquisition of a routine CT study [4].
However, to meet the needs of radiotherapy
wide-bore CT scanners with increased bore
size were developed. Moreover, these
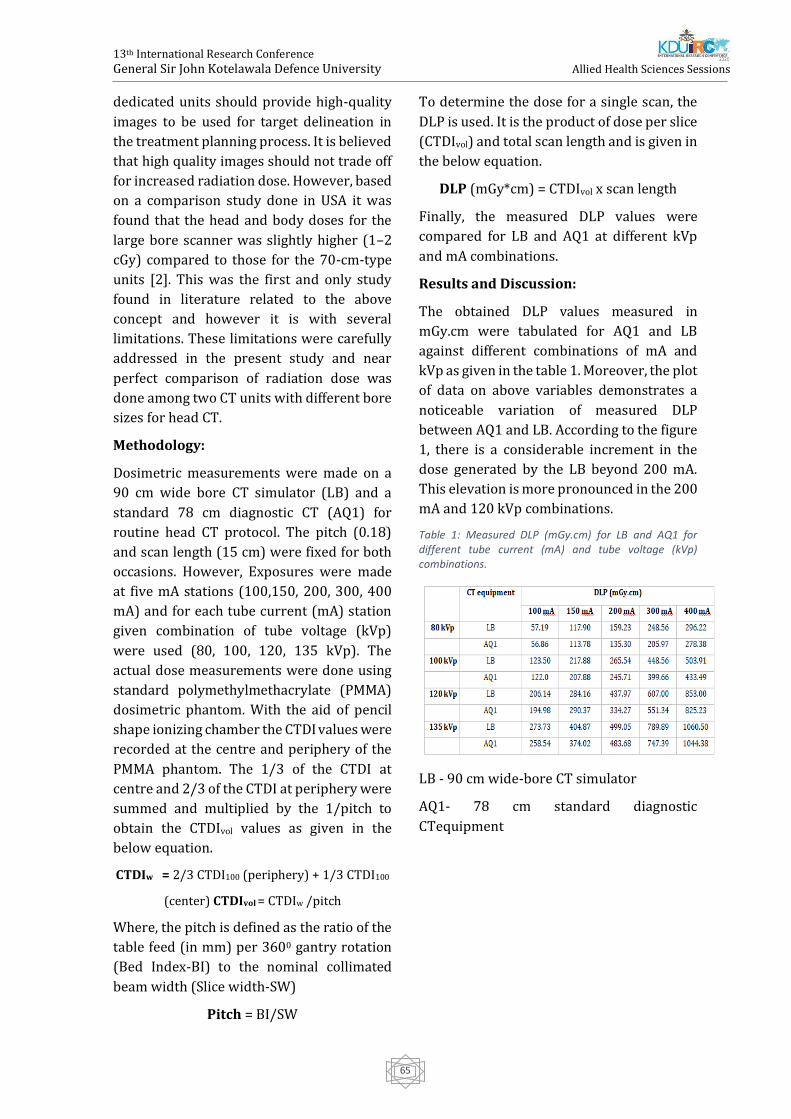
13th International Research Conference
General Sir John Kotelawala Defence University
Allied Health Sciences Sessions
65
dedicated units should provide high-quality
images to be used for target delineation in
the treatment planning process. It is believed
that high quality images should not trade off
for increased radiation dose. However, based
on a comparison study done in USA it was
found that the head and body doses for the
large bore scanner was slightly higher (1–2
cGy) compared to those for the 70-cm-type
units [2]. This was the first and only study
found in literature related to the above
concept and however it is with several
limitations. These limitations were carefully
addressed in the present study and near
perfect comparison of radiation dose was
done among two CT units with different bore
sizes for head CT.
Methodology:
Dosimetric measurements were made on a
90 cm wide bore CT simulator (LB) and a
standard 78 cm diagnostic CT (AQ1) for
routine head CT protocol. The pitch (0.18)
and scan length (15 cm) were fixed for both
occasions. However, Exposures were made
at five mA stations (100,150, 200, 300, 400
mA) and for each tube current (mA) station
given combination of tube voltage (kVp)
were used (80, 100, 120, 135 kVp). The
actual dose measurements were done using
standard polymethylmethacrylate (PMMA)
dosimetric phantom. With the aid of pencil
shape ionizing chamber the CTDI values were
recorded at the centre and periphery of the
PMMA phantom. The 1/3 of the CTDI at
centre and 2/3 of the CTDI at periphery were
summed and multiplied by the 1/pitch to
obtain the CTDIvol values as given in the
below equation.
CTDIw = 2/3 CTDI100 (periphery) + 1/3 CTDI100
(center) CTDIvol = CTDIw /pitch
Where, the pitch is defined as the ratio of the
table feed (in mm) per 3600 gantry rotation
(Bed Index-BI) to the nominal collimated
beam width (Slice width-SW)
Pitch = BI/SW
To determine the dose for a single scan, the
DLP is used. It is the product of dose per slice
(CTDIvol) and total scan length and is given in
the below equation.
DLP (mGy*cm) = CTDIvol x scan length
Finally, the measured DLP values were
compared for LB and AQ1 at different kVp
and mA combinations.
Results and Discussion:
The obtained DLP values measured in
mGy.cm were tabulated for AQ1 and LB
against different combinations of mA and
kVp as given in the table 1. Moreover, the plot
of data on above variables demonstrates a
noticeable variation of measured DLP
between AQ1 and LB. According to the figure
1, there is a considerable increment in the
dose generated by the LB beyond 200 mA.
This elevation is more pronounced in the 200
mA and 120 kVp combinations.
Table 1: Measured DLP (mGy.cm) for LB and AQ1 for different tube current (mA) and tube voltage (kVp) combinations.
LB - 90 cm wide-bore CT simulator
AQ1- 78 cm standard diagnostic
CTequipment
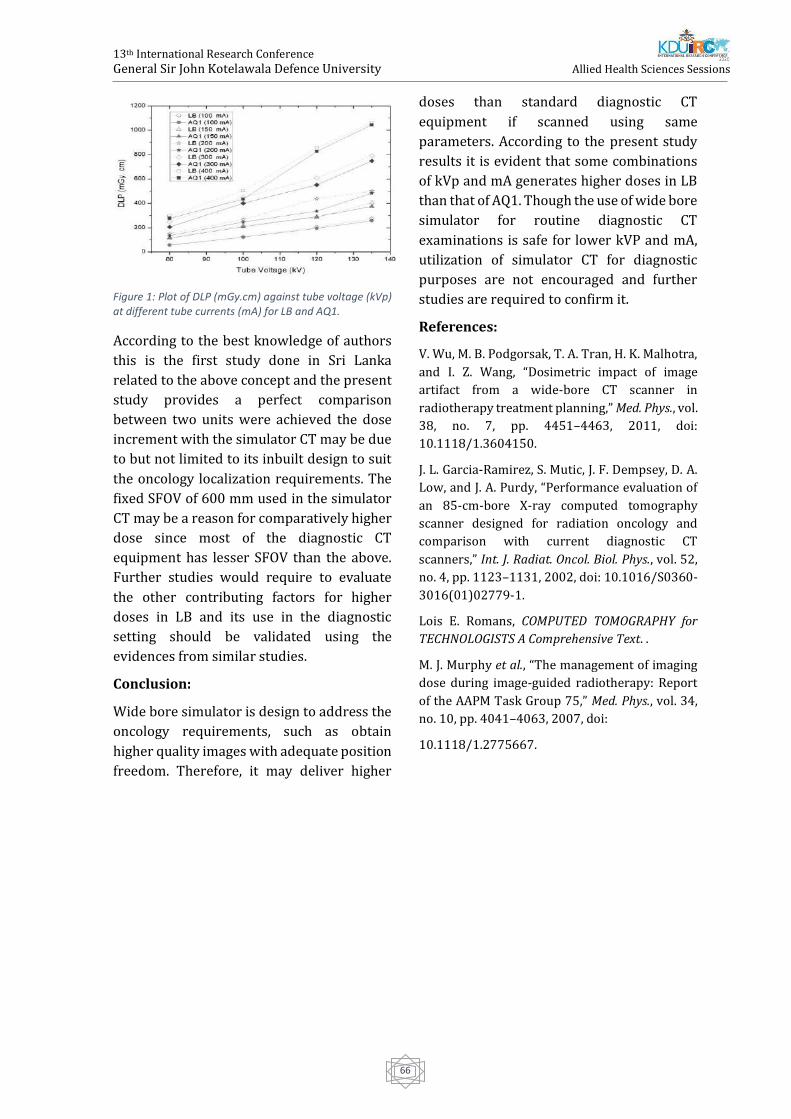
13th International Research Conference
General Sir John Kotelawala Defence University
Allied Health Sciences Sessions
66
Figure 1: Plot of DLP (mGy.cm) against tube voltage (kVp) at different tube currents (mA) for LB and AQ1.
According to the best knowledge of authors
this is the first study done in Sri Lanka
related to the above concept and the present
study provides a perfect comparison
between two units were achieved the dose
increment with the simulator CT may be due
to but not limited to its inbuilt design to suit
the oncology localization requirements. The
fixed SFOV of 600 mm used in the simulator
CT may be a reason for comparatively higher
dose since most of the diagnostic CT
equipment has lesser SFOV than the above.
Further studies would require to evaluate
the other contributing factors for higher
doses in LB and its use in the diagnostic
setting should be validated using the
evidences from similar studies.
Conclusion:
Wide bore simulator is design to address the
oncology requirements, such as obtain
higher quality images with adequate position
freedom. Therefore, it may deliver higher
doses than standard diagnostic CT
equipment if scanned using same
parameters. According to the present study
results it is evident that some combinations
of kVp and mA generates higher doses in LB
than that of AQ1. Though the use of wide bore
simulator for routine diagnostic CT
examinations is safe for lower kVP and mA,
utilization of simulator CT for diagnostic
purposes are not encouraged and further
studies are required to confirm it.
References:
V. Wu, M. B. Podgorsak, T. A. Tran, H. K. Malhotra,
and I. Z. Wang, “Dosimetric impact of image
artifact from a wide-bore CT scanner in
radiotherapy treatment planning,” Med. Phys., vol.
38, no. 7, pp. 4451–4463, 2011, doi:
10.1118/1.3604150.
J. L. Garcia-Ramirez, S. Mutic, J. F. Dempsey, D. A.
Low, and J. A. Purdy, “Performance evaluation of
an 85-cm-bore X-ray computed tomography
scanner designed for radiation oncology and
comparison with current diagnostic CT
scanners,” Int. J. Radiat. Oncol. Biol. Phys., vol. 52,
no. 4, pp. 1123–1131, 2002, doi: 10.1016/S0360-
3016(01)02779-1.
Lois E. Romans, COMPUTED TOMOGRAPHY for
TECHNOLOGISTS A Comprehensive Text. .
M. J. Murphy et al., “The management of imaging
dose during image-guided radiotherapy: Report
of the AAPM Task Group 75,” Med. Phys., vol. 34,
no. 10, pp. 4041–4063, 2007, doi:
10.1118/1.2775667.
13th International Research Conference
General Sir John Kotelawala Defence University
Allied Health Sciences Sessions
67
Gastroprotective Activity Of Vishnukarnthi Chewable Granular
Dosage Form Formulated Using Evolvulus Alsinoides And Its
Accelerated Stability Studies
TDMTS Kumara, HUV Hettiarachchi, #WJABN Jayasuriya, LDAM Arawwawala and TS
Suresh
Department of Pharmacy and Pharmaceutical Sciences, Faculty of Allied Health Sciences,
University of Sri Jayewardenepura
Herbal Technology Section, Industrial Technology Institute - Sri Lanka
Department of Biochemistry, Faculty of Medical Sciences,
University of Sri Jayewardenepura.
Abstract: This study investigates the in vitro
gastroprotective activity of Vishnukranthi
chewable granules formulated using dry
plant powder of Evolvulus alsinoides by
evaluating neutralizing capacity in artificial
gastric juice and the titration method using
Fordtran’s model. Accelerated stability
studies were conducted upto three months to
access the stability of granules. Each
parameter was accessed at day 1, 1 month
and after three months.Particle size
distribution, moisture content and pH were
measured as physical stability parameters.
Microbial stability accessed by total viable
bacteria and total viable fungi counts.
Stability of the gastroprotective activity was
evaluated using neutralizing capacity in
artificial gastric juice and the titration
method using Fordtran’s model. Chewable
granules has demonstrated a significant
(p<0.01) neutralizing capacity on artificial
gastric acid (mean pH 1.71±0.01) when
compared with negative control. The
titration conducted using Fordtran’s model
consumed 0.1493±0.0036 of H+ (p<0.001).
There was a significant difference between
fine percentage, percentage of weight loss,
total viable count of granules at day 1 and
after 1 month and 3 months (p<0.05). There
were no significant differences between pH
values, Rf values and the gastroprotective
activity of granules at day 1 and after 1
month and 3 months. Granules were
chemically stable but physically and
microbiologically less stable. In conclusion,
granules has demonstrated significant
gastroprotective activity in both models.
Further studies are recommended to
improve the physical and microbial stability
of the dosage form by adding a suitable
binding agent and an appropriate
preservative. Further, it is important to
evaluate the efficacy of Vishnukranthi
chewable granules clinically because this
product has a good potential to
commercialize as a herbal remedy for
gastritis.
Keywords: Evolvulus alsinoides,
gastroprotective activity, Fordtran’s model,
Accelerated stability studies, Vishnukranthi
Introduction:
Gastritis is an inflammation of gastric
mucosa. It is due to excessive secretion of
acid from stomach parietal cells. It may
induce due to alcohol, irritant drugs e.g. non-
steroidal anti-inflammatory drugs (NSAIDS),
Helicobacter pylori infection and severe
physiological stress (Waugh, A. and Grant, A.
(n.d.). Ross & Wilson anatomy and
physiology in health and illness.,2014). The
most commonly used drugs for the treatment
of peptic ulcer disease (PUD) are H2-
receptor antagonists (Cimetidine), chelates
13th International Research Conference
General Sir John Kotelawala Defence University
Allied Health Sciences Sessions
68
and complexes (Sucralfate), prostaglandin
analogs and prostamides, proton pump
inhibitors. (Omeprazole) and antacids
(Sodium alginate with calcium carbonate and
sodium bicarbonate) (BNF 76th
edition,2018-2019).
Evolvulus alsinoides is locally known as Nil
Vishnukranthi. E. alsinoides is an annual or
perennial plant which belongs to family
Convolvulaceae (Indhumol et al., 2013). The
plant is used in Ayurveda and Yunani as
nootropic or brain-tonic (Yadav et al., 2016).
Different formulations of E. alsinoides have
evaluated for gastroprotective activity.
Lekshmi and Reddy, 2011 has revealed E.
alsinoides has strong dose dependent
gastroprotectant activity in rats.
Vishnukranthi kalka is a paste which is
recommended in Ayurveda for treatment of
peptic ulcers. A study has demonstrated a
significant gastroprotective activity of the
said powder (Hewageegana, Ariyawansa and
Ratnasooriya, 2006). Our research group has
formulated a chewable granular dosage form
using E. alsinoides (Welipitiya et al., 2018).
The aim of this study was to evaluate the in
vitro gastro protective activity of the
formulation.
Furthermore, stability of Vishnukranthi
chewable granules using accelerated
stability testing was accessed.
Methodology:
Plant Collection and Authentication
E. alsinoides were authenticated and the
voucher specimens deposited at National
Herbarium, National Botanic Gardens,
Peradeniya.
Formulation of Vishnukranthi chewable
granular dosage form
Chewable granules were made using dried
plant powder, maize starch as diluent,
mannitol as the sweetening agent, starch
solution as binding agent, approved
chocolate flavour and chocolate colouring
agents. 15 g portions of granules were
packed in airtight polythene sachet and
labeled properly.
In vitro gastroprotective activity of
Vishnukranthi chewable granules
Neutralizing effects of Vishnukranthi
chewable granules on artificial gastric
acid
A sachet of Vishnukranthi chewable granules
(15g) was dissolved in distilled water. The
solution was shaken for 2 hours. Eno
(GlaxoSmithKline) and Belcid suspension
(Biolab Co. Ltd) were used as positive
controls whereas distilled water was taken
as negative control. Initial pH of each sample
(9 ml) was measured. 10 ml of freshly
prepared artificial gastric juice was added to
each sample and shaken for 5 minutes. pH of
each solution was measured. Each solution
was kept on the shaker and measure the pH
at 10 minutes time intervals until reaches a
constant value of pH (Thabrew and
Arawwawala, 2016).
Neutralizing capacity of Vishnukranthi
chewable granules using a titration
method of Fordtran’s model
Test sample of chewable granules, Eno,
Belcid suspension and distilled water were
heated and stirred to 37 oC and 30 r.p.m.
respectively. Test solutions were titrated
with artificial gastric juice until the pH of the
solution became pH 3.00 which considered
as the end point. Titrations were triplicated.
The consumed volume (v) of the artificial
gastric juice was measured and total
consumed H+ (mmol) was calculated
(Thabrew and Arawwawala, 2016).
If consumed volume for titration = V (ml),
Total Consumed H+ moles = 0.063096
(mmol/ml) x V (ml)
13th International Research Conference
General Sir John Kotelawala Defence University
Allied Health Sciences Sessions
69
Accelerated stability testing of chewable
granular dosage form
Accelerated stability testing was done for a
period of 3 months. Specified accelerated
conditions are temperature at 40 ± 2 °C and
relative humidity at 75 ± 5% (USP32–NF27).
Each parameter of the initial sample on the
day of manufacture(day 1) and the samples
kept in accelerated conditions after 1 month
and after 3 months were determined..
Physical stability tests of Vishnukranthi
chewable granules
Particle size distribution, moisture content
and pH were measured as physical stability
parameters.
The retaining percentage of weight of
particles between standard pharmacopeial
fine range was assessed. Moisture content
was determined by loss of weight on drying.
Percentage of loss on drying (LOD) was
calculated (British pharmacopeia 2007).
Microbial stability tests of Vishnukranthi
chewable granules
Microbial bioburdens were tested using total
viable aerobic count (TVC). Number of
colony forming units per gram of sample was
evaluated for fungi and bacteria separately
and then total viable count was calculated.
The total viable aerobic count = sum of the
bacterial count (CFU) + the fungal count
(CFU).
The growth mediums were Soboroud
dextrose agar (SDA) for fungi and casein
digest agar was for bacteria. Triplicate plates
were grown for each sample (British
pharmacopeia 2007).
Thin Layer Chromatography (TLC) for
Vishnukranthi chewable granule samples
TLC fingerprint was used to test the chemical
stability. Toluene – ethyl acetate – formic
acid at a ratio of 7.5: 1.5: 1.1 (v/v/v) was used
as the solvent system. The plate was
visualized under UV 254 nm and UV 366 nm.
Rf values were obtained (Irshad et al., 2016).
Stability of gastroprotective activity of
Vishnukranthi chewable granules
Neutralizing effects of Vishnukranthi
chewable granules on artificial gastric
acid
Neutralizing effects of samples of
Vishnukranthi chewable granules at
accelerated conditions were accessed
according to the methodology stated in 2.3.1.
Neutralizing capacity of Vishnukranthi
chewable granules using a titration
method of Fordtran’s model
Neutralizing capacity of samples of
Vishnukranthi chewable granules at
accelerated conditions were accessed
according to the methodology stated in 2.3.2.
Results and Discussion
In vitro gastroprotective activity of
Vishnukranthi chewable granules
Neutralizing effects of Vishnukranthi
chewable granules on artificial gastric
acid
Table 1: Neutralizing capacity of Vishnukranthi chewable granules on artificial gastric acid
Sample Mean value of end
pH
ENO
5.55±0.01 ***
Belcid suspension
4.22±0.02***
Distilled water 1.52±0.01
Vishnukranthi
chewable granules
1.71±0.01 **
Table 6 shows the initial and end pH values
of distilled water, Eno, Belcid, and
vishnukranthi chewable granules. *p < 0.05, **p < 0.01 and ***p < 0.001 compared to
Control.
13th International Research Conference
General Sir John Kotelawala Defence University
Allied Health Sciences Sessions
70
Mean values of end pH of Eno, Belcid, and
chewable granules were statistically
significant with respective negative control
groups (p<0.05). Hence the ENO, Belcid and
chewable granules are shown neutralizing
capacity on artificial gastric acid.
Table 2: Fordtran’s model analysis of Vishnukranthi chewable granules
Sample Mean value of
consumed H+ (mmol)
Vishnukranthi
chewable granules
0.1493±0.0036 ***
Distilled water 0.0069±0.0021
ENO
2.0695±0.0063***
Belcid suspension
3.9477±0.0036***
Table 2 shows the mean value of consumed
H+ of distilled water, Eno, Belcid, and
vishnukranthi chewable granules. *p < 0.05, **p < 0.01 and ***p < 0.001 compared to
Control.
Mean values of consumed H+ of Eno, Belcid, and chewable granules were statistically significant with respective negative control (p<0.05). Hence the ENO, Belcid and chewable granules are shown neutralizing capacity on titration method of Fordtran’s model.
Accelerated stability testing of chewable
granular dosage form
Physical stability tests of Vishnukranthi
chewable granules
The fine percentage of day 1, 1 month and 3
months samples were 0.56±0.17, 1.28±0.18
and 1.47±0.02 respectively. There is a
significant difference between fine
percentages of day 1 and 1 month, 3 months
accelerated samples (p<0.05). Particles has
shifted towards more fine ranges within
accelerated conditions.
Percentages of weight loss in drying in day 1,
1 month and 3 months were 9.3±0.30 %,
8.67±0.23 % and 7.73±0.23 %. The result
shows significantly higher percentage of
weight loss in drying in day 1 sample
compared to 1 month and 3 months
samples(p<0.05).
pH of day 1,1 month and 3 months
accelerated samples were 5.36±0.01,
5.36±0.00 and 5.35±0.06. There is no
significant difference between the pH of day
1, 1 month and 3 months accelerated
samples (p>0.05). Hence the pH of the
accelerated sample at 1 month and 3 months
has not changed significantly.
Microbial stability tests of Vishnukranthi
chewable granules
Number CFU in Casein Soybean Digest Agar
medium per gram of sample in day 1 and 3
months were 80000 CFU/g and 20500 CFU/g
respectively. Results indicate there is a
significant difference between total viable
bacteria counts between two samples
(p<0.05).
Number of CFU in Sobaroud Dextrose Agar
Medium per gram of sample in day 1 and 3
months samples were 30 CFU/g and 250
CFU/g respectively. Results indicate there is
a significant difference between total viable
fungi counts between two samples(p<0.05).
Total viable count (TVC) of day 1 sample and
3 months sample were 8030 CFU/g and
20750 CFU/g respectively.
Thin Layer Chromatography (TLC) for
Vishnukranthi chewable granule samples
There were three identical separate spots on
day 1, 1 month and 3 months samples.
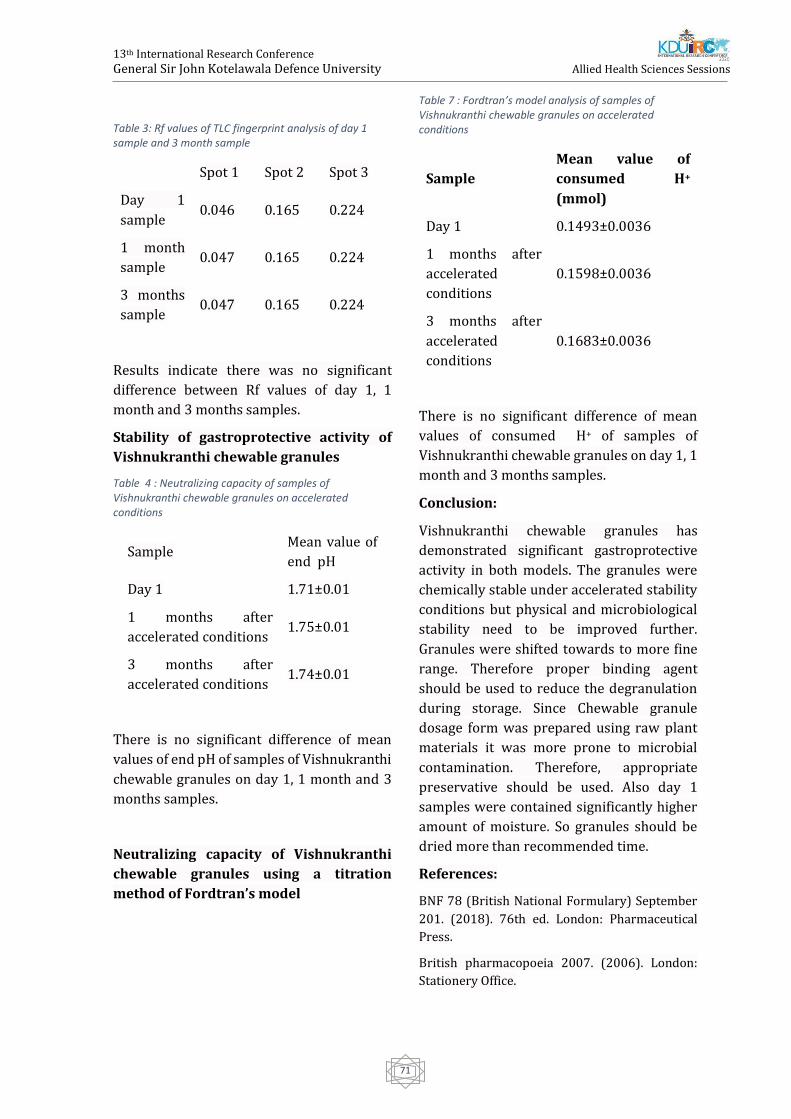
13th International Research Conference
General Sir John Kotelawala Defence University
Allied Health Sciences Sessions
71
Table 3: Rf values of TLC fingerprint analysis of day 1 sample and 3 month sample
Spot 1 Spot 2 Spot 3
Day 1
sample 0.046 0.165 0.224
1 month
sample 0.047 0.165 0.224
3 months
sample 0.047 0.165 0.224
Results indicate there was no significant
difference between Rf values of day 1, 1
month and 3 months samples.
Stability of gastroprotective activity of
Vishnukranthi chewable granules
Table 4 : Neutralizing capacity of samples of Vishnukranthi chewable granules on accelerated conditions
Sample Mean value of
end pH
Day 1 1.71±0.01
1 months after
accelerated conditions 1.75±0.01
3 months after
accelerated conditions 1.74±0.01
There is no significant difference of mean
values of end pH of samples of Vishnukranthi
chewable granules on day 1, 1 month and 3
months samples.
Neutralizing capacity of Vishnukranthi
chewable granules using a titration
method of Fordtran’s model
Table 7 : Fordtran’s model analysis of samples of Vishnukranthi chewable granules on accelerated conditions
Sample
Mean value of
consumed H+
(mmol)
Day 1 0.1493±0.0036
1 months after
accelerated
conditions
0.1598±0.0036
3 months after
accelerated
conditions
0.1683±0.0036
There is no significant difference of mean
values of consumed H+ of samples of
Vishnukranthi chewable granules on day 1, 1
month and 3 months samples.
Conclusion:
Vishnukranthi chewable granules has
demonstrated significant gastroprotective
activity in both models. The granules were
chemically stable under accelerated stability
conditions but physical and microbiological
stability need to be improved further.
Granules were shifted towards to more fine
range. Therefore proper binding agent
should be used to reduce the degranulation
during storage. Since Chewable granule
dosage form was prepared using raw plant
materials it was more prone to microbial
contamination. Therefore, appropriate
preservative should be used. Also day 1
samples were contained significantly higher
amount of moisture. So granules should be
dried more than recommended time.
References:
BNF 78 (British National Formulary) September
201. (2018). 76th ed. London: Pharmaceutical
Press.
British pharmacopoeia 2007. (2006). London:
Stationery Office.
13th International Research Conference
General Sir John Kotelawala Defence University
Allied Health Sciences Sessions
72
Hewageegana, H.G.S., Ariyawansa, H.A.S. and
Ratnasooriya, W.D., 2006. Gastroprotective
activity of the paste of Evolvulus alsinoides
L.(vishnukranti kalka) in rats.
Indhumol, V.G., Pradeep, H.R., Sushrutha, C.K.,
Jyothi, T. and Shavas, M.M., 2013. Ethnomedicinal,
phytochemical, and therapeutic applications of
Evolvulus alsinoides Linn.–a review. Int. Res. J.
Pharm. Plant Sci, 1, pp.1-6.
Irshad, S., Misra, P.K., Rawat, A.K.S. and Khatoon,
S., 2016. Authentication of commercial samples of
Shankhpushpi through physico-phytochemical
analysis and TLC fingerprinting.
Lekshmi, U.D. and Reddy, P.N., 2011. Preliminary
studies on antiinflammatory, antipyretic, and
antidiarrhoeal properties of Evolvulus alsinoides.
Turkish Journal of Biology, 35(5), pp.611-618.
Thabrew, M.I. and Arawwawala, L.D.A.M., 2018.
An Overview of In Vivo and In Vitro Models that
can be used for Evaluating Anti-Gastric Ulcer
Potential of Medicinal Plants.
United States Pharmacopeial Convention, Usp
(2009). USP NF 2010. United States
Pharmacopeial, p.662.
Waugh, A. and Grant, A. (n.d.). Ross & Wilson
anatomy and physiology in health and
illness.,2014.
W.P.W.D. Welipitiya, K.H.S. Madushani, W.J.A.B.N.
Jayasuriya, L.D.A.M. Arawwawala, T.S.
Suresh.(2018). A pharmacognostical study on
Evolvulus alsinoides Linn. and formulation of a
chewable granular dosage form. Proceedings of
the Asian Symposium on Medicinal Plants, Spices,
and other Natural Products XVI, Sri Lanka, 163.
Yadav, M.K., Singh, S.K., Tripathi, J.S. and Tripathi,
Y.B., 2016. Ethnopharmacological activities of
traditional medicinal plant: Evolvulus alsinoides.
World Journal of Pharmacy and Pharmaceutical
Sciences, 5(4), pp.2263-2268.
13th International Research Conference
General Sir John Kotelawala Defence University
Allied Health Sciences Sessions
73
Comparative Study Of Range Of Motion After Conventional
Physiotherapy In Adhesive Capsulitis Of Shoulder Joint Among
Diabetic And Non-Diabetic Patients At Teaching Hospital Batticaloa.
#R Rakunaraj
Teaching Hospital, Batticaloa
Abstract: Adhesive capsulitis (AC) of
shoulder is one of the commonest condition
among musculoskeletal disorders. It affects
both male and female gender and some
medical conditions associated with AC
especially diabetes. Physiotherapy is the
most advocated treatment option to manage
this condition conservatively. The objectives
were to compare the range of motion (ROM)
of shoulder joint in percentage among the
patients with AC associated with diabetic and
nondiabetic patients received follow-up at
the Teaching Hospital Batticaloa after
conventional physiotherapy and to
determine the associated risk factors that
delaying the recovery. The methodology was
Observational, prospective institutional
based study was conducted at the
Department of Physiotherapy, Teaching
Hospital Batticaloa, Sri Lanka for the period
of 12 weeks. 32 patients with primary AC
were recruited to this study, 15 with diabetic
and 17 without diabetic. An interviewer
administered questionnaire was given to the
participants prior to the commencement of
physiotherapy sessions and goniometry
measurement was obtained in mean
percentage in AC shoulder and contralateral
side before and after the conventional
physiotherapy with a standard 12-inch
plastic goniometer. Data was analyzed in
SPSS. The results shown that the
conventional physiotherapy would have an
impact in improving ROM of AC shoulder
both in DM and non-DM population and this
trend was statistically significant at a
confidence level of 95% (p<0.05). However,
there was no statistically significant
(p>0.005) observation identified when
compare the recovery of the ROM among DM
and non-DM patients with conventional
physiotherapy. There was no impact on the
recovery of ROM in AC patients associated
with DM when compared to non-DM
population. Even though the present study is
a preliminary in nature, the results indicated
that there is no significant improvement
among patients with non-DM with compared
to DM patients. Therefore, it may not
advisable to do over treatment to DM
patients with the intention of gaining a
higher productivity in the range of motion.
Keywords: Adhesive capsulitis, Frozen
shoulder, Range of Motion, Diabetes,
Physiotherapy.
Introduction
Peripheral joint disorders are common
among the orthopaedic conditions. Of which
Adhesive Capsulitis (AC) of shoulder also
known as Frozen Shoulder (FS) is one of the
commonest peripheral joint disorder
primarily referred to physiotherapy for
managing conservatively. The AC involve at
the glenohumeral joint resulted by synovial
thickening of the joint capsule and
contracture of the surrounding soft tissues.
Movements of the glenohumeral joint are
restricted in all directions and the symptoms
of pain and Range of Motion (ROM) of
shoulder are getting worse gradually (Yanlei,
Keong, & Tijauw Tjoen, 2019). Some studies
revealed that about 40 % of patients felt
stiffness and pain persistently for more than
13th International Research Conference
General Sir John Kotelawala Defence University
Allied Health Sciences Sessions
74
3 years and 7 % to 15 % patients experienced
permanent loss of function in shoulder joint.
Definite cause for idiopathic or primary AC is
unknown, though there are some risk factors
influencing in to this condition such as
diabetic, hyperthyroidism and female gender
however, diabetic shows strong closest
association with AC (Yanlei et al., 2019). FS is
common among diabetic patients with a
reported incidence ranges from 10.0% to
36.0% and prevalence ranges between
10.3% to 22.4% (Vastamäki et al., 2016).
Another there study revealed that incidence
range in diabetic is 28% to 40 % where as 2
% to 5 % in general population (Yanlei et al.,
2019). Adhesive capsulitis is one of the
common condition among the
musculoskeletal system. According the past
records from May 2018 to May 2019 period,
there are about 8-9% of the incidence among
the reported cases to the Physiotherapy
Department of Teaching Hospital Batticaloa
as outpatients were recorded as adhesive
capsulitis. However, some of them require in
ward admission in order to undergo other
intervention such as Manipulation Under the
Anesthesia (MUA) or intra articular injection.
AC patients with diabetic complained of poor
improvements in Range of Motion (ROM)
followed by physiotherapy sessions.
Therefore, a focus should be drawn to
compare the improvement of ROM in AC
patients associated with diabetic and non-
diabetic condition in order to assess the
improvement and recovery rate. In addition,
the present study aims at determining the
responsible factors affecting a delay in
recovery. The objective of this study was to
compare the range of motion (ROM) of
shoulder joint in percentage among the
patients with adhesive capsulitis associated
with diabetes and nondiabetic patients
received follow-up at the Teaching Hospital
Batticaloa after conventional physiotherapy.
Methodology:
This was a 12 weeks cross sectional
prospective institutional based study was
conducted at the Department of
Physiotherapy, Teaching Hospital Batticaloa,
Sri Lanka. 32 patients were recruited for this
study. Patients over 18 years with diabetic
lasting more than 3 years and patients
without having diabetic have been diagnosed
to have unilateral primary AC in the period
between 3 to 9 months after the onset of the
condition were included. And the patients
who reject to participate for the study,
patients undergoing other alternative
medicine parallel with physiotherapy, non-
consenting patients and past history of
shoulder surgery or with comorbidities of
life-threatening disease were excluded. Data
was collected through an interviewer
administered questionnaire prior to the
commencement of physiotherapy session
and goniometry measurement was obtained
in mean percentage of shoulder ROM
(flexion, abduction, external rotation,
internal rotation and extension) of AC
shoulder and contralateral shoulder before
and after the conventional physiotherapy
with a standard 12-inch plastic goniometer
based as gold standard measurement. Data
was analysed in SPSS version 19. Also, the
ethical clearance was obtained from the
Ethics Review Committee (ERC) of the
Faculty of Medicine, University of Kelaniya
Sri Lanka.
Results:
Among the 32 studied patient population, the
gender ratio remained 1:1 (n=16 for males
and females), while majority of respondents
(81.3 %) were belonging to the age group of
> 55 years old (Table 4.1). Around 96.9 %
patients were married. The O/L qualification
was the most common education level (34.4
%) among the patients, while majority were
unemployed (53.1 %), with a monthly
income of < 10000 LKR (56.2 %).
Interestingly, majority of the patients (65.6
%) were not familiar with the issues in ROM.
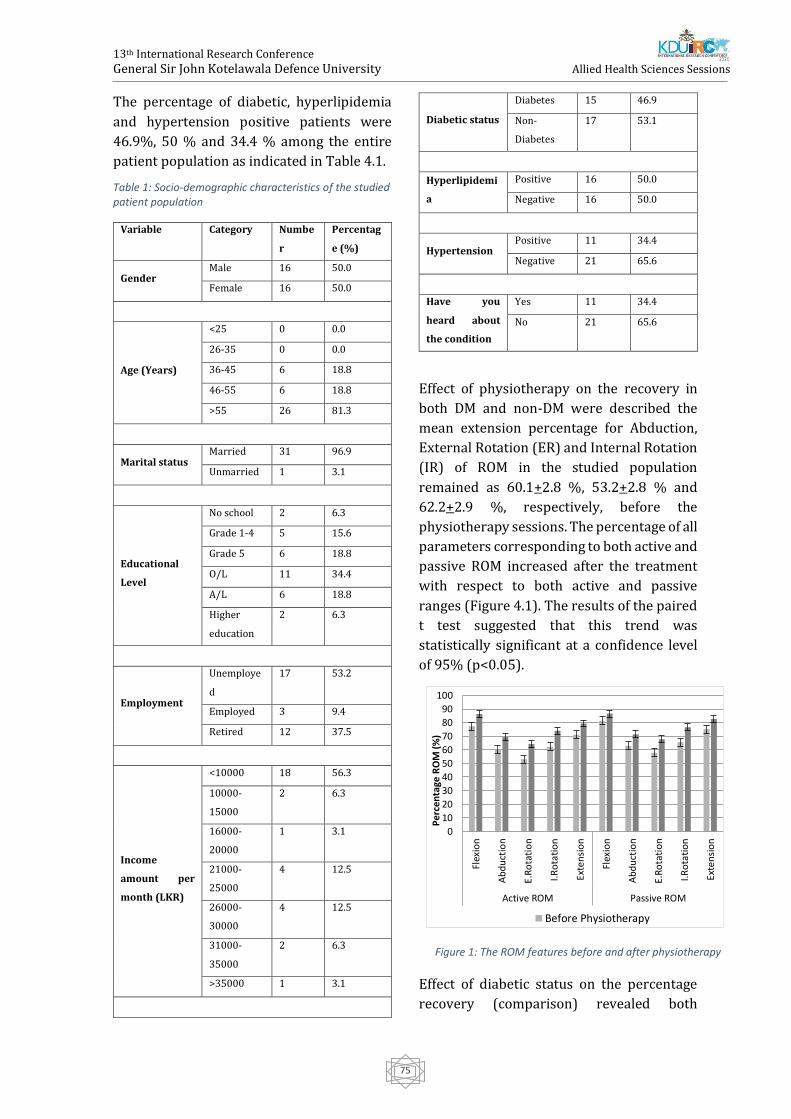
13th International Research Conference
General Sir John Kotelawala Defence University
Allied Health Sciences Sessions
75
The percentage of diabetic, hyperlipidemia
and hypertension positive patients were
46.9%, 50 % and 34.4 % among the entire
patient population as indicated in Table 4.1.
Table 1: Socio-demographic characteristics of the studied patient population
Variable Category Numbe
r
Percentag
e (%)
Gender Male 16 50.0
Female 16 50.0
Age (Years)
<25 0 0.0
26-35 0 0.0
36-45 6 18.8
46-55 6 18.8
>55 26 81.3
Marital status Married 31 96.9
Unmarried 1 3.1
Educational
Level
No school 2 6.3
Grade 1-4 5 15.6
Grade 5 6 18.8
O/L 11 34.4
A/L 6 18.8
Higher
education
2 6.3
Employment
Unemploye
d
17 53.2
Employed 3 9.4
Retired 12 37.5
Income
amount per
month (LKR)
<10000 18 56.3
10000-
15000
2 6.3
16000-
20000
1 3.1
21000-
25000
4 12.5
26000-
30000
4 12.5
31000-
35000
2 6.3
>35000 1 3.1
Diabetic status
Diabetes 15 46.9
Non-
Diabetes
17 53.1
Hyperlipidemi
a
Positive 16 50.0
Negative 16 50.0
Hypertension Positive 11 34.4
Negative 21 65.6
Have you
heard about
the condition
Yes 11 34.4
No 21 65.6
Effect of physiotherapy on the recovery in
both DM and non-DM were described the
mean extension percentage for Abduction,
External Rotation (ER) and Internal Rotation
(IR) of ROM in the studied population
remained as 60.1+2.8 %, 53.2+2.8 % and
62.2+2.9 %, respectively, before the
physiotherapy sessions. The percentage of all
parameters corresponding to both active and
passive ROM increased after the treatment
with respect to both active and passive
ranges (Figure 4.1). The results of the paired
t test suggested that this trend was
statistically significant at a confidence level
of 95% (p<0.05).
Effect of diabetic status on the percentage
recovery (comparison) revealed both
0
10
20
30
40
50
60
70
80
90
100
Flex
ion
Ab
du
ctio
n
E.R
ota
tio
n
I.Ro
tati
on
Exte
nsi
on
Flex
ion
Ab
du
ctio
n
E.R
ota
tio
n
I.Ro
tati
on
Exte
nsi
on
Active ROM Passive ROM
Per
cen
tage
RO
M (%
)
Before Physiotherapy
Figure 1: The ROM features before and after physiotherapy
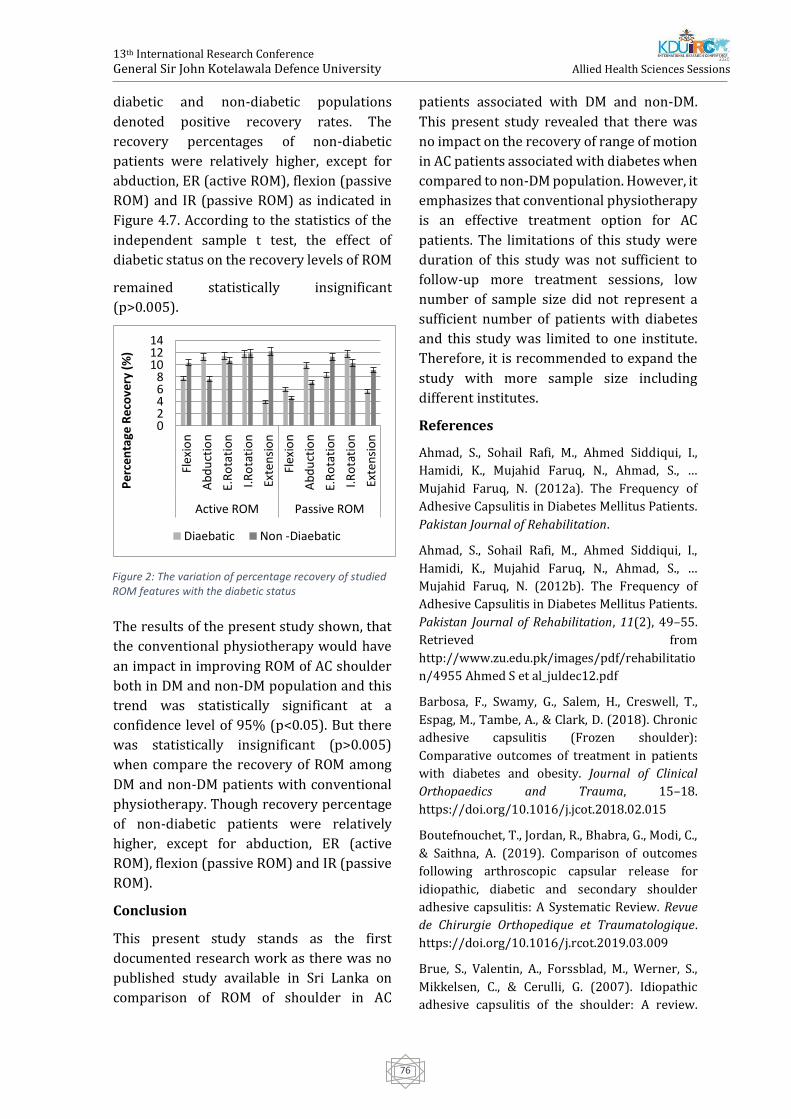
13th International Research Conference
General Sir John Kotelawala Defence University
Allied Health Sciences Sessions
76
diabetic and non-diabetic populations
denoted positive recovery rates. The
recovery percentages of non-diabetic
patients were relatively higher, except for
abduction, ER (active ROM), flexion (passive
ROM) and IR (passive ROM) as indicated in
Figure 4.7. According to the statistics of the
independent sample t test, the effect of
diabetic status on the recovery levels of ROM
remained statistically insignificant
(p>0.005).
The results of the present study shown, that
the conventional physiotherapy would have
an impact in improving ROM of AC shoulder
both in DM and non-DM population and this
trend was statistically significant at a
confidence level of 95% (p<0.05). But there
was statistically insignificant (p>0.005)
when compare the recovery of ROM among
DM and non-DM patients with conventional
physiotherapy. Though recovery percentage
of non-diabetic patients were relatively
higher, except for abduction, ER (active
ROM), flexion (passive ROM) and IR (passive
ROM).
Conclusion
This present study stands as the first
documented research work as there was no
published study available in Sri Lanka on
comparison of ROM of shoulder in AC
patients associated with DM and non-DM.
This present study revealed that there was
no impact on the recovery of range of motion
in AC patients associated with diabetes when
compared to non-DM population. However, it
emphasizes that conventional physiotherapy
is an effective treatment option for AC
patients. The limitations of this study were
duration of this study was not sufficient to
follow-up more treatment sessions, low
number of sample size did not represent a
sufficient number of patients with diabetes
and this study was limited to one institute.
Therefore, it is recommended to expand the
study with more sample size including
different institutes.
References
Ahmad, S., Sohail Rafi, M., Ahmed Siddiqui, I.,
Hamidi, K., Mujahid Faruq, N., Ahmad, S., …
Mujahid Faruq, N. (2012a). The Frequency of
Adhesive Capsulitis in Diabetes Mellitus Patients.
Pakistan Journal of Rehabilitation.
Ahmad, S., Sohail Rafi, M., Ahmed Siddiqui, I.,
Hamidi, K., Mujahid Faruq, N., Ahmad, S., …
Mujahid Faruq, N. (2012b). The Frequency of
Adhesive Capsulitis in Diabetes Mellitus Patients.
Pakistan Journal of Rehabilitation, 11(2), 49–55.
Retrieved from
http://www.zu.edu.pk/images/pdf/rehabilitatio
n/4955 Ahmed S et al_juldec12.pdf
Barbosa, F., Swamy, G., Salem, H., Creswell, T.,
Espag, M., Tambe, A., & Clark, D. (2018). Chronic
adhesive capsulitis (Frozen shoulder):
Comparative outcomes of treatment in patients
with diabetes and obesity. Journal of Clinical
Orthopaedics and Trauma, 15–18.
https://doi.org/10.1016/j.jcot.2018.02.015
Boutefnouchet, T., Jordan, R., Bhabra, G., Modi, C.,
& Saithna, A. (2019). Comparison of outcomes
following arthroscopic capsular release for
idiopathic, diabetic and secondary shoulder
adhesive capsulitis: A Systematic Review. Revue
de Chirurgie Orthopedique et Traumatologique.
https://doi.org/10.1016/j.rcot.2019.03.009
Brue, S., Valentin, A., Forssblad, M., Werner, S.,
Mikkelsen, C., & Cerulli, G. (2007). Idiopathic
adhesive capsulitis of the shoulder: A review.
Figure 2: The variation of percentage recovery of studied ROM features with the diabetic status
02468
101214
Flex
ion
Ab
du
ctio
n
E.R
ota
tio
n
I.Ro
tati
on
Exte
nsi
on
Flex
ion
Ab
du
ctio
n
E.R
ota
tio
n
I.Ro
tati
on
Exte
nsi
on
Active ROM Passive ROM
Per
cen
tage
Rec
ove
ry (
%)
Diaebatic Non -Diaebatic
13th International Research Conference
General Sir John Kotelawala Defence University
Allied Health Sciences Sessions
77
Knee Surgery, Sports Traumatology, Arthroscopy.
https://doi.org/10.1007/s00167-007-0291-2
Fieseler, G., Laudner, K. G., Irlenbusch, L., Meyer,
H., Schulze, S., Delank, K.-S., … Schwesig, R.
(2017). Inter- and intrarater reliability of
goniometry and hand held dynamometry for
patients with subacromial impingement
syndrome. Journal of Exercise Rehabilitation.
https://doi.org/10.1002/acr.23156
Jain, T. K., & Sharma, N. K. (2014). The
effectiveness of physiotherapeutic interventions
in treatment of frozen shoulder/adhesive
capsulitis: A systematic review. Journal of Back
and Musculoskeletal Rehabilitation.
https://doi.org/10.3233/BMR-130443
Junaid, M. (2016). A Comparative Study to
Determine the Efficacy of Routine Physical
Therapy Treatment with and without Kaltenborn
Mobilization on Pain and Shoulder Mobility in
Frozen Shoulder Patients. International Journal of
Physiotherapy.
https://doi.org/10.15621/ijphy/2016/v3i3/100
836
Katulanda, P., Sheriff, M., & Matthews, D. (2009).
The diabetes epidemic in Sri Lanka – a growing
problem. Ceylon Medical Journal.
https://doi.org/10.4038/cmj.v51i1.1373
Kingston, K., Curry, E. J., Galvin, J. W., & Li, X.
(2018a). Shoulder adhesive capsulitis:
epidemiology and predictors of surgery. Journal
of Shoulder and Elbow Surgery.
https://doi.org/10.1016/j.jse.2018.04.004
Kingston, K., Curry, E. J., Galvin, J. W., & Li, X.
(2018b). Shoulder adhesive capsulitis:
epidemiology and predictors of surgery. Journal
of Shoulder and Elbow Surgery.
https://doi.org/10.1016/j.jse.2018.04.004
Kolber, M. J., Fuller, C., Marshall, J., Wright, A., &
Hanney, W. J. (2012). The reliability and
concurrent validity of scapular plane shoulder
elevation measurements using a digital
inclinometer and goniometer. Physiotherapy
Theory and Practice.
https://doi.org/10.3109/09593985.2011.57420
3
Le, H. V., Lee, S. J., Nazarian, A., & Rodriguez, E. K.
(2017). Adhesive capsulitis of the shoulder:
review of pathophysiology and current clinical
treatments. Shoulder & Elbow.
https://doi.org/10.1177/1758573216676786
Lin, M. T., Hsiao, M. Y., Tu, Y. K., & Wang, T. G.
(2018). Comparative Efficacy of Intra-Articular
Steroid Injection and Distension in Patients With
Frozen Shoulder: A Systematic Review and
Network Meta-Analysis. Archives of Physical
Medicine and Rehabilitation.
https://doi.org/10.1016/j.apmr.2017.08.471
Lyhne, J. M., Jacobsen, J. R., Hansen, S. J., Jensen, C.
M., & Deutch, S. R. (2018). Diabetic and non-
diabetic patients report equal symptom relief
after arthroscopic capsular release of frozen
shoulder. Journal of Clinical Orthopaedics and
Trauma.
https://doi.org/10.1016/j.jcot.2018.05.004
Malavolta, E. A., Gracitelli, M. E. C., Ribeiro Pinto,
G. de M., Freire da Silveira, A. Z., Assunção, J. H., &
Ferreira Neto, A. A. (2018). Asian ethnicity: a risk
factor for adhesive capsulitis? Revista Brasileira
de Ortopedia, 53(5), 602–606.
https://doi.org/10.1016/j.rbo.2017.07.006
Mehta, S. S., Singh, H. P., & Pandey, R. (2014).
Comparative outcome of arthroscopic release for
frozen shoulder in patients with and without
diabetes. Bone and Joint Journal.
https://doi.org/10.1302/0301-
620X.96B10.34476
Pandey, A., Shrestha, B., & Shrestha, K. M. (2018).
A Comparative Study of Steroid Injection With or
Without Lignocaine in Treating Frozen Shoulder.
Journal of Universal College of Medical Sciences.
https://doi.org/10.3126/jucms.v5i1.19051
Pons-Villanueva, J., & Escalada San Martín, J.
(2016). The stiff shoulder in diabetic patients.
International Journal of Rheumatic Diseases.
https://doi.org/10.1111/1756-185X.12890
Reddy, B. C., & Metgud, S. (2014). A RANDOMIZED
CONTROLLED TRIAL TO COMPARE THE EFFECT
OF MUSCLE ENERGY TECHNIQUE WITH
CONVENTIONAL THERAPY IN STAGE II
ADHESIVE CAPSULITIS Quick Response code. Int
J Physiother Res, 2(3), 549–554. Retrieved from
http://oaji.net/articles/2014/287-
1402459034.pdf%5Cnwww.ijmhr.org/ijpr.html
Struyf, F., & Meeus, M. (2014). Current evidence
on physical therapy in patients with adhesive
capsulitis: What are we missing? Clinical
13th International Research Conference
General Sir John Kotelawala Defence University
Allied Health Sciences Sessions
78
Rheumatology. https://doi.org/10.1007/s10067-
013-2464-3
Sule, K., Rathi, M., Palekar, Tushar, J., & Anwer, S.
(2015). Comparison of Conventional Therapy
versus Sleeper Stretch with Conventional
Therapy in Adhesive Capsulitis. International
Journal of Health Sciences & Research, 5(11), 186–
192.
Uddin, M. M., Khan, A. A., Haig, A. J., & Uddin, M. K.
(2014). Presentation of frozen shoulder among
diabetic and non-diabetic patients. Journal of
Clinical Orthopaedics and Trauma.
https://doi.org/10.1016/j.jcot.2014.09.008
Vastamäki, H., Ristolainen, L., & Vastamäki, M.
(2016). Range of motion of diabetic frozen
shoulder recovers to the contralateral level.
Journal of International Medical Research.
https://doi.org/10.1177/0300060516675112
Werner, B. C., Holzgrefe, R. E., Griffin, J. W., Lyons,
M. L., Cosgrove, C. T., Hart, J. M., & Brockmeier, S.
F. (2014). Validation of an innovative method of
shoulder range-of-motion measurement using a
smartphone clinometer application. Journal of
Shoulder and Elbow Surgery.
https://doi.org/10.1016/j.jse.2014.02.030
Whelton, C., & Peach, C. A. (2018a). Review of
diabetic frozen shoulder. European Journal of
Orthopaedic Surgery and Traumatology.
https://doi.org/10.1007/s00590-017-2068-8
Whelton, C., & Peach, C. A. (2018b). Review of
diabetic frozen shoulder. European Journal of
Orthopaedic Surgery and Traumatology, 28(3),
363–371. https://doi.org/10.1007/s00590-017-
2068-8
Yanlei, G. L., Keong, M. W., & Tijauw Tjoen, D. L.
(2019). Do diabetic patients have different
outcomes after arthroscopic capsular release for
frozen shoulder? Journal of Orthopaedics.
https://doi.org/10.1016/j.jor.2019.02.003
Yuan, X., Zhang, Z., & Li, J. (2017).
Pathophysiology of adhesive capsulitis of
shoulder and the physiological effects of
hyaluronan. European Journal of Inflammation,
15(3), 239–243.
https://doi.org/10.1177/1721727X17747439
Zappia, M., Di Pietto, F., Aliprandi, A., Pozza, S., De
Petro, P., Muda, A., & Sconfienza, L. M. (2016).
Multi-modal imaging of adhesive capsulitis of the
shoulder. Insights into Imaging.
https://doi.org/10.1007/s13244-016-0491-8
Zreik, N. H., Malik, R. A., & Charalambous, C. P.
(2016). Adhesive capsulitis of the shoulder and
diabetes: A meta-analysis of prevalence. Muscles,
Ligaments and Tendons Journal, 6(1), 26–34.
https://doi.org/10.11138/mltj/2016.6.1.026
13th International Research Conference
General Sir John Kotelawala Defence University
Allied Health Sciences Sessions
79
A Study On The Assessment Of Perceived Stress, Self-Efficacy And
Associated Socio-Demographic Factors Among Undergraduates In A
Higher Educational Institution In Sri Lanka
SS Wadduwage, PJ Wijekumar, LH Walpola, NDK Ranadeva#, S Chackrewarthy
Department of Biomedical Science, Faculty of Health Science, KIU, Sri Lanka
Department of Biochemistry and Clinical chemistry, Faculty of Medicine, University of Kelaniya, Sri Lanka
Abstract: Nearly 80% of students in higher
education worldwide experience psychological
stress during their university life due to
imbalances in social, emotional, and physical
conditions. Stress can lead to poor academic
performance and underachievement among
students. The present study assessed the levels
of perceived stress, general self-efficacy and
their association with socio-demographic
factors among a selected group of
undergraduates at a higher educational
institute. A descriptive cross-sectional study
was performed using stratified random
sampling among 393 undergraduates. The data
were collected through the Perceived Stress
Scale (PSS-10), the General Self-Efficacy Scale
(GSES) and a questionnaire to collect the socio-
demographic data. The data were analyzed
using SPSS version 23. The mean age of the
sample (n=393) was 22.36±2.33 years. The
results showed a mean perceived stress score of
20.72±4.96 (moderate perceived stress). The
majority of the participants (79.4%) had
moderate perceived stress, followed by high
stress (12.7%) and low stress (7.4%). There was
no significant difference between the stress
levels of male and female students (p=0.766). No
significant association was observed between
perceived stress and socio-demographic factors
assessed (age, gender, residence status, financial
status, the program of study, employment
prospects) using the chi-squared test. Spearman
correlation showed a significant negative
association between perceived stress levels and
general self-efficacy (p<0.001). Intervention
strategies to develop and improve self-efficacy
among undergraduates should be implemented
as it affects their perceived stress levels and
academic achievements which will impact their
life goals. Further studies are needed to
understand the stressors contributing to stress
among undergraduate students.
Keywords: Perceived stress, General self-
efficacy, Higher education
Introduction:
Hans Hugo Bruno Selye, “Father of stress,”
defined stress as “the non-specific response of
the body to any demand for change” (Fink,
2016). World Health Organization introduced
the stress as the “Health Epidemic of the 21st
century” since stress has become a part of
routine life. The most common health
complications of stress include; depression,
hypertension, headaches, back pain, skin
disorders, irritable bowel syndrome, ulcers,
panic disorder, general adaptation syndrome,
phobia, and post-traumatic stress disorder
(PTSD) (Badur-un-Nisa, Kashif and Khan, 2016).
Mood disorders and suicides are other critical
stages of severe stress among various
populations (Ang and Huan, 2006).
Worldwide, deaths due to suicide account for
nearly 800,000 people every year. Suicide is
considered the second leading cause of death
among 15-29-year-olds globally (WHO, 2019).
Sri Lanka is the 29th country on the suicide list,
with 14.6 suicides per 100 000 in 2020 (World
Population Review, 2020). A recent study
revealed 20 – 30 years as the second leading age
group that has become the prey for suicides
(Senavirathna and Sanjeewani, 2019). At this
particular age, most of the young population
engage in higher education. Worldwide, around
80% of students following higher education
13th International Research Conference
General Sir John Kotelawala Defence University
Allied Health Sciences Sessions
80
experience stress during their life (Scott, 2009),
and in Sri Lanka, psychological distress is more
significant among university students than the
general population (Kuruppuarachchi et al.,
2002). Research evidence reports that learning
efficiency is affected due to social, emotional,
and physical conditions. The studies done
previously summarizes the critical reasons for
high-stress levels as socio-demographic factors,
gender, financial constraints, marital status, and
accommodation (Rathnayake and Ekanayaka,
2016).
In Sri Lanka, most of the universities have
counseling systems to support students
emotionally and motivate them. However, due
to the negative aura among the community,
most of the students suppress their problems.
Since university students endure a critical
transitory period in which they advance from
adolescence to adulthood, it can be stressful in
their lives. Therefore, the present study
assessed the levels of perceived stress (PS),
general self-efficacy, and their association with
socio-demographic factors among a selected
group of undergraduates. This study will
eventually contribute towards increasing the
quality of life among undergraduate students
and to seal the gaps in knowledge that will
support the society to discover and understand
the factors and outcomes associated with
undergraduate stress levels.
Methodology
A descriptive cross-sectional study was
conducted at KIU, Sri Lanka, among a selected
group of undergraduates following various
study programmes. The samples were randomly
stratified according to the program of study. The
sample size was obtained using the following
equation; n = N/ 1+N*e2 (Yamane, 1967). A total
of 393 undergraduates of KIU (301 females and
92 males) in the age group of 19 – 40 years were
randomly recruited into the sample, and
participants with previously diagnosed
psychiatric disorders, chronic illness, and
pregnancy were excluded. Data were collected
using a pre-tested self-administered
questionnaire of socio-demographic details,
standard questionnaires of perceived stress
scale (PSS-10) ) (Cohen, 1994) and general self-
efficacy scale (GSES) (Schwarzer and Jerusalem,
1995).Statistical analysis SPSS version 23
software was used for all data processing and
analysis. Data were assessed by the chi-square
test and Spearman correlation analysis. The
level of significance was set at two-tailed with
p>0.05.
Results and Discussion:
A total of 393 undergraduates were included in
the analysis. Among them, 301 (76.6%) were
females, and 92 (23.4%) were males. The
undergraduates were in the age group of 19 – 40
years. Table 1 summarizes the socio-
demographic profile of the participants
including the association of PS and socio-
demographic factors.
Note. Significant at p-value of <0.05.
The mean perceived stress (PS) score of the
sample population in the present study was
20.72, with a standard deviation (SD) of 4.96. It
was higher than the value reported in a similar
study done in the University of Colombo by
Ranasinghe et al., where a mean score of 19.9 ±
5.1 was reported among 2nd-year medical
students (Ranasinghe et al., 2017). On the
contrary, the finding of the present study the PS
score was lower than a research done in India,
which showed a mean score of 25.53 ± 5.55.
Several studies done around the world reported
different PS scores. An approximate score of 18
among a group of students in North of England
(Shaw, Peart and Fairhead, 2017), 16 from a
group of undergraduates of business students in
the US (Smith, Rosenberg and Haight, 2014) and
19 from a group of students in a Turkish
University (Örücü and Demir, 2009) are some of
the findings around the world.
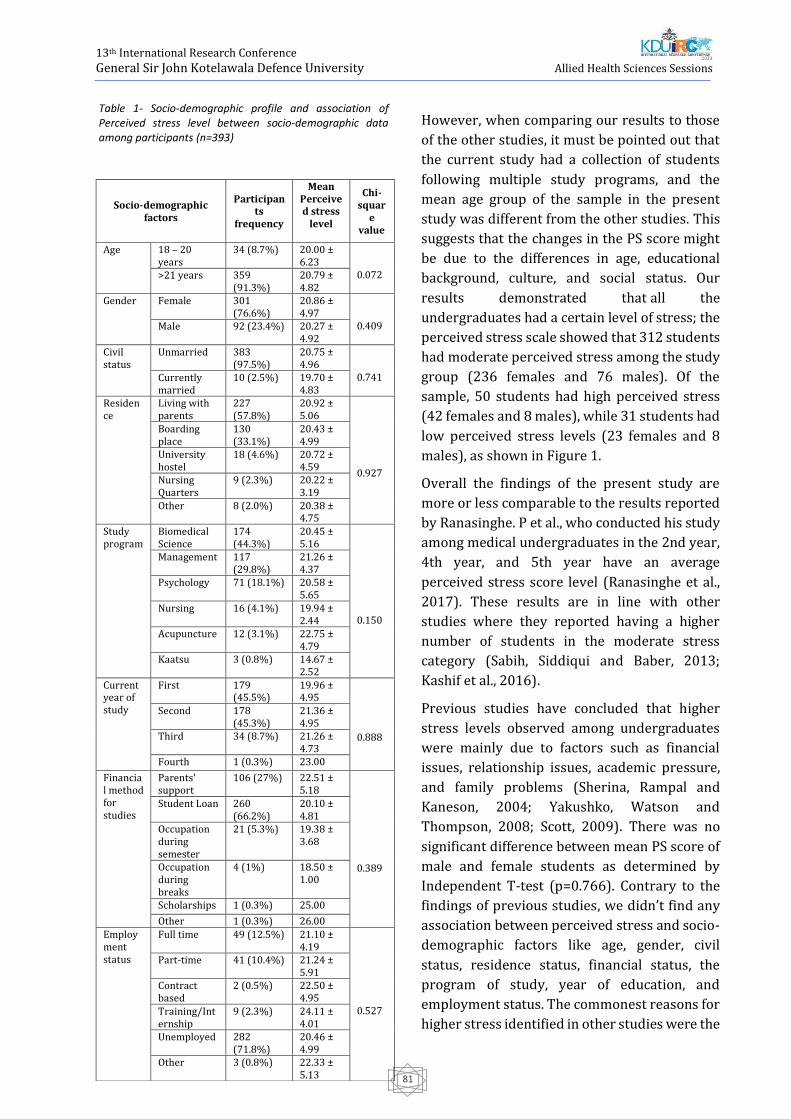
13th International Research Conference
General Sir John Kotelawala Defence University
Allied Health Sciences Sessions
81
However, when comparing our results to those
of the other studies, it must be pointed out that
the current study had a collection of students
following multiple study programs, and the
mean age group of the sample in the present
study was different from the other studies. This
suggests that the changes in the PS score might
be due to the differences in age, educational
background, culture, and social status. Our
results demonstrated that all the
undergraduates had a certain level of stress; the
perceived stress scale showed that 312 students
had moderate perceived stress among the study
group (236 females and 76 males). Of the
sample, 50 students had high perceived stress
(42 females and 8 males), while 31 students had
low perceived stress levels (23 females and 8
males), as shown in Figure 1.
Overall the findings of the present study are
more or less comparable to the results reported
by Ranasinghe. P et al., who conducted his study
among medical undergraduates in the 2nd year,
4th year, and 5th year have an average
perceived stress score level (Ranasinghe et al.,
2017). These results are in line with other
studies where they reported having a higher
number of students in the moderate stress
category (Sabih, Siddiqui and Baber, 2013;
Kashif et al., 2016).
Previous studies have concluded that higher
stress levels observed among undergraduates
were mainly due to factors such as financial
issues, relationship issues, academic pressure,
and family problems (Sherina, Rampal and
Kaneson, 2004; Yakushko, Watson and
Thompson, 2008; Scott, 2009). There was no
significant difference between mean PS score of
male and female students as determined by
Independent T-test (p=0.766). Contrary to the
findings of previous studies, we didn’t find any
association between perceived stress and socio-
demographic factors like age, gender, civil
status, residence status, financial status, the
program of study, year of education, and
employment status. The commonest reasons for
higher stress identified in other studies were the
Socio-demographic factors
Participants
frequency
Mean Perceived stress
level
Chi-squar
e value
Age 18 – 20 years
34 (8.7%) 20.00 ± 6.23
0.072 >21 years 359 (91.3%)
20.79 ± 4.82
Gender Female 301 (76.6%)
20.86 ± 4.97
0.409 Male 92 (23.4%) 20.27 ± 4.92
Civil status
Unmarried 383 (97.5%)
20.75 ± 4.96
0.741 Currently married
10 (2.5%) 19.70 ± 4.83
Residence
Living with parents
227 (57.8%)
20.92 ± 5.06
0.927
Boarding place
130 (33.1%)
20.43 ± 4.99
University hostel
18 (4.6%) 20.72 ± 4.59
Nursing Quarters
9 (2.3%) 20.22 ± 3.19
Other 8 (2.0%) 20.38 ± 4.75
Study program
Biomedical Science
174 (44.3%)
20.45 ± 5.16
0.150
Management 117 (29.8%)
21.26 ± 4.37
Psychology 71 (18.1%) 20.58 ± 5.65
Nursing 16 (4.1%) 19.94 ± 2.44
Acupuncture 12 (3.1%) 22.75 ± 4.79
Kaatsu 3 (0.8%) 14.67 ± 2.52
Current year of study
First 179 (45.5%)
19.96 ± 4.95
0.888
Second 178 (45.3%)
21.36 ± 4.95
Third 34 (8.7%) 21.26 ± 4.73
Fourth 1 (0.3%) 23.00
Financial method for studies
Parents' support
106 (27%) 22.51 ± 5.18
0.389
Student Loan 260 (66.2%)
20.10 ± 4.81
Occupation during semester
21 (5.3%) 19.38 ± 3.68
Occupation during breaks
4 (1%) 18.50 ± 1.00
Scholarships 1 (0.3%) 25.00
Other 1 (0.3%) 26.00 Employment status
Full time 49 (12.5%) 21.10 ± 4.19
0.527
Part-time 41 (10.4%) 21.24 ± 5.91
Contract based
2 (0.5%) 22.50 ± 4.95
Training/Internship
9 (2.3%) 24.11 ± 4.01
Unemployed 282 (71.8%)
20.46 ± 4.99
Other 3 (0.8%) 22.33 ± 5.13
Table 1- Socio-demographic profile and association of Perceived stress level between socio-demographic data among participants (n=393)
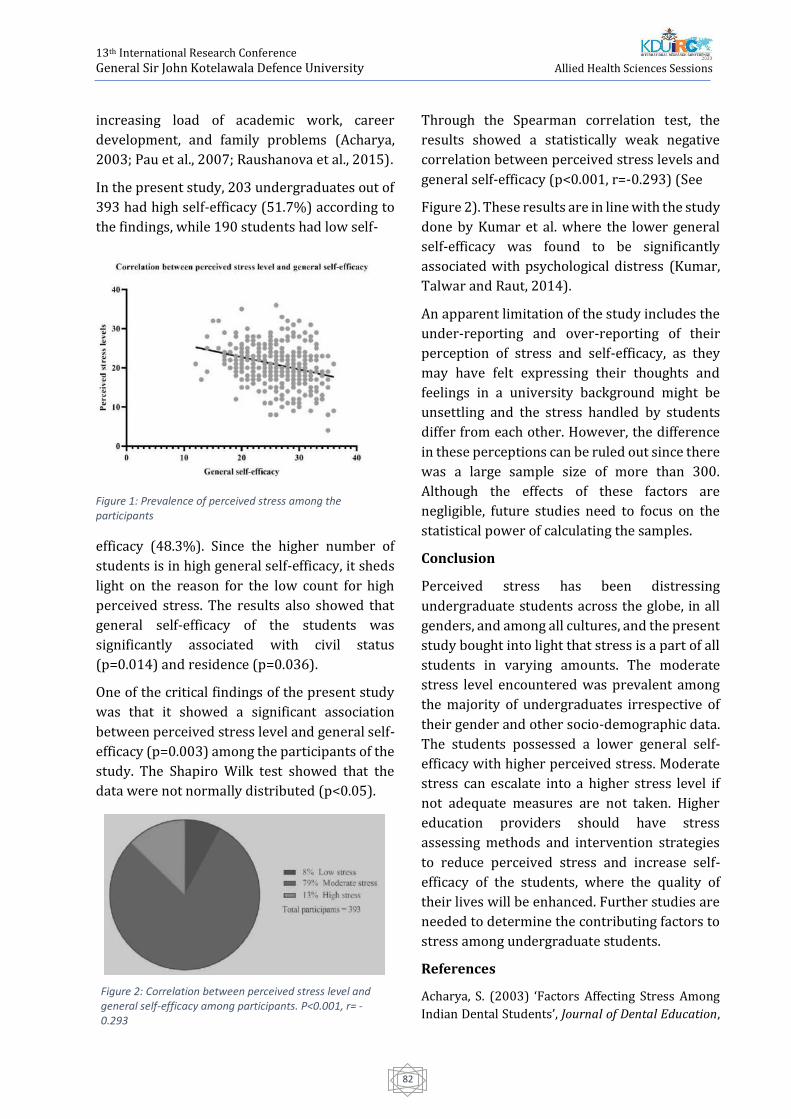
13th International Research Conference
General Sir John Kotelawala Defence University
Allied Health Sciences Sessions
82
increasing load of academic work, career
development, and family problems (Acharya,
2003; Pau et al., 2007; Raushanova et al., 2015).
In the present study, 203 undergraduates out of
393 had high self-efficacy (51.7%) according to
the findings, while 190 students had low self-
efficacy (48.3%). Since the higher number of
students is in high general self-efficacy, it sheds
light on the reason for the low count for high
perceived stress. The results also showed that
general self-efficacy of the students was
significantly associated with civil status
(p=0.014) and residence (p=0.036).
One of the critical findings of the present study
was that it showed a significant association
between perceived stress level and general self-
efficacy (p=0.003) among the participants of the
study. The Shapiro Wilk test showed that the
data were not normally distributed (p<0.05).
Through the Spearman correlation test, the
results showed a statistically weak negative
correlation between perceived stress levels and
general self-efficacy (p<0.001, r=-0.293) (See
Figure 2). These results are in line with the study
done by Kumar et al. where the lower general
self-efficacy was found to be significantly
associated with psychological distress (Kumar,
Talwar and Raut, 2014).
An apparent limitation of the study includes the
under-reporting and over-reporting of their
perception of stress and self-efficacy, as they
may have felt expressing their thoughts and
feelings in a university background might be
unsettling and the stress handled by students
differ from each other. However, the difference
in these perceptions can be ruled out since there
was a large sample size of more than 300.
Although the effects of these factors are
negligible, future studies need to focus on the
statistical power of calculating the samples.
Conclusion
Perceived stress has been distressing
undergraduate students across the globe, in all
genders, and among all cultures, and the present
study bought into light that stress is a part of all
students in varying amounts. The moderate
stress level encountered was prevalent among
the majority of undergraduates irrespective of
their gender and other socio-demographic data.
The students possessed a lower general self-
efficacy with higher perceived stress. Moderate
stress can escalate into a higher stress level if
not adequate measures are not taken. Higher
education providers should have stress
assessing methods and intervention strategies
to reduce perceived stress and increase self-
efficacy of the students, where the quality of
their lives will be enhanced. Further studies are
needed to determine the contributing factors to
stress among undergraduate students.
References
Acharya, S. (2003) ‘Factors Affecting Stress Among
Indian Dental Students’, Journal of Dental Education,
Figure 1: Prevalence of perceived stress among the participants
Figure 2: Correlation between perceived stress level and general self-efficacy among participants. P<0.001, r= -0.293
13th International Research Conference
General Sir John Kotelawala Defence University
Allied Health Sciences Sessions
83
67(10), pp. 1140–1148. doi: 10.1002/j.0022-
0337.2003.67.10.tb03707.x.
Ang, R. P. and Huan, V. S. (2006) ‘Relationship
between academic stress and suicidal ideation:
Testing for depression as a mediator using multiple
regression’, Child Psychiatry and Human
Development, 37(2), pp. 133–143. doi:
10.1007/s10578-006-0023-8.
Badur-un-Nisa, Kashif, M. and Khan, T. M. (2016)
‘Level of Stress and its Association with Socio-
Demographic Factors Among Students of Allied
Health Sciences’, Journal of Rawalpindi Medical
College Students Supplement, 20(S1), pp. 27–30.
Cohen, S. (1994) ‘Perceived stress scale - 10-item
version’, Psychology, pp. 1–3. doi: 10.1037/t02889-
000.
Fink, G. (2016) ‘Stress: Concepts, definition and
history’, in Reference Module in Neuroscience and
Biobehavioral Psychology. Elsevier Science Ltd., pp.
549–555. doi: 10.1016/B978-0-12-809324-5.02208-
2.
Kashif, M. et al. (2016) ‘Level of Stress and Its
Association with Socio-Demographic Factors among
Medical Students of Rawalpindi Medical College’,
Journal of Rawalpindi Medical College, 4(1), pp. 27–
30.
Kumar, V., Talwar, R. and Raut, D. K. (2014)
‘Psychological distress, general self-efficacy and
psychosocial adjustments among first year medical
college students in New Delhi, India’, South East Asia
Journal of Public Health, 3(2), pp. 35–40. doi:
10.3329/seajph.v3i2.20038.
Kuruppuarachchi, K. A. L. A. et al. (2002)
‘Psychological distress among students from five
universities in Sri Lanka.’, The Ceylon medical journal,
47(1), pp. 13–15. doi: 10.4038/cmj.v47i1.6401.
Örücü, M. Ç. and Demir, A. (2009) ‘Psychometric
evaluation of perceived stress scale for Turkish
university students’, Stress and Health. John Wiley &
Sons, Ltd, 25(1), pp. 103–109. doi:
10.1002/smi.1218.
Pau, A. et al. (2007) ‘Emotional intelligence and
perceived stress in dental undergraduates: a
multinational survey.’, Journal of dental education,
71(2), pp. 197–204.
Ranasinghe, P. et al. (2017) ‘Emotional intelligence,
perceived stress and academic performance of Sri
Lankan medical undergraduates’, BMC Medical
Education, 17(1), pp. 1–7. doi: 10.1186/s12909-017-
0884-5.
Rathnayake, S. and Ekanayaka, J. (2016) ‘Depression,
Anxiety and Stress among Undergraduate Nursing
Students in a Public University in Sri Lanka’,
International Journal of Caring Sciences, 9(3), pp.
1020–1032.
Raushanova, A. et al. (2015) ‘Socio-demographics
factors and stress levels among undergraduate
medical students in Kazakhstan’, Research Journal of
Pharmaceutical, Biological and Chemical Sciences,
6(6), pp. 346–351.
Sabih, F., Siddiqui, F. R. and Baber, M. N. (2013)
‘Assessment of Stress Among Physiotherapy
Students at Riphah Centre of Rehabilitation Sciences’,
J Pak Med Assoc, 63(3), pp. 346–349.
Schwarzer, R. and Jerusalem, M. (1995) ‘General Self-
Efficacy Scale’, in Weinman, J., Wright, S., and
Johnston, M. (eds) Measures in health psychology: A
user’s portfolio. Causal and control beliefs, pp. 35–37.
Scott, E. (2009) ‘Stress in college, Common causes of
stress in college’, Health Promotion International
Journal, 2(16), pp. 215–232.
Senavirathna, H. A. C. D. and Sanjeewani, R. M. S.
(2019) ‘Demographic characteristics of suicides in
Sri Lanka from 2006 to 2018’, 6th Annual Research
Symposium Procedings.
Shaw, M. P., Peart, D. J. and Fairhead, O. J. W. (2017)
‘Perceived stress in university students studying in a
further education college’, Research in Post-
Compulsory Education. Routledge, 22(3), pp. 442–
452. doi: 10.1080/13596748.2017.1362534.
Sherina, M. S., Rampal, L. and Kaneson, N. (2004)
‘Psychological stress among undergraduate medical
students’, Medical Journal of Malaysia, 59(2), pp.
207–211.
Smith, K. J., Rosenberg, D. L. and Haight, T. G. (2014)
‘An assessment of the psychometric properties of the
Perceived Stress Scale-10 (PSS10) with business and
accounting students’, Accounting Perspectives.
Canadian Academic Accounting Association, 13(1),
pp. 29–59. doi: 10.1111/1911-3838.12023.
WHO (2019) WHO | Suicide data, WHO. World Health
Organization.
World Population Review (2020) Suicide Rate By
Country 2020. Available at:
https://worldpopulationreview.com/countries/suic
ide-rate-by-country/.

13th International Research Conference
General Sir John Kotelawala Defence University
Allied Health Sciences Sessions
84
Yakushko, O., Watson, M. and Thompson, S. (2008)
‘Stress and coping in the lives of recent immigrants
and refugees: Considerations for counseling’,
International Journal for the Advancement of
Counselling, 30(3), pp. 167–178. doi:
10.1007/s10447-008-9054-0.
Yamane, T. (1967) Statistics: An Introductory
Analysis. 2nd edn. New York: Harper and Row.
13th International Research Conference
General Sir John Kotelawala Defence University
Allied Health Sciences Sessions
85
Investigation Of In-Vitro Antiurolithiatic Activity Of Passiflora Foetida
And Stachytarpheta Indica On Experimentally Prepared Calcium Oxalate
Crystals.
WDPA Jeewananda, HHND Priyankara, NM Thilakaratne, RN Pathirana, BLC Samanmali#
Department of Pharmacy, Faculty of Allied Health Sciences, General Sir John Kotelawala Defence University
Abstract:-Urolithiasis or the formation of
urinary stones is a major non communicable
disease that affects the urinary system. Among
the different types of renal stones CaC2O4 are the
overwhelming. Antiurolithiatic activity is the
inhibition of formation of urinary stones. There
is a high demand for herbal medicines to treat
urolithiasis due to unavailability of a successful
drug devoid of complications. Passiflora foetida
(Udahalu) & Stachytarpheta indica (Balunakuta)
plants are used in the treatment of kidney stones
in traditional medicine. This study was aimed to
investigate in-vitro antiurolithiatic activity of
these plants on experimentally prepared CaC2O4
crystals. The crude plant extracts were prepared
by boiling the dried plant material in water
followed by evaporation of the solvents via
rotary evaporation. A concentration series of
aqueous extract of the plants were prepared
with negative and positive (cystone tablets)
controls. Antiurolithiatic activity was evaluated
using the UV/visible spectrophotometry by
measuring optical density of each samples
having different concentrations of the plant
extracts at 620 nm. The mean absorbance of
P.foetida extract at 0.125 mg/mL, 0.25 mg/mL,
0.5 mg/mL, 1 mg/mL, 2 mg/mL, 4 mg/mL
concentrations were 0.045, 0.062, 0.105, 0.216,
0.1393, 0.623 respectively. The mean
absorbance of S. indica extract at 0.125 mg/mL,
0.25 mg/mL, 0.5 mg/mL, 1 mg/mL, 2 mg/mL, 4
mg/mL concentrations were 0.180, 0.260,
0.201, 0.959, 0.862, 0.492 respectively. There is
a concentration dependent increase in the mean
absorbance for the samples. The results reveal
that both extracts exhibit antiurolithiatic
activity and the highest activity is exhibited by S.
indica.
Keywords: Urolithiasis, calcium oxalate,
Passiflora foetida, Stachytarpheta indica,
antiurolithiatic activity
Introduction:
Urolithiasis is one of the major diseases in the
world. Urolithiasis means the formation of
stones in the urinary system i e. in the kidney,
ureter, and urinary bladder or in the urethra.
‘Urolithiasis’ = ouron (urine) and lithos (stone).
Globally, the prevalence and recurrence rates of
urolithiasis disease are increasing. This affects
about 12% of the world population at some
stage in their lifetime. There are mainly five
types of kidney stones, based on the mineral
composition and the pathogenesis as
Calcium stones, Struvite or Magnesium
Ammonium Phosphate stones, Uric acid stones
or Urate, Cystine stones and drug-induced
stones
There are two types of calcium stones namely
calcium oxalate and calcium phosphate. Calcium
stones are overwhelming renal stones
containing about 80% of every urinary stones.
Calcium oxalate is found in most of kidney
stones and exists as CaOx monohydrate (COM,
termed as mineral names: whewellite,
CaC2O4•H2O), and CaOx dihydrate (COD,
weddellite, CaC2O4•2H2O), or as a combination
of both which accounts for greater than 60%.
COM is the most thermodynamically stable form
of stone and more frequently observed than
COD in clinical stones. Stone development
begins with the arrangement of crystals in
supersaturated urine which at that point stick to
the urothelium, subsequently making the nidus
ensuing stone development. Crystals in urine
stick together to arrange a small hard mass of
13th International Research Conference
General Sir John Kotelawala Defence University
Allied Health Sciences Sessions
86
stone called crystal growth. This crystal growth
occurs through aggregation of secondary
nucleation of crystal on the matrix – coated
surface. This crystal formation is a very slow
process and it takes a long time to obstruct the
renal tubules.
Antiurolithiatic means preventing the formation
of urine stones. To prevent the formation of
urine stones, anti urolithiatic drugs have been
discovered. Most of the synthetic anti
urolithiatic drugs are having adverse effects.
The traditional herbal medication is the basis of
the modern complementary medical therapy.
Nowadays, antiurolithiatic drugs are not
generally used by physicians. Instead they just
treat for the pain until the stone passes out by
itself. Standard drugs are not using due to its
side effects and less effectiveness. Commonly
using drugs are Allopurinol, Citrate, Cystone and
thiazide diuretics
In this study, two plant species which are used
as herbal remedies to treat urolithiatic patients
in Sri Lanka have been investigated for
antiurolithiatic activity.
The main objectives of this study are to
investigate in-vitro antiurolithiatic activity of
the plants Passiflora foetida and Stachytarpheta
indica on experimentally prepared calcium
oxalate crystals.
Methodology
The study was carried out to evaluate in-vitro
antiurolithiatic activity of selected medicinal
plants; Passiflora foetida and Stachytarpheta
indica on experimentally designed calcium
oxalate crystals as a laboratory based
experimental study in natural urine medium.
The study was carried out in the laboratories of
the Faculty of Allied Health Sciences, General Sir
John Kotelawala Defence University Ratmalana.
The Passiflora foetida and Stachtarpheta indica
plants including its flowers and fruits were
collected at daytime from the local areas of
Ratnapura (6.70560N, 80.38470E) and Galle
(6.05350N, 80.22100E) districts.
The specimens were identified by the National
herbarium, Royal botanical garden, Peradeniya,
Sri Lanka. The collected plants were washed
with running water and air dried for seven days
to remove the moisture and grinded as a coarse
powder. Then they were labelled and stored in
air tight bottles.
Phytochemical screening was carried out for
both plants to detect the presence of particular
compounds using standard procedures
The crude plant extracts were prepared by using
standard methods with minor modifications.
From the stored plant powder, 50 g were taken
from each, soaked in 750 mL of distilled water
and boiled for 2 hours separately. The two
solution mixtures were filtered through a filter
paper. The filtrates were subjected to rotary
evaporation to remove the water and solid
crystals of the crude extract were obtained. The
crystals were kept in separate air tight bottles
and stored under 2-40C.
A concentration series of plant extract was
prepared using the doubling method. First,
40mg of plant extract was taken and dissolved in
10.0 mL of distilled water (10 mL). This process
was repeated to make a successive dilution
series as 4 mg/mL, 2 mg/mL, 1 mg/mL, 5
mg/mL, 0.25 mg/mL, 0.125 mg/mL.
A volume of 1.0 mL of the plant extracts having
different concentrations were added to six test
tubes each containing 2 mL of healthy urine. Into
those test tubes, 50 μL of Na2C2O4 solution
having a concentration of 0.0005 mg/dm-3 and
50 μL of CaCl2 solution having a concentration of
0.003 mg/dm-3 were added. For this mixture,
Tris buffer with the concentration of 0.05 mol/L
was added drop wise until the pH is adjusted to
6.5 and 10 μL of dil. Sulphuric was added to
facilitate the formation of crystals.
For the positive control, two Himalaya Cystone
tablets were crushed and 40 mg was taken and
dissolved in 10.0 mL of distilled water. A volume
of 1.0 mL of this solution was added to test tubes
containing 2.0 mL of healthy urine along with
the 0.05 mol/L of Tris buffer solution to
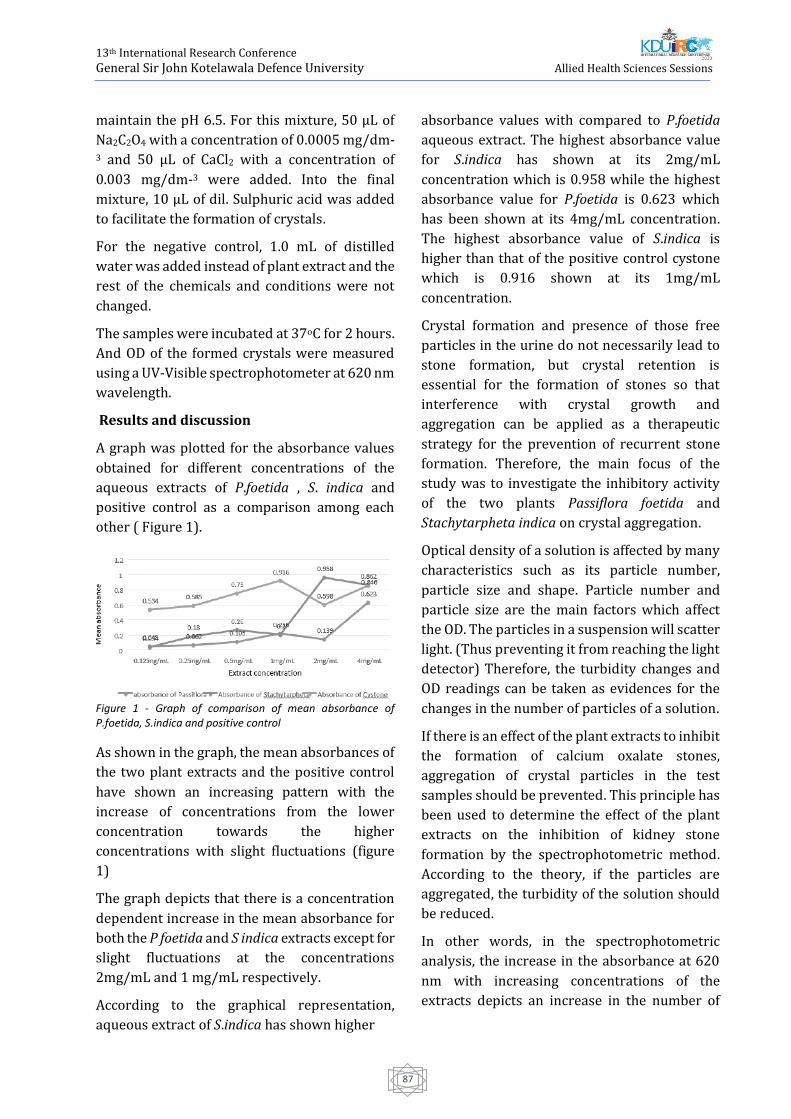
13th International Research Conference
General Sir John Kotelawala Defence University
Allied Health Sciences Sessions
87
maintain the pH 6.5. For this mixture, 50 μL of
Na2C2O4 with a concentration of 0.0005 mg/dm-3 and 50 μL of CaCl2 with a concentration of
0.003 mg/dm-3 were added. Into the final
mixture, 10 μL of dil. Sulphuric acid was added
to facilitate the formation of crystals.
For the negative control, 1.0 mL of distilled
water was added instead of plant extract and the
rest of the chemicals and conditions were not
changed.
The samples were incubated at 37oC for 2 hours.
And OD of the formed crystals were measured
using a UV-Visible spectrophotometer at 620 nm
wavelength.
Results and discussion
A graph was plotted for the absorbance values
obtained for different concentrations of the
aqueous extracts of P.foetida , S. indica and
positive control as a comparison among each
other ( Figure 1).
Figure 1 - Graph of comparison of mean absorbance of P.foetida, S.indica and positive control
As shown in the graph, the mean absorbances of
the two plant extracts and the positive control
have shown an increasing pattern with the
increase of concentrations from the lower
concentration towards the higher
concentrations with slight fluctuations (figure
1)
The graph depicts that there is a concentration
dependent increase in the mean absorbance for
both the P foetida and S indica extracts except for
slight fluctuations at the concentrations
2mg/mL and 1 mg/mL respectively.
According to the graphical representation,
aqueous extract of S.indica has shown higher
absorbance values with compared to P.foetida
aqueous extract. The highest absorbance value
for S.indica has shown at its 2mg/mL
concentration which is 0.958 while the highest
absorbance value for P.foetida is 0.623 which
has been shown at its 4mg/mL concentration.
The highest absorbance value of S.indica is
higher than that of the positive control cystone
which is 0.916 shown at its 1mg/mL
concentration.
Crystal formation and presence of those free
particles in the urine do not necessarily lead to
stone formation, but crystal retention is
essential for the formation of stones so that
interference with crystal growth and
aggregation can be applied as a therapeutic
strategy for the prevention of recurrent stone
formation. Therefore, the main focus of the
study was to investigate the inhibitory activity
of the two plants Passiflora foetida and
Stachytarpheta indica on crystal aggregation.
Optical density of a solution is affected by many
characteristics such as its particle number,
particle size and shape. Particle number and
particle size are the main factors which affect
the OD. The particles in a suspension will scatter
light. (Thus preventing it from reaching the light
detector) Therefore, the turbidity changes and
OD readings can be taken as evidences for the
changes in the number of particles of a solution.
If there is an effect of the plant extracts to inhibit
the formation of calcium oxalate stones,
aggregation of crystal particles in the test
samples should be prevented. This principle has
been used to determine the effect of the plant
extracts on the inhibition of kidney stone
formation by the spectrophotometric method.
According to the theory, if the particles are
aggregated, the turbidity of the solution should
be reduced.
In other words, in the spectrophotometric
analysis, the increase in the absorbance at 620
nm with increasing concentrations of the
extracts depicts an increase in the number of
13th International Research Conference
General Sir John Kotelawala Defence University
Allied Health Sciences Sessions
88
crystals in the samples preventing the crystal
growth and aggregation. Inhibition of crystal
growth and aggregation can inhibit the stone
formation. Because the dispersed crystals can be
eliminated easily through urinary tract.
In this study, the antiurolithiatic property was
investigated in-vitro with the mean absorbance
results obtained by the spectrophotometer.
They show a concentration dependent increase
in the mean absorbance values with slight
fluctuations which can be taken as a proof to
demonstrate the inhibition of particle
aggregation with the increase in the
concentration of the plant extracts in natural
urine. In P.foetida, the extract in the
concentration 4 mg/mL has shown a mean
absorbance value of 0.623 which is higher than
that of the negative control which is 0.492 and
plant S.indica has shown its highest mean
absorbance value of 0.861 at 4 mg/mL
concentration.
Conclusion
The present study reveals that aqueous extracts
of Passiflora foetida and Stachytarpheta indica
exhibit antiurolithiatic activity on
experimentally prepared calcium oxalate stones
in natural urine medium. They may be beneficial
in the treatment of urolithiasis due to calcium
oxalate kidney stones. Aqueous extract of
Stachytarpheta indica exhibits the highest
antiurolithiatic activity following the standard
drug cystone (Himalaya drug company, India)
and aqueous extract of Passiflora foetida.
References
Atmani, F, Slimani, Y, Mimouni, M and Hacht, B
(2003): Prophylaxis of calcium oxalate stones by
Herniaria hirsuta on experimentally induced
nephrolithiasis in rats, BJU International 92 (1), pp
137–140.
Barbas, C, Garcıa, A, Saavedra, L and Muros, M ́
(2002): Urinary analysis of nephrolithiasis markers,
Journal of Chromatography 781(1–2), pp 433–455.
Basavaraj, D R, Biyani, C S, Browning, A J and
Cartledge, J J (2007): The Role of Urinary Kidney
Stone Inhibitors and Promoters in the Pathogenesis
of Calcium Containing Renal Stones, EAU-EBU Update
Series 5 (3), pp 126–136. Available:
http://www.sciencedirect.com/science/article/pii/
s1871259207000159 [Accessed: 7th July 2019].
Chauhan, C K, Joshi, M J and Vaidya, A D B (2008):
Growth inhibition of Struvite crystals in the presence
of herbal extract Commiphora wightii, Journal of
Materials Science: Materials in Medicine 20 (1), pp 85.
Coe, F L, Parks, J H and Asplin, J R (1992): The
Pathogenesis and Treatment of Kidney Stones, New
England Journal of Medicine 327 (16), pp 1141–1152.
Khan, A, Bashir, S, Khan, S R and Gilani, A H (2011):
Antiurolithic activity of Origanum vulgare is
mediated through multiple pathways, BMC
Complementary and Alternative Medicine 11 (1), pp
96.
Miller, B F (2003): Encyclopedia & dictionary of
medicine, nursing, and allied health. Saunders,
Saunders 2003 ISBN: 9780721697918 p 122.
Available from
https://www.elsevier.com/books/miller-keane-
encyclopedia-and-dictionary-ofmedicine-nursing-
and-allied-health/miller-keane/978-0-7216-9791-8
[Accessed on 7th Julay 2019].
Mittal, A, Tandon, S, Singla, S K and Tandon, C (2015):
In-vitro studies reveal antiurolithic effect of
Terminalia arjuna using quantitative morphological
information from computerized microscopy,
International Brazilian Journal of Urology 41 (5), pp
935–944.
Rashmi, S and Rajkumar, H G (2011): Preliminary
Phytochemical Analysis and in-vitro Evaluation of
Antifungal Activity of Five Invasive Plant Species
against Macrophomina phaseolina (Tassi) Goid (1),
pp 11–15.
Ratkalkar, V N and Kleinman, J G (2011): Mechanisms
of stone formation, Clinical Reviews in Bone and
Mineral Metabolism 9 (3–4), pp 187–197.
Sijoria, R, Wanjari, M M, Dey, Y N, Jadhav, A D, Sharma,
D and Sikarwar, I (2016): In-vitro study of aqueous
leaf extract of Chenopodium album for inhibition of
calcium oxalate and brushite crystallization, Egyptian
Journal of Basic and Applied Sciences 3 (2), pp 164–
171.
Tiwari, A, Soni, V, Londhe, V, Bhandarkar, A,
Bandawane, D and Nipate, S (2012): An overview on
potent indigenous herbs for urinary tract infirmity:

13th International Research Conference
General Sir John Kotelawala Defence University
Allied Health Sciences Sessions
89
Urolithiasis, Asian Journal of Pharmaceutical and
Clinical Research 5, pp 7–12.
Vijaya, T, Sathish Kumar, M, Ramarao, N V, Naredra
Babu, A and Ramarao, N (2013): Urolithiasis and Its
Causes-Short Review, The Journal of
Phytopharmacology 2 (3), pp 1–6.
13th International Research Conference
General Sir John Kotelawala Defence University
Allied Health Sciences Sessions
90
In Vitro Evaluation Of Sun Screen Activity And Phytochemical Screening
Of Methanolic Leaf Extract Of Magnolia Figo
PMKT Dharmatilake1#, TRL Peiris1, BLC Samanmali1, RN Pathirana2 and WD Ratnasooriya3
1Department of Pharmacy, Faculty of Allied Health Sciences, General Sir John Kotelawala Defence University, Sri
Lanka 2Department of Basic Sciences, Faculty of Allied Health Sciences, General Sir John Kotelawala Defence University,
Sri Lanka 3Department of Zoology, Faculty of Science, University of Colombo, Sri Lanka
Abstract: Magnolia figo (Local name: “Madana-
kama”) is a native Chinese plant, which belongs
to Family Magnoliaceae. Although, different
parts of the plant have been used as a treatment
for several types of disease conditions such as
malaria, cardiovascular diseases and as a
strengthening agent for sexual virility in
traditional medicine. The aims of the present
study were to evaluate the sunscreen activity
and to qualitatively analyze the phytochemicals
present in methanolic leaf extract of Magnolia
figo. Collected leaves were air-dried, powdered
and macerated in methanol. The filtrate was
evaporated to dryness and subjected to freeze-
drying process. The SPF values of methanolic
extract of Magnolia figo and the reference agent;
Dermatone® were analyzed in vitro by using
spectrophotometric method. The results
exhibited that 2.00 mg/mL methanolic extract of
Magnolia figo has high sun protection activity
(29.94). The dose response relationship of
Magnolia figo and Dermatone® was analyzed
according to concentration series of each,
respectively. In the current study EC 50 was
calculated to methanolic leaf extract of Magnolia
figo (0.9135) which is lower than Dermatone®
(1.7820) suggesting that the potency of
methanolic leaf extract of Magnolia figo is higher
than the reference agent. According to the
phytochemical screening, methanolic leaf
extract of Magnolia figo was rich in alkaloids,
phenols, tannins, terpenoids, flavonoids,
steroidal glycosides and saponins. The results
concluded that leaf extract of Magnolia figo
possesses marked sunscreen activity which
exhibits its potential use for development of
sunscreen formulations.
Keywords: Magnolia figo, sun screen activity,
phytochemical screening
Introduction:
In the present day, most practical and popular
strategy to protect from the UV radiation is the
application of topical broad-spectrum
sunscreen formulations on the skin, because
they have the ability to reduce the penetration
of UV-A and UV-B radiation through the skin.
Sun screen formulations act by either absorbing
or reflecting the sun’s ultraviolet radiation
(Napagoda et al., 2016). The Sun Protection
factor (SPF), which is expressed as numeric
measurement on sunscreen products is the
recognized universal indicator for the photo
protective performance of the product (M.S.
Latha, 2013). SPF is defined as the UV energy
required to produce a minimal erythema dose
(MED) on protected skin, divided by the UV
energy required to produce a MED on
unprotected skin (Saraf and Kaur, 2010). The
SPF values of a sunscreen product can be
determined using in-vitro methods. (Mansur J.S.,
1986, Sayre et al., 1979). There are many factors
that should be considered when formulating a
new sun screen to the public because it has to be
safe, chemically inert, non-irritating, non-toxic
and photo-stable and should provide complete
protection to the skin (Mbanga et al., 2014).
Synthetic products are known to cause photo
13th International Research Conference
General Sir John Kotelawala Defence University
Allied Health Sciences Sessions
91
allergic reactions and potential to develop skin
melanoma due to complete absorption of UV-B
radiation allowing transmission of large
quantities of UV-A in to the deeper layers of the
skin, exacerbation of acne and rosacea because
they contain zinc oxide and titanium dioxide
which can block skin pores (Latha et al., 2013).
Due to associated adverse effects synthetic
sunscreen products are rapidly being replaced
by the herbal sunscreen products because most
of the materials which are used in sunscreen
products have not been established as safe for
long term human use (Korać and Khambholja,
2011). There is strong evidence that UV light
induces the accumulation of UV light absorbing
flavonoids and other phenols in dermal tissues
of plant body. This is a protective mechanism in
plants (Bissonnette, Nigen and Bolduc, 2012).
Naturally occurring phytochemicals such as
phenolic acids, flavonoids and high molecular
weight poly phenols are very useful for
prevention of harmful effects generated by UV
radiation (Saraf and Kaur, 2010).In order to
fulfill this great demand of novel plant based
clinical herbal sunscreens, many
pharmaceutical companies try to invest lots of
money for their research & development to get a
product outcome which can compete with other
products, with higher efficacy, relatively cheap
and user friendly. Species of genus Magnolia
have many traditional uses. In Ayurvedic
medicine, diseases such as fever, colic, leprosy,
eye disorder, gonorrhea, and gout can be treated
with Magnolia champaca. Magnolia alba is used
to treat bronchitis, prostatitis, and leucorrhoea.
Magnolia hypoleuca and Magnolia officinalis
have been used to treat carcinomatous sores in
leukemia. Flowers of Magnolia figo are used as a
cardiac tonic and roots and bark are used as
antidote for fish poison (Kumar, 2012). There is
no scientific evidence available about Magnolia
figo leaves that correspond to in vitro evaluation
of sunscreen activity. Phytochemical analysis
studies proved that the leaves of Magnolia figo
have several phyto constituents such as
polyphenols, flavonoids, alkaloids, aporphines
and sesquiterpene lactones which possess
exquisite biological activities (Kumar et al.,
2012). The presence of magnolamine,
magnoline and tetrandrine in the leaves also has
been reported (Jayaweera and Senaratna,
2006). Accordingly, the current study was
conducted to evaluate the sun screen activity
and carry out a qualitative analysis of the
phytochemicals present in methanolic leaf
extract of Magnolia figo.
Methodology:
Matured leaves of plant Magnolia figo (“Madana-
kama”) were collected,air-dried, powdered and
macerated in methanol. The filtrate was
evaporated to dryness and subjected to freeze-
drying process. The freeze-dried sample from
the plant extract (2 mg) was weighed using an
analytical balance and put into 1.5 mL
eppendorf tube. Eppendorf with extract was
filled with 1000 µl ethanol and it was properly
mixed using vortex mixer. In addition, the
reference agent; Dermatone® was dissolved in
ethanol to obtain a solution of 2.0 mg/mL and
absorbance of UV radiation by the methanolic
plant extract and Dermatone® were determined
in triplicate using SPECTRA max PLUS 384
microplate spectrophotometer from 290 to 320
nm, at 5 nm intervals taking ethanol as the blank
and data were recorded using the software-
Softmax Pro. SPF values were then determined
using the Mansur equation (Mansur, et al.,
1986).
EE = erythemal effect spectrum
I = solar intensity spectrum
abs = absorbance of sunscreen product;
CF = correction factor (= 10)
λ = wavelength
For Determination of the dose – response
relationship, the freeze-dried sample which
obtained from Magnolia figo was redissolved to
obtain 2.0 mg/mL, 1.0 mg/mL, 0.5 mg/mL, 0.25
SPFin vitro = CF × 𝐸𝐸290320 × (λ) × I(λ) × abs(λ)
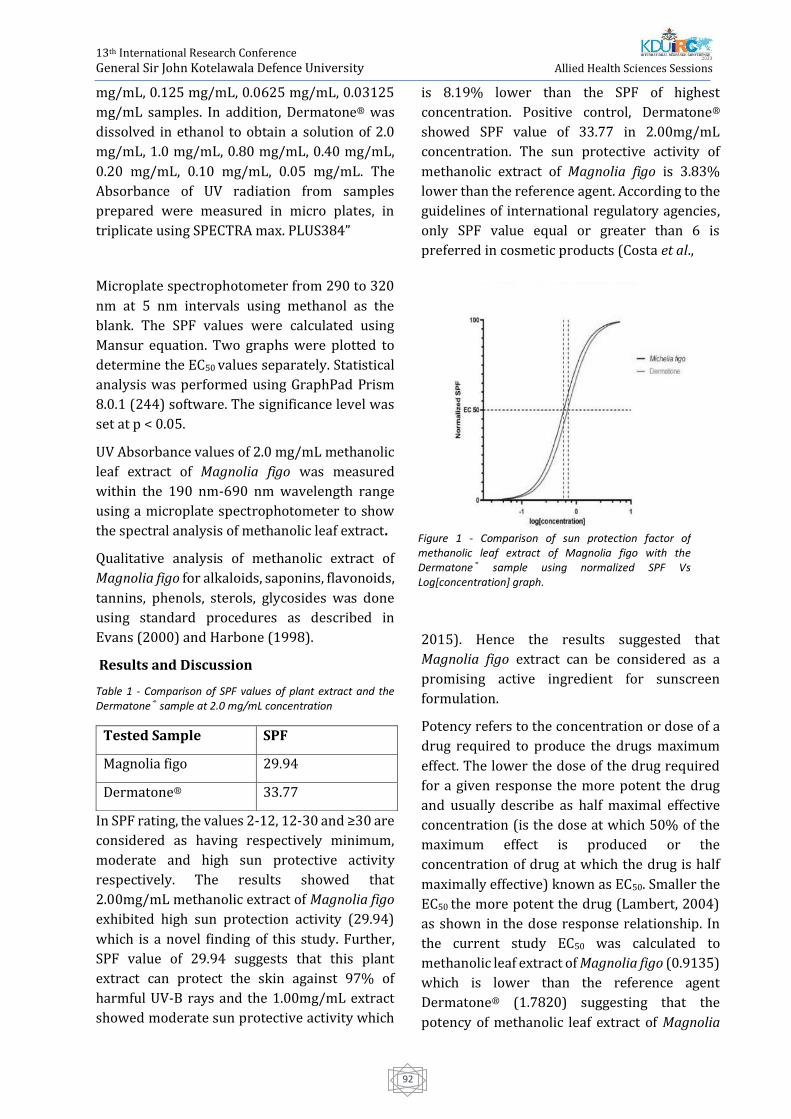
13th International Research Conference
General Sir John Kotelawala Defence University
Allied Health Sciences Sessions
92
mg/mL, 0.125 mg/mL, 0.0625 mg/mL, 0.03125
mg/mL samples. In addition, Dermatone® was
dissolved in ethanol to obtain a solution of 2.0
mg/mL, 1.0 mg/mL, 0.80 mg/mL, 0.40 mg/mL,
0.20 mg/mL, 0.10 mg/mL, 0.05 mg/mL. The
Absorbance of UV radiation from samples
prepared were measured in micro plates, in
triplicate using SPECTRA max. PLUS384”
Microplate spectrophotometer from 290 to 320
nm at 5 nm intervals using methanol as the
blank. The SPF values were calculated using
Mansur equation. Two graphs were plotted to
determine the EC50 values separately. Statistical
analysis was performed using GraphPad Prism
8.0.1 (244) software. The significance level was
set at p < 0.05.
UV Absorbance values of 2.0 mg/mL methanolic
leaf extract of Magnolia figo was measured
within the 190 nm-690 nm wavelength range
using a microplate spectrophotometer to show
the spectral analysis of methanolic leaf extract.
Qualitative analysis of methanolic extract of
Magnolia figo for alkaloids, saponins, flavonoids,
tannins, phenols, sterols, glycosides was done
using standard procedures as described in
Evans (2000) and Harbone (1998).
Results and Discussion
Table 1 - Comparison of SPF values of plant extract and the Dermatone® sample at 2.0 mg/mL concentration
In SPF rating, the values 2-12, 12-30 and ≥30 are
considered as having respectively minimum,
moderate and high sun protective activity
respectively. The results showed that
2.00mg/mL methanolic extract of Magnolia figo
exhibited high sun protection activity (29.94)
which is a novel finding of this study. Further,
SPF value of 29.94 suggests that this plant
extract can protect the skin against 97% of
harmful UV-B rays and the 1.00mg/mL extract
showed moderate sun protective activity which
is 8.19% lower than the SPF of highest
concentration. Positive control, Dermatone®
showed SPF value of 33.77 in 2.00mg/mL
concentration. The sun protective activity of
methanolic extract of Magnolia figo is 3.83%
lower than the reference agent. According to the
guidelines of international regulatory agencies,
only SPF value equal or greater than 6 is
preferred in cosmetic products (Costa et al.,
2015). Hence the results suggested that
Magnolia figo extract can be considered as a
promising active ingredient for sunscreen
formulation.
Potency refers to the concentration or dose of a
drug required to produce the drugs maximum
effect. The lower the dose of the drug required
for a given response the more potent the drug
and usually describe as half maximal effective
concentration (is the dose at which 50% of the
maximum effect is produced or the
concentration of drug at which the drug is half
maximally effective) known as EC50. Smaller the
EC50 the more potent the drug (Lambert, 2004)
as shown in the dose response relationship. In
the current study EC50 was calculated to
methanolic leaf extract of Magnolia figo (0.9135)
which is lower than the reference agent
Dermatone® (1.7820) suggesting that the
potency of methanolic leaf extract of Magnolia
Tested Sample SPF
Magnolia figo 29.94
Dermatone® 33.77
Figure 1 - Comparison of sun protection factor of methanolic leaf extract of Magnolia figo with the Dermatone® sample using normalized SPF Vs Log[concentration] graph.
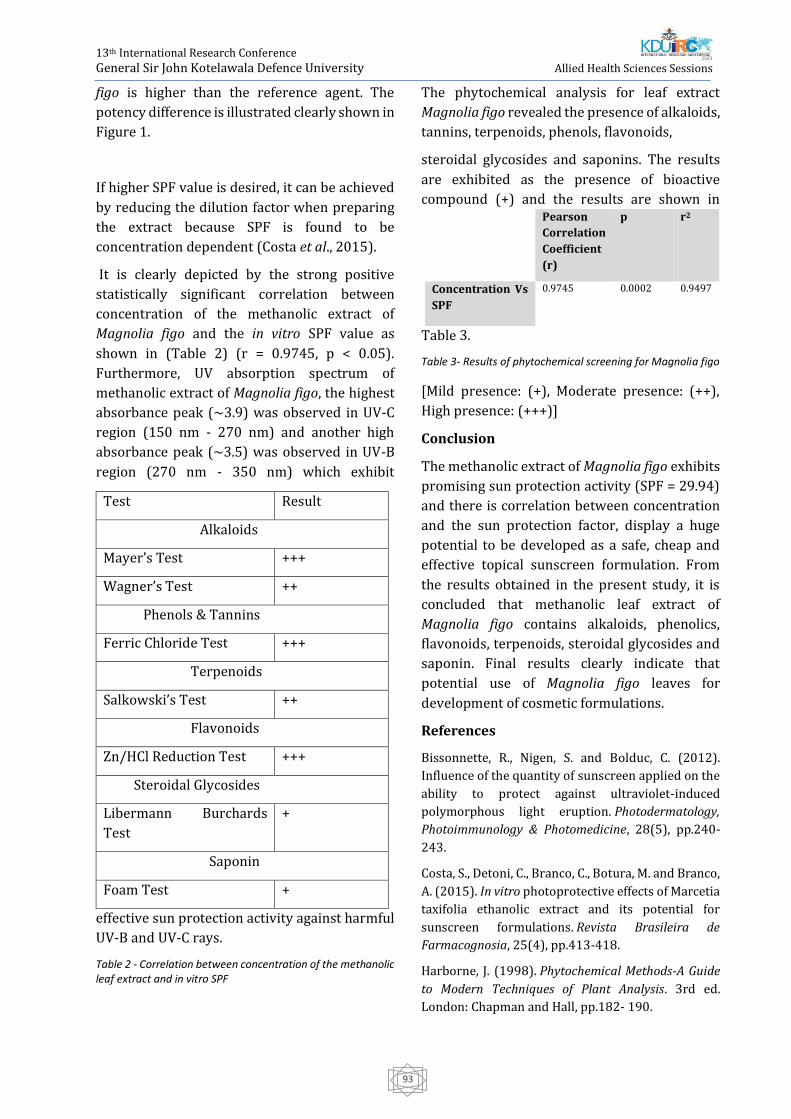
13th International Research Conference
General Sir John Kotelawala Defence University
Allied Health Sciences Sessions
93
figo is higher than the reference agent. The
potency difference is illustrated clearly shown in
Figure 1.
If higher SPF value is desired, it can be achieved
by reducing the dilution factor when preparing
the extract because SPF is found to be
concentration dependent (Costa et al., 2015).
It is clearly depicted by the strong positive
statistically significant correlation between
concentration of the methanolic extract of
Magnolia figo and the in vitro SPF value as
shown in (Table 2) (r = 0.9745, p < 0.05).
Furthermore, UV absorption spectrum of
methanolic extract of Magnolia figo, the highest
absorbance peak (~3.9) was observed in UV-C
region (150 nm - 270 nm) and another high
absorbance peak (~3.5) was observed in UV-B
region (270 nm - 350 nm) which exhibit
effective sun protection activity against harmful
UV-B and UV-C rays.
Table 2 - Correlation between concentration of the methanolic leaf extract and in vitro SPF
The phytochemical analysis for leaf extract
Magnolia figo revealed the presence of alkaloids,
tannins, terpenoids, phenols, flavonoids,
steroidal glycosides and saponins. The results
are exhibited as the presence of bioactive
compound (+) and the results are shown in
Table 3.
Table 3- Results of phytochemical screening for Magnolia figo
[Mild presence: (+), Moderate presence: (++),
High presence: (+++)]
Conclusion
The methanolic extract of Magnolia figo exhibits
promising sun protection activity (SPF = 29.94)
and there is correlation between concentration
and the sun protection factor, display a huge
potential to be developed as a safe, cheap and
effective topical sunscreen formulation. From
the results obtained in the present study, it is
concluded that methanolic leaf extract of
Magnolia figo contains alkaloids, phenolics,
flavonoids, terpenoids, steroidal glycosides and
saponin. Final results clearly indicate that
potential use of Magnolia figo leaves for
development of cosmetic formulations.
References
Bissonnette, R., Nigen, S. and Bolduc, C. (2012).
Influence of the quantity of sunscreen applied on the
ability to protect against ultraviolet-induced
polymorphous light eruption. Photodermatology,
Photoimmunology & Photomedicine, 28(5), pp.240-
243.
Costa, S., Detoni, C., Branco, C., Botura, M. and Branco,
A. (2015). In vitro photoprotective effects of Marcetia
taxifolia ethanolic extract and its potential for
sunscreen formulations. Revista Brasileira de
Farmacognosia, 25(4), pp.413-418.
Harborne, J. (1998). Phytochemical Methods-A Guide
to Modern Techniques of Plant Analysis. 3rd ed.
London: Chapman and Hall, pp.182- 190.
Pearson
Correlation
Coefficient
(r)
p r2
Concentration Vs
SPF
0.9745
0.0002
0.9497
Test Result
Alkaloids
Mayer’s Test +++
Wagner’s Test ++
Phenols & Tannins
Ferric Chloride Test +++
Terpenoids
Salkowski’s Test ++
Flavonoids
Zn/HCl Reduction Test +++
Steroidal Glycosides
Libermann Burchards
Test
+
Saponin
Foam Test +
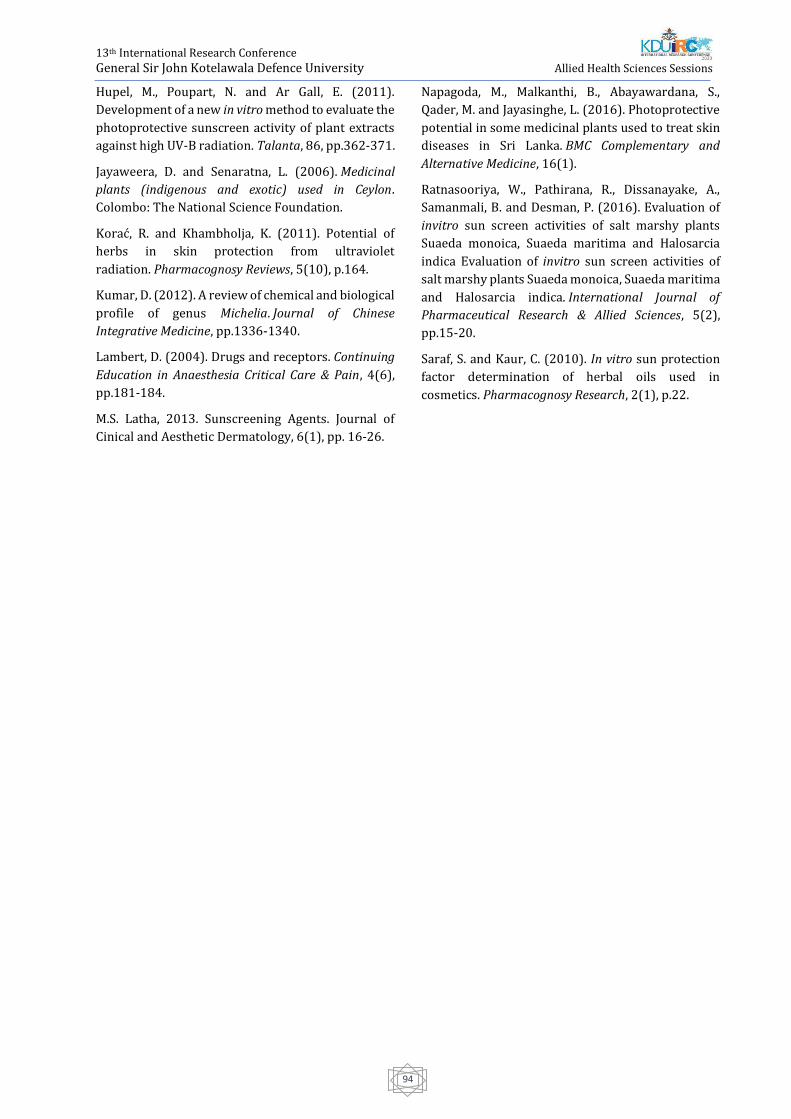
13th International Research Conference
General Sir John Kotelawala Defence University
Allied Health Sciences Sessions
94
Hupel, M., Poupart, N. and Ar Gall, E. (2011).
Development of a new in vitro method to evaluate the
photoprotective sunscreen activity of plant extracts
against high UV-B radiation. Talanta, 86, pp.362-371.
Jayaweera, D. and Senaratna, L. (2006). Medicinal
plants (indigenous and exotic) used in Ceylon.
Colombo: The National Science Foundation.
Korać, R. and Khambholja, K. (2011). Potential of
herbs in skin protection from ultraviolet
radiation. Pharmacognosy Reviews, 5(10), p.164.
Kumar, D. (2012). A review of chemical and biological
profile of genus Michelia. Journal of Chinese
Integrative Medicine, pp.1336-1340.
Lambert, D. (2004). Drugs and receptors. Continuing
Education in Anaesthesia Critical Care & Pain, 4(6),
pp.181-184.
M.S. Latha, 2013. Sunscreening Agents. Journal of
Cinical and Aesthetic Dermatology, 6(1), pp. 16-26.
Napagoda, M., Malkanthi, B., Abayawardana, S.,
Qader, M. and Jayasinghe, L. (2016). Photoprotective
potential in some medicinal plants used to treat skin
diseases in Sri Lanka. BMC Complementary and
Alternative Medicine, 16(1).
Ratnasooriya, W., Pathirana, R., Dissanayake, A.,
Samanmali, B. and Desman, P. (2016). Evaluation of
invitro sun screen activities of salt marshy plants
Suaeda monoica, Suaeda maritima and Halosarcia
indica Evaluation of invitro sun screen activities of
salt marshy plants Suaeda monoica, Suaeda maritima
and Halosarcia indica. International Journal of
Pharmaceutical Research & Allied Sciences, 5(2),
pp.15-20.
Saraf, S. and Kaur, C. (2010). In vitro sun protection
factor determination of herbal oils used in
cosmetics. Pharmacognosy Research, 2(1), p.22.
13th International Research Conference
General Sir John Kotelawala Defence University
Allied Health Sciences Sessions
95
Association Between Perceived Stress And Obesity Among Female
Undergraduate Students In The University Of Peradeniya
EHMRK Ekanayake 1#, RM Mudiyanse2
1Faculty of Allied Health Sciences, University of Peradeniya, Sri Lanka 2Faculty of Medicine, University of Peradeniya, Sri Lanka
Abstract:-Obesity has been widely recognized
as a major health hazard due to the increased
risk of heart disease, diabetes mellitus, and
cancers. BMI is the most popular method of
measuring obesity. However, waist
circumference is a commonly used measure to
evaluate the abdominal fat distribution. In Sri
Lanka, female sex is recognized to be associate
with overweight and obesity. Out of many
well-known etiological factors, ever-
increasing stress in life remains a poorly
understood cause of obesity. University
students are particularly subjected to
stressors and possibly have a higher incidence
of becoming obese and to have high abdominal
obesity. This study explores the prevalence of
overweight and obesity by Body Mass Index,
abdominal obesity by Waist Circumference,
and explores the association between the
degree of perceived stress measured by
perceived stress scale with BMI and waist
circumference among female students at the
University of Peradeniya. A total of 450, 3rd-
year female students were selected randomly
to represent all the faculties of theUniversity
of Peradeniya. The Perceived stress scale; a
self-reporting questionnaire was
administered. Anthropometric measurements
were measured by using standardized
equipment. Visceral fat was measured by the
Bio Impedance analysis machine. Data were
analysed using SPSS 20 software. Prevalence
of overweight, obesity, and abdominal obesity
were 19.9%, 4.1% and 10.1% respectively.
There was a statistically significant
association between perceived stress level
and the waist circumference categories
(p<0.05). A similar trend was seen with BMI
even though it
is not significant (p>0.05). This study
demonstrates a low prevalence of obesity
among university students compared to the
previously reported 7.3% of prevalence
among the female population, Sri Lanka. The
impact of high perceived stress; a manageable
risk factor of obesity was recognized.
Keywords: Obesity, Perceived stress,
University students
Introduction:
Obesity also is known as adiposity,
chubbiness, corpulence, and fatness has
gained considerable attention as a major
health hazard. Obesity is defined as abnormal
or excessive accumulation of fat that may
impair health. It is defined as body mass index
greater than or equal to 30 kg/m2 according
to the international classification of obesity
and overweight is defined as BMI above 25 kg
/m2 (World Health Organization, 2017).
Worldwide obesity has increased by more
than double between 1980 and 2014. It causes
at least 2.8 million people to die each year and
contributed to an estimated 35.8 million
(2.3%) global disability-adjusted life years. In
low and middle-income countries, the
prevalence of obesity is twice higher among
women than men (World Health Organization,
2017). In Sri Lankan adults, the
percentage of overweight, obese and centrally
obese categories were 25.2%, 9.2%, and
26.2%. Female sex, urban living, higher
13th International Research Conference
General Sir John Kotelawala Defence University
Allied Health Sciences Sessions
96
education, higher income and being in the
middle age were shown to be associated with
overweight and obesity in Sri Lanka
(Katulanda et al., 2010).
Genetics predispose to severe obesity and
early onset of obesity (Shawky and Sadik,
2012). Individual behaviors and
environmental factors can contribute to
excess calorie intake and inadequate physical
activity leads to obesity (Duffey and Popkin,
2011). Certain medical conditions such as
polycystic ovary syndrome (Sam, 2007) and
prescription drugs such as steroids, and
antidepressants (Kulkarni and Kaur, 2001)
can cause weight gain. Inadequate sleep,
prenatal and post-natal influences
(Gunderson, 2009), chemical exposure (Wang
et al., 2012) and stress (Richardson et al.,
2015) may affect energy balance and obesity
risk. However, out of many well-known
etiological factors, ever-increasing stress in
life, remains a poorly understood cause of
obesity.
Obese people tend to die prematurely (Global
BMI Mortality Collaboration, 2016).
Overweight and obesity predispose to
vascular diseases (Lawlor, Lean and Sattar,
2006), diabetes mellitus (Al-Goblan, Al-Alfi
and Khan, 2014), renal diseases (Eknoyan,
2011), gallbladder diseases (Amaral and
Thompson, 1985) and impairs respiratory
function (Lin et al., 2006). They often suffer
from anxiety, sleep apnea, psychosocial
problems, depression and low self-esteem
(Araghi et al., 2013). Consequently, morbidity
and mortality rates are higher among the
obese people (Abdelaal, le Roux and Docherty,
2017).
In the evaluation of obesity, various methods
have been used. Body mass index is the most
widely used method in epidemiological
studies (Nuttall, 2015). Furthermore, skinfold
thickness (SFT) measurement has been used
from ancient times (Gray et al., 1990). Also,
waist to hip ratio (WHR) and waist
circumference have been done to evaluate
abdominal obesity (Ahmad et al., 2016).
Measuring waist circumference is considered
as an effective method of assessment of health
risks (Siren et al., 2012). Also, the place of
distribution of fat is an important risk factor,
because fat cells have different metabolic
activities depending on their locations
(Jensen, 2008). In recent years, development
of Bio Impedance Analysis (BIA) method,
which involves assessment of the resistance of
body tissues by passing an electric current of
low intensity, with a fixed frequency,
contributes to measuring the percentage of
the different compartment of body fat (Sampei
and Sigulem, 2009).
Abdominal obesity is often referring to belly
fat also known as central obesity or intra-
abdominal fat. It includes both subcutaneous
fat that sits just under the skin and the visceral
fat that sits deep in the abdominal cavity
around internal organs (Hellen, 2009).
Visceral adipose tissue, more metabolically
active, more sensitive to lipolysis and more
insulin resistant than subcutaneous adipose
tissue thereby carries a greater risk of
morbidity and mortality (Ibrahim, 2010).
Abdominal obesity is associated with serious
adverse metabolic and cardiovascular
outcomes, including type 2 diabetes,
atherosclerotic heart disease (Pischon et al.,
2008) and severe impairment of lung function
(Leone et al., 2009). Cytokines released by
adipocytes may cause
inflammation which can lead to certain
cancers in tissues such as in colon,
endometrium and breast (American Cancer
Society, 2016). Risk of diabetes is increased
when the waist circumference is more than
31.5 inches (80 cm) in women and more than
35.5 inches (90 cm) in men (The
International Diabetes Federation, 2010).
Stress is a state of threatened homeostasis
caused by intrinsic or extrinsic adverse forces
(stressors) (Tsigos et al., 2000). Intrinsic
13th International Research Conference
General Sir John Kotelawala Defence University
Allied Health Sciences Sessions
97
stressors were defined as stressful
components that are triggered by
the cognitive challenges (Sandi and Pinelo-
Nava, 2007) such as dealing with uncertainty,
novel and urgent tasks (Pottier et al., 2015).
Extrinsic stressors were defined as stressful
components that are induced by conditions
that are completely unrelated to the cognitive
tasks (Sandi and
Pinelo-Nava, 2007) such as noise, pain, sleep
deprivation and crowding (Pottier et al.,
2015). Stress is counteracted by complex
physiological responses including increased
heart rate, increased sweating, dilation of the
pupil and behavioral responses including
changing eating and
sleeping patterns, feeling angry or depressed
(Henry, 1997).
Central and peripheral stress systems
contribute to maintain and re-establish the
body equilibrium (Tsigos et al., 2000). Within
the CNS, they produce lasting changes relevant
to depression and anxiety-like behavior by
activating the hypothalamic-pituitary-adrenal
axis. Peripheral systems release immature,
pro-inflammatory monocytes and neutrophils
into the peripheral circulation that precipitate
a series of immune events (Pfau and Russo,
2015). Each one’s stress is determined by a
multiplicity of genetic, environmental and
developmental factors (Tsigos et al., 2000).
Methods to assess the stressors include self-
report and biofeedback methods. In a self-
report questionnaire an individual’s answer
questions about the mental or physical state
(Morgan, Umberson and Hertzog, 2014).
Perceived Stress Scale (PSS) is a validated self-
report tool thatused globally (Chiu et al.,
2016). For the understanding of daily stress,
diary methods, ecological momentary
assessment, short questionnaire and
telephone interviews are used (Almeida,
McGonagle and King, 2009). In the
biofeedback technique, record the activity of
the physiological systems of the body‘s stress
response. Measurement of blood pressure,
heart rate, respiratory rate
and stress hormones (mostly cortisol) in
saliva can be used (Lupien, 2013).
Stress has a multitudes impact on health.
Short-term stressors boost the immune
system but chronic stress suppresses the
immune system and increased risk for viral
illnesses (Segerstrom and Miller, 2004). Stress
increased the risk of bronchoconstriction
(Edith, et al., 2007), diabetes mellitus
(Richard, 2002), gastroesophageal reflux
causing peptic ulcers, stress ulcers or
ulcerative colitis (Bradley et al., 1993). Stress
is linked to psychiatric illnesses such as
schizophrenia and depression (Cheryl et al.,
2002). As well as Stress has been associated
with poor eating behaviors, diet quality, high
body mass index (Richardson et al., 2015) and
impairs the inclination to be physically active
(Stults et al., 2014).
Undergraduate students are subjected to high
levels of stress due to academic, health-related
and psychosocial stressors (Waghachavare et
al., 2013). Stress plays a role in the
determination of body fat distribution among
the female population. This is consistent with
the known effects of cortisol in the
redistribution of fat from the periphery to the
abdominal region (Dallman, Pecoraro and la
Fleur, 2005). Enzymes that control tissue
cortisol concentrations is located in adipose
(fat) tissues (Morris and Zemel, 2005). Thus, a
higher percentage of deep fat cells
surrounding the abdomen may lead to obesity
due to the production of greater amounts of
cortisol at the tissue level (Epel et al., 2000).
Therefore, evaluation of the association of the
stressors and obesity may be important for the
prevention of stress-related obesity among
female undergraduate University students.
This study aimed to determine the prevalence
of obesity among undergraduate female and to
evaluate the association between perceived
stress with body mass index and waist
13th International Research Conference
General Sir John Kotelawala Defence University
Allied Health Sciences Sessions
98
circumference among undergraduate female
students in the university of Peradeniya.
Methodology:
The study is a descriptive and exploratory
study that was carried over a period of six
months from December 2017 to June 2018.
Third-year undergraduate female students
from all nine faculties in the University of
Peradeniya were included and undergraduate
female students who are with disabilities were
excluded from the sample. A random sampling
method was used to select the sample.
According to the large sample theory, the
sample size was taken as 450. The names of
the female third-year students were taken
randomly from the registers under the
permission of deans and senior registrars
from each faculty.
[]
Height was measured using a calibrated
stadiometer. Weight and visceral fat were
measured using bioelectrical impedance
machine (BIA). Waist at minimal waist
circumferences was taken using a calibrated
measuring tape. The degree of Perceived
Stress level was measured using validated
English, Sinhala and Tamil version of the self-
report tool PSS; 10 item questionnaire. Sinhala
PSS Translation courtesy of Dr. A.V.S. Rekha
Aththidiye, Licensed Clinical Psychologist,
University of Colombo; Sri Lanka. Tamil
Translation courtesy to Mr. Santhalingam
Sathees, University of Jaffna.
Ethical clearance was taken from the faculty of
Allied Health Science, University of
Peradeniya. Permission to conduct the study
was obtained from the Deans of all nine
faculties and contact the senior registrars of
each faculty. Registers of names were
obtained to select the random sample and get
a convenient time and the venue for data
collection was decided after discussing with
the participant of each faculty. Research
assistants and primary investigator were
trained under the supervision of a clinical
nutritionist, for measurement of
anthropometric measurements and to operate
the BIA machine. Clinical nutritionist
evaluates the trainees for precise and accurate
measurements. Calibrated of equipment were
done along with the training. Participants
were recruited by the poster. Spend one to
three days per faculty to get the total number
expected from one faculty. On the day of the
study, it was arranged in a suitable place.
The information sheet that includes a
description of the research, ethical
consideration and medical boundaries of the
research and the written consent forms were
distributed and time was given to participants
to read, understand, ask for queries and sign
the document before the data collection
process.
Questionnaire used to collect demographic
data including age and district. Perceived
stress scale questionnaire (Cohen, et al, 1983)
that is consisted of ten items about the feelings
and thoughts during the last month was used
to assess perceived stressors. It was taken 10
to 15 minutes to complete the questionnaire
for a single participant.
A. PSS Score
Reverse the scores for questions 4, 5, 7, and 8.
On these 4 questions, change the scores like, 0
=4, 1 = 3, 2 = 2, 3 = 1, 4 = 0. Add up the scores
for each item to get a total. Individual scores
on the PSS can range from 0 to 40 with higher
scores indicating higher perceived stress.
Scores ranging from 0-13, 14-26 and 27-40
would be considered as low, moderate and
high perceived stress.
B. Anthropometric measurements.
Each anthropometric measurement was taken
by a single investigator. Anthropometric
measurements were taken according to
accepted guidelines (‘WHO | Physical status:
the use and interpretation of anthropometry’,
2013). Measurement of height was taken by a
stadiometer to the nearest 0.5 cm. Participants
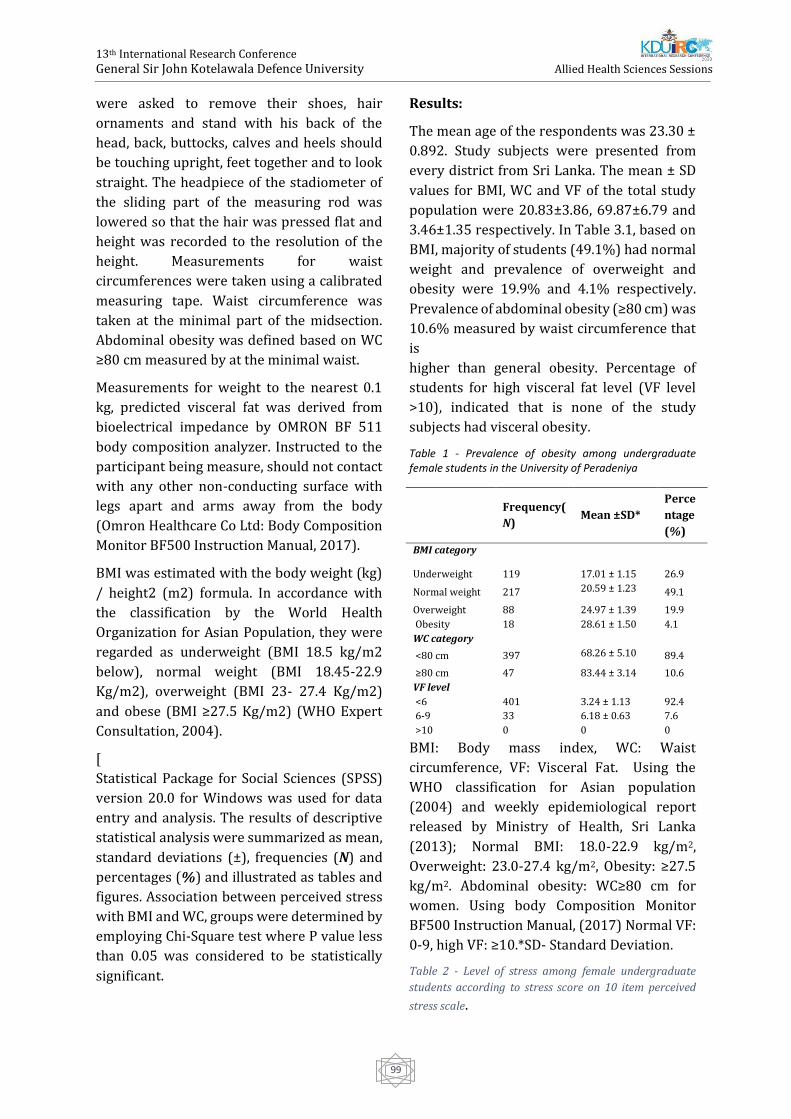
13th International Research Conference
General Sir John Kotelawala Defence University
Allied Health Sciences Sessions
99
were asked to remove their shoes, hair
ornaments and stand with his back of the
head, back, buttocks, calves and heels should
be touching upright, feet together and to look
straight. The headpiece of the stadiometer of
the sliding part of the measuring rod was
lowered so that the hair was pressed flat and
height was recorded to the resolution of the
height. Measurements for waist
circumferences were taken using a calibrated
measuring tape. Waist circumference was
taken at the minimal part of the midsection.
Abdominal obesity was defined based on WC
≥80 cm measured by at the minimal waist.
Measurements for weight to the nearest 0.1
kg, predicted visceral fat was derived from
bioelectrical impedance by OMRON BF 511
body composition analyzer. Instructed to the
participant being measure, should not contact
with any other non-conducting surface with
legs apart and arms away from the body
(Omron Healthcare Co Ltd: Body Composition
Monitor BF500 Instruction Manual, 2017).
BMI was estimated with the body weight (kg)
/ height2 (m2) formula. In accordance with
the classification by the World Health
Organization for Asian Population, they were
regarded as underweight (BMI 18.5 kg/m2
below), normal weight (BMI 18.45-22.9
Kg/m2), overweight (BMI 23- 27.4 Kg/m2)
and obese (BMI ≥27.5 Kg/m2) (WHO Expert
Consultation, 2004).
[
Statistical Package for Social Sciences (SPSS)
version 20.0 for Windows was used for data
entry and analysis. The results of descriptive
statistical analysis were summarized as mean,
standard deviations (±), frequencies (N) and
percentages (%) and illustrated as tables and
figures. Association between perceived stress
with BMI and WC, groups were determined by
employing Chi-Square test where P value less
than 0.05 was considered to be statistically
significant.
Results:
The mean age of the respondents was 23.30 ±
0.892. Study subjects were presented from
every district from Sri Lanka. The mean ± SD
values for BMI, WC and VF of the total study
population were 20.83±3.86, 69.87±6.79 and
3.46±1.35 respectively. In Table 3.1, based on
BMI, majority of students (49.1%) had normal
weight and prevalence of overweight and
obesity were 19.9% and 4.1% respectively.
Prevalence of abdominal obesity (≥80 cm) was
10.6% measured by waist circumference that
is
higher than general obesity. Percentage of
students for high visceral fat level (VF level
>10), indicated that is none of the study
subjects had visceral obesity.
Table 1 - Prevalence of obesity among undergraduate female students in the University of Peradeniya
BMI: Body mass index, WC: Waist
circumference, VF: Visceral Fat. Using the
WHO classification for Asian population
(2004) and weekly epidemiological report
released by Ministry of Health, Sri Lanka
(2013); Normal BMI: 18.0-22.9 kg/m2,
Overweight: 23.0-27.4 kg/m2, Obesity: ≥27.5
kg/m2. Abdominal obesity: WC≥80 cm for
women. Using body Composition Monitor
BF500 Instruction Manual, (2017) Normal VF:
0-9, high VF: ≥10.*SD- Standard Deviation.
Table 2 - Level of stress among female undergraduate
students according to stress score on 10 item perceived
stress scale.
Frequency(
N) Mean ±SD*
Perce
ntage
(%)
BMI category
Underweight 119 17.01 ± 1.15 26.9
Normal weight 217 20.59 ± 1.23 49.1
Overweight 88 24.97 ± 1.39 19.9
Obesity 18 28.61 ± 1.50 4.1
WC category
<80 cm 397 68.26 ± 5.10 89.4
≥80 cm 47 83.44 ± 3.14 10.6
VF level
<6 401 3.24 ± 1.13 92.4
6-9 33 6.18 ± 0.63 7.6
>10 0 0 0
13th International Research Conference
General Sir John Kotelawala Defence University
Allied Health Sciences Sessions
100
Using Cohen et al (1983); Low perceived
stress: 0-13 score, moderate perceived stress:
14-26 score, high perceived
stress: 27-40 score.
The mean ± SD perceived stress scale (PSS)
score of the total study population was
18.92±5.22. There was a significant difference
between means of perceived stress levels
(p<0.01) according to the One-way ANOVA
test. The descriptive characteristics for each
PSS are as shown in Table 3.2 and majority of
students (76.8%) perceived moderate stress.
Table 3 - Comparison of WC, BMI and stress score with the chi-square test, among undergraduate female Students University of Peradeniya.
*Significant association between degree of
stress based on WC categories assessed, WC:
waist circumference, BMI: Body Mass Index,
PSS: Perceived Stress Scale, N = frequency
counts, figures in parentheses represent
percentages.
There was a statistically significant
association between perceived stress level
and the waist circumference categories
(p<0.05) and a similar trend with BMI even
though it is not significant (p>0.05) (Table
3.3).
Discussion
Excess body fat is well documented as a risk
factor for numerous chronic conditions, such
as diabetes, hypertension, hyperlipidemia and
cardiovascular diseases (Must and McKeown,
2000). In this study, BMI; a measure of general
obesity and WC; a measure of abdominal
obesity that are predictors of cardiovascular
risks, non-insulin-dependent diabetes, and
hypertension (Morris and Zemel, 2005).
Total 450 subjects represent students from
every district in Sri Lanka. The mean age of the
study
the population was 23.30±0.892 years. The
prevalence of underweight, normal,
overweight and obesity determined by BMI
were 26.9%, 48.1%, 19.9%, and 4.1%
respectively. This study indicates lower
prevalence of obesity than the previous report
of 7.3 % prevalence of obesity in the female
population,Sri Lanka (World Data Atlas,
2017).
The prevalence of overweight, obesity and
central obesity among university students
reported from India were 26.8% and 10.7%,
and 16.4% (Pengpid and Peltzer, 2014) In
another study involving university students in
22 countries prevalence of underweight,
normal weight, over weight and obesity were
17.6%, 62.1%, 14.1% and 5.2% respectively
(Peltzer et al., 2014). Both studies indicate a
lower prevalence of obesity (4.1%) and a
higher prevalence of underweight (26.9%) in
our sample, probably indicating the
socioeconomic background of our university
entrants. It is important to note that none of
the study subjects had visceral obesity when
compared with 39% of prevalence among
female students in A’shaqiyah University,
Oman (Louay Labban, 2015). Obesity
prevalence by BMI was 4.1% when compared
to 10.6% of obesity prevalence that is
Perceived stress level (score)
Low
Perceived
Stress
Moderate
Perceived
Stress
High
Perceived
Stress
Frequency(N) 63 337 39
Percentages
(%)
14.4 76.8 8.9
mean ± SD 11.02 ±
1.77
19.24 ±
3.29
29.00 ±
2.10
PSS score P value, df
low
moderat
e high
N (%) N (%) N (%)
WC
categories
<80 cm 47
(12.1)
306
(79.1)
34(8.8
) p=0.002*,
2 ≥80 cm
14(30.4
) 27(58.7)
5(10.9
)
BMI
categories
Underweigh
t
18
(15.5)
96
(82.8) 2 (1.7)
p=0.067,6
Normal
weight
25
(11.8)
161
(75.9)
26
(12.3)
overweight 14
(16.5)
62
(72.9)
9
(10.6)
obesity 3 (16.7)
13
(72.2)
29
(11.1)
13th International Research Conference
General Sir John Kotelawala Defence University
Allied Health Sciences Sessions
101
measured by WC. 6.5% of obese girls were not
detected by BMI. The discrepancy of obesity
prevalence measured by BMI and WC needs
further evaluation.
The average perceived stress score was 18.92,
which is higher than the standard score (M =
14.2; SD = 6.2), and 51.9 % of students had
scored above standard, indicating a higher
prevalence of stress among these participants.
However, the mean perceived stress scale
score (18.92) reported by Swaminathan et al
in a Tamil Nadu university was 21.09
(Swaminathan et al., 2015) and findings of Al-
Dubai et al among medical residents in
Malaysia was 20.4 (Al-Dubai et al., 2014) and
in a study in Pakistan among first and second-
year students was 30.84 (Shah et al., 2010)
indicating better stress levels in our university
students that is probably indicating the
psychosocial relief provided by this garden
university with vast facilities for leisure and
recreation. Comparisons with other
universities in the country would be a valuable
exercise.
The focus of this study was on the association
of PSS on BMI and WC, two measures used to
classify obesity and the risk of fat
accumulation. PSS investigation would make a
unique contribution to understanding the
association in a university female population.
There was a statistically significant
association between perceived stress level
and the waist circumference categories
(p<0.05) and a similar trend with BMI even
though it is not significant (p>0.05).
This study provides preliminary evidence that
perceived stress interacts to play a role in the
determination of body fat distribution among
female. This is consistent with the known
effects of cortisol to redistribute fat from the
periphery to the abdominal region (Dallman,
Pecoraro and la Fleur, 2005)
Stress is a phenomenon occurring between an
individual and the environment, and it creates
a biochemical, psychosomatic condition
including releasing cortisol. Particular
enzymes that control tissue cortisol
concentrations is located in adipose (fat)
tissues (Morris and Zemel, 2005). Thus, higher
levels of these enzymes in these deep fat cells
surrounding the abdomen may lead to obesity
due to greater amounts of cortisol being
produced at the tissue level (Epel et al., 2000).
It is suggested that women with visceral fat
accumulation have elevated cortisol secretion
due to an increased sensitivity along the
hypothalamic-pituitary-adrenal axis, and that
this may be causing their abnormal fat depot
distribution (Marin P. et al., 1992)
Conclusion
Low prevalence of obesity among study
subjects was noticed when compared with
reported prevalence of 7.3% among females in
the general population, Sri Lanka.. Better
stress levels in female students in Peradeniya
University, probably indicate that the
psychosocial relief provided by this garden
university with vast facilities for leisure and
recreation. Also, it may associate with body
image perceptions of attractiveness as female
students to maintain a healthy BMI to remain
attractive. WC becomes a useful measure in a
university setting due to its simplicity.
Discrepancy of obesity prevalence measured
by BMI and WC needs further evaluation.
The results of this study show statistically
significant association with perceived stress
with WC So, perceived stress is a risk factor of
obesity for female university students, which
is manageable and need attention and further
clarification. The impact of high perceived
stress; a manageable risk factor of obesity was
recognized.
Acknowledgement
This research is a granted project by
University research grants in December 2017
(Grant No. URG/2017/42/M)
References
13th International Research Conference
General Sir John Kotelawala Defence University
Allied Health Sciences Sessions
102
Almeida, D. M., McGonagle, K. and King, H. (2009)
‘Assessing daily stress processes in social surveys
by combining stressor exposure and salivary
cortisol.’, Biodemography and social biology. NIH
Public Access, 55(2), pp. 219–37.
Abdelaal, M., le Roux, C. W. and Docherty, N. G.
(2017) ‘Morbidity and mortality associated with
obesity.’, Annals of translational medicine. AME
Publications, 5(7), p. 161. doi:
10.21037/atm.2017.03.107.
Ahmad, N. et al. (2016) ‘Abdominal Obesity
Indicators: Waist Circumference or Waist-to-hip
Ratio in Malaysian Adults Population.’,
International journal of preventive medicine.
Wolters Kluwer -- Medknow Publications, 7, p. 82.
doi: 10.4103/2008-7802.183654.
Al-Dubai, S. et al. (2014) ‘Evaluation of
psychometric properties of the Malay version
perceived stress scale in two occupational settings
in Malaysia’, Annals of Medical and Health Sciences
Research, 4(8), p. 104. doi: 10.4103/2141-
9248.138023.
Al-Goblan, A. S., Al-Alfi, M. A. and Khan, M. Z. (2014)
‘Mechanism linking diabetes mellitus and obesity.’,
Diabetes, metabolic syndrome and obesity : targets
and therapy. Dove Press, 7, pp. 587–91. doi:
10.2147/DMSO.S67400.
Amaral, J. F. and Thompson, W. R. (1985)
‘Gallbladder disease in the morbidly obese.’,
American journal of surgery, 149(4), pp. 551–7.
Available at:
http://www.ncbi.nlm.nih.gov/pubmed/3985293
Araghi, M. H. et al. (2013) ‘The complex
associations among sleep quality, anxiety-
depression, and quality of life in patients with
extreme obesity.’, Sleep. Oxford University Press,
36(12), pp. 1859–65. doi: 10.5665/sleep.3216.
Bradley, L. A. et al. (1993) ‘The relationship
between stress and symptoms of gastroesophageal
reflux: the influence of psychological factors.’, The
American journal of gastroenterology, 88(1), pp.
11–9. Available at:
http://www.ncbi.nlm.nih.gov/pubmed/8420248
Chiu, Y.-H. et al. (2016) ‘Psychometric properties of
the Perceived Stress Scale (PSS): measurement
invariance between athletes and non-athletes and
construct validity’, PeerJ. PeerJ Inc., 4, p. e2790. doi:
10.7717/peerj.2790.
Mårin P, Darin N, Amemiya T, Andersson B, Jern S,
Björntorp P. Cortisol secretion in relation to body
fat distribution in obese premenopausal
women. Metabolism. 1992;41(8):882-886.
doi:10.1016/0026-0495(92)90171-6
Dallman, M. F., Pecoraro, N. C. and la Fleur, S. E.
(2005) ‘Chronic stress and comfort foods: self-
medication and abdominal obesity’, Brain,
Behavior, and Immunity. Academic Press, 19(4), pp.
275–280. doi: 10.1016/J.BBI.2004.11.004.
Duffey, K. J. and Popkin, B. M. (2011) ‘Energy
Density, Portion Size, and Eating Occasions:
Contributions to Increased Energy Intake in the
United States, 1977–2006’, PLoS Medicine. Edited
by D. Ludwig. Public Library of Science, 8(6), p.
e1001050. doi: 10.1371/journal.pmed.1001050.
Eknoyan, G. and Eknoyan, G. (2011) ‘Obesity and
chronic kidney disease’, Houston, Texas (USA)
Nefrologia, 31(4), pp. 397–403. doi:
10.3265/Nefrologia.pre2011.May.10963.
Epel, E. S. et al. (no date) ‘Stress and body shape:
stress-induced cortisol secretion is consistently
greater among women with central fat.’,
Psychosomatic medicine, 62(5), pp. 623–32.
Available at:
http://www.ncbi.nlm.nih.gov/pubmed/11020091
Global BMI Mortality Collaboration, E. Di et al.
(2016) ‘Body-mass index and all-cause mortality:
individual-participant-data meta-analysis of 239
prospective studies in four continents.’, Lancet
(London, England). Elsevier, 388(10046), pp. 776–
86. doi: 10.1016/S0140-6736(16)30175-1.
Gray, D. S. et al. (1990) ‘Skinfold thickness
measurements in obese subjects’, The American
Journal of Clinical Nutrition, 51(4), pp. 571–577.
doi: 10.1093/ajcn/51.4.571.
Gunderson, E. P. (2009) ‘Childbearing and obesity
in women: weight before, during, and after
pregnancy.’, Obstetrics and gynecology clinics of
North America. NIH Public Access, 36(2), p. 317–
32, ix. doi: 10.1016/j.ogc.2009.04.001.
Henry, J. P. (1997) ‘Psychological and physiological
responses to stress: the right hemisphere and the
hypothalamo-pituitary-adrenal axis, an inquiry
into problems of human bonding.’, Acta
physiologica Scandinavica. Supplementum, 640, pp.
10–25. Available at:
http://www.ncbi.nlm.nih.gov/pubmed/9401599
13th International Research Conference
General Sir John Kotelawala Defence University
Allied Health Sciences Sessions
103
Ibrahim, M. M. (2010) ‘Subcutaneous and visceral
adipose tissue: structural and functional
differences’, Obesity Reviews, 11(1), pp. 11–18. doi:
10.1111/j.1467-789X.2009.00623.x.
Jensen, M. D. (2008) ‘Role of body fat distribution
and the metabolic complications of obesity.’, The
Journal of clinical endocrinology and metabolism.
The Endocrine Society, 93(11 Suppl 1), pp. S57-63.
doi: 10.1210/jc.2008-1585.
Katulanda, P. et al. (2010) ‘Prevalence of
overweight and obesity in Sri Lankan adults’,
Obesity Reviews, 11(11), pp. 751–756. doi:
10.1111/j.1467-789X.2010.00746.x.
Kulkarni, S. K. and Kaur, G. (2001)
‘Pharmacodynamics of drug-induced weight gain.’,
Drugs of today (Barcelona, Spain : 1998), 37(8), pp.
559–571. Available at:
http://www.ncbi.nlm.nih.gov/pubmed/12743638
Lawlor, D. A., Lean, M. and Sattar, N. (2006) ‘ABC of
obesity: obesity and vascular disease.’, BMJ
(Clinical research ed.). BMJ Publishing Group,
333(7577), pp. 1060–3. doi:
10.1136/bmj.333.7577.1060.
Leone, N. et al. (2009) ‘Lung Function Impairment
and Metabolic Syndrome’, American Journal of
Respiratory and Critical Care Medicine. American
Thoracic Society, 179(6), pp. 509–516. doi:
10.1164/rccm.200807-1195OC.
Lin, W.-Y. et al. (2006) ‘Impaired Lung Function Is
Associated with Obesity and Metabolic Syndrome
in Adults*’, Obesity, 14(9), pp. 1654–1661. doi:
10.1038/oby.2006.190.
Louay Labban (2015) NUTRITION Research Article
The Prevalence... (PDF Download Available).
Available at:
https://www.researchgate.net/publication/2872
01165_NUTRITION_Research_Article_The_Prevale
nce_of_Overweight_and_Obesity_Among_A’Sharqiy
ah_University_Students_in_Sultanate_of_Oman_A_
Randomized_Study.
Lupien, S. J. et al. (2013) ‘The DeStress for Success
Program: Effects of a stress education program on
cortisol levels and depressive symptomatology in
adolescents making the transition to high school’,
Neuroscience, 249, pp. 74–87. doi:
10.1016/j.neuroscience.2013.01.057.
Morgan, E. S., Umberson, K. and Hertzog, C. (2014)
‘Construct validation of self-reported stress
scales.’, Psychological assessment. NIH Public
Access, 26(1), pp. 90–9. doi: 10.1037/a0034714.
Morris, K. L. and Zemel, M. B. (2005) ‘1, 25-
Dihydroxyvitamin D 3 Modulation of Adipocyte
Glucocorticoid Function’, Obesity Research, 13(4),
pp. 670–677. doi: 10.1038/oby.2005.75.
Must, A. and McKeown, N. M. (2000) The Disease
Burden Associated with Overweight and Obesity,
Endotext. MDText.com, Inc. Available at:
http://www.ncbi.nlm.nih.gov/pubmed/25905320
Nuttall, F. Q. (2015) ‘Body Mass Index: Obesity,
BMI, and Health: A Critical Review.’, Nutrition
today. Wolters Kluwer Health, 50(3), pp. 117–128.
doi: 10.1097/NT.0000000000000092.
Omron Healthcare Co Ltd: Body Composition
Monitor BF500 Instruction Manual (2017) Weight
Management | Omron Healthcare. Available at:
https://www.omron-
healthcare.com/en/products/weightmanagement
Pengpid, S. and Peltzer, K. (2014) ‘Prevalence of
overweight/obesity and central obesity and its
associated factors among a sample of university
students in India’, Obesity Research & Clinical
Practice, 8(6), pp. e558–e570. doi:
10.1016/j.orcp.2013.12.003.
Pfau, M. L. and Russo, S. J. (2015) ‘Peripheral and
central mechanisms of stress resilience’,
Neurobiology of Stress. Elsevier, 1, pp. 66–79. doi:
10.1016/J.YNSTR.2014.09.004.
Pischon, T. et al. (2008) ‘General and Abdominal
Adiposity and Risk of Death in Europe’, New
England Journal of Medicine. Massachusetts
Medical Society , 359(20), pp. 2105–2120. doi:
10.1056/NEJMoa0801891.
Pottier, P. et al. (2015) ‘Effect of Extrinsic and
Intrinsic Stressors on Clinical Skills Performance in
Third-Year Medical Students.’, Journal of general
internal medicine. Springer, 30(9), pp. 1259–69.
doi: 10.1007/s11606-015-3314-6.
Richardson, A. S. et al. (2015) ‘Perceived stress,
unhealthy eating behaviors, and severe obesity in
low-income women.’, Nutrition journal. BioMed
Central, 14, p. 122. doi: 10.1186/s12937-015-
0110-4.
13th International Research Conference
General Sir John Kotelawala Defence University
Allied Health Sciences Sessions
104
Sam, S. (2007) ‘Obesity and Polycystic Ovary
Syndrome.’, Obesity management. NIH Public
Access, 3(2), pp. 69–73. doi:
10.1089/obe.2007.0019.
Sampei, M. A. and Sigulem, D. M. (2009) ‘Field
methods in the evaluation of obesity in children
and adolescents’, Revista Brasileira de Saúde
Materno Infantil. Instituto Materno Infantil de
Pernambuco, 9(1), pp. 21–29. doi: 10.1590/S1519-
38292009000100003.
Sandi, C. and Pinelo-Nava, M. T. (2007) ‘Stress and
memory: behavioral effects and neurobiological
mechanisms.’, Neural plasticity. Hindawi Limited,
2007, p. 78970. doi: 10.1155/2007/78970.
Segerstrom, S. C. and Miller, G. E. (2004)
‘Psychological stress and the human immune
system: a meta-analytic study of 30 years of
inquiry.’, Psychological bulletin. NIH Public Access,
130(4), pp. 601–30. doi: 10.1037/0033-
2909.130.4.601.
Shah, M. et al. (2010) ‘Perceived stress, sources and
severity of stress among medical undergraduates
in a Pakistani medical school.’, BMC medical
education. BioMed Central, 10, p. 2. doi:
10.1186/1472-6920-10-2.
Shawky, R. M. and Sadik, D. I. (2012) ‘Genetics of
obesity’, Egyptian Journal of Medical Human
Genetics, 13(1), pp. 11–17. doi:
10.1016/j.ejmhg.2011.08.005.
Siren, R., Eriksson, J. G. and Vanhanen, H. (2012)
‘Waist circumference a good indicator of future
risk for type 2 diabetes and cardiovascular
disease.’, BMC public health. BioMed Central, 12, p.
631. doi: 10.1186/1471-2458-12-631.
Stults-Kolehmainen, M. A. and Sinha, R. (2014) ‘The
effects of stress on physical activity and exercise.’,
Sports medicine (Auckland, N.Z.). NIH Public Access,
44(1), pp. 81–121. doi: 10.1007/s40279-013-
0090-5.
Swaminathan, A. et al. (2015) ‘Perceived stress and
sources of stress among first-year medical
undergraduate students in a private medical
college – Tamil Nadu’. doi:
10.5455/njppp.2015.5.1909201574.
Waghachavare, V. B. et al. (2013) ‘A Study of Stress
among Students of Professional Colleges from an
Urban area in India.’, Sultan Qaboos University
medical journal. Sultan Qaboos University, 13(3),
pp. 429–36. Available at:
http://www.ncbi.nlm.nih.gov/pubmed/23984029
Wang, H. et al. (2012) ‘Association between
bisphenol A exposure and body mass index in
Chinese school children: a cross-sectional study.’,
Environmental health : a global access science
source. BioMed Central, 11, p. 79. doi:
10.1186/1476-069X-11-79.
‘WHO | Obesity and overweight’ (2017) WHO.
World Health Organization. Available at:
http://www.who.int/media (Accessed: 28
September 2017).
‘WHO | Physical status: the use and interpretation
of anthropometry’ (2013) WHO. World Health
Organization. Available at:
http://www.who.int/childgrowth/publications/p
hysical_status/en/
WHO Expert Consultation (2004) ‘Appropriate
body-mass index for Asian populations and its
implications for policy and intervention
strategies.’, Lancet (London, England). Elsevier,
363(9403), pp. 157–63. doi: 10.1016/S0140-
6736(03)15268-3.
World Data Atlas (2017) Sri Lanka Female obesity
prevalence, 1960-2017 - knoema.com. Available at:
https://knoema.com/atlas/Sri-Lanka/Female-
obesity-prevalence
Authors Biography
E.H.M.R.K. Ekanayake is a Post
graduate student (M.Phil) at the
Faculty of Medicine, University of
Perdeniya. Received a bachelor’s
degree - B,Sc in (Hons) in Nursing from Faculty
of Allied Health Sciences University of
Peradeniya. Interested in research on obesity,
parenting styles, communication and
education.
Prof. R.M. Mudiyanse, professor
in paediatrics at Faculty of
Medicine, University of
Peradeniya.
13th International Research Conference
General Sir John Kotelawala Defence University
Allied Health Sciences Sessions
105
Evaluation of Anti-inflammatory and Antibacterial activities of the
extracts of leaves, roots and combination of leaves and roots of plant
Magnolia figo.
AMAU Abeykoon1, GMCP De Silva1, KTSS Karunathilake1, ARN Silva2#, AWMKK Bandara2 and
RN Pathirana1
1Department of Pharmacy, Faculty of Allied Health Sciences, General Sir John Kotelawala Defence University,
Sri Lanka. 2Department of Basic Sciences, Faculty of Allied Health Sciences, General Sir John Kotelawala Defence
University, Sri Lanka.
Abstract:-Discovery of novel drugs from
medicinal plants is getting popular owing to
lesser side effects and to overcome
antimicrobial resistance. The methanolic
extracts of both leaves and roots of Magnolia
figo plant by cold maceration were subjected
to the evaluation of anti-inflammatory and
antibacterial activity. In vitro anti-
inflammatory property was determined using
heat-induced protein (egg albumin)
denaturation test compared to diclofenac
sodium (positive control). Concentration
series of the extracts were analyzed to
calculate the percentage inhibition (IC50) of
heat-induced protein denaturation.
Antibacterial activity of the methanolic extract
was determined against Escherichia coli
(ATCC® 25922TM) and Staphylococcus aureus
(ATCC® 25923TM) using the cylinder plate
method using gentamycin as the positive
control. The size of inhibitory zone was
compared with the positive control to
determine the antibacterial activity. Lower IC
50 value (1.819 (µg/mL)) was shown in the
combination extract of M. figo plant compared
to the reference drug (4.337 (µg/mL)). It
reflects the synergistic effect of the plant parts.
The leaves and roots combination extract
exhibited dose-dependent behavior of anti-
inflammatory activity and highest
antibacterial activity against E. coli (zone
diameter – 15 mm). However, none of the
extracts exhibited antibacterial activity
against S. aureus. Phytochemical
investigations of extracts indicated the
presence of alkaloids, flavonoids, phenols,
tannins, saponins, terpenoids, glycosides and
steroids. Significant results elicited by the
combination of plant parts confirm that M. figo
is a medicinal plant which can be used to
develop novel anti-inflammatory agents.
Keywords: Antibacterial activity, Anti-
inflammatory activity, Magnolia figo,
Introduction :
Use of traditional herbal and folk medicines is
becoming more popular and globally accepted
nowadays. Therefore, it is necessary to seek
their medicinal properties and ascertain their
therapeutic properties. The bioactive
compounds of medicinal plants are used as
antidiabetic, chemotherapeutic, anti-
inflammatory, anti-arthritic agents where
there is no satisfactory cure in modern
medicines (Megha G. et al., 2013).
Inflammatory and infectious diseases are the
most prevalent conditions leading to poor
quality of life (Oz, 2017). The commonly used
drugs for the management of inflammatory
conditions are nonsteroidal anti-
inflammatory drugs (NSAIDs) which have
several side effects especially gastric irritation
leading to the formation of gastric ulcers.
Instead of side effects causing NSAIDs, the rich
wealth of plant kingdom has been used to
13th International Research Conference
General Sir John Kotelawala Defence University
Allied Health Sciences Sessions
106
represent a novel source of compounds with
antiinflammatory activities (Chatterjee et al.,
2012). Bacterial infections are the most
common cause of inflammatory conditions
and having a strong relationship that leads to
find substituents that elicit both antibacterial
and anti-inflammatory effects (Park et al.,
2004). The emergence of new infectious
diseases, the resurgence of several infections
and the increase in bacterial resistance have
created the necessity for studies directed
towards the development of new
antimicrobial agents (Valgas et al., 2007).
Magnolia figo is a plant belongs to
Magnoliaceae family rich with secondary
metabolites like alkaloids, polyphenols,
tannins. Hence M. figo was selected and in vitro
anti-inflammatory and antibacterial activity of
methanolic extracts of leaves, roots and
combination of both leaves and roots extracts
of M. figo was evaluated in this study.
Methodology:
About 800 g of each matured, fully expanded
leaves and roots of M. figo were collected in
fresh condition at day time. Selected plant
materials were thoroughly cleaned using
running tap water and air-dried until a
constant weight was obtained. The dried
leaves were ground well to obtain fine powder
form. Well dried and blended powder samples
of each plant material were taken for the
extraction procedure. The methanolic extract
was obtained by cold maceration with 1000
mL of 80% methanol. Erlenmeyer flask was
used to obtain a hydro alcoholic crude extract
and it was stirred for 7 days at room
temperature. The alcohol was distilled off and
concentrated to a dry residue by evaporating
the water from the filtrate using a rotary
evaporator under reduced pressure.
For the anti-inflammatory study, plant
samples were compared with diclofenac
sodium under the same concentration. The
dilution series (1000, 500, 250, 125, 62.5,
31.25, 15.625, 7.8125, 3.9, 1.95, 1, 0.5 µg/mL)
of reference drug sample and the plant
extracts were prepared. A similar volume of
double distilled water was used as negative
control. This process was carried out by using
ELISA plate reader. A flat bottom ELISA plate
which has 96 wells where each well consisted
300μl of reaction mixture was used for the
evaluation. The mixtures were placed in an
incubator at 37 °C (37±2°C) for 10 to 15
minutes. Denaturation process was induced
by increasing the temperature gradually up to
57 °C in the laboratory oven. Samples were
allowed to cool down to room temperature at
30 °C. After cooling down, the absorbance was
measured at 660 nm using ELISA plate reader.
The percentage inhibition of protein
denaturation for each sample was calculated
by using the absorption readings according to
equation 100*[Vt/Vc-1] where Vt =
absorbance of test sample and Vc =
absorbance of control.
In the antibacterial studies, a serial dilution
was prepared by re-dissolving crude extract in
DMSO starting from 1500 µg/mL filtrate up to
250 µg/ml. Cylinder plate method was used to
evaluate the antibacterial activity. DMSO was
used as negative control while gentamicin was
used as positive control. Mueller-Hinton agar
was used as the culture media to determine
antibacterial activity of Staphylococcus aureus
(ATCC® 25923TM) and Escherichia coli
(ATCC® 25922TM). The antibacterial activity
was examined in triplicate for each sample
and the diameter of the inhibition zone (in
mm) for the extracts against the above-
mentioned bacterial strains was measured
and recorded.
The two extracts which were prepared by
using only roots and combination of both
leaves and roots were subjected to
phytochemical analysis to detect the
availability of the following secondary
metabolites; flavonoids, carbohydrates,
tannins, saponins, alkaloids, glycosides,
phenols, terpenoids, amino acids and proteins
and steroids.
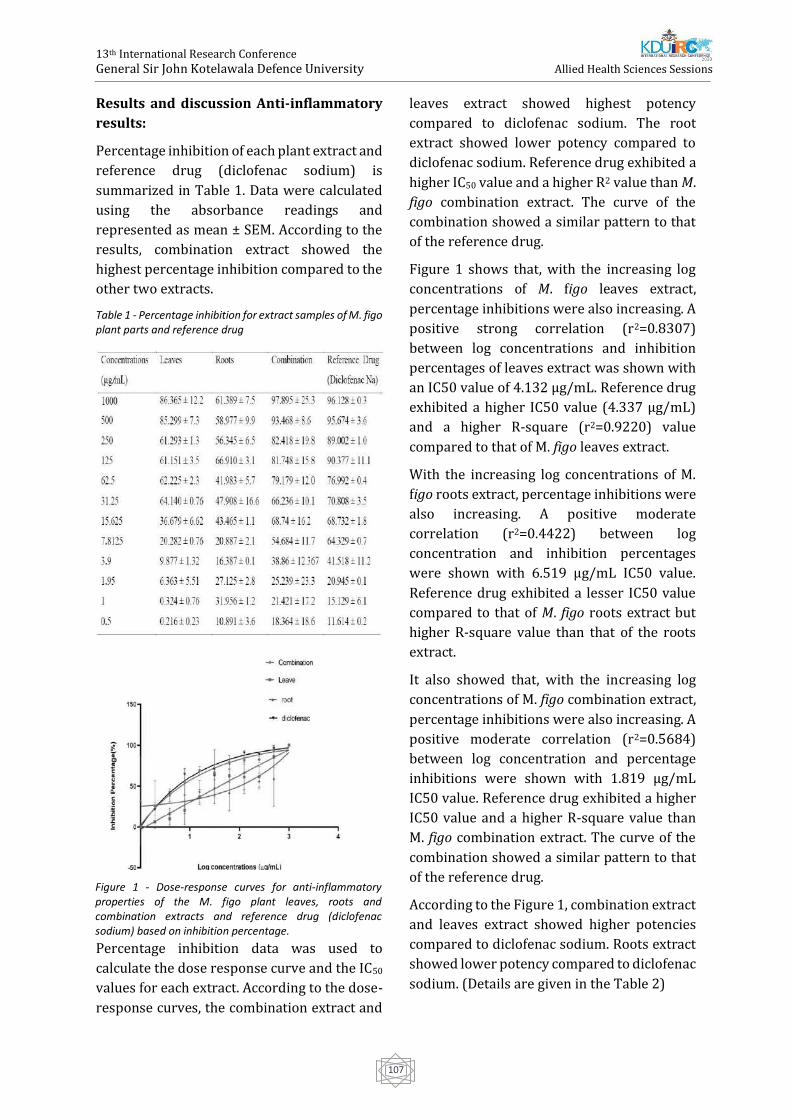
13th International Research Conference
General Sir John Kotelawala Defence University
Allied Health Sciences Sessions
107
Results and discussion Anti-inflammatory
results:
Percentage inhibition of each plant extract and
reference drug (diclofenac sodium) is
summarized in Table 1. Data were calculated
using the absorbance readings and
represented as mean ± SEM. According to the
results, combination extract showed the
highest percentage inhibition compared to the
other two extracts.
Table 1 - Percentage inhibition for extract samples of M. figo plant parts and reference drug
Percentage inhibition data was used to
calculate the dose response curve and the IC50
values for each extract. According to the dose-
response curves, the combination extract and
leaves extract showed highest potency
compared to diclofenac sodium. The root
extract showed lower potency compared to
diclofenac sodium. Reference drug exhibited a
higher IC50 value and a higher R2 value than M.
figo combination extract. The curve of the
combination showed a similar pattern to that
of the reference drug.
Figure 1 shows that, with the increasing log
concentrations of M. figo leaves extract,
percentage inhibitions were also increasing. A
positive strong correlation (r2=0.8307)
between log concentrations and inhibition
percentages of leaves extract was shown with
an IC50 value of 4.132 μg/mL. Reference drug
exhibited a higher IC50 value (4.337 μg/mL)
and a higher R-square (r2=0.9220) value
compared to that of M. figo leaves extract.
With the increasing log concentrations of M.
figo roots extract, percentage inhibitions were
also increasing. A positive moderate
correlation (r2=0.4422) between log
concentration and inhibition percentages
were shown with 6.519 μg/mL IC50 value.
Reference drug exhibited a lesser IC50 value
compared to that of M. figo roots extract but
higher R-square value than that of the roots
extract.
It also showed that, with the increasing log
concentrations of M. figo combination extract,
percentage inhibitions were also increasing. A
positive moderate correlation (r2=0.5684)
between log concentration and percentage
inhibitions were shown with 1.819 μg/mL
IC50 value. Reference drug exhibited a higher
IC50 value and a higher R-square value than
M. figo combination extract. The curve of the
combination showed a similar pattern to that
of the reference drug.
According to the Figure 1, combination extract
and leaves extract showed higher potencies
compared to diclofenac sodium. Roots extract
showed lower potency compared to diclofenac
sodium. (Details are given in the Table 2)
Figure 1 - Dose-response curves for anti-inflammatory properties of the M. figo plant leaves, roots and combination extracts and reference drug (diclofenac sodium) based on inhibition percentage.
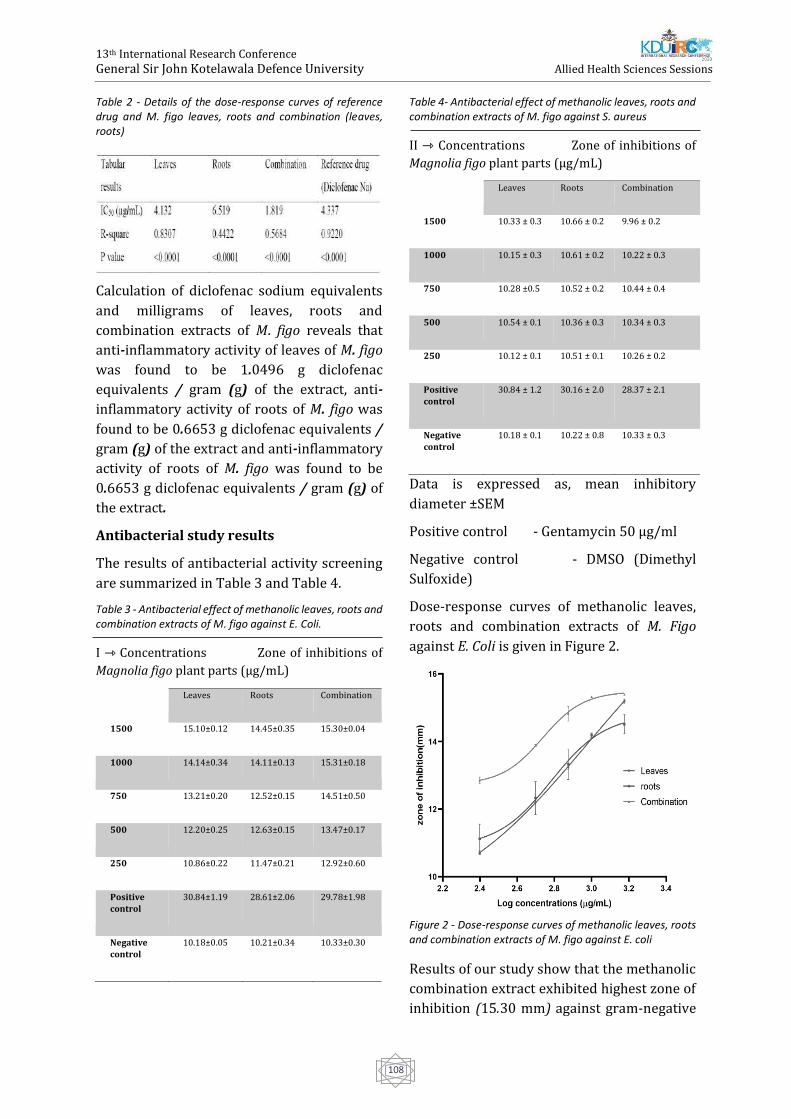
13th International Research Conference
General Sir John Kotelawala Defence University
Allied Health Sciences Sessions
108
Table 2 - Details of the dose-response curves of reference drug and M. figo leaves, roots and combination (leaves, roots)
Calculation of diclofenac sodium equivalents
and milligrams of leaves, roots and
combination extracts of M. figo reveals that
anti-inflammatory activity of leaves of M. figo
was found to be 1.0496 g diclofenac
equivalents / gram (g) of the extract, anti-
inflammatory activity of roots of M. figo was
found to be 0.6653 g diclofenac equivalents /
gram (g) of the extract and anti-inflammatory
activity of roots of M. figo was found to be
0.6653 g diclofenac equivalents / gram (g) of
the extract.
Antibacterial study results
The results of antibacterial activity screening
are summarized in Table 3 and Table 4.
Table 3 - Antibacterial effect of methanolic leaves, roots and combination extracts of M. figo against E. Coli.
I ⇾ Concentrations Zone of inhibitions of
Magnolia figo plant parts (μg/mL)
Table 4- Antibacterial effect of methanolic leaves, roots and combination extracts of M. figo against S. aureus
II ⇾ Concentrations Zone of inhibitions of
Magnolia figo plant parts (μg/mL)
1500
Leaves Roots Combination
10.33 ± 0.3 10.66 ± 0.2 9.96 ± 0.2
1000 10.15 ± 0.3 10.61 ± 0.2 10.22 ± 0.3
750 10.28 ±0.5 10.52 ± 0.2 10.44 ± 0.4
500 10.54 ± 0.1 10.36 ± 0.3 10.34 ± 0.3
250 10.12 ± 0.1 10.51 ± 0.1 10.26 ± 0.2
Positive
control
30.84 ± 1.2 30.16 ± 2.0 28.37 ± 2.1
Negative
control
10.18 ± 0.1 10.22 ± 0.8 10.33 ± 0.3
Data is expressed as, mean inhibitory
diameter ±SEM
Positive control - Gentamycin 50 μg/ml
Negative control - DMSO (Dimethyl
Sulfoxide)
Dose-response curves of methanolic leaves,
roots and combination extracts of M. Figo
against E. Coli is given in Figure 2.
Figure 2 - Dose-response curves of methanolic leaves, roots and combination extracts of M. figo against E. coli
Results of our study show that the methanolic
combination extract exhibited highest zone of
inhibition (15.30 mm) against gram-negative
1500
Leaves Roots Combination
15.10±0.12 14.45±0.35 15.30±0.04
1000 14.14±0.34 14.11±0.13 15.31±0.18
750 13.21±0.20 12.52±0.15 14.51±0.50
500 12.20±0.25 12.63±0.15 13.47±0.17
250 10.86±0.22 11.47±0.21 12.92±0.60
Positive
control
30.84±1.19 28.61±2.06 29.78±1.98
Negative
control
10.18±0.05 10.21±0.34 10.33±0.30
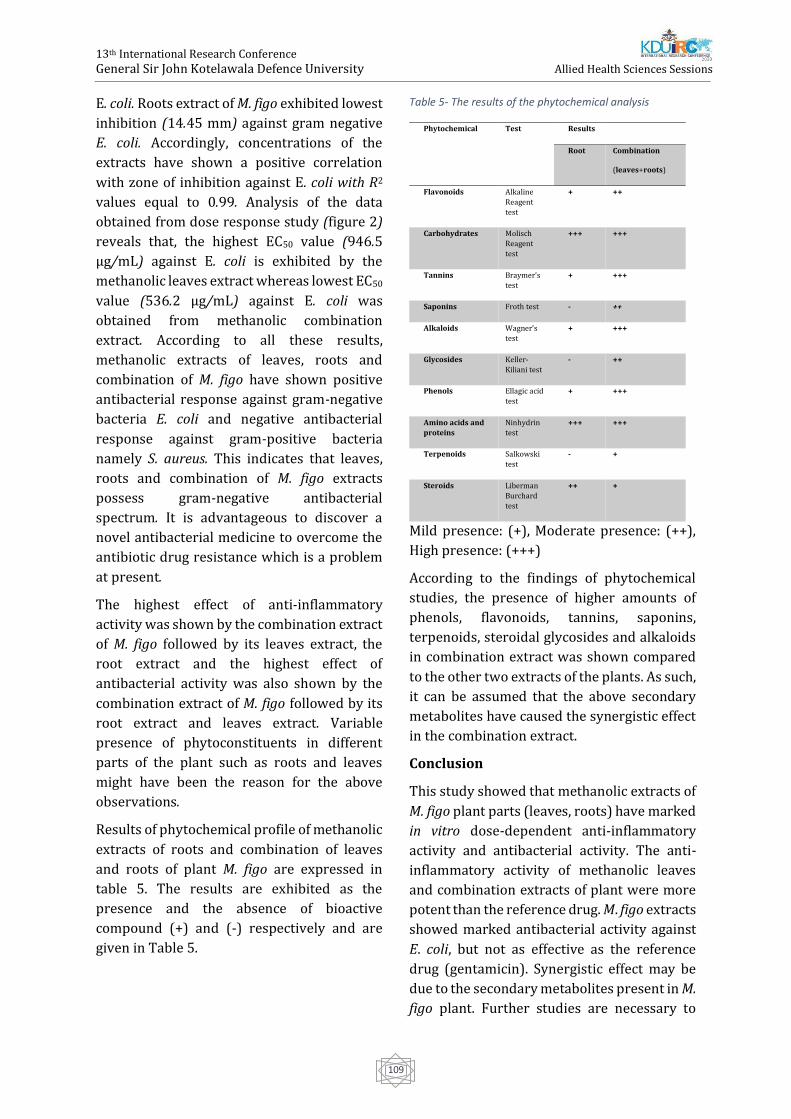
13th International Research Conference
General Sir John Kotelawala Defence University
Allied Health Sciences Sessions
109
E. coli. Roots extract of M. figo exhibited lowest
inhibition (14.45 mm) against gram negative
E. coli. Accordingly, concentrations of the
extracts have shown a positive correlation
with zone of inhibition against E. coli with R2
values equal to 0.99. Analysis of the data
obtained from dose response study (figure 2)
reveals that, the highest EC50 value (946.5
μg/mL) against E. coli is exhibited by the
methanolic leaves extract whereas lowest EC50
value (536.2 μg/mL) against E. coli was
obtained from methanolic combination
extract. According to all these results,
methanolic extracts of leaves, roots and
combination of M. figo have shown positive
antibacterial response against gram-negative
bacteria E. coli and negative antibacterial
response against gram-positive bacteria
namely S. aureus. This indicates that leaves,
roots and combination of M. figo extracts
possess gram-negative antibacterial
spectrum. It is advantageous to discover a
novel antibacterial medicine to overcome the
antibiotic drug resistance which is a problem
at present.
The highest effect of anti-inflammatory
activity was shown by the combination extract
of M. figo followed by its leaves extract, the
root extract and the highest effect of
antibacterial activity was also shown by the
combination extract of M. figo followed by its
root extract and leaves extract. Variable
presence of phytoconstituents in different
parts of the plant such as roots and leaves
might have been the reason for the above
observations.
Results of phytochemical profile of methanolic
extracts of roots and combination of leaves
and roots of plant M. figo are expressed in
table 5. The results are exhibited as the
presence and the absence of bioactive
compound (+) and (-) respectively and are
given in Table 5.
Table 5- The results of the phytochemical analysis
Phytochemical Test Results
Root Combination
(leaves+roots)
Flavonoids Alkaline
Reagent
test
+ ++
Carbohydrates Molisch
Reagent
test
+++ +++
Tannins Braymer’s
test
+ +++
Saponins Froth test - ++
Alkaloids Wagner’s
test
+ +++
Glycosides Keller-
Kiliani test
- ++
Phenols Ellagic acid
test
+ +++
Amino acids and
proteins
Ninhydrin
test
+++ +++
Terpenoids Salkowski
test
- +
Steroids Liberman
Burchard
test
++ +
Mild presence: (+), Moderate presence: (++),
High presence: (+++)
According to the findings of phytochemical
studies, the presence of higher amounts of
phenols, flavonoids, tannins, saponins,
terpenoids, steroidal glycosides and alkaloids
in combination extract was shown compared
to the other two extracts of the plants. As such,
it can be assumed that the above secondary
metabolites have caused the synergistic effect
in the combination extract.
Conclusion
This study showed that methanolic extracts of
M. figo plant parts (leaves, roots) have marked
in vitro dose-dependent anti-inflammatory
activity and antibacterial activity. The anti-
inflammatory activity of methanolic leaves
and combination extracts of plant were more
potent than the reference drug. M. figo extracts
showed marked antibacterial activity against
E. coli, but not as effective as the reference
drug (gentamicin). Synergistic effect may be
due to the secondary metabolites present in M.
figo plant. Further studies are necessary to
13th International Research Conference
General Sir John Kotelawala Defence University
Allied Health Sciences Sessions
110
ascertain the mechanism and the active
constituents responsible for the anti-
inflammatory and antibacterial activities of
the methanolic extracts of plant parts of M.
figo.
References
Chatterjee, P, Chandra, S, Dey, P and Bhattacharya,
S (2012): Evaluation of anti-inflammatory effects
of green tea and black tea: A comparative in vitro
study, Journal of Advanced Pharmaceutical
Technology and Research 3 (2) pp 136–138.
Megha G Choudhari, Bhoomi B Joshi, K N M (2013):
in Vitro Anti-Diabetic and Anti-Inflammatory
Activity of Stem Bark of Bauhinia Purpurea, ]
Bulletin of Pharmaceutical and Medical Science 1
(2) pp 139–150.
Oz, H S (2017): Chronic inflammatory diseases and
green tea polyphenols, Nutrients 9 (6) pp 1–14.
Park, J, Lee, J, Jung, E, Park, Y, Kim, K, Park, B, Jung,
K, Park, E, Kim, J and Park, D (2004): In vitro
antibacterial and anti-inflammatory effects of
honokiol and magnolol against Propionibacterium
sp, European Journal of Pharmacology 496 (1) pp
189–195
Valgas, C, De Souza, S M, Smânia, E F A and Smânia,
A (2007): Screening methods to determine
antibacterial activity of natural products, Brazilian
Journal of Microbiology 38 (2) pp 369–380.
13th International Research Conference
General Sir John Kotelawala Defence University
Allied Health Sciences Sessions
111
Determination of Gender using Measurements of the Mandible taken
from Orthopantomogram and Cephalogram
MDR Munasinghe1#, LPN Madhavee1, LHMIM Herath1 and RP Illeperuma2
1Department of Radiography and Radiotherapy, Faculty of Allied Health Science, General Sir John
KotelawalaDefence University, Sri Lanka 2Department of Medical Laboratory Science, Faculty of Allied Health Science, University of Peradeniya, Sri
Lanka
Abstract:-Determining of age is essential in
forensic and medico legal practices. Most
dimorphic bone of the skull is mandible.
Therefore, in sex estimation, mandible plays a
dominant role. Since the measurements of the
mandible vary with the ethnicity, it is
important to evaluate the measurements of
the mandible which are important in
determining gender for a Sri Lankan
population. The aim of this study was to
determine the gender using measurements of
mandible taken from orthopantomogram and
cephalogram. This prospective cross sectional
study was conducted among 116 SriLankan
Sinhala patients (female 93, male 23) who
underwent both orthopantomography (OPG)
and lateral cephalometric examination at
National Dental Teaching Hospital, Colombo
07. Maximum and minimum ramus breadth,
condylar height, projective height, ramus
height, coronoid height, biogonial width were
taken from the OPG image and gonial angle
was taken from the lateral cephalometry using
left mandible of the patient. According to the
statistical analysis, mean values of maximum
ramus breadth, minimum ramus breadth,
condylar height, projective height, ramus
height, coronoid height, biogonial width of
males were higher than females. Mean value of
gonial angle of males were lower than females.
Projective height was the most significant
predictor in determining gender (P=0.000).
Among the sample, 67.2% predicted the
gender accurately using the prediction model
found in the present study. 67.7% were
predicted as females and 60.9% were
predicted as males accurately. In conclusion,
the most reliable measurement of the
mandible is projective height in determining
the gender of a Sinhala population in SriLanka.
Keywords: Gender, Mandible,
Orthopantomography, Cephalometry
Introduction:
Age and gender estimation of individuals plays
an important role in issues related to
immigration, child labour and forensic
sciences. Age and gender are the information
that is vital to determine the identity in cases
where visual recognition is not possible. The
role of aging and gender changing in forensic
investigations are not limited only to
identification. In addition to the identification,
age and gender changes can also be utilized in
the context of crime investigation, chemical
and nuclear bomb explosions, natural
disasters, and ethical studies (Bhagwatkar et
al., 2016).
To determine the gender, physical and
chemical methods are used. As chemical
methods DNA test is the accurate method. As
physical methods, identification of the skeletal
remainders is a very significant step in
medico-legal investigations.
Numerous markers on a human skeleton can
be used to assessment the sex of the deceased.
Sexual dimorphism as seen in the human
skeleton can be resolute by using skull,
dentition, pelvic and dimorphism. Among
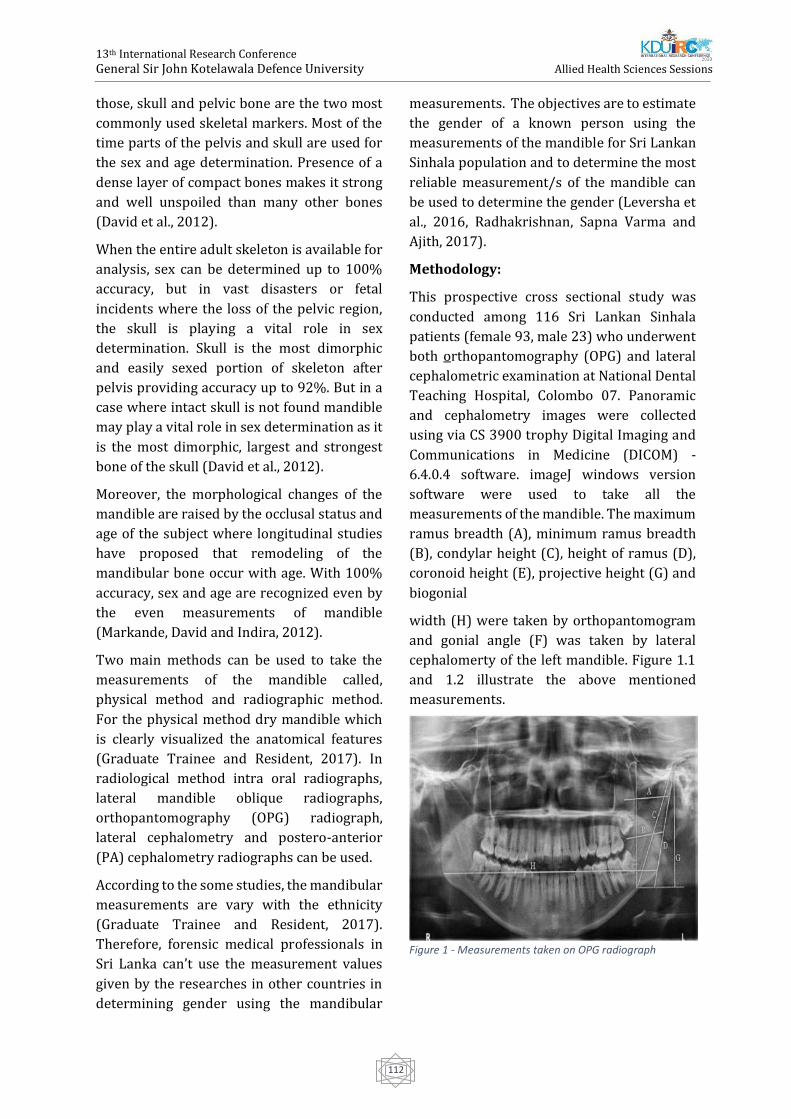
13th International Research Conference
General Sir John Kotelawala Defence University
Allied Health Sciences Sessions
112
those, skull and pelvic bone are the two most
commonly used skeletal markers. Most of the
time parts of the pelvis and skull are used for
the sex and age determination. Presence of a
dense layer of compact bones makes it strong
and well unspoiled than many other bones
(David et al., 2012).
When the entire adult skeleton is available for
analysis, sex can be determined up to 100%
accuracy, but in vast disasters or fetal
incidents where the loss of the pelvic region,
the skull is playing a vital role in sex
determination. Skull is the most dimorphic
and easily sexed portion of skeleton after
pelvis providing accuracy up to 92%. But in a
case where intact skull is not found mandible
may play a vital role in sex determination as it
is the most dimorphic, largest and strongest
bone of the skull (David et al., 2012).
Moreover, the morphological changes of the
mandible are raised by the occlusal status and
age of the subject where longitudinal studies
have proposed that remodeling of the
mandibular bone occur with age. With 100%
accuracy, sex and age are recognized even by
the even measurements of mandible
(Markande, David and Indira, 2012).
Two main methods can be used to take the
measurements of the mandible called,
physical method and radiographic method.
For the physical method dry mandible which
is clearly visualized the anatomical features
(Graduate Trainee and Resident, 2017). In
radiological method intra oral radiographs,
lateral mandible oblique radiographs,
orthopantomography (OPG) radiograph,
lateral cephalometry and postero-anterior
(PA) cephalometry radiographs can be used.
According to the some studies, the mandibular
measurements are vary with the ethnicity
(Graduate Trainee and Resident, 2017).
Therefore, forensic medical professionals in
Sri Lanka can’t use the measurement values
given by the researches in other countries in
determining gender using the mandibular
measurements. The objectives are to estimate
the gender of a known person using the
measurements of the mandible for Sri Lankan
Sinhala population and to determine the most
reliable measurement/s of the mandible can
be used to determine the gender (Leversha et
al., 2016, Radhakrishnan, Sapna Varma and
Ajith, 2017).
Methodology:
This prospective cross sectional study was
conducted among 116 Sri Lankan Sinhala
patients (female 93, male 23) who underwent
both orthopantomography (OPG) and lateral
cephalometric examination at National Dental
Teaching Hospital, Colombo 07. Panoramic
and cephalometry images were collected
using via CS 3900 trophy Digital Imaging and
Communications in Medicine (DICOM) -
6.4.0.4 software. imageJ windows version
software were used to take all the
measurements of the mandible. The maximum
ramus breadth (A), minimum ramus breadth
(B), condylar height (C), height of ramus (D),
coronoid height (E), projective height (G) and
biogonial
width (H) were taken by orthopantomogram
and gonial angle (F) was taken by lateral
cephalomerty of the left mandible. Figure 1.1
and 1.2 illustrate the above mentioned
measurements.
Figure 1 - Measurements taken on OPG radiograph
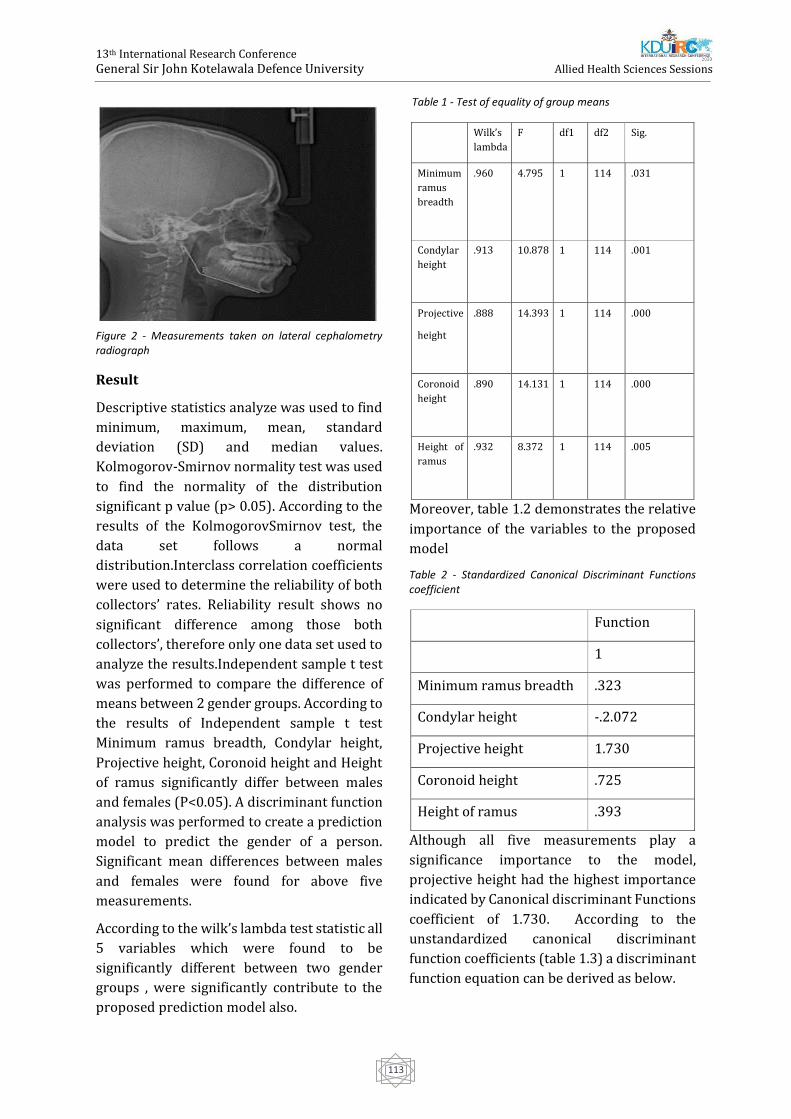
13th International Research Conference
General Sir John Kotelawala Defence University
Allied Health Sciences Sessions
113
Figure 2 - Measurements taken on lateral cephalometry radiograph
Result
Descriptive statistics analyze was used to find
minimum, maximum, mean, standard
deviation (SD) and median values.
Kolmogorov-Smirnov normality test was used
to find the normality of the distribution
significant p value (p> 0.05). According to the
results of the KolmogorovSmirnov test, the
data set follows a normal
distribution.Interclass correlation coefficients
were used to determine the reliability of both
collectors’ rates. Reliability result shows no
significant difference among those both
collectors’, therefore only one data set used to
analyze the results.Independent sample t test
was performed to compare the difference of
means between 2 gender groups. According to
the results of Independent sample t test
Minimum ramus breadth, Condylar height,
Projective height, Coronoid height and Height
of ramus significantly differ between males
and females (P<0.05). A discriminant function
analysis was performed to create a prediction
model to predict the gender of a person.
Significant mean differences between males
and females were found for above five
measurements.
According to the wilk’s lambda test statistic all
5 variables which were found to be
significantly different between two gender
groups , were significantly contribute to the
proposed prediction model also.
Table 1 - Test of equality of group means
Wilk’s
lambda
F df1 df2 Sig.
Minimum
ramus
breadth
.960 4.795 1 114 .031
Condylar
height
.913 10.878 1 114 .001
Projective
height
.888 14.393 1 114 .000
Coronoid
height
.890 14.131 1 114 .000
Height of
ramus
.932 8.372 1 114 .005
Moreover, table 1.2 demonstrates the relative
importance of the variables to the proposed
model
Table 2 - Standardized Canonical Discriminant Functions coefficient
Function
1
Minimum ramus breadth .323
Condylar height -.2.072
Projective height 1.730
Coronoid height .725
Height of ramus .393
Although all five measurements play a
significance importance to the model,
projective height had the highest importance
indicated by Canonical discriminant Functions
coefficient of 1.730. According to the
unstandardized canonical discriminant
function coefficients (table 1.3) a discriminant
function equation can be derived as below.
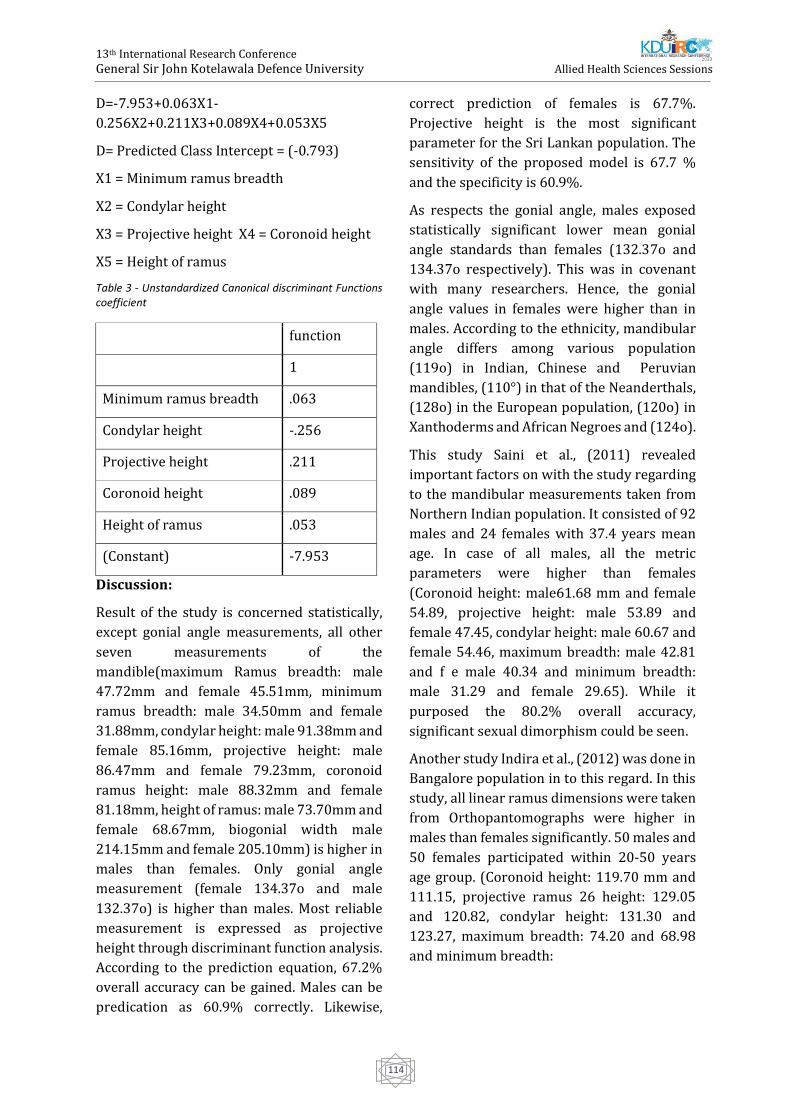
13th International Research Conference
General Sir John Kotelawala Defence University
Allied Health Sciences Sessions
114
D=-7.953+0.063X1-
0.256X2+0.211X3+0.089X4+0.053X5
D= Predicted Class Intercept = (-0.793)
X1 = Minimum ramus breadth
X2 = Condylar height
X3 = Projective height X4 = Coronoid height
X5 = Height of ramus
Table 3 - Unstandardized Canonical discriminant Functions coefficient
function
1
Minimum ramus breadth .063
Condylar height -.256
Projective height .211
Coronoid height .089
Height of ramus .053
(Constant) -7.953
Discussion:
Result of the study is concerned statistically,
except gonial angle measurements, all other
seven measurements of the
mandible(maximum Ramus breadth: male
47.72mm and female 45.51mm, minimum
ramus breadth: male 34.50mm and female
31.88mm, condylar height: male 91.38mm and
female 85.16mm, projective height: male
86.47mm and female 79.23mm, coronoid
ramus height: male 88.32mm and female
81.18mm, height of ramus: male 73.70mm and
female 68.67mm, biogonial width male
214.15mm and female 205.10mm) is higher in
males than females. Only gonial angle
measurement (female 134.37o and male
132.37o) is higher than males. Most reliable
measurement is expressed as projective
height through discriminant function analysis.
According to the prediction equation, 67.2%
overall accuracy can be gained. Males can be
predication as 60.9% correctly. Likewise,
correct prediction of females is 67.7%.
Projective height is the most significant
parameter for the Sri Lankan population. The
sensitivity of the proposed model is 67.7 %
and the specificity is 60.9%.
As respects the gonial angle, males exposed
statistically significant lower mean gonial
angle standards than females (132.37o and
134.37o respectively). This was in covenant
with many researchers. Hence, the gonial
angle values in females were higher than in
males. According to the ethnicity, mandibular
angle differs among various population
(119o) in Indian, Chinese and Peruvian
mandibles, (110°) in that of the Neanderthals,
(128o) in the European population, (120o) in
Xanthoderms and African Negroes and (124o).
This study Saini et al., (2011) revealed
important factors on with the study regarding
to the mandibular measurements taken from
Northern Indian population. It consisted of 92
males and 24 females with 37.4 years mean
age. In case of all males, all the metric
parameters were higher than females
(Coronoid height: male61.68 mm and female
54.89, projective height: male 53.89 and
female 47.45, condylar height: male 60.67 and
female 54.46, maximum breadth: male 42.81
and f e male 40.34 and minimum breadth:
male 31.29 and female 29.65). While it
purposed the 80.2% overall accuracy,
significant sexual dimorphism could be seen.
Another study Indira et al., (2012) was done in
Bangalore population in to this regard. In this
study, all linear ramus dimensions were taken
from Orthopantomographs were higher in
males than females significantly. 50 males and
50 females participated within 20-50 years
age group. (Coronoid height: 119.70 mm and
111.15, projective ramus 26 height: 129.05
and 120.82, condylar height: 131.30 and
123.27, maximum breadth: 74.20 and 68.98
and minimum breadth:
13th International Research Conference
General Sir John Kotelawala Defence University
Allied Health Sciences Sessions
115
51.35 and 46.96 in males and females
respectively). 76% of the cases were classified
correctly.
Conclusion:
For determination of gender, applicable
measurement of the mandible is projective
height. The results of this study will contribute
in the medico-legal practice in Sri Lanka for
determination of gender in Sinhala
population.
Reference
Bhagwatkar, T. et al. (2016) ‘Sex Determination By
Using Mandibular Ramus -a Forensic Study’,
Journal of Advanced Medical and Dental Sciences
Research J Adv Med Dent Scie Res, 44(2), pp. 1–6.
Markande, A., David, M. and Indira, A. (2012)
‘Mandibular ramus: An indicator for sex
determination - A digital radiographic study’,
Journal of Forensic Dental Sciences, 4(2), p. 58. doi:
10.4103/0975-1475.109885.
Radhakrishnan, P. D., Sapna Varma, N. K. and Ajith,
V. V. (2017) ‘Dilemma of gonial angle
measurement: Panoramic radiograph or lateral
cephalogram’, Imaging Science in Dentistry, 47(2),
p. 93. doi: 10.5624/isd.2017.47.2.93.
13th International Research Conference
General Sir John Kotelawala Defence University
Allied Health Sciences Sessions
116
Correlation between Liver Fat Indices and Ultrasonography to
determine NAFLD among Diabetic patients.
KKDSD Kannangara1#, MR Dehigolla1, CMJU Gunathilake1, RS Maddumage1, GDS Dulshika1,
WAC Karunarathne1, WA Epa2, Uditha Bulugahapititya3, and JMKB Jayasekara1
1Department of Medical Laboratory Science, Faculty of Allied Health Sciences, General Sir John Kotelawala
Defence University. 2Radiology Unit, Colombo South Teaching Hospital, Kalubowila
3Diabetic and Endocrinology Unit, Colombo South Teaching University, Kalubowila.
Abstract:-Non Alcoholic Fatty Liver Disease
(NAFLD) and Diabetes Mellitus (mainly Type 2
Diabetes Mellitus – T2DM) strongly coexist
with each other as both share common
pathophysiological conditions that causes an
imbalance in homeostasis. Non-invasive scores
have been introduced to detect NAFLD using
routine biochemical investigations and
anthropometric measurements which
provides simple, cost effective and patient
friendly means of diagnosing fatty liver.
Determination of the incidence of NAFLD
patients at the Diabetic clinic, Colombo South
Teaching Hospital and Association between
ultrasonography based diagnosis of fatty liver
with the two liver fat indices – Hepatic
Steatosis index (HSI) and Fatty Liver Index
(FLI) were the main objectives of this research.
The study was a cross-sectional analytical
study conducted involving 100 newly
diagnosed diabetic patients selected using
exclusion and inclusion criteria. Socio-
demographic data, patient history and medical
history was obtained using an interviewer
based questionnaire. Anthropometric
measurements were collected using standard
methods. Blood was collected to conduct
biochemical investigations and each
participant underwent an ultrasounds scan to
diagnose and stage fatty liver. The data were
analyzed statistically. The incidence of NAFLD
among T2DM was 82%. There was a significant
correlation (p<0.05) between
Ultrasonography results of NAFLD with HSI.
The study also found a highly significant
correlation (p<0.001) between
ultrasonography results of NAFLD with FLI and
also determined that it shows a significant
difference between the categories; No fatty
liver and grade 2 fatty liver or above which
makes it a suitable marker to predict the
presence or absence of fatty liver in Diabetic
patients.
Keywords: Non-alcoholic Fatty Liver Disease,
Diabetic Mellitus, Ultrasonography, Fatty Liver
Index, Hepatic Steatosis Index
Introduction:
Non-alcoholic fatty liver disease (NAFLD) is
one of the most important causes for chronic
liver diseases worldwide and it is predicted to
be one of the leading causes of end stage liver
disease in the future as it affects the population
irrespective of age; adults or children
(Younossi et al., 2017) and according to the
World Gastroenterology Organization, it is
considered to be the hepatic presentation of
metabolic syndrome – Diseases related to Type
2 Diabetes Mellitus (T2DM), insulin resistance,
obesity, hyperlipidemia and hypertension.
Diabetes Mellitus is a group of metabolic
disorders characterized by hyperglycemia
which negatively affects the insulin secretion,
insulin action or both (Diagnosis and
Classification of Diabetic Mellitus, 2009).
NAFLD and Diabetic Mellitus (mainly Type 2
Diabetic Mellitus – T2DM) show a strong
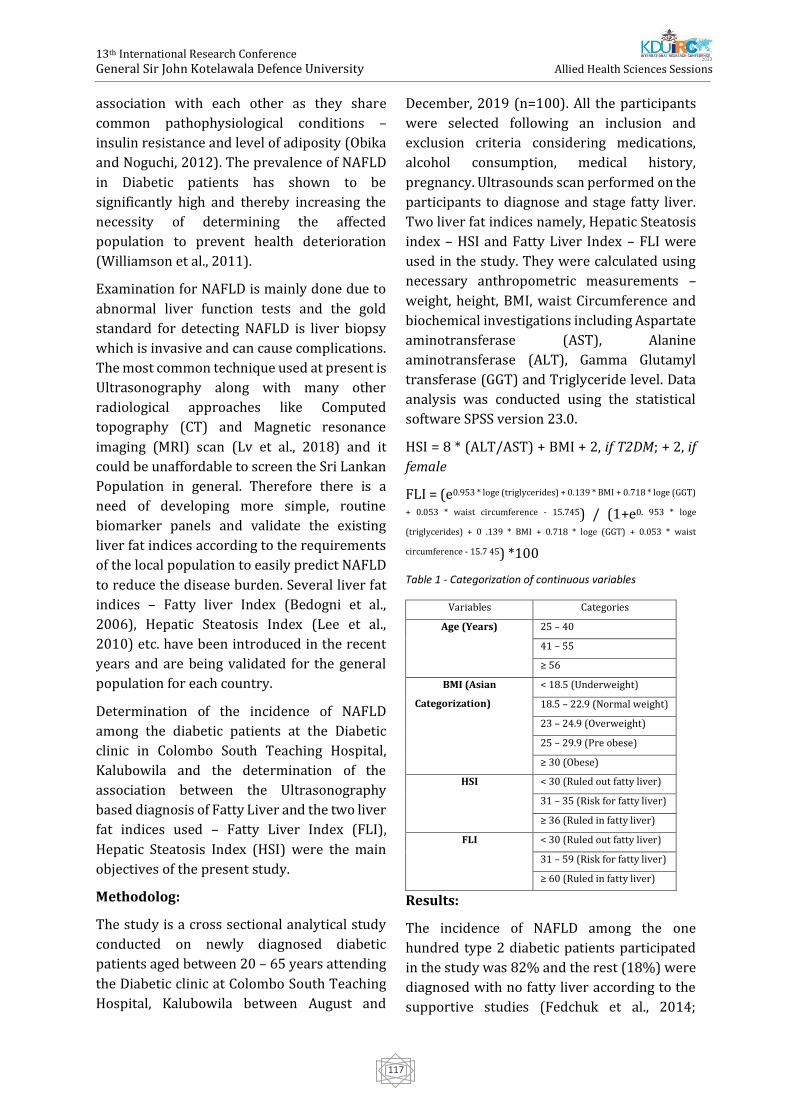
13th International Research Conference
General Sir John Kotelawala Defence University
Allied Health Sciences Sessions
117
association with each other as they share
common pathophysiological conditions –
insulin resistance and level of adiposity (Obika
and Noguchi, 2012). The prevalence of NAFLD
in Diabetic patients has shown to be
significantly high and thereby increasing the
necessity of determining the affected
population to prevent health deterioration
(Williamson et al., 2011).
Examination for NAFLD is mainly done due to
abnormal liver function tests and the gold
standard for detecting NAFLD is liver biopsy
which is invasive and can cause complications.
The most common technique used at present is
Ultrasonography along with many other
radiological approaches like Computed
topography (CT) and Magnetic resonance
imaging (MRI) scan (Lv et al., 2018) and it
could be unaffordable to screen the Sri Lankan
Population in general. Therefore there is a
need of developing more simple, routine
biomarker panels and validate the existing
liver fat indices according to the requirements
of the local population to easily predict NAFLD
to reduce the disease burden. Several liver fat
indices – Fatty liver Index (Bedogni et al.,
2006), Hepatic Steatosis Index (Lee et al.,
2010) etc. have been introduced in the recent
years and are being validated for the general
population for each country.
Determination of the incidence of NAFLD
among the diabetic patients at the Diabetic
clinic in Colombo South Teaching Hospital,
Kalubowila and the determination of the
association between the Ultrasonography
based diagnosis of Fatty Liver and the two liver
fat indices used – Fatty Liver Index (FLI),
Hepatic Steatosis Index (HSI) were the main
objectives of the present study.
Methodolog:
The study is a cross sectional analytical study
conducted on newly diagnosed diabetic
patients aged between 20 – 65 years attending
the Diabetic clinic at Colombo South Teaching
Hospital, Kalubowila between August and
December, 2019 (n=100). All the participants
were selected following an inclusion and
exclusion criteria considering medications,
alcohol consumption, medical history,
pregnancy. Ultrasounds scan performed on the
participants to diagnose and stage fatty liver.
Two liver fat indices namely, Hepatic Steatosis
index – HSI and Fatty Liver Index – FLI were
used in the study. They were calculated using
necessary anthropometric measurements –
weight, height, BMI, waist Circumference and
biochemical investigations including Aspartate
aminotransferase (AST), Alanine
aminotransferase (ALT), Gamma Glutamyl
transferase (GGT) and Triglyceride level. Data
analysis was conducted using the statistical
software SPSS version 23.0.
HSI = 8 * (ALT/AST) + BMI + 2, if T2DM; + 2, if
female
FLI = (e0.953 * loge (triglycerides) + 0.139 * BMI + 0.718 * loge (GGT)
+ 0.053 * waist circumference - 15.745) / (1+e0. 953 * loge
(triglycerides) + 0 .139 * BMI + 0.718 * loge (GGT) + 0.053 * waist
circumference - 15.7 45) *100
Table 1 - Categorization of continuous variables
Variables Categories
Age (Years) 25 – 40
41 – 55
≥ 56
BMI (Asian
Categorization)
< 18.5 (Underweight)
18.5 – 22.9 (Normal weight)
23 – 24.9 (Overweight)
25 – 29.9 (Pre obese)
≥ 30 (Obese)
HSI < 30 (Ruled out fatty liver)
31 – 35 (Risk for fatty liver)
≥ 36 (Ruled in fatty liver)
FLI < 30 (Ruled out fatty liver)
31 – 59 (Risk for fatty liver)
≥ 60 (Ruled in fatty liver)
Results:
The incidence of NAFLD among the one
hundred type 2 diabetic patients participated
in the study was 82% and the rest (18%) were
diagnosed with no fatty liver according to the
supportive studies (Fedchuk et al., 2014;
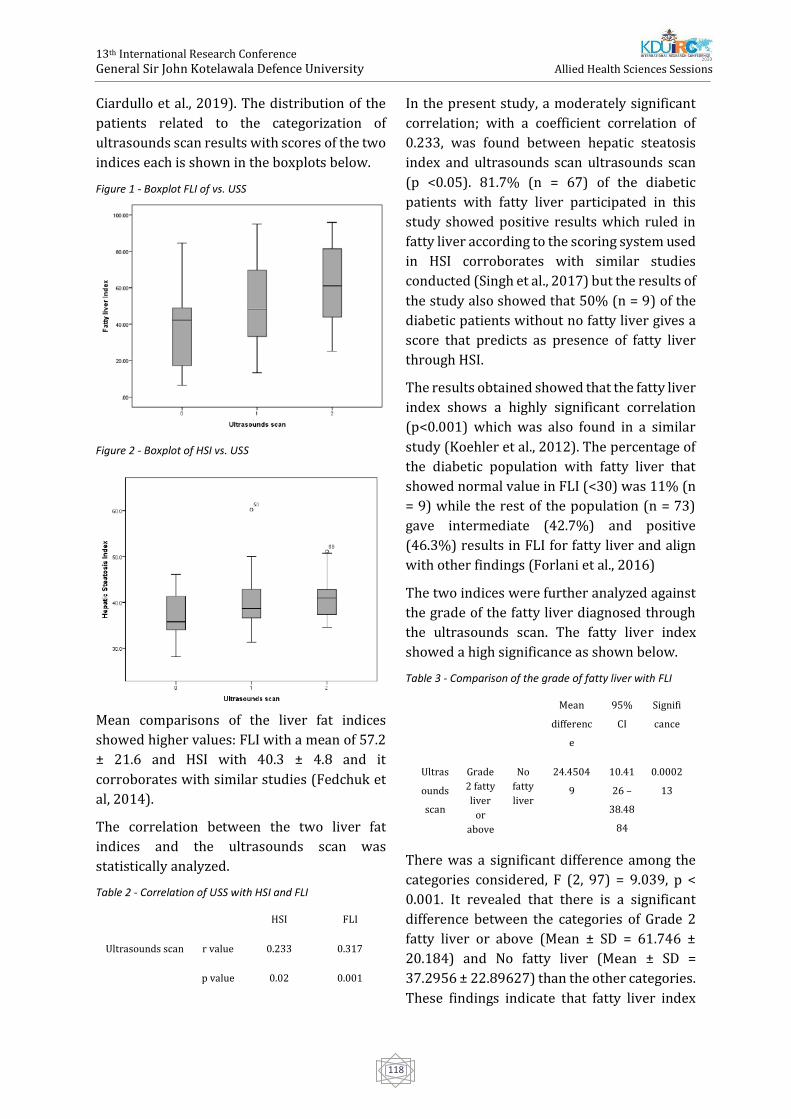
13th International Research Conference
General Sir John Kotelawala Defence University
Allied Health Sciences Sessions
118
Ciardullo et al., 2019). The distribution of the
patients related to the categorization of
ultrasounds scan results with scores of the two
indices each is shown in the boxplots below.
Figure 1 - Boxplot FLI of vs. USS
Figure 2 - Boxplot of HSI vs. USS
Mean comparisons of the liver fat indices
showed higher values: FLI with a mean of 57.2
± 21.6 and HSI with 40.3 ± 4.8 and it
corroborates with similar studies (Fedchuk et
al, 2014).
The correlation between the two liver fat
indices and the ultrasounds scan was
statistically analyzed.
Table 2 - Correlation of USS with HSI and FLI
HSI FLI
Ultrasounds scan r value 0.233 0.317
p value 0.02 0.001
In the present study, a moderately significant
correlation; with a coefficient correlation of
0.233, was found between hepatic steatosis
index and ultrasounds scan ultrasounds scan
(p <0.05). 81.7% (n = 67) of the diabetic
patients with fatty liver participated in this
study showed positive results which ruled in
fatty liver according to the scoring system used
in HSI corroborates with similar studies
conducted (Singh et al., 2017) but the results of
the study also showed that 50% (n = 9) of the
diabetic patients without no fatty liver gives a
score that predicts as presence of fatty liver
through HSI.
The results obtained showed that the fatty liver
index shows a highly significant correlation
(p<0.001) which was also found in a similar
study (Koehler et al., 2012). The percentage of
the diabetic population with fatty liver that
showed normal value in FLI (<30) was 11% (n
= 9) while the rest of the population (n = 73)
gave intermediate (42.7%) and positive
(46.3%) results in FLI for fatty liver and align
with other findings (Forlani et al., 2016)
The two indices were further analyzed against
the grade of the fatty liver diagnosed through
the ultrasounds scan. The fatty liver index
showed a high significance as shown below.
Table 3 - Comparison of the grade of fatty liver with FLI
Mean
differenc
e
95%
CI
Signifi
cance
Ultras
ounds
scan
Grade
2 fatty
liver
or
above
No
fatty
liver
24.4504
9
10.41
26 –
38.48
84
0.0002
13
There was a significant difference among the
categories considered, F (2, 97) = 9.039, p <
0.001. It revealed that there is a significant
difference between the categories of Grade 2
fatty liver or above (Mean ± SD = 61.746 ±
20.184) and No fatty liver (Mean ± SD =
37.2956 ± 22.89627) than the other categories.
These findings indicate that fatty liver index
13th International Research Conference
General Sir John Kotelawala Defence University
Allied Health Sciences Sessions
119
can be used to predict fatty liver more
precisely between patients without fatty liver
and patients with Grade 2 fatty liver or above.
Conclusion
The current study showed a higher incidence
of NAFLD in the diabetic patients. There was a
moderate significance between HSI and
ultrasounds scan a highly significant
correlation was observed between FLI and
Ultrasounds scan results that could predict the
presence or absence of fatty liver in diabetic
patients (T2DM). It also provided that the
association between FLI and Ultrasonography
was able to predict the patients without fatty
liver and patients with Grade 2 fatty liver or
above more precisely according to the scores
given to the index. Therefore it can be
concluded that, according to the present study
FLI and HSI can be used as cost-effective, non-
invasive and simple markers to predict NAFLD
in diabetic patients which allowing the early
detection and prevention of chronic
complications that would deteriorate health
status of an individual.
References
Bedogni, G., Bellentani, S., Miglioli, L., Masutti, F.,
Passalacqua, M., Castiglione, A. and Tiribelli, C.,
2006. The Fatty Liver Index: a simple and accurate
predictor of hepatic steatosis in the general
population. BMC Gastroenterology, 6(1).
Ciardullo, S., Muraca, E., Perra, S., Bianconi, E.,
Zerbini, F., Oltolini, A., Cannistraci, R., Parmeggiani,
P., Manzoni, G., Gastaldelli, A., Lattuada, G. and
Perseghin, G., 2020. Screening for non-alcoholic
fatty liver disease in type 2 diabetes using non-
invasive scores and association with diabetic
complications. BMJ Open Diabetes Research & Care,
8(1), p.e000904.
Diabetes Care, 2009. Diagnosis and Classification of
Diabetes Mellitus. 33(Supplement_1), pp.S62-S69.
Fedchuk, L., Nascimbeni, F., Pais, R., Charlotte, F.,
Housset, C. and Ratziu, V., 2014. Performance and
limitations of steatosis biomarkers in patients with
nonalcoholic fatty liver disease. Alimentary
Pharmacology & Therapeutics, 40(10), pp.1209-
1222.
Forlani, G., Giorda, C., Manti, R., Mazzella, N., De
Cosmo, S., Rossi, M., Nicolucci, A., Di Bartolo, P.,
Ceriello, A., Guida, P. and Study Group, A., 2016. The
Burden of NAFLD and Its Characteristics in a
Nationwide Population with Type 2
Diabetes. Journal of Diabetes Research, 2016, pp.1-9.
Lee, J., Kim, D., Kim, H., Lee, C., Yang, J., Kim, W., Kim,
Y., Yoon, J., Cho, S., Sung, M. and Lee, H., 2010.
Hepatic steatosis index: A simple screening tool
reflecting nonalcoholic fatty liver disease. Digestive
and Liver Disease, 42(7), pp.503-508.
Lv, S., Jiang, S., Liu, S., Dong, Q., Xin, Y. and Xuan, S.,
2018. Noninvasive Quantitative Detection Methods
of Liver Fat Content in Nonalcoholic Fatty Liver
Disease. Journal of Clinical and Translational
Hepatology, 6(2), pp.217-221.
Obika, M. and Noguchi, H., 2012. Diagnosis and
Evaluation of Nonalcoholic Fatty Liver
Disease. Experimental Diabetes Research, 2012,
pp.1-12.
Singh, A., Le, P., Peerzada, M., Lopez, R. and Alkhouri,
N., 2018. The Utility of Noninvasive Scores in
Assessing the Prevalence of Nonalcoholic Fatty
Liver Disease and Advanced Fibrosis in Type 2
Diabetic Patients. Journal of Clinical
Gastroenterology, 52(3), pp.268-272.
Williamson, R., Price, J., Glancy, S., Perry, E., Nee, L.,
Hayes, P., Frier, B., Van Look, L., Johnston, G.,
Reynolds, R. and Strachan, M., 2011. Prevalence of
and Risk Factors for Hepatic Steatosis and
Nonalcoholic Fatty Liver Disease in People With
Type 2 Diabetes: the Edinburgh Type 2 Diabetes
Study. Diabetes Care, 34(5), pp.1139-1144.
Younossi, Z., Anstee, Q., Marietti, M., Hardy, T.,
Henry, L., Eslam, M., George, J. and Bugianesi, E.,
2017. Global burden of NAFLD and NASH: trends,
predictions, risk factors and prevention. Nature
Reviews Gastroenterology & Hepatology, 15(1),
pp.11-20.
13th International Research Conference
General Sir John Kotelawala Defence University
Allied Health Sciences Sessions
120
Correlation between Hemoglobin Concentration and Absolute
Reticulocyte count of adolescent female iron deficient patients at
Colombo north teaching hospital.
R.M.D.K Rathnayaka1#, R.M.D Seneviratne1, D. Kottahachchi1 and Y. Costa2
1Department of Medical Laboratory Science, Faculty of Allied Health Sciences, General Sir John Kotelawala
Defence University, Sri Lanka 2Colombo North Teaching Hospital, Ragama, Sri Lanka
Abstract:-Iron deficiency can be identified as
the most common micro-nutrient disorder
and cause of anemia. Most frequently occurred
in children under the age of 5 years, females of
childbearing age and pregnant women. Study
population comprised of untreated female
patients, between 15-35 years of age (n=111)
with Iron deficiency due to nutritional
deficiency; from Thalassemia unit, Colombo
North teaching hospital. In order to generate a
comparison, of the correlations in a healthy
person and an Iron deficient patient, a control
population (n=60) were selected according
age and gender matched patient population.
The Thalassemia unit was chosen, as those
patients who could make a major effect on
hemoglobin levels, could be eliminated. Blood
from the selected patients were collected for
Full blood count analysis with Reticulocyte
count and Serum Ferritin analysis. The
Pearson’s moment correlation of coefficient
(r) of patient population (n=111); between Hb
and Abs.Retic is r = - 0.432, a moderate
negative correlation (t-test: P=0.000 < 0.01),
between Hb and S. Ferritin r = 0.570, a strong
positive correlation (t-test: P=0.000 < 0.01),
between Abs.Retic count and S. Ferritin r= -
0.268, a weak negative correlation (t-test:
P=0.000 < 0.01). There were no correlations
between parameters of control population.
The Hb sub-group 9- 9.9 g/dL of patient
population contributed to the significant
strong negative correlation (t-test: r=-0.717;
P=0.000<0.05) among all the groups. The
results of our study shows that the body starts
to present iron deficiency (ID) features
(Microcytosis, Hypochromasia) in blood
picture below Hb value 11.1 g/dL level.
Although, above the 11.1 g/dL of Hb the ID
features in blood picture is not prominent
there are symptoms of ID. At the Hb range 9 –
9.9 g/dL the Abs.Retic count increases by
about 6.804 x 10¹⁰/L which could be identified
as an attempt of compensating the bone
marrow in reduction of RBC production, in
Iron deficiency anemia.
Keywords: Iron deficiency anemia, Serum
Ferritin, Absolute Reticulocyte count,
Correlation, ID symptoms
Introduction:
Iron deficiency can be identified as the most
common micro-nutrient disorder and cause of
anemia. Most frequently occurred in children
under the age of 5 years, females of
childbearing age and pregnant women.
Nutritional iron deficiency occurs when bio
availability of iron is insufficient in dietary
supplies to meet the body’s requirement
(Lynch, 2011). Iron deficiency is the most
common nutritional deficiency in the world,
and it is a global health problem (Camaschella,
2015; Haas et al., 2001). It is a condition in
which the mobilizable iron stores are absent
which results in compromised iron supply to
tissues including erythrocytes. Pallor fatigue
and dyspnea are the most common symptoms
of anemia (Iron deficiency anemia, 2001;
Dallal et al., 2016).
Sri Lanka too is heavily burdened by the
problem of anemia, mostly due to nutritional
13th International Research Conference
General Sir John Kotelawala Defence University
Allied Health Sciences Sessions
121
deficiency of iron. According to a study done
by the medical research institute Sri Lanka in
2001 using a sub sample of 2000 population
from the District Hospital System, prevalence
of anemia among children age 6 -59 months
was 32.6%, prevalence of anemia among non-
pregnant women age 15- 49 years was 34.1 %
and prevalence of anemia among pregnant
women age 15 - 49 was 39.1% (Demographic
& Health Survey, 2007). According to the host
factors: age, gender, physiological,
pathological, socio economic and
environmental conditions the prevalence of
iron deficiency may vary greatly.
The purpose of this study was to find an
association between Hb and Absolute
reticulocyte count in patients those who are
newly diagnosed of Iron deficiency caused by
nutrient deficiency, and to compare the
statistical correlations in patient and control
populations.
Methodology:
Hundred and seventy one adolescent girls and
women of childbearing age (15 to 35 years)
were enrolled for the study. The participants
who were attending the Thalassemia
prevention program, CNTH within the time
frame of our data collection were selected by
their serum ferritin values, confirmed by the
Consultant haematologist CNTH. Individuals
with serum ferritin value <20 ng/mL were
selected as the patient population (n=111)
and individuals with serum ferritin values >20
ng/mL were selected as control population
(n=60) based on the study population
selection criteria of previous study
(Thoradeniya et al, 2005). Patients with ID
symptoms, and have been excluded for
Thalassemia by the Thalassemia Prevention
program, CNTH were identified. Written
consent were obtained, ensuring the
willingness to participate in the research.
Blood samples were collected by the nursing
staff of the selected individuals. Questions
regarding dietery intake of participants, food
habits, nutritional practices, knowledge about
ID, ID symptoms if any shown and menstrual
problems were queried and certain
background knowledge about the patients
were obtained.
Individuals with a normal healthy Hb
concentration, which have been excluded of
Thalassemia by the Thalassemia Prevention
program, CNTH, were also selected and above
mentioned procedures of obtaining consent
and collection of blood samples were done
similarly to the patient group.
All the samples from patients and controls
were checked for visible hemolysis prior to
performing the tests, by holding each sample
against a clear white color background.
The tests were carried out within 4 hours of
sample collection. The samples for Full blood
count with reticulocyte count were analysed
in Mindray BC6800 fully automated analyser
in CDR mode. Hemoglobin estimation by
Colorimetry and RBC estimation by
Flowcytometry. The samples for serum
ferritin were analysed in VITROS 3600 fully
automated immunodiagnostic analyser by
immunodiagnostic methods. A manual
reticulocyte count analysis was performed for
50 randomly selected samples for
confirmation of the automated values. A blood
picture analysis was performed for samples
with Hb < 10.00 g/dL (14 samples) and 36
more random samples to confirm the
exclusion of other anemias.
All data analysis was done using IBM SPSS
software version 20 and Microsoft office Excel
2010 software.The statistical analysis that
was used in the study was Pearson’s
correlation coefficient.
Results:
Patient Hb values varied from 6.6 to 14.4 g/dL
and Hb values of the control population used
in the study vary from 12.1 to 15.1 g/dL
Ferritin values vary from 3.81 to 19.9 ng/dL in
patient population and Ferritin values of the
13th International Research Conference
General Sir John Kotelawala Defence University
Allied Health Sciences Sessions
122
healthy control population vary from 20.9 to
84.5 ng/dL. Out of the 111 patients 62 patients
have a higher Hb value than 11.9 g/dL
(according to WHO criteria < 11.9g/dL Hb,
defines as anemic.) but they have low serum
ferritin values which indicates them as iron
deficient but not anemic. They represent
55.85% of whole patient population that
strongly indicates even patients with high Hb
values can be iron deficient with symptoms.
44.15% of the patient population have IDA.
Their Abs.Retic count vary from 1.5 to
11.1X10¹⁰/L in the patient population.
The Pearson’s moment correlation of
coefficient (r) value between Hb and Abs.Retic
of the patient population (n=111) is - 0.432,
which indicates a moderate negative
correlation between parameters. The 2
parameters showed a significant statistical
difference (t-test: P=0.000 < 0.01).
The Pearson’s moment correlation of
coefficient between Hb and S. Ferritin (r) value
of the patient population is 0.570 which
indicates a strong positive correlation
between Abs.Retic count and S. Ferritin. The
parameters showed a significant statistical
difference (t-test: P=0.000 < 0.01).
The Pearson’s moment correlation of
coefficient between Abs.Retic count and S.
Ferritin (r) value of the patient population is -
0.268 which indicates a weak negative
correlation between parameters. The
parameters showed a significant statistical
difference (t-test: P=0.000 < 0.01).
None of the correlations showed significant
correlations (t test: p value > 0.01) in the
control population (n=60). Since the Hb and
Ab. Retic count parameters indicated a
negative correlation the Hb levels were
further grouped according to the WHO criteria
for anemia. According to the WHO criteria for
non-pregnant women the groups are designed
as Hb > 11.9 g/dL; 11.0 < Hb > 11.9 g/dL; 8.0
< Hb > 10.9 g/dL; Hb < 8.0 g/dL. The data were
re-analysed by Pearson coefficient correlation
to identify which group specifically gives the
negative correlation. However, there was no
correlation in above groups.
The patients were sub-grouped by reducing
the width of the range and 7 subgroups were
prepared.
The only significant correlation was obtained
in 9.0 to 9.9 g/dL Hb group and it was a strong
negative correlation (r= -0.717). There were
no correlations observed in any other sub-
group. In our patient population we observed
that the majority (56%) had normal Hb values
(Hb > 11.9 g/dL – non anemic) but low iron
stores (serum ferritin < 20 ng/dL) suggesting
cellular iron deficiency and iron depletion as
indicated in Allen et al. (2017).
Discussion:
Our most significant finding in the ID patient
population, is the Pearson’s moment
correlation of coefficient (r) value between Hb
and Abs.Retic of the Patient population
(n=111) was - 0.432, which indicates a
moderate negative correlation between two
parameters fulfils our general objective. Since
we achieved a significant correlation and also
our Hb range width is comparatively large the
range was further divided into groups as
shown in Table 4. During the analysis we
observed that Hb group 9 - 9.9 g/dL was the
only group that contributed to the significant
correlation (t-test: r=-0.717; P=0.000<0.05)
among all the groups. Such finding has not
revealed in the literature to our knowledge.
The most probable reason as revealed in
literature that nutrient deficiencies specially
iron, which is a major necessity for RBC
production, decreases RBC production hence
the reticulocyte count also decreases,
resulting in reticulocytopenia (Thurnham and
Northrop-Clewes, 2013).
Conclusion:
But as our finding indicates one level of Hb in
ID, shows an increased reticulocyte count,
which indicates reticulocytosis which may be
13th International Research Conference
General Sir John Kotelawala Defence University
Allied Health Sciences Sessions
123
due to the bone marrows attempt of trying to
compensate the loss of RBC. In the higher Hb
levels (>10 g/dL) and very low Hb levels (< 8.9
g/dL) this compensation process and
reticulocytosis cannot be observed.
References:
Al Dallal, S., Wolton, K. and Hentges, K. (2016).
Zfp521 promotes B-cell viability and cyclin D1
gene expression in a B cell culture system.
Leukemia Research, 46, pp.10-17.
Allen, A., Allen, S., Rodrigo, R., Perera, L., Shao, W.,
Li, C., Wang, D., Olivieri, N., Weatherall, D. and
Premawardhena, A. (2017). Iron status and
anaemia in Sri Lankan secondary school children:
A cross-sectional survey. PLOS ONE, 12(11),
p.e0188110.
Camaschella, C. (2015). Iron-Deficiency Anemia.
THE NEW ENGLAND JOURNAL OF MEDICINE,
p.1832.
Camaschella, C. and Nai, A. (2015). Ineffective
erythropoiesis and regulation of iron status in iron
loading anemias. British Journal of Haematology,
172(4), pp.512-523.
CEYLAN, C., MISKIOĞLU, M., ÇOLAK, H.,
KILIÇÇIOĞLU, B. and ÖZDEMIR, E. (2007).
Evaluation of reticulocyte parameters in iron
deficiency, vitamin B12deficiency and thalassemia
minor patients. International Journal of Laboratory
Hematology, 29(5), pp.327-334.
Fisher, J. (2003). Erythropoietin: Physiology and
Pharmacology Update. Experimental Biology and
Medicine, 228(1), pp.1-14.
Fritsma, G., Rodak, B. and Doig, K. (2012).
Hematology. Vancouver, B.C.: Langara College,
pp.233-234.
Hettiarachchi, M., Liyanage, C., Wickremasinghe, R.,
Hilmers, D. and Abrams, S. (2007). The efficacy of
micronutrient supplementation in reducing the
prevalence of anaemia and deficiencies of zinc and
iron among adolescents in Sri Lanka. European
Journal of Clinical Nutrition, 62(7), pp.856-865.
Iron deficiency anemia. (2001). Geneva: WHO
Thoradeniya, T., Wickremasinghe, R., Ramanayake,
R. and Atukorala, S. (2006). Low folic acid status
and its association with anaemia in urban
adolescent girls and women of childbearing age in
Sri Lanka. British Journal of Nutrition, 95(3),
pp.511-516.
13th International Research Conference
General Sir John Kotelawala Defence University
Allied Health Sciences Sessions
124
Effect of Lidocaine Spray in the Enhancement of the Quality of Intra-
Oral Periapical Radiograph when Imaging Lower Third Molar Teeth
GK Dharmaratne1#, DBP Rupasinghe1, EMTH Ekanayake1, RD Jayasinghe2
1Faculty of Allied Health Sciences, University of Peradeniya, Sri Lanka 2Division of Oral Medicine and Radiology, University Dental Hospital Peradeniya, Sri Lanka
Abstract: Dental radiography is one of the
best diagnostic methods used to identify
dental diseases and several dental
radiographic methods are practised in order
to achieve quality images of the specific dental
region. In the process of imaging lower third
molar region using bisected angle technique
(BAT), which is an intra-oral peri apical (IOPA)
radiographic method, radiographers and the
patients undergo a lot of difficulties. As a result
of the difficulty in placing the film packet
sufficiently posterior in the mouth cavity, the
qualities of the radiographs are contrastively
affected and patients tend to experience
discomfort and pain. This study introduces an
anaesthetic spray, to be sprayed around the
oral mucosa of lower third molar region so
that above difficulties are minimized. This
applied descriptive study is carried out
engaging 62 patients in two randomly selected
groups as 31 in an experimental group and 31
in a controlled group. Photographs of each
radiograph obtained from both the groups
were analysed for quality using a quality
assessment tool and each patient were given a
visual analogue scale for the pain assessment.
Results obtained from statistical analysis
showed that there was no significant
difference between the qualities of
radiographs obtained from conventional
method and the new method. However, there
were significant differences between
conventional and new method when the
overall opinions of the evaluators and the pain
levels were analysed. This study can be
considered as a useful supplementary aid in
the clinical practise.
Keywords: BAT, IOPA, anaesthetic, evaluators
Introduction:
Oral diseases are common non-communicable
diseases which affect people throughout their
lifetime, causing pain, discomfort,
disfigurement and even death. Dental
radiography plays an important role in
managing oral diseases. During diagnosis and
treatment procedures such as root canal
treatment, caries diagnosis, diagnosis and
treatment planning of orthodontic patients,
dental radiography analysis is
mandatory.(Wang et al., 2016) In the oral
cavity, lower third molar region is an
important region which is vulnerable to much
pathology and also creates much difficulty in
radiographic imaging due to its anatomical
position. Pathological cases such as impacted
third molar, acute or chronic periodontitis,
caries, pericoronitis and deleterious effects on
second molars, may lead to the removal of the
third molar.(Marciani, 2007) Therefore
radiographic examination of the third molar is
very important in diagnosing most of the
above pathologies and treatment planning and
also in estimating the age of individuals.(Jung
and Cho, 2014) Among different radiographic
methods, bisected angle technique which is an
intra-oral peri apical radiographic method, is
widely practised when imaging lower third
molar region due to its high convenience.
However, the main difficulty in this technique
is the placement of the film packet sufficiently
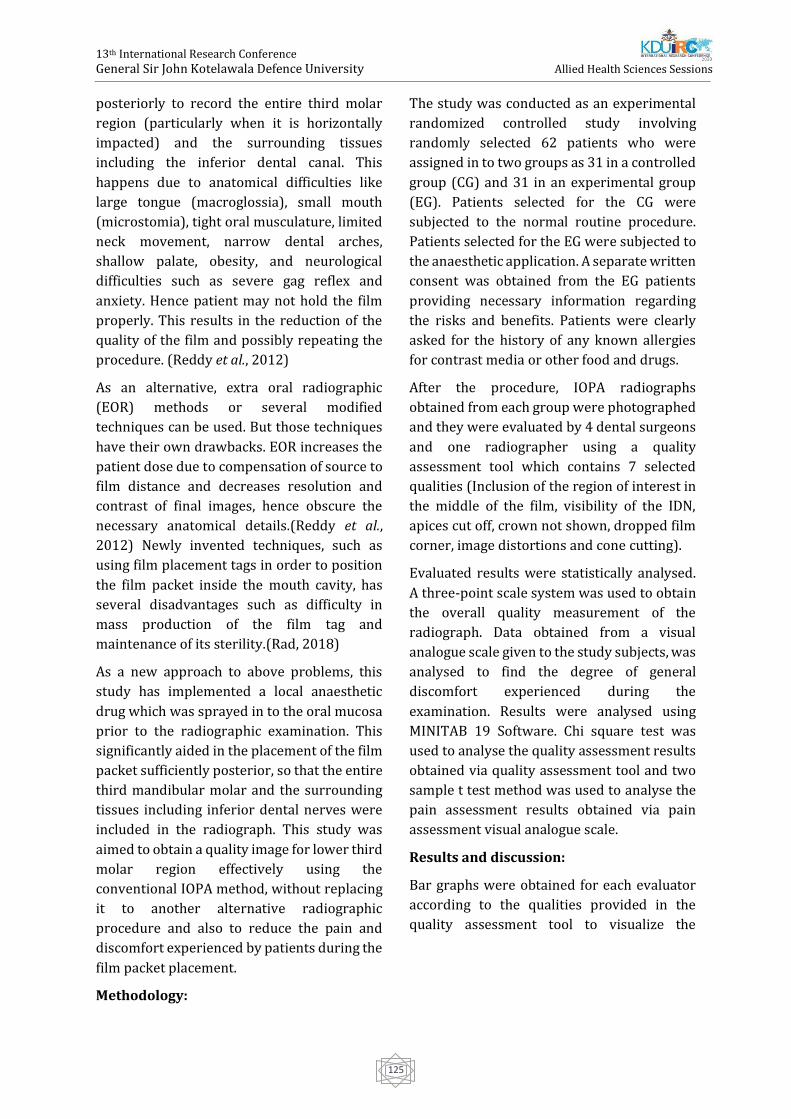
13th International Research Conference
General Sir John Kotelawala Defence University
Allied Health Sciences Sessions
125
posteriorly to record the entire third molar
region (particularly when it is horizontally
impacted) and the surrounding tissues
including the inferior dental canal. This
happens due to anatomical difficulties like
large tongue (macroglossia), small mouth
(microstomia), tight oral musculature, limited
neck movement, narrow dental arches,
shallow palate, obesity, and neurological
difficulties such as severe gag reflex and
anxiety. Hence patient may not hold the film
properly. This results in the reduction of the
quality of the film and possibly repeating the
procedure. (Reddy et al., 2012)
As an alternative, extra oral radiographic
(EOR) methods or several modified
techniques can be used. But those techniques
have their own drawbacks. EOR increases the
patient dose due to compensation of source to
film distance and decreases resolution and
contrast of final images, hence obscure the
necessary anatomical details.(Reddy et al.,
2012) Newly invented techniques, such as
using film placement tags in order to position
the film packet inside the mouth cavity, has
several disadvantages such as difficulty in
mass production of the film tag and
maintenance of its sterility.(Rad, 2018)
As a new approach to above problems, this
study has implemented a local anaesthetic
drug which was sprayed in to the oral mucosa
prior to the radiographic examination. This
significantly aided in the placement of the film
packet sufficiently posterior, so that the entire
third mandibular molar and the surrounding
tissues including inferior dental nerves were
included in the radiograph. This study was
aimed to obtain a quality image for lower third
molar region effectively using the
conventional IOPA method, without replacing
it to another alternative radiographic
procedure and also to reduce the pain and
discomfort experienced by patients during the
film packet placement.
Methodology:
The study was conducted as an experimental
randomized controlled study involving
randomly selected 62 patients who were
assigned in to two groups as 31 in a controlled
group (CG) and 31 in an experimental group
(EG). Patients selected for the CG were
subjected to the normal routine procedure.
Patients selected for the EG were subjected to
the anaesthetic application. A separate written
consent was obtained from the EG patients
providing necessary information regarding
the risks and benefits. Patients were clearly
asked for the history of any known allergies
for contrast media or other food and drugs.
After the procedure, IOPA radiographs
obtained from each group were photographed
and they were evaluated by 4 dental surgeons
and one radiographer using a quality
assessment tool which contains 7 selected
qualities (Inclusion of the region of interest in
the middle of the film, visibility of the IDN,
apices cut off, crown not shown, dropped film
corner, image distortions and cone cutting).
Evaluated results were statistically analysed.
A three-point scale system was used to obtain
the overall quality measurement of the
radiograph. Data obtained from a visual
analogue scale given to the study subjects, was
analysed to find the degree of general
discomfort experienced during the
examination. Results were analysed using
MINITAB 19 Software. Chi square test was
used to analyse the quality assessment results
obtained via quality assessment tool and two
sample t test method was used to analyse the
pain assessment results obtained via pain
assessment visual analogue scale.
Results and discussion:
Bar graphs were obtained for each evaluator
according to the qualities provided in the
quality assessment tool to visualize the
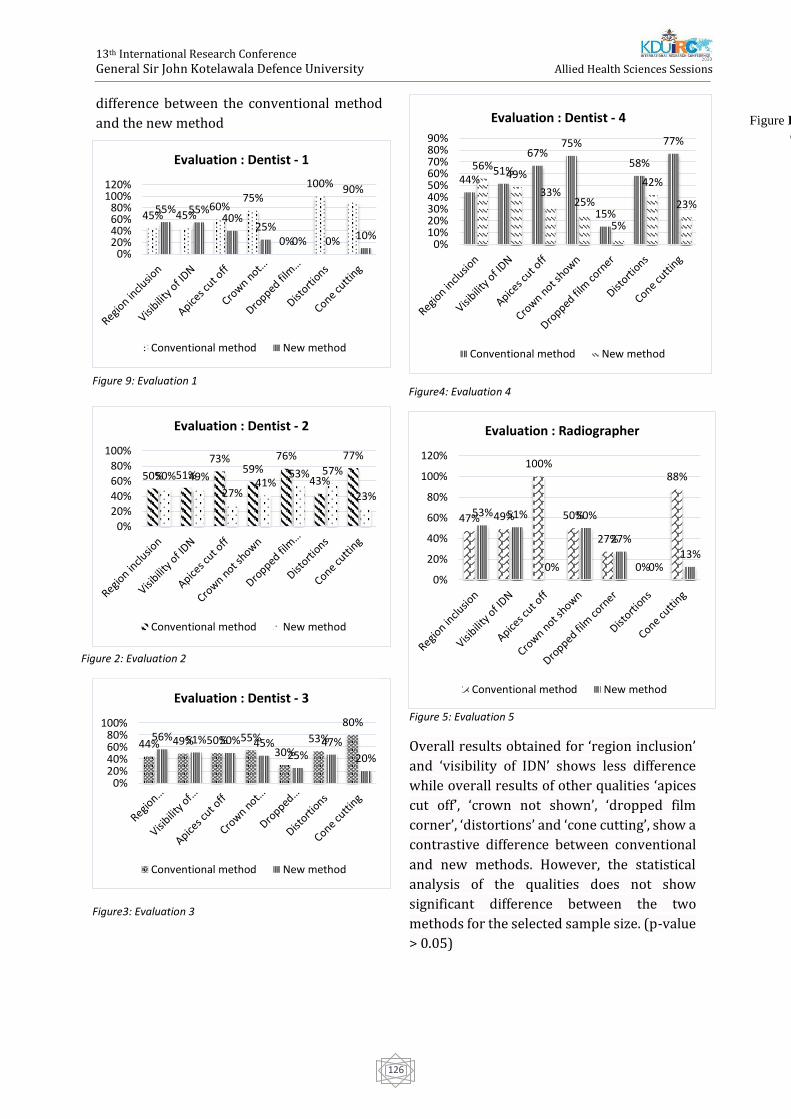
13th International Research Conference
General Sir John Kotelawala Defence University
Allied Health Sciences Sessions
126
difference between the conventional method
and the new method
Figure 5: Evaluation 5
Overall results obtained for ‘region inclusion’
and ‘visibility of IDN’ shows less difference
while overall results of other qualities ‘apices
cut off’, ‘crown not shown’, ‘dropped film
corner’, ‘distortions’ and ‘cone cutting’, show a
contrastive difference between conventional
and new methods. However, the statistical
analysis of the qualities does not show
significant difference between the two
methods for the selected sample size. (p-value
> 0.05)
44%51%
67%75%
15%
58%
77%
56%49%
33%25%
5%
42%
23%
0%10%20%30%40%50%60%70%80%90%
Evaluation : Dentist - 4
Conventional method New method
50% 51%
73%59%
76%
43%
77%
50% 49%
27%41%
53% 57%
23%
0%
20%
40%
60%
80%
100%
Evaluation : Dentist - 2
Conventional method New method
44% 49% 50% 55%30%
53%
80%56% 51% 50% 45%
25%47%
20%
0%20%40%60%80%
100%
Evaluation : Dentist - 3
Conventional method New method
Figure Error! No text of specified style in
document..10 .Evaluation 2
Figure 1: Evaluation1
45% 45%60%
75%
0%
100% 90%
55% 55%40%
25%0% 0% 10%
0%20%40%60%80%
100%120%
Evaluation : Dentist - 1
Conventional method New method
Figure 2: Evaluation 2
Figure3: Evaluation 3
Figure4: Evaluation 4 Figure 9: Evaluation 1
47% 49%
100%
50%
27%
0%
88%
53% 51%
0%
50%
27%
0%13%
0%
20%
40%
60%
80%
100%
120%
Evaluation : Radiographer
Conventional method New method
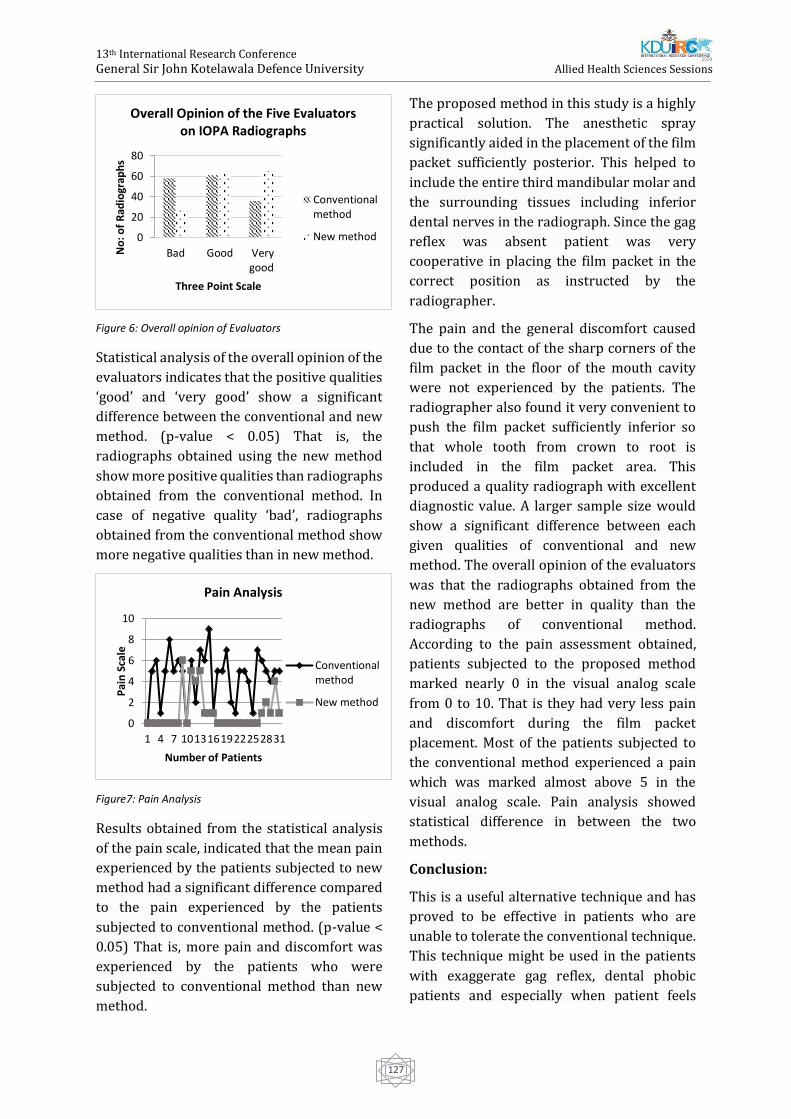
13th International Research Conference
General Sir John Kotelawala Defence University
Allied Health Sciences Sessions
127
Figure 6: Overall opinion of Evaluators
Statistical analysis of the overall opinion of the
evaluators indicates that the positive qualities
‘good’ and ‘very good’ show a significant
difference between the conventional and new
method. (p-value < 0.05) That is, the
radiographs obtained using the new method
show more positive qualities than radiographs
obtained from the conventional method. In
case of negative quality ‘bad’, radiographs
obtained from the conventional method show
more negative qualities than in new method.
Figure7: Pain Analysis
Results obtained from the statistical analysis
of the pain scale, indicated that the mean pain
experienced by the patients subjected to new
method had a significant difference compared
to the pain experienced by the patients
subjected to conventional method. (p-value <
0.05) That is, more pain and discomfort was
experienced by the patients who were
subjected to conventional method than new
method.
The proposed method in this study is a highly
practical solution. The anesthetic spray
significantly aided in the placement of the film
packet sufficiently posterior. This helped to
include the entire third mandibular molar and
the surrounding tissues including inferior
dental nerves in the radiograph. Since the gag
reflex was absent patient was very
cooperative in placing the film packet in the
correct position as instructed by the
radiographer.
The pain and the general discomfort caused
due to the contact of the sharp corners of the
film packet in the floor of the mouth cavity
were not experienced by the patients. The
radiographer also found it very convenient to
push the film packet sufficiently inferior so
that whole tooth from crown to root is
included in the film packet area. This
produced a quality radiograph with excellent
diagnostic value. A larger sample size would
show a significant difference between each
given qualities of conventional and new
method. The overall opinion of the evaluators
was that the radiographs obtained from the
new method are better in quality than the
radiographs of conventional method.
According to the pain assessment obtained,
patients subjected to the proposed method
marked nearly 0 in the visual analog scale
from 0 to 10. That is they had very less pain
and discomfort during the film packet
placement. Most of the patients subjected to
the conventional method experienced a pain
which was marked almost above 5 in the
visual analog scale. Pain analysis showed
statistical difference in between the two
methods.
Conclusion:
This is a useful alternative technique and has
proved to be effective in patients who are
unable to tolerate the conventional technique.
This technique might be used in the patients
with exaggerate gag reflex, dental phobic
patients and especially when patient feels
0
20
40
60
80
Bad Good Verygood
No
: of
Rad
iogr
aph
s
Three Point Scale
Overall Opinion of the Five Evaluators on IOPA Radiographs
Conventionalmethod
New method
0
2
4
6
8
10
1 4 7 1013161922252831
Pai
n S
cale
Number of Patients
Pain Analysis
Conventionalmethod
New method
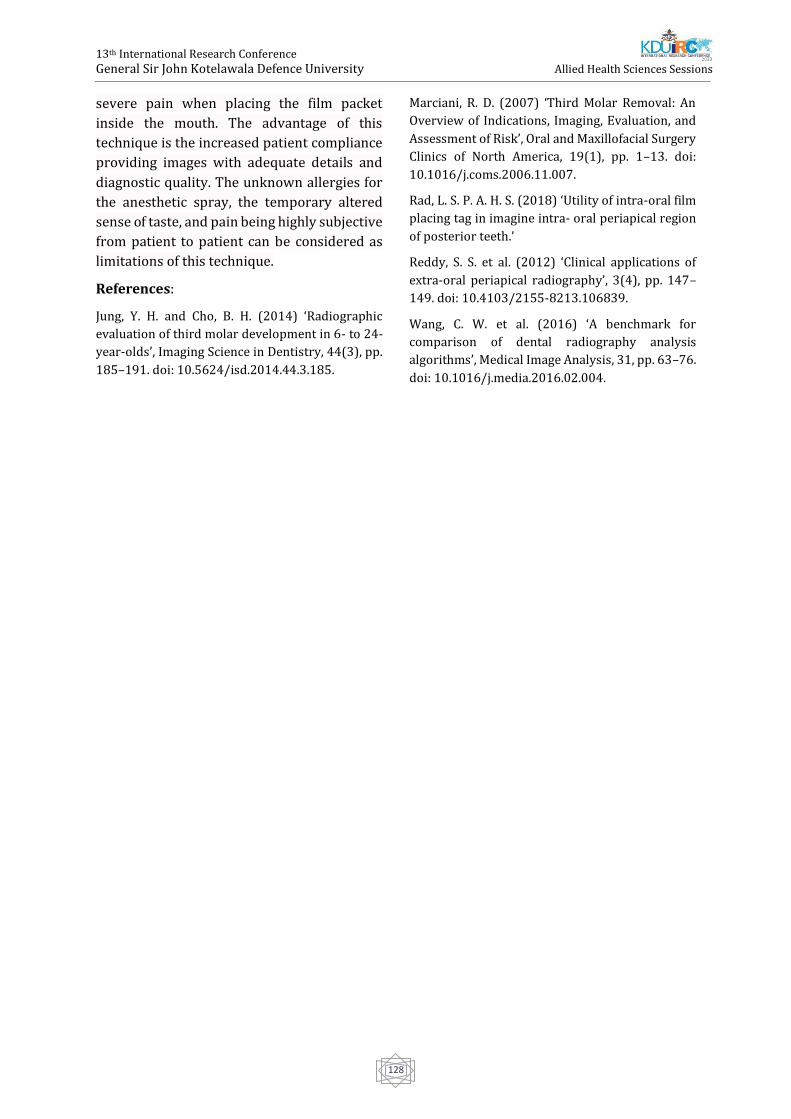
13th International Research Conference
General Sir John Kotelawala Defence University
Allied Health Sciences Sessions
128
severe pain when placing the film packet
inside the mouth. The advantage of this
technique is the increased patient compliance
providing images with adequate details and
diagnostic quality. The unknown allergies for
the anesthetic spray, the temporary altered
sense of taste, and pain being highly subjective
from patient to patient can be considered as
limitations of this technique.
References:
Jung, Y. H. and Cho, B. H. (2014) ‘Radiographic
evaluation of third molar development in 6- to 24-
year-olds’, Imaging Science in Dentistry, 44(3), pp.
185–191. doi: 10.5624/isd.2014.44.3.185.
Marciani, R. D. (2007) ‘Third Molar Removal: An
Overview of Indications, Imaging, Evaluation, and
Assessment of Risk’, Oral and Maxillofacial Surgery
Clinics of North America, 19(1), pp. 1–13. doi:
10.1016/j.coms.2006.11.007.
Rad, L. S. P. A. H. S. (2018) ‘Utility of intra-oral film
placing tag in imagine intra- oral periapical region
of posterior teeth.’
Reddy, S. S. et al. (2012) ‘Clinical applications of
extra-oral periapical radiography’, 3(4), pp. 147–
149. doi: 10.4103/2155-8213.106839.
Wang, C. W. et al. (2016) ‘A benchmark for
comparison of dental radiography analysis
algorithms’, Medical Image Analysis, 31, pp. 63–76.
doi: 10.1016/j.media.2016.02.004.
13th International Research Conference
General Sir John Kotelawala Defence University
Allied Health Sciences Sessions
129
Health Promoting Lifestyle and Its Associated Factors Among
Undergraduate Students in Faculty of Allied Health Sciences,
University of Peradeniya, Sri Lanka
NGGS Chandana#, HMRKG Nandasena, TS Amarasinghe
Department of Nursing, Faculty of Allied Health Sciences, University of Peradeniya
Abstract: Health promoting life style is the
main strategy to improve health status of an
individual .The objective of this study was to
assess the health promoting lifestyle and its
determinants among undergraduate students .
A descriptive cross - sectional study was
conducted among 380 students in Faculty of
Allied Health Sciences, University of
Peradeniya .Health-promoting lifestyle was
measured using Walker's health-promoting
lifestyle profile II ( HPLP II.) Weight and height
of the students were measured using
electronic weight scale and stadiometer .Data
was analyzed using SPSS version 25 and 0.05
p value was considered as the level of
significance . Out of 380 students 70.5 %were
females and 29.5 %were males .The total
mean score of HPLP II was 120.69±16 .51 .
Spiritual growth had the highest score
(24.16±5.18 )in subscales and the lowest was
physical activity (14.39±4.02 .)Mean BMI of
the students was 21.28±3 .47 .Religion
(p=0.024), course of study ( P=0.008 )and
involvement in leisure activities ( p=<0.001 )
were significantly associated with the HPLP II
total score .Majority (92.4 )%of them stated
that they have barriers towards implementing
health promoting lifestyle at the university
and the lack of time was the most common
barrier . Health promoting lifestyle of the
students was at moderate level and the
identified barriers should be addressed to
improve the healthy life styles among this
student population .
Keywords :University Students, Health
Promoting Lifestyle, Sri Lanka
Introduction:
Health is a state of complete physical, mental
and social well-being and not merely the
absence of disease or infirmity (WHO,1948 ) .
The enjoyment of the highest attainable
standard of health is one of the fundamental
rights of every human being without
distinction of race, religion, political believes,
economic or social condition .The most
important Health Promoting Behaviours
(HPB) include healthy eating, physical
activities, stress management, interpersonal
communication, spiritual growth, and health
responsibility (Shaheen et al., 2015 ). Healthy
eating or nutrition involves correct selection
and consumption of foods that essential for
health and well-being (Walker, Sechrist and
Pender, 1995 ) . Physical activity means bodily
movement that is produced by the contraction
of skeletal muscles which substantially
increases energy expenditure (Fuchs, 2015 ).
Stress is a collection of physiological,
emotional, behavioral and cognitive reactions
that occur in response to a stressor .Stress
should be managed very well to maintain a
healthy lifestyle (Mehta and Sharma, 2015 ).
Interpersonal relationship is a connection or
an association between two or more people .
Spiritual growth means an increased depth of
awareness, connection to the transcendent,
search for ultimate meaning and engage in
spiritual activities (Brown, 2012 ) . Health
responsibility means being responsible for
one’s own personal health (Steinbrook,
2006 ) . The living way of individuals, families,
and societies called a lifestyle .It can be
13th International Research Conference
General Sir John Kotelawala Defence University
Allied Health Sciences Sessions
130
healthy or unhealthy .A healthy lifestyle
important for good quality of life and an
unhealthy lifestyle is the important risk factor
contributing to the progression of suboptimal
health status into a disease condition (Mehri et
al., 2016 ) . Health-promoting lifestyle is a
determinant of health to maintain a healthy
lifestyle (Masina and , Tomislav and Madzar,
2017 ). To measure the level of health-
promoting lifestyle of an individual mainly six
dimensions of health are used .They are
physical activity, nutrition, stress
management, health responsibility ,
interpersonal relationships, and self -
actualization ( Shaheen et al., 2015 ) .
University students are a distinct group of
students who have unique needs and
problems .They have particular physical,
social and emotional characteristics .Since
they are at young age, they believe that they
are in good health condition and they do not
need to maintain a health-promoting lifestyle
(Mehri et al., 2016.) Students ’health status
and behaviours may be affected by their
circumstances (Peker and Bermek, 2011 ) .
Moreover, students are away from parents
and they enter a period of new independence .
This leads to rapid changes in body, mind, and
relationships .Also, students who live
independently are subject to less parental
control that can inhibit healthy behaviour .
Such students are more prone to have poor
eating habits, lack of sleep, or the acquisition
of new habits, such as smoking or usage of
drugs .All these factors do not contribute
positively to the development of a healthy
lifestyle .Because of unhealthy lifestyles,
students are subjected to experience stress,
impaired eating and sleeping disturbances,
gastrointestinal disturbances, body weakness,
and mental problems .It affects the learning
activities of the students and as well as the
social reactions of the students .Therefore,
university life is the best time and place that
can provide education regarding health
promotion for the young people (Peker and
Bermek, 2011 ) . It is important to maintain a
health-promoting lifestyle among university
students because they are educated well and
their behaviour affects the health status and
well -being of the society (Garrusi, Safizadeh
and Pourhosseini, 2008 ) .
Especially the university students who are
going to be health workers are expected to be
role models in society .It is assumed that
health workers who adopt and display healthy
lifestyle behaviours throughout their
professional lives can motivate their patients
to improve their health, which can also
contribute to improving health care from the
viewpoint of public health (Wolf, 1994 .) The
general objective of the study was to assess
the health-promoting lifestyle and its
determinants among undergraduate students
in Faculty of Allied Health Sciences, University
of Peradeniya and also it was conducted to
determine the relationship in between health-
promoting lifestyle behavior subscales, to
assess the relationship between health-
promoting lifestyle behaviors and socio-
demographic characteristics and to identify
the barriers towards implementing health-
promoting lifestyle behaviors among
undergraduate students in, Faculty of Allied
Health Sciences, University of Peradeniya .
Methodology:
This was a descriptive cross- sectional study
conducted among 380 undergraduate
students in Faculty of Allied Health Sciences,
University of Peradeniya, Sri Lanka. Stratified
random sampling method was used as the
sampling technique. Data was collected using
a pre-validated, pre-tested, self-administered
questionnaire .No changes were done to the
questionnaire after the pre-test and the
medium of the questionnaire was English .The
questionnaire consisted of 4 parts, part A –
Anthropometric measurements, part B - socio-
demographic data, part C - HPLP II (Walker’s
Health Promoting Life Style Profile II )and part
D - Barriers towards implementing health
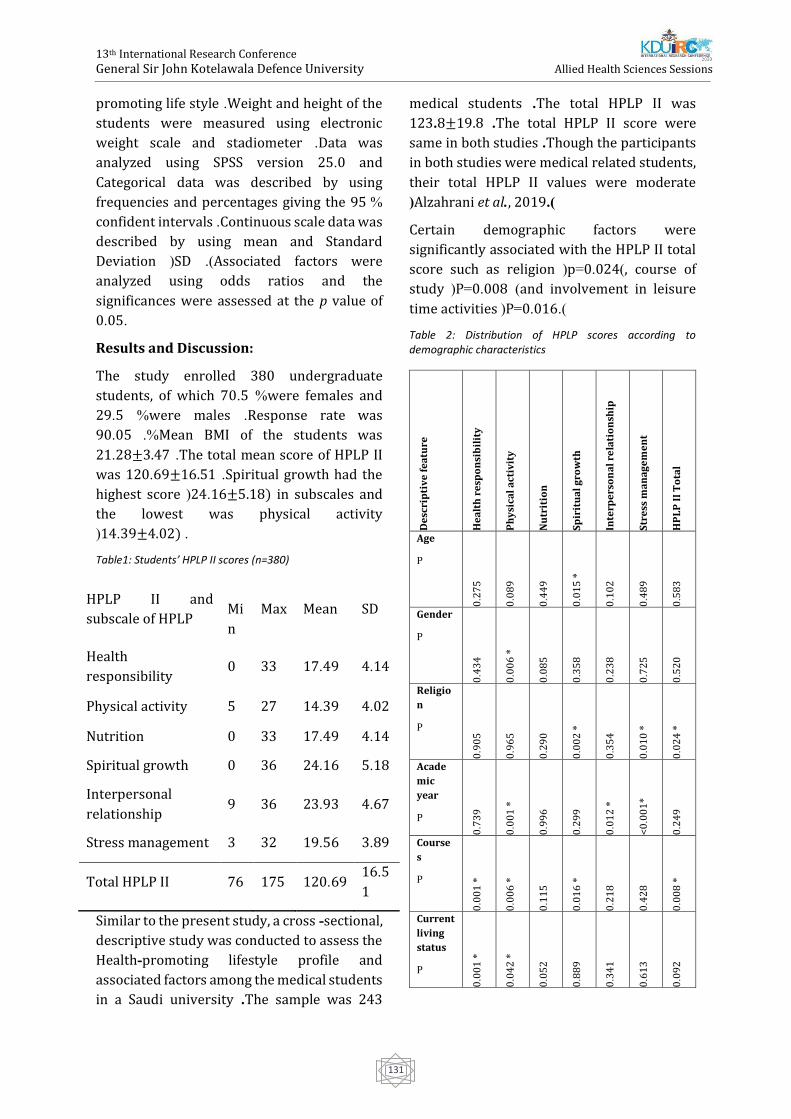
13th International Research Conference
General Sir John Kotelawala Defence University
Allied Health Sciences Sessions
131
promoting life style .Weight and height of the
students were measured using electronic
weight scale and stadiometer .Data was
analyzed using SPSS version 25.0 and
Categorical data was described by using
frequencies and percentages giving the 95 %
confident intervals .Continuous scale data was
described by using mean and Standard
Deviation (SD .)Associated factors were
analyzed using odds ratios and the
significances were assessed at the p value of
0.05 .
Results and Discussion:
The study enrolled 380 undergraduate
students, of which 70.5 %were females and
29.5 %were males .Response rate was
90.05 .%Mean BMI of the students was
21.28±3.47 .The total mean score of HPLP II
was 120.69±16.51 .Spiritual growth had the
highest score (24 .16±5.18) in subscales and
the lowest was physical activity
(14.39±4.02) .
Table1: Students’ HPLP II scores (n=380)
HPLP II and
subscale of HPLP
Mi
n
Max Mean SD
Health
responsibility 0 33 17.49 4.14
Physical activity 5 27 14.39 4.02
Nutrition 0 33 17.49 4.14
Spiritual growth 0 36 24.16 5.18
Interpersonal
relationship 9 36 23.93 4.67
Stress management 3 32 19.56 3.89
Total HPLP II 76 175 120.69 16.5
1
Similar to the present study, a cross - sectional,
descriptive study was conducted to assess the
Health-promoting lifestyle profile and
associated factors among the medical students
in a Saudi university .The sample was 243
medical students .The total HPLP II was
123 .8±19.8 .The total HPLP II score were
same in both studies .Though the participants
in both studies were medical related students,
their total HPLP II values were moderate
(Alzahrani et al., 2019 ).
Certain demographic factors were
significantly associated with the HPLP II total
score such as religion (p=0.024), course of
study (P=0.008 )and involvement in leisure
time activities (P=0.016.)
Table 2: Distribution of HPLP scores according to demographic characteristics
De
scri
pti
ve
fe
atu
re
He
alt
h r
esp
on
sib
ilit
y
Ph
ysi
cal
act
ivit
y
Nu
trit
ion
Sp
irit
ua
l g
row
th
Inte
rpe
rso
na
l re
lati
on
ship
Str
ess
ma
na
ge
me
nt
HP
LP
II
To
tal
Age
P
0.2
75
0.0
89
0.4
49
0.0
15
*
0.1
02
0.4
89
0.5
83
Gender
P
0.4
34
0.0
06
*
0.0
85
0.3
58
0.2
38
0.7
25
0.5
20
Religio
n
P
0.9
05
0.9
65
0.2
90
0.0
02
*
0.3
54
0.0
10
*
0.0
24
*
Acade
mic
year
P
0.7
39
0.0
01
*
0.9
96
0.2
99
0.0
12
*
<0
.00
1*
0.2
49
Course
s
P
0.0
01
*
0.0
06
*
0.1
15
0.0
16
*
0.2
18
0.4
28
0.0
08
*
Current
living
status
P
0.0
01
*
0.0
42
*
0.0
52
0.8
89
0.3
41
0.6
13
0.0
92
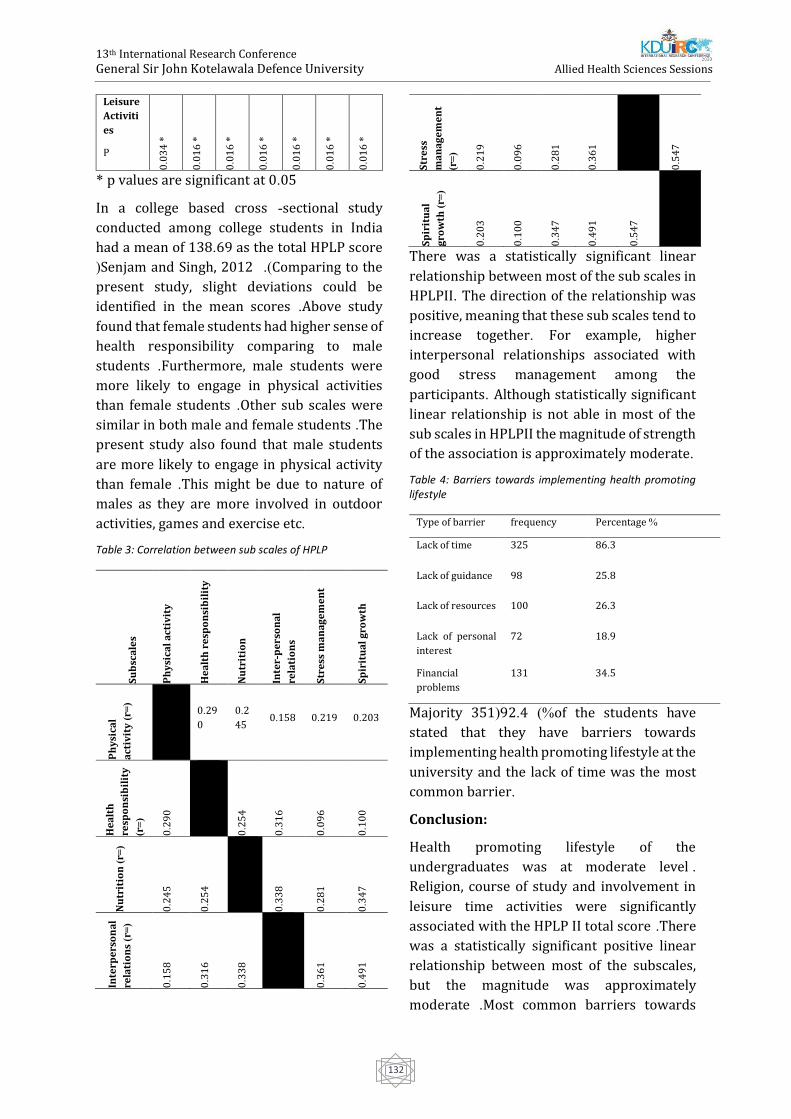
13th International Research Conference
General Sir John Kotelawala Defence University
Allied Health Sciences Sessions
132
Leisure
Activiti
es
P 0
.03
4 *
0.0
16
*
0.0
16
*
0.0
16
*
0.0
16
*
0.0
16
*
0.0
16
*
* p values are significant at 0.05
In a college based cross - sectional study
conducted among college students in India
had a mean of 138.69 as the total HPLP score
(Senjam and Singh, 2012 ) . Comparing to the
present study, slight deviations could be
identified in the mean scores .Above study
found that female students had higher sense of
health responsibility comparing to male
students .Furthermore, male students were
more likely to engage in physical activities
than female students .Other sub scales were
similar in both male and female students .The
present study also found that male students
are more likely to engage in physical activity
than female .This might be due to nature of
males as they are more involved in outdoor
activities, games and exercise etc .
Table 3: Correlation between sub scales of HPLP
Su
bsc
ale
s
Ph
ysi
cal
act
ivit
y
He
alt
h r
esp
on
sib
ilit
y
Nu
trit
ion
Inte
r-p
ers
on
al
rela
tio
ns
Str
ess
ma
na
ge
me
nt
Sp
irit
ua
l g
row
th
Ph
ysi
cal
act
ivit
y )
r=(
0.29
0
0.2
45 0.158 0.219 0.203
He
alt
h
resp
on
sib
ilit
y
)r=
(
0.2
90
0.2
54
0.3
16
0.0
96
0.1
00
Nu
trit
ion
)r=
(
0.2
45
0.2
54
0.3
38
0.2
81
0.3
47
Inte
rpe
rso
na
l
rela
tio
ns
)r=
(
0.1
58
0.3
16
0.3
38
0.3
61
0.4
91
Str
ess
ma
na
ge
me
nt
)r=
(
0.2
19
0.0
96
0.2
81
0.3
61
0.5
47
Sp
irit
ua
l
gro
wth
)r=
(
0.2
03
0.1
00
0.3
47
0.4
91
0.5
47
There was a statistically significant linear
relationship between most of the sub scales in
HPLPII. The direction of the relationship was
positive, meaning that these sub scales tend to
increase together. For example, higher
interpersonal relationships associated with
good stress management among the
participants. Although statistically significant
linear relationship is not able in most of the
sub scales in HPLPII the magnitude of strength
of the association is approximately moderate.
Table 4: Barriers towards implementing health promoting lifestyle
Type of barrier frequency Percentage %
Lack of time 325 86.3
Lack of guidance 98 25.8
Lack of resources 100 26.3
Lack of personal
interest
72 18.9
Financial
problems
131 34.5
Majority 351(92.4 )%of the students have
stated that they have barriers towards
implementing health promoting lifestyle at the
university and the lack of time was the most
common barrier .
Conclusion:
Health promoting lifestyle of the
undergraduates was at moderate level .
Religion, course of study and involvement in
leisure time activities were significantly
associated with the HPLP II total score .There
was a statistically significant positive linear
relationship between most of the subscales,
but the magnitude was approximately
moderate .Most common barriers towards
13th International Research Conference
General Sir John Kotelawala Defence University
Allied Health Sciences Sessions
133
maintaining health promoting lifestyle
activities were lack of time and financial
problems .Therefore, this study emphasizes
the importance of addressing the barriers
towards maintaining healthy life styles among
this university student population .
References:
Alzahrani, S. H., Malik, A. A., Bashawri, J., Shaheen,
S. A., Shaheen, M. M., Alsaib, A. A., & Mubarak, M.
A. )2019(. Health-promoting lifestyle profile and
associated factors among medical students in a
Saudi university. SAGE Open Medicine
Brown, P. )2012(. Spiritual development. Early
Years Educator, 14)7(, viii–ix.
Callahan, D. )1973(. The WHO definition of
“health”. Studies - Hastings Center, 1)3(, 77–88.
Fuchs, R. )2015(. Physical Activity and Health.
International Encyclopedia of the Social &
Behavioral Sciences: Second Edition, 87–90.
Garrusi, B., Safizadeh, H., & Pourhosseini, O.
)2008(. A study on the lifestyle of the Iranian
university students. Iranian Journal of Psychiatry
and Behavioral Sciences, 2)2(, 41–45.
Masina, T., & , Tomislav Madzar, V. M. and M. M.
)2017(. Differences in Health-Promoting Lifestyle
Profile Among Croatian Medical Students
According to Gender and Year of Study. Acta Clinica
Croatica, 56)1(, 84–90.
Mehri, A., Solhi, M., Garmaroudi, G., Nadrian, H., &
Sighaldeh, S. S. )2016a(. Health Promoting Lifestyle
and its Determinants Among University Students
in Sabzevar, Iran. International Journal of
Preventive Medicine, 7, 65.
Mehta, M., & Sharma, V. )2015(. Stress
management. A Practical Approach to Cognitive
Behaviour Therapy for AdolescentsA Practical
Approach to Cognitive Behaviour Therapy for
Adolescents, )January 2012(, 149–178.
Peker, K., & Bermek, G. )2011(. Predictors of
health-promoting behaviors among freshman
dental students at istanbul university. Journal of
Dental Education, 75)3(, 413–420.
Senjam, S., & Singh, A. )2012(. Health promoting
behavior among college students in Chandigarh,
India. Indian Journal of Community Health, 24)1(,
58–62.
Shaheen, A. M., Nassar, O. S., Amre, H. M., &
Hamdan-Mansour, A. M. )2015(. Factors Affecting
Health-Promoting Behaviors of University
Students in Jordan. Health, 07)01(, 1–8.
Steinbrook, R. )2006(. Imposing personal
responsibility for health. New England Journal of
Medicine, 355)8(, 753–756.
Walker, S., Sechrist, K., & Pender, N. )1995(. Health
Promotion Model - Instruments to Measure Health
Promoting Lifestyle : Health-Promoting Lifestyle
Profile [HPLP II] )Adult Version(. Journal of Nursing
Research, 22)7(, 796–811.
13th International Research Conference
General Sir John Kotelawala Defence University
Allied Health Sciences Sessions
134
Evaluation of Physicochemical Properties of Starch from Two
Modified Sri Lankan Rice Varieties to Be Used as Excipients in the
Pharmaceutical Industry
LMH Piyumini1, KWDC Lalindra1, HSAM Premathilake1, SU Kankanamge1# TS Suresh2, P
Danthanarayana3 and WJABN Jayasuriya4
1Department of Pharmacy, Faculty of Allied Health Sciences, General Sir John Kotelawala Defence University,
Sri Lanka 2Department of Biochemistry, Faculty of Medical Sciences, University of Sri Jayewardenepura, Sri Lanka
3State Pharmaceutical Manufacturing Corporation of Sri Lanka, Sri Lanka 4Department of Pharmacy and Pharmaceutical science, Faculty of Allied Health Sciences, University of Sri
Jayewardenepura, Sri Lanka
Abstracts: Starches are the main excipients
used in the formulation of solid oral dosage
forms and the majority of the excipients are
imported to Sri Lanka for the country’s
pharmaceutical manufacturing industry.
Therefore, research studies need to be done
on finding the suitability of the available
sources as pharmaceutical excipients which in
return would be more beneficial for the
country when making it self-reliant and
secured in healthcare. Thus, the present study
was aimed at evaluation of the
physicochemical properties of rice starch
isolated from two modified Sri Lankan
varieties of rice, in order to facilitate their
exploitation as suitable excipients for the local
pharmaceutical manufacturing industry. Two
Sri Lankan varieties of rice, BW 267/3 and BW
367 were subjected to experiments in the
present study. Starches were isolated
following the alkali extraction method used by
Valgadde et al., 2015. The starches obtained
were characterized by their physical and
chemical properties. The results showed both
the rice varieties have favourable
physicochemical characteristics in their
starches as pharmaceutical excipients while
some modifications in the isolation and
storage procedures would rather enhance
those characteristics more precisely. This
knowledge of starch properties will be helpful
in explaining the behaviour of these starches
and selecting them as necessary when used as
pharmaceutical excipients.
Keywords: Rice varieties, Rice Starch,
Physicochemical properties, Pharmaceutical
excipient
Introduction:
According to the International Pharmaceutical
Excipient Council, “Excipient” is defined as
“Any substance other than active drug or
prodrug that is included in the manufacturing
process or is contained in finished
pharmaceutical dosage forms” (Hartesi et al.,
2016). In the pharmaceutical industry starch
is an important excipient that has been
commonly used because of its versatility and
cheapness (Muazu et al., 2012).
Rice (Oryza sativa L) is the staple food for
millions of people in Southeast Asia. The
climate and the fertile soil of Sri Lanka are
favorable for growing different types of rice
crops. Sri Lanka has about 730,000 ha
available land for rice cultivation. It is grown
under both irrigated and rain fed conditions in
the dry, intermediate, and wet zones.
Cultivation is done in two main cropping
seasons [Maha (October to March) and Yala
(April to August)], (Premasiri et al., 2016).
13th International Research Conference
General Sir John Kotelawala Defence University
Allied Health Sciences Sessions
135
Rice starch has commercial value in different
industries because of its smallest particle size
among commercial starches, whitest color and
neutral state such as in cosmetic and tableting
industries (Vithyashini and Wickramasinghe,
2016).
The whole pharmaceutical manufacturing in
Sri Lanka imports the total quantity of
starches that are required for manufacturing.
In general, the manufacturing of tablets and
capsules are higher due to its high
consumption. The importation cost could be
minimized resulting reduction of total
manufacturing cost if the manufactures can
obtain raw materials such as starch from the
most available sources in Sri Lanka. Because
some of the crops cultivated in Sri Lanka could
be used to extract excipients. Research studies
can be carried out to assess the suitability of
the extracted starches from such crops as
excipients. The priority must be given to those
with characteristics such as high availability,
cost-effectiveness and high yield of targeted
excipient. Rice (Oryza sativa) is a commonly
grown crop in Sri Lanka and rice starch is
already being used as an excipient in the
pharmaceutical industry (Rowe,2009). In Sri
Lanka, many varieties of rice are being grown
and the excipient properties of starches
extracted from those need to be studied to
confirm the most suitable variety. Therefore,
this study would focus on the evaluation of the
excipient properties of starch from two
modified Sri Lankan varieties of rice (BW
267/3 and BW 367) for oral dosage forms that
satisfy the aforesaid characteristics. Thus;
focusing on the attempt to make Sri Lanka self-
reliant and secure in healthcare.
Methodology:
Modified rice varieties of BW 267/3 and BW
367 were collected under the authentication
of Rice Research and Development Institute,
Bombuwala, Sri Lanka. The authentication
was also granted from National Herbarium,
Peradeniya, Sri Lanka.
The alkali starch extraction method described
in Valgadde et al., 2015 was used to isolate the
starch from rice grains. Starch identification
was done according to the method mentioned
in British Pharmacopoeia 2015. The texture,
colour, odour and taste of starch powders
were examined via sensory evaluations.
The starch yield of rice was calculated
according to the following equation.
dry weight of starch
Starch yield percentage of rice = dry weight of starch
weight of rice∗ 100%
pH values of the starches were determined
following the method in British
Pharmacopoeia, 2015.
Scanning Electron Microscopic images of
starches were obtained according to the
method described in Sainio (2011) by using a
Carl Zeiss EVO 18 Scan Electron Microscope
(SEM).
Particle size distribution was estimated by dry
sieving method described in British
Pharmacopoeia 2015 by allowing the powders
to pass through the nest of sieves.
Moisture contents of the dried starches were
calculated by using a moisture analyzer.
Proximate composition analysis of starch
samples was evaluated according to the
methods described in AOAC: Official Methods
of Analysis, 1990 and the purity of the starches
were calculated from the following equation
(Vasanthan, 2001
Percentage of starch purity = %carbohydrate
(100 −%moisture)∗ 100%
The methods used by Tuffor (2013) and
Mosisa (2014) were used to find the Amylose
contents of the two starch samples. The
swelling capacity of the starch powders was
determined by the method of Hasan et al.,
2015. The solubility of the starches was
calculated from the test carried out according
to Emenike et al., 2017.
To evaluate the True densities, the fluid
displacement method described in the
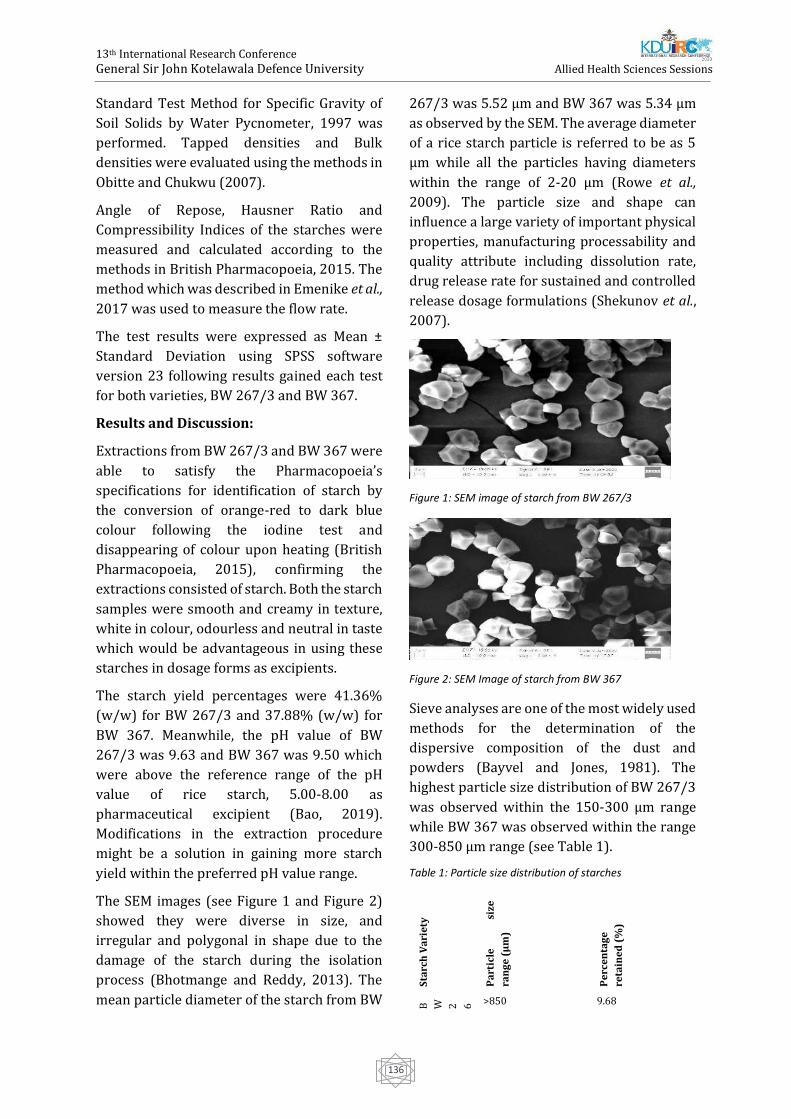
13th International Research Conference
General Sir John Kotelawala Defence University
Allied Health Sciences Sessions
136
Standard Test Method for Specific Gravity of
Soil Solids by Water Pycnometer, 1997 was
performed. Tapped densities and Bulk
densities were evaluated using the methods in
Obitte and Chukwu (2007).
Angle of Repose, Hausner Ratio and
Compressibility Indices of the starches were
measured and calculated according to the
methods in British Pharmacopoeia, 2015. The
method which was described in Emenike et al.,
2017 was used to measure the flow rate.
The test results were expressed as Mean ±
Standard Deviation using SPSS software
version 23 following results gained each test
for both varieties, BW 267/3 and BW 367.
Results and Discussion:
Extractions from BW 267/3 and BW 367 were
able to satisfy the Pharmacopoeia’s
specifications for identification of starch by
the conversion of orange-red to dark blue
colour following the iodine test and
disappearing of colour upon heating (British
Pharmacopoeia, 2015), confirming the
extractions consisted of starch. Both the starch
samples were smooth and creamy in texture,
white in colour, odourless and neutral in taste
which would be advantageous in using these
starches in dosage forms as excipients.
The starch yield percentages were 41.36%
(w/w) for BW 267/3 and 37.88% (w/w) for
BW 367. Meanwhile, the pH value of BW
267/3 was 9.63 and BW 367 was 9.50 which
were above the reference range of the pH
value of rice starch, 5.00-8.00 as
pharmaceutical excipient (Bao, 2019).
Modifications in the extraction procedure
might be a solution in gaining more starch
yield within the preferred pH value range.
The SEM images (see Figure 1 and Figure 2)
showed they were diverse in size, and
irregular and polygonal in shape due to the
damage of the starch during the isolation
process (Bhotmange and Reddy, 2013). The
mean particle diameter of the starch from BW
267/3 was 5.52 µm and BW 367 was 5.34 µm
as observed by the SEM. The average diameter
of a rice starch particle is referred to be as 5
µm while all the particles having diameters
within the range of 2-20 µm (Rowe et al.,
2009). The particle size and shape can
influence a large variety of important physical
properties, manufacturing processability and
quality attribute including dissolution rate,
drug release rate for sustained and controlled
release dosage formulations (Shekunov et al.,
2007).
Figure 1: SEM image of starch from BW 267/3
Figure 2: SEM Image of starch from BW 367
Sieve analyses are one of the most widely used
methods for the determination of the
dispersive composition of the dust and
powders (Bayvel and Jones, 1981). The
highest particle size distribution of BW 267/3
was observed within the 150-300 µm range
while BW 367 was observed within the range
300-850 µm range (see Table 1).
Table 1: Particle size distribution of starches
Sta
rch
Va
rie
ty
Pa
rtic
le
size
ran
ge
(µ
m)
Pe
rce
nta
ge
reta
ine
d (
%)
B W
2 6 7 / 3 >850 9.68
13th International Research Conference
General Sir John Kotelawala Defence University
Allied Health Sciences Sessions
137
300-850 31.84
150-300 45.56
<150 12.92
BW
36
7
>850 9.82
300-850 52.20
150-300 35.32
<150 2.66
All starches are hygroscopic in nature. They
absorb atmospheric moisture to reach
equilibrium humidity (Crouter and Briens,
2014). For many powders including starches,
moisture is known to modify the flow and
mechanical properties (Tester et al., 2004).
With compared to the recommended moisture
percentage (14%) of rice starch as
pharmaceutical excipients (Rowe et al., 2009),
moisture content percentages of 15.78%
(w/w) and 19.78% (w/w) were obtained
respectively for BW 267/3 and BW 367 were
higher. The quality of starches is adversely
affected by the high amount of moisture
content than the recommended level. The high
moisture content of starch is favorable for
molds to grow resulting in reduced shelf life.
The quantity of starch is also reduced and as a
result, the market value is also reduced as
there is a weight loss on drying. To produce
compacts with high tensile strength and low
friability, it is essential to have the moisture
contents of starches at optimum levels
(Staniforth, 1971). Improvements in the
starch drying process will help to lower the
moisture contents of the starches.
Devoid of other plant components such as
fibre, protein and lipid, a good starch material
for pharmaceutical application should contain
more than 96% (w/w) of starch and as much
as possible (Vasanthan, 2001). Along with the
results of proximate composition analysis and
moisture content, the purities of starches were
calculated as 97.73% (w/w) for BW 267/3 and
95.98% (w/w) for BW 367 which indicated
that they were good starch materials for
pharmaceutical applications.
Amylose content appears to be the major
factor controlling almost all physicochemical
properties of rice starch such as turbidity,
syneresis, freeze-thaw stability, pasting,
gelatinization, and retro degradation
properties (Wickramasinghe and Noda, 2008).
The amylose contents of BW 267/3 and BW
367 were estimated to be 9.5% and 46.0%
respectively. The higher the amylose content,
the lower is the swelling power and the
smaller is the gel strength for the same starch
concentration. To a certain extent, however, a
smaller swelling power due to high amylose
content can be counteracted by a larger
granule size and therefore expected to exert
stronger disintegrant action (Tuffour, 2013).
The swelling capacity of a material is the
ability of a material to absorb water and swell
up. Materials with high swelling power have
good disintegrating properties. Results
obtained from BW 267/3 and BW 367 were
27.40% (w/v) and 21.34% (w/v) respectively.
The results indicated that the swelling
capacity of BW 267/3 was faster than BW 367.
Both varieties were insoluble at the cold
water, hot water and ethanol (96%). British
Pharmacopoeia, 2015 reveals that rice starch
is insoluble in cold water and ethanol (96%).
One of the critical importance of powders to be
considered in the pharmaceutical dosage
forms is the ability of the powder to flow. The
flowability of powders is of immense
importance in the manufacture of
pharmaceutical tablets and capsules with the
correct amount of pharmaceutical active
ingredients (Staniforth, 1971). The
compendial methods available for the
measurement of powder flow are flow rate,
measurement of angle of repose, bulk density,
tapped density, true density, compressibility
index and Hausner ratio.
The test results for True density, Bulk density
and Tapped density are in the Table. When the
powder is free flowing the ratio of bulk density
over tapped density is small in value and when
the powder is poor in the flowability that value
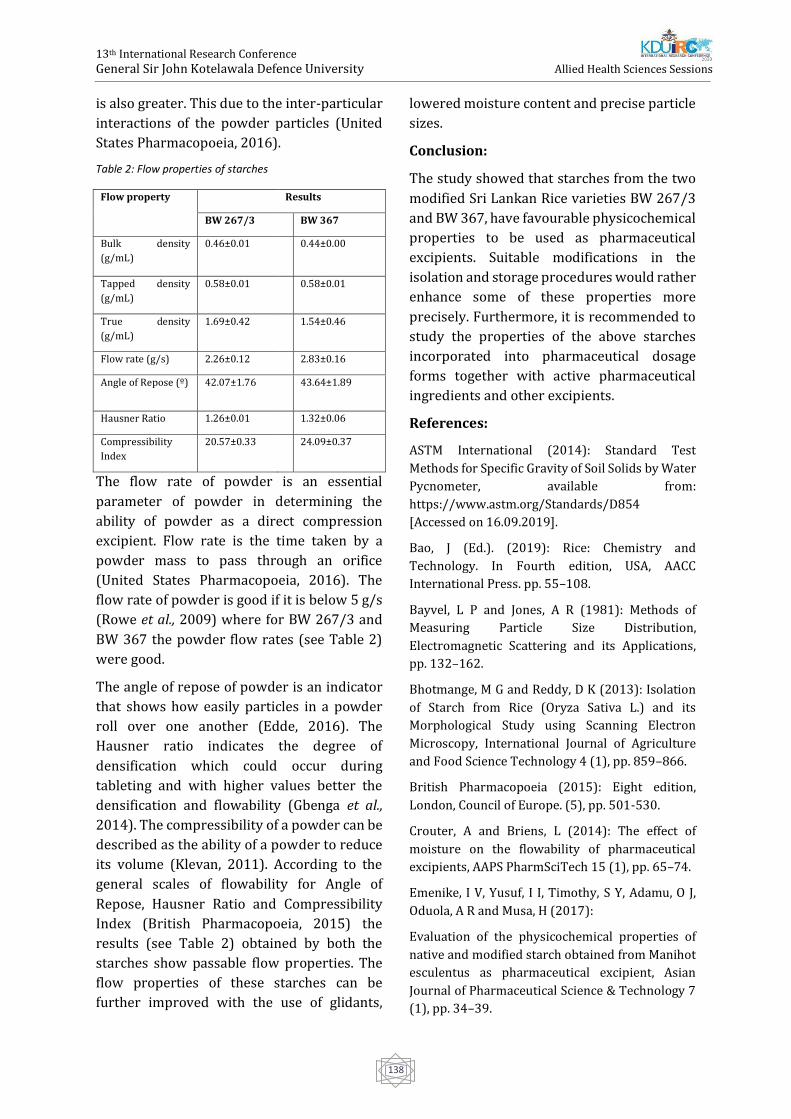
13th International Research Conference
General Sir John Kotelawala Defence University
Allied Health Sciences Sessions
138
is also greater. This due to the inter-particular
interactions of the powder particles (United
States Pharmacopoeia, 2016).
Table 2: Flow properties of starches
Flow property Results
BW 267/3 BW 367
Bulk density
(g/mL)
0.46±0.01 0.44±0.00
Tapped density
(g/mL)
0.58±0.01 0.58±0.01
True density
(g/mL)
1.69±0.42 1.54±0.46
Flow rate (g/s) 2.26±0.12 2.83±0.16
Angle of Repose (º) 42.07±1.76 43.64±1.89
Hausner Ratio 1.26±0.01 1.32±0.06
Compressibility
Index
20.57±0.33 24.09±0.37
The flow rate of powder is an essential
parameter of powder in determining the
ability of powder as a direct compression
excipient. Flow rate is the time taken by a
powder mass to pass through an orifice
(United States Pharmacopoeia, 2016). The
flow rate of powder is good if it is below 5 g/s
(Rowe et al., 2009) where for BW 267/3 and
BW 367 the powder flow rates (see Table 2)
were good.
The angle of repose of powder is an indicator
that shows how easily particles in a powder
roll over one another (Edde, 2016). The
Hausner ratio indicates the degree of
densification which could occur during
tableting and with higher values better the
densification and flowability (Gbenga et al.,
2014). The compressibility of a powder can be
described as the ability of a powder to reduce
its volume (Klevan, 2011). According to the
general scales of flowability for Angle of
Repose, Hausner Ratio and Compressibility
Index (British Pharmacopoeia, 2015) the
results (see Table 2) obtained by both the
starches show passable flow properties. The
flow properties of these starches can be
further improved with the use of glidants,
lowered moisture content and precise particle
sizes.
Conclusion:
The study showed that starches from the two
modified Sri Lankan Rice varieties BW 267/3
and BW 367, have favourable physicochemical
properties to be used as pharmaceutical
excipients. Suitable modifications in the
isolation and storage procedures would rather
enhance some of these properties more
precisely. Furthermore, it is recommended to
study the properties of the above starches
incorporated into pharmaceutical dosage
forms together with active pharmaceutical
ingredients and other excipients.
References:
ASTM International (2014): Standard Test
Methods for Specific Gravity of Soil Solids by Water
Pycnometer, available from:
https://www.astm.org/Standards/D854
[Accessed on 16.09.2019].
Bao, J (Ed.). (2019): Rice: Chemistry and
Technology. In Fourth edition, USA, AACC
International Press. pp. 55–108.
Bayvel, L P and Jones, A R (1981): Methods of
Measuring Particle Size Distribution,
Electromagnetic Scattering and its Applications,
pp. 132–162.
Bhotmange, M G and Reddy, D K (2013): Isolation
of Starch from Rice (Oryza Sativa L.) and its
Morphological Study using Scanning Electron
Microscopy, International Journal of Agriculture
and Food Science Technology 4 (1), pp. 859–866.
British Pharmacopoeia (2015): Eight edition,
London, Council of Europe. (5), pp. 501-530.
Crouter, A and Briens, L (2014): The effect of
moisture on the flowability of pharmaceutical
excipients, AAPS PharmSciTech 15 (1), pp. 65–74.
Emenike, I V, Yusuf, I I, Timothy, S Y, Adamu, O J,
Oduola, A R and Musa, H (2017):
Evaluation of the physicochemical properties of
native and modified starch obtained from Manihot
esculentus as pharmaceutical excipient, Asian
Journal of Pharmaceutical Science & Technology 7
(1), pp. 34–39.
13th International Research Conference
General Sir John Kotelawala Defence University
Allied Health Sciences Sessions
139
Gbenga, B L, Olakunle, O and Adedayo, A M (2014):
Influence of pregelatinization on the
physicochemical and compressional
characteristics of starches obtained from two local
varieties of Dioscorea rotundata, IOSR Journal of
Pharmacy (IOSR-PHR) 4 (6), pp. 24–32.
Hartesi, B, Sriwidodo, Abdassah, M and
Chaerunisaa, A Y (2016): Starch as pharmaceutical
excipient, International Journal of Pharmaceutical
Sciences Review and Research 41 (2), pp. 59–64.
Hasan, M M, Rana, M S, Uddin, N, Rahman, K J and
Chowdhury, S S (2015): Comparative Evaluation of
Solanum tuberosum L. and Manihot esculenta
Starch as Pharmaceutical Excipients: Assessment
by Preformulation Studies, Bangladesh
Pharmaceutical Journal 17 (2), pp. 128–134.
Helrich K (Ed.). (1990): Official Methods of
Analysis: Association of Official Analytical
Chemists. In Fifteenth edition, USA, Association of
Analytical Chemists, Inc. pp. 380-384, 788,789.
Klevan, I (2011): Compression Analysis of
Pharmaceutical Powders: Assessment of
Mechanical Properties and Tablet
Manufacturability Prediction, PhD Thesis,
University of Tromso, Norway.
Mosisa, B (2014): Isolation, Physicochemical
Characterization and Evaluation of Triticum
Decocum Starch as Binder and Disintegrant in
Paracetamol Tablets, Master’s Thesis, School of
pharmacy, Department of Pharmaceutics and
Social Pharmacy, Addis Ababa University, Addis
Ababa, Ethiopia.
Muazu, J, Girbo, A, Usman, A and Mohammed, G T
(2012): Preliminary studies on Hausa potato
starch I: The disintegrant properties, Journal of
Pharmaceutical Science and Technology 4 (3), pp.
883–891.
Obitte, N and Chukwu, A (2007): Preliminary
Studies on Tacca Involucrata (Schum & Thonn)
Starch. FAM: Taccaceae, West African Journal of
Pharmacy, pp. 2–3.
Premasiri, R, Weerasinghe, A, Fernando, P and
Gunarathna, P (2016): Use of high accuracy GPS for
soil geochemical mapping in paddy fields; A case
study in Kalutara, Sri Lanka. 37th Asian Conference
on Remote Sensing 2016, 1 May 2017. pp. 384–392.
Rowe, R C, Sheskey, P J and Quinn, M E (Eds.).
(2009): Handbook of Pharmaceutical Excipients. In
Sixth edition, UK, RPS publishing, Pharmaceutical
Press. pp. 685-690.
Sainio, J A (2011): Characterization and Evaluation
of Melibiose as Novel Excipient in Tablet
Compaction, Master’s Thesis, Division of
Pharmaceutical Technology, Faculty of pharmacy,
University of Helsinki, Finland.
Shekunov, B Y, Chattopadhyay P, Tong H H Y and
Chow A H L (2007): Particle size analysis in
pharmaceutics: Principles, methods and
applications, Pharmaceutical Research 24 (2), pp.
203–227.
Staniforth J (1971): Powder flow. In Aulton, M E
(Ed.), Pharmaceutics: The Science of Dosage Form
Design. Second edition, USA, Churchill Livingstone.
pp. 197-210.
Tester, R F, Karkalas, J and Qi, X (2004): Starch-
composition, fine structure and architecture,
Journal of Cereal Science 39 (2), pp. 151–165.
Tuffour, E (2013): Evaluation of starch from
ghanaian sweet potato varieties as excipients for
solid oral dosage forms, MPhil Thesis, Department
of Pharmaceutics, Kwame Nkrumah University of
Science and Technology, Ghana.
United States Pharmacopoeia (2016): Powder
Flow. Stage 6 Harmonization. 30 (60) (6), pp. 7.
Valgadde, P S, Wankhade, V and Sahoo D A K
(2015): Isolation of Starch from the Brokens of
Sona Masuri Rice (Oryza Sativa L.), International
Journal of Engineering Research and Technology 4
(9), pp. 467–469.
Vasanthan, T (2001): Overview of Laboratory
Isolation of Starch from Plant Materials. Current
Protocols in Food Analytical Chemistry 0(1), pp.
E2.1.1-E2.1.1.6.
Vithyashini, L and Wickramasinghe, H A M (2016):
Genetic diversity of seed storage proteins of rice
(Oryza sativa L.) varieties in Sri Lanka, Tropical
Agricultural Research 27 (1), pp. 49.
Wickramasinghe, H A M and Noda, T (2008): Physicochemical Properties of Starches from Sri

13th International Research Conference
General Sir John Kotelawala Defence University
Allied Health Sciences Sessions
140
Lankan Rice Varieties, Food Science and Technology Research 14 (1), pp. 49-54.
13th International Research Conference
General Sir John Kotelawala Defence University
Allied Health Sciences Sessions
141
Health Related Quality of Life among Patients with Chronic Kidney
Disease in Sri Lanka; a Review
KIP Prabani1#, HDWT Damayanthi1, H Takahashi2, U Shimizu3
1Faculty of Allied Health Sciences, University of Peradeniya, Sri Lanka 2School of Health Sciences, Faculty of Medicine, Niigata University, Japan.
3Graduate School of health sciences, Niigata University, Japan
Abstract: Chronic Kidney Disease (CKD) gives
a considerable burden to the Sri Lankan health
care delivery system. Prevalence of CKD rise
due to the high prevalence of non-
communicable diseases and unknown
aetiologies. Health Related Quality of Life
(HRQOL) reduced with the initiation and
progression of the disease. Many factors
significantly influenced HRQOL of CKD
patients. This study reviews the state of
HRQOL among Sri Lankan CKD patients and
factors associated with the HRQOL. The search
was done via PubMed, CINAHL, Web of
Science, and Google Scholar according to the
predefined criteria. Selected articles were
reviewed and extracted the data which were
relevant to the study. Extracted data were
entered into the summary table and organized
according to the research objectives. Seven
articles selected for the final analysis. All the
studies were cross-sectional studies. Sample
size range from 120 to 1174. Haemoglobin
level, being employed, high education level,
and advanced stages of CKD were identified as
factors that positively influenced HRQOL in
CKD patients. Depression, psychological
distress, symptom burden, and age negatively
influenced on HRQOL. Depression and
psychological distress are common among Sri
Lankan patients with CKD. Impaired social
support, perception of low social support,
economic burden, high out pocket
expenditure, unemployment are the main
causes for the depression and psychological
distress among patients with CKD in Sri Lanka.
Health care professionals need to pay more
attention on HRQOL and factors associated
with HRQOL among patients CKD.
Keywords: Chronic Kidney Disease, Quality of
life, Health related Quality of Life, Sri Lanka
Introduction:
Chronic kidney disease (CKD) is a global
health burden and it affects the physical,
psychological cultural, and socio-economic
status of the current global population (S.
Senanayake, Gunawardena, Palihawadana,
Bandara, et al., 2017) with many adverse
events such as CVD and death (Levey et al.,
2005). chronic kidney disease is one of the
major suffering problem in Sri Lanka in the
present time due to chronic kidney disease
unknown etiology(CKDu) (Rajapakse,
Shivanthan and Selvarajah, 2016;
Wimalawansa, 2016). With the time,
prevalence of non- communicable diseases
such as hypertension and diabetes mellitus
are increasing and those are the other causes
for rising CKD in Sri Lanka (Rajapakse,
Shivanthan, and Selvarajah, 2016). CKDu is
prominent in north-central province in Sri
Lanka and most of the affected individuals are
farmers, agricultural field workers, or people
who live around the agricultural area
(Wimalawansa, 2016). In some Districts,
CKDu prevalence is 15.1%-22.9%; especially
in rural Dry zones of Sri Lanka (Rajapakse,
Shivanthan and Selvarajah, 2016). CKD
classified according to the estimated
Glomerular Filtration Rate (eGFR): Stage 1;
renal damage with normal or high eGFR:
>90ml/min/1.73m2, Stage 2; renal damage
13th International Research Conference
General Sir John Kotelawala Defence University
Allied Health Sciences Sessions
142
with mild reduced eGFR: 60-
89ml/min/1.73m2, Stage 3; moderately
reduced eGFR: 30- 59ml/min/1.73m2, Stage 4;
severely impaired eGFR: 15-
29ml/min/1.73m2, Stage 5; renal failure: <15
ml/min/1.73m2 or with dialysis (Levey et al.,
2005). Stage one accompanied with perceived
glomerular filtration rate and protein urea and
end stage renal disease accompanied with
impaired or absence urine filtration and entire
renal sclerosis, interstitial fibrosis, and
interstitial inflammation with high protein
urea. Most of the people who are affected with
renal disease identified at the end stage/ End
Stage Renal Disease (ESRD) (Rajapakse,
Shivanthan and Selvarajah, 2016). CKD
patients experience reduced life expectancy
and patients who progress to ESRD (End Stage
Renal Disease) reduced their life expectance
20 times compared to the age and sex matched
individuals with ordinal kidney function
(Liyanage et al., 2017). Diabetes mellitus type
II and chronic hypertension associated with
chronic kidney disease record all over the
country
Health-related quality of life (HRQOL) is a
subjective indicator of an individual’s health
status which depends on beliefs, experiences,
perceptions, expectations, present health
status, and their influences on the enjoyment
of life (Khatib et al., 2018). Physical,
psychological, and lifestyle disturbances along
with physical and emotional symptoms
directly affect on HRQOL among patients with
renal replacement therapy (Unruh, Weisbord
and Kimmel, 2005). Identification of HRQOL
status and factors associated with HRQOL are
important because it is a tool to improve
clinical care and it provide information for
clinical decision making (Unruh, Weisbord
and Kimmel, 2005). Generic and disease-
specific tools can be used to measure HRQOL.
SF 36, WHOQOL BREF, and EQ 5D/EQ 5D
3L/EQ 5D 5L are generic tools and KDQOL is a
disease specific tool to measure HRQOL
among patients with CKD.
This study aims to review the quality of life
among CKD patients in Sri Lanka and factors
associated with their HRQOL. Sri Lanka is a
middle-income country and the burden of CKD
is considerable with the increased CKD
affected population.
Methods:
Inclusion criteria;
Original studies published in English and
examine QOL through the standard validated
instrument (SF 36, EQ 5D 5L/EQ 5D 3L or
KDQOL/KDQOL-SF, WHOQOL BREF have to be
used in each study to assess HRQOL) in
diagnosed patients with CKD.
Participants’ age more than 18 years old.
The geographical location of the study: studies
should be done in Sri Lanka.
Published year: after 2000
Exclusion criteria;
Study design; qualitative studies, case reports,
personal opinions, conference presentations,
books, review articles.
Studies with insufficient data and
incomprehensive methodology.
Search strategy;
Original English publications were searched
via: PubMed, CINAHL, Web of science, and
google scholar. Keywords were quality of life,
chronic kidney disease, CKD, Sri Lanka, End
Stage Renal Disease, Health related quality of
life. Keywords were combined through
Boolean operators (“and”, “or”). The search
was limited to the studies published after
2000. Reference lists and citations of the
identified articles were reviewed for
additional resources.
Evaluation and data extraction
Identified study abstracts were screen two
times to confirm incompatibility with the
study. Eleven articles were selected for final
review. From that, 4 studies were excluded;
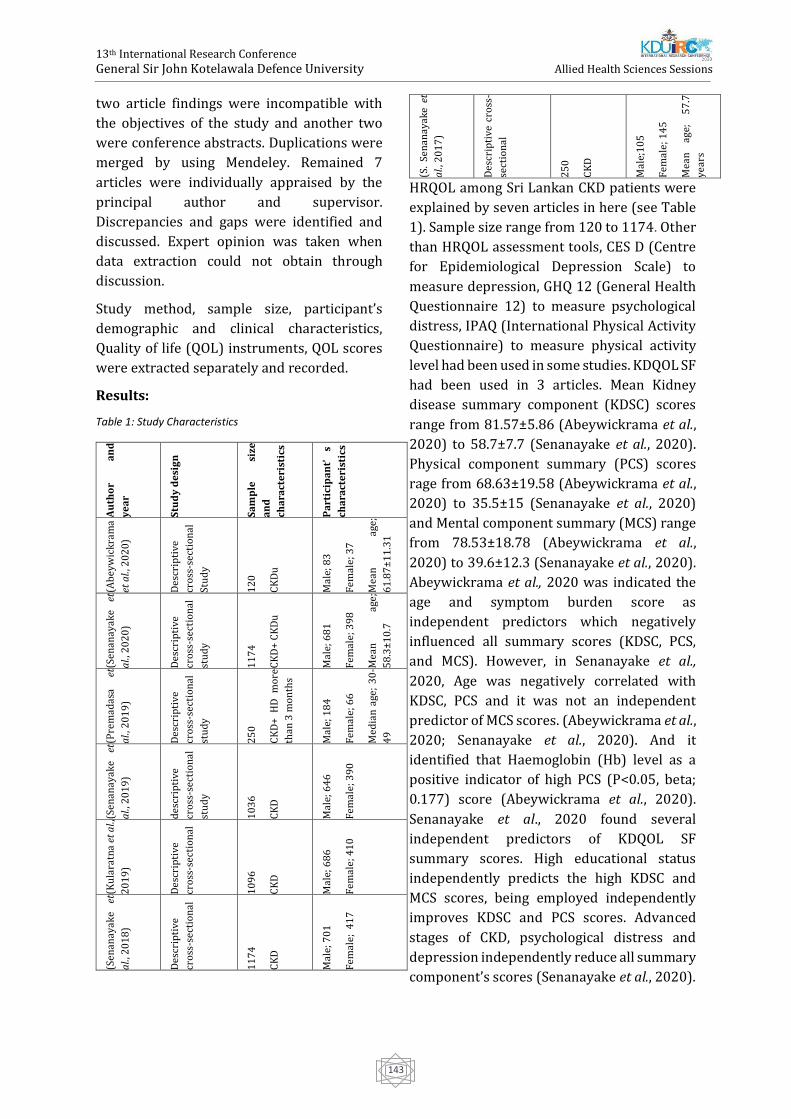
13th International Research Conference
General Sir John Kotelawala Defence University
Allied Health Sciences Sessions
143
two article findings were incompatible with
the objectives of the study and another two
were conference abstracts. Duplications were
merged by using Mendeley. Remained 7
articles were individually appraised by the
principal author and supervisor.
Discrepancies and gaps were identified and
discussed. Expert opinion was taken when
data extraction could not obtain through
discussion.
Study method, sample size, participant’s
demographic and clinical characteristics,
Quality of life (QOL) instruments, QOL scores
were extracted separately and recorded.
Results:
Table 1: Study Characteristics
Au
tho
r a
nd
ye
ar
Stu
dy
de
sig
n
Sa
mp
le
size
an
d
cha
ract
eri
stic
s
Pa
rtic
ipa
nt’
s
cha
ract
eri
stic
s
(Ab
eyw
ick
ram
a
et a
l., 2
02
0)
Des
crip
tive
cro
ss-s
ecti
on
al
Stu
dy
12
0
CK
Du
Mal
e; 8
3
Fem
ale;
37
Mea
n
age;
61
.87
±1
1.3
1
93
.3%
en
gage
in
farm
ing
(Sen
anay
ake
et
al.,
20
20
)
Des
crip
tive
cro
ss-s
ecti
on
al
stu
dy
11
74
CK
D+
CK
Du
Mal
e; 6
81
Fem
ale;
39
8
Mea
n
age;
58
.3±
10
.7
(Pre
mad
asa
et
al.,
20
19
)
Des
crip
tive
cro
ss-s
ecti
on
al
stu
dy
25
0
CK
D+
HD
m
ore
than
3 m
on
ths
Mal
e; 1
84
Fem
ale;
66
Med
ian
age
; 3
0-
49
(Sen
anay
ake
et
al.,
20
19
)
des
crip
tive
cro
ss-s
ecti
on
al
stu
dy
10
36
CK
D
Mal
e; 6
46
Fem
ale;
39
0
(Ku
lara
tna
et a
l.,
20
19
)
Des
crip
tive
cro
ss-s
ecti
on
al
10
96
CK
D
Mal
e; 6
86
Fem
ale;
41
0
(Sen
anay
ake
et
al.,
20
18
)
Des
crip
tive
cro
ss-s
ecti
on
al
11
74
CK
D
Mal
e; 7
01
Fem
ale;
41
7
(S.
Sen
anay
ake
et
al.,
20
17
)
Des
crip
tive
cro
ss-
sect
ion
al
25
0
CK
D
Mal
e;1
05
Fem
ale;
14
5
Mea
n
age;
5
7.7
year
s
HRQOL among Sri Lankan CKD patients were
explained by seven articles in here (see Table
1). Sample size range from 120 to 1174. Other
than HRQOL assessment tools, CES D (Centre
for Epidemiological Depression Scale) to
measure depression, GHQ 12 (General Health
Questionnaire 12) to measure psychological
distress, IPAQ (International Physical Activity
Questionnaire) to measure physical activity
level had been used in some studies. KDQOL SF
had been used in 3 articles. Mean Kidney
disease summary component (KDSC) scores
range from 81.57±5.86 (Abeywickrama et al.,
2020) to 58.7±7.7 (Senanayake et al., 2020).
Physical component summary (PCS) scores
rage from 68.63±19.58 (Abeywickrama et al.,
2020) to 35.5±15 (Senanayake et al., 2020)
and Mental component summary (MCS) range
from 78.53±18.78 (Abeywickrama et al.,
2020) to 39.6±12.3 (Senanayake et al., 2020).
Abeywickrama et al., 2020 was indicated the
age and symptom burden score as
independent predictors which negatively
influenced all summary scores (KDSC, PCS,
and MCS). However, in Senanayake et al.,
2020, Age was negatively correlated with
KDSC, PCS and it was not an independent
predictor of MCS scores. (Abeywickrama et al.,
2020; Senanayake et al., 2020). And it
identified that Haemoglobin (Hb) level as a
positive indicator of high PCS (P<0.05, beta;
0.177) score (Abeywickrama et al., 2020).
Senanayake et al., 2020 found several
independent predictors of KDQOL SF
summary scores. High educational status
independently predicts the high KDSC and
MCS scores, being employed independently
improves KDSC and PCS scores. Advanced
stages of CKD, psychological distress and
depression independently reduce all summary
component’s scores (Senanayake et al., 2020).
13th International Research Conference
General Sir John Kotelawala Defence University
Allied Health Sciences Sessions
144
Senanayake et al., 2019 assessed the
relationship between HRQOL, depression, and
the psychological distress of patients with
CKD. EQ 5D 3L index score, Visual analogue
scale (VAS), PCS, and MCS score values were
significantly different between patients with
and without depression (P<0.001). And the
same findings were noted for the patients with
and without psychological distress (P<0.001)
(Senanayake et al., 2019). Senanayake et al.,
2018 indicated that KDSC, PCS, and MCS were
negatively correlated with depression;
Spearman correlations were r;-0.544, r;-
0.285, r; -0.339 respectively, and the
relationship was statistically significant
(P<0.001). Also, KDSC PCS and MCS were
negatively significant with psychological
distress; Spearman correlations were
respectively r; 0.373, r; -0.383, r;-0.373
(P<0.001) (Senanayake et al., 2018). In
Senanayake et al., 2017, KDSC's highest score
was reported in hospital staff encouragement
while the lowest score was reported in the
work status. In PCS, the highest was physical
functioning and the lowest was role physical.
In MCS, the highest was social functioning and
the lowest was role emotional (S. Senanayake,
Gunawardena, Palihawadana, Kularatna, et al.,
2017). Premadasa et al., 2019 indicated that
the majority of the HD population report their
overall perception on QOL as “neither poor
nor good” (54%), only 2.4% were reported as
“very good”. And this study revealed that
education level, average monthly income were
significant with overall QOL which were
identified as independent predictors of
HRQOL in the previous study (Senanayake et
al., 2020). And HD duration also significant
with overall QOL among chronic
haemodialysis patients (Premadasa et al.,
2019).
Discussion:
Several factors which effect on Health-Related
Quality of Life have been identified through
the subjective articles. Health interventions
and support systems can target factors effect
on HRQOL to improve the HRQOL of the CKD
patients. It’s a known phenomenon, HRQOL of
the CKD patients were lowers than the general
population and related factors aid on the
improvement or reduction of QOL. Therefore,
health professionals can make decisions based
on factors that influenced HRQOL in CKD
patients.
Depression and psychological distress are the
most common psychological disorders among
the CKD population (Sumanathissa, De Silva,
and Hanwella, 2011). It is negatively
associated with HRQOL of the affected
individuals (Senanayake, 2016; Senanayake et
al., 2018) and there are many factors
associated with depression and psychological
distress among patients with CKD in Sri Lanka.
The mode of renal replacement therapy is a
factor that affects an individual’s depression
level. Patients who are undergoing dialysis
have been reported higher depression status
compared to the patients without dialysis.
Some studies indicated that depression was
prominent among HD patients than the PD
(Chilcot et al., 2008; Ozcan et al., 2015;
Hiramatsu et al., 2019) and transplant
patients were reported the lowest depression
score (Ozcan et al., 2015). Indian study
indicated, age below 60, absence of treatment
funding, education less than grade 12,
monthly income, CKD stage, patient on
haemodialysis and associated comorbidities
more than 3 were associated with higher
depression scores. In Sri Lanka, several
studies had been done to assess depression
and psychological distress among CKD
patients. Poor social support, low satisfaction
with social support received, within one year
of diagnosis, low monthly income, high out
pocket expenditure, being a female,
unemployment has a positive relationship
with distress (Hettiarachchi and Abeysena,
2018; Senanayake et al., 2018). Female sex,
unemployment, being dialysed, advanced age,
and presence of comorbidities are positively
significant with depression (Senanayake et al.,
13th International Research Conference
General Sir John Kotelawala Defence University
Allied Health Sciences Sessions
145
2018). But another study indicated that the
age, gender, income, employment status, and
education were not significant with
depression and the patient’s understanding of
prognosis is the only significant associated
factor that affects depression among CKD
patients (Sumanathissa, De Silva and
Hanwella, 2011). Factors associated with
depression and distress can be directly or
indirectly associated with HRQOL among CKD
individuals as there is a negative correlation
between HRQOL vs depression and
psychological distress. In Sri Lanka, most of
the affected people are male farmers and with
the disease progression, they have low
monthly income and high out pocket
expenditure. Most of the affected people
engaged in the earning process and with the
disease they cannot engage with their jobs as
usual. In Sri Lanka, out pocket expenditure for
each dialysis episode in a government hospital
is Rs 595 (415-995) and for the
transportation, they have to pay Rs. 320 (IQR
320-500) per one episode. Patients have to go
2 or 3 times per week for dialysis.
Transportation expenses are considerable (S.
J. Senanayake et al., 2017). Therefore, the
government has to pay much attention to
initiate a well-designed insurance system and
patients should be released from
transportation expenses, and a well-improved
transportation system should be established
for Sri Lankan CKD patients. Having an
occupation is positively correlated with
HRQOL (Blake et al., 2000; Tamura et al.,
2018) and unemployment was significantly
reduced the HRQOL (Lopes et al., 2007).
Having an occupation improves of economic
stability of affected individuals and it
improves physical functioning.
Conclusion:
This study aimed to identify the state of
HRQOL among patients with CKD and Factors
associated with their HRQOL. HRQOL is
subjective in nature and various prominent
factors were identified in this review.
Psychological burden is a considerable issue
among patients with CKD as they experience
many psychological symptoms. Many factors
seems to be associated with depression and
distress and those were directly or indirectly
associated with HRQOL. Especially,
Educational level, monthly income are
associated with HRQOL among patients with
CKD in Sri Lanka. Interventions need to be
planed based on research evidence to improve
HRQOL.
The identified factors that have an effect on
HRQOL seems to be interrelated. When
improving HRQOL, health professionals
should follow a holistic approach. It reduces
the socio-economic and public health burden
due to chronic kidney disease.
References:
Abeywickrama, H.M., Wimalasiri, S., Koyama, Y.,
Uchiyama, M., Shimizu, U., Kakihara, N.,
Chandrajith, R. and Nanayakkara, N., 2020. Quality
of Life and Symptom Burden among Chronic
Kidney Disease of Uncertain Etiology (CKDu)
Patients in Girandurukotte, Sri
Lanka. International Journal of Environmental
Research and Public Health, 17(11), p.4041.
Blake, C., Codd, M.B., Cassidy, A. and O'Meara, Y.M.,
2000. Physical function, employment and quality of
life in end-stage renal disease. Journal of
nephrology, 13(2), pp.142-149.
Chilcot, J., Wellsted, D., Da Silva-Gane, M. and
Farrington, K., 2008. Depression on
dialysis. Nephron Clinical Practice, 108(4),
pp.c256-c264.
Hettiarachchi, R. and Abeysena, C., 2018.
Association of poor social support and financial
insecurity with psychological distress of chronic
kidney disease patients attending national
nephrology unit in Sri Lanka. International journal
of nephrology, 2018.
Hiramatsu, T., Okumura, S., Asano, Y., Mabuchi, M.,
Iguchi, D. and Furuta, S., 2020. Quality of life and
emotional distress in peritoneal dialysis and
hemodialysis patients. Therapeutic Apheresis and
Dialysis, 24(4), pp.366-372.
13th International Research Conference
General Sir John Kotelawala Defence University
Allied Health Sciences Sessions
146
Khatib, S.T., Hemadneh, M.K., Hasan, S.A., Khazneh,
E. and Sa’ed, H.Z., 2018. Quality of life in
hemodialysis diabetic patients: a multicenter
cross-sectional study from Palestine. BMC
nephrology, 19(1), p.49.
Kularatna, S., Senanayake, S., Gunawardena, N. and
Graves, N., 2019. Comparison of the EQ-5D 3L and
the SF-6D (SF-36) contemporaneous utility scores
in patients with chronic kidney disease in Sri
Lanka: a cross-sectional survey. BMJ open, 9(2),
p.e024854.
Liyanage, T, Ninomiya, T, Perkovic, V, Woodward,
M, Stirnadel-Farrant, H, Matsushita, K, Iseki, K,
Seong, HL, Monaghan, H & Jha, V 2017, 'Chronic
kidney disease in Asia: Protocol for a collaborative
overview', Nephrology, vol. 22, no. 6, pp. 456-462.
Lopes, A.A., Bragg-Gresham, J.L., Goodkin, D.A.,
Fukuhara, S., Mapes, D.L., Young, E.W., Gillespie,
B.W., Akizawa, T., Greenwood, R.N., Andreucci, V.E.
and Akiba, T., 2007. Factors associated with health-
related quality of life among hemodialysis patients
in the DOPPS. Quality of life research, 16(4), p.545.
Moe, S., Drueke, T., Cunningham, J., Goodman, W.,
Martin, K., Olgaard, K., Ott, S., Sprague, S., Lameire,
N. and Eknoyan, G., 2005. Kidney disease:
Improving global outcomes (kdigo). definition and
classification of chronic kidney disease: a position
statement from kidney disease: Improving global
outcomes (kdigo). Kidney Int, 67, pp.2089-2100.
Ozcan, H., Yucel, A., Avşar, U.Z., Çankaya, E., Yucel,
N., Gözübüyük, H., Eren, F., Keles, M. and Aydınlı, B.,
2015, June. Kidney transplantation is superior to
hemodialysis and peritoneal dialysis in terms of
cognitive function, anxiety, and depression
symptoms in chronic kidney disease.
In Transplantation proceedings (Vol. 47, No. 5, pp.
1348-1351). Elsevier.
Premadasa, M.A.S.S., Hulangamuwa, H.G.I.M.,
Wijesooriya, W.A.D.H. and Amarasekara, T.D.,
2019. Quality of Life Among Patients With Chronic
Kidney Disease Who are Undergoing
Haemodialysis at Two Selected Teaching Hospitals
in Sri Lanka. OUSL Journal, 14(2).
Rajapakse, S., Shivanthan, M.C. and Selvarajah, M.,
2016. Chronic kidney disease of unknown etiology
in Sri Lanka. International journal of occupational
and environmental health, 22(3), pp.259-264.
Senanayake, S., Gunawardena, N., Palihawadana, P.,
Bandara, P., Haniffa, R., Karunarathna, R. and
Kumara, P., 2017. Symptom burden in chronic
kidney disease; a population based cross sectional
study. BMC nephrology, 18(1), p.228.
Senanayake, S., Gunawardena, N., Palihawadana, P.,
Kularatna, S. and Peiris, T.S.G., 2017. Validity and
reliability of the Sri Lankan version of the kidney
disease quality of life questionnaire (KDQOL-
SF™). Health and quality of life outcomes, 15(1),
p.119.
Senanayake, S., Gunawardena, N., Palihawadana, P.,
Senanayake, S., Karunarathna, R., Kumara, P. and
Kularatna, S., 2020. Health related quality of life in
chronic kidney disease; a descriptive study in a
rural Sri Lankan community affected by chronic
kidney disease. Health and quality of life
outcomes, 18, pp.1-9.
Senanayake, S., Gunawardena, N., Palihawadana, P.,
Suraweera, C., Karunarathna, R. and Kumara, P.,
2018. Depression and psychological distress in
patients with chronic renal failure: Prevalence and
associated factors in a rural district in Sri
Lanka. Journal of psychosomatic research, 112,
pp.25-31.
Senanayake, S., Mahesh, P.K.B., Gunawardena, N.,
Graves, N. and Kularatna, S., 2019. Validity and
internal consistency of EQ-5D-3L quality of life tool
among pre-dialysis patients with chronic kidney
disease in Sri Lanka, a lower middle-income
country. PloS one, 14(6), p.e0211604.
Senanayake, S.J., 2016. Health status, quality of life
and household cost of CKD patients living in
Anuradhapura.doi.10.13140/RG.2.2.32599.11682
Senanayake, S.J., Gunawardena, N.S., Palihawadana,
P., Bandara, S., Bandara, P., Ranasinghe, A.U.,
Karunarathna, R.H. and Kumara, G.P., 2017. Out-of-
pocket expenditure in accessing healthcare
services among Chronic Kidney Disease patients in
Anuradhapura District. Ceylon Medical
Journal, 62(2), pp.100-103.
Sumanathissa, M., De Silva, V.A. and Hanwella, R.,
2011. Prevalence of major depressive episode
among patients with pre-dialysis chronic kidney
disease. The International Journal of Psychiatry in
Medicine, 41(1), pp.47-56.
Tamura, Y., Urawa, A., Watanabe, S., Hasegawa, T.,
Ogura, T., Nishikawa, K., Sugimura, Y., Komori, T.
13th International Research Conference
General Sir John Kotelawala Defence University
Allied Health Sciences Sessions
147
and Okada, M., 2018, October. Mood status and
quality of life in kidney recipients after
transplantation. In Transplantation
proceedings (Vol. 50, No. 8, pp. 2521-2525).
Elsevier.
Unruh, M.L., Weisbord, S.D. and Kimmel, P.L., 2005,
March. Psychosocial factors in patients with
chronic kidney disease: Health‐related quality of
life in nephrology research and clinical practice.
In Seminars in dialysis (Vol. 18, No. 2, pp. 82-90).
Oxford, UK: Blackwell Science Inc.
Wimalawansa, S.J., 2016. The role of ions, heavy
metals, fluoride, and agrochemicals: critical
evaluation of potential aetiological factors of
chronic kidney disease of multifactorial origin
(CKDmfo/CKDu) and recommendations for its
eradication. Environmental geochemistry and
health, 38(3), pp.639-678.
13th International Research Conference
General Sir John Kotelawala Defence University
Allied Health Sciences Sessions
148
Knowledge And Practices Regarding Open-System Endotracheal
Suctioning Among Intensive Care Unit Nurses At The National Hospital
Of Sri Lanka
BPRW Balasooriya1# and SMKS Seneviratne2
1Teaching Hospital, Kurunegala, Sri Lanka 2Faculty of Allied Health Sciences, University of Sri Jayewardenepura, Sri Lanka
Abstracts: Open-system endotracheal
suctioning (OS-ETS) is performed on critically
ill requiring mechanical ventilation to keep the
airway patent. Intensive care unit (ICU) nurses
need to perform this procedure ensuring
patient safety while taking measures to
prevent ventilator associated pneumonia. This
study aimed at assessing knowledge and
practices of ICU nurses regarding OS-ETS. In
phase I, a descriptive cross-sectional survey
was carried out to assess knowledge
regarding OS-ETS among a convenience
sample of 150 ICU nurses from the National
Hospital of Sri Lanka using a pre-tested self-
administered questionnaire. In phase II, a
subsample of 50 ICU nurses who participated
in the survey were observed while performing
OS-ETS by two trained independent raters
using a pre-tested previously validated
structured 20 item check list. Data were
analyzed using SPSS version 21. Mean overall
knowledge score was 57.93 ± 12.81, while the
mean overall practice score was 63.70 ± 7.81.
Participants had good knowledge on
indications, suction catheter selection criteria,
infection control practices, hyperoxygenation,
suction pressure selection and post suction
practices. Poor knowledge was evident
regarding contraindications, hazards/
complications, patient positioning and
suctioning techniques. Good practices were
observed among 26 (56%), while poor
practices were observed in areas of patient
positioning, verbal reassurance, infection
control practices and chest auscultation. The
findings revealed that ICU nurses have poor
overall knowledge on OS-ETS though their
practices were favorable. The study highlights
the need for continuous professional
education for nurses to address the gaps
identified and establishing practice guidelines
regarding OS-ETS for improving quality and
safety in health care.
Keywords: Intensive care nurses, open
system endotracheal suctioning, knowledge
and practices
Introduction:
Open-system endotracheal suctioning (OS-
ETS) procedure is done to keep the airway
patency among critically ill patients requiring
mechanical ventilation. It is a component of
bronchial hygiene therapy and mechanical
ventilation (MV) that involves the mechanical
aspiration of pulmonary secretions from a
patient’s artificial airway to prevent its’
obstruction (Guglielminotti, et al., 1998).
There are guidelines and best practices
recommended to prevent the risk of adverse
effects of endotracheal suctioning (ETS). The
Main aim of ETS is to keep air pathways
permeability; provide sufficient oxygenation;
avoid the risk of ventilator-associated
pneumonia (VAP), prevent atelectasis and
pulmonary consolidation (Seckel, 2008).
Intensive care unit (ICU) nurses who care for
critically ill patients 24 hours need to follow
guidelines to ensure patient safety and
prevent VAP. However, previous studies
showed that ICU nurses’ knowledge and
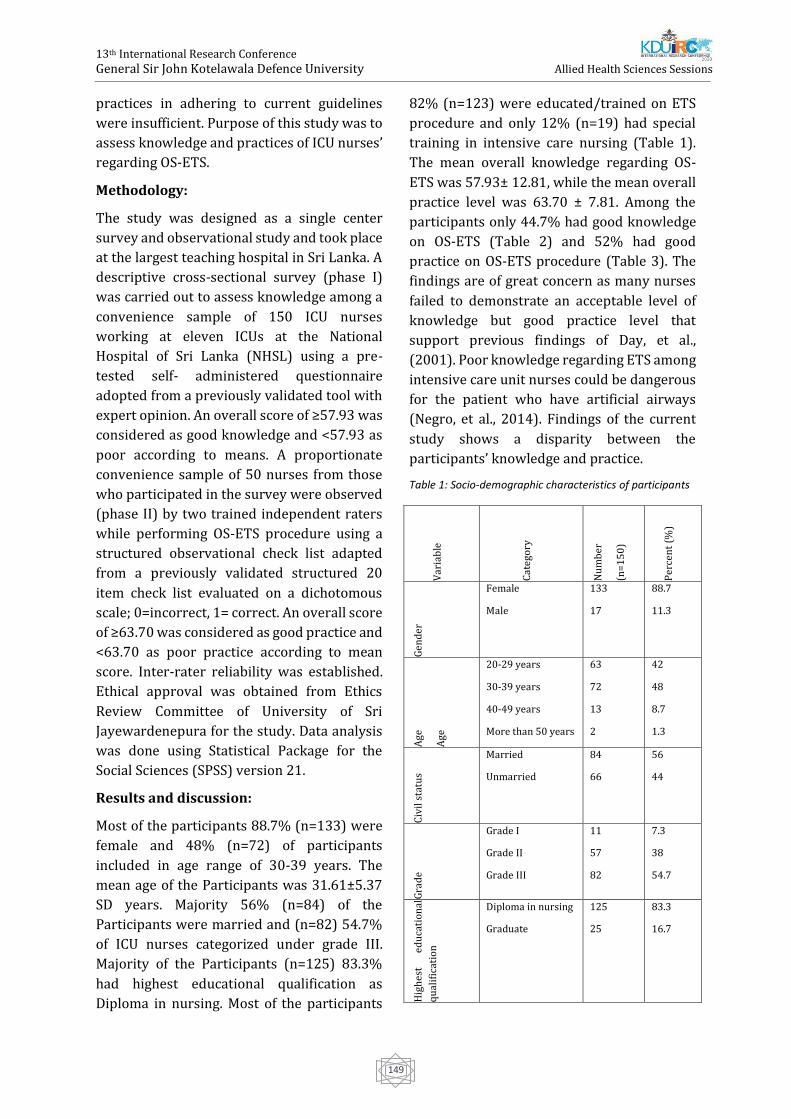
13th International Research Conference
General Sir John Kotelawala Defence University
Allied Health Sciences Sessions
149
practices in adhering to current guidelines
were insufficient. Purpose of this study was to
assess knowledge and practices of ICU nurses’
regarding OS-ETS.
Methodology:
The study was designed as a single center
survey and observational study and took place
at the largest teaching hospital in Sri Lanka. A
descriptive cross-sectional survey (phase I)
was carried out to assess knowledge among a
convenience sample of 150 ICU nurses
working at eleven ICUs at the National
Hospital of Sri Lanka (NHSL) using a pre-
tested self- administered questionnaire
adopted from a previously validated tool with
expert opinion. An overall score of ≥57.93 was
considered as good knowledge and <57.93 as
poor according to means. A proportionate
convenience sample of 50 nurses from those
who participated in the survey were observed
(phase II) by two trained independent raters
while performing OS-ETS procedure using a
structured observational check list adapted
from a previously validated structured 20
item check list evaluated on a dichotomous
scale; 0=incorrect, 1= correct. An overall score
of ≥63.70 was considered as good practice and
<63.70 as poor practice according to mean
score. Inter-rater reliability was established.
Ethical approval was obtained from Ethics
Review Committee of University of Sri
Jayewardenepura for the study. Data analysis
was done using Statistical Package for the
Social Sciences (SPSS) version 21.
Results and discussion:
Most of the participants 88.7% (n=133) were
female and 48% (n=72) of participants
included in age range of 30-39 years. The
mean age of the Participants was 31.61±5.37
SD years. Majority 56% (n=84) of the
Participants were married and (n=82) 54.7%
of ICU nurses categorized under grade III.
Majority of the Participants (n=125) 83.3%
had highest educational qualification as
Diploma in nursing. Most of the participants
82% (n=123) were educated/trained on ETS
procedure and only 12% (n=19) had special
training in intensive care nursing (Table 1).
The mean overall knowledge regarding OS-
ETS was 57.93± 12.81, while the mean overall
practice level was 63.70 ± 7.81. Among the
participants only 44.7% had good knowledge
on OS-ETS (Table 2) and 52% had good
practice on OS-ETS procedure (Table 3). The
findings are of great concern as many nurses
failed to demonstrate an acceptable level of
knowledge but good practice level that
support previous findings of Day, et al.,
(2001). Poor knowledge regarding ETS among
intensive care unit nurses could be dangerous
for the patient who have artificial airways
(Negro, et al., 2014). Findings of the current
study shows a disparity between the
participants’ knowledge and practice.
Table 1: Socio-demographic characteristics of participants
Var
iab
le
Cat
ego
ry
Nu
mb
er
(n=
15
0)
Per
cen
t (%
)
Gen
der
Female
Male
133
17
88.7
11.3
Ag
e
Ag
e
20-29 years
30-39 years
40-49 years
More than 50 years
63
72
13
2
42
48
8.7
1.3
Civ
il s
tatu
s
Married
Unmarried
84
66
56
44
Gra
de
Grade I
Grade II
Grade III
11
57
82
7.3
38
54.7
Hig
hes
t ed
uca
tio
nal
qu
alif
icat
ion
Diploma in nursing
Graduate
125
25
83.3
16.7
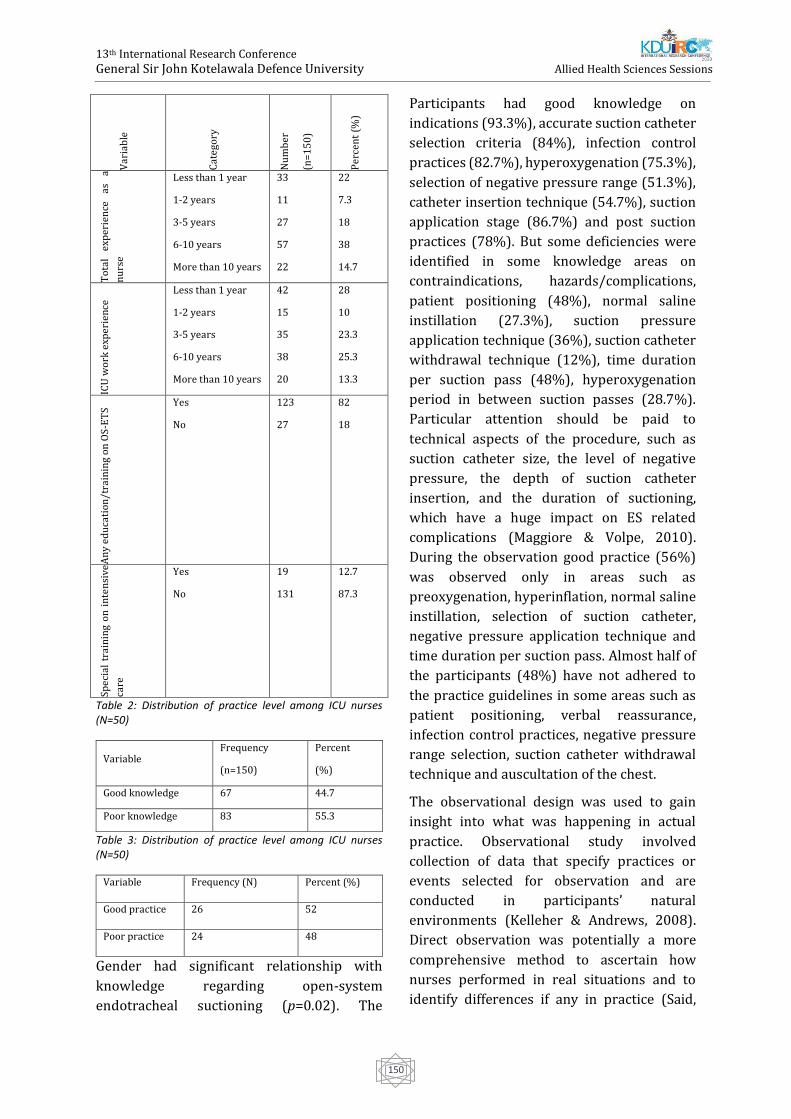
13th International Research Conference
General Sir John Kotelawala Defence University
Allied Health Sciences Sessions
150
Var
iab
le
Cat
ego
ry
Nu
mb
er
(n=
15
0)
Per
cen
t (%
)
To
tal
exp
erie
nce
as
a
nu
rse
Less than 1 year
1-2 years
3-5 years
6-10 years
More than 10 years
33
11
27
57
22
22
7.3
18
38
14.7
ICU
wo
rk e
xper
ien
ce
Less than 1 year
1-2 years
3-5 years
6-10 years
More than 10 years
42
15
35
38
20
28
10
23.3
25.3
13.3
An
y ed
uca
tio
n/t
rain
ing
on
OS
-ET
S
Yes
No
123
27
82
18
Spec
ial
trai
nin
g o
n i
nte
nsi
ve
care
Yes
No
19
131
12.7
87.3
Table 2: Distribution of practice level among ICU nurses (N=50)
Variable Frequency
(n=150)
Percent
(%)
Good knowledge 67 44.7
Poor knowledge 83 55.3
Table 3: Distribution of practice level among ICU nurses (N=50)
Variable Frequency (N) Percent (%)
Good practice 26 52
Poor practice 24 48
Gender had significant relationship with
knowledge regarding open-system
endotracheal suctioning (p=0.02). The
Participants had good knowledge on
indications (93.3%), accurate suction catheter
selection criteria (84%), infection control
practices (82.7%), hyperoxygenation (75.3%),
selection of negative pressure range (51.3%),
catheter insertion technique (54.7%), suction
application stage (86.7%) and post suction
practices (78%). But some deficiencies were
identified in some knowledge areas on
contraindications, hazards/complications,
patient positioning (48%), normal saline
instillation (27.3%), suction pressure
application technique (36%), suction catheter
withdrawal technique (12%), time duration
per suction pass (48%), hyperoxygenation
period in between suction passes (28.7%).
Particular attention should be paid to
technical aspects of the procedure, such as
suction catheter size, the level of negative
pressure, the depth of suction catheter
insertion, and the duration of suctioning,
which have a huge impact on ES related
complications (Maggiore & Volpe, 2010).
During the observation good practice (56%)
was observed only in areas such as
preoxygenation, hyperinflation, normal saline
instillation, selection of suction catheter,
negative pressure application technique and
time duration per suction pass. Almost half of
the participants (48%) have not adhered to
the practice guidelines in some areas such as
patient positioning, verbal reassurance,
infection control practices, negative pressure
range selection, suction catheter withdrawal
technique and auscultation of the chest.
The observational design was used to gain
insight into what was happening in actual
practice. Observational study involved
collection of data that specify practices or
events selected for observation and are
conducted in participants’ natural
environments (Kelleher & Andrews, 2008).
Direct observation was potentially a more
comprehensive method to ascertain how
nurses performed in real situations and to
identify differences if any in practice (Said,
13th International Research Conference
General Sir John Kotelawala Defence University
Allied Health Sciences Sessions
151
2012). Nosocomial infection (NI) which also
called “hospital-acquired or health care-
associated infection” is a serious public health
issue affecting hundreds of millions of people
every year worldwide (WHO, 2016). Health
care associated infections (HCAI) increase
morbidity, mortality, length of hospital stays,
and costs (Collins, 2008); therefore, more
research and changes in practice are needed to
ensure hospital safety and prevent HCAIs
(WHO, 2011). Infection control practices of
OS-ETS prior to suction showed that 80% of
the participants did not wash hands before
starting the procedure and out of them 28%
used alcohol hand rub as an alternative for
hand washing prior to suction.
Almost all participants in the observational
study used at least a single personal protective
equipment, but none used all the PPE
necessary. All of them, n=50 (100%) were
wearing a mask, 14% (n=7) were wearing a
polythene disposable apron, 70% (n=35) were
wearing gown and only 4% (n=2) wore
goggles/eyewear before practice. This may
suggest a perconception among nurses that
wearing gloves and using ‘non-touch’ aseptic
technique when inserting the suction catheter
that neglects the need for frequent hand
washing. Yet, the literature clearly suggests
that use of gloves do not replace the need for
hand washing (Pratt, et al., 2001).
A majority of participants (66.7%) in the
survey revealed that not having formal
training on OS-ETS as the most common
barrier. Half of the participants (50%) noted
that lack of knowledge on OS-ETS as another
barrier. Moreover, 44% of them identified no
supervisory guidance to monitor the
effectiveness of ETS practice and lack of
experience/practice on OS-ETS as barriers.
Only 38% of the participants reported that
unavailability guidelines in the unit/hospital
for ETS as a barrier.
Conclusion
ICU nurses have poor overall knowledge on
OS-ETS. Their overall practices were favorable
but deficiencies that could affect patient safety
were evident. The study highlights the need
for continuing education for nurses to address
the gaps identified and establishing practice
guidelines regarding OS-ETS for improving
quality and safety in health care. Therefore,
on-going education programmers focusing on
improving both theory and practice should be
implemented by the hospital authorities. In
addition, practice guidelines on ETS should be
implemented and continuous monitoring
through nursing audits should be done for
prevention of VAP and thereby to improve the
quality of care and safety of patients.
References:
Burke, J., 2003. Infection control-A problem for
patient safety. The New England Journal of
Medicine, 348(7), pp. 651-656.
Collins, A., 2008. Preventing Health Care-Associated
Infections. [Online]
Available at:
https://www.ncbi.nlm.nih.gov/books/NBK2683/
[Accessed 01 April 2018].
Guglielminotti, J., Desmonts, J. & Dureuil, B., 1998.
Effect of tracheal suctioning on respiratory
resistances in mechanically ventilated patients'
chest. 113(5), pp. 1335-1338.
Kelleher, S. J. & Andrews, T., 2008. An observational
study on the open-system endotracheal suctioning
practices of critical care nurses. Journal of Clinical
Nursing, 17(3), pp. 360-369.
Maggiore, S. & Volpe, C., 2010. Springer Link.
[Online]
Available at:
https://link.springer.com/article/10.1007/s1354
6-010-0211-1
[Accessed 20 October 2017].
Negro, A., Ranzani, R., Villa, M. & Manara, D., 2014.
Survey of Italian intensive care unit nurses'
knowledge about endotracheal suctioning
guidelines. Intensive and Critical Care Nursing,
30(6), pp. 339-345.
Pratt, R. J.; Pellowe, C.; Loveday, H. P.; Robinson, N.;
Smith, G. W., 2001. The Epic Project: Developing
13th International Research Conference
General Sir John Kotelawala Defence University
Allied Health Sciences Sessions
152
National Evidence Based Guidelines for Preventing
Healthcare Associated Infections. Phase I:
Guidelines for Preventing Hospital Acquired
Infections. Journal of Hospital Infection, 47(Suppl.),
pp. S1-S82.
Said, A. T., 2012. Knowledge and practice of
intensive care nurses on prevention of ventilator
associated pneumonia at Muhimbili National
Hospital, Dar Es Salaam, Tanzania, s.l.: s.n.
Seckel, M., 2008. Does the use of a closed suction
system help to prevent ventilator associated
pneumonia?. Critical Care Nurse, 28(1), pp. 65-66.
WHO, 2011. World Health Organization. [Online]
Available at:
http://apps.who.int/iris/bitstream/handle/1066
5/80135/9789241501507_eng.pdf?sequence=1
[Accessed 19 April 2018].
WHO, 2016. Health care without avoidable
infections:The critical role of infection prevention
and control. [Online]
Available at: http://www.who/his/sds
[Accessed 5 May 2018].
13th International Research Conference
General Sir John Kotelawala Defence University
Allied Health Sciences Sessions
153
Prevalence of Unintentional Home Injuries and Awareness of Child
Safety among the Parents of Inpatient Children at Sirimavo
Bandaranayake Specialized Children’s Hospital Peradeniya
S Senthuran# and ML Pathirathna
Department of Nursing, Faculty of Allied Health Sciences, University of Peradeniya, Sri Lanka
Abstract: Unintentional injuries are estimated
to cause 389,000 annual child deaths in
Southern Asia resulting in an annual loss of 74
healthy lives per 1000 population. In Sri
Lanka, childhood injuries have been reported
as the fourth leading cause of child mortality
under 5 years. A descriptive cross-sectional
study was conducted in Sirimavo
Bandaranayake Specialized Children's
Hospital-Peradeniya, Sri Lanka with the aims
of identifying commonly reported types of
unintentional home injuries and to assess the
effects of parental factors on awareness of
child safety. Under 6-year-old inpatient
children and their parents were included in
the study. Data were collected from 99 child-
parent pairs within one-month period starting
from 31st January 2020. An interviewer-
administered questionnaire was used to
collect data, followed by a simple physical
examination of each child. Data were analyzed
using Minitab 18 statistical software. Among
the participants, majority of the children were
male (64.6%). The most common type of
unintentional home injury was fall injuries
(75.76%). In more than one-third of cases
(39.39%), mother was the person who was
presented with the child at the time of injury.
It was found that unemployed mothers were
having significantly higher awareness on child
safety and injury prevention compared to
mothers who were working (p=0.005). The
results of this study suggest that falls as the
most commonly reported unintentional home
injuries which lead to hospital admission
among the children under 6 years of age. The
findings also reveal that unemployed mothers
were having better awareness on child safety
and injury prevention.
Keywords: Unintentional home injuries,
parental awareness, child safety
Introduction:
Accidental injuries remain the leading cause of
death among children aged 1 to 18 years.
Every year, millions of children are
permanently disabled or disfigured because of
accidents (Laursen, Møller, 2009). Most
injury-related deaths occur in low and middle-
income countries where knowledge is limited
regarding injury prevention (Rezapur et al.,
2008). In Sri Lanka, childhood injury has been
reported as the fourth leading cause of death
among children younger than 5 years
(Punyadasa and Samarakkody, 2016). Home
accidents have been identified as the largest
single cause of death after the age of one year
and are among the most severe health
problems facing the world today.
Unintentional injuries are estimated to cause
389,000 annual child deaths in Southern Asia
resulting in an annual loss of 74 healthy lives
per 1000 population (Hyder et al., 2008).
Unintentional injuries refer to the injuries that
are unplanned or unexpected. According to
the National Safe Kids Campaign in USA, 40%
of deaths and 50% of nonfatal unintentional
injuries occur in and around the home (Peden
and Oyegbite, 2013). Falls, scalds, and burns,
glass-related accidents, poisoning, suffocating
and choking, strangulation and blind cords,
drowning can be considered as most common
home accidents (Fox, 2015). In Sri Lanka, the
13th International Research Conference
General Sir John Kotelawala Defence University
Allied Health Sciences Sessions
154
available literature on accidents among young
children is scarce and therefore this study
aimed to find out the prevalence of different
types of unintentional home injuries among
the children under 6 years of age and assess
the relationship between the parental factors
and awareness on prevention of unintentional
home injuries among parents.
Methodology:
A descriptive cross-sectional study was
conducted in Sirimavo Bandaranayake
Specialized Children's Hospital (SBSCH),
Peradeniya. All the children under 6 years,
who were receiving treatment at SBSCH,
Peradeniya between 31st January to 29th
February 2020 and their parents were
included in the sample. The selection of the
study subjects was done by the researcher by
using the available data in the respective bed
head ticket (BHT) of each child. Children who
were with a clinical diagnosis of unintentional
home injury (or any type of injury which
comes under unintentional home injuries)
were selected as the eligible participants for
the study. After selecting the eligible children,
permission to include their children in to the
study was obtained from each parent or
caregiver. Informed written consent was
obtained from the respective parent or
guardian before the data collection after
explaining the study purpose, data collection
methods, time duration for data collection,
and confidentiality of personal information. A
parental interview was done using a strutted
interviewer administer questionnaire. The
questionnaire consisted of 4 parts socio-
demographic characters of the child,
description of unintentional injuries, socio-
economic characteristic of the parents and
parental awareness on child safety.
Approximately 20 minutes were taken to fill
one questionnaire. Besides the questionnaire,
a simple physical examination of each child
was carried. The physical examination was
carried out with the presence of relevant
parent or guardian and the privacy of the
children was maintained throughout the
examination. Pretest of the study was done
with 10 parent-child pairs who were admitted
to the SBSCH, Peradeniya due to unintentional
home injuries and they were excluded from
the final sample. Ethical clearance for the
study was obtained from the Ethics Review
Committee of the Faculty of Allied Health
Sciences, University of Peradeniya
(AHS/ERC/2019/074). And the permission to
collect data was obtained from the director,
SBSCH. Informed written consent was
obtained from the participants before data
collection after explaining the purpose of the
study. Privacy and confidentiality of the
collected data were strictly maintained
throughout the study. All the data collected
were entered into an excel spreadsheet and
then analyzed using Minitab 18 statistical
software. Descriptive statistics were
presented as mean±standard deviation (SD)
and as percentages. In order to assess the
impact of parental factors on parental
awareness on child safety, 18 questions from
part 4 of the questionnaire were selected. The
answers which indicate the parental
awareness was good have been given score “1”
(one) and answers which indicate poor
parental awareness were given score “0”
(zero). One-way ANOVA test was carried out
to assess the effects of parental factors on the
score of parental awareness on child safety
(Table 1). Then the analysis was repeated by
diving parents into two groups based on the
total score on child safety awareness as;
“group 1 = having good awareness on child
safety” and “group 2 = having poor awareness
on child safety”. Accordingly, those who
gained scores of equal or above 11 were
categorized as group 1 and those who scored
10 or below were categorized as group 2
(Figure 1). A chi-square test was carried out to
assess the relationship between 2 parental
groups based on awareness score and the
maternal employability.
Results and Discussion:
13th International Research Conference
General Sir John Kotelawala Defence University
Allied Health Sciences Sessions
155
Unintentional home injuries are among the
leading causes for hospitalization of young
children. In the present study, data were
collected from 99 parent-child pairs who were
admitted due to unintentional home injuries
to the SBSCH, Peradeniya. The mean age of the
children was 40.9±15.3 months. Majority of
children were males (64.6%). This finding is
consistent with the findings of Schwebel in
2014 (Schwebel, 2014). The reason behind
this finding might be because of the higher
activity level of male children compared to
female children. SBSCH is the only one
hospital solely dedicated only for children’s
care in Central Province, Sri Lanka and it
accommodates patients from all over the
country. Supporting this, the current study
sample consisted of residents from urban
(37.4%), rural (53.5 %), and estate (9.1%)
areas with the highest proportion from rural
areas. A quasi-experimental study which was
conducted by Ihalahewage, Fernando and
Weliange in 2018 revealed that burn injuries
(31%) as the most common type of injury
among the children under five years of age in
two villages in Sri Lanka. In contrast, the
findings of the current study revealed falls
(75.8%) as the most common type of
unintentional home injury among the children
under 6 years of age. The other types of
reported injuries in Ihalagama et al.’s study
were cut injuries (18.2%), fall (18.2%), animal
bites (13.6%), and chemical/invasive things
penetrating body (13.6%), while the current
study reported burns (4%), animal bite (1%),
foreign body ingestion (5.1%), cut injuries
(5.1%) and other injuries (5.1%). Among the
children who were admitted due to the foreign
body ingestion, 80% of the children were
ingested small watch batteries. Besides the
main types of injuries, crush injury was
reported under the category of other injuries.
One reason for this difference might be due to
the conducting of current study in a
specialized children's hospital whereas
Ihalagama et al.’s study was conducted in the
community. Also, the slight difference of age
limits of the two studies might affect the
results.
The current study also assessed the risks of
home environments such as in kitchen,
bedroom, living room, garden, and other
places, and the findings revealed that most of
the injuries occurred in living room. This was
evidently shown from the injury prevalence
data of the current study by highlighting living
room (46.5%), bedroom (23.2%), garden
(20.2%), and kitchen (10.1%) as the places
where injuries occurred. Among the accidents
which were occurred in living rooms, 76.1%
accidents were fall injuries and the mean age
of this group (falls in the living room) was
43.9±12.4 months. These findings stressed the
need of improving parental awareness on
arranging living rooms to maximize the child’s
safety. It is important to educate the parents to
avoid high places inside the living rooms
where children can easily climb and not to
keep the children in high places/chairs
without attention especially when they are
having children under 4 years of age.
However, the study done by Ihalahewage et al.
revealed more accidents occurred in kitchen
and garden (31.8%), and other places were
bed room (23.2%) and living room (13.6%).
Ihalahewage et al.’s study also revealed that
most home injuries (82%) had occurred when
someone was near or around the injured child
and in consistent, the current study found that
more than one third of children were injured
while their mothers with them (39.4 %). Also,
the currents study found that 74.8% of
parents were aware that there are many
chances for their children to meet with severe
accidents in their home environments. At the
same time, more than half of the parents
(60.6%) mentioned that their houses provide
some kind of safety to their children to protect
against unintentional injuries. Moreover, the
present study found that mean score for the
parental awareness on child safety was
11.2±1.9 (range 6.0 to 15.0). The results of the
one-way ANOVA revealed that none of the
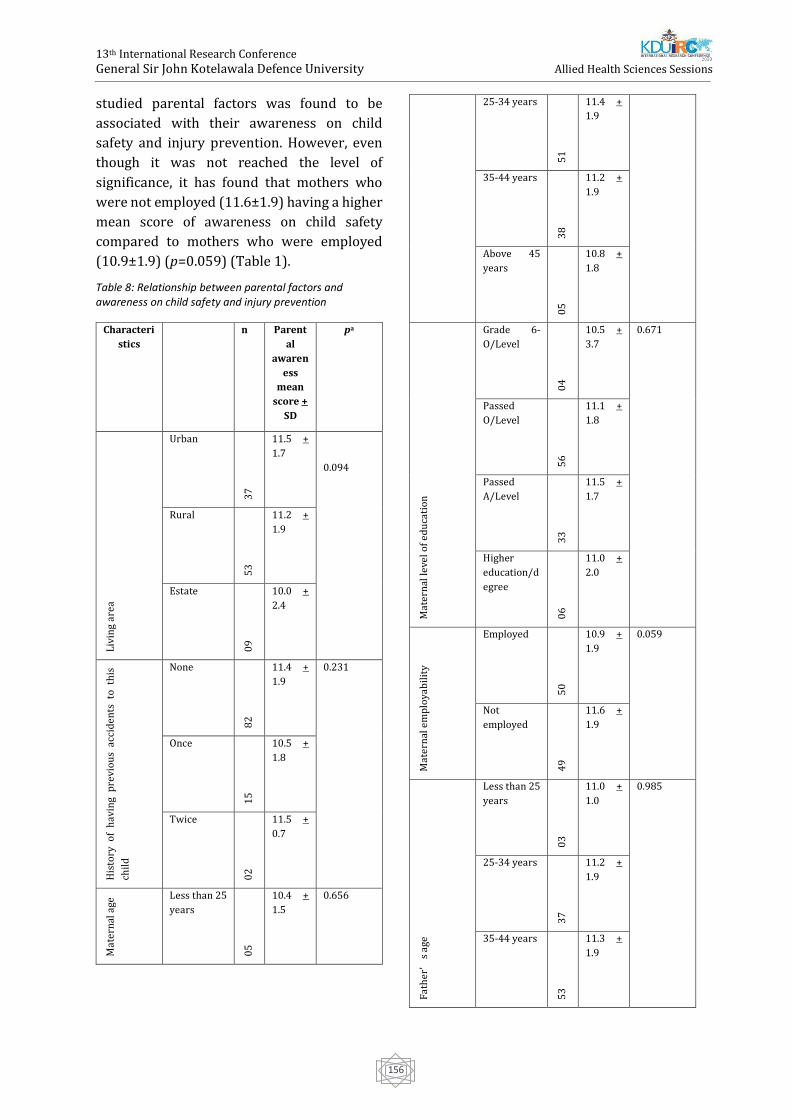
13th International Research Conference
General Sir John Kotelawala Defence University
Allied Health Sciences Sessions
156
studied parental factors was found to be
associated with their awareness on child
safety and injury prevention. However, even
though it was not reached the level of
significance, it has found that mothers who
were not employed (11.6±1.9) having a higher
mean score of awareness on child safety
compared to mothers who were employed
(10.9±1.9) (p=0.059) (Table 1).
Table 8: Relationship between parental factors and awareness on child safety and injury prevention
Characteri
stics
n Parent
al
awaren
ess
mean
score +
SD
pa
Liv
ing
area
Urban
37
11.5 +
1.7
0.094
Rural
53
11.2 +
1.9
Estate
09
10.0 +
2.4
His
tory
of
hav
ing
pre
vio
us
acci
den
ts t
o t
his
chil
d
None
82
11.4 +
1.9
0.231
Once
15
10.5 +
1.8
Twice
02
11.5 +
0.7
Mat
ern
al a
ge Less than 25
years
05
10.4 +
1.5
0.656
25-34 years
51
11.4 +
1.9
35-44 years
38
11.2 +
1.9
Above 45
years
05
10.8 +
1.8
Mat
ern
al le
vel o
f e
du
cati
on
Grade 6-
O/Level
04
10.5 +
3.7
0.671
Passed
O/Level
56
11.1 +
1.8
Passed
A/Level
33
11.5 +
1.7
Higher
education/d
egree
06
11.0 +
2.0
Mat
ern
al e
mp
loya
bil
ity
Employed
50
10.9 +
1.9
0.059
Not
employed
49
11.6 +
1.9
Fat
her
’s
age
Less than 25
years
03
11.0 +
1.0
0.985
25-34 years
37
11.2 +
1.9
35-44 years
53
11.3 +
1.9
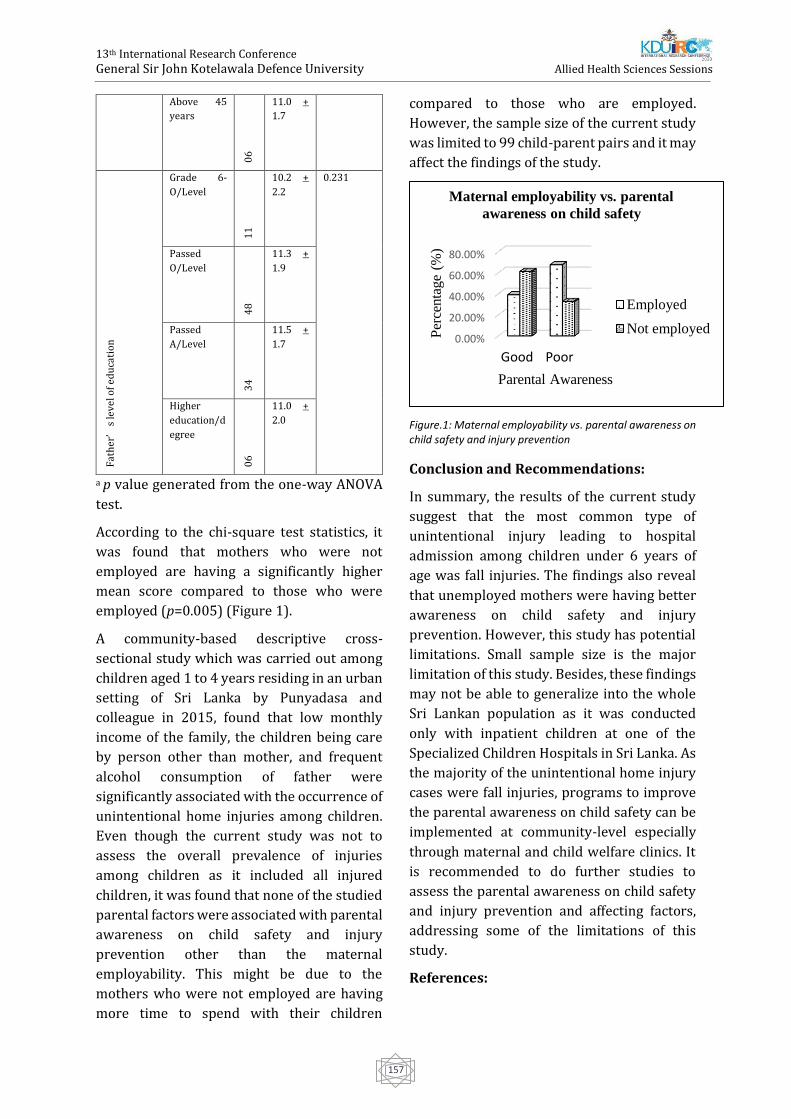
13th International Research Conference
General Sir John Kotelawala Defence University
Allied Health Sciences Sessions
157
Above 45
years
06
11.0 +
1.7 F
ath
er’
s le
vel o
f e
du
cati
on
Grade 6-
O/Level
11
10.2 +
2.2
0.231
Passed
O/Level
48
11.3 +
1.9
Passed
A/Level
34
11.5 +
1.7
Higher
education/d
egree
06
11.0 +
2.0
a p value generated from the one-way ANOVA
test.
According to the chi-square test statistics, it
was found that mothers who were not
employed are having a significantly higher
mean score compared to those who were
employed (p=0.005) (Figure 1).
A community-based descriptive cross-
sectional study which was carried out among
children aged 1 to 4 years residing in an urban
setting of Sri Lanka by Punyadasa and
colleague in 2015, found that low monthly
income of the family, the children being care
by person other than mother, and frequent
alcohol consumption of father were
significantly associated with the occurrence of
unintentional home injuries among children.
Even though the current study was not to
assess the overall prevalence of injuries
among children as it included all injured
children, it was found that none of the studied
parental factors were associated with parental
awareness on child safety and injury
prevention other than the maternal
employability. This might be due to the
mothers who were not employed are having
more time to spend with their children
compared to those who are employed.
However, the sample size of the current study
was limited to 99 child-parent pairs and it may
affect the findings of the study.
Figure.1: Maternal employability vs. parental awareness on child safety and injury prevention
Conclusion and Recommendations:
In summary, the results of the current study
suggest that the most common type of
unintentional injury leading to hospital
admission among children under 6 years of
age was fall injuries. The findings also reveal
that unemployed mothers were having better
awareness on child safety and injury
prevention. However, this study has potential
limitations. Small sample size is the major
limitation of this study. Besides, these findings
may not be able to generalize into the whole
Sri Lankan population as it was conducted
only with inpatient children at one of the
Specialized Children Hospitals in Sri Lanka. As
the majority of the unintentional home injury
cases were fall injuries, programs to improve
the parental awareness on child safety can be
implemented at community-level especially
through maternal and child welfare clinics. It
is recommended to do further studies to
assess the parental awareness on child safety
and injury prevention and affecting factors,
addressing some of the limitations of this
study.
References:
0.00%
20.00%
40.00%
60.00%
80.00%
Good Poor
Per
centa
ge
(%)
Parental Awareness
Maternal employability vs. parental
awareness on child safety
Employed
Not employed
13th International Research Conference
General Sir John Kotelawala Defence University
Allied Health Sciences Sessions
158
Fox, H. (2015). Common childhood accidents and
how to prevent them. Retrieved 13 October 2019,
from https://www.motherandbaby.co.uk/baby-
and-toddler/baby/lookingafter-your-baby/7-
common-childhood-accidents-and-how-to-
prevent-them
Hyder, A. A., Wali, S., Fishman, S., & Schenk, E.
(2008). The burden of unintentional injuries
among the under-five population in South Asia.
Acta Paediatrica, 97(3): pp.267-275.
doi:10.1111/j.1651-2227.2008.00670.x
Ihalahewage, Nayana Fernando, W.M.S.Weliange,
A. A. S. D. S. (2018). Health promotion approach to
reduce unintentional home injuries of young
children in rural villages in the North Central
Province of Sri Lanka. Sri Lanka Journal of Child
Health, 47(1), pp.33–39.
doi:10.4038/sljch.v47i1.8427
Laursen, Bjarne Møller, H. (2009). Unintentional
injuries in children of Danish and foreign-born
mothers. Scandinavian Journal of Public Health.
37(6). doi: 10.1177/1403494809105793
Peden, M., & Oyegbite, K. (2013). World report on
child injury prevention. Choice Reviews Online,
47(1), 47-0325-47–0325. doi:10.5860/choice.47-
0325
Punyadasa, D., & Samarakkody, D. I. A. N. A. (2016).
Community-based study on family related
contributory factors for childhood unintentional
injuries in an urban setting of Sri Lanka. Asia-
Pacific Journal of Public Health, 28, pp.102S-110S.
doi:10.1177/1010539515616454
Rezapur Shahkolai, F., Naghavi, M., Shokouhi, M., &
Laflamme, L. (2008). Unintentional injuries in the
rural population of Twiserkan, Iran: A cross-
sectional study on their incidence, characteristics
and preventability. BMC Public Health. 8, 269 doi:
10.1186/1471-2458-8-269
Schwebel, D. C. (eds) (2014) Child injury
prevention, MDPI, Basel, Switzerland
13th International Research Conference
General Sir John Kotelawala Defence University
Allied Health Sciences Sessions
159
Relationship Between Hip Abductor Muscle Strength And Flatfoot
Deformity Among Undergraduates At Faculty Of Allied Health
Sciences, General Sir John Kotelawala Defence University
GAA Ransimala1#, DRM Fernando1, DYRS Madhuwanthi1, ADT Nawakshana1, HLDKND
Rathnasiri1, NH Wickramasinghe1, SADCS Senavirathna1 and UTN Senaratne2
1Department of Physiotherapy, Faculty of Allied Health Sciences,General Sir John Kotelawala Defence
University, Werahera, Sri Lanka
2Department of Multidisciplinary Sciences, Faculty of Allied Health Sciences,General Sir John Kotelawala
Defence University, Werahera, Sri Lanka
Abstract: Numerous factors and many inter
relationships between various anatomical
deformities affect flatfoot. The objective of this
study was to find the relationship between
Arch Index and hip abductor muscle strength
in both unilateral and bilateral flatfoot among
undergraduates, at the Faculty of Allied Health
Sciences (FAHS), General Sir John Kotelawala
Defence University (KDU). A descriptive cross-
sectional study was carried out including 510
students, aged between 19 - 40 years. Flat foot
students were identified using the Arch index
(AI) using modified Harris matt and AUTOCAD
software. The hip abductor muscle strength
was measured using modified
Sphygmomanometer. The results indicated
statistically significant relationships between
unilateral and bilateral flatfoot with hip
abductor muscle strength. A weak negative
correlation was noted between left side hip
abductor muscle strength and AI among the
students with bilateral flatfoot (p=0.04, r= -
0.15) and also between left side hip abductor
muscle strength and left side AI in left
unilateral flatfoot students (p=0.04, r= -0.32).
However, no significant difference was noted
between hip abductor muscle strength and the
presence of flatfoot.
Keywords: Flatfoot, Hip abductors, Arch
index
Introduction:
Flatfoot is any condition of the foot in which
the medial longitudinal arch of the foot is
lowered or lost. Therefore, the medial
longitudinal arch is a main reference for the
diagnosis of flatfoot (Villarroya et al., 2008).
The foot typically is characterized as having
three arches: medial and lateral longitudinal
arches and the transverse arch, of which the
medial longitudinal arch is the largest. These
three arches fully integrated with one another
to enhance the dynamic function of the foot
(Levangie, Norkin and Lewek, 2019). A study
done in India revealed 13.6% (for males-
12.8%; for females-14.4%) prevalence of flat
foot population (Aenumulapalli, 2017).
Furthermore, no research had been conducted
on prevalence of flatfoot among
undergraduate students in Sri Lanka. A
research was conducted among: 6-10-year-old
children to find the flatfoot prevalence in the
central province of Sri Lanka and to identify
the associated factors of flatfoot. The
prevalence was found to be: 16.06 %. (V.
Senadheera, V., 2016). Objectives of the study
were to determine the proportion of flatfoot
among undergraduates of FAHS, KDU, to
identify the hip abductor muscle strength in
both flat foot and non-flatfoot group of
students in FAHS, KDU and to identify the
relationship between hip abductor muscle
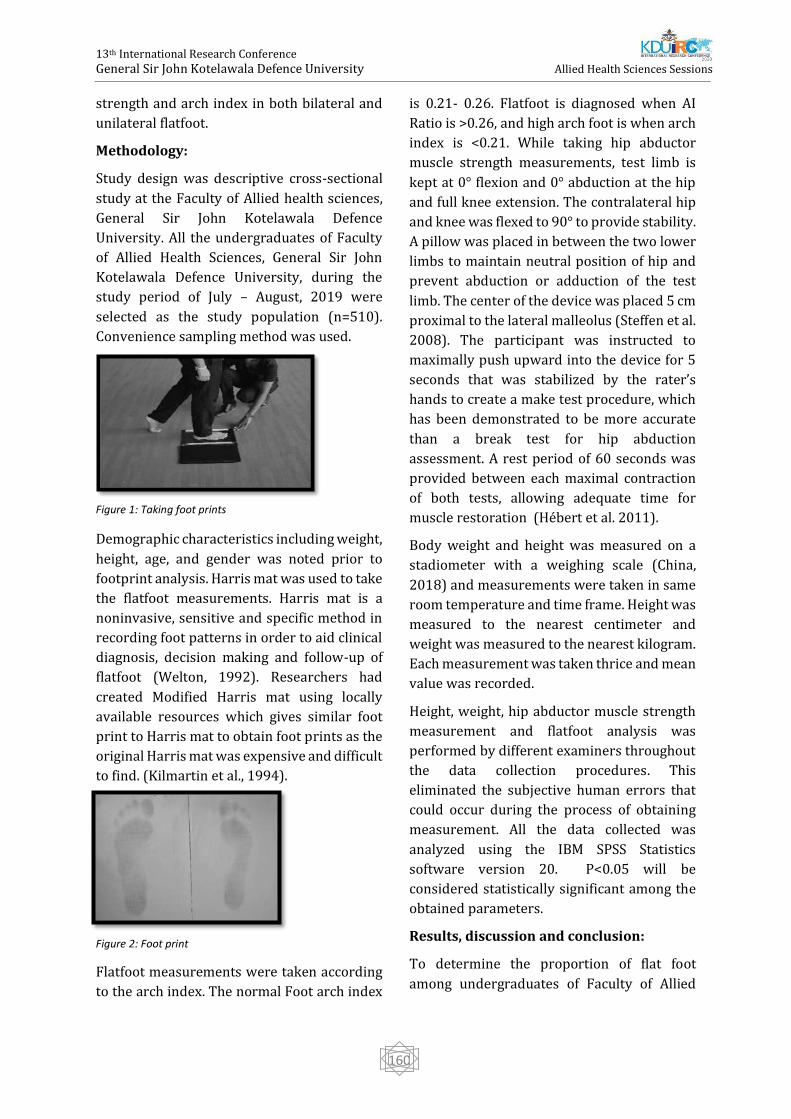
13th International Research Conference
General Sir John Kotelawala Defence University
Allied Health Sciences Sessions
160
strength and arch index in both bilateral and
unilateral flatfoot.
Methodology:
Study design was descriptive cross-sectional
study at the Faculty of Allied health sciences,
General Sir John Kotelawala Defence
University. All the undergraduates of Faculty
of Allied Health Sciences, General Sir John
Kotelawala Defence University, during the
study period of July – August, 2019 were
selected as the study population (n=510).
Convenience sampling method was used.
Figure 1: Taking foot prints
Demographic characteristics including weight,
height, age, and gender was noted prior to
footprint analysis. Harris mat was used to take
the flatfoot measurements. Harris mat is a
noninvasive, sensitive and specific method in
recording foot patterns in order to aid clinical
diagnosis, decision making and follow-up of
flatfoot (Welton, 1992). Researchers had
created Modified Harris mat using locally
available resources which gives similar foot
print to Harris mat to obtain foot prints as the
original Harris mat was expensive and difficult
to find. (Kilmartin et al., 1994).
Flatfoot measurements were taken according
to the arch index. The normal Foot arch index
is 0.21- 0.26. Flatfoot is diagnosed when AI
Ratio is >0.26, and high arch foot is when arch
index is <0.21. While taking hip abductor
muscle strength measurements, test limb is
kept at 0° flexion and 0° abduction at the hip
and full knee extension. The contralateral hip
and knee was flexed to 90° to provide stability.
A pillow was placed in between the two lower
limbs to maintain neutral position of hip and
prevent abduction or adduction of the test
limb. The center of the device was placed 5 cm
proximal to the lateral malleolus (Steffen et al.
2008). The participant was instructed to
maximally push upward into the device for 5
seconds that was stabilized by the rater’s
hands to create a make test procedure, which
has been demonstrated to be more accurate
than a break test for hip abduction
assessment. A rest period of 60 seconds was
provided between each maximal contraction
of both tests, allowing adequate time for
muscle restoration (Hébert et al. 2011).
Body weight and height was measured on a
stadiometer with a weighing scale (China,
2018) and measurements were taken in same
room temperature and time frame. Height was
measured to the nearest centimeter and
weight was measured to the nearest kilogram.
Each measurement was taken thrice and mean
value was recorded.
Height, weight, hip abductor muscle strength
measurement and flatfoot analysis was
performed by different examiners throughout
the data collection procedures. This
eliminated the subjective human errors that
could occur during the process of obtaining
measurement. All the data collected was
analyzed using the IBM SPSS Statistics
software version 20. P<0.05 will be
considered statistically significant among the
obtained parameters.
Results, discussion and conclusion:
To determine the proportion of flat foot
among undergraduates of Faculty of Allied
Figure 2: Foot print
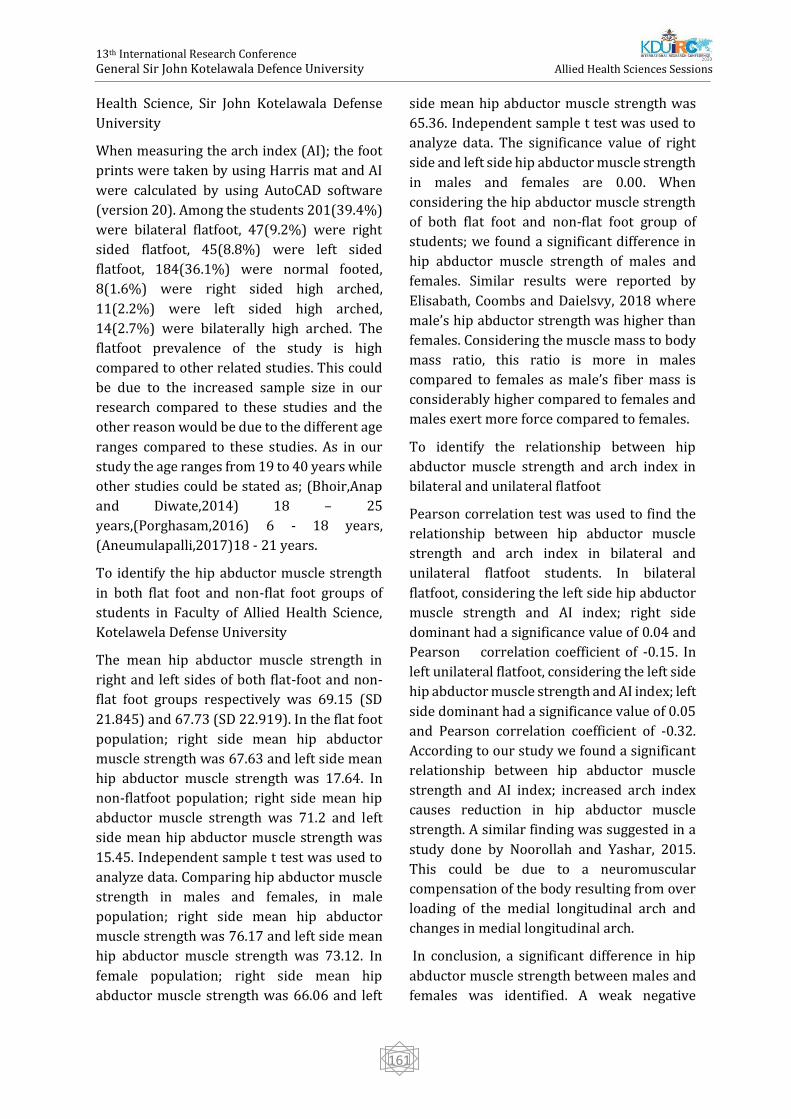
13th International Research Conference
General Sir John Kotelawala Defence University
Allied Health Sciences Sessions
161
Health Science, Sir John Kotelawala Defense
University
When measuring the arch index (AI); the foot
prints were taken by using Harris mat and AI
were calculated by using AutoCAD software
(version 20). Among the students 201(39.4%)
were bilateral flatfoot, 47(9.2%) were right
sided flatfoot, 45(8.8%) were left sided
flatfoot, 184(36.1%) were normal footed,
8(1.6%) were right sided high arched,
11(2.2%) were left sided high arched,
14(2.7%) were bilaterally high arched. The
flatfoot prevalence of the study is high
compared to other related studies. This could
be due to the increased sample size in our
research compared to these studies and the
other reason would be due to the different age
ranges compared to these studies. As in our
study the age ranges from 19 to 40 years while
other studies could be stated as; (Bhoir,Anap
and Diwate,2014) 18 – 25
years,(Porghasam,2016) 6 - 18 years,
(Aneumulapalli,2017)18 - 21 years.
To identify the hip abductor muscle strength
in both flat foot and non-flat foot groups of
students in Faculty of Allied Health Science,
Kotelawela Defense University
The mean hip abductor muscle strength in
right and left sides of both flat-foot and non-
flat foot groups respectively was 69.15 (SD
21.845) and 67.73 (SD 22.919). In the flat foot
population; right side mean hip abductor
muscle strength was 67.63 and left side mean
hip abductor muscle strength was 17.64. In
non-flatfoot population; right side mean hip
abductor muscle strength was 71.2 and left
side mean hip abductor muscle strength was
15.45. Independent sample t test was used to
analyze data. Comparing hip abductor muscle
strength in males and females, in male
population; right side mean hip abductor
muscle strength was 76.17 and left side mean
hip abductor muscle strength was 73.12. In
female population; right side mean hip
abductor muscle strength was 66.06 and left
side mean hip abductor muscle strength was
65.36. Independent sample t test was used to
analyze data. The significance value of right
side and left side hip abductor muscle strength
in males and females are 0.00. When
considering the hip abductor muscle strength
of both flat foot and non-flat foot group of
students; we found a significant difference in
hip abductor muscle strength of males and
females. Similar results were reported by
Elisabath, Coombs and Daielsvy, 2018 where
male’s hip abductor strength was higher than
females. Considering the muscle mass to body
mass ratio, this ratio is more in males
compared to females as male’s fiber mass is
considerably higher compared to females and
males exert more force compared to females.
To identify the relationship between hip
abductor muscle strength and arch index in
bilateral and unilateral flatfoot
Pearson correlation test was used to find the
relationship between hip abductor muscle
strength and arch index in bilateral and
unilateral flatfoot students. In bilateral
flatfoot, considering the left side hip abductor
muscle strength and AI index; right side
dominant had a significance value of 0.04 and
Pearson correlation coefficient of -0.15. In
left unilateral flatfoot, considering the left side
hip abductor muscle strength and AI index; left
side dominant had a significance value of 0.05
and Pearson correlation coefficient of -0.32.
According to our study we found a significant
relationship between hip abductor muscle
strength and AI index; increased arch index
causes reduction in hip abductor muscle
strength. A similar finding was suggested in a
study done by Noorollah and Yashar, 2015.
This could be due to a neuromuscular
compensation of the body resulting from over
loading of the medial longitudinal arch and
changes in medial longitudinal arch.
In conclusion, a significant difference in hip
abductor muscle strength between males and
females was identified. A weak negative
13th International Research Conference
General Sir John Kotelawala Defence University
Allied Health Sciences Sessions
162
relationship between hip abductor muscle
strength and arch index in unilateral and
bilateral flatfoot individuals was also found in
our study.
References:
Codes, I. (2019). 2019 ICD-10-CM Diagnosis Code
M21.42: Flatfoot [pes planus]
(acquired),leftfoot.[online]Icd10data.com.Availabl
eat:https://www.icd10data.com/ICD10CM/Codes
/M00-M99/M20-M25/M21-/M21.42 [Accessed 4
Mar. 2019].
Didia BC, e. (2019). The use of footprint contact
index II for classification of flat feet in a Nigerian
population. - PubMed - NCBI. [online]
Ncbi.nlm.nih.gov. Available at:
https://www.ncbi.nlm.nih.gov/pubmed/3583162
[Accessed 4 Mar. 2019].
Journals.sagepub.com. (2019). SAGE Journals: Your
gateway to world-class journal
research.[online]Availableat:http://journals.sagep
ub.com/doi/abs/10.1177/107110078700700504
[Accessed 4 Mar. 2019].
jmhr.org. (2019). IJPR.2018.139 – International
Journal of Physiotherapy and Research. [online]
Available at:
https://www.ijmhr.org/IntJPhysiotherRes/ijpr-
2018-139 [Accessed 4 Mar. 2019].
Kagaya, Y., Fujii, Y. and Nishizono, H. (2019).
Association between hip abductor function, rear-
foot dynamic alignment, and dynamic knee valgus
during single-leg squats and drop landings.
Palmer, K., Hebron, C. and Williams, J. (2019). A
randomised trial into the effect of an isolated hip
abductor strengthening programme and a
functional motor control programme on knee
kinematics and hip muscle strength.
Pourghasem, M., Kamali, N., Farsi, M. and
Soltanpour, N. (2019). Prevalence of flatfoot among
school students and its relationship with BMI.
http://journals.sagepub.com/doi/pdf/10.1177/1
938640015578520 [Accessed 4 Mar. 2019].
Shibuya, N., Jupiter, D., Ciliberti, L., VanBuren, V.
and La Fontaine, J. (2019). Characteristics of Adult
Flatfoot in the United States.
Askary Kachoosangy, R., Aliabadi, F. and Ghorbani,
M. (2019). Prevalence of Flatfoot: Comparison
between Male and Female Primary School
Students. [online] Irj.uswr.ac.ir. Available at:
http://irj.uswr.ac.ir/browse.php?a_id=300&sid=1
&slc_lang=en [Accessed 4 Mar. 2019].
Stark, T., Walker, B., Phillips, J., Fejer, R. and Beck,
R. (2011). Hand-held Dynamometry Correlation
With the Gold Standard Isokinetic Dynamometry: A
Systematic Review. PM&R, 3(5), pp.472-479.
Menz, H., Fotoohabadi, M., Wee, E. and Spink, M.
(2012). Visual categorisation of the arch index: a
simplified measure of foot posture in older people.
Journal of Foot and Ankle Research, 5(1).
Menz, H. and Munteanu, S. (2005). Validity of 3
Clinical Techniques for the Measurement of Static
Foot Posture in Older People. Journal of
Orthopaedic & Sports Physical Therapy, 35(8),
pp.479-486.
Goo, Y., Kim, T. and Lim, J. (2016). The effects of
gluteus maximus and abductor hallucis
strengthening exercises for four weeks on
navicular drop and lower extremity muscle activity
during gait with flatfoot. Journal of Physical
Therapy Science, 28(3), pp.911-915.
Arab, A. and Nourbakhsh, M. (2010). The
relationship between hip abductor muscle strength
and iliotibial band tightness in individuals with low
back pain.
Livingston, L. and Mandigo,J.(1999). Bilateral
Qangle asymmetry and amterior knee pain
syndrome. Clinical Biomechanics, 14(1), pp.7-13.
Villarroya, M.,
Esquivel,J.,Tomas,C.,Moreno,l.,Buenafe A. and
Bueno, G.(2008).Assesment of the medial
longitudinal arch in children and adolescents
withobesity; footprints and radiographic study.
European journal of pediatrics, 168(5), pp. 559-
567.
Conti, M., Chan,J., Do, H., Ellis, S. and
Deland,J(2015). Correlation of postoperative mid
foot position with outcome following
reconstruction of the stage II Adult Acquired
Flatfoot Deformity. Foot and ankle international,
36(3),pp. 239-247.

13th International Research Conference
General Sir John Kotelawala Defence University
Allied Health Sciences Sessions
163
Babu, K. and Ganesh, K. (2017). Assessment of
Plantar Arch Index and Prevalence of Flat Feet
among South Indian Adolescent Population.
Journal of pharmaceutical sciences and research,
9(4)(0975-1459), pp. 490-492.
Aenumupalli, A. (2017). Prevalence of Flexible
Flatfoot in Adults: A Cross- sectional Study.
JOURNAL OF CLINICAL AND DIAGNOSTIC
RESEARCH.
13th International Research Conference
General Sir John Kotelawala Defence University
Allied Health Sciences Sessions
164
Family Members Experiences Related to Organ Donation of their
Brain Death Patient
LND Amarasinghe, SKR Senadheera, BATN Buathsinghala, AKA Madhuwanthi, RAND
Ranaweera# and BSS De Silva
1The Open University of Sri Lanka # [email protected]
Abstract: Organ transplantation from brain
dead patients in Sri Lanka has become a
critical medical intervention since the
availability of organs has fallen behind the
requirement. Nonetheless, the difficulty in
obtaining the consent by the family members
still exists as it was. This study aimed to
describe the family members’ experiences
related to organ donation of their brain death
patients in Neuro - Surgical Intensive Care
Unit in National Hospital of Sri Lanka. Ten
immediate family members who have
provided their consent to proceed with an
organ donation of their loved ones were
selected purposively. The interviewing was
held at the hospital premises. This was
conducted as a phenomenological study. Data
collection was performed with semi-
structured interviews using a theme guide
from March to June 2019. Thematic analysis
was used for data analysis. Ethical approval
was obtained from the National Hospital of Sri
Lanka. Three themes that emerged from the
transcribed interviews were: decision conflict,
respecting the donor and acceptance of the
unexpected death. Stressful decision making,
family involvement and internal dissonance
were the sub-themes emerged from decision
conflict. Further, religious beliefs, honouring
the donors’ wishes, saving recipient life,
letting the donor live on and comforting the
grief were the sub-themes derived from
respecting the donor. Dedication of health
care professionals, the ambiguity of brain
death and awareness derived from the last
theme. The study revealed that the overall
attitudes towards organ donation of a brain
death patient exist to a slight negative bias
among Sri Lankan society. Hence it is
recommended to have public educational
interventions to educate the society regarding
organ donation.
Keywords: Brain death, Organ donation,
Family Members, Experience
Introduction:
The concept of brain death can be defined as
the irreversible end of all brain and brain stem
activities. Moreover the concept of brain death
varies with other acute brain disorders like
the vegetative state and coma (Yousefi et al,
2012). Due to the existing cultural and
religious diversity in the world, different
imaginations are embedded among people
regarding brain death patients. Further their
experiences were also affecting for their
attitudes regarding brain death (Groot et al,
2012). The concept of brain death have paved
pathways in a new dimension for the organ
donation process. Instructions for the organ
transplantation is also appearing in WHO
guiding principles on human cell, tissue and
organ transplantation, 2010.
Considering the organ donation in the
international context, the rates on organ
donation in India was identified as 0.26 per
million, United States, it was 25.6 per million,
18.3 per million in United Kingdom and 32 per
million in Spain (Wig et al, 2003). Considering
the Asian context, it is clear that the family
members of the brain death patients with
other intact organs have to face an ethical
dilemma. Providing the consent or taking the
decision to donate organs were mentioned as
the most difficult and complicated issue).
13th International Research Conference
General Sir John Kotelawala Defence University
Allied Health Sciences Sessions
165
Furthermore factors like bodily disfigurement
of the dead patient, failure of the families to
understand the concept of brain death have
highly influenced in decision making (Anker,
A., 2010). Global statistics have confirmed that
only 10% of the global needs of the organ
transplantation is met (Matesanze et al, 2017).
Each day around 60 patients all over the world
were getting an organ transplantation.
Nevertheless 13 patients die with
unavailability of organs all over the world
(Sulania et al, 2016)
As a developing country still Sri Lanka has
many people who are in the waiting list for an
organ transplantation. Yet the donated organs
were less than the requirement. Most of the
patients who are brain death are buried in Sri
Lanka due to the unwillingness of the family
members to donate. Therefore this was
conducted in the aim of exploring the family
members’ experience who are directly
involving with the organ donation of their
brain death patients in Neuro- Surgical
Intensive Care Units in National Hospital of Sri
Lanka. Specific objectives of the study were, to
identify psychological experiences of the
family members related to the organ donation
of their brain death patients, to explore socio-
cultural experiences of the family members
related to the organ donation of their brain
death patients and to describe institutional
experiences of the family members related to
the organ donation of their brain death
patients in Neuro- Surgical Intensive Care
Units in National Hospital of Sri Lanka.
Methodology:
This was a qualitative study with descriptive
phenomenological approach. The study was
conducted in the premises of the National
Hospital of Sri Lanka (NHSL). Study
participants were the family members of brain
death patients who were admitted to Neuro –
Surgical Intensive Care Units. They were in
the age group of 30 -67. There are five Neuro
Trauma Intensive Care Units in the NHSL
including an emergency treatment unit. Ten
immediate family members from ten families
were selected purposively joined the study to
provide face to face semi structured in depth
interviews. The inclusion criteria for the
participants was being an immediate family
member who has signed a consent form for an
organ donation. Ethical approval for the study
was granted from the ethics review committee
of the NHSL.
Written invitations were provided for the
participants and obtained the informed
consent to conduct the study. Semi-structured
in-depth interviews were conducted with the
ten participants for a half an hour to one-hour
length depending on the participant’s demand.
The participant’s confidentiality was
maintained throughout the study by using a
specific code to identify the participant. An
interview guide developed by exploring the
literature provided the main structure for the
interviewing process. The theme guide was
validated with the expert guidance and
opinion. Interviews were initiated with the
question “can you disclose about yourself”.
Eventually the investigators have asked about
the experiences of the family members.
Interviews were ended when the investigators
were satisfied and believed that all the
necessary information were gathered and the
data were saturated. All the recorded
interviews were transcribed and primary
codes were derived. Then the subthemes and
themes were derived according to the
thematic analysis. The rigor of the study was
maintained by the investigators by consulting
the supervisors and the subject experts.
Findings:
Three main themes and eleven sub themes
were generated with the data analysis. Main
findings were represented in the table 1.
Three main themes emerged were the
decision conflict, respecting the donor and the
acceptance of the unexpected death.
13th International Research Conference
General Sir John Kotelawala Defence University
Allied Health Sciences Sessions
166
The theme of ‘decision conflict’ explored the
stressful decision making, family involvement
and internal dissonance. Stressful decision
making expressed by the family members are
in a shocked and panicking behaviour. They
are expecting a miracle to happen and save the
patient.
“I saw my sister was sleeping on the bed. She
breathe well with the help of a machines. First I
can’t believe that her brain was not working.
(Silence) I thought she was having a
comfortable sleep there” (Participant A)
Family involvement plays a major role in
attempting to do an organ donation, there the
immediate kin of the donor was not the only
person to take decisions but his/her other
relatives involve too. Cooperativeness and the
understanding is a much more convenient in
this regard.
“Organ donation is such an important issue.
During our gathering we were used to spoke
about such topics. We donated our father’s eyes
also when he was died. I also spoke to my
children about my wishes. My other two sisters
and their children also accepted the decision
without any hesitation. One of our daughter is
married to a doctor. As a health care person his
involvement made the family decision more
comfortable.” (Participant B)
Most of the family members experience
uncertainty and dissonance after making the
final decision, some of the families who have
agreed to donate their loved one’s organs
suffered from uncertainty and dissonance
regarding the organ donation process. Some
internal conflicts have also emerged on the
confirmation of the death as well. They think
that their relative physically appeared alive
and normal since they don’t have any visible
injuries.
“Sometimes I thought that I should have kept
him. May be he would have recovered from the
coma. Sometime I asked myself if I was on the
wrong side…….. (Sigh).”(Participant C)
Table 1: Family members’ experiences related to organ donation of their brain death patient
Respecting the donor has derived five sub
themes as, religious beliefs, honoring the
donor’s wishes, saving recipient’s life, letting
the donor live on and comforting the grief.
Religious beliefs are one of the main concerns
that are embedded among the family
members. Most of them believed that donation
will help the dead person in their afterlife.
“My sister is young. There is no meaning to just
bury her body in vain. By giving her organ to
another one can survive another life. Because of
this she will be merited. Not only her, we too got
a chance to involve in a donation.”(Participant
A).
Honouring the donors’ wishes help in making
the relations to conclude about the act of
donation.
“My husband had a living will that in the case of
his death. He wanted to donate his body…..then
we agreed to donate his organ according to his
will to honour him.”(Participant G)
Saving recipient’s life came up with the
relative’s perceptions on improving the
survival and quality of life in patients
regarding a transplant and therefore
participants appeared to believe that the
consent for the donation should be given
without expecting anything in return.
“Even though we don’t know the person who
received the organs, it is very pleasure to think
Themes Sub Themes
Decision Conflict Stressful Decision Making,
Family Involvement
Internal Dissonance
Respecting the Donor Religious Beliefs
Honoring the Donors’ wishes
Saving Recipient’s Life
Letting the Donor live on
Comforting the Grief
Acceptance of Unexpected
Death
Dedication of Hospital Staff
Ambiguity of Brain Death
Awareness
13th International Research Conference
General Sir John Kotelawala Defence University
Allied Health Sciences Sessions
167
that we helped to save another person’s
life.”(Participant G)
Letting the donor live on provide the idea that
the family members believe their loved one
will be living on another person’s body. So that
it provides them the idea that the patient is no
longer dead.
“I know that my husband’s organ alive on
somebody. I’m happy to think about that. Even
though I was alone he gave life to another one.
I think that I should remind this at three month
Dana Ceremony.” (participant J)
Comforting the grief in the sense of relieving
from the thought of separation from the
family. They think donation will make them a
factor to celebrate in a good manner.
“We wish not to have unexpected death
after a while. We made up our minds by giving
his organ”. (Participant I)
The theme ‘accepting the unexpected death’
has derived three subthemes as dedication of
the hospital staff, ambiguity of brain death and
awareness. Dedication of the hospital staff was
derived due to the immense dedication that is
being provided by the staff of the hospital,
specially the intensive care units. They try
their best to save the lives yet at last they
failed.
“Doctors and nurses do everything to save my
son. I don’t know what to do. They do everything
to my son. There’s nothing I can do. I only trust
about the medical team. We saw how much they
try to save my son. But at last we all failed.
(crying……..).” (Participant F)
Ambiguity of brain death signifies that the
most of the family members were very
unlikely knowing the terms and conditions
related to brain death. They were so frustrated
with this new information. All the terms are a
lot new for them.
“I never got to know about brain death. I was
confused how other body parts live in a brain
death person.”(Participant C)
Awareness explains the brain death and organ
donation is a new concept to the Sri Lankan
society. Since then there is no well-planned
public awareness program to update the
public. As well as normally Sri Lankans are not
motivated enough to see medical information
as a habit. So giving adequate information is a
key role in organ donation process. Most of the
participants had positive responses about the
information from health professionals.
“Doctors explained me that even though my
father’s brain was death his organs work well.
The doctor calmly explained the situation in
detailed. After that we gave consent.”
(Participant C)
Discussion:
The study identified both positive and
negative experiences of family members
regarding organ donation of their brain death
patient. Several Themes that were based on
lived experiences of the participants were
emerged with the organ donation process of
the brain death patient. The discussion
highlights the importance of the study and the
findings of the study that may be benefitted in
filling the existing gap in the field.
Psychological experiences of family members
regarding organ donation
Stressful decision making is the most
significant finding of this study. It is because
most of the brain deaths are unexpected ones
and the relatives feel sense of shock and panic.
Some relations think that the patient’s
condition will reverse by miracle. This is
consistent with a study conducted in China
where it is described that disbelief, anxiety
and acute psychological stress have been
experienced in most of the families when faced
with a brain death member (Wong & Chan,
2007).
Study revealed that the positive attitudes and
cooperative involvement of the family
members help to get concrete decisions. An
Australian study findings also suggest that
13th International Research Conference
General Sir John Kotelawala Defence University
Allied Health Sciences Sessions
168
existing, conflicting views and tensions ended
up with anxiety and once the family member is
over powered by another member make them
reluctant to take decisions (Ralph et al, 2013).
Moreover the internal dissonance directly
affecting the decision making process. Healthy
appearance of the body of the patient other
than the severe injuries hidden increases the
hope of recovery of the patient. According an
Iranian study it is revealed that the more
important the family role the patient plays,
more the expectation of the recovery of the
patient (Yousefi et al, 2012)
Socio cultural experiences of family members
regarding organ donation
The current study revealed that religious
beliefs play a key role in the decision making.
Findings of an Iranian study stated that the
chance of donation increases by the increasing
one score in the domain religious beliefs
(Ahmadian et al, 2009). Moreover another
study revealed donating families are highly
religious. Family members of these families
express that donating is saving life of others in
need. Furthermore and Australian study
revealed that the diseased donor would be
rewarded in their afterlife for fulfilling the
religious teachings. It is seen that families tend
to donate organs to save others’ lives and
helping them in the necessity. (Wilson et al,
2006)
Moreover honouring the donor’s decision was
very much important in organ donation. This
finding was consistent with an Australian
study, where the family members were
confident about the patient’s decision that
makes them comfortable with donating.
(Ralph et al, 2013). Further this allows the
donor live on which was also confirmed by the
Australian study where they have stated,
donating the organ will let them live on
another person body. This makes them to
release the grievance come with the complete
departure from the family as well (Ralphe et
al, 2013).
Institutional experiences of family member
regarding organ donation
It is clear that the awareness provided on
organ donation support the procedure, further
this was also confirmed with Australian study
where increasing the awareness of the family
would be benefiting on late support in
donation of the organs. Ambiguity of brain
death happens due to the lack of knowledge on
brain death on family members. The same
concept evolved since participants request
more comprehensive information on brain
injuries and how they are medically confirmed
(Ralph et al, 2013).
Conclusion
Beliefs and experiences revealed by the
participants along with the ambiguity on brain
death and organ donation is clearly emerged
through the interviewing process. Family
members of the brain death patients would be
much benefited if much information about
brain death identification is disclosed. This
might help in improving the rate of organ
donation currently existing in Sri Lanka.
References:
Ahmadian, S,H, Haghdoost, A,
&Mohommadalizadeh, S, 2009, Effective factors on
the decision of families to donate the organ of their
brain death relatives. Journal of Kerman University
Medical Sciences, vol.16, no. 4, pp. 353-63.
Anker, A,E, Feely, T,H, 2010, Why families decline
donation: the perspective of organ procurement
coordinators. Progress in Transplantation, vol.20,
no.3, pp. 239-246.
Groot, J,D, Dassen, M,V, Hoedemaekers, C, Hoitsma,
A, Smeets, W, Leeuwen, E,V, 2012, Decision making
by relatives about brain dealth organ donation: an
integrated review. Transplantation, vol.93, no. 12,
pp. 1196-1211.
Matesanz, R, Dominguez-Gil, B, Coll, E, mahillo,B,
Rosa, G,D L, Valentin, M, 2017, Transplant
programs worldwide and Spanish miracle. Kidney
transplantation, bioengineering and regeneration,
pp. 13-27.
13th International Research Conference
General Sir John Kotelawala Defence University
Allied Health Sciences Sessions
169
Ralphe, A, Chapman, J, R., Gillis, J, Craig, J,C, Butow,
P, Howard, K, Irving, M, Sutanto, B and Tong, A,
2014, Family perspectives on Deceased Organ
Donation: Thematic Synthesis of Qualitative
Studies. American Journal of Transplantation,
vol.14, pp. 923-935.
Sulania, A, Sachdeva, S, Jha, D, Kaur, G, and
Sachdeva, R, 2016. Organ donation and
transplantation: an updated overview. MAMC
Journal of Medical Sciences. Vol. 2, no. 1, pp.18-27.
Wig,N, Gupta, P, Kailash, S, 2003, Awareness of
Brain Death and Organ Transplantation Among
Select Indian Population, Journal Association of
Physicians of India, vol.51, pp. 455 -458.
Wilson P, Sexton W, Singh A, Smith M, Durham S,
Cowie A and Fritschi, L, 2006, Family experiences
of tissue donation in Australia. Progress in
Transplantation, vol.16, no. 1, pp.52-56.
Wong, M,S, and Chan, S,W,C, 2007, The experiences
of Chinese family members of terminally ill
patients – a qualitative study. Journal of Clinical
Nursing, Vol.16, no. 12, pp. 2357–2364.
World Health Organization, 2010, WHO guiding
principles on human cell, tissue and organ
transplantation, viewed on 27 August 2020, <
http:www.who.int/transplantation/donation/en/
>
Yousefi, H, Roshani, A, and Nazari, F, 2014,
Experiences of the families concerning organ
donation of a family member with brain death.
Iranian Journal of Nursing and Midwifery Research,
vol. 9, no.3, pp. 323-330.
13th International Research Conference
General Sir John Kotelawala Defence University
Allied Health Sciences Sessions
170
Investigation of Nasal Colonization of Methicillin-Resistant
Staphylococcus aureus Among Nursing Students at a University in Sri
Lanka
Pathiraja P.A.C.P1#, Gamage C.D.2, Dissanayake B.N3
1 Department of Nursing, Faculty of Allied Health Sciences, University of Peradeniya 2,3 Department of Microbiology, Faculty of Medicine, University of Peradeniya
Abstract Methicillin-Resistant Staphylococcus
aureus (MRSA) is one of the important
pathogenic bacteria within the hospital and
the community. Asymptotic nasal carriers are
potential sources for transmission and
subsequent infection. Objectives of this study
were to determine the MRSA nasal
colonization among nursing students of the
Department of Nursing, Faculty of Allied
Health Sciences, University of Peradeniya, Sri
Lanka and to assess associated risk factors.
This was a descriptive cross-sectional study
which was conducted from January 2020 to
March 2020 with voluntary participation of
135 nursing students. Relevant data were
collected by using a pre-tested, self-
administrated questionnaire. Participants
were requested to collect nasal swabs to
investigate colonization of MRSA. Routine
standard microbiological methods were used
to isolate Staphylococcus aureus and cefoxitin
disk diffusion method used to detect
methicillin sensitivity. Collected data were
statistically analyzed and the possible
associations with risk factors were assessed
by cross tabulations and chi-square test. Total
of 135 participants constituted with 34 males
and 101 females between 21-27 years. Out of
them 15.56% (21/135) were identified as
colonized with Staphylococcus aureus and 5.19
% (7/135) were MRSA. History of skin
infection was the only known risk factor
identified as associated with MRSA nasal
colonization (OR=26, CI=2.99-226.13,
p=0.00). Although identified MRSA colonizers
are relatively low in the present study they are
potential candidates for transmission and is a
concern in healthcare facilities. As screening
programs are limited in Sri Lanka due to lack
of facilities and financial resources, students
should be emphasized regarding simple
preventive measures such as hand hygiene.
Keywords: Methicillin-Resistant
Staphylococcus aureus (MRSA), Nasal
colonization, Nursing students, Risk factors
Introduction:
Staphylococcus aureus is a human commensal
bacterium, 20-30% of the healthy human
population carries it on the skin and mucous
membranes especially in nose and perineum
(Sakr et al., 2018). Although it is a human
commensal it can invasive and cause wide
range of infections including skin abscess,
post-operative wound infections, septicemia
and pneumonia. (Guidelines for the Control of
Methicillin-resistant Staphylococcus aureus in
New Zealand, 2002).Treatment of
Staphylococcus aureus infections has become
more complicated and significantly limited
due to MRSA strains(Prates et al., 2010) (Al-
tamimi et al., 2018). The majority of hospital-
acquired infections (HAI) are caused by MRSA
Strains. Worldwide largely concern about
increasing prevalence of MRSA infections and
controlling the spread of organisms
(Thevanesam et al., 2013). The primary route
of MRSA transmission in the health care
setting is through, direct contact with an
infected person, contaminated hands of
healthcare workers and, asymptomatic
carriers of MRSA (Tong et al., 2015).Usually,
MRSA carriers are not clinically infected but
MRSA organisms can be colonized on their
13th International Research Conference
General Sir John Kotelawala Defence University
Allied Health Sciences Sessions
171
skin (odu NN, 2012). Most areas of the body
can colonize with MRSA, but nose, throat,
groin, and hands have been identified as
hotspots for MRSA colonization (Brown et al.,
2015). It has identified nasal carriers are
playing a key role in pathogenesis and
subsequent MRSA infections (Prates et al.,
2010). Screening has facilitated the early
identification of the MRSA colonized
individual and promote contact precautions. It
is involved performing culture and sensitivity
test on a collected sample such as nasal, groin,
and throat. Nursing students are encountered
with more patients and involved in direct
patient care during the clinical practice at the
hospital. Due to prolonged contact with the
patients, there is a significant risk of
transmission pathogens among nursing
students and patients. Hence, this study was
designed to identify the nasal colonization of
MRSA, and to evaluate the associated risk
factors among nursing students at the
Department of Nursing, Faculty of Allied
Health Sciences, University of Peradeniya, Sri
Lanka.
Methodology:
Study design and Setting
A descriptive cross-sectional study was
conducted from January 2020 to March 2020
at the Faculty of Allied Health Sciences,
University of Peradeniya, Sri Lanka. A total of
135 undergraduate nursing students from
first year to the final year, who are currently
engaged in hospital based clinical training
were recruited according to the inclusion and
exclusion criteria. Therefore Students who
had contraindications for nasal sampling such
as recent nasal surgery, active nasal bleeding
and use of nasal medications were excluded.
Data collection and sample processing:
A pre-tested, self-administered questionnaire
was administered to the participants to assess
socio-demographic factors and known MRSA
risk factors.
Self-collected nasal swab samples were used
to investigate the colonization of MRSA in the
nasal cavity. Pre-moistened (with sterile
saline) swab used to collect sample along with
the questionnaire. Collected samples were
transferred to the Department of
Microbiology, Faculty of Medicine, University
of Peradeniya with minimum delay for
specimen processing. Collected nasal swabs
were enriched in 7% NaCl nutrient broth
individually and incubated for overnight at 35o
C. Enriched samples were inoculated on
mannitol salt agar and incubated at 35o C for
18-24 hours. Following the incubation,
observed for suspected staphylococcus
colonies according to colony morphology
(suspected colonies appeared yellow colour in
mannitol salt agar).
Suspected staphylococcus colonies sub
cultured on blood agar and incubated at 35o C
for 18- 24 hours to obtain pure-isolates. Gram
staining, catalase enzyme test, slide coagulase,
tube coagulase and DNase test performed for
identification of Staphylococcus aureus.
Methicillin sensitivity test for Staphylococcus
aureus were tested by using the standard
cefoxitin disc diffusion method according to
guidelines of the Clinical and Laboratory
Standards Institute. The inhibition zone
diameter was measured and interpreted using
CLSI recommendations (resistant≤ 21 mm,
sensitive ≥ 22 mm)(Clinical and Laboratory
Standards Institute, 2018).
Ethical consideration:
Ethical clearance was obtained from the Ethics
Review Committee of Faculty of Allied health
Sciences, University of Peradeniya
(AHS/ERC/2019/064) on 19th December 2019.
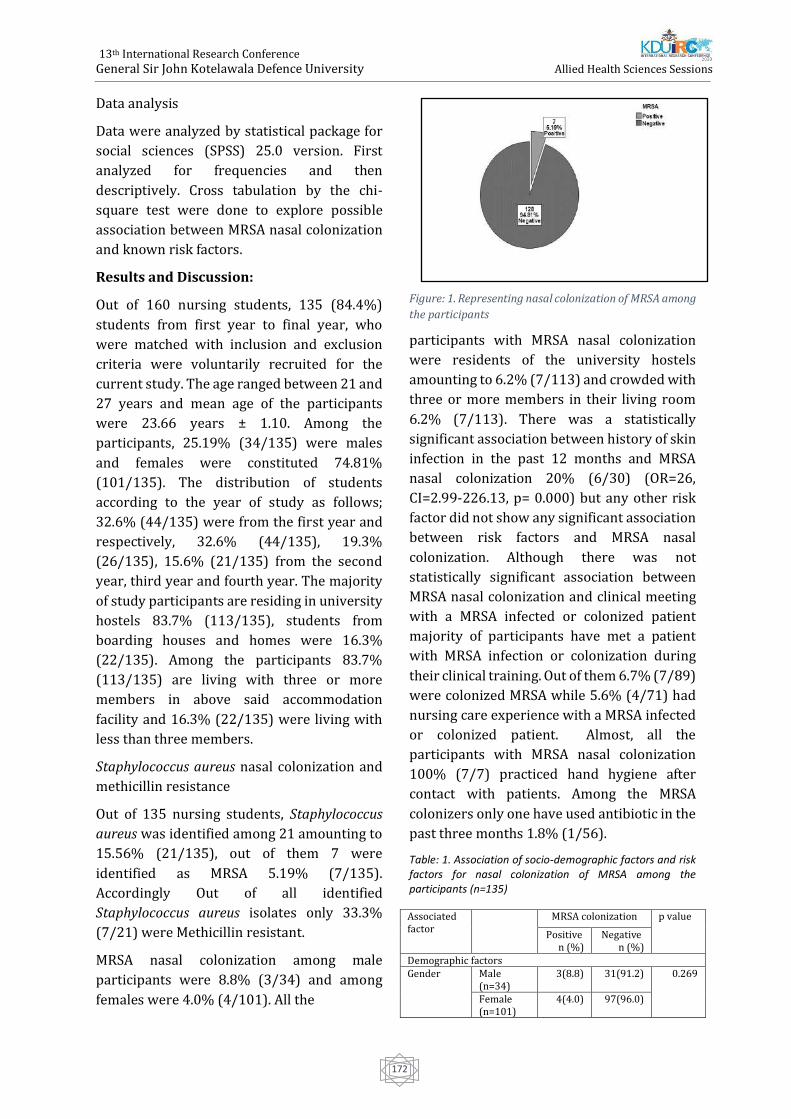
13th International Research Conference
General Sir John Kotelawala Defence University
Allied Health Sciences Sessions
172
Data analysis
Data were analyzed by statistical package for
social sciences (SPSS) 25.0 version. First
analyzed for frequencies and then
descriptively. Cross tabulation by the chi-
square test were done to explore possible
association between MRSA nasal colonization
and known risk factors.
Results and Discussion:
Out of 160 nursing students, 135 (84.4%)
students from first year to final year, who
were matched with inclusion and exclusion
criteria were voluntarily recruited for the
current study. The age ranged between 21 and
27 years and mean age of the participants
were 23.66 years ± 1.10. Among the
participants, 25.19% (34/135) were males
and females were constituted 74.81%
(101/135). The distribution of students
according to the year of study as follows;
32.6% (44/135) were from the first year and
respectively, 32.6% (44/135), 19.3%
(26/135), 15.6% (21/135) from the second
year, third year and fourth year. The majority
of study participants are residing in university
hostels 83.7% (113/135), students from
boarding houses and homes were 16.3%
(22/135). Among the participants 83.7%
(113/135) are living with three or more
members in above said accommodation
facility and 16.3% (22/135) were living with
less than three members.
Staphylococcus aureus nasal colonization and
methicillin resistance
Out of 135 nursing students, Staphylococcus
aureus was identified among 21 amounting to
15.56% (21/135), out of them 7 were
identified as MRSA 5.19% (7/135).
Accordingly Out of all identified
Staphylococcus aureus isolates only 33.3%
(7/21) were Methicillin resistant.
MRSA nasal colonization among male
participants were 8.8% (3/34) and among
females were 4.0% (4/101). All the
Figure: 1. Representing nasal colonization of MRSA among
the participants
participants with MRSA nasal colonization
were residents of the university hostels
amounting to 6.2% (7/113) and crowded with
three or more members in their living room
6.2% (7/113). There was a statistically
significant association between history of skin
infection in the past 12 months and MRSA
nasal colonization 20% (6/30) (OR=26,
CI=2.99-226.13, p= 0.000) but any other risk
factor did not show any significant association
between risk factors and MRSA nasal
colonization. Although there was not
statistically significant association between
MRSA nasal colonization and clinical meeting
with a MRSA infected or colonized patient
majority of participants have met a patient
with MRSA infection or colonization during
their clinical training. Out of them 6.7% (7/89)
were colonized MRSA while 5.6% (4/71) had
nursing care experience with a MRSA infected
or colonized patient. Almost, all the
participants with MRSA nasal colonization
100% (7/7) practiced hand hygiene after
contact with patients. Among the MRSA
colonizers only one have used antibiotic in the
past three months 1.8% (1/56).
Table: 1. Association of socio-demographic factors and risk factors for nasal colonization of MRSA among the participants (n=135)
Associated factor
MRSA colonization p value
Positive n (%)
Negative n (%)
Demographic factors Gender Male
(n=34) 3(8.8) 31(91.2) 0.269
Female (n=101)
4(4.0) 97(96.0)
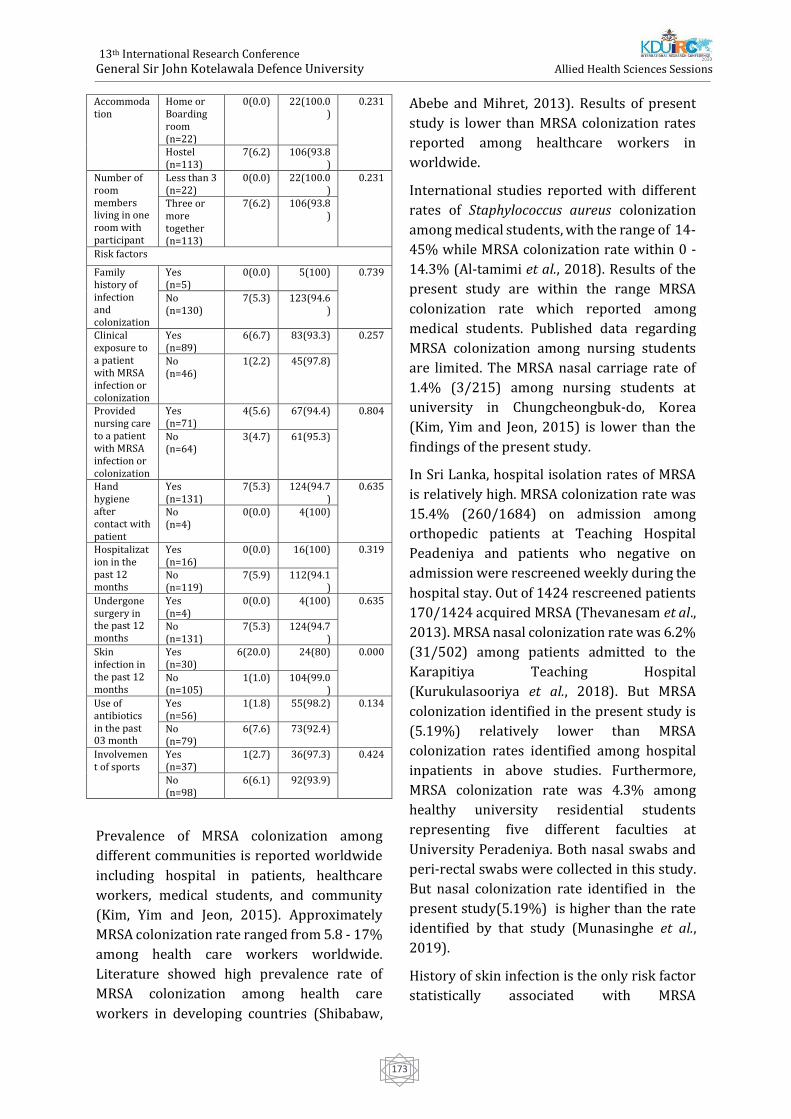
13th International Research Conference
General Sir John Kotelawala Defence University
Allied Health Sciences Sessions
173
Accommodation
Home or Boarding room (n=22)
0(0.0) 22(100.0)
0.231
Hostel (n=113)
7(6.2) 106(93.8)
Number of room members living in one room with participant
Less than 3 (n=22)
0(0.0) 22(100.0)
0.231
Three or more together (n=113)
7(6.2) 106(93.8)
Risk factors
Family history of infection and colonization
Yes (n=5)
0(0.0) 5(100) 0.739
No (n=130)
7(5.3) 123(94.6)
Clinical exposure to a patient with MRSA infection or colonization
Yes (n=89)
6(6.7) 83(93.3) 0.257
No (n=46)
1(2.2) 45(97.8)
Provided nursing care to a patient with MRSA infection or colonization
Yes (n=71)
4(5.6) 67(94.4) 0.804
No (n=64)
3(4.7) 61(95.3)
Hand hygiene after contact with patient
Yes (n=131)
7(5.3) 124(94.7)
0.635
No (n=4)
0(0.0) 4(100)
Hospitalization in the past 12 months
Yes (n=16)
0(0.0) 16(100) 0.319
No (n=119)
7(5.9) 112(94.1)
Undergone surgery in the past 12 months
Yes (n=4)
0(0.0) 4(100) 0.635
No (n=131)
7(5.3) 124(94.7)
Skin infection in the past 12 months
Yes (n=30)
6(20.0) 24(80) 0.000
No (n=105)
1(1.0) 104(99.0)
Use of antibiotics in the past 03 month
Yes (n=56)
1(1.8) 55(98.2) 0.134
No (n=79)
6(7.6) 73(92.4)
Involvement of sports
Yes (n=37)
1(2.7) 36(97.3) 0.424
No (n=98)
6(6.1) 92(93.9)
Prevalence of MRSA colonization among
different communities is reported worldwide
including hospital in patients, healthcare
workers, medical students, and community
(Kim, Yim and Jeon, 2015). Approximately
MRSA colonization rate ranged from 5.8 - 17%
among health care workers worldwide.
Literature showed high prevalence rate of
MRSA colonization among health care
workers in developing countries (Shibabaw,
Abebe and Mihret, 2013). Results of present
study is lower than MRSA colonization rates
reported among healthcare workers in
worldwide.
International studies reported with different
rates of Staphylococcus aureus colonization
among medical students, with the range of 14-
45% while MRSA colonization rate within 0 -
14.3% (Al-tamimi et al., 2018). Results of the
present study are within the range MRSA
colonization rate which reported among
medical students. Published data regarding
MRSA colonization among nursing students
are limited. The MRSA nasal carriage rate of
1.4% (3/215) among nursing students at
university in Chungcheongbuk-do, Korea
(Kim, Yim and Jeon, 2015) is lower than the
findings of the present study.
In Sri Lanka, hospital isolation rates of MRSA
is relatively high. MRSA colonization rate was
15.4% (260/1684) on admission among
orthopedic patients at Teaching Hospital
Peadeniya and patients who negative on
admission were rescreened weekly during the
hospital stay. Out of 1424 rescreened patients
170/1424 acquired MRSA (Thevanesam et al.,
2013). MRSA nasal colonization rate was 6.2%
(31/502) among patients admitted to the
Karapitiya Teaching Hospital
(Kurukulasooriya et al., 2018). But MRSA
colonization identified in the present study is
(5.19%) relatively lower than MRSA
colonization rates identified among hospital
inpatients in above studies. Furthermore,
MRSA colonization rate was 4.3% among
healthy university residential students
representing five different faculties at
University Peradeniya. Both nasal swabs and
peri-rectal swabs were collected in this study.
But nasal colonization rate identified in the
present study(5.19%) is higher than the rate
identified by that study (Munasinghe et al.,
2019).
History of skin infection is the only risk factor
statistically associated with MRSA
13th International Research Conference
General Sir John Kotelawala Defence University
Allied Health Sciences Sessions
174
colonization (20.0%, OR=26, CI=2.99-226.13,
p value=0.000) in the current study while
other studies reported statistically significant
association with gender, chronic illness,
history of hospitalization and antibiotic usage.
But in the present study, none of the MRSA
colonizers have been hospitalized for the past
12 months while only one colonizer reported
with antibiotic usage during the past 3 months
of period. Interestingly in the present study,
there was no significant association between
clinical exposure and MRSA colonization
whereas 6.7% (6/7) of the MRSA colonizers
have met a patient with MRSA infection or
colonization during hospital training while
5.6% (4/7) had an experience of providing
nursing care to a patient with MRSA infection
or colonization. Knowledge of basic infection
management, proper hand hygiene, and use of
protective equipment in nursing care may
have affected the transmission of MRSA
among patients and students. As most of the
known risk factors have not shown to be
associated with MRSA colonization in the
present study, this may indicate that possible
risk factors yet to be identified if any which
associate with the nasal colonization of MRSA
among nursing students.
Conclusion and Recommendations:
The present study provides an overview of
MRSA nasal colonization of the nursing
students attached to a university in Sri Lanka.
Among 135 nursing students, 15.6% (21/135)
which is a significant percentage, was
identified as colonized with Staphylococcus
aureus and 5.2% (7/21) of those were MRSA.
As nursing students are involved with
healthcare, carriage of MRSA is a concern in
infection control. History of skin infection in
the past 12 months was the only known risk
factor identified in this study with significant
association with MRSA colonization.
Screening programs are limited in Sri Lanka
due to lack of facilities and financial resources.
But simple preventive measures such as hand
hygiene which is both affordable and effective
for preventing MRSA transmission need to be
strengthened in healthcare. Awareness of
MRSA is vital to prevent transmission and
subsequent infections, especially students'
exposure to the clinical-setting. Future studies
should be conducted in a large population
with healthy participants to identify the extent
of the carriage and the possible risk factors
associated with MRSA colonization. Further
molecular studies will be beneficial to
characterize MRSA strains associated with
healthy individuals.
References:
Al-tamimi, M., Himsawi, N., Abu-raideh, J.,
Jazar, D. abu, Jawaldesh, H. Al, Mahmoud, A. H.,
… Hawamdeh, H. (2018). Nasal colonization by
methicillin-sensitive and methicillin-resistant
Staphylococcus aureus among medical
students. The Journal Of Infection In
Developing Countries, 12(5), pp.326–335.
Brown, K., Fournier, F., Plaugher, R., &
Robbins, J. (2015). Methicillin-resistant
Staphylococcus aureus ( MRSA ) Prevalence at
Xavier University : Clinical- attending
Students are 2x More Likely to Colonize MRSA.
Biology. Paper 1.
Clinical and Laboratory Standards Institute.
(2018). M100 Performance Standards for
Antimicrobial 28 th Edition.
Guidelines for the Control of Methicillin-
resistant Staphylococcus aureus in New
Zealand. (2002).
Kurukulasooriya, R., Tillekeratne, G.,
Mudiyanselage, W., Gaya, D., Wijayaratne, B., &
Bodinayake, C. (2016). Methicillin-resistant
Staphylococcus aureus : prevalence of and risk
factors associated with colonization of patients
on admission to the Teaching hospital ,
Methicillin-resistant Staphylococcus aureus :
prevalence of and risk factors associated with
colo. (December 2018).
Munasinghe, T., Liyanapathirana, V.,
Ekanayake, A., Vidanapathirana, G., Akram, I.,
Angulmaduwa, S., … Kalupahana, R. (2019).
13th International Research Conference
General Sir John Kotelawala Defence University
Allied Health Sciences Sessions
175
Colonization with selected antibiotic resistant
bacteria among a cohort of Sri Lankan
university students. Presented at BSAC Spring
Conference 2019, (March), 2019.
odu NN, O. I. (2012). New York Science Journal
2012;5(7)
http://www.sciencepub.net/newyork Nasal
carriage and antibiotics susceptibility of. New
York Science Journal, 5(7), 56–63. Retrieved
from http://www.sciencepub.net/newyork
Prates, K., Torres, A. M., Garcia, L. B., Yamada,
S. F., Ogatta, Cardoso, C. L., Tognim. (2010).
BRIEF Nasal carriage of methicillin-resistant
Staphylococcus aureus in university students.
Brazil Journal of Infectious Diseases, 14(3), pp.
316–318.
Sakr, A., Brégeon, F., Mège, J., Rolain, J., &
Gobert, A. P. (2018). Staphylococcus aureus
Nasal Colonization : An Update on Mechanisms
, Epidemiology , Risk Factors , and Subsequent
Infections. 9(October), pp. 1–15.
Shibabaw, A., Abebe, T., & Mihret, A. (2013).
Nasal carriage rate of methicillin resistant
Staphylococcus aureus among Dessie Referral
Hospital Health Care Workers ; Dessie ,
Northeast Ethiopia. Antimicrobial Resistance
and Infection Control, 2(25), pp. 1–5.
Thevanesam, V., Suraweera, H. J., Kannangara,
P., Weerasekera, I. K. B., Abeywardena, H. M.
W., Ekanayake, E. W. M. A., & Gamage, T. M.
(2013). Prospective 18 month surveillance
study of MRSA colonization in an Orthopedic
unit in Sri Lanka . Sri Lankan Journal of
Infectious Diseases, 3(1), pp. 9–14.
Tong, S. Y. C., Davis, J. S., Eichenberger, E.,
Holland, T. L., & Fowler, V. G. (2015).
Staphylococcus aureus Infections :
Epidemiology , Pathophysiology , Clinical
Manifestations , and Management. Clinical
Microbiology Reviews, 28(3), pp. 603–661.
13th International Research Conference
General Sir John Kotelawala Defence University
Allied Health Sciences Sessions
176
Manual Immature Reticulocyte Fraction: a reliable marker to assess
post traumatic blood loss.
J.K.D. Wijegunawardena1#, K.A.C. Wickramaratne2
1Department of Medical Laboratory Science, Faculty of Allied Health Sciences, University of Ruhuna
2Department of Pathology, Faculty of Medicine, University of Ruhuna
Abstract. Hemorrhage is a common stress
condition following acute trauma that needs
prompt medical attention as it can be fatal.
Traumatic haemorrhage be classified into
three categories; mild, moderate and severe
based on clinical manifestations and
outcomes expected with each. However,
some instances, clinical features may not
reflect exact degree of blood loss due to other
comorbid factors etc. Rapid marrow
response to haemorrhage includes release of
more immature red cells; reticulocytes and
normoblasts depending on haemopoietic
stimulus. Therefore, the presence of red cell
precursors in peripheral blood is an expected
marker following acute hemorrhage. Among
reticulocyte parameters, Immature
Reticulocyte Fraction (IRF) is widely used to
indicate the erythropoietic activity of the
bone marrow in stress conditions. Even
though the manual reticulocyte count is
performed in laboratories, calculation of
manual IRF is not routinely practiced. Based
on morphology, reticulocytes can be
classified in to immature and mature sub
types. Although automated method is
available, it is costly to use. Therefore this
study was performed to evaluate the
relationship of manual IRF with degree of
hemorrhage in acute trauma. In this
analytical cross-sectional study, 38 blood
samples of acute trauma patients admitted to
emergency trauma care at a tertiary care
hospital were analyzed. The IRF values were
significantly higher in study subjects with
severe hemorrhage than mild and moderate.
When the time duration from trauma to
admission was considered, subjects with
clinically severe hemorrhage showed high IRF
values within one hour. Appearance of the most
immature (stage I) reticulocytes were noted
after two hours of trauma in study subjects.
Therefore, this study supports us ability of
manual IRF in objective assessment of early
marrow response to hemorrhage thus
assessment of severity of acute trauma. Thus
the manual IRF in peripheral blood can be
considered an important, reliable and cheap
laboratory indicator in acute trauma care in the
diagnosis and management acute blood loss.
Keywords: Immature Reticulocyte Fraction,
Degree of hemorrhage, Acute trauma
Introduction:
Haemorrhage is a common major complication
in acute trauma that needs prompt medical
attention as it can cause significant morbidity
and mortality due to acute hypovolemia and
shock. Clinically, blood loss in trauma care is
classified into three categories according to the
severity as mild, moderate and severe.This
clinical classification aid patient management
thus outcomes. Following acute hemorrhage,
red cell production is activated in response to
impaired tissue perfusion through increased
erythropoietin secreted by kidneys. More
immature stages of red cells are released into
circulation and remain longer in circulationin
the presence of erythropoieticdrive together
with massive production of red cells
predominantly. This is well documented in both
haemorrhage and haemolysis.
Immature red cells are detected using a special
supra-vital stain and the test is called
reticulocyte count. This test specifically stain
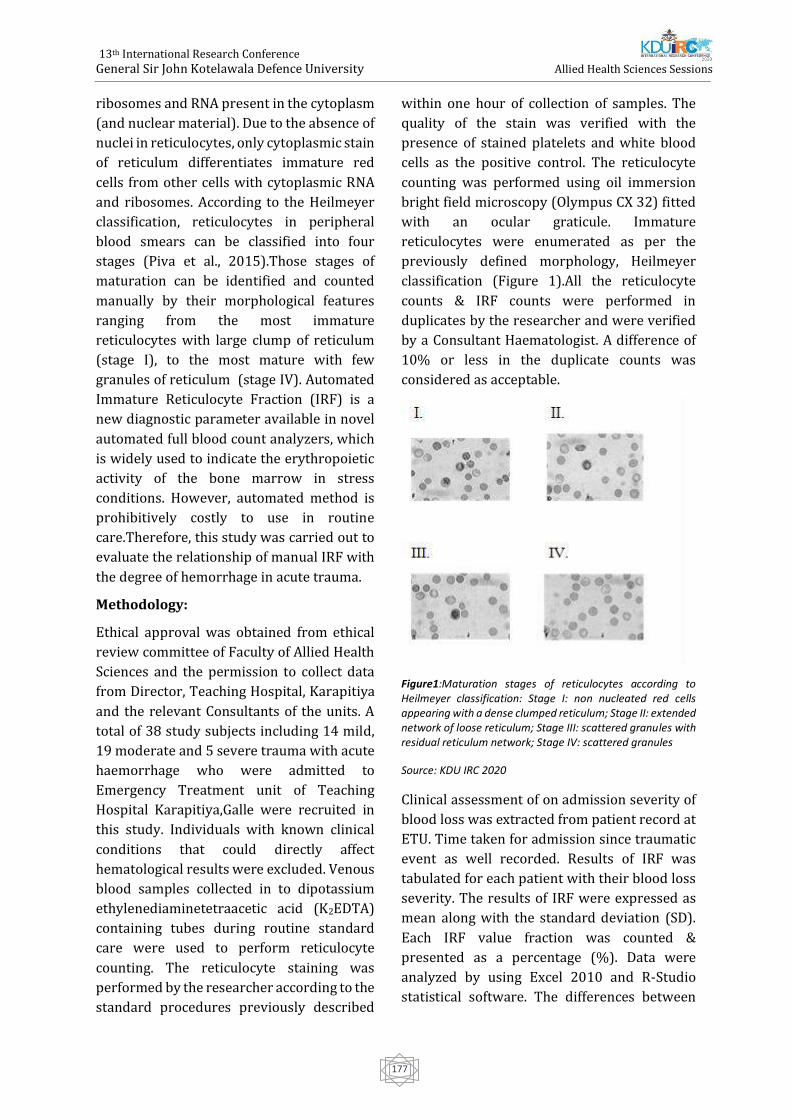
13th International Research Conference
General Sir John Kotelawala Defence University
Allied Health Sciences Sessions
177
ribosomes and RNA present in the cytoplasm
(and nuclear material). Due to the absence of
nuclei in reticulocytes, only cytoplasmic stain
of reticulum differentiates immature red
cells from other cells with cytoplasmic RNA
and ribosomes. According to the Heilmeyer
classification, reticulocytes in peripheral
blood smears can be classified into four
stages (Piva et al., 2015).Those stages of
maturation can be identified and counted
manually by their morphological features
ranging from the most immature
reticulocytes with large clump of reticulum
(stage I), to the most mature with few
granules of reticulum (stage IV). Automated
Immature Reticulocyte Fraction (IRF) is a
new diagnostic parameter available in novel
automated full blood count analyzers, which
is widely used to indicate the erythropoietic
activity of the bone marrow in stress
conditions. However, automated method is
prohibitively costly to use in routine
care.Therefore, this study was carried out to
evaluate the relationship of manual IRF with
the degree of hemorrhage in acute trauma.
Methodology:
Ethical approval was obtained from ethical
review committee of Faculty of Allied Health
Sciences and the permission to collect data
from Director, Teaching Hospital, Karapitiya
and the relevant Consultants of the units. A
total of 38 study subjects including 14 mild,
19 moderate and 5 severe trauma with acute
haemorrhage who were admitted to
Emergency Treatment unit of Teaching
Hospital Karapitiya,Galle were recruited in
this study. Individuals with known clinical
conditions that could directly affect
hematological results were excluded. Venous
blood samples collected in to dipotassium
ethylenediaminetetraacetic acid (K2EDTA)
containing tubes during routine standard
care were used to perform reticulocyte
counting. The reticulocyte staining was
performed by the researcher according to the
standard procedures previously described
within one hour of collection of samples. The
quality of the stain was verified with the
presence of stained platelets and white blood
cells as the positive control. The reticulocyte
counting was performed using oil immersion
bright field microscopy (Olympus CX 32) fitted
with an ocular graticule. Immature
reticulocytes were enumerated as per the
previously defined morphology, Heilmeyer
classification (Figure 1).All the reticulocyte
counts & IRF counts were performed in
duplicates by the researcher and were verified
by a Consultant Haematologist. A difference of
10% or less in the duplicate counts was
considered as acceptable.
Figure1:Maturation stages of reticulocytes according to Heilmeyer classification: Stage I: non nucleated red cells appearing with a dense clumped reticulum; Stage II: extended network of loose reticulum; Stage III: scattered granules with residual reticulum network; Stage IV: scattered granules
Source: KDU IRC 2020
Clinical assessment of on admission severity of
blood loss was extracted from patient record at
ETU. Time taken for admission since traumatic
event as well recorded. Results of IRF was
tabulated for each patient with their blood loss
severity. The results of IRF were expressed as
mean along with the standard deviation (SD).
Each IRF value fraction was counted &
presented as a percentage (%). Data were
analyzed by using Excel 2010 and R-Studio
statistical software. The differences between
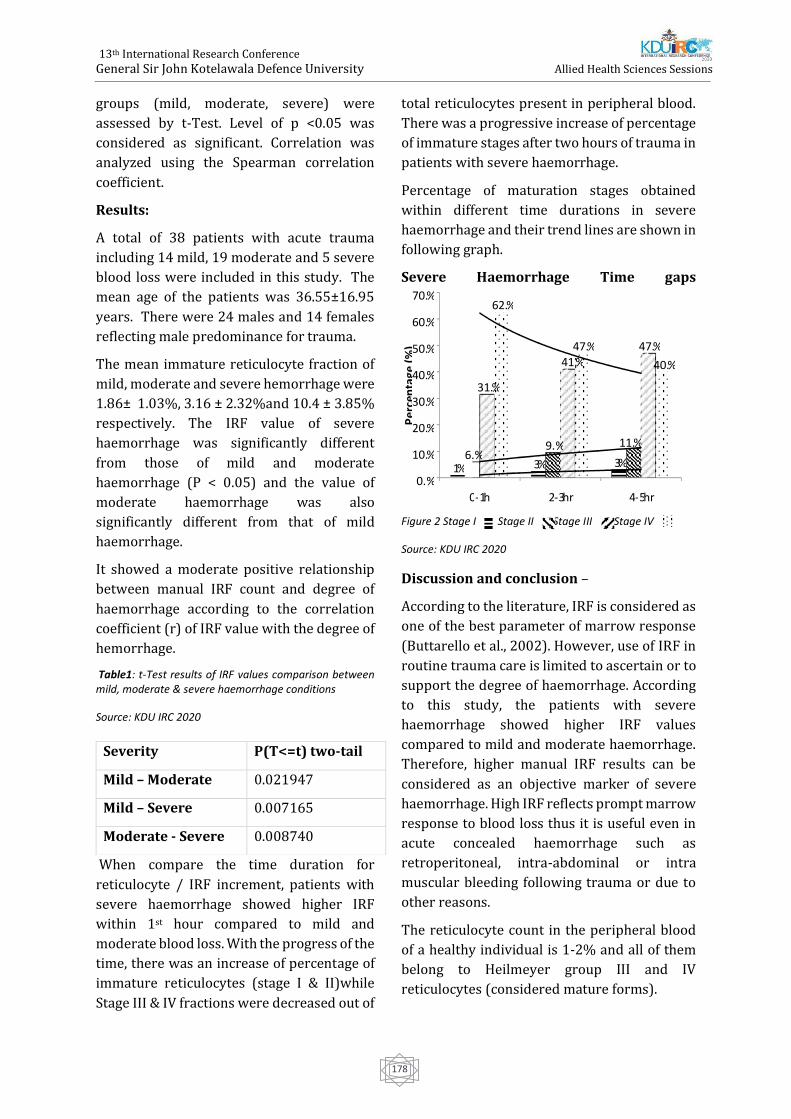
13th International Research Conference
General Sir John Kotelawala Defence University
Allied Health Sciences Sessions
178
groups (mild, moderate, severe) were
assessed by t-Test. Level of p <0.05 was
considered as significant. Correlation was
analyzed using the Spearman correlation
coefficient.
Results:
A total of 38 patients with acute trauma
including 14 mild, 19 moderate and 5 severe
blood loss were included in this study. The
mean age of the patients was 36.55±16.95
years. There were 24 males and 14 females
reflecting male predominance for trauma.
The mean immature reticulocyte fraction of
mild, moderate and severe hemorrhage were
1.86± 1.03%, 3.16 ± 2.32%and 10.4 ± 3.85%
respectively. The IRF value of severe
haemorrhage was significantly different
from those of mild and moderate
haemorrhage (P < 0.05) and the value of
moderate haemorrhage was also
significantly different from that of mild
haemorrhage.
It showed a moderate positive relationship
between manual IRF count and degree of
haemorrhage according to the correlation
coefficient (r) of IRF value with the degree of
hemorrhage.
Table1: t-Test results of IRF values comparison between mild, moderate & severe haemorrhage conditions
Source: KDU IRC 2020
When compare the time duration for
reticulocyte / IRF increment, patients with
severe haemorrhage showed higher IRF
within 1st hour compared to mild and
moderate blood loss. With the progress of the
time, there was an increase of percentage of
immature reticulocytes (stage I & II)while
Stage III & IV fractions were decreased out of
total reticulocytes present in peripheral blood.
There was a progressive increase of percentage
of immature stages after two hours of trauma in
patients with severe haemorrhage.
Percentage of maturation stages obtained
within different time durations in severe
haemorrhage and their trend lines are shown in
following graph.
Severe Haemorrhage Time gaps
Figure 2 Stage I Stage II Stage III Stage IV
Source: KDU IRC 2020
Discussion and conclusion –
According to the literature, IRF is considered as
one of the best parameter of marrow response
(Buttarello et al., 2002). However, use of IRF in
routine trauma care is limited to ascertain or to
support the degree of haemorrhage. According
to this study, the patients with severe
haemorrhage showed higher IRF values
compared to mild and moderate haemorrhage.
Therefore, higher manual IRF results can be
considered as an objective marker of severe
haemorrhage. High IRF reflects prompt marrow
response to blood loss thus it is useful even in
acute concealed haemorrhage such as
retroperitoneal, intra-abdominal or intra
muscular bleeding following trauma or due to
other reasons.
The reticulocyte count in the peripheral blood
of a healthy individual is 1-2% and all of them
belong to Heilmeyer group III and IV
reticulocytes (considered mature forms).
Severity P(T<=t) two-tail
Mild – Moderate 0.021947
Mild – Severe 0.007165
Moderate - Severe 0.008740
% 1 3 % 3 % 6.
0 %
% 9.
5
11.
0 %
31.
5 %
41.
0 %
47.
0 %
62.
5 %
47.
0 %
40.
0 %
0.
0 %
10.
0 %
% 20.
0
% 30.
0
% 40.
0
% 50.
0
60.
0 %
70.
0 %
0 - hr
1 2 - 3 hr
s 4 - 5 hr
s
13th International Research Conference
General Sir John Kotelawala Defence University
Allied Health Sciences Sessions
179
The group I and II reticulocytes are not
normally found in peripheral circulation
(Crouch et al., 1985) in healthy subjects. In
this study, stage I reticulocytes appeared in
higher percentages (>3%) in the blood
samples which were collected two hours
after the trauma. In compliance with
literature available, this study too shows that
the time taken for marrow response to occur
in severe haemorrhage is over two hours.
Findings of this study show the importance
of properly performed manual IRF in
differentiating the severity of haemorrhage
in patients with trauma. Therefore, we
conclude that, the manual IRF can be
considered as a reliable, cheaper alternative
marker of post traumatic blood loss.
References
Bain, B. (2006). Blood cells. 4th ed. Malden,
Mass.: Blackwell.
Bain, B., Lewis, S., Bates, I. and Laffan, M. (2011).
Dacie and Lewis practical haematology. 11th ed.
[Edinburgh]: Churchill Livingstone, pp.36-37.
Buttarello, M., Bulian, P., Farina, G., Petris, M.,
Temporin, V. and Toffolo, L. (2002). Five Fully
Automated Methods for Performing Immature
Reticulocyte Fraction. American Journal of
Clinical Pathology, 117(6), pp.871-879.
Crouch, J. and Kaplow, L. (1985). Relationship of
reticulocyte age to polychromasia, shift cells,
and shift reticulocytes. Arch Pathol Lab Med.,
109(4), pp.325-329.
ICSH guidelines for reticulocyte counting by
microscopy on supravitally stained
preparations. (1992). World Health
Organization.
Piva, E., Brugnara, C., Spolaore, F. and Plebani,
M. (2015). Clinical Utility of Reticulocyte
Parameters. Clinics in Laboratory Medicine,
35(1), pp.133-163.
13th International Research Conference
General Sir John Kotelawala Defence University
Allied Health Sciences Sessions
180
Awareness on Prevention of Common Oral Diseases Among
Non – Dental Undergraduate Students of University of Peradeniya
NT Wijesinghe1#, BMHSK Bannaheka2, TS Amarasinghe1
1 Department of Nursing, Faculty of Allied Health Sciences, University of Peradeniya 2 Department of Basic Sciences, Faculty of Dental Sciences, University of Peradeniya
Abstract:. In Sri Lankan context, dental
caries, periodontal diseases and oral cancers
are the common oral diseases with a higher
prevalence .Objective of this study was to
assess the awareness on prevention of
common oral diseases among non-dental
undergraduate students of University of
Peradeniya.A descriptive cross-sectional
study was conducted among 489 non-dental
undergraduate students in University of
Peradeniya .A self-administered
questionnaire was used to collect data in the
study .Awareness of the participants was
categorized into three groups according to
the scores they have obtained (≥75 – High
Awareness, 74-50 – Moderate Awareness,
≥50 – Low Awareness .)Data was analyzed
using SPSS version 25 and 0.05 p value was
considered as the level of significance . Out of
489 students, 243 (49 .7 )%were male and
246 (50.3 )%were female .Majority of the
participants (82.82 )%had lower awareness
level on prevention of common oral diseases
while only 0.2 %had high awareness .
Students from faculty of Medicine were
having the highest awareness and students
from faculty of Management were having the
lowest awareness .Statistically significant
difference was observed in awareness levels
between the health related and non-health
related faculties (p<0.01 ) This study reveals
that the non-dental undergraduates of
University of Peradeniya have a low
awareness on prevention of common oral
diseases .Thus, it is suggested to make
measures to improve awareness on common
oral diseases among the university students ’
population which will be very effective in
preventing oral diseases and building up a
healthy population .
Keywords :Common oral diseases, Awareness
on prevention, University undergraduates
Introduction:
In recent time, oral health has gained equal
importance as general health in the world .
Furthermore, knowledge regarding oral health
has been introduced as an important factor that
determines overall health .Various oral
diseases such as Dental caries, Periodontal
diseases and Oral cancers are considered to be
major public health problems worldwide and
they can be 100 %prevented (Vodanovic, 2013.)
Dental caries also called as tooth decay, is one
of the most common and most preventable
diseases .Dental caries is the localized
destruction of susceptible dental hard tissues
by acidic
productions from bacterial fermentation of
dietary carbohydrates ( Selwitz, Ismail and
Pitts, 2007 .)Dental caries is still a major health
problem in most industrialized countries as it
affects 60 %– 90 %of school-aged children and
the enormous majority of adults (Petersen et al.,
2005 .)Periodontal or gum disease is an
inflammatory condition of the gum, alveolar
bone, connective tissue attachments and
periodontal tissues surrounding the teeth (Loe,
1993 .)This is said to be the most common
chronic disorder of the humans (Williams,
1990 .)There are two main categories of
periodontal diseases, namely gingivitis and
periodontitis .Mouth cancer or oral cancer can
13th International Research Conference
General Sir John Kotelawala Defence University
Allied Health Sciences Sessions
181
be identified anywhere in the oral cavity, the
surface of the tongue, on the lips, in the gums,
inside the cheeks, in the tonsils and in the
salivary glands .Tobacco, alcohol, betel and
similar products are prominent risk factors
for the mouth cancer (Scully and Porter,
2001 .) Oral cancer is the commonest cancer
among males and 3rd commonest among
females in Sri Lanka (‘International Congress
on Oral Cancer, Smokeless Tobacco and
Arecanut ICO’, no date .) The burden of
common oral diseases is especially high for
the disadvantaged and poor population
groups in both developing and developed
countries .Main reason is the arrangements
for oral health care in developing countries,
like Sri Lanka is limited due to inadequate
dental manpower, financial resources, and
lack of knowledge need for dental care
among the people (Gunawardena et al,
2016 .)
According to Global Burden of Disease study,
unrelated tooth decay has become one of the
most
common disease conditions in 2010 .But it
can be prevented through simple and cost-
effective
interventions .Reducing sugar consumption
and promoting good delivery habits are the
main
preventive measures of the tooth decay .
Exposure to fluoride and universal access to
primary
oral healthcare are most cost-effective
preventive measures .Periodontal disease is
a major public health problem that
challenges health systems around the world .
However, in prevention of periodontal
disease, low exposure to risk factors such as
alcohol or tobacco use, good personal oral
hygiene, awareness and regular check-ups
are important elements .Early detection and
management are another important
preventive measure for periodontal disease .
Generally, death rates for oral cancer become
increased .Early detection and timely
referral directly help to the treatment and
prevention for the oral cancer ( FDI, 2015 )
Knowing the preventive methods for the
common oral diseases would help the
prevention and early detection of the diseases .
University students come across a great
number of people of different age groups from
different backgrounds in their day to day course
of study hence with proper knowledge and oral
health behaviors they can act as role models for
their family and community at large .Therefore,
aim of this study was to identify the level of
awareness on prevention of common oral
disease amongst the non -dental students of
University of Peradeniya .And to determine the
awareness on prevention of common oral
diseases according to gender and the studying
faculty .
Methodology:
This study was designed as a descriptive cross -
sectional study and 489 students were selected
from eight faculties of University of Peradeniya,
Sri Lanka . Since Dental students get to learn
about the preventive methods of common oral
diseases as a part of their curriculum, they were
exempted from the study sample to avoid bias .
Stratified random sampling method was used
as the sampling technique. Data was collected
using a pre-tested self-administered
questionnaire .The questionnaire consisted of
demographic information, open and closed
ended questions related with prevention of
common oral diseases .Awareness of the
participants was categorized into three groups
according to the scores they have obtained for
the questionnaire (≥75 – High Awareness, 74 -
50 – Moderate Awareness, ≥50 – Low
Awareness.) Data analyze was done using SPSS
version 25.0 .Categorical data was described
using frequencies and percentages giving the
95 %confident intervals .Continuous scale data
was described using mean values. Significances
were assessed at the p value of 0.05.
Results and Discussion:
13th International Research Conference
General Sir John Kotelawala Defence University
Allied Health Sciences Sessions
182
This study was conducted in University of
Peradeniya using a sample of 489 students
from eight faculties to determine the
awareness on prevention of common oral
diseases among non-dental undergraduate
students of University of Peradeniya .These
489 participants who responded for the
study were from both health related and non-
health related faculties.
Total number of students in health-related
faculties was 139 (28 .4 )%and number of
students in non-health related faculties was
350 (71.6 .)%As a whole there were 243
(49.7 )%male and 246 (50.3 )%female in the
study conducted .
Table 1 :Distribution of the sample
Gender
Total Male Female
Type of
Faculty
Non-Health
Related
Count 174 176 350
%of
Total
35.6 % 36.0 % 71.6 %
Health
Related
Count 69 70 139
%of
Total
14.1 % 14.3 % 28.4 %
Total Count 243 246 489
%of
Total
49.7 % 50.3 % 100.0 %
Out of the 489 participants, a majority of 405
(82.8)% participants scored less than 50
marks which was considered as ‘Low
Awareness’. Among the participants, 83
undergraduates ( 17.0 )%scored between 74
and 50 for the questionnaire and they were
at the level of ‘Moderate Awareness’. Only 1
participant ( 0.2 )%obtained more than 75
marks and that undergraduate student was
the only participant with ‘High Awareness ’
level .Mean percentage score of male
students was 37.36 and for female students
it was 37.36 .There was no significant
difference in the mean scores of the students
according to the gender.
Table 2: Awareness on prevention of common oral
diseases
These results may be an indicating the low
knowledge of the undergraduates ’lack of
knowledge for day today health information .
Because disregard of the gender, 82 %of the
whole population are at low awareness levels
for the undergraduate this level is not
acceptable whether they are related to health
field or not as they have the power to deliver
information to the society .
Awareness level on the prevention of common
oral diseases were assessed according to the
faculty of the participants and the highest
awareness level was observed in Medical
Faculty with a moderate awareness level in
50 %of the participants .In contrast, faculty of
Management displayed the lowest awareness
level where the moderate awareness was 2 .2 .%
The only participant who displayed a high
awareness was from the faculty of Medicine .
These results may be due to the reason that the
medical students are getting knowledge
regarding these disease conditions and
students studying non health related subjects
Awareness of Prevention Total
Low
Awaren
ess
Moder
ate
Aware
ness
High
Awar
eness
Ge
nd
er
Mal
e
Count 198 45 0 243
%
withi
n
Gend
er
81.5 % 18.5 % 0.0 % 100.0
%
Fe
mal
e
Count 207 38 1 246
%
withi
n
Gend
er
84.1 % 15.4 % 0.4 % 100.0
%
Total Count 405 83 1 489
%
withi
n
Gend
er
82.8 % 17.0 % 0.2 % 100.0
%
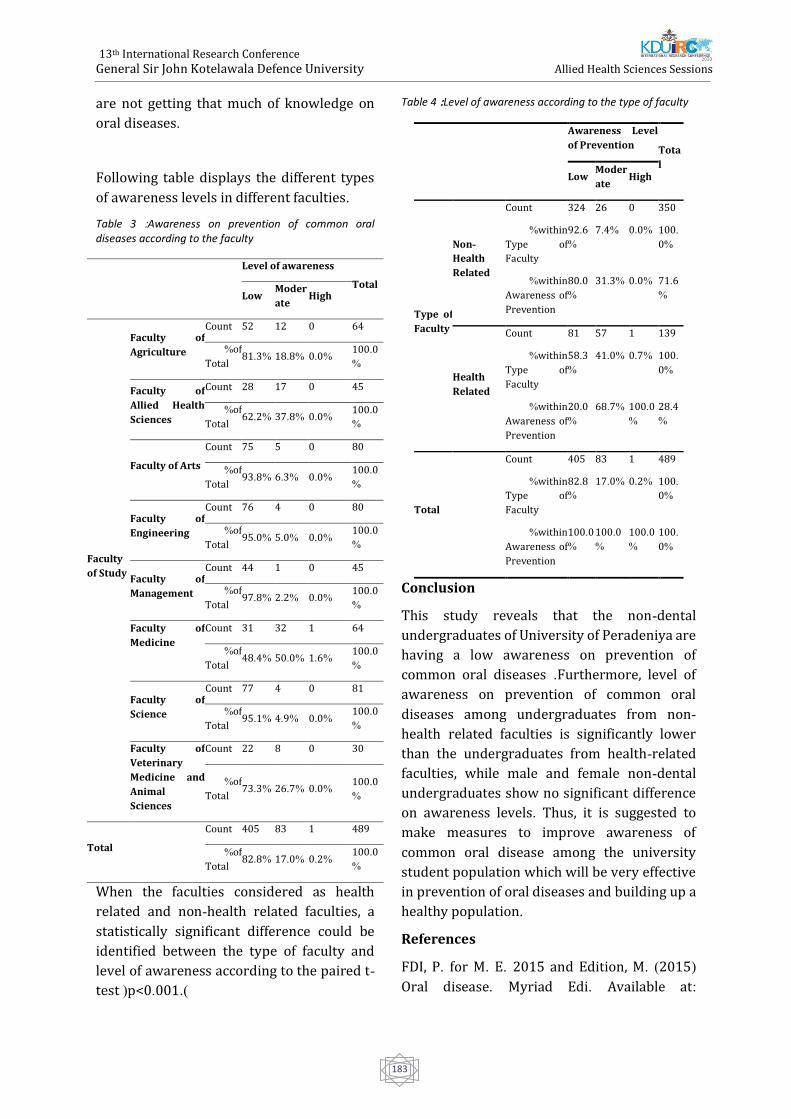
13th International Research Conference
General Sir John Kotelawala Defence University
Allied Health Sciences Sessions
183
are not getting that much of knowledge on
oral diseases .
Following table displays the different types
of awareness levels in different faculties .
Table 3 :Awareness on prevention of common oral diseases according to the faculty
Level of awareness
Total Low
Moder
ate High
Faculty
of Study
Faculty of
Agriculture
Count 52 12 0 64
%of
Total 81.3 % 18.8 % 0.0 %
100.0
%
Faculty of
Allied Health
Sciences
Count 28 17 0 45
%of
Total 62.2 % 37.8 % 0.0 %
100.0
%
Faculty of Arts
Count 75 5 0 80
%of
Total 93.8 % 6.3 % 0.0 %
100.0
%
Faculty of
Engineering
Count 76 4 0 80
%of
Total 95.0 % 5.0 % 0.0 %
100.0
%
Faculty of
Management
Count 44 1 0 45
%of
Total 97.8 % 2.2 % 0.0 %
100.0
%
Faculty of
Medicine
Count 31 32 1 64
%of
Total 48.4 % 50.0 % 1.6 %
100.0
%
Faculty of
Science
Count 77 4 0 81
%of
Total 95.1 % 4.9 % 0.0 %
100.0
%
Faculty of
Veterinary
Medicine and
Animal
Sciences
Count 22 8 0 30
%of
Total 73.3 % 26.7 % 0.0 %
100.0
%
Total
Count 405 83 1 489
%of
Total 82.8 % 17.0 % 0.2 %
100.0
%
When the faculties considered as health
related and non-health related faculties, a
statistically significant difference could be
identified between the type of faculty and
level of awareness according to the paired t-
test (p<0.001 .)
Table 4 :Level of awareness according to the type of faculty
Awareness Level
of Prevention Tota
l Low
Moder
ate High
Type of
Faculty
Non-
Health
Related
Count 324 26 0 350
%within
Type of
Faculty
92.6
%
7.4 % 0.0 % 100.
0%
%within
Awareness of
Prevention
80.0
%
31.3 % 0.0 % 71.6
%
Health
Related
Count 81 57 1 139
%within
Type of
Faculty
58.3
%
41.0 % 0.7 % 100.
0%
%within
Awareness of
Prevention
20.0
%
68.7 % 100.0
%
28.4
%
Total
Count 405 83 1 489
%within
Type of
Faculty
82.8
%
17.0 % 0.2 % 100.
0%
%within
Awareness of
Prevention
100.0
%
100.0
%
100.0
%
100.
0%
Conclusion
This study reveals that the non-dental
undergraduates of University of Peradeniya are
having a low awareness on prevention of
common oral diseases .Furthermore, level of
awareness on prevention of common oral
diseases among undergraduates from non -
health related faculties is significantly lower
than the undergraduates from health-related
faculties, while male and female non-dental
undergraduates show no significant difference
on awareness levels . Thus, it is suggested to
make measures to improve awareness of
common oral disease among the university
student population which will be very effective
in prevention of oral diseases and building up a
healthy population .
References
FDI, P. for M. E. 2015 and Edition, M. )2015(
Oral disease. Myriad Edi. Available at:
13th International Research Conference
General Sir John Kotelawala Defence University
Allied Health Sciences Sessions
184
http://myriadeditions.com/ )Accessed: 28
December 2018(
Williams, R. C. )1990(. ‘Periodontal disease.’
The New England journal of medicine 322:
373–82.
Scully, C. and Porter, S. )2001(. ‘Oral cancer’.
British Medical Journal, 174: 348–351.
Selwitz, R. H., Ismail, A. I. and Pitts, N. B.
)2007(. ‘Dental caries’. The Lancet, 369: 51–
59.
Petersen, P. E., Bourgeois, D., Ogawa, H.,
Estupinan-day, S. and Ndiaye, C. )2005(.
‘Policy and Practice The global burden of oral
diseases and risks to oral health’. Bulletin of
the World Health Organization, 83: 661–669.
Loe, H. )1993(. Periodontal disease: The sixth
complication of diabetes mellitus. Diabetes
care, 16: 329–334.
‘International Congress on Oral Cancer,
Smokeless Tobacco and Arecanut ICO’ )2014(,
201
Gunawardane, S., Angammana R., Banneheka S
and Fonseka M. )2016(. ‘Oral Health Status and
the Impact of Socio- behavioral Factors in
Institutionalized Children -Sri Lanka. American
Journal of Public Health Research, 61: 77-79.
Francis, D. L., Balasubramanian, K. R., Durga, R.
and Chandran, R. )2018(. ‘Knowledge about
Causes and Prevention of Oral Diseases among
Higher Secondary School Students in Vellore
District, Tamil Nadu, India: A Cross - Sectional
Survey’. Indian Association of Public Health
Dentistry, 16: 231–235.
13th International Research Conference
General Sir John Kotelawala Defence University
Allied Health Sciences Sessions
185
Behavioural and Psychological Impact of Covid-19 on a Group of
Youth and Young Adults Repatriated Back to Sri lanka from the uk: a
qualitative study
K Abhayasinghe1,2,7#, N Weerasinghe3, TN Karunaratne4, L Dissanayake2, K Jayasinghe2, M
Hewamulla5, GND Guruge2,6, A Sumathipala2,7
1Faculty of Allied Health Sciences, KDU, Sri Lanka
2Institute for Research and Development in Health and Social Care, Sri Lanka 3Coventry University, UK
4Army Hospital, Narahenpita, Sri Lanka 5Heriot-Watt University, Edinburgh, UK
6Rajarata University, Sri Lanka 7Keele University, UK
Abstract. The COVID-19 pandemic affected
international students around the world,
including the Sri Lankan undergraduate and
post-graduate students who were studying in
the UK, and they were repatriated to Sri Lanka
by the government last May. The current study
aimed to explore and understand the impact
on behaviour and psychological changes on
this youth and young adult group of being
under lockdown in the UK, repatriation,
quarantine processes and self-isolation, as
well as the experience during the journey from
the UK to Sri Lanka. This qualitative study was
planned and conducted in a quarantine
environment based on the lived experiences of
investigators, who were also students
repatriated back to Sri Lanka from the UK due
to COVID-19 pandemic, which is also the
significance of this study. A convenient sample
of sixteen (16) students (age ranged from 18 –
34) participated in the study. Data was
collected using three investigative methods:
questionnaires, researcher’s objective
observations and semi-structured interviews
(over the phone or online). Data analysis was
done using thematic analysis method. There
were three preliminary themes that emerged
from the study: (1) Fear, worry and anxiety,
(2) Adherence to safety precautions, and (3)
Agitation. Findings indicate that the abrupt
changes to their education and day-to-day
lifestyles, perceived stigma and emotional
imbalance during this stressful situation
caused psychological as well as behavioural
challenges and difficulty in coping among this
group. Findings highlight the need for
addressing their age-specific psychological
needs when developing guidelines to manage
similar situations in the future and to increase
resilience.
Keywords: COVID-19, repatriation, youth and
young adults, psychological and behavioural
patterns.
Introduction:
With its highly prestigious, world-recognised
universities and the culturally diverse
environment, the United Kingdom (UK) is
popular among thousands of international
students choosing to pursue their higher
educational qualifications. According to the
Higher Education Statistics Agency, over five
million international students were pursuing
their degree in the UK under Tier 4 and tier 5
visa categories in year 2018/2019. Majority of
these students are from China, India, Thailand,
Hong-Kong as well as African countries.
Twenty-nine percent of all students in the UK
are from former colonies including India,
13th International Research Conference
General Sir John Kotelawala Defence University
Allied Health Sciences Sessions
186
Thailand and Sri Lanka (International Student
Statistics in UK 2020).
During December 2019, a novel Coronavirus
disease (COVID-19) outbreak was reported
from Wuhan, China, soon progressing it to an
epidemic distinct from SARS-Cov and MERS-
Cov (Zhu et al., 2020). COVID-19 was then
identified as a highly contagious disease,
making it a pandemic that led the whole world
to shut down and undergo lockdown periods
(Watkins, 2020). While countries started
proceeding with lockdown and social
distancing measures, people started working
from home, home-schooling and major
consequences such as Airport closures
occurred due to the fast spread of the disease.
The COVID-19 pandemic affected
international students around the world,
including the Sri Lankan students who are
studying in the UK, as it resulted in disruption
of their daily routines, sudden and abrupt
changes to their academic activities, social
lives and lifestyles. For example, the
lockdown, social distancing and self-isolation
procedures led Sri Lankan students studying
in the UK to be confined to their
accommodations, being unable to move to Sri
Lanka causing a negative effect towards their
psychological wellbeing. Throughout this
difficult period, the Sri Lankan students (aged
18 – 34) in the UK were advised and supported
by their universities, immigration compliance
and the Sri Lanka High Commission (SLHC).
On 03rd and 05th May, 2020 they were
repatriated to Sri Lanka by the government
and quarantined in Colombo.
It is not clear how long the COVID-19
pandemic will continue to limit the usual
academic activities and lifestyles of this group
of students. Clearly, there are challenges of
continuing academic activities such as
attending online virtual classes and
completing assignments while being under
quarantine with limited resources and
distractions and also being far away from their
universities in a different time zone. Young
adults are one of the high-risk category group
of individuals who are more likely to develop
negative psychological and behavioural
patterns due to outbreaks and self-isolation
(Pang et al., 2004; Brooks et al., 2020).
Therefore, it is important to explore and
understand the impact of being under
lockdown, self-isolation, repatriation and
quarantine processes during the journey from
the UK to Sri Lanka, on the behaviour and
psychological changes on this youth and
young adult group.
Taking this into account, the present study
opens an avenue to see how these youth and
young adults stranded in overseas could be
subjected to different psychological and
behavioural issues due to the COVID-19
pandemic. Also, this study was conducted in
the natural setting of the participants and it
was first-hand experience research where the
researchers were also present in the setting,
overtly observing the particular group of
participants. Having a real-life experience of
being affected by the lockdown, repatriated
back to Sri Lanka from the UK due to COVID-
19 pandemic and being under quarantine as
Sri Lankans based in the UK, we aimed to carry
out a qualitative study to explore and
understand the experience (including views,
perceptions and attitudes) of youth and young
adults. This study also aimed to observe and
describe the psychological and behavioural
impact of COVID-19 global pandemic on the
lives of this group. In this paper, we wish to
describe the methodology and preliminary
findings of the study.
Methodology:
This research study was developed based on
the lived experiences of the investigators (KA,
NW and MH), who are also international Sri
Lankan students, repatriated back to Sri Lanka
from the UK due to COVID-19 pandemic. The
study setting was one of the government
quarantine centres located in Colombo. Ethical
clearance for the study was obtained from the
13th International Research Conference
General Sir John Kotelawala Defence University
Allied Health Sciences Sessions
187
expedition review committee at Rajarata
University (Ref: ERC/2020/38)
A convenient sample of undergraduates and
post-graduate level students who were
repatriated back to Sri Lanka due to COVID-19
and underwent quarantine in the selected
study setting were recruited in the study.
Investigators shared information about the
study via a closed WhatsApp group and
invited the students to take part in the study.
Those who wished to take part voluntarily
were recruited using an online consent form,
developed via google forms. Then they were
encouraged to contact the study team (KA,
NW, MH and TK) via the online messaging
platform, considering the ease of convenience
and the need of maintaining physical
distancing measures at the quarantine centre.
Three investigative methods were used for
data collection: (1) Researcher’s objective
observations (Ethnographic research
approach), (2) Questionnaires (including
demographic information questions, The
Generalized Anxiety Disorder 7-item (GAD-7)
scale and the ‘Ways of Coping Checklist-
Revised (WCCL-R) scale; Sawang et al., 2010)
and (3) Semi-structured interviews (over the
phone or online) to explore participants’ lived
experience. Data collection was conducted at
three phases.
Phase 01: At the time of obtaining the consent,
participants were asked to complete a short
demographic questionnaire and the GAD-7
scale (circulated online via closed WhatsApp
group or email). In-depth, semi-structured
interviews were conducted using a topic guide
to further explore the real-life experience and
perceptions of being locked down in the UK,
repatriated to Sri Lanka and quarantined. The
ethnographic research approach was
considered most appropriate as the
investigators interact with the participants
while observing them in a real-life
environment. Journal keeping was a
continuation of a fun activity among this group
of students while they were under lockdown
in the UK as a coping method. The student
group were informed verbally regarding the
objective observation of their psychological
and behavioural patterns on the day one at the
arrival of Heathrow, London, where they first
met in person. KA, NW and MH maintained
independent personal journals based on their
experience and objective observations in the
UK and continued this exercise during their
stay at quarantine centre and entered daily
notes in their own time.
Phase 02: GAD-7 scale was administered
online at the end of the quarantine period in
Sri Lanka.
Phase 03: GAD-7 scale and WCCL-R scale was
administered three weeks after the students
being sent home at the completion of
quarantine (after a week of completion of self-
isolation at home).
The research team used these personal
journals as a data source for the current study.
However, this was reminded to the
participants at the time of obtaining consent;
observations of those who did not give the
consent for the study will not be entered in any
research report/ publication.
All the interviews were transcribed verbatim.
Diary entries and interview transcripts were
anonymised in order to maintain the
confidentiality of the participants and to
prevent them from being traced back.
Qualitative data analysis was conducted using
thematic analysis. Relevant descriptive and
inferential statistics measures were also used
when presenting demographic information.
Results:
Sixteen undergraduates and post-graduate
level students completed phase one. Among
them, all agreed for observations and seven
agreed to take part in interviews. However,
dropout rate was high after the quarantine
period; thirteen of them completed the second
phase (GAD-7 scale) and only 08 students
13th International Research Conference
General Sir John Kotelawala Defence University
Allied Health Sciences Sessions
188
completed the final phase of the study (GAD-7
and WCCL-R scales).
Findings indicated both positive and negative
psychological and behavioural impacts. There
were three themes emerged: (1) Fear, worry
and anxiety, (2) Adherence to safety
precautions and (3) Agitation.
Fear, worry and anxiety
Many young adults reported that they were
not worried or did not take the condition
seriously during the epidemic level at China
and carried out their normal routines until the
lockdown started in the UK or the outbreak
reached Sri Lanka and Europe.
“At first, I thought it would not go for a
pandemic scale. I thought it would just stay in
China. So, I wasn’t taking it that seriously. When
the outbreak reached around Europe… Italy
and Spain, I realised it’s a serious issue.” (P01)
Almost all students reported that they were
stressed or worried that their academic
activities were hindered during the lockdown
period due to the university closure and after
repatriation mode of studies changed to
distanced and online learning. Students’ main
concerns during the lockdown in the UK were
that their loved ones being overly worried and
afraid of them staying in the UK alone, with
lack or no access to health care facilities if
things went wrong.
“I wasn’t worried or panicking that much. But
my parents were… since they were in SL and I
was in the UK. They kept on thinking about the
distance between us […] It was quite of pressure
for me. Actually, I was worried about them more
than worrying about myself.” (P04)
“I started getting anxious at the end. I realised
that it’s not that easy as you think it is since I
didn’t have any flatmate or friend whom I can
rely on in an emergency.” (P03)
Fear of being exposed to COVID-19 infection
during repatriation and anxiety caused by
perceived social stigma and judgements
related to the quarantine also commonly
reported.
“I still don’t know what to expect once I go
home, how people view me… whether as a
diseased person or I’m like Coronavirus career,
like I would just be spreading all over… I kept
thinking about what would people think about
my parents as well.” (P01)
When asked about how they were coping,
many reported that they ‘felt at ease’ after
coming back to Sri Lanka:
“In the UK… I had the worst mental break
downs. I overslept and just kept thinking ‘is this
going to finish or not?’ The travelling part… It
was a bit overwhelming. But, the overall process
in quarantine is good.” (P01)
“I knew I’m safe and in good hands at the very
moment I stepped out from the flight. What a
relief!” (P02)
During the interviews the students reported
that they experienced moderate to severe
anxiety levels during the lockdown period and
repatriation process as well as the last day of
quarantine. However, the GAD scores show
minimal or mild anxiety levels and therefore
indicate a discrepancy between the verbalised
anxiety levels and the evidence reflected by
the GAD scale.
Adherence to safety precautions
Level of adherence to the safety precautions
among the study participants was varied over
time. Best adherence was reported at the
beginning of the lockdown in the UK and
during the repatriation process.
“Whenever I get my groceries I would come
back and washed most of the things. I think I got
pretty paranoid about it… I realised that I
should do it [smiles], I can’t take a risk. I kept
washing my hands and I made sure that I had at
least 3 sanitizers with me. Even my shoes, I
sprayed them with Ethanol and stuff [laugh].
(P01)
13th International Research Conference
General Sir John Kotelawala Defence University
Allied Health Sciences Sessions
189
Girls reported more adherence when
compared to boys all the time. However, the
students appeared to become normalised
living with COVID- 19 over time and
complained of getting bored, forgetting to
adhere to strict safety precautions:
“At the beginning, I was very keen. Later on, I
started forgetting things… perhaps I got bored
and wasn’t bothered to do it. Sometimes I did it
just because my mother or boyfriend reminded
me so often.” (P02)
“I was like, ‘why should I keep doing this?’ It’s a
headache. It’s too much of work.” (P01)
Observation notes from the researchers’
diaries support the interview findings and
reveal strict adherence on the first few days at
the quarantine Centre but gradual decrease
towards the end of the quarantine period.
“The students were afraid of the staff who were
wearing PPE. They asked many questions [from
the nurses] and worried about their
temperature levels, about the passengers who
had fever and hospitalised. They all wore masks;
only appeared at the door for checking
temperature and went into their rooms
quickly.” (R03, Observation notes- Day 01 at
quarantine)
“Some of the students appeared not following
the instructions. Some even walked along the
corridors without wearing masks and chatting
with each other.” (R01, Observation notes- Day
10 at quarantine)
Agitation
Majority of this group reported that they
experienced hostility, irritability or agitation
as well as low mood and frequent arguments
with their roommates, parents or partners
during this period. Over-sleeping, smoking,
alcohol consumption, gaming or increased
screen times and avoidance of adherence to
strict physical distancing and safety guidelines
were reported as a result.
“I got quite irritated even for smaller things
really quickly... Even if my parents called me
and say something really simple, like ‘are you
okay?’ that irritated me pretty easily. At some
point I even wanted to avoid people, I mean the
phone calls came from [my loved ones].” (P05)
“We played cards, sometimes smoked and had a
beer to relieve our stress.” (P06)
However, positive experiences such as
improved work efficiency, making new friends
and changes to one’s lifestyle, perspectives
and behaviour was also reported. Some
students appreciated increased productivity
during self-isolation due to fewer distractions,
enhanced tolerance and coping, team working,
new connections established via online
communication, peer support during the
quarantine period and especially the
opportunity they got to return to their families
in Sri Lanka as a result of the pandemic.
“It was an adventure, a good experience. I
managed to get most of my work done during
the lockdown as well as while being under
quarantine.” (P02)
“I became really close to some. Met interesting
people unexpectedly. We were in the same boat
since we all faced the similar situation, maybe
that made us bond easily. So, that togetherness
was quite a good feeling. I feel really good, I felt
quite comfortable around them as well.” (P06)
Discussion:
Prior to the outbreak of COVID-19, similar
epidemics such as SARS (during 2002-2003),
led to major self-isolation procedures and
quarantining of individuals, during the
absence of a proper treatment method (Yan,
Zou 2009). Similar to the findings of the
current study, Chan et al., (2007) reported that
dramatic changes in lifestyles may be
accompanied by fear of being infected to self
or loved ones resulting in a significant
negative impact to their psychological
wellbeing.
13th International Research Conference
General Sir John Kotelawala Defence University
Allied Health Sciences Sessions
190
In line with the findings, existing evidence also
reports that prolong home confinement
during a disease outbreak can have negative
effects on young people’s mental and physical
health (Liu et al., 2020). Less physical
activities, outdoor activities and inability to
interact with friends and family may cause
changes to their psychological and
behavioural patterns. For example, an
exhibition of discomfort in forms of confusion,
anger, aggressiveness, irregular sleep
patterns, addiction to internet or screen time
(TV or computer) and less favourable diet
preferences were commonly reported among
young people (Brooks et al., 2020; Wang et al.,
2020). Empirical evidence indicates that
quarantine processes result in depression, low
mood, fear, confusion, anger and other
psychological issues such as post-trauma
stress symptoms among youth (Pang et al.,
2004; Brooks et al., 2020). Young age (16-24),
lower levels of educational qualifications and
female gender are some of the predictors that
may increase negative psychological
symptoms (Brooks et al., 2020). Nevertheless,
the current study shows positive experiences
(e.g. adventure and befriending) as well.
Investigators (KA, NW, MH and TK) think that
objective observations and journal keeping
was fun and also was a good coping
mechanism during this difficult period.
The ethnographical method is fully immersive,
‘live and work’ approach where the
researchers observe and reflect people’s
behaviour patterns (Dwyer and Buckle, 2009).
Ethnographic research approach (i.e., use of
objective observations written in personal
journals as research data) was very much
appropriate for the current study as the
investigators could interact with the
participants while observing them in a real-
life environment. It was also pragmatic for this
research because objective observations and
online interviews were feasible (while
maintaining physical distancing and safety
precautions (such as wearing a mask) as three
members of the study team were residing with
the study sample in the same quarantine
centre. WhatsApp platform allowed sending
photos, voice clips and texts so that
participants could easily send their
expressions when they go home after
quarantine; WhatsApp was easier for the
participants than email as it has one-to-one
secure encryption.
Conclusion:
This qualitative study was planned and
conducted in a quarantine environment based
on the lived experiences of investigators, who
were also students repatriated back to Sri
Lanka from the UK due to COVID-19 pandemic.
Therefore, the current study provided
evidence-based guidance on identifying how
the students responded to the closure of
schools and universities, how they coped with
their studies during a time of a pandemic.
Findings identified the psychological and
educational needs, challenges, coping
strategies of youth and young adults in this
group and indicate the need of addressing
them and developing guidelines to manage
similar situations in future and increase
resilience. The investigators learnt positive
life lessons by actively participating in this
research and being able to share their lived
experience during this difficult period. The
study contributes to the research gap in the
present literature regarding the impact of
COVID-19 on a group of young academics in
Sri Lanka.
Reference:
Brooks, S. K. et al. (2020) ‘The psychological impact
of quarantine and how to reduce it: rapid review of
the evidence’, The Lancet. Elsevier Ltd,
395(10227), pp. 912–920. doi: 10.1016/S0140-
6736(20)30460-8.
Chan, S. S. C. et al. (2007) ‘Parental Response to
Child’s Isolation During the SARS Outbreak’,
Ambulatory Pediatrics, 7(5), pp. 401–404. doi:
10.1016/j.ambp.2007.06.002.
13th International Research Conference
General Sir John Kotelawala Defence University
Allied Health Sciences Sessions
191
Dwyer, S. C. and Buckle, J. L. (2009) ‘The Space
Between: On Being an Insider-Outsider in
Qualitative Research’, International Journal of
Qualitative Methods, 8(1), pp. 54–63. doi:
10.1177/160940690900800105.
International Student Statistics in UK 2020 (2020).
Available at: https://www.studying-in-
uk.org/international-student-statistics-in-uk/
(Accessed: 5 July 2020).
Liu, J. J. et al. (2020) ‘Mental health considerations
for children quarantined because of COVID-19.’,
The Lancet Child & adolescent health. Elsevier Ltd,
2019(20), pp. 2019–2020. doi: 10.1016/S2352-
4642(20)30096-1.
Mfutso-Bengo, J., Masiye, F. and Muula, A. (2008)
‘Ethical challenges in conducting research in
humanitarian crisis situations’, Malawi Medical
Journal, 20(2), pp. 46–49. doi:
10.4314/mmj.v20i2.10956.
Sawang, S. et al. (2010) ‘Confirmatory Factor
Analysis of the Way of Coping Checklist-Revised (
WCCL-R ) in the Asian Context’, Applied Psychology,
59(2), pp. 202–219. doi: 10.1111/j.1464-
0597.2009.00378.x.
Pang, E., Tam, C., Lam, L. and Chiu, H., 2004. Severe
acute respiratory syndrome (SARS) in Hong Kong
in 2003: stress and psychological impact among
frontline healthcare workers. Psychological
Medicine, 34(7), pp.1197-1204
Wang, G. et al. (2020) ‘Mitigate the effects of home
confinement on children during the COVID-19
outbreak’, The Lancet, 395(10228), pp. 945–947.
doi: 10.1016/S0140-6736(20)30547-X.
Watkins, J., 2020. Preventing a covid-19 pandemic.
BMJ, p.m810.
Yan, X. and Zou, Y., 2008. Optimal and sub-optimal
quarantine and isolation control in SARS
epidemics. Mathematical and Computer Modelling,
47(1-2), pp.235-245.
Zhu, N. et al. (2020) ‘A novel coronavirus from
patients with pneumonia in China, 2019’, New
England Journal of Medicine, 382(8), pp. 727–733.
doi: 10.1056/NEJMoa2001017.
13th International Research Conference
General Sir John Kotelawala Defence University
Allied Health Sciences Sessions
192
Usefulness of Timed Up and Go test, Berg Balance Scale and Six Minute
Walk Test as fall risk predictors in post stroke adults attending
Rehabilitation Hospital Ragama
KMT Bandara1#, UK Ranawaka2, and A Pathmeswaran3
1Rehabilitation Hospital, Ragama 2Faculty of Medicine, University of Kelaniya 3Faculty of Medicine, University of Kelaniya
Abstract: Stroke is a major risk factors for
falls. However, there are no established
practices being used to predict fall risk with
Stroke patients in Sri Lankan stroke care
settings. The purpose of this study is to
determine the usefulness of Timed Up and Go
test (TUG), Berg Balance Scale (BBS) and Six
Minute Walk Test (6MWT) as fall risk
predictors in post stroke individuals and to
introduce cut off values to predict fall risk. 74
patients with first ever stroke during past
year (mean age 56.5± 28.5, males 67.6%)
recruited from the Physiotherapy Unit,
Rehabilitation Hospital, Ragama; 17 (23%)
had history of falls. History of falls was
recorded from participants’ interview. Each
participant underwent TUG, BBS and 6MWT.
Scores were compared with existing cut off
values. Receiver Operating Characteristic
(ROC) curves were constructed to describe
sensitivity, specificity and predictive values.
Optimum cut off values for fall risk prediction
were determined. There is no significant
difference in the baseline characteristics
between the two groups. The cut off values
for fall prediction of three tests were
recognized as follows; TUG ≥ 23s, p = 0.044,
AUC = 0.662; BBS <45, p = 0.001, AUC =
0.773; 6MWT <193 meters, p =0.020, AUC =
0.686. The BBS performed better than TUG
and 6MWT in predicting fall risk in stroke
individuals. We recommend the use of
physical performance tests as TUG test, BBS
and 6MWT to predict fall risk and to
minimize risk of falling in stroke individuals
in Sri Lanka.
KeyWords: Stroke, fall risk, Timed Up and Go
Test, Berg Balance scale, six Minute walk Test
Introduction:
Stroke is the second leading cause of death
worldwide among top ten leading causes. There
were about 14 million first ever stroke victims
in 2016. According to the WHO statistics
approximately 6.2 million deaths occur due to
stroke and also rated as third most common
cause of disability of the adults globally. Stroke
leads to functional disability of a stroke
survivor and effect of stroke causes paralysis of
the body. The stroke prevalence in Sri Lanka
increased during the past decades with changes
of demography. However improvements in the
healthcare facilities may lead to increase in the
number of survived stroke victims in Sri Lanka.
Rheumatology and Rehabilitation Hospital
Ragama is the main rehabilitation hospital in Sri
Lanka for stroke rehabilitation. According to
the Medical Statistics Unit of Rheumatology and
Rehabilitation hospital, 402 post stroke
survivors were admitted to the hospital in the
year 2018. There were 339 males and 63
females. When considering the 2019 statistics,
108 post stroke individuals were admitted
during the first five months. The disability of the
wage earner may be a burden to the family and
also to the community. In this sense, stroke is a
burden not only globally but also in Sri Lanka,
as it affects patient’s abilities physically and
psychologically
Post stroke individuals are more prone to fall as
they present with impaired weight bearing to
13th International Research Conference
General Sir John Kotelawala Defence University
Allied Health Sciences Sessions
193
paretic limb and increased muscle tone.
Frequent falls may be a cause for increased
length of hospital stay and it could increase
health care costs. Stroke causes severe
disability in post stroke survivors. This
sudden onset disability is a life changing
stressful incident for family members. In this
context, caregiving for the post stroke
survivor is a responsible and stressful task
for the family caregivers and also this
situation badly influence financially. Falls can
be predicted as well as prevented. Falls can
occur repeatedly if preventive measures are
not taken Hence, prediction and prevention
of falls should be a key component in stroke
rehabilitation. The unexpected incidence of
falls and fear of falling may have a negative
impact on rehabilitation process and can lead
to lack of socialization with depression. The
consequences of accidental falls also may be
a burden for family members and healthcare
professionals. Unprovoked incidence of falls
during the hospital stay has been identified
as an adverse effect, which need special
consideration. It will increase the healthcare
cost if there is a fracture which can increase
the length of stay. Therefore, it is important
to identify which patient is having a risk of
falling and provide with fall prevention
interventions. This task can be achieved by
assessing the patients using valid and
reliable clinical tests which can be used
easily. The fall risk prediction has been done
in many countries using Timed Up and Go
test, Berg balance scale and Six Minute Walk
Test. Though there are previous studies, data
from one country would not reflect the fall
risk of another country. There may be
differences in demographic factors between
the countries. Considering the above factors,
the importance of fall risk prediction and its
value cannot be underestimated. Hence, this
study aimed to investigate the contribution
of TUG test, BBS and Six minute walk test
within the context of fall risk prediction,
quantifying fall risk in post stroke individuals
and providing information to family members.
Methodology:
A cross sectional descriptive study was carried
out from May 2019 to August 2019, at the
Physiotherapy Department of Rehabilitation
Hospital, Ragama. The appropriateness of the
subjects was evaluated by the researcher
according to their past medical records in the
BHT or clinic book. 74 first ever post stroke
adults (>18 years) were recruited to the
present study. Demographic data collected
using Participants’ Data Collection Form and
fall history was recorded. The enrolled
participants were tested with three clinical
tests. (1) Timed Up and Go test (TUG), (2) Berg
Balance Scale (BBS) and (3) Six Minute Walk
Test (6MWT). The TUG test was used to assess
functional mobility and was performed
according to the international guidelines. The
cut off value for the TUG test was determined as
≥14s for fall risk prediction.
BBS which comprises of 14 components used to
assess functional balance. Maximum score was
56/56 and <45 was suggested as cut point to
predict fall risk. The 6MWT was used to assess
walking capacity of post stroke individuals. The
test was carried out according to American
Thoracic Society guidelines and protocols
(2002) and reference value for normal healthy
adults was 510m. But this value cannot be
justified for post stroke adults. Hence, we
consider new cut value of 285m which was
proposed by Dunn et al. in 2015 specifically for
post stroke adults. The entitled subjects
participated above three physical performance
tests and individual scores were recorded.
The data analyses were performed using
program SPSS version 22.0 and both univariate
and bivariate analyzing methods were used. To
find the association between categorical
variables Chi-square test was used.
Independent sample t-test was used for
analysis of numeric data. The p value < 0.05 was
considered as significant value. A receiver
operating characteristic curves (ROC) analysis
13th International Research Conference
General Sir John Kotelawala Defence University
Allied Health Sciences Sessions
194
and areas under the curves (AUC) were used
to determine the cut off points of TUG, BBS
and 6MWT. (0.5< AUC≤ 0.7 = less accurate,
0.7<AUC≤ 0.9 = moderately accurate,
0.9<AUC ≤1.0 = very accurate, AUC = 1
perfectly accurate). Ethical approval was
obtained from the Ethics Review Committee,
Faculty of Medicine, University of Kelaniya.
Administrative authorization was obtained
from the Deputy Director and the
Rheumatology and Rehabilitation
Consultants of Rehabilitation Hospital,
Ragama.
Results and Discussion:
This study population comprised of 74 post
stroke individuals (mean age 56.5± 28.5,
males 67.6%) and 17 (23%) had history of
falls. There is no significant difference in
baseline characteristics for instance age,
gender, duration of stroke, type, use of
orthses and use of assistive device.
Association between physical
performance tests and fall history
TUG test
Table 1: Results of the Timed Up and Go test in relation to fall history
Note: TUG- Timed Up and Go test, SD-
Standard Deviation , TUG test duration of ≥
14s indicate high fall risk ( G. Andersson et
al., 2006; Jalayondeja et al., 2014)
Receiver operating characteristic curve
(ROC) analysis of TUG test
In accordance with Receiver Operating Curve
Analysis (ROC) for the TUG test introduced cut
off value was 23 seconds (77% sensitivity, 50%
specificity). Area Under the Curve (AUC) of all
measured TUG values was 0.662, provide less
accurate prediction. (p = 0.044)
BBS
Table 2: Results of the Berg Balance Scale in relation to fall history
Receiver operating characteristic curve (ROC)
analysis of BBS
According to Receiver Operating Curve Analysis
(ROC) for the BBS cut off value was 45 (88%
sensitivity, 50% specificity). Area Under the
Curve (AUC) of all measured BBS values was
0.773 provide moderately accurate prediction.
(p = 0.001)
6MWT
Receiver operating characteristic curve (ROC)
analysis of 6MWT
ROC curve analysis for 6MWT indicated a cut off
value of 193metres (76% sensitivity, 50%
specificity) and the Area Under the Curve (AUC)
for all measured 6MWT distances was 0.686
provide less accurate prediction. (p = 0.020)
Characterist
ic
Fallers Non
fallers
p-
val
ue
Total
BBS < 45 15
(88.2%)
27
(47.4
%)
42 (56.8%)
BBS > 45 02
(11.8%)
30
(52.6
%)
32 (43.2%)
Mean BBS±
SD
37.59 ±
6.2
44.37±
6.88
0.0
01
Characterist
ic
Fallers Non
fallers
p-
val
ue
Total
16(94.1%
)
49(86%
)
TUG
≥ 14 seconds 65 (87.8%)
TUG ≤ 14
seconds
01 (5.9%) 08
(14%)
09 (12.2%)
Mean
TUG±SD
35.92±19.
72
25.86±1
2.55
0.0
61
28.17±14.97
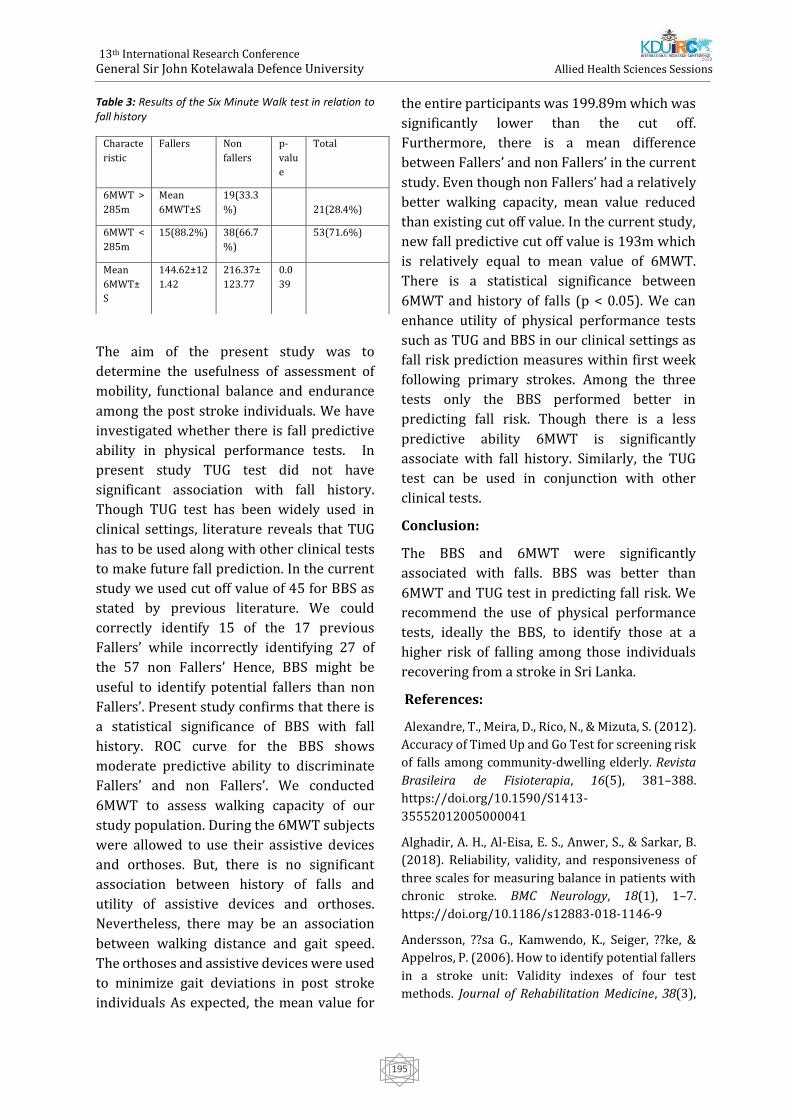
13th International Research Conference
General Sir John Kotelawala Defence University
Allied Health Sciences Sessions
195
Table 3: Results of the Six Minute Walk test in relation to fall history
The aim of the present study was to
determine the usefulness of assessment of
mobility, functional balance and endurance
among the post stroke individuals. We have
investigated whether there is fall predictive
ability in physical performance tests. In
present study TUG test did not have
significant association with fall history.
Though TUG test has been widely used in
clinical settings, literature reveals that TUG
has to be used along with other clinical tests
to make future fall prediction. In the current
study we used cut off value of 45 for BBS as
stated by previous literature. We could
correctly identify 15 of the 17 previous
Fallers’ while incorrectly identifying 27 of
the 57 non Fallers’ Hence, BBS might be
useful to identify potential fallers than non
Fallers’. Present study confirms that there is
a statistical significance of BBS with fall
history. ROC curve for the BBS shows
moderate predictive ability to discriminate
Fallers’ and non Fallers’. We conducted
6MWT to assess walking capacity of our
study population. During the 6MWT subjects
were allowed to use their assistive devices
and orthoses. But, there is no significant
association between history of falls and
utility of assistive devices and orthoses.
Nevertheless, there may be an association
between walking distance and gait speed.
The orthoses and assistive devices were used
to minimize gait deviations in post stroke
individuals As expected, the mean value for
the entire participants was 199.89m which was
significantly lower than the cut off.
Furthermore, there is a mean difference
between Fallers’ and non Fallers’ in the current
study. Even though non Fallers’ had a relatively
better walking capacity, mean value reduced
than existing cut off value. In the current study,
new fall predictive cut off value is 193m which
is relatively equal to mean value of 6MWT.
There is a statistical significance between
6MWT and history of falls (p < 0.05). We can
enhance utility of physical performance tests
such as TUG and BBS in our clinical settings as
fall risk prediction measures within first week
following primary strokes. Among the three
tests only the BBS performed better in
predicting fall risk. Though there is a less
predictive ability 6MWT is significantly
associate with fall history. Similarly, the TUG
test can be used in conjunction with other
clinical tests.
Conclusion:
The BBS and 6MWT were significantly
associated with falls. BBS was better than
6MWT and TUG test in predicting fall risk. We
recommend the use of physical performance
tests, ideally the BBS, to identify those at a
higher risk of falling among those individuals
recovering from a stroke in Sri Lanka.
References:
Alexandre, T., Meira, D., Rico, N., & Mizuta, S. (2012).
Accuracy of Timed Up and Go Test for screening risk
of falls among community-dwelling elderly. Revista
Brasileira de Fisioterapia, 16(5), 381–388.
https://doi.org/10.1590/S1413-
35552012005000041
Alghadir, A. H., Al-Eisa, E. S., Anwer, S., & Sarkar, B.
(2018). Reliability, validity, and responsiveness of
three scales for measuring balance in patients with
chronic stroke. BMC Neurology, 18(1), 1–7.
https://doi.org/10.1186/s12883-018-1146-9
Andersson, ??sa G., Kamwendo, K., Seiger, ??ke, &
Appelros, P. (2006). How to identify potential fallers
in a stroke unit: Validity indexes of four test
methods. Journal of Rehabilitation Medicine, 38(3),
Characte
ristic
Fallers Non
fallers
p-
valu
e
Total
6MWT >
285m
Mean
6MWT±S
19(33.3
%)
21(28.4%)
6MWT <
285m
15(88.2%) 38(66.7
%)
53(71.6%)
Mean
6MWT±
S
144.62±12
1.42
216.37±
123.77
0.0
39
13th International Research Conference
General Sir John Kotelawala Defence University
Allied Health Sciences Sessions
196
186–191.
https://doi.org/10.1080/16501970500478023
Andersson, Å. G., Seiger, Å., & Appelros, P. (2013).
Hip fractures in persons with stroke. Stroke
Research and Treatment, 2013.
https://doi.org/10.1155/2013/954279
Barry, E., Galvin, R., Keogh, C., Horgan, F., & Fahey,
T. (2014). Is the Timed Up and Go test a useful
predictor of risk of falls in community dwelling
older adults: A systematic review and meta-
analysis. BMC Geriatrics, 14(1).
https://doi.org/10.1186/1471-2318-14-14
Blum, L., & Korner-Bitensky, N. (2008).
Usefulness of the Berg Balance Scale in Stroke
Rehabilitation: A Systematic Review. Physical
Therapy, 88(5), 559–566.
https://doi.org/10.2522/ptj.20070205
Casanova, C., Celli, B. R., Barria, P., Casas, A., Cote,
C., Torres, J. P. De, … Marin, J. M. (2011). The 6-min
walk distance in healthy subjects: reference
standards from seven countries, 37(1), 150–156.
https://doi.org/10.1183/09031936.00194909
Chang, T., Gajasinghe, S., & Arambepola, C. (2015).
Prevalence of stroke and its risk factors in urban
Sri Lanka: Population-based study. Stroke.
https://doi.org/10.1161/STROKEAHA.115.0102
03
Costa, T. F. da, Costa, K. N. de F. M., Martins, K. P.,
Fernandes, M. das G. de M., & Brito, S. da S. (2015).
Burden over family caregivers of elderly people
with stroke. Escola Anna Nery - Revista de
Enfermagem, 19(2), 350–355.
https://doi.org/10.5935/1414-8145.20150048
Dunn, A., Marsden, D. L., Nugent, E., Van Vliet, P.,
Spratt, N. J., Attia, J., & Callister, R. (2015).
Protocol Variations and Six-Minute Walk Test
Performance in Stroke Survivors: A Systematic
Review with Meta-Analysis. Stroke Research and
Treatment.
https://doi.org/10.1155/2015/484813
Forster, A., & Young, J. (1995). Incidence and
consequences offalls due to stroke: A systematic
inquiry. Bmj, 311(6997), 83.
https://doi.org/10.1136/bmj.311.6997.83
Herman, T., Giladi, N., & Hausdorff, J. M. (2011).
Properties of the “Timed Up and Go” test: More
than meets the eye. Gerontology, 57(3), 203–210.
https://doi.org/10.1159/000314963
Iosa, M., Morone, G., Fusco, A., Pratesi, L., Bragoni, M.,
Coiro, P., … Paolucci, S. (2012). Effects of walking
endurance reduction on gait stability in patients
with stroke. Stroke Research and Treatment, 2012.
https://doi.org/10.1155/2012/810415
Issues,., Test, M. W., Equipment, R., & Preparation, P.
(2002). American Thoracic Society ATS Statement :
Guidelines for the Six-Minute Walk Test, 166, 111–
117.https://doi.org/10.1164/rccm.166/1/111
Jalayondeja, C., Sullivan, P. E., & Pichaiyongwongdee,
S. (2014). Six-month prospective study of fall risk
factors identification in patients post-stroke.
Geriatrics and Gerontology International, 14(4), 778–
785. https://doi.org/10.1111/ggi.12164
Kang, L., Han, P., Wang, J., Ma, Y., Jia, L., Fu, L., … Guo,
Q. (2017). Timed up and go test can predict
recurrent falls: A longitudinal study of the
community-dwelling elderly in China. Clinical
Interventions in Aging, 12, 2009–2016.
https://doi.org/10.2147/CIA.S138287
Katan, M., & Luft, A. (2018). Global Burden of Stroke.
Seminars in Neurology, 38(2), 208–211.
https://doi.org/10.1055/s-0038-1649503
Kim, E. J., Arai, H., Chan, P., Chen, L. K., D. Hill, K.,
Kong, B., … Won, C. W. (2015). Strategies on fall
prevention for older people living in the community:
A report from a round-table meeting in IAGG 2013.
Journal of Clinical Gerontology and Geriatrics, 6(2),
39–44. https://doi.org/10.1016/j.jcgg.2015.02.004
Kim, J. C., Chon, J., Kim, H. S., Lee, J. H., Yoo, S. D., Kim,
D. H., … Won, C. W. (2017). The association between
fall history and physical performance tests in the
community-dwelling elderly: A cross-sectional
analysis. Annals of Rehabilitation Medicine, 41(2),
239–247.
https://doi.org/10.5535/arm.2017.41.2.239
Maeda, N., Kato, J., & Shimada, T. (2009). Predicting
the probability for fall incidence in stroke patients
using the Berg Balance Scale. Journal of International
Medical Research, 37(3), 697– 704.
https://doi.org/10.1177/147323000903700313
Manaf, H., Justine, M., & Omar, M. (2014). Fnc
Balance, 2014.
Mancini, M., & Horak, F. B. (2010). The relevance of
clinical balance assessment tools to differentiate
balance deficits. European Journal of Physical and
13th International Research Conference
General Sir John Kotelawala Defence University
Allied Health Sciences Sessions
197
Rehabilitation Medicine, 46(2), 239–248.
https://doi.org/0000
Ng, S. S., & Hui-Chan, C. W. (2005). The Timed Up
& Go Test: Its Reliability and Association
With Lower-Limb Impairments and Locomotor
Capacities in People With Chronic Stroke.
Archives of Physical Medicine and Rehabilitation,
86(8), 1641–1647.
https://doi.org/10.1016/j.apmr.2005.01.011
Outermans, J. (n.d.). Investigating and stimulating
walking after stroke.
Persson, C. U., Hansson, P. O., & Sunnerhagen, K. S.
(2011). Clinical tests performed in acute stroke
identify the risk of falling during the first year:
Postural stroke study in Gothenburg (Postgot)*.
Journal of Rehabilitation Medicine, 43(4), 348–
353. https://doi.org/10.2340/16501977-0677
Rajapakse, S., Maithripala, C., Ibrahim, S.,
Weerasinghe, D., & Rajapakse, A. (2012). Disease
Patterns and Care of Older People in Sri Lanka.
Indian Journal of Gerontology, 26(3), 351–366.
Retrieved from
http://search.ebscohost.com/login.aspx?direct=t
rue&db=aph&AN=78295701&site=ehost-live
Ranawaka, U. K. (2018). Stroke Care in Sri Lanka:
The Way We Were, the Way We Are, and the Way
Forward. Journal of Stroke Medicine, 1(1), 45–50.
https://doi.org/10.1177/2516608518774167
Ranaweera, A., Fonseka, P., PattiyaArachchi, A., &
Siribaddana, S. (2013). Incidence and risk factors
of falls among the elderly in the district of
Colombo. Ceylon Medical Journal, 58(3), 100.
https://doi.org/10.4038/cmj.v58i3.5080
Sawacha, Z., Carraro, E., Contessa, P., Guiotto, A.,
Masiero, S., & Cobelli, C. (2013). Relationship
between clinical and instrumental balance
assessments in chronic post-stroke hemiparesis
subjects. Journal of NeuroEngineering and
Rehabilitation, 10(1), 1–7.
https://doi.org/10.1186/1743-0003-10-95
Schoene, D., Wu, S. M. S., Mikolaizak, A. S., Menant,
J. C., Smith, S. T., Delbaere, K., & Lord, S. R. (2013).
Discriminative ability and predictive validity of
the timed up and go test in identifying older
people who fall: Systematic review and meta-
analysis. Journal of the American Geriatrics
Society. https://doi.org/10.1111/jgs.12106
Shumway-cook, A., & Woollacott, M. (2000).
Predicting the Probability for Falls in
CommunityDwelling Older Adults Using the Timed
Up &amp; Go Test. Physical Therapy, 80(9),
896–903. https://doi.org/10.1093/ptj/80.9.896
Simpson, L. A., Miller, W. C., & Eng, J. J. (2011). Effect
of stroke on fall rate, location and predictors: A
prospective comparison of older adults with and
without stroke. PLoS ONE, 6(4), 2–7.
https://doi.org/10.1371/journal.pone.0019431
Steffen, T., Hacker, T., & Mollinger, L. (2002). Berg
Balance Scale , Timed Up & Go. Physical Therapy,
82(2), 128–137.
https://doi.org/10.1093/ptj/86.5.646
Stroke.org.uk. (2015). State of the nation.
Stroke.Org.Uk, (February), 40.
https://doi.org/10.1080/07393149508429756
Thrane, G., Joakimsen, R. M., & Thornquist, E. (2007).
The association between timed up and go test and
history of falls: The Tromsø study. BMC Geriatrics, 7,
1–7.https://doi.org/10.1186/1471-2318-7-1
Tilson, J. K., Wu, S. S., Cen, S. Y., Feng, Q., Rose, D. R.,
Behrman, A. L., & Azen, S. (2012). Leaps Study : a
Randomized Clinical Trial of Interventions To
Improve Walking Post-Stroke, 43(2), 446–452.
https://doi.org/10.1161/STROKEAHA.111.636258.
CHARACTERIZING
Venketasubramanian, N., Yoon, B. W., Pandian, J., &
Navarro, J. C. (2018). Stroke Epidemiology in South,
East, and South-East Asia: A Review. Journal of
Stroke, 20(1), 142–142.
https://doi.org/10.5853/jos.2017.00234.e1
Weerasuriya, N., & Jayasinghe, S. (2004).
Cmj_2005V50N1P18 (1), (December 2003), 2004–
2005.
Weerdesteyn, V., Niet, M. de, van Duijnhoven, H. J. R.,
& Geurts, A. C. H. (2008). <Title/>. The Journal of
Rehabilitation Research and Development, 45(8),
1195. https://doi.org/10.1682/JRRD.2007.09.0145
Rajapakse, S., Maithripala, C., Ibrahim, S.,
Weerasinghe, D., & Rajapakse, A. (2012). Disease
Patterns and Care of Older People in Sri Lanka.
Indian Journal of Gerontology, 26(3), 351–366.
Retrieved
fromhttp://search.ebscohost.com/login.aspx?direct
=true&db=aph&AN=78295701&site=ehostlive
13th International Research Conference
General Sir John Kotelawala Defence University
Allied Health Sciences Sessions
198
Ranawaka, U. K. (2018). Stroke Care in Sri Lanka:
The Way We Were, the Way We Are, and the Way
Forward. Journal of Stroke Medicine, 1(1), 45–50.
https://doi.org/10.1177/2516608518774167
Ranaweera, A., Fonseka, P., PattiyaArachchi, A., &
Siribaddana, S. (2013). Incidence and risk factors
of falls among the elderly in the district of
Colombo. Ceylon Medical Journal, 58(3), 100.
https://doi.org/10.4038/cmj.v58i3.5080
Sawacha, Z., Carraro, E., Contessa, P., Guiotto, A.,
Masiero, S., & Cobelli, C. (2013). Relationship
between clinical and instrumental balance
assessments in chronic post-stroke hemiparesis
subjects. Journal of NeuroEngineering and
Rehabilitation, 10(1), 1–7.
https://doi.org/10.1186/1743-0003-10-95
Schoene, D., Wu, S. M. S., Mikolaizak, A. S., Menant,
J. C., Smith, S. T., Delbaere, K., & Lord, S. R. (2013).
Discriminative ability and predictive validity of
the timed up and go test in identifying older
people who fall: Systematic review and meta-
analysis. Journal of the American Geriatrics
Society. https://doi.org/10.1111/jgs.12106
Shumway-cook, A., & Woollacott, M. (2000).
Predicting the Probability for Falls in
CommunityDwelling Older Adults Using the
Timed Up &amp; Go Test. Physical Therapy,
80(9), 896–903.
https://doi.org/10.1093/ptj/80.9.896
Simpson, L. A., Miller, W. C., & Eng, J. J. (2011). Effect
of stroke on fall rate, location and predictors: A
prospective comparison of older adults with and
without stroke. PLoS ONE, 6(4), 2–7.
https://doi.org/10.1371/journal.pone.0019431
Steffen, T., Hacker, T., & Mollinger, L. (2002). Berg
Balance Scale , Timed Up & Go. Physical Therapy,
82(2), 128–137.
https://doi.org/10.1093/ptj/86.5.646
Stroke.org.uk. (2015). State of the nation.
Stroke.Org.Uk, (February), 40.
https://doi.org/10.1080/07393149508429756
Thrane, G., Joakimsen, R. M., & Thornquist, E. (2007).
The association between timed up and go test and
history of falls: The Tromsø study. BMC Geriatrics, 7,
1–7. https://doi.org/10.1186/1471-2318-7-1
Tilson, J. K., Wu, S. S., Cen, S. Y., Feng, Q., Rose, D. R.,
Behrman, A. L., & Azen, S. (2012). Leaps Study : a
Randomized Clinical Trial of Interventions To
Improve Walking Post-Stroke, 43(2), 446–452.
https://doi.org/10.1161/STROKEAHA.111.636258.
CHARACTERIZING Venketasubramanian, N., Yoon,
B. W., Pandian, J., & Navarro, J. C. (2018). Stroke
Epidemiology in South, East, and South-East Asia: A
Review. Journal of Stroke, 20(1), 142–142.
https://doi.org/10.5853/jos.2017.00234.e1
13th International Research Conference
General Sir John Kotelawala Defence University
Allied Health Sciences Sessions
199
Formulation development for a herbal cream incorporating the
extracts of Curcuma zedoaria rhizome
SMDU Silva1, AS Malshi1, DN Kaluthanthri1, BLC Samanmali1#, HMDR Herath2, and WJABN
Jayasuriya2
1Department of Pharmacy, Faculty of Allied Health Sciences,General Sir John Kotelawala Defence University,
Werahera, Sri Lanka 2Department of Pharmacy and Pharmaceutical Sciences, Faculty of Allied Health Sciences, University of Sri
Jayewardenepura, Nugegoda, Sri Lanka
Abstract: Curcuma zedoaria is a perennial
herb which belongs to the family
Zingiberaceae. In traditional medicine, the
rhizome of Curcuma zedoaria is used to treat
various diseases including inflammatory
conditions. The objectives of the study were
to formulate a stable anti-inflammatory
cream by incorporating aqueous extract of
Curcuma zedoaria rhizome (ARE) and to
investigate its phytochemicals. ARE was
screened for phytochemicals. Fourteen
different trial base formulations were
developed by drop-wise addition of aqueous
phase to the oil phase with continuous
stirring at 600C (fusion method). The
formulations were subjected to
characterization tests and stability tests (real
time and accelerated) for 90 days. Among
them, the best two base formulations, which
were stable for the tested period of 90 days,
were selected. Creams with 0.75%, 1% and
1.5% (w /w) of ARE were prepared using the
selected two base formulations and
characterization and stability studies were
conducted. Creams with 0.75% and 1%
(w/w) ARE were stable for 90 days at both
real and accelerated conditions. According to
the characterization, all creams were
identified as oil in water emulsions with pH
of 6. The parent base texture was not
changed after incorporating the extract.
Flavonoids, tannins, alkaloids, saponins,
terpenoids, carbohydrates and gums were
present in ARE. It is concluded that using newly
formulated bases, stable anti-inflammatory
cream can be formulated by incorporating ARE
of Curcuma zedoaria, a plant which is well
known to have anti-inflammatory activity in
traditional medicine. It is recommended to
establish quality control standards for the novel
formulation for future studies.
Keywords: Curcuma zedoaria, formulation,
cream, stability
Introduction:
Inflammation is a protective response against
harmful agents. But, the unregulated
inflammation can cause harmful conditions
such as life-threatening hypersensitivity
reactions, cardiovascular diseases,
neurogenerative diseases, cancer, etc (Kumar et
al., 2005). Many currently used drugs to
suppress such unregulated inflammatory
activity have less curability and more side
effects (Okin and Medzhitov., 2012). So, there is
a huge interest in developing anti-inflammatory
drugs having better efficacy and fewer side
effects. Natural plant extracts are rich in many
active constituents and give considerably fewer
side effects. Therefore, they can be considered
as possible candidates for preparing such novel
drugs with better efficacy and lesser side effects
(Okin and Medzhitov., 2012). Curcuma zedoaria
belongs to the genus Curcuma Linn of the
13th International Research Conference
General Sir John Kotelawala Defence University
Allied Health Sciences Sessions
200
family Zingiberaceae and it is a perennial
herb which is identified to have anti-
inflammatory, antinociceptive, anti-tumor,
antimicrobial, analgesic and wound healing
activity (Add reference). In traditional
medicines, Curcuma zedoaria is used to treat
various diseases such as inflammation,
wounds, pain, skin ailments, menstrual
irregularities, malaria fever,etc. (Ullahet al.,
2014). The objectives of this study were to
develop a stable anti-inflammatory cream by
incorporating the extracts of Curcuma
zedoaria rhizome and to investigate its
phytochemicals.
Methodology:
Sample collection and authentication
The fresh rhizomes from the mature plant of
Curcuma zedoaria were collected from
Kegalle District (Coordinates: 7015’11” N
80020’43” E), Sabaragamuwa Province, Sri
Lanka in June 2019. The collected plant parts
were identified and their authenticity was
confirmed by national herbarium, Royal
Botanic Gardens, Peradeniya, Sri Lanka.
Preparation of aqueous extract of the
rhizome
Fresh powdered rhizomes of Curcuma
zedoaria (100.0 g) were boiled with 1500 mL
of distilled water and the resulting filtrate
was evaporated using a rotary vacuum
evaporator. The resulting sludge was dried
and aqueous extract of the rhizome (ARE)
was obtained.
Phytochemical analysis
The extract was screened qualitatively for
the presence of alkaloids, tannins, flavonoids,
saponins, terpenoids, carbohydrates and
gums using standard methods of analysis
described in Vishnoi (1979) and Sofowara
(1993).
Preparation, stability evaluation and
characterization of the base formulations.
A set of fourteen bases (S1 -S14) were prepared
using different ratios of white soft paraffin,
Eucalyptus oil, water, surfactants (polyethylene
glycol, Tween 80), emulsifying wax, hard
paraffin, liquid paraffin and stearic acid by
fusion method. In fusion method, the required
weight of distilled water was taken to a dry
beaker and heated up to 600C using a water
bath. At the same time, components of the oil
phase including emulsifying agents were
weighed to another container and heated up to
600C using a water bath. When components of
both aqueous and oil phases were dissolved at
600C, the aqueous phase was added drop wise
to the mixture of oil phase with continuous
stirring. The prepared bases were transferred
into universal bottles and centrifuge tubes and
labeled accordingly.
Base formulations were subjected to real time
and accelerated stability testings over a period
of 3 months and observations were made on 1st,
3rd ,5th, 10th, 15th, 29th ,45th ,60th ,75th and 90th
day at specific storage conditions [8 °C (in
refrigerator), 25 °C, 40 °C (in oven)]. In
addition, base formulations were subjected to
centrifugation stability test.
In characterization, microscopic analysis,
measuring pH, organoleptic evaluation and
evaluation of homogenicity were performed.
Incorporation of ARE to base formulations
and of preparation, stability evaluation and
characterization of cream formulations
Creams with 1%, 0.75% and 1.5% (w/w) ARE
of Curcuma zedoaria were formulated with the
best two stable base formulations (S5 and S13)
as mentioned in Table 1. Initially the aqueous
phase was prepared by mixing the required
weight of the powder of the aqueous extract
with required quantity of distilled water and
heated to 600C sing a water bath. The
components of the oil phase were weighed in to
another container and heated up to the same
temperature (600C) using a water bath. Then,
the mixture of oil phase was added drop wise to
the aqueous phase with continuous stirring.
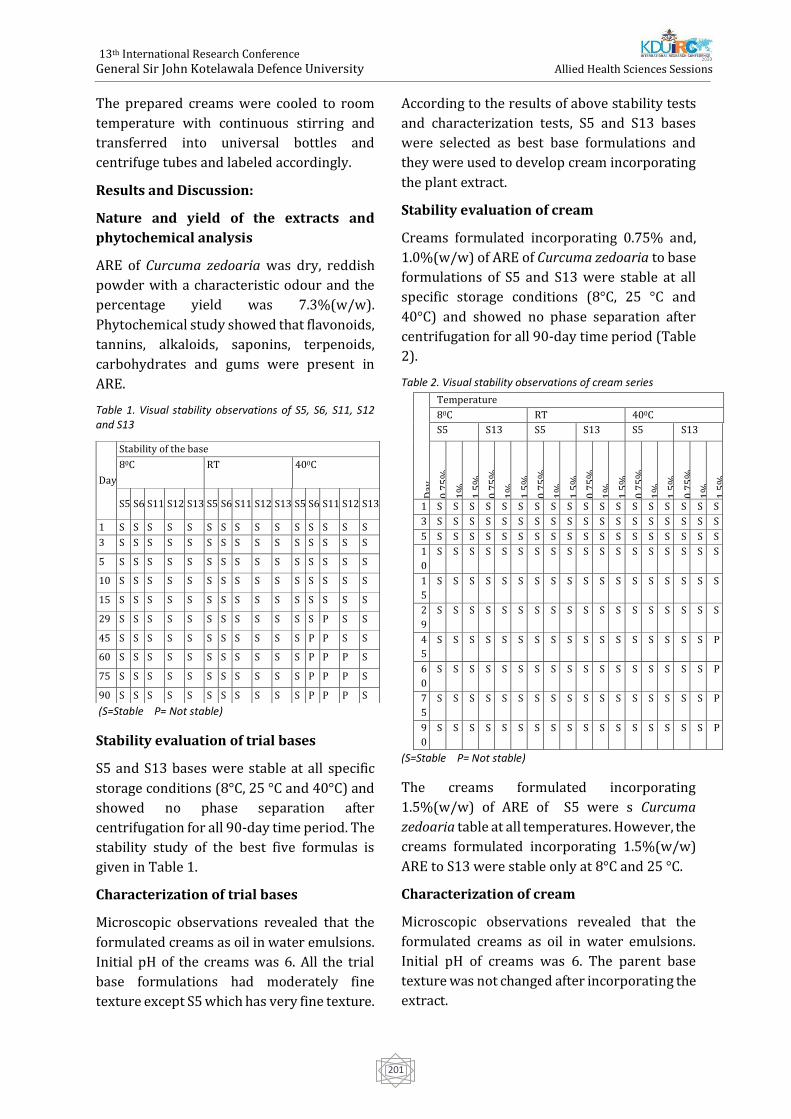
13th International Research Conference
General Sir John Kotelawala Defence University
Allied Health Sciences Sessions
201
The prepared creams were cooled to room
temperature with continuous stirring and
transferred into universal bottles and
centrifuge tubes and labeled accordingly.
Results and Discussion:
Nature and yield of the extracts and
phytochemical analysis
ARE of Curcuma zedoaria was dry, reddish
powder with a characteristic odour and the
percentage yield was 7.3%(w/w).
Phytochemical study showed that flavonoids,
tannins, alkaloids, saponins, terpenoids,
carbohydrates and gums were present in
ARE.
Table 1. Visual stability observations of S5, S6, S11, S12 and S13
(S=Stable P= Not stable)
Stability evaluation of trial bases
S5 and S13 bases were stable at all specific
storage conditions (8°C, 25 °C and 40°C) and
showed no phase separation after
centrifugation for all 90-day time period. The
stability study of the best five formulas is
given in Table 1.
Characterization of trial bases
Microscopic observations revealed that the
formulated creams as oil in water emulsions.
Initial pH of the creams was 6. All the trial
base formulations had moderately fine
texture except S5 which has very fine texture.
According to the results of above stability tests
and characterization tests, S5 and S13 bases
were selected as best base formulations and
they were used to develop cream incorporating
the plant extract.
Stability evaluation of cream
Creams formulated incorporating 0.75% and,
1.0%(w/w) of ARE of Curcuma zedoaria to base
formulations of S5 and S13 were stable at all
specific storage conditions (8°C, 25 °C and
40°C) and showed no phase separation after
centrifugation for all 90-day time period (Table
2).
Table 2. Visual stability observations of cream series
(S=Stable P= Not stable)
The creams formulated incorporating
1.5%(w/w) of ARE of S5 were s Curcuma
zedoaria table at all temperatures. However, the
creams formulated incorporating 1.5%(w/w)
ARE to S13 were stable only at 8°C and 25 °C.
Characterization of cream
Microscopic observations revealed that the
formulated creams as oil in water emulsions.
Initial pH of creams was 6. The parent base
texture was not changed after incorporating the
extract.
Day
Stability of the base
80C RT 400C
S5 S6 S11 S12 S13 S5 S6 S11 S12 S13 S5 S6 S11 S12 S13
1 S S S S S S S S S S S S S S S
3 S S S S S S S S S S S S S S S
5 S S S S S S S S S S S S S S S
10 S S S S S S S S S S S S S S S
15 S S S S S S S S S S S S S S S
29 S S S S S S S S S S S S P S S
45 S S S S S S S S S S S P P S S
60 S S S S S S S S S S S P P P S
75 S S S S S S S S S S S P P P S
90 S S S S S S S S S S S P P P S
Day
Temperature
80C RT 400C
S5 S13 S5 S13 S5 S13 0
.75
%
1%
1.5
%
0.7
5%
1%
1.5
%
0.7
5%
1%
1.5
%
0.7
5%
1%
1.5
%
0.7
5%
1%
1.5
%
0.7
5%
1%
1.5
%
1 S S S S S S S S S S S S S S S S S S
3 S S S S S S S S S S S S S S S S S S
5 S S S S S S S S S S S S S S S S S S
1
0
S S S S S S S S S S S S S S S S S S
1
5
S S S S S S S S S S S S S S S S S S
2
9
S S S S S S S S S S S S S S S S S S
4
5
S S S S S S S S S S S S S S S S S P
6
0
S S S S S S S S S S S S S S S S S P
7
5
S S S S S S S S S S S S S S S S S P
9
0
S S S S S S S S S S S S S S S S S P
13th International Research Conference
General Sir John Kotelawala Defence University
Allied Health Sciences Sessions
202
According to results and observations, S5
base is more compatible with ARE than S13
base. Also, S5 base in which white soft
paraffin used as oil phase is more cost
effective than S13 base in which eucalyptus
oil used. Both S5 and S13 creams can be
improved by incorporating anti-oxidant
agents, antimicrobial agents and
preservatives.
Resulting cream can be further subjected to
anti-inflammatory and quality control
studies to produce a marketable drug that
serves as an anti-inflammatory cream.
Conclusion:
Stable anti-inflammatory cream can be
formulated using newly found base
formulations incorporating ARE of Curcuma
zedoaria.
References:
Chandra S., Chatterjee P., Dey P. and Battacharya
S. (2012). Evaluation of in vitro anti-
inflammatory activity of coffee against
denaturation of protein. Asian paccificJournal of
Tropical Biomedicine, pp.178-180
Kumar V., Abbas A., Fausto N. and Perkins J. (2005).
Robbins and Coltran pathologic basis of disease. 7th
ed. Pennsylvania: Elsevier.
Leelaprakash G. and Dass S. (2011). In vitro anti-
inflammatory activity of methanol extract of
Enecostemmaaxillare International journal of Drug
Development and Research, 3(3), pp.189-196.
Okin D. and Medzhitov R. (2012): Evolution of
Inflammatory Diseases, Current Biology, 22 (17), pp.
R 733- R 740.
Sofowara A. Medicinal plants and Traditional
Medicinal in Africa. 2nd Ed. Sunshine House, Ibadan,
Nigeria: Spectrum Books Ltd; 1993. Screening plants
for Bioactive Agents; pp. 134-156.
Ullah, H., Sayera, Z., Juhara, F., Akter, L., Treq, S.,
Masum, E. and Battacharjee, R. (2014). Evaluation of
antinociceptive, in vivo and in vitro anti-
inflammatory activity of ethanolic extract of
Curcuma zedoariarhizome. Journal of BMC
complementary and alternative medicine, pp. 1-12.
Vishnoi NR. Advanced Practical Chemistry.
Ghaziabad-India: Yikas Publication House, PVT Ltd.;
1979. pp. 447-449.
13th International Research Conference
General Sir John Kotelawala Defence University
Allied Health Sciences Sessions
203
Poster Session
13th International Research Conference
General Sir John Kotelawala Defence University
Allied Health Sciences Sessions
204
Association of quadriceps and hamstring muscle strengths with low
back pain due to non-contact injuries among fast bowlers aged
between 15 – 19 years in division 1 boys’ schools in Colombo
HWUS Jayasinghe#, TIS Swaris, DS Weerasooriya, NVD Maura, IMS Bandara, DMKH
Disanayake and ADP Perera
1Faculty of Allied Health Sciences, General Sir John Kotelawala Defence University, Sri Lanka
Abstract. The purpose of this study was to
investigate how quadriceps and hamstring
muscle strengths associate with low back
pain (LBP) due to non-contact injuries
among 102 fast bowlers aged between 15-19
years at Colombo division 1 boys’ schools in
Sri Lanka. Eighty-five fast bowlers were
fulfilled the requirements and an interviewer
administered questionnaire was used to
gather the demographic data regarding
general characteristics and the severity of
low back pain respectively. Bowlers were
prospectively monitored over the
competition period of 2019 cricket season
and the quadriceps and hamstring muscle
strengths were recorded. SPSS software was
used to analyse the data. Thirty-seven
(43.5%) of the subjects were presented with
LBP due to non-contact injuries. Reduction of
quadriceps strength of dominant side leg and
hamstring strength of non-dominant side leg
were found to be significantly associated
with LBP (P<0.05). Conflicting results were
found for the association of quadriceps
strength of non-dominant side leg and
hamstring strength of dominant side leg with
LBP (P>0.05). There was a significant
difference for the quadriceps strength of
dominant side leg and hamstring strength of
non-dominant side leg between the fast
bowlers with and without lower back pain.
The results concluded that reduced
quadriceps muscle strength of dominant side
leg and reduced hamstring muscle strength
of non-dominant side leg have an important
role in predisposing a fast bowler to have an
increase in low back pain which occurred due to
non-contact injuries.
Keywords: quadriceps strength, hamstring
strength, low back pain, non-contact injuries,
fast bowlers, age 15-19 years
Extended Abstract
Introduction
Cricket is considered as a team sport which is
described as the gentlemen’s game originated
in South East England and has globally
developed by today. Fast bowlers have a long
run up and generate more speed in bowling/
releasing the ball when compared with the
spinners. Run up, pre-delivery stride, delivery
stride and follow through are the main
components of a fast bowling action (Mathew et
al., 2016).
Non-contact injury is defined as the occurrence
of an injury without any collision mechanism
with an external force; players or objects
(Forrest et al., 2017). Right lower limb can be
described as ipsilateral leg/ dominant leg/ non-
preferred leg while left lower limb as
contralateral leg/ non-dominant leg/ preferred
leg regarding to a right arm fast bowler. Fast
bowlers are more prone to get injuries due to
their heavy workload and repetitive stress acts
through body alignments which results from
ground reaction force (GRF) during front foot
impact and back foot impact comparing to other
different roles in cricket (Elliott, 2000). The
prevalence of injury among fast bowlers were
8% in international cricket (Mount, et al., 2014)
and 14% in Australian first class level fast
bowlers (Orchard, 2002). According to
13th International Research Conference
General Sir John Kotelawala Defence University
Allied Health Sciences Sessions
205
Pardiwala, et al., (2017), Australian, South
African, English, West Indian and Indian
bowlers are the one who experienced more
injuries (41.3%). Gamage et al., (2018)
observed lower limbs and lower back strains
and sprains are at greatest injury incidence
in Sri Lankan junior cricket bowlers with
20.3% and match injury incidence rate is 5.7.
Ground reaction force will result a stress
force on lumbar spine through foot, ankle,
knee and hip kinematic chain. This GRF is
absorbed by the knee joint through the
lumbar spine. Weakened quadriceps and
hamstring muscles result on stiffness of knee
joint and this cause reduction of shock
absorption on the knee joint and increase the
force on the lumbar spine, which increases
the vulnerability to low back injuries (Cai and
Kong 2015). Limitations in hamstring and
quadriceps strengths have a connection with
lower back injuries in highly active
sportsmen (Murphy, 1997) especially when
they are young and playing a high-risk sport
such as cricket fast bowling (Millson et al.,
2004). Hamstring and quadriceps strains
which occurred secondarily to the weakness
of those muscles have an association with
lumbar stress fractures (Orchard et al., 2010)
which is the most severe condition in young
fast bowler (Pardiwala et al., 2017).
Thus, the aim of this study was to examine
the association of quadriceps and hamstring
muscle strengths with low back pain due to
non-contact injuries among fast bowlers
aged between 15-19 years in division 1 boy’s
schools in Colombo. School fast bowlers
those who are yet having time to mature
physically are susceptible for injuries and
they are the ones who are going to represent
the national team in near future. This
research will open up the pathways to
evolving of many other research topics
related to school level cricketers about what
they are going to face in the future.
Methodology
This descriptive cross-sectional study was
conducted with 102 subjects in the competition
period of 2019 cricket season among all the
division 1 boys’ schools in Colombo.
The subjects with a history of any neurological
disorders, cardio-vascular diseases, experience
a pain in any area that different from lower back
region, complaint of pain more than 6 in the
NPRS of any joint which will be used in the test
procedures and intolerable pain during the
measurement gaining procedures were
excluded. The data provided by the fast bowlers
were collected and recorded following taking
the written informed consent and explaining
the procedure of the research. Selected subjects
performed a 5 minutes warm up session and 5
minutes static stretching exercises specially
targeting the quadriceps, hamstring, lower back
and upper extremity muscle groups in order to
minimize the variability and the standard error
of the measurements by reducing the impact of
different muscle temperature on muscle
flexibility.
Before administrating the questionnaires and
the data collection tools to the study
participants, it was administered to randomly
select 10 male fast bowler between 15-19 years
old, who were outside the defined study area.
Height was measured by using the Seca
stadiometer 282 (SecaGmBH and Co kg,
Hamburg, and Germany) and weight using the
Tanita HD 318 digital weighing scale (Tanita
Cooperation, Tokyo, Japan). Intensity of pain
was measured by using Numerical Pain Rating
Scale (NPRS).
Quadriceps and hamstring muscle strength and
muscle strength were measured by using a
modified sphygmomanometer which was made
by making adaptations to a
sphygmomanometer. The inflatable part was
folded into four equal parts and the remaining
velcro part was wrapped around the inflatable
part and fixed with adhesive tape. Before the
sphygmomanometer was taken to the data
collection it was calibrated using 2kg weights to
13th International Research Conference
General Sir John Kotelawala Defence University
Allied Health Sciences Sessions
206
check whether it provides consistent
measurements. When taking the
measurement of quadriceps strength, athlete
was sitting in 90 degrees flexed hip and 90
degrees flexed knee position. The cuff was
placed just above the ankle in line with the
knee joint in the anterior side. When
assessing the hamstring strength, the athlete
was in prone lying position with knees
extended fully. During the test, athletes were
asked to perform maximum isometric
contraction for five seconds. Athletes were
given a 10 second rest in between each
repetition. Three repetitions were given to
an individual athlete to perform.
Data analysis was done using the statistical
package for the social science (SPSS)
software. As the variable data did not express
a normal distribution across the sample, non-
parametric tests were used to analyze the
data. Mann Whitney U test was used to assess
the difference between the fast bowlers with
and without LBP. Spearman correlation was
used to assess the association between two
variables. P < 0.05 was considered for
significant level.
Results
Eighty-five (85) fast bowlers were recruited
and 17 were excluded from a preliminary
sample of 102. No adverse effects were
observed during the measurements. The
mean age of study population was 16.6 ± 1.0
years. The Prevalence of LBP was 43.5% in
the study population. The majority of the
population is with right arm bowlers (91%)
while the remaining of the population (9%)
is with left arm.
Table 1. Distribution of variables in the study population
Median values
(n=85)
P-value
With LBP (n=37)
Without LBP (n=48)
Age (years) 17.0 17.0 0.81
Bowling experience (years) 6.0 6.0 0.83
Training period (hours per week)
2.0 3.0 0.08
Body Mass Index (kg/m-2) 20.0 21.1 0.26
Quadriceps strength of non-dominant side (mmHg)
142.0 152.5 0.12
Quadriceps strength of dominant side (mmHg)
147.0 163.0 0.01
*
Hamstring strength of non-dominant side (mmHg)
101.0 117.0 0.04
*
Hamstring strength of dominant side (mmHg)
108.0 119.0 0.35
P-value → significant level * p < .05 →
significant
Table 2. Association of variables with low back pain of the study population
Low Back Pain
rsp P-value
Age (years) -0.01 0.96
Experience (years) 0.01 0.99
Training period (hours per week) -0.24 0.13
Body Mass Index (kg/m-2) -0.17 0.11
Quadriceps strength of non-dominant side (mmHg)
-0.18 0.11
Quadriceps strength of dominant side (mmHg)
-0.34* 0.01*
Hamstring strength of non-dominant side (mmHg)
-0.28* 0.01*
Hamstring strength of dominant side (mmHg)
-0.15 0.17
rsp → sperman’s correlation P-value →
significant level * p < .05 → significant
As the data did not show a normal distribution,
non-parametric median values were used to
assess the difference between two variables
(Table 1). The general characteristics (age,
experience, training period and BMI) did not
show any significant difference between the
fast bowlers with and without LBP (p>0.05).
But it showed a highly significant difference for
the quadriceps strength of dominant side and
hamstring strength of non-dominant side
between the fast bowlers with and without LBP
(p<0.05).
Association of general characteristics and
muscle strengths with the low back pain of the
13th International Research Conference
General Sir John Kotelawala Defence University
Allied Health Sciences Sessions
207
study population was evaluated in Table 2.
There were negative correlations for the age,
training period and BMI and positive
correlation for the bowling experience with
LBP of the study population which were
insignificant. The quadriceps strength of
dominant side and the hamstring strength of
non- dominant side were significantly
negatively correlated with the LBP (p<0.05)
while quadriceps strength of non-dominant
side and hamstring strength of dominant side
were negatively correlated with the LBP
insignificantly.
Discussion
This study describes the association of
quadriceps and hamstring muscle strengths
with low back pain due to non-contact
injuries in adolescent male fast bowlers
playing for division 1 Colombo boys’ schools
aged between 15-19 years. Previously some
studies had been conducted, but mostly
focusing on only one or different intrinsic
factor related to LBP in Asian region and non-
Asian region. This is the first research study
presenting quadriceps and hamstring muscle
strengths as associated intrinsic factors to
fast bowlers’ low back pain due to non-
contact injuries in Sri Lankan region.
In the present study, the mean age of the
study population was 16.6 ±1.0 years. Similar
to present study, Foster et al., (1989) also
explained that the age of the fast bowlers
(mean age=16.8) might be susceptible for
high incidence of back injuries (LBI) due to
incomplete ossification of neural arches of
lumbar vertebrae. Many of the research
studies revealed that younger players (16-20
years) are more prone for lower back injuries
among fast bowlers, mainly lumbar stress
injuries (Engstrom and Walker, 2007; Foster
et al., 1989; Hardcastle et al., 1992). Young
cricketers had more trunk and back injuries,
on-field injuries and more recurrent injuries
than the adult cricketers (Stretch, 2014).
When considering BMI, there was no significant
association between the BMI value of the male
fast bowlers and their LBP in the current study.
Also, there were lack of evidences to support
the resulted conclusion with regard to LBP of
fast bowlers and BMI. With opposed in a clinic
based cross-sectional studies (with back pain
patients) stated that LBI are common among
the people with higher BMI and obese and
overweight subjects presented with severe LBP
(Chowdhury et al., 2014). However, the current
study differs from a clinical based study as the
current study directed from a sample of elite
fast bowlers. Therefore, BMI should be
compared using a similar sample of elite fast
bowlers with a similar geographical and ethnic
area and also differentiate in various age
groups for further clarification.
In the current study, reduction of the dominant
side quadriceps muscle strength showed a
highly significant association with the LBP in
fast bowlers. Foster et al. (1989) had supported
that weakened quadriceps muscle strength lead
to low back injuries. Normally during run up
phase, the generated GRF was absorbed by the
knee joint and the lumbar spine and the
reduction of quadriceps and hamstring muscle
strength resulted on improving knee joint
stiffness and this caused reduction of shock
absorption on the knee joint and increased the
force on the lumbar spine, which increases the
vulnerability to LBI (Cai and Kong 2015). A
systemic review was done using a non-sport
population who suffered from nonspecific and
chronic LBP for more than 03 months and a
healthy population as the control group and
lower limb muscle power was checked. It was
determined that muscle power of knee
extensors was greatly reduced in nonspecific
chronic LPB group than the control group (De
Sousa et al., 2019). In contrast, a study was done
by using fast bowlers aged between 18- 22
years interpreted that quadriceps muscle
strength of non-dominant side was associated
with LBP of fast bowlers (Foster et al., 1989). In
fast bowlers, quadriceps and hamstrings
13th International Research Conference
General Sir John Kotelawala Defence University
Allied Health Sciences Sessions
208
muscles are repeatedly contracted
eccentrically and concentrically through the
run up phase and a peak vertical GRF and a
horizontal GRF exert on the dominant side
leg on delivery stride (Feros, 2015). But the
relationship between the hamstrings and
quadriceps muscle strength of the dominant
side and LBI was not identified clearly
(Elliott et al.,1989).
Reduced hamstring strength of the non-
dominant side was strongly associated with
high risk of LBP among the current study
population. Recently it was evident in some
articles (Burton, 2012; de Sousa et al., 2019)
that reduced hamstring muscle strength
cause LBP. Hamstring and quadriceps
muscles were possessed with equal
flexibility, length and strength in order to
stabilize the movements of knee and pelvis as
a pulley system. When hamstrings weakened
than quadriceps muscle, it resulted a
downward pull of pelvis by tightened
quadriceps, since hamstring muscles was
unable counter balance the pull. That
downward pull of pelvis caused
hyperextended lumbar spine. Due to the
changed vertebral angle of the spine, the
pressure placed on intervertebral discs was
increased which would lead to lower back
injuries (Burton, 2012). To support the
current study, Madic et al., (2019) conducted
a study with professional soccer players to
investigate the correlation of strength and
imbalances of knee muscles with LBP. The
study showed a satisfactory difference in
peak torque of left and right knee flexors
between players with and without LBP.
Although there were limited literatures done
related to association of hamstring strength
in prevalence of LBP in cricket fast bowlers, a
recent study has interpreted a contrast result
to our current study concluded that there
was no significant variant between
hamstring strength of persons with LBP and
without LBP, but using a non-sport related
population. (de Sousa et al., 2019).
Conclusions
In summary, the findings of this study revealed
that none of the general characteristics which
are age, BMI, training hours per week and
experience did not contribute to develop low
back pain symptoms among the adolescent fast
bowlers aged between 15-19 years. The higher
muscular strength of dominant side quadriceps
muscle and non-dominant side hamstring
muscle having less probability to develop LBP.
References
Burton, S. (2012). Weak Hamstring: Cause of Lower
Back Pain. [online] Available at:
https://ezinearticles.com/Weak-Hamstrings:-
Cause-Of-Lower-Back-Pain&id=6919593 [Accessed
11 Jan. 2020].
Cai, C. and Kong, P. W. (2015). Low back and lower-
limb muscle performance in male and female
recreational runners with chronic low back pain.
Journal of Orthopaedic and Sports Physical Therapy,
45(6), pp. 436–443.
Chowdhury, D., Sarkar, S., Rashid, M., Rahaman, A.,
Sarkar, S. and Roy, R. (2014). Influence of body mass
index on low back pain. 1(23), pp.125-9.
De Sousa, C., de Jesus, F., Machado, M. and Ferreira,
G. (2019). Lower limb muscle strength in patients
with low back pain: a systematic review and meta-
analysis. Journal of musculoskeletal & neuronal
interactions, 19(1), pp.69-78.
Elliott, B. (2000). Back injuries and the fast bowler in
cricket. Journal of Sports Sciences, 18(12), pp.983-
991.
Elliott, B., Foster, D., John, D., Ackland, T. and Fitch, K.
(1989). Biomechanical correlates of fast bowling
and back injuries in cricket: A prospective
study. Journal of Biomechanics, 22(10), p.1007.
Engstrom, C. and Walker, D., 2007. Pars
Interarticularis Stress Lesions in the Lumbar Spine
of Cricket Fast Bowlers. Medicine & Science in Sports
& Exercise, 39(1), pp.28-33.
Feros, S. (2015). The determinants and development
of fast bowling performance in cricket. [online]
hresearchgate. Available at:
https://www.researchgate.net/publication/31228
0088_The_determinants_and_development_of_fast_
13th International Research Conference
General Sir John Kotelawala Defence University
Allied Health Sciences Sessions
209
bowling_performance_in_cricket [Accessed 10
Jul. 2019].
Forrest, M., Hebert, J., Scott, B., Brini, S. and
Dempsey, A. (2017). Risk Factors for Non-Contact
Injury in Adolescent Cricket Pace Bowlers: A
Systematic Review. Sports Medicine, 47(12),
pp.2603-2619.
Foster, D., John, D., Elliott, B., Ackland, T. and Fitch,
K. (1989). Back injuries to fast bowlers in cricket:
a prospective study. British Journal of Sports
Medicine, 23(3), pp.150-154.
Gamage, P., Fortington, L., Kountouris, A. and
Finch, C. (2018). Match injuries in Sri Lankan
junior cricket: A prospective, longitudinal
study. Journal of Science and Medicine in Sport.
Hardcastle, P., Annear, P., Foster, D., Chakera, T.,
McCormick, C., Khangure, M. and Burnett, A.,
1992. Spinal abnormalities in young fast
bowlers. The Journal of Bone and Joint Surgery.
British volume, 74-B(3), pp.421-425.
Madic, D., Obradović, B., Golik-Perić, D.,
Marinković, D., Trajković, N. and Gojković, Z.
(2019). The isokinetic strength profile of semi-
professional soccer players according to low back
pain. Journal of Back and Musculoskeletal
Rehabilitation, pp.1-6.
Mathew, A., Rai, S. and Kumar, D. (2016). Low
back injuries in fast bowlers: A literature
review. International Journal of Allied Medical
Sciences and Clinical Research, 4(2), pp.184-195.
Millson, H., Gray, J., Stretch, R. and Lambert, M.
(2004). Dissociation between back pain and bone
stress reaction as measured by CT scan in young
cricket fast bowlers. British Journal of Sports
Medicine, 38(5), pp.586-591.
Mount, S., Moore, I. and Ranson, C. (2014). Injury
types and rates in an international cricket team:
application of subsequent injury
categorisation. British Journal of Sports Medicine,
48(7), pp.642.2-642.
Murphy, M., Frischknecht, R. and Koutedakis, Y.
(1997). Knee flexion to extension peak torque ratios
and low back injuries in highly active
individuals. International Journal of Sports
Medicine, 18(4), 290-295.
Orchard, J. (2002). Injuries in Australian cricket at
first class level 1995/1996 to 2000/2001
Commentary. British Journal of Sports Medicine,
36(4), pp.270-274.
Orchard, J., Farhart, P., Kountouris, A., James, T. and
Portus, M. (2010). Pace bowlers in cricket with
history of lumbar stress fracture have increased risk
of lower limb muscle strains, particularly calf
strains. Open Access Journal of Sports Medicine, 1,
pp.177-182.
Pardiwala, D., Rao, N. and Varshney, A. (2017).
Injuries in Cricket. Sports Health: A Multidisciplinary
Approach, 10(3), pp.217-222.
Stretch, R. (2014). Junior cricketers are not a smaller
version of adult cricketers: A 5-year investigation of
injuries in elite junior cricketers. South African
Journal of Sports Medicine, 26(4), p.123.
13th International Research Conference
General Sir John Kotelawala Defence University
Allied Health Sciences Sessions
210
Does learning environment differ in BSc. Nursing degree
programmes in Sri Lankan state universities?
JAVPD Jayaweera1, MRAS Thilakarathna1, WDT Shashikala1, RMLM Rathnayaka1, JARJ
Arachchige1, RDN Karunathilaka1# and AATD Amarasekara2
1 Department of Nursing and Midwifery, Faculty of Allied Health Sciences, General Sir John Kotelawala
Defence University, Sri Lanka
2 Department of Nursing & Midwifery, Faculty of Allied Health Sciences, University of Sri Jayewardenepura,
Sri Lanka
Abstract. The optimum learning
environment of the degree programme
provides better indication of its quality.
Therefore, the objective of the study is to
assess the learning environment of BSc.
Nursing degree programmes in Sri Lankan
state universities. A descriptive cross-
sectional study conducted among all 4th year
nursing undergraduates who were studying
in six Sri Lankan state universities; University
of Sri Jayewardenepura, Peradeniya, Ruhuna,
Jaffna, Eastern and General Sir John
Kotelawala Defence University. These
universities are mentioned anonymously in
arbitrarily order. The sample size was 161
and the data was collected by already
validated Dundee Ready Education
Environment (DREEM) questionnaire. The
questionnaire consisted of five domains;
student’s perception of learning, student’s
perception of teachers, student’s academic
self-perception, student’s perception of
atmosphere and student’s self-perception.
Overall scores of DREEM and subdomains
scores were calculated and categorized into
the very poor, significant problem, more
positive than negative and excellent groups.
The results revealed that the median score
(±IQR) of DREEM were 127 ± 12, 130 ± 31,
127 ± 18, 133 ± 16, 129 ± 23, 126 ± 13 among
universities out of 200. It showed that there
was more positive than the negative
environment in all BSc. Nursing degree
programmes. Furthermore, the subdomains
of DREEM also revealed that all median
scores were within more positive than the
negative group but moving to the lower
margin. Therefore remedial actions should be
taken to uplift the learning environment to
improve the quality of all bachelor nursing
degree programme in Sri Lanka in future.
Keywords: Learning environment, BSc.
Nursing degree programmes, Sri Lankan state
universities
Extended Abstract
Introduction
The environment is straightly connected to
the attainment, happiness, fulfilment and
favorable outcome of the students (Aamer et
al., 2018). The quality of environment affects
the educational programme effectively
(Genn, 2001). The learning environment is
one of the most essential element of learning
procedure (Roff et al., 2001). Successful
learning environment connects with the best
results of the learning institute
(Abdulrahman, 2013). The learning
environment is an inescapable part of the
syllabus, influencing the association between
students, techniques, assessments and
academic consequences. Learning
environment refers to weather, atmosphere,
and environment and has many different
features such as personality, spirit, culture,
family background (Palmgren and
Chandrathilake, 2011). Development of
values, views and professional performances
of students are critical factors of the learning
environment (Genn, 2001).
13th International Research Conference
General Sir John Kotelawala Defence University
Allied Health Sciences Sessions
211
Currently, separate nursing schools and
universities conduct nursing education
programme in Sri Lanka (Jayasekara and
Amarasekara, 2016). Nursing schools are joined
to the Ministry of Health as governmental
institutions. Universities are administered by the
University Grants Commission (UGC) and the
Ministry of Higher Education in Sri Lanka
(Jayasekara and Amarasekara, 2016). Currently,
pre-enrollment nursing education in Sri Lanka is
based on a nursing programme at the level of a
three-year diploma in nursing schools and four-
year Bachelor of Science (BSc) degree
programme during 2000-2002 (Jayasekara and
Amarasekara, 2016).
Consequently, a four-year degree programme
leading to B.Sc. in Nursing was started by the
University Grants Commission (UGC) in Sri
Lanka, in five universities (University of Sri-
Jayewardenepura (2005), University of
Peradeniya (2006), Eastern University. (2006),
University of Jaffna (2006), and University of
Ruhuna (2008) (Jayasekara and Amarasekara,
2016). Despite that, the UGC informed
universities to remake a curriculum, general
grade of three years with an additional year for
those students who wish to obtain a special title
(Jayasekara and Amarasekara, 2016). At
present, two types of nursing degree programme
are available in Sri Lanka. Such as direct entry
B.Sc. degree programme in state universities and
post-registration degree programme at Open
University (Jayasekara and Amarasekara, 2016).
Five standard universities in Sri Lanka have set
up pre-registration degree programme leading to
B.Sc. in Nursing, and the Open University offers
a bachelor's degree in nursing for registered
nurses of the Ministry of Health, Sri Lanka as a
post-registration programme (Jayasekara and
Amarasekara, 2016).
Current researches in the west revealed that
the learning environment straightly impacts
the learning process of nursing students
(Aamer et al., 2018). However, in west
majority universities have observed in
positive aspects of learning environment as
well as negative aspects have observed in
some universities those who are delivering
the nursing education curriculum (Aamer et
al., 2018 and Aghamolaei and Fazel, 2010).
There were limited types of research findings
available in the Sri Lankan context. However it
has been done within the single universities to
study learning environment among nursing
undergraduates in individually in university of
Ruhuna in 2012 and university of Eastern in
2016 almost four years (Hettiarachchi and
Chandana, 2012 and Punithalingam and
Sathaanathan, 2016). Now all the nursing
faculties are matured, have enough facilities and
staff. Therefore, it is needed to do more studies
and best time to evaluate the learning
environment of nursing undergraduates in
universities, Sri Lanka to achieve best outcomes
from nursing undergraduates.
However there were scanty of data in the Sri
Lankan context to compare with these results
with the global context. And also there is no
comparison between universities in globe. There
is a paucity data available in learning
environment in all state universities in the same
time period. And also there is no limit available
data in all state universities conducting the B.Sc.
degree programmes to see whether the learning
environment among these universities.
This study was conducted in all state universities
to identify the learning environment and lacking
areas of the DREEM questionnaire. Therefore
this study is needed to be conducted to compare
with all state universities and which may helpful
to develop bench mark of the nursing in Sri
Lankan context in future.
Methodology
It was a descriptive cross-sectional study
conducted in all state universities who having
B.Sc. nursing degree programme. These
universities are mentioned anonymously based
on privacy and confidentially in arbitrarily order
(A-F). For this study, 161 fourth year nursing
undergraduates who are studying in Sri Lankan
state universities A (n=29), B(n=20), C(23),
D(n=29), E(n=27) and F(n=43) were selected as
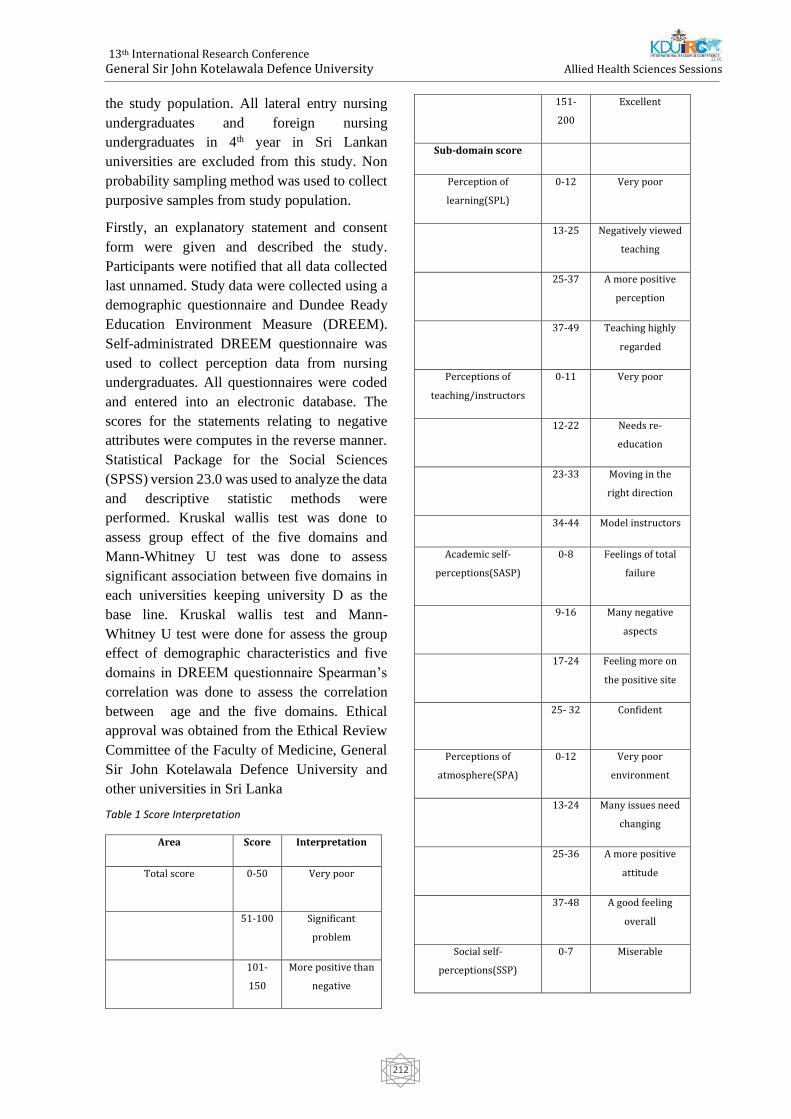
13th International Research Conference
General Sir John Kotelawala Defence University
Allied Health Sciences Sessions
212
the study population. All lateral entry nursing
undergraduates and foreign nursing
undergraduates in 4th year in Sri Lankan
universities are excluded from this study. Non
probability sampling method was used to collect
purposive samples from study population.
Firstly, an explanatory statement and consent
form were given and described the study.
Participants were notified that all data collected
last unnamed. Study data were collected using a
demographic questionnaire and Dundee Ready
Education Environment Measure (DREEM).
Self-administrated DREEM questionnaire was
used to collect perception data from nursing
undergraduates. All questionnaires were coded
and entered into an electronic database. The
scores for the statements relating to negative
attributes were computes in the reverse manner.
Statistical Package for the Social Sciences
(SPSS) version 23.0 was used to analyze the data
and descriptive statistic methods were
performed. Kruskal wallis test was done to
assess group effect of the five domains and
Mann-Whitney U test was done to assess
significant association between five domains in
each universities keeping university D as the
base line. Kruskal wallis test and Mann-
Whitney U test were done for assess the group
effect of demographic characteristics and five
domains in DREEM questionnaire Spearman’s
correlation was done to assess the correlation
between age and the five domains. Ethical
approval was obtained from the Ethical Review
Committee of the Faculty of Medicine, General
Sir John Kotelawala Defence University and
other universities in Sri Lanka
Table 1 Score Interpretation
Area Score Interpretation
Total score 0-50 Very poor
51-100 Significant
problem
101-
150
More positive than
negative
151-
200
Excellent
Sub-domain score
Perception of
learning(SPL)
0-12 Very poor
13-25 Negatively viewed
teaching
25-37 A more positive
perception
37-49 Teaching highly
regarded
Perceptions of
teaching/instructors
0-11 Very poor
12-22 Needs re-
education
23-33 Moving in the
right direction
34-44 Model instructors
Academic self-
perceptions(SASP)
0-8 Feelings of total
failure
9-16 Many negative
aspects
17-24 Feeling more on
the positive site
25- 32 Confident
Perceptions of
atmosphere(SPA)
0-12 Very poor
environment
13-24 Many issues need
changing
25-36 A more positive
attitude
37-48 A good feeling
overall
Social self-
perceptions(SSP)
0-7 Miserable
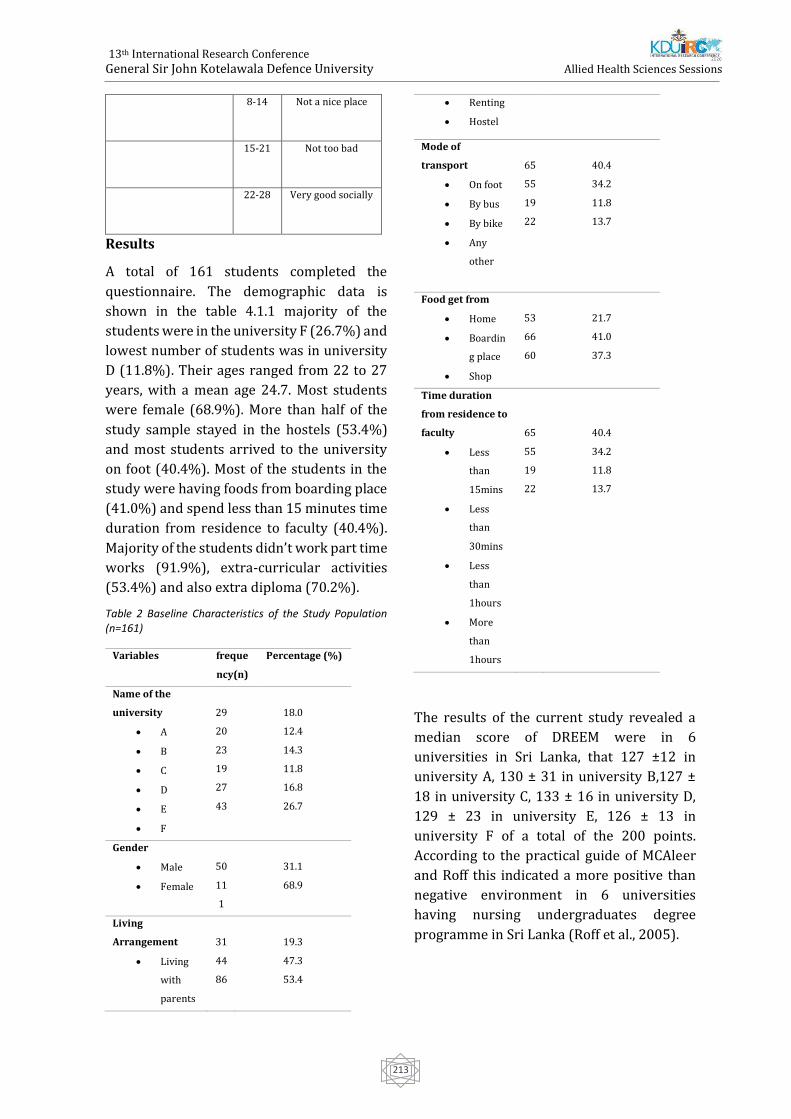
13th International Research Conference
General Sir John Kotelawala Defence University
Allied Health Sciences Sessions
213
8-14 Not a nice place
15-21 Not too bad
22-28 Very good socially
Results
A total of 161 students completed the
questionnaire. The demographic data is
shown in the table 4.1.1 majority of the
students were in the university F (26.7%) and
lowest number of students was in university
D (11.8%). Their ages ranged from 22 to 27
years, with a mean age 24.7. Most students
were female (68.9%). More than half of the
study sample stayed in the hostels (53.4%)
and most students arrived to the university
on foot (40.4%). Most of the students in the
study were having foods from boarding place
(41.0%) and spend less than 15 minutes time
duration from residence to faculty (40.4%).
Majority of the students didn’t work part time
works (91.9%), extra-curricular activities
(53.4%) and also extra diploma (70.2%).
Table 2 Baseline Characteristics of the Study Population (n=161)
Variables freque
ncy(n)
Percentage (%)
Name of the
university
• A
• B
• C
• D
• E
• F
29
20
23
19
27
43
18.0
12.4
14.3
11.8
16.8
26.7
Gender
• Male
• Female
50
11
1
31.1
68.9
Living
Arrangement
• Living
with
parents
31
44
86
19.3
47.3
53.4
• Renting
• Hostel
Mode of
transport
• On foot
• By bus
• By bike
• Any
other
65
55
19
22
40.4
34.2
11.8
13.7
Food get from
• Home
• Boardin
g place
• Shop
53
66
60
21.7
41.0
37.3
Time duration
from residence to
faculty
• Less
than
15mins
• Less
than
30mins
• Less
than
1hours
• More
than
1hours
65
55
19
22
40.4
34.2
11.8
13.7
The results of the current study revealed a
median score of DREEM were in 6
universities in Sri Lanka, that 127 ±12 in
university A, 130 ± 31 in university B,127 ±
18 in university C, 133 ± 16 in university D,
129 ± 23 in university E, 126 ± 13 in
university F of a total of the 200 points.
According to the practical guide of MCAleer
and Roff this indicated a more positive than
negative environment in 6 universities
having nursing undergraduates degree
programme in Sri Lanka (Roff et al., 2005).
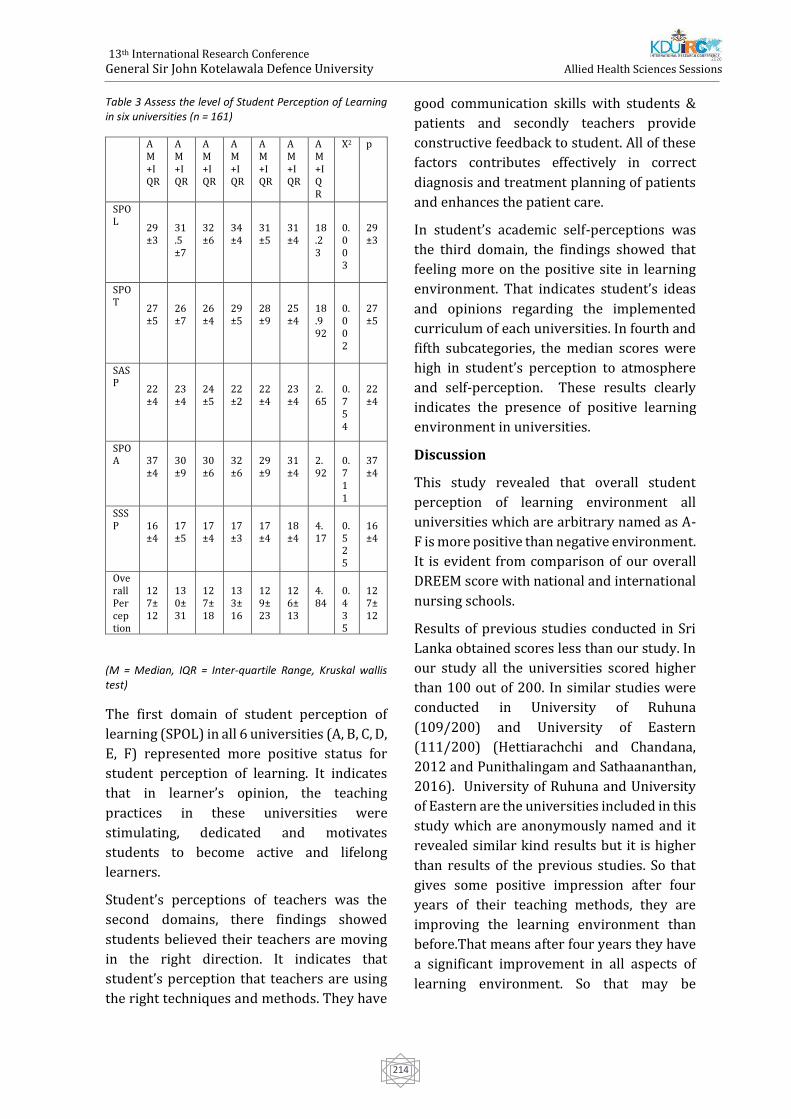
13th International Research Conference
General Sir John Kotelawala Defence University
Allied Health Sciences Sessions
214
Table 3 Assess the level of Student Perception of Learning in six universities (n = 161)
A M+IQR
A M+IQR
A M+IQR
A M+IQR
A M+IQR
A M+IQR
A M+IQR
X2 p
SPOL
29±3
31.5±7
32±6
34±4
31±5
31±4
18.23
0.003
29±3
SPOT
27±5
26±7
26±4
29±5
28±9
25±4
18.992
0.002
27±5
SASP
22±4
23±4
24±5
22±2
22±4
23±4
2.65
0.754
22±4
SPOA
37±4
30±9
30±6
32±6
29±9
31±4
2.92
0.711
37±4
SSSP
16±4
17±5
17±4
17±3
17±4
18±4
4.17
0.525
16±4
Overall Perception
127±12
130±31
127±18
133±16
129±23
126±13
4.84
0.435
127±12
(M = Median, IQR = Inter-quartile Range, Kruskal wallis test)
The first domain of student perception of
learning (SPOL) in all 6 universities (A, B, C, D,
E, F) represented more positive status for
student perception of learning. It indicates
that in learner’s opinion, the teaching
practices in these universities were
stimulating, dedicated and motivates
students to become active and lifelong
learners.
Student’s perceptions of teachers was the
second domains, there findings showed
students believed their teachers are moving
in the right direction. It indicates that
student’s perception that teachers are using
the right techniques and methods. They have
good communication skills with students &
patients and secondly teachers provide
constructive feedback to student. All of these
factors contributes effectively in correct
diagnosis and treatment planning of patients
and enhances the patient care.
In student’s academic self-perceptions was
the third domain, the findings showed that
feeling more on the positive site in learning
environment. That indicates student’s ideas
and opinions regarding the implemented
curriculum of each universities. In fourth and
fifth subcategories, the median scores were
high in student’s perception to atmosphere
and self-perception. These results clearly
indicates the presence of positive learning
environment in universities.
Discussion
This study revealed that overall student
perception of learning environment all
universities which are arbitrary named as A-
F is more positive than negative environment.
It is evident from comparison of our overall
DREEM score with national and international
nursing schools.
Results of previous studies conducted in Sri
Lanka obtained scores less than our study. In
our study all the universities scored higher
than 100 out of 200. In similar studies were
conducted in University of Ruhuna
(109/200) and University of Eastern
(111/200) (Hettiarachchi and Chandana,
2012 and Punithalingam and Sathaananthan,
2016). University of Ruhuna and University
of Eastern are the universities included in this
study which are anonymously named and it
revealed similar kind results but it is higher
than results of the previous studies. So that
gives some positive impression after four
years of their teaching methods, they are
improving the learning environment than
before.That means after four years they have
a significant improvement in all aspects of
learning environment. So that may be
13th International Research Conference
General Sir John Kotelawala Defence University
Allied Health Sciences Sessions
215
positive of their teaching experts, staff
recruitments and curriculum revisions.
In similar mean scores of DREEM reported in
Korea 112/200 (Park KH, et al., 2015),
Trinidad 106/200 (Bassaw B et al., 2003) ,
Iran 113/200 (Bakhialiabad et al., 2019),
Nigeria 118/200 (Roff S et al.,2001) and
Kuwait 106/200 (Bouhaimed M, et
al.,2009).Achieving higher DREEM score for
more student centered curricular in these
universities and have modified problem-
based learning will encourage students to
combine available learning resources
effectively (Al-Hazimi et al., 2004). These
results are below the 120. But these scores
implicates that learning environment is
positive more than negative.Total mean score
of DREEM which is higher than 120 were
reported in Lahore at Pakistan, Karachi at
Pakistan, Nepal, Indonesia, Eastern Nepal,
Australia and Iran (Zafar et al., 2017, Farooq
et al., 2016, Roff et al., 2001, Rochmawati et
al., 2014, Shrestha et al., 2019 and Starman et
al., 2018). There is a study that scored 157
which was conducted in Iran. It scored more
than 150 out of 200. It shows that there is an
excellent learning environment (Hassanian
and Oshvand, 2018).
Conclusion
All the universities who are having B.Sc.
nursing degree programme are within the
optimum range which is more positive than
negative. All are within the normal reference
range but they are need to be improved in
scores. None of the universities are in the
excellent range. So, the next target is to get
remedial actions to move all the universities
in to the excellent range that may improve the
bench mark of the nursing.
REFERENCES
Aamer, S., Umar Ziab, A., Zaib, N., Feroz, S. and
Afzal, A. (2018). Measuring student's perceptions
about the educational environment and strength
of implemented curriculum at Foundation
University College of Dentistry by DREEM's
inventory. [online]
ResearchGate.Availableat:https://www.research
gate.net/publication/328529614[Accessed 26
Mar. 2019].
Aghamolaei, T. and Fazel, I. (2010). Medical
students' perceptions of the educational
environment at an Iranian Medical Sciences
University. BMC Medical Education, 10(1).
Al-Hazimi, A., Zaini, R., Al-Hyiani, A., Hassan, N.,
Gunaid, A., Ponnamperuma, G., Karunathilake, I.,
Roff, S., McAleer, S. and Davis, M. (2004).
Educational Environment in Traditional and
Innovative Medical Schools: A Study in Four
Undergraduate Medical Schools. Education for
Health: Change in Learning & Practice, 17(2),
pp.192-203.
Al-Natour, S. (2019). Medical students'
perceptions of their educational environment at a
Saudi university. Saudi Journal of Medicine and
Medical Sciences, 7(3), p.163.
Bakhshialiabad, H., Bakhshi, G., Hashemi, Z.,
Bakhshi, A. and Abazari, F. (2019). Improving
students’ learning environment by DREEM: an
educational experiment in an Iranian medical
sciences university (2011–2016). BMC Medical
Education, 19(1).
Bassaw, B., Roff, S., McAleer, S., Roopnarinesingh,
S., De Lisle, J., Teelucksingh, S. and Gopaul, S.
(2003). Students' perspectives on the educational
environment, Faculty of Medical Sciences,
Trinidad. Medical Teacher, 25(5), pp.522-526.
Bouhaimed, M., Thalib, L. and Doi, S. (2009).
Perception of the Educational Environment by
Medical Students Undergoing a Curricular
Transition in Kuwait. Medical Principles and
Practice, 18(3), pp.204-208
Carey, R. and Dier, K. (1995). "Concepts in
Nursing",The Open University of Sri Lanka,
Nugegoda,.of the first ever Srilankan nursing
graduates at the open university of Sri Lanka by
distance education.
Chick, N. and Gortner, S. (1987). Nursing Research
in New Zealand. Western Journal of Nursing
Research, 9(3), pp.317-334.
Demirören, M. (2008). Perceptions of Students in
Different Phases of Medical Education of
13th International Research Conference
General Sir John Kotelawala Defence University
Allied Health Sciences Sessions
216
Educational Environment: Ankara University
Faculty of Medicine. Medical Education Online, 13.
Dunn, S. and PhD, P. (1995). The development of a
clinical learning environment scale. Journal of
Advanced Nursing, 22(6), pp.1166-1173.
Dunne, F., McAleer, S. and Roff, S. (2006).
Assessment of the undergraduate medical
education environment in a large UK medical
school. Health Education Journal, 65(2), pp.149-
158.
Farajpour, A., Raisolsadat, S., S. Moghadam, S. and
Mostafavian, Z. (2017). Perception of educational
environment among undergraduate students of
health disciplines in an Iranian
university. International Journal of Medical
Education, 8, pp.300-306.
Farooq, S., Rehman, R., Hussain, M. and Maria Dias,
J. (2016). Perceptions of nursing students of
educational environment at a private
undergraduate School of Nursing in
KarachiPubMed[online]Ncbi.nlm.nih.gov.Availabl
eat:https://www.ncbi.nlm.nih.gov/pubmed/[Acc
essed 27 Mar. 2019].
Fernando, J. (2005). collaboration between open
universities in the common wealth:successful
production.
Genn, J.M. (2001). AMEE Medical Education Guide
No. 23 (Part 2): Curriculum, environment, climate,
quality and change in medical education a unifying
perspective. Medical Teacher, 23(5), pp.445-454.
Gunawardena, C. (2017). Improving the quality of
university education in Sri Lanka: an analysis of
Quality Assurance Agency Council's reviews. Sri
Lanka Journal of Social Sciences, 40(1), p.3.
Hafizah, A., Mohd Said, N. and Rogayah, J. (2009).
A Study of Learning Environments in the Kulliyyah
(Faculty) of Nursing, International Islamic
University Malaysia [online]
PubMedCentral(PMC).Availableat:https://www.n
cbi.nlm.nih.gov/pmc/articles/PMC3216132/
[Accessed 26 Mar. 2019].
Hamid, B., Farrukh, A. and Mohammad Hosein, B.
(2013). Nursing Students' Perceptions of their
Educational Environment Based on DREEM Model
in an Iranian
University.PubMedNCBI.[online]Ncbi.nlm.nih.gov
.Availableat:https://www.ncbi.nlm.nih.gov/pub
med/ [Accessed 27 Mar. 2019].
Hassanian, Z. and Oshvandi, K. (2018). Nursing
and midwifery students' perceptions of
educational environment and grade point
average: a comparison between nursing and
midwifery students. Electronic Physician, 10(7),
pp.7107-7114.
Hettiarachchi, M. and Chandana, N. (2012).
Evaluation of educational environment of Nursing
Undergraduates. Galle Medical Journal, 17(2),
p.19.
Imanipour, M., Sadooghiasl, A., Ghiyasvandian, S.
and Haghani, H. (2015). Evaluating the
Educational Environment of a Nursing School by
Using the DREEM Inventory. Global Journal of
Health Science, 7(4).
Jayasekara, R. and Amarasekara, T. (2015).
Nursing Education in Sri Lanka Challenges and
Vision for the Future. [online]
https://www.researchgate.net/publication/3002
42044. Available at:
https://www.researchgate.net/publication/3002
42044 [Accessed 31 Mar. 2019].
Jayasekara, D. (2013). Evidence Based National
Framework for Undergraduate Nursing Education
in Sri Lanka. GSTF International Journal of Nursing
and Health Care, Volume 1 Number 1, 1(1).
Khabeer, A., Khan, S., Al-Shahrani, M., Farooqi, F.,
Alshamrani, A., Alabduljabbar, A., Bahamdan, A.
and Alqathani, M. (2019). Medical students'
perception of their educational environment at
Imam Abdulrahman Bin Faisal University,
Kingdom of Saudi Arabia. Journal of Family and
Community Medicine, 26(1), p.45.
Kossioni, A., Varela, R., Ekonomu, I., Lyrakos, G.
and Dimoliatis, I. (2011). Students’ perceptions of
the educational environment in a Greek Dental
School, as measured by DREEM. European Journal
of Dental Education, 16(1), pp.e73-e78.
M. (2001). After Five Years of Collaboration: The
Benefits of University Based Eduaction for Nurses
in Sri Lanka. Journal of Applied Sciences, 1(3),
pp.371-373.
Mayya, S. and Roff, S. (2004). Students'
Perceptions of Educational Environment: A
Comparison of Academic Achievers and Under-
13th International Research Conference
General Sir John Kotelawala Defence University
Allied Health Sciences Sessions
217
Achievers at Kasturba Medical College,
India. Education for Health: Change in Learning &
Practice, 17(3), pp.280-291.
Nozha, O. and Fadel, H. (2017). Student Perception
of the Educational Environment in Regular and
Bridging Nursing Programme in Saudi Arabia
using the Dundee Ready Educational Environment
Measure. Annals of Saudi Medicine, 37(3), pp.225-
231.
Palmgren, P. and Chandratilake, M. (2011).
Perception of Educational Environment Among
Undergraduate Students in a Chiropractic
Training Institution. Journal of Chiropractic
Education, 25(2), pp.151-163.
Park, K., Park, J., Kim, S., Rhee, J., Kim, J., Ahn, Y.,
Han, J. and Suh, D. (2015). Students' perception of
the educational environment of medical schools in
Korea: findings from a nationwide survey. Korean
Journal of Medical Education, 27(2), pp.117-130.
Patil, A. and Chaudhari, V. (2016). Students’
perception of the educational environment in
medical college: a study based on DREEM
questionnaire. Korean Journal of Medical
Education, 28(3), pp.281-288.
Payne, L. and Glaspie, T. (2013). Associations
between baccalaureate nursing students'
perceptions of educational environment and
HESI™ scores and GPA. Nurse Education Today,
34(6), pp.e64-e68.
Payne, L. (2013). Comparison of students'
perceptions of educational environment in
traditional vs. accelerated second degree BSN
programme. Nurse Education Today, 33(11),
pp.1388-1392.
Pimparyon, S. M Caleer, S. Pemba, S, P. (2000).
Educational environment, student approaches to
learning and academic achievement in a Thai
nursing school. Medical Teacher, 22(4), pp.359-
364.
Rochmawati, E., Rahayu, G. and Kumara, A. (2014).
Educational environment and approaches to
learning of undergraduate nursing students in an
Indonesian School of Nursing. Nurse Education in
Practice, 14(6), pp.729-733.
Roff, S., McAleer, S., Harden, R., Al-Qahtani, M.,
Ahmed, A., Deza, H., Groenen, G. and Primparyon,
P. (1997). Development and validation of the
Dundee Ready Education Environment Measure
(DREEM). Medical Teacher, 19(4), pp.295-299.
Roff, S., McAleer, S., Ifere, O. and Bhattacharya, S.
(2001). A global diagnostic tool for measuring
educational environment: comparing Nigeria and
Nepal. Medical Teacher, 23(4), pp.378-382.
Rothman, A. and Ayoade, F. (1970). The
development of a learning environment. Academic
Medicine, 45(10), pp.754-9.
Shrestha, E., Mehta, R., Mandal, G., Chaudhary, K.
and Pradhan, N. (2019). Perception of the learning
environment among the students in a nursing
college in Eastern Nepal. BMC Medical Education,
19(1).
Stormon, N., Ford, P. and Eley, D. (2018). DREEM-
ing of dentistry: Students’ perception of the
academic learning environment in Australia.
European Journal of Dental Education, 23(1),
pp.35-41.
TONTUŞ, H. (2010). DREEM; Dreams of the
Educational Environment As Its Effect on
Education Result of 11 Medical Faculties of
Turkey. Journal of Experimental and Clinical
Medicine, 27(3), pp.104-108.
Victor, G., Ishtiaq, M. and Parveen, S. (2016).
Nursing student’s perception of their educational
environment in the bachelor's programme of Shifa
College of Nursing, Pakistan. Journal of
Educational Evaluation for Health Professions, 13,
p.43.
World Health Organization. (2019). Nursing.
[online] Available at:
https://www.who.int/topics/nursing/en/
[Accessed 31 Mar. 2019].
Youhasan, P. and Sathaananthan, T. (2016).
Educational Environment for Undergraduate
Medicine and Nursing Programme at Eastern
University, Sri Lanka; Students’ Perceptions. OUSL
Journal, 11(0), p.23.
Zafar, U., Daud, S., Shakoor, Q., Chaudhry, A.,
Naser, F. and Mushtaq, M. (2017). MEDICAL
STUDENTS’ PERCEPTIONS OF THEIR
LEARNING ENVIRONMENT AT LAHORE
MEDICAL AND DENTAL COLLEGE LAHORE.
[online] Available at:
https://www.researchgate.net/publication/
322488453_Medical_Students'_Perceptions_

13th International Research Conference
General Sir John Kotelawala Defence University
Allied Health Sciences Sessions
218
Of_Their_Learning_Environment_At_Lahore_
Medical_And_Dental_College_Lahore
[Accessed 31 Jan. 2020].
Zafar, U., Daud, S., Shakoor, Q., Chaudhry, A.,
Naser, F. and Mushtaq, M. (2017). Medical
students’ perceptions of their learning
environment at lahore medical and dental
collegelahore.[online] Available at:
https://www.researchgate.net/publication/
322488453_Medical_Students'_Perceptions_
Of_Their_Learning_Environment_At_Lahore_
Medical_And_Dental_College_Lahore
[Accessed 31 Jan. 2020
13th International Research Conference
General Sir John Kotelawala Defence University
Allied Health Sciences Sessions
219
Effects of Exposure to Digital Screens in Children and Adolescence
Arosha Rajapakse1#, Dilshara Wijenayake2
1Sri Lanka Air Force 2Faculty of Medicine, University of Kelaniya
Abstract – During the past three decades, using of
screen has become an integral part of life. Over
the years the screen has become more
sophisticated and technologically developed. It
has become a concern among parents and
medical professionals on using screens by
children and adolescence for excessive amount of
time. The study focuses on physiological and
psychological effects in relation to sleep
deprivation, behaviour changes and possible
behaviour outcomes of using digital screens. The
sample was a convenient random sample of male
children from three urban schools covering
kindergarten, middle School and senior school,
ages between 05-18 years with a total of 600
children. The initial assessment for children from
ages 12-18 was done using a questionnaire to
assess the current mental status and focused
interviews were conducted. For children below
the age of 12years were assessed individually
through play and paper and pencil activities. Data
was collected through parents and teachers
regarding their behaviour. The same was cross
checked with the participants. Minnesorta leisure
time activity questionnaire, State-Trait anxiety
inventory and Outcome questionnaire 45 was
used to collect data. A self-assessed questionnaire
was used to collect data regarding the use of
smart devices, frequency of use and the level of
addiction. SPSS 22 was used to assess data.
Ethical clearance was taken from the Ethics
review committee of university of Peradeniya.
There was little social interaction even with
parents and siblings. They showed a positive
correlation with addiction to video
games/extended screen time and antisocial
behaviour traits (0.60) p0.5. The tendency for
violent acts including both verbal and physical
aggression was found. The study found
moderate evidence of positive association
between duration of screen time and severity
of symptoms of anxiety (0.55) p0.5. Children
below 12 years showed only aggressive
behaviour when devises were removed from
them. The screen time used by them is higher
compared to children over 12 years. Children
with long duration of screen time showed,
disturbed and restless in sleep and jittery.
Moderate evidence was found with screen
time including television, computer, video
and mobile phone were associated with poor
sleep outcomes including delayed bedtimes,
shortened total sleep time, sleep-onset-
latency and daytime tiredness. In conclusion,
it is a common responsibility to develop
strategies to build up children in a safer and a
supportive environment along with limited and
guided exposure to screens in order to help with
physiological and psychological wellbeing as they
grow.
Keywords: Screens, Physiological responses,
Psychological wellbeing,
Extended Abstract –
Introduction - During the past three decades,
using of screen has become an integral part of life.
Over the years screens has become more
sophisticated and technologically developed. It
has become a concern among parents and
medical professionals on using screens by
children and adolescence for excessive amount of
time. The evolution of the screen began from a
white cloth screen to todays’ blue ray light
emitting diode screens (LED) which has changed
the use of the screen dramatically. In the
beginning of the 21st century, with the invention
of smart phones, the small screen concept came
into limelight and today it has become the most
used type of screen in the society. Types of
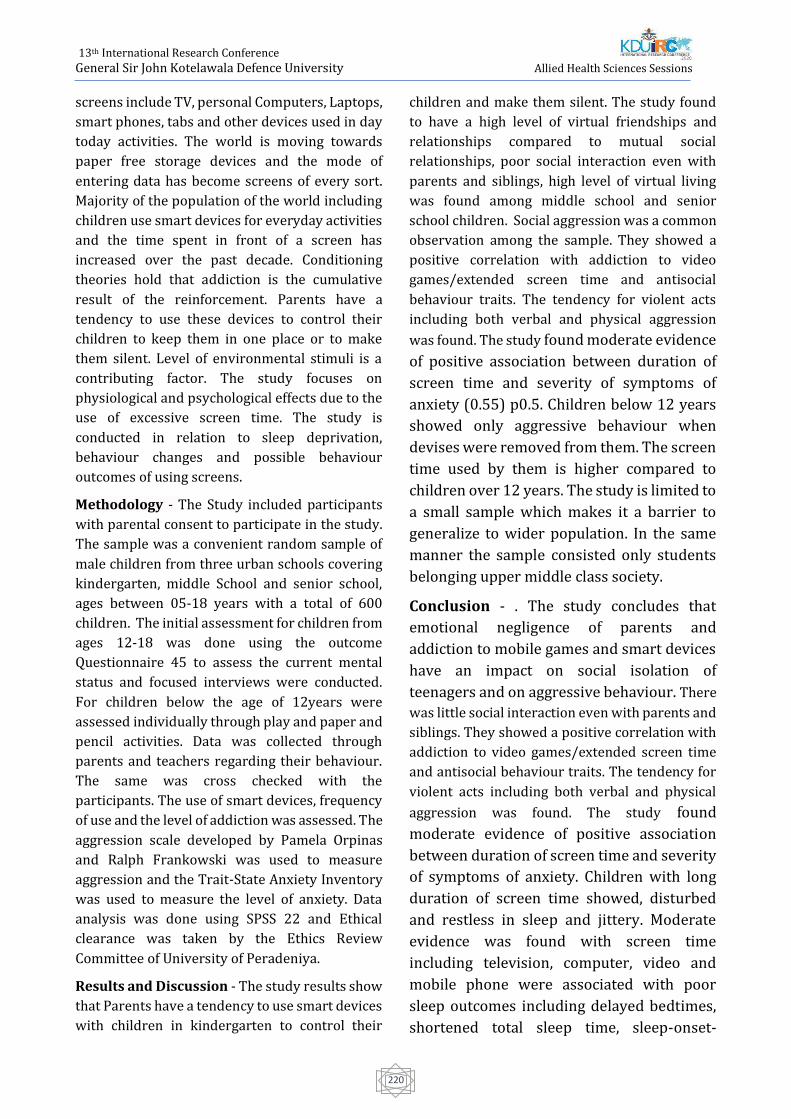
13th International Research Conference
General Sir John Kotelawala Defence University
Allied Health Sciences Sessions
220
screens include TV, personal Computers, Laptops,
smart phones, tabs and other devices used in day
today activities. The world is moving towards
paper free storage devices and the mode of
entering data has become screens of every sort.
Majority of the population of the world including
children use smart devices for everyday activities
and the time spent in front of a screen has
increased over the past decade. Conditioning
theories hold that addiction is the cumulative
result of the reinforcement. Parents have a
tendency to use these devices to control their
children to keep them in one place or to make
them silent. Level of environmental stimuli is a
contributing factor. The study focuses on
physiological and psychological effects due to the
use of excessive screen time. The study is
conducted in relation to sleep deprivation,
behaviour changes and possible behaviour
outcomes of using screens.
Methodology - The Study included participants
with parental consent to participate in the study.
The sample was a convenient random sample of
male children from three urban schools covering
kindergarten, middle School and senior school,
ages between 05-18 years with a total of 600
children. The initial assessment for children from
ages 12-18 was done using the outcome
Questionnaire 45 to assess the current mental
status and focused interviews were conducted.
For children below the age of 12years were
assessed individually through play and paper and
pencil activities. Data was collected through
parents and teachers regarding their behaviour.
The same was cross checked with the
participants. The use of smart devices, frequency
of use and the level of addiction was assessed. The
aggression scale developed by Pamela Orpinas
and Ralph Frankowski was used to measure
aggression and the Trait-State Anxiety Inventory
was used to measure the level of anxiety. Data
analysis was done using SPSS 22 and Ethical
clearance was taken by the Ethics Review
Committee of University of Peradeniya.
Results and Discussion - The study results show
that Parents have a tendency to use smart devices
with children in kindergarten to control their
children and make them silent. The study found
to have a high level of virtual friendships and
relationships compared to mutual social
relationships, poor social interaction even with
parents and siblings, high level of virtual living
was found among middle school and senior
school children. Social aggression was a common
observation among the sample. They showed a
positive correlation with addiction to video
games/extended screen time and antisocial
behaviour traits. The tendency for violent acts
including both verbal and physical aggression
was found. The study found moderate evidence
of positive association between duration of
screen time and severity of symptoms of
anxiety (0.55) p0.5. Children below 12 years
showed only aggressive behaviour when
devises were removed from them. The screen
time used by them is higher compared to
children over 12 years. The study is limited to
a small sample which makes it a barrier to
generalize to wider population. In the same
manner the sample consisted only students
belonging upper middle class society.
Conclusion - . The study concludes that
emotional negligence of parents and
addiction to mobile games and smart devices
have an impact on social isolation of
teenagers and on aggressive behaviour. There
was little social interaction even with parents and
siblings. They showed a positive correlation with
addiction to video games/extended screen time
and antisocial behaviour traits. The tendency for
violent acts including both verbal and physical
aggression was found. The study found
moderate evidence of positive association
between duration of screen time and severity
of symptoms of anxiety. Children with long
duration of screen time showed, disturbed
and restless in sleep and jittery. Moderate
evidence was found with screen time
including television, computer, video and
mobile phone were associated with poor
sleep outcomes including delayed bedtimes,
shortened total sleep time, sleep-onset-
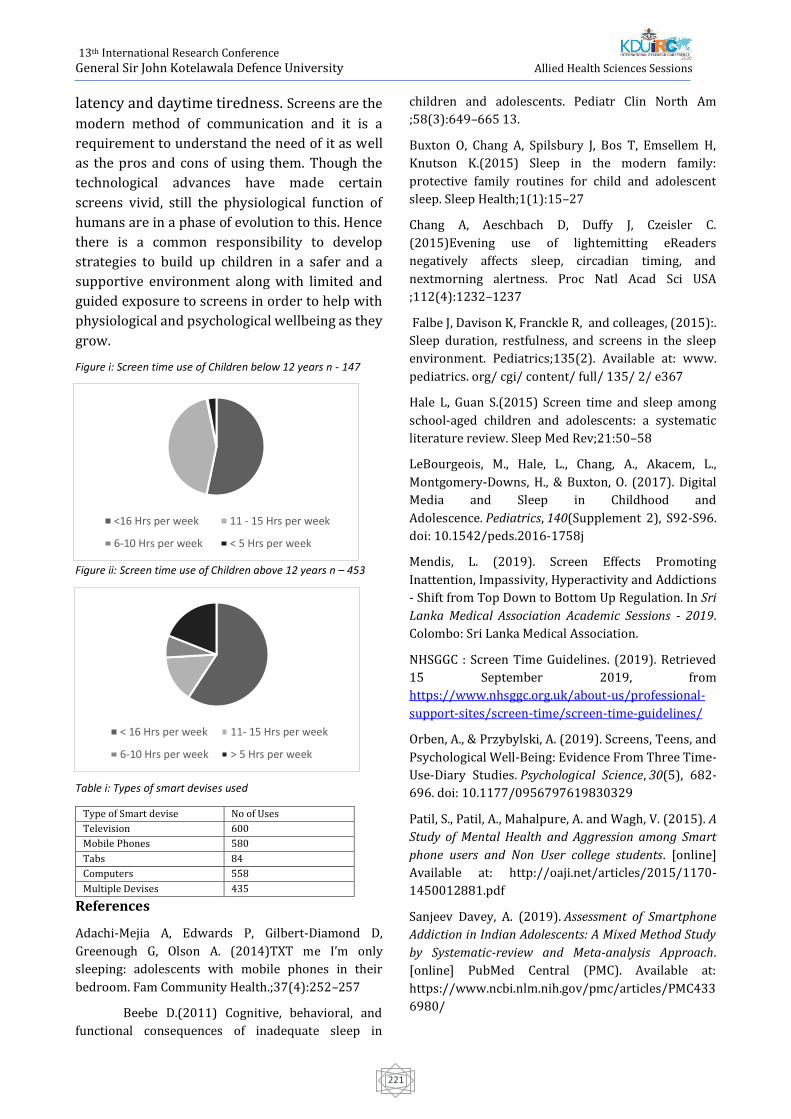
13th International Research Conference
General Sir John Kotelawala Defence University
Allied Health Sciences Sessions
221
latency and daytime tiredness. Screens are the
modern method of communication and it is a
requirement to understand the need of it as well
as the pros and cons of using them. Though the
technological advances have made certain
screens vivid, still the physiological function of
humans are in a phase of evolution to this. Hence
there is a common responsibility to develop
strategies to build up children in a safer and a
supportive environment along with limited and
guided exposure to screens in order to help with
physiological and psychological wellbeing as they
grow.
Figure i: Screen time use of Children below 12 years n - 147
Figure ii: Screen time use of Children above 12 years n – 453
Table i: Types of smart devises used
References
Adachi-Mejia A, Edwards P, Gilbert-Diamond D,
Greenough G, Olson A. (2014)TXT me I’m only
sleeping: adolescents with mobile phones in their
bedroom. Fam Community Health.;37(4):252–257
Beebe D.(2011) Cognitive, behavioral, and
functional consequences of inadequate sleep in
children and adolescents. Pediatr Clin North Am
;58(3):649–665 13.
Buxton O, Chang A, Spilsbury J, Bos T, Emsellem H,
Knutson K.(2015) Sleep in the modern family:
protective family routines for child and adolescent
sleep. Sleep Health;1(1):15–27
Chang A, Aeschbach D, Duffy J, Czeisler C.
(2015)Evening use of lightemitting eReaders
negatively affects sleep, circadian timing, and
nextmorning alertness. Proc Natl Acad Sci USA
;112(4):1232–1237
Falbe J, Davison K, Franckle R, and colleages, (2015):.
Sleep duration, restfulness, and screens in the sleep
environment. Pediatrics;135(2). Available at: www.
pediatrics. org/ cgi/ content/ full/ 135/ 2/ e367
Hale L, Guan S.(2015) Screen time and sleep among
school-aged children and adolescents: a systematic
literature review. Sleep Med Rev;21:50–58
LeBourgeois, M., Hale, L., Chang, A., Akacem, L.,
Montgomery-Downs, H., & Buxton, O. (2017). Digital
Media and Sleep in Childhood and
Adolescence. Pediatrics, 140(Supplement 2), S92-S96.
doi: 10.1542/peds.2016-1758j
Mendis, L. (2019). Screen Effects Promoting
Inattention, Impassivity, Hyperactivity and Addictions
- Shift from Top Down to Bottom Up Regulation. In Sri
Lanka Medical Association Academic Sessions - 2019.
Colombo: Sri Lanka Medical Association.
NHSGGC : Screen Time Guidelines. (2019). Retrieved
15 September 2019, from
https://www.nhsggc.org.uk/about-us/professional-
support-sites/screen-time/screen-time-guidelines/
Orben, A., & Przybylski, A. (2019). Screens, Teens, and
Psychological Well-Being: Evidence From Three Time-
Use-Diary Studies. Psychological Science, 30(5), 682-
696. doi: 10.1177/0956797619830329
Patil, S., Patil, A., Mahalpure, A. and Wagh, V. (2015). A
Study of Mental Health and Aggression among Smart
phone users and Non User college students. [online]
Available at: http://oaji.net/articles/2015/1170-
1450012881.pdf Sanjeev Davey, A. (2019). Assessment of Smartphone
Addiction in Indian Adolescents: A Mixed Method Study
by Systematic-review and Meta-analysis Approach.
[online] PubMed Central (PMC). Available at:
https://www.ncbi.nlm.nih.gov/pmc/articles/PMC433
6980/
Type of Smart devise No of Uses
Television 600
Mobile Phones 580
Tabs 84
Computers 558
Multiple Devises 435
< 16 Hrs per week 11- 15 Hrs per week
6-10 Hrs per week > 5 Hrs per week
<16 Hrs per week 11 - 15 Hrs per week
6-10 Hrs per week < 5 Hrs per week
13th International Research Conference
General Sir John Kotelawala Defence University
Allied Health Sciences Sessions
222
Screen time associated with behavioral problems in
preschoolers (2019, April 17) retrieved 31 August
2019 from https://medicalxpress.com/news/2019-
04-screen-behavioral-problemspreschoolers.html
Stiglic, N., & Viner, R. (2019). Effects of screentime on
the health and well-being of children and adolescents:
a systematic review of reviews. BMJ Open, 9(1),
e023191. doi: 10.1136/bmjopen-2018-023191
Tamana SK, Ezeugwu V, Chikuma J, Lefebvre DL, Azad
MB, Moraes TJ, and colleages,:. (2019) Screen-time is
associated with inattention problems in preschoolers:
Results from the CHILD birth cohort study. PLoS ONE
14(4): e0213995.
doi.org/10.1371/journal.pone.0213995
Twenge, J., & Campbell, W. (2018).
Associations between screen time and lower
psychological well-being among children and
adolescents: Evidence from a population-based
study. Preventive Medicine Reports, 12, 271-283.
doi: 10.1016/j.pmedr.2018.10.003
Wai Hang Kwok, S., Hong Lee, P. and Lai
Tong Lee, R. (2017). Smart Device Use and
Perceived Physical and Psychosocial Outcomes
among Hong Kong Adolescents. [online]
https://www.ncbi.nlm.nih.gov/pmc/articles/PMC53
34759/. Available at: https://www.mdpi.com/1660-
4601/14/2/205/pdf .
13th International Research Conference
General Sir John Kotelawala Defence University
Allied Health Sciences Sessions
223
Knowledge on disaster preparedness and associated work related factors
among allied health professionals at Teaching hospital, Jaffna
Pirasanth Niruja1, P. A. Dinesh Coonghe2, and S. T. Sarma3
1Postgraduate Institute of Sciences, University of Peradeniya, Sri Lanka
2Department of Community and Family Medicine, University of Jaffna, Sri Lanka
3University surgical unit, University of Jaffna, Sri Lanka
Abstract—Time to time as Sri Lankans, we
have faced major natural hazards. Though
disasters create a heavy physical and
psychological burden for the members of the
healthcare team, their preparedness to meet
the disaster is utmost important as they are in
the frontline of disaster management. The
purpose of this study was to assess the level
of knowledge on disaster preparedness and
associated work related among allied health
professionals at Teaching Hospital, Jaffna. A
descriptive cross-sectional study was done
with 300 allied health professionals recruited
using stratified random sampling method. A
multi sectional self-administered
questionnaire was used to collect data.
Correlation analysis and independent sample
t-test and ANOVA were performed to identify
associated factors. The mean age of
participants was 34.5(SD±8.031) years. More
than half of the participants were Nurses
(n=209, 69.7%). The following work related
factors were statistically significant on
knowledge of disaster preparedness among
allied health professionals. Travelling
distance from residence was positively
correlated with knowledge on disaster
preparedness r (300) =0.123, p=0.033.
Educational status, occupation and
professional experiences were statistically
significant associated factors for knowledge
on disaster preparedness (p<0.001). There is
a huge gap between the knowledge level on
disaster and current needs of disaster
preparedness among allied health
professionals. They had limited opportunities
for training. Specially nurses had that kind of
practices than other allied health
professionals. Therefore, training should be
provided focusing on the specific gaps
identified. Disaster preparedness should be
rehearsed possibly through training and
simulation exercises because training and
education in disaster preparedness are
considered as back bone.
Keywords— Disaster preparedness,
Knowledge, Associated work related factors
INTRODUCTION
Globally hospitals have been involved in both
internal and external disasters. These two
types of disasters are independent but not
mutually exclusive. Internal disasters are
integrated to the hospital and occur more
frequently than external disasters. External
disasters affect the community as well as the
hospital (Sakhare et al., 2016). Communities
may need to be rebuilt physically, mentally,
economically and socially with the strike of
disasters (eg pandemic, epidemic outbreak).
Especially in disasters that involve a large
number of people such as pandemic or
epidemic outbreak, all hospitals will be
expected to play a major part in the response.
With no or insufficient emergency plans, the
hospital resources may be overwhelmed.
As one of the key steps in disaster
management is preparedness. All health care
professionals need to be familiar with
effective actions in the case of disastrous
events and in turn must receive proper
disaster preparedness education, including
continuing education courses in disaster
management, regular drills within the
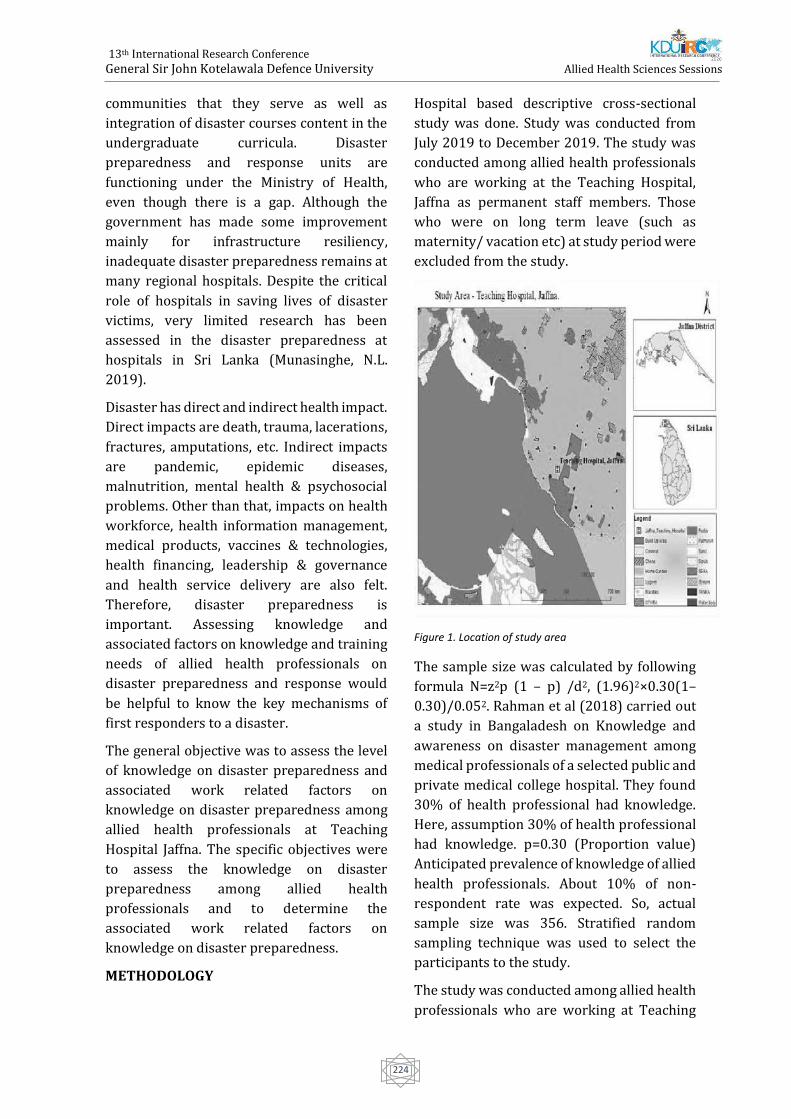
13th International Research Conference
General Sir John Kotelawala Defence University
Allied Health Sciences Sessions
224
communities that they serve as well as
integration of disaster courses content in the
undergraduate curricula. Disaster
preparedness and response units are
functioning under the Ministry of Health,
even though there is a gap. Although the
government has made some improvement
mainly for infrastructure resiliency,
inadequate disaster preparedness remains at
many regional hospitals. Despite the critical
role of hospitals in saving lives of disaster
victims, very limited research has been
assessed in the disaster preparedness at
hospitals in Sri Lanka (Munasinghe, N.L.
2019).
Disaster has direct and indirect health impact.
Direct impacts are death, trauma, lacerations,
fractures, amputations, etc. Indirect impacts
are pandemic, epidemic diseases,
malnutrition, mental health & psychosocial
problems. Other than that, impacts on health
workforce, health information management,
medical products, vaccines & technologies,
health financing, leadership & governance
and health service delivery are also felt.
Therefore, disaster preparedness is
important. Assessing knowledge and
associated factors on knowledge and training
needs of allied health professionals on
disaster preparedness and response would
be helpful to know the key mechanisms of
first responders to a disaster.
The general objective was to assess the level
of knowledge on disaster preparedness and
associated work related factors on
knowledge on disaster preparedness among
allied health professionals at Teaching
Hospital Jaffna. The specific objectives were
to assess the knowledge on disaster
preparedness among allied health
professionals and to determine the
associated work related factors on
knowledge on disaster preparedness.
METHODOLOGY
Hospital based descriptive cross-sectional
study was done. Study was conducted from
July 2019 to December 2019. The study was
conducted among allied health professionals
who are working at the Teaching Hospital,
Jaffna as permanent staff members. Those
who were on long term leave (such as
maternity/ vacation etc) at study period were
excluded from the study.
Figure 1. Location of study area
The sample size was calculated by following
formula N=z2p (1 – p) /d2, (1.96)2×0.30(1–
0.30)/0.052. Rahman et al (2018) carried out
a study in Bangaladesh on Knowledge and
awareness on disaster management among
medical professionals of a selected public and
private medical college hospital. They found
30% of health professional had knowledge.
Here, assumption 30% of health professional
had knowledge. p=0.30 (Proportion value)
Anticipated prevalence of knowledge of allied
health professionals. About 10% of non-
respondent rate was expected. So, actual
sample size was 356. Stratified random
sampling technique was used to select the
participants to the study.
The study was conducted among allied health
professionals who are working at Teaching
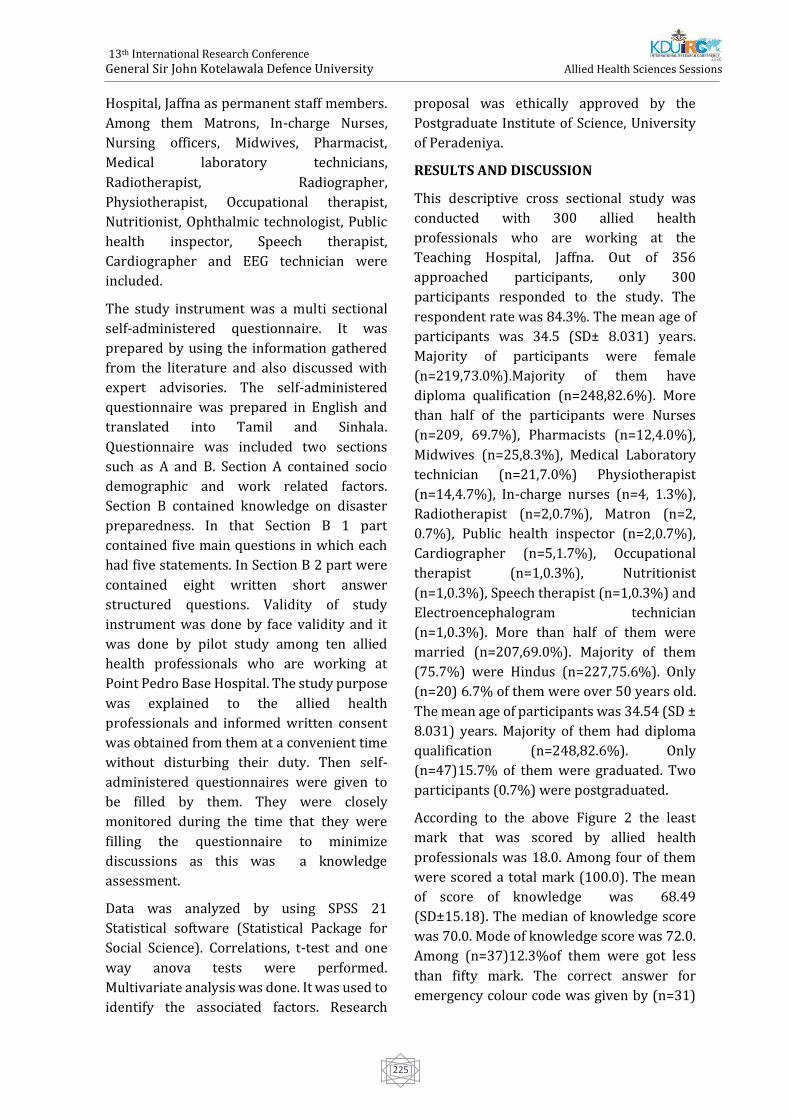
13th International Research Conference
General Sir John Kotelawala Defence University
Allied Health Sciences Sessions
225
Hospital, Jaffna as permanent staff members.
Among them Matrons, In-charge Nurses,
Nursing officers, Midwives, Pharmacist,
Medical laboratory technicians,
Radiotherapist, Radiographer,
Physiotherapist, Occupational therapist,
Nutritionist, Ophthalmic technologist, Public
health inspector, Speech therapist,
Cardiographer and EEG technician were
included.
The study instrument was a multi sectional
self-administered questionnaire. It was
prepared by using the information gathered
from the literature and also discussed with
expert advisories. The self-administered
questionnaire was prepared in English and
translated into Tamil and Sinhala.
Questionnaire was included two sections
such as A and B. Section A contained socio
demographic and work related factors.
Section B contained knowledge on disaster
preparedness. In that Section B 1 part
contained five main questions in which each
had five statements. In Section B 2 part were
contained eight written short answer
structured questions. Validity of study
instrument was done by face validity and it
was done by pilot study among ten allied
health professionals who are working at
Point Pedro Base Hospital. The study purpose
was explained to the allied health
professionals and informed written consent
was obtained from them at a convenient time
without disturbing their duty. Then self-
administered questionnaires were given to
be filled by them. They were closely
monitored during the time that they were
filling the questionnaire to minimize
discussions as this was a knowledge
assessment.
Data was analyzed by using SPSS 21
Statistical software (Statistical Package for
Social Science). Correlations, t-test and one
way anova tests were performed.
Multivariate analysis was done. It was used to
identify the associated factors. Research
proposal was ethically approved by the
Postgraduate Institute of Science, University
of Peradeniya.
RESULTS AND DISCUSSION
This descriptive cross sectional study was
conducted with 300 allied health
professionals who are working at the
Teaching Hospital, Jaffna. Out of 356
approached participants, only 300
participants responded to the study. The
respondent rate was 84.3%. The mean age of
participants was 34.5 (SD± 8.031) years.
Majority of participants were female
(n=219,73.0%).Majority of them have
diploma qualification (n=248,82.6%). More
than half of the participants were Nurses
(n=209, 69.7%), Pharmacists (n=12,4.0%),
Midwives (n=25,8.3%), Medical Laboratory
technician (n=21,7.0%) Physiotherapist
(n=14,4.7%), In-charge nurses (n=4, 1.3%),
Radiotherapist (n=2,0.7%), Matron (n=2,
0.7%), Public health inspector (n=2,0.7%),
Cardiographer (n=5,1.7%), Occupational
therapist (n=1,0.3%), Nutritionist
(n=1,0.3%), Speech therapist (n=1,0.3%) and
Electroencephalogram technician
(n=1,0.3%). More than half of them were
married (n=207,69.0%). Majority of them
(75.7%) were Hindus (n=227,75.6%). Only
(n=20) 6.7% of them were over 50 years old.
The mean age of participants was 34.54 (SD ±
8.031) years. Majority of them had diploma
qualification (n=248,82.6%). Only
(n=47)15.7% of them were graduated. Two
participants (0.7%) were postgraduated.
According to the above Figure 2 the least
mark that was scored by allied health
professionals was 18.0. Among four of them
were scored a total mark (100.0). The mean
of score of knowledge was 68.49
(SD±15.18). The median of knowledge score
was 70.0. Mode of knowledge score was 72.0.
Among (n=37)12.3%of them were got less
than fifty mark. The correct answer for
emergency colour code was given by (n=31)
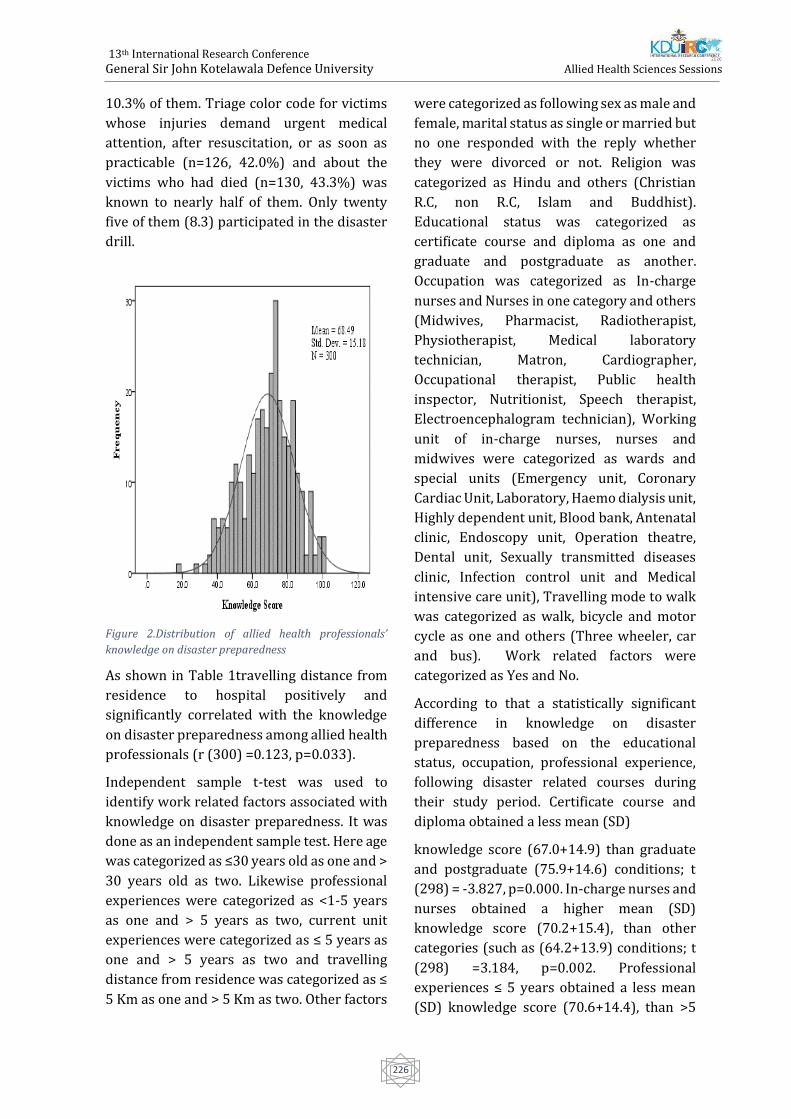
13th International Research Conference
General Sir John Kotelawala Defence University
Allied Health Sciences Sessions
226
10.3% of them. Triage color code for victims
whose injuries demand urgent medical
attention, after resuscitation, or as soon as
practicable (n=126, 42.0%) and about the
victims who had died (n=130, 43.3%) was
known to nearly half of them. Only twenty
five of them (8.3) participated in the disaster
drill.
Figure 2.Distribution of allied health professionals’
knowledge on disaster preparedness
As shown in Table 1travelling distance from
residence to hospital positively and
significantly correlated with the knowledge
on disaster preparedness among allied health
professionals (r (300) =0.123, p=0.033).
Independent sample t-test was used to
identify work related factors associated with
knowledge on disaster preparedness. It was
done as an independent sample test. Here age
was categorized as ≤30 years old as one and >
30 years old as two. Likewise professional
experiences were categorized as <1-5 years
as one and > 5 years as two, current unit
experiences were categorized as ≤ 5 years as
one and > 5 years as two and travelling
distance from residence was categorized as ≤
5 Km as one and > 5 Km as two. Other factors
were categorized as following sex as male and
female, marital status as single or married but
no one responded with the reply whether
they were divorced or not. Religion was
categorized as Hindu and others (Christian
R.C, non R.C, Islam and Buddhist).
Educational status was categorized as
certificate course and diploma as one and
graduate and postgraduate as another.
Occupation was categorized as In-charge
nurses and Nurses in one category and others
(Midwives, Pharmacist, Radiotherapist,
Physiotherapist, Medical laboratory
technician, Matron, Cardiographer,
Occupational therapist, Public health
inspector, Nutritionist, Speech therapist,
Electroencephalogram technician), Working
unit of in-charge nurses, nurses and
midwives were categorized as wards and
special units (Emergency unit, Coronary
Cardiac Unit, Laboratory, Haemo dialysis unit,
Highly dependent unit, Blood bank, Antenatal
clinic, Endoscopy unit, Operation theatre,
Dental unit, Sexually transmitted diseases
clinic, Infection control unit and Medical
intensive care unit), Travelling mode to walk
was categorized as walk, bicycle and motor
cycle as one and others (Three wheeler, car
and bus). Work related factors were
categorized as Yes and No.
According to that a statistically significant
difference in knowledge on disaster
preparedness based on the educational
status, occupation, professional experience,
following disaster related courses during
their study period. Certificate course and
diploma obtained a less mean (SD)
knowledge score (67.0+14.9) than graduate
and postgraduate (75.9+14.6) conditions; t
(298) = -3.827, p=0.000. In-charge nurses and
nurses obtained a higher mean (SD)
knowledge score (70.2+15.4), than other
categories (such as (64.2+13.9) conditions; t
(298) =3.184, p=0.002. Professional
experiences ≤ 5 years obtained a less mean
(SD) knowledge score (70.6+14.4), than >5
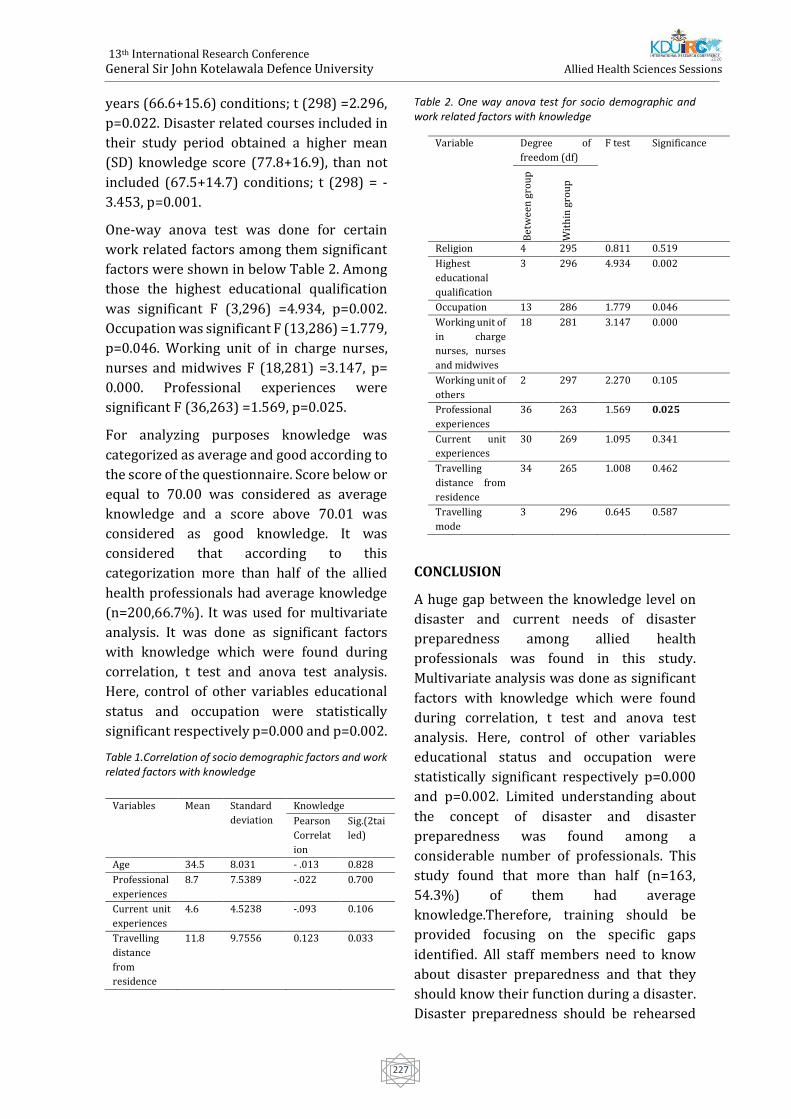
13th International Research Conference
General Sir John Kotelawala Defence University
Allied Health Sciences Sessions
227
years (66.6+15.6) conditions; t (298) =2.296,
p=0.022. Disaster related courses included in
their study period obtained a higher mean
(SD) knowledge score (77.8+16.9), than not
included (67.5+14.7) conditions; t (298) = -
3.453, p=0.001.
One-way anova test was done for certain
work related factors among them significant
factors were shown in below Table 2. Among
those the highest educational qualification
was significant F (3,296) =4.934, p=0.002.
Occupation was significant F (13,286) =1.779,
p=0.046. Working unit of in charge nurses,
nurses and midwives F (18,281) =3.147, p=
0.000. Professional experiences were
significant F (36,263) =1.569, p=0.025.
For analyzing purposes knowledge was
categorized as average and good according to
the score of the questionnaire. Score below or
equal to 70.00 was considered as average
knowledge and a score above 70.01 was
considered as good knowledge. It was
considered that according to this
categorization more than half of the allied
health professionals had average knowledge
(n=200,66.7%). It was used for multivariate
analysis. It was done as significant factors
with knowledge which were found during
correlation, t test and anova test analysis.
Here, control of other variables educational
status and occupation were statistically
significant respectively p=0.000 and p=0.002.
Table 1.Correlation of socio demographic factors and work related factors with knowledge
Table 2. One way anova test for socio demographic and work related factors with knowledge
CONCLUSION
A huge gap between the knowledge level on
disaster and current needs of disaster
preparedness among allied health
professionals was found in this study.
Multivariate analysis was done as significant
factors with knowledge which were found
during correlation, t test and anova test
analysis. Here, control of other variables
educational status and occupation were
statistically significant respectively p=0.000
and p=0.002. Limited understanding about
the concept of disaster and disaster
preparedness was found among a
considerable number of professionals. This
study found that more than half (n=163,
54.3%) of them had average
knowledge.Therefore, training should be
provided focusing on the specific gaps
identified. All staff members need to know
about disaster preparedness and that they
should know their function during a disaster.
Disaster preparedness should be rehearsed
Variables Mean Standard
deviation
Knowledge
Pearson
Correlat
ion
Sig.(2tai
led)
Age 34.5 8.031 - .013 0.828
Professional
experiences
8.7 7.5389 -.022 0.700
Current unit
experiences
4.6 4.5238 -.093 0.106
Travelling
distance
from
residence
11.8 9.7556 0.123 0.033
Variable Degree of
freedom (df)
F test Significance
Bet
wee
n g
rou
p
Wit
hin
gro
up
Religion 4 295 0.811 0.519
Highest
educational
qualification
3 296 4.934 0.002
Occupation 13 286 1.779 0.046
Working unit of
in charge
nurses, nurses
and midwives
18 281 3.147 0.000
Working unit of
others
2 297 2.270 0.105
Professional
experiences
36 263 1.569 0.025
Current unit
experiences
30 269 1.095 0.341
Travelling
distance from
residence
34 265 1.008 0.462
Travelling
mode
3 296 0.645 0.587
13th International Research Conference
General Sir John Kotelawala Defence University
Allied Health Sciences Sessions
228
possibly through training and simulation
exercises because training and education in
disaster preparedness are considered as
backbone.
REFERENCES
Boyce, M., and Katz, R. (2019). Community health
workers and pandemic preparedness current and
prospective roles. Frontiers in Public Health
7(62), 1-5.
Dancey, C.P., Reidy, J.G. and Rowe, R. (2012).
Statistics for the health sciences. SAGE
publications, London.
Ibrahim, F.A.A., (2014). Nurses knowledge,
attitudes, practices and familiarity regarding
disaster and emergency preparedness. American
Journal of Nursing Science 3(2), 18-25.
ICRC (International Federation of Red Cross and
Red Crescent Societies), (2000, June) Introduction
to disaster preparedness. Hand book for
delegates, 1-20.
Kathmandu, N. (2006). A mass casualty
management trainer’s manual World Health
Organization.
Munasinghe, N.L. 2019. Examining disaster
preparedness at Matara district general hospital
in Sri Lanka. International Journal of Disaster Risk
Reduction, 40.
Pathirage, C., Seneviratne, K., Amaratunga, D. and
Haigh, R. (2012). Managing disaster knowledge:
identification of knowledge factors and
challenges, International Journal of Disaster
Resilience in the Built Environment 3 (3), 237-
252.
Rahman, A.B., Chaklader, M.A. and Muhamad, F.
(2018). Knowledge and awareness on disaster
management among medical professionals of a
selected public and private medical college
hospital. International Journal of Advances in
Medicine 5(6).
Sakhare, V., Waghmare, S. and Joshi, S.G. (2016).
Knowledge and attitude regarding the health care
team members in selected hospitals of Pune city.
International Journal of Recent Scientific Research
7(5), 11251-11257.
ACKNOWLEDGEMENT
I would like to express my sincere thanks to
Prof. B. S. B. Kaunaratne, Postgraduate
Institute of Science, University of Peradeniya
for their support to make this attempt
successful. I would like to express my utmost
gratitude to Dr. P. A. Dinesh Coonghe, Dr. S. T.
Sarma, Mr. T. Sangarapillai and
Dr.S.Sivapathamoorthy who have supported
for my successful completion of this study. It
was with their advice and leadership I could
accomplish my research. My heartiest thanks
to my family for their valuable physical and
psychological support for completion of this
study. In the end I would like to express my
thanks to my lecturers, non-academic staffs
and friends at Postgraduate Institute of
Science for their support throughout the
completion of this study.
13th International Research Conference
General Sir John Kotelawala Defence University
Allied Health Sciences Sessions
229
The relationship between static foot posture and chronic bilateral
knee osteoarthritis among the patients attending Department of
Rheumatology and Rehabilitation (General), National hospital, Sri
Lanka
Gunawardana GEE1 , Kandegedara WMST1 , Perera AY1 , Ramdina MDL1 , Rathnayake
RMVS1 , Thilsath MHM1# , Praveena T2 , Balasuriya A3
1Faculty of Allied Health Sciences, General Sir John Kotelawala Defence University, Colombo, Sri Lanka. 2Department of Physiotherapy, Faculty of Allied Health Sciences, General Sir John Kotelawala Defence
University, Colombo, Sri Lanka. 3Faculty of Medicine, General Sir John Kotelawala Defence University, Colombo, Sri Lanka.
Abstract. Knee osteoarthritis is one of the
most common types of arthritis presented in
Sri Lanka that deteriorates the quality of life
and physical performances of affected
individuals. In chronic bilateral knee
osteoarthritis, there is a higher possibility to
develop deviated foot and ankle
characteristics as a result of alterations in the
mechanical alignment of lower limbs.
Therefore, the main purpose of this study was
to evaluate the relationship between static
foot posture and chronic bilateral knee
osteoarthritis. A descriptive cross-sectional
study was conducted under consecutive
sampling method including 155 patients
within the age group of 40–80, who were
clinically diagnosed as bilateral knee
osteoarthritis and fulfilled the inclusion
criteria at Department of Rheumatology and
Rehabilitation (General), National hospital of
Sri Lanka. The foot posture was evaluated
using two foot measures, Foot Posture Index
(FPI) and Staheli Arch Index (SAI). The study
included 135 females and 20 males with the
mean age of 59.19±8.649 years old. According
to the FPI and SAI, altered foot postures were
exhibited by 52.3% and 67.7% of the
participants respectively. Significant positive
correlations (P<0.01) were emphasized
between chronicity of the condition and each
of the foot posture changes. Furthermore,
pronation (51.3%) and flatfeet (57.7%) are
common among patients who were ≥60
years. There is a significant difference
(P<0.01) between foot postural changes of
males and foot postural changes of females
which were evaluated using FPI while a
significant difference was not denoted
(P>0.05) for foot posture changes which were
evaluated using SAI. Altered foot postures are
common among chronic bilateral knee
osteoarthritis patients in Sri Lanka.
Therefore, it is recommended that
assessment of foot posture in knee
osteoarthritis patients is an essential
component in clinical practice in Sri Lanka.
Keywords: Chronic Bilateral Knee
Osteoarthritis, Foot posture index, Staheli
Arch Index
Introduction
Osteoarthritis (OA) is a wear and tear type
degenerative disease involving the cartilage
and many of its surrounding tissues (Goldring
& Goldring, 2006). Knee osteoarthritis (OA)
is considered as a common disease which
manifests physical, functional, psychological
and social burdens in the affected individual.
Knee is the most vulnerable joint for
osteoarthritis (Blagojevic et al, 2010).
In musculoskeletal conditions of lower limb
like chronic knee osteoarthritis, as a result of
the alterations in the mechanical alignment,
there is a higher possibility to develop
abnormal ankle and foot characteristics.
13th International Research Conference
General Sir John Kotelawala Defence University
Allied Health Sciences Sessions
230
Among these abnormalities, alterations in the
foot posture are considerable.
The foot consists of forefoot, midfoot and rear
foot which forms a complex system with
ankle. The foot typically consists of three
arches; medial longitudinal arch, lateral
longitudinal arch and a transverse arch. Foot
arches perform static and dynamic weight
bearing functions (Norkin & Levangie, 2005).
The movements occurring in the foot are as
follows.
• Ankle joint - Dorsiflexion,
plantarflexion in the sagittal plane
• Subtalar joint - Inversion, eversion in
the frontal plane
Abduction, adduction in the transverse plane
Furthermore, these movements occur
together as complex combined movements,
known as supination and pronation.
Pronation is a combined movement of
eversion, abduction and dorsiflexion.
Supination is a combined movement of
inversion, adduction and plantar flexion.
In the optimal erect posture, the ankle joint is
in the neutral position, or midway between
dorsiflexion and plantar flexion, without any
pronation or supination (Norkin & Levangie,
2005).
Flat feet or pes planus is a postural deformity
in which the arches of the foot collapse, with
the entire sole of the foot coming into
complete or near complete contact with the
ground (Pranati, Yuvraj Babu & Ganesh,
2017).
Pes Cavus is the increase in the height of the
medial longitudinal arch of the foot and it
does not become flat on the ground when the
person is in the weight bearing position
(Troiano, Nante & Citarelli, 2017).
Staheli plantar arch index (SAI) is one of the
simple, easy, inexpensive and reproducible,
quantitative measurements to determine flat
feet. The foot print is obtained using the
Harris mat, and the SAI is calculated from the
foot print. Staheli Index refers to the ratio
between the minimal distance in the mid foot
region and the maximal distance in the hind
foot region (Plumarom, Imjaijitt &
Chaiphrom, 2014).
Foot Posture Index (FPI) is a clinical tool
which has been designed to evaluate the foot
posture with a quick and reliable manner. FPI
was originally designed with 8 components
(FPI-8) based on observations of postural
variations of rear foot, mid foot and fore foot.
But due to several mismatching and limited
reliability, FPI was redesigned and modified
with 6 components. Each component was
scored from -2 to +2 evaluating the total FPI
score as -12 to +12 (Aquino et al., 2018). FPI
6 has manifested metric properties and has a
validity of a unidimensional measure of foot
posture. (Keenan et al, 2007).
A chronic disease is one lasting 3 months or
more according to the definition of United
States National center for health statistics
(MedicineNet, 2020).
Majority of the patients with knee
osteoarthritis experience variety of
complications in addition to the symptoms
related to the affected knee joint. Therefore,
the purpose of this study was to evaluate the
relationship between static foot posture with
regards to Chronicity, Age and Gender and
determine the prevalence of foot posture
change among chronic bilateral knee
osteoarthritis patients.
Materials and Methodology
A descriptive cross-sectional study was
conducted under consecutive sampling
method including 155 patients. The study
included male and female patients aged
between 40-80 years who have been
diagnosed with bilateral knee osteoarthritis
at Department of Rheumatology and
Rehabilitation (General), National hospital of
Sri Lanka. The patients who have bilateral
knee osteoarthritis for more than three
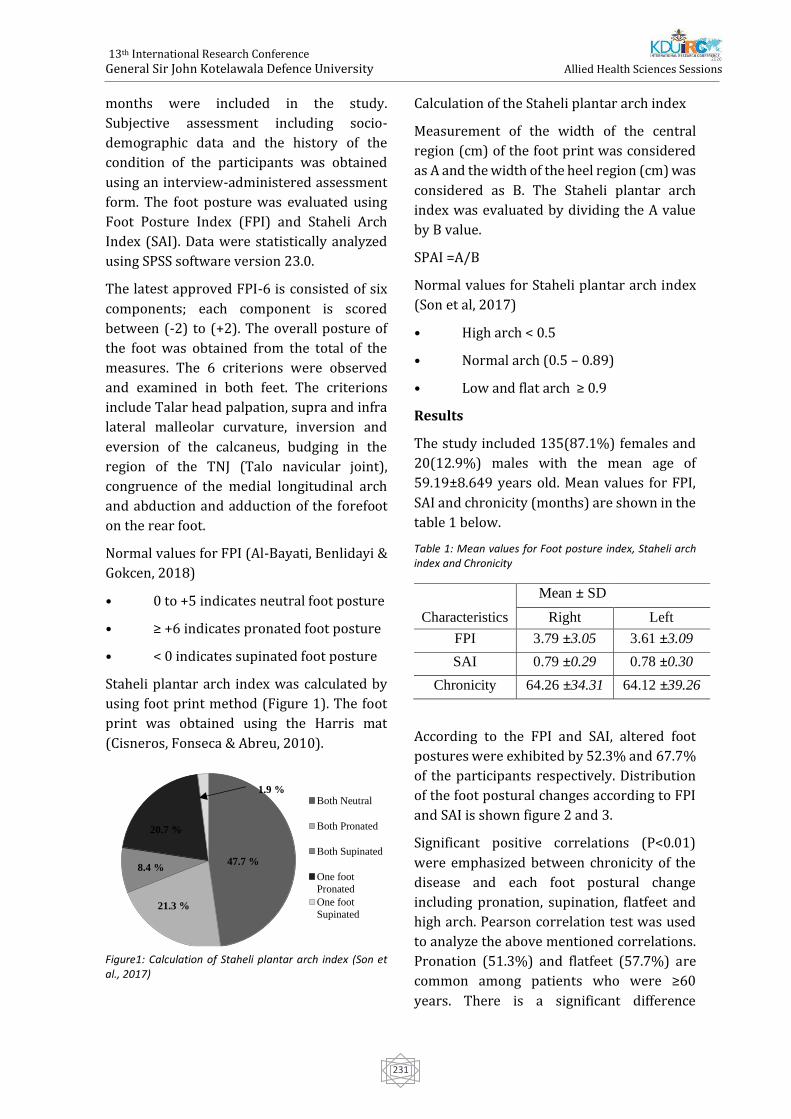
13th International Research Conference
General Sir John Kotelawala Defence University
Allied Health Sciences Sessions
231
months were included in the study.
Subjective assessment including socio-
demographic data and the history of the
condition of the participants was obtained
using an interview-administered assessment
form. The foot posture was evaluated using
Foot Posture Index (FPI) and Staheli Arch
Index (SAI). Data were statistically analyzed
using SPSS software version 23.0.
The latest approved FPI-6 is consisted of six
components; each component is scored
between (-2) to (+2). The overall posture of
the foot was obtained from the total of the
measures. The 6 criterions were observed
and examined in both feet. The criterions
include Talar head palpation, supra and infra
lateral malleolar curvature, inversion and
eversion of the calcaneus, budging in the
region of the TNJ (Talo navicular joint),
congruence of the medial longitudinal arch
and abduction and adduction of the forefoot
on the rear foot.
Normal values for FPI (Al-Bayati, Benlidayi &
Gokcen, 2018)
• 0 to +5 indicates neutral foot posture
• ≥ +6 indicates pronated foot posture
• < 0 indicates supinated foot posture
Staheli plantar arch index was calculated by
using foot print method (Figure 1). The foot
print was obtained using the Harris mat
(Cisneros, Fonseca & Abreu, 2010).
Figure1: Calculation of Staheli plantar arch index (Son et al., 2017)
Calculation of the Staheli plantar arch index
Measurement of the width of the central
region (cm) of the foot print was considered
as A and the width of the heel region (cm) was
considered as B. The Staheli plantar arch
index was evaluated by dividing the A value
by B value.
SPAI =A/B
Normal values for Staheli plantar arch index
(Son et al, 2017)
• High arch < 0.5
• Normal arch (0.5 – 0.89)
• Low and flat arch ≥ 0.9
Results
The study included 135(87.1%) females and
20(12.9%) males with the mean age of
59.19±8.649 years old. Mean values for FPI,
SAI and chronicity (months) are shown in the
table 1 below.
Table 1: Mean values for Foot posture index, Staheli arch index and Chronicity
Mean ± SD
Characteristics Right Left
FPI 3.79 ±3.05 3.61 ±3.09
SAI 0.79 ±0.29 0.78 ±0.30
Chronicity 64.26 ±34.31 64.12 ±39.26
According to the FPI and SAI, altered foot
postures were exhibited by 52.3% and 67.7%
of the participants respectively. Distribution
of the foot postural changes according to FPI
and SAI is shown figure 2 and 3.
Significant positive correlations (P<0.01)
were emphasized between chronicity of the
disease and each foot postural change
including pronation, supination, flatfeet and
high arch. Pearson correlation test was used
to analyze the above mentioned correlations.
Pronation (51.3%) and flatfeet (57.7%) are
common among patients who were ≥60
years. There is a significant difference
Both Neutral
Both Pronated
Both Supinated
One foot
Pronated
One foot
Supinated
47.7 %
21.3 %
20.7 %
8.4 %
1.9 %
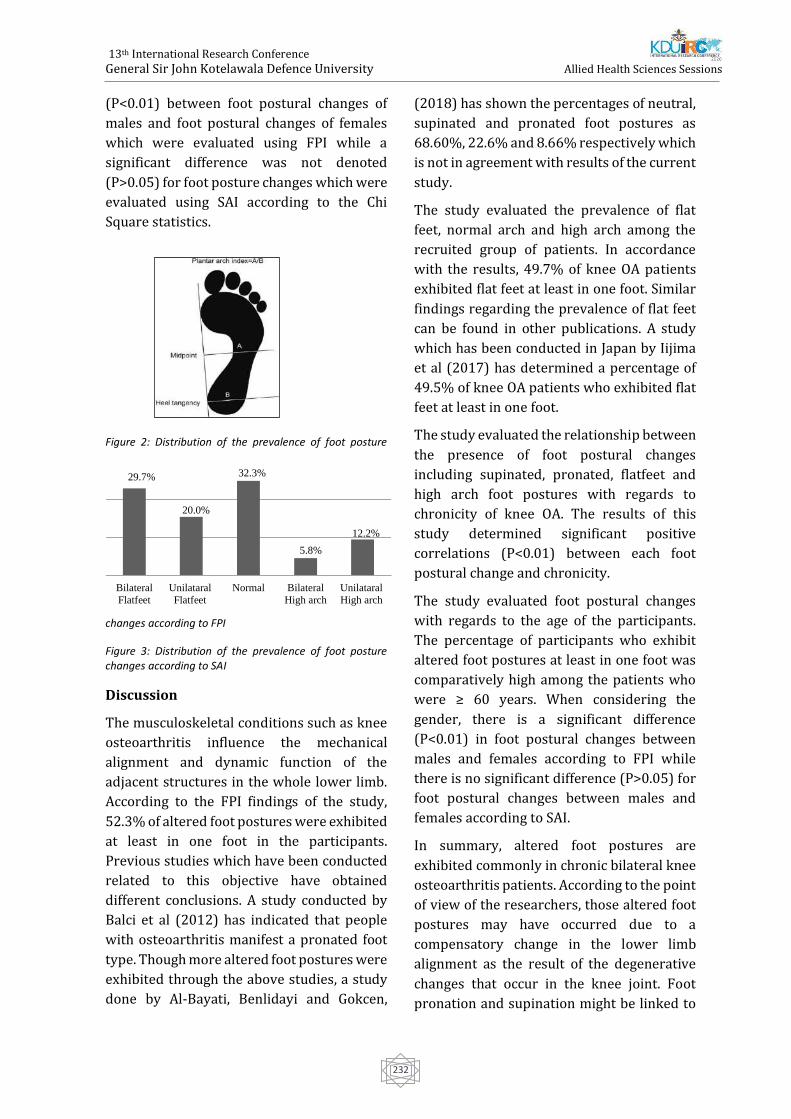
13th International Research Conference
General Sir John Kotelawala Defence University
Allied Health Sciences Sessions
232
(P<0.01) between foot postural changes of
males and foot postural changes of females
which were evaluated using FPI while a
significant difference was not denoted
(P>0.05) for foot posture changes which were
evaluated using SAI according to the Chi
Square statistics.
Figure 2: Distribution of the prevalence of foot posture
changes according to FPI
Figure 3: Distribution of the prevalence of foot posture changes according to SAI
Discussion
The musculoskeletal conditions such as knee
osteoarthritis influence the mechanical
alignment and dynamic function of the
adjacent structures in the whole lower limb.
According to the FPI findings of the study,
52.3% of altered foot postures were exhibited
at least in one foot in the participants.
Previous studies which have been conducted
related to this objective have obtained
different conclusions. A study conducted by
Balci et al (2012) has indicated that people
with osteoarthritis manifest a pronated foot
type. Though more altered foot postures were
exhibited through the above studies, a study
done by Al-Bayati, Benlidayi and Gokcen,
(2018) has shown the percentages of neutral,
supinated and pronated foot postures as
68.60%, 22.6% and 8.66% respectively which
is not in agreement with results of the current
study.
The study evaluated the prevalence of flat
feet, normal arch and high arch among the
recruited group of patients. In accordance
with the results, 49.7% of knee OA patients
exhibited flat feet at least in one foot. Similar
findings regarding the prevalence of flat feet
can be found in other publications. A study
which has been conducted in Japan by Iijima
et al (2017) has determined a percentage of
49.5% of knee OA patients who exhibited flat
feet at least in one foot.
The study evaluated the relationship between
the presence of foot postural changes
including supinated, pronated, flatfeet and
high arch foot postures with regards to
chronicity of knee OA. The results of this
study determined significant positive
correlations (P<0.01) between each foot
postural change and chronicity.
The study evaluated foot postural changes
with regards to the age of the participants.
The percentage of participants who exhibit
altered foot postures at least in one foot was
comparatively high among the patients who
were ≥ 60 years. When considering the
gender, there is a significant difference
(P<0.01) in foot postural changes between
males and females according to FPI while
there is no significant difference (P>0.05) for
foot postural changes between males and
females according to SAI.
In summary, altered foot postures are
exhibited commonly in chronic bilateral knee
osteoarthritis patients. According to the point
of view of the researchers, those altered foot
postures may have occurred due to a
compensatory change in the lower limb
alignment as the result of the degenerative
changes that occur in the knee joint. Foot
pronation and supination might be linked to
Bilateral
Flatfeet
Unilataral
Flatfeet
Normal Bilateral
High arch
Unilataral
High arch
29.7%
20.0%
32.3%
5.8%
12.2%
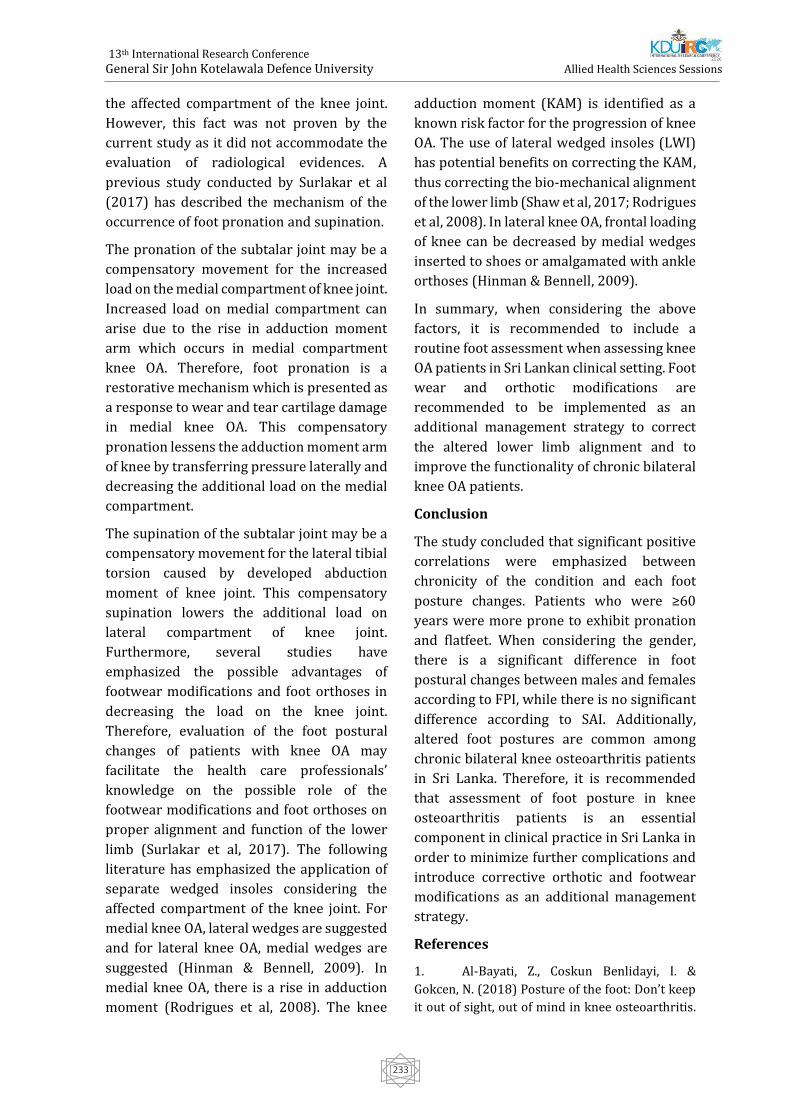
13th International Research Conference
General Sir John Kotelawala Defence University
Allied Health Sciences Sessions
233
the affected compartment of the knee joint.
However, this fact was not proven by the
current study as it did not accommodate the
evaluation of radiological evidences. A
previous study conducted by Surlakar et al
(2017) has described the mechanism of the
occurrence of foot pronation and supination.
The pronation of the subtalar joint may be a
compensatory movement for the increased
load on the medial compartment of knee joint.
Increased load on medial compartment can
arise due to the rise in adduction moment
arm which occurs in medial compartment
knee OA. Therefore, foot pronation is a
restorative mechanism which is presented as
a response to wear and tear cartilage damage
in medial knee OA. This compensatory
pronation lessens the adduction moment arm
of knee by transferring pressure laterally and
decreasing the additional load on the medial
compartment.
The supination of the subtalar joint may be a
compensatory movement for the lateral tibial
torsion caused by developed abduction
moment of knee joint. This compensatory
supination lowers the additional load on
lateral compartment of knee joint.
Furthermore, several studies have
emphasized the possible advantages of
footwear modifications and foot orthoses in
decreasing the load on the knee joint.
Therefore, evaluation of the foot postural
changes of patients with knee OA may
facilitate the health care professionals’
knowledge on the possible role of the
footwear modifications and foot orthoses on
proper alignment and function of the lower
limb (Surlakar et al, 2017). The following
literature has emphasized the application of
separate wedged insoles considering the
affected compartment of the knee joint. For
medial knee OA, lateral wedges are suggested
and for lateral knee OA, medial wedges are
suggested (Hinman & Bennell, 2009). In
medial knee OA, there is a rise in adduction
moment (Rodrigues et al, 2008). The knee
adduction moment (KAM) is identified as a
known risk factor for the progression of knee
OA. The use of lateral wedged insoles (LWI)
has potential benefits on correcting the KAM,
thus correcting the bio-mechanical alignment
of the lower limb (Shaw et al, 2017; Rodrigues
et al, 2008). In lateral knee OA, frontal loading
of knee can be decreased by medial wedges
inserted to shoes or amalgamated with ankle
orthoses (Hinman & Bennell, 2009).
In summary, when considering the above
factors, it is recommended to include a
routine foot assessment when assessing knee
OA patients in Sri Lankan clinical setting. Foot
wear and orthotic modifications are
recommended to be implemented as an
additional management strategy to correct
the altered lower limb alignment and to
improve the functionality of chronic bilateral
knee OA patients.
Conclusion
The study concluded that significant positive
correlations were emphasized between
chronicity of the condition and each foot
posture changes. Patients who were ≥60
years were more prone to exhibit pronation
and flatfeet. When considering the gender,
there is a significant difference in foot
postural changes between males and females
according to FPI, while there is no significant
difference according to SAI. Additionally,
altered foot postures are common among
chronic bilateral knee osteoarthritis patients
in Sri Lanka. Therefore, it is recommended
that assessment of foot posture in knee
osteoarthritis patients is an essential
component in clinical practice in Sri Lanka in
order to minimize further complications and
introduce corrective orthotic and footwear
modifications as an additional management
strategy.
References
1. Al-Bayati, Z., Coskun Benlidayi, I. &
Gokcen, N. (2018) Posture of the foot: Don’t keep
it out of sight, out of mind in knee osteoarthritis.
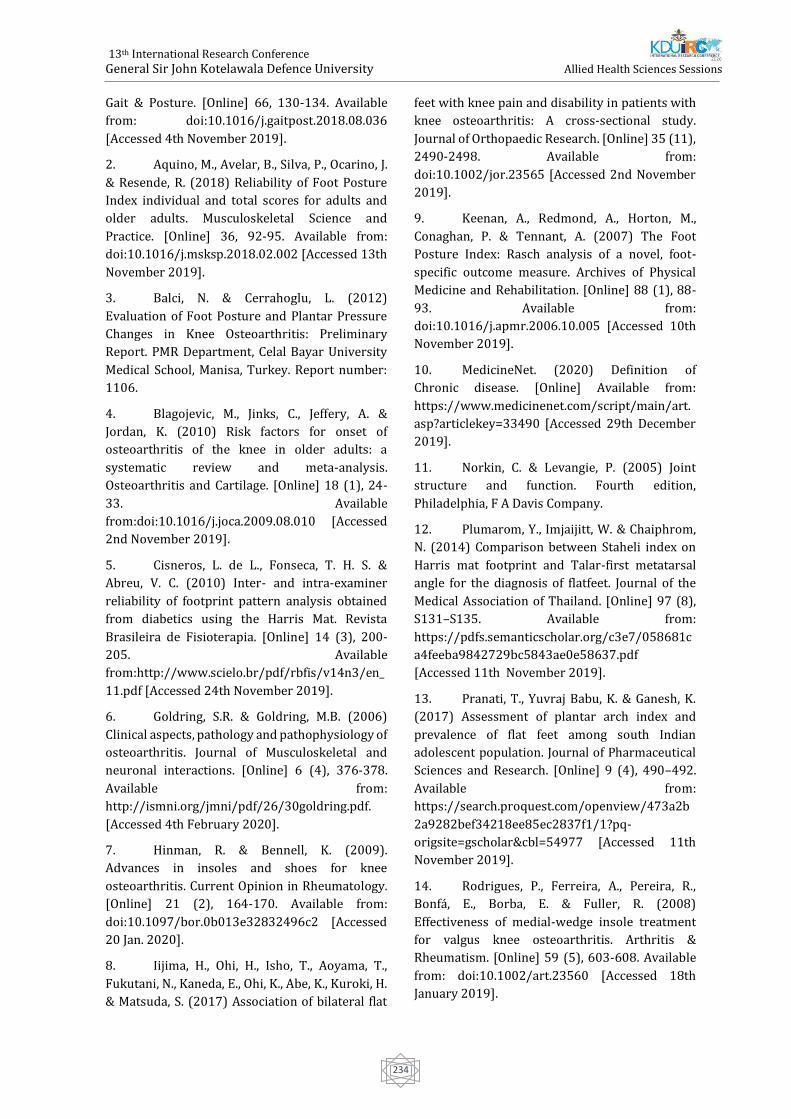
13th International Research Conference
General Sir John Kotelawala Defence University
Allied Health Sciences Sessions
234
Gait & Posture. [Online] 66, 130-134. Available
from: doi:10.1016/j.gaitpost.2018.08.036
[Accessed 4th November 2019].
2. Aquino, M., Avelar, B., Silva, P., Ocarino, J.
& Resende, R. (2018) Reliability of Foot Posture
Index individual and total scores for adults and
older adults. Musculoskeletal Science and
Practice. [Online] 36, 92-95. Available from:
doi:10.1016/j.msksp.2018.02.002 [Accessed 13th
November 2019].
3. Balci, N. & Cerrahoglu, L. (2012)
Evaluation of Foot Posture and Plantar Pressure
Changes in Knee Osteoarthritis: Preliminary
Report. PMR Department, Celal Bayar University
Medical School, Manisa, Turkey. Report number:
1106.
4. Blagojevic, M., Jinks, C., Jeffery, A. &
Jordan, K. (2010) Risk factors for onset of
osteoarthritis of the knee in older adults: a
systematic review and meta-analysis.
Osteoarthritis and Cartilage. [Online] 18 (1), 24-
33. Available
from:doi:10.1016/j.joca.2009.08.010 [Accessed
2nd November 2019].
5. Cisneros, L. de L., Fonseca, T. H. S. &
Abreu, V. C. (2010) Inter- and intra-examiner
reliability of footprint pattern analysis obtained
from diabetics using the Harris Mat. Revista
Brasileira de Fisioterapia. [Online] 14 (3), 200-
205. Available
from:http://www.scielo.br/pdf/rbfis/v14n3/en_
11.pdf [Accessed 24th November 2019].
6. Goldring, S.R. & Goldring, M.B. (2006)
Clinical aspects, pathology and pathophysiology of
osteoarthritis. Journal of Musculoskeletal and
neuronal interactions. [Online] 6 (4), 376-378.
Available from:
http://ismni.org/jmni/pdf/26/30goldring.pdf.
[Accessed 4th February 2020].
7. Hinman, R. & Bennell, K. (2009).
Advances in insoles and shoes for knee
osteoarthritis. Current Opinion in Rheumatology.
[Online] 21 (2), 164-170. Available from:
doi:10.1097/bor.0b013e32832496c2 [Accessed
20 Jan. 2020].
8. Iijima, H., Ohi, H., Isho, T., Aoyama, T.,
Fukutani, N., Kaneda, E., Ohi, K., Abe, K., Kuroki, H.
& Matsuda, S. (2017) Association of bilateral flat
feet with knee pain and disability in patients with
knee osteoarthritis: A cross-sectional study.
Journal of Orthopaedic Research. [Online] 35 (11),
2490-2498. Available from:
doi:10.1002/jor.23565 [Accessed 2nd November
2019].
9. Keenan, A., Redmond, A., Horton, M.,
Conaghan, P. & Tennant, A. (2007) The Foot
Posture Index: Rasch analysis of a novel, foot-
specific outcome measure. Archives of Physical
Medicine and Rehabilitation. [Online] 88 (1), 88-
93. Available from:
doi:10.1016/j.apmr.2006.10.005 [Accessed 10th
November 2019].
10. MedicineNet. (2020) Definition of
Chronic disease. [Online] Available from:
https://www.medicinenet.com/script/main/art.
asp?articlekey=33490 [Accessed 29th December
2019].
11. Norkin, C. & Levangie, P. (2005) Joint
structure and function. Fourth edition,
Philadelphia, F A Davis Company.
12. Plumarom, Y., Imjaijitt, W. & Chaiphrom,
N. (2014) Comparison between Staheli index on
Harris mat footprint and Talar-first metatarsal
angle for the diagnosis of flatfeet. Journal of the
Medical Association of Thailand. [Online] 97 (8),
S131–S135. Available from:
https://pdfs.semanticscholar.org/c3e7/058681c
a4feeba9842729bc5843ae0e58637.pdf
[Accessed 11th November 2019].
13. Pranati, T., Yuvraj Babu, K. & Ganesh, K.
(2017) Assessment of plantar arch index and
prevalence of flat feet among south Indian
adolescent population. Journal of Pharmaceutical
Sciences and Research. [Online] 9 (4), 490–492.
Available from:
https://search.proquest.com/openview/473a2b
2a9282bef34218ee85ec2837f1/1?pq-
origsite=gscholar&cbl=54977 [Accessed 11th
November 2019].
14. Rodrigues, P., Ferreira, A., Pereira, R.,
Bonfá, E., Borba, E. & Fuller, R. (2008)
Effectiveness of medial-wedge insole treatment
for valgus knee osteoarthritis. Arthritis &
Rheumatism. [Online] 59 (5), 603-608. Available
from: doi:10.1002/art.23560 [Accessed 18th
January 2019].
13th International Research Conference
General Sir John Kotelawala Defence University
Allied Health Sciences Sessions
235
15. Shaw, K., Charlton, J., Perry, C., de Vries, C.,
Redekopp, M., White, J. & Hunt, M. (2017) The
effects of shoe-worn insoles on gait biomechanics
in people with knee osteoarthritis: a systematic
review and meta-analysis. British Journal of
Sports Medicine. [Online] 52 (4), 238-253.
Available from: doi:10.1136/bjsports-2016-
097108 [Accessed 20th January 2020].
16. Son, Y., Kang, H., Song, Y. & Hwang, J.
(2017) Relationships Between Self-awareness
and Clinical Diagnostic Findings of Abnormal Foot
Arch Height in Koreans. Annals of Rehabilitation
Medicine. [Online] 41 (6), 1013. Available from:
doi:10.5535/arm.2017.41.6.1013 [Accessed 20th
November 2019].
17. Surlakar, S., Sarfare, B., Ghodey, S. &
Bhise, S. (2017) Prevalence of altered foot posture
in osteoarthritis of knee. Journal of Applied and
Advanced Research. [Online] 2 (3), 144-149.
Available from: doi:10.21839/jaar.2017.v2i3.87
[Accessed 20th November 2019].
18. Troiano, G., Nante, N. & Citarelli, G. (2017)
Epidemiology of foot deformities in southern
Italy: focus on Pes planus and Pes cavus. European
Journal of Public Health. [Online] 53 (2), 142-145.
Available from: doi:10.4415/ANN_17_02_10
[Accessed 12th November 2019].
13th International Research Conference
General Sir John Kotelawala Defence University
Allied Health Sciences Sessions
236
Knowledge and practice of pre-hospital care after a road traffic
injury among three-wheel drivers and associated factors in selected
police areas in Colombo district.
Nawarathna SNAM1#, Goonewardena CSE2
1Department of Nursing and Midwifery, Faculty of Allied Health Sciences, University of Sri
Jayewardenepura,
Gangodawila, Nugegoda, Sri Lanka
2Consultant Community Physician/ Professor in Community Medicine, Faculty of Medical Sciences,
University of Sri Jayewardenepura, Gangodawila, Nugegoda, Sri Lanka
Abstract- Globally, the number of road
traffic deaths remains unacceptably high.
However, effective pre-hospital services can
minimize many crash consequences. Usually,
basic pre-hospital care is delivered by a lay
first responder, mostly another driver. The
aim of this study is to describe the knowledge
and practice of pre-hospital care after a road
traffic injury among three-wheel drivers and
associated factors in selected police areas in
Colombo district, Sri Lanka. A community
based descriptive cross-sectional study was
carried out in Kollupitiya, Bambalapitiya, and
Kirulapona police areas. A sample of 384
three-wheel drivers registered in above
police areas were recruited using simple
random sampling method. Structured pre-
tested interviewer administered
questionnaire was used for data collection.
Descriptive analysis was used to determine
level of knowledge and practices regarding
pre-hospital care. To identify the associated
factors for knowledge and practice chi-
square test was used. SPSS version 25 was
used for data entry and analysis. Ethical
approval was obtained from Ethics Review
Committee, Faculty of Medical Sciences,
University of Sri Jayewardenepura. Only
31.5% of the drivers had first aid training.
Even though majority (52.9%) of the drivers
had good knowledge, 65.2% had poor
practice towards pre-hospital care.
Advanced age and having a first aid training
were significantly associated with the good
knowledge (p<0.05). Drivers with a previous
first aid training within last ten years, having
less hires per day and having good
knowledge were significantly associated
with better first aid practice. Although
knowledge regarding pre-hospital care was
adequate, practice of pre-hospital care was
inadequate.
Key words: Pre hospital care, Knowledge,
Practice, Road traffic accidents
Extended Abstract
Introduction
Injury, an increasingly significant public
health issue worldwide, accounts for up to
16% of the global burden of disease.
Approximately 1.35 million people die each
year as a result of road traffic crashes.
Between 20 and 50 million more people
suffer non-fatal injuries, with many incurring
a disability as a result of their injury (WHO,
2018). Trauma is a leading cause of
hospitalization in Sri Lanka and accounts for
almost 600,000 patients per year in
Government Hospitals. Most moderate to
severe trauma results from Road Traffic
Crashes (Wimalaratne et al., 2017).
Prevention and control of RTIs require multi-
sectoral integrated actions aiming at limiting
the occurrence of crashes, providing best
possible care in the event of a crash and
13th International Research Conference
General Sir John Kotelawala Defence University
Allied Health Sciences Sessions
237
suitable rehabilitation services for the
injured person. However, it is often possible
to minimize crash consequences by
providing effective pre-hospital services
promptly. Prehospital services are a
continuum of activities at the crash site and
till the injured person is adequately managed
by hospital staff (Mpombo and Mwanakasale,
2018). There are ample medical evidences to
recommend a “golden hour” for road traffic
accident victims. If the necessary care is
given immediately for casualties within this
time, there is a greater chance of survival. In
many communities, the most basic level of
prehospital trauma care is provided by
laypeople known as “first responders”
(Teshale and Alemu, 2017). In most low and
middle-income countries including Sri Lanka
first responders are usually a relative, driver
of a private vehicle, police officers, and other
motorist (bus drivers and taxi drivers) who
are usually untrained (Mpombo and
Mwanakasale, 2018). Frequently the first
person on the scene is more likely to be
another driver and have more chance to be
the first responder. So, by encouraging local
people including drivers to learn and
practice the elements of pre hospital care
system, we can create a group of first
responders. Thus, we can develop an
effective pre hospital care system which can
save many lives and reduce many disabilities.
So, this study was conducted aiming to
describe the knowledge and practice of pre
hospital care after a road traffic injury among
three-wheel drivers and associated factors in
selected police areas in Colombo district, Sri
Lanka.
Methodology
A community based descriptive cross-
sectional study was carried out in
Kollupitiya, Bambalapitiya, and Kirulapona
police areas in Sri Lanka. In the Colombo
Municipal Council administrative area,
Colombo district, there are three DIG areas
(Deputy Inspector General of Police). They
are Colombo North, Colombo south and
Colombo Central DIG areas. 22 police areas
are included in these 3 DIG areas and there
are 7 police areas in the Colombo south DIG
area. From that, 3 police areas namely
Kirulapone, Bambalapitiya, Kollupitiya in
Colombo South DIG areas were selected to
this study. A sample of 384 three-wheel
drivers registered in above police areas were
recruited using simple random sampling
method after obtaining a sample framework
of registered three-wheel drivers from
united three-wheel drivers’ associations in
each police area. Proportion of drivers to be
taken from each police area were calculated
according to probability proportionate to
size, so that final sample of 422 is obtained
with 10% non-response rate. A structured
pre-tested interviewer administered
questionnaire was used for data collection.
The questionnaire was pre tested among 15
three-wheel drivers in Wellawatta police
area. Content and face validity done by an
expert in the field of trauma. Descriptive
analysis was used to determine level of
knowledge and practices regarding pre
hospital care. Chi-square test was used to
identify the associated factors for knowledge
and practice of pre hospital care. SPSS
version 25 was used for data entry and
analysis. Ethical approval was obtained from
Ethics Review Committee, Faculty of Medical
Sciences, University of Sri Jayewardenepura.
All the relevant information about the study
was explained and the approval was
obtained from the police stations in
Kirulapone, Bambalapitiya, Kollupitiya.
Results and Discussions
A total of 384 three-wheel drivers responded
to the study which resulted in a response rate
of 90.1% where 151 (39.3%), 121 (31.5%),
and 112 (29.2%) respondents participated to
the study from Kollupitiya, Kirulapona and
Bambalapitiya police divisions respectively.
The mean age of the three-wheel drivers was
40.98 (SD ± 11.01) with a range of 21 to 71
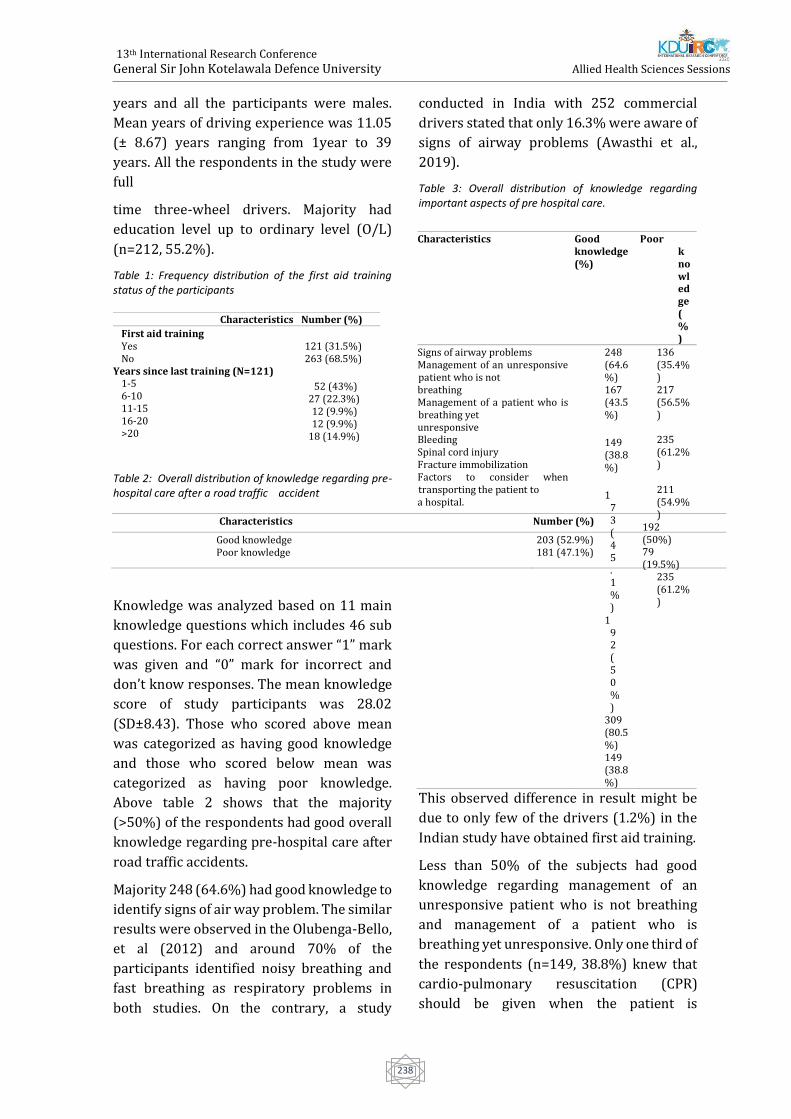
13th International Research Conference
General Sir John Kotelawala Defence University
Allied Health Sciences Sessions
238
years and all the participants were males.
Mean years of driving experience was 11.05
(± 8.67) years ranging from 1year to 39
years. All the respondents in the study were
full
time three-wheel drivers. Majority had
education level up to ordinary level (O/L)
(n=212, 55.2%).
Table 1: Frequency distribution of the first aid training status of the participants
Table 2: Overall distribution of knowledge regarding pre-hospital care after a road traffic accident
Characteristics Number (%)
Good knowledge Poor knowledge
203 (52.9%) 181 (47.1%)
Knowledge was analyzed based on 11 main
knowledge questions which includes 46 sub
questions. For each correct answer “1” mark
was given and “0” mark for incorrect and
don’t know responses. The mean knowledge
score of study participants was 28.02
(SD±8.43). Those who scored above mean
was categorized as having good knowledge
and those who scored below mean was
categorized as having poor knowledge.
Above table 2 shows that the majority
(>50%) of the respondents had good overall
knowledge regarding pre-hospital care after
road traffic accidents.
Majority 248 (64.6%) had good knowledge to
identify signs of air way problem. The similar
results were observed in the Olubenga-Bello,
et al (2012) and around 70% of the
participants identified noisy breathing and
fast breathing as respiratory problems in
both studies. On the contrary, a study
conducted in India with 252 commercial
drivers stated that only 16.3% were aware of
signs of airway problems (Awasthi et al.,
2019).
Table 3: Overall distribution of knowledge regarding important aspects of pre hospital care.
This observed difference in result might be
due to only few of the drivers (1.2%) in the
Indian study have obtained first aid training.
Less than 50% of the subjects had good
knowledge regarding management of an
unresponsive patient who is not breathing
and management of a patient who is
breathing yet unresponsive. Only one third of
the respondents (n=149, 38.8%) knew that
cardio-pulmonary resuscitation (CPR)
should be given when the patient is
Characteristics Number (%)
First aid training Yes No
Years since last training (N=121) 1-5 6-10 11-15 16-20 >20
121 (31.5%) 263 (68.5%)
52 (43%) 27 (22.3%) 12 (9.9%) 12 (9.9%)
18 (14.9%)
Characteristics Good knowledge (%)
Poor knowledge (%)
Signs of airway problems Management of an unresponsive patient who is not breathing Management of a patient who is breathing yet unresponsive Bleeding Spinal cord injury Fracture immobilization Factors to consider when transporting the patient to a hospital.
248 (64.6%) 167 (43.5%)
149 (38.8%)
173 (45.1%)
192 (50%)
309 (80.5%) 149 (38.8%)
136 (35.4%) 217 (56.5%)
235 (61.2%)
211 (54.9%)
192 (50%) 79 (19.5%)
235 (61.2%)
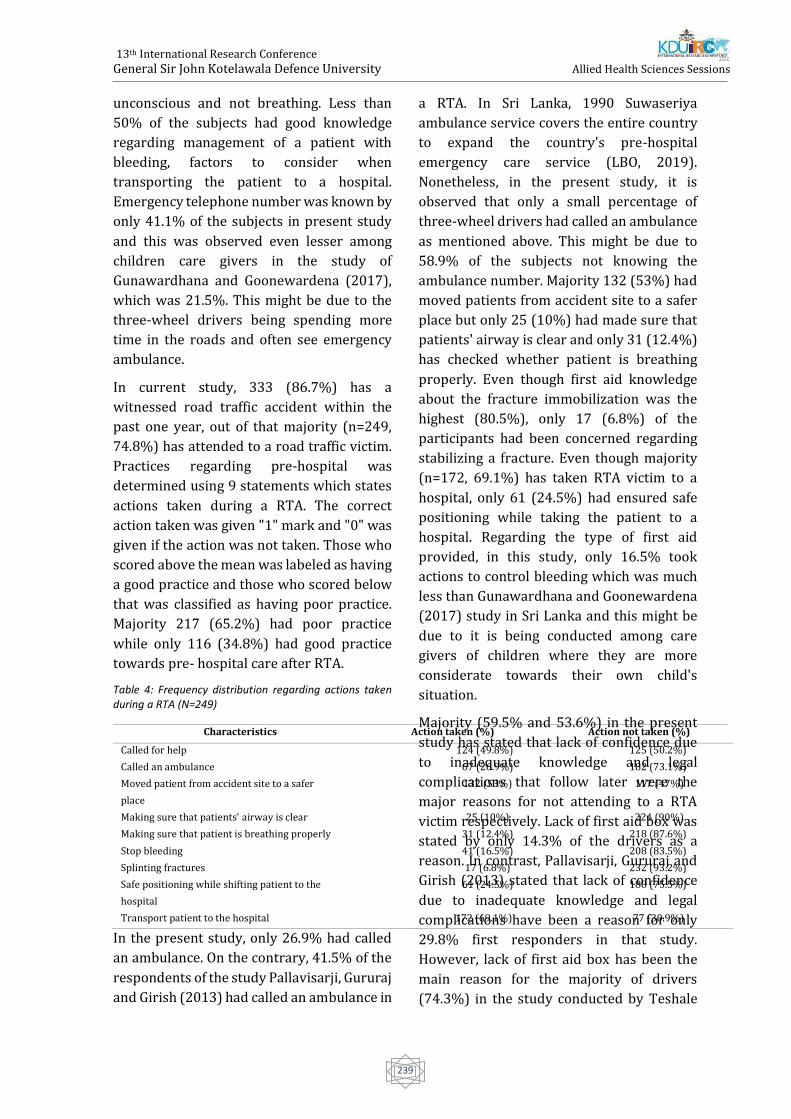
13th International Research Conference
General Sir John Kotelawala Defence University
Allied Health Sciences Sessions
239
unconscious and not breathing. Less than
50% of the subjects had good knowledge
regarding management of a patient with
bleeding, factors to consider when
transporting the patient to a hospital.
Emergency telephone number was known by
only 41.1% of the subjects in present study
and this was observed even lesser among
children care givers in the study of
Gunawardhana and Goonewardena (2017),
which was 21.5%. This might be due to the
three-wheel drivers being spending more
time in the roads and often see emergency
ambulance.
In current study, 333 (86.7%) has a
witnessed road traffic accident within the
past one year, out of that majority (n=249,
74.8%) has attended to a road traffic victim.
Practices regarding pre-hospital was
determined using 9 statements which states
actions taken during a RTA. The correct
action taken was given "1" mark and "0" was
given if the action was not taken. Those who
scored above the mean was labeled as having
a good practice and those who scored below
that was classified as having poor practice.
Majority 217 (65.2%) had poor practice
while only 116 (34.8%) had good practice
towards pre- hospital care after RTA.
Table 4: Frequency distribution regarding actions taken during a RTA (N=249)
Characteristics Action taken (%) Action not taken (%)
Called for help 124 (49.8%) 125 (50.2%)
Called an ambulance 67 (26.9%) 182 (73.1%)
Moved patient from accident site to a safer 132 (53%) 117 (47%)
place
Making sure that patients' airway is clear 25 (10%) 224 (90%)
Making sure that patient is breathing properly 31 (12.4%) 218 (87.6%)
Stop bleeding 41 (16.5%) 208 (83.5%)
Splinting fractures 17 (6.8%) 232 (93.2%)
Safe positioning while shifting patient to the 61 (24.5%) 188 (75.5%)
hospital
Transport patient to the hospital 172 (69.1%) 77 (30.9%)
In the present study, only 26.9% had called
an ambulance. On the contrary, 41.5% of the
respondents of the study Pallavisarji, Gururaj
and Girish (2013) had called an ambulance in
a RTA. In Sri Lanka, 1990 Suwaseriya
ambulance service covers the entire country
to expand the country's pre-hospital
emergency care service (LBO, 2019).
Nonetheless, in the present study, it is
observed that only a small percentage of
three-wheel drivers had called an ambulance
as mentioned above. This might be due to
58.9% of the subjects not knowing the
ambulance number. Majority 132 (53%) had
moved patients from accident site to a safer
place but only 25 (10%) had made sure that
patients' airway is clear and only 31 (12.4%)
has checked whether patient is breathing
properly. Even though first aid knowledge
about the fracture immobilization was the
highest (80.5%), only 17 (6.8%) of the
participants had been concerned regarding
stabilizing a fracture. Even though majority
(n=172, 69.1%) has taken RTA victim to a
hospital, only 61 (24.5%) had ensured safe
positioning while taking the patient to a
hospital. Regarding the type of first aid
provided, in this study, only 16.5% took
actions to control bleeding which was much
less than Gunawardhana and Goonewardena
(2017) study in Sri Lanka and this might be
due to it is being conducted among care
givers of children where they are more
considerate towards their own child's
situation.
Majority (59.5% and 53.6%) in the present
study has stated that lack of confidence due
to inadequate knowledge and legal
complications that follow later were the
major reasons for not attending to a RTA
victim respectively. Lack of first aid box was
stated by only 14.3% of the drivers as a
reason. In contrast, Pallavisarji, Gururaj and
Girish (2013) stated that lack of confidence
due to inadequate knowledge and legal
complications have been a reason for only
29.8% first responders in that study.
However, lack of first aid box has been the
main reason for the majority of drivers
(74.3%) in the study conducted by Teshale
13th International Research Conference
General Sir John Kotelawala Defence University
Allied Health Sciences Sessions
240
and Alemu (2017) in Ethiopia. In the present
study only 1.3% of the respondents had a
first aid box in their vehicle and significantly
high availability of first aid kits (84.3%,) was
seen in the study by Gunawardhana and
Goonewardena (2017). In the current study,
only 34.8% had good practice towards pre
hospital care after a RTA. So, it is observed
that practice towards pre hospital care was
generally poor in this study.
Majority of the respondents who were above
45 years of age, 107 (60.8%) had better
knowledge than who were below 45 years of
age and it was statistically significant (X2
=8.202, p=0.004 and OR=1.809, CI=1.204-
2.719). The majority of the respondents who
had first aid training had better knowledge
(n=105, 86.1%) than who did not have a first
aid training 98 (37.4%). This observed
difference was highly significant (X2
=79.101, P<0.001, OR=10.336, CI=5.844-
18.281). Even though drivers who had a
higher educational level (A/L to degree) had
a better knowledge (57.6%) than the drivers
with lower educational level (primary to
O/L), there was no significant association
between educational status and the
knowledge. In contrast, study of
Gunawardhana and Goonewardena (2017)
which was conducted in Sri Lanka among
care givers of children stated that first aid
knowledge was significantly associated with
the education level.
The majority of the respondents who had
first aid training (n=45, 42.5%) had better
practice than who did not have a first aid
training 69 (30.4%). This observed
difference was statistically significant (X2
=4.665, p= 0.03, OR=1.689, CI=1.048- 2.724).
This finding was supported by the study
conducted by Teshale and Alemu (2017) in
Ethiopia where delivering first aid was five
times more likely among trained drivers than
those who were not. Those who had the
training within last ten years had a better
first aid practice (n=35, 52.2%) than those
who had the training before 10 years (n=10,
27.0%). This observed difference was
statistically significant (X2 = 6.172, p= 0.013,
OR=2.953, CI=1.238- 7.046). It seems like,
even though they had a training, with time,
they reduce their confidence in performing
pre- hospital care. Those who have more
hires per day (n=86, 29.7%) were less likely
to provide pre hospital care for a RTA victim
than who drive less hires per day (n=28,
65.1%). This observed difference was highly
significant (X2 =20.915, p=0.000, OR=4.428,
CI=2.253– 8.704). Furthermore, respondents
who had good knowledge (n=77, 43.0%)
showed to have a better practice than those
who had poor knowledge (n=37, 24.0%).
This observed difference was statistically
significant (X2=13.260, p<0.001, OR=2.387,
CI=1.487-3.833).
Conclusions
Less than one third of the respondents in the
study, had attended to some form of first aid
training. More than half of the respondents in
the study had good knowledge regarding pre
hospital care after a RTA. The knowledge has
been less in the areas such as managing an
unconscious patient, controlling a bleeding
and regarding the factors to be considered
while transporting a patient to a hospital
safely. The study identified inadequate
knowledge and legal complications that
follows later as factors that would prevent
three-wheel drivers from providing first aid
to an RTA victim. Even though knowledge
regarding pre-hospital care among three-
wheel drivers was adequate, overall practice
of pre-hospital care was inadequate. After
witnessing a RTA, transporting the RTA
victim was the main action taken by majority
of the participants. Three-wheel drivers’
knowledge regarding pre hospital care was
significantly associated with being at an age
of more than 45 years and having a training
(p<0.05) while factors such as ethnicity,
driving experience, level of education,
marital status, and number of trips per day
13th International Research Conference
General Sir John Kotelawala Defence University
Allied Health Sciences Sessions
241
had no significant association with it
(p>0.05). Having a previous first aid training,
training within last ten years, having less
hires per day (<10) and good knowledge
regarding pre hospital care had significant
association with good practice of pre hospital
care after a RTA (p<0.05). Factors such as
Age, ethnicity, marital status, driving
experience, level of education had no
significant association with it (p>0.05).
Hence it is recommended that first aid
training should be given on a regular basis
and be made mandatory before issuing a
driving license to all three-wheel drivers.
Also, increasing the publicity of existing pre
hospital care number and other important
emergency numbers within the population,
establishing clear regulations and legislation
addressing the issues of a first aid providers
taking actions at the scene are
recommended.
References
Awasthi, S., Pamei, G., Solanki, H. K., Kamur, A.,
Bhatt, M., 2019, Knowlegge, attitude, and practice
of first aid among the commercial drivers in the
Kumaon region of India, 4th National Conference
on Family Medicine and Primary care, 8(6),
pp.1994-1998.
Gunawardhana, G. and Goonewardena, S.,
2017,Pre-hospital care received by injured
children less than five years admitted to the Lady
Ridgeway Hospital for Children, Colombo, Journal
of the College of Community Physicians of Sri
Lanka, 21(1), pp. 49.10.4038/jccpsl.v21i1.8076.
LBO, 2019. 1990 Suwaseriya ambulance service
now covers entire nation. [Online] Available
at:https://www.lankabusinessonline.com[Acces
sed 07 November 2019].
Mpombo, D. A. K. and Mwanakasale, V., 2018,
Assessment of knowledge, attitude and practice
of first aid amongst minibus drivers, conductors
and road traffic police officers in Ndola, Zambia,
Asian Pacific Journal of Health Sciences, 4(3), pp.
121–128. 10.21276/apjhs.2017.4.3.20.
Olugbenga-Bello, A.I., Sunday, O.K., Nicks, B.A.,
Olawale, O.A. and Adefisoye, A.O., 2012, First aid
knowledge and application among commercial
intercity drivers in Nigeria, African Journal of
Emergency Medicine,2, pp.108-113.
http://dx.doi.org/10.1016/j.asjem.2012.06.003
Pallavisarji, U., Gururaj, G. and Nagaraja
Girish, R., 2013, Practice and Perception of
First Aid Among Lay First Responders in a
Southern District of India’, Archives of
Trauma Research, 1(4), pp. 155–60.
10.5812/atr.7972.
Teshale, A. A. and Alemu, Z. A., 2017, Knowledge,
Attitude and Practice of first aid and factors
associated with practice among taxi drivers in
Addis Ababa, Ethiopia, Ethiopian Journal of
Health Development, 31(3), pp. 200–207.
WHO, 2018. Global status report on road traffic
safety, Geneva: s.n.
WHO, 2018. Road traffic injuries. [Online]
Available at: https://www.who.int [Accessed 2
March 2019].
Wimalaratne, K., Lee , J.I., Lee , K.H., Lee , H.Y., Lee,
J.H., Kang, I.H., 2017, Emergency medical service
systems in Sri Lanka: problems of the past,
challenges of the future, International Journal of
Emergency Medicine. International Journal of
Emergency Medicine, 10(1).
10.1186/s122450170127-x.
13th International Research Conference
General Sir John Kotelawala Defence University
Allied Health Sciences Sessions
242
Paper ID: 139
Prevalence of urinary incontinence and its association with risk
factors in three months postpartum women attending MOH clinics
registered under Colombo Municipal Council during September and
October 2019
KMR Ranasinghe, MAN Madhurangi, IS Samarasinghe, NAVW Yapa, JI Widanagamage, VS
Ruwandika, # GAD Perera
Department of Physiotherapy, Faculty of Allied Health Sciences, General Sir John Kotelawala Defence
University, Ratmalana, Sri Lanka. #[email protected]
Abstract: Ultraviolet radiations (UV) cause
numerous skin diseases when exposed in
excess. Ophiorrhiza mungos (OM) and
Leucas zeylanica (LZ) have identified as
plants with high Sun Protection Factor (SPF)
values. Neem oil and Virgin Coconut Oil
(VCO) are natural oils that have been used in
Ayurvedic medicine for several indications.
The objective of the study was to evaluate the
SPF activity and carry out stability studies in
Neem oil and VCO based cream formulations
consisted with methanolic extracts of OM
and LZ. The Methanolic extracts were
incorporated in to selected ratios of VCO and
Neem oil bases. Samples were subjected to
secondary homogenization. Most stable
ratios of the emulsions were identified as
33% VCO: 35% water: 32% T80, and 29%
Neem oil: 42% water: 29% T80. Cream
formulations were prepared based on above
identified ratios. All creams were
thermodynamically and kinetically stable
more than 120 days at room temperature
(28± 2 0C). The SPF values of creams were
above 30 and they showed higher SPF values
compared to the pure leaf extracts of OM and
LZ. Neem oil based creams had the highest
SPF values which is greater than 38. The
creams were o/w type and in the acceptable
pH range for topical application. Due to the
consistency of the creams, they could retain
on the skin for longer period. All creams
composed with other standard sunscreen
characteristics which increase the market
value of the product.
Key Words: Sun Protection Factor, Stability
evaluation, Characteristics
Introduction
Ultraviolet (UV) radiation cause sunburns,
wrinkles, premature aging and skin cancers
(Dutra et al., 2004). It is considered that
sunscreen agents with the Sun Protection
Factor (SPF) value of 15 or greater are
suitable for the use against the harmful
effects of solar radiation (Ratnasooriya et al.,
2014). The public prefer to use herbal
creams as alternative photo protective
agents, because some synthetic ingredients
such as Amino Benzoic acid can cause photo
sensitivity reactions. This study was done
using Ophiorrhiza mungos (OM) and Leucas
zeylanica (LZ) which were previously
identified as potential agents with photo
protective effect SPF values as 39.2 (+/- 0.92)
and 39.8 (+/- 0.35) respectively (Napagoda
et al., 2016).
For this study, two natural oils, Virgin
Coconut Oil (VCO) and Neem oil were
selected (Sanjeewani and Sakeena, 2013 and
De Silva et al., 2018). Tween 80®
(Polyoxyethylene sorbitan monooleate -
T80), molecular formula C64H124O26, was
used as the surfactant. The objective of the
study was to evaluate SPF activity and to
formulate stable cream formulation(s) using
Neem oil and VCO based emulsions with
methanolic extracts of OM and LZ..
Methodology
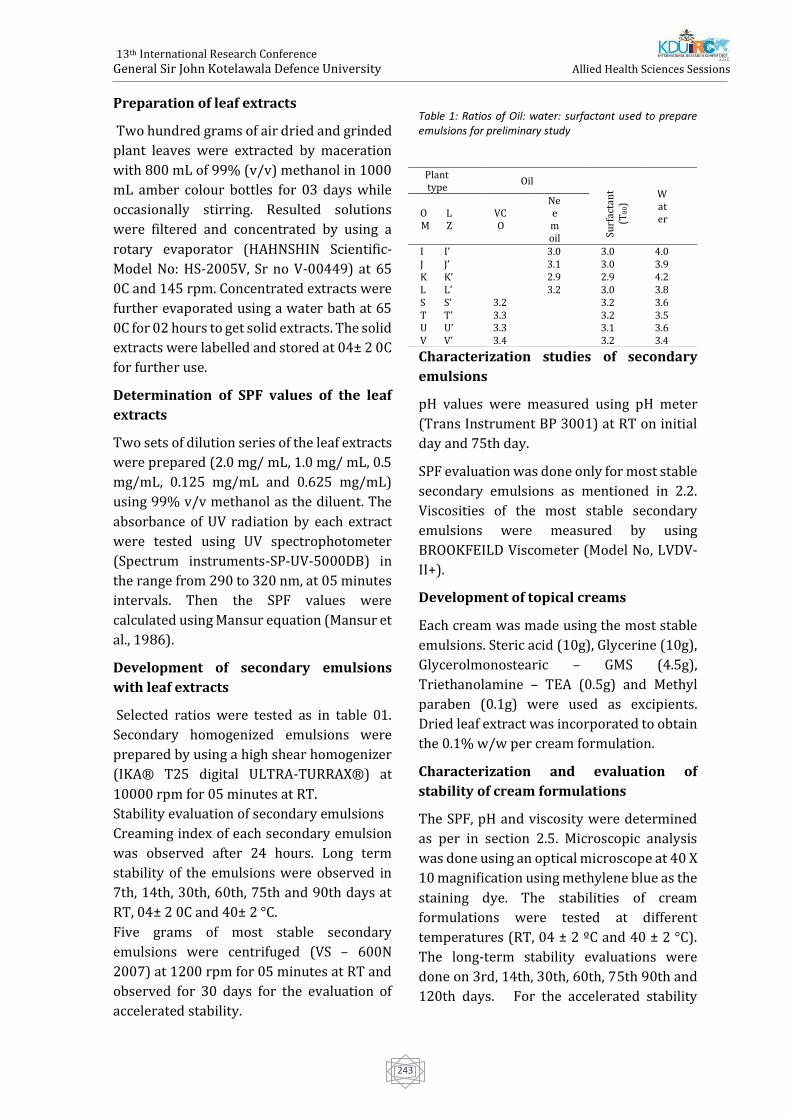
13th International Research Conference
General Sir John Kotelawala Defence University
Allied Health Sciences Sessions
243
Preparation of leaf extracts
Two hundred grams of air dried and grinded
plant leaves were extracted by maceration
with 800 mL of 99% (v/v) methanol in 1000
mL amber colour bottles for 03 days while
occasionally stirring. Resulted solutions
were filtered and concentrated by using a
rotary evaporator (HAHNSHIN Scientific-
Model No: HS-2005V, Sr no V-00449) at 65
0C and 145 rpm. Concentrated extracts were
further evaporated using a water bath at 65
0C for 02 hours to get solid extracts. The solid
extracts were labelled and stored at 04± 2 0C
for further use.
Determination of SPF values of the leaf
extracts
Two sets of dilution series of the leaf extracts
were prepared (2.0 mg/ mL, 1.0 mg/ mL, 0.5
mg/mL, 0.125 mg/mL and 0.625 mg/mL)
using 99% v/v methanol as the diluent. The
absorbance of UV radiation by each extract
were tested using UV spectrophotometer
(Spectrum instruments-SP-UV-5000DB) in
the range from 290 to 320 nm, at 05 minutes
intervals. Then the SPF values were
calculated using Mansur equation (Mansur et
al., 1986).
Development of secondary emulsions
with leaf extracts
Selected ratios were tested as in table 01.
Secondary homogenized emulsions were
prepared by using a high shear homogenizer
(IKA® T25 digital ULTRA-TURRAX®) at
10000 rpm for 05 minutes at RT.
Stability evaluation of secondary emulsions
Creaming index of each secondary emulsion
was observed after 24 hours. Long term
stability of the emulsions were observed in
7th, 14th, 30th, 60th, 75th and 90th days at
RT, 04± 2 0C and 40± 2 °C.
Five grams of most stable secondary
emulsions were centrifuged (VS – 600N
2007) at 1200 rpm for 05 minutes at RT and
observed for 30 days for the evaluation of
accelerated stability.
Table 1: Ratios of Oil: water: surfactant used to prepare emulsions for preliminary study
Characterization studies of secondary
emulsions
pH values were measured using pH meter
(Trans Instrument BP 3001) at RT on initial
day and 75th day.
SPF evaluation was done only for most stable
secondary emulsions as mentioned in 2.2.
Viscosities of the most stable secondary
emulsions were measured by using
BROOKFEILD Viscometer (Model No, LVDV-
II+).
Development of topical creams
Each cream was made using the most stable
emulsions. Steric acid (10g), Glycerine (10g),
Glycerolmonostearic – GMS (4.5g),
Triethanolamine – TEA (0.5g) and Methyl
paraben (0.1g) were used as excipients.
Dried leaf extract was incorporated to obtain
the 0.1% w/w per cream formulation.
Characterization and evaluation of
stability of cream formulations
The SPF, pH and viscosity were determined
as per in section 2.5. Microscopic analysis
was done using an optical microscope at 40 X
10 magnification using methylene blue as the
staining dye. The stabilities of cream
formulations were tested at different
temperatures (RT, 04 ± 2 ºC and 40 ± 2 °C).
The long-term stability evaluations were
done on 3rd, 14th, 30th, 60th, 75th 90th and
120th days. For the accelerated stability
Plant type
Oil
Surf
acta
nt
(T8
0)
Water
OM
LZ
VCO
Neem oil
I I’ 3.0 3.0 4.0 J J’ 3.1 3.0 3.9 K K’ 2.9 2.9 4.2 L L’ 3.2 3.0 3.8 S S’ 3.2 3.2 3.6 T T’ 3.3 3.2 3.5 U U’ 3.3 3.1 3.6 V V’ 3.4 3.2 3.4
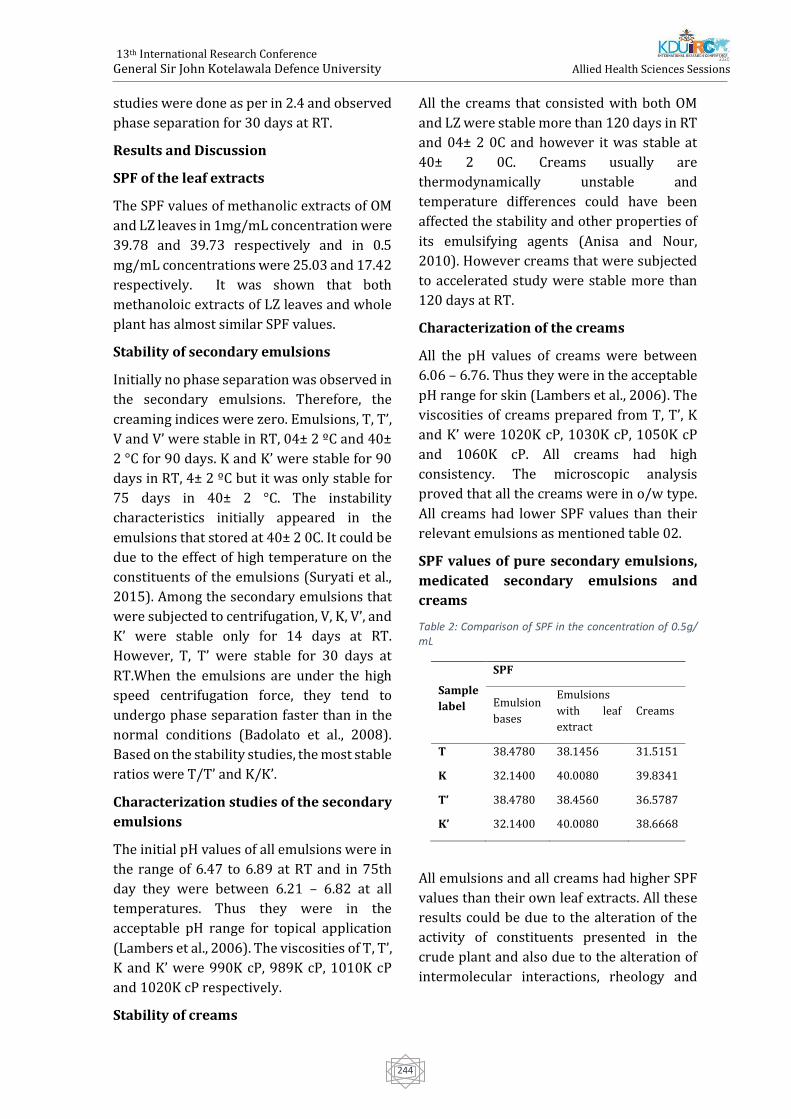
13th International Research Conference
General Sir John Kotelawala Defence University
Allied Health Sciences Sessions
244
studies were done as per in 2.4 and observed
phase separation for 30 days at RT.
Results and Discussion
SPF of the leaf extracts
The SPF values of methanolic extracts of OM
and LZ leaves in 1mg/mL concentration were
39.78 and 39.73 respectively and in 0.5
mg/mL concentrations were 25.03 and 17.42
respectively. It was shown that both
methanoloic extracts of LZ leaves and whole
plant has almost similar SPF values.
Stability of secondary emulsions
Initially no phase separation was observed in
the secondary emulsions. Therefore, the
creaming indices were zero. Emulsions, T, T’,
V and V’ were stable in RT, 04± 2 ºC and 40±
2 °C for 90 days. K and K’ were stable for 90
days in RT, 4± 2 ºC but it was only stable for
75 days in 40± 2 °C. The instability
characteristics initially appeared in the
emulsions that stored at 40± 2 0C. It could be
due to the effect of high temperature on the
constituents of the emulsions (Suryati et al.,
2015). Among the secondary emulsions that
were subjected to centrifugation, V, K, V’, and
K’ were stable only for 14 days at RT.
However, T, T’ were stable for 30 days at
RT.When the emulsions are under the high
speed centrifugation force, they tend to
undergo phase separation faster than in the
normal conditions (Badolato et al., 2008).
Based on the stability studies, the most stable
ratios were T/T’ and K/K’.
Characterization studies of the secondary
emulsions
The initial pH values of all emulsions were in
the range of 6.47 to 6.89 at RT and in 75th
day they were between 6.21 – 6.82 at all
temperatures. Thus they were in the
acceptable pH range for topical application
(Lambers et al., 2006). The viscosities of T, T’,
K and K’ were 990K cP, 989K cP, 1010K cP
and 1020K cP respectively.
Stability of creams
All the creams that consisted with both OM
and LZ were stable more than 120 days in RT
and 04± 2 0C and however it was stable at
40± 2 0C. Creams usually are
thermodynamically unstable and
temperature differences could have been
affected the stability and other properties of
its emulsifying agents (Anisa and Nour,
2010). However creams that were subjected
to accelerated study were stable more than
120 days at RT.
Characterization of the creams
All the pH values of creams were between
6.06 – 6.76. Thus they were in the acceptable
pH range for skin (Lambers et al., 2006). The
viscosities of creams prepared from T, T’, K
and K’ were 1020K cP, 1030K cP, 1050K cP
and 1060K cP. All creams had high
consistency. The microscopic analysis
proved that all the creams were in o/w type.
All creams had lower SPF values than their
relevant emulsions as mentioned table 02.
SPF values of pure secondary emulsions,
medicated secondary emulsions and
creams
Table 2: Comparison of SPF in the concentration of 0.5g/ mL
Sample
label
SPF
Emulsion
bases
Emulsions
with leaf
extract
Creams
T 38.4780 38.1456 31.5151
K 32.1400 40.0080 39.8341
T’ 38.4780 38.4560 36.5787
K’ 32.1400 40.0080 38.6668
All emulsions and all creams had higher SPF
values than their own leaf extracts. All these
results could be due to the alteration of the
activity of constituents presented in the
crude plant and also due to the alteration of
intermolecular interactions, rheology and
13th International Research Conference
General Sir John Kotelawala Defence University
Allied Health Sciences Sessions
245
penetration properties (Hamid et al., 2015
and Suryati et al., 2015).
In this study maceration was used as the
extraction technique because it was the most
effective method for thermo liable
compounds (Zhang et al., 2017). Increasing
the temperature of extracts can alter their
chemical properties Therefore, methanol is
more appropriate in using as a solvent
(Zhang et al., 2017). However the risk of
exposure to methanol was minimized by
using the rotatory evaporator until the pure
dry extract was obtained. It was found that,
the stable ratios for each emulsion consisted
of the two separate leaf extracts used in this
study were the same. This could be due to the
presence of similar types of compounds in
both plants (Radhika et al., 2018 and
Madhavan, 2013).
In cream formulation GMS was used as a
stabilizer, emollient and plasticizer. Steric
acid was used as an emulsifier and
solubilizing agent. Methyl paraben was used
as an antibacterial agent. TEA was used as an
emulsifying agent to produce stable o/w
formulations and as a pH adjuster. Further,
Glycerine was used due to its humectant and
emollient properties (Raymond et al., 1986).
Conclusion
As the conclusion of the study, two different
stable ratios of medicated emulsions has
found as 33% VCO: 35% water: 32% T80 and
29% Neem oil: 42% water: 29% T80. Creams
that were prepared according to these ratios
were proven thermodynamically stable more
than 120 days at RT and 04 ± 2 0C, kinetically
stable at RT more than 120 days. All final
cream formulations had higher SPF values
than methanolic extracts of OM and LZ
leaves. The SPF values of each cream was
above 30. Hence all the creams can be used
as effective sunscreen agents.
References
Anisa, A, and Nour, A (2010): Catastrophic and
Transitional Phase Inversion of Water-in-Oil
Emulsion for Heavy and Light Crude Oil. Journal
of Applied Sciences 10 (23), pp 3076-3083.
Babu, A, Mohamed, SN, Jaikumar, K, Anand, D and
Saravanan, P (2016): In-Vitro antifungal activity
of leaf extracts of leucas aspera and leucas
zeylanicab, international journal of
pharmaceutical sciences and research 7 (2), pp
752-756.
Badolato, GG, Aguilar, F, Schuchmann, HP,
Sobisch, T and Lerche, D (2008): Evaluation
of long term stability of model emulsions by
multisample analytical centrifugation,
Progress in colloid and polymer Science 134,
pp 66–73.
Hamid, AK, Shafiyah, S, Shariq, B, Jiyauddin, K,
Kaleemullah, M, Samer, AD and Budiasih, S
(2015): Photoprotective activity ethanolic
extracts and cream formulation of Camellia
sinensis and Azadirachta indica, World Journal of
Pharmaceutical Research 4 (5), pp 422-435.
Jayaweera, DMA (2006): Medicinal plants
(Indigenous and Exotic) used in Ceylon. Sri Lanaka,
The National Science Foundation. part (iii), pp 92-
93 and part (iv), pp 294-295.
Lambers, H, Piessens, S, Bloem, A, Pronk, H and
Finkel, P (2006): Natural skin surface pH is on
average below 5, which is beneficial for its
resident flora, International journal of cosmetic
sciences 28 (5), pp 359-370.
Madhavan, V, Yoganarasimhan, S, Gurudeva, M,
John, C and Deveswaran, R (2013):
Pharmacognostical studies on the leaves of
Ophiorrhiza mungos (Rubiaceae), Spatula DD -
Peer Reviewed Journal on Complementary
Medicine and Drug Discovery 3 (3), pp 89.
Mansur, JS, Breder, MNR, Mansur, MCA, Azulay,
RD (1986): ‘Determinacao do fator de protecao
solar por espectrofotometria’, Anais brasileiros de
dermatologia 61 (3), pp 121- 124.
Napagoda, M, Malkanthi, B, Abayawardana, S,
Qader, M and Jayasinghe, L (2016):
Photoprotective potential in some medicinal
plants used to treat skin diseases in Sri Lanka,
BMC Complementary and Alternative Medicine 16
(1), pp 479.
Radhika, B (2018): Pharmacognostic and
preliminary phytochemical evaluation of the
13th International Research Conference
General Sir John Kotelawala Defence University
Allied Health Sciences Sessions
246
leaves of Leucas zeylanica, International Journal of
Biomedical Investigation 1 (1), pp 1-6.
Ratnasooriya, WD, Jayakody, JRAC, Rosa, SRD, and
Ratnasooriya, CDT (2014): In- vitro anti-
hyaluronidase activity of Sri Lankan low grown
orthodox orange pekoe grade black tea (Camellia
sinensis), World Journal of Pharmaceutical
Sciences ISSN 2 (2), pp 144-148.
Raymond, CR, Paul, JS, Marian and EQ (1986):
Handbook of Pharmaceutical Excipients. In sixth
edition, USA, RPS publisher, Pharmaceutical
press. pp 283-754.
Sanjeewani, NA and Sakeena, MHF (2013):
Formulation and characterization of Virgin
Coconut Oil (VCO) based emulsion, International
Journal of Scientific and Research publications 3
(12), pp 1-6.
Suryati, Lucida, H and Dachriyanus (2015):
Formulation of sunscreen cream of germanicol
cinnamate from the leaves of tabat barito (Ficus
deltoides jack) and an assay of its’ sun protection
factor International Journal of Pharmaceutical
Sciences Review and Research 32 (1), pp 104–107.
Thoman, CJ (1999): The versatility of
polysorbate 80 (Tween 80®) as an ionophor,
Journal of pharmaceutical sciences 88 (2), pp
258-260.
Zhang, QW, Lin, LG, Ye, WC (2017): Techniques
for extraction and isolation of natural products: a
comprehensive review, Chinese medicine 13 (1),
pp 1-26
13th International Research Conference
General Sir John Kotelawala Defence University
Allied Health Sciences Sessions
247
Paper ID: 164
Knowledge Regarding Weight Management Through Lifestyle
Modification Among Overweight And Obese Type 2 Diabetes Mellitus
Patients
#U Powsiga , PAD Coonghe, M Aravinthan and L Kamalarupan
Department of Nursing, Faculty of Allied Health Sciences, University of Jaffna
Department of Community and Family Medicine, Faculty of Medicine, University of Jaffna
Diabetic Center, Teaching Hospital Jaffna #[email protected]
Introduction
Diabetes mellitus is a leading cause of
morbidity and mortality worldwide, with an
estimated 80% of the affected population
living in developing countries like Sri Lanka
(Hu, 2011). Prevalence of diabetes in Sri
Lanka, which was around 2.0 % in the early
nineties, has increased by about five-fold
during the last two decades. It is estimated
that over 2 million people are suffering from
diabetes (Katulanda et al., 2010).
Overweight and obesity are becoming more
prevalent in developing countries due to
change in lifestyle. One in five adults in Sri
Lanka has either diabetes or pre-diabetes.
Weight maintenance within the target body
mass index (BMI) helps to prevent many
diseases especially diabetes. The relationship
between the metabolic control and
development of chronic complications of
diabetes is an important aspect of patient
management. The causes of type 2 diabetes
are multi-factorial. Diet and physical activity
are important
modifiable risk factors that play a central role
in the incidence, severity and management of
diabetes.
Overweight and obesity are the major risk
factors for type 2 diabetic patients. Weight
reduction is an important goal for overweight
or obese type 2 diabetes, because it improves
glycemic control. Moderate weight reduction
(5% of body weight) can improve insulin
action, decrease fasting blood glucose
concentrations, and reduce the need for
diabetes medications. Moreover,
improvement in fasting blood glucose is
directly related to the relative amount of
weight reduction. According to the study
result on May 2009 to November2013 at
Diabetic Center, Teaching Hospital Jaffna,
more than half of the population were
overweight (20.5%) and obesity (33.8%)
(Sujanitha et al., 2015). Therefore, there is
important to necessary for accessing
knowledge regarding weight management for
the type 2 diabetic patients. Objective of the
study is assessing the level of knowledge
regarding overweight, obesity and weight
management through lifestyle modification
among overweight and obese type 2 Diabetes
mellitus patients and to assess the relation
between socio demographic factors associated
on knowledge.
Methodology
It was an institutional based cross-sectional
study conducted in Diabetic Center at
Teaching Hospital Jaffna. Above age of 18
patients and patients diagnosed as type 2
diabetes mellitus above 6 months of period
were recruited for this study. Estimated
sample size was 414. Overweight and obese
patients were identified among all type 2
diabetes mellitus patients in annual review.
An interviewer administered semi structures
questionnaire used to collect data.
Questionnaire contains clinic details, socio
demographic and economic related questions
and questions to assess knowledge regarding
13th International Research Conference
General Sir John Kotelawala Defence University
Allied Health Sciences Sessions
248
overweight, obesity and weight management
through lifestyle modification. Overweight
and obese patients were identified among all
type 2 diabetes mellitus patients. Every
overweight and obese patient was included in
this study. In the morning and evening data
was collected. Purpose of the study was
explained and written consent was obtained
before administering the questionnaire. Each
interviewer administered questionnaire spent
nearly twenty to thirty minutes to fill. Data
was collected with the interview
administrated questionnaire during the
waiting time for the physician. Totally data
was collected from four hundred fourteen
patients in 29 days during week days.
Data was analyzed by using SPSS 22
(statistical Package for Social Sciences).
Eighteen questions were used to assess
knowledge regarding weight management
through life style modification. Each correct
response was scored with one mark while
incorrect or don’t know response were
received zero mark. Total thirty-four marks
were given for the section. The score less
than fifty was considered as poor
knowledge and the score above fifty was
considered as good knowledge. Chi squared
statistical test was used to identify the factors
influence on knowledge related to weight
management through life style modification.
The data was analyzed based on research
problems and objectives. Results presented as
tables and diagram. All the data of the patients
which collected for research purpose was
confidentially kept in personal file and was not
exposing to none other than researchers. All
the data used to analysis was confidentially
kept on personal computer with password
protection. At the end of the research all data
obtained from the patients was submitted to
Unit of Allied Health Sciences, Faculty of
Medicine, University of Jaffna.
Results and discussion
The study was done among414 overweight
and obese type 2 Diabetes mellitus patients
attended Diabetic Center at Teaching Hospital
Jaffna. The response rate was 100%.28% of
the participants were overweight and 72% of
the participants were obese. Nearly three
quartiles (74.6%) of participants were female.
Mean age of participants was 56.1 (SD-10.6)
years. Age range of the participants was 27 to
82 years. More than three fourth (78.3%) of
participants were married. Most of them were
nuclear family (72.5%). Majority of the
participants were Sri Lankan Tamil (98.8%).
Most of them were hindus (73.4%). Ordinary
level was the highest level of education for
nearly one third (33.3%) of participants.
Nearly three quartiles (75.6%) of participants
were unemployed. Nearly two fifth of
monthly family income less than 20,000
(43.2%) and 20,000-40000 (43.7%) SLRs
respectively.
Majority of participants (98.3%) knew the
important to maintain ideal body weight for
the healthy living. Nearly 63% of participants
knew weight should be appropriate for their
height. Nearly one third (34.1%) of
participants incorrectly said weight was
appropriate for their age. Only 3.1%
participants knew the method of calculation of
the BMI. Only 2.4% participants knew healthy
BMI range of Sri Lankan adult was 18.5 22.9
km/m2 .Only 0.2% participants knew that
referred range of BMI for overweight was 23-
24.9 kg/m2.While only 1.0% of the
participants knew the referred range of BMI
for obesity (≥25kg/m2). Only 13.8% knew
their correct BMI category.
A similar study was done in Bangladesh; it
revealed majority of respondents (99.0%) did
not have any idea about meaning of obesity,
more than half of the population (59.0%)
could not give the answer about ideal body
built (Saleh et al.,2012). Another study was
done in Ghana; it revealed 72.0% had
adequate knowledge on the general
understanding of obesity, for ideal body
13th International Research Conference
General Sir John Kotelawala Defence University
Allied Health Sciences Sessions
249
weight 56.6% of them had inadequate
knowledge (Obirikorang et al., 2015).
Nearly 61.6% participants correctly answered
that increasing waist circumference can
increase the risk of diabetic mellitus. Only
8.0% male participants knew ideal waist
circumference for male. Only 3.2% female
participants knew ideal waist circumference
for female.
Nearly three fourth participants (77.8%)
correctly answered about overweight and
obesity has an impact on diabetic mellitus.
Most of the participants knew that excess
calorie intake (77.8%), Physical Inactivity
(99.8%), family history (88.4%) were the
causes of overweight and obesity. However,
the participants knew that hypothyroidism
(51.7%), steroids (12.1%), oral contraceptive
pills (20.8%) were the causes of overweight
and obesity. Another study was done in Ghana;
higher proportion (76.9%) of the participants
responded that poor diet was a common cause
of obesity followed by physical inactivity
(67.1%), family history of obesity (56.6%)
(Obirikorang et al., 2015).
Majority of the participants stated that
following proper diet (100%), doing regular
exercises were the healthy ways to maintain
ideal body built. However, nearly 90% of the
participants knew that to take weight
reduction medications (85.3%), skip breakfast
(95.2%), fasting (94.4%) were not the healthy
ways to maintain ideal body built. A similar
study was done in Ghana; among 471
participants 86.7% knew that adjusting to
dietary modification is the best mode of
managing obesity while 68.6% and 28.7% of
them knew that doing regular physical activity
and health check-up, respectively, could help
manage obesity(Obirikorang et al.,2015).
Nearly 64.7% the participants knew that they
should be allocated half portion of their plate
for vegetables while 85.7% of the participants
stated that quarter portion in the plate should
be allocate for the starchy food items.
However, 91.8% of the participants stated that
quarter portion should be allocate for the
protein foods.
Most of the participants (96.4) knew that
overweight and obese persons should be
taken reduce amount of cereals, yams, rice and
wheat flour preparations rather than normal
adult. Most of the participants knew that
overweight and obese persons also can be take
recommended amount of vegetables (98.8%),
fruits (89.6%) like healthy adult. Nearly half
(54.3%) of the participants knew that
overweight and obese persons can be taken
recommended amount of fish, pulses, meats,
eggs like normal healthy adult. Nearly 70 % of
the participants knew that overweight and
obese persons should be taken reduce amount
of milk and dairy products (70.8%), nuts and
oil items (87.0%) rather than normal adult.
A study was done in Bangladesh; it revealed
that majority of the respondents stated that
fast foods (77%), soft drinks (84%) and
mayonnaise (33%) were not bad for weight
management. On the other hand, most of the
respondents (97%) said fiber rich food is good
for health. Majority of them gave correct
answer about red meat (93%), egg yolk (89%),
butter, cheese and cream (91%) (Saleh et
al.,2012).
Nearly one quartile (25.6%) of the
participants said that thirty minutes was a
minimal duration to perform an exercise in a
day for an overweight person. However Only
5.8% of the participants knew that five
consecutive days in a week was a minimal
frequency to perform an exercise in a week for
an overweight person. Nearly one fifth
(18.4%) of participants knew that sixty
minutes was a minimal duration to perform an
exercise in a day for an obese person. However
more than one third (37.2%) of the
participants correctly answered that seven
days was a minimal frequency to perform an
exercise in a week for an obese person
13th International Research Conference
General Sir John Kotelawala Defence University
Allied Health Sciences Sessions
250
Most of the participants (81.2%) had good
knowledge and nearly one fifth (18.8%) of
the participants had poor knowledge.
Conclusion and Recommendation
The present study shows that nearly four
fifth of the participants had good
knowledge regarding
weight management through lifestyle
modification. Only 2.4% of the
participants knew healthy
BMI rage for the Sri Lankan. Only 13.8% of
the participants knew whether they were
obese or
overweight. Most of the participants
stated that excess calorie intake, physical
inactivity, family
history are the causes for overweight and
obesity. Majority of the participants knew
about
healthy ways to maintain ideal body built,
portion and amount of food items while
few of them
knew about frequency and duration of the
exercise. According to their BMI health
education should be done by health care
professionals regarding ideal body built,
importance of maintain target weight and
weight management through life style
modification. Further studies should be
done to assess their practice pattern.
References
American Diabetes Association, 2016. 6. Obesity
management for the treatment of type 2
diabetes. Diabetes Care, 39(Supplement 1), pp.S47-
S51.
Ansari, M.R., 2010. Effect of Physical Activity and
Obesity on Type 2 Diabetes in a Middle-Aged
Population. Journal of Environmental and Public
Health, 2010(2010), p.5.
Cooper, J.N. and Robeck, I.R., 1984. Management of
obesity. Virginia medical, 111(7), p.384.
Feleke, S.A., Alemayehu, C.M., Adane, H.T.,
Onigbinde, A.T., Akindoyi, O. and Faremi, F.A., 2013.
Assessment of the level and associated factors with
knowledge and practice of diabetes mellitus among
diabetic patients attending at FelegeHiwot
hospital, Northwest Ethiopia. Clin Med Res, 2(6),
p.110.
Hailu, E., Mariam, W.H., Belachew, T. and Birhanu,
Z., 2012. Self-care practice and glycaemic control
amongst adults with diabetes at the Jimma
University Specialized Hospital in south-west
Ethiopia: A cross-sectional study. African journal of
primary health care & family medicine, 4(1).
Katulanda, P., Jayawardena, M.A.R., Sheriff, M.H.R.,
Constantine, G.R. and Matthews, D.R., 2010.
Prevalence of overweight and obesity in Sri Lankan
adults. Obesity reviews, 11(11), pp.751-756.
Katulanda, P., Rathnapala, D.A.V., Sheriff, R. and
Matthews, D.R., 2012. Province and ethnic specific
prevalence of diabetes among Sri Lankan
adults. Sri Lanka Journal of Diabetes Endocrinology
and Metabolism, 1(1)
Kisokanth, G., Prathapan, S., Indrakumar, J. and
Ilankoon, I.M.P.S., 2018. Diet related factors for
good glycaemic control among patients with
diabetes mellitus in the Teaching Hospital,
Batticaloa, Sri Lanka. Journal of the National
Science Foundation of Sri Lanka, 46(3)
Klein, S., Sheard, N.F., Pi-Sunyer, X., Daly, A., Wylie-
Rosett, J., Kulkarni, K. and Clark, N.G., 2004. Weight
management through lifestyle modification for the
prevention and management of type 2 diabetes:
rationale and strategies: a statement of the
American Diabetes Association, the North
American Association for the Study of Obesity, and
the American Society for Clinical
Nutrition. Diabetes care, 27(8), pp.2067-2073.
Laws, R.A., Vita, P., Venugopal, K., Rissel, C., Davies,
D. and Colagiuri, S., 2012. Factors influencing
participant enrolment in a diabetes prevention
program in general practice: lessons from the
Sydney diabetes prevention program. BMC public
health, 12(1), p.822.
Medagama, A. and Galgomuwa, M., 2018. Lack of
infrastructure, social and cultural factors limit
physical activity among patients with type 2
13th International Research Conference
General Sir John Kotelawala Defence University
Allied Health Sciences Sessions
251
diabetes in rural Sri Lanka, a qualitative study. PloS
one, 13(2), p.e0192679
Medagama, A. and Widanapathirana, H., 2015. An
appraisal of food serving characteristics among
patients with type 2 diabetes mellitus attending a
tertiary care diabetes facility in Sri
Lanka. International Archives of Medicine, 8.
Ministry of health, S. L. (2014) ‘Dietary Guidelines
& Nutrition Therapy for Specific Diseases Nutrition
Division -Ministry of Health’.
Ministry of health, S. L. (2011) ‘Food based dietary
Guidelines & for Sri Lankans -Ministry of Health’.
Obirikorang, Y., Obirikorang, C., Odame Anto, E.,
Acheampong, E., Dzah, N., Akosah, C.N. and
Nsenbah, E.B., 2016. Knowledge and lifestyle-
associated prevalence of obesity among newly
diagnosed type II diabetes mellitus patients
attending diabetic clinic at komfo anokye teaching
hospital, kumasi, ghana: a hospital-based cross-
sectional study. Journal of diabetes research, 2016.
Okonta, H.I., Ikombele, J.B. and Ogunbanjo, G.A.,
2014. Knowledge, attitude and practice regarding
lifestyle modification in type 2 diabetic
patients. African journal of primary health care &
family medicine, 6(1), pp.1-6.
Physical Activity Guidelines advisory
committee.2018 Physical Activity Guidelines
advisory committee scientific report. Washington,
2018.Physical Activity Guidelines advisory
committee
Raithatha, S.J., Shankar, S.U. and Dinesh, K., 2014.
Self-care practices among diabetic patients in
Anand District of Gujarat. ISRN family
medicine, 2014.
Ranasinghe, P., Pigera, A.S.A.D., Ishara, M.H.,
Jayasekara, L.M.D.T., Jayawardena, R. and
Katulanda, P., 2015. Knowledge and perceptions
about diet and physical activity among Sri Lankan
adults with diabetes mellitus: a qualitative
study. BMC public health, 15(1), p.1160.
Ranasinghe, D.C., Ranasinghe, P., Jayawardena, R.,
Matthews, D.R. and Katulanda, P., 2014. Evaluation
of physical activity among adults with diabetes
mellitus from Sri Lanka. International archives of
medicine, 7(1), p.15.
Saleh, F., Mumu, S.J., Ara, F., Ali, L., Hossain, S. and
Ahmed, K.R., 2012. Knowledge, attitude and
practice of type 2 diabetic patients regarding
obesity: study in a tertiary care hospital in
Bangladesh. Journal of public health in Africa, 3(1).
Senadheera, S.P.A.S., Ekanayake, S. and
Wanigatunge, C., 2016. Dietary habits of type 2
diabetes patients: variety and frequency of food
intake. Journal of nutrition and metabolism, 2016.
Somasundaram, N.P., Wijeyaratne, C.N., De Silva, S.,
Siribaddana, S., Illangasekara, U., Rajaratnam, H.,
Katulanda, P., Bulugahapitiya, S., Siyambalapitiya,
S., Antonypillai, C. and Sumanatilleke, M., 2013.
Diabetes mellitus: Glucose control.
Sujanitha, V., Sivansuthan, S., Selvakaran, P. and
Parameshwaran, R., 2015. Overweight, obesity and
chronic complications of diabetes mellitus in
patients attending Diabetic Centre, Teaching
Hospital, Jaffna, Sri Lanka. Ceylon Medical Journal, .
13th International Research Conference
General Sir John Kotelawala Defence University
Allied Health Sciences Sessions
252
Paper ID: 166
Development of a herbal soap using selected medicinal plants and
evaluation of its antimicrobial activity
NM Wijayawardhana, MMDU Cooray, DI Uluwaduge, LDAM Arawwawala and
#WJABN Jayasuriya
Department of Pharmacy and Pharmaceutical Sciences, Faculty of Allied Health Sciences,
University of Sri Jayewardenepura, Sri Lanka
Department of Medical Laboratory Sciences, Faculty of Allied Health Sciences,
University of Sri Jayewardenepura, Sri Lanka
Industrial Technology Institute, Colombo 07, Sri Lanka # [email protected]
Abstract: Soaps are used as a modality for
topical application of medicinal plants used in
the treatment of skin infections. In herbal
soaps, natural bioactive constituents with a
variety of therapeutic activities are
incorporated into basic soap medium. Natural
herbs are the main ingredients of herbal soap
which are safer and beneficial than the
commercial soaps. Antimicrobial activity of
leaf extracts of Azadirachta indica, Cassia
fistula and flower extract of Nelumbo nucifera
has been evaluated individually and in
combination by a previous study. This study
aims to formulate a novel herbal soap using
the above combined extract and to investigate
its antimicrobial activity. Further, this study
evaluates the physicochemical characteristics
of the soap. The combined extract used in the
formulation of soap was prepared by
incorporating aqueous extracts of A. indica,
N.nucifera and ethanol extract of C.fistula at a
ratio of 4:1:1 according to the previous study.
Soap was formulated by including the
combined extract with other ingredients into
the melted glycerin soap base. The
antimicrobial activity of formulated soap was
tested by agar well diffusion method against
Staphylococcus aureus, Pseudomonas
aeruginosa and Candida albicans and
compared with standard drugs. Test was done
in triplicate. Formulated soap exhibited
antimicrobial activity against tested
organisms with a highest activity against S
aureus. Physiochemical parameters of soap
were evaluated by determining the colour, pH,
% free alkali and % of alcohol insoluble matter
of the soap. pH at 28 ºC was 9.11 and % of
alcohol insoluble matter was 24.6% which
were within the accepted range. Further
studies are pursued to evaluate the safety and
efficacy of the formulated herbal soap.
Keywords: Antimicrobial activity, herbal
soap, Azadirachta indica, Cassia fistula,
Nelumbo nucifera
Introduction
Depending on the recent discoveries done on
medicinal plants, the use of herbal medicines
has been enormously increased in worldwide.
The demand for herbal products is increasing
as they are generally safer, cost-effective, and
has fewer adverse effects compared to
synthetic products. Soaps are used as a
modality for topical application of medicinal
plants used in the treatment of skin infections
(Kareru, P.G., Keriko, J.M., Kenji, G.M., Thiong’o,
G.T., Gahanna, A.N. and Makira, H.N.,
2010).Natural bioactive constituents with a
variety of therapeutic activities are
incorporated into basic soap medium in
preparation of soap (Wijetunge, W.M.A.N.K.
and Perera, B.G.K., 2015). Soaps that are
13th International Research Conference
General Sir John Kotelawala Defence University
Allied Health Sciences Sessions
253
available in the market are formulated by
incorporating one or more plant extracts and
claimed for the antifungal or antibacterial
property.
Azadirachta indica, Cassia fistula and Nelumbo
nucifera are medicinal plants that are
frequently found in Sri Lanka.C. fistula which
belongs to the family of Fabacae possesses
antioxidant, antitumor, antimicrobial and
anti-inflammatory activities. Antimicrobial
activity was detected in bark, leaves and
flowers of C. fistula (Ali, M.A., Sayeed, M.A.,
Bhuiyan, M.S.A., Sohel, F.I. and Yeasmin, M.S.,
2004)
A. indica belongs to the family of Meliaceae, is
often known as neem. The plant has been
demonstrated anti-bacterial anti-fungal,
antiviral, anti-oxidant, anti-malarial activities
etc. (Biswas, K., Chattopadhyay, I., Banerjee,
R.K. and Bandyopadhyay, U, 2002).
N.nucifera is an aquatic plant in which its
flower has shown hypoglycemic, antioxidant,
anti-microbial and antihypertensive abilities.
Different chemical compounds with different
therapeutic activities were isolated from
flowers of N.nucifera (Gunawardana, S.L.A.
and Jayasuriya, W.J.A.B.N., 2019).
Although the antimicrobial activity of leaf
extracts of A. indica and C.fistula and flower
extract of N. nucifera has been investigated
individually, a herbal soap has not been
developed using a combined extract of said
plants. Antimicrobial activity of the combined
extract of leaf extracts of A.indica, C.fistula and
flower extract of N.nucifera has evaluated in
our previous study (unpublished data). Hence,
the present study aims to formulate a novel
herbal soap using the above combined extract
and to investigate the antimicrobial activity of
the formulated soap. Furthermore to evaluate
the physicochemical characteristics of the
soap.
Methodology
Plant Collection and Authentication.
Fresh leaves of A. indica,C. fistula and white
flowers of N. nucifera were collected from
Southern and Western Provinces, Sri Lanka.
Plants were authenticated at the National
Herbarium, Botanical Gardens, Peradeniya, Sri
Lanka. The collected plant parts (leaves and
flowers) were washed, air-dried and
powdered to a coarse powder and stored in
air-tight bottles.
Preparation of the extracts
• Preparation of hot ethanol leaf extract
of C. fistula
Prepared sample of C. fistula was added to a
round-bottomed flask containing 150 ml of
ethanol and boiled for 4 hours. Then the
extract was filtered using Whatmaan 0.45 µm
filter paper and the filtrate was concentrated
using a rotary evaporator. Stored at 4℃.
• Preparation of hot aqueous extracts of
leaves of A. indica and flowers of N. nucifera
Sample of each plant was added to round-
bottomed flasks separately containing 150 ml
of distilled water and boiled for 4 hours. Then
the extracts were filtered using Whatmaan
0.45µm filter paper and the filtrate was
concentrated using a rotary evaporator and
freeze-dried. Extracts were stored at 4 ℃.
Preparation of the combined extract
According to the previous study the ratio of
the effective combined extract was aqueous
extract of A. indica (4): aqueous extract of
N.nucifera (1): ethanol extract of C.fistula (1).
Hence 1000 mg/ml of aqueous extract of A.
indica, 250 mg/ml of aqueous extract of
N.nucifera and 250 mg/ml of ethanol extract
of C.fistula were combined.
Test microorganisms
Isolates of Candida albicans, Staphylococcus
aureus ATCC 25923 and Pseudomonas
aeruginosa ATCC 27853 were obtained from
the Department of Microbiology, Faculty of
Medical Sciences University of Sri
Jayewardenepura.
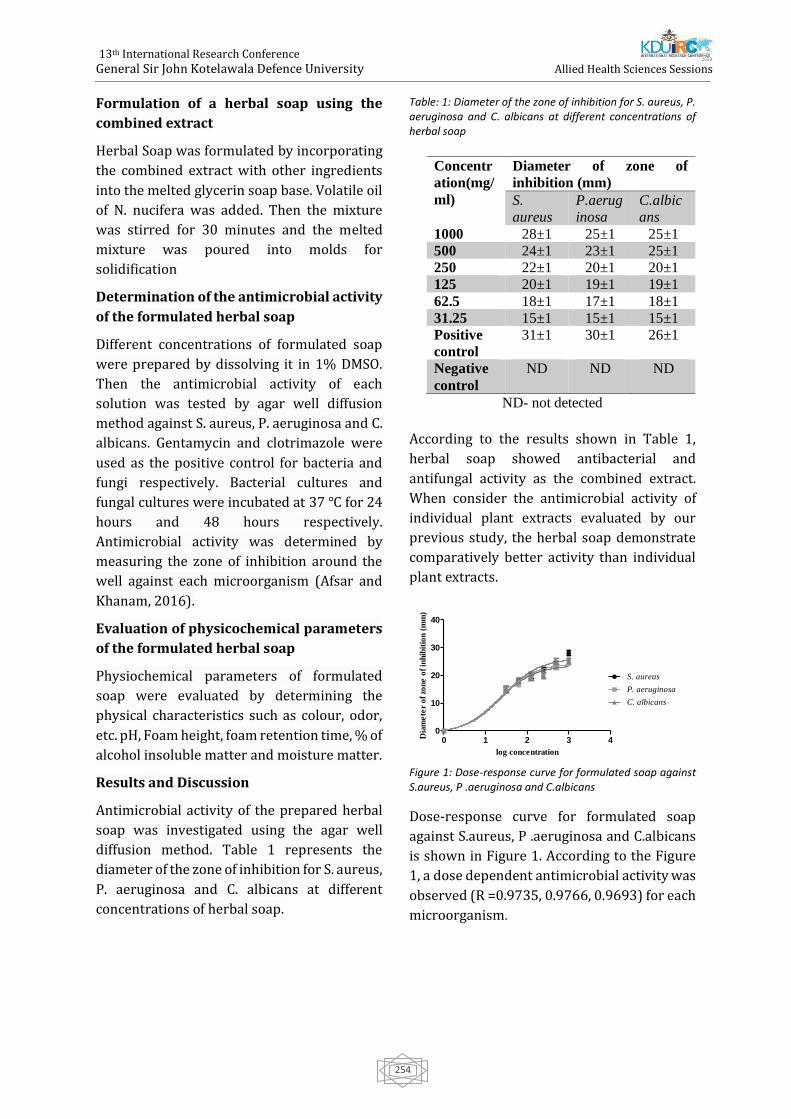
13th International Research Conference
General Sir John Kotelawala Defence University
Allied Health Sciences Sessions
254
Formulation of a herbal soap using the
combined extract
Herbal Soap was formulated by incorporating
the combined extract with other ingredients
into the melted glycerin soap base. Volatile oil
of N. nucifera was added. Then the mixture
was stirred for 30 minutes and the melted
mixture was poured into molds for
solidification
Determination of the antimicrobial activity
of the formulated herbal soap
Different concentrations of formulated soap
were prepared by dissolving it in 1% DMSO.
Then the antimicrobial activity of each
solution was tested by agar well diffusion
method against S. aureus, P. aeruginosa and C.
albicans. Gentamycin and clotrimazole were
used as the positive control for bacteria and
fungi respectively. Bacterial cultures and
fungal cultures were incubated at 37 ℃ for 24
hours and 48 hours respectively.
Antimicrobial activity was determined by
measuring the zone of inhibition around the
well against each microorganism (Afsar and
Khanam, 2016).
Evaluation of physicochemical parameters
of the formulated herbal soap
Physiochemical parameters of formulated
soap were evaluated by determining the
physical characteristics such as colour, odor,
etc. pH, Foam height, foam retention time, % of
alcohol insoluble matter and moisture matter.
Results and Discussion
Antimicrobial activity of the prepared herbal
soap was investigated using the agar well
diffusion method. Table 1 represents the
diameter of the zone of inhibition for S. aureus,
P. aeruginosa and C. albicans at different
concentrations of herbal soap.
Table: 1: Diameter of the zone of inhibition for S. aureus, P. aeruginosa and C. albicans at different concentrations of herbal soap
ND- not detected
According to the results shown in Table 1,
herbal soap showed antibacterial and
antifungal activity as the combined extract.
When consider the antimicrobial activity of
individual plant extracts evaluated by our
previous study, the herbal soap demonstrate
comparatively better activity than individual
plant extracts.
Figure 1: Dose-response curve for formulated soap against S.aureus, P .aeruginosa and C.albicans
Dose-response curve for formulated soap
against S.aureus, P .aeruginosa and C.albicans
is shown in Figure 1. According to the Figure
1, a dose dependent antimicrobial activity was
observed (R =0.9735, 0.9766, 0.9693) for each
microorganism.
Concentr
ation(mg/
ml)
Diameter of zone of
inhibition (mm)
S.
aureus
P.aerug
inosa
C.albic
ans
1000 28±1 25±1 25±1
500 24±1 23±1 25±1
250 22±1 20±1 20±1
125 20±1 19±1 19±1
62.5 18±1 17±1 18±1
31.25 15±1 15±1 15±1
Positive
control
31±1 30±1 26±1
Negative
control
ND ND ND
0 1 2 3 40
10
20
30
40
S. aureus
P. aeruginosa
C. albicans
log concentration
Dia
me
ter
of
zon
e o
f in
hib
itio
n (
mm
)
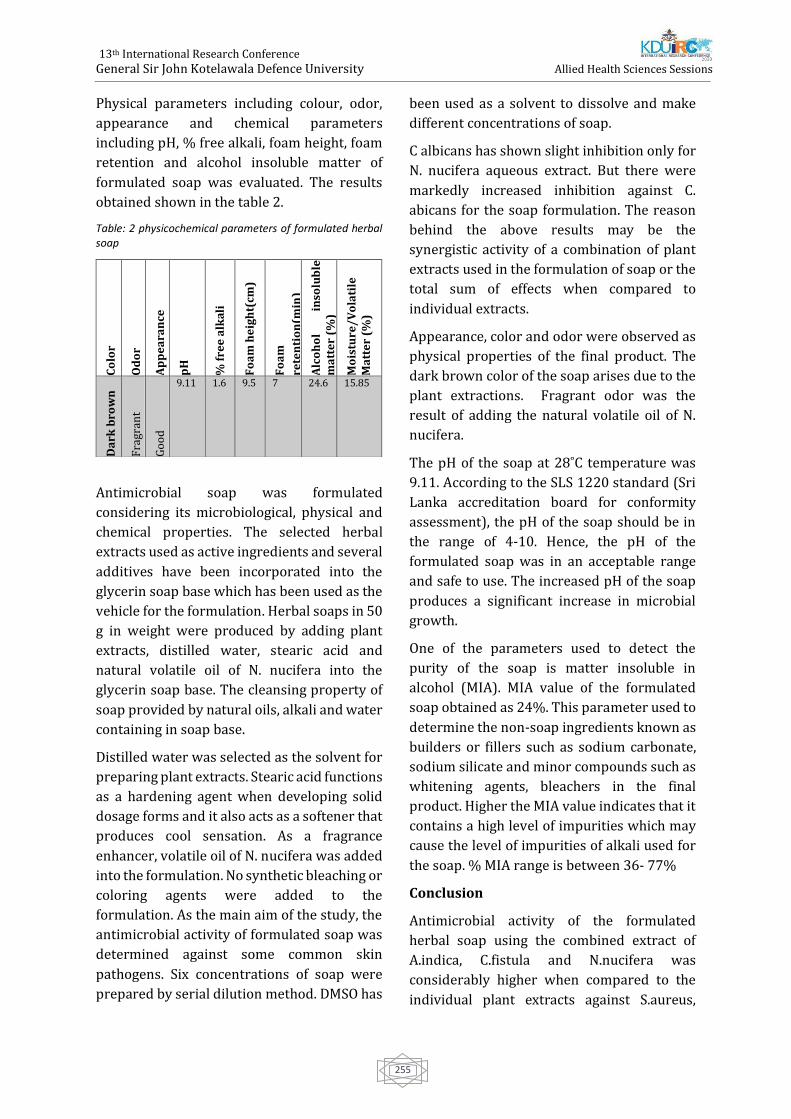
13th International Research Conference
General Sir John Kotelawala Defence University
Allied Health Sciences Sessions
255
Physical parameters including colour, odor,
appearance and chemical parameters
including pH, % free alkali, foam height, foam
retention and alcohol insoluble matter of
formulated soap was evaluated. The results
obtained shown in the table 2.
Table: 2 physicochemical parameters of formulated herbal soap
Antimicrobial soap was formulated
considering its microbiological, physical and
chemical properties. The selected herbal
extracts used as active ingredients and several
additives have been incorporated into the
glycerin soap base which has been used as the
vehicle for the formulation. Herbal soaps in 50
g in weight were produced by adding plant
extracts, distilled water, stearic acid and
natural volatile oil of N. nucifera into the
glycerin soap base. The cleansing property of
soap provided by natural oils, alkali and water
containing in soap base.
Distilled water was selected as the solvent for
preparing plant extracts. Stearic acid functions
as a hardening agent when developing solid
dosage forms and it also acts as a softener that
produces cool sensation. As a fragrance
enhancer, volatile oil of N. nucifera was added
into the formulation. No synthetic bleaching or
coloring agents were added to the
formulation. As the main aim of the study, the
antimicrobial activity of formulated soap was
determined against some common skin
pathogens. Six concentrations of soap were
prepared by serial dilution method. DMSO has
been used as a solvent to dissolve and make
different concentrations of soap.
C albicans has shown slight inhibition only for
N. nucifera aqueous extract. But there were
markedly increased inhibition against C.
abicans for the soap formulation. The reason
behind the above results may be the
synergistic activity of a combination of plant
extracts used in the formulation of soap or the
total sum of effects when compared to
individual extracts.
Appearance, color and odor were observed as
physical properties of the final product. The
dark brown color of the soap arises due to the
plant extractions. Fragrant odor was the
result of adding the natural volatile oil of N.
nucifera.
The pH of the soap at 28˚C temperature was
9.11. According to the SLS 1220 standard (Sri
Lanka accreditation board for conformity
assessment), the pH of the soap should be in
the range of 4-10. Hence, the pH of the
formulated soap was in an acceptable range
and safe to use. The increased pH of the soap
produces a significant increase in microbial
growth.
One of the parameters used to detect the
purity of the soap is matter insoluble in
alcohol (MIA). MIA value of the formulated
soap obtained as 24%. This parameter used to
determine the non-soap ingredients known as
builders or fillers such as sodium carbonate,
sodium silicate and minor compounds such as
whitening agents, bleachers in the final
product. Higher the MIA value indicates that it
contains a high level of impurities which may
cause the level of impurities of alkali used for
the soap. % MIA range is between 36- 77%
Conclusion
Antimicrobial activity of the formulated
herbal soap using the combined extract of
A.indica, C.fistula and N.nucifera was
considerably higher when compared to the
individual plant extracts against S.aureus,
Co
lor
Od
or
Ap
pe
ara
nce
pH
% f
ree
alk
ali
Fo
am
he
igh
t(cm
)
Fo
am
rete
nti
on
(min
)
Alc
oh
ol
inso
lub
le
ma
tte
r (%
)
Mo
istu
re/
Vo
lati
le
Ma
tte
r (%
)
Da
rk b
row
n
Fra
gran
t
Go
od
9.11 1.6 9.5 7 24.6 15.85
13th International Research Conference
General Sir John Kotelawala Defence University
Allied Health Sciences Sessions
256
P.aeruginosa and C.albicans. Therefore this
study concludes that the synergism between
the constituents or total sum of effects of the
combination may cause enhanced growth
inhibition of tested microorganisms. Further
the value of pH, % free alkali, alcohol insoluble
matter and moisture content of the formulated
soap were within the accepted range. Clinical
trials are recommended to evaluate the safety
and efficacy of the formulated soap in future
studies.
References
Afsar, Z. and Khanam, S., 2016. Formulation and
evaluation of polyherbal soap and hand sanitizer.
International Research Journal of Pharmacy, 7(8).
Ali, M.A., Sayeed, M.A., Bhuiyan, M.S.A., Sohel, F.I.
and Yeasmin, M.S., 2004. Antimicrobial screening
of Cassia fistula and Mesua ferrea. J Med Sci, 4(1),
pp.24-29.
Biswas, K., Chattopadhyay, I., Banerjee, R.K. and
Bandyopadhyay, U., 2002. Biological activities and
medicinal properties of neem (Azadirachta indica).
CURRENT SCIENCE-BANGALORE-, 82(11),
pp.1336-1345.
Gunawardana, S.L.A. and Jayasuriya, W.J.A.B.N.,
2019. Medicinally important herbal flowers in Sri
Lanka. Evidence-Based Complementary and
Alternative Medicine, 2019.
Kareru, P.G., Keriko, J.M., Kenji, G.M., Thiong’o, G.T.,
Gachanja, A.N. and Mukiira, H.N., 2010.
Antimicrobial activities of skincare preparations
from plant extracts. African Journal of Traditional,
Complementary and Alternative Medicines, 7(3).
Wijetunge, W.M.A.N.K. and Perera, B.G.K., 2015.
Preparation of liquid medicinal soap products
using Adhatoda vasica (Adhatoda) leaf extracts.
International Journal of multidisciplinary Studies,
2(2).
WMANK, W. and Perera, B.G.K., 2016. Preparation
of medicinal soap products using the leaf extracts
of Punica granatum (pomegranate). International
Journal of Pharmacy and Biological Sciences, 6(2),
pp.7-16.
13th International Research Conference
General Sir John Kotelawala Defence University
Allied Health Sciences Sessions
257
Paper ID: 220
Knowledge On Usage Of Thyroxin Tablet Among Primary
Hypothyroidism Patients Attending Endocrinology Clinic At Teaching
Hospital Jaffna
#R Tharsan, M Aravinthan, PAD Coonghe, and P Kalki
Department of Pharmacy, Faculty of Allied Health Sciences, University of Jaffna
Consultant Endocrinologist, Teaching Hospital Jaffna
Department of Community and Family Medicine, Faculty of Medicine, University of Jaffna
Abstract: Hypothyroidism is a common
condition in Sri Lanka as it is world-wide. Most
of the people were getting treatment for
hypothyroidism in Jaffna. By having good
knowledge on usage of thyroxin medicine, can
be improving the quality of life. The aim of the
study was to evaluate knowledge on usage of
thyroxin tablet and assess relationship
between sociodemographic factors and
knowledge among primary hypothyroidism
patients. A descriptive cross-sectional study
was conducted in 2019, used interviewer
administered questionnaire, include whole
population who had primary hypothyroidism
and SPSS 25 and chi square test were
performed to found out the relationship.
Among the participants’ majority were
females (88.5%), in between age of eighteen to
thirty and mean age was 37.5 years. Most of
the participants (97.7%) knew thyroxin
should be taken as once daily, 94.1% knew
that thyroxin should take in early morning at
empty stomach, 62% knew thyroxin should
store in brown colour container. Only 19%
knew that thyroxin can cause side effects, 40%
was knew that consult the doctor when notice
any side effects following ingestion of thyroxin
however only 19% was knew that should
consult the doctor if missed tablet more than 3
days. Nearly two third of the participants
(64.9%) had poor knowledge. Factors were
assessed and no relationship identified. To
improve the patients’ knowledge, increase the
availability of articles in newspapers, internet
and books in their own mother tongue and
small session can be carried out during clinics.
Keywords: knowledge, hypothyroidism,
Teaching Hospital Jaffna
Introduction
Hypothyroidism is defined as a condition in
which the production of the thyroid hormones
thyroxin (T4) and triiodothyronine (T3) by
the thyroid gland is inadequate to meet
peripheral tissue demand. Thyroid failure
caused by a disease of the thyroid gland is
termed primary hypothyroidism. Primary
hypothyroidism is by far the most common
cause of hypothyroidism, and occurs as a
result of Hashimoto‟s thyroiditis,
thyroidectomy and radiotherapy to the neck,
radioiodine thyroid ablation or medications.
Decreased levels of circulating free thyroxin
and free triiodothyronine (fT4 and fT3)
stimulate the production of thyroid
stimulating hormone (TSH) in the pituitary
gland to restore sufficient thyroid hormone
production. An elevated serum TSH level is the
main and most sensitive laboratory
abnormality to occur in primary
hypothyroidism, followed by reductions in
serum levels of fT4 and fT3. Synthetic
levothyroxine is the treatment of choice for
primary hypothyroidism (Mandel, Brent, &
Larsen, 2016).
Primary hypothyroidism results from under
secretion of thyroid hormone and secondary
hypothyroidism is caused by lack of TSH
13th International Research Conference
General Sir John Kotelawala Defence University
Allied Health Sciences Sessions
258
production from the pituitary. The most
common cause for hypothyroidism in Sri
Lanka is autoimmune thyroid disease
(Hashimoto‟s thyroiditis). Clinical suspicion
of hypothyroidism, Strong family history of
hypothyroidism, Newborns of mothers with
thyroid diseases, Past history of neck
irradiation, Radioactive iodine or thyroid
surgery, patients on drugs such as lithium or
amiodarone, children with Down syndrome,
Patients with other autoimmune diseases
these are the indication for screening
hypothyroidism (Somasundaram,
Wijeyaratne, Fernando, & Siribaddana, 2012).
Thyroxin is stable in dry air, but unstable in
the presence of light, heat and humidity. In
some cases overseas, thyroxin tablets have
been unstable even at room temperature, and
storage temperatures of 8°C to 15°C were
necessary to maintain potency. Therefore very
essential that thyroxin tablets should be kept
in their original container and stored out of
sunlight in a cool dry place (Roberts,
Pharmacist, Hospital, & Park, 2004).
Thyroxin is variably absorbed from the gut
following oral administration. It has a
bioavailability of 40–80%. Absorption may
decrease with age. The extent of thyroxin
absorption is increased in the fasting state and
is influenced by the content of the
gastrointestinal tract. Some substances bind
the thyroxin, making it unavailable for
diffusion across the gut wall. Concurrent
administration with iron salts, antacids,
calcium carbonate (including milk), sucralfate,
cholestyramine and soy-based formulas may
therefore decrease absorption of thyroxin
(Roberts et al., 2004). For patients,
particularly children, who cannot swallow
tablets, the tablets may be crushed in 10–20
mL of water, breast milk or non-soybean
formula. The resulting mixture should be used
immediately and any remainder discarded.
Breast milk contains only 20–30% of the
calcium concentration of cow’s milk, making
the likelihood of decreased thyroxin
bioavailability less likely. Nonetheless, if
breast milk is used to deliver the thyroxin, it
should be used consistently, in order to
minimize any variation in absorption (Roberts
et al., 2004).
Methodology
It was a hospital based descriptive cross-
sectional study conducted in Endocrinology
clinic at Teaching Hospital Jaffna among the
primary hypothyroidism patients from August
2018 to July 2019 with sample size of 380.
Researcher visited on that clinic days and take
whole population for the data collection. Total
305 participants data was collected in 25
clinics by used interviewer administered
questionnaire. The questionnaire was
designed as section A and B. Section A
included socio demographic factors of study
participants include age, gender, civil status,
educational level, employment, working hours
and distance. Section B contain questions to
assess the knowledge of patient regarding
name of the medicine, dosage, frequency, time,
storage, side effects, interaction, overdose and
consultation of medicine usage. Each correct
answer carried one marks and total maximum
obtained score was fourteen marks then it
converted into percentage. The scoring of
knowledge was categorized into two
categories which were poor (less than 75%)
and good (more than 75%). The collected data
was analysed by SPSS 25 (statistical Package
for Social Sciences). Data was calculated as
mean, standard deviation, percentage, average
and the result was presented as table and
diagram. Chi square statistical test was
performed to find out relationship.
Results and discussion
In this study mean age of participants was
37.45 (SD=14.59). Age range of the
participants was 9 to 68 years old. More than
half of them (64.3%) were greater than 30
years old. Most of the participants (88.5%)
were female. Most of the participants is
Married (70.8%), 39.7% were studied up to
13th International Research Conference
General Sir John Kotelawala Defence University
Allied Health Sciences Sessions
259
O/L and 0.7% were not get any education.
Most of the participants (84.3%) were not
working. Among the Employees, 81.3% were
working for 6-10 hours. Majority (90.5%) of
the participants were coming to clinic with in
25km of distance. A study done in India by
Sethi et al., revealed that mean age of
respondents was 43.0 (±13.6) years and
72.4% were women. Most participants were
undergraduates (44.2%) and graduates
(39.6%) (Sethi et al., 2016). In this present
study, mean age was less, female participants
were high and only 3.6% were graduates.
Among them 94.1% knew the name of the
drug and correctly name it. 90.8% knew their
dosage of the drug. Only 43.5% of the
participants were using 75-100 µg, 35.9% was
using 25-50 µg. A study was done in UK by
Dew et al in 2017 revealed that only 7.4%
were using 25-50 µg at the same time 33.3%
were using 75-100 µg (Dew et al., 2017). In
this present study both frequencies was
increased because of high number of
participants and geographical variations.
Thyroxine is the treatment of choice for
hypothyroidism. It has a seven day half-life,
allowing daily dosing (Chakera et al., 2011).
Most of the participants (97.7%) knew
thyroxin should be taken as once daily.
Hypothyroid patients are advised to take
thyroxine on an empty stomach half an hour
before breakfast to prevent impairment of
absorption by food (Chakera et al., 2011). Most
of the participants (94.1%) knew that thyroxin
should take in early morning at empty
stomach and 1.0% told that it can be taken
after dinner. A small nonrandomized study
involving eleven hypothyroid patients on a
stable dose of morning thyroxine found a
decrease in mean TSH and an increase in free
thyroid hormone levels when the timing of
levothyroxine dosage was changed to bedtime
(Chakera et al., 2011).
Most of the participants (62.0%) knew that
thyroxin should store in brown color container
and 14.8% were told in brown color blister pack.
Nearly 17.4% were told that it should be store in
plastic bottle and only 5.2% were told in paper
covering. It may be due to insufficient knowledge
among the participants. It can be corrected by
giving proper storage methods by pharmacists
when they give to the thyroxin medicine. Most of
the participants (83.0%) were known that
thyroxin should store away from the light. More
than half of the participants (53.8%) were known
thyroxin dosage may vary with age, weight and
other medical condition. A randomized
controlled trial has shown that, in patients with no
significant comorbidities, initiation of
levothyroxine at a full dose based on body weight
(1.6 µg/kg/day) is safe and effective (Chakera et
al., 2011). It is important to know about thyroxin
dosage vary with medical condition because
people have more attention to take care in their
health in special situations. But in this present
study nearly 46.2% were giving wrong answer.
Most of the participants (79.7%) knew that
thyroxin should not be taken with any other
drugs. When the patients had good knowledge
about drug interaction only they can get good
compliance.
Only 19.0% were known that thyroxin can cause
side effects, but Most of the participants (74.8%)
told thyroxin not cause any side effects. Health
education and posters can be provide in clinic
setup can correct the knowledge about side
effects. Most of the participants (83.6%) were
known that discontinuation must done after
consulting with doctor. However some
participants told that discontinuation can be done
without consulting doctor once the symptoms
were settled. Majority (73.1%) were known that
it is important to tell the pharmacist/ doctor
regarding thyroxin usage when taking medicine
for other medical conditions.
Only 40.0% was knew that consult the doctor
when notice any side effects following ingestion
of thyroxin, at the same time 48.9% were told that
it is not important to consult the doctor. Nearly
46.2% were told consult the doctor if take
overdose of thyroxin. Only 19.0% was knew that
should consult the doctor if missed tablet more
than 3 days and more than half of the participants
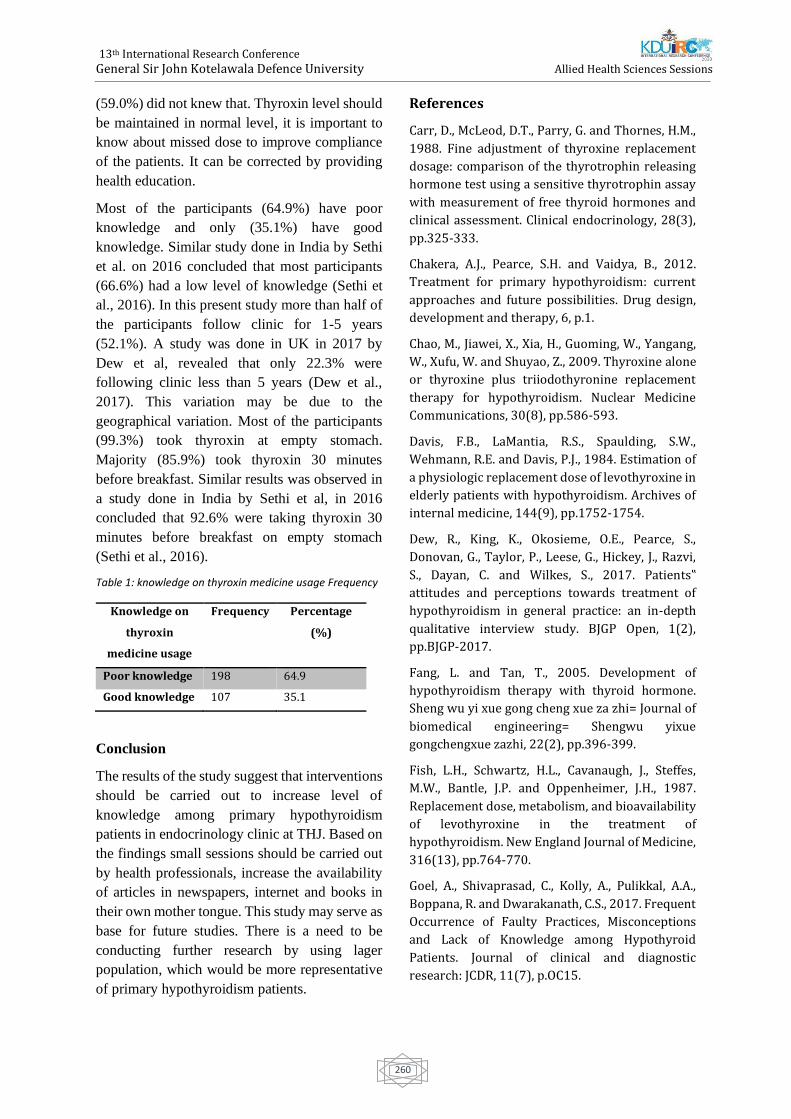
13th International Research Conference
General Sir John Kotelawala Defence University
Allied Health Sciences Sessions
260
(59.0%) did not knew that. Thyroxin level should
be maintained in normal level, it is important to
know about missed dose to improve compliance
of the patients. It can be corrected by providing
health education.
Most of the participants (64.9%) have poor
knowledge and only (35.1%) have good
knowledge. Similar study done in India by Sethi
et al. on 2016 concluded that most participants
(66.6%) had a low level of knowledge (Sethi et
al., 2016). In this present study more than half of
the participants follow clinic for 1-5 years
(52.1%). A study was done in UK in 2017 by
Dew et al, revealed that only 22.3% were
following clinic less than 5 years (Dew et al.,
2017). This variation may be due to the
geographical variation. Most of the participants
(99.3%) took thyroxin at empty stomach.
Majority (85.9%) took thyroxin 30 minutes
before breakfast. Similar results was observed in
a study done in India by Sethi et al, in 2016
concluded that 92.6% were taking thyroxin 30
minutes before breakfast on empty stomach
(Sethi et al., 2016).
Table 1: knowledge on thyroxin medicine usage Frequency
Knowledge on
thyroxin
medicine usage
Frequency Percentage
(%)
Poor knowledge 198 64.9
Good knowledge 107 35.1
Conclusion
The results of the study suggest that interventions
should be carried out to increase level of
knowledge among primary hypothyroidism
patients in endocrinology clinic at THJ. Based on
the findings small sessions should be carried out
by health professionals, increase the availability
of articles in newspapers, internet and books in
their own mother tongue. This study may serve as
base for future studies. There is a need to be
conducting further research by using lager
population, which would be more representative
of primary hypothyroidism patients.
References
Carr, D., McLeod, D.T., Parry, G. and Thornes, H.M.,
1988. Fine adjustment of thyroxine replacement
dosage: comparison of the thyrotrophin releasing
hormone test using a sensitive thyrotrophin assay
with measurement of free thyroid hormones and
clinical assessment. Clinical endocrinology, 28(3),
pp.325-333.
Chakera, A.J., Pearce, S.H. and Vaidya, B., 2012.
Treatment for primary hypothyroidism: current
approaches and future possibilities. Drug design,
development and therapy, 6, p.1.
Chao, M., Jiawei, X., Xia, H., Guoming, W., Yangang,
W., Xufu, W. and Shuyao, Z., 2009. Thyroxine alone
or thyroxine plus triiodothyronine replacement
therapy for hypothyroidism. Nuclear Medicine
Communications, 30(8), pp.586-593.
Davis, F.B., LaMantia, R.S., Spaulding, S.W.,
Wehmann, R.E. and Davis, P.J., 1984. Estimation of
a physiologic replacement dose of levothyroxine in
elderly patients with hypothyroidism. Archives of
internal medicine, 144(9), pp.1752-1754.
Dew, R., King, K., Okosieme, O.E., Pearce, S.,
Donovan, G., Taylor, P., Leese, G., Hickey, J., Razvi,
S., Dayan, C. and Wilkes, S., 2017. Patients‟
attitudes and perceptions towards treatment of
hypothyroidism in general practice: an in-depth
qualitative interview study. BJGP Open, 1(2),
pp.BJGP-2017.
Fang, L. and Tan, T., 2005. Development of
hypothyroidism therapy with thyroid hormone.
Sheng wu yi xue gong cheng xue za zhi= Journal of
biomedical engineering= Shengwu yixue
gongchengxue zazhi, 22(2), pp.396-399.
Fish, L.H., Schwartz, H.L., Cavanaugh, J., Steffes,
M.W., Bantle, J.P. and Oppenheimer, J.H., 1987.
Replacement dose, metabolism, and bioavailability
of levothyroxine in the treatment of
hypothyroidism. New England Journal of Medicine,
316(13), pp.764-770.
Goel, A., Shivaprasad, C., Kolly, A., Pulikkal, A.A.,
Boppana, R. and Dwarakanath, C.S., 2017. Frequent
Occurrence of Faulty Practices, Misconceptions
and Lack of Knowledge among Hypothyroid
Patients. Journal of clinical and diagnostic
research: JCDR, 11(7), p.OC15.
13th International Research Conference
General Sir John Kotelawala Defence University
Allied Health Sciences Sessions
261
HENNESSEY, J.V., EVAUL, J.E., TSENG, Y.C.,
BURMAN, K.D. and WARTOFSKY, L., 1986. L-
thyroxine dosage: a reevaluation of therapy with
contemporary preparations. Annals of internal
medicine, 105(1), pp.11-15.
Hueston, W.J., 2001. Treatment of hypothyroidism.
American family physician, 64(10), pp.1717-1724.
Kumar, P., Khandelwal, D., Mittal, S., Dutta, D., Kalra,
S., Katiyar, P. and Aggarwal, V., 2017. Knowledge,
awareness, practices and adherence to treatment
of patients with primary hypothyroidism in Delhi.
Indian journal of endocrinology and metabolism,
21(3), p.429.
Mandel, S.J., Brent, G.A. and Larsen, P.R., 1993.
Levothyroxine therapy in patients with thyroid
disease. Annals of Internal Medicine, 119(6),
pp.492-502.
Roberts, G.W., 2004. Taking care of thyroxine.
Australian Prescriber, 27(3), pp.75-6.
Rosenbaum, R.L. and Barzel, U.S., 1982.
Levothyroxine replacement dose for primary
hypothyroidism decreases with age. Annals of
internal medicine, 96(1), pp.53-55.
Rosenbaum, R.L. and Barzel, U.S., 1982.
Levothyroxine replacement dose for primary
hypothyroidism decreases with age. Annals of
internal medicine, 96(1), pp.53-55.
Saravanan, P., Chau, W.F., Roberts, N., Vedhara, K.,
Greenwood, R. and Dayan, C.M., 2002.
Psychological well‐being in patients on
„adequate‟doses of l‐thyroxine: results of a large,
controlled community‐based questionnaire study.
Clinical endocrinology, 57(5), pp.577-585.
Sawin, C.T., Surks, M.I., London, M., Ranganathan, C.
and LARSEN, P.R., 1984. Oral thyroxine: variation
in biologic action and tablet content. Annals of
internal medicine, 100(5), pp.641-645.
Sethi, B., Khandelwal, D. and Vyas, U., 2018. A cross-
sectional survey to assess knowledge, attitude, and
practices in patients with hypothyroidism in India.
Thyroid Research and Practice, 15(1), p.15.
Simonin, R., San, J.M., Heim, M. and Brindisi, G.,
1981. Treatment of primary hypothyroidism in
adults: dosage schedule and biological surveillance
(author's transl). La semaine des hopitaux:
organe fonde par l'Association d'enseignement
medical des hopitaux de Paris, 57(37-38), pp.1480-
1487.
Somasundaram, Dr. Henry Rajaratnam, Prof.
Chandrika Wijeyarathne, Prof.Shamya De Silva,
Prof. Channa Ratnathunga, Prof. Ranil Fernando,
Prof. Sisira Siribaddana, Dr. Prasad Katulanda, Dr.
Uditha Bulugahapitiya, Dr. Sajith Siyambalapitiya,
Dr. Charles Antonypillai, Dr. Manilka
Sumanathilake, Dr. Chaminda Garusinghe, Dr.
Dimuthu Muthukuda, Dr. M. W. S. Niranjala, Dr.
Muditha Weerakkody, Dr. Dharshini Karuppiah, Dr.
Sivatharshya Pathmanathan, Dr. Sachith
Abeyarathne, Dr. Shaminda Kahandawa, Dr.
Samanthi Cooray, Dr. Kavinga Gunawardena, Dr.
Nayananjani Karunasena., 2013. The Endocrine
Society of Sri Lanka‟s CLINICAL GUIDELINES
Thyroid Diseases.
Wenzel, K.W. and Kirschsieper, H.E., 1977. Aspects
of the absorption of oral L-thyroxine in normal
man. Metabolism-Clinical and Experimental, 26(1),
pp.1-8
13th International Research Conference
General Sir John Kotelawala Defence University
Allied Health Sciences Sessions
262
Paper ID: 221
Knowledge On Diet Among The Ischemic Heart Disease Patients
Attending Cardiology Clinic At Teaching Hospital Jaffna
#U Yanuthy, PAD Coonghe, M Guruparan and L Kamalarupan
Department of Nursing, Faculty of Allied Health Sciences, University of Jaffna
Department of Community and Family Medicine, Faculty of Medicine, University of Jaffna
Consultant Cardiologist, Teaching Hospital Jaffna
Abstract - Ischemic Heart Disease (IHD) is
major cause of death in worldwide. In Sri
Lanka, cardiovascular diseases cover 40% of
Non-communicable diseases. IHD was ranked
as leading cause for the hospital deaths since
year 2013 and 14.2% of total deaths in 2017.
Un-healthy dietary pattern is one of the
modifiable risk factor for IHD. The aim of the
study is to evaluate the knowledge on diet and
assess influence of sociodemographic factors
on knowledge. A descriptive cross sectional
study was conducted in 2019, used an
interviewer administered questionnaire
among 414 IHD patients. Data was analysed
using SPSS 25 and chi square test was
performed to find out the relationship.
Majority were male (70.3%), mean age was
66.2. Among them 68.4% were having
dyslipidemia. Nearly two third (67.6%) of the
participants knew that un-healthy dietary
pattern can cause IHD. Majority of them knew
that margarine (92.3%), fried foods (76.8%)
and fast foods (74.2%) can increase blood
cholesterol level. However, majority of them
didn’t aware that Olive oil (78.5%) and Oats
(59.7%) are good to consume and white bread
(56%) is bad. Majority of them aware that
vegetables (72%), fruits (52.2%) and legumes
(51.7%) were good to take in high amount,
however 64.3% of them didn’t know cereal
also good to take. Only 28.3% had good
knowledge on diet. Family history and highest
educational level (p<0.05) showed significant
relationship with knowledge. Conducting
nutritional awareness programme for IHD
may help to increase the level of knowledge.
Keywords: Knowledge, Diet, Ischemic Heart
disease, Teaching Hospital Jaffna
Introduction
Cardio vascular diseases take the lives of 17.9
million people every year, 31% of all global
deaths. Ischemic Heart Disease (IHD) is the
single largest cause of death worldwide.
Highest IHD mortality rates are in Eastern
Europe and central Asian countries. Greater
than 85% of heart diseases occur in low and
middle income countries (WHO 2018).
In Sri Lanka Cardiovascular diseases are
responsible for 40% of those NCDs (Annual
Health Bulletin 2017). Out of these
cardiovascular diseases, Ischemic Heart
Disease (IHD) has been ranked as the first
leading cause for hospital deaths. It is
responsible for 14.2% of total deaths in 2017.
The rank as first in hospital deaths remain
from year 2013. Specific death rates due to
IHD are high among in the males and age
between 50-69 years in 2017. Total hospital
discharges in Sri Lanka due to IHD represents
56% of male and 44% of female (Annual
Health Statistic 2017).
Ischemic Heart Disease (IHD) is caused by the
narrowing or blockage of the arteries and
vessels that provide oxygen and nutrients to
the heart. Manifestations of IHD are Stable /
unstable angina, Myocardial infarction,
13th International Research Conference
General Sir John Kotelawala Defence University
Allied Health Sciences Sessions
263
Sudden death, Heart failure (Nutrition
Division 2014).
The risk factor for IHD includes unhealthy diet,
tobacco smoking, and lack of physical activity
and harmful use of alcohol. Co-morbid risk
factors are high blood cholesterol and
Triglyceride levels, high blood pressure,
diabetes mellitus, overweight and obesity.
Other risk factors include poverty and low
educational status, advancing age, gender and
psychological factors (global atlas 2011).
According to these risk factors unhealthy diet,
tobacco smoking, lack of physical activity and
harmful use of alcohol are major risk factors
that can be prevented. Life style modification
and behavioral changes will help to slow the
progression of disease condition. Healthy diet
pattern can be easily followed by anyone with
proper medication compliance. It will improve
life expectancy and provide good outcome of
the disease condition.
Methodology
It was an institutional based descriptive cross
sectional study was conducted from August
2018 to July 2019. Around six hundred and
fifty patients were attending Cardiology clinic
per month for Ischemic Heart Disease at
Teaching Hospital Jaffna. Patient’s age was
greater than 18 years old, Patients who
attending Cardiology clinic more than 6
months are included for this study. Actual
sample size was 414. Systematic random
sampling was used to collect data. IHD
patients were identified among Cardiology
clinic patients and name list was prepared
with clinical number. An interviewer
administered semi structured questionnaire
was used to collect data. Study instrument was
designed with section I for socio demographic
data. Section II for knowledge on diet.
Interviewer administered questionnaire was
conducted during the waiting time for the
physician and medical clinic pharmacy with
help of batch mates. Data was analysed by
using SPSS 25 statistical software. Each
correct response was scored with one mark
while incorrect or don’t know response were
received zero mark. Predetermined cut off
was used to assess the knowledge level. The
score less than fifty was considered as poor
knowledge, fifty to seventy five considered as
average knowledge and the score above
seventy five was considered as good
knowledge. Chi square statistical test was
used to identify the factors influence on
knowledge.
Results and discussion
Mean age of participants was 66.16 years. Age
range of the participants was 36 to 86 years
old; more than half of them (56%) were
greater than 65 years old. Majority (70.3%)
were male. According to the literatures male
was the highly affected by IHD than females.
Females have hormonal protective effect until
their menopause than males. Around 70%
were married, majority were Sri Lankan Tamil
(98.6%) and Hindus (86%). Grade 6-10 was
the highest level of education for nearly one
third of the participants (31.9%). More than
half of them were employed (56.3%). Most of
the participants (44.9%) were earning Sri
Lankan Rupees greater than 10000 for a
month. Nearly three fourth of the participants
(77.5%) were had no family history of IHD.
Most of the participants (37.2%) were living
with their wife/husband and children.
Most of them (72.7%) were following clinic for
1-10 years of duration. Nearly 35% of the
participants were added as new admission
within one year. Nearly 18.6% were not
having co-morbidities while 1.4% having all
four co-morbid diseases and nearly one third
(35.7%) were having any two comorbid
disease condition. Dyslipidemia (68.4%) was
found as the most common comorbid disease
condition among the participants. Others were
having Hypertension (43.5%) and Diabetes
(39.6%). A study was done in Bangladesh
among cardiovascular disease participants
nearly 29.3% were having Diabetes and
13th International Research Conference
General Sir John Kotelawala Defence University
Allied Health Sciences Sessions
264
Hypertension were 32.4% of the participants
who were in the age between 41-60 years
(Abu-Sayeef et al., 2013). According to the
annual health statistics of Sri Lanka
mentioned that the most affected age group
with diabetes and hypertension were 50-69
years. Nearly 98% of the present study
participants were above the age of 50 years.
Therefore the co-morbidity in the participants
was higher than Bangladesh study. More than
half of the participants (56.5%) got
information regarding diet from Consultant
Cardiologist and 35% of the participants were
getting information from general practitioner.
Participants who were getting information
from books (6.3%) and newspaper (18.6%)
were very low. It may be non-availability of
articles in books or newspaper in their mother
tongue. Only 5.3% were getting information
from awareness program. More than half of
the participants (67.6%) gave correct answer
as unhealthy dietary pattern can cause IHD
while 22.0% participants were giving wrong
answer as unhealthy diet pattern not cause
IHD. Nearly three fourth of the participants
(79%) knew that diet influence on blood
cholesterol level.
The unhealthy food habit is another
influencing factor on the causation of IHD
among the participants. It increases the risk of
IHD even when they are on treatment. A study
was done by Sivajeneni et al, at cardiology
clinic at THJ in 2014; concluded that 69% of
participants followed an unhealthy dietary
habit (Sivajeneni et al., 2014). Another study
was done in 2013 in Bangladesh found that
47% were believed unhealthy diet did not
cause IHD (Abu-Sayeef et al., 2013). However
in the present study, majority were known
unhealthy diet can cause IHD. Majority of the
participants (84.8%) knew that repeatedly
heating oil for frying was not good for patients
with IHD. Repeatedly heating oil can generate
Trans fatty acid, it should be limited in
patients with IHD. Only 8.2% of the
participants did not know about repeatedly
heating oil.
Majority of the participants knew that
margarine (92.3%), butter (93.4%), cheese
(92.3%), egg yolk (76.6%), shell fish (71.5%),
fried foods (76.8%) and fast foods (74.2%) can
increase blood cholesterol level. A study was
done in 2013 in Bangladesh, 78% of
participants avoid fatty foods that can prevent
IHD (Abu-Sayeef et al., 2013). Another study
was conducted in 1993 in England by Arthur V
et al. found that 38.9% of participants knew
margarines and butter can increase blood
cholesterol level (Arthur V et al., 1993). In the
present study most of the participants knew
that. At the same time participants knew fatty
fish (85%), garlic (78.7%) and spinach
(78.5%) were not increase the blood
cholesterol level. Garlic has been qualified
with favorable cardiovascular effects. Most of
the participants didn’t know about almonds
(75.6%). Most of the participants knew red
rice (94.9%), parboiled rice (86%), whole
wheat flour (64.5%), kurakkan (85.5%) and
millet (83.6%) can be taken by IHD patients.
Majority (74.4%) were known to limit white
rice. More than half of the participants didn’t
know about white bread (56%) and Oats
(59.7%).
More than half of the participants (59.7%)
knew that sunflower oil can use in cooking.
About 66.2% of participants responded as
coconut was not used in cooking. Even though,
coconut oil was rich in saturated fatty acids in
comparison with sunflower oil (Maniyal et al.,
2016). Pehowich stated that coconut oil is
good for the heart because it has median chain
fatty acids, which increases the High Density
Lipoprotein (Pehowich, Gomes & Barnes,
2000). About 45.2% of the participants didn’t
know about vegetable oil. Most of the
participants (82.4%) knew Gingelly oil can
use. more than three fourth of participants
(78.5%) didnt know about Olive oil.Majority of
the participants knew that vegetables (72%),
fruits (52.2%) and legumes (51.7%) were
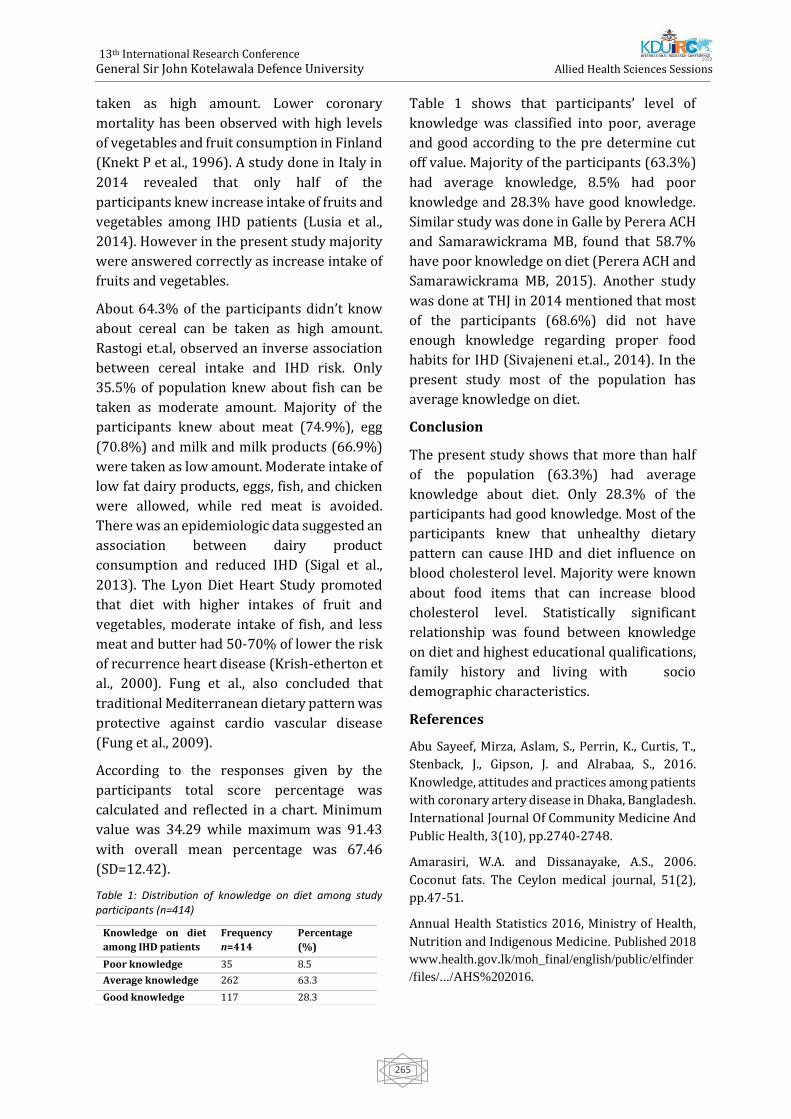
13th International Research Conference
General Sir John Kotelawala Defence University
Allied Health Sciences Sessions
265
taken as high amount. Lower coronary
mortality has been observed with high levels
of vegetables and fruit consumption in Finland
(Knekt P et al., 1996). A study done in Italy in
2014 revealed that only half of the
participants knew increase intake of fruits and
vegetables among IHD patients (Lusia et al.,
2014). However in the present study majority
were answered correctly as increase intake of
fruits and vegetables.
About 64.3% of the participants didn’t know
about cereal can be taken as high amount.
Rastogi et.al, observed an inverse association
between cereal intake and IHD risk. Only
35.5% of population knew about fish can be
taken as moderate amount. Majority of the
participants knew about meat (74.9%), egg
(70.8%) and milk and milk products (66.9%)
were taken as low amount. Moderate intake of
low fat dairy products, eggs, fish, and chicken
were allowed, while red meat is avoided.
There was an epidemiologic data suggested an
association between dairy product
consumption and reduced IHD (Sigal et al.,
2013). The Lyon Diet Heart Study promoted
that diet with higher intakes of fruit and
vegetables, moderate intake of fish, and less
meat and butter had 50-70% of lower the risk
of recurrence heart disease (Krish-etherton et
al., 2000). Fung et al., also concluded that
traditional Mediterranean dietary pattern was
protective against cardio vascular disease
(Fung et al., 2009).
According to the responses given by the
participants total score percentage was
calculated and reflected in a chart. Minimum
value was 34.29 while maximum was 91.43
with overall mean percentage was 67.46
(SD=12.42).
Table 1: Distribution of knowledge on diet among study participants (n=414)
Table 1 shows that participants’ level of
knowledge was classified into poor, average
and good according to the pre determine cut
off value. Majority of the participants (63.3%)
had average knowledge, 8.5% had poor
knowledge and 28.3% have good knowledge.
Similar study was done in Galle by Perera ACH
and Samarawickrama MB, found that 58.7%
have poor knowledge on diet (Perera ACH and
Samarawickrama MB, 2015). Another study
was done at THJ in 2014 mentioned that most
of the participants (68.6%) did not have
enough knowledge regarding proper food
habits for IHD (Sivajeneni et.al., 2014). In the
present study most of the population has
average knowledge on diet.
Conclusion
The present study shows that more than half
of the population (63.3%) had average
knowledge about diet. Only 28.3% of the
participants had good knowledge. Most of the
participants knew that unhealthy dietary
pattern can cause IHD and diet influence on
blood cholesterol level. Majority were known
about food items that can increase blood
cholesterol level. Statistically significant
relationship was found between knowledge
on diet and highest educational qualifications,
family history and living with socio
demographic characteristics.
References
Abu Sayeef, Mirza, Aslam, S., Perrin, K., Curtis, T.,
Stenback, J., Gipson, J. and Alrabaa, S., 2016.
Knowledge, attitudes and practices among patients
with coronary artery disease in Dhaka, Bangladesh.
International Journal Of Community Medicine And
Public Health, 3(10), pp.2740-2748.
Amarasiri, W.A. and Dissanayake, A.S., 2006.
Coconut fats. The Ceylon medical journal, 51(2),
pp.47-51.
Annual Health Statistics 2016, Ministry of Health,
Nutrition and Indigenous Medicine. Published 2018
www.health.gov.lk/moh_final/english/public/elfinder
/files/.../AHS%202016.
Knowledge on diet
among IHD patients
Frequency
n=414
Percentage
(%)
Poor knowledge 35 8.5
Average knowledge 262 63.3
Good knowledge 117 28.3
13th International Research Conference
General Sir John Kotelawala Defence University
Allied Health Sciences Sessions
266
Arthur.V, Plous, S., Chesne, R.B. and McDOWELL
III,., 1995. Nutrition knowledge and attitudes of
cardiac patients. Journal of the American Dietetic
Association, 95(4), pp.442-446.
Ascherio, A., Rimm, E.B., Giovannucci, E.L.,
Spiegelman, D., Meir, S. and Willett, W.C., 1996.
Dietary fat and risk of coronary heart disease in
men: cohort follow up study in the United States.
Bmj, 313(7049), pp.84-90.
Bazzano, L.A., He, J., Ogden, L.G., Loria, C.M.,
Vupputuri, S., Myers, L. and Whelton, P.K., 2002.
Fruit and vegetable intake and risk of
cardiovascular disease in US adults: the first
National Health and Nutrition Examination Survey
Epidemiologic Follow-up Study. The American
journal of clinical nutrition, 76(1), pp.93-99.
Borgermans, L., Buchan, J., Gibson, L.C., Myrup, A.C.,
De Maeseneer, J., Farrington, J., Figueras, J., Galea,
G., Hunter, D., Jakab, M. and Jakubowski, E., 2018.
Senior editorial team. eurohealth, 24(1).
Boutayeb, A., 2006. The double burden of
communicable and non-communicable diseases in
developing countries. Transactions of the Royal
society of Tropical Medicine and Hygiene, 100(3),
pp.191-199.
Eilat-Adar, S., Sinai, T., Yosefy, C. and Henkin, Y.,
2013. Nutritional recommendations for
cardiovascular disease prevention. Nutrients, 5(9),
pp.3646-3683.
Emad Ahmed, Moussa Youssif, Ibrahim Ayasreh,
Nabeel Al-Mawajdeh. 2012. Assess the risk factors
and knowledge on modification of lifestyle among
patients who have experienced acute myocardial
infarction in taif.
Health, N. a. (2014). Annual Health Bulletin.
Colombo: Ministry of Health, Nutrition and
Indegenous medicine.
Jakobsen, M.U., O’Reilly, E.J., Heitmann, B.L.,
Pereira, M.A., Bälter, K., Fraser, G.E., Goldbourt, U.,
Hallmans, G., Knekt, P., Liu, S. and Pietinen, P., 2009.
Major types of dietary fat and risk of coronary
heart disease: a pooled analysis of 11 cohort
studies–. The American journal of clinical
nutrition, 89(5), pp.1425-1432.
Kemppainen, K., 2016. Key factors to successful
adherence to dietary modifications for patients
with coronary heart disease: a literature review.
Kris-Etherton, P., Eckel, R.H., Howard, B.V., St. Jeor,
S. and Bazzarre, T.L., 2001. Lyon diet heart study:
benefits of a Mediterranean-Style, National
Cholesterol Education Program/American Heart
Association Step I dietary pattern on
cardiovascular disease. Circulation, 103(13),
pp.1823-1825.
Lichtenstein, A.H., Appel, L.J., Brands, M.,
Carnethon, M., Daniels, S., Franch, H.A., Franklin, B.,
Kris-Etherton, P., Harris, W.S., Howard, B. and
Karanja, N., 2006. Diet and lifestyle
recommendations revision 2006: a scientific
statement from the American Heart Association
Nutrition Committee. Circulation, 114(1), pp.82-
96.
Marckmann, P. and Grønbæk, M., 1999. Fish
consumption and coronary heart disease mortality.
A systematic review of prospective cohort studies.
European journal of clinical nutrition, 53(8), p.585.
Mente, A., de Koning, L., Shannon, H.S. and Anand,
S.S., 2009. A systematic review of the evidence
supporting a causal link between dietary factors
and coronary heart disease. Archives of internal
medicine, 169(7), pp.659-669.
Nutrition Division - Ministry of Health. Dietary
guidelines and nutritional therapy for specific
diseases srilanka., 2014.
Ostrander, L.D., Lamphiear, D.E., Carman, W.J. and
Williams, G.W., 1981. Blood glucose and risk of
coronary heart disease. Arteriosclerosis,
Thrombosis, and Vascular Biology, 1(1), pp.33-37.
Perera ACH, Samarawickrama MB. 2015.
Knowledge, Attitude and Practices of Dietary
Management Among Ischaemic Heart Disease
Patients Treated at Teaching Hospital Karapitiya,
Galle, Sri Lanka. IOSR Journal Of Pharmacy, Volume
7, Issue 1 Version. 2. pp. 58-65.
Qidwai, W. and Ashfaq, T., 2013. Role of garlic
usage in cardiovascular disease prevention: an
evidence-based approach. Evidence-Based
Complementary and Alternative Medicine, 2013.
Rattan Kaur Chawla, Niamatullah1 and
Muhammad Arif., 2013. Nutritional status
assessment and dietary intake of the
cardiovascular disease patients. ARPN Journal of
Agricultural and Biological Science, vol. 8, no. 2.
13th International Research Conference
General Sir John Kotelawala Defence University
Allied Health Sciences Sessions
267
Shekelle, R.B., Shryock, A.M., Paul, O., Lepper, M.,
Stamler, J., Liu, S. and Raynor Jr, W.J., 1981. Diet,
serum cholesterol, and death from coronary heart
disease: the Western Electric Study. New England
Journal of Medicine, 304(2), pp.65-70.
Sivajenani, S., Kuillini, S. and Madona, E., 2015.
Lifestyle factors influencing coronary heart
disease.
Tanuja Rastogi, K Srinath Reddy, Mario Vaz, Donna
Spiegelman, D Prabhakaran, Walter C Willett, Meir
J Stampfer, Alberto Ascherio; Diet and risk of
ischemic heart disease in India, The American
Journal of Clinical Nutrition, Volume 79, Issue 4, 1
April 2004, Pages 582–592.
Tedesco, L.M.R., Di Giuseppe, G., Napolitano, F. and
Angelillo, I.F., 2015. Cardiovascular diseases and
women: knowledge, attitudes, and behavior in the
general population in Italy. BioMed research
international, 2015.
van den Hoogen, P.C., Feskens, E.J., Nagelkerke, N.J.,
Menotti, A., Nissinen, A. and Kromhout, D., 2000.
The relation between blood pressure and mortality
due to coronary heart disease among men in
different parts of the world. New England Journal of
Medicine, 342(1), pp.1-8.
Vijayakumar, M., Vasudevan, D.M., Sundaram, K.R.,
Krishnan, S., Vaidyanathan, K., Nandakumar, S.,
Chandrasekhar, R. and Mathew, N., 2016. A
randomized study of coconut oil versus sunflower
oil on cardiovascular risk factors in patients with
stable coronary heart disease. Indian heart journal,
68(4), pp.498-506
13th International Research Conference
General Sir John Kotelawala Defence University
Allied Health Sciences Sessions
268
Paper ID: 224
Assessment of the Awareness in Management of Chemotherapy
Related Adverse Effects Experienced by Cancer Patients at Apeksha
Hospital, Maharagama, Sri Lanka
#JMAD Jayalath, GNDDZ Wikramarathne, DMNPK Doranegoda, NA Sanjeewani, MA
Siriwardhene and KASJ Balawardhene
Department of Pharmacy, Faculty of Allied Health sciences, General Sir John Kotelawala Defence University,
Sri Lanka.
Department of Pharmacy and Pharmaceutical Sciences, Faculty of Allied Health Sciences, University of Sri
Jayewardenapura, Sri Lanka
Faculty of Medicine, General Sir John Kotelawala Defence University, Sri Lanka.
Abstract: Cancer accounts for majority of the
disease related deaths all over the world.
Although cancer can be treated with
chemotherapy successfully, the burden of
chemotherapy related side effects makes a
negative impact about the treatment in
patients. The study was carried out in the
purpose of assessment of awareness in
management of chemotherapy related
adverse effects experienced by the cancer
patients at Apeksha Hospital, Maharagama, Sri
Lanka. Moreover, it focused on the patients’
knowledge on the disease and the treatment
schedule and the most frequently experienced
side effects by the patients. This is a single
centre descriptive cross-sectional study. The
study population of 155 cancer patients with
multiple carcinomas, attending medical
oncology clinics at Apeksha Hospital was
selected randomly. An interviewer
administered questionnaire was used to
gather information. Collected data was
analysed by SPSS Version 23 software. The
diagnosis of the disease was known by almost
all the participants. The names of the
chemotherapy medicines receiving were fully
known by only one fifth of the total population.
Most commonly experienced adverse effect
among the population was fatigue. Drinking
adequate amount of fluid had been the most
frequently followed instruction in order to
minimize the adverse effects. Discussions with
healthcare professionals were chosen as the
most effective way of having information.
Discomfort due to chemotherapy related
adverse effects may cause delay or early
termination of treatments and increase
unnecessary hospital admissions. A thorough
counselling in managing the adverse effects
accounts a better quality of life to the patient.
Keywords: Cancer, Chemotherapy, Side
effects
Introduction
The occurrence of caner has been notable in
recent times. Though chemotherapy treats
cancer specifically, patients experience
adverse effects during active treatment,
immediate after treatment or later. Due to
inappropriate management of adverse effects
their treatments may be delayed or
terminated earlier. Patients undergoing
chemotherapy treatments often receive
information about common adverse effects
related to chemotherapy from their health
care professionals in Si Lanka. Though they
receive relevant and adequate information,
the patients are still conversant in
management of chemotherapy related
adverse effects. The study was carried out in
the purpose of assessment of awareness in
management of chemotherapy related
adverse effects experienced by the cancer
patients at Apeksha Hospital, Maharagama, Sri
Lanka. Moreover, it focused on the most
common cancer type, the patients’ knowledge
13th International Research Conference
General Sir John Kotelawala Defence University
Allied Health Sciences Sessions
269
on the disease and the treatment schedule, the
most common side effects experienced by the
patients and informational need of the
patients in minimizing adverse effects.
Methodology
This is a single centre descriptive cross-
sectional study. The study population was 155
cancer patients with multiple carcinomas,
attending medical oncology clinics at Apeksha
Hospital, Maharagama, Sri Lanka. Every 5th
patient who fulfilled inclusion criteria was
included to the study and all the patients were
notified that inclusion for this survey is
entirely voluntary. The privacy and
confidentiality of all participants were
protected throughout the study. An
interviewer administered questionnaire was
used to gather information. Collected data was
analysed by SPSS Version 23 software. Data
processing was done by categorizing data,
coding, summarizing and verification by
computer. Production and interpretation of
frequencies, tables and graphs were used to
describe the findings.
Results and Discussion
Of 155 participants majority were females.
Nearly half of the participants belonged to the
age group of 53-70 years. Among the total
population, most of them had studied up to
A/L and were non-occupied. Results of the
study revealed, the most common cancer
types of females were breast, womb colo-
rectal, ovarian, and cervical cancers, while
blood, neck, colo-rectal and lung cancers were
common in males. The diagnosis of the disease
was known by almost all the participants and
the stage of cancer and treatment schedule
was known by majority (90.1%) of the
participants. It seemed that most of the
patients dedicated to have their treatment
cycles regularly. Names of the chemotherapy
medicines receiving were fully known by only
one fifth of the total population. This may be
due to patient’s unfamiliarity with the names
of chemotherapy agents, the difficulty in
pronouncing and remembering them. Most
commonly experienced side effect among the
population was fatigue (71%). Alopecia,
nausea and vomiting were also reported by
more than half of the total population.
Reduction in White Blood Cells, constipation,
stomatitis, fever, skin problems, dysuria were
among the significantly occurring side effects
experienced by the patients. Gum bleeding,
back pain, breathing difficulties, weakness in
teeth, burning sensation, delay menstruation,
discoloration of skin, discoloration of nails,
dry skin, headache, leg pain, sleeplessness had
been reported by less than 10% of
participants in each. Of respondents, majority
(85.2%) knew that drinking adequate amount
of fluid can remove harmful agents from the
body. About 70% respondents knew that
having more fresh vegetables and fruits gain
more benefits while having chemotherapy.
More than half of respondents had known to
have frequent small meals to avoid emesis as
well as to increase appetite. To prevent
acquiring of infections, more than 60% of
respondents were aware to avoid public
places after having chemotherapy treatments.
Nearly half of respondents knew that wearing
a mask was essential to prevent inhalation of
harmful agents in order to prevent from
infections. About 20% of participants knew
that dry skin conditions can be managed by
applying moisturizing creams. Among
participants 17.4% of respondents were
knowledgeable to avoid constipation
conditions by eating high fiber foods with
adequate fluid, however 20.6% participants
were used to treat constipation when it
became unmanageable. Patients had a
satisfactory knowledge and adherence
regarding management of more frequently
experienced side effects such as nausea,
vomiting, anorexia, constipation, skin
problems and in taking precautionary actions
to avoid secondary side effects such as
infections which occur as a result of immunity
suppression in chemotherapy. Adverse effects
management methods were followed only for
13th International Research Conference
General Sir John Kotelawala Defence University
Allied Health Sciences Sessions
270
a limited number of side effects by the patients
including methods to relieve nausea, vomiting,
diarrhoea and protection from infections.
Although the most common side effect was
fatigue, none of the respondents had followed
any management method to minimize it. It
was observed that, there is a gap between
patients’ actual need and information
provided by the health care professionals.
Conclusion
Due to inappropriate management of adverse
effects, patients’ treatments may be delayed or
terminated earlier which may increase
morbidity and mortality, increase
unnecessary hospital admissions and
decrease cure rate. As discomforts due to
chemotherapy related side effects negatively
influence the cancer patients, they demanded
more information on side effects and
management methods to cope with the side
effects successfully. As participants perceived
more information, it is suggested to arrange
more interactive counselling sessions for
patients by healthcare professionals. A
thorough counselling in management
methods of the side effects may account a
better quality of life to the cancer patient.
References
Choenyi, M N, Kumari, M, Choedon, M S, Kumari, M,
Kumari, S, Kumari, I, Charan, S M and Bala, M K
(2016): Knowledge Regarding Ill Effects of
Chemotherapy and Its Home Management among
Patients Receiving Chemotherapy, IOSR Journal of
Nursing and Health Science 5 (3), pp 25–29.
Katabalo, D M, Matinde, R, Mwita, S, Marwa, K and
Masalu, N (2018): Awareness of Chemotherapy
Side Effects and Attitude Towards Chemotherapy
Use Among Cancer Patients Attending Oncology
Clinic At Bugando Medical Centre, in Mwanza,
Northern Tanzania, Journal of Drug Delivery and
Therapeutics 8 (5), pp 448–454.
Ministry of Health, Nutrition and Indigenous
Medicine, Sri Lanka (2012): Health Statistics,
Apeksha Hospital,Maharagama, pp 10-15.
World Health Organization (2018): Latest global
cancer data, available from
http://www.who.int/cancer/PRGlobocanFinal.pdf[Ac
cessed on 08.06.2020]
13th International Research Conference
General Sir John Kotelawala Defence University
Allied Health Sciences Sessions
271
Paper ID: 225
Association of socio demographic and educational factors on
knowledge and attitudes on the role of community pharmacist in
healthcare system among the science students of University of Jaffna
T Thilaxy, N Clindon, #S Thuvaragan and R Surenthirakumaran
Department of Pharmacy, Faculty of Allied Health Sciences, University of Jaffna
Department of Community and Family Medicine, Faculty of Medicine, University of Jaffna
Abstract – Community pharmacists are
expanding their services from dispensing
practice to various health services to the
public. Understanding their role in
healthcare system is essential to get their
satisfactory services. Study was conducted
among university students since they are
involving in community education and they
have leading role in disseminating
knowledge to other people-. The objective of
the study was to assess the knowledge and
attitudes towards the role of community
pharmacist among the science students of
University of Jaffna and influence of socio
demographic and educational factors. It was
an institutional based descriptive cross-
sectional study. A self- administered,
pretested and validated questionnaire was
used to collect the data. SPSS version 23
statistical software was used to analyse the
data. Descriptive statistics was used to
describe the data and Chi Squared test was
performed to determine the level of
association. Among the total of 701
participants, 563 participants were
responded with the respondent rate of 80.3
%. The mean age of participants was
24.61±0.9 years and 53.8 % (n=303) of
participants were males. Of 40.3% (n=227)
participants had good knowledge and 42.3%
(n=238) of participants had positive
attitudes. Age (p=0.004), gender (p=0.036),
place of resident (p=0.012) and course of
study (p=0.000) had statistically significant
association with knowledge. The course of
study (p=0.003) had statistically significant
association with attitudes. Study revealed
that more than half of the participants had
poor knowledge and negative attitudes
towards roles of community pharmacist.
Awareness programmes should be
conducted regarding role of community
pharmacists on health care system.
Keywords: community pharmacist,
Knowledge, attitudes, health care system
Introduction
Pharmacy services throughout the world
play a broad range of activities in provision
of health services provided to the general
public. In recent years, pharmacy profession
has extended its role of product-oriented to
consumer oriented with an emphasis on the
provision of consumer care services. The
consumer’s opinion of the benefits of
pharmaceutical care is based on the ability
of the pharmacist to help them. More
frequent interaction with the consumers
increases the opportunities to improve
outcomes of therapy (Jin et al., 2014) .
(Dalgleish et al., 2007).
The pharmaceutical care process assumes
the establishment of a meaningful
therapeutic relationship between the
patient and the pharmacist based on care,
13th International Research Conference
General Sir John Kotelawala Defence University
Allied Health Sciences Sessions
272
trust, effective communication, and
collaboration to promote health, prevent
disease, and ensure safe and effective
medication therapy. (Awad, Al-Rasheedi and
Lemay, 2017) (Helper and Strand, 1990),
(Practices, 2003). . (Petkova and Dimitrova,
2003).
Problems in pharmacist consultation can
occur when patients and pharmacists have
different expectations about the
pharmacist’s role and pharmacy services.
Therefore, the advancement of community
pharmacy practice needs understanding of
patients’ knowledge and attitude of the
pharmacist’s role as well as of their
utilization and views of community
pharmacy services. Knowledge and attitude
about public utilization and views about
community pharmacy service can assist
pharmacists in enhancing the quality of their
service and improving customer
satisfaction. (El Hajj, Salem and Mansoor,
2011). The objective of the study is to assess
the knowledge and attitudes towards the
role of community pharmacist among the
science students of University of Jaffna and
influence of socio demographic and
educational factors.
Methodology
It is a descriptive institutional based cross-
sectional study design. This study was
conducted from July 2018 to April 2019
among Undergraduate science students of
third & fourth years in the Faculty of Science,
University of Jaffna. There are 793 male and
697 female students with the total of 1480
students studying in three different courses
such as Physical science, Bio science and
computer science respectively 950, 370 and
160 students. These students represent
different districts in Sri Lanka. Among them,
701 students represent third year and
fourth year.
Study instrument
A self-administered, validated, and
pretested questionnaire was used to collect
data. A structured questionnaire was
designed as sections A, B and C. Section A
was designed to collect the socio
demographic factors (Age, Gender,
Ethnicity, marital status, place of resident)
and educational factors (Course of study,
Year of study) of students. Section B and
Section C are designed to collect knowledge
and attitude of students on role of
community pharmacist in health care
system. The knowledge section contains 18
statements to assess knowledge
components related to community
pharmacist: working place, dispensing the
Over the Counter Medication and
prescription only medication, advice need to
be given when dispensing medication and
other responsibilities. Section C contain 10
statements to collect the data regarding
attitude of students on the role of
community pharmacist.
Data analysis
The data were entered in the computer and
transferred to SPSS 22 (statistical Package
for Social Sciences version 22) and were
analysed based on research specific
objectives. Descriptive statistics were
presented as mean, proportion, and
percentage and were presented in tables.
Data was analysed to assess the knowledge
and attitudes among the science students
and assess the influence of socio
demographic and educational factors on
them using chi-square test.
Each correct response on knowledge was
scored with one mark while incorrect
response was received zero mark. Total of
eighteen marks was given for section B. The
mean value was taken as cut off value. The
score from 10 to 18 considered as good
knowledge and score from 0 to 9 considered
as poor knowledge. Student’s attitudes
towards role of community pharmacist was
13th International Research Conference
General Sir John Kotelawala Defence University
Allied Health Sciences Sessions
273
assessed using 10 statements and answers
obtained from students. All statements of
attitudes scale were rated on five-point
Likert scale: strongly disagree, disagree,
undecided, agree, and strongly agree and
scores were given 1,2,3,4, and 5
respectively. Total maximum score is 50.
The mean value was taken as cut-off value
for student’s attitudes towards role of
community pharmacist. If the total score is 0
to 30 considered as negative attitudes, and if
the total score is 31 to 50 considered as
positive attitudes.
Ethical considerations
Ethical clearance was obtained from Ethical
Review Committee, Faculty of Medicine,
University of Jaffna. Purpose of the study
was explained and the informed written
consent was obtained from the participants
prior to data collection.
Results and discussion
This present study was conducted among
563 students. The respondent rate was 80.3
%. More than half of the students (53.8%)
were males and nearly half of the students
(50.6%) were under age group of 20-24
years and the mean age of participants was
24.61±0.9 years. Majority of the students
(97.5%) were unmarried and most of the
students (48.3%) were Sinhalese. Around
equal number of students came from
urban/city as well as village. Majority of the
students (67.7%) were following Physical
science and more than half of the students
(55.1%) were from 3rd year. A similar study
was carried out in Pakistan. In their study,
majority of participants were female
(62.1%), unmarried (99.2%) and the mean
age was 23.93 ±1.3 years (Khaliq et al.,
2018).
In this study 59.7% of participants had poor
knowledge regarding roles of community
pharmacist. 38.2% of students were aware
that community pharmacist cannot dispense
antibiotics without prescription in this
study. Same awareness was observed in the
study carried in Taiwan, where 48% of
students were aware that (Hsiao et al.,
2006). In the present study 69.8% and
75.7% of students were aware regarding
advice about side effects and direction of
usage of medication that should be given by
community pharmacist when dispensing
medication respectively. A study was carried
out in United States about “increasing
client’s knowledge of community
pharmacist roles”. Their results revealed
that 60% and 51% of participants were
aware regarding advices about side effects
and direction of usage of medication which
should be given by community pharmacist
respectively. (Chewning and Schommer,
1996).
40.3% of participants in the present study
were aware that community pharmacist are
dispensers. In contrast a study was
conducted in South Carolina where they
have compared the knowledge between
Pharmacy students and Non-Pharmacy
students (dental medicine, graduate studies,
medicine, nursing and health professions).
95% of pharmacy students and 93% of Non-
Pharmacy students were aware about
community pharmacist are dispensing
medication. Also 67% of pharmacy students
and 64% of Non-Pharmacy students were
aware that community pharmacist should
tell about direction of usage of medication
(Vrontos, Kuhn and Brittain, 2011).
In this present study 57.7% of participants
had fewer positive attitudes towards the
roles of community pharmacist. A study
conducted among public in Iraq showed that
majority of the respondents (79.8%) had
negative attitudes towards the roles of
community pharmacist (Ibrahim, Al
Tukmagi and Wayyes, 2013). A pilot study
which was done in Qatar among public
revealed that the respondents had positive
attitudes towards the roles of community
pharmacist(El Hajj, Salem and Mansoor,
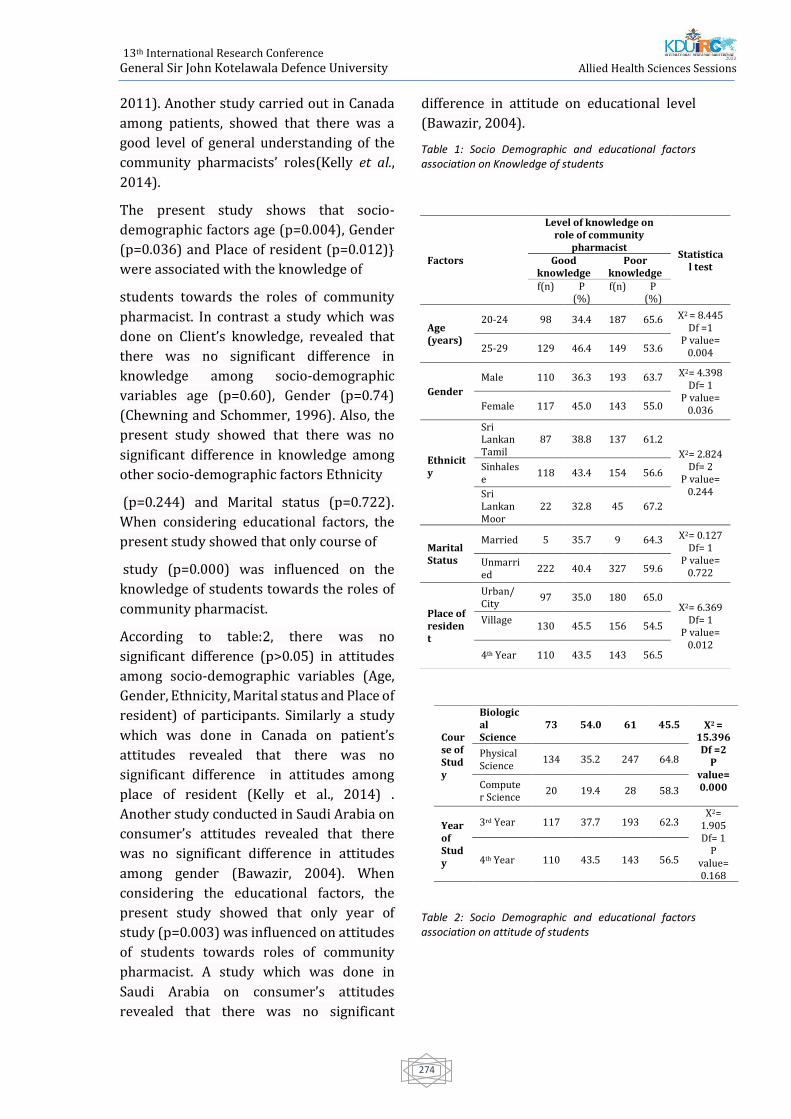
13th International Research Conference
General Sir John Kotelawala Defence University
Allied Health Sciences Sessions
274
2011). Another study carried out in Canada
among patients, showed that there was a
good level of general understanding of the
community pharmacists’ roles(Kelly et al.,
2014).
The present study shows that socio-
demographic factors age (p=0.004), Gender
(p=0.036) and Place of resident (p=0.012)}
were associated with the knowledge of
students towards the roles of community
pharmacist. In contrast a study which was
done on Client’s knowledge, revealed that
there was no significant difference in
knowledge among socio-demographic
variables age (p=0.60), Gender (p=0.74)
(Chewning and Schommer, 1996). Also, the
present study showed that there was no
significant difference in knowledge among
other socio-demographic factors Ethnicity
(p=0.244) and Marital status (p=0.722).
When considering educational factors, the
present study showed that only course of
study (p=0.000) was influenced on the
knowledge of students towards the roles of
community pharmacist.
According to table:2, there was no
significant difference (p>0.05) in attitudes
among socio-demographic variables (Age,
Gender, Ethnicity, Marital status and Place of
resident) of participants. Similarly a study
which was done in Canada on patient’s
attitudes revealed that there was no
significant difference in attitudes among
place of resident (Kelly et al., 2014) .
Another study conducted in Saudi Arabia on
consumer’s attitudes revealed that there
was no significant difference in attitudes
among gender (Bawazir, 2004). When
considering the educational factors, the
present study showed that only year of
study (p=0.003) was influenced on attitudes
of students towards roles of community
pharmacist. A study which was done in
Saudi Arabia on consumer’s attitudes
revealed that there was no significant
difference in attitude on educational level
(Bawazir, 2004).
Table 1: Socio Demographic and educational factors association on Knowledge of students
Table 2: Socio Demographic and educational factors association on attitude of students
Factors
Level of knowledge on role of community
pharmacist Statistica
l test Good
knowledge Poor
knowledge f(n) P
(%) f(n) P
(%)
Age (years)
20-24 98 34.4 187 65.6 X2 = 8.445 Df =1
P value= 0.004 25-29 129 46.4 149 53.6
Gender
Male 110 36.3 193 63.7 X2= 4.398 Df= 1
P value= 0.036 Female 117 45.0 143 55.0
Ethnicity
Sri Lankan Tamil
87 38.8 137 61.2
X2= 2.824 Df= 2
P value= 0.244
Sinhalese
118 43.4 154 56.6
Sri Lankan Moor
22 32.8 45 67.2
Marital Status
Married 5 35.7 9 64.3 X2= 0.127 Df= 1
P value= 0.722
Unmarried
222 40.4 327 59.6
Place of resident
Urban/ City
97 35.0 180 65.0 X2= 6.369
Df= 1 P value=
0.012
Village
130 45.5 156 54.5
4th Year 110 43.5 143 56.5
Course of Study
Biological Science
73 54.0 61 45.5 X2 = 15.396
Df =2 P
value= 0.000
Physical Science
134 35.2 247 64.8
Computer Science
20 19.4 28 58.3
Year of Study
3rd Year 117 37.7 193 62.3 X2=
1.905 Df= 1
P value= 0.168
4th Year 110 43.5 143 56.5
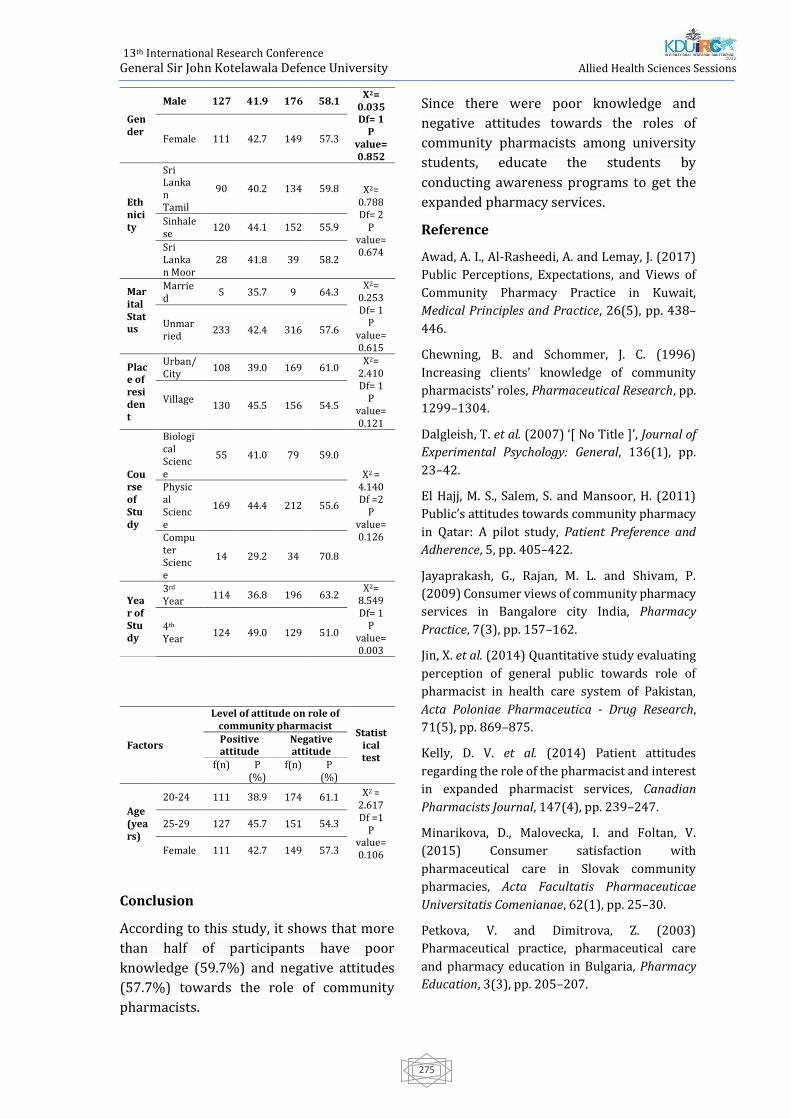
13th International Research Conference
General Sir John Kotelawala Defence University
Allied Health Sciences Sessions
275
Conclusion
According to this study, it shows that more
than half of participants have poor
knowledge (59.7%) and negative attitudes
(57.7%) towards the role of community
pharmacists.
Since there were poor knowledge and
negative attitudes towards the roles of
community pharmacists among university
students, educate the students by
conducting awareness programs to get the
expanded pharmacy services.
Reference
Awad, A. I., Al-Rasheedi, A. and Lemay, J. (2017)
Public Perceptions, Expectations, and Views of
Community Pharmacy Practice in Kuwait,
Medical Principles and Practice, 26(5), pp. 438–
446.
Chewning, B. and Schommer, J. C. (1996)
Increasing clients’ knowledge of community
pharmacists’ roles, Pharmaceutical Research, pp.
1299–1304.
Dalgleish, T. et al. (2007) ‘[ No Title ]’, Journal of
Experimental Psychology: General, 136(1), pp.
23–42.
El Hajj, M. S., Salem, S. and Mansoor, H. (2011)
Public’s attitudes towards community pharmacy
in Qatar: A pilot study, Patient Preference and
Adherence, 5, pp. 405–422.
Jayaprakash, G., Rajan, M. L. and Shivam, P.
(2009) Consumer views of community pharmacy
services in Bangalore city India, Pharmacy
Practice, 7(3), pp. 157–162.
Jin, X. et al. (2014) Quantitative study evaluating
perception of general public towards role of
pharmacist in health care system of Pakistan,
Acta Poloniae Pharmaceutica - Drug Research,
71(5), pp. 869–875.
Kelly, D. V. et al. (2014) Patient attitudes
regarding the role of the pharmacist and interest
in expanded pharmacist services, Canadian
Pharmacists Journal, 147(4), pp. 239–247.
Minarikova, D., Malovecka, I. and Foltan, V.
(2015) Consumer satisfaction with
pharmaceutical care in Slovak community
pharmacies, Acta Facultatis Pharmaceuticae
Universitatis Comenianae, 62(1), pp. 25–30.
Petkova, V. and Dimitrova, Z. (2003)
Pharmaceutical practice, pharmaceutical care
and pharmacy education in Bulgaria, Pharmacy
Education, 3(3), pp. 205–207.
Gender
Male 127 41.9 176 58.1 X2=
0.035 Df= 1
P value= 0.852
Female 111 42.7 149 57.3
Ethnicity
Sri Lankan Tamil
90 40.2 134 59.8 X2= 0.788 Df= 2
P value= 0.674
Sinhalese
120 44.1 152 55.9
Sri Lankan Moor
28 41.8 39 58.2
Marital Status
Married
5 35.7 9 64.3 X2=
0.253 Df= 1
P value= 0.615
Unmarried
233 42.4 316 57.6
Place of resident
Urban/ City
108 39.0 169 61.0 X2=
2.410 Df= 1
P value= 0.121
Village
130 45.5 156 54.5
Course of Study
Biological Science
55 41.0 79 59.0
X2 = 4.140
Df =2 P
value= 0.126
Physical Science
169 44.4 212 55.6
Computer Science
14 29.2 34 70.8
Year of Study
3rd Year
114 36.8 196 63.2 X2=
8.549 Df= 1
P value= 0.003
4th Year
124 49.0 129 51.0
Factors
Level of attitude on role of community pharmacist
Statistical test
Positive attitude
Negative attitude
f(n) P (%)
f(n) P (%)
Age (years)
20-24 111 38.9 174 61.1 X2 = 2.617
Df =1 P
value= 0.106
25-29 127 45.7 151 54.3
Female 111 42.7 149 57.3

13th International Research Conference
General Sir John Kotelawala Defence University
Allied Health Sciences Sessions
276
Practices, P. (2003) ‘international coalition of
library consortia ( icolc ) statement of current
perspective and preferred practices for the
selection and purchase of electronic
information : Update No . 1 : New Developments
in E-Journal Licensing ( December 2001 update
to Ma’, Update, 29(1), pp. 9–10.
Serag-Bolos, E. S. et al. (2017) Assessing
students’ knowledge regarding the roles and
responsibilities of a pharmacist with focus on
care transitions through simulation, Currents in
Pharmacy Teaching and Learning. Elsevier, 9(4),
pp. 616–625.
13th International Research Conference
General Sir John Kotelawala Defence University
Allied Health Sciences Sessions
277
Paper ID: 321
Prevalence And Association Of Overweight With Major Non-
Communicable Diseases Among Elderly People Living In Kesbewa
Secretariat Division, Colombo, Sri Lanka
HATM Wijesekara1#, BGH Sanjeewani1, BADN Sandeepani1, HA Samarasinghe1, AWA
Sathsarani1, GRL Godamulla1, HSMSK Wijesiri1 and Sudath SP Warnakulasuriya2
1Department of Nursing and Midwifery, Faculty of Allied Health Sciences, General Sir John Kotelawala
Defence University, Sri Lanka 2Faculty of Medicine, University of Colombo, Sri Lanka
Abstract:-Non-Communicable diseases
(NCDs) have become a major global health
problem. Cardiovascular diseases, diabetes
mellitus, cancer and chronic respiratory
diseases are considered as major NCDs.
Those conditions commonly can be seen
among elderly populations. Therefore this,
community based cross sectional study was
conducted among 368 participants over the
age of 60 years to determine the prevalence
of NCDs and its associated anthropometric
measurements among elderly living in
Kesbewa secretariat division, Colombo
district, Sri Lanka. A representative sample
was obtained by multi-stage cluster
sampling technique. A pre-tested
interviewer administered questionnaire
was used and body mass index (BMI), waist
hip ratio (WHR) were calculated through the
anthropometric measurements. Statistical
analysis was done by SPSS 23.0. Among the
respondents, 60.9% (n=224) were females
and mean age was 69.53±6.147. Out of the
total sample 58.1% (n=214) of respondents
were suffering from major NCDs. The
prevalence of cardiovascular diseases,
diabetes mellitus (DM), cancer, chronic
respiratory diseases were 19.3%, 40.2%
1.6%, and 12% respectively and 42.4%
respondents were suffering from at least
one NCD. The results suggested that BMI
(P<0.05) and WHR (p<0.05) are significantly
associated with major NCDs. The analysis
revealed significant association between DM
and overweight (p<0.05). There was no
significant association between other major
NCDs with overweight. The prevalence of
NCDs are considerably high and higher BMI
& WHR are the major study observation of
NCDs among elderly. As the factors are
considered as modifiable risk factors,
actions should be taken to address at
community level to reduce the disease
burden associated with NCDs.
KEY WORDS- Non-Communicable Diseases,
Prevalence, Overweight, elderly
Introduction: The elderly population is
rapidly progressing in worldwide due to
declining of fertility rates, lower infant
mortality and increasing of survival rates as
a result of advancements in medical sector.
The aging of the population has become a
major discussion point in modern
economics and is a major concern on the
future growth of the world (Perera, 2017).
Non- communicable diseases (NCDs) are
considered as one of the major problems
which can be highlighted with the increasing
of elderly population (Third UN High-level
Meeting on Non-Communicable Diseases,
2018). Cardio vascular diseases (CVDs),
cancer (CA), chronic respiratory diseases
(CRDs) and diabetes mellitus (DM) which
are known as major NCDs and are leading
causes of mortality in the world (STEPS
survey Sri Lanka, 2015). Day by day, NCDs
are increasing due to modifiable risk factors,
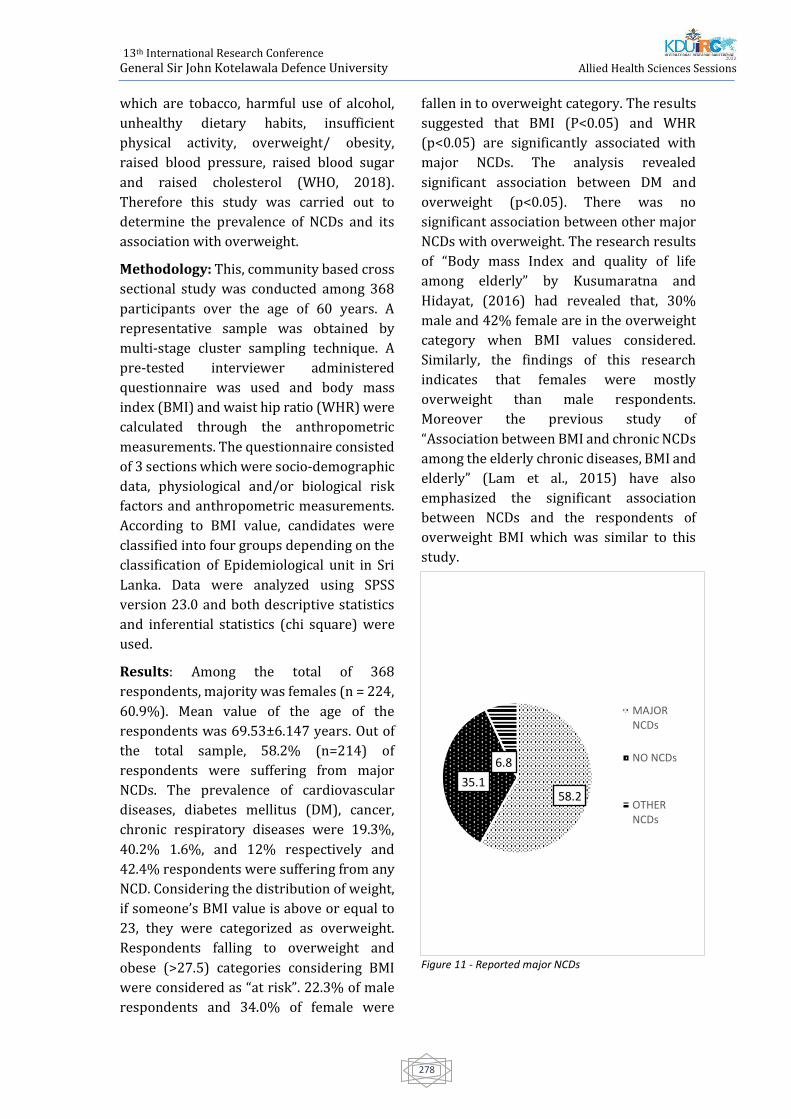
13th International Research Conference
General Sir John Kotelawala Defence University
Allied Health Sciences Sessions
278
which are tobacco, harmful use of alcohol,
unhealthy dietary habits, insufficient
physical activity, overweight/ obesity,
raised blood pressure, raised blood sugar
and raised cholesterol (WHO, 2018).
Therefore this study was carried out to
determine the prevalence of NCDs and its
association with overweight.
Methodology: This, community based cross
sectional study was conducted among 368
participants over the age of 60 years. A
representative sample was obtained by
multi-stage cluster sampling technique. A
pre-tested interviewer administered
questionnaire was used and body mass
index (BMI) and waist hip ratio (WHR) were
calculated through the anthropometric
measurements. The questionnaire consisted
of 3 sections which were socio-demographic
data, physiological and/or biological risk
factors and anthropometric measurements.
According to BMI value, candidates were
classified into four groups depending on the
classification of Epidemiological unit in Sri
Lanka. Data were analyzed using SPSS
version 23.0 and both descriptive statistics
and inferential statistics (chi square) were
used.
Results: Among the total of 368
respondents, majority was females (n = 224,
60.9%). Mean value of the age of the
respondents was 69.53±6.147 years. Out of
the total sample, 58.2% (n=214) of
respondents were suffering from major
NCDs. The prevalence of cardiovascular
diseases, diabetes mellitus (DM), cancer,
chronic respiratory diseases were 19.3%,
40.2% 1.6%, and 12% respectively and
42.4% respondents were suffering from any
NCD. Considering the distribution of weight,
if someone’s BMI value is above or equal to
23, they were categorized as overweight.
Respondents falling to overweight and
obese (>27.5) categories considering BMI
were considered as “at risk”. 22.3% of male
respondents and 34.0% of female were
fallen in to overweight category. The results
suggested that BMI (P<0.05) and WHR
(p<0.05) are significantly associated with
major NCDs. The analysis revealed
significant association between DM and
overweight (p<0.05). There was no
significant association between other major
NCDs with overweight. The research results
of “Body mass Index and quality of life
among elderly” by Kusumaratna and
Hidayat, (2016) had revealed that, 30%
male and 42% female are in the overweight
category when BMI values considered.
Similarly, the findings of this research
indicates that females were mostly
overweight than male respondents.
Moreover the previous study of
“Association between BMI and chronic NCDs
among the elderly chronic diseases, BMI and
elderly” (Lam et al., 2015) have also
emphasized the significant association
between NCDs and the respondents of
overweight BMI which was similar to this
study.
Figure 11 - Reported major NCDs
58.235.1
6.8
MAJORNCDs
NO NCDs
OTHERNCDs
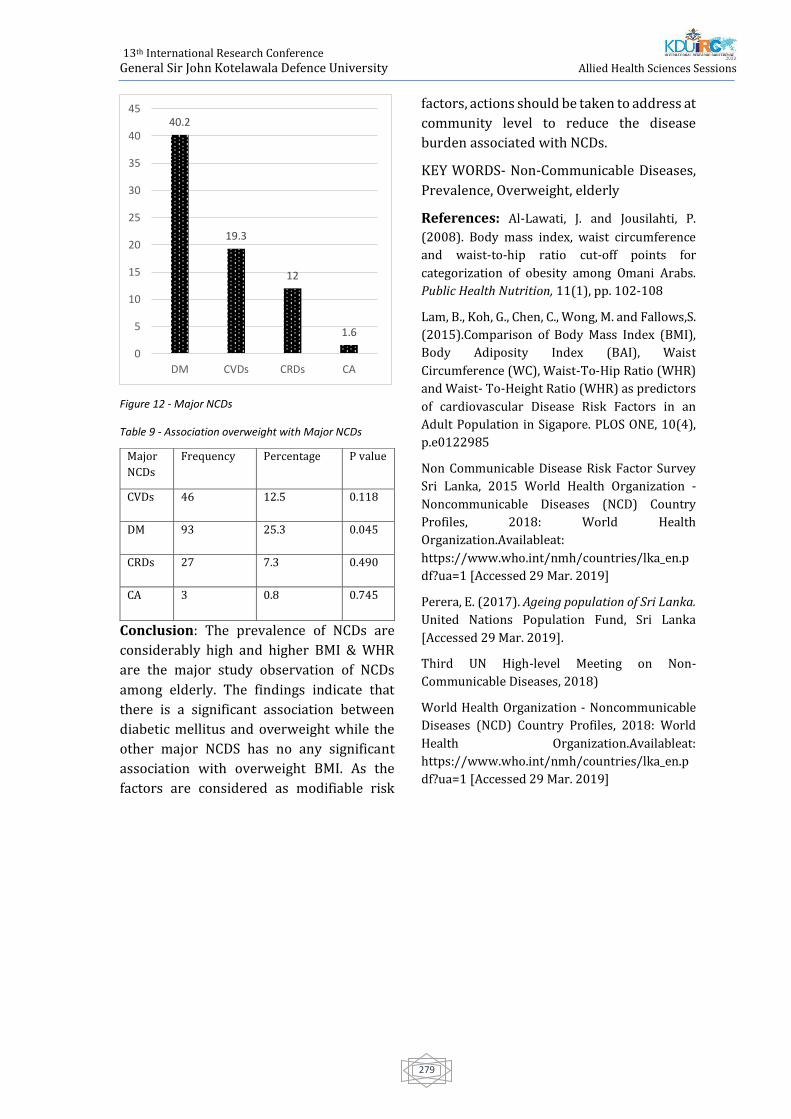
13th International Research Conference
General Sir John Kotelawala Defence University
Allied Health Sciences Sessions
279
Figure 12 - Major NCDs
Table 9 - Association overweight with Major NCDs
Conclusion: The prevalence of NCDs are
considerably high and higher BMI & WHR
are the major study observation of NCDs
among elderly. The findings indicate that
there is a significant association between
diabetic mellitus and overweight while the
other major NCDS has no any significant
association with overweight BMI. As the
factors are considered as modifiable risk
factors, actions should be taken to address at
community level to reduce the disease
burden associated with NCDs.
KEY WORDS- Non-Communicable Diseases,
Prevalence, Overweight, elderly
References: Al-Lawati, J. and Jousilahti, P.
(2008). Body mass index, waist circumference
and waist-to-hip ratio cut-off points for
categorization of obesity among Omani Arabs.
Public Health Nutrition, 11(1), pp. 102-108
Lam, B., Koh, G., Chen, C., Wong, M. and Fallows,S.
(2015).Comparison of Body Mass Index (BMI),
Body Adiposity Index (BAI), Waist
Circumference (WC), Waist-To-Hip Ratio (WHR)
and Waist- To-Height Ratio (WHR) as predictors
of cardiovascular Disease Risk Factors in an
Adult Population in Sigapore. PLOS ONE, 10(4),
p.e0122985
Non Communicable Disease Risk Factor Survey
Sri Lanka, 2015 World Health Organization -
Noncommunicable Diseases (NCD) Country
Profiles, 2018: World Health
Organization.Availableat:
https://www.who.int/nmh/countries/lka_en.p
df?ua=1 [Accessed 29 Mar. 2019]
Perera, E. (2017). Ageing population of Sri Lanka.
United Nations Population Fund, Sri Lanka
[Accessed 29 Mar. 2019].
Third UN High-level Meeting on Non-
Communicable Diseases, 2018)
World Health Organization - Noncommunicable
Diseases (NCD) Country Profiles, 2018: World
Health Organization.Availableat:
https://www.who.int/nmh/countries/lka_en.p
df?ua=1 [Accessed 29 Mar. 2019]
40.2
19.3
12
1.6
0
5
10
15
20
25
30
35
40
45
DM CVDs CRDs CA
Major
NCDs
Frequency Percentage P value
CVDs 46 12.5 0.118
DM 93 25.3 0.045
CRDs 27 7.3 0.490
CA 3 0.8 0.745
13th International Research Conference
General Sir John Kotelawala Defence University
Allied Health Sciences Sessions
280
Paper ID: 342
The association between physical activities and
overweight/obesity among adolescent girls in three provincial
girls’ schools in Piliyandala Educational Zone, Colombo, Sri Lanka.
KPNP Karunarathna1, HKLJ Karunarathne1, EMP Jayathilaka1#, DMWS Dissanayake1,
OLPA Lekamge1, RDUP Sugathapala 1, D Vidanage1 and MKDL Meegoda2
1Department of Nursing & Midwifery, Faculty of Allied Health Sciences, General Sir John Kotelawala
Defence University, Sri Lanka 2 Department of Nursing & Midwifery, Faculty of Allied Health Sciences, University of Sri
Jayewardenepura, Sri Lanka
Abstract:-Obesity/overweight in
adolescents have declared as a risk for non-
communicable diseases in late life. The level
of physical activity is considered a useful
determinant in assessing the risk of
overweight/obesity. Thus, this study aimed
to determine the association between
activity level and overweight/obesity
among adolescent girls. A descriptive cross-
sectional study was conducted in three
selected girls’ schools in Piliyandala
Educational Zone. A total of 277 participants
between 10-19 years, who were willing to
maintain a 3-day activity diary were
selected by simple random sampling
technique. A pre-tested questionnaire was
used to obtain demographic data. Results
revealed that prevalence of overweight and
obesity were 15.2% and 13.7% respectively.
About 48.4% were normal weight and
22.7% were underweight. The participants
spent <2 hours (49.5%), 2-4 hours (35%),4-
6 hours (13%), >6 hours (2.5%) on mobile
phone, computer and TV per day while they
spent < 2 hours (16.3%), 2-4 hours (32.1%),
4-6 hours (24.2%), >6 hours (27.4%)on
education purposes (i.e. tuition /study at
home). Around 47.3% participants spent 6-
8h/day for sleep. The activity diary showed
that 26% of students performed <60 min of
exercises 1-3 days/week, while 74 % avoid
perform any. In conclusion, risk of
obesity/overweight was dominantly seen in
the adolescent girls in this study and it was
significantly associated with activity level
(p<0.05). Programmes on activity level
modification would be an effective strategy
in reducing the prevalence of
overweight/obesity in adolescent girls.
Keywords: Obesity, Overweight, Physical
activities
Introduction
Increase of overweight (OW) and obesity in
adolescents have been identified as a
common health problem which cause
adverse health outcomes in adulthood,
mainly the risk for non-communicable
diseases. OW and obesity are defined as
abnormal or excessive fat accumulation that
may impair health (WHO, 2019).World
Health Organization (WHO) defines the
adolescents as the age group between 10 to
19 years. According to WHO (2019), the
recommended cut off values of
anthropometry in girls aged 5-19 years are
interpreted as obese (>2SD), over weight
(1SD up to 2SD), normal (-2SD up to 1SD),
thinness (-3SD up to -2SD) and severe
thinness (<-3SD). Adolescents are the rising
population of a country, as the hormonal
changes with the puberty increases the
demand for nutrients. As a result, they are
prone to consume more calories for fulfilling
their nutritional needs. The American
College of Obstetricians and Gynecologists
13th International Research Conference
General Sir John Kotelawala Defence University
Allied Health Sciences Sessions
281
stated that the prevalence of obesity in
female adolescents (12-19 years) continues
to increase as they face medical,
psychological and reproductive health
challenges (ACOG committee opinion,
2017).
The risk factors affecting obesity can be
divided as modifiable and non-modifiable
risk factors. Among them socio economic
status, birth weight, skipping breakfast
meal, low fruit and vegetable consumption,
high energy intake and level of physical
activity were the most probable risk factors
affecting obesity in adolescents
(Rathnayake, Roopasingam and
Wickramasighe, 2014). WHO states that
increase of dietary intake and decrease of
physical activities may result in obesity in
adolescents (WHO, 2018).The journal of
Nutritional disorders and therapy of Sri
Lanka in 2015, showed that the prevalence
of childhood obesity can be reduced by
changing dietary practices and maintaining
regular physical activity in the early
childhood. According to the Annual Health
Bulletin Report (2015) by Family Health
Bureau (FHB) in Sri Lanka, the life
expectancy of Sri Lankan women is 78.6
years and the life expectancy of Sri Lankan
men is 72 years. Exploring about prevalence
of obesity, OW among adolescent girls will
be effective in eradicating the risk factors
for non-communicable diseases mainly
during child bearing ages of the girls.
Methodology
A descriptive cross-sectional study was
conducted from January 2019 to December
2019, to determine the association between
physical activities and overweight/obesity
among adolescent girls in three selected
provincial girls’ schools in Piliyandala
Educational Zone, Colombo, Sri Lanka.
Three schools were randomly selected from
‘1 AB’ school category named as provincial
schools in the Piliyandala Educational
Zone.The participants were selected from
grades 5, 6, 7, 8, 9, 10, 11, 12 and 13 in each
selected school using simple random
sampling method. The participants were
recruited after obtaining permission from
the Zonal Director of Education, Piliyandala
Educational Zone, Sri Lanka. The permission
for the study was obtained from the
principals of selected schools. The lists of
students’ names were obtained from the
school principals of three selected schools.
The permission of the class teacher was
obtained and the consent from parent/
guardian of the participants was obtained
prior to the recruitment. Method of the
study was explained to all the participants.
The participants were free to ask any
question from the investigators at any time
during the study. Privacy and confidentiality
of the participants were ensured throughout
the study, mainly during obtaining
anthropometric measurements.
A pilot study was conducted in a selected
school in Kurunegala district, Mayurapada
Central College, Narammala, Sri Lanka with
45 girls who fulfil similar inclusion and
exclusion criteria. A self-administered
questionnaire and a 3 day activity diary was
used as study instruments. Minor changes
were in cooperated to the study instruments
according to the results of the pilot study.
The data was analysed using SPSS 23.0.
version. Crosstab was done to assess the
association between risk factors. Level of
significance was set as 0.05.The ethical
clearance was obtained from the Ethical
Review Committee of Faculty of Medicine,
General Sir John Kotelawala Defence
University (KDU), Sri Lanka.
Results and Discussion
According to the findings, majority of the
adolescent girls were Sinhalese 99.6%
(n=276) and only 0.4% (n=1) were Muslims.
Majority 97%, (n=269) of the participants
were Buddhists and 2.2% (n=6) were
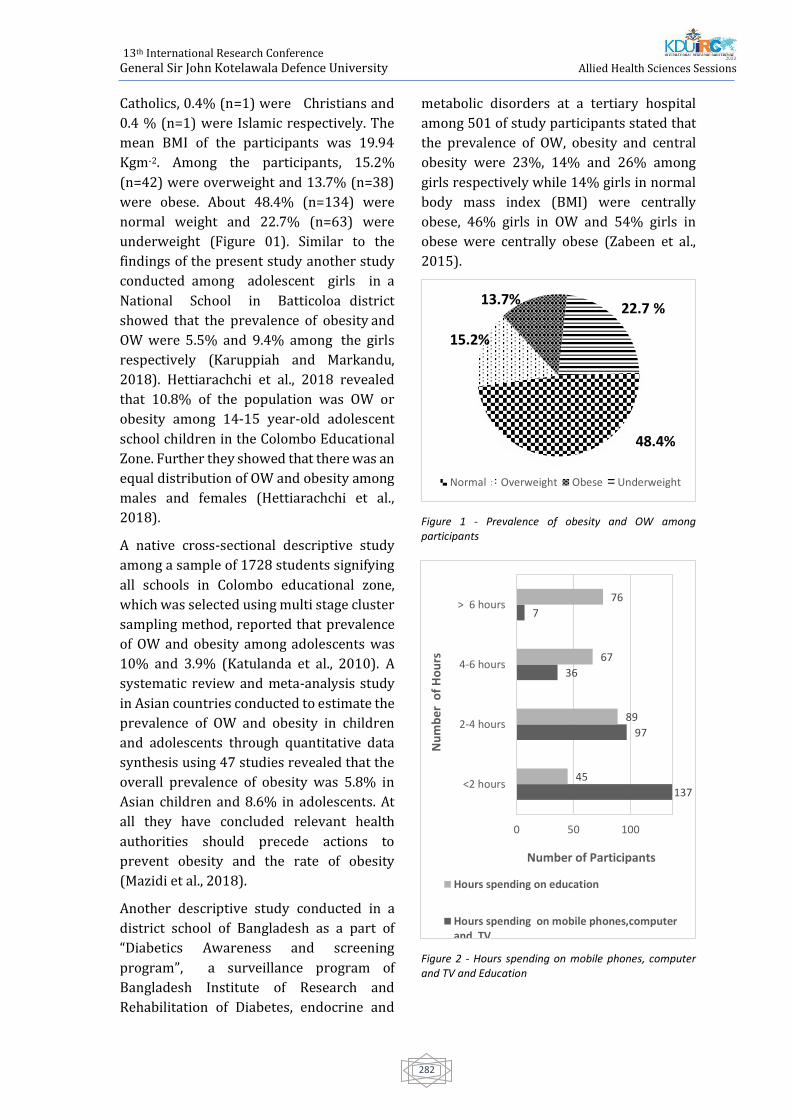
13th International Research Conference
General Sir John Kotelawala Defence University
Allied Health Sciences Sessions
282
Catholics, 0.4% (n=1) were Christians and
0.4 % (n=1) were Islamic respectively. The
mean BMI of the participants was 19.94
Kgm-2. Among the participants, 15.2%
(n=42) were overweight and 13.7% (n=38)
were obese. About 48.4% (n=134) were
normal weight and 22.7% (n=63) were
underweight (Figure 01). Similar to the
findings of the present study another study
conducted among adolescent girls in a
National School in Batticoloa district
showed that the prevalence of obesity and
OW were 5.5% and 9.4% among the girls
respectively (Karuppiah and Markandu,
2018). Hettiarachchi et al., 2018 revealed
that 10.8% of the population was OW or
obesity among 14-15 year-old adolescent
school children in the Colombo Educational
Zone. Further they showed that there was an
equal distribution of OW and obesity among
males and females (Hettiarachchi et al.,
2018).
A native cross-sectional descriptive study
among a sample of 1728 students signifying
all schools in Colombo educational zone,
which was selected using multi stage cluster
sampling method, reported that prevalence
of OW and obesity among adolescents was
10% and 3.9% (Katulanda et al., 2010). A
systematic review and meta-analysis study
in Asian countries conducted to estimate the
prevalence of OW and obesity in children
and adolescents through quantitative data
synthesis using 47 studies revealed that the
overall prevalence of obesity was 5.8% in
Asian children and 8.6% in adolescents. At
all they have concluded relevant health
authorities should precede actions to
prevent obesity and the rate of obesity
(Mazidi et al., 2018).
Another descriptive study conducted in a
district school of Bangladesh as a part of
“Diabetics Awareness and screening
program”, a surveillance program of
Bangladesh Institute of Research and
Rehabilitation of Diabetes, endocrine and
metabolic disorders at a tertiary hospital
among 501 of study participants stated that
the prevalence of OW, obesity and central
obesity were 23%, 14% and 26% among
girls respectively while 14% girls in normal
body mass index (BMI) were centrally
obese, 46% girls in OW and 54% girls in
obese were centrally obese (Zabeen et al.,
2015).
Figure 1 - Prevalence of obesity and OW among participants
Figure 2 - Hours spending on mobile phones, computer and TV and Education
48.4%
15.2%
13.7%22.7 %
Normal Overweight Obese Underweight
137
97
36
7
45
89
67
76
0 50 100
<2 hours
2-4 hours
4-6 hours
> 6 hours
Number of Participants
Nu
mb
er o
f H
ou
rs
Hours spending on education
Hours spending on mobile phones,computerand TV
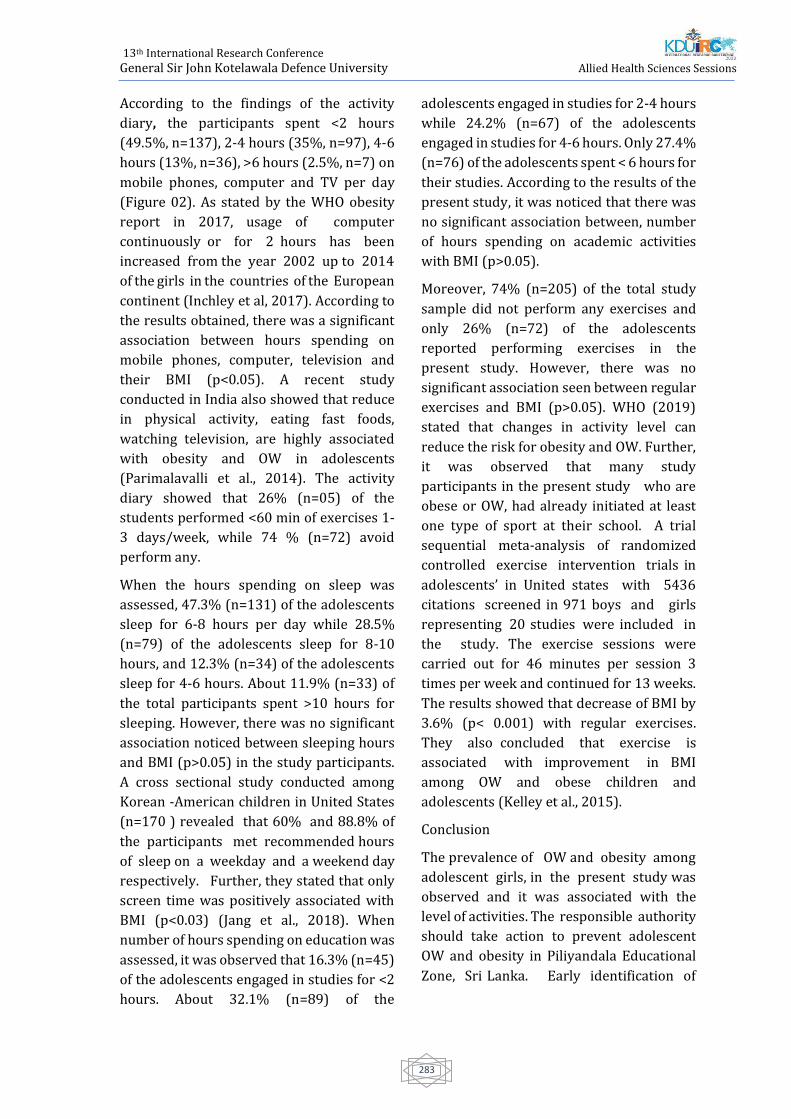
13th International Research Conference
General Sir John Kotelawala Defence University
Allied Health Sciences Sessions
283
According to the findings of the activity
diary, the participants spent <2 hours
(49.5%, n=137), 2-4 hours (35%, n=97), 4-6
hours (13%, n=36), >6 hours (2.5%, n=7) on
mobile phones, computer and TV per day
(Figure 02). As stated by the WHO obesity
report in 2017, usage of computer
continuously or for 2 hours has been
increased from the year 2002 up to 2014
of the girls in the countries of the European
continent (Inchley et al, 2017). According to
the results obtained, there was a significant
association between hours spending on
mobile phones, computer, television and
their BMI (p<0.05). A recent study
conducted in India also showed that reduce
in physical activity, eating fast foods,
watching television, are highly associated
with obesity and OW in adolescents
(Parimalavalli et al., 2014). The activity
diary showed that 26% (n=05) of the
students performed <60 min of exercises 1-
3 days/week, while 74 % (n=72) avoid
perform any.
When the hours spending on sleep was
assessed, 47.3% (n=131) of the adolescents
sleep for 6-8 hours per day while 28.5%
(n=79) of the adolescents sleep for 8-10
hours, and 12.3% (n=34) of the adolescents
sleep for 4-6 hours. About 11.9% (n=33) of
the total participants spent >10 hours for
sleeping. However, there was no significant
association noticed between sleeping hours
and BMI (p>0.05) in the study participants.
A cross sectional study conducted among
Korean -American children in United States
(n=170 ) revealed that 60% and 88.8% of
the participants met recommended hours
of sleep on a weekday and a weekend day
respectively. Further, they stated that only
screen time was positively associated with
BMI (p<0.03) (Jang et al., 2018). When
number of hours spending on education was
assessed, it was observed that 16.3% (n=45)
of the adolescents engaged in studies for <2
hours. About 32.1% (n=89) of the
adolescents engaged in studies for 2-4 hours
while 24.2% (n=67) of the adolescents
engaged in studies for 4-6 hours. Only 27.4%
(n=76) of the adolescents spent < 6 hours for
their studies. According to the results of the
present study, it was noticed that there was
no significant association between, number
of hours spending on academic activities
with BMI (p>0.05).
Moreover, 74% (n=205) of the total study
sample did not perform any exercises and
only 26% (n=72) of the adolescents
reported performing exercises in the
present study. However, there was no
significant association seen between regular
exercises and BMI (p>0.05). WHO (2019)
stated that changes in activity level can
reduce the risk for obesity and OW. Further,
it was observed that many study
participants in the present study who are
obese or OW, had already initiated at least
one type of sport at their school. A trial
sequential meta-analysis of randomized
controlled exercise intervention trials in
adolescents’ in United states with 5436
citations screened in 971 boys and girls
representing 20 studies were included in
the study. The exercise sessions were
carried out for 46 minutes per session 3
times per week and continued for 13 weeks.
The results showed that decrease of BMI by
3.6% (p< 0.001) with regular exercises.
They also concluded that exercise is
associated with improvement in BMI
among OW and obese children and
adolescents (Kelley et al., 2015).
Conclusion
The prevalence of OW and obesity among
adolescent girls, in the present study was
observed and it was associated with the
level of activities. The responsible authority
should take action to prevent adolescent
OW and obesity in Piliyandala Educational
Zone, Sri Lanka. Early identification of
13th International Research Conference
General Sir John Kotelawala Defence University
Allied Health Sciences Sessions
284
childhood obesity, will be effective in
reducing adolescent obesity.
References
ACOG committee opinion. (2017). obesity in
adolescents.
De Silva, A., De Silva, S., Haniffa, R., Liyanage, I.,
Jayasinghe, K., Katulanda, P., Wijeratne, C.,
Wijeratne, S. and Rajapakse, L. (2015).A cross
sectional survey on social, cultural and economic
determinants of obesity in a low middle income
setting. International Journal for Equity in
Health, 14(1).
Family Health Bureau.
(2015). anual_report_2015.pdf. [Online]
Available at:
https://drive.google.com/file/d/1cym2eQEM1P
GuEM52KucGwThDw1m4kgnY/view [Accessed
21 Oct. 2019].
Jang, M., Grey, M., Sadler, L., Jeon, S., Nam, S., Song,
H. And Whittemore, R., 2018. Obesity-risk
behaviours and their associations with body
mass index (BMI) in Korean American children.
Journal of Clinical Nursing, 27(17-18), pp.3408-
3417.
Karuppiah, D. and Markandu, M.
(2018).Prevalence of obesity, OW and central
obesity among adolescent girls in national school
in Batticaloa district, Sri Lanka. Sri Lanka
Journal of Diabetes Endocrinology and
Metabolism, 8(1), p.17.
Kelley, G., Kelley, K. And Pate, R., 2015. Exercise
and BMI in Overweight and Obese Children and
Adolescents: A Systematic Review and Trial
Sequential Meta-Analysis. BioMed Research
International, 2015, pp.1-17.
Mazidi,M.,Banach,M.,Kengne,A. and Meta
analysis Collaboration Group, L. (2018).
Prevalence of childhood obesity and
adolescent overweight and obesity in Asian
countries: a systematic review and meta-
analysis. Archives of Medical Science, 14(6),
pp.1185-1203.
Hettiarachchi, J., Jayatissa, R., Wickramasinghe, S.
and Wijeywardena, K. (2018). OW and obesity
among adolescent school children in the
Colombo education zone. Journal of the
Postgraduate Institute of Medicine, 5(1), p.63.
Inchley, J. (2017). Adolescent obesity and related
behaviours. World Health Organization, Regional
Office for Europe.
Parimalavalli, R. and Kowsalya, T.
(2014).Prevalence of OW/obesity among
adolescents in urban and rural areas of Salem,
India. Journal of Obesity and Metabolic Research,
1(3), p.153.
Rathnayake, K., Roopasingam, T. and
Wickramasighe, V. (2014). Nutritional and
behavioural determinants of adolescent obesity:
a case–control study in Sri Lanka. BMC Public
Health, 14(1).
SM, M. (2015). Childhood Obesity: Epidemiology,
Determinants, and Prevention. Journal of
Nutritional Disorders & Therapy, 5(2).
Who.int. (2018).Obesity and OW. [online]
Available at: https://www.who.int/news-
room/fact-sheets/detail/obesity-and-OW
[Accessed 3 Jan. 2019].
Who.int.(2019).[online]Availableat:https://ww
w.who.int/growthref/bmifa_girls_z_5_19_
labels.pdf?ua=1[Assessed 1 Jan.2019]
Zabeen, B., Tayyeb, S., Naz, F., Ahmed, F., Rahman,
M., Nahar, J., Nahar, N. and Azad, K.
(s).Prevalence of obesity and central obesity
among adolescent girls in a district school in
Bangladesh
13th International Research Conference
General Sir John Kotelawala Defence University
Allied Health Sciences Sessions
285
Paper ID: 365
Knowledge And Attitude Regarding Adverse Drug Reaction
Reporting And Associated Factors Among State Pharmacist In
Northern Province, Srilanka
ML. Kaluarachchi1#, S. Thuvaragan1, PAD.Coonghe2, and SN. Thihahiny3
1 Department of Pharmacy, Faculty of Allied Health Sciences, University of Jaffna, Sri Lanka. 2 Department of Community & Family Medicine, Faculty of Medicine, University of Jaffna, Sri Lanka.
3 Department of Pharmacology, Faculty of Medicine, University of Jaffna, Sri Lanka.
Abstract – Adverse drug reaction (ADR) is a
significant cause of morbidity and mortality
worldwide. Reporting of ADRs is considered
to be an important step to achieve a safe
drug use. Reporting of ADR becomes a part
of professional obligation of a pharmacist, as
expanding of the role towards patient care
rather than the dispensing. This study was
conducted to assess the knowledge, attitude
regarding ADR reporting and association of
socio-demographic and work-related
factors among pharmacists working at
Public Sector Hospitals in Northern
Province, Sri Lanka. It is a descriptive cross-
sectional study which was conducted among
76 pharmacists using validated self-
administered questionnaire. Descriptive
statistics was used to describe the data.
Association of socio-demographic and work-
related factors on knowledge and attitude
was determined by chi-square test and
fisher’s extract test. Data were analyzed by
using SPSS version 23. The response rate of
the study was 88.2% (n=67). The mean age
of participants was 35.8 ± 9.3 years and
most of them were females (71.6%, n=48).
Predetermined cut-off value was used as 70
% to determine the level of knowledge and
attitude regarding ADR reporting with help
of supervisors. Among participants, 65.2%
(n=44) of participants had good knowledge
about ADRs and 67.2% (n=45) had positive
attitude towards ADR reporting. Extra
working hours had statistically significant
influence on knowledge on ADR (p=0.048)
and working experience showed significant
influence on the attitude toward ADR
reporting (p=0.03). This study revealed that
majority of pharmacists had good level of
knowledge and positive attitude towards
ADR reporting.
Keywords: Adverse drug reaction (ADR),
Adverse drug reaction reporting,
Pharmacist
Introduction
Adverse drug reaction (ADRs) is a significant
cause of morbidity and mortality worldwide.
World Health Organization (WHO) has
provided the definition of adverse drug
reactions as “an ADR is any noxious,
unintended and undesired effect of a drug,
which occurs at doses used in human
prophylaxis, diagnosis, or therapy”(Ahmad
et al., 2013). ADRs are associated with
prolonged length of hospital stay, increased
economic burden and increased death;
many studies have reported that ADRs were
responsible for large number of hospital
admissions. Thus reporting of ADRs is
considered to be an important step in
maintaining and achieving medication
safety. All sectors of the healthcare system
would need to be involved in the ADR
reporting process. Wherever treatments are
being started, there should be an alertness
to observe and report unwanted adverse
events (both expected and
13th International Research Conference
General Sir John Kotelawala Defence University
Allied Health Sciences Sessions
286
unexpected)(WHO, 2002). Reporting of ADR
becomes a part of professional obligation of
a pharmacist, as expanding of the role
towards patient care rather than the
dispensing of medication. These roles
include reporting ADRs, improving patient
health, and economic outcomes(Hepler and
Strand, 1990; Manley and Carroll, 2002).
Since pharmacists directly involve with
patients, they are expected to play an
important role in providing drug
information and reporting of ADRs. Having
good knowledge and positive attitude
towards ADR reporting could promote
spontaneous ADR reporting not only by
pharmacist themselves but, also by patients
through providing appropriate drug
information.
The thalidomide tragedy in the mid
twentieth century triggered a chain of
activities, which established monitoring
schemes based on reporting of suspected
ADRs(WHO, 2004a). Most countries
developed their national pharmacovigilance
system after the thalidomide disaster in
1960s(Reddy et al., 2014). Most developed
countries and many developing countries
follow spontaneous reporting systems (SRS
s) e.g. UK Yellow card scheme for reporting
for suspected adverse drug
reactions(Herdeiro, Figueiras and Pol,
2006). The SRS receives ADR reports from
medical practitioners and other health care
professionals, such as pharmacists and
nurses(Hazell and Shakir, 2006). The main
function of the SRS is detection of signals of
new, rare or serious ADRs. ADR
spontaneous reporting systems are the basic
components for the comprehensive post-
marketing surveillance of drug induced
risks(Pal et al., 2013). Recently Sri Lanka
was being a full-time member of the WHO
collaboration center for the ADR monitoring
and reporting. Mainly, the major drawback
in spontaneous voluntary system used in Sri
Lanka is under reporting of suspected drug
related problems(Munasinghe, 2002). It is
highly depending on attitude and knowledge
regarding reporting of ADR. Therefore, the
objective of this study was to assess the
knowledge and attitude among pharmacist,
working in Northern Province, Sri Lanka and
association of socio-demographic and work-
related factors.
Methodology
The study was an Institutional based
descriptive cross-sectional study among the
state pharmacist in Northern Province, Sri
Lanka. A self-administered questionnaire
was used to collect data which included four
sections (A, B, C, D). A and B designed to
collect the information about socio-
demographic and work related factors
respectively. Section C and D designed to
assess knowledge and attitude regarding
ADR reporting respectively. Questionnaire
was designed through literature review of
the published journals and WHO
guideline(WHO, 2004b; Ahmad et al., 2013;
Khan, 2013; Suyagh, Farah and Abu Farha,
2015). Questionnaire was validated by
circulating it among 3 experts such as senior
pharmacist, consultant physician and
pharmacologist. Data collection was done
after getting the ethical clearance from
Ethical Review Committee, Faculty of
Medicine, University of Jaffna. Permission
for data collection was obtained from
Provincial/ Regional Director of Health
Services, Director of hospitals and chief
pharmacists accordingly. The data collection
was conducted over two months.
Descriptive statistics was used to describe
the data. Association of socio-demographic
and work-related factors on knowledge and
attitude was determined by chi-square test
and fisher’s extract test. Data were analyzed
by using SPSS version 23 (Statistical package
for social sciences version 23).
Results
13th International Research Conference
General Sir John Kotelawala Defence University
Allied Health Sciences Sessions
287
Socio-demographic factors of
participants
Out of the 76 pharmacists, 67 of them were
responded with response rate of 88.2%. In
this study 71.6% of participants were female
and 28.4% were male. The average age of
the participants was 35.5 years. 88.1% of
them were Sri Lankan Tamil.
Work-related factors of participants
In this study few of them were qualified as B.
Pharm or Bsc In pharmacy (10.4%, n=7).
Working experience of participants ranged
from 5 months to 28 years with the average
of 8.4 years. Only 17.9% (n= 12) of
participants had participated service
training program regarding ADR reporting
and 14.9% (n= 10) of them had participated
in seminars regarding ADR reporting.
Knowledge level of participants
Among the participants 35.8% (n=24) were
able to correctly define the ADR while 11.9%
(n=8) of them were unable to define at all.
More than half of participants had good
knowledge on Incidents which could be
reported. However 61.2% (n=41) of
participants failed to give correct answer for
the location of National pharmacovigilance
center. In this study all the participants had
awareness of ADR reporting system in Sri
Lanka and 97% of them had awareness on
availability of structured form for reporting
of ADRs. Almost all of participants (n=65,
97%) had good knowledge regarding the
information which they need to include
while reporting an ADR. Nearly two third of
participants (n=44, 65.7%) were stated that
the conformation of ADR with particular
drug is necessary before reporting. 83.6%
(n=56) participants were aware of ADR
reporting system in Sri Lanka.
Attitude level of participants
More than half of participants (n=37, 55.2%)
had positive attitude towards reporting ADR
with their routine duties, while one third of
participant (33.3%, n=23) stated, that is
time consuming and highly affects their
routine duties. Majority of them were not
believed that fear of legal liability (n=44,
65.6%) and lack of confidence in discussing
ADR with a prescriber (n=36, 53.7%) as a
reason them to discourage reporting. Only
16.4% (n=11) were stated that the, ADR
reporting is neglected because pharmacists
were overloaded with duties due to large
number of patients at the clinics. About one
tenth of participants (9%) had negative
attitudes towards ADR reporting as they feel
their reports would not be considered as
valuable.
Discussion
Adverse drug reaction reporting plays a
major role in pharmacovigilance process,
which introduced by World Health
Organization in order to assess, detect and
prevent unwanted health outcomes related
to drugs and other medicine related items.
In the present study 38.8% of participants
knew the location of National
pharmacovigilance center. It was almost
similar to the study done in India, in which
30% of them knew the location of
pharmacovigilance center(Ahmad et al.,
2013). In accordance with the findings of
this study all of the participants (100.0%)
had awareness of ADR reporting system in
Sri Lanka. In contrast, two studies conducted
in Kuwait and Saudi Arabia reported very
low level of awareness regarding
availability of ADR reporting system, where
only 7% and 10% of participants were
aware of the existence of reporting system
respectively(Khan, 2013; Alsaleh et al.,
2017). When considering all dimensions of
attitude, the present study has found that
67.2% of participants had positive attitude
towards ADR reporting. There 65.6% of
them were disagreed to the fear of legal
liability as a discouraging factor for ADR
reporting. But different figures had been
reported in studies from Northern China and
13th International Research Conference
General Sir John Kotelawala Defence University
Allied Health Sciences Sessions
288
Jordan, 93.3% and 59.6% respectively(Su, Ji
and Bs, 2010a; Suyagh, Farah and Abu Farha,
2015). Only 16.4% of participants were
accepted the work load as factor which leads
to consider ADR reporting negligence. This
finding is higher with the study done in
Saudi Arabia, in which only 6.3% of
participants mentioned that they are not
report ADR due to their
workload(Mauhmoud, Alswaida and
Alshammari, 2014). In the present study,
few participants (9%) stated that
pharmacist will do ADR reporting if there is
a reward. Almost Similar figure had been
reported in Northern china, in which only
6.9% of pharmacist were suggested fee for
ADR reporting(Su, Ji and Bs, 2010b). In the
present study majority of participants
(89.6%) were diploma holders. In contrast,
different situation exist in countries like
Saudi Arabia, Norway and Jordan, where
100.0%, 65.7%, 77.9% of the participants
were degree holders respectively (Granas et
al., 2007; Khan, 2013; Suyagh, Farah and
Abu Farha, 2015). This study shows the low
involvement of training programs regarding
ADR reporting (17.9%) which is lower than
the value from a study from neighboring
country India, in which 30% of participants
were trained for ADR reporting (Ahmad et
al., 2013). In this study 14.9% of participants
had participated in seminars/ workshops
regarding ADR. It is higher than the study
conduct in Jordan, in which only 8.2% had
participated a workshop regarding ADR
reporting (Suyagh, Farah and Abu Farha,
2015). When considering the influence of
work-related factors on knowledge, working
experience of the participants had not
showed statistically significant association
with knowledge on ADR reporting (p value=
0.095). Similar figure has been reported in
an Ethiopian study(Necho Mulatu, 2014). In
contrast same study found a statistically
significant association between
participation of training program with the
knowledge on ADR reporting (p value <
0.05), whereas present study participant’s
knowledge was not influenced by the
participation of service training program
regarding ADRs ( p value= 0.207). Working
experience of participants was influenced on
the level of attitude towards ADR reporting
among participants ( p value= 0.03).
Younger participants who recently joined to
the pharmacy profession showed a positive
attitude when compare with more
experienced participants. It may due to the
expansion of the scope of pharmacist.
Younger participants may realize their
responsibility in clinical side as well as
patient care. In study conducted in Northern
China showed significant association
between working experience with attitudes
as similar to present study(Su, Ji and Bs,
2010b). However, participation of training
programs was not influenced with attitude (
p value= 0.162). It is not accordance with the
study conducted in Northern China, it
revealed a positive influence on attitude
with the participation of training programs
(p value= 0.03)(Su, Ji and Bs, 2010b).
Conclusion
The finding of the study revealed that,
majority (65.7%) of participants had good
knowledge on adverse drug reaction
reporting (ADR) and 67.2% of participants
had positive attitude towards the adverse
drug reaction (ADR) reporting. There is
correlation between attitudes towards ADR
reporting with the work experience,
participants who engaged recently to the
profession have positive attitude than more
experienced participants. Conducting in –
service training programs, workshops and
seminars will improve pharmacy
professional’s knowledge and attitude
regarding ADR reporting which will
subsequently improve the patient safety.
References
Ahmad, A., Patel, I., Balkrishnan, R., Mohanta, G.P.
and Manna, P.K., 2013. An evaluation of
13th International Research Conference
General Sir John Kotelawala Defence University
Allied Health Sciences Sessions
289
knowledge, attitude and practice of Indian
pharmacists towards adverse drug reaction
reporting: A pilot study. Perspectives in clinical
research, 4(4), p.204.
Alsaleh, F.M., Alzaid, S.W., Abahussain, E.A.,
Bayoud, T. and Lemay, J., 2017.Knowledge,
attitude and practices of pharmacovigilance and
adverse drug reaction reporting among
pharmacists working in secondary and tertiary
governmental hospitals in Kuwait. Saudi
Pharmaceutical Journal, 25(6), pp.830-837.
Granas, A.G., Buajordet, M., Stenberg Nilsen, H.,
Harg, P. and Horn, A.M., 2007. Pharmacists'
attitudes towards the reporting of suspected
adverse drug reactions in
Norway. Pharmacoepidemiology and drug
safety, 16(4), pp.429-434.
Hazell, L. and Shakir, S.A., 2006.Under-reporting
of adverse drug reactions. Drug safety, 29(5),
pp.385-396.
Hepler, C.D. and Strand, L.M., 1990.
Opportunities and responsibilities in
pharmaceutical care. Am J hosp pharm, 47(3),
pp.533-543.
Herdeiro, M.T., Figueiras, A., Polónia, J. and
Gestal-Otero, J.J., 2006. Influence of pharmacists’
attitudes on adverse drug reaction
reporting. Drug safety, 29(4), pp.331-340.
Khan, T.M., 2013.Community pharmacists’
knowledge and perceptions about adverse drug
reactions and barriers towards their reporting in
Eastern region, Alahsa, Saudi
Arabia. Therapeutic advances in drug safety, 4(2),
pp.45-51.
Mahmoud, M.A., Alswaida, Y., Alshammari, T.,
Khan, T.M., Alrasheedy, A., Hassali, M.A. and
Aljadhey, H., 2014.Community pharmacists’
knowledge, behaviors and experiences about
adverse drug reaction reporting in Saudi
Arabia. Saudi pharmaceutical journal, 22(5),
pp.411-418.
Manley, H.J. and Carroll, C.A., 2002, February.The
clinical and economic impact of pharmaceutical
care in end‐stage renal disease
patients.In Seminars in dialysis (Vol. 15, No. 1, pp.
45-49). Malden, USA: Blackwell Publishing.
Munasinghe, T.M.J., 2014. Adverse drug
reactions: monitoring, reporting and
prevention. Ceylon Medical Journal, 47(1).
Necho, W. and Worku, A., 2014. Assessment of
knowledge, attitude and practice of health
professionals towards adverse drug reaction
reporting and factors associated with reporting. J
Pharmacovigilance, 2(4), p.135.
Pal, S.N., Duncombe, C., Falzon, D. and Olsson, S.,
2013. WHO strategy for collecting safety data in
public health programmes: complementing
spontaneous reporting systems. Drug
safety, 36(2), pp.75-81.
Reddy, V.L., Pasha, S.J., Rathinavelu, M. and
Reddy, Y.P., 2014.Assessment of knowledge,
attitude and perception of pharmacovigilance
and adverse drug reaction (ADR) reporting
among the pharmacy students in south
India. IOSR J Pharm BiolSci, 9(2), pp.34-43.
Su, C., Ji, H. and Su, Y., 2010. Hospital
pharmacists' knowledge and opinions regarding
adverse drug reaction reporting in Northern
China. Pharmacoepidemiology and drug
safety, 19(3), pp.217-222.
Suyagh, M., Farah, D. and Farha, R.A.,
2015.Pharmacist’s knowledge, practice and
attitudes toward pharmacovigilance and adverse
drug reactions reporting process. Saudi
Pharmaceutical Journal, 23(2), pp.147-153.
World Health Organization, 2002.The
importance of pharmacovigilance.
World Health Organization,
2004. Pharmacovigilance: ensuring the safe use of
medicines (No. WHO/EDM/2004.8). Geneva:
World Health Organization.
World Health Organization, 2004.WHO
guidelines on safety monitoring of herbal
medicines in pharmacovigilance systems.
13th International Research Conference
General Sir John Kotelawala Defence University
Allied Health Sciences Sessions
290
Paper ID: 430
Effectiveness of an awareness programme on burn prevention and
first aid among grade 10 students of type 1 and 2 schools in
Kesbewa Divisional area, Piliyandala educational zone, Colombo
District, Sri Lanka
RAKP Jayarathna1, BPD Silva1, GASS Gamasinghearachchi1, DBI Chamaleen1#, MBDT
Rajawardhana1, DVDM Samarasinghe1, RDUP Sugathapala2
1, 2Department of Nursing & Midwifery, Faculty of Allied Health Sciences, General Sir John Kotelawala
Defence University, Sri Lanka
Abstract - Burns are one of the most
common household injuries, especially
among children. Burn education is a must for
reduce the levels of morbidity and mortality
rate due to burns. This study was based on
one group pretest posttest design and it was
carried out to determine the effectiveness of
an awareness programme on burn
prevention and first aid among grade 10
students of type 1 and 2 schools in Kesbewa
area. Stratified random sampling and cluster
sampling were used to select schools and
participants of the study. A self-
administered pretested questionnaire was
administered to 321 school children of
grade 10, in order to obtain the socio-
demographic data and to assess the previous
knowledge on burn prevention and first aid.
An awareness programme was developed
and conducted to all the participants of the
study on key factors regarding burn
prevention and first aid for burns. Students
answered the same self-administered
questionnaire after seven days of awareness
programme. There were 188 (59%) males
and 133 (41%) females. According to the
paired sample t test results, the average
knowledge score of burn prevention before
the awareness programme was 79.25 and
after the awareness programme it was
91.43. Mean difference of marks was 12.18.
Similarly, the mean difference between pre
and post-test scores on first aid was 23.09.
The average mark of the students after the
awareness programme is significantly
different from the average mark before the
awareness programme (p < 0.05). This study
demonstrated that the awareness
programme on burn prevention and first aid
was effective for improving knowledge of
grade 10 students in Kesbewa area. It is
suggested to use this awareness programme
further as an effective strategy to increase
the awareness of school children on burn
prevention and first aid for burns.
Key words - Burns, Prevention of burns,
First aid, Awareness programme
Introduction
A burn is defined as an injury to the skin or
other organic tissue caused by thermal
trauma. It occurs when some or all the cells
in the skin or other tissues are destroyed by
hot liquids, hot solids or flames. Injuries to
the skin or other organic tissues due to
radiation, radioactivity, electricity, friction
or contact with chemicals are also
considered as burns (WHO, 2018). Children
are naturally curious. They encounter
objects that can cause severe injuries.
Playing with fire or touching hot objects can
result in burns. This is a debilitating
condition accompanied by intense pain and
often by long term illness that creates
suffering not only for the child but for the
wider family and community. The rate of
child deaths from burns is currently over
13th International Research Conference
General Sir John Kotelawala Defence University
Allied Health Sciences Sessions
291
seven times higher in low and middle-
income countries than in high-income
countries (WHO, 2018). Children are at high
risk for death from burns, with a global rate
of 3.9 deaths per 100,000 populations
(WHO, 2008). Majority of burns occur in low
and middle-income countries due to lack of
knowledge regarding prevention strategies
and lack of improvements in the care of
people affected by burns. Sri Lanka has a
high incidence of burn-related injuries
annually due to a combination of adverse
social, economic and cultural factors. The
management of burn injuries remains a
formidable public health problem (Lau,
2006). Burns are the fifth most common
cause of non-fatal childhood injuries in Sri
Lanka (Kumarapeli, 2010). Burn education
is a must to reduce the levels of morbidity
and mortality rate due to burns. The aim of
the study was to determine the effectiveness
of an awareness programme on burn
prevention and first aid for burns among
grade 10 students of type 1 and 2 schools in
Kesbewa area.
Methodology
The study was based on one group pretest
posttest design and it was conducted in six
selected schools. The sample size was 321,
assuming a prevalence knowledge regarding
burn prevention and first aid for burns of
50% among participants, for a precision of
0.05 and a confidence level of 95%. Stratified
random sampling and cluster sampling
methods used to select schools and
participants of the study. The previous
knowledge on burn prevention and first aid
methods were assessed initially using a pre-
tested self-administered questionnaire
which consisted of 4 parts. Part I was about
the socio-demographic details of students,
Part II comprised of past personal burn
injuries and sources of getting knowledge,
Part III consisted of 26 knowledge questions
on burn prevention and Part IV consisted of
13 questions on burn first aid methods. The
awareness programme, which was a
PowerPoint presentation regarding the
burns, burn causes, burn types according to
depth, knowledge on burn prevention and
first aid was conducted by the investigators
on the same day of pre- test. Following a
week of awareness programme, the post-
test was conducted. Descriptive frequencies
were used to describe the student's
knowledge of burn prevention and first aid
treatment. Paired sample t tests were
conducted to determine the effectiveness of
the programme. Ethical clearance was
obtained from the Ethical Review
Committee of the Faculty of Medicine,
General Sir John Kotelawala Defence
University, Rathmalana. Parents of the
participant were given an information sheet
and a consent form to ensure voluntary
participation of their child. Assent forms
were administered to the students to ensure
voluntary participation.
Results and Discussion
A total of 321 grade 10 students were
participated in this study. There were 188
(58.6%) boys and 133 (41.4%) girls. Out of
321 students, 197 (61%) have faced burn
injury previously and 19 (6%) of them were
admitted to the hospital for further
treatments. Furthermore, 114 (36%)
participants were in the opinion of “washing
the burn area under clean running water” is
the first action taken after the burn injury.
86 (27%) participants were applied various
applicants like butter, toothpaste, aloe vera
and egg etc to the burn area. Considering the
causes associated with the reported burn
injuries, more than 75% of burns were due
to the contact of hot liquid and hot objects
whereas, chemical and corrosive agents
were the least common cause of burns.
(Figure 1).
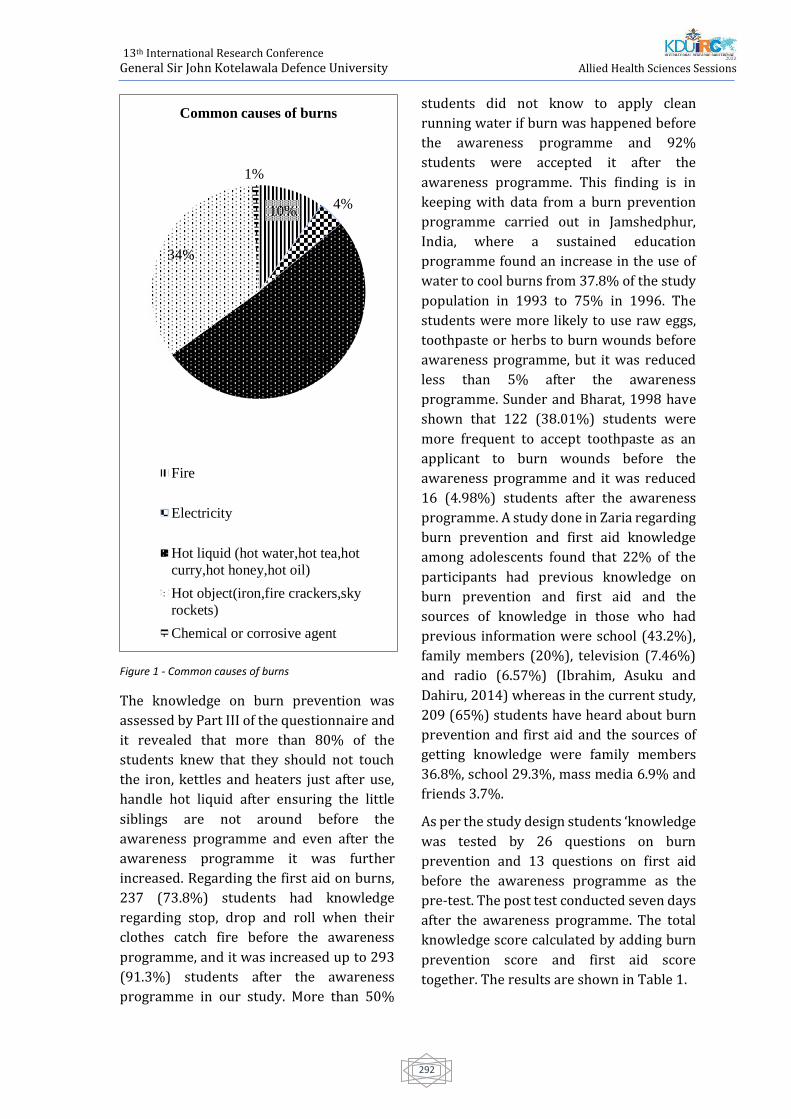
13th International Research Conference
General Sir John Kotelawala Defence University
Allied Health Sciences Sessions
292
Figure 1 - Common causes of burns
The knowledge on burn prevention was
assessed by Part III of the questionnaire and
it revealed that more than 80% of the
students knew that they should not touch
the iron, kettles and heaters just after use,
handle hot liquid after ensuring the little
siblings are not around before the
awareness programme and even after the
awareness programme it was further
increased. Regarding the first aid on burns,
237 (73.8%) students had knowledge
regarding stop, drop and roll when their
clothes catch fire before the awareness
programme, and it was increased up to 293
(91.3%) students after the awareness
programme in our study. More than 50%
students did not know to apply clean
running water if burn was happened before
the awareness programme and 92%
students were accepted it after the
awareness programme. This finding is in
keeping with data from a burn prevention
programme carried out in Jamshedphur,
India, where a sustained education
programme found an increase in the use of
water to cool burns from 37.8% of the study
population in 1993 to 75% in 1996. The
students were more likely to use raw eggs,
toothpaste or herbs to burn wounds before
awareness programme, but it was reduced
less than 5% after the awareness
programme. Sunder and Bharat, 1998 have
shown that 122 (38.01%) students were
more frequent to accept toothpaste as an
applicant to burn wounds before the
awareness programme and it was reduced
16 (4.98%) students after the awareness
programme. A study done in Zaria regarding
burn prevention and first aid knowledge
among adolescents found that 22% of the
participants had previous knowledge on
burn prevention and first aid and the
sources of knowledge in those who had
previous information were school (43.2%),
family members (20%), television (7.46%)
and radio (6.57%) (Ibrahim, Asuku and
Dahiru, 2014) whereas in the current study,
209 (65%) students have heard about burn
prevention and first aid and the sources of
getting knowledge were family members
36.8%, school 29.3%, mass media 6.9% and
friends 3.7%.
As per the study design students ‘knowledge
was tested by 26 questions on burn
prevention and 13 questions on first aid
before the awareness programme as the
pre-test. The post test conducted seven days
after the awareness programme. The total
knowledge score calculated by adding burn
prevention score and first aid score
together. The results are shown in Table 1.
10%4%
51%
34%
1%
Common causes of burns
Fire
Electricity
Hot liquid (hot water,hot tea,hot
curry,hot honey,hot oil)
Hot object(iron,fire crackers,sky
rockets)
Chemical or corrosive agent
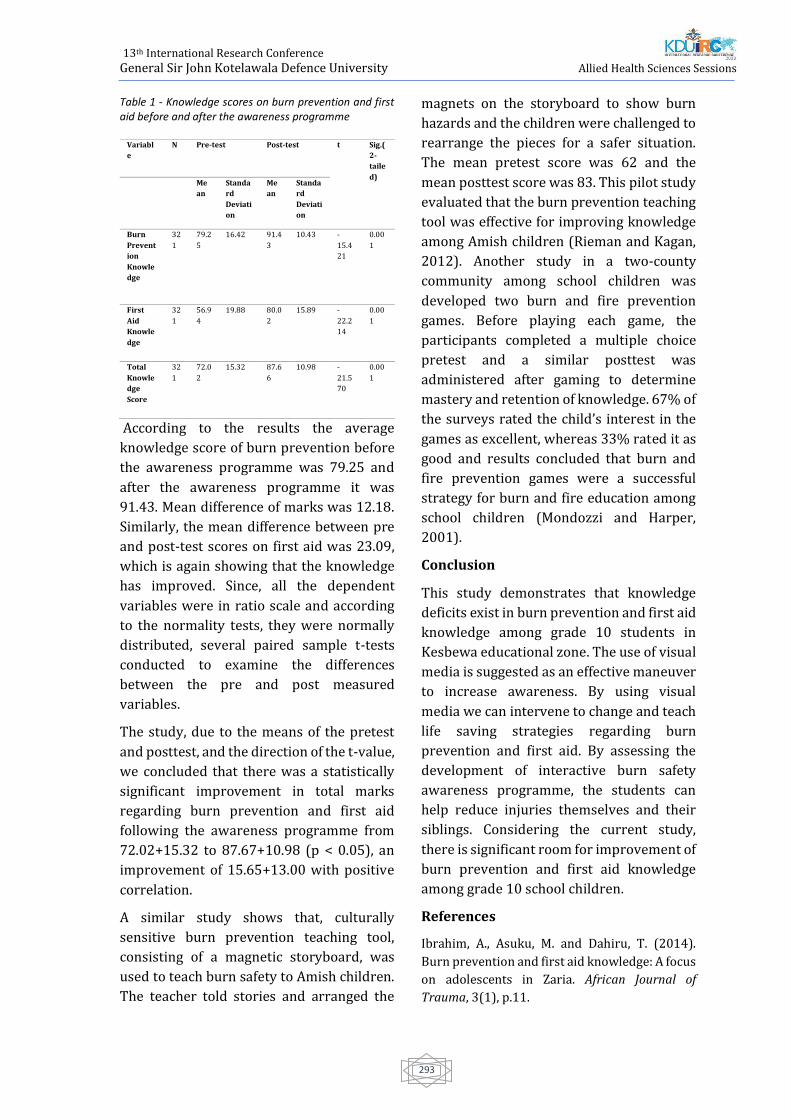
13th International Research Conference
General Sir John Kotelawala Defence University
Allied Health Sciences Sessions
293
Table 1 - Knowledge scores on burn prevention and first aid before and after the awareness programme
According to the results the average
knowledge score of burn prevention before
the awareness programme was 79.25 and
after the awareness programme it was
91.43. Mean difference of marks was 12.18.
Similarly, the mean difference between pre
and post-test scores on first aid was 23.09,
which is again showing that the knowledge
has improved. Since, all the dependent
variables were in ratio scale and according
to the normality tests, they were normally
distributed, several paired sample t-tests
conducted to examine the differences
between the pre and post measured
variables.
The study, due to the means of the pretest
and posttest, and the direction of the t-value,
we concluded that there was a statistically
significant improvement in total marks
regarding burn prevention and first aid
following the awareness programme from
72.02+15.32 to 87.67+10.98 (p < 0.05), an
improvement of 15.65+13.00 with positive
correlation.
A similar study shows that, culturally
sensitive burn prevention teaching tool,
consisting of a magnetic storyboard, was
used to teach burn safety to Amish children.
The teacher told stories and arranged the
magnets on the storyboard to show burn
hazards and the children were challenged to
rearrange the pieces for a safer situation.
The mean pretest score was 62 and the
mean posttest score was 83. This pilot study
evaluated that the burn prevention teaching
tool was effective for improving knowledge
among Amish children (Rieman and Kagan,
2012). Another study in a two-county
community among school children was
developed two burn and fire prevention
games. Before playing each game, the
participants completed a multiple choice
pretest and a similar posttest was
administered after gaming to determine
mastery and retention of knowledge. 67% of
the surveys rated the child’s interest in the
games as excellent, whereas 33% rated it as
good and results concluded that burn and
fire prevention games were a successful
strategy for burn and fire education among
school children (Mondozzi and Harper,
2001).
Conclusion
This study demonstrates that knowledge
deficits exist in burn prevention and first aid
knowledge among grade 10 students in
Kesbewa educational zone. The use of visual
media is suggested as an effective maneuver
to increase awareness. By using visual
media we can intervene to change and teach
life saving strategies regarding burn
prevention and first aid. By assessing the
development of interactive burn safety
awareness programme, the students can
help reduce injuries themselves and their
siblings. Considering the current study,
there is significant room for improvement of
burn prevention and first aid knowledge
among grade 10 school children.
References
Ibrahim, A., Asuku, M. and Dahiru, T. (2014).
Burn prevention and first aid knowledge: A focus
on adolescents in Zaria. African Journal of
Trauma, 3(1), p.11.
Variabl
e
N Pre-test Post-test
t Sig.(
2-
taile
d) Me
an
Standa
rd
Deviati
on
Me
an
Standa
rd
Deviati
on
Burn
Prevent
ion
Knowle
dge
32
1
79.2
5
16.42
91.4
3
10.43
-
15.4
21
0.00
1
First
Aid
Knowle
dge
32
1
56.9
4
19.88 80.0
2
15.89
-
22.2
14
0.00
1
Total
Knowle
dge
Score
32
1
72.0
2
15.32 87.6
6
10.98
-
21.5
70
0.00
1
13th International Research Conference
General Sir John Kotelawala Defence University
Allied Health Sciences Sessions
294
Kumarapeli, V. (2010). Welcome to
Epidemiology Unit official Website. [online]
Epid.gov.lk. Available at: http://www.epid.gov.lk
[Accessed 6 May 2019].
Lau, Y. (2006). An insight into burns in a
developing country: A Sri Lankan experience.
Public Health, 120(10), pp.958-965.
Mondozzi, M. and Harper, M. (2001). In Search of
Effective Education in Burn and Fire Prevention,
Journal of Burn Care & Rehabilitation, 22(4),
pp.277-281.
Rieman, M. and Kagan, R. (2012). Pilot Testing of
a Burn Prevention Teaching Tool for Amish
Children, Journal of Burn Care & Research, 33(2),
pp.265-271.
Sunder, S. and Bharat, R. (1998). Industrial burns
in Jamshedpur, India: Epidemiology, prevention
and first aid. Burns, 24(5), pp.444-447.
Who.int. (2018). Burns. [online] Available at:
https://www.who.int/news-room/fact-
sheets/detail/burns [Accessed 3 Jan. 2019].
World Health Organization. (2018). Burns.
[Online] Available at:
https://www.who.int/violence_injury_preventi
on/other_injury/burns/en/ [Accessed 3 Jan.
2019].
World Health Organization (2008) . The global
burden of disease: 2004 update. World Health
Organization.https://apps.who.int/iris/handle/
10665/43942
13th International Research Conference
General Sir John Kotelawala Defence University
Allied Health Sciences Sessions
295
Paper ID: 432
Knowledge and Awareness regarding Human Papilloma Virus
(HPV) infection and vaccination among adolescents aged 14 – 16
years in selected mixed Government Schools in Kesbewa
Educational Division, Sri Lanka.
HLC Ushara 1#, HMRR Wijesimghe1, V Vysnavy1, GGCR Malalagama1, MGCH Jayasekara1,
MN Priyadarshanie1 and Dr. GDI Rodrigo2
1Department of Nursing and Midwifery, General Sir John Kotelawala Defence University, Ratmalana, Sri
Lanka 2 Faculty of Medicine, General Sir John Kotelawala Defence University, Ratmalana, Sri Lanka
Abstract:-Human Papilloma Virus (HPV) is
the most prevalent sexually transmitted
infection worldwide. It causes cervical
cancer which is the second most common
cancer type among Sri Lankan women. HPV
vaccine has been introduced for early
adolescents in preventing HPV. Adequate
knowledge and awareness regarding HPV
and vaccine is effective in successful
prevention. The objective of this study was
to assess the knowledge and awareness
regarding HPV infection and vaccination
among adolescents aged 14-16 years
studied in selected mixed government
schools in Kesbewa Educational Division, Sri
Lanka. A descriptive cross-sectional study
was conducted among randomly selected
450 male and female adolescents aged 14-
16 years studied in selected mixed
government schools in Kesbewa
Educational Division using a pre tested self-
administered questionnaire. Results
portrayed that, only 139(30.89%)
participants had heard of HPV infection
before the study. Among them 113(81.3%)
had overall poor knowledge regarding HPV
infection. The mean knowledge score was
6.01±4.332 with the range of 0-18. Out of all
participants, only 137(30.4%) had heard of
HPV vaccine before the study and
117(85.4%) of them had overall poor
awareness on HPV vaccination. The mean
awareness score was 3.12±2.997 with the
range of 0-11. Adolescents’ knowledge and
awareness on HPV infection and vaccination
was statistically significant with parents’
occupation (p=0.000 95%CI). The study
concluded that the majority of adolescents
had overall poor knowledge and awareness
regarding HPV infection and vaccination. It
is necessary to implement well-designed,
systematic health education interventions to
enhance knowledge and awareness
regarding HPV infection and vaccination
among adolescents.
Key Words: Knowledge, awareness, HPV
infection, HPV vaccination, cervical cancer.
Introduction
Human Papilloma Virus (HPV) is the most
prevalent sexually transmitted infection
worldwide, affecting more than 6.2 million
individuals every year (Bosch et al., 2002). It
causes cervical cancer which is the second
most common cancer type among Sri
Lankan women. More than 90% of cervical
cancer among women in Asia and more than
99% of cervical cancers among Sri Lankan
women are caused by HPV (WHO,2013). It
also recognized as the causative agent for
other cancer types such as anal, vulva,
penile, vaginal and oropharyngeal cancers
(Giuliano et al., 2014). This virus is
transmitted via sexual contact where sexual
behavior is the main factor associated with
13th International Research Conference
General Sir John Kotelawala Defence University
Allied Health Sciences Sessions
296
high rates of acquisition of HPV infection
among sexually active women. Furthermore,
genital HPV infection is acquired by direct
skin contact during sexual intercourse with
a person who has either clinical or
subclinical infection (Harper et al., 2004).
Recognition of the role of HPV in cervical
cancer has stimulated a search for
preventive vaccines with the hope and an
option of controlling of cervical cancer
worldwide. Thus, HPV vaccine which is
introduced in preventing HPV infection has
been introduced in many countries
including Sri Lanka for early adolescent
population as the risk of invading HPV and
other related infections are increasing in
that age group (WHO,2017). Therefore,
adequate knowledge and awareness of HPV
infection, vaccine and the vaccination
process are effective for this programme to
be a success.
Objectives
To assess knowledge and awareness
regarding HPV infection and vaccination
among adolescents aged 14-16 years,
studying in selected mixed government
schools in Kesbewa Educational Division.
Material and Methods
A descriptive cross-sectional study was
conducted among 450 male and female
adolescents aged 14-16 years studying in
selected mixed government schools in
Kesbewa Educational Division. Data was
collected using a pre-tested self-
administered questionnaire from 4th of June
to13th of September 2019. Three mixed
schools were randomly selected by
including one from each school category
named as Type 1 AB, Type C and Type 2.
Stratified random sampling method was
performed to collect a representative
sample of adolescents. Adolescents from
each school were selected proportionately
to the total sample size. Out of them, number
of male and female adolescents from each
selected school were selected
proportionately to the total number of male
and female students in the respective grade.
A number of representatives from each
grade of 9, 10 and 11 were selected
proportionately to the total number of
students in each grade in the particular
school. A single representative from each
grade was selected by using a systematic
random sampling method with a sampling
interval of 3. Data was entered and analyzed
using SPSS version 23.
Descriptive statistics (frequency,
percentage tables) and Chi square test were
used for the analysis. Statistical significance
level was considered 95% of Confidence
Interval (CI). All socio demographical data,
knowledge and awareness on HPV as well as
associations of socio demographic factors
with HPV infection and vaccination were
presented using tables and graphs.
A scoring system was developed to allocate
a score for each response of the close ended
questionnaire which was developed on the
knowledge and awareness on HPV infection
and vaccination among adolescents with
responses as in order to categorize their
knowledge level and awareness level. The
total score received to knowledge level and
awareness level was calculated separately.
Based on the score received for each
component, overall categorization was done
in two levels of knowledge and awareness
using an approved category namely “poor
and good” (Bowyer et al., 2012).
Ethical approval was obtained from the
Ethics Review Committee (ERC) of the
Faculty of Medicine, General Sir John
Kotelawala Defence University, Rathmalana.
Permission was also obtained from the
Zonal Director of Piliyandala Zonal
Educational Office and principals of relevant
schools through the Zonal Director to
conduct the study. Every participants were
13th International Research Conference
General Sir John Kotelawala Defence University
Allied Health Sciences Sessions
297
given an information sheet with consent
form to ensure the voluntary participation.
Results and Discussion
The study sample consisted of 450
adolescents aged 14-16 years from three
different schools in Kesbewa Educational
Division as 90 (20%) from type 1AB, 90
(20%) from type 2 and 270 (60%) students
from type 1C schools. Majority of
respondents were male adolescents (60%,
n=270) and 33.33% (n=150) of students
were enrolled from each grade. All the
participants were Sinhalese with a majority
of Buddhist (98%, n=441). Majority of
parents, were non health care workers
(97.1%, n=437). The most common
educational level of adolescents’ fathers and
mothers was up to O/L (54.9%, n=247 and
61.3%, n=276 respectively).
Out of the total respondents (n=450), only
139 (30.89%) had heard of HPV infection
prior commencing the study. Among them
the majority (81.3%, n=113) had poor
overall knowledge regarding HPV infection.
The mean knowledge score was (6.01±
4.332) with a range of 0-18. And also,
adolescents’ knowledge on carcinogenic
association of HPV with gender, mode of
transmission, consequences related to HPV
infection, risk factors and preventive
measures was also not at a satisfactory level.
Similar studies conducted in Sweden,
Hungary and Greece had reported
respectively, 5.4%, 35% and 42.8% of
adolescents had heard of HPV infection
before commencing the study (Hoglund et
al., 2009; Marek et al., 2011 and Vaidakis et
al., 2017). Contrary to the above findings,
Sopracordevole et al. (2012), Gerend and
Magloire (2008) and Kasymova, Harrison
and Pascal (2019) had reported that the
awareness of HPV infection was relatively
good among the study participants with the
majority of 75%, 78% and 95.3%
adolescents had heard of HPV infection prior
to the study.
Out of the total study participants (n=450),
only 137 (30.4%) had heard of HPV vaccine
before conducting the study. Of them 22.7%
had obtained awareness through mass
media. However, the majority (85.4%,
n=117) had poor overall awareness on HPV
vaccination. The mean awareness score was
(3.12 ± 2.997) with a range of 0-11. They
also had an inadequate awareness of HPV
vaccination procedure practicing in Sri
Lanka. Participants’ willingness for
receiving education on HPV and receiving
vaccination against HPV was also assessed.
However, the majority (63.6%, n=286) of
adolescents interested in HPV education
while the minority (25.8%, n=116)
interested in receiving HPV vaccine. Similar
studies conducted in Sweden and Italy
reported that awareness on HPV vaccine
before conducting the study was 1.1% and
42% respectively. (Hoglund et al., 2009; Di
Giuseppe et al., 2008). In contrast,
Sopracordevole et al. (2012) noted that 94.4
%of girls and 71.3% of boys had heard of
HPV vaccine prior to the study and Blodt et
al. (2011) also indicated a good awareness of
HPV vaccine where 96.5% of females and
78.8% males had heard on HPV vaccine
before the study. Accordingly, their main
source of information was reported as
public media (Gerend and Magloire, 2008),
school health promotion campaigns and
school health services (Patel et al., 2016;
Marek et al., 2011) and health care providers
(Kasymova, Harrison and Pascal, 2008).
A statistically significant association was
observed between adolescents’ knowledge
on HPV infection and vaccination with the
occupation of the parents (p=0.000, 95% CI).
Also, grades in which adolescents studied
was significantly associated with their
awareness on HPV vaccination (p=0.014,
95% CI). In parallel to the current study,
gender of the adolescents was also
13th International Research Conference
General Sir John Kotelawala Defence University
Allied Health Sciences Sessions
298
statistically significant with knowledge
regarding HPV infection. Accordingly,
females possess higher knowledge than men
(Gerend and Magloire, 2008; Marek et al.,
2016; Patel et al., 2009 and Blodt et al.,
2011). Furthermore, Kasymova, Harrison
and Pascal (2019) had reported that both
male and female gender (p=0.005, 95% CI)
and race (p=0.004, 95% CI) were
statistically significant with knowledge and
awareness regarding HPV infection and
vaccination. Vaidakis et al. (2017) stated
that both gender (p=001, 95% CI) and area
of resident (p=0.001, 95% CI) showed a
statistically significant with knowledge
about HPV infection and vaccination where
male adolescents from rural areas were less
likely to know about the vaccine than girls
and adolescent from urban area.
Conclusion
As per the finding of the current study, only
a small proportion of adolescents included
in the study had heard of HPV infection and
vaccination prior to commencing the study.
Of them the majority had overall poor
knowledge and awareness of the
carcinogenic association of HPV infection
with gender, modes of transmission,
consequences related to HPV infection, risk
factors, high risk sexual behaviors,
importance of regular screening, preventive
measures, precautions after vaccinations,
and current vaccination procedure against
HPV infection in Sri Lanka.
References,
Bosch, FX, Lorincz, A., Munoz, N., Meijer, C.J.L.M.
and Shah, K.V., (2002). The causal relation
between human papillomavirus and cervical
cancer. Journal of clinical pathology, 55(4),
pp.244-265.
Bowyer, H.L., Marlow, L.A., Hibbitts, S., Pollock,
K.G. and Waller, J., 2013. Knowledge and
awareness of HPV and the HPV vaccine among
young women in the first routinely vaccinated
cohort in England. Vaccine, 31(7), pp.1051-1056.
D. Gamage, L. Rajapaksa, N. Abeysinghe, and A. de
Silva, Prevalence of Carcinogenic Human
Papilloma Virus Infection and burden of cervical
cancer attributable to it in the District of
Gampaha, Sri Lanka. (2012).
Gerend, M.A. and Magloire, Z.F., 2008.
Awareness, knowledge, and beliefs about human
papillomavirus in a racially diverse sample of
young adults. Journal of Adolescent Health, 42(3),
pp.237-242.
Kasymova, S., Harrison, S.E. and Pascal, C., 2019.
Knowledge and awareness of human
papillomavirus among college students in South
Carolina. Infectious Diseases: Research and
Treatment, 12, p.1178633718825077.
Marek, E., Dergez, T., Rebek-Nagy, G., Kricskovics,
A., Kovacs, K., Bozsa, S., Kiss, I., Ember, I. and
Gocze, P., 2011. Adolescents’ awareness of HPV
infections and attitudes towards HPV
vaccination 3 years following the introduction of
the HPV vaccine in Hungary. Vaccine, 29(47),
pp.8591-8598
Ministry of Health and Indigenous Medicine, Sri
Lanka, 2015 Family Health Bureau, Sri Lanka
(Online) Available at: http://fhb.health.gov.lk
[Accessed 21 June 2019].
Samarawickrema, N.A., Tabrizi, S.N.,
Hewavisenthi, J., Leong, T. and Garland, S.M.,
(2011). Distribution of human papillomavirus
genotypes in archival cervical tissue from
women with cervical cancer in urban Sri Lanka.
International Journal of Gynecology & Obstetrics,
115(2), pp.180-182.
Sankaranarayanan, R., Bhatla, N., Gravitt, P.E.,
Basu, P., Esmy, P.O., Ashrafunnessa, K.S.,
Ariyaratne, Y., Shah, A. and Nene, B.M., (2008).
Human papillomavirus infection and cervical
cancer prevention in India, Bangladesh, Sri
Lanka and Nepal. Vaccine, 26, pp.M43-M52.
Shanaka, K.A.S.N., Wilathgamuwa, S.,
Gunawardene, Y.I.N.S. and Dassanayake, R.S.,
2018. Prevalence of human papilloma virus and
their high-risk genotypes in Sri Lankan women.
Virusdisease, 29(1), pp.27-31.
Vaidakis, D., Moustaki, I., Zervas, I., Barbouni, A.,
Merakou, K., Chrysi, M.S., Creatsa, G. and
Panoskaltsis, T., 2017. Knowledge of Greek
adolescents on human papilloma virus (HPV)

13th International Research Conference
General Sir John Kotelawala Defence University
Allied Health Sciences Sessions
299
and vaccination: A national epidemiologic study.
Medicine, 96(1).
13th International Research Conference
General Sir John Kotelawala Defence University
Allied Health Sciences Sessions
300
Paper ID: 449
Comparative in vitro bioequivalence evaluation of atenolol
tablets available in Sri Lanka
#T K K de Silva, L C P T Liyanaarachchie, H M D R Herath
Department of Pharmacy, Faculty of Allied Health Sciences, University of Peradeniya, Sri Lanka
Department of Pharmacy and Pharmaceutical Sciences, Faculty of Allied Health Sciences, University of Sri
Jayewardenepura, Sri Lanka #[email protected]
Abstract: The availability of multiple brands
for a single drug places health professionals
and patients in a dilemma of drug
substitution. Hence, evaluating
bioequivalence of different brands compared
to respective innovator drug is a timely need.
This study was performed to compare the in
vitro bioequivalence of commercially
available brands of atenolol 50 mg tablets in
the Sri Lankan market. Four different brands
of atenolol 50 mg tablets (A1 – A4) and the
innovator drug (A5) were selected for the
study. All the tablets were tested for
organoleptic properties, uniformity of
weight, thickness and diameter, hardness,
friability, assay percentage and dissolution.
To evaluate in vitro bioequivalence of the
selected drugs, their dissolution profiles
were compared with the innovator drug
using calculated fit factors (difference and
similarity factors) and dissolution
efficiencies of respective brands. The results
of organoleptic properties of all the tested
tablets showed no sign of defects. Tablets’
thickness, diameter and hardness complied
with the general standards. All the tested
tablets complied with the British
Pharmacopoeial (BP) standards for
uniformity of weight, friability, assay
percentage and dissolution. Tablets; A1-A4
had similarity factors above 50 and the
difference factors below 15 revealing that
their dissolution profiles are similar to the
innovator product. According to the
dissolution efficiency calculations, only A1,
A2, and A3 of the selected brands of atenolol
50 mg tablets were similar with the
innovator. Hence, the brands; A1, A2 and A3
could be regarded as bioequivalent thus
expected to produce similar therapeutic
effects.
Keywords: Bioequivalence, Atenolol,
Tablets, in vitro
Introduction
Availability of several brands of a drug places
health practitioners and patients in
problematic situations like which one to be
selected or is it possible to substitute with
another brand.(Tamader, Y. E.; Mosbah, A. E.
M.; Redab, 2016) New brands of the same
drug from multiple sources are coming to the
market time to time. Additionally, a number
of undesirable clinical responses have also
been reported as a result of batch-batch
inconsistencies.(Thambavita et al., 2018) So,
it is essential to monitor the quality of
pharmaceutical products regularly.
Antihypertensive drugs are one of the drug
categories that large extent of different
brands are available in the market with
significant price variations.(Kumar et al.,
2015) Therefore, it is essential to compare
and evaluate the bioequivalence of such
drugs. Based on the wide usage, availability
of several brands and price variations,
atenolol tablets were selected for this study.
In vivo bioequivalence studies are time
consuming, difficult and very expensive.
Therefore, in vitro bioequivalence studies
are established to check the bioequivalence
among generics and brands. According to the
Biopharmaceutics Classification System
13th International Research Conference
General Sir John Kotelawala Defence University
Allied Health Sciences Sessions
301
(BCS), atenolol can be categorized as a class
III drug substance.(Guidance for Industry
Dissolution Testing of Immediate Release
Solid Oral Dosage Forms, 1997) In class III, in
vitro – in vivo correlation can be expected
only for rapidly dissolving drug substances.
Atenolol is regarded as a rapidly dissolving
drug, therefore in vitro bioequivalence
studies through dissolution profiles can be
applied in order to waive in vivo
bioequivalence studies.
Materials and Methodology
The five brands of atenolol 50 mg tablets
(coded as A1, A2, A3, A4 and A5) were used
for the study. A5 was the reference drug.
Following tests were performed for all the
tablets,
• visual observations for organoleptic
properties
• test for thickness and diameter
• test for uniformity of weight
• hardness test
• friability test
• assay percentages
• dissolution test
Dissolution profiles were compared using fit
factors (f1 & f2) and dissolution efficiency
(DE) to evaluate in vitro bioequivalence of
the selected drugs. Equations for f2, f1 and
DE calculations are given below (Equation 1,
2 and 3)
Equation 1
𝑓2 = 50𝑙𝑜𝑔{[1 +1
𝑛∑(𝑅𝑡 − 𝑇𝑡)
2
𝑛
𝑡=1
]
−0.5
× 100}
Equation 2
𝑓1 = { |𝑅𝑡 − 𝑇𝑡|𝑛𝑡=1
𝑅𝑡𝑛𝑡=1
} × 100
Equation 3
𝐷𝐸 =∫ 𝑦. 𝑑𝑡𝑡2𝑡1
𝑦100 × (𝑡2 − 𝑡1)× 100
Results and Discussion
The visual inspection for colour, shape and
surface texture of all the atenolol 50 mg
tablets showed no sign of defects.
The physicochemical parameters of the
tested atenolol 50 mg tablets are listed in
Table 1.
Table 1: Evaluated physicochemical parameters of atenolol 50 mg tablets
Tested brands
Mean DE (%) with CIS
DE CIS
A1 77.74 (81.44 – 74.04)
-4.95 1.37
A2 72.90 (75.27 – 70.53)
-0.11 4.88
A3 76.51 (82.28 – 70.75)
-3.72 4.66
A4 70.88 (80.80 – 60.96)
1.91 14.45
A5 72.79 (75.41 – 70.17)
0.0 0
Mean DE is the mean value of dissolution
efficiencies calculated for each of the 6
vessels of the dissolution apparatus.
DE = DE of innovator – DE of test
brand
CIS = 95% Confidence Intervals
CIS = maximum possible mean DE
value of innovator - minimum possible mean
DE value of test brand
This study shows that the price variation of
the tablets tested may not be due to the
quality of the product. However, the quality
of ingredients, excipients and packaging
materials in all these tablet formulas may not
be the same. Therefore, stability and side
effect profiles may vary. Even though some
drugs comply with all routine quality control
13th International Research Conference
General Sir John Kotelawala Defence University
Allied Health Sciences Sessions
302
tests and BP specifications, they may fail in
bioequivalence studies.
Conclusion
The conventional quality control tests
performed in this study indicated that all the
selected brands of atenolol 50 mg tablets are
chemically and pharmaceutically equivalent
to the innovator brand. However, according
to the in vitro bioequivalence studies, only
A1, A2 and A3 are similar with its innovator
drug; therefore bioequivalent.
References
Anderson, N. H. et al. (1998) ‘An evaluation of fit
factors and dissolution efficiency for the
comparison of in vitro dissolution profiles’,
Journal of Pharmaceutical and Biomedical
Analysis. J Pharm Biomed Anal, 17(4–5), pp. 811–
822. doi: 10.1016/S0731-7085(98)00011-9.
Cunha, R. et al. (2016) ‘Analysis of spironolactone
polymorphs in active pharmaceutical ingredients
and their effect on tablet dissolution profiles’,
Article Brazilian Journal of Pharmaceutical
Sciences, 52(4). doi: 10.1590/S1984-
82502016000400005.
Dabare, P. R. L., Wanigatunge, C. A. and
Beneragama, B. H. (2014) ‘A national survey on
availability, price and affordability of selected
essential medicines for non communicable
diseases in Sri Lanka’, BMC Public Health. BioMed
Central Ltd., 14(1), p. 817. doi: 10.1186/1471-
2458-14-817.
Guidance for Industry Dissolution Testing of
Immediate Release Solid Oral Dosage Forms
(1997). Available at:
https://www.fda.gov/media/70936/download
(Accessed: 9 June 2020).
Kumar, R. et al. (2015) ‘The extent of price
variation amongst branded antihypertensive
drugs and its association with number of
pharmaceutical companies’, International Journal
of Research in Medical Sciences. Medip Academy,
pp. 2800–2806. doi: 10.18203/2320-
6012.ijrms20150689.
Tamader, Y. E.; Mosbah, A. E. M.; Redab, B. et al
(2016) ‘Comparative In-Vitro Evaluation of
Commercial Simvastatin Tablet (20mg)’,
International Journal of Pharmaceutical Sciences
and Research, 7(6), pp. 2402–2409. doi:
10.13040/IJPSR.0975-8232.7(6).2402-09.
Thambavita, D. et al. (2018) ‘Application of
biowaiver methodology for a post-marketing
study of generic and brand name metronidazole
tablets’, Dissolution Technologies, 25(2), pp. 34–
38. doi: 10.14227/DT250218P34.
Yang, Y. et al. (2007) ‘Biopharmaceutics
Classification of Selected β-blockers: Solubility
and permeability class membership’, Molecular
Pharmaceutics. Mol Pharm, 4(4), pp. 608–614.
doi: 10.1021/mp070028i.
13th International Research Conference
General Sir John Kotelawala Defence University
Allied Health Sciences Sessions
303
Paper ID: 451
Parental Feeding Styles Of Preschoolers In A Semi-Urban Setting In
Kurunegala District
#BGMS Jayawardhana, and KLMD Seneviwickrama
Department of Allied Health Sciences, Faculty of Medical Sciences, University of Sri Jayewardenepura, Sri
Lanka Department of Community Medicine, Faculty of Medical Sciences, University of Sri Jayewardenepura, Sri
Lanka # [email protected]
Abstract: Parental feeding style influences the
nutritional status, growth, development,
health and survival of preschool children. The
objective of this study was to describe the
parental feeding styles in selected preschools
in a semi-urban setting in Sri Lankan context.
A descriptive cross-sectional study was
conducted among randomly selected 306
parent-preschooler pairs in selected
preschools in Ibbagamuwa Divisional
Secretariat in Kurunegala district. Validated,
interviewer administered, 27-item, Parental
Feeding Style Questionnaire (PFSQ) on a five
point Likert scale was used to assess four
common feeding styles: Encouragement to Eat
(EE), Control over Eating (CE), Emotional
Feeding (EF) and Instrumental Feeding (IF).
Mean scores were calculated for each scale
which had a possible range between 1-5 with
higher scores indicating a tendency for a
particular feeding style. All data were
analyzed using SPSS version 25. The mean age
of the parents was 34.86 years (SD=4.93). The
majority were mothers (N=250, 81.7%)
educated up to Ordinary Level (N=117,
38.2%) with an average monthly income
between Rs.30, 000-50,000 (N=133, 43.5%).
The mean age was 58.06 months (SD=7.62).
Majority were girls (N=164, 53.6%) with
normal weight for height (50.0%, N=153).
Mean scores for each feeding style were EE:
4.25 (SD=0.55), CE: 3.2 (SD=0.61), EF: 2.76
(SD=0.92) and IF: 2.35 (SD=0.78). Prominent
parental feeding styles were Encouragement
to Eat and Control over Eating. No gender
differences were observed in parental feeding
styles.
Keywords: Parental feeding styles, Preschool
children, Parental Feeding Style Questionnaire
(PFSQ)
Introduction
Feeding is a process that involves interactions
between parents and children. It is a key
aspect in parenting. Parental feeding practices
are specific behavioural strategies that
parents use to control what, how much and
when their children eat (Gandhi., 2014).
Parental feeding practices are mainly
categorized into two domains as positive and
negative feeding styles. Parental feeding style
is a major determinant of child eating
behaviours (Nowicka et al., 2020). Future
health depends on behaviours adapted during
childhood. Preschool period, defined as the
age between three to five years (Dias et al.,
2020), is regarded as an important stage in the
life cycle during which establishment of such
behaviours starts. Globally, overweight and
obesity among children are on the rise. In
addition, those with childhood obesity have an
increased risk of diet related non-
communicable diseases such as,
cardiovascular diseases, cancer and diabetes
mellitus during their adult life (Jansen et al.,
2012). Sri Lanka is having a very high disease
burden due to diet related non-communicable
diseases (WHO, 2018). The effect of parental
feeding styles on children’s eating behaviours
is not being adequately explored in the Sri
13th International Research Conference
General Sir John Kotelawala Defence University
Allied Health Sciences Sessions
304
Lankan context. The objective of the study is to
describe the parental feeding styles among
preschoolers in Sri Lanka.
Methodology
A descriptive cross-sectional study was
conducted among 306 parent child pairs
selected using a multi-stage cluster sampling
method from 15 preschools in Ibbagamuwa
divisional secretariat in Kurunegala district
during September to October in 2019.
Children aged 3-5 years in each preschool
were included into the study. Exclusion
criteria included children who were on long
term treatment for chronic diseases
(recurrent episodes of bronchial asthma,
thalassemia, malignancies), identified with
learning difficulties and physical disabilities
and 0parents with communication barriers
(ie. hearing problems, psychiatric conditions
and language barriers). An interviewer-
administered questionnaire consisting of both
open and closed ended questions was used as
the data collection instrument to obtain basic
data regarding socio-demographic
characteristics and parental feeding styles.
Four common parental feeding styles assessed
by 27-item, validated Parental Feeding Style
Questionnaire (PFSQ) included: Instrumental
Feeding (4 items) (feeding children in
response to their behaviour, using
Food as a reward, e.g., “I reward my child with
something to eat when she is well-behaved”),
Emotional
feeding (5 items) (feeding children in
response to their emotions, offering food to
soothe the child’s negative emotions, e.g., “I
give my child something to eat to make him
feel better when he is upset”), Encouragement
to eat (8 items) (encouraging children to
consume a variety of foods, e.g., “I praise my
child if she eats what I give her”), and Control
over eating (10 items) (controlling the child’s
food intake, determining the types and
quantities of foods that children should
consume, e.g., “I decide how many snacks my
child should have”) (Lipowska et al., 2018).
Each item was scored on a five-point Likert
scale (1 for Never and 5 for Always). The mean
score with SD was calculated for each scale.
Five out of ten items in Control over Eating
were reverse scored before calculating the
mean. The possible range for mean score on
each scale was 1-5. Height and weight were
measured according to standard operational
protocol of National Health and Nutrition
Examination Survey (NHANES., 2017).
Children were categorized into 3 weight for
height Z score categories based on WHO child
growth standards (WHO, n.d.)
Prior to commencement of the study, approval
was obtained from the Ethics Review
Committee of the Faculty of Medical Sciences,
University of Sri Jayewardenepura and from
Divisional Secretariat of Ibbagamuwa and
relevant preschool teachers. All data were
analyzed using SPSS version 25. Descriptive
statistics like frequencies, proportions, mean
(SD) and box and whiskers plots were used to
describe the findings of the study.
Results and Discussion
There were 306 parents and child pairs.
Majority of the parents were mothers (N=250,
81.7%). The mean age of the parents was
34.86 (SD + 4.938) and most of them were
Sinhalese (N=302, 98.7%), studied up to
Ordinary Level (N=117, 38.2%) with an
average monthly income between Rs.30, 000-
50,000 (N=133, 43.5). The mean age of the
preschool children was 58.06 months (SD
=7.619). Most of the preschoolers were girls
(N=164, 53.6%). Fifty percent of the
preschoolers (N = 153) belonged to healthy
weight for height. Nearly half (49.0%, N = 150)
of the children were in < -2SD.
Distribution of PFSQ mean scores according to
the parental feeding style is shown in Table 1.
Parental feeding style which recorded the
highest score was Encouragement to Eat (M =
4.25, SD=0.554). Based on the PFSQ mean
scores, most parents reported a comparatively
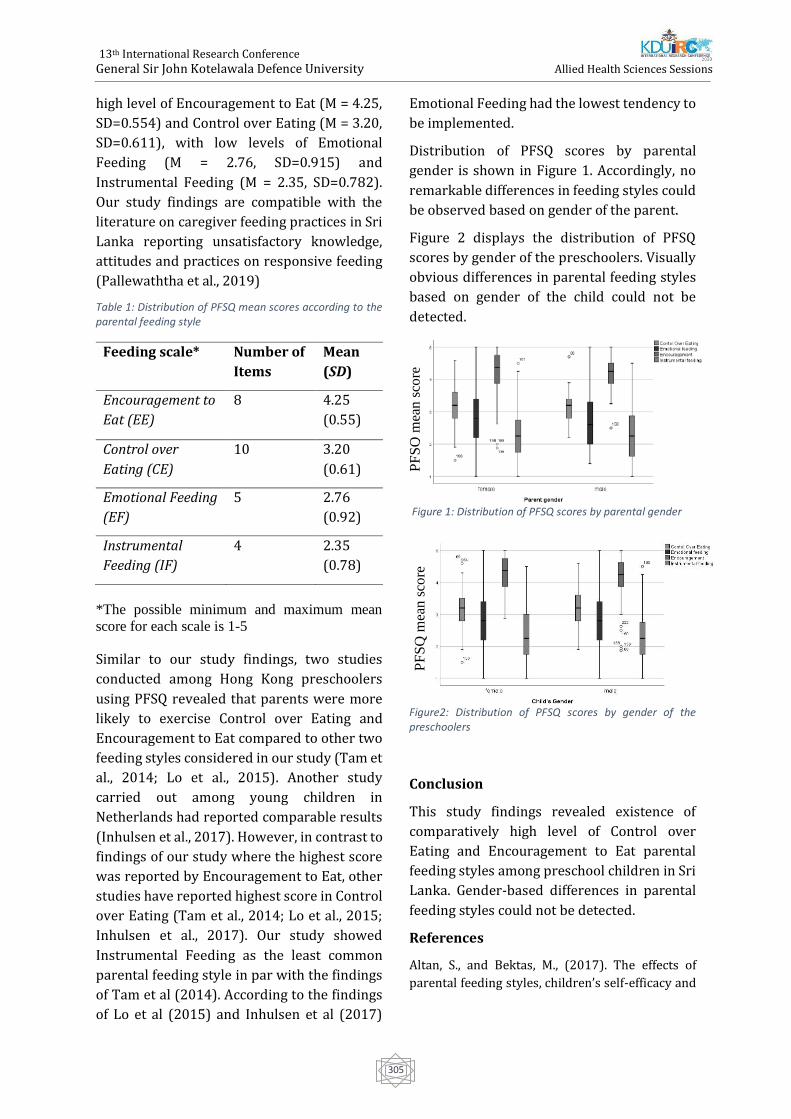
13th International Research Conference
General Sir John Kotelawala Defence University
Allied Health Sciences Sessions
305
high level of Encouragement to Eat (M = 4.25,
SD=0.554) and Control over Eating (M = 3.20,
SD=0.611), with low levels of Emotional
Feeding (M = 2.76, SD=0.915) and
Instrumental Feeding (M = 2.35, SD=0.782).
Our study findings are compatible with the
literature on caregiver feeding practices in Sri
Lanka reporting unsatisfactory knowledge,
attitudes and practices on responsive feeding
(Pallewaththa et al., 2019)
Table 1: Distribution of PFSQ mean scores according to the parental feeding style
Feeding scale* Number of
Items
Mean
(SD)
Encouragement to
Eat (EE)
8 4.25
(0.55)
Control over
Eating (CE)
10 3.20
(0.61)
Emotional Feeding
(EF)
5 2.76
(0.92)
Instrumental
Feeding (IF)
4 2.35
(0.78)
*The possible minimum and maximum mean
score for each scale is 1-5
Similar to our study findings, two studies
conducted among Hong Kong preschoolers
using PFSQ revealed that parents were more
likely to exercise Control over Eating and
Encouragement to Eat compared to other two
feeding styles considered in our study (Tam et
al., 2014; Lo et al., 2015). Another study
carried out among young children in
Netherlands had reported comparable results
(Inhulsen et al., 2017). However, in contrast to
findings of our study where the highest score
was reported by Encouragement to Eat, other
studies have reported highest score in Control
over Eating (Tam et al., 2014; Lo et al., 2015;
Inhulsen et al., 2017). Our study showed
Instrumental Feeding as the least common
parental feeding style in par with the findings
of Tam et al (2014). According to the findings
of Lo et al (2015) and Inhulsen et al (2017)
Emotional Feeding had the lowest tendency to
be implemented.
Distribution of PFSQ scores by parental
gender is shown in Figure 1. Accordingly, no
remarkable differences in feeding styles could
be observed based on gender of the parent.
Figure 2 displays the distribution of PFSQ
scores by gender of the preschoolers. Visually
obvious differences in parental feeding styles
based on gender of the child could not be
detected.
Figure 1: Distribution of PFSQ scores by parental gender
Figure2: Distribution of PFSQ scores by gender of the preschoolers
Conclusion
This study findings revealed existence of
comparatively high level of Control over
Eating and Encouragement to Eat parental
feeding styles among preschool children in Sri
Lanka. Gender-based differences in parental
feeding styles could not be detected.
References
Altan, S., and Bektas, M., (2017). The effects of
parental feeding styles, children’s self-efficacy and
PF
SQ
mea
n s
core
P
FS
Q m
ean
sco
re
13th International Research Conference
General Sir John Kotelawala Defence University
Allied Health Sciences Sessions
306
social anxiety on adolescent obesity. Brazilian
Journal of Nutrition, 30(6), pp.759-769.
Centers for Disease Control and Prevention (2014).
National Health and Nutrition Examination Survey
(NHANES): Anthropometry Procedures Manual.
CA: Createspace Independent Pub
Dias, G., Panduwawala, P., Posonmali, B.,
Ranaweera, H., De Alwis, S., Prathapan, S. and
Liyanage, G. (2018). Caregiver Feeding Styles And
Their Effect On Behaviour And Activity Of A Cohort
Of Preschool Children In 4 Selected Schools In The
Colombo District Of Sri Lanka. Sri Lanka Journal of
Child Health, 2018; 47: 215-218
Duncanson, K., Burrows, T. and Collins, C. (2016).
Child Feeding and Parenting Style Outcomes and
Composite Score Measurement in the ‘Feeding
Healthy Food to Kids Randomised Controlled Trial’.
Children, 3(4), p.28.
Ek, A., Sorjonen, K., Eli, K., Lindberg, L., Nyman, J.,
Marcus, C. and Nowicka, P. (2016). Associations
between Parental Concerns about Preschoolers’
Weight and Eating and Parental Feeding Practices:
Results from Analyses of the Child Eating Behavior
Questionnaire, the Child Feeding Questionnaire,
and the Lifestyle Behavior Checklist. PLOS ONE,
11(1), p.e0147257.
Gandhi, S., Godara, N., Modi, A. and Kantharia, S.,
2014. Impact of feeding practices on nutritional
status of children in rural area of Navsari district.
International Journal of Medical Science and Public
Health, 3(11), p.1338.
Inhulsen, M.B.M., Mérelle, S.Y. and Renders, C.M.
(2017). Parental feeding styles, young children’s
fruit, vegetable, water and sugar-sweetened
beverage consumption, and the moderating role of
maternal education and ethnic background. Public
health nutrition, 20(12), pp.2124-2133.
Jansen, P., Roza, S., Jaddoe, V., Mackenbach, J., Raat,
H., Hofman, A., Verhulst, F. and Tiemeier, H.,
(2012). Children's Eating Behavior, Feeding
Practices Of Parents And Weight Problems In Early
Childhood: Results From The Population-Based
Generation R Study. International Journal of
Behavioral Nutrition and Physical Activity 2012,
9:130
Lipowska, M., Lipowski, M., Jurek, P., Jankowska,
A.M. and Pawlicka, P. (2018). Gender and body-fat
status as predictors of parental feeding styles and
children’s nutritional knowledge, eating habits and
behaviours. International journal of environmental
research and public health, 15(5), p.852.
Lo, K., Cheung, C., Lee, A., Tam, W. and Keung, V.
(2015). Associations between Parental Feeding
Styles and Childhood Eating Habits: A Survey of
Hong Kong Pre-School Children. PLOS ONE, 10(4),
p.e0124753.
Nowicka, P., Sorjonen, K., Pietrobelli, A., Flodmark,
C. and Faith, M. (2020). Parental Feeding Practices
And Associations With Child Weight Status.
Swedish Validation Of The Child Feeding
Questionnaire Finds Parents Of 4-Year-Olds Less
Restrictive. Appetite 81 (2014) 232–241
Pallewaththa, P., Agampodi, S.B., Agampodi, T.C.,
Siribaddana, S.H. (2019). Knowledge, attitudes, and
practices of responsive feeding in rural Sri Lanka
(A qualitative study). Ceylon Medical Journal; 64:
70-75, DOI:
http://doi.org/10.4038/cmj.v64i2.8894
Tam, W., Keung, V., Lee, A., Lo, K. and Cheung, C.
(2014). Chinese translation and validation of a
parental feeding style questionnaire for parents of
Hong Kong preschoolers. BMC Public Health, 14(1),
p.1194.
World Health Organization (n.d.). Child growth
standards: weight-for-height. Available at:
https://www.who.int/childgrowth/standards/we
ight_for_height/en/
World Health Organization (2018). Sri Lanka: Noncommunicable Diseases (NCD) Country Profiles, 2018. Available at: https://www.who.int/nmh/countries/lka_en.pdf?ua=1
13th International Research Conference
General Sir John Kotelawala Defence University
Allied Health Sciences Sessions
307
Paper ID: 468
Expectations Of Patients Who Underwent Chemotherapy For Breast
Cancers In Apeksha Hospital Maharagama
AAA Dushmanthi#, WASM Wijesooriya, JPTSW Jayalath, HPMD Thilakarathna, MGR
Malkanthi, DMND Senevirathna and AN Senanayaka
Department of Nursing and Midwifery, Faculty of Allied Health Sciences, General Sir John Kotelawala
Defence University, Sri Lanka
Faculty of Medicine, General Sir John Kotelawala Defence University, Sri Lanka
Abstract:-Breast cancer is the most common
cancer among females all around the world
and in Sri Lanka. Patients receiving
chemotherapy have reported several side
effects and can affect for health status of
patients leading many issues. Therefore, the
aim of the study was to assess the patient’s
expectations while having chemotherapy for
breast cancers in Apeksha Hospital
Maharagama which can be an aid in
addressing the above issues as health care
workers. It is the fifth leading cause of deaths
(627 000,(6.6%) among all cancers. One of the
main treatment options is chemotherapy.
Total of 207 were selected by simple random
sampling. Data were collected through
interviewer administered questionnaire and
analyzed via SPSS. Mean age was 54, and
91.3% were married. Participants expected
further knowledge and support of the health
staff during treatments. Television and
newspapers were the most important sources
of information. 96.1% of participants were
expecting to share all the information about
their treatment with the family members or
care givers. 12.6% of the participants were
expected privacy to discuss their health
problems. Majority, of 90.8%, were expecting
a contact number to get information in an
emergency or to solve their problems. Most of
the respondents (80.7%) prefer to have
further explanations on drugs that they
received to take home for the management of
side effects of chemotherapy. Out of the total
sample ,96.6% of the patients reported that
they were expecting to get more explanations
regarding side effect management from
nursing officers.
Keywords: Expectations, Chemotherapy,
Breast cancers
Introduction
Breast cancer is the fifth leading cause of
deaths (627000,6.6%) among all cancer types.
According to the Global cancer observatory in
2019, the reported number of new cases in
2018 are 24% of all the female cancer types in
Sri Lanka. One of the main treatment options
for cancer is chemotherapy. It causes number
of side effects and regressions for patients.
Considering their expectations on
chemotherapy treatment we can help to
release their regressions and improve
effectiveness of chemotherapy. Also, evidence-
based practice is more effective than normal
health care practice. Expectations are
identified by using researches and findings
and it is more useful for the betterment of the
patient’s health and enhancement of palliative
care.
Methodology
This study was conducted at Apeksha Hospital
Maharagama Sri Lanka. It was a descriptive
cross-sectional study. Sample size was 207.
They were selected by simple random
sampling method. The data were collected
using pre-tested interviewer administered
questionnaire. The questionnaire consisted of
two sections. Section A assessed socio
13th International Research Conference
General Sir John Kotelawala Defence University
Allied Health Sciences Sessions
308
demographic variables. Section B consists of
three parts. It included,
1) Part I - Questions to assess the
knowledge on chemotherapy for breast
cancer.
2) Part II - Questions to assess the
expectation of chemotherapy.
3) Part III - Questions to assess the
experiences of chemotherapy
treatment.
Data analysis was done using the computer
Statistical Package for Social Sciences (SPSS)
Version 23. Descriptive statistics were used
for data analysis. Chi-square was applied to
test the differences between selected
variables.
Results
Socio-demographic characteristics. The study
sample consisted of 207 participants. Age
categories were divided as below. 9 (20-30)
4.35%, 18(31-40) 8.69%, 48(41-50) 23.19%,
57(51-60) 27.54%,61(61-70) 29.47% and
14(71-80) 6.76% mean age was 54.74. Also,
out of the study sample, highest number of
study participants were belonged to Sinhala
ethnic group 186 (89.9%), and 9 (4.3%) were
belong to Tamils, and 8 (3.9%) were belong to
Muslims and remaining 4 (1.9%) were the
others. Considering religious groups, majority
of the participants were Buddhist 159
(76.8%), and others 34 (16.4%) were Catholic,
Islamic 9 (4.3%) and Hindus were 5 (2.4%)
respectively. When we consider the marital
status, out of the study participants
189(91.3%) were married females, 13 (6.3%)
were single, 4 (1.9%) were widowed and one
participant (0.5%) was divorced and
regarding the level of education, highest
number of study participants have been
educated up to O/L and A/L 151 (72.9%),
nearly 20% of participants were educated
below grade 8, And 16 (7.7%) were graduates.
Knowledge on chemotherapy for breast
cancer. Most patients 164 (79.2%) knew that
chemotherapy is a type of cancer treatment
that uses one or more anti-cancer drugs with
the aim to prolong life or to reduce symptoms.
3 (1.4%) told that chemotherapy is exposure
to the X-Rays, 8(3.9%) answered that
chemotherapy is a relaxation technique,
1(0.5%) told that chemotherapy is a surgical
treatment. Also, out of all respondents few 15
(7.2%) knew the names of the drugs given.
Most of the patients 192 (92.8%) did not know
the names of chemotherapy medications.
Regarding knowledge on pre medications,
majority (79.2%) knew that pre medications
prevent side effects of chemotherapy during
their treatment period. According to the study
results, 142(68.6%) participants tend to get
medical advices immediately when they get
high fever. It shows that the others should be
advised on the importance of taking medical
advice immediately. In conclusion, 122
(58.9%) had a good knowledge on
chemotherapy, 66 (31.9%) had average
knowledge on chemotherapy and 19 (9.2%)
had poor knowledge on chemotherapy.
Experience on chemotherapy. According to
final study results, majority of the participants
126 (60.9%) had plenty of time to give their
consent before chemotherapy. 17 (8.2%)
participants were expected more time to give
their consent. 25 (12.1%) of participants had
not given enough time to think of
chemotherapy treatment. 39 (18.8%) of
participants could not be able to memorize it.
When we consider the side effects, 52.2% of
participants had experienced pain while but
47.8% of participants had not. Weight loss
56% of participants said no and 43% said yes.
57% of participants said that they had
experienced nausea and vomiting during
treatment period. 68.1% of patients were
affected by constipation. Specially 86% of
patients have experienced appetite changes
and 87% of participants have experienced hair
loss during treatment period. And,
194(93.7%) of participants had a chance to
have a discussion on their health issues with
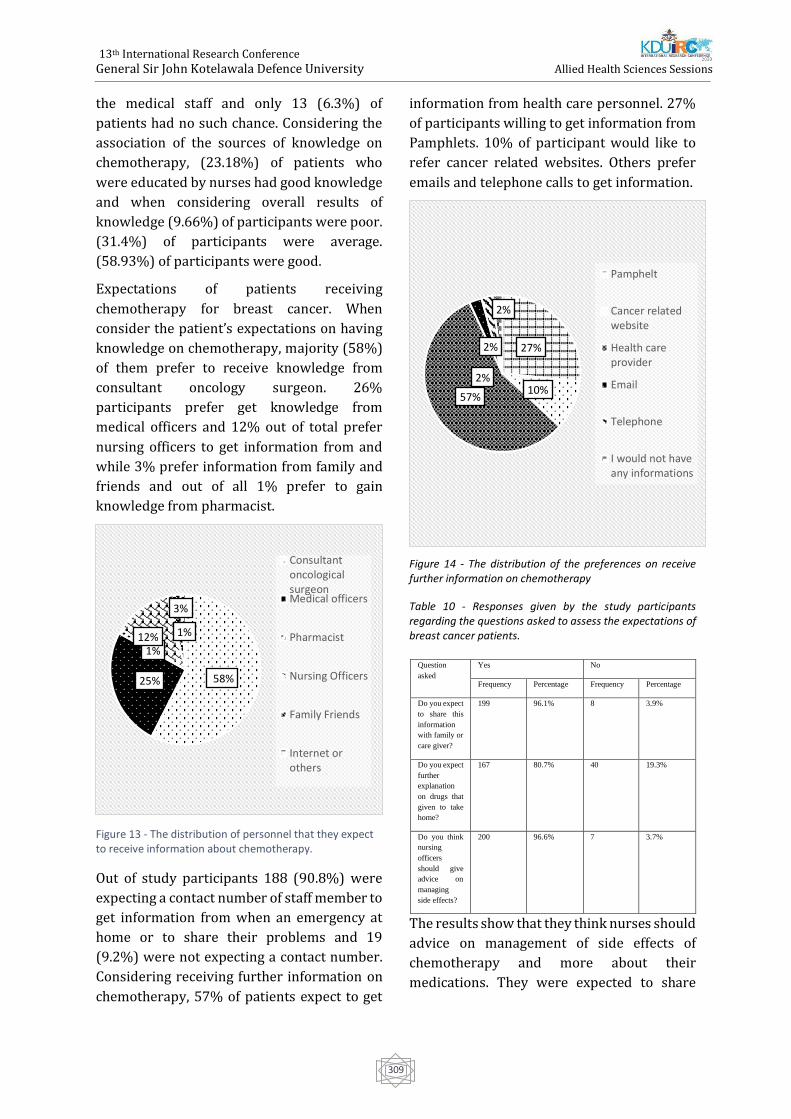
13th International Research Conference
General Sir John Kotelawala Defence University
Allied Health Sciences Sessions
309
the medical staff and only 13 (6.3%) of
patients had no such chance. Considering the
association of the sources of knowledge on
chemotherapy, (23.18%) of patients who
were educated by nurses had good knowledge
and when considering overall results of
knowledge (9.66%) of participants were poor.
(31.4%) of participants were average.
(58.93%) of participants were good.
Expectations of patients receiving
chemotherapy for breast cancer. When
consider the patient’s expectations on having
knowledge on chemotherapy, majority (58%)
of them prefer to receive knowledge from
consultant oncology surgeon. 26%
participants prefer get knowledge from
medical officers and 12% out of total prefer
nursing officers to get information from and
while 3% prefer information from family and
friends and out of all 1% prefer to gain
knowledge from pharmacist.
Figure 13 - The distribution of personnel that they expect to receive information about chemotherapy.
Out of study participants 188 (90.8%) were
expecting a contact number of staff member to
get information from when an emergency at
home or to share their problems and 19
(9.2%) were not expecting a contact number.
Considering receiving further information on
chemotherapy, 57% of patients expect to get
information from health care personnel. 27%
of participants willing to get information from
Pamphlets. 10% of participant would like to
refer cancer related websites. Others prefer
emails and telephone calls to get information.
Figure 14 - The distribution of the preferences on receive further information on chemotherapy
Table 10 - Responses given by the study participants regarding the questions asked to assess the expectations of breast cancer patients.
The results show that they think nurses should
advice on management of side effects of
chemotherapy and more about their
medications. They were expected to share
58%25%
1%12%
3%
1%
ConsultantoncologicalsurgeonMedical officers
Pharmacist
Nursing Officers
Family Friends
Internet orothers
Question
asked
Yes No
Frequency Percentage Frequency Percentage
Do you expect
to share this
information
with family or
care giver?
199 96.1% 8 3.9%
Do you expect
further
explanation
on drugs that
given to take
home?
167 80.7% 40 19.3%
Do you think
nursing
officers
should give
advice on
managing
side effects?
200 96.6% 7 3.7%
27%
10%57%
2%
2%
2%
Pamphelt
Cancer relatedwebsite
Health careprovider
Telephone
I would not haveany informations
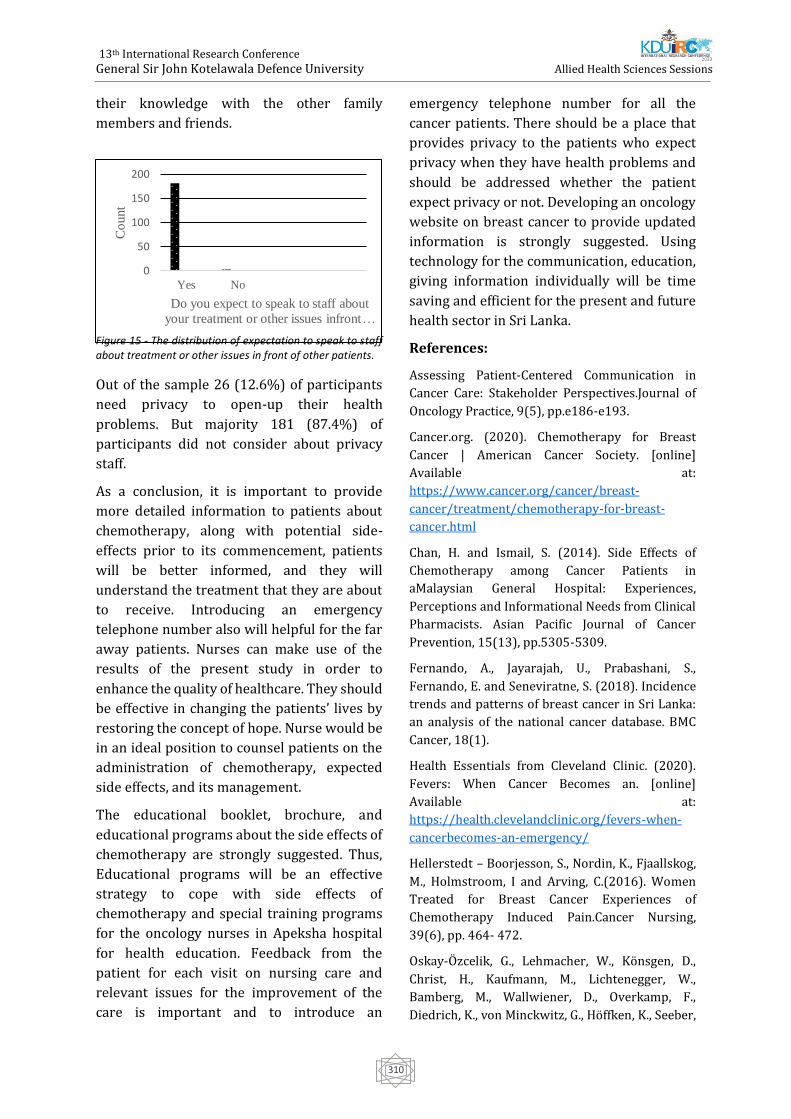
13th International Research Conference
General Sir John Kotelawala Defence University
Allied Health Sciences Sessions
310
0
50
100
150
200
Yes No
Co
unt
Do you expect to speak to staff about
your treatment or other issues infront …
their knowledge with the other family
members and friends.
Figure 15 - The distribution of expectation to speak to staff about treatment or other issues in front of other patients.
Out of the sample 26 (12.6%) of participants
need privacy to open-up their health
problems. But majority 181 (87.4%) of
participants did not consider about privacy
staff.
As a conclusion, it is important to provide
more detailed information to patients about
chemotherapy, along with potential side-
effects prior to its commencement, patients
will be better informed, and they will
understand the treatment that they are about
to receive. Introducing an emergency
telephone number also will helpful for the far
away patients. Nurses can make use of the
results of the present study in order to
enhance the quality of healthcare. They should
be effective in changing the patients’ lives by
restoring the concept of hope. Nurse would be
in an ideal position to counsel patients on the
administration of chemotherapy, expected
side effects, and its management.
The educational booklet, brochure, and
educational programs about the side effects of
chemotherapy are strongly suggested. Thus,
Educational programs will be an effective
strategy to cope with side effects of
chemotherapy and special training programs
for the oncology nurses in Apeksha hospital
for health education. Feedback from the
patient for each visit on nursing care and
relevant issues for the improvement of the
care is important and to introduce an
emergency telephone number for all the
cancer patients. There should be a place that
provides privacy to the patients who expect
privacy when they have health problems and
should be addressed whether the patient
expect privacy or not. Developing an oncology
website on breast cancer to provide updated
information is strongly suggested. Using
technology for the communication, education,
giving information individually will be time
saving and efficient for the present and future
health sector in Sri Lanka.
References:
Assessing Patient-Centered Communication in
Cancer Care: Stakeholder Perspectives.Journal of
Oncology Practice, 9(5), pp.e186-e193.
Cancer.org. (2020). Chemotherapy for Breast
Cancer | American Cancer Society. [online]
Available at:
https://www.cancer.org/cancer/breast-
cancer/treatment/chemotherapy-for-breast-
cancer.html
Chan, H. and Ismail, S. (2014). Side Effects of
Chemotherapy among Cancer Patients in
aMalaysian General Hospital: Experiences,
Perceptions and Informational Needs from Clinical
Pharmacists. Asian Pacific Journal of Cancer
Prevention, 15(13), pp.5305-5309.
Fernando, A., Jayarajah, U., Prabashani, S.,
Fernando, E. and Seneviratne, S. (2018). Incidence
trends and patterns of breast cancer in Sri Lanka:
an analysis of the national cancer database. BMC
Cancer, 18(1).
Health Essentials from Cleveland Clinic. (2020).
Fevers: When Cancer Becomes an. [online]
Available at:
https://health.clevelandclinic.org/fevers-when-
cancerbecomes-an-emergency/
Hellerstedt – Boorjesson, S., Nordin, K., Fjaallskog,
M., Holmstroom, I and Arving, C.(2016). Women
Treated for Breast Cancer Experiences of
Chemotherapy Induced Pain.Cancer Nursing,
39(6), pp. 464- 472.
Oskay-Özcelik, G., Lehmacher, W., Könsgen, D.,
Christ, H., Kaufmann, M., Lichtenegger, W.,
Bamberg, M., Wallwiener, D., Overkamp, F.,
Diedrich, K., von Minckwitz, G., Höffken, K., Seeber,
13th International Research Conference
General Sir John Kotelawala Defence University
Allied Health Sciences Sessions
311
S., Mirz, R. and Sehouli, J. (2007). Breast cancer
patients' expectations in respect of the physician–
patient relationship and treatment management
results of a survey of 617 patients. Annals of
Oncology, 18(3), pp.479-484.
Tierney, A., Taylor, J. and Closs, S. (1992).
Knowledge, Expectations and Experiences of
Patients receiving Chemotherapy for Breast
Cancer. Scandinavian Journal of Caring Sciences,
6(2), pp.7580.
World Cancer Research Fund. (2019). Breast
cancer statistics. [online] Available
at:https://www.wcrf.org/dietandcancer/cancer-
trends/breast-cancer-statistics
13th International Research Conference
General Sir John Kotelawala Defence University
Allied Health Sciences Sessions
312
Paper ID: 476
Knowledge, Attitudes And Practices On Antibiotic Therapy Among
Parents Of Children Admitted To A Specialized Children’s Hospital In
Sri Lanka #[email protected]
Abstract:- Antibiotics are used to prevent and
treat bacterial infections. It is mostly
prescribed for sick children globally than for
adults. Antibiotic resistance is a critical global
health issue. Over-prescription and
inappropriate self-medication are the main
culprits of antibiotic resistance. The objective
of this study was to assess knowledge,
attitudes and practices regarding antibiotic
therapy among the parents of children getting
admitted to a specialized children’s hospital in
Sri Lanka. A descriptive cross sectional study
was carried out with 403 participants at
Sirimavo Bandaranayake Specialized
Children’s Hospital, Sri Lanka from January to
March, 2020. A pre-tested, self-administered
questionnaire was used to collect data.
Participants had 51.85% overall knowledge
on scale. Urban parents had higher knowledge
(59%) than rural parents. 67% have never
heard of antibiotic resistance and 69% have
never received health education on
antibiotics. 25% recognized that antibiotics
can treat bacterial infections. Amoxicillin was
the mostly identified antibiotic. 80.9%
responded that antibiotics cure viral flu.
Majority (64%) strongly agreed that parents
should be further educated on pediatric
antibiotic use. Parents had good attitudes
(78.21%) and practices (71.27%) in using
antibiotics. The study concludes that Sri
Lankan parents have moderate knowledge but
they have achieved good attitudes and
practices. Parental health education on
antibiotics was critically poor. Parents believe
that they should be further educated on
judicious antibiotic use. Majority never self-
medicate antibiotics to children without
physicians’ prescription. Physicians were the
main source of information, and involvement
of nurses and other healthcare professionals
was low. Telecommunication minimally
contributes in community health education on
antibiotics.
Keywords: Antibiotics, Parents, Paediatric,
Antibiotic resistance, Knowledge
Introduction - Antibiotics are medicines,
which are used to prevent and treat bacterial
infections as defined by the World Health
Organization-WHO (World Health
Organization, 2018). One of the major causes
to seek medical advices world widely is acute
illnesses in children (Williams et al., 2018).
They are more prone to get infectious diseases
than adults and it is often difficult to
etiologically diagnose them because of the
non-specific manifestations of infections.
Therefore, the microbiological tests are more
appropriate for the infected children to
confirm their definitive indication and to
decide the initiation of rational antibiotic
therapies (Chaw et al., 2018). The evidence
shows that, globally, the most common
prescription drugs given to children are
antibiotics(Vangay et al., 2015). Antibiotic
resistance is a rapidly emerging global public
health crisis, especially in countries where
resources of health care are limited (Williams
et al., 2018)(Chaw et al., 2018)(Van Hecke et
al., 2019)(Hsia et al., 2019)(McMullan et al.,
2019)(Fink et al., 2020)(Schrier et al., 2018).
In developing countries where health facilities
such as laboratory testing facilities for the
community are limited, the bacterial species
such as Streptococcus, Salmonella and
Helicobacter pylori have reported antibiotic
resistant patterns. In these countries, the
infectious diseases are common and hold
higher rates (Chaw et al., 2018). Inappropriate
13th International Research Conference
General Sir John Kotelawala Defence University
Allied Health Sciences Sessions
313
prescribing of antibiotics for children can be
commonly noted during regular clinical
practice in clinical setup (McMullan et al.,
2019)(Choe and Shin, 2019). According to
WHO, self-medication can be defined as using
pharmaceutical or medicinal products by the
consumer to treat self-recognized disorders or
symptoms, the intermittent or continued use
of a medication previously prescribed by a
physician for chronic or recurring disease or
symptom, or the use of medication
recommended by lay sources or health
workers not entitled to prescribe medicine
(Arulmoli, Sivachandiran and Perera, 2009). It
increases inappropriate use of antibiotics,
further leading to antibiotic resistance (Al-
Dosari, 2013). Antimicrobial stewardship
program is the most appropriate strategy to
prevent antimicrobial resistance and has been
recognized as the key intervention to promote
effective and proper prescribing of antibiotics.
But there is a remarkable lack of assessment
to evaluate the effectiveness of AMS program
(McMullan et al., 2019). It focuses on
improving the quality of treatment by
initiating appropriate use of antibiotics and
reducing its’ over use (Schrier et al., 2018).
Inappropriate parental education, fewer
number of children in the family, and less
exposure to sources of health information,
especially social media and
telecommunication, are significant reasons of
weak parental knowledge on antibiotics.
Generally, the existing misconceptions and
inappropriate knowledge lead parents to
misuse antibiotics and promote self-
prescribing patterns. The parents do not
consider the fact that some illness of children
do not require antibiotic treatments. Parents
expect the physicians to prescribe antibiotics
to sick children even though it is not needed
(Hernández-Díaz et al., 2019).
The results reflect the sources of information
which help parents to gain the knowledge
regarding antibiotic use and the risk of
developing antibiotic resistance among
children due to misuse of antibiotics. It helps
to evaluate the effectiveness of current
antibiotic related health educational
interventions and programs in Sri Lanka.
Furthermore this is helpful in designing and
updating health educational interventions and
antibiotic guidelines using modern
telecommunication methods and social media
to approach the parents of children as well as
the general population of Sri Lanka.
Objective - The general objective of this study
is to assess the knowledge, attitudes and
practices regarding antibiotic therapy among
the parents of children admitted to a
specialized hospital in Sri Lanka.
Methodology - A descriptive cross sectional
study was conducted at the medical wards of
Sirimavo Bandaranayake Specialized
Children’s Hospital, Peradeniya, Sri Lanka
from January to March, 2020. 403 parents of
children who were admitted to the medical
wards participated. Parents who were
illiterate in Sinhala or Tamil were excluded
from the study. A pre-tested, self-
administered, structured questionnaire was
used to collect data. The collected data was
arranged in a MS Excel spread sheet. IBM SPSS
Statistics version 21 was used to analyze data.
Results and discussion - Among total 403
participants, there were 389 (96.5%) mothers.
Majority of the participants were educated up
to advanced level, Sinhala (88.3%), and living
in rural sector (74.4%). Most families received
a gross monthly income between 25,001-
50,000LKR. 26.6% were working mothers. Sri
Lankan parents in this study had overall
51.85% knowledge on antibiotics on the scale,
which is greater than the assessed overall
knowledge in rural Chinese parents (39%).
Similarly to the Chinese study, urban Sri
Lankan parents showed higher overall
knowledge (59.37%) than rural (50%) and
estate living (43.88%) parents (Yu et al.,
2014). More than half (69%) of parents
responded that they have never received
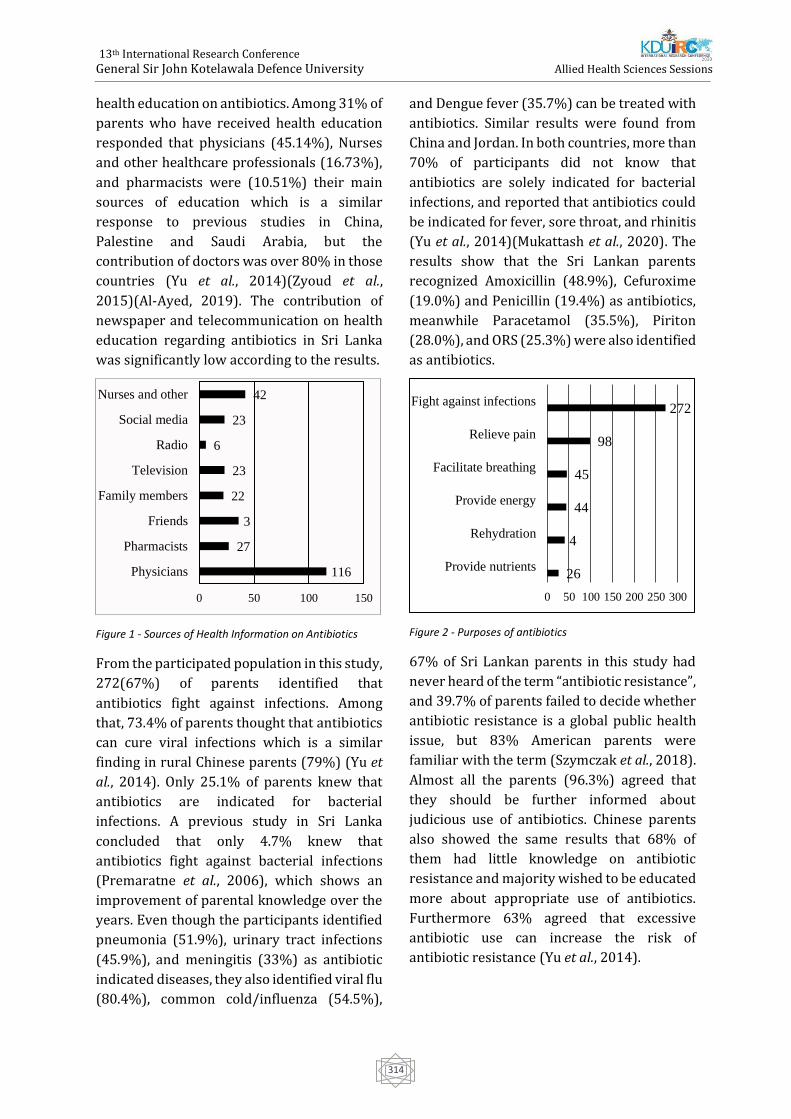
13th International Research Conference
General Sir John Kotelawala Defence University
Allied Health Sciences Sessions
314
health education on antibiotics. Among 31% of
parents who have received health education
responded that physicians (45.14%), Nurses
and other healthcare professionals (16.73%),
and pharmacists were (10.51%) their main
sources of education which is a similar
response to previous studies in China,
Palestine and Saudi Arabia, but the
contribution of doctors was over 80% in those
countries (Yu et al., 2014)(Zyoud et al.,
2015)(Al-Ayed, 2019). The contribution of
newspaper and telecommunication on health
education regarding antibiotics in Sri Lanka
was significantly low according to the results.
Figure 1 - Sources of Health Information on Antibiotics
From the participated population in this study,
272(67%) of parents identified that
antibiotics fight against infections. Among
that, 73.4% of parents thought that antibiotics
can cure viral infections which is a similar
finding in rural Chinese parents (79%) (Yu et
al., 2014). Only 25.1% of parents knew that
antibiotics are indicated for bacterial
infections. A previous study in Sri Lanka
concluded that only 4.7% knew that
antibiotics fight against bacterial infections
(Premaratne et al., 2006), which shows an
improvement of parental knowledge over the
years. Even though the participants identified
pneumonia (51.9%), urinary tract infections
(45.9%), and meningitis (33%) as antibiotic
indicated diseases, they also identified viral flu
(80.4%), common cold/influenza (54.5%),
and Dengue fever (35.7%) can be treated with
antibiotics. Similar results were found from
China and Jordan. In both countries, more than
70% of participants did not know that
antibiotics are solely indicated for bacterial
infections, and reported that antibiotics could
be indicated for fever, sore throat, and rhinitis
(Yu et al., 2014)(Mukattash et al., 2020). The
results show that the Sri Lankan parents
recognized Amoxicillin (48.9%), Cefuroxime
(19.0%) and Penicillin (19.4%) as antibiotics,
meanwhile Paracetamol (35.5%), Piriton
(28.0%), and ORS (25.3%) were also identified
as antibiotics.
Figure 2 - Purposes of antibiotics
67% of Sri Lankan parents in this study had
never heard of the term “antibiotic resistance”,
and 39.7% of parents failed to decide whether
antibiotic resistance is a global public health
issue, but 83% American parents were
familiar with the term (Szymczak et al., 2018).
Almost all the parents (96.3%) agreed that
they should be further informed about
judicious use of antibiotics. Chinese parents
also showed the same results that 68% of
them had little knowledge on antibiotic
resistance and majority wished to be educated
more about appropriate use of antibiotics.
Furthermore 63% agreed that excessive
antibiotic use can increase the risk of
antibiotic resistance (Yu et al., 2014).
116
27
3
22
23
6
23
42
0 50 100 150
Physicians
Pharmacists
Friends
Family members
Television
Radio
Social media
Nurses and other
26
4
44
45
98
272
0 50 100 150 200 250 300
Provide nutrients
Rehydration
Provide energy
Facilitate breathing
Relieve pain
Fight against infections
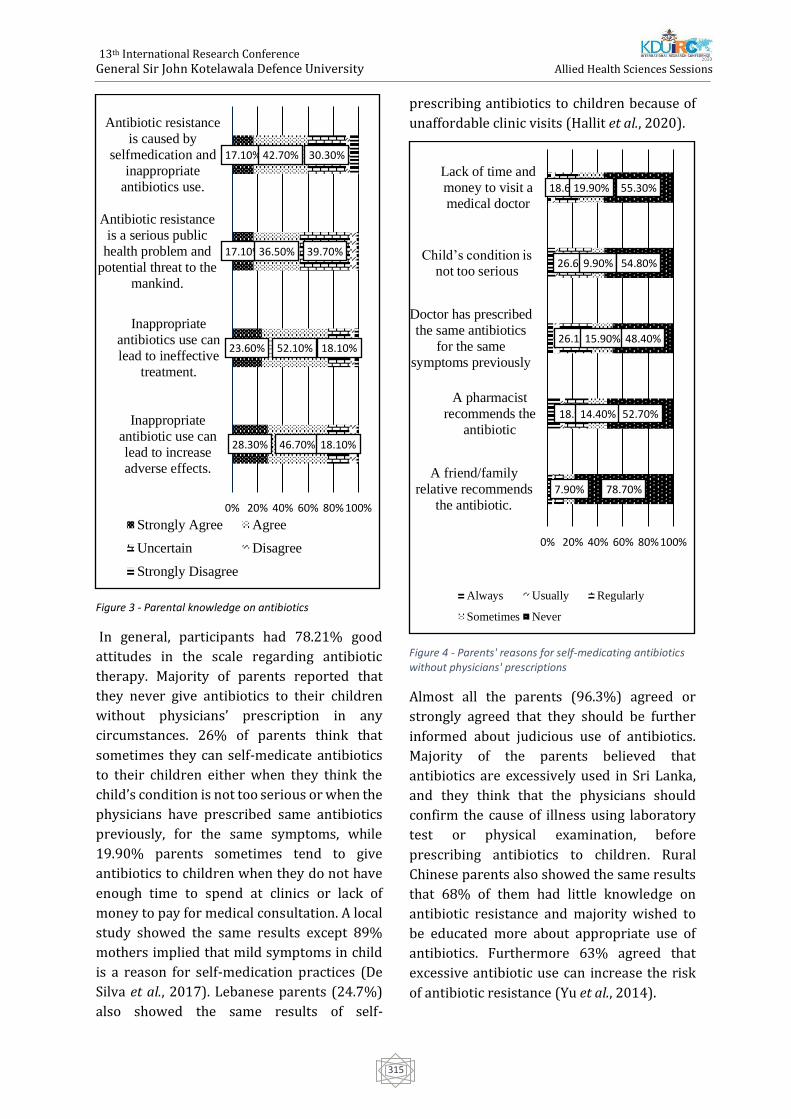
13th International Research Conference
General Sir John Kotelawala Defence University
Allied Health Sciences Sessions
315
Figure 3 - Parental knowledge on antibiotics
In general, participants had 78.21% good
attitudes in the scale regarding antibiotic
therapy. Majority of parents reported that
they never give antibiotics to their children
without physicians’ prescription in any
circumstances. 26% of parents think that
sometimes they can self-medicate antibiotics
to their children either when they think the
child’s condition is not too serious or when the
physicians have prescribed same antibiotics
previously, for the same symptoms, while
19.90% parents sometimes tend to give
antibiotics to children when they do not have
enough time to spend at clinics or lack of
money to pay for medical consultation. A local
study showed the same results except 89%
mothers implied that mild symptoms in child
is a reason for self-medication practices (De
Silva et al., 2017). Lebanese parents (24.7%)
also showed the same results of self-
prescribing antibiotics to children because of
unaffordable clinic visits (Hallit et al., 2020).
Figure 4 - Parents' reasons for self-medicating antibiotics without physicians' prescriptions
Almost all the parents (96.3%) agreed or
strongly agreed that they should be further
informed about judicious use of antibiotics.
Majority of the parents believed that
antibiotics are excessively used in Sri Lanka,
and they think that the physicians should
confirm the cause of illness using laboratory
test or physical examination, before
prescribing antibiotics to children. Rural
Chinese parents also showed the same results
that 68% of them had little knowledge on
antibiotic resistance and majority wished to
be educated more about appropriate use of
antibiotics. Furthermore 63% agreed that
excessive antibiotic use can increase the risk
of antibiotic resistance (Yu et al., 2014).
28.30%
23.60%
17.10%
17.10%
46.70%
52.10%
36.50%
42.70%
18.10%
18.10%
39.70%
30.30%
0% 20% 40% 60% 80% 100%
Inappropriate
antibiotic use can
lead to increase
adverse effects.
Inappropriate
antibiotics use can
lead to ineffective
treatment.
Antibiotic resistance
is a serious publichealth problem and
potential threat to the
mankind.
Antibiotic resistance
is caused by
selfmedication andinappropriate
antibiotics use.
Strongly Agree Agree
Uncertain Disagree
Strongly Disagree
18.90%
26.10%
26.60%
18.60%
7.90%
14.40%
15.90%
9.90%
19.90%
78.70%
52.70%
48.40%
54.80%
55.30%
0% 20% 40% 60% 80% 100%
A friend/family
relative recommends
the antibiotic.
A pharmacist
recommends the
antibiotic
Doctor has prescribed
the same antibiotics
for the same
symptoms previously
Child’s condition is not too serious
Lack of time and
money to visit a
medical doctor
Always Usually Regularly
Sometimes Never
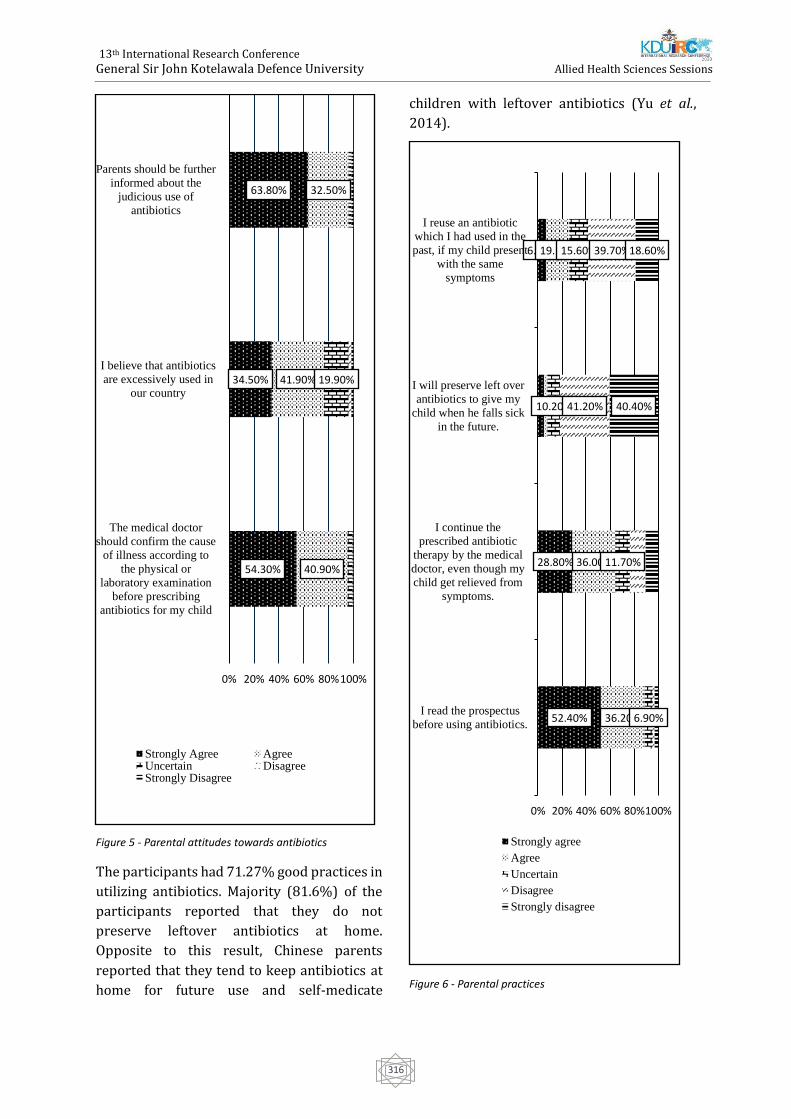
13th International Research Conference
General Sir John Kotelawala Defence University
Allied Health Sciences Sessions
316
Figure 5 - Parental attitudes towards antibiotics
The participants had 71.27% good practices in
utilizing antibiotics. Majority (81.6%) of the
participants reported that they do not
preserve leftover antibiotics at home.
Opposite to this result, Chinese parents
reported that they tend to keep antibiotics at
home for future use and self-medicate
children with leftover antibiotics (Yu et al.,
2014).
Figure 6 - Parental practices
54.30%
34.50%
63.80%
40.90%
41.90%
32.50%
19.90%
0% 20% 40% 60% 80%100%
The medical doctor
should confirm the cause
of illness according to
the physical or
laboratory examination
before prescribing
antibiotics for my child
I believe that antibiotics
are excessively used in
our country
Parents should be further
informed about the
judicious use of
antibiotics
Strongly Agree AgreeUncertain DisagreeStrongly Disagree
52.40%
28.80%
6.90%
36.20%
36.00%
19.10%
6.90%
11.70%
10.20%
15.60%
41.20%
39.70%
40.40%
18.60%
0% 20% 40% 60% 80%100%
I read the prospectus
before using antibiotics.
I continue the
prescribed antibiotic
therapy by the medical
doctor, even though my
child get relieved from
symptoms.
I will preserve left over
antibiotics to give my
child when he falls sick
in the future.
I reuse an antibiotic
which I had used in the
past, if my child present
with the same
symptoms
Strongly agree
Agree
Uncertain
Disagree
Strongly disagree
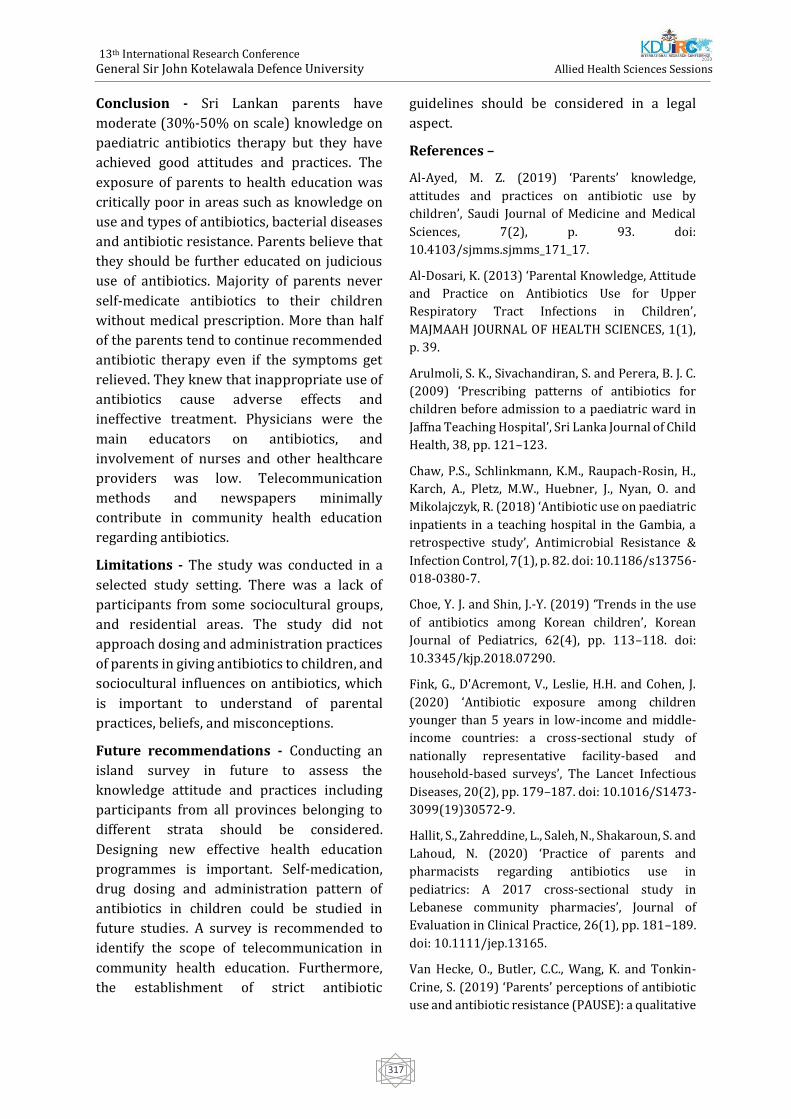
13th International Research Conference
General Sir John Kotelawala Defence University
Allied Health Sciences Sessions
317
Conclusion - Sri Lankan parents have
moderate (30%-50% on scale) knowledge on
paediatric antibiotics therapy but they have
achieved good attitudes and practices. The
exposure of parents to health education was
critically poor in areas such as knowledge on
use and types of antibiotics, bacterial diseases
and antibiotic resistance. Parents believe that
they should be further educated on judicious
use of antibiotics. Majority of parents never
self-medicate antibiotics to their children
without medical prescription. More than half
of the parents tend to continue recommended
antibiotic therapy even if the symptoms get
relieved. They knew that inappropriate use of
antibiotics cause adverse effects and
ineffective treatment. Physicians were the
main educators on antibiotics, and
involvement of nurses and other healthcare
providers was low. Telecommunication
methods and newspapers minimally
contribute in community health education
regarding antibiotics.
Limitations - The study was conducted in a
selected study setting. There was a lack of
participants from some sociocultural groups,
and residential areas. The study did not
approach dosing and administration practices
of parents in giving antibiotics to children, and
sociocultural influences on antibiotics, which
is important to understand of parental
practices, beliefs, and misconceptions.
Future recommendations - Conducting an
island survey in future to assess the
knowledge attitude and practices including
participants from all provinces belonging to
different strata should be considered.
Designing new effective health education
programmes is important. Self-medication,
drug dosing and administration pattern of
antibiotics in children could be studied in
future studies. A survey is recommended to
identify the scope of telecommunication in
community health education. Furthermore,
the establishment of strict antibiotic
guidelines should be considered in a legal
aspect.
References –
Al-Ayed, M. Z. (2019) ‘Parents’ knowledge,
attitudes and practices on antibiotic use by
children’, Saudi Journal of Medicine and Medical
Sciences, 7(2), p. 93. doi:
10.4103/sjmms.sjmms_171_17.
Al-Dosari, K. (2013) ‘Parental Knowledge, Attitude
and Practice on Antibiotics Use for Upper
Respiratory Tract Infections in Children’,
MAJMAAH JOURNAL OF HEALTH SCIENCES, 1(1),
p. 39.
Arulmoli, S. K., Sivachandiran, S. and Perera, B. J. C.
(2009) ‘Prescribing patterns of antibiotics for
children before admission to a paediatric ward in
Jaffna Teaching Hospital’, Sri Lanka Journal of Child
Health, 38, pp. 121–123.
Chaw, P.S., Schlinkmann, K.M., Raupach-Rosin, H.,
Karch, A., Pletz, M.W., Huebner, J., Nyan, O. and
Mikolajczyk, R. (2018) ‘Antibiotic use on paediatric
inpatients in a teaching hospital in the Gambia, a
retrospective study’, Antimicrobial Resistance &
Infection Control, 7(1), p. 82. doi: 10.1186/s13756-
018-0380-7.
Choe, Y. J. and Shin, J.-Y. (2019) ‘Trends in the use
of antibiotics among Korean children’, Korean
Journal of Pediatrics, 62(4), pp. 113–118. doi:
10.3345/kjp.2018.07290.
Fink, G., D'Acremont, V., Leslie, H.H. and Cohen, J.
(2020) ‘Antibiotic exposure among children
younger than 5 years in low-income and middle-
income countries: a cross-sectional study of
nationally representative facility-based and
household-based surveys’, The Lancet Infectious
Diseases, 20(2), pp. 179–187. doi: 10.1016/S1473-
3099(19)30572-9.
Hallit, S., Zahreddine, L., Saleh, N., Shakaroun, S. and
Lahoud, N. (2020) ‘Practice of parents and
pharmacists regarding antibiotics use in
pediatrics: A 2017 cross‐sectional study in
Lebanese community pharmacies’, Journal of
Evaluation in Clinical Practice, 26(1), pp. 181–189.
doi: 10.1111/jep.13165.
Van Hecke, O., Butler, C.C., Wang, K. and Tonkin-
Crine, S. (2019) ‘Parents’ perceptions of antibiotic
use and antibiotic resistance (PAUSE): a qualitative
13th International Research Conference
General Sir John Kotelawala Defence University
Allied Health Sciences Sessions
318
interview study’, Journal of Antimicrobial
Chemotherapy, 74(6), pp. 1741–1747. doi:
10.1093/jac/dkz091.
Hernández-Díaz, I., Ayala-Meléndez, A., González-
González, E., Rosario-Calderón, I., Figueroa-Ríos, D.,
Melin, K. and Hernández-Muñoz, J.J. (2019)
‘Knowledge and beliefs, behaviors, and adherence
among Latino parents or legal guardians related to
antibiotic use for upper respiratory tract infections
in children under 6 years of age’, Journal of the
American Pharmacists Association, 59(4), pp. 506–
513. doi: 10.1016/j.japh.2019.03.004.
Hsia, Y., Lee, B.R., Versporten, A., Yang, Y., Bielicki,
J., Jackson, C., Newland, J., Goossens, H., Magrini, N.
and Sharland, M. (2019) Articles Use of the WHO
Access, Watch, and Reserve classification to define
patterns of hospital antibiotic use (AWaRe): an
analysis of paediatric survey data from 56
countries.
McMullan, B.J., Hall, L., James, R., Mostaghim, M.,
Jones, C.A., Konecny, P., Blyth, C.C. and Thursky,
K.A. (2019) ‘Antibiotic appropriateness and
guideline adherence in hospitalized children:
results of a nationwide study’, Journal of
Antimicrobial Chemotherapy. doi:
10.1093/jac/dkz474.
Mukattash, T.L., Alkhatatbeh, M.J., Andrawos, S.,
Jarab, A.S., AbuFarha, R.K. and Nusair, M.B. (2020)
‘Parental self‐medication of antibiotics for children
in Jordan’, Journal of Pharmaceutical Health
Services Research, 11(1), pp. 75–80. doi:
10.1111/jphs.12331.
Premaratne, R. Rajindrajith, S., Mettananda, C.,
Balasooriya, H., Fonseka, J., Randeny, S., De Silva,
H.J. (2006) ‘Knowledge and expectations of parents
regarding the role of antibiotic treatment of upper
respiratory tract infections - a survey among
parents attending a tertiary care institution with a
sick child’, The Ceylon Medical Journal.
Schrier, L., Hadjipanayis, A., Del Torso, S., Stiris, T.,
Emonts, M. and Dornbusch, H.J. (2018) ‘European
Antibiotic Awareness Day 2017: training the next
generation of health care professionals in
antibiotic stewardship’, European Journal of
Pediatrics, 177(2), pp. 279–283. doi:
10.1007/s00431-017-3055-0.
De Silva, B.P., Hussain, F.H., Ginige, G., Kulathunge,
A., Kannangara, H., Goonewardena, S. and Gamage,
M. (2017) ‘Self-medication practices and misuse of
medicine among mothers of young children
attending a teaching hospital in Sri Lanka’, Sri
Lanka Journal of Child Health, 46(2), p. 122. doi:
10.4038/sljch.v46i2.8267.
Szymczak, J.E., Klieger, S.B., Miller, M., Fiks, A.G. and
Gerber, J.S. (2018) ‘What Parents Think About the
Risks and Benefits of Antibiotics for Their Child’s
Acute Respiratory Tract Infection’, Journal of the
Pediatric Infectious Diseases Society, 7(4), pp.
303–309. doi: 10.1093/jpids/pix073.
Vangay, P., Ward, T., Gerber, J.S. and Knights, D.
(2015) ‘Antibiotics, Pediatric Dysbiosis, and
Disease’, Cell Host & Microbe, 17(5), pp. 553–564.
doi: 10.1016/j.chom.2015.04.006.
Williams, M.R., Greene, G., Naik, G., Hughes, K.,
Butler, C.C. and Hay, A.D. (2018) ‘Antibiotic
prescribing quality for children in primary care: an
observational study’, British Journal of General
Practice, 68(667), pp. e90–e96. doi:
10.3399/bjgp18X694409.
World Health Organization (2018) Antibiotic
resistance. Available at:
https://www.who.int/news-room/fact-
sheets/detail/antibiotic-resistance.
Yu, M., Zhao, G., Lundborg, C.S., Zhu, Y., Zhao, Q. and
Xu, B. (2014) ‘Knowledge , attitudes , and practices
of parents in rural China on the use of antibiotics in
children : a cross-sectional study’, BMC Infectious
Diseases, 14(112), pp. 1–8.
Zyoud, S. H., Taha, A.A., Araj, K.F., Abahri, I.A.,
Sawalha, A.F., Sweileh, W.M., Awang, R., and Al-Jabi,
S.W. (2015) ‘Parental knowledge, attitudes and
practices regarding antibiotic use for acute upper
respiratory tract infections in children: a cross-
sectional study in Palestine’, BMC Pediatrics, 15(1),
p. 176. doi: 10.1186/s12887-015-0494-5.
13th International Research Conference
General Sir John Kotelawala Defence University
Allied Health Sciences Sessions
319
Paper ID: 489
Occupational risk factors related to Cutaneous Leishmaniasis: A
descriptive study
WAMSD Abeysinghe, WS Nilmini, GGCN Sandarekha, HT Illangasingha, KIDF Senanayake#, N
Liyanage and KGPK Munidasa
Department of Nursing, Faculty of Health Sciences, The Open University of Sri Lanka
Abstract:-Cutaneous Leishmaniasis (CL) is an
endemic disease in Sri Lanka and it is
considered as a notifiable disease from year
2008. Anuradhapura has been one of the areas
shows highest incidences of Leishmaniasis in
Sri Lanka. The purpose of this present study
was to identify the occupational risk factors
associated with Cutaneous Leishmaniasis. A
quantitative cross-sectional study was
conducted among patients who were
diagnosed with CL and visit to Dermatology
clinic at the Base Hospital Thabuththegama.
Two hundred participants were recruited to
the study by using convenience sampling
method. A self-administered questionnaire
was used to collect data and Statistical
Package for Social Sciences (SPSS) Version 21
was used to analyze the data. Majority of the
participants were male (n=145, 72.5%) and
46% of participants were over 40 years old.
More than half (n=123, 61.5%) of the
participants were paddy cultivators. Being a
paddy cultivator was a significant
occupational risk factor for CL. The results
showed that gender was statistically
significant variable for CL (P< 0.05).
Statistically significant associations were also
found at the level of 0.01 between occupation
with gender, age and educational level.
Furthermore, laborers (7.5%) were also more
prone to affect by CL comparable with other
occupations. Hence, a special attention should
be given to male paddy cultivators by
providing health education on the disease,
identifying reservoir hosts and vector control
will be important initiatives to prevent the
spread of this disease.
Keywords: Occupational Risk factors,
Cutaneous Leishmaniasis
Introduction
Cutaneous Leishmaniasis (CL) is a neglected
disease strongly associated with the poorest
population of the world (Thilahun et al., 2014).
Leishmaniasis is a vector-bone disease caused
by a protozoan parasite of the genus
Leishmanial and transmitted by the bite of an
infected female phlebotomine sand fly
(Galgamuwa et al., 2017). Patients with CL
present with a single ulcer or nodular lesions
near the site of insect bite (Mccwir & Satoskar,
2013). The ulcers or nodules can be seen
uncovered areas of the body such as the face,
forearms and lower legs (Mccwir et al., 2013).
According to the World Health Organization
(WHO) Leishmaniasis threatens about 350
million people and children in 88 countries
worldwide (WHO, 2017). As estimated, 0.9 to
1.3 million new patients and 20000 to 30000
deaths occurred annually in worldwide
(Bmorovat et al, 2018). As many as 12 million
people are believed to be currently affected
(WHO, 2017).
Leishmaniasis is an endemic disease in Sri
Lanka since the first autochthonous CL case
was identified in 1992 (Weerakoon et al.,
2016; Galgamuwa et al., 2017). The
percentages of patients have increased in the
last few decades due to numerous reasons
such as human migration from endemic to
endemic areas, poverty, deforestation and
urbanization (Galgamuwa et al., 2017). More
than 2000 cases have been identified from
2000 to 2009 and nearly 8487 patients have
13th International Research Conference
General Sir John Kotelawala Defence University
Allied Health Sciences Sessions
320
been recorded during 2009 to 2016
representing at least one case from all 25
administrative districts (Wijerathna et al.,
2018). Anuradhapura is one of the most
endemic districts for CL in Sri Lanka.
(Galgamuwa et al., 2017). Although, after
conducting several studies, it can be seen the
development of Leishmaniasis remains the
same. Therefore, it is necessary to understand
the risk factors to control and prevent
Leishmaniasis properly hence we decided to
perform this study. The purpose of this study
is to identify occupational risk factors related
to Cutaneouse Leishmaniasis among patients
who visit to the dermatology clinic at Base
Hospital Thabuththegama.
Methodology
Study Design
A descriptive cross-sectional study was
conducted among patients who were
diagnosed with CL, visit to Dermatology clinic
at Thabuththegama.
Study setting
This study was conducted at dermatology
clinic in Base Hospital Thabuththegama. It is
one of the largest base hospitals in
Anuradhapura district. Diagnosed patients
with Cutaneous Leishmaniasis visit
dermatology clinic every Wednesday for
treatments. Approximately, there are 35 to 40
patients daily at the clinic. All the diagnosis,
treatments, care and procedures in the clinic
are conducted under the supervision of one
dermatologist while coordinating by nursing
officers relevance to clinic.
Study population
The population of the research was the
patients who visit the dermatology clinic at
the Base Hospital Thabuththegama. 215
diagnosed patients with CL were selected as
the sample by using convenience sampling
method. Inclusion criteria for the study were
patients who have diagnosed with CL. Patients
who have mental illnesses, disabilities or
difficulties to communicate were excluded
from the study.
Study material & Data collection
A self-administered questionnaire was
developed in three languages Sinhala, English
and Tamil. The questionnaire was consisted of
two parts, part A-Socio demographic data
(Age, Gender, and Educational level) and part
B- Occupation related data. The questionnaire
was pre-tested with 25 patients with CL, those
data were not considered in the study.
Reliability was established with results of pre-
test. Face validity and content validity was
done with supervisor and subject experts at
the dermatology clinic. Modified
questionnaire was used to collect data. The
value of Cronbach’s Alpha was more than 0.7
in the study.
Ethical consideration
Ethical approval was obtained from ethical
review committee of National Hospital of Sri
Lanka. All the information was gathered
anonymously after obtaining the informed
consent from the participants. Participants
had the right to withdraw from the
participation at any time of the study. Privacy
and confidentiality of the participants and
their information were ensured to the
maximum at every stage of the research.
Data collection
The data collection was conducted from June
2019 to one month period.
Data Analysis
Analysis of collected data were carried out
with the Statistical Package for Social Sciences,
(Version 21).
Results and Discussion
Total of 215 patients who were diagnosed as
Cutaneous Leishmaniasis in the dermatology
clinic at base hospital Thambutthegama were
invited to participate for answer the
questionnaires. 15 questionnaires were
excluded from final analysis due to incomplete
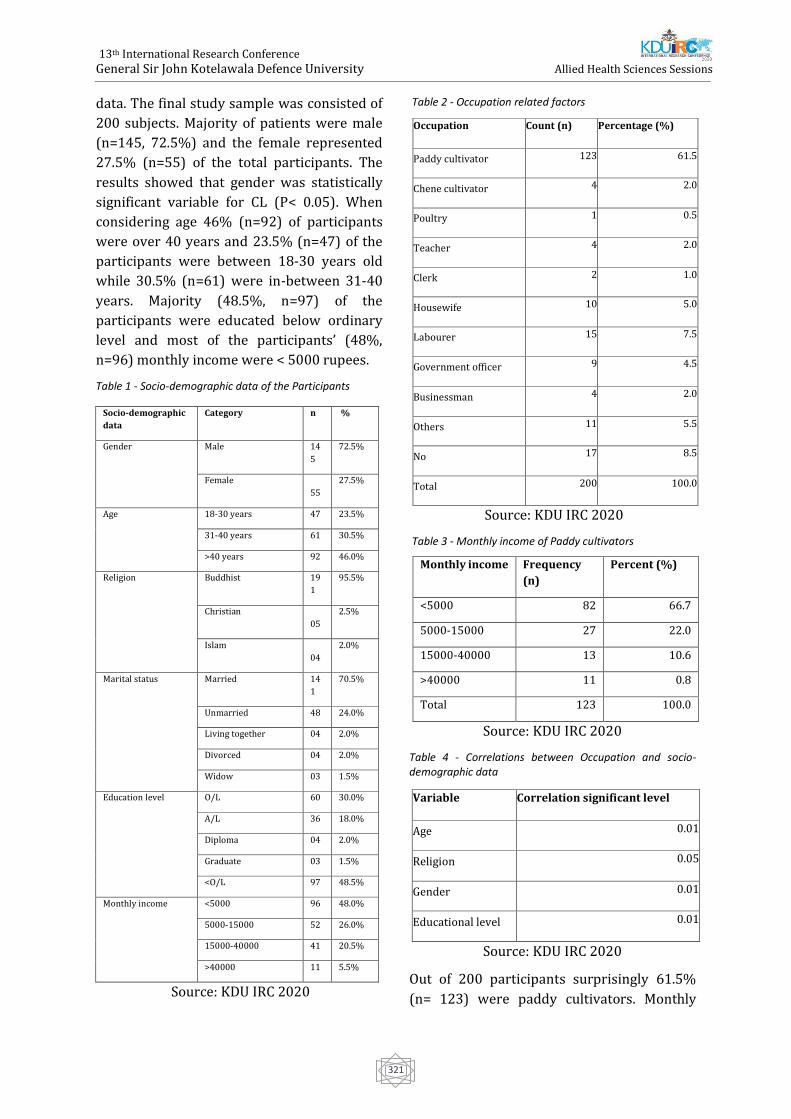
13th International Research Conference
General Sir John Kotelawala Defence University
Allied Health Sciences Sessions
321
data. The final study sample was consisted of
200 subjects. Majority of patients were male
(n=145, 72.5%) and the female represented
27.5% (n=55) of the total participants. The
results showed that gender was statistically
significant variable for CL (P< 0.05). When
considering age 46% (n=92) of participants
were over 40 years and 23.5% (n=47) of the
participants were between 18-30 years old
while 30.5% (n=61) were in-between 31-40
years. Majority (48.5%, n=97) of the
participants were educated below ordinary
level and most of the participants’ (48%,
n=96) monthly income were < 5000 rupees.
Table 1 - Socio-demographic data of the Participants
Socio-demographic
data
Category n %
Gender Male 14
5
72.5%
Female
55
27.5%
Age 18-30 years 47 23.5%
31-40 years 61 30.5%
>40 years 92 46.0%
Religion Buddhist 19
1
95.5%
Christian
05
2.5%
Islam
04
2.0%
Marital status Married 14
1
70.5%
Unmarried 48 24.0%
Living together 04 2.0%
Divorced 04 2.0%
Widow 03 1.5%
Education level O/L 60 30.0%
A/L 36 18.0%
Diploma 04 2.0%
Graduate 03 1.5%
<O/L 97 48.5%
Monthly income <5000 96 48.0%
5000-15000 52 26.0%
15000-40000 41 20.5%
>40000 11 5.5%
Source: KDU IRC 2020
Table 2 - Occupation related factors
Source: KDU IRC 2020
Table 3 - Monthly income of Paddy cultivators
Source: KDU IRC 2020
Table 4 - Correlations between Occupation and socio-demographic data
Source: KDU IRC 2020
Out of 200 participants surprisingly 61.5%
(n= 123) were paddy cultivators. Monthly
Occupation Count (n) Percentage (%)
Paddy cultivator 123 61.5
Chene cultivator 4 2.0
Poultry 1 0.5
Teacher 4 2.0
Clerk 2 1.0
Housewife 10 5.0
Labourer 15 7.5
Government officer 9 4.5
Businessman 4 2.0
Others 11 5.5
No 17 8.5
Total 200 100.0
Monthly income Frequency
(n)
Percent (%)
<5000 82 66.7
5000-15000 27 22.0
15000-40000 13 10.6
>40000 11 0.8
Total 123 100.0
Variable Correlation significant level
Age 0.01
Religion 0.05
Gender 0.01
Educational level 0.01
13th International Research Conference
General Sir John Kotelawala Defence University
Allied Health Sciences Sessions
322
income of most of the paddy cultivators was
less than 5000 rupees (Table 3). Statistically
significant associations were found between
occupation with gender, age, religion, and
educational level (Table 4).
Being a paddy cultivator had a significant
association to the presence of CL (p<0.05).
Similar finding to that of a study conducted in
Ethiopia (Tilahun, Alemu, & Mulatu, 2014).
The reason for the finding confirmed that the
people whose occupations were closely
related to paddy field were more prone to
sand fly bites due to presence of increase the
density of sand fly breeding places. A study
conducted in Mekelle City, Ayder referral
hospital. Tigray, North Ethiopia done by
F.Tilahun et al in 2014 highlighted that the
most of males and the farmers were relatively
exposure for CL.
The findings of the present study revealed that
gender was statistically significant variable for
CL. This result agrees with finding of the
previous study in Iran, (Oryan & Aetal, 2014).
Another similar study conducted in Ethiopia
that the sex was significant, highlighted that
the gender had significant association to the
prevalence of CL (Thilahun et al., 2014).
Previous similar findings were reported even
in Sri Lanka that the infection of CL was higher
among males than females (Galgamuwa et al.,
2017). Further findings were reported in
Colombia, Silit, India, Libia and Pakistan.
However, the reason for that in this study is
that the main livelihood of most of the
participants is paddy cultivating.
Furthermore, the paddy fields facilitate
favorable resting breeding habitants for sand
flies and the north central province can be
described as a province adorned by irrigated
colonies and eco-systems which are for paddy
cultivation.
Conclusion
Occupation was significantly associated with
the disease of CL. Being a paddy cultivator was
a main risk factor for CL and being a labourer
also a risk for affect by the disease comparable
with other occupations. Because most of them
work in open environment such as field and
agricultural farms and wearing cloths to cover
only lower part of the body. Therefore, they
have a high risk of exposure to sand fly bites.
According to this study results, males have a
high risk to affect this disease since most of
them perform outdoor activities mainly paddy
cultivation. Hence, a special attention should
be given to male paddy cultivators by
providing health education on the disease,
identifying reservoir hosts and vector control
will be important initiatives to prevent the
spread of this disease.
Acknowledgement
Researchers would like to appreciate the
Ethical Review Committee of The National
Hospital of Sri Lanka and the Provincial
Director of Health Services, Anuradhapura for
granting the permission for conduct this
research study.
References
Eid, D., Guzman-Rivero, M., Rojas, E., Goicolea, I.,
Hurtig, A.K., Illanes, D. and San Sebastian, M., 2018.
Risk factors for cutaneous leishmaniasis in the
rainforest of Bolivia: a cross-sectional
study. Tropical medicine and health, 46(1), p.9.
Galgamuwa, L.S., Dharmaratne, S.D. and Iddawela,
D., 2018. Leishmaniasis in Sri Lanka: spatial
distribution and seasonal variations from 2009 to
2016. Parasites & vectors, 11(1), p.60.
Galgamuwa, L.S., Sumanasena, B., Yatawara, L.,
Wickramasinghe, S. and Iddawela, D., 2017.
Clinico-epidemiological patterns of cutaneous
leishmaniasis patients attending the
Anuradhapura teaching hospital, Sri Lanka. The
Korean Journal of Parasitology, 55(1), p.1.
Karunaweera, N.D. and Rajapaksa, U.S., 2009. Is
leishmaniasis in Sri Lanka benign and be
ignored?. Journal of Vector Borne Diseases, 46(1),
p.13.
Nawaratna, S.S., Weilgama, D.J. and Rajapaksha, K.,
2009. Cutaneous leishmaniasis in Sri Lanka: a
study of possible animal reservoirs. International
Journal of Infectious Diseases, 13(4), pp.513-517.
13th International Research Conference
General Sir John Kotelawala Defence University
Allied Health Sciences Sessions
323
Ocampo, C.B., Ferro, M.C., Cadena, H., Gongora, R.,
Pérez, M., Valderrama‐Ardila, C.H., Quinnell, R.J.
and Alexander, N., 2012. Environmental factors
associated with American cutaneous leishmaniasis
in a new Andean focus in Colombia. Tropical
Medicine & International Health, 17(10), pp.1309-
1317.
Oryan, A., Alidadi, S. and Akbari, M., 2014. Risk
factors associated with leishmaniasis. Tropical
Medicine & Surgery.
Ranasinghe, S., Wickremasinghe, R., Munasinghe,
A., Hulangamuwa, S., Sivanantharajah, S.,
Seneviratne, K., Bandara, S., Athauda, I., Navaratne,
C., Silva, O. and Wackwella, H., 2013. Cross-
sectional study to assess risk factors for
leishmaniasis in an endemic region in Sri
Lanka. The American journal of tropical medicine
and hygiene, 89(4), pp.742-749.
Siriwardana, H.Y.D., Noyes, H.A., Beeching, N.J.,
Chance, M.L., Karunaweera, N.D. and Bates, P.A.,
2007. Leishmania donovani and cutaneous
leishmaniasis, Sri Lanka. Emerging infectious
diseases, 13(3), p.476.
Siriwardana, H.V.Y.D., Chandrawansa, P.H.,
Sirimanna, G. and Karunaweera, N.D., 2012.
Leishmaniasis in Sri Lanka: a decade old story. Sri
Lankan Journal of Infectious Diseases, 2(2).
Tilahun, F., Alemu, W. and Mulatu, G., 2014.
Magnitude and associated factors of cutaneous
leishmaniasis; in Mekelle city, Ayder referral
hospital, Tigray, Northern Ethiopia, 2014. Clinical
Medicine Research, 3(6), pp.189-199.
13th International Research Conference
General Sir John Kotelawala Defence University
Allied Health Sciences Sessions
324
Paper ID: 495
Exploration Of The Door To Needle Time Gap Of Administering Anti-
Venom Serum (AVS) And Its Determinants: A Mixed-Method Study
RAM Ritigahapola1#, NSD Wijesingha1, JPMH Jayalath1, HPM Karunarathna1, ACW
Madanayaka1, HMP Herath2, A Silva2 and S Siribaddana2
1Department of Nursing and Midwifery, General Sir John Kotelawala Defence University, Ratmalana, Sri
Lanka 2Faculty of Medicine & Allied Sciences, Rajarata University, Saliyapura, Sri Lanka.
Abstract:-A mix method study was conducted
at the Teaching hospital, Anuradhapura (THA)
to describe the demographic characteristics of
snake bites, determine the median time gap of
administering anti-venom, identify reasons
for delaying administration of anti-venom
serum and propose measures to be adopted in
order to shorten the door to needle time gap.
Ethical approval was obtained by ethical
committee, Faculty of Medicine, KDU. The
descriptive cross-sectional part was based on
snake bite victims elder than 16 years(n=50)
who were admitted to the THA and received
AVS (Anti-venom serum) therapy over a 3 ½
months period from 15th July 2019 and 50
victims were sample size for quantitative
study. The data was collected through an
interviewer administrated questionnaire
.Participants were purposively recruited for
the qualitative study and in-depth interviews
were conducted with health care
professionals in THA and peripheral hospitals.
Qualitative data analyzed by thematic analysis
with four themes including limited physical
and human resources, issues in the diagnosis
of envenoming, delays in preparation of AVS,
reasons and delays in transferring patients
from the local hospital to THA. Data were
analyzed by using SPSS 23 with Mann-
Whitney U test.
There were 88% (44) male and 12% (8)
female victims. The most bites were not
identified (50%) and most of the common bite
were Russell's viper (46%).Below the ankle
82% and between 6 a.m. to 6 p.m. was the
commonest bite site and time. There were 40
(80%) indirect admissions and 10 (20%)
direct admissions. Door to needle median gap
of all direct and indirect admission was 125
(IQR= 65-158) minutes. Door to needle
median gap in indirect admissions was 178
(IQR=90-210) minutes and direct admissions
median gap was 72 (IQR=30-104) minutes.
There was a significant difference between the
median time gap of indirect and direct
admissions. Poor rural hospital facilities,
overcrowding, inadequate staffing and the
unavailability of quality tubes for whole blood
clotting time are the main factors contributing
to the time gap. Final suggestions are
increasing bed capacity and implementation
of a triage system in the ETU.
Key Words - Snake envenoming, AVS therapy,
Door to needle time gap (the time between
admission to the Teaching Hospital
Anuradhapura or Peripheral hospital to
administration of AVS)
Background - Estimates suggest 4.5-5.4
million snakebites, 1.8-2.7 million
envenoming and 81 000 to 138 000 deaths
occur due to snakebites globally each year
(WHO, 2019). In Sri Lanka, it is estimated that
80,000 bites, 30,000 envenoming and 400
deaths occur due to snakebite each year, much
more than claimed by official statistics. Most of
the cases are reported from the dry zone of the
country (Ediriweera et al., 2016). Antivenom,
the only specific treatment must be given
without a delay for the snakebite patients.
13th International Research Conference
General Sir John Kotelawala Defence University
Allied Health Sciences Sessions
325
Possible factors that could determine door-to-
needle time gap (the time gap between the
times of hospital admission to the end of AVS
therapy) includes time taken to develop
clinical features of systemic envenoming, time
taken to become positive in ward CT (Clotting
Time), delay in lab CT reports, time taken to
prepare AVS (Anti-Venom Serum) and
developing adverse reactions during AVS
administration. In addition, patients are
transferred to tertiary care units from
peripheral units due to lack of facilities
including heart monitors, AVS (anti-venom
serum), trained nurses, doctors and
emergency care facilities. The Teaching
Hospital Anuradhapura is the largest tertiary
care hospital in the Northern Central Province
and also in the dry zone of Sri Lanka. Teaching
Hospital Anuradhapura rats over 1000 snake
bite patients annually. The majority of
snakebite victims in the region seek western
medical treatments and most of them enter
the health care system as soon as possible. The
purpose of this study is to determine the mean
time between the time of admission to the
hospital to end of the AVS (Anti-Venom
Serum) therapy as well as to determine the
preventable and non-preventable factors
contributing to the mean door to needle time
gap.
Objectives - To describe the demographic
characteristics of snake bites, to determine the
median time gap of administering anti-venom,
reasons for delaying AVS administration and
suggestions to be adopted in order to shorten
the door to needle time gap.
Methods - This was a mix method study with
two phases. The descriptive cross-sectional
study was based on snakebite victims who
were presented in THA (Teaching Hospital
Anuradhapura) and received AVS therapy
over a 3 ½ months period from 15th July 2019
and took these all admissions (50 admissions)
as the quantitative sample size. And also
Quantitative study design was interviewer
administrate questioner. Qualitative study
was based on in-depth interview of health care
professionals (medical officers, nurses,
medical laboratory technicians who were
experienced at least two years in snake bite
management) and the health care assistants
work at the THA as well as medical officers in
peripheral hospitals (District Hospital
Nochchiyagama, Rural Hospital Senapura,
Peripheral Unit Mihinthle, Peripheral Unit
Thalawa). Sampling method was purposive
sampling technique. Qualitative data analysed
using thematic analysis method and
quantitative data analysed using SPSS 23
version. Ethical clearance for the study will be
obtained from the Ethics review committee of
the Faculty of Medicine, General Sir John
Kotelawala Defence University. Participants
will be recruited to the study after obtaining
written permission by the respective
Provincial Director of Health – North Central
Province, Regional Director of Health, and
Ethical board of the Teaching Hospital
Anuradhapura. Written informed consent will
be obtained from the recruited participants
prior to commencement of the study.
Confidentiality of all information and
identities of participants will be strictly
maintained and will not be disclosed when
publishing the results of the study.
Information sheet and consent form will be
translated to Sinhala and Tamil to ensure that
it’s accessible to members
Results - Among the total 50 victims, 88%
(44) were (>16 years) adult male and the 12%
(6) were (>16 years) adult females. There
were 23 (46%) Russell’s viper bites, 1(2%)
common cobra bite, 1 (2%) Indian Krait bite
and 25 (50%) unidentified. Most victims had
bites below the ankle (82%). 58% (29) bites
were occurred during 6 am-6pm. Of all
patients, 40 (80%) were indirect admissions
and the rest were direct admissions to THA.
There was no significant difference of median
time durations after admission to the THA to
the AVS administration in direct and indirect
admissions. Door (Primary Care Hospital or
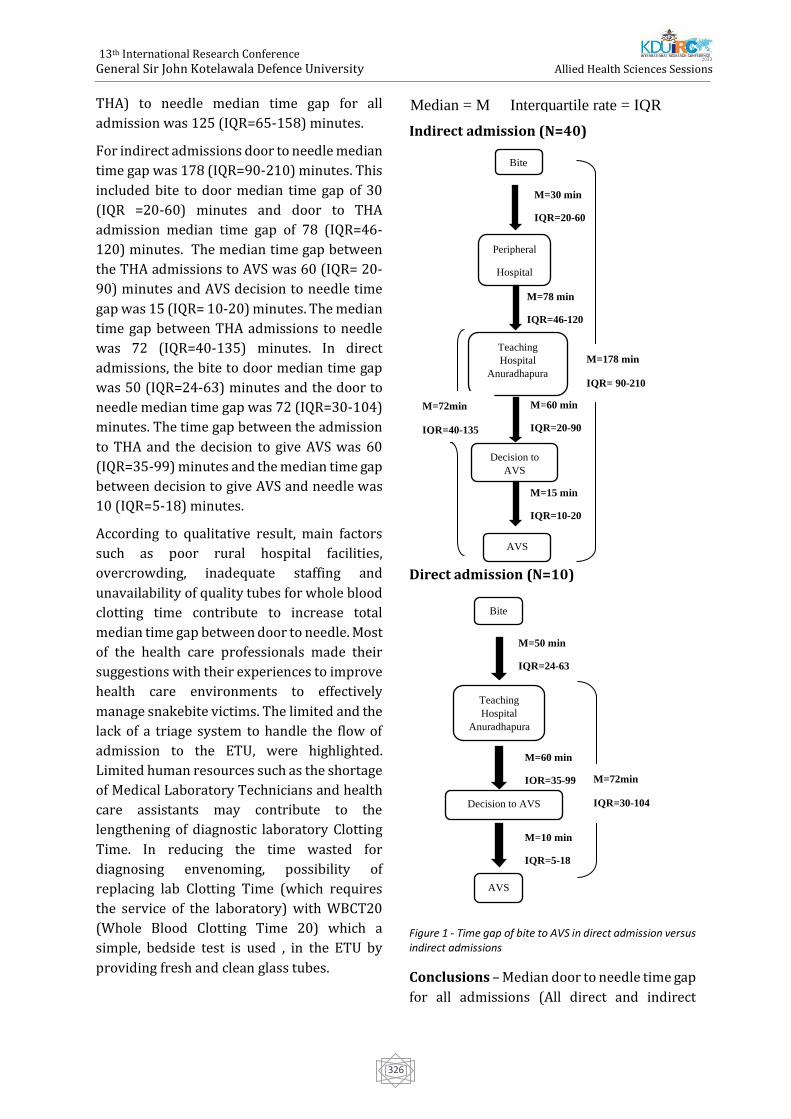
13th International Research Conference
General Sir John Kotelawala Defence University
Allied Health Sciences Sessions
326
THA) to needle median time gap for all
admission was 125 (IQR=65-158) minutes.
For indirect admissions door to needle median
time gap was 178 (IQR=90-210) minutes. This
included bite to door median time gap of 30
(IQR =20-60) minutes and door to THA
admission median time gap of 78 (IQR=46-
120) minutes. The median time gap between
the THA admissions to AVS was 60 (IQR= 20-
90) minutes and AVS decision to needle time
gap was 15 (IQR= 10-20) minutes. The median
time gap between THA admissions to needle
was 72 (IQR=40-135) minutes. In direct
admissions, the bite to door median time gap
was 50 (IQR=24-63) minutes and the door to
needle median time gap was 72 (IQR=30-104)
minutes. The time gap between the admission
to THA and the decision to give AVS was 60
(IQR=35-99) minutes and the median time gap
between decision to give AVS and needle was
10 (IQR=5-18) minutes.
According to qualitative result, main factors
such as poor rural hospital facilities,
overcrowding, inadequate staffing and
unavailability of quality tubes for whole blood
clotting time contribute to increase total
median time gap between door to needle. Most
of the health care professionals made their
suggestions with their experiences to improve
health care environments to effectively
manage snakebite victims. The limited and the
lack of a triage system to handle the flow of
admission to the ETU, were highlighted.
Limited human resources such as the shortage
of Medical Laboratory Technicians and health
care assistants may contribute to the
lengthening of diagnostic laboratory Clotting
Time. In reducing the time wasted for
diagnosing envenoming, possibility of
replacing lab Clotting Time (which requires
the service of the laboratory) with WBCT20
(Whole Blood Clotting Time 20) which a
simple, bedside test is used , in the ETU by
providing fresh and clean glass tubes.
Indirect admission (N=40)
Direct admission (N=10)
Figure 1 - Time gap of bite to AVS in direct admission versus indirect admissions
Conclusions – Median door to needle time gap
for all admissions (All direct and indirect
Median = M Interquartile rate = IQR
Decision to
AVS
Bite
Peripheral
Hospital
Teaching
Hospital
Anuradhapura
AVS
M=178 min
IQR= 90-210
M=78 min
IQR=46-120
M=30 min
IQR=20-60
M=60 min
IQR=20-90
M=15 min
IQR=10-20
M=72min
IQR=40-135
M=10 min
IQR=5-18
M=50 min
IQR=24-63
M=60 min
IQR=35-99 M=72min
IQR=30-104
AVS
Bite
Teaching
Hospital
Anuradhapura
Decision to AVS
13th International Research Conference
General Sir John Kotelawala Defence University
Allied Health Sciences Sessions
327
admission) was 125 (IQR=65-158) minutes.
Median door to needle time gap in indirect
admissions was 178 (IQR=90-210) minutes
and median door to needle time gap indirect
admissions is 72 (40-135) minutes. Such
median time gaps were obtained because of
poor facilities of rural hospitals.
There was no significant median time gap
between admission to THA at the time of onset
of AVS among direct and indirect admissions.
Overcrowding, inadequate staffing and
unavailability of quality glass tubes for WBCT
are the main factors contributing to door to
needle time gap for all admissions (All direct
and indirect admission).
Key Words - Snake envenoming, AVS therapy,
Door to needle time gap (the time between
admission to the Teaching Hospital
Anuradhapura or Peripheral hospital to
administration of AVS)
Reference
Ediriweera, D., Kasturiratne, A., Pathmeswaran, A.,
Gunawardena, N., Wijayawickrama, B., Jayamanne,
S., Isbister, G., Dawson, A., Giorgi, E., Diggle, P.,
Lalloo, D. and de Silva, H. (2016).Mapping the Risk
of Snakebite in Sri Lanka - A National Survey with
Geospatial Analysis. PLOS Neglected Tropical
Diseases, 10(7), p.e0004813
WHO | Snake Antivenom Immunoglobulins [WWW
Document], 2019. .WHO. URL
http://www.who.int/bloodproducts/snake_antive
noms/en/ (accessed 12.11.19).
World Health Organization. (2019). What is
snakebite envenoming? [online] Available at:
https://www.who.int/snakebites/disease/en/
[Accessed 26 Dec. 2019].
13th International Research Conference
General Sir John Kotelawala Defence University
Allied Health Sciences Sessions
328
Paper ID: 511
Dietary Adherence With Guideline Recommendations In Patients
Undergoing Continuous Ambulatory Peritoneal Dialysis
DRTS Dasanayake1#, AMSD Pathiranage1 and N Nanayakkara2
1Faculty of Allied Health Sciences, University of Peradeniya, Sri Lanka
2National hospital, Kandy, Sri Lanka
Abstract:- Dietary nutrient intake plays a
dominant role in maintaining proper
nutritional status in Continuous Ambulatory
Peritoneal Dialysis (CAPD) patients. Adhering
to multiple dietary restrictions imposed on
CAPD patients may be difficult but crucial in
maintaining proper nutritional status. The
study aimed to assess the dietary adherence
with renal specific European Society for
Parenteral and Enteral Nutrition (ESPEN)
guideline recommendations for CAPD
patients. This cross-sectional study carried
out engaging 102 patients (66 were male) who
attended to the CAPD clinic, General Hospital
Kandy from January to April 2020.
Participants were selected by simple random
sampling method. Interviewer administrated
food frequency questionnaire was used to
collect dietary data. A small minority of the
patients reached recommended targets of
energy (30.4%) and protein (10.8%). The
Number of adherents to potassium and
phosphorus was also as lower as 10.8% and
17.6% respectively. Most of the participants
consumed less than target recommendation in
relation to potassium and phosphorus. Only
10.8% consumed sufficient fiber.
Furthermore, only 26.5% were within
recommended dietary sodium targets and
20.6% of participants’ sodium intake was
higher than recommendations. It is generally
accepted that dietary intake of CAPD patients
are relatively lower than target
recommendations. Majority of CAPD patients
participated in this study also did not meet
current renal specific dietary
recommendation in relation to all the selected
dietary components. Therefore, other than
conventional dietary counselling, nutritionally
sound, appropriate dietary interventions
should be implemented in order to improve
adherence to recommended dietary intake to
obtain the best optimum results.
Keywords: CAPD, adherence,
recommendations, ESPEN
Introduction
Chronic kidney disease (CKD) is progressive
loss of kidney functions which is defined as
kidney damage or an estimated glomerular
filtration rate (eGFR) of less than
60ml/min/1.73m2 (Hajira, Samiullah and
Chawla, 2013). Renal transplantation and
renal replacement therapies such as
Continuous Ambulatory Peritoneal Dialysis
(CAPD) and hemodialysis (HD) are the only
treatment modalities available to sustain and
prolong the life of the final stage of CKD or
End-Stage Renal Disease (ESRD) patients.
CAPD has been available as an effective and
safe renal replacement treatment for ESRD
patients in and around the world.
CAPD patients have to adhere to multiple
recommended dietary regimens related to
dietary nutrient components and also fluid
intake. It is said to be difficult for patients to
follow the renal diet as there may be
restrictions imposed on amount of protein,
sodium, potassium, phosphorus, and calcium
allowed in the diet. Due to this complexity of
dietary modifications, majority of dialysis
patients are having difficulties in adhering and
continuing in the long term (Beto and
13th International Research Conference
General Sir John Kotelawala Defence University
Allied Health Sciences Sessions
329
Nicholas, 2009). There is no consensus
guideline available, but there are number of
renal specific nutrition guidelines using
around the world. There are slight differences
in recommended values in each guideline.
European Society for Parenteral and Enteral
Nutrition (ESPEN) guideline (Cano et al.,
2009) is one of the most accepted guidelines
among them.
Dietary intake of patients can be assessed
through several methods, i.e., 24-hour dietary
recall, dietary diary, food frequency
questionnaires are available for
epidemiological purposes. Some of these
methods are complex and laborious.
Population studies require simple, and
reliable methods. Food frequency
questionnaires often use as practical, cost-
effective and efficient method for assessing
dietary intake over periods of time (Biró et al.,
2002). FFQs are most commonly used method
to assess dietary intake because of its low cost
and ability to capture usual food patterns
(Zang et al., 2019).
Multiple dietary restrictions recommended to
CAPD patients may be difficult to achieve and
at the same time may result in nutritional
deficiencies rendering a poor dietary quality.
Adherence to a specific dietary regime is not
easy. It requires individual, social, cultural and
environmental adaptations too (Cupisti and
Kalantar-Zadeh, 2013). It is believed that
there are five associated factors which leads to
dietary non-adherence according to WHO
Multidimensional adherence model (Chaudri,
2004). Those are, socio-economic factors,
condition-related factors, therapy-related
factors, health care team and system factors
and patient-related factors. As patients cannot
switch into dialysis diet on their own there
should be dietary counseling for them to help
to change their dietary intake and it should be
part of treatment for ensure they are taking
adequate calorie and protein (Prasad et al.,
2008).
Very few studies have been done to address
nutritional aspect of CAPD patients in Sri
Lanka. As the previous literature was not
available on similar studies in Sri Lanka,
conducting this type of research will be
important to understand nutritional status of
this population. Assessing the adherence to
the dietary recommendations in these
population may be the first step towards
directing appropriate nutritional
interventions which is crucial to maintain
proper nutritional status. Therefore, this
study aimed to identify deviations of current
nutrient intake from CAPD guideline
recommendations in the study sample.
Methodology
Cross-sectional study was done at CAPD clinic,
Nephrology and Transplantation Unit,
National Hospital, Kandy. The study was
carried out engaging 102 patients who
attended to CAPD clinic. Simple random
sampling method was used to select patients
for the study. Considering about inclusion
criteria, patients who were on CAPD
treatment more than one month were
recruited for the study. Total number of
participants attending to clinic were 135 at the
time of starting data collection. Simple
random sampling method used to select
patients for the study. Patients were asked to
pick a chit randomly among chits which were
numbered from 1 to 135. Only those patients
who picked numbers in between 1 to 102
included in the study. Patients who were
having peritonitis and other therapy related
complications were excluded from the study.
A validated food frequency questionnaire
(FFQ) which was developed for Sri Lankan
adult population (Mallika Arachchige, 2013)
was used to collect information about
currently consuming foods on daily, weekly
and monthly basis. The average frequency of
food intake per week and month of the FFQ
was converted to a daily intake value. In this
FFQ, details about the quantity and frequency
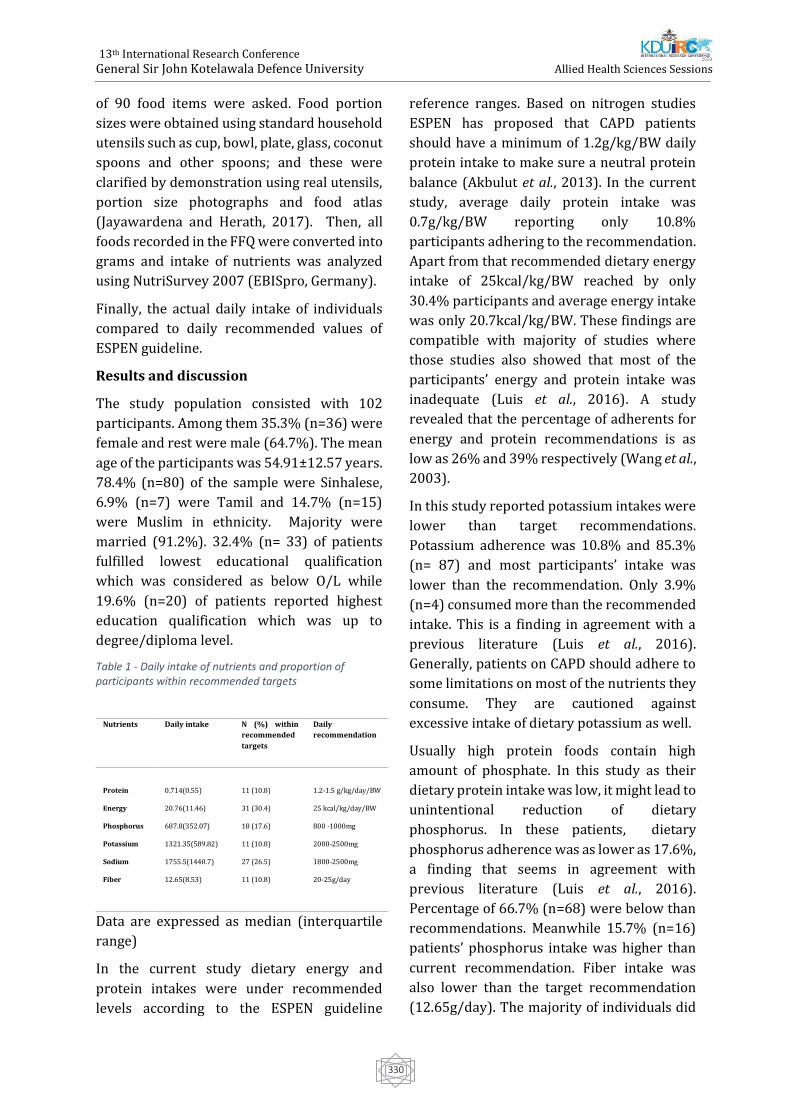
13th International Research Conference
General Sir John Kotelawala Defence University
Allied Health Sciences Sessions
330
of 90 food items were asked. Food portion
sizes were obtained using standard household
utensils such as cup, bowl, plate, glass, coconut
spoons and other spoons; and these were
clarified by demonstration using real utensils,
portion size photographs and food atlas
(Jayawardena and Herath, 2017). Then, all
foods recorded in the FFQ were converted into
grams and intake of nutrients was analyzed
using NutriSurvey 2007 (EBISpro, Germany).
Finally, the actual daily intake of individuals
compared to daily recommended values of
ESPEN guideline.
Results and discussion
The study population consisted with 102
participants. Among them 35.3% (n=36) were
female and rest were male (64.7%). The mean
age of the participants was 54.91±12.57 years.
78.4% (n=80) of the sample were Sinhalese,
6.9% (n=7) were Tamil and 14.7% (n=15)
were Muslim in ethnicity. Majority were
married (91.2%). 32.4% (n= 33) of patients
fulfilled lowest educational qualification
which was considered as below O/L while
19.6% (n=20) of patients reported highest
education qualification which was up to
degree/diploma level.
Table 1 - Daily intake of nutrients and proportion of participants within recommended targets
Data are expressed as median (interquartile
range)
In the current study dietary energy and
protein intakes were under recommended
levels according to the ESPEN guideline
reference ranges. Based on nitrogen studies
ESPEN has proposed that CAPD patients
should have a minimum of 1.2g/kg/BW daily
protein intake to make sure a neutral protein
balance (Akbulut et al., 2013). In the current
study, average daily protein intake was
0.7g/kg/BW reporting only 10.8%
participants adhering to the recommendation.
Apart from that recommended dietary energy
intake of 25kcal/kg/BW reached by only
30.4% participants and average energy intake
was only 20.7kcal/kg/BW. These findings are
compatible with majority of studies where
those studies also showed that most of the
participants’ energy and protein intake was
inadequate (Luis et al., 2016). A study
revealed that the percentage of adherents for
energy and protein recommendations is as
low as 26% and 39% respectively (Wang et al.,
2003).
In this study reported potassium intakes were
lower than target recommendations.
Potassium adherence was 10.8% and 85.3%
(n= 87) and most participants’ intake was
lower than the recommendation. Only 3.9%
(n=4) consumed more than the recommended
intake. This is a finding in agreement with a
previous literature (Luis et al., 2016).
Generally, patients on CAPD should adhere to
some limitations on most of the nutrients they
consume. They are cautioned against
excessive intake of dietary potassium as well.
Usually high protein foods contain high
amount of phosphate. In this study as their
dietary protein intake was low, it might lead to
unintentional reduction of dietary
phosphorus. In these patients, dietary
phosphorus adherence was as lower as 17.6%,
a finding that seems in agreement with
previous literature (Luis et al., 2016).
Percentage of 66.7% (n=68) were below than
recommendations. Meanwhile 15.7% (n=16)
patients’ phosphorus intake was higher than
current recommendation. Fiber intake was
also lower than the target recommendation
(12.65g/day). The majority of individuals did
Nutrients
Daily intake
N (%) within
recommended
targets
Daily
recommendation
Protein
Energy
Phosphorus
Potassium
Sodium
Fiber
0.714(0.55)
20.76(11.46)
687.8(352.07)
1321.35(589.82)
1755.5(1440.7)
12.65(8.53)
11 (10.8)
31 (30.4)
18 (17.6)
11 (10.8)
27 (26.5)
11 (10.8)
1.2-1.5 g/kg/day/BW
25 kcal/kg/day/BW
800 -1000mg
2000-2500mg
1800-2500mg
20-25g/day
13th International Research Conference
General Sir John Kotelawala Defence University
Allied Health Sciences Sessions
331
not consume sufficient fiber. Proportion of
non-adherent was 85.3% (n=87). This finding
is in line with a study which found that less
consumption of dietary fiber. They suggest
that it may be as a result of dietary advices
received by patients to avoid fruits and
vegetables as a measure to control potassium
levels (Luis et al., 2016). Constipation is a
common complaint in CAPD patients and low
fiber intake is a cause for constipation. Fiber-
rich foods are normally high in potassium and
phosphorus (Sutton, Talbot and Stevens,
2001). Advices to restrict potassium and
phosphorus may adversely affect on the intake
of sufficient fiber in these patients.
There are lots of uncertainties when
estimating salt intake as daily consumption
varies depending on their choices and
preferences on daily basis. Food composition
tables are also unable to consider each and
every commercial product detail and exact salt
amounts of regional preparation of dishes.
Therefore, salt intake estimation is a difficult
task (Vaz et al., 2014). However, the average of
sodium consumption of our participants was
1755.5(1440.7) mg/day while ESPEN
recommendation proposes 1800-
2500mg/day intake. Proportion of individuals
consumed more than target daily sodium was
20.6% (n=21) and 52.9% (n= 54) individuals
consumed less than target range.
Conclusion
In conclusion, the majority of CAPD patients,
participated in this study did not meet current
renal specific dietary recommendation in
relation to all the selected dietary
components. Furthermore, results show that
majority of the participants consumed less
than recommended intake. Finally,
conventional dietary counselling which has
received by all the participants is not enough
in order to achieve proper dietary knowledge
as well as to adhere to dietary modifications to
reach recommended dietary targets values.
References
Akbulut, G. et al. (2013) ‘Daily dietary energy and
macronutrient intake and anthropometric
measurements of the peritoneal dialysis patients’,
Renal Failure, 35(1), pp. 56–61. doi:
10.3109/0886022X.2012.734768.
Beto, J. A. and Nicholas, M. (2009) ‘So just what can
I eat? Nutritional care in patients with diabetes
mellitus and chronic kidney disease.’, Nephrology
nursing journal : journal of the American
Nephrology Nurses’ Association, 36(5), pp. 497–
504; quiz 505. Available at:
http://www.embase.com/search/results?subacti
on=viewrecord&from=export&id=L355906358
(Accessed: 2 May 2020).
Biró, G. et al. (2002) ‘Selection of methodology to
assess food intake’, European Journal of Clinical
Nutrition, 56(S2), pp. S25–S32. doi:
10.1038/sj.ejcn.1601426.
Cano, N. J. M. et al. (2009) ‘ESPEN Guidelines on
Parenteral Nutrition: Adult Renal Failure’, Clinical
Nutrition. Elsevier Ltd, 28(4), pp. 401–414. doi:
10.1016/j.clnu.2009.05.016.
Chaudri, N. A. (2004) ‘Adherence to Long-term
Therapies Evidence for ActionWorld Health
Organization (WHO). 2003, 216 pages [English].
ISBN 92 4 154599 2’, Annals of Saudi Medicine. King
Faisal Specialist Hospital and Research Centre,
24(3), pp. 221–222. doi: 10.5144/0256-
4947.2004.221.
Cupisti, A. and Kalantar-Zadeh, K. (2013)
‘Management of Natural and Added Dietary
Phosphorus Burden in Kidney Disease’, Seminars in
Nephrology. NIH Public Access, 33(2), pp. 180–190.
doi: 10.1016/j.semnephrol.2012.12.018.
Hajira, B., Samiullah, M. and Chawla, R. K. (2013)
‘Nutritional Status Assesment of Hemodialysis
Patients At Rehman Medical Institute Peshawar’,
ARPN Journal of Agricultural and Biological Science,
8(4), pp. 329–336.
Luis, D. et al. (2016) ‘Dietary Quality and
Adherence to Dietary Recommendations in
Patients Undergoing Hemodialysis’, Journal of
Renal Nutrition, 26(3), pp. 190–195. doi:
10.1053/j.jrn.2015.11.004.
Mallika Arachchige, R. J. (2013) ‘Validity of dietary
questionnaires in Sri Lankan adults and the
13th International Research Conference
General Sir John Kotelawala Defence University
Allied Health Sciences Sessions
332
association of dietary intake with obesity’, (April).
Available at:
http://eprints.qut.edu.au/64505/1/Ranil_Mallika
_Arachchige_Thesis.pdf.
Prasad, N. et al. (2008) ‘Changes in Nutritional
Status on Follow-Up of an Incident Cohort of
Continuous Ambulatory Peritoneal Dialysis
Patients’, Journal of Renal Nutrition, 18(2), pp. 195–
201. doi: 10.1053/j.jrn.2007.08.002.
Sutton, D., Talbot, S. T. and Stevens, J. M. (2001) ‘Is
there a relationship between diet and nutrition
status in continuous ambulatory peritoneal
dialysis patients?’, Peritoneal Dialysis International.
SAGE PublicationsSage UK: London, England,
21(SUPPL. 3), pp. 168–173. doi:
10.1177/089686080102103s28.
Vaz, I. M. F. et al. (2014) ‘Food intake in patients on
hemodialysis’, Revista de Nutrição, 27(6), pp. 665–
675. doi: 10.1590/1415-52732014000600002.
Wang, A. Y. M. et al. (2003) ‘Important factors other
than dialysis adequacy associated with inadequate
dietary protein and energy intakes in patients
receiving maintenance peritoneal dialysis.’, The
American journal of clinical nutrition, 77(4), pp.
834–841. doi: 10.1093/ajcn/77.4.834.
Zang, J. et al. (2019) ‘Validity and reliability of a
food frequency questionnaire for assessing dietary
intake among Shanghai residents’, Nutrition
Journal. BioMed Central Ltd., 18(1), p. 30. doi:
10.1186/s12937-019-0454-2.
13th International Research Conference
General Sir John Kotelawala Defence University
Allied Health Sciences Sessions
333
Paper ID: 619
Evaluation Of Efficacy & Efficiency In Implementing Knee Ankle Foot
Orthosis (KAFO) As A Functionally Assistive Indoor Ambulatory
Device For Motor Complete Thoracic Level (T10 –T12) Spinal Cord
Injury In Males
WGTN Gamage1# and DTD Warnakulasuriya2
1Rheumatology & Rehabilitation Hospital, Ragama, Sri Lanka 2Faculty of Medicine, University of Kelaniya, Sri Lanka
Abstract:- The objective was to evaluate
walking velocity, walking endurance & energy
expenditure in use of KAFOs over the
alternative Aluminum Back Slab & Toe Raising
Straps (ABS & TRS) on paraplegic (T10 –T12)
ambulation which has not been performed
among Sri Lankan patients. This was a case
cross over study where fifteen, T10 – T12 motor
complete paraplegic males who were
practicing indoor ambulation with ABS & TRS
& recommended to use KAFOs were recruited.
A two weeks standardized ambulatory
training was provided with either device prior
to test. The 10 meter walk test, 6-minute walk
test & physiological cost index (PCI) were used
to assess walking velocity, walking endurance
& energy expenditure respectively. Testing
was done 6 weeks apart. A statistically
significant difference was seen in walking
velocity (z = -3.30, p = 0.001), with ABS & TRS
having faster velocity. The walking endurance
was significantly less (z = - 3.41, p = 0.001,) &
the energy expenditure was significantly high
(z = -3.41, p = 0.001) with KAFOs relative to
ABS &TRS. The results are closely compatible
with previous studies, but remarkably differed
with values of healthy individuals in normal
ambulation. The walking velocity & the
walking endurance of participants were
relatively greater with less energy
expenditure during ambulation with ABS &
TRS. Therefore, it is concluded that KAFOs
have less efficacy & efficiency as a functional
indoor ambulatory device over ABS & TRS in
rehabilitation of T10 –T12 paraplegic males.
Keywords: KAFOs, ABS & TRS, T10 – T12
paraplegics, walking velocity, walking
endurance, energy expenditure, 10 meter
walk test, 6-minute walk test, physiological
cost index (PCI).
Introduction
A pair of Knee Ankle Foot Orthosis (KAFOs) is
recommended as an assistive functional
indoor ambulatory device for subjects with
paraplegia resulting from T10 –T12 traumatic
spinal cord lesions in local settings where an
analysis of the efficacy and efficiency of the
device yet to be perform among Sri Lankan
patients undergoing rehabilitation following
spinal cord injuries. Hence the objective of this
study was to evaluate walking velocity,
walking endurance & energy expenditure in
use of KAFOs over the alternative Aluminium
Back Slab & Toe Raising Straps (ABS & TRS) on
paraplegic (T10 –T12) ambulation which has
not been performed among Sri Lankan
patients.
Methodology
This was a case cross over study conducted at
the Department of Spinal injury rehabilitation,
Rheumatology & Rehabilitation Hospital,
Ragama during the period of 4 months from
April 2019 to evaluate the gait related
parameters in indoor ambulation using a pair
of KAFOs & that of using ABS with TRS. Fifteen,
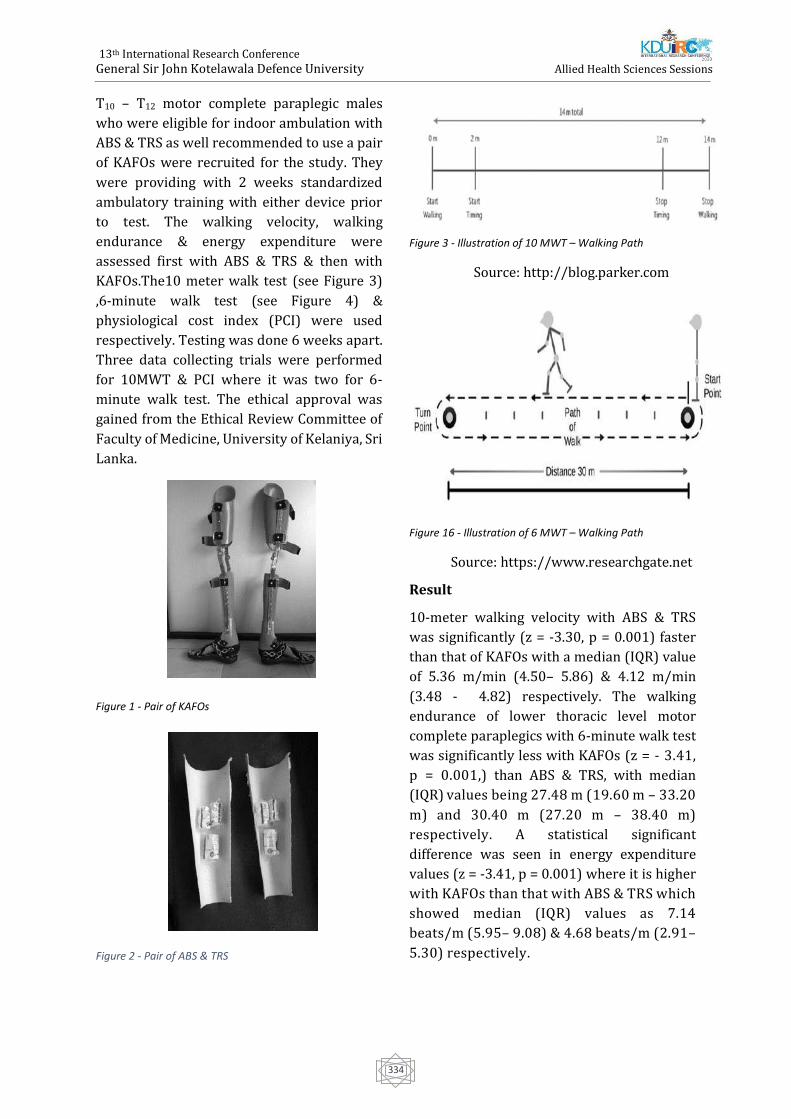
13th International Research Conference
General Sir John Kotelawala Defence University
Allied Health Sciences Sessions
334
T10 – T12 motor complete paraplegic males
who were eligible for indoor ambulation with
ABS & TRS as well recommended to use a pair
of KAFOs were recruited for the study. They
were providing with 2 weeks standardized
ambulatory training with either device prior
to test. The walking velocity, walking
endurance & energy expenditure were
assessed first with ABS & TRS & then with
KAFOs.The10 meter walk test (see Figure 3)
,6-minute walk test (see Figure 4) &
physiological cost index (PCI) were used
respectively. Testing was done 6 weeks apart.
Three data collecting trials were performed
for 10MWT & PCI where it was two for 6-
minute walk test. The ethical approval was
gained from the Ethical Review Committee of
Faculty of Medicine, University of Kelaniya, Sri
Lanka.
Figure 1 - Pair of KAFOs
Figure 2 - Pair of ABS & TRS
Figure 3 - Illustration of 10 MWT – Walking Path
Source: http://blog.parker.com
Figure 16 - Illustration of 6 MWT – Walking Path
Source: https://www.researchgate.net
Result
10-meter walking velocity with ABS & TRS
was significantly (z = -3.30, p = 0.001) faster
than that of KAFOs with a median (IQR) value
of 5.36 m/min (4.50– 5.86) & 4.12 m/min
(3.48 - 4.82) respectively. The walking
endurance of lower thoracic level motor
complete paraplegics with 6-minute walk test
was significantly less with KAFOs (z = - 3.41,
p = 0.001,) than ABS & TRS, with median
(IQR) values being 27.48 m (19.60 m – 33.20
m) and 30.40 m (27.20 m – 38.40 m)
respectively. A statistical significant
difference was seen in energy expenditure
values (z = -3.41, p = 0.001) where it is higher
with KAFOs than that with ABS & TRS which
showed median (IQR) values as 7.14
beats/m (5.95– 9.08) & 4.68 beats/m (2.91–
5.30) respectively.
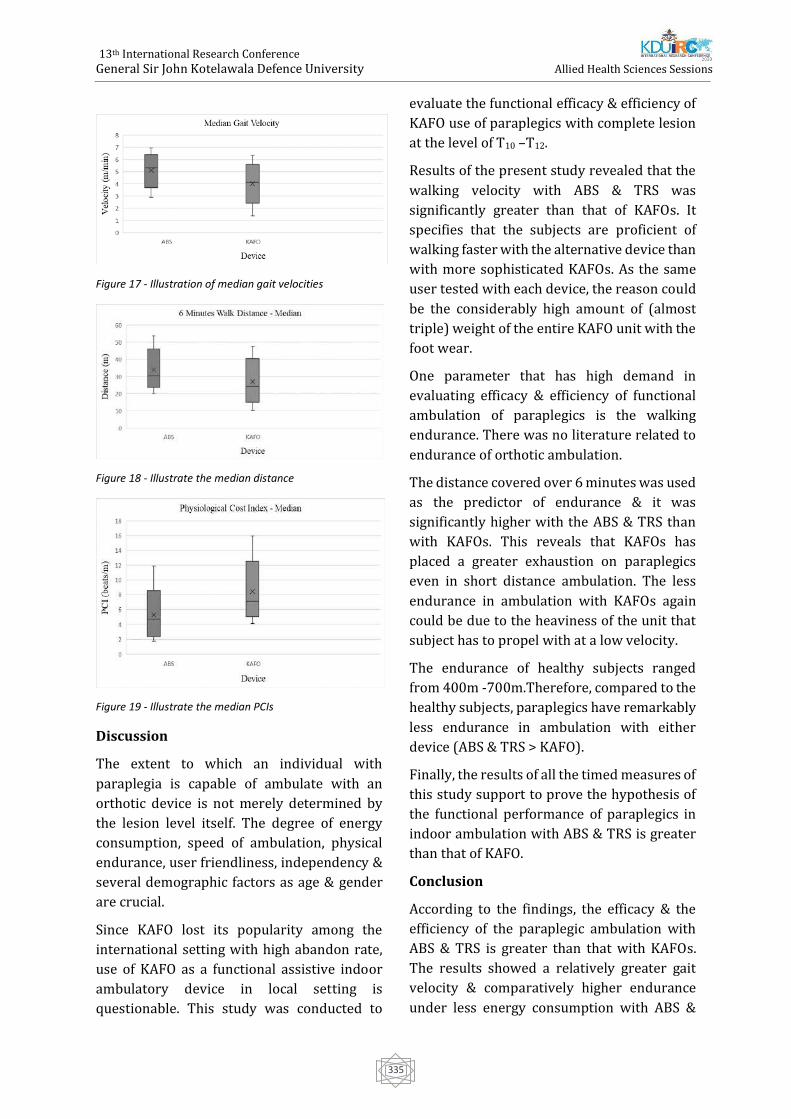
13th International Research Conference
General Sir John Kotelawala Defence University
Allied Health Sciences Sessions
335
Figure 17 - Illustration of median gait velocities
Figure 18 - Illustrate the median distance
Figure 19 - Illustrate the median PCIs
Discussion
The extent to which an individual with
paraplegia is capable of ambulate with an
orthotic device is not merely determined by
the lesion level itself. The degree of energy
consumption, speed of ambulation, physical
endurance, user friendliness, independency &
several demographic factors as age & gender
are crucial.
Since KAFO lost its popularity among the
international setting with high abandon rate,
use of KAFO as a functional assistive indoor
ambulatory device in local setting is
questionable. This study was conducted to
evaluate the functional efficacy & efficiency of
KAFO use of paraplegics with complete lesion
at the level of T10 –T12.
Results of the present study revealed that the
walking velocity with ABS & TRS was
significantly greater than that of KAFOs. It
specifies that the subjects are proficient of
walking faster with the alternative device than
with more sophisticated KAFOs. As the same
user tested with each device, the reason could
be the considerably high amount of (almost
triple) weight of the entire KAFO unit with the
foot wear.
One parameter that has high demand in
evaluating efficacy & efficiency of functional
ambulation of paraplegics is the walking
endurance. There was no literature related to
endurance of orthotic ambulation.
The distance covered over 6 minutes was used
as the predictor of endurance & it was
significantly higher with the ABS & TRS than
with KAFOs. This reveals that KAFOs has
placed a greater exhaustion on paraplegics
even in short distance ambulation. The less
endurance in ambulation with KAFOs again
could be due to the heaviness of the unit that
subject has to propel with at a low velocity.
The endurance of healthy subjects ranged
from 400m -700m.Therefore, compared to the
healthy subjects, paraplegics have remarkably
less endurance in ambulation with either
device (ABS & TRS > KAFO).
Finally, the results of all the timed measures of
this study support to prove the hypothesis of
the functional performance of paraplegics in
indoor ambulation with ABS & TRS is greater
than that of KAFO.
Conclusion
According to the findings, the efficacy & the
efficiency of the paraplegic ambulation with
ABS & TRS is greater than that with KAFOs.
The results showed a relatively greater gait
velocity & comparatively higher endurance
under less energy consumption with ABS &
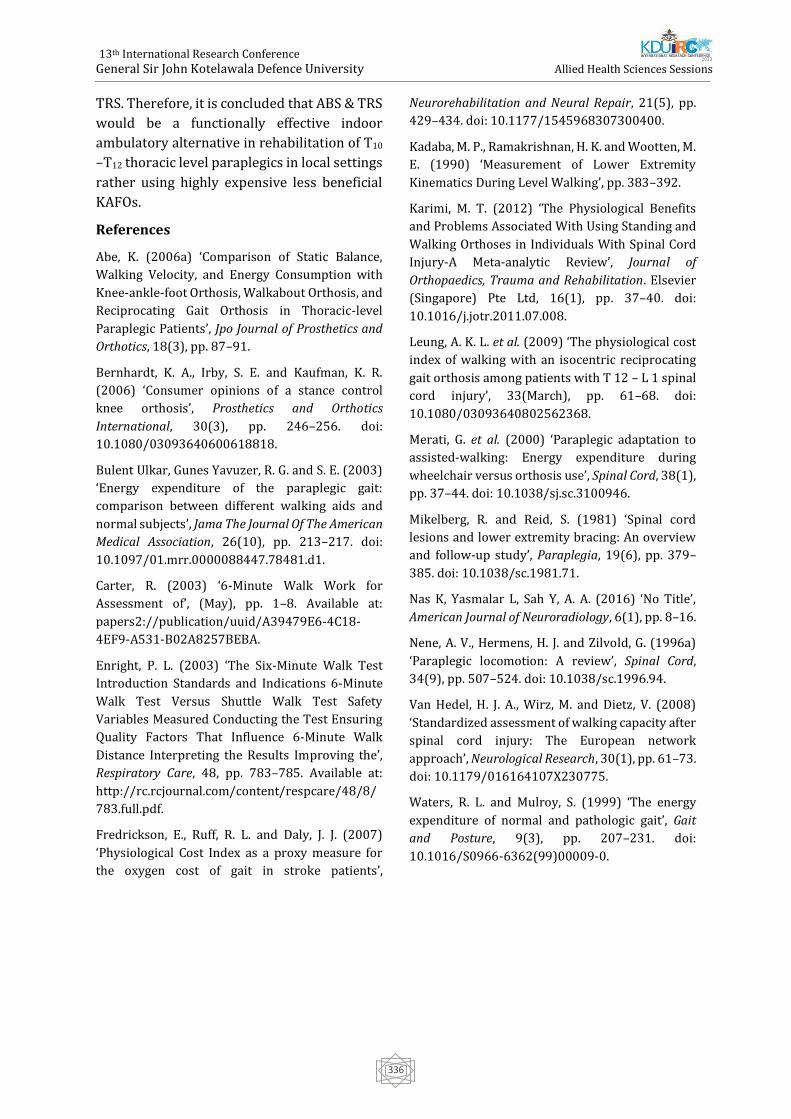
13th International Research Conference
General Sir John Kotelawala Defence University
Allied Health Sciences Sessions
336
TRS. Therefore, it is concluded that ABS & TRS
would be a functionally effective indoor
ambulatory alternative in rehabilitation of T10
–T12 thoracic level paraplegics in local settings
rather using highly expensive less beneficial
KAFOs.
References
Abe, K. (2006a) ‘Comparison of Static Balance,
Walking Velocity, and Energy Consumption with
Knee-ankle-foot Orthosis, Walkabout Orthosis, and
Reciprocating Gait Orthosis in Thoracic-level
Paraplegic Patients’, Jpo Journal of Prosthetics and
Orthotics, 18(3), pp. 87–91.
Bernhardt, K. A., Irby, S. E. and Kaufman, K. R.
(2006) ‘Consumer opinions of a stance control
knee orthosis’, Prosthetics and Orthotics
International, 30(3), pp. 246–256. doi:
10.1080/03093640600618818.
Bulent Ulkar, Gunes Yavuzer, R. G. and S. E. (2003)
‘Energy expenditure of the paraplegic gait:
comparison between different walking aids and
normal subjects’, Jama The Journal Of The American
Medical Association, 26(10), pp. 213–217. doi:
10.1097/01.mrr.0000088447.78481.d1.
Carter, R. (2003) ‘6-Minute Walk Work for
Assessment of’, (May), pp. 1–8. Available at:
papers2://publication/uuid/A39479E6-4C18-
4EF9-A531-B02A8257BEBA.
Enright, P. L. (2003) ‘The Six-Minute Walk Test
Introduction Standards and Indications 6-Minute
Walk Test Versus Shuttle Walk Test Safety
Variables Measured Conducting the Test Ensuring
Quality Factors That Influence 6-Minute Walk
Distance Interpreting the Results Improving the’,
Respiratory Care, 48, pp. 783–785. Available at:
http://rc.rcjournal.com/content/respcare/48/8/
783.full.pdf.
Fredrickson, E., Ruff, R. L. and Daly, J. J. (2007)
‘Physiological Cost Index as a proxy measure for
the oxygen cost of gait in stroke patients’,
Neurorehabilitation and Neural Repair, 21(5), pp.
429–434. doi: 10.1177/1545968307300400.
Kadaba, M. P., Ramakrishnan, H. K. and Wootten, M.
E. (1990) ‘Measurement of Lower Extremity
Kinematics During Level Walking’, pp. 383–392.
Karimi, M. T. (2012) ‘The Physiological Benefits
and Problems Associated With Using Standing and
Walking Orthoses in Individuals With Spinal Cord
Injury-A Meta-analytic Review’, Journal of
Orthopaedics, Trauma and Rehabilitation. Elsevier
(Singapore) Pte Ltd, 16(1), pp. 37–40. doi:
10.1016/j.jotr.2011.07.008.
Leung, A. K. L. et al. (2009) ‘The physiological cost
index of walking with an isocentric reciprocating
gait orthosis among patients with T 12 – L 1 spinal
cord injury’, 33(March), pp. 61–68. doi:
10.1080/03093640802562368.
Merati, G. et al. (2000) ‘Paraplegic adaptation to
assisted-walking: Energy expenditure during
wheelchair versus orthosis use’, Spinal Cord, 38(1),
pp. 37–44. doi: 10.1038/sj.sc.3100946.
Mikelberg, R. and Reid, S. (1981) ‘Spinal cord
lesions and lower extremity bracing: An overview
and follow-up study’, Paraplegia, 19(6), pp. 379–
385. doi: 10.1038/sc.1981.71.
Nas K, Yasmalar L, Sah Y, A. A. (2016) ‘No Title’,
American Journal of Neuroradiology, 6(1), pp. 8–16.
Nene, A. V., Hermens, H. J. and Zilvold, G. (1996a)
‘Paraplegic locomotion: A review’, Spinal Cord,
34(9), pp. 507–524. doi: 10.1038/sc.1996.94.
Van Hedel, H. J. A., Wirz, M. and Dietz, V. (2008)
‘Standardized assessment of walking capacity after
spinal cord injury: The European network
approach’, Neurological Research, 30(1), pp. 61–73.
doi: 10.1179/016164107X230775.
Waters, R. L. and Mulroy, S. (1999) ‘The energy
expenditure of normal and pathologic gait’, Gait
and Posture, 9(3), pp. 207–231. doi:
10.1016/S0966-6362(99)00009-0.
13th International Research Conference
General Sir John Kotelawala Defence University
Allied Health Sciences Sessions
337
Paper ID: 679
Psychological Experiences of Parents having a Child with Cleft Lip and
Palate
SMT Laksrini, WAD Dilrukshika, YMJM Yapa, AAI Sirimanna, MAR Saumika#, N Liyanage and
KGPK Munidasa
Department of Nursing, Faculty of Health Sciences, The Open University of Sri Lanka
Abstract:-Cleft Lip and Palate (CLP) is one of
the most common congenital craniofacial
conditions globally. Parents’ who are having
Children with CLP are facing various types of
experiences. A qualitative study was
conducted to explore the parent’s
psychological experiences of having a child
with CLP. Twenty parents who take care of
children with CLP more than three months
were purposively recruited for this
phenomenological study. The study was
conducted at Dental Teaching Hospital,
Peradeniya and ethical approval was obtained
from the Faculty of Allied Health Sciences,
University of Peradeniya. Data were collected
using semi-structured interviews and data
analysis was done using thematic analysis
method. Three major themes were emerged
from the data as excessive sorrow, fear
towards the surgery and coping with the
child’s birth defect. Not having the child that
parents expected to have, low body weight of
the child and sadness towards child’s future
with CLP were perceived as reasons for
excessive sorrow. Probable complication of
the surgery and lack of knowledge regarding
the surgery were reasons for fear towards the
surgery. Follow up treatments and family
supports were helped parents to coping with
the child’s birth defect. These main negative
adverse experiences and drawbacks help to
understand several hidden unpleasant
experiences of parents having a child with
CLP. Hence, it is needed to ensure the
importance of arranging social support
services for these parents which are one of the
neglected areas within the health care context
of Sri Lanka.
Keywords: Cleft Lip and Palate, Parents,
Experiences
Introduction
The CLP are among the most common
congenital craniofacial birth defect globally.
The CLP is referred to an abnormal opening of
the lip and roof of the mouth (Revezes, 2013).
A cleft lip and, on occasions a cleft palate, may
be visualised antenatally by ultrasound scan
and if identified early allows an opportunity to
inform parents prior to birth. However, a facial
cleft lip may also remain undiagnosed until the
birth, when the full extent of the anomaly
becomes apparent at delivery (Beaumont,
2006).
Child with CLP can be emotionally, socially,
traumatic for parents (Johansson, 2004). The
worldwide parents have so many experiences
with CLP children. Johansson (2004) further
explained parents slowly adapted to this
situation. Most of the time, there is no major
difficulties or problems with feeding a
newborn child with Cleft Lip whereas a child
with Cleft Palate has feeding problems
because of its incapability to produce effective
oral suction. According to clinical standards
advisory group in United Kingdom (1998), the
CLP may affect to child’s capability such as
feeding, chewing, breathing, and hearing along
with cause to disorders of dental, facial,
speech and even in language development.
Addressing about the ‘loss’, ‘mourning’ and
‘correcting’ have been common aspects in
13th International Research Conference
General Sir John Kotelawala Defence University
Allied Health Sciences Sessions
338
research viewpoints in surrounding the
diagnosis of a child with a cleft, which
informed by the assumptions of previous
theoretical perspectives (Olshansky 1962;
Solnit & Stark 1962; Drotar et al., 1975). Both
pre- and post-nataly, across countries and
cultures, parents’ feelings of shock, anger,
grief and worry have been identified equally in
surveys and in qualitative studies (Bradbury &
Hewison 1994). Coy et al. (2002) found that
some mothers of children with CLP or CP
showed extraordinary protectiveness and
responsiveness towards their children, as they
viewed them as vulnerable.
There are many studies in worldwide
regarding parents’ experiences having child
with cleft lip and palate. However, it is hard to
find published studies related to this area in
local context. Therefore, this study was aimed
to determine the experiences of parents who
are having children with CLP and identifying
what kind of humanistic nursing care that
should be provide to these parents
METHODOLOGY
This is a qualitative phenomenological study.
Semi- structured interviews were used to
collect data on parents’ experiences and close
observations to observe their expressions and
responses. A sample of 20 participants was
selected purposively considering the
characteristics of population and objectives of
the study. Parents who take care of children
with CLP more than three months were
recruited to the study and child should be
diagnosed with CLP by a pediatrician and Oro
Maxilla Facial surgeon and record should be
available. This study conducted at the Dental
Teaching Hospital, Peradeniya. Ethical
approval was obtained from the ERC of
Faculty of Allied Health Sciences, University of
Peradeniya. Data analysis was done using
thematic analysis method.
RESULTS
Sample was comprised with 85% of Sinhalese,
5%of Muslims and10% of Tamils. They were
belongs to three age groups as 40% in18 - 25
years, 35% in 25 - 35 years and 25% over 35
years. As level of education60% parents had
completed Ordinary level (O/L), 30% had
completed Advanced level (A/L) and
10%were graduates. Furthermore, 10% of
them were employed, 90% were unemployed.
Considering the gender of the child 70% were
male and 30% were female. Within the sample
only 10% was diagnosed pre-natal stage.
Among 20 children 5% diagnosed as Cleft lip,
15% children were diagnosed as Cleft palate
and 80% diagnosed as both cleft lip and palate.
From those 20 children 15% had family
history of cleft lip or palate. When considering
the birth order of child 55% were first child of
the family.
Three major themes were emerged from the
data as excessive sorrow, fear towards the
surgery and Coping with the child’s birth
defect.
Excessive sorrow: Not having the child that
parents expected to have, low body weight of
the child and sadness towards child’s future
with CLP were perceived as reasons for
excessive sorrow.
“When I saw her, I didn’t know what I could do
with her. I thought there would be nothing
anyone can do to my child. I was feeling
something terrible” (Participant 06).
“This is my first baby. We were looking for three
years for a baby. We never thought our baby
will be like this. When the nurse has shown my
baby to me, I felt like this baby is not mine. I
cried lot” (participant 8).
“When compared to other children, my baby is
having low body weight. it’s always make me
sad” (participant 2).
“She is a girl; I really worry about her future
with this condition” (Participant 5).
Fear towards the surgery: Probable
complication of the surgery and lack of
knowledge regarding the surgery were
reasons for fear towards the surgery.
13th International Research Conference
General Sir John Kotelawala Defence University
Allied Health Sciences Sessions
339
“I saw my baby lay on the theatre bed
unconsciously. I was afraid. The doctor said that
the baby is sleeping. But I had a fear that my
baby will not be recovered after surgery”
(participant 14).
“I searched about surgery via online. And I saw
photos of babies before and after surgery. Then
I strongly decided to go to the surgery as soon
as possible. Before that I wasn’t that much sure
about the surgery” (participant 1).
Coping with the child’s birth defect: Follow up
treatments and family supports were helped
parents to Coping with the child’s birth defect.
“When I took her to the clinic, I saw some
children who were in the same condition. I
understood that this is common, and I saw the
pictures before and after treatment. I felt guilty
that I hid my child in the beginning. I saw a
nurse with the same condition and I was more
encouraged that my daughter also will have
bright future” (Participant11).
“When I came to the hospital I saw many
children with cleft lip and palate with their
mothers, and I found that very strengthening. It
helped me keep on track. I saw some children
who have got treatment. I got new hope”
(Participant3).
“As I went to hospital, I met many in the same
condition. I became strong and even
encouraged them. When I am there, I forget
things that bother me and I feel am in a better
position where treatments are available.”
(Participant14).
Most of participants worried of their family
acceptance. There were many complaining,
comparing with other children and not
supportive from their extended family such as
mother, mother in law, grandmother, sisters
and sister in law.
“My mother in law said me that I was the first
lady to give birth a child like this in their family”
(participant 09).
“My sister in law always comparing her two
children with my little one. She said again and
again try to emphasise my baby is giving an
extra burden to the family” (participant 12).
However, some participant has good family
acceptance.
“My mother was with me until I got stronger
and emotionally stable. Even in the hospital, she
was the first one who came to see my baby. I was
very happy to have her standing by my side”
(Participant 4)).
“I think my mother in law is a great woman. She
never complained me. She supports me always.
She kept lot of hopes of her granddaughter. She
always said with me that all the things
happened according to the karma and we have
to accept it. She participated to the bodhi puja
to bless my child” (participant 09).
DISCUSSION
All most all participants of this study had great
sorrow due to their children’s condition. They
were shocked when they were showing their
baby at the first time. Similar findings were
identified in other studies done in South Africa
and Nigeria (Hlongwa & Rispel2018; Fakuade
et al., 2012). This study was identified that
most of the participants were denial to accept
unfortunate condition and appearance of their
child. Nidley (2016) also stated that the most
parents of child with CLP in United States had
denied.
All of participant initially had fear and
confused for surgery. most of parents had
reduced the fear in second time in palate
surgery. These findings are also consistent
with another study done by Chuacharoen et
al., (2009).
Coping with the child’s birth defect is a major
finding that was identified in this study.
Follow up treatment and family support were
the sub themes in coping with condition. Most
participants said that regular follow up
treatment was help them coping with the
child’s birth defect and reduce psychological
13th International Research Conference
General Sir John Kotelawala Defence University
Allied Health Sciences Sessions
340
discomfort. In a study done by Young et al.,
(2001) also found similar situation in their
study which highlighted that follow up
treatment was a good coping strategy.
CONCLUSION
Majority of the parents who are having
children with CLP had negative experiences
that they had to face in their life. The findings
of this study can be used in staff education to
promote understanding of Parents’
experience and how best to help them to
recover from psychological issues. And also
counseling program will be started in the
hospital for parents with cleft lip and palate
child for reduce psychological disturbances.
ACKNOWLEDGEMENTS
We wish to express our appreciation to the
entire participants of the research project for
their valuable co-operation and, the
consultant and nursing staff of the Dental
Teaching Hospital, Peradeniya
REFERENCES
Beaumont, D., (2006) Exploring parental reactions
to the diagnosis of cleft lip and palate. Paediatric
Nursing 18(3):14-8.
Bradbury, E. T. & Hewison, J. (1994) Early parental
adjustment to visible congenital disfigurement.
Child: Care, Health and Development, 20, 251–266.
Chuacharoean, R., Rithugol, W. Hunsrisakhun, J. &
Nilmanat, K. (2009). Felt needs
parents have 0 to 3-month-old child with a cleft lip
and palate. Scholarly article. Faculty of dentistry,
Prince of Sonngkla university, Karnnjanavanitrd,
Hat Yai, Sonngkla, Thailand.
Clinical Standards Advisory Group (1998) Cleft Lip
and/or Palate. Report of a CSAG Committee. The
Stationery Office, London, UK
Coy K., Speltz M.L. & Jones K. (2002) Facial
appearance and attachment in infants with
orofacial clefts: a replication. Cleft Palate-
Craniofacial Journal 39(1), 66–72.
Drotar, D., Baskiewicz, A., Irving, B., Kennell, J. &
Klaus, M. (1975) The adaptation of parents to the
birth of an infant with a congenital malformation: a
hypothetical model. Pediatrics, 56, 710–717.
Fakuade, B. O., Efunkoya, A. A., Adebayo, A. M., &
Adisa, A. O. (2018). Psychosocial impact of cleft lip
and palate children on their parents. Nigerian
Journal of Basic and Clinical Sciences, 15(1), 50.
Hlongwa, P., & Rispel, L. C. (2018) “People look and
ask lots of questions”: caregivers’ perceptions of
healthcare provision and support for children born
with cleft lip and palate. BMC public health, 18(1),
506.
Johansson, B. & Ringsberg, K. C. (2004). Parents’
experience of having a child with
cleft lip and palate. Journal of Advanced Nursing
47(2), 165−173.
Nideley, B. A. (2016, January). Psychological
wellbeing of parents of children
with oral cleft. Child care Health Development, 15,
42-50.
Olshansky, S. (1962) Chronic sorrow: a response to
having a mentally defective child. Social Casework,
43, 190–193.
Revezes, L. J. (2013). Incidence of orofacial cleft in
Ghana. Journal of ISRN
Plastic Surgery,10, 1-6.
Solnit, A. & Stark, M. H. (1962) Mourning and the
birth of a defective child. The Psychoanalytic Study
of the Child, 16, 9–24.
Young, J. L., O'Riordan, M., Goldstein, J. A., & Robin,
N. H. (2001). What information do parents of
newborns with cleft lip, palate, or both want to
know?. The Cleft palate-craniofacial journal, 38(1),
55-58.
Related Documents