Report Issued: September 2, 2016 Revision 0 ALLIANT ENERGY Interstate Power and Light Lansing Generating Station CCR SURFACE IMPOUNDMENT SAFETY FACTOR ASSESSMENT

Welcome message from author
This document is posted to help you gain knowledge. Please leave a comment to let me know what you think about it! Share it to your friends and learn new things together.
Transcript

Report Issued: September 2, 2016 Revision 0
ALLIANT ENERGY Interstate Power and Light Lansing Generating Station CCR SURFACE IMPOUNDMENT SAFETY FACTOR ASSESSMENT
Interstate Power and Light – Lansing Generating Station Safety Factor Assessment September 2, 2016 i
EXECUTIVE SUMMARY
This Safety Factor Assessment (Report) is prepared in accordance with the requirements
of the United States Environmental Protection Agency (USEPA) published Final Rule for
Hazardous and Solid Waste Management System – Disposal of Coal Combustion
Residual (CCR) from Electric Utilities (40 CFR Parts 257 and 261, also known as the CCR
Rule) published on April 17, 2015 and effective October 19, 2015.
This Report assess the safety factors of each CCR unit at Lansing Generating Station in
Lansing, Iowa in accordance with §257.73(b) and §257.73(e) of the CCR Rule. For
purposes of this Report, “CCR unit” refers to existing CCR surface impoundments.
Primarily, this Report is focused on assessing if each CCR surface impoundment achieves
the minimum safety factors, which include:
• Static factor of safety under long-term, maximum storage pool loading condition,
• Static factor of safety under the maximum surcharge pool loading condition,
• Seismic factor of safety; and,
• Post-Liquefaction factor of safety for embankments constructed of soils that have susceptibility to liquefaction.

Interstate Power and Light – Lansing Generating Station Safety Factor Assessment September 2, 2016 ii
Table of Contents
1 Introduction ............................................................................................................................................ 1
1.1 CCR Rule Applicability .................................................................................................................. 1
1.2 Safety Factor Assessment Applicability ........................................................................................ 1
2 FACILITY DESCRIPTION ..................................................................................................................... 2
2.1 LAN Upper Ash Pond .................................................................................................................... 3
3 SAFETY FACTOR ASSESSMENT- §257.73(e) .................................................................................... 5
3.1 Safety Factor Assessment Methods ............................................................................................. 5
3.1.1 Soil Conditions In and Under the Impoundment ....................................................................... 5
3.1.2 Design Water Surface in Impoundment: Maximum Normal Pool and Maximum Pool Under Design Inflow Storm ............................................................................................................................... 7
3.1.3 Selection of Seismic Design Parameters and Description of Method ....................................... 8
3.1.4 Liquefaction Assessment Method and Parameters .................................................................. 8
3.2 LAN Upper Ash Pond .................................................................................................................... 9
3.2.1 Static Safety Factor Assessment Under Maximum Storage Pool Loading - §257.73(e)(1)(i) 10
3.2.2 Static Safety Factor Assessment Under Maximum Surcharge Pool Loading - §257.73(e)(1)(ii) 10
3.2.3 Seismic Safety Factor Assessment - §257.73(e)(1)(iii)........................................................... 10
3.2.4 Post-Liquefaction Safety Factor Assessment - §257.73(e)(1)(iv) ........................................... 10
4 Results Summary ................................................................................................................................. 11
5 QUALIFIED PROFESSIONAL ENGINEER CERTIFICATION ............................................................ 12
Figures
Figure 1: Site Location Figure 2: Soil Boring and Analyses Cross-Sections
Appendices
Appendix A: Soil Borings Appendix B Soil Laboratory Testing Appendix C Earthquake and Liquefaction Analysis Appendix D Slope Stability Analysis
Interstate Power and Light – Lansing Generating Station Safety Factor Assessment September 2, 2016 1
1 Introduction
The owner or operator of the Coal Combustion Residual (CCR) unit must conduct an
initial and periodic safety factor assessments to determine if each CCR surface
impoundment achieves the minimum safety factors, which include:
• Static factor of safety under long-term, maximum storage pool loading condition,
• Static factor of safety under the maximum surcharge pool loading condition,
• Seismic factor of safety; and,
• Post-Liquefaction factor of safety for embankments constructed of soils that have susceptibility to liquefaction.
This Report has been prepared in accordance with the requirements of §257.73(b) and
§257.73(e) of the CCR Rule.
1.1 CCR Rule Applicability
The CCR Rule requires a periodic safety factor assessment by a qualified professional
engineer (PE) for existing CCR surface impoundments with a height of 5 feet or more and
a storage volume of 20 acre-feet or more; or the existing CCR surface impoundment has
a height of 20 feet or more.
1.2 Safety Factor Assessment Applicability
The Lansing Generating Station (LAN) in Lansing, Iowa (Figure 1) has one existing CCR
surface impoundment, identified as LAN Upper Ash Pond
The identified existing CCR surface impoundment meets the requirements of
§257.73(b)(1) and/or §257.73(b)(2), therefore is subject to the periodic safety factor
assessment requirements of §257.73(e) of the CCR Rule.

Interstate Power and Light – Lansing Generating Station Safety Factor Assessment September 2, 2016 2
2 FACILITY DESCRIPTION
LAN is located approximately three miles southeast of Lansing, Iowa on the western
shore of the Mississippi River in Allamakee County, at 2320 Power Plant Drive, Lansing,
Iowa (Figure 1).
LAN is a fossil-fueled electric generating station that has used four steam turbine electric
generating units throughout its history. Unit 1, Unit 2, and Unit 3 were retired by 2014
and Unit 4 is the only operating unit. Sub-bituminous coal is the primary fuel for
producing steam at LAN. The CCR at LAN is categorized into three types: bottom ash,
fly ash, and scrubber byproduct. Fly ash is collected by electrostatic precipitators and
pneumatically conveyed to an onsite fly ash silo, which is equipped with a baghouse for
dust control. The fly ash is then either transported off-site for beneficial reuse, landfilled
(in the case of high loss on ignition), or sluiced to LAN Upper Ash Pond (typically during
startup and shutdown). Bottom ash is sluiced to a surface impoundment identified as
the LAN Upper Ash Pond, Figure 2, where it is dredged, dewatered, and transported to
the onsite landfill. The LAN Upper Ash Pond is located south of the generating plant
and is the only existing CCR surface impoundment. Scrubber byproduct consists of fly
ash, unreacted lime, and activated carbon. Scrubber byproduct is collected in the
byproduct silo prior to being landfilled.
A previous CCR surface impoundment at LAN, identified as the Lower Ash Pond, was
located west of the generating plant and north of Power Plant Drive. The Lower Ash
Pond was closed in September 2015 by removing the CCR from the surface impoundment
via hydraulic dredge and sluicing the CCR to the south end of the LAN Upper Ash Pond.
CCR was removed from the Lower Ash Pond prior to backfilling the surface
impoundment.
General Facility Information:
Date of Initial Facility Operations: 1946
NPDES Permit Number: IA0300100

Interstate Power and Light – Lansing Generating Station Safety Factor Assessment September 2, 2016 3
Latitude / Longitude: 41°56’38.43”N 91°38’22.39”W
Nameplate Ratings: Unit 1 (1948): 16.6 MW (Retired)
Unit 2 (1949): 11.4 MW (Retired)
Unit 3 (1957): 35.8 MW (Retired)
Unit 4 (1977): 270 MW
2.1 LAN Upper Ash Pond
The LAN Upper Ash Pond is located southwest of the generating plant and south of
Power Plant Drive. The LAN Upper Ash Pond receives influent flows from the Unit 4
boiler floor sumps, water treatment sumps, fly ash hydroveyor system, storm water
runoff from the active dry ash landfill and hillside east of the impoundment, as well as
sluiced fly ash and bottom ash. The LAN Upper Ash Pond is the only receiver of sluiced
CCR at LAN. The CCR is sluiced from the generating plant to the south east corner of
the LAN Upper Ash Pond, Figure 2. The sluiced CCR discharges into the southeast
corner of the LAN Upper Ash Pond where the majority of the CCR settles. Ongoing
maintenance dredging is conducted in the southern portion of the LAN Upper Ash Pond.
The dredged CCR is temporarily stockpiled and dewatered prior to being transported to
the on-site active dry ash landfill located south of the LAN Upper Ash Pond.
The sluiced water that is discharged into the LAN Upper Ash Pond flows to the west
prior to flowing north through a series of five interconnected settling ponds separated by
intermediate dikes. The intermediate dikes have 30-inch diameter corrugated metal
pipes on the west and east sides, which hydraulically connects the five settling ponds.
The water from each settling pond flows north until it enters the fifth large open settling
pond area of the LAN Upper Ash Pond. The north end of the LAN Upper Ash Pond has
a concrete wet well and overflow weir structure that controls the LAN Upper Ash Ponds
water level, and is identified as Weir Box #1. The water in the LAN Upper Ash Pond
overflows a stop log weir into Weir Box #1 and then through a 146 foot long 24 inch
diameter corrugated metal pipe, under Power Plant Drive, and into Weir Box #2. The
water leaves Weir Box #2 through a 225 foot long, 24-inch diameter high density
polyethylene pipe, which connects Weir Box #2 to Weir Box #3. The water flows through
Interstate Power and Light – Lansing Generating Station Safety Factor Assessment September 2, 2016 4
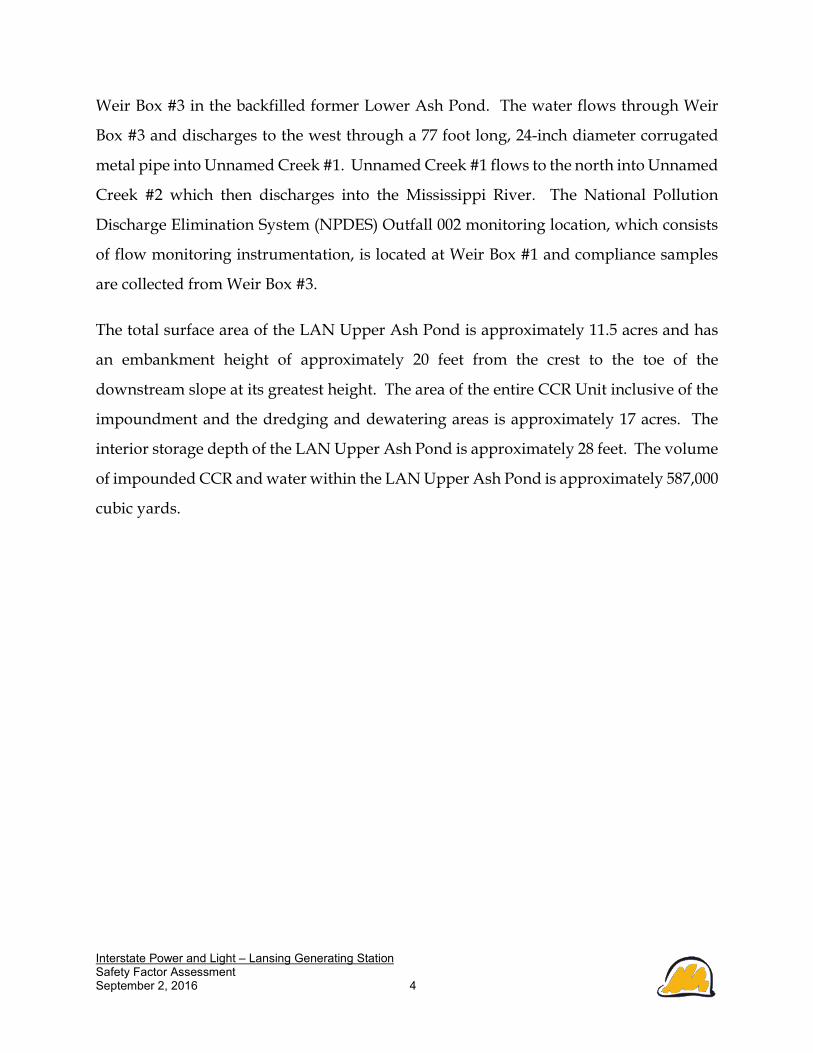
Weir Box #3 in the backfilled former Lower Ash Pond. The water flows through Weir
Box #3 and discharges to the west through a 77 foot long, 24-inch diameter corrugated
metal pipe into Unnamed Creek #1. Unnamed Creek #1 flows to the north into Unnamed
Creek #2 which then discharges into the Mississippi River. The National Pollution
Discharge Elimination System (NPDES) Outfall 002 monitoring location, which consists
of flow monitoring instrumentation, is located at Weir Box #1 and compliance samples
are collected from Weir Box #3.
The total surface area of the LAN Upper Ash Pond is approximately 11.5 acres and has
an embankment height of approximately 20 feet from the crest to the toe of the
downstream slope at its greatest height. The area of the entire CCR Unit inclusive of the
impoundment and the dredging and dewatering areas is approximately 17 acres. The
interior storage depth of the LAN Upper Ash Pond is approximately 28 feet. The volume
of impounded CCR and water within the LAN Upper Ash Pond is approximately 587,000
cubic yards.

Interstate Power and Light – Lansing Generating Station Safety Factor Assessment September 2, 2016 5
3 SAFETY FACTOR ASSESSMENT- §257.73(e)
This Report evaluates whether each CCR surface impoundment achieves the minimum
safety factors, which are identified on the table below.
Safety Factor Assessment Minimum Safety Factor
Static Safety Factor Under Maximum Storage Pool Loading
1.50
Static Safety Factor Under Maximum Surcharge Pool Loading
1.40
Seismic Safety Factor 1.00
Liquefaction Safety Factor 1.20
3.1 Safety Factor Assessment Methods
The safety factor assessment is completed with the two dimensional limit-equilibrium
slope stability analyses program STABL5M (1996)1. The program analyzes many
potential failure circles or block slides by random generation of failure surfaces using the
toe and crest search boundaries set for each analysis. The solution occurs by balancing
the resisting forces along the failure plane due to the Mohr-Columb failure strength
parameters of friction angle and cohesion. The gravity driving forces are divided by the
resisting forces to produce a safety factor for the slope. The minimum of hundreds of
searches is presented as the applicable safety factor.
There are both total stress and effective stress friction angle and cohesion values for soil.
In the case of cohesionless soil (gravel, sand and silt) the values are the same. For clay
the total stress value is cohesion only. At the LAN Upper Ash Pond only cohesionless
soil is present in and under the embankments.
3.1.1 Soil Conditions In and Under the Impoundment
The LAN Upper Ash Pond is constructed in the valley of Unnamed Creek #1 south of the
LAN Generating Station. The Unnamed Creek #1 was rerouted to the west side of the
1 STABL User Manual by Ronald A. Siegal, Purdue University, June 4, 1975 and STABL5 – The Spencer Method
of Slices: Final Report by J. R. Carpenter, Purdue University, August 28, 1985
Interstate Power and Light – Lansing Generating Station Safety Factor Assessment September 2, 2016 6
valley in the northern half of the LAN Upper Ash Pond when the impoundment was
constructed in 1974. At the north end of the LAN Upper Ash Pond, Unnamed Creek #1
drops over a manmade riffle structure under the Power Plant road Bridge losing
approximately 14 feet of elevation to reach the elevation of Pool #9 of the Mississippi
River. The drop structure prevents backwater flooding of the Mississippi River from
encroaching on the toe of the LAN Upper Ash Pond embankment.
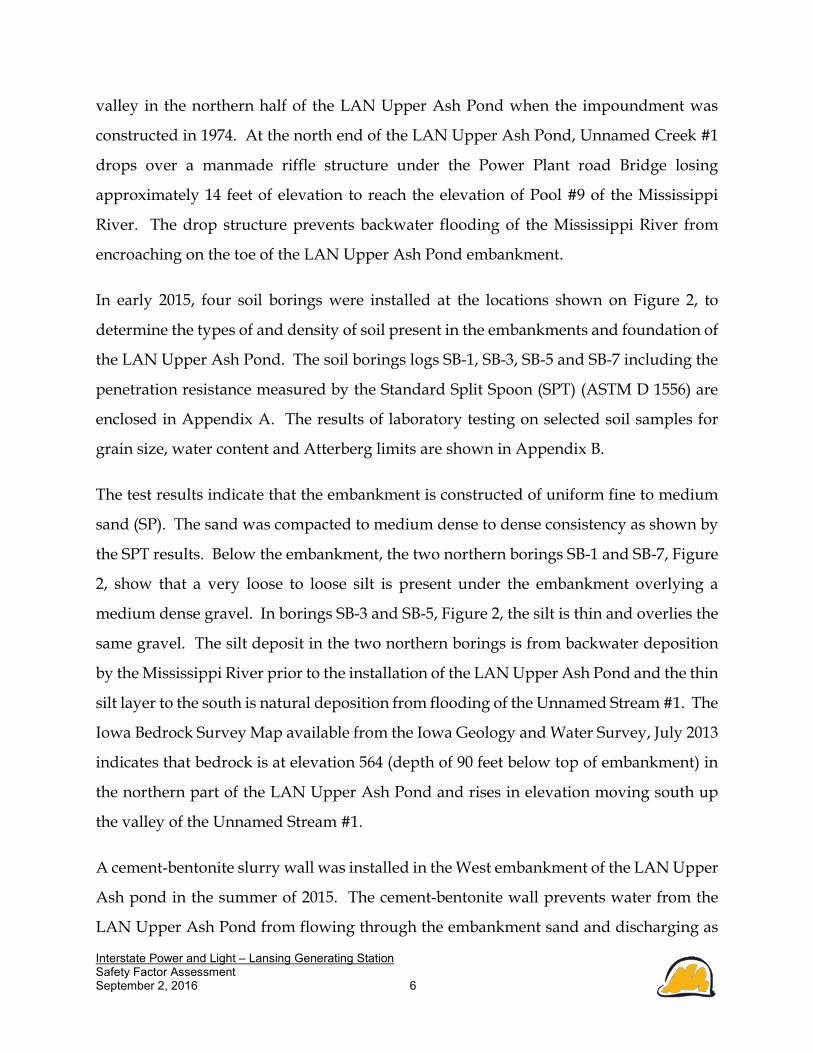
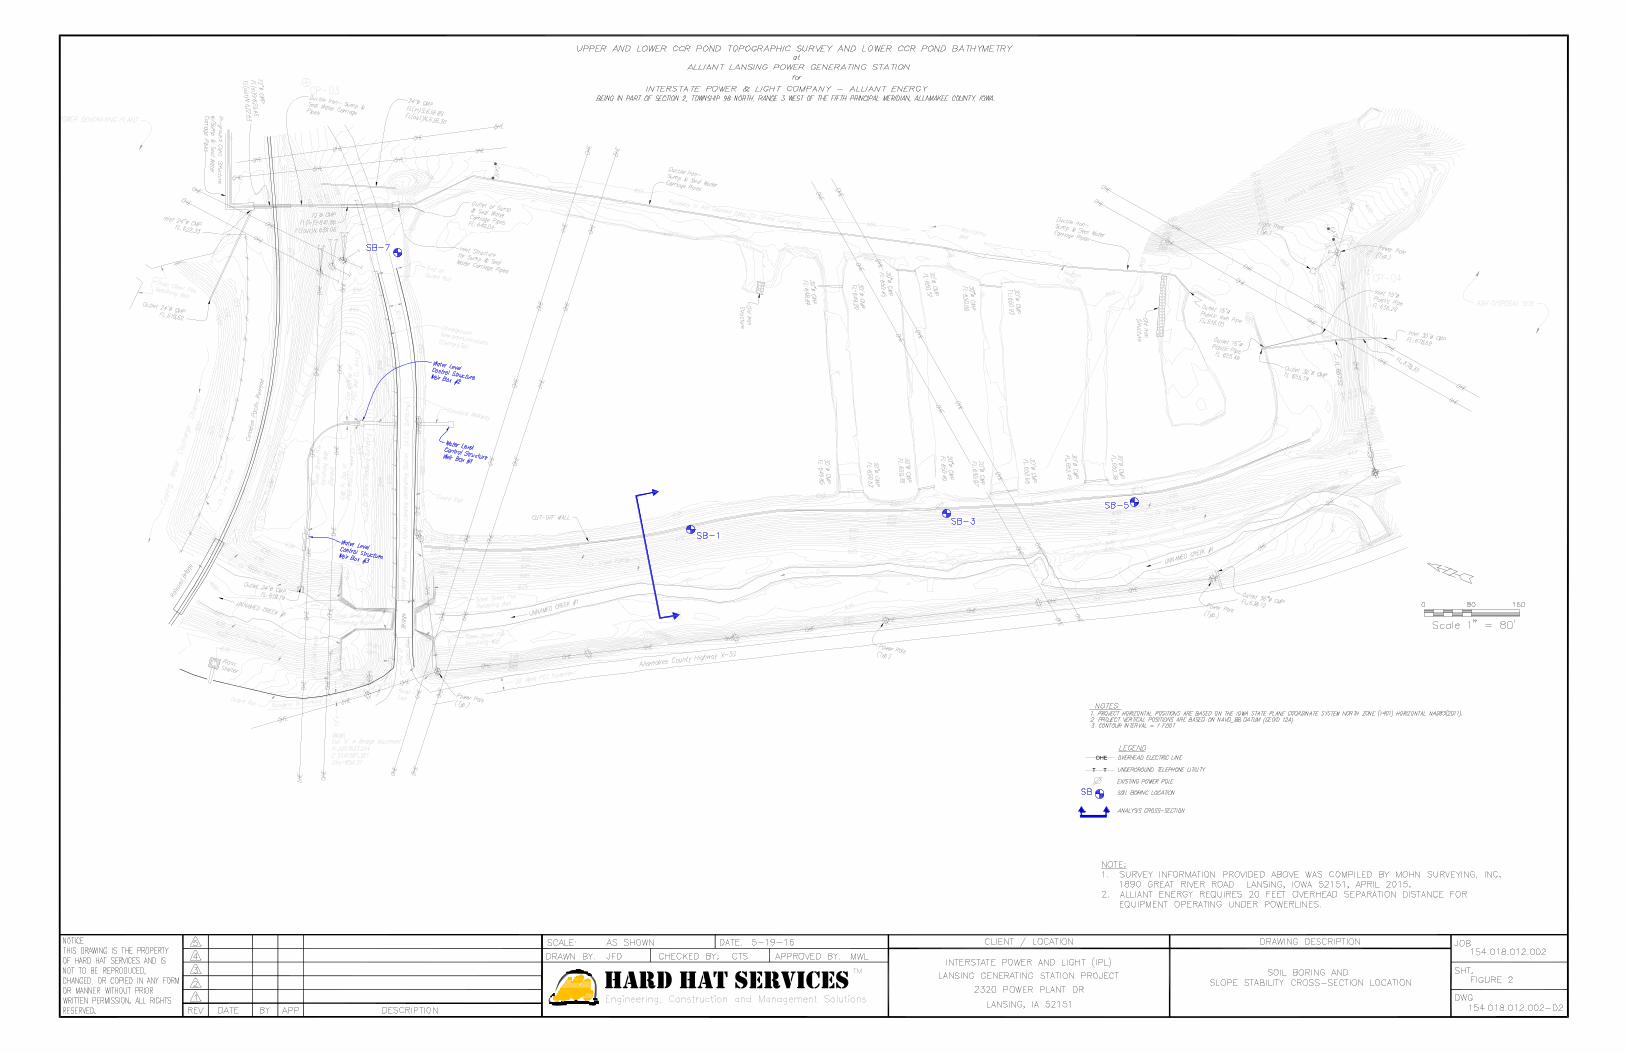
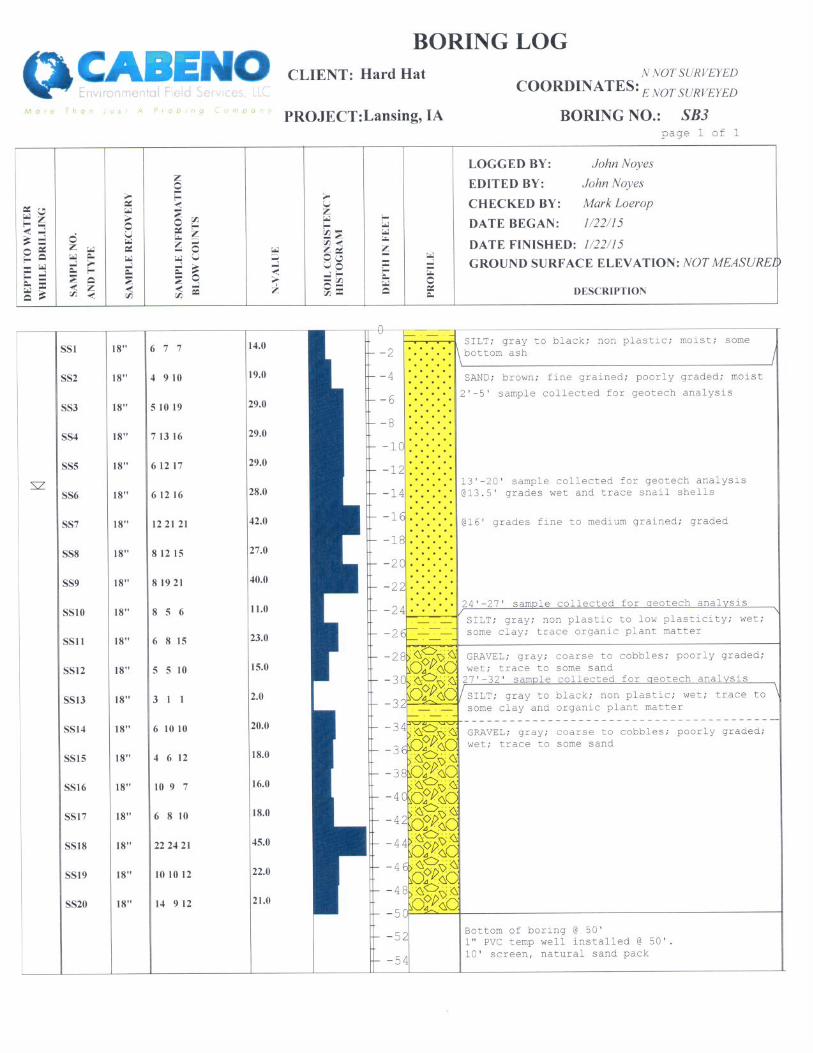
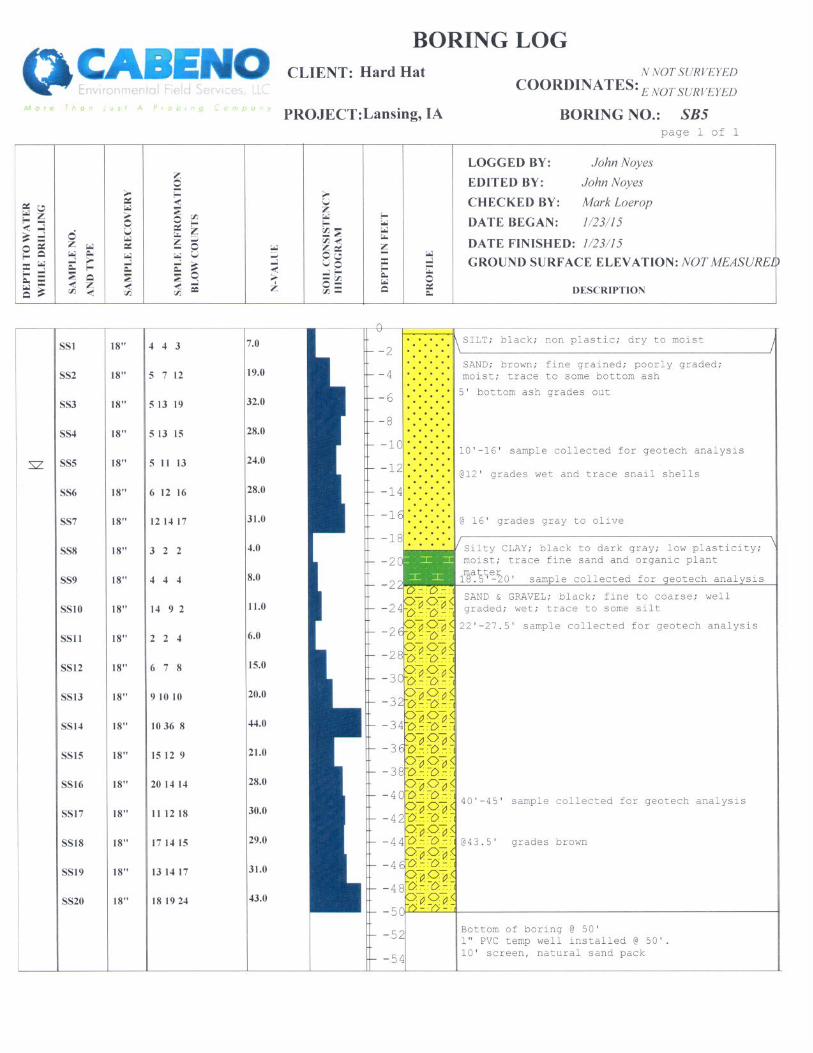
In early 2015, four soil borings were installed at the locations shown on Figure 2, to
determine the types of and density of soil present in the embankments and foundation of
the LAN Upper Ash Pond. The soil borings logs SB-1, SB-3, SB-5 and SB-7 including the
penetration resistance measured by the Standard Split Spoon (SPT) (ASTM D 1556) are
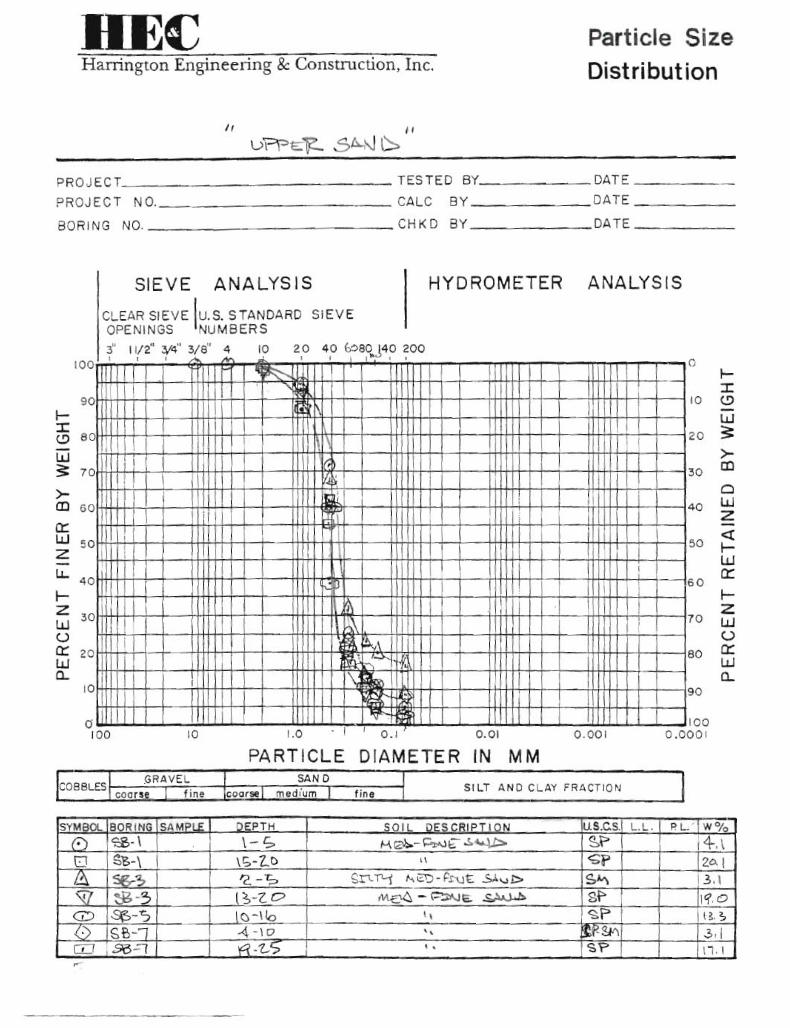
enclosed in Appendix A. The results of laboratory testing on selected soil samples for
grain size, water content and Atterberg limits are shown in Appendix B.
The test results indicate that the embankment is constructed of uniform fine to medium
sand (SP). The sand was compacted to medium dense to dense consistency as shown by
the SPT results. Below the embankment, the two northern borings SB-1 and SB-7, Figure
2, show that a very loose to loose silt is present under the embankment overlying a
medium dense gravel. In borings SB-3 and SB-5, Figure 2, the silt is thin and overlies the
same gravel. The silt deposit in the two northern borings is from backwater deposition
by the Mississippi River prior to the installation of the LAN Upper Ash Pond and the thin
silt layer to the south is natural deposition from flooding of the Unnamed Stream #1. The
Iowa Bedrock Survey Map available from the Iowa Geology and Water Survey, July 2013
indicates that bedrock is at elevation 564 (depth of 90 feet below top of embankment) in
the northern part of the LAN Upper Ash Pond and rises in elevation moving south up
the valley of the Unnamed Stream #1.
A cement-bentonite slurry wall was installed in the West embankment of the LAN Upper
Ash pond in the summer of 2015. The cement-bentonite wall prevents water from the
LAN Upper Ash Pond from flowing through the embankment sand and discharging as

Interstate Power and Light – Lansing Generating Station Safety Factor Assessment September 2, 2016 7
surface seepage at the toe of the embankment. During installation of the wall it was
observed that the sand below the normal water elevation in the embankment had higher
strength than sand above the water table likely due to cementation of the sand particles
by calcium hydroxide in the impoundment water. The observation was used along with
the SPT values in the boring logs to assign soil properties to the embankment and
foundation soils using NAVFACS DM-72. The internal friction angles selected based on
the SPT results are:
Soil Type Internal Friction Angle
Total Unit Weight (lb/ft3)
Embankment Sand above GW 32 110
Embankment Sand below GW 36 108
River Silt 26 100
Valley Gravel 35 120
The ground water elevation in the embankment is monitored by piezometers installed on
both sides of the cement-bentonite wall in 2015. The monitoring results show that the
water elevation in the embankment drops 17 feet across the cement-bentonite cut off wall
at the north end of the west embankment.
3.1.2 Design Water Surface in Impoundment: Maximum Normal Pool and Maximum
Pool Under Design Inflow Storm
The LAN Upper Ash Pond water elevation is controlled by stop logs in the overflow
structure, Weir Box #1, Figure 2. The normal pool is elevation 648.75 feet that occurs
when operating with stop logs installed to elevation 648 feet and with the normal process
water flow to the LAN Upper Ash Pond of 8.0 cubic feet per second.
During passage of the 1,000 year return period design storm, the impoundment elevation
rises to elevation 652.5 feet according to the Inflow Flood Control Plan (a separate
document developed to comply with40 CFR 257.82). The rise in pool elevation during
2 Naval Facilities Engineering Command Design Manual DM-7, Figure 3-7 “Density versus Angle of Internal
Friction for Cohesionless Soils”, March 1971

Interstate Power and Light – Lansing Generating Station Safety Factor Assessment September 2, 2016 8
the storm flow is 3.75 feet with a remaining freeboard of 1.5 feet on the minimum crest
elevation of 654.
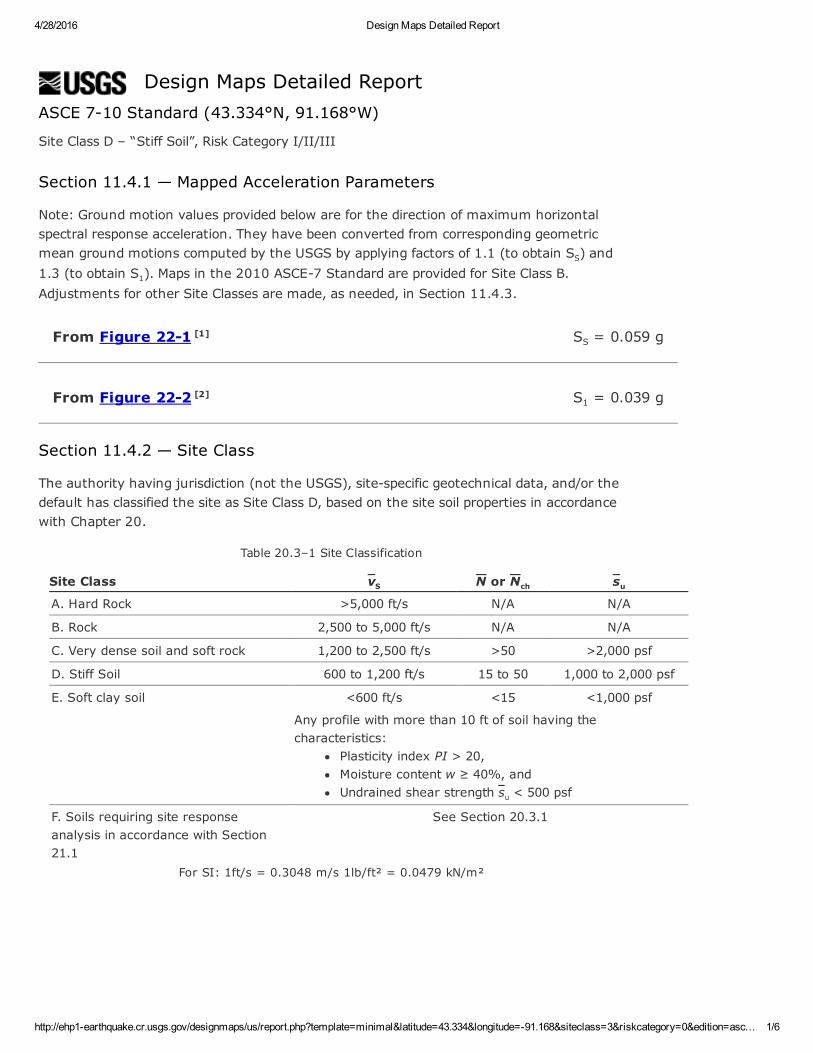
3.1.3 Selection of Seismic Design Parameters and Description of Method
The design earthquake ground acceleration is selected from the United States Geologic
Survey (USGS) detailed seismic design maps based on the latitude and longitude of the
station. The peak ground acceleration (PGA) value is selected for a 2% probability of
exceedance in 50 years (2500 year return period) as required by 40 CFR 257.53. Since the
site soils with the exception of the river silt layer are medium dense to dense sand and
gravel and extend to bedrock at 90 feet, the site class as defined in the 2009 International
Building Code 1613.5.5 is Site Class D. For Site Class D the ground surface PGA for slope
stability and liquefaction assessment is 0.044 g, Appendix C.
3.1.4 Liquefaction Assessment Method and Parameters
Certain soils may have zero effective stress (liquefaction) during an earthquake from
static shear of a saturated embankment slope. Soils that will liquefy include loose or very
loose uniform fine sand or silt, and low plasticity clay (plastic index of less than 12). The
liquefaction resistance of a soil is based on its strength and effective confining stress. The
strength of the saturated embankment sand, river silt and valley gravel are measured by
the SPT results shown on the borings in Appendix A.
The test results for SB-1 located on the west embankment, Figure 1, at the highest
embankment height and with the lowest river silt strength measured indicate the silt is
very loose (blowcounts weight of rod only).
The simplified assessment of liquefaction procedure as first proposed by Seed and most
recently updated and published by Idriss and Boulanger3 is used to assess the potential
for liquefaction of the river silt. The procedure uses the strengths determined by the SPT
test, adjusted to normalize for overburden pressure and for fines content, to determine
3 Idriss I. M. and R. W. Boulanger, “Soil Liquefaction During Earthquakes”, EERI MNO-12, 2008.

Interstate Power and Light – Lansing Generating Station Safety Factor Assessment September 2, 2016 9
the cyclic resistance ratio for the soil at earthquake magnitude 7.5 and at 1 atmosphere
pressure. The cyclic resistance ratio is then adjusted for the actual earthquake magnitude
of the design event which is 7.7 for a New Madrid Fault source earthquake4. The cyclic
stress ratio caused by the design surface PGA is then used to determine the actual cyclic
stress ratio at 65% of maximum strain at depth in the soil profile. The cyclic resistance
ratio is divided by the cyclic stress ratio to determine the factor of safety for liquefaction.
The results for the soil profile of SB-1 at the north end of the west embankment of the
LAN Upper Ash Pond is shown in Appendix C. The results indicate that the river silt
layer will not liquefy during the site design earthquake.
3.2 LAN Upper Ash Pond
The LAN Upper Ash Pond is incised on the east and south sides of the impoundment.
The north and west sides the impoundment is created by construction of medium to fine
sand embankments reported to be sand from maintenance dredging of the Mississippi
River. All of the embankments have the same outer slope of 3 horizontal to 1 vertical.
The southern end of the west embankment has lower embankment height and sits on
more competent foundation soil and is not the critical section of the embankment.
The northern embankment and the north half of the west embankment sit on a layer of
loose to very loose river silt. After closure of the former LAN Lower Ash Pond, the north
embankment height was reduced and has more confinement on the river silt layer than
the west embankment. In addition, the north embankment has a much wider crest to
accommodate Power Plant Road.
For all of the above reasons, the west embankment in the vicinity of boring SB-1 is the
critical embankment slope for the LAN Upper Ash Pond, Figure 2.
4 Elnashi et al, “Impact of Earthquakes on the Central USA”, FEMA Report 8-02, Mid-American Earthquake
Center, 2002
Interstate Power and Light – Lansing Generating Station Safety Factor Assessment September 2, 2016 10
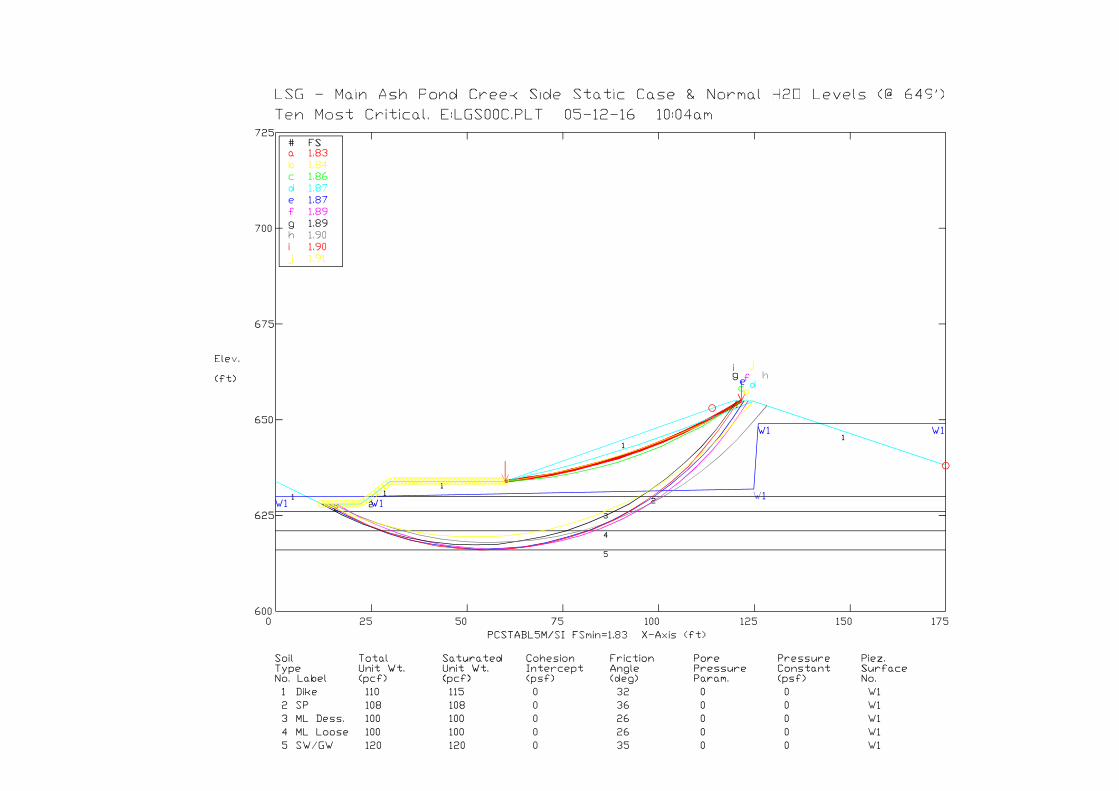
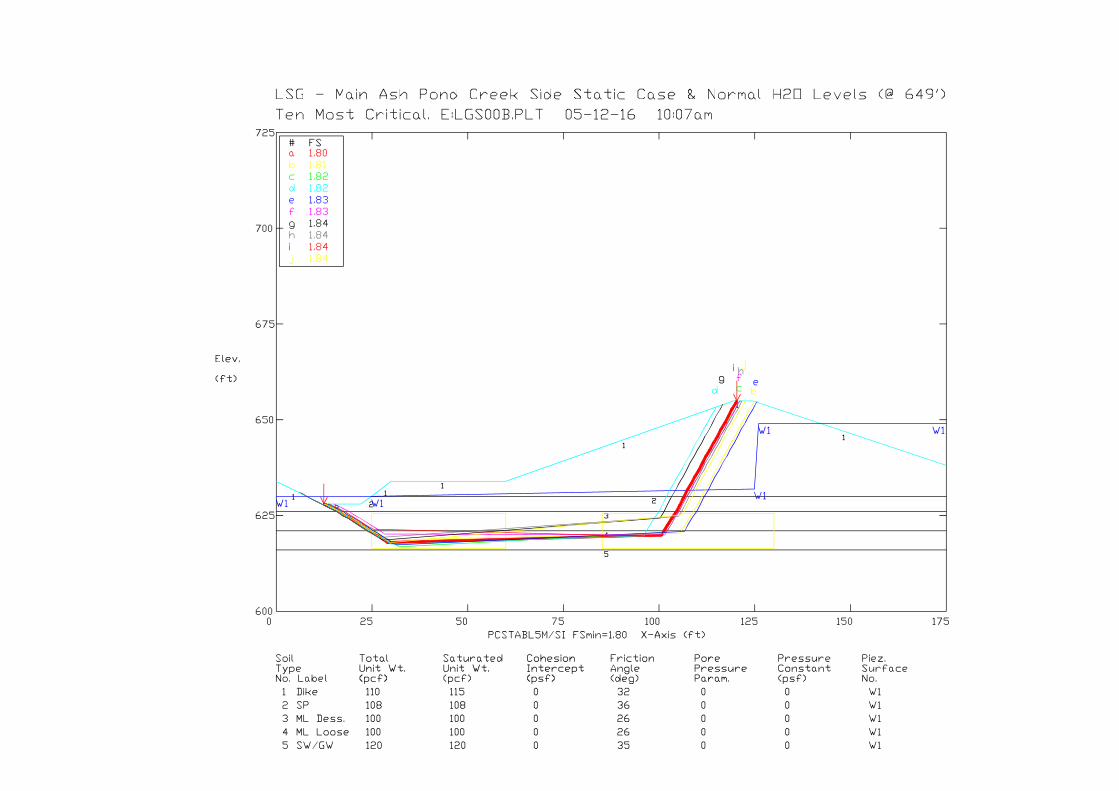
3.2.1 Static Safety Factor Assessment Under Maximum Storage Pool Loading -
§257.73(e)(1)(i)
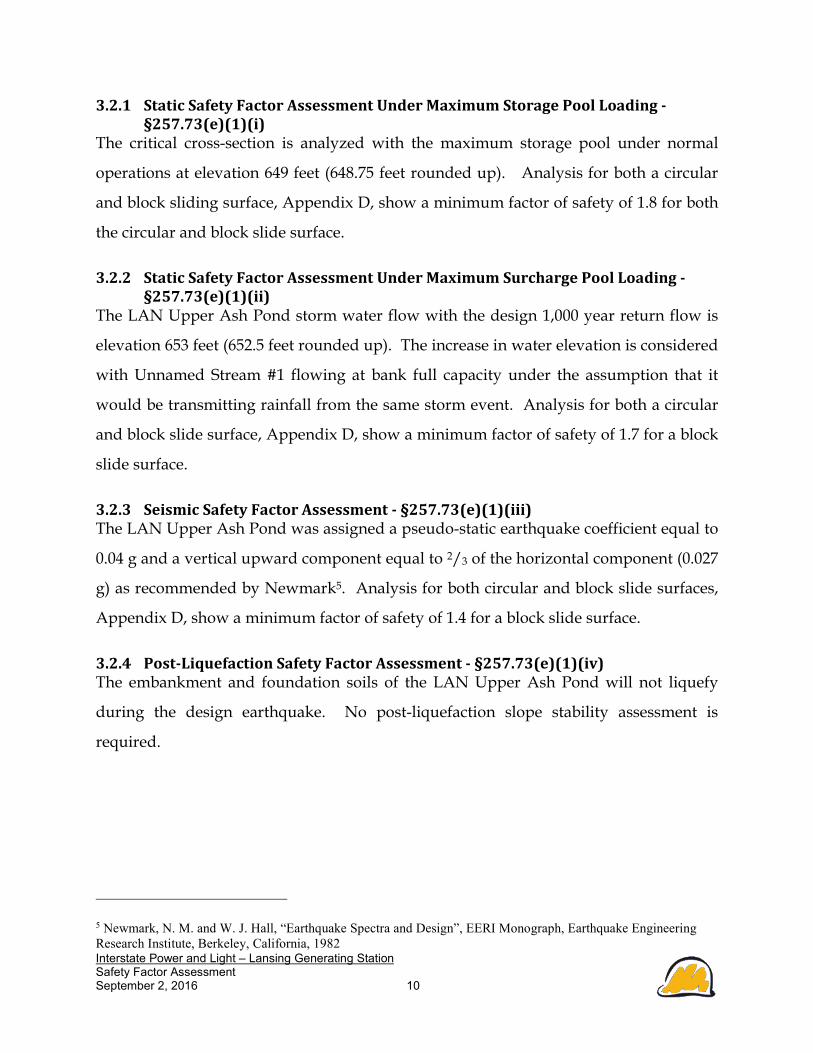
The critical cross-section is analyzed with the maximum storage pool under normal
operations at elevation 649 feet (648.75 feet rounded up). Analysis for both a circular
and block sliding surface, Appendix D, show a minimum factor of safety of 1.8 for both
the circular and block slide surface.
3.2.2 Static Safety Factor Assessment Under Maximum Surcharge Pool Loading -
§257.73(e)(1)(ii)
The LAN Upper Ash Pond storm water flow with the design 1,000 year return flow is
elevation 653 feet (652.5 feet rounded up). The increase in water elevation is considered
with Unnamed Stream #1 flowing at bank full capacity under the assumption that it
would be transmitting rainfall from the same storm event. Analysis for both a circular
and block slide surface, Appendix D, show a minimum factor of safety of 1.7 for a block
slide surface.
3.2.3 Seismic Safety Factor Assessment - §257.73(e)(1)(iii)
The LAN Upper Ash Pond was assigned a pseudo-static earthquake coefficient equal to
0.04 g and a vertical upward component equal to 2/3 of the horizontal component (0.027
g) as recommended by Newmark5. Analysis for both circular and block slide surfaces,
Appendix D, show a minimum factor of safety of 1.4 for a block slide surface.
3.2.4 Post-Liquefaction Safety Factor Assessment - §257.73(e)(1)(iv)
The embankment and foundation soils of the LAN Upper Ash Pond will not liquefy
during the design earthquake. No post-liquefaction slope stability assessment is
required.
5 Newmark, N. M. and W. J. Hall, “Earthquake Spectra and Design”, EERI Monograph, Earthquake Engineering
Research Institute, Berkeley, California, 1982
Interstate Power and Light – Lansing Generating Station Safety Factor Assessment September 2, 2016 11
4 Results Summary
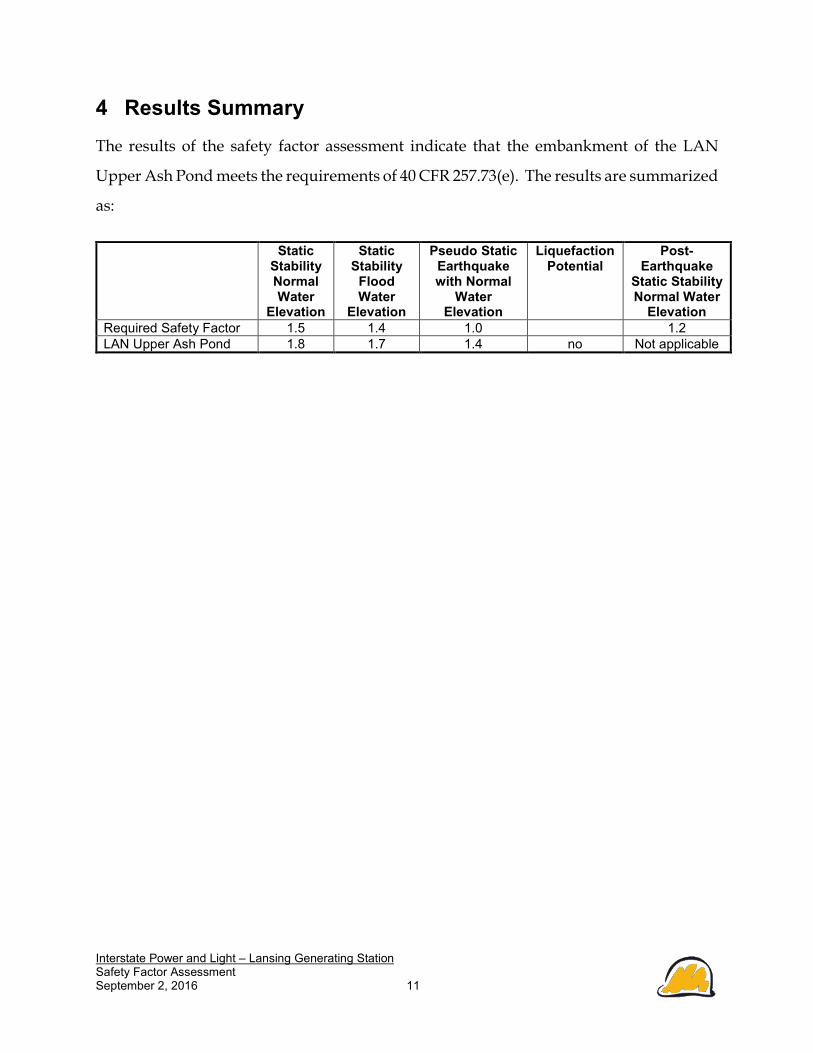
The results of the safety factor assessment indicate that the embankment of the LAN
Upper Ash Pond meets the requirements of 40 CFR 257.73(e). The results are summarized
as:
Static Stability Normal Water
Elevation
Static Stability
Flood Water
Elevation
Pseudo Static Earthquake with Normal
Water Elevation
Liquefaction Potential
Post-Earthquake
Static Stability Normal Water
Elevation
Required Safety Factor 1.5 1.4 1.0 1.2
LAN Upper Ash Pond 1.8 1.7 1.4 no Not applicable

Scanned by CamScanner

Interstate Power and Light – Lansing Generating Station Safety Factor Assessment September 2, 2016
FIGURES
Alliant Energy Interstate Power and Light Lansing Generating Station Lansing, Iowa Safety Factor Assessment

Approximate Property Boundary
Site Location Drawing
Lansing Generating Station Figure 1
Intersate Power and Light Company Date
6/7/2016
Historical Aerial Photo
Interstate Power and Light – Lansing Generating Station Safety Factor Assessment September 2, 2016
EXHIBIT A
40 CFR Part 112 Cross Reference Wisconsin Power & Light Company Riverside Energy Center Spill Prevention, Control, and Countermeasure (SPCC) Plan
APPENDIX A – Soil Borings
Alliant Energy Interstate Power and Light Lansing Generating Station Lansing, Iowa Safety Factor Assessment


Interstate Power and Light – Lansing Generating Station Safety Factor Assessment September 2, 2016
EXHIBIT A
40 CFR Part 112 Cross Reference Wisconsin Power & Light Company Riverside Energy Center Spill Prevention, Control, and Countermeasure (SPCC) Plan
APPENDIX B – Soil Laboratory Testing
Alliant Energy Interstate Power and Light Lansing Generating Station Lansing, Iowa Safety Factor Assessment


Interstate Power and Light – Lansing Generating Station Safety Factor Assessment September 2, 2016
EXHIBIT A
40 CFR Part 112 Cross Reference Wisconsin Power & Light Company Riverside Energy Center Spill Prevention, Control, and Countermeasure (SPCC) Plan
APPENDIX C – Earthquake and Liquefaction Analysis
Alliant Energy Interstate Power and Light Lansing Generating Station Lansing, Iowa Safety Factor Assessment
4/28/2016 Design Maps Detailed Report
http://ehp1earthquake.cr.usgs.gov/designmaps/us/report.php?template=minimal&latitude=43.334&longitude=91.168&siteclass=3&riskcategory=0&edition=asc… 1/6
From Figure 221 [1]
From Figure 222 [2]
Design Maps Detailed ReportASCE 710 Standard (43.334°N, 91.168°W)
Site Class D – “Stiff Soil”, Risk Category I/II/III
Section 11.4.1 — Mapped Acceleration Parameters
Note: Ground motion values provided below are for the direction of maximum horizontalspectral response acceleration. They have been converted from corresponding geometricmean ground motions computed by the USGS by applying factors of 1.1 (to obtain SS) and1.3 (to obtain S1). Maps in the 2010 ASCE7 Standard are provided for Site Class B.Adjustments for other Site Classes are made, as needed, in Section 11.4.3.
SS = 0.059 g
S1 = 0.039 g
Section 11.4.2 — Site Class
The authority having jurisdiction (not the USGS), sitespecific geotechnical data, and/or thedefault has classified the site as Site Class D, based on the site soil properties in accordancewith Chapter 20.
Table 20.3–1 Site Classification
Site Class vS N or Nch suA. Hard Rock >5,000 ft/s N/A N/A
B. Rock 2,500 to 5,000 ft/s N/A N/A
C. Very dense soil and soft rock 1,200 to 2,500 ft/s >50 >2,000 psf
D. Stiff Soil 600 to 1,200 ft/s 15 to 50 1,000 to 2,000 psf
E. Soft clay soil <600 ft/s <15 <1,000 psf
Any profile with more than 10 ft of soil having thecharacteristics:
Plasticity index PI > 20,Moisture content w ≥ 40%, andUndrained shear strength su < 500 psf
F. Soils requiring site responseanalysis in accordance with Section21.1
See Section 20.3.1
For SI: 1ft/s = 0.3048 m/s 1lb/ft² = 0.0479 kN/m²

4/28/2016 Design Maps Detailed Report
http://ehp1earthquake.cr.usgs.gov/designmaps/us/report.php?template=minimal&latitude=43.334&longitude=91.168&siteclass=3&riskcategory=0&edition=asc… 2/6
Section 11.4.3 — Site Coefficients and Risk–Targeted Maximum Considered Earthquake(MCER) Spectral Response Acceleration Parameters
Table 11.4–1: Site Coefficient Fa
Site Class Mapped MCE R Spectral Response Acceleration Parameter at Short Period
SS ≤ 0.25 SS = 0.50 SS = 0.75 SS = 1.00 SS ≥ 1.25
A 0.8 0.8 0.8 0.8 0.8
B 1.0 1.0 1.0 1.0 1.0
C 1.2 1.2 1.1 1.0 1.0
D 1.6 1.4 1.2 1.1 1.0
E 2.5 1.7 1.2 0.9 0.9
F See Section 11.4.7 of ASCE 7
Note: Use straight–line interpolation for intermediate values of SS
For Site Class = D and SS = 0.059 g, Fa = 1.600
Table 11.4–2: Site Coefficient Fv
Site Class Mapped MCE R Spectral Response Acceleration Parameter at 1–s Period
S1 ≤ 0.10 S1 = 0.20 S1 = 0.30 S1 = 0.40 S1 ≥ 0.50
A 0.8 0.8 0.8 0.8 0.8
B 1.0 1.0 1.0 1.0 1.0
C 1.7 1.6 1.5 1.4 1.3
D 2.4 2.0 1.8 1.6 1.5
E 3.5 3.2 2.8 2.4 2.4
F See Section 11.4.7 of ASCE 7
Note: Use straight–line interpolation for intermediate values of S1
For Site Class = D and S1 = 0.039 g, Fv = 2.400

4/28/2016 Design Maps Detailed Report
http://ehp1earthquake.cr.usgs.gov/designmaps/us/report.php?template=minimal&latitude=43.334&longitude=91.168&siteclass=3&riskcategory=0&edition=asc… 3/6
Equation (11.4–1):
Equation (11.4–2):
Equation (11.4–3):
Equation (11.4–4):
From Figure 2212 [3]
SMS = FaSS = 1.600 x 0.059 = 0.094 g
SM1 = FvS1 = 2.400 x 0.039 = 0.095 g
Section 11.4.4 — Design Spectral Acceleration Parameters
SDS = ⅔ SMS = ⅔ x 0.094 = 0.062 g
SD1 = ⅔ SM1 = ⅔ x 0.095 = 0.063 g
Section 11.4.5 — Design Response Spectrum
TL = 12 seconds
Figure 11.4–1: Design Response Spectrum
4/28/2016 Design Maps Detailed Report
http://ehp1earthquake.cr.usgs.gov/designmaps/us/report.php?template=minimal&latitude=43.334&longitude=91.168&siteclass=3&riskcategory=0&edition=asc… 4/6
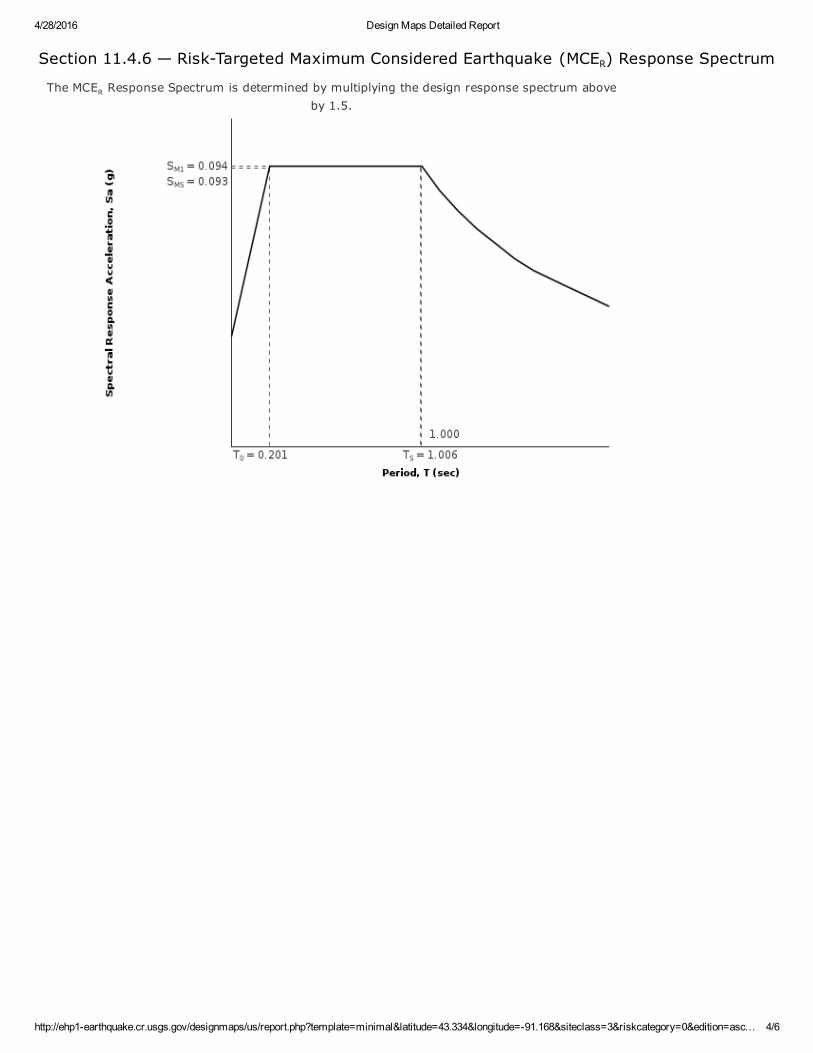
Section 11.4.6 — RiskTargeted Maximum Considered Earthquake (MCER) Response Spectrum
The MCER Response Spectrum is determined by multiplying the design response spectrum aboveby 1.5.
4/28/2016 Design Maps Detailed Report
http://ehp1earthquake.cr.usgs.gov/designmaps/us/report.php?template=minimal&latitude=43.334&longitude=91.168&siteclass=3&riskcategory=0&edition=asc… 5/6
From Figure 227 [4]
Equation (11.8–1):
From Figure 2217 [5]
From Figure 2218 [6]
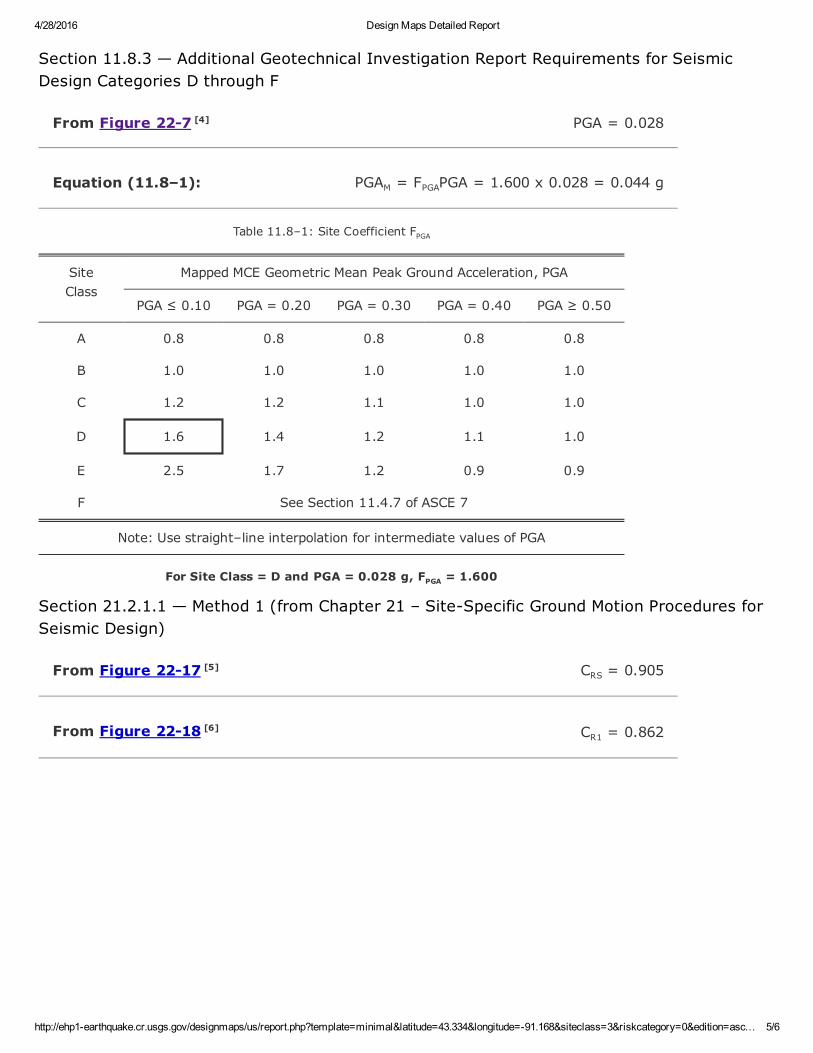
Section 11.8.3 — Additional Geotechnical Investigation Report Requirements for SeismicDesign Categories D through F
PGA = 0.028
PGAM = FPGAPGA = 1.600 x 0.028 = 0.044 g
Table 11.8–1: Site Coefficient FPGA
SiteClass
Mapped MCE Geometric Mean Peak Ground Acceleration, PGA
PGA ≤ 0.10 PGA = 0.20 PGA = 0.30 PGA = 0.40 PGA ≥ 0.50
A 0.8 0.8 0.8 0.8 0.8
B 1.0 1.0 1.0 1.0 1.0
C 1.2 1.2 1.1 1.0 1.0
D 1.6 1.4 1.2 1.1 1.0
E 2.5 1.7 1.2 0.9 0.9
F See Section 11.4.7 of ASCE 7
Note: Use straight–line interpolation for intermediate values of PGA
For Site Class = D and PGA = 0.028 g, FPGA = 1.600
Section 21.2.1.1 — Method 1 (from Chapter 21 – SiteSpecific Ground Motion Procedures forSeismic Design)
CRS = 0.905
CR1 = 0.862

4/28/2016 Design Maps Detailed Report
http://ehp1earthquake.cr.usgs.gov/designmaps/us/report.php?template=minimal&latitude=43.334&longitude=91.168&siteclass=3&riskcategory=0&edition=asc… 6/6
Section 11.6 — Seismic Design Category
Table 11.61 Seismic Design Category Based on Short Period Response Acceleration Parameter
VALUE OF SDSRISK CATEGORY
I or II III IV
SDS < 0.167g A A A
0.167g ≤ SDS < 0.33g B B C
0.33g ≤ SDS < 0.50g C C D
0.50g ≤ SDS D D D
For Risk Category = I and SDS = 0.062 g, Seismic Design Category = A
Table 11.62 Seismic Design Category Based on 1S Period Response Acceleration Parameter
VALUE OF SD1RISK CATEGORY
I or II III IV
SD1 < 0.067g A A A
0.067g ≤ SD1 < 0.133g B B C
0.133g ≤ SD1 < 0.20g C C D
0.20g ≤ SD1 D D D
For Risk Category = I and SD1 = 0.063 g, Seismic Design Category = A
Note: When S1 is greater than or equal to 0.75g, the Seismic Design Category is E forbuildings in Risk Categories I, II, and III, and F for those in Risk Category IV, irrespective ofthe above.
Seismic Design Category ≡ “the more severe design category in accordance withTable 11.61 or 11.62” = A
Note: See Section 11.6 for alternative approaches to calculating Seismic Design Category.
References
1. Figure 221: http://earthquake.usgs.gov/hazards/designmaps/downloads/pdfs/2010_ASCE7_Figure_221.pdf2. Figure 222: http://earthquake.usgs.gov/hazards/designmaps/downloads/pdfs/2010_ASCE7_Figure_222.pdf3. Figure 2212: http://earthquake.usgs.gov/hazards/designmaps/downloads/pdfs/2010_ASCE7_Figure_2212.pdf
4. Figure 227: http://earthquake.usgs.gov/hazards/designmaps/downloads/pdfs/2010_ASCE7_Figure_227.pdf5. Figure 2217: http://earthquake.usgs.gov/hazards/designmaps/downloads/pdfs/2010_ASCE7_Figure_2217.pdf
6. Figure 2218: http://earthquake.usgs.gov/hazards/designmaps/downloads/pdfs/2010_ASCE7_Figure_2218.pdf
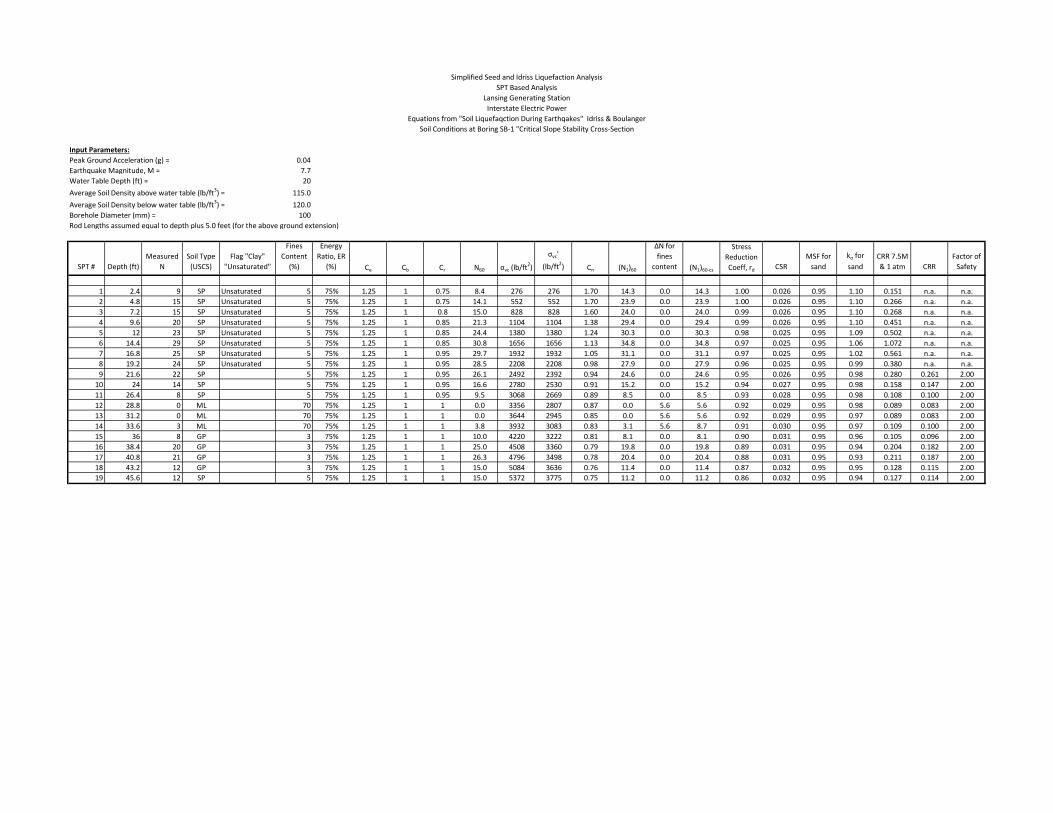
Input Parameters:
Peak Ground Acceleration (g) = 0.04
Earthquake Magnitude, M = 7.7
Water Table Depth (ft) = 20
Average Soil Density above water table (lb/ft3) = 115.0
Average Soil Density below water table (lb/ft3) = 120.0
Borehole Diameter (mm) = 100
Rod Lengths assumed equal to depth plus 5.0 feet (for the above ground extension)
SPT # Depth (ft)
Measured
N
Soil Type
(USCS)
Flag "Clay"
"Unsaturated"
Fines
Content
(%)
Energy
Ratio, ER
(%) Ce Cb Cr N60 σvc (lb/ft2)
σvc'
(lb/ft2) Cn (N1)60
ΔN for
fines
content (N1)60-cs
Stress
Reduction
Coeff, rd CSR
MSF for
sand
kσ for
sand
CRR 7.5M
& 1 atm CRR
Factor of
Safety
1 2.4 9 SP Unsaturated 5 75% 1.25 1 0.75 8.4 276 276 1.70 14.3 0.0 14.3 1.00 0.026 0.95 1.10 0.151 n.a. n.a.
2 4.8 15 SP Unsaturated 5 75% 1.25 1 0.75 14.1 552 552 1.70 23.9 0.0 23.9 1.00 0.026 0.95 1.10 0.266 n.a. n.a.
3 7.2 15 SP Unsaturated 5 75% 1.25 1 0.8 15.0 828 828 1.60 24.0 0.0 24.0 0.99 0.026 0.95 1.10 0.268 n.a. n.a.
4 9.6 20 SP Unsaturated 5 75% 1.25 1 0.85 21.3 1104 1104 1.38 29.4 0.0 29.4 0.99 0.026 0.95 1.10 0.451 n.a. n.a.
5 12 23 SP Unsaturated 5 75% 1.25 1 0.85 24.4 1380 1380 1.24 30.3 0.0 30.3 0.98 0.025 0.95 1.09 0.502 n.a. n.a.
6 14.4 29 SP Unsaturated 5 75% 1.25 1 0.85 30.8 1656 1656 1.13 34.8 0.0 34.8 0.97 0.025 0.95 1.06 1.072 n.a. n.a.
7 16.8 25 SP Unsaturated 5 75% 1.25 1 0.95 29.7 1932 1932 1.05 31.1 0.0 31.1 0.97 0.025 0.95 1.02 0.561 n.a. n.a.
8 19.2 24 SP Unsaturated 5 75% 1.25 1 0.95 28.5 2208 2208 0.98 27.9 0.0 27.9 0.96 0.025 0.95 0.99 0.380 n.a. n.a.
9 21.6 22 SP 5 75% 1.25 1 0.95 26.1 2492 2392 0.94 24.6 0.0 24.6 0.95 0.026 0.95 0.98 0.280 0.261 2.00
10 24 14 SP 5 75% 1.25 1 0.95 16.6 2780 2530 0.91 15.2 0.0 15.2 0.94 0.027 0.95 0.98 0.158 0.147 2.00
11 26.4 8 SP 5 75% 1.25 1 0.95 9.5 3068 2669 0.89 8.5 0.0 8.5 0.93 0.028 0.95 0.98 0.108 0.100 2.00
12 28.8 0 ML 70 75% 1.25 1 1 0.0 3356 2807 0.87 0.0 5.6 5.6 0.92 0.029 0.95 0.98 0.089 0.083 2.00
13 31.2 0 ML 70 75% 1.25 1 1 0.0 3644 2945 0.85 0.0 5.6 5.6 0.92 0.029 0.95 0.97 0.089 0.083 2.00
14 33.6 3 ML 70 75% 1.25 1 1 3.8 3932 3083 0.83 3.1 5.6 8.7 0.91 0.030 0.95 0.97 0.109 0.100 2.00
15 36 8 GP 3 75% 1.25 1 1 10.0 4220 3222 0.81 8.1 0.0 8.1 0.90 0.031 0.95 0.96 0.105 0.096 2.00
16 38.4 20 GP 3 75% 1.25 1 1 25.0 4508 3360 0.79 19.8 0.0 19.8 0.89 0.031 0.95 0.94 0.204 0.182 2.00
17 40.8 21 GP 3 75% 1.25 1 1 26.3 4796 3498 0.78 20.4 0.0 20.4 0.88 0.031 0.95 0.93 0.211 0.187 2.00
18 43.2 12 GP 3 75% 1.25 1 1 15.0 5084 3636 0.76 11.4 0.0 11.4 0.87 0.032 0.95 0.95 0.128 0.115 2.00
19 45.6 12 SP 5 75% 1.25 1 1 15.0 5372 3775 0.75 11.2 0.0 11.2 0.86 0.032 0.95 0.94 0.127 0.114 2.00
Soil Conditions at Boring SB-1 "Critical Slope Stability Cross-Section
Simplified Seed and Idriss Liquefaction Analysis
SPT Based Analysis
Lansing Generating Station
Interstate Electric Power
Equations from "Soil Liquefaqction During Earthqakes" Idriss & Boulanger

Interstate Power and Light – Lansing Generating Station Safety Factor Assessment September 2, 2016
EXHIBIT A
40 CFR Part 112 Cross Reference Wisconsin Power & Light Company Riverside Energy Center Spill Prevention, Control, and Countermeasure (SPCC) Plan
APPENDIX D – Slope Stability Analysis
Alliant Energy Interstate Power and Light Lansing Generating Station Lansing, Iowa Safety Factor Assessment


Related Documents