doi:10.1182/blood-2002-03-0673 Prepublished online July 12, 2002; Hoogsteden and Bart N Lambrecht Leonie S van Rijt, Jan-Bas Prins, Pieter J Leenen, Kris Thielemans, Victor C de Vries, Henk C model of asthma an increase in CD31hiLy-6Cnegbone marrow precursors in a mouse Allergen-induced accumulation of airway dendritic cells is supported by (5022 articles) Immunobiology Articles on similar topics can be found in the following Blood collections http://bloodjournal.hematologylibrary.org/site/misc/rights.xhtml#repub_requests Information about reproducing this article in parts or in its entirety may be found online at: http://bloodjournal.hematologylibrary.org/site/misc/rights.xhtml#reprints Information about ordering reprints may be found online at: http://bloodjournal.hematologylibrary.org/site/subscriptions/index.xhtml Information about subscriptions and ASH membership may be found online at: articles must include the digital object identifier (DOIs) and date of initial publication. priority; they are indexed by PubMed from initial publication. Citations to Advance online prior to final publication). Advance online articles are citable and establish publication yet appeared in the paper journal (edited, typeset versions may be posted when available Advance online articles have been peer reviewed and accepted for publication but have not Copyright 2011 by The American Society of Hematology; all rights reserved. Washington DC 20036. by the American Society of Hematology, 2021 L St, NW, Suite 900, Blood (print ISSN 0006-4971, online ISSN 1528-0020), is published weekly For personal use only. by guest on June 12, 2013. bloodjournal.hematologylibrary.org From

Welcome message from author
This document is posted to help you gain knowledge. Please leave a comment to let me know what you think about it! Share it to your friends and learn new things together.
Transcript

doi:10.1182/blood-2002-03-0673Prepublished online July 12, 2002;
Hoogsteden and Bart N LambrechtLeonie S van Rijt, Jan-Bas Prins, Pieter J Leenen, Kris Thielemans, Victor C de Vries, Henk C model of asthmaan increase in CD31hiLy-6Cnegbone marrow precursors in a mouse Allergen-induced accumulation of airway dendritic cells is supported by
(5022 articles)Immunobiology �Articles on similar topics can be found in the following Blood collections
http://bloodjournal.hematologylibrary.org/site/misc/rights.xhtml#repub_requestsInformation about reproducing this article in parts or in its entirety may be found online at:
http://bloodjournal.hematologylibrary.org/site/misc/rights.xhtml#reprintsInformation about ordering reprints may be found online at:
http://bloodjournal.hematologylibrary.org/site/subscriptions/index.xhtmlInformation about subscriptions and ASH membership may be found online at:
articles must include the digital object identifier (DOIs) and date of initial publication. priority; they are indexed by PubMed from initial publication. Citations to Advance online prior to final publication). Advance online articles are citable and establish publicationyet appeared in the paper journal (edited, typeset versions may be posted when available Advance online articles have been peer reviewed and accepted for publication but have not
Copyright 2011 by The American Society of Hematology; all rights reserved.Washington DC 20036.by the American Society of Hematology, 2021 L St, NW, Suite 900, Blood (print ISSN 0006-4971, online ISSN 1528-0020), is published weekly
For personal use only. by guest on June 12, 2013. bloodjournal.hematologylibrary.orgFrom
1
Allergen-induced accumulation of airway dendritic cells is supported by an
increase in CD31hi Ly-6Cneg bone marrow precursors in a mouse model of
asthma1
Leonie S. van Rijt1, Jan-Bas Prins1, Pieter J.M. Leenen2, Kris Thielemans3, Victor C. de Vries1, Henk
C. Hoogsteden1 and Bart N. Lambrecht1
1Department of Pulmonary and Critical Care Medicine and 2Department of Immunology, Erasmus
University Medical Center, 3015 GE Rotterdam, The Netherlands and 3Department of Physiology,
Free University Brussels, B1090 Brussels, Belgium
Running title: Dendritic cells in a mouse model of asthma
Address correspondence to: Leonie van RijtErasmus University Rotterdam (Room Ee2263)Department of Pulmonary MedicineDr Molewaterplein 503015 GE RotterdamThe NetherlandsTel +31 10 4087701Fax +31 10 [email protected]
Total Text Word count: 5448
Abstract Word count: 240
Scientific Heading: Immunobiology
1 These studies were supported by a grant of the Dutch Asthma Foundation (NAF3.2.99.37).
Copyright 2002 American Society of Hematology
Blood First Edition Paper, prepublished online July 12, 2002; DOI 10.1182/blood-2002-03-0673 For personal use only. by guest on June 12, 2013. bloodjournal.hematologylibrary.orgFrom

2
Abstract
Airway dendritic cells (DCs) are held responsible for inducing sensitization to inhaled Ag leading to
eosinophilic airway inflammation, typical of asthma. Less information is however available about the
role of these cells in ongoing inflammation. In a mouse model of asthma, sensitization to OVA was
induced by intratracheal injection of myeloid OVA-pulsed DCs. Upon OVA aerosol challenge and
induction of eosinophilic airway inflammation in sensitized mice, there was a time dependent and
almost 100 fold increase in the number of MHCII+ CD11b+ CD11c+ endogenous airway DCs as well
as CD11b+ blood DCs. The mechanism of this increase was studied. Adoptive transfer experiments
demonstrated that accumulation of airway DCs was not due to reduced migration to the mediastinal
lymph nodes. Rather, the massive increase in airway and lymph node DCs was supported by an almost
3 fold expansion of myeloid CD31hi Ly-6Cneg hematopoietic precursor cells in the BM. There was no
change in any of the other 5 populations revealed by CD31/Ly-6C staining. When these CD31hi Ly-
6Cneg BM precursors were sorted and grown in GM-CSF they differentiated into MHCII+ CD11c+ DC.
The same CD31hi Ly-6Cneg precursors also expressed the eotaxin receptor CCR3 and differentiated into
eosinophils when grown in IL-5. Serum levels of eotaxin were doubled in mice with inflammation.
These findings in an animal model of asthma suggest that the bone marrow increases its output of
myeloid precursors to meet the enhanced demand for DCs and eosinophils in inflamed airways.
For personal use only. by guest on June 12, 2013. bloodjournal.hematologylibrary.orgFrom
3
Introduction
The role of the dendritic cell (DC) as a professional APC in the primary immune response is now well
established (1). Airway DCs form a network in the epithelium, capture inhaled antigen (Ag) and
migrate to the mediastinal lymph nodes (MLN) where Ag is presented to recirculating naive T cells (2-
5). Not surprisingly, these cells have been implicated to cause sensitization to inhaled allergens,
typical of Th2-mediated allergic asthma. In a mouse model of asthma, intratracheal (i.t.) immunization
with Ovalbumin (OVA)-pulsed DCs generates Th2 effector cells that control eosinophilic airway
inflammation, goblet cell hyperplasia and bronchial hyperreactivity upon repeated challenge with
OVA aerosol (6, 7). These observations indicate that airway DCs are essential in the early steps of
sensitization. However, less information is available on the role of DCs in stimulating memory and/or
effector Th2 cells upon repeated encounter with allergen (8). In patients with stable allergic asthma,
the number of airway DCs is elevated compared with healthy controls and local allergen challenge
leads to rapid accumulation of CD1a+ HLA-DR+ DCs in the airway lamina propria, suggesting that
DCs also present allergens to T cells in the secondary immune response leading to airway
inflammation (9).
The mechanisms by which DC numbers increase in asthmatic airways include several - not mutually
exclusive - possibilities. Firstly, the increase could be caused by enhanced recruitment of DCs from
the bloodstream into the site of airway inflammation. To support an enhanced demand for DCs in the
inflamed airways, the bone marrow (BM) might enhance its output of DCs or DC progenitors. Such a
mechanism would be similar to the enhanced recruitment of eosinophils into sites of allergic
inflammation, supported by a release of eosinophilic progenitors from the BM (10-14). Secondly,
enhanced differentiation of freshly recruited monocytes into DCs could also lead to increased numbers
of DCs being found at sites of airway inflammation (15). In such a scenario, one would suspect to
find enhanced production of DC differentiation and/or growth factors within the lung. Finally, as there
is continuous and high throughput migration of airway DCs from the epithelium to the draining
MLNs, a small decrease of DC efflux could lead to rapid and profound accumulation of DCs within
the epithelium (5, 16). To study which of these mechanisms might predominate, we have used a DC-
driven mouse model of asthma (6).
For personal use only. by guest on June 12, 2013. bloodjournal.hematologylibrary.orgFrom

4
Methods
Animals
All experiments were performed with 8-10 weeks old female Balb/c (H-2d) mice (Harlan, Zeist, the
Netherlands). Mice were housed under specific pathogen-free conditions at the animal care facility at
the Erasmus University Rotterdam. All of the experimental procedures used in this study were
approved by the Erasmus University committee of Animal Experiments.
Murine model of asthma
To induce sensitization to inhaled OVA, BM-derived DCs were pulsed with OVA in vitro and
subsequently injected into the airways of naive mice (6). In short, BM cells were cultured for ten days
in tissue culture medium (TCM; 5% FCS (Biocell laboratories Inc., Rancho Dominguez, USA), RPMI
1640, gentamycine, β-mercaptoethanol (all from Gibco, BRL, Paisly, Scotland)) supplemented with 20
ng/ml rm granulocyte-macrophage colony stimulating factor (GM-CSF) (17). After 9 days of culture,
cells were pulsed overnight with 100 µg/ml of OVA (OVA-DC) (OVA, grade V, Sigma Chemical Co.,
MO, USA). On d10 of culture, cells were collected, washed and 1x10⁶ DCs were injected i.t. in naive
mice. Control mice received identical numbers of unpulsed DCs (PBS-DC). Ten days after
immunization, mice were challenged with OVA aerosol (grade III, 1% w/vol in Phosphate Buffered
Saline (PBS), Sigma) or with PBS aerosol during a 30 min challenge per day for 1, 3 or 7 consecutive
days. In separate experiments, an additional control group consisted of naive unmanipulated mice.
Detection of airway dendritic cells in whole mounts of the trachea
Twenty four hour after the last OVA challenge, animals were anesthetized and tracheal whole mounts
were prepared as described earlier with a modification that the secondary antibody, used to detect rat
anti- mouse MHCII, was goat anti-rat F(ab’)2 fragments conjugated to horseradish peroxidase (Serotec,
Oxford, U.K.)(18). The entire trachea was mounted in Entellan (Merck, Darmstadt, Germany) and
viewed under a transmission light microscope equipped with Nomarski optics (Leica, Cambridge,
U.K.) ).
Collection of cells and tissues
Bronchoalveolaire Lavage Fluid (BALF): Twenty-four hour after the last aerosol, groups of mice
were sacrificed by avertin overdose followed by exsanguination. BAL was performed with 3x 1 ml of
For personal use only. by guest on June 12, 2013. bloodjournal.hematologylibrary.orgFrom
5
Ca2+- and Mg2+-free PBS supplemented with 0.1 mM EDTA. After red blood cells (RBCs) were lysed
using ammoniumchloride lysis buffer, cytospin slides were prepared and remaining cells were used for
flow cytometric analysis. Supernatants of BALF and serum were stored for ELISA quantification of
GM-CSF, IL-6 (OptEIA, PharMingen, Becton Dickinson, San Diego, CA; threshold 8 pg/ml), eotaxin,
and fms-like tyrosine kinase 3 Ligand (Flt-3L)(R&D systems, Abingdon, UK; threshold 5 pg/ml).
Lymph nodes : LN cell suspensions were prepared by a 1 h incubation at 37 °C with 0.02 mg/ml of
DNAse I (Sigma Chemical Co) and 100 U/ml of Collagenase IV (Life Technologies). RBCs were
lysed and cells were passed through a 40 µm cell sieve (Becton Dickinson).
Blood : Blood was collected in heparinized tubes from the iliac artery and lysed with 20 ml RBC lysis
solution for 4 minutes at 4ºC.
Bone marrow : BM cells were prepared by flushing femurs and tibiae with 5 ml of sterile PBS,
followed by RBC lysis and passage through a 100 µm cell sieve.
Staining for major basic protein-positive eosinophils
Cytospin preparations of BALF and cultured BM were acetone fixed and blocked with 1% Bovine
Serum Albumin/PBS. Major basic protein (MBP) was detected using a rabbit anti-mouse MBP
antibody (Ab) (J.J. Lee, Mayo Clinic, Scottsdale, Arizona), followed by alkaline phosphatase
conjugated goat anti rabbit Abs (Sigma) and development of signal with New Fuchsin in Tris-HCl.
Slides were counterstained with Mayer's haematoxilin (Merck). One investigator counted all cells.
Flow cytometric analysis on BALF, LN and blood cells
Cells were washed in PBS containing 5% FCS and 5 mM sodium azide (FACS wash), and 1x10⁶ cells
were stained for 30 min on ice. To reduce non-specific binding, cells were incubated with 2.4G2
blocking reagent for 15 min. Monoclonals used were: MHCII-FITC (2G9), allophycocyanin (APC)-
labeled CD11c (HL3), Phycoerytrin (PE)-labeled Abs against CD3 (145-2C11), B220 (RA3-6B2) and
CCR3 (R&D systems, Abingdon, UK), biotin-labeled CD11b (M1/70), followed by streptavidin(SA)-
PE-Cy5 (Quantum Red, Sigma). Propidium Iodide (Sigma) was added for exclusion of dead cells
before analysis on a FACScalibur flow cytometer using CellQuest (Becton and Dickinson
Immunocytometry Systems, San Jose, CA) and FlowJo software (Treestar, Costa Mesa, CA).
For personal use only. by guest on June 12, 2013. bloodjournal.hematologylibrary.orgFrom

6
Flow cytometric analysis and sorting of BM cells
BM cells were stained with anti-CD31 (anti-platelet endothelial cell adhesion molecule PECAM-1;
ER-MP12-bio), and anti-Ly-6C (ER-MP20-FITC, both produced in-house) followed by SA-PE or SA-
PE-Cy5, allowing the discrimination of 6 distinct populations of cells (19-22). For phenotype
description the following mAbs were used: CD11b-APC, CD127-PE (IL-7Rα; SB/14), CD131-PE
(JORO50), CCR3-PE, CCR5-PE, CD3-PECy5 and CD4-APC (GK1.5), CD11c-APC and B220-
PECy5, or Gr1-PE (RB6-8C5). Antibodies were from PharMingen or R&D systems.
In separate sorting experiments, 80*106 cells were stained with CD31-bio followed by SA-PE and Ly-
6C-FITC and were sorted into CD31hiLy-6Cneg and into CD31negLy-6Cmed populations under sterile
conditions on a FACS Vantage flow cytometer (Becton Dickinson).
Culture of CD31hiLy-6Cneg and CD31negLy-6Cmed populations
After sorting, cells were washed twice in TCM and cultured for 7 days at 0.25 *106/well in 24 well
plates with 40 ng GM-CSF/ml to induce DC differentiation. In separate experiments, cells were grown
at 8x10⁵ cells/well in round bottom 96 well plates in TCM supplemented with 30% FCS and 24 ng/ml
of murine rIL-5 (PharMingen) to induce eosinophil differentiation. As a control, unsorted BM was
stained and cultured under identical conditions. After 7 days, cells were analyzed for expression of
MHCII-FITC, CD11c-bi (N418) in combination with CD80-PE (16-10A1), CD86-PE (GL-1) or
CD40-PE (3/23), followed by SA-PECy5. For eosinophil differentiation, cytospin preparations were
stained with an anti-MBP Ab as described above.
Detection of labeled DCs after adoptive transfer
BM DCs were labeled using carboxyfluorescein diacetate succinimidyl ester (CFSE, Molecular
Probes, Oregon, MI), as previously described (6). Two-5 x10⁶ CFSE+ DCs were transferred i.t. into
mice with established eosinophilic airway inflammation (OVA-DC/3xOVA) or into control mice
(PBS-DC/3xPBS). Forty-eight hour after the i.t. cell transfer, mice were sacrificed. The number of
CD11c+, CFSE+ DCs was determined on BALF, MLN and inguinal LN samples.
Statistical analysis
All experiments were performed using 3-10 mice per group, and per time point in kinetic experiments.
Comparison of means between different groups was performed with a Kruskal-Wallis test for equality
For personal use only. by guest on June 12, 2013. bloodjournal.hematologylibrary.orgFrom

7
between the different groups and in the case of a significant difference the Mann-Whitney U test for
unpaired data was used for comparing two groups (SPSS 10.0 for Windows) separately. Differences
were considered significant if p<0.05.
For personal use only. by guest on June 12, 2013. bloodjournal.hematologylibrary.orgFrom
8
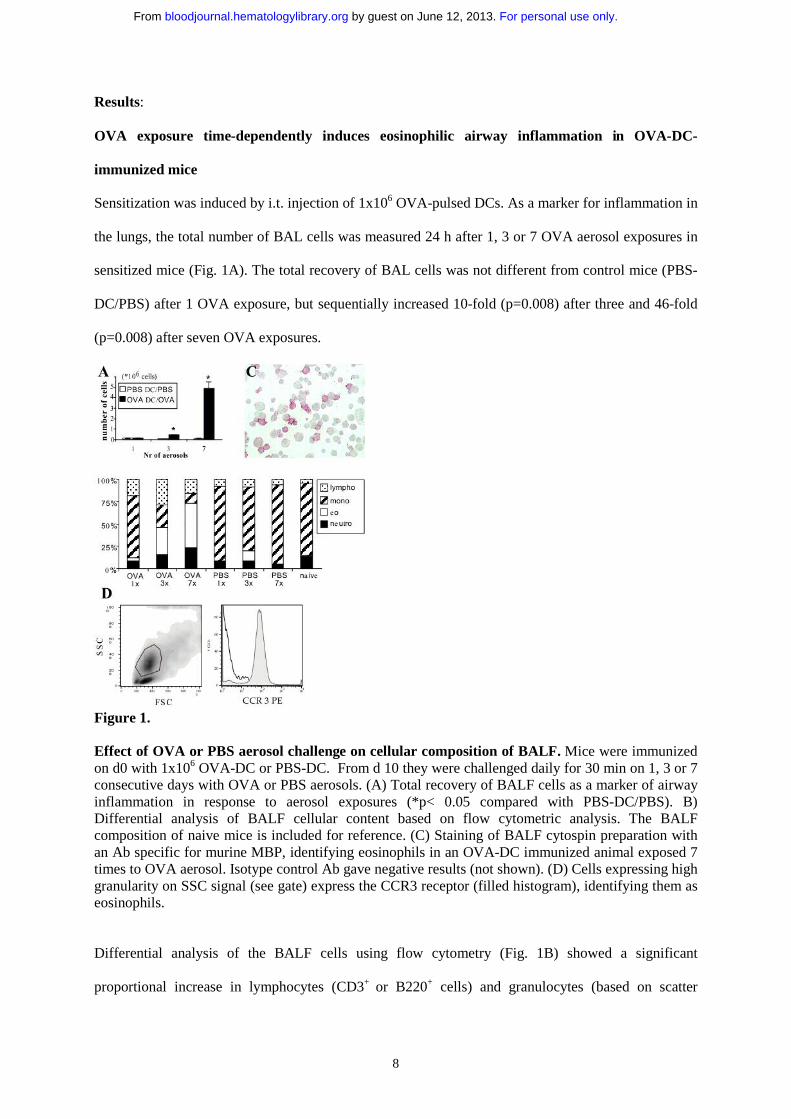
Results:
OVA exposure time-dependently induces eosinophilic airway inflammation in OVA-DC-
immunized mice
Sensitization was induced by i.t. injection of 1x10⁶ OVA-pulsed DCs. As a marker for inflammation in
the lungs, the total number of BAL cells was measured 24 h after 1, 3 or 7 OVA aerosol exposures in
sensitized mice (Fig. 1A). The total recovery of BAL cells was not different from control mice (PBS-
DC/PBS) after 1 OVA exposure, but sequentially increased 10-fold (p=0.008) after three and 46-fold
(p=0.008) after seven OVA exposures.
Figure 1.
Effect of OVA or PBS aerosol challenge on cellular composition of BALF. Mice were immunized on d0 with 1x10⁶ OVA-DC or PBS-DC. From d 10 they were challenged daily for 30 min on 1, 3 or 7 consecutive days with OVA or PBS aerosols. (A) Total recovery of BALF cells as a marker of airway inflammation in response to aerosol exposures (*p< 0.05 compared with PBS-DC/PBS). B) Differential analysis of BALF cellular content based on flow cytometric analysis. The BALF composition of naive mice is included for reference. (C) Staining of BALF cytospin preparation with an Ab specific for murine MBP, identifying eosinophils in an OVA-DC immunized animal exposed 7 times to OVA aerosol. Isotype control Ab gave negative results (not shown). (D) Cells expressing high granularity on SSC signal (see gate) express the CCR3 receptor (filled histogram), identifying them as eosinophils.
Differential analysis of the BALF cells using flow cytometry (Fig. 1B) showed a significant
proportional increase in lymphocytes (CD3+ or B220+ cells) and granulocytes (based on scatter
For personal use only. by guest on June 12, 2013. bloodjournal.hematologylibrary.orgFrom

9
characteristics) with a concomitant decrease in alveolar macrophages/monocytes (highly
autofluorescent cells) in OVA-DC/OVA mice (Fig. 2A). As the discrimination of eosinophils from
other polymorphonuclear granulocytes is impossible based on scatter characteristics alone, eosinophils
were further characterized as non-autofluorescent highly granular (SSChi) cells expressing
intermediate levels of CD11c, and lacking expression of MHCII, B220, and CD3 (23). These highly
granular cells also expressed the eotaxin receptor CCR3 (Fig 1D) (24). This method of counting
eosinophils was compared with counting BALF cytospins stained with an anti-MBP Ab, yielding a
highly statistically significant Pearson correlation coefficient of 0.82 (p=0.0001)(Fig. 1C). Three OVA
aerosols induced an eosinophilia of 30.7 ± 6.0 % and 7 OVA aerosols induced an eosinophilia of 49.0
% ± 5.1 of all BALF cells. Thus, OVA exposure in OVA-DC immunized mice time-dependently
induces eosinophilic airway inflammation.
Figure 2.
Effect of OVA or PBS aerosol challenge on the number of DCs in the BALF. Mice were immunized on D0 with 1x10⁶ OVA-DC or PBS-DC. From d 10 they were challenged daily for 30 min on 1, 3 or 7 consecutive days with OVA or PBS aerosols. (A) In OVA-DC/OVA mice, the FSC/SSC plot contains lymphoid cells 'L', and granulocytes 'G'. In contrast in PBS-DC/PBS mice the majority of
For personal use only. by guest on June 12, 2013. bloodjournal.hematologylibrary.orgFrom

10
cells are large and spontaneously autofluorescent, representing alveolar macrophages 'M'. A gate was set (lower panels) on low autofluorescent cells that lacked expression of CD3 and B220. (B) Within the set gate, MHCIIhi CD11chi cells represent DCs, whereas CD11cdim MHCII- cells represent eosinophils 'Eo'. In our experiments, eosinophils did not express MHCII molecules. The average percentage of MHCIIhi CD11chi DCs as a percentage of total cells analyzed is indicated in the plot. (C) Kinetics of increase of DCs following OVA exposure as expressed as the absolute number of MHCIIhi
CD11chi cells within the BALF (n=5 animals per group; *p<0.05 compared with PBS-DC/PBS group) (D) Top panel : Gated CD11c+ MHCII+ DCs are of myeloid lineage as revealed by strong staining for CD11b (filled histogram); isotype control is open. Bottom panel : gated MHCII+CD11c+ (filled histogram) do not express the eosinophil marker CCR3, whereas gated CD11cdim granular eosinophils (open histogram)clearly do.
OVA exposure leads to a massive increase in endogenous airway DCs in OVA-sensitized mice.
To determine the number of DCs in the airways of PBS and OVA exposed mice, we have analyzed
BALF cells 24 h after the last OVA aerosol (Fig. 2A). Dendritic cells were identified with multi-
parameter flow cytometry as non-autofluorescent CD11chi/MHCIIhi/B220-/CD3- cells, as described
previously (3). Additional staining revealed that these cells expressed CD11b, identifying them as
myeloid DCs (Fig 2D). First we verified that injected DCs could no longer be recovered from the
BALF 5 days following i.t. injection (data not shown). This eliminates the possibility that non-
endogenous DCs still remaining in the BALF could confound the counting of DCs after the aerosol
challenge period (d 11-17 after injection). The absolute number of DCs was elevated about 10x in
OVA-DC immunized mice challenged with 3 OVA aerosols (p=0.008) and increased about 100x after
7 OVA aerosols (p=0.016) compared with control PBS-DC/PBS mice (Fig. 2B). In addition to an
absolute increase in cell number, the percentage of DCs found in BALF cells was similarly increased
following 3 aerosols, although not significantly (p=0.056), and doubled after 7 aerosols (p=0.016). In
control mice the number of DCs remained at low levels, comparable to the situation in unmanipulated
mice.
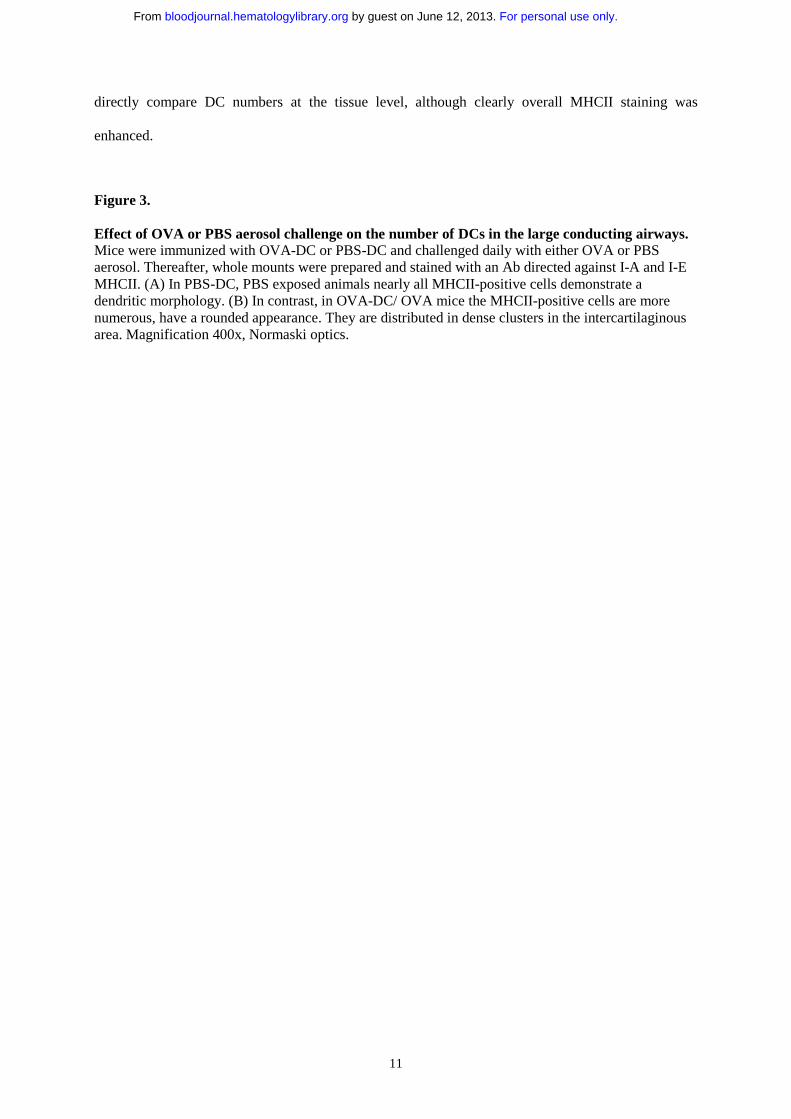
To determine if the increase in the number of BALF DCs was also supported by an increase in airway
mucosal DCs, we visualized the DC network in tracheal whole mounts, as previously described (18).
The pattern of the MHCII staining revealed a dendritic network in the control PBS-DC/PBS mice (Fig.
3A) whereas in the OVA-DC immunized mice exposed to three OVA aerosols, numerous dense areas
of rounded MHCII+ cells lacking the typical dendritic morphology were seen (Fig. 3B). Due to the fact
that MHCII+ cells were rounded and could also represent MHCII+ B cells or eosinophils, we could not
For personal use only. by guest on June 12, 2013. bloodjournal.hematologylibrary.orgFrom
11
directly compare DC numbers at the tissue level, although clearly overall MHCII staining was
enhanced.
Figure 3.
Effect of OVA or PBS aerosol challenge on the number of DCs in the large conducting airways. Mice were immunized with OVA-DC or PBS-DC and challenged daily with either OVA or PBS aerosol. Thereafter, whole mounts were prepared and stained with an Ab directed against I-A and I-E MHCII. (A) In PBS-DC, PBS exposed animals nearly all MHCII-positive cells demonstrate a dendritic morphology. (B) In contrast, in OVA-DC/ OVA mice the MHCII-positive cells are more numerous, have a rounded appearance. They are distributed in dense clusters in the intercartilaginous area. Magnification 400x, Normaski optics.
For personal use only. by guest on June 12, 2013. bloodjournal.hematologylibrary.orgFrom
12
For personal use only. by guest on June 12, 2013. bloodjournal.hematologylibrary.orgFrom

13
OVA exposure leads to an increase in peripheral blood DCs in OVA sensitized mice.
To investigate if the accumulation of lung CD11c+ CD11b+ DCs was supported by recruitment from
the bloodstream, the number of DCs (CD11c+/MHCII+/B220-/CD3- cells) was determined in the blood
24 h after the last of three aerosols. The percentage of MHCII+ CD11c+ blood DCs was significantly
(OVA 0.81 ± 0.09% vs PBS 0.37 ± 0.03 vs naïve 0.39 ± 0.03, p<0.0001) raised in response to OVA
challenges in OVA-DC mice (Fig. 4A and C).
Figure 4.
Effect of OVA or PBS aerosol challenge on the percentage of blood DCs. Mice were immunized with OVA-DC or PBS-DC and challenged daily with either OVA or PBS aerosol. (A) A gate was set on MHCII+ cells within CD3-B220- cells. Numbers represent the mean percentage of cells within this gate. (B) Within the MHCII+ gate, CD11c+ cells represent DCs. Additional staining involved CD11b to discriminate myeloid (CD11b+) versus lymphoid (CD11b-) DCs. Numbers indicate the mean percentage of the population as % of total cells within lysed blood cells (n=9 per group). (C) Quantitative summary from unmanipulated naive mice, PBS-DC/PBS and OVA-DC/OVA animals (*p<0.05 compared with the naive and PBS-DC/PBS group).
In the blood of the control PBS- DC/PBS immunized mice, levels were comparable with those found in
untreated animals. Additional experiments were set out to define the CD11b+ myeloid and CD11b-
lymphoid population within the CD11c+ MHCII+ B220-CD3- population of blood cells (Fig. 4B and
C). It appeared that the percentage of blood CD11b+ myeloid DCs was significantly elevated in OVA-
DC/OVA mice compared with PBS-DC/PBS mice (OVA 0.6 ± 0.066 % vs PBS 0.231 ± 0.022 %,
For personal use only. by guest on June 12, 2013. bloodjournal.hematologylibrary.orgFrom
14
p<0.0001). In the blood of OVA-DC/OVA mice, the percentage of MHC II+ CD11b+ CD11c- cells
(putative monocytes) was also raised significantly over the control mice (1.00 ± 0.30 % vs 0.30 ± 0.03
%, p <0.0001).
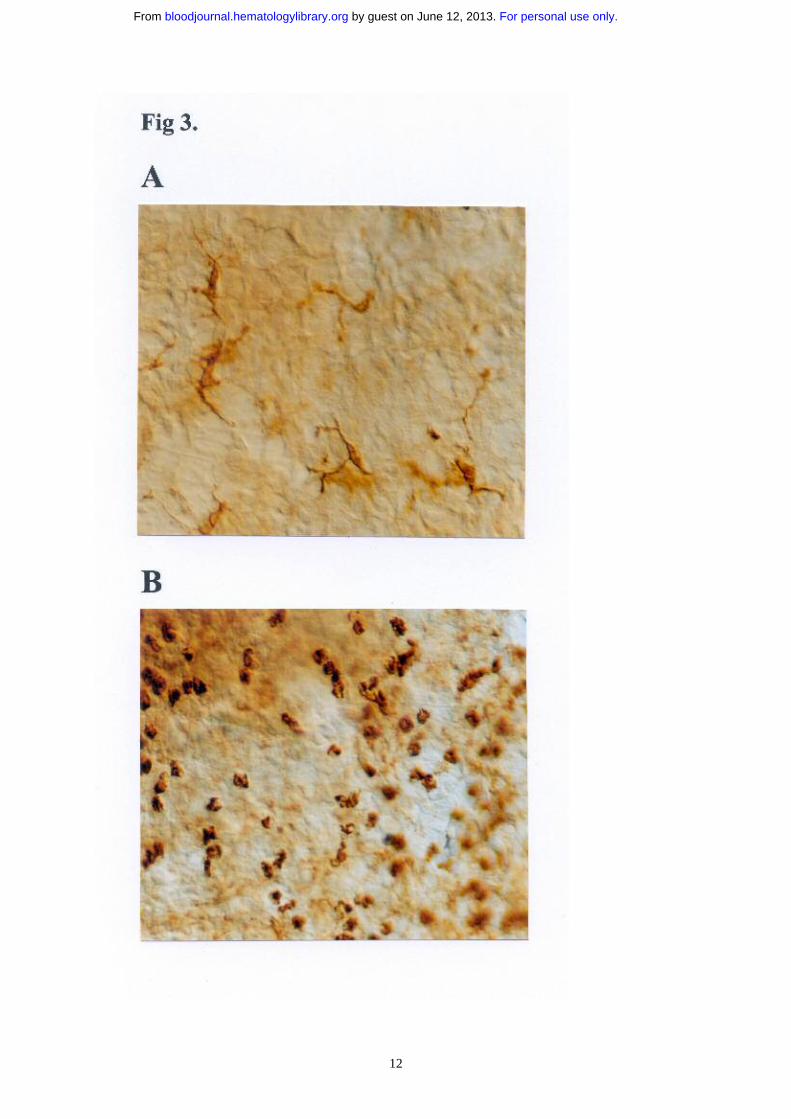
OVA exposure leads to an increase in CD31hi Ly-6Cneg BM cells in OVA-sensitized mice.
The increased presence of CD11c+ DCs in the bloodstream during OVA challenge, despite the massive
influx of DCs into the airways, suggested that DC output from the BM might be enhanced.
Figure 5.
Effect of OVA or PBS aerosol exposure on the cellular composition of BM. OVA-DC or PBS-DC-immunized mice were challenged with either 1x, 3x or 7x daily OVA or PBS aerosols. Twenty-four hours after the last challenge, BM was collected and stained for Ly-6C and CD31. (A) Using this combination of markers, 6 distinct populations can be identified. Morphologically these populations consist of: a. 70% blast cells and 25% lymphoid cells; b. lymphoid cells; c. erythroid cells; d. myeloid progenitors and plasmacytoid cells; e. granulocytes; f. 75% monocytes and 20% myeloid progenitors (19). Plots represent Ly-6C/CD31 staining on BM cells taken from mice exposed seven times to PBS or OVA aerosol. There is a clear and selective increase in the CD31hiLy-6Cneg subset in the OVA-DC/OVA group. Percentages of each population are indicated below the FACS plot (B) Kinetics and magnitude of increase in the CD31hi Ly-6Cneg BM subset following OVA or PBS challenge (n=6-8 per group per time point, *p< 0.05 compared with PBS-DC/PBS). (C) Additional staining included CD11c and B220 to delineate plasmacytoid DCs. Plots were gated on CD31hi Ly-6Chi cells (population d) in
For personal use only. by guest on June 12, 2013. bloodjournal.hematologylibrary.orgFrom
15
PBS-DC/PBS and OVA-DC/OVA mice. Average percentage of CD11c+ B220+ within the gate is indicated.
Staining of whole BM cells with the monoclonal Abs CD31 (ER-MP12) and Ly-6C (ER-MP20), gives
rise to six distinct populations of BM cells, each with varying degrees of lineage commitment and
progenitor potential (see Fig. 5A) (19). This staining was used to define the cellular composition of
BM in mice with or without eosinophilic airway inflammation. One, three or seven OVA aerosol
exposures to OVA-DC mice sequentially induced an increase in the CD31hi Ly-6Cneg population, from
4.61 ± 0.75% of total BM at baseline up to 7.84 ± 1.25% after 3 exposures and 11.1 ± 1.48 % after
seven aerosols (Fig. 5A and B). There was no increase in this population after exposure to PBS
aerosols. None of the 5 other distinct populations was altered significantly by OVA aerosol in OVA-
DC mice or by PBS aerosol in PBS-DC mice.
To explore whether the increase of the CD31hi Ly-6Cneg population was due to an increase of cells
with myeloid or lymphoid commitment, additional staining was performed using the myeloid
differentiation marker CD11b in combination with a CD127 Ab against the IL-7Rα chain, identifying
cells with lymphoid commitment (25, 26). Within the CD31hi Ly-6Cneg subset, cells expressed CD11b
or CD127 exclusively. After four aerosols, the percentage of CD11b+ cells in this subset remained
constant whereas that of CD11b-CD127+ lymphoid committed cells was 9.5±1.4% in PBS-DC/PBS
mice, compared with 6.1±0.4% in OVA-DC/OVA mice, indicating a small but significant (p=0.004)
decrease of cells with lymphoid differentiation (potential). Cells were also stained with an Ab against
CD131, the common β chain of the IL-3/IL-5/GM-CSF receptor. The CD31hi Ly-6Cneg subset had the
highest expression compared to the other populations or whole BM. There was no difference in
CD131 expression of the CD31hi Ly-6Cneg subset between the PBS and the OVA exposed group.
The CD31hi Ly-6Cneg BM subset gives rise to DCs and eosinophils under different culture
conditions
As the CD31hi Ly-6Cneg subset of cells was the only population that was increased in the BM of mice
with eosinophilic airway inflammation, we examined if this subset could give rise to DCs. The CD31hi
Ly-6Cneg population was purified by flow cytometric sorting to 85-95% purity, and cultured in GM-
CSF (40 ng/ml) (Fig. 6).
For personal use only. by guest on June 12, 2013. bloodjournal.hematologylibrary.orgFrom

16
Figure 6. CD31hi Ly-6Cneg cells give rise to DCs following culture in GM-CSF. OVA-DC or PBS-DC immunized mice were challenged daily for 3 days with OVA or PBS aerosols. Twenty four hours after the last challenge, BM was collected and stained with CD31 and Ly-6C antibodies. Plots shown are representative of mice within the OVA-DC/OVA group. The CD31hiLy-6Cneg and the CD31negLy-6Cmed populations were purified using flow cytometric sorting (middle panels) and subsequently cultured in the presence of GM-CSF for 7 days. The lower panels represent FACS plots of cells at the end of the culture period stained for MHCII and CD11c. Immature DCs are CD11c+ MHCII- and mature DCs are CD11c+ MHC II+.
After 7 days culture in the presence of GM-CSF, many colonies of proliferating cells were seen. About
77% of cells were CD11c-positive and more than half of these expressed MHC II, indicating
maturation in culture (Fig. 6C). In contrast, the CD31neg Ly-6Cmed population was sorted and cultured
under the same conditions and yielded only 2.2% MHCII+/CD11c+cells.
Airway eosinophilia is a prominent feature of allergic airway inflammation and was also observed in
our model. Therefore, we investigated whether the same CD31hiLy-6Cneg population contained
eosinophil precursors. First, to support the concept that cells with eosinophil potential were contained
within the CD31hiLy-6Cneg population, bone marrow subsets were stained with a monoclonal against
the eotaxin receptor CCR3 (24). Cells within this subset expressed CCR3 at intermediate levels (see
figure 7A). Mature granulocytes, contained within the CD31negLy-6Cmed also contained CCR3hi
mature eosinophils. Next, cells in the allergen-induced enlarged CD31hi Ly-6Cneg population were
sorted (about 85% to 95% pure CD31hi Ly-6Cneg cells) and cultured in the presence of IL-5 (24 ng/ml)
For personal use only. by guest on June 12, 2013. bloodjournal.hematologylibrary.orgFrom
17
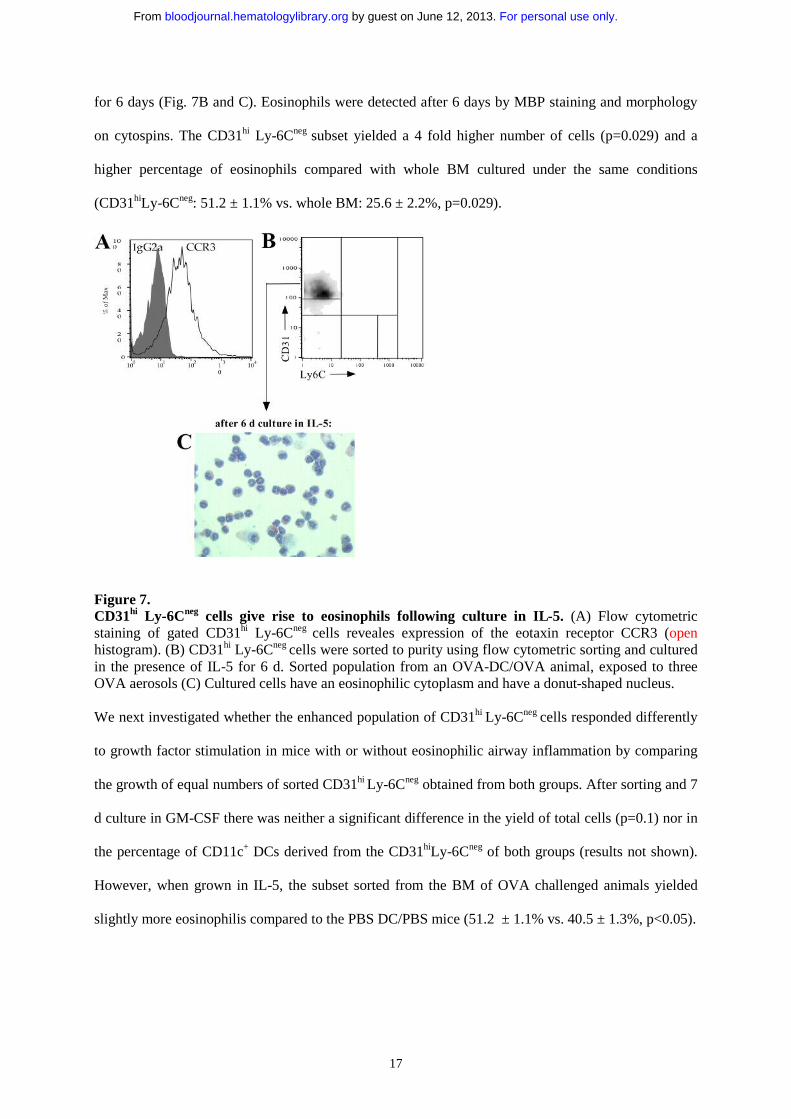
for 6 days (Fig. 7B and C). Eosinophils were detected after 6 days by MBP staining and morphology
on cytospins. The CD31hi Ly-6Cneg subset yielded a 4 fold higher number of cells (p=0.029) and a
higher percentage of eosinophils compared with whole BM cultured under the same conditions
(CD31hiLy-6Cneg: 51.2 ± 1.1% vs. whole BM: 25.6 ± 2.2%, p=0.029).
Figure 7. CD31hi Ly-6Cneg cells give rise to eosinophils following culture in IL-5. (A) Flow cytometric staining of gated CD31hi Ly-6Cneg cells reveales expression of the eotaxin receptor CCR3 (openhistogram). (B) CD31hi Ly-6Cneg cells were sorted to purity using flow cytometric sorting and cultured in the presence of IL-5 for 6 d. Sorted population from an OVA-DC/OVA animal, exposed to three OVA aerosols (C) Cultured cells have an eosinophilic cytoplasm and have a donut-shaped nucleus.
We next investigated whether the enhanced population of CD31hi Ly-6Cneg cells responded differently
to growth factor stimulation in mice with or without eosinophilic airway inflammation by comparing
the growth of equal numbers of sorted CD31hi Ly-6Cneg obtained from both groups. After sorting and 7
d culture in GM-CSF there was neither a significant difference in the yield of total cells (p=0.1) nor in
the percentage of CD11c+ DCs derived from the CD31hiLy-6Cneg of both groups (results not shown).
However, when grown in IL-5, the subset sorted from the BM of OVA challenged animals yielded
slightly more eosinophilis compared to the PBS DC/PBS mice (51.2 ± 1.1% vs. 40.5 ± 1.3%, p<0.05).
For personal use only. by guest on June 12, 2013. bloodjournal.hematologylibrary.orgFrom

18
OVA exposure does not increase the number of plasmacytoid DCs in BM
Despite the fact that none of the other populations identified by CD31 and Ly-6C staining were
percentually changed, we studied these subsets in greater detail by 4-color analysis. More specifically,
the percentage of CD31hi Ly-6Chi cells, known to contain precursors for DCs as well as plasmacytoid
DCs was not altered by exposure to OVA (22, 27, 28). The percentage of plasmacytoid CD11c+ B220+
DCs within the CD31hi Ly-6Chi subset was 12.2±1.4% in OVA exposed mice compared with
13.0±0.8% in PBS exposed mice after three aerosols (Fig. 5C). However, in response to the OVA
challenges, the CD31hiLy-6Chi, subset, expressed more CD131 compared with the control mice (data
not shown).
The percentage of CD3+CD4+ T cells (falling within the CD31med Ly-6Cneg fraction) in total BM was
significantly lower (0.16±0.03%) in the OVA-DC/OVA group compared with the PBS-DC/PBS group
(0.37±0.07%; p=0.001).
OVA exposure modifies the BALF and serum level of cytokines in OVA sensitized mice.
An increase in DCs could also be caused by increased local differentiation of DCs from monocytic
precursors within inflamed tissues. To determine the presence of early growth and differentiation
factors for DCs, we measured the content of the cytokines IL-6, GM-CSF and Flt-3L in BALF 24 h
after three OVA aerosol exposures, when the number of DCs was significantly increased. IL-6 was
significantly raised after three aerosols in OVA-DC/OVA mice compared with PBS-DC/PBS mice
(OVA:418.2 ± 74.6 pg/ml, PBS:12.5 ± 1.9 pg/ml, p=0.016). Ag challenge did not effect the GM-CSF
level (OVA:3.90±1.50 pg/ml vs PBS:9.45±2.3 pg/ml, p=0.111). The Flt-3L levels in BALF were just
above the detection level of our assay, showing no detectable difference in the various groups.
In serum, levels of IL-6 (13.67±3.39 pg/ml vs 2.55±0.79 pg/ml, p=0.016) and eotaxin (564± 62 pg/ml
vs 282 ± 25 pg/ml, p=0.008) were higher in the OVA-DC/OVA group compared with the PBS-
DC/PBS group, while that of GM-CSF was below the detection limit.
For personal use only. by guest on June 12, 2013. bloodjournal.hematologylibrary.orgFrom

19
OVA exposure increases DC migration towards the draining lymph nodes in OVA-sensitized
mice.
Figure 8.Effect of OVA or PBS aerosol challenge on DC subsets within the draining mediastinal LN. OVA-DC or PBS-DC immunized mice were challenged three times with either OVA or PBS aerosol. Twenty four h after the last challenge, mediastinal LN were collected, homogenized and stained for the presence of MHCII+ CD11c+ DCs. (A) Within the MHCII+ population, CD11c+ cells were further characterized as CD11bmed/hi myeloid and CD11bneg lymphoid DCs. (B) In OVA-DC/OVA animals, there is an absolute and relative increase in both lymphoid and myeloid DCs compared with PBS-DC/PBS mice. (*p< 0.05). (C) To investigate whether the observed increase in DCs in the LN was caused by enhanced migration, BM DCs were labeled with CFSE and 2x10⁶ cells were injected intratracheally into mice without (PBS) or with (OVA) eosinophilic airway inflammation, and subsequently traced in the MLN and the inguinal non-draining LN. Injected DCs can be discriminated from endogenous DCs by CFSE positivity. Numbers represent the percentage of injected DCs of total cells in the LN.
In addition to the mechanisms studied above, a decreased efflux to the draining MLN could contribute
to an accumulation of DCs in inflamed airways. We observed that the draining MLNs of OVA-
DC/OVA mice were grossly swollen compared with non-draining nodes or MLNs of PBS-DC/PBS
mice. After three aerosol exposures, the total number (both relative and absolute) of DCs was
increased in the OVA-DC/OVA group compared to the control PBS-DC/PBS group (7.00 ± 0.53% vs.
2.37 ±0.27%, p=0.002). This was due primarily to an increase in the CD11bmed/hi myeloid DCs (3.5
For personal use only. by guest on June 12, 2013. bloodjournal.hematologylibrary.orgFrom
20
fold increase), although the lymphoid CD11b- subset was also increased following OVA challenge
(Fig. 8A and B). To provide further proof that migration of airway DCs was influenced by the
eosinophilic airway inflammation, we injected CFSE-labeled BM-derived in-vitro cultured DCs i.t. in
mice with (OVA-DC/OVA group) or without (PBS-DC/PBS) eosinophilic airway inflammation. Forty
eight h after injection, mice with inflamed lungs had a small, but significantly higher number of CFSE
labeled DCs in the MLNs, compared with control mice with uninflamed lungs (9.74 ± 1.81 x 10² vs
2.41 ± 0.84 x 10² CFSE-labeled CD11c+ cells (p=0.029), Fig. 9C), demonstrating that DC efflux to the
MLNs was actually enhanced in mice with eosinophilic airway inflammation. After i.t. injection,
CFSE-labeled DCs could not be detected in peripheral LN.
For personal use only. by guest on June 12, 2013. bloodjournal.hematologylibrary.orgFrom
21
Discussion
Airway DCs have been implicated in causing the sensitization to inhaled allergens, by taking up Ag in
the lung mucosa, transporting it into the draining LN and finally by inducing differentiation of Th2
effector cells that can orchestrate eosinophilic airway inflammation (3, 4, 6, 7). Despite these
observations that airway DCs might be essential in the early steps of sensitization, less information is
available on the role of DCs in stimulating memory and/or effector Th2 cells at times of repeated
exposure to inhaled allergen. In this paper, we have demonstrated that the number of airway CD11c+
CD11b+ myeloid DCs is strongly increased within the airway epithelium and BALF following allergen
challenge in sensitized animals. Within 3 days, an almost 10 fold expansion in the number of DCs was
found following repeated OVA challenge, in parallel with an increase in CD4+ lymphocytes and
eosinophils in the airways, reaching a 100 fold expansion at d 7. At the same time, the number of
CD11c+ CD11b+ myeloid DCs in the bloodstream was increased threefold.
The massive increase in airway DCs and the accompanying increase in circulating blood DCs led us to
investigate whether the production of DCs from the BM ('dendropoiesis') might be enhanced in mice
with eosinophilic airway inflammation, to meet the enhanced demand for DCs in the inflamed lung.
Numerous studies have demonstrated that the BM reacts to airway allergen challenge by increasing its
output of eosinophilic precursors (10-14). Previously, repopulation experiments in irradiated and BM-
reconstituted rats have shown that airway DCs stem from a rapidly dividing precursor cell in the BM
(16). It is possible to discriminate distinct populations of BM cells using multiparameter flow
cytometry (19, 22, 29, 30). Here, we have used the expression of Ly-6C in combination with CD31,
platelet endothelial cell adhesion molecule PECAM-1, to delineate six discrete populations of BM
cells, each with differential lineage commitment and differentiation potential (19, 22). When we
stained BM cells from mice with or without eosinophilic airway inflammation, there was a striking
and time-dependent increase in the population of CD31hi Ly-6Cneg cells, while none of the other
populations were affected by allergen challenge. In previous experiments, this population of BM cells
was shown to contain cells with colony forming unit (CFU) potential for granulocytes/monocytes,
erythrocytes, megakaryocytes and mast cells and as well as cells with thymus repopulating capacity.
More primitive precursors with long term repopulating ability were found in the CD31med Ly-6Cneg
For personal use only. by guest on June 12, 2013. bloodjournal.hematologylibrary.orgFrom

22
population (29, 31). In mice with eosinophilic airway inflammation, CD31hi Ly-6Cneg cells
predominantly expressed the myeloid marker CD11b, and the expression of the lymphoid
differentiation marker IL-7Rα (CD127) was slightly, but significantly, decreased, suggesting an
expansion of cells with myeloid potential. When CD31hiLy-6Cneg cells were sorted and subsequently
grown in the DC-growth factor GM-CSF, clusters were formed in liquid culture and a majority of the
outgrowth of these colonies were myeloid CD11b+CD11c+ cells with a dendritic morphology (data not
shown). In contrast when CD31negLy-6Cmed cells were grown under the same conditions, no colonies
were formed and hardly any CD11c+ cells grew out of the cultures. When the CD31hiLy-6Cneg DC-
precursor population was sorted from both groups of mice, and grown under the same plating density
and GM-CSF concentration, there was no difference in the amount or percentage of DCs that grew
from these cultures. Therefore, sensitivity to GM-CSF, either by enhanced expression of the GM-CSF
receptor or by modified post-receptor events, was not enhanced in mice with eosinophilic airway
inflammation. In support of this, the expression of the common β chain of the IL-3/IL-5/GM-CSF on
CD31hiLy-6Cneg cells, was not different between mice with or without eosinophilic airway
inflammation.
The fact that a time dependent increase in CD31hi Ly-6Cneg cells with DC potential was observed in
mice with massive accumulation of CD11b+ CD11c+ airway and blood DCs strongly suggests that the
BM increased its production of DCs to meet the enhanced demand in the airways. Moreover, in mice
with airway inflammation, there was no increase in the CD31hi Ly-6Chi population, known to contain
the plasmacytoid B220+ CD11c+ DCs and some precursors of myeloid DCs (22). The fact that we did
not see an increase in any of these more mature DC populations following allergen challenge suggests
that DC precursors leave the BM at an early stage of differentiation. One possibility that needs further
investigation is that they were attracted to the airways through the action of particular chemokines.
Allergic inflammation is accompanied by enhanced production of eotaxin in the airways (32). The
subset of CD31hi Ly-6C- BM precursors expressed the eotaxin receptor CCR3, suggesting that these
cells might be attracted into inflamed airways.
The observed increase in CD31hiLy-6Cneg cells in BM, without any other increase in BM populations
is unique for eosinophilic airway inflammation. Bacterial infection with Listeria monocytogenes leads
For personal use only. by guest on June 12, 2013. bloodjournal.hematologylibrary.orgFrom
23
to profound changes in BM composition with a predominant time-dependent increase in CD31hiLy-
6Chi monocyte precursors, CD31negLy-6Chi mature monocytes, and CD31negLy-6Cmed granulocytes. At
the same time, there was a depletion of CD31medLy-6Cneg lymphoid cells and more importantly the
CD31hiLy-6Cneg population described in this study (19). The changes in the BM of Listeria-infected
mice reflect an increased need for granulocytes and monocytes, which are attracted, to lesions
consisting of mononuclear and neutrophil-rich cell infiltrates. However, in our model of OVA-induced
airway inflammation, eosinophils are strongly recruited to the airways of challenged mice together
with DCs. Not surprisingly, we were able to demonstrate that the CD31hi Ly-6Cneg population of BM
cells could also differentiate into MBP-positive eosinophils after culture in IL-5, suggesting that
enhanced production of eosinophils from the BM was induced to meet the increased demand for
eosinophils. This is in line with previous experiments in which mouse BM cells were cultured in the
presence of IL-5 in semi-solid media to asses CFU-Eo potential and showing increased CFU-Eo in
mice with eosinophilic airway inflammation (11-14).
The increase in eosinophil-CFU in challenged mice has been attributed either to the presence of a
serum factor distinct from IL-5, such as eotaxin, or to migration of IL-5-producing T cells to the BM
(13, 14, 33). In support of a serum factor in our system, we measured a slightly enhanced level of the
DC growth factor IL-6 (34). One likely candidate that could be involved in the upregulation of GM-
CSF responsive BM cells is eotaxin (33), of which the serum levels were indeed doubled in mice with
inflammation. Further, the CD31hi Ly-6Cneg cells expressed the eotaxin receptor CCR3, with identical
levels in allergic and non allergic mice (data not shown). The migration of 'dendropoiesis' promoting T
cells to the BM is less likely as we measured a decrease in BM CD4+ T cells following allergen
challenge, probably due to their migration to the lung.
Although the direct recruitment of immature blood DCs, is the most likely explanation for the
observed accumulation of lung DCs, one contributing mechanism could also be enhanced local
proliferation of DCs from monocytic precursors in allergic lung. Although it was shown in irradiation
experiments that there is little if any local self-renewal capacity for DCs in rat airways, this situation
could be different under inflammatory conditions (16). Indeed, in our experiments, there was an
increase in circulating CD11c-CD11b+MHCII+ monocytes, that could be recruited to the airways and
For personal use only. by guest on June 12, 2013. bloodjournal.hematologylibrary.orgFrom

24
further differentiate to DCs. (15). When we measured the concentration of the DC-differentiation
factors GM-CSF and Flt-3L in the airways of allergic mice, we could however not detect enhanced
production (34, 35). One factor that enhances differentiation of mouse BM-derived DCs that was
enhanced in BALF was IL-6 (34). It was recently shown that enhanced expression of IL-6 in the lungs
of mice receiving IL-13 and Interferon-γ correlates with enhanced numbers of CD11c+ DCs being
found in the BALF (36). Definite proof whether locally produced IL-6, GM-CSF or Flt-3L
functionally contributes to enhanced differentiation of monocytes (precursors) to DCs in mice with
airway eosinophilia awaits studies using neutralizing antibodies.
One final mechanism that could be responsible for the observed change in airway DCs in mice with
airway eosinophilia would be reduced emigration of DCs. There is continuous and high throughput
migration of airway DCs from the epithelium to the draining MLN and a small decrease of DC efflux
could lead to rapid and profound accumulation within the epithelium (3, 5, 16). To our surprise, we
found that the numbers of CD11c+CD11b+ myeloid and CD11c+CD11b- lymphoid DCs were increased
strongly in the MLN of OVA challenged mice. We believe that the increase in LN DCs was partly due
to enhanced migration of lung-derived DCs into the MLN. In support of this, CFSE+, CCR-7+ BM
DCs migrated three times more efficiently towards the MLNs following injection into the airways of
mice with established airway eosinophilia. Reduced migration of DCs to the MLN is therefore not a
mechanism that contributes to accumulation of airway DCs in our model. Enhanced migration of Ag-
laden DCs to the MLN during a secondary response to inhaled Ag could prove to be necessary to
stimulate the recirculating pool of non-polarized CCR7+ central memory T cells, which recirculate
through the T cell area of LN and spleen and fail to migrate into peripheral tissues (37, 38). We have
shown that a proportion of divided Ag-reactive T cells remain in a non-polarized, non-recirculating
state in the MLN after immunization with DCs (4). It is possible that migratory DCs recruit these
sessile partially activated cells into further cell division during renewed encounter with inhaled Ag
(38).
In summary, our data show that CD11b+CD11c+ DCs are massively attracted into the airways and
draining LN upon OVA challenge in sensitized mice, a process supported by increased dendropoiesis
in the BM. We have previously shown that systemic abolition of DCs in sensitized thymidine kinase
For personal use only. by guest on June 12, 2013. bloodjournal.hematologylibrary.orgFrom

25
transgenic mice immediately prior to secondary challenge completely suppresses eosinophilic airway
inflammation, goblet cell hyperplasia and IgE synthesis (18). Together, these data imply an important
functional role for airway DCs not only in the induction of Th2 cells from naive precursors, but also in
the maintenance of eosinophilic airway inflammation. Inhibiting the influx of DCs could prove to be a
strategy for reducing airway inflammation that is typical of asthma (8).
For personal use only. by guest on June 12, 2013. bloodjournal.hematologylibrary.orgFrom

26
Acknowledgements
We thank C. Snoys (Cell Biology Erasmus University) for sorting and J. Lee for antibodies.
For personal use only. by guest on June 12, 2013. bloodjournal.hematologylibrary.orgFrom

27
References
1. Banchereau J, Steinman RM. Dendritic cells and the control of immunity. Nature. 1998;392:245-
252
2. Holt PG, Stumbles PA. Regulation of immunologic homeostasis in peripheral tissues by dendritic
cells: the respiratory tract as a paradigm. J. Allergy Clin. Immunol. 2000;105:421-429
3. Vermaelen KY, Carro-Muino I, Lambrecht BN, Pauwels RA. Specific migratory dendritic cells
rapidly transport antigen from the airways to the thoracic lymph nodes. J.Exp.Med. 2001;193:51-60
4. Lambrecht BN, Pauwels RA, Fazekas De St Groth B. Induction of rapid T cell activation, division,
and recirculation by intratracheal injection of dendritic cells in a TCR transgenic model. J. Immunol.
2000;164:2937-2946
5. Xia W, Pinto C, Kradin RL. The antigen-presenting activities of Ia+ Dendritic cells shift
dynamically from lung to lymph node after an airway challenge with soluble antigen. J. Exp. Med.
1995;181:1275-1283
6. Lambrecht BN, De Veerman M, Coyle AJ, Gutierrez-Ramos JC, Thielemans K, Pauwels RA.
Myeloid dendritic cells induce Th2 responses to inhaled antigen, leading to eosinophilic airway
inflammation. J Clin Invest. 2000;106:551-559
7. Sung S, Rose CE, Jr., Fu SM. Intratracheal Priming with Ovalbumin- and Ovalbumin 323-339
Peptide- Pulsed Dendritic Cells Induces Airway Hyperresponsiveness, Lung Eosinophilia, Goblet Cell
Hyperplasia, and Inflammation. J. Immunol. 2001;166:1261-1271
8. Lambrecht BN. The dendritic cell in allergic airway diseases: a new player to the game. Clin. Exp.
Allergy. 2001;31:206-218
9. Jahnsen FL, Moloney ED, Hogan T, Upham JW, Burke CM, Holt PG. Rapid dendritic cell
recruitment to the bronchial mucosa of patients with atopic asthma in response to local allergen
challenge. Thorax. 2001;56:823-826.
10. Saito H, Howie K, Wattie J, et al. Allergen-induced murine upper airway inflammation: local and
systemic changes in murine experimental allergic rhinitis. Immunology. 2001;104:226-234.
11. Ohkawara Y, Lei XF, Stampfli MR, Marshall JS, Xing Z, Jordana M. Cytokine and eosinophil
responses in the lung, peripheral blood, and bone marrow compartments in a murine model of
For personal use only. by guest on June 12, 2013. bloodjournal.hematologylibrary.orgFrom
28
allergen- induced airways inflammation [see comments]. Am. J. Respir. Cell Mol. Biol.. 1997;16:510-
520
12. Inman MD, Ellis R, Wattie J, Denburg JA, O'Byrne PM. Allergen-induced increase in airway
responsiveness, airway eosinophilia, and bone-marrow eosinophil progenitors in mice. Am. J. Respir.
Cell Mol. Biol. 1999;21:473-479.
13. Tomaki M, Zhao LL, Lundahl J, et al. Eosinophilopoiesis in a murine model of allergic airway
eosinophilia: involvement of bone marrow IL-5 and IL-5 receptor alpha. J. Immunol. 2000;165:4040-
4050.
14. Gaspar Elsas MI, Joseph D, Elsas PX, Vargaftig BB. Rapid increase in bone-marrow eosinophil
production and responses to eosinopoietic interleukins triggered by intranasal allergen challenge. Am.
J. Respir. Cell Mol. Biol.. 1997;17:404-413
15. Randolph GJ, Beaulieu S, Lebecque S, Steinman RM, Muller WA. Differentiation of monocytes
into dendritic cells in a model of transendothelial trafficking. Science. 1998;282:480-483
16. Holt PG, Haining S, Nelson DJ, Sedgwick JD. Origin and steady-state turnover of class II MHC-
bearing dendritic cells in the epithelium of the conducting airways. J. Immunol. 1994;153:256-261
17. Lutz MB, Kukutsch N, Ogilvie AL, et al. An advanced culture method for generating large
quantities of highly pure dendritic cells from mouse bone marrow. J. Immunol. Methods.
1999;223:77-92
18. Lambrecht BN, Salomon B, Klatzmann D, Pauwels RA. Dendritic cells are required for the
development of chronic eosinophilic airway inflammation in response to inhaled antigen in sensitized
mice. J. Immunol. 1998;160:4090-4097
19. de Bruijn MF, van Vianen W, Ploemacher RE, et al. Bone marrow cellular composition in Listeria
monocytogenes infected mice detected using ER-MP12 and ER-MP20 antibodies: a flow cytometric
alternative to differential counting. J. Immunol. Methods. 1998;217:27-39.
20. de Bruijn MF, Slieker WA, van der Loo JC, Voerman JS, van Ewijk W, Leenen PJ. Distinct mouse
bone marrow macrophage precursors identified by differential expression of ER-MP12 and ER-MP20
antigens. Eur J. Immunol. 1994;24:2279-2284.
For personal use only. by guest on June 12, 2013. bloodjournal.hematologylibrary.orgFrom
29
21. Ling V, Luxenberg D, Wang J, et al. Structural identification of the hematopoietic progenitor
antigen ER- MP12 as the vascular endothelial adhesion molecule PECAM-1 (CD31). Eur J. Immunol.
1997;27:509-514.
22. Bruno L, Seidl T, Lanzavecchia A. Mouse pre-immunocytes as non-proliferating multipotent
precursors of macrophages, interferon-producing cells, CD8alpha(+) and CD8alpha(-) dendritic cells.
Eur J. Immunol. 2001;31:3403-3412.
23. Throsby M, Herbelin A, Pleau JM, Dardenne M. CD11c+ eosinophils in the murine thymus:
developmental regulation and recruitment upon MHC class I-restricted thymocyte deletion. J.
Immunol. 2000;165:1965-1975.
24. Grimaldi JC, Yu NX, Grunig G, et al. Depletion of eosinophils in mice through the use of
antibodies specific for C-C chemokine receptor 3 (CCR3). J.Leukoc.Biol. 1999;65:846-853
25. de Bruijn MF, Ploemacher RE, Mayen AE, et al. High-level expression of the ER-MP58 antigen
on mouse bone marrow hematopoietic progenitor cells marks commitment to the myeloid lineage. Eur
J. Immunol. 1996;26:2850-2858.
26. Manz MG, Traver D, Miyamoto T, Weissman IL, Akashi K. Dendritic cell potentials of early
lymphoid and myeloid progenitors. Blood. 2001;97:3333-3341.
27. Asselin-Paturel C, Boonstra A, Dalod M, et al. Mouse type I IFN-producing cells are immature
APCs with plasmacytoid morphology. Nat. Immunol. 2001;2:1144-1150.
28. Nakano H, Yanagita M, Gunn MD. CD11c(+)B220(+)Gr-1(+) cells in mouse lymph nodes and
spleen display characteristics of plasmacytoid dendritic cells. J. Exp. Med. 2001;194:1171-1178.
29. van der Loo JC, Slieker WA, Kieboom D, Ploemacher RE. Identification of hematopoietic stem
cell subsets on the basis of their primitiveness using antibody ER-MP12. Blood. 1995;85:952-962.
30. Schlueter AJ, Bhatia SK, Li X, et al. Delineation among eight major hematopoietic subsets in
murine bone marrow using a two-color flow cytometric technique. Cytometry. 2001;43:297-307.
31. Slieker WA, van der Loo JC, de Rijk-de Bruijn MF, Godfrey DI, Leenen PJ, van Ewijk W. ER-
MP12 antigen, a new cell surface marker on mouse bone marrow cells with thymus-repopulating
ability: II. Thymus-homing ability and phenotypic characterization of ER-MP12-positive bone marrow
cells. Int Immunol. 1993;5:1099-1107.
For personal use only. by guest on June 12, 2013. bloodjournal.hematologylibrary.orgFrom

30
32. Ganzalo JA, Jia GQ, Aguirre V, et al. Mouse Eotaxin expression parallels eosinophil accumulation
during lung allergic inflammation but it is not restricted to a Th2-type response. Immunity. 1996;4:1-
14
33. Peled A, Gonzalo JA, Lloyd C, Gutierrez-Ramos JC. The chemotactic cytokine eotaxin acts as a
granulocyte- macrophage colony-stimulating factor during lung inflammation. Blood. 1998;91:1909-
1916
34. Brasel K, De Smedt T, Smith JL, Maliszewski C. Generation of murine dendritic cells from flt3-
ligand supplemented bone marrow cultures. Blood. 2000;96:3029-3039
35. Inaba K, Inaba M, Romani N, et al. Generation of large numbers of dendritic cells from mouse
bone marrow cultures supplemented with granulocyte/macrophage colony-stimulating factor. J. Exp.
Med. 1992;176:1693-1702
36. Ford JG, Rennick D, Donaldson DD, et al. IL-13 and IFN-gamma: Interactions in Lung
Inflammation. J. Immunol. 2001;167:1769-1777.
37. Iezzi G, Scheidegger D, Lanzavecchia A. Migration and function of antigen-primed nonpolarized
T lymphocytes in vivo. J. Exp. Med. 2001;193:987-993.
38. Harris NL, Watt V, Ronchese F, Le Gros G. Differential T cell function and fate in lymph node
and nonlymphoid tissues. J Exp Med. 2002;195:317-326.
For personal use only. by guest on June 12, 2013. bloodjournal.hematologylibrary.orgFrom
Related Documents