All Slides Sexually Transmitted Disease Surveillance 2001 Division of STD Prevention

Welcome message from author
This document is posted to help you gain knowledge. Please leave a comment to let me know what you think about it! Share it to your friends and learn new things together.
Transcript

All Slides
Sexually Transmitted Disease Surveillance 2001
Division of STD Prevention

Chlamydia
Sexually Transmitted Disease Surveillance 2001
Division of STD Prevention

Chlamydia — Number of states that require reporting of Chlamydia trachomatis infections: United States, 1987–2001
No. of states
0
10
20
30
40
50
1987 88 89 90 91 92 93 94 95 96 97 98 99 2000 01

Chlamydia — Reported rates: United States, 1984–2001
Rate (per 100,000 population)
0
60
120
180
240
300
1984 86 88 90 92 94 96 98 2000

Chlamydia — Rates by state: United States and outlying areas, 2001
Note: The total rate of chlamydia for the United States and outlying areas (including Guam, Puerto Rico and Virgin Islands) was 275.5 per 100,000 population.
Rate per 100,000population
<=150150.1-300>300
VT 104.8 NH 111.9 MA 163.8 RI 277.8 CT 226.6 NJ 193.9 DE 356.4 MD 295.3
Guam 278.4
Puerto Rico 72.2 Virgin Is. 120.6
(n= 7)(n= 29)(n= 17)
326.6
437.7
279.6272.3
301.0 307.8
235.4
413.4
332.7
156.3
352.0 250.9
194.7
225.0219.7
399.2
104.9
312.8
169.2
414.6
249.3
212.7
187.3241.8
343.8
244.5
274.6
165.4
331.7
303.7
217.9
231.0
382.1
241.2
273.5
334.5
134.5
259.1
231.3
129.7
303.6
169.9
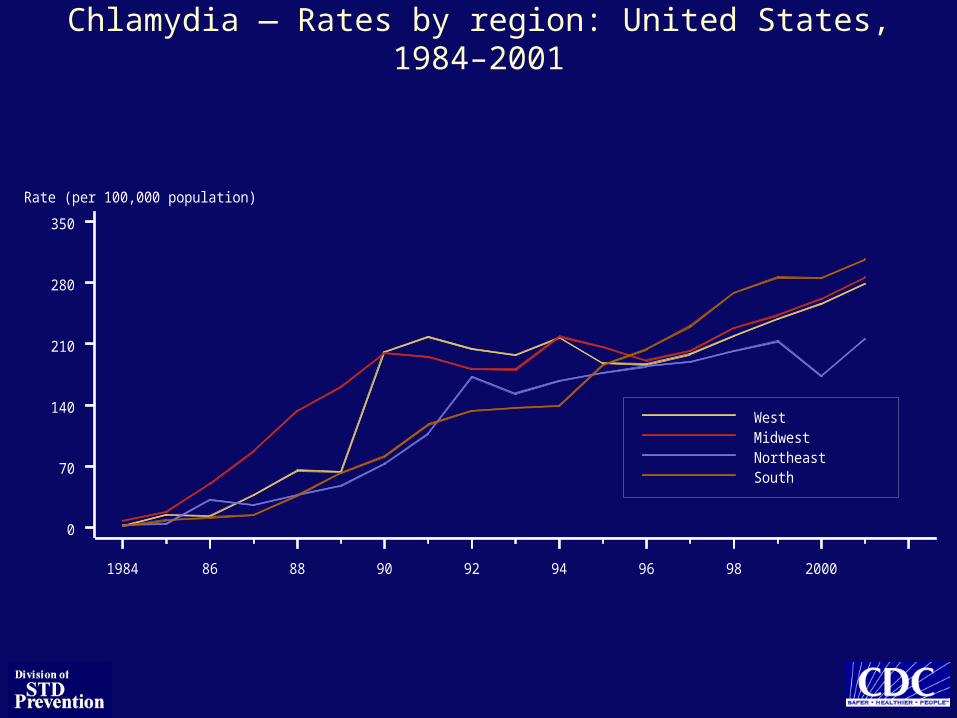
Chlamydia — Rates by region: United States, 1984–2001
Rate (per 100,000 population)
WestMidwestNortheastSouth
0
70
140
210
280
350
1984 86 88 90 92 94 96 98 2000

Chlamydia — Rates by sex: United States, 1984–2001
Rate (per 100,000 population)
MenWomen
0
90
180
270
360
450
1984 86 88 90 92 94 96 98 2000

Chlamydia — Age- and sex-specific rates: United States, 2001
Men Rate (per 100,000 population) Women
Age3,000 2,400 1,800 1,200 600 0 0 600 1,200 1,800 2,400 3,000
Total 65+55-6445-5440-4435-3930-3425-2920-2415-1910-14 9.9
Men Rate (per 100,000 population) Women
Age3,000 2,400 1,800 1,200 600 0 0 600 1,200 1,800 2,400 3,000
Total 65+55-6445-5440-4435-3930-3425-2920-2415-1910-14
375.9
Men Rate (per 100,000 population) Women
Age3,000 2,400 1,800 1,200 600 0 0 600 1,200 1,800 2,400 3,000
Total 65+55-6445-5440-4435-3930-3425-2920-2415-1910-14
604.9
Men Rate (per 100,000 population) Women
Age3,000 2,400 1,800 1,200 600 0 0 600 1,200 1,800 2,400 3,000
Total 65+55-6445-5440-4435-3930-3425-2920-2415-1910-14
284.7
Men Rate (per 100,000 population) Women
Age3,000 2,400 1,800 1,200 600 0 0 600 1,200 1,800 2,400 3,000
Total 65+55-6445-5440-4435-3930-3425-2920-2415-1910-14
140.4
Men Rate (per 100,000 population) Women
Age3,000 2,400 1,800 1,200 600 0 0 600 1,200 1,800 2,400 3,000
Total 65+55-6445-5440-4435-3930-3425-2920-2415-1910-14
70.3
Men Rate (per 100,000 population) Women
Age3,000 2,400 1,800 1,200 600 0 0 600 1,200 1,800 2,400 3,000
Total 65+55-6445-5440-4435-3930-3425-2920-2415-1910-14
37.1
Men Rate (per 100,000 population) Women
Age3,000 2,400 1,800 1,200 600 0 0 600 1,200 1,800 2,400 3,000
Total 65+55-6445-5440-4435-3930-3425-2920-2415-1910-14
15.9
Men Rate (per 100,000 population) Women
Age3,000 2,400 1,800 1,200 600 0 0 600 1,200 1,800 2,400 3,000
Total 65+55-6445-5440-4435-3930-3425-2920-2415-1910-14
5.5
Men Rate (per 100,000 population) Women
Age3,000 2,400 1,800 1,200 600 0 0 600 1,200 1,800 2,400 3,000
Total 65+55-6445-5440-4435-3930-3425-2920-2415-1910-14
2.2
Men Rate (per 100,000 population) Women
Age3,000 2,400 1,800 1,200 600 0 0 600 1,200 1,800 2,400 3,000
Total 65+55-6445-5440-4435-3930-3425-2920-2415-1910-14
114.2
Men Rate (per 100,000 population) Women
Age3,000 2,400 1,800 1,200 600 0 0 600 1,200 1,800 2,400 3,000
Total 65+55-6445-5440-4435-3930-3425-2920-2415-1910-14 139.8
Men Rate (per 100,000 population) Women
Age3,000 2,400 1,800 1,200 600 0 0 600 1,200 1,800 2,400 3,000
Total 65+55-6445-5440-4435-3930-3425-2920-2415-1910-14
2,536.1
Men Rate (per 100,000 population) Women
Age3,000 2,400 1,800 1,200 600 0 0 600 1,200 1,800 2,400 3,000
Total 65+55-6445-5440-4435-3930-3425-2920-2415-1910-14
2,447.0
Men Rate (per 100,000 population) Women
Age3,000 2,400 1,800 1,200 600 0 0 600 1,200 1,800 2,400 3,000
Total 65+55-6445-5440-4435-3930-3425-2920-2415-1910-14
824.6
Men Rate (per 100,000 population) Women
Age3,000 2,400 1,800 1,200 600 0 0 600 1,200 1,800 2,400 3,000
Total 65+55-6445-5440-4435-3930-3425-2920-2415-1910-14
301.9
Men Rate (per 100,000 population) Women
Age3,000 2,400 1,800 1,200 600 0 0 600 1,200 1,800 2,400 3,000
Total 65+55-6445-5440-4435-3930-3425-2920-2415-1910-14
119.1
Men Rate (per 100,000 population) Women
Age3,000 2,400 1,800 1,200 600 0 0 600 1,200 1,800 2,400 3,000
Total 65+55-6445-5440-4435-3930-3425-2920-2415-1910-14
51.4
Men Rate (per 100,000 population) Women
Age3,000 2,400 1,800 1,200 600 0 0 600 1,200 1,800 2,400 3,000
Total 65+55-6445-5440-4435-3930-3425-2920-2415-1910-14
18.1
Men Rate (per 100,000 population) Women
Age3,000 2,400 1,800 1,200 600 0 0 600 1,200 1,800 2,400 3,000
Total 65+55-6445-5440-4435-3930-3425-2920-2415-1910-14
5.1
Men Rate (per 100,000 population) Women
Age3,000 2,400 1,800 1,200 600 0 0 600 1,200 1,800 2,400 3,000
Total 65+55-6445-5440-4435-3930-3425-2920-2415-1910-14
2.9
Men Rate (per 100,000 population) Women
Age3,000 2,400 1,800 1,200 600 0 0 600 1,200 1,800 2,400 3,000
Total 65+55-6445-5440-4435-3930-3425-2920-2415-1910-14
436.3

Chlamydia — Positivity among 15-24 year old women tested in family planning clinics by state: United States and outlying areas,
2001
Positivity (%)
<44.0-4.9>=5
VT 3.4 NH 5.9 MA 5.2 RI 7.0 CT 5.0 NJ 6.3 DE 5.8 MD 5.1 DC 6.1
Puerto Rico 6.1 Virgin Is. 13.9
(n= 8)(n= 8)(n= 37)
7.7
3.7
5.6 6.6
6.5 5.0
5.5
8.3
5.4
4.4
7.0 5.4
4.3
4.1 3.9
10.8
3.1
5.5
4.3
13.5
4.3
5.8
3.8 7.5
6.7
5.2
6.9
3.2
5.7
6.0
4.0
5.6
7.6
3.4
4.9
8.4
5.1
8.1
6.2
2.7
7.5
4.2
Note: States reported chlamydia positivity data on at least 500 women aged 15-24 years screened during 2001.
SOURCE: Regional Infertility Prevention Program; Office of Population Affairs; Local and State STD Control Programs; Centers for Disease Control and Prevention

Chlamydia — Trends in positivity among 15-44 year old women tested in family planning clinics by HHS regions, 1988–2001
Note: Trends adjusted for changes in laboratory test method and associated increases in test sensitivity. No data on laboratory test method available for Region VII in 1995 and Regions IV and V in 1996.
SOURCE: Regional Infertility Prevention Program; Office of Population Affairs; Local and State STD Control Programs; Centers for Disease Control and Prevention
IX
XVIII
VII
VI
V
IV
III
III
Region IRegion II
Region III
Region IV
Region V
Region VIRegion VII
Region VIII
Region IX
Region X 97 98 99 00 01
5.7 6.2 6.2 6.47.3
96 97 98 99 00 01
6.74.9 4.6 4.1 4.9 5.1
96 97 98 99 00 019594
7.46.0 5.3 5.6 6.0 6.3 6.0 5.5
97 98 99 00 01
8.910.1 9.5
8.6 8.5
97 98 99 00 01
5.6
7.5 7.2 7.1 6.6
96 97 98 99 00 01
8.4 8.9 9.78.7 8.8 8.5
96 97 98 99 00 01
4.9 4.7 5.4 5.3 5.5 5.4
96 97 98 99 00 0194 95
6.05.0 4.6 4.6 5.3 5.4 5.6 6.0
96 97 98 99 00 01
5.1 5.25.9 6.3 6.2 6.3
96 97 98 99 00 0194 95939291908988
13.0
10.0 9.58.0
6.75.0 4.7 4.1 3.9 3.9 4.6 4.9 5.3 5.3

Gonorrhea
Sexually Transmitted Disease Surveillance 2001
Division of STD Prevention

Gonorrhea — Reported rates: United States, 1970–2001 and the Healthy People year 2010 objective
R ate (per 100,000 population)
G onorrhea2010 O bjective
0
100
200
300
400
500
1970 73 76 79 82 85 88 91 94 97 2000
Note: The Healthy People 2010 (HP2010) objective for gonorrhea is 19.0 cases per 100,000 population.

Gonorrhea — Rates by state: United States and outlying areas, 2001
Note: The total rate of gonorrhea for the United States and outlying areas (including Guam, Puerto Rico and Virgin Islands) was 126.9 per 100,000 population. The Healthy People year 2010 objective is 19.0 per 100,000 population.
R ate per 100,000popu la tion
<2020-100>100
V T 12 .5 N H 14 .2 M A 50 .6 R I 79 .2 C T 74 .8 N J 106 .0 D E 221 .2 M D 178 .0
Guam 31.0
P uerto R ico 15 .5 V irg in Is . 31 .3
(n= 9 )(n= 21)(n= 23)
251.4
72 .9
76 .4172.2
68 .8 74 .2
134.7
231.1
49 .9
5 .9
193.4 114.7
48 .5
99 .3 88 .8
274.2
11 .1
172.3
54 .9
272.8
155.9
11 .5
69 .5 87 .9
57 .2
117.5
206.0
8 .7
186.4
138.6
33 .4
116.0
269.3
38 .3
178.3
144.0
9 .8
156.7
50 .7
40 .5
112.1
15 .6

Gonorrhea — Rates by region: United States, 1981–2001 and the Healthy People year 2010 objective
R ate (per 100,000 population)
W estM idw estN ortheastSouth2010 O bjective
0
120
240
360
480
600
1981 83 85 87 89 91 93 95 97 99 2001

Gonorrhea — Rates by sex: United States, 1981–2001 and the Healthy People year 2010 objective
R ate (per 100,000 population)
M aleFem ale2010 O bjective
0
120
240
360
480
600
1981 83 85 87 89 91 93 95 97 99 2001

Gonorrhea — Rates by race and ethnicity: United States, 1981–2001 and the Healthy People year 2010 objective
R ate (per 100,000 population)
W hiteB lackH ispan icAsian/Pac Is lAm Ind /AK N at2010 O bjective
0
500
1,000
1,500
2,000
2,500
1981 83 85 87 89 91 93 95 97 99 2001

Gonorrhea — Age- and sex-specific rates: United States, 2001
M en R ate (per 100,000 population) W om en
Age750 600 450 300 150 0 0 150 300 450 600 750
Tota l 65+
55-64
45-5440-4435-39
30-3425-2920-2415-19
10-148.2
M en R ate (per 100,000 population) W om en
Age750 600 450 300 150 0 0 150 300 450 600 750
Tota l 65+
55-64
45-5440-4435-39
30-3425-2920-2415-19
10-14307.5
M en R ate (per 100,000 population) W om en
Age750 600 450 300 150 0 0 150 300 450 600 750
Tota l 65+
55-64
45-5440-4435-39
30-3425-2920-2415-19
10-14
563.6
M en R ate (per 100,000 population) W om en
Age750 600 450 300 150 0 0 150 300 450 600 750
Tota l 65+
55-64
45-5440-4435-39
30-3425-2920-2415-19
10-14
328.4
M en R ate (per 100,000 population) W om en
Age750 600 450 300 150 0 0 150 300 450 600 750
Tota l 65+
55-64
45-5440-4435-39
30-3425-2920-2415-19
10-14
203.9
M en R ate (per 100,000 population) W om en
Age750 600 450 300 150 0 0 150 300 450 600 750
Tota l 65+
55-64
45-5440-4435-39
30-3425-2920-2415-19
10-14
134.3
M en R ate (per 100,000 population) W om en
Age750 600 450 300 150 0 0 150 300 450 600 750
Tota l 65+
55-64
45-5440-4435-39
30-3425-2920-2415-19
10-14
90.5
M en R ate (per 100,000 population) W om en
Age750 600 450 300 150 0 0 150 300 450 600 750
Tota l 65+
55-64
45-5440-4435-39
30-3425-2920-2415-19
10-14
46.8
M en R ate (per 100,000 population) W om en
Age750 600 450 300 150 0 0 150 300 450 600 750
Tota l 65+
55-64
45-5440-4435-39
30-3425-2920-2415-19
10-14
17.2
M en R ate (per 100,000 population) W om en
Age750 600 450 300 150 0 0 150 300 450 600 750
Tota l 65+
55-64
45-5440-4435-39
30-3425-2920-2415-19
10-14
4.5
M en R ate (per 100,000 population) W om en
Age750 600 450 300 150 0 0 150 300 450 600 750
Tota l 65+
55-64
45-5440-4435-39
30-3425-2920-2415-19
10-14
128.6
M en R ate (per 100,000 population) W om en
Age750 600 450 300 150 0 0 150 300 450 600 750
Tota l 65+
55-64
45-5440-4435-39
30-3425-2920-2415-19
10-14 51.8
M en R ate (per 100,000 population) W om en
Age750 600 450 300 150 0 0 150 300 450 600 750
Tota l 65+
55-64
45-5440-4435-39
30-3425-2920-2415-19
10-14703.2
M en R ate (per 100,000 population) W om en
Age750 600 450 300 150 0 0 150 300 450 600 750
Tota l 65+
55-64
45-5440-4435-39
30-3425-2920-2415-19
10-14
664.1
M en R ate (per 100,000 population) W om en
Age750 600 450 300 150 0 0 150 300 450 600 750
Tota l 65+
55-64
45-5440-4435-39
30-3425-2920-2415-19
10-14
249.4
M en R ate (per 100,000 population) W om en
Age750 600 450 300 150 0 0 150 300 450 600 750
Tota l 65+
55-64
45-5440-4435-39
30-3425-2920-2415-19
10-14
112.7
M en R ate (per 100,000 population) W om en
Age750 600 450 300 150 0 0 150 300 450 600 750
Tota l 65+
55-64
45-5440-4435-39
30-3425-2920-2415-19
10-14
57.8
M en R ate (per 100,000 population) W om en
Age750 600 450 300 150 0 0 150 300 450 600 750
Tota l 65+
55-64
45-5440-4435-39
30-3425-2920-2415-19
10-14
31.2
M en R ate (per 100,000 population) W om en
Age750 600 450 300 150 0 0 150 300 450 600 750
Tota l 65+
55-64
45-5440-4435-39
30-3425-2920-2415-19
10-14
9.4
M en R ate (per 100,000 population) W om en
Age750 600 450 300 150 0 0 150 300 450 600 750
Tota l 65+
55-64
45-5440-4435-39
30-3425-2920-2415-19
10-14
2.0
M en R ate (per 100,000 population) W om en
Age750 600 450 300 150 0 0 150 300 450 600 750
Tota l 65+
55-64
45-5440-4435-39
30-3425-2920-2415-19
10-14
0.9
M en R ate (per 100,000 population) W om en
Age750 600 450 300 150 0 0 150 300 450 600 750
Tota l 65+
55-64
45-5440-4435-39
30-3425-2920-2415-19
10-14
128.5

Gonorrhea — Positivity among 15-24 year old women tested in family planning clinics by state: United States and outlying areas,
2001
P ositiv ity (% )
S ee *<11.0-1 .9>=2
VT 0 .2 N H 0 .4 M A R I C T 1 .0 N J 1 .3 D E M D D C 1 .3
P uerto R ico 0 .1 V irg in Is . 1 .6
(n= 16 )(n= 17 )(n= 15 )(n= 5)
1 .9
0 .2
1 .6
1 .1 0 .3
1 .2
2 .2
0 .1
1 .7 0 .8
0 .9
0 .7 0 .5
2 .9
1 .2
3 .2
0 .8
1 .1
0 .5 2 .3
0 .4
1 .0
0 .8 1 .3
0 .7
1 .3
0 .4 2 .5
1 .7
0 .9
*States reported gonorrhea positivity data on less than 500 women aged 15-24 years during 2001.
SOURCE: Regional Infertility Prevention Program; Office of Population Affairs; Local and State STD Control Programs; Centers for Disease Control and Prevention

Gonococcal Isolate Surveillance Project (GISP) — Location of participating clinics and regional laboratories: United States, 2001
Tripler AMC

Gonococcal Isolate Surveillance Project (GISP) — Penicillin and tetracycline resistance among GISP isolates, 2001
Note: PPNG=penicillinase-producing N. gonorrhoeae; TRNG=plasmid-mediated tetracycline resistant N. gonorrhoeae; PPNG-TRNG=plasmid-mediated penicillin and tetracycline resistant N. gonorrhoeae; PenR=chromosomally mediated penicillin resistant N. gonorrhoeae; TetR=chromosomally mediated tetracycline resistant N. gonorrhoeae; CMRNG=chromosomally mediated penicillin and tetracycline resistant N. gonorrhoeae.
S usceptib le
P P N G
TR N G
P P N G /TR N G
P enR
TetR
C M R N G
79.1%
1.5%
5.2%
0.5%2.9%
4.4%
6.4%

Gonococcal Isolate Surveillance Project (GISP) — Percent of Neisseria gonorrhoeae isolates with resistance or intermediate
resistance to ciprofloxacin, 1990–2001
Note: Resistant isolates have ciprofloxacin MICs >1 g/mL. Isolates with intermediate resistance have ciprofloxacin MICs of 0.125 - 0.5 g/mL. Susceptibility to ciprofloxacin was first measured in GISP in 1990.
Percent
R esistance
Interm ediate resistance
0.0
0.6
1.2
1.8
2.4
3.0
1990 91 92 93 94 95 96 97 98 99 2000 01

Gonococcal Isolate Surveillance Project (GISP) — Percent of men with gonorrhea who had a previous gonorrhea infection, 1991–2001
Percent
Ever*Last 12 m onths**
0
10
20
30
40
50
1991 92 93 94 95 96 97 98 99 2000 01
*Data first collected in 1991.
**Data first collected in 1992.

Syphilis
Sexually Transmitted Disease Surveillance 2001
Division of STD Prevention

Syphilis — Reported cases by stage of illness: United States, 1941–2001
Thousands of cases
P&SEarly LatentTotal Syphilis
0
120
240
360
480
600
1941 46 51 56 61 66 71 76 81 86 91 96 2001

Primary and secondary syphilis — Reported rates: United States, 1970–2001 and the Healthy People year 2010 objective
Rate (per 100,000 population)
P&S Syphilis2010 Objective
0
5
10
15
20
25
1970 73 76 79 82 85 88 91 94 97 2000
Note: The Healthy People 2010 (HP2010) objective for primary and secondary syphilis is 0.2 case per 100,000 population.

Primary and secondary syphilis — Rates by state: United States and outlying areas, 2001
Note: The total rate of primary and secondary syphilis for the United States and outlying areas (including Guam, Puerto Rico and Virgin Islands) was 2.2 per 100,000 population. The Healthy People year 2010 objective is 0.2 per 100,000 population.
Rate per 100,000population
<=.2.21-4>4
VT 0.5 NH 0.1 MA 0.7 RI 0.9 CT 0.4 NJ 1.6 DE 1.8 MD 5.0
Guam 7.8
Puerto Rico 6.4 Virgin Is. 0.0
(n= 10)(n= 34)(n= 9)
3.2
0.0
3.5 1.8
1.6 0.5
3.0
5.1
1.0
0.1
3.3 2.5
0.2
0.9 1.2
3.9
0.1
4.3
0.7
4.9
0.5
0.0
0.6 0.4
1.0
1.6
5.5
0.0
0.7
1.7
0.4
0.8
5.9
0.1
5.8
2.3
0.5
1.4
1.0
0.3
0.4
0.2

Primary and secondary syphilis — Counties with rates above and counties with rates below the Healthy People year 2010 objective:
United States, 2001
Rate per 100,000Population
<=0.2>0.2
(n=2,533)(n=606)

Primary and secondary syphilis — Rates by region: United States, 1981–2001 and the Healthy People year 2010 objective
Rate (per 100,000 population)
WestMidwestNortheastSouth2010 Objective
0
10
20
30
40
50
1981 83 85 87 89 91 93 95 97 99 2001

Primary and secondary syphilis — Rates by sex: United States, 1981–2001 and the Healthy People year 2010 objective
Rate (per 100,000 population)
MaleFemale2010 Objective
0
5
10
15
20
25
1981 83 85 87 89 91 93 95 97 99 2001

Primary and secondary syphilis — Rates by race and ethnicity: United States, 1981–2001 and the Healthy People year 2010
objective
Rate (per 100,000 population)
WhiteBlackHispanicAsian/Pac IslAm Ind/AK Nat2010 Objective
0
30
60
90
120
150
1981 83 85 87 89 91 93 95 97 99 2001

Primary and secondary syphilis — Male to female rate ratios: United States, 1981–2001
Male-Female rate ratio
0
1:1
2:1
3:1
4:1
5:1
1981 83 85 87 89 91 93 95 97 99 2001

Primary and secondary syphilis — Age- and sex-specific rates: United States, 2001
Men Rate (per 100,000 population) Women
Age7.5 6.0 4.5 3.0 1.5 0.0 0.0 1.5 3.0 4.5 6.0 7.5
Total 65+55-6445-5440-4435-3930-3425-2920-2415-1910-140.0
Men Rate (per 100,000 population) Women
Age7.5 6.0 4.5 3.0 1.5 0.0 0.0 1.5 3.0 4.5 6.0 7.5
Total 65+55-6445-5440-4435-3930-3425-2920-2415-1910-14
1.4
Men Rate (per 100,000 population) Women
Age7.5 6.0 4.5 3.0 1.5 0.0 0.0 1.5 3.0 4.5 6.0 7.5
Total 65+55-6445-5440-4435-3930-3425-2920-2415-1910-14
5.0
Men Rate (per 100,000 population) Women
Age7.5 6.0 4.5 3.0 1.5 0.0 0.0 1.5 3.0 4.5 6.0 7.5
Total 65+55-6445-5440-4435-3930-3425-2920-2415-1910-14
5.9
Men Rate (per 100,000 population) Women
Age7.5 6.0 4.5 3.0 1.5 0.0 0.0 1.5 3.0 4.5 6.0 7.5
Total 65+55-6445-5440-4435-3930-3425-2920-2415-1910-14
6.4
Men Rate (per 100,000 population) Women
Age7.5 6.0 4.5 3.0 1.5 0.0 0.0 1.5 3.0 4.5 6.0 7.5
Total 65+55-6445-5440-4435-3930-3425-2920-2415-1910-14
7.2
Men Rate (per 100,000 population) Women
Age7.5 6.0 4.5 3.0 1.5 0.0 0.0 1.5 3.0 4.5 6.0 7.5
Total 65+55-6445-5440-4435-3930-3425-2920-2415-1910-14
5.3
Men Rate (per 100,000 population) Women
Age7.5 6.0 4.5 3.0 1.5 0.0 0.0 1.5 3.0 4.5 6.0 7.5
Total 65+55-6445-5440-4435-3930-3425-2920-2415-1910-14
3.4
Men Rate (per 100,000 population) Women
Age7.5 6.0 4.5 3.0 1.5 0.0 0.0 1.5 3.0 4.5 6.0 7.5
Total 65+55-6445-5440-4435-3930-3425-2920-2415-1910-14
1.4
Men Rate (per 100,000 population) Women
Age7.5 6.0 4.5 3.0 1.5 0.0 0.0 1.5 3.0 4.5 6.0 7.5
Total 65+55-6445-5440-4435-3930-3425-2920-2415-1910-14
0.4
Men Rate (per 100,000 population) Women
Age7.5 6.0 4.5 3.0 1.5 0.0 0.0 1.5 3.0 4.5 6.0 7.5
Total 65+55-6445-5440-4435-3930-3425-2920-2415-1910-14
3.0
Men Rate (per 100,000 population) Women
Age7.5 6.0 4.5 3.0 1.5 0.0 0.0 1.5 3.0 4.5 6.0 7.5
Total 65+55-6445-5440-4435-3930-3425-2920-2415-1910-14 0.2
Men Rate (per 100,000 population) Women
Age7.5 6.0 4.5 3.0 1.5 0.0 0.0 1.5 3.0 4.5 6.0 7.5
Total 65+55-6445-5440-4435-3930-3425-2920-2415-1910-14
2.5
Men Rate (per 100,000 population) Women
Age7.5 6.0 4.5 3.0 1.5 0.0 0.0 1.5 3.0 4.5 6.0 7.5
Total 65+55-6445-5440-4435-3930-3425-2920-2415-1910-14
3.8
Men Rate (per 100,000 population) Women
Age7.5 6.0 4.5 3.0 1.5 0.0 0.0 1.5 3.0 4.5 6.0 7.5
Total 65+55-6445-5440-4435-3930-3425-2920-2415-1910-14
3.1
Men Rate (per 100,000 population) Women
Age7.5 6.0 4.5 3.0 1.5 0.0 0.0 1.5 3.0 4.5 6.0 7.5
Total 65+55-6445-5440-4435-3930-3425-2920-2415-1910-14
3.0
Men Rate (per 100,000 population) Women
Age7.5 6.0 4.5 3.0 1.5 0.0 0.0 1.5 3.0 4.5 6.0 7.5
Total 65+55-6445-5440-4435-3930-3425-2920-2415-1910-14
2.9
Men Rate (per 100,000 population) Women
Age7.5 6.0 4.5 3.0 1.5 0.0 0.0 1.5 3.0 4.5 6.0 7.5
Total 65+55-6445-5440-4435-3930-3425-2920-2415-1910-14
2.0
Men Rate (per 100,000 population) Women
Age7.5 6.0 4.5 3.0 1.5 0.0 0.0 1.5 3.0 4.5 6.0 7.5
Total 65+55-6445-5440-4435-3930-3425-2920-2415-1910-14
0.9
Men Rate (per 100,000 population) Women
Age7.5 6.0 4.5 3.0 1.5 0.0 0.0 1.5 3.0 4.5 6.0 7.5
Total 65+55-6445-5440-4435-3930-3425-2920-2415-1910-14
0.2
Men Rate (per 100,000 population) Women
Age7.5 6.0 4.5 3.0 1.5 0.0 0.0 1.5 3.0 4.5 6.0 7.5
Total 65+55-6445-5440-4435-3930-3425-2920-2415-1910-14
0.0
Men Rate (per 100,000 population) Women
Age7.5 6.0 4.5 3.0 1.5 0.0 0.0 1.5 3.0 4.5 6.0 7.5
Total 65+55-6445-5440-4435-3930-3425-2920-2415-1910-14
1.4

Congenital syphilis — Reported cases for infants <1 year of age and rates of primary and secondary syphilis among women:
United States, 1970–2001
Kaufman Criteria
CDC SurveillanceDefinition
P&S rate (per 100,000 population) CS cases (in thousands)
P&S Syphilis
CongenitalSyphilis
0
4
8
12
16
20
1970 75 80 85 90 95 2000
0.0
1.5
3.0
4.5
6.0
7.5
Note: The surveillance case definition for congenital syphilis changed in 1988.

Congenital syphilis — Rates for infants <1 year of age: United States, 1981–2001 and the Healthy People year 2010 objective
Rate (per 100,000 live births)
Cong. Syphilis2010 Objective
0
25
50
75
100
125
1981 83 85 87 89 91 93 95 97 99 2001
Note: The Healthy People 2010 (HP2010) objective for primary and secondary syphilis is 0.2 case per 100,000 population. The surveillance case definition for congenital syphilis changed in 1988.

Other Sexually Transmitted Diseases
Sexually Transmitted Disease Surveillance 2001
Division of STD Prevention

Chancroid — Reported cases: United States, 1981–2001
Cases (in thousands)
0
1
2
3
4
5
1981 83 85 87 89 91 93 95 97 99 2001

Genital herpes — Initial visits to physicians’ offices: United States, 1966–2001
Visits (in thousands)
0
50
100
150
200
250
1966 69 72 75 78 81 84 87 90 93 96 99
SOURCE: National Disease and Therapeutic Index (IMS America, Ltd.)

Genital herpes simplex virus type 2 infections — Percent seroprevalence according to age in NHANES* II (1976-1980) and
NHANES III (1988-1994)
Percent
NHANES IINHANES III
0
8
16
24
32
40
Age Group
12-19 20-29 30-39 40-49 50-59 60-69 70+
Note: Bars indicate 95% confidence intervals.
*National Health and Nutrition Examination Survey

Genital warts — Initial visits to physicians’ offices: United States, 1966–2001
Visits (in thousands)
0
80
160
240
320
400
1966 69 72 75 78 81 84 87 90 93 96 99
SOURCE: National Disease and Therapeutic Index (IMS America, Ltd.)

Nonspecific urethritis — Initial visits to physicians’ offices by men:United States, 1966–2001
Visits (in thousands)
0
80
160
240
320
400
1966 69 72 75 78 81 84 87 90 93 96 99
SOURCE: National Disease and Therapeutic Index (IMS America, Ltd.)

Trichomonal and other vaginal infections — Initial visits to physicians’ offices: United States, 1966–2001
Visits (in thousands)
TrichomonalOther Vaginitis
0
900
1,800
2,700
3,600
4,500
1966 69 72 75 78 81 84 87 90 93 96 99
SOURCE: National Disease and Therapeutic Index (IMS America, Ltd.)

STDs in Women and Infants
Sexually Transmitted Disease Surveillance 2001
Division of STD Prevention

Chlamydia — Rates for women by state: United States and outlying areas, 2001
Note: The total rate of chlamydia for women in the United States and outlying areas (including Guam, Puerto Rico and Virgin Islands) was 430.8 per 100,000 population.
Rate per 100,000population
<=150150.1-300>300
VT 168.4 NH 165.9 MA 240.0 RI 403.4 CT 356.4 NJ 331.3 DE 527.2 MD 469.7
Guam 458.8
Puerto Rico 117.1Virgin Is. 204.4
(n= 1)(n= 13)(n= 39)
581.4
654.2
435.6434.6
448.7 463.4
374.4
670.9
506.4
227.6
522.5 376.6
288.1
366.0342.7
625.1
158.9
484.7
242.0
697.3
412.3
323.8
290.5365.8
528.9
389.6
453.6
222.6
505.4
490.1
315.5
354.6
655.7
344.7
414.7
548.7
190.2
420.8
343.2
211.9
443.7
276.7

Gonorrhea — Rates for women by state: United States and outlying areas, 2001
Note: The total rate of gonorrhea for women in the United States and outlying areas (including Guam, Puerto Rico and Virgin Islands) was 126.6 per 100,000 population. The Healthy People year 2010 objective is 19.0 per 100,000 population for women.
Rate per 100,000population
<2020-100>100
VT 13.5 NH 15.3 MA 48.4 RI 89.6 CT 80.3 NJ 104.4 DE 248.6 MD 167.6
Guam 29.1
Puerto Rico 14.1 Virgin Is. 35.2
(n= 9)(n= 20)(n= 24)
248.3
80.6
66.2175.6
61.5 74.4
126.8
230.6
48.4
6.0
192.1 122.4
51.4
107.9 87.7
262.6
8.4
178.8
58.8
317.0
157.9
12.6
77.3 77.6
51.0
120.8
190.2
9.3
192.7
152.2
26.0
123.9
248.5
43.7
164.7
148.6
8.5
152.1
44.0
45.0
135.3
17.5

Primary and secondary syphilis — Rates for women by state: United States and outlying areas, 2001
Note: The total rate of primary and secondary syphilis for women in the United States and outlying areas (including Guam, Puerto Rico and Virgin Islands) was 1.4 per 100,000 population. The Healthy People year 2010 objective is 0.2 per 100,000 population.
Rate per 100,000population
<=.2.21-4>4
VT 0.0 NH 0.0 MA 0.1 RI 0.0 CT 0.1 NJ 1.0 DE 1.2 MD 4.1
Guam 6.6
Puerto Rico 6.6 Virgin Is. 0.0
(n= 22)(n= 24)(n= 7)
2.9
0.0
1.92.0
0.2 0.2
1.6
3.1
0.0
0.0
1.4 2.3
0.1
0.8 0.8
3.6
0.0
3.2
0.6
4.7
0.3
0.0
0.9 0.1
0.6
0.2
4.7
0.0
0.4
1.6
0.1
0.4
4.9
0.0
5.4
1.6
0.2
1.2
0.2
0.1
0.5
0.4

Congenital syphilis — Rates for infants <1 year of age by state: United States and outlying areas, 2001
Note: The total rate of congenital syphilis for infants <1 year of age for the United States and outlying areas (including Guam, Puerto Rico and Virgin Islands) was 11.5 per 100,000 live births. The Healthy People year 2010 objective is 1.0 per 100,000 live births.
Rate per 100,000live births
<11-40>40
VT 0.0 NH 0.0 MA 2.5 RI 0.0 CT 4.6 NJ 28.0 DE 0.0 MD 5.6
Guam 24.9
Puerto Rico 35.3 Virgin Is. 59.8
(n= 24)(n= 28)(n= 1)
9.7
0.0
35.7 16.3
11.4 1.6
18.8
14.2
0.0
0.0
22.0 15.1
0.0
5.2 1.8
0.0
0.0
3.0
0.0
21.1
6.6
0.0
0.00.0
0.0
12.9
16.7
0.0
0.7
10.2
0.0
2.8
29.1
0.0
18.0
20.9
0.0
2.1
0.0
0.0
0.0
0.0

Congenital syphilis — Cases by prenatal care utilization: United States, 1995-2001
Cases
Prenatal
No prenatal
Unknown
0
240
480
720
960
1,200
1995 1996 1997 1998 1999 2000 2001

Chlamydia — Positivity among 15-24 year old women tested in prenatal clinics by state: United States and outlying areas, 2001
Positivity (%)
See *<55.0-9.9>=10
VT NH MA RI CT NJ DE 8.7 MD 3.9 DC
Puerto Rico 8.9 Virgin Is.
(n= 30)(n= 6)(n= 13)(n= 4)
11.0
8.0
6.6
7.7
4.8
7.1 3.8
13.5
13.5
7.1
5.4 3.7
7.5
8.1
7.4
4.5
8.6
6.7
11.1 4.4
*States not reporting chlamydia positivity data in prenatal clinics.Note: States reported chlamydia positivity data on at least 100 women aged 15-24 years during 2001.
SOURCE: Regional Infertility Prevention Program; Office of Population Affairs; Local and State STD Control Programs; Centers for Disease Control and Prevention

Gonorrhea — Positivity among 15-24 year old women tested in prenatal clinics by state: United States and outlying areas, 2001
Positivity (%)
See *<11.0-1.9>=2
VT NH MA RI CT NJ DE MD DC
Puerto Rico Virgin Is.
(n= 37)(n= 9)(n= 2)(n= 5)
2.7
1.3
0.7
1.5
0.9 0.6
3.9
3.1
0.4
0.80.0
0.2 0.9
2.0
0.7
4.3
*States not reporting gonorrhea positivity data in prenatal clinics.Note: States reported gonorrhea positivity data on at least 100 women aged 15-24 years during 2001.
SOURCE: Regional Infertility Prevention Program; Office of Population Affairs; Local and State STD Control Programs; Centers for Disease Control and Prevention

Ectopic pregnancy — Hospitalizations of women 15-44 years of age: United States, 1980-2000
Ectopic Pregnancies (in thousands)
0
20
40
60
80
100
1980 82 84 86 88 90 92 94 96 98 2000
Note: Some variations in 1981 and 1988 numbers may be due to changes in sampling procedures. The relative standard error for these estimates ranges from 8% to 11%.
SOURCE: National Hospital Discharge Survey (National Center for Health Statistics, CDC)

Pelvic inflammatory disease — Hospitalizations of women 15-44 years of age: United States, 1980–2000
Hospitalizations (in thousands)
Acute, Unspec.Chronic
0
40
80
120
160
200
1980 82 84 86 88 90 92 94 96 98 2000
Note: The relative standard error for the estimates of the overall total number of PID cases range from 6% to 9%.
SOURCE: National Hospital Discharge Survey (National Center for Health Statistics, CDC)

Pelvic inflammatory disease — Initial visits to physicians’ offices by women 15-44 years of age: United States, 1980–2001
Visits (in thousands)
0
100
200
300
400
500
1980 82 84 86 88 90 92 94 96 98 2000
SOURCE: National Disease and Therapeutic Index (IMS America, Ltd.)

STD’s in Adolescents and Young Adults
Sexually Transmitted Disease Surveillance 2001
Division of STD Prevention

Chlamydia — Positivity among women tested in family planning clinics by age group: Region X, 1988–2001
Percent
<18 Years18-19 Years20-24 Years25-29 Years30+ Years
0
3
6
9
12
15
1988 89 90 91 92 93 94 95 96 97 98 99 2000 01
Note: Women who met screening criteria were tested. Trends not adjusted for changes in laboratory test method and associated increases in test sensitivity in 1994 and 1999–2001.
SOURCE: Regional Infertility Prevention Program: Region X Chlamydia Project (Alaska, Idaho, Oregon and Washington)

Chlamydia — Prevalence among 16-24 year-old women entering the National Job Training Program by state of residence: United States
and outlying areas, 2001
Prevalence (%)
See *<1010.0-14.9>=15
VT NH MA 9.9 RI CT NJ 13.9 DE MD 13.4 DC
Puerto Rico 9.8 Virgin Is.
(n= 26)(n= 9)(n= 17)(n= 1)
13.8
11.2 13.7
7.6
13.2
12.8
9.5 5.1
10.3
8.8
10.6
18.0
10.1
9.6
11.8
10.7
10.3
6.2
11.5
12.3
13.5
10.1
9.6
*Fewer than 100 women residing in these states and entering the National Job Training Program were screened for chlamydia in 2001.Note: The overall chlamydia prevalence among female students entering the National Job Training Program in 2001 was 10.8%.
SOURCE: U.S. Department of Labor

Chlamydia — Adolescent Women Reproductive Health Monitoring Project chlamydia positivity by venue and project area, 2001
Note: Where data are missing for project areas and venues, no testing or fewer than 50 chlamydia tests were performed at the missing location in 2001.
Percent
Venues
Colorado
Connecticut
Minnesota
New York City
Wisconsin
0
8
16
24
32
40
-------- Schools -------- ------ Street Youth -----

Gonorrhea — Adolescent Women Reproductive Health Monitoring Project gonorrhea positivity by venue and project area, 2001
Note: Where data are missing for project areas and venues, no testing or fewer than 50 gonorrhea tests were performed in 2001.
Percent
Venues
Colorado
Connecticut
Minnesota
New York City
Wisconsin
0
3
6
9
12
15
-------- Schools -------- ------ Street Youth -----

Gonorrhea — Prevalence among 16-24 year-old women entering the National Job Training Program by state of residence: United States
and outlying areas, 2001
Prevalence (%)
See *<22.0-4.9>=5
VT NH MA 2.0 RI CT NJ DE MD DC
Puerto Rico 1.6 Virgin Is.
(n= 35)(n= 5)(n= 9)(n= 4)
8.1
2.4
0.8
5.3
6.1
3.6
4.6
4.8
3.8
1.4
4.6
5.9
1.1
4.1
3.1
0.7
*Fewer than 100 women residing in these states and entering the National Job Training Program were screened for gonorrhea by the national contract laboratory in 2001. Note: Many training centers test female students for gonorrhea using local laboratories; these results are not available to CDC. For this map, gonorrhea test results for students at centers submitting specimens to the national contract laboratory were included if the number of gonorrhea tests submitted was greater than 90% of the number of chlamydia tests submitted. The overall gonorrhea prevalence among female students entering the National Job Training Program in 2001 was 3.3%.
SOURCE: U.S. Department of Labor

Gonorrhea — Age-specific rates among women 10-44 years of age: United States, 1981–2001
Rate (per 100,000 population)
10-1415-1920-2425-2930-3435-3940-44
0
300
600
900
1,200
1,500
1981 83 85 87 89 91 93 95 97 99 2001

Gonorrhea — Age-specific rates among men 10-44 years of age: United States, 1981–2001
Rate (per 100,000 population)
10-1415-1920-2425-2930-3435-3940-44
0
400
800
1,200
1,600
2,000
1981 83 85 87 89 91 93 95 97 99 2001

Primary and secondary syphilis — Age-specific rates among women 10-44 years of age: United States, 1981–2001
Rate (per 100,000 population)
10-1415-1920-2425-2930-3435-3940-44
0
15
30
45
60
75
1981 83 85 87 89 91 93 95 97 99 2001

Primary and secondary syphilis — Age-specific rates among men 10-44 years of age: United States, 1981–2001
Rate (per 100,000 population)
10-1415-1920-2425-2930-3435-3940-44
0
15
30
45
60
75
1981 83 85 87 89 91 93 95 97 99 2001

STDs in Racial and Ethnic Minorities
Sexually Transmitted Disease Surveillance 2001
Division of STD Prevention

Chlamydia — Positivity among women tested in family planning clinics by race and ethnicity: Region X, 1988–2001
Percent
W hiteB lackH ispanicAsian/Pac IslAm Ind/AK N at
0
3
6
9
12
15
1988 89 90 91 92 93 94 95 96 97 98 99 2000 01
Note: Women who met screening criteria were tested. Trends not adjusted for changes in laboratory test method and associated increases in test sensitivity in 1994, 1999–2001.
SOURCE: Regional Infertility Prevention Program: Region X Chlamydia Project (Alaska, Idaho, Oregon and Washington)

Chlamydia — Positivity among 15-30 year old women tested in Indian Health Service Clinics by IHS areas, 2001
*IHS areas not reporting chlamydia positivity data during 2001. Note: Albuquerque Area - chlamydia positivity data reported for January-October only.
SOURCE: Indian Health Service
Navajo Area*
Albuquerque Area6.9
Tucson Area*
California Area*
Portland Area*
Alaska Area*
Phoenix Area*
BillingsArea10.0
AberdeenArea8.6 Bemidji Area*
Nashville Area*
Oklahoma City Area3.1
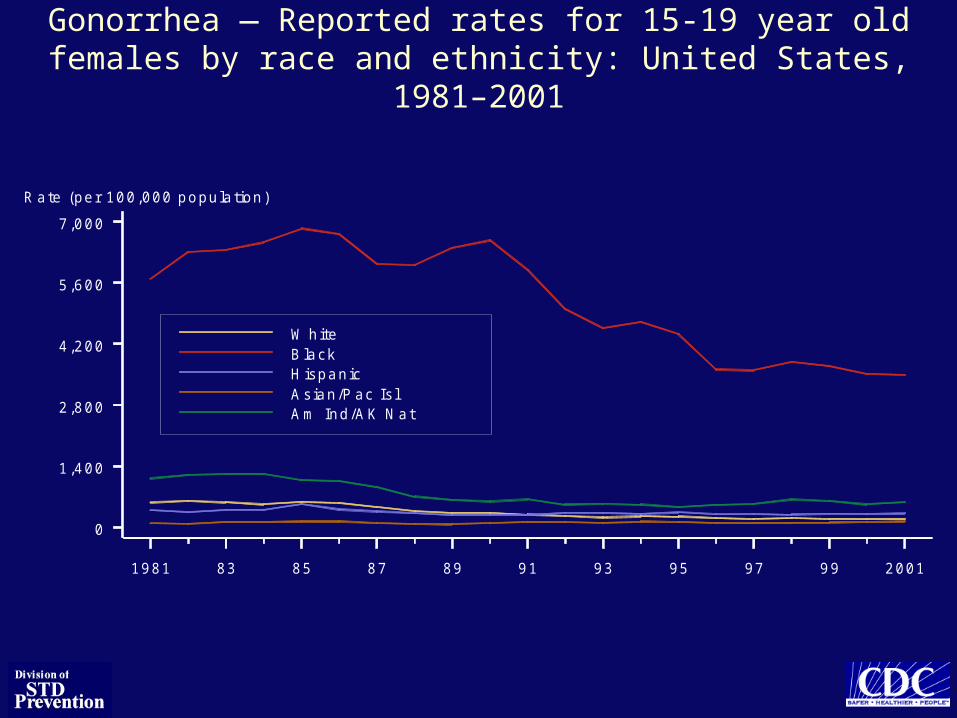
Gonorrhea — Reported rates for 15-19 year old females by race and ethnicity: United States, 1981–2001
R ate (per 100,000 population)
W hiteB lackH ispanicAsian/Pac Is lAm Ind/AK N at
0
1,400
2,800
4,200
5,600
7,000
1981 83 85 87 89 91 93 95 97 99 2001

Gonorrhea — Reported rates for 15-19 year old males by race and ethnicity: United States, 1981–2001
R ate (per 100,000 population)
W hiteB lackH ispanicAsian/Pac Is lAm Ind/AK N at
0
1,400
2,800
4,200
5,600
7,000
1981 83 85 87 89 91 93 95 97 99 2001

Primary and secondary syphilis — Reported rates for 15-19 year old females by race and ethnicity: United States, 1981–2001
R ate (per 100,000 population)
W hiteB lackH ispanicAsian/Pac Is lAm Ind/AK N at
0
50
100
150
200
250
1981 83 85 87 89 91 93 95 97 99 2001

Primary and secondary syphilis — Reported rates for 15-19 year old males by race and ethnicity: United States, 1981–2001
R ate (per 100,000 population)
W hiteB lackH ispanicAsian/Pac Is lAm Ind/AK N at
0
25
50
75
100
125
1981 83 85 87 89 91 93 95 97 99 2001

Congenital syphilis — Rates for infants <1 year of age by mother’s race and ethnicity: United States, 1991–2001 and the Healthy People
year 2010 objective
R ate (per 100,000 live b irths)
W hiteB lackH ispanicAsian/P ac Is lAm Ind/AK N at2010 O bjective
0
90
180
270
360
450
1991 92 93 94 95 96 97 98 99 2000 01
Note: Less than 5% of cases had missing race/ethnicity information and were excluded.

STDs Among Men Who Have Sex with Men
Sexually Transmitted Disease Surveillance 2001
Division of STD Prevention

MSM Prevalence Monitoring Project — Median test positivity by clinic for gonorrhea, chlamydia, and HIV among MSM attending
STD clinics, by race/ethnicity, 2001
M edian positivity
W hite
B lack
H ispanic
0
5
10
15
20
25
U rethra lgonorrhea
R ecta lgonorrhea
Pharyngealgonorrhea
U rethra lch lam ydia
*H IV
*Excludes persons known to be HIV-positive.

MSM Prevalence Monitoring Project — Median test positivity by clinic for gonorrhea and chlamydia among MSM attending STD
clinics, by HIV status, 2001
M edian positivity
H IV -positive
H IV -negative or unknow n
0
5
10
15
20
25
U rethra lgonorrhea
R ecta lgonorrhea
Pharyngealgonorrhea
U rethra lch lam ydia
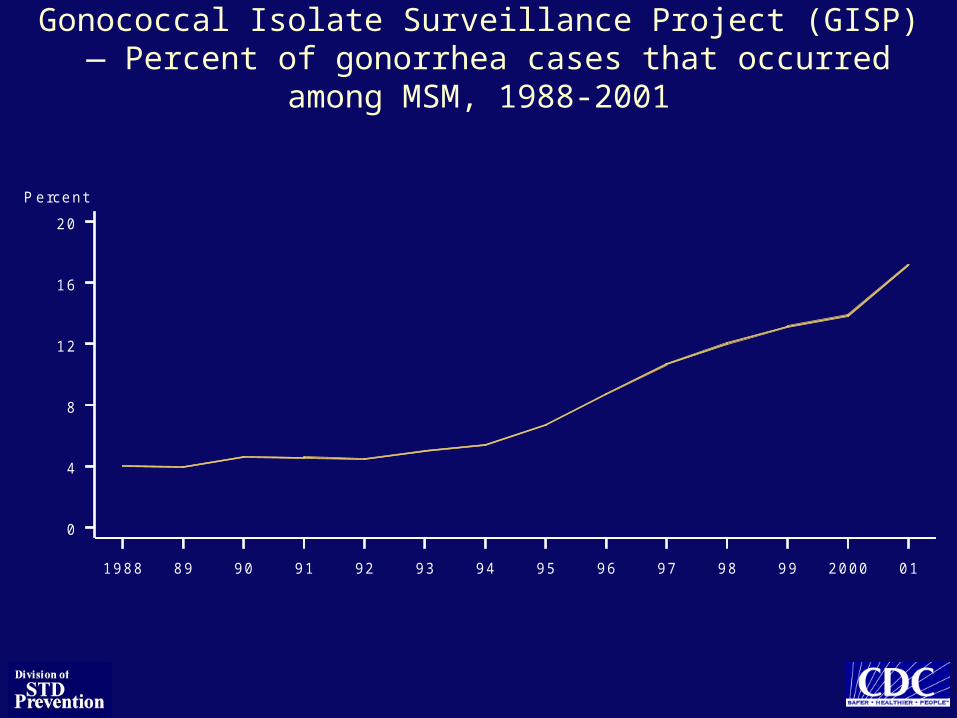
Gonococcal Isolate Surveillance Project (GISP) — Percent of gonorrhea cases that occurred among MSM, 1988-2001
Percent
0
4
8
12
16
20
1988 89 90 91 92 93 94 95 96 97 98 99 2000 01

Gonococcal Isolate Surveillance Project (GISP) — Percent of Neisseria gonorrhoeae isolates obtained from MSM attending STD
clinics in 16 cities, 1999, 2000, and 2001
Note: In 2001, these 16 clinics reported 95.2% (853/896) of GISP gonorrhea cases among men who have sex with men (MSM). Clinics include: ALB=Albuquerque, NM; ANC=Anchorage, AK; ATL=Atlanta, GA; CHI=Chicago, IL; DEN=Denver, CO; HON=Honolulu, HI; LBC=Long Beach, CA; MIA=Miami, FL; MIN=Minneapolis, MN; ORA=Orange County, CA; PHI=Philadelphia, PA; PHX=Phoenix, AZ; POR=Portland, OR; SDG=San Diego, CA; SEA=Seattle, WA; and SFO=San Francisco, CA.
Percent
1999
2000
2001
0
15
30
45
60
75
ALB AN C ATL C H I D E N H O N LBC M IA
C itiesM IN O R A PH I PH X PO R SD G SEA SFO

STDs in Persons Entering Corrections Facilities
Sexually Transmitted Disease Surveillance 2001
Division of STD Prevention

Syphilis serologic tests — Percent seroreactivity in women entering juvenile and adult corrections facilities, 2001
Note: The median positivity is presented from facilities reporting >100 test results. Texas submitted data from more than one adult corrections facility. California submitted data from more than one juvenile corrections facility.
SOURCE: Jail STD Prevalence Monitoring Project; Local and State STD Control Programs; Centers for Disease Control and Prevention
4.4
0.6
7.4
10.5
1.6 7.1
22.2 9.3
21.2
6.7
2.3
10.0
MA
RINJ
MD
Adult Correctional Facility
Juvenile Correctional Facility
2.4
2.18.6
11.3
DECT
VT
ME
NH8.9
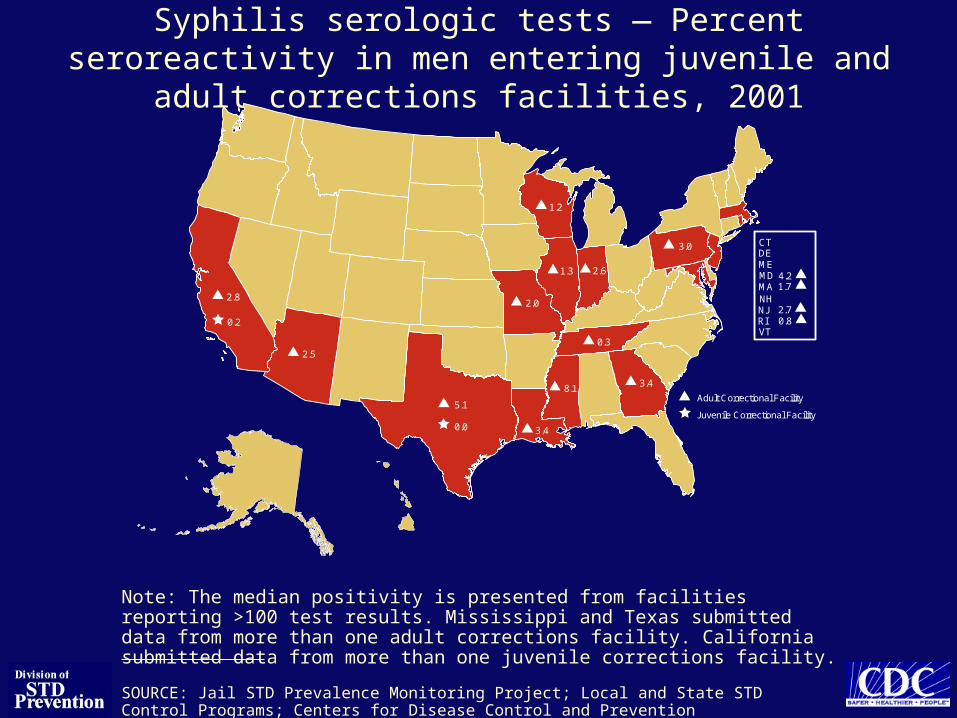
Syphilis serologic tests — Percent seroreactivity in men entering juvenile and adult corrections facilities, 2001
Note: The median positivity is presented from facilities reporting >100 test results. Mississippi and Texas submitted data from more than one adult corrections facility. California submitted data from more than one juvenile corrections facility.
SOURCE: Jail STD Prevalence Monitoring Project; Local and State STD Control Programs; Centers for Disease Control and Prevention
2.8
0.2
2.5
5.1
0.0 3.4
8.1 3.4
0.3
1.3 2.6
1.2
3.0
Adult Correctional Facility
Juvenile Correctional Facility
MA
RINJ
MD1.7
0.82.7
4.2
DECT
VT
ME
NH2.0

Chlamydia — Positivity in women entering juvenile and adult corrections facilities, 2001
Note: The median positivity is presented from facilities reporting >100 test results. Hawaii, Kansas, Pennsylvania, Massachusetts and Wisconsin submitted data from more than one adult corrections facility. California, Texas, Utah and Wisconsin submitted data from more than one juvenile corrections facility.
SOURCE: Jail STD Prevalence Monitoring Project; Adolescent Women Reproductive Health Monitoring Project; Regional Infertility Prevention Program; Local and State STD Control Programs; Centers for Disease Control and Prevention
6.8
14.0
2.5
3.9
2.1 8.6
0.5
6.9
4.8
0.5
5.2 8.5
5.7
6.8
Adult Correctional Facility
Juvenile Correctional Facility
9.6
21.7
17.0
5.8
17.5
8.1
21.0
23.9
4.5
22.1
12.1
24.1
21.5
3.6
MA
RINJ
MD
DECT
VT
ME
NH5.720.8

Chlamydia — Positivity in men entering juvenile and adult corrections facilities, 2001
Note: The median positivity is presented from facilities reporting >100 test results. Massachusetts, Tennessee and Wisconsin submitted data from more than one adult corrections facility. California, Illinois, Maryland, Oregon, Texas, Utah, Washington and Wisconsin submitted data from more than one juvenile corrections facility.
SOURCE: Jail STD Prevalence Monitoring Project; Adolescent Women Reproductive Health Monitoring Project; Regional Infertility Prevention Program; Local and State STD Control Programs; Centers for Disease Control and Prevention
5.04.8
3.4
7.9
3.9
6.5
6.7
1.6
2.9 8.4
9.2
8.3
Adult Correctional Facility
Juvenile Correctional Facility
7.3
8.8
3.9
5.3
6.8
2.9
5.2
6.0
4.8
5.7
MA
RINJ
MD
DECT
VT
ME
NH7.67.4
6.9

Gonorrhea — Positivity in women entering juvenile and adult corrections facilities, 2001
Note: The median positivity is presented from facilities reporting >100 test results. Wisconsin submitted data from more than one adult corrections facility. California, Texas and Wisconsin submitted data from more than one juvenile corrections facility.
SOURCE: Jail STD Prevalence Monitoring Project; Adolescent Women Reproductive Health Monitoring Project; Regional Infertility Prevention Program; Local and State STD Control Programs; Centers for Disease Control and Prevention
2.5
4.9
4.7
2.6
8.3
2.50.7
2.2
3.3
1.8
0.5
1.3 5.0
4.4
4.4
Adult Correctional Facility
Juvenile Correctional Facility
0.6
0.06.1
8.6
12.4
0.4 3.3
5.9
MA
RINJ
MD
DECT
VT
ME
NH
8.9

Gonorrhea — Positivity in men entering juvenile and adult corrections facilities, 2001
Note: The median positivity is presented from facilities reporting >100 test results. Wisconsin submitted data from more than one adult corrections facility. California, Colorado, Illinois, Kentucky, Maryland and Wisconsin submitted data from more than one juvenile corrections facility.
SOURCE: Jail STD Prevalence Monitoring Project; Adolescent Women Reproductive Health Monitoring Project; Regional Infertility Prevention Program; Local and State STD Control Programs; Centers for Disease Control and Prevention
1.63.2
2.1
2.1
0.5
1.4 2.8
5.7
2.2
Adult Correctional Facility
Juvenile Correctional Facility
0.5
2.10.7
2.7
1.6
0.9
0.8
1.9 MA
RINJ
MD
DECT
VT
ME
NH
2.3
0.8

STDs in the South
Sexually Transmitted Disease Surveillance 2001
Division of STD Prevention

South — Primary and secondary syphilis case rates by county, 2001
Rate per 100,000 population
<=0.20.21-4.0>4.0
(n=1,020)(n=233)(n=170)

South — Chlamydia case rates by county, 2001
Rate per 100,000 population<=150150.1-300>300
(n=489)(n=488)(n=446)
SOURCE: National Electronic Telecommunications System for Surveillance (NETSS) data

South — Gonorrhea case rates by county, 2001
Rate per 100,000 population
<=1919.1-100>100
(n=298)(n=497)(n=628)
SOURCE: National Electronic Telecommunications System for Surveillance (NETSS) data

NETSS
Sexually Transmitted Disease Surveillance 2001
Division of STD Prevention

Chlamydia — National Electronic Telecommunications System for Surveillance (NETSS) transmission status by state, 2001
Note: Unless noted, large city projects transmit records in the same format as states. San Francisco and Los Angeles projects report case extended chlamydia records to NETSS.
Guam
Puerto Rico Virgin Is.
NETSS Data: Summary Case Case Extended Discontinued Hardcopy

Gonorrhea — National Electronic Telecommunications System for Surveillance (NETSS) transmission status by state, 2001
Note: Unless noted, large city projects transmit records in the same format as states. San Francisco and Los Angeles projects report case extended gonorrhea records to NETSS.
Guam
Puerto Rico Virgin Is.
NETSS Data: Summary Case Case Extended Discontinued Hardcopy

Primary and secondary syphilis — National Electronic Telecommunications System for Surveillance (NETSS) transmission
status by state, 2001
Guam
Puerto Rico Virgin Is.
NETSS Data: Summary Case Case Extended Discontinued Hardcopy
Note: Unless noted, large city projects transmit records in the same format as states.
Related Documents