Housing Affordability & Livability Agenda City of Seattle Basic Demographics 2. Map: 2010 City of Seattle Census Profile 3. Seattle’s Growing Population and Housing Stock 4. Map: Percentage of Population Who Are Persons of Color 5. Map: Distribution of Population by Race/Ethnicity 6. Map: Percent of Population Who speak English Less Than Well 7. Map: Percent of Population Under Age of 18 8. Map: Population under 200% of Poverty Level 9. Map: Renter Occupied Units by Census Block 10. Household Size Trends 11. Poverty Rates by Race/Ethnicity 12. Homelessness in Seattle Housing & Affordability Characteristics 13. Affordability & Availability – Rental Housing 14. Severely Cost Burdened Households 15. Severe Housing Cost Burden by Race/Ethnicity 16. Rent Trends 17. Map: Average Rents by Sub-Market (1 Bedroom) 18. 1 Bedroom Average Rents by Sub-Market 19. Housing Affordability for Working Households – Studios 20. Housing Affordability for Working Households – 1BR 21. Housing Affordability for Working Households – 2BR 22. Housing Affordability for Working Households - 3BR 23. Rental Housing Affordability & Availability by Unit Size 24. Households Size & Rental Unit Size 25. Race/Ethnicity by Income – Renter Households 26. Race/Ethnicity by Income – Owner Households 27. 2014 Fair Housing Testing Preliminary Findings 28. Homeownership Rates by Race & Ethnicity 29. Seattle Households by Income – Owners & Renters 30. Housing Needed to Accommodate Growth by Income 31. Housing Units by Year Built 32. Age of Apartment Buildings & Rents Office of Housing & DPD Programs 33. Graphic: Ways the City Affects Housing 34. Department of Planning & Development (DPD) Programs 35. Office of Housing (OH) Programs - Target Income Ranges 36. Rental Housing Program - Households by Income 37. Map: Office of Housing Portfolio 38. Rental Housing Program - Households Served by Race/Ethnicity 39. Households Living in OH Income-Restricted Units 40. Rental Housing Program – Homeless Housing & Households Served Land Use & Development Characteristics 41. Map: Zoning 42. Map: Where Multifamily Housing is Allowed 43. Map: Residential Growth by Urban Village/Urban Center 44. Zoning Capacity for New Housing 45. Construction & Permit Volumes 46. Housing Units Constructed 2005-2014 47. Cost Breakdown of Newly Constructed Housing 48. Cost to Construct Parking 49. Map: Accessory Dwelling Unit Production 50. Map: Micro-housing and Congregate Housing 51. Tenant Relocation Assistance 52. Map: Percent Changes in Average Rent (Spring 2005 to Fall 2014) Selected slides updated 6/26/2015 1

Welcome message from author
This document is posted to help you gain knowledge. Please leave a comment to let me know what you think about it! Share it to your friends and learn new things together.
Transcript

Housing Affordability & Livability AgendaCity of Seattle
Basic Demographics2. Map: 2010 City of Seattle Census Profile
3. Seattle’s Growing Population and Housing Stock
4. Map: Percentage of Population Who Are Persons of Color
5. Map: Distribution of Population by Race/Ethnicity
6. Map: Percent of Population Who speak English Less Than Well
7. Map: Percent of Population Under Age of 18
8. Map: Population under 200% of Poverty Level
9. Map: Renter Occupied Units by Census Block
10. Household Size Trends
11. Poverty Rates by Race/Ethnicity
12. Homelessness in Seattle
Housing & Affordability Characteristics13. Affordability & Availability – Rental Housing
14. Severely Cost Burdened Households
15. Severe Housing Cost Burden by Race/Ethnicity
16. Rent Trends
17. Map: Average Rents by Sub-Market (1 Bedroom)
18. 1 Bedroom Average Rents by Sub-Market
19. Housing Affordability for Working Households – Studios
20. Housing Affordability for Working Households – 1BR
21. Housing Affordability for Working Households – 2BR
22. Housing Affordability for Working Households - 3BR
23. Rental Housing Affordability & Availability by Unit Size
24. Households Size & Rental Unit Size
25. Race/Ethnicity by Income – Renter Households
26. Race/Ethnicity by Income – Owner Households
27. 2014 Fair Housing Testing Preliminary Findings
28. Homeownership Rates by Race & Ethnicity
29. Seattle Households by Income – Owners & Renters
30. Housing Needed to Accommodate Growth by Income
31. Housing Units by Year Built
32. Age of Apartment Buildings & Rents
Office of Housing & DPD Programs33. Graphic: Ways the City Affects Housing
34. Department of Planning & Development (DPD) Programs
35. Office of Housing (OH) Programs - Target Income Ranges
36. Rental Housing Program - Households by Income
37. Map: Office of Housing Portfolio
38. Rental Housing Program - Households Served by Race/Ethnicity
39. Households Living in OH Income-Restricted Units
40. Rental Housing Program – Homeless Housing & Households Served
Land Use & Development Characteristics 41. Map: Zoning
42. Map: Where Multifamily Housing is Allowed
43. Map: Residential Growth by Urban Village/Urban Center
44. Zoning Capacity for New Housing
45. Construction & Permit Volumes
46. Housing Units Constructed 2005-2014
47. Cost Breakdown of Newly Constructed Housing
48. Cost to Construct Parking
49. Map: Accessory Dwelling Unit Production
50. Map: Micro-housing and Congregate Housing
51. Tenant Relocation Assistance
52. Map: Percent Changes in Average Rent (Spring 2005 to Fall 2014)
Selected slides updated 6/26/2015
1

2
2

Housing Affordability & Livability AgendaCity of Seattle
Seattle’s Growing Population and Housing Stock
Source: U.S. Census Bureau, Decennial Census; 2015 to 2035 growth estimate in “Updating Seattle’s
Comprehensive Plan Background Report;” 2015 housing informal projection by SPC Demographer.
221,973 230,039 249,032 270,524
308,516
1970 1980 1990 2000 2010
Housing Units328,000
398,000
2015 2035
70,000 Housing
Units
2015-2035
Growth being
planned for in
Comprehensive
Plan Update
Population
516,259 563,374 608,660493,846530,831 ~725,000
3

4
4

20
10
Distrib
utio
n o
f Po
pu
latio
n
By R
ace
/ Eth
nicity
5

6
6

7

8
8

9

Housing Affordability & Livability AgendaCity of Seattle
Housing Affordability & Livability AgendaCity of Seattle
Household Size Trends
10
0.0
0.5
1.0
1.5
2.0
2.5
3.0
Seattle King County U.S.
1980
1990
2000
2010
The long-term trends show that average household size is declining. Household sizes increased after the Great Recession but are likely to resume previous trends.
U.S. Census Bureau, Decennial Census.

Housing Affordability & Livability AgendaCity of Seattle
Housing Affordability & Livability AgendaCity of Seattle
0%
5%
10%
15%
20%
25%
30%
35%
40%
45%
Asian Black / African American White two or more races Hispanic / Latino (of only
one race)
Poverty Rates by Major Racial Category and Hispanic/Latino Ethnicity
Poverty rates vary greatly for different races and ethnicities, especially among children and seniors.
All people
Under 18
Over 65
Source: US Census. 2010 decennial Census.
13% citywide average.
11

Housing Affordability & Livability AgendaCity of Seattle
Housing Affordability & Livability AgendaCity of Seattle
Homelessness in Seattle
Sources: 2014 King County One Night Count Data;
“Homeless student count in Wash. hits record high”, Seattle Post-
Intelligencer, February 27, 2014.
In January of 2014, there were 2,303 people surviving on the streets
without shelter in Seattle.
Number of students who were homeless in
Seattle Public Schools in the 2012-2013
school year.
2,370
Seattle is part of a statewide trend
in rising numbers of homeless
students, with 71% staying in
emergency shelters.
In addition, another 2,390 people were staying in emergency shelter.
12

Housing Affordability & Livability AgendaCity of Seattle
Housing Affordability & Livability AgendaCity of Seattle
3356
8915
31
45
0
20
40
60
80
100
120
140
160
0-30% of AMI 0-50% of AMI 0-80% of AMI
Units Per 100 Renter Households (HHs) Affordable in
income range,
but not available
(rented by HHs
with higher
income)
Affordable in
income range,
and available
(rented by HHs
within income
range or vacant)
GAP: 67
units per
100 HHs (roughly
23,500
units)
GAP: 44
units per
100 HHs (roughly
25,000
units)
GAP: 11
units per
100 HHs (roughly
9,500
units)
Affordability and Availability: Rental HousingThe gap between renter households and affordable and available rental housing units is greatest for lowest income households. Part of the gap is due to higher income households renting units affordable at lower income levels.
Source: U.S. Housing & Urban Development, CHAS, 2006-2010 5-Year American Community Survey, Seattle city.
Note: these are rough estimates.
13
Housing Affordability & Livability AgendaCity of Seattle
Housing Affordability & Livability AgendaCity of Seattle
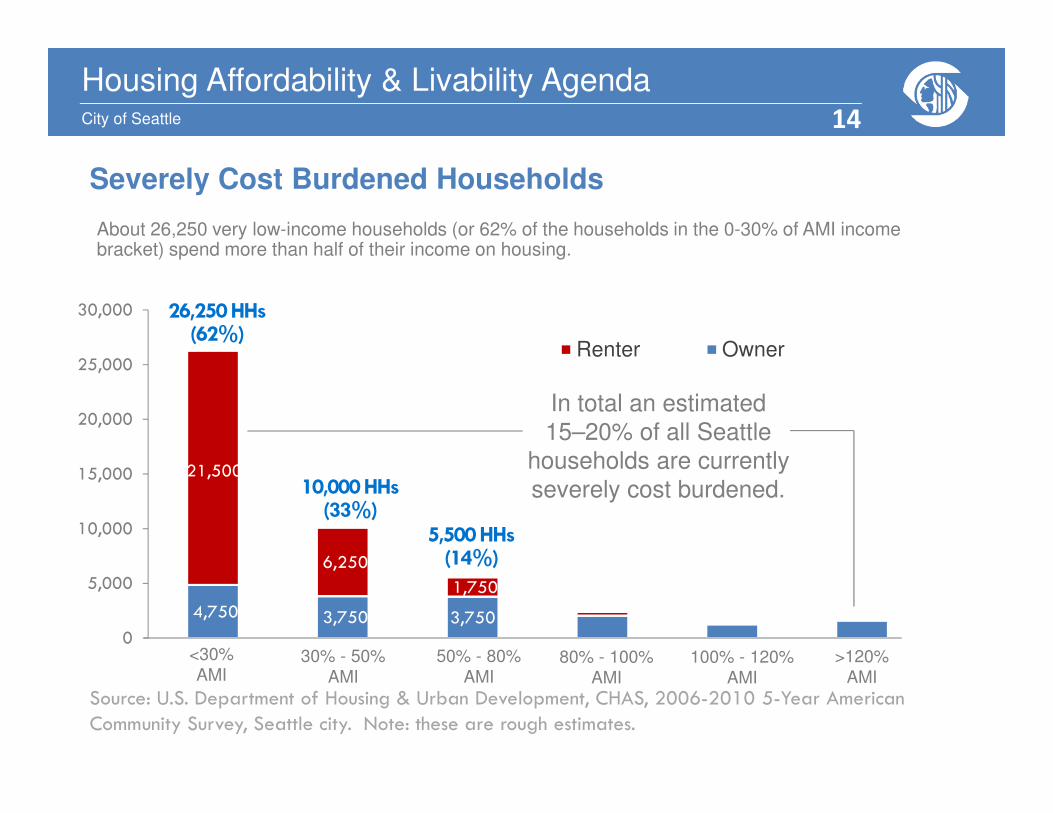
Severely Cost Burdened Households
Source: U.S. Department of Housing & Urban Development, CHAS, 2006-2010 5-Year American
Community Survey, Seattle city. Note: these are rough estimates.
4,750 3,750 3,750
21,500
6,250
1,750
0
5,000
10,000
15,000
20,000
25,000
30,000
Renter Owner
26,250 HHs (62%)
10,000 HHs (33%)
5,500 HHs (14%)
About 26,250 very low-income households (or 62% of the households in the 0-30% of AMI income bracket) spend more than half of their income on housing.
14
<30% AMI
30% - 50% AMI
50% - 80% AMI
80% - 100% AMI
100% - 120% AMI
>120% AMI
In total an estimated15–20% of all Seattle
households are currently severely cost burdened.

Housing Affordability & Livability AgendaCity of Seattle
Housing Affordability & Livability AgendaCity of Seattle
Severe Housing Cost Burden by Race/Ethnicity
0%
5%
10%
15%
20%
25%
30%
35%
40%
White alone,non-Hispanic
Asian alone,non-Hispanic
Black orAfrican-American
alone, non-Hispanic
Other (includingmultiple races,non-Hispanic)
Hispanic,any race
Source: U.S. Department of Housing & Urban Development, CHAS, 2006-2010 5-Year American Community Survey, Seattle city.
Over 25% of Black/African American owner households, and close to 35% of Black/African American renter households, pay more than half of their incomes for housing.
RentersOwners
15

Housing Affordability & Livability AgendaCity of Seattle
Housing Affordability & Livability AgendaCity of Seattle
Sources: Seattle Residential Permit Report, DPD Permit Warehouse, 2014;
Dupre+Scott Apartment Advisors, Apartment Vacancy Report, 20+ unit buildings, Fall 2014, Seattle-14 market areas.
In the last few years, housing development has accelerated, but rents continue to climb, driven by rapidly growing demand. Rental rates for new units are higher, and housing that is demolished tends to be older more affordable housing stock in varying conditions.
Rent Trends
Sources: Seattle Residential Permit Report, DPD Permit Warehouse, 2014;
$1.00
$1.20
$1.40
$1.60
$1.80
$2.00
$2.20
$2.40
$2.60
(1,000)
-
1,000
2,000
3,000
4,000
5,000
6,000
7,000
8,000
9,000
2005 2006 2007 2008 2009 2010 2011 2012 2013 2014
Units Built
Units Demolished
1 BR Rent per s.f.
(Built 2005 or Later)
1 BR Rent per s.f. (All
Units)
1 BR Rent per s.f.
(Built Before 2005)
16

Housing Affordability & Livability AgendaCity of Seattle
Housing Affordability & Livability AgendaCity of Seattle
Average Rents by Sub-Market
(1 Bedroom)
Average rents are highest in Downtown, and around Lake Union and the Ship Canal.
Average rents are most affordable in North Seattle, Rainier Valley, and Beacon Hill.
$1,400+
$1,200 - $1,399
$1,000 - $1,199
17
Dupre+Scott Apartment Advisors, Apartment Vacancy Report, 20+ unit
buildings, Fall 2014, Seattle-14 market areas.

Housing Affordability & Livability AgendaCity of Seattle
Housing Affordability & Livability AgendaCity of Seattle
1-Bedroom Rents by Seattle Sub-MarketsAverage rents are highest in Downtown and around Lake Union and the Ship Canal. Rents are lowest in North Seattle, Rainier Valley, and Beacon Hill.
Market Area Average Rent/Unit
Downtown, Belltown,
South Lake Union$ 1,841
Ballard $ 1,489
Queen Anne $ 1,469
Greenlake/Wallingford $ 1,444
Capitol Hill, Eastlake $ 1,430
First Hill $ 1,409
Central $ 1,380
Madison/Leschi $ 1,284
Magnolia $ 1,248
University $ 1,240
West Seattle $ 1,211
Beacon Hill $ 1,055
Rainier Valley $ 1,042
North Seattle $ 1,020
Market Area Avg. Rent/NRSF
Downtown, Belltown, South
Lake Union$ 2.59
Queen Anne $ 2.29
Greenlake/Wallingford $ 2.28
First Hill $ 2.27
Capitol Hill, Eastlake $ 2.22
Ballard $ 2.19
Central $ 2.11
University $ 2.03
Madison/Leschi $ 1.90
Magnolia $ 1.86
West Seattle $ 1.86
Beacon Hill $ 1.69
Rainier Valley $ 1.68
North Seattle $ 1.53
Dupre+Scott Apartment Advisors, Apartment Vacancy Report, 20+ unit buildings, Fall 2014, Seattle-14 market areas.
18
Housing Affordability & Livability AgendaCity of Seattle
Housing Affordability & Livability AgendaCity of Seattle
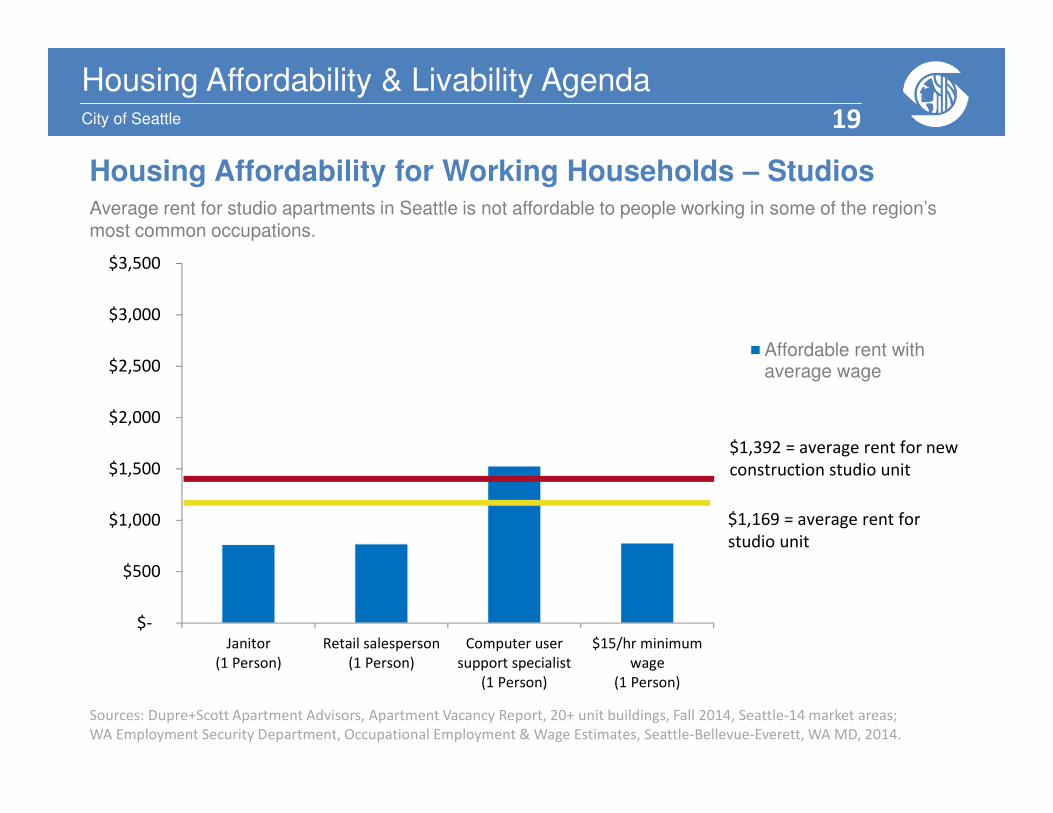
Housing Affordability for Working Households – Studios
$-
$500
$1,000
$1,500
$2,000
$2,500
$3,000
$3,500
Janitor
(1 Person)
Retail salesperson
(1 Person)
Computer user
support specialist
(1 Person)
$15/hr minimum
wage
(1 Person)
Affordable rent withaverage wage
$1,169 = average rent for
studio unit
$1,392 = average rent for new
construction studio unit
Sources: Dupre+Scott Apartment Advisors, Apartment Vacancy Report, 20+ unit buildings, Fall 2014, Seattle-14 market areas;
WA Employment Security Department, Occupational Employment & Wage Estimates, Seattle-Bellevue-Everett, WA MD, 2014.
Average rent for studio apartments in Seattle is not affordable to people working in some of the region’s most common occupations.
19

Housing Affordability & Livability AgendaCity of Seattle
Housing Affordability & Livability AgendaCity of Seattle
Housing Affordability for Working Households – 1 Bedrooms
$-
$500
$1,000
$1,500
$2,000
$2,500
$3,000
$3,500
Medical assistant
(1 Person)
Elementary school
teacher
(1 Person)
$15/hr minimum
wage
(1 Person)
$15/hr minimum
wage x 2
(2 People)
Affordable rent withaverage wage
$1,412 = average rent for 1
BR/1 B unit
$1,780 = average rent for new
construction 1 BR/1 B unit
Sources: Dupre+Scott Apartment Advisors, Apartment Vacancy Report, 20+ unit buildings, Fall 2014, Seattle-14 market areas;
WA Employment Security Department, Occupational Employment & Wage Estimates, Seattle-Bellevue-Everett, WA MD, 2014.
Average rent for 1 bedroom apartments in Seattle is not affordable to people working in some of the region’s most common occupations.
20

Housing Affordability & Livability AgendaCity of Seattle
Housing Affordability & Livability AgendaCity of Seattle
Housing Affordability for Working Households – 2 BR/2 B
$-
$500
$1,000
$1,500
$2,000
$2,500
$3,000
$3,500
Childcare worker,
Home health aide,
& Child
(3 People)
Elementary school
teacher, Teacher
assistant, & Child
(3 People)
Registered nurse &
Child
(2 People)
$15 minimum
wage x 2 & Child
(3 People)
Affordable rent withaverage wage
$1,605 = average rent for 2
BR/1 B unit
$2,132 = average rent for new
construction 2 BR/1 B unit
Sources: Dupre+Scott Apartment Advisors, Apartment Vacancy Report, 20+ unit buildings, Fall 2014, Seattle-14 market areas;
WA Employment Security Department, Occupational Employment & Wage Estimates, Seattle-Bellevue-Everett, WA MD, 2014.
Average rent for 2 bedroom/1 bath apartments in Seattle is not affordable to families with wage earners in some of the region’s most common occupations.
21

Housing Affordability & Livability AgendaCity of Seattle
Housing Affordability & Livability AgendaCity of Seattle
Housing Affordability for Working Households – 3 BR/2 B
$-
$500
$1,000
$1,500
$2,000
$2,500
$3,000
$3,500
Services sales rep,
Restaurant cook, &
3 Children
(5 People)
Administrative
assistant,
Bookkeeper, &
3 Children
(5 People)
Computer
programmer
(1 Person)
$15/hr minimum
wage x 2
& 3 Children
(5 People)
Affordable rent withaverage wage
$2,411 = average rent for 3
BR/2 B unit
$3,019 = average rent for new
construction 3BR/2 B unit
Sources: Dupre+Scott Apartment Advisors, Apartment Vacancy Report, 20+ unit buildings, Fall 2014, Seattle-14 market areas;
WA Employment Security Department, Occupational Employment & Wage Estimates, Seattle-Bellevue-Everett, WA MD, 2014.
Average rent for 3 bedroom/2 bath apartments in Seattle is not affordable to families with wage earners in some of the region’s most common occupations.
22

Housing Affordability & Livability AgendaCity of Seattle
Housing Affordability & Livability AgendaCity of Seattle
37
61
95
27
54
89
34
52
80
-
20
40
60
80
100
120
≤ 30% of AMI
≤ 50% of AMI
≤ 80% of AMI
≤ 30% of AMI
≤ 50% of AMI
≤ 80% of AMI
≤ 30% of AMI
≤ 50% of AMI
≤ 80% of AMI
0-1 BRs 2 BRs 3 BRs
Affordable and Available Units Per 100 HHs
Source: U.S. Housing & Urban Development, CHAS, 2006-2010 5-Year American Community Survey, Seattle city.
Rental Housing Affordability & Availability by Unit SizeLow and moderate income families face significant challenges in finding affordable and available rental housing
with more than 1 bedroom.
Ratio o
f U
nits P
er
100 H
Hs
23

Housing Affordability & Livability AgendaCity of Seattle
Housing Affordability & Livability AgendaCity of Seattle
Household Size
Seattle Balance of KingCounty
5+
4
3
2
1
Seattle Balance ofKing
County
4+ BR
3 BR
2 BR
1 BR
0 BR
Unit Size
Source: U.S. Census Bureau, 2008-2012 5-Year American Community Survey, Seattle city
This comparison suggests that Seattle and King County have a sufficient supply of large units. However, it does not take into account affordability or reflect the degree to which larger units are occupied by smaller size households.
Households Size and Rental Unit Size
100% 100%
50% 50%
0% 0%
24
Housing Affordability & Livability AgendaCity of Seattle
Housing Affordability & Livability AgendaCity of Seattle
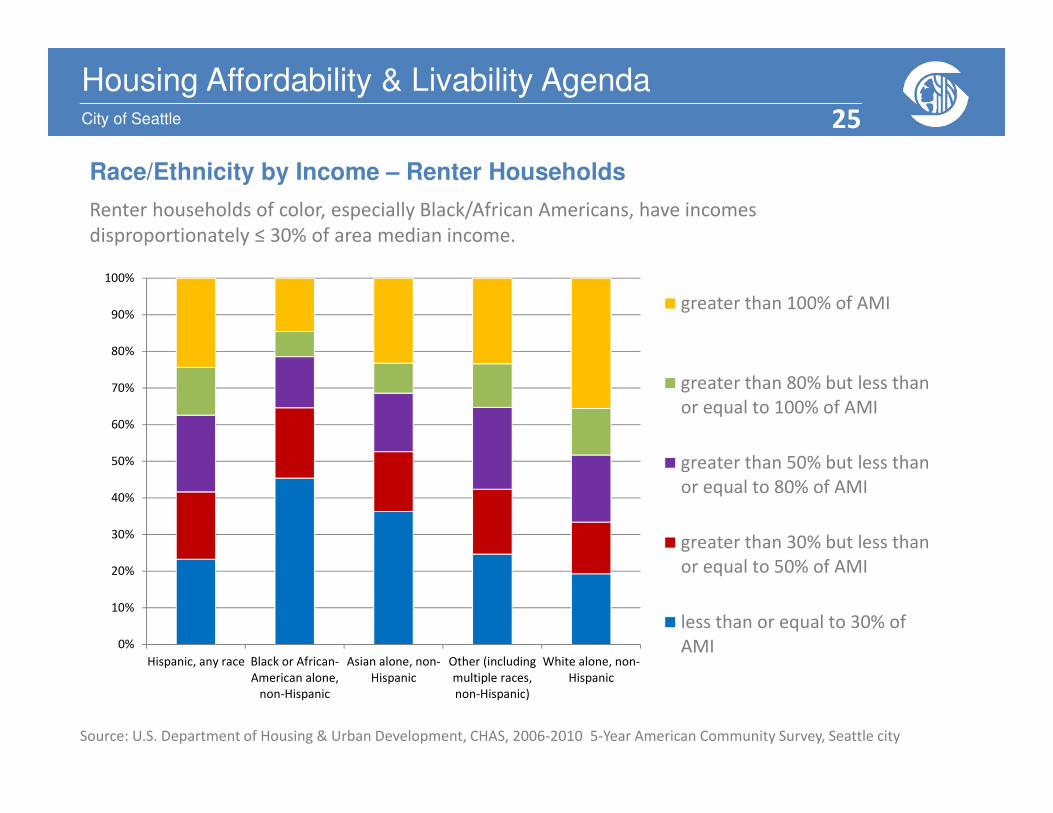
Race/Ethnicity by Income – Renter Households
0%
10%
20%
30%
40%
50%
60%
70%
80%
90%
100%
Hispanic, any race Black or African-
American alone,
non-Hispanic
Asian alone, non-
Hispanic
Other (including
multiple races,
non-Hispanic)
White alone, non-
Hispanic
greater than 100% of AMI
greater than 80% but less than
or equal to 100% of AMI
greater than 50% but less than
or equal to 80% of AMI
greater than 30% but less than
or equal to 50% of AMI
less than or equal to 30% of
AMI
Renter households of color, especially Black/African Americans, have incomes
disproportionately ≤ 30% of area median income.
Source: U.S. Department of Housing & Urban Development, CHAS, 2006-2010 5-Year American Community Survey, Seattle city
25

Housing Affordability & Livability AgendaCity of Seattle
Housing Affordability & Livability AgendaCity of Seattle
Race/Ethnicity by Income – Owner Households
0%
10%
20%
30%
40%
50%
60%
70%
80%
90%
100%
Hispanic, any race Black or African-
American alone,
non-Hispanic
Asian alone, non-
Hispanic
Other (including
multiple races,
non-Hispanic)
White alone, non-
Hispanic
greater than 100% of AMI
greater than 80% but less than
or equal to 100% of AMI
greater than 50% but less than
or equal to 80% of AMI
greater than 30% but less than
or equal to 50% of AMI
less than or equal to 30% of
AMI
Black/African American homeowner households have incomes disproportionately ≤ 80% of area median income.
Source: U.S. Department of Housing & Urban Development, CHAS, 2006-2010 5-Year American Community Survey, Seattle city
26

Housing Affordability & Livability AgendaCity of Seattle
64% of all tests showed evidence of different treatment.
42 tests focused on Race - 64% showed patterns that generally
favored white testers.
Seattle Office of Civil Rights 2014 Fair Housing Testing
Preliminary Findings
9 tests focused on Gender Identity - 67% showed evidence of
different treatment
31 tests focused on Sexual Orientation - 61% showed evidence
of different treatment
43 tests focused on National Origin - 67% showed evidence of
different treatment
27

Housing Affordability & Livability AgendaCity of Seattle
Housing Affordability & Livability AgendaCity of Seattle
0%
10%
20%
30%
40%
50%
60%
Asian Black / African American White two or more races Hispanic / Latino (of only
one race)
Homeownership Rates by Major Racial Category and Hispanic/Latino
Ethnicity
46%
29%
52%
33%
27%
Homeownership rates for Black/African American, Hispanic/Latino and mixed race households are significantly lower than for Asian and White households.
48% overall in Seattle
Source: US Census. 2010 decennial Census.
28
Housing Affordability & Livability AgendaCity of Seattle
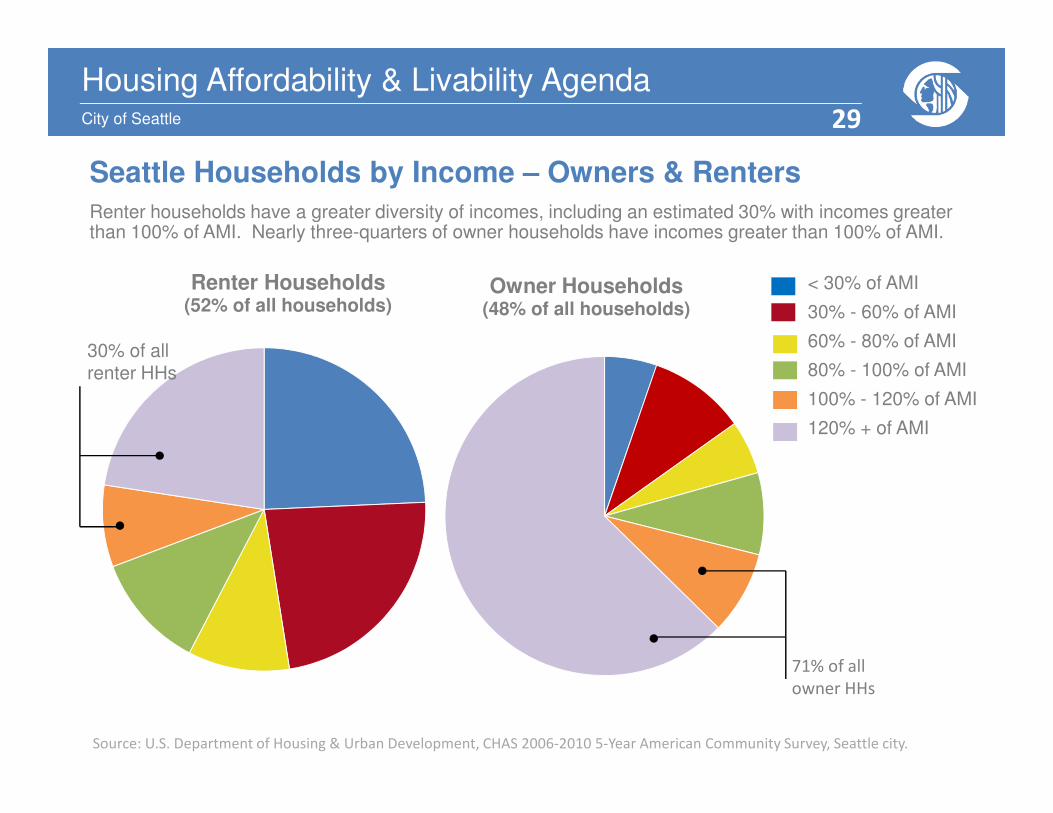
Housing Affordability & Livability AgendaCity of Seattle
Renter Households(52% of all households)
Owner Households(48% of all households)
Seattle Households by Income – Owners & Renters
Renter households have a greater diversity of incomes, including an estimated 30% with incomes greater than 100% of AMI. Nearly three-quarters of owner households have incomes greater than 100% of AMI.
Source: U.S. Department of Housing & Urban Development, CHAS 2006-2010 5-Year American Community Survey, Seattle city.
< 30% of AMI
30% - 60% of AMI
60% - 80% of AMI
80% - 100% of AMI
100% - 120% of AMI
120% + of AMI
71% of all
owner HHs
30% of allrenter HHs
29

Housing Affordability & Livability AgendaCity of Seattle
Housing Affordability & Livability AgendaCity of Seattle
15% or ~10,500
11% or ~7,500
14% or ~9,500
0
10,000
20,000
30,000
40,000
50,000
60,000
70,000
Housing
Units
> 120%
of AMI
100-120%
of AMI
80-100%
of AMI
50-80%
of AMI
30-50%
of AMI
0-30%
of AMI
40%
or
28,000
units
≤ 80% AMI
26% or
~18,000
units
≤ 50% AMI
Income bands:
Sources: U.S. Housing & Urban Development, CHAS, 2006-2010 5-Year American Community Survey, Seattle
city; Seattle 2035 Updating Seattle’s Comprehensive Plan, Background Report, February 2014.
An incomplete lookOverlaying today’s income distribution on growth starts to tell us how much of the housing growth needs to be affordable at low and moderate income levels.
However, it does not account for:• Some affordable units being
occupied by higher income households; and
• Existing unmet need for affordable housing (for example, looking just at 0-30% of AMI there is currently a shortage of 23,500 affordable and available renter units.)
Housing Needed to Accommodate Growth by Income Level
30

Housing Affordability & Livability AgendaCity of Seattle
Housing Affordability & Livability AgendaCity of Seattle
Year Built Housing Units Percentage
2010 or later About 16,000 5%
2000-2009 47,861 15%
1990-1999 24,861 8%
1980-1989 23,566 7%
1970-1979 27,914 9%
1960-1969 28,424 9%
1950-1959 35,267 11%
1940-1949 29,441 9%
1939 or earlier 88,279 27%
Age of Housing Stock
Over a quarter of the City’s existing housing stock was built before 1940.
Source: U.S. Census Bureau, 2011-2013 3-Year American Community Survey, Seattle city.
31

Housing Affordability & Livability AgendaCity of Seattle
Housing Affordability & Livability AgendaCity of Seattle
Age of Apartment Buildings & RentsSeattle’s least expensive rental housing stock was built in the 1960s and 1970s.
Sources: Dupre+Scott Apartment Advisors, Apartment Vacancy Report, 20+ unit buildings, Spring 2015, Seattle-14 market areas.
$-
$0.50
$1.00
$1.50
$2.00
$2.50
$3.00
$0
$200
$400
$600
$800
$1,000
$1,200
$1,400
$1,600
$1,800
$2,000
Average Rent $/NRSF

Housing Affordability & Livability AgendaCity of Seattle
Housing Affordability & Livability
Production
Preservation
Housing Access
Building Code
Development
Incentives / Fees
Resources
Affordable Housing
Financing
Design Review
Land Use CodeFair Housing
Housing Types
Tenant Relocation
Assistance
Data
Systems
Subsidized
Housing
Landlord Tenant
Laws
Supportive Housing
for Homeless
Households
Place-Based
Investment
Homeownership
Opportunities
Tax Exemption
Permitting
Planning
Weatherization
Zoning
Compliance/ Monitoring
Rental Registration
and Inspection
Public Resources
Foreclosure
Prevention
Surplus Properties
33

Housing Affordability & Livability AgendaCity of Seattle
Housing Affordability & Livability AgendaCity of Seattle
PLANNING
Comprehensive Planning
- Area Planning
- Land Use Code (Zoning) Changes
LAND USE & ENVIRONMENTAL REGULATION
Land Use Permitting (MUP)
- Design Review
- Environmental & Shoreline Regulations (SEPA , SMP etc.)
REGULATION OF CONSTRUCTION
Building Permits (Building Code & Residential Code)
- Fire & Life Safety
Department of Planning & Development – Programs
CODE COMPLIANCE
Tenant Relocation Assistance Ordinance (TRAO)
Housing Building and Maintenance Code (and Land Use Code) Enforcement
Rental Registration and Inspection Ordinance (RRIO) Program
34

Housing Affordability & Livability AgendaCity of Seattle
Housing Affordability & Livability AgendaCity of Seattle
PROGRAMS 0% AMI 30% AMI 60% AMI 100% AMI
RENTAL
Rental Production & Preservation
Weatherization
Rental Operating Subsidy
HOMEOWNERSHIP
Homebuyer Assistance
Home Repair
Weatherization
INCENTIVE PROGRAMS
Multifamily Tax Exemption
Incentive Zoning
Office of Housing Programs – Target Income Ranges
35

Housing Affordability & Livability AgendaCity of Seattle
Housing Affordability & Livability AgendaCity of Seattle
Office of Housing – Rental Housing Program
Households Living in Income-Restricted Units, by Income
Extremely
Low-Income
(0-30%
AMI), 75.8%
Very Low-
Income (31-
50% AMI),
16.5%
Low-Income
(51-80%
AMI), 6.2%
Over 80%
AMI, 1.5%
Source: Office of Housing, Annual Report Data, 2013
Projects in Operation
and Reporting as of
12/31/13
Number of
Households by
Income
Percent of
Households
Units by
Income
Restriction
Percent
of Units
Extremely Low-Income
(0-30% AMI)10,375 75.8% 5,630 51.9%
Very Low-Income
(31-50% AMI)2,253 16.5% 3,286 30.3%
Low-Income
(51-80% AMI)853 6.2% 1,560 14.4%
Over 80% AMI 209 1.5% 374* 3.4%
Total 13,690 100% 10,850 100%
*”Over 80% AMI” represents units in OH-funded projects that are restricted
by other funders.
36

37
Housing Affordability & Livability AgendaCity of Seattle
Housing Affordability & Livability AgendaCity of Seattle
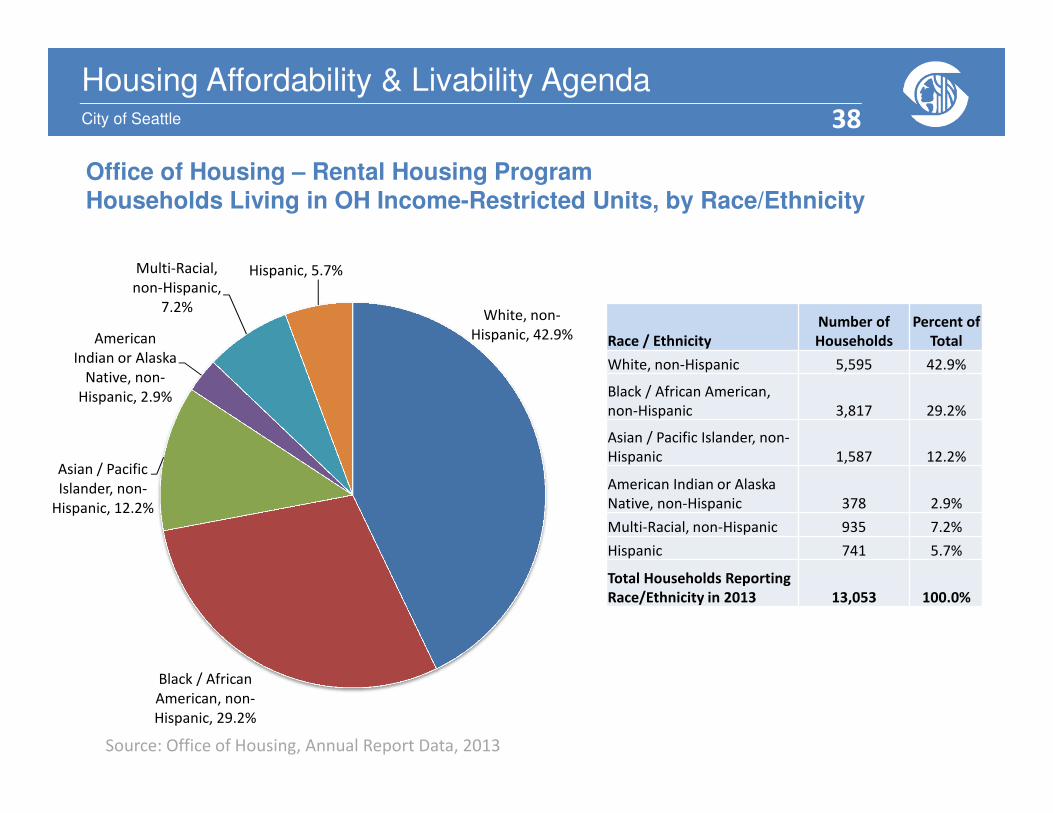
Office of Housing – Rental Housing Program
Households Living in OH Income-Restricted Units, by Race/Ethnicity
White, non-
Hispanic, 42.9%
Black / African
American, non-
Hispanic, 29.2%
Asian / Pacific
Islander, non-
Hispanic, 12.2%
American
Indian or Alaska
Native, non-
Hispanic, 2.9%
Multi-Racial,
non-Hispanic,
7.2%
Hispanic, 5.7%
Source: Office of Housing, Annual Report Data, 2013
Race / Ethnicity
Number of
Households
Percent of
Total
White, non-Hispanic 5,595 42.9%
Black / African American,
non-Hispanic 3,817 29.2%
Asian / Pacific Islander, non-
Hispanic 1,587 12.2%
American Indian or Alaska
Native, non-Hispanic 378 2.9%
Multi-Racial, non-Hispanic 935 7.2%
Hispanic 741 5.7%
Total Households Reporting
Race/Ethnicity in 2013 13,053 100.0%
38

Housing Affordability & Livability AgendaCity of Seattle
Unit TypeAverage Size of
Households
Studio 1.04
1-Bedroom 1.29
2-Bedroom 2.71
3-Bedroom 4.09
4-Bedroom 5.99
5-Bedroom 8.17
1.04 1.29
2.714.09
5.99
8.17
0
2
4
6
8
10
Studio 1-BR 2-BR 3-BR 4-BR 5-BR
Persons
per
Household
Source: Office of Housing, 2013 Annual Report Data
$10,536
$16,841
$22,980 $22,859
$30,235
$26,243
$-
$5,000
$10,000
$15,000
$20,000
$25,000
$30,000
$35,000
Studio 1-BR 2-BR 3-BR 4-BR 5-BR
$s per
Year
Office of Housing – Rental Housing Program
Households Living in Income-Restricted Units, by Average Size and Income
of Households
Unit Type
Average Annual
Income of
Households
Income of
Households
as % of Area
Median Income
Studio $10,536 17%
1-Bedroom $16,841 26%
2-Bedroom $22,980 30%
3-Bedroom $22,859 29%
4-Bedroom $30,235 31%
5-Bedroom $26,243 22%
Average Annual Gross Income of Households in Units
Average Size of Households in Units
39

Housing Affordability & Livability AgendaCity of Seattle
Housing Affordability & Livability AgendaCity of Seattle
Office of Housing – Rental Housing Program
Homeless Housing and Households Served
4,122 Units
4,829 Households
821 Households
Homeless Housing Units 1 Person Households 2+ Person Households
Source: Office of Housing, Annual Report Data, 2013
40

Housing Affordability & Livability AgendaCity of Seattle
Housing Affordability & Livability AgendaCity of Seattle
Existing Zoning
A large portion of the city is zoned for single family.
Zone Category Parcel Acres % Total
Single Family 24,706 67.2%
Lowrise 3,450 9.4%
Midrise & Highrise 278 0.8%
Commercial* 1,292 3.5%
Neighb. Commercial 1,553 4.2%
Downtown*** 463 1.3%
Industrial 4,125 11.2%
Major Institution** 924 2.5%
Total 36,791 100.0%
* Includes Seattle Mixed (South Lake Union)** Includes Yesler Terrace*** Includes Chinatown/ ID & Pioneer Square
41

Housing Affordability & Livability AgendaCity of Seattle
Housing Affordability & Livability AgendaCity of Seattle
Where Multifamily Housing
is Allowed by Zoning
In mixed use zones (10.2% of city parcel area) multifamily housing and commercial uses are allowed
In multifamily zones (9.0% of city parcel area) multifamily housing is allowed but commercial uses are not
42

Housing Affordability & Livability AgendaCity of Seattle
Housing Affordability & Livability AgendaCity of Seattle
Net New Housing Units By
Urban Center/Urban Village
Residential growth has been strong in most Urban Centers/Urban Villages, though some have not seen much new housing.
0% - 50%
51% - 100%
101% - 150%
151% - 200%
201% - 250%
251%+ Source: Seattle DPD Urban Center/Village
Residential Growth Report (Finaled Permits)
43
Total number of net new housing units added in urban center/urban village 2005-3rd Q 2014
###
2005 through 3rd Q 2014 growth as a percentage of 2005-2024 Comprehensive Plan residential growth targets
Housing Affordability & Livability AgendaCity of Seattle
Housing Affordability & Livability AgendaCity of Seattle
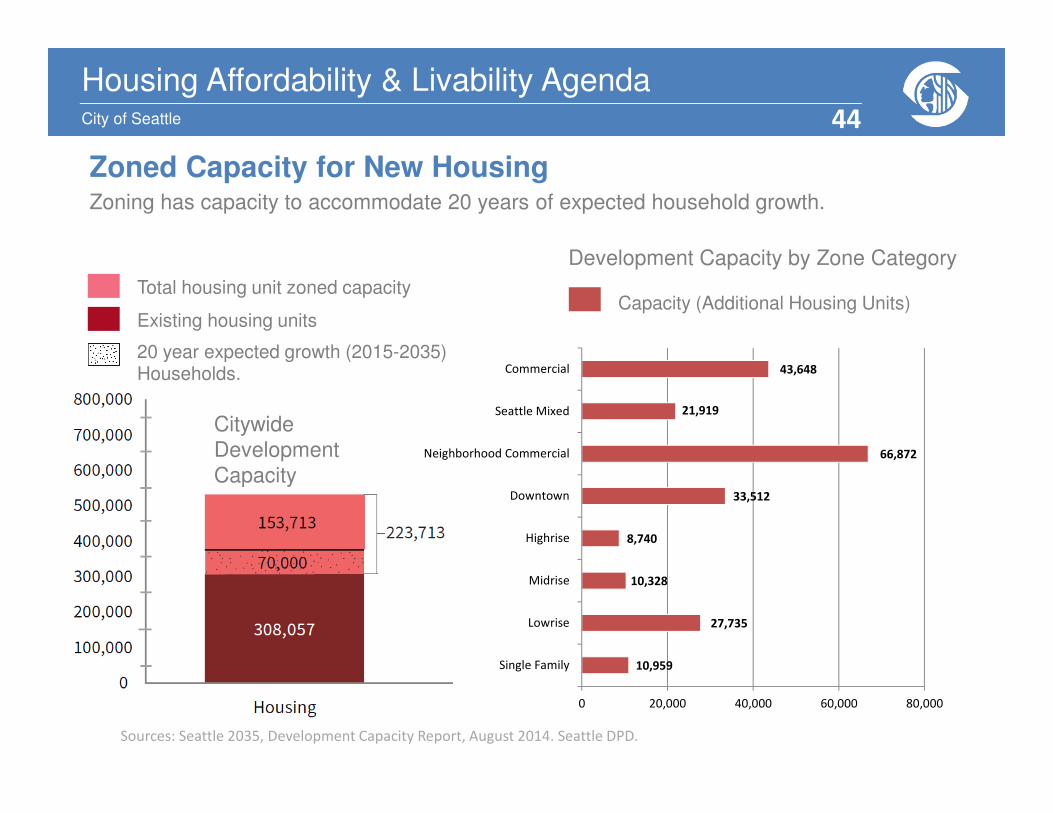
Zoned Capacity for New Housing
Sources: Seattle 2035, Development Capacity Report, August 2014. Seattle DPD.
Citywide Development Capacity
Development Capacity by Zone Category
Total housing unit zoned capacity
Existing housing units
20 year expected growth (2015-2035)Households.
Capacity (Additional Housing Units)
Zoning has capacity to accommodate 20 years of expected household growth.
10,959
27,735
10,328
8,740
33,512
66,872
21,919
43,648
0 20,000 40,000 60,000 80,000
Single Family
Lowrise
Midrise
Highrise
Downtown
Neighborhood Commercial
Seattle Mixed
Commercial
44

Housing Affordability & Livability AgendaCity of Seattle
Housing Affordability & Livability AgendaCity of Seattle
We have seen historically high permitting and construction volumes in recent years, although the overall trends are complex.
Construction and Permit Volumes
0
2000
4000
6000
8000
10000
12000
19
90
19
91
19
92
19
93
19
94
19
95
19
96
19
97
19
98
19
99
20
00
20
01
20
02
20
03
20
04
20
05
20
06
20
07
20
08
20
09
20
10
20
11
20
12
20
13
20
14
Nu
mb
er
of
Un
its
Year
Issued Building Permits and Finaled Building Permits
Permits Issued
Permits Finaled
Sources: Seattle DPD Permit Data.
45

Housing Affordability & Livability AgendaCity of Seattle
Housing Affordability & Livability AgendaCity of Seattle
The vast majority of new housing being constructed is multifamily housing located outside of Downtown and South Lake Union.
Housing Units Constructed
0
1000
2000
3000
4000
5000
6000
7000
8000
2005 2006 2007 2008 2009 2010 2011 2012 2013 2014
Single Family
ADU/DADU
Multifamily (outside
Downtown / SLU)
SLU
Downtown
New
Housin
g U
nits
Sources: Seattle DPD Permit Data.
46

Housing Affordability & Livability AgendaCity of Seattle
Housing Affordability & Livability AgendaCity of Seattle
Cost of construction is the biggest factor in the cost of new housing, but many factors play a role. Permit fees and other soft costs are a small portion of overall development cost.
Cost Breakdown of Newly Constructed Housing
0
100
200
300
400
500
600
DOWNTOWN MIDRISE (MED) MIDRISE (LOW) LOWRISE (MED) LOWRISE (LOW)
Co
st p
er
Ne
t S
qu
are
Fo
ot
Financing & Equity Cost
Developer Management
Other Soft Costs
Arch/Eng/Consultants
State Sales Tax
Construction
Land Acquisition
Physical construction accounts for about 55% of project cost
Sources: 2014 DRA Study Prototypes.
47

Housing Affordability & Livability AgendaCity of Seattle
Housing Affordability & Livability AgendaCity of Seattle
Parking is expensive to build and adds to the monthly cost of housing when it is included in a project.
Cost to Construct Parking
Central Business
District Locations(e.g. Downtown, Belltown)
Urban Locations(e.g. Central District, Ballard, West Seattle
Junction)
Estimated Capital Cost Per Parking Stall (Structured) $40,817 $31,583
Estimated Monthly Cost For Parking Stall per Residential Unit (Structured)
$298 $237
Sources: King County Right Size Parking. August 15, 2014 Parking Costs and Operating Expense Estimates. Kidder Mathews.
48

Housing Affordability & Livability AgendaCity of Seattle
Housing Affordability & Livability AgendaCity of Seattle
Accessory Dwelling Unit Production
Year Number of DADUs
2007 4
2008 6
2009 8
2010 17
2011 27
2012 40
2013 39
2014 18
Total 159
Detached Accessory Dwelling Units (DADU)Final Building Permits Issued By Year
Total Attached Accessory Dwelling Units (ADUs)Permitted from 1994 – 2014: Approximately 1,200
DADU production has been modest since being legalized citywide in 2009.
Sources: Seattle DPD Permit Data.
49

Housing Affordability & Livability AgendaCity of Seattle
Housing Affordability & Livability AgendaCity of Seattle
Micro-housing and
Congregate Housing
• There were about 64 applications for micro-housing or congregate residence projects between 2009 and 2014.
• 3,500+ sleeping rooms.
• Rents are about $600 - $900
• On a per SF basis rents are high ($3.15+).
• Note: New regulations for Small Efficiency Dwelling Units have since gone into effect.
Sources: Seattle DPD Permit Data.
50
Housing Affordability & Livability AgendaCity of Seattle
Housing Affordability & Livability AgendaCity of Seattle
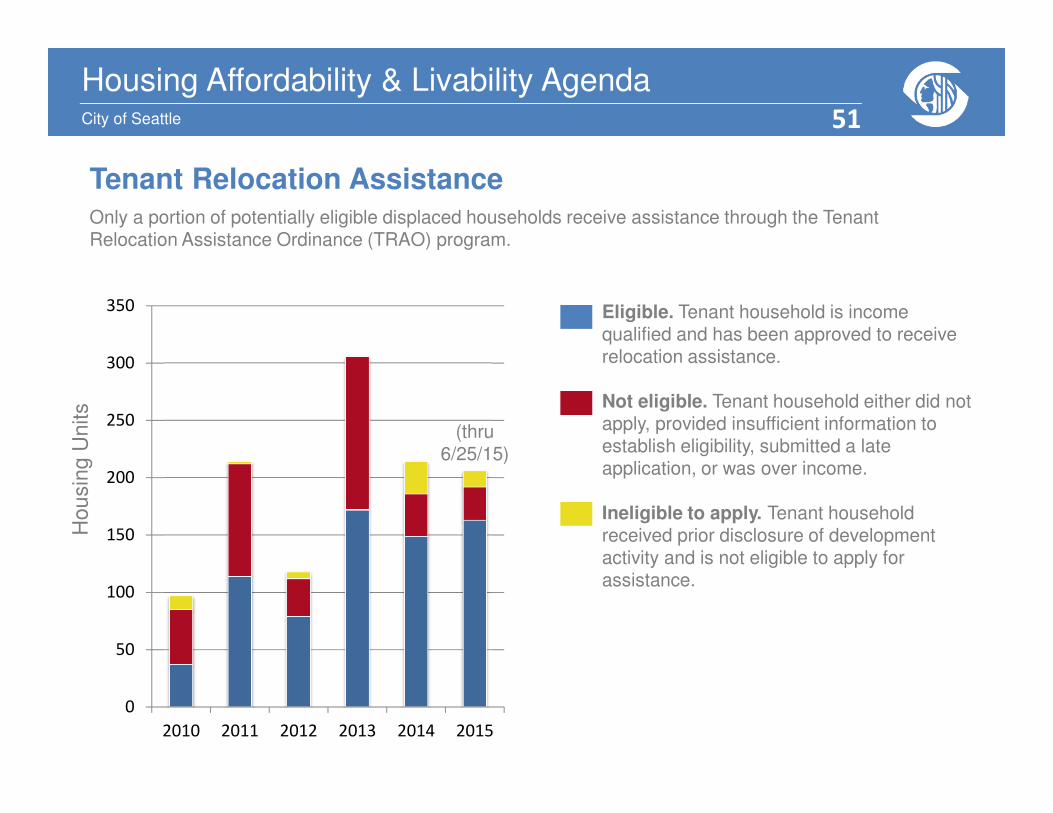
Tenant Relocation AssistanceOnly a portion of potentially eligible displaced households receive assistance through the Tenant Relocation Assistance Ordinance (TRAO) program.
Eligible. Tenant household is income qualified and has been approved to receive relocation assistance.
Not eligible. Tenant household either did not apply, provided insufficient information to establish eligibility, submitted a late application, or was over income.
Ineligible to apply. Tenant household received prior disclosure of development activity and is not eligible to apply for assistance.
Ho
usin
g U
nits
0
50
100
150
200
250
300
350
2010 2011 2012 2013 2014 2015
(thru 6/25/15)
51

Housing Affordability & Livability AgendaCity of Seattle
Housing Affordability & Livability AgendaCity of Seattle
Percent Change in
Average Rent and
Average Rent Per NRSF
(net rentable square foot)
Spring 2005 – Fall 2014
52
Related Documents