Manitoba’s Poverty Reduction and Social Inclusion Strategy 2016/17 Annual Report September 2017 Pursuant to The Poverty Reduction Strategy Act, this document reports on the status of 21 indicators of poverty reduction and social inclusion in the fiscal year 2016/17.

Welcome message from author
This document is posted to help you gain knowledge. Please leave a comment to let me know what you think about it! Share it to your friends and learn new things together.
Transcript

Manitoba’s Poverty Reduction and Social Inclusion Strategy
2016/17 Annual Report September 2017
Pursuant to The Poverty Reduction Strategy Act, this document reports on the status of 21 indicators of poverty reduction and social inclusion in the fiscal year 2016/17.
The Poverty Reduction CommitteeIn 2016/17, the members of the Poverty Reduction Committee were:
• Minister Ian Wishart, Education and Training (co‑chair)
• Minister Scott Fielding, Families (co‑chair)
• Minister Eileen Clarke, Indigenous and Municipal Relations
• Minister Cliff Cullen, Growth, Enterprise and Trade
• Minister Rochelle Squires, Sport, Culture and Heritage, Minister responsible for Francophone Affairs, Minister responsible for Status of Women
• Mr. Charles Loewen
• Dr. Jennie Wastesicoot
• Rev. Dr. Stanley McKay
• Ms. Zully Trujillo
The Poverty Reduction Strategy Act (PRSA) came into effect June 6, 2011. This annual report provides an update of the twenty‑one poverty reduction and social inclusion indicators prescribed by regulation that have been used to measure the progress of this Strategy.

Message from the Poverty Reduction Committee Co‑Chairs
The Government of Manitoba (GOM) recognizes the resilience of Manitobans as one of our greatest collective assets. The Poverty Reduction Committee supports and affirms the Province’s focus on improving the lives of Manitobans and their families, particularly those who face tough choices daily and come up against barriers in their lives.
Poverty is complex and multi‑faceted, which means that moving the needle to reduce poverty in Manitoba requires innovative solutions combined with strong partnerships, and leveraging opportunities to align with work and investments occurring at federal, municipal and local community levels.
This All Aboard Annual report tracks the progress of provincial efforts to reduce poverty through 21 regulated indicators. The report also highlights several important programs and services, which are improving the quality of life of Manitobans living with limited and low‑incomes. Examples of actions that our government has taken in 2016/17 include:
• Tax Relief for Manitobans: Over 2,100 low‑income Manitobans removed from paying tax at all by indexing the Basic Personal Amount and Personal Income Tax Brackets.
• Support for Social Enterprises: $5 to $7 million annually, through the Manitoba Housing and Renewal Corporation in contracts to social enterprises. These social enterprises provide training and employment opportunities to more than 200 individuals per year.
• No Claw back of the Canadian Child Benefit (CCB): Families on EIA get to keep the full value of the federal CCB.
• Introduced a New Rapid Employment Service Model: “Jobs on Market” has been engaging EIA clients, fully assessing their service needs, making referrals to community employment services, and monitoring progress toward employment.
• Refugee Employment Development Initiative (REDI): Four service providers were contracted to deliver REDI programming to over 170 clients. REDI is a coordinated and collaborative approach between Government, service providers and businesses, to integrate refugee job seekers into the Manitoba workforce more quickly.
• Support for pre‑employment training and internships: Assisted individuals furthest from the labour market to obtain and keep real jobs and reduce their reliance on income supports.
• Youth aging out of the child welfare system: Access to financial supports for post‑secondary education as well as other employment preparation supports to foster independence, prepare for a career and to realize their full potential as adults.
• Social Impact Bond (SIB): Initiated discussions with potential service providers and developed the context for selecting a landmark SIB, including an ongoing framework for soliciting related proposals in 2017.
• Enhanced Supports through Rent Assist: An increase of $13.8 million to the Rent Assist program means thousands more low‑income Manitobans are being supported. This represents a 47% increase in individuals receiving supports.
Budget 2016’s Budget Paper D: Reducing Poverty and Promoting Social Inclusion confirmed our Provincial commitment to addressing poverty through development of a multi‑year plan. A vital aspect of developing this strategy is our continued commitment as a Committee to listen to the ideas and input from Manitobans, especially those with lived experiences of poverty, to inform a renewed provincial poverty reduction strategy.
We all benefit by working together and look forward to our continued shared journey in the year ahead. Deepest thanks and acknowledgement to staff, partners across government, service providers, and to Manitobans who are facing poverty who have shared their experiences and challenges and continue to keep this issue a priority for Manitoba.
Scott Fielding Minister of Families, Committee co‑chair
Ian Wishart Minister of Education and Training, Committee co‑chair
All Aboard: Manitoba’s Poverty Reduction and Social Inclusion Strategy 2016/17 Annual Report | Page 1

Message des coprésidents du Comité de réduction de la pauvreté
Le gouvernement du Manitoba sait bien que la résilience de la population manitobaine représente l’un des plus grands atouts collectifs de la province. Le Comité de réduction de la pauvreté appuie et confirme l’objectif de la Province qui est d’améliorer la vie des Manitobaines et des Manitobains ainsi que de leurs familles, en particulier celles et ceux qui sont confrontés tous les jours à des choix difficiles et se heurtent à toutes sortes d’obstacles.
La pauvreté est quelque chose de complexe avec de multiples facettes, ce qui signifie que, pour la réduire au Manitoba, il faut songer à des solutions novatrices et à de solides partenariats, mais il faut aussi accroître les occasions de nous aligner sur les travaux et les investissements effectués aux niveaux fédéral, municipal et local.
Le présent rapport annuel sur la stratégie Tout le monde à bord fait état des progrès de la province dans ses efforts de réduction de la pauvreté à l’aide de 21 indicateurs réglementés. Il souligne également plusieurs programmes et services importants qui améliorent la qualité de vie des Manitobaines et des Manitobains à revenu faible et limité. Exemples de mesures prises par notre gouvernement en 2016‑2017 :
• Allègement fiscal pour les Manitobains : plus de 2 100 Manitobains à faible revenu seront totalement exemptés d’impôts grâce à l’indexation du montant personnel de base et des tranches d’imposition sur le revenu des particuliers.
• Soutien aux entreprises sociales : de 5 à 7 millions de dollars sont accordés chaque année aux entreprises sociales par la Société d’habitation et de rénovation, sous forme de contrats. Ces entreprises sociales offrent des occasions de formation et d’emploi à plus de 200 personnes chaque année.
• Pas de récupération de l’Allocation canadienne pour enfants (ACE) : les familles bénéficiaires de l’AER conservent la totalité de l’ACE fédérale.
• Mise en place d’un nouveau modèle de service favorisant l’intégration rapide au marché de l’emploi : dans le cadre de l’initiative Jobs on Market (emplois sur le marché), nous avons sollicité les bénéficiaires de l’AER, évalué leurs besoins en matière de services, fait des recommandations auprès des services communautaires de l’emploi et surveillé les progrès sur le plan de l’emploi.
• Initiative de développement de l’emploi pour les réfugiés (IDER) : nous avons demandé à quatre fournisseurs de services liés par contrat d’offrir des programmes à plus de 170 clients dans le cadre de cette initiative. L’IDER est un projet coordonné de collaboration entre le gouvernement, les fournisseurs de services et les entreprises afin d’intégrer plus rapidement les réfugiés demandeurs d’emploi dans la population active du Manitoba.
• Soutien à la formation préalable à l’emploi et aux stages : nous avons aidé les personnes les plus éloignées du marché du travail à obtenir et à garder de vrais emplois, et aussi à réduire leur dépendance vis‑à‑vis des aides au revenu.
• Jeunes qui ne sont plus pris en charge par le système de protection de l’enfance en raison de leur âge : nous leur avons donné accès à des aides financières pour études postsecondaires et leur avons offert d’autres formes de soutien à la préparation à l’emploi de façon à les rendre autonomes, à les préparer à une carrière et à leur permettre d’atteindre leur potentiel en tant qu’adultes.
• Obligation à impact social (OIS) : nous avons entamé des discussions avec des fournisseurs de services potentiels et préparé le terrain en vue de la sélection d’une OIS de référence, y compris l’établissement d’un cadre pour solliciter des propositions connexes en 2017.
• Accroissement du soutien grâce à l’allocation pour le loyer : augmentation de 13,8 millions de dollars, ce qui signifie une augmentation de 47 % du nombre de Manitobaines et de Manitobains à revenu faible et ne bénéficiant pas de l’aide à l’emploi et au revenu qui perçoivent cette aide au loyer.
Le document budgétaire accompagnant le Budget de 2016 et intitulé Budget Paper D : Reducing Poverty and Promoting Social Inclusion a confirmé l’engagement de notre province à lutter contre la pauvreté à l’aide d’un plan multiannuel. L’un des principaux aspects de l’élaboration de la stratégie est l’engagement continu de notre comité à écouter les idées et les commentaires des Manitobaines et des Manitobains, en particulier ceux qui, eux‑mêmes, connaissent ou ont connu la pauvreté, pour qu’il en soit tenu compte dans une stratégie provinciale renouvelée de réduction de la pauvreté.
Le travail collectif profitant à tous, nous nous réjouissons de poursuivre ensemble notre cheminement au cours de l’année à venir. Nous tenons à remercier profondément le personnel, tous les partenaires au sein du gouvernement, les fournisseurs de services ainsi que les Manitobaines et Manitobains qui connaissent la pauvreté, qui ont accepté de partager leurs expériences et leurs difficultés, et qui font tout ce qu’ils peuvent pour que la question de la pauvreté reste au rang des priorités du Manitoba.
Scott Fielding Le ministre des Familles, coprésident du Comité
Page 2 | All Aboard: Manitoba’s Poverty Reduction and Social Inclusion Strategy 2016/17 Annual Report
Ian Wishart Le ministre de l’Éducation et de la Formation, coprésident du Comité
Table of Contents
Message from the Poverty Reduction Committee Co‑Chairs ..................................................................................1
Message des co‑présidents du comité de réduction de la pauvreté .......................................................................2
Table of Contents ..........................................................................................................................................................3
Introduction ...................................................................................................................................................................4
Indicator Summary .......................................................................................................................................................4
Considerations ..............................................................................................................................................................5
Indicator One: Total Units of Social and Affordable Housing Supported by the Manitoba Housing and Renewal Corporation .....................................................................................................7
Indicator Two: New Households Served through the Manitoba Housing and Renewal Corporation’s Programs and Services ................................................................................................8
Indicator Three: Households in Core Housing Need .............................................................................................10
Indicator Four: Sense of Community Belonging ....................................................................................................11
Indicator Five: High School Graduation Rates ........................................................................................................12
Indicator Six: Participation in Adult Learning Programs .......................................................................................14
Indicator Seven: Employment Rates........................................................................................................................15
Indicator Eight: Average Weekly Earnings ..............................................................................................................17
Indicator Nine: Minimum Wage Rates ....................................................................................................................18
Indicator Ten: Low‑Income Rates ............................................................................................................................19
Indicator Eleven: Income Inequality .........................................................................................................................21
Indicator Twelve: Post‑secondary Education Participation ...................................................................................23
Indicator Thirteen: Early Development Instrument Scores ...................................................................................25
Indicator Fourteen: Availability of Licensed Child Care .........................................................................................26
Indicator Fifteen: Number of Children in Care .......................................................................................................27
Indicator Sixteen: Teen Birth Rates .........................................................................................................................29
Indicator Seventeen: Potential Years of Life Lost by Income Quintile ..................................................................31
Indicator Eighteen: Prevalence of Chronic Diseases by Income Quintile .............................................................32
Indicator Nineteen: Average Number of People Receiving Co‑ordinated Home Care Services ........................33
Indicator Twenty: Continuity of Physician Care .......................................................................................................34
Indicator Twenty‑One: Number of People Using Access Centres ........................................................................35
All Aboard: Manitoba’s Poverty Reduction and Social Inclusion Strategy 2016/17 Annual Report | Page 3

Introduction
Under The Poverty Reduction Strategy Act, the Government of Manitoba is required to have a long‑term strategy to reduce poverty and increase social inclusion. The Act also requires indicators to have been set in place to measure progress, which are reported upon annually.
Manitoba has twenty‑one indicators of poverty reduction and social inclusion prescribed in the Poverty Reduction and Social Inclusion Indicators Regulation. This report provides Manitobans a Strategy update and shows that there has been progress (stability) on 17 out of 21 indicators.
Indicator Summary
The following table relates Manitoba’s twenty‑one regulated indicators of poverty and social exclusion to the All Aboard Strategy’s four pillars and their respective objectives. These indicators were selected because they are reliable, valid, inclusive, understandable, meaningful, relevant, consistent and comparable over a five‑year period.
Pillar OneSafe, Affordable Housing in Supportive Communities
Pillar TwoEducation, Jobs and Income Support
Pillar ThreeStrong, Healthy Families
Pillar FourAccessible Coordinated Services
Objectives
• ToensurethatManitobanshaveaccesstosafe,adequateandaffordablehousing
• ToensurethatpeoplelivinginManitobacommunitiesandneighbourhoodsarewell‑supported,leadingtogreatersocialinclusion
Objectives
• ToensurethatmoreManitobansparticipateinhighschool,post‑secondaryandadulteducation,andarepreparedtoparticipateinthelabourmarket
• ToensurethatManitobanshavefinancialsecuritythroughwork,andaccesstoincomesupportsasneeded
• ToensurethatthenumberofManitobanslivinginlowincomeisreduced
Objective
• ToensurethatManitobachildrenandfamiliesareemotionallyandphysicallyhealthy,safeandsecure,socially‑engagedandresponsible,andhaveaccesstosupportsthatallowthemtoreachtheirfullpotential
Objectives
• ToensurethatManitobagovernmentservicesareaccessible,coordinatedandintegratedacrossdepartments
• ToensurethatManitobanshaveaccesstoinformationandsupportsthatareresponsivetotheirneeds
Indicators
1. TotalUnitsofSocialandAffordableHousingsupportedbytheManitobaHousingandRenewalCorporation(MHRC)
2. NewHouseholdsservedthroughMHRC’sProgramsandServices
3. HouseholdsinCoreHousingNeed
4. SenseofCommunityBelonging
Indicators
5. HighSchoolGraduationRates
6. ParticipationinAdultLearningPrograms
7. EmploymentRates
8. AverageWeeklyEarnings
9. MinimumWageRates
10.Low‑incomeRates
11.IncomeInequality
12.Post‑secondaryEducationParticipation
Indicators
13.EarlyDevelopmentInstrumentScores
14.AvailabilityofLicensedChildCare
15.NumberofChildreninCare
16.TeenBirthRates
17.PotentialYearsofLifeLostbyIncomeQuintile
18.PrevalenceofChronicDiseasesbyIncomeQuintile
Indicators
19.AverageNumberofPeopleReceivingCo‑ordinatedHomeCareServices
20.ContinuityofPhysicianCare
21.NumberofPeopleUsingAccessCentres
Page 4 | All Aboard: Manitoba’s Poverty Reduction and Social Inclusion Strategy 2016/17 Annual Report
Considerations
The Government of Manitoba is committed to repairing services with a focus on improving the circumstances of Manitoba’s most vulnerable citizens, while ensuring that all Manitobans experience better results from the programs and services they rely upon.
At the same time, government is committed to building relationships based on respect and trust while governing with values of integrity and inclusion in mind. Four examples of legislation/action where government has been improving service delivery and maximizing efficiencies, building positive, sustainable relationships with Manitobans, and removing barriers include:
(1) Red Tape Reduction Strategy, (2) Improving Accessibility for Manitobans, (3) The Path to Reconciliation Act, and (4) Manitoba Government Diversity and Inclusion Strategy.
Consideration of these “whole of government” approaches have enriched and will continue to enrich ongoing government efforts to reduce poverty in Manitoba.
1. Red Tape Reduction Strategy The Government of Manitoba places high priority on regulatory accountability and red tape reduction. The government’s strategy serves as a key pillar of its economic plan and is aimed at increasing the province’s economic growth by streamlining and reducing regulatory requirements to increase Manitobans’ accessibility to and use of programs and services.
Beginning in 2016, a 14‑member task force consisting of government officials and external stakeholders was created for the purpose of developing a transparent process for reducing red tape.
In January 2017, online public consultations were held which allowed Manitobans to assist in providing ideas for reducing red tape. Participants were asked to identify specific examples where excessive regulations and other barriers make it difficult to conduct business or access services.
In February 2017, government departments undertook the first phase of the red tape reduction process by establishing baseline counts for all regulatory requirements. These baseline counts are scheduled for completion in 2017/18.
2. Improving Accessibility for ManitobansThe Accessibility for Manitobans Act (AMA) became law on December 5, 2013. Under this landmark legislation, the Government of Manitoba is developing accessibility standards to address barriers for Manitobans in key areas of daily living. Standards will apply to Manitoba’s private and public sector organizations.
For 2016/17, commitments were identified in the Minister’s Annual Plan with Respect to The Accessibility for Manitobans Act and organized according to the following six strategic priorities:
1. Development and Implementation of Standards2. Government Leadership3. Resource Development4. Training5. Public Awareness6. Development of Compliance Measures
The Manitoba Government Accessibility Plan was launched in December 2016. By mid‑February 2017, a Manitoba Government Accessible Customer Service Policy had been released, providing a framework for accessible services, and direction that all civil servants receive training on accessible customer service.
In December 2016, the Deputy Minister of the Department of Families was appointed as Compliance Director in accordance with The Civil Service Act. Work is underway by the Disability Issues Office to develop a compliance framework which will be in place in 2017/18.
Achievements and highlights of how Manitoba is implementing the provisions of The Accessibility for Manitobans Act each year are available through the Minister’s Annual Report with Respect to The Accessibility for Manitobans Act.
The website www.AccessibilityMB.ca (www.accesibilitéMB.ca in French) was created in 2015 to act as a central repository of a broad range of information and resources to support implementation of The Accessibility for Manitobans Act. The site was restructured in March 2017 and is continuously updated. The website includes links to Accessibility Plans and leading practices.
As of March 31, 2017, the Government of Manitoba, four health authorities, eight municipalities, 34 school divisions, five universities and colleges and four crown corporations had adopted and made publicly available their Accessibility Plans.
The main goal of accessibility legislation is to identify, prevent and remove barriers by working with public and private sectors on long range accessibility plans.
All Aboard: Manitoba’s Poverty Reduction and Social Inclusion Strategy 2016/17 Annual Report | Page 5
3. The Path to Reconciliation Act In March 2016, The Path to Reconciliation Act was passed with unanimous support in the Manitoba Legislature. The Act sets out the government’s commitment to advancing reconciliation, guided by the Truth and Reconciliation Commission of Canada (TRC) Calls to Action and the principles set out in the United Nations Declaration on the Rights of Indigenous Peoples (UNDRIP).
The Act establishes a transparent mechanism to monitor and evaluate the measures taken by the Government of Manitoba, including the measures taken to engage Indigenous nations and peoples in the process. The Act obliges the minister responsible for reconciliation to table an Annual Progress Report which includes a summary of both ongoing and new programs, services and initiatives undertaken by government and its partners.
The government will be guided in its efforts toward reconciliation by the principles of respect, understanding, engagement and action. Manitoba will be engaging with Indigenous nations and peoples, as well as other Manitobans, to develop a strategic path forward.
4. Manitoba Government Diversity and Inclusion Strategy: Building an Exemplary Civil Service
The Manitoba Government Diversity and Inclusion Strategy (MGDIS) outlines government’s approach to building an exemplary civil service that is inclusive and reflective of the population it serves. The multi‑pronged strategy is shaped around three objectives:
1. to recruit from a diverse, qualified group of potential applicants to build a representative workforce, at all levels of the organization
2. to identify and remove employment barriers to enable the full participation of all employees
3. to cultivate a culture that motivates individuals to contribute to their full potential and build a career with a high‑performing Manitoba government
Ongoing MGDIS activity has included efforts to recruit diverse civil service candidates, delivery of employee learning events, and support for employee networks. Significant developments in 2016/17 included:
• designating a group of Safe Spaces Advisors across government to serve as contacts for employees with questions, or seeking resources, on sexual orientation or gender identity matters (in May 2016)
• supporting the establishment of WAVE (We are All Valuable and Equal), a new employee network for gender and sexual minority employees and allies (in May 2016)
• the development and launch of two new diversity‑related e‑learning courses for employees (in September 2016): – Inclusion and Diversity in the Workplace – The Accessibility for Manitobans Act (AMA)
• the development and public release of the Manitoba Government Accessibility Plan (MGAP), setting out measures to enhance accessibility for members of the public and government employees with disabilities (in December 2016)
• the establishment of the Manitoba Government Accessible Customer Service Policy, updating a previous policy on accessibility as a commitment under the MGAP (in February 2017)
Page 6 | All Aboard: Manitoba’s Poverty Reduction and Social Inclusion Strategy 2016/17 Annual Report

Indicator 1Total Units of Social and Affordable Housing Supported by the Manitoba Housing and Renewal Corporation1
What Does This Indicate?This indicator tallies social and affordable units supported by the Manitoba Housing and Renewal Corporation (MHRC). Social housing refers to rental accommodation available to low‑income households with rates charged on a rent‑geared‑to‑income (RGI) scale (or determined by their Employment and Income (EIA) shelter benefit, if applicable) and affordable housing refers to units with fixed flat rate rents aligned with Median Market Rents (MMRs) (reviewed annually).
Why is This Important?Support for social and affordable housing is one measure to assist low‑income households’ transition out of poverty.
Successful transition for many depends on capacity, adequate income and housing market supply, including the availability of affordable housing options.
Indicator BaselineIn 2009/10, MHRC supported 30,257 units of social and affordable housing (in addition to supporting 4,700 special purpose and personal care home beds).
Most Recent DataIn 2016/17, MHRC supported 31,429 units of social and affordable housing (in addition to supporting 4,204 special purpose and personal care home beds2).
TotalUnitsofMHRCSocialandAffordableHousing,2009/10to2016/17*
29,000
29,500
30,000
30,500
31,000
31,500
32,000
2009
/10
2010
/11
2011
/12
2012
/13
2015
/16
2016
/17
2013
/14
2014
/15
* Excludes special purpose and personal care home beds.
All Aboard StatusSince2009/10,thereare3.9%moreunitsofsocialandaffordablehousingsupportedbytheManitobaHousingandRenewalCorporation.
SocialInfrastructureFundIn October 2016, the Government of Manitoba signed the 2016 Social Infrastructure Fund (SIF) Agreement with the Government of Canada. This two‑year funding agreement (2016/17 and 2017/18) provides a combined Manitoba‑Canada investment of nearly $90 million to improve the quality and increase the supply of affordable housing for Manitoba households in need. The Government of Manitoba, through the Manitoba Housing and Renewal Corporation, has focused its SIF delivery efforts to enhance the quality of life through safe and stable housing, a foundation for individual and community well‑being. Additionally, capital projects supported through the SIF investment will generate economic activity and employment for Manitobans.
Key SIF delivery activities during 2016/17 included Manitoba Housing and Renewal Corporation’s release of a $19 million request for proposals (RFP) for capital upgrade funding for the non‑profit housing sector, which will benefit more than 50 housing providers in up to 20 Manitoba communities and position them for long‑term success. Additionally, SIF supported a $1 million RFP for homeownership opportunities that will build wealth and economic stability for Winnipeg, Brandon, and Indigenous households. SIF dollars were also committed to rent supplement programs, including a housing first pilot project, in partnership with the Manitoba Métis Federation (Southwest region). This will assist vulnerable families and individuals, including those at high risk of experiencing homelessness, in Brandon.
1 Data on the number of social and affordable housing units supported by the Manitoba Housing and Renewal Corporation is provided by the Department of Families, annually.
2 Note: The count of special purpose and personal care home beds supported by MHRC is lower than 2015/16 largely because of the expiry of original operating agreements.
All Aboard: Manitoba’s Poverty Reduction and Social Inclusion Strategy 2016/17 Annual Report | Page 7
Indicator 2New Households Served through the Manitoba Housing and Renewal Corporation’s Programs and Services3
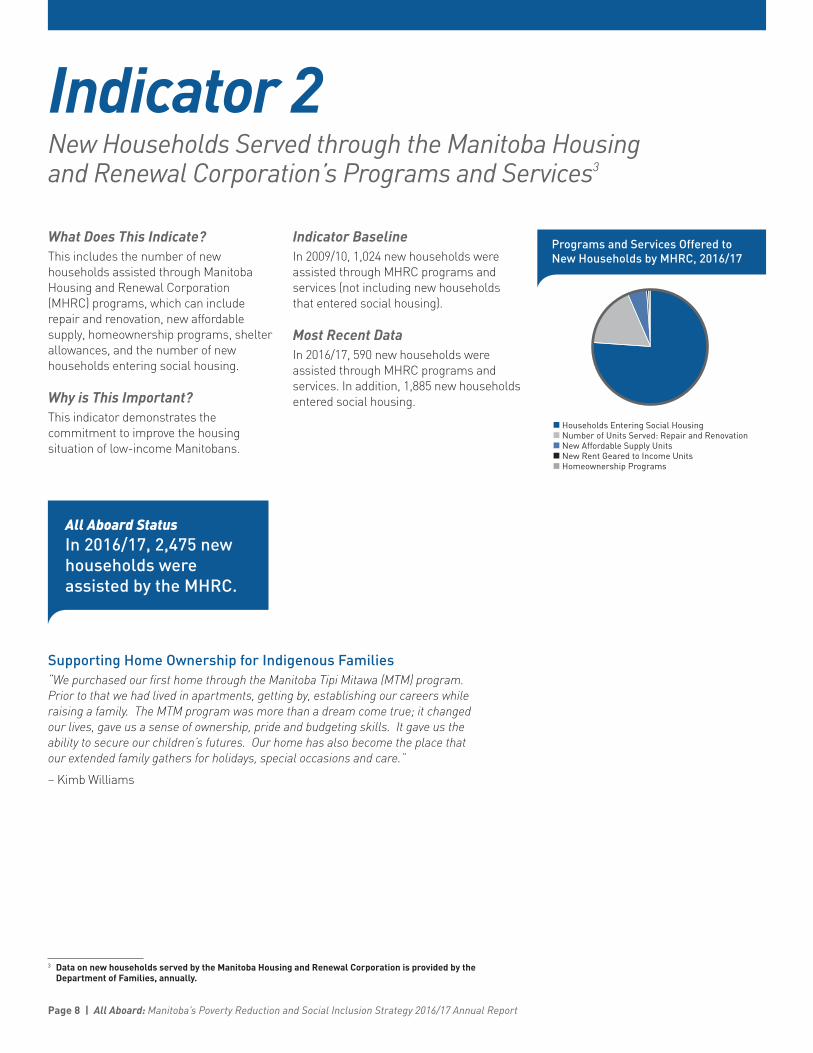
What Does This Indicate? This includes the number of new households assisted through Manitoba Housing and Renewal Corporation (MHRC) programs, which can include repair and renovation, new affordable supply, homeownership programs, shelter allowances, and the number of new households entering social housing.
Why is This Important?This indicator demonstrates the commitment to improve the housing situation of low‑income Manitobans.
Indicator BaselineIn 2009/10, 1,024 new households were assisted through MHRC programs and services (not including new households that entered social housing).
Most Recent DataIn 2016/17, 590 new households were assisted through MHRC programs and services. In addition, 1,885 new households entered social housing.
ProgramsandServicesOfferedtoNewHouseholdsbyMHRC,2016/17
Households Entering Social HousingNumber of Units Served: Repair and RenovationNew Affordable Supply UnitsNew Rent Geared to Income UnitsHomeownership Programs
All Aboard StatusIn2016/17,2,475newhouseholdswereassistedbytheMHRC.
SupportingHomeOwnershipforIndigenousFamilies“We purchased our first home through the Manitoba Tipi Mitawa (MTM) program. Prior to that we had lived in apartments, getting by, establishing our careers while raising a family. The MTM program was more than a dream come true; it changed our lives, gave us a sense of ownership, pride and budgeting skills. It gave us the ability to secure our children’s futures. Our home has also become the place that our extended family gathers for holidays, special occasions and care.”
– Kimb Williams
3 Data on new households served by the Manitoba Housing and Renewal Corporation is provided by the Department of Families, annually.
Page 8 | All Aboard: Manitoba’s Poverty Reduction and Social Inclusion Strategy 2016/17 Annual Report
BuildingEmploymentOpportunitiesThroughSocialEnterpriseThe Manitoba Housing and Renewal Corporation (MHRC) has had a unique, eight‑year relationship with social enterprises. The relationship has been fostered through partnerships with social enterprises that provide training and employment opportunities for those facing barriers to employment. Through its procurement activities, MHRC offers $5 to $7 million annually in contracts to various social enterprises, which in turn support more than 200 individuals, per year.
MHRC and social enterprise partners have worked collaboratively to develop various concepts and management processes that have demonstrated reasonable contracting value and verifiable social outcomes. A positive result from lessons learned was MHRC’s creation of a Social Enterprise Contracting/Support Team (in November 2015) responsible for the maintenance, growth and monitoring of social enterprise relationships.
In 2016/17, this team managed the contracting and support services related to the following social enterprises:
• Building Urban Industry through Local Development (B.U.I.L.D.)
• Manitoba Green Retrofit (MGR) • New Directions Genesis • North End Community Renewal Corporation (NECRC)• Inner City Renovation (ICR)• Brandon Neighbourhood Renewal Corporation (BNRC)
By March 31, 2017, social enterprise contractors had completed 850 unit turns and 53 capital unit refresh projects with excellent results. These contractors consistently maintain good quality workmanship, on time delivery, and at a fair market value. MHRC relies on social enterprise contractors for prompt unit turns to reduce vacancy. Long‑term procurement contracts/memoranda of understanding are in place with social enterprises in Winnipeg and Brandon.
Work is underway to develop a social procurement policy that builds on existing relationships that foster new business, as well as social and community partnerships, aimed at giving Manitobans work that is linked with social supports.
MHRC monitors the social impact of government investment in social enterprises and reports these outcomes using a Social Return on Investment (SROI) measurement tool. The most recent SROI analysis indicates the total return on purchasing services from social enterprises was $3.52 for every $1.00 invested, creating value for government and other stakeholders.
ConsultingManitobanstoBuildaNewProvincialHousingStrategyIn 2016/17, over 1,500 of Manitobans participated in a public consultation process to inform the development of a made‑in‑Manitoba Provincial Housing Strategy.
Consultations sought the feedback of Manitobans on the following broad‑based themes:
• Addressing Homelessness• Condition of Existing Social and Affordable Housing Stock • Affordability of Housing • Supports for Existing and Potential Homeowners
By focusing on the development of solutions, the consultation process provided an opportunity to capture stakeholder and community input to ensure that provincial programs and services remain relevant and that government priorities are responsive to community needs.
Stakeholder input was gathered via online survey, written submissions, in‑person consultations held with Indigenous service providers, members of the Manitoba Métis Federation, as well as through regional stakeholder consultations.
All Aboard: Manitoba’s Poverty Reduction and Social Inclusion Strategy 2016/17 Annual Report | Page 9
Indicator 3Households in Core Housing Need4
What Does This Indicate? Core housing need refers to housing that falls below one of Canada’s affordability, suitability or adequacy standards, described below:
• Affordable dwellings cost less than 30.0% of total before‑tax household income
• Suitable dwellings have sufficient bedrooms for the size and make‑up of households (according to National Occupancy Standards)
• Adequate dwellings are those that residents report as neither requiring any major repairs nor lacking systems (plumbing, wiring and structure)
If a household could spend less than 30.0% of its before‑tax income to pay the median rent for alternative local market housing that meets all three standards, it is not considered to be in core housing need.
Why is This Important?This indicator reflects the extent of housing problems experienced by Manitobans.
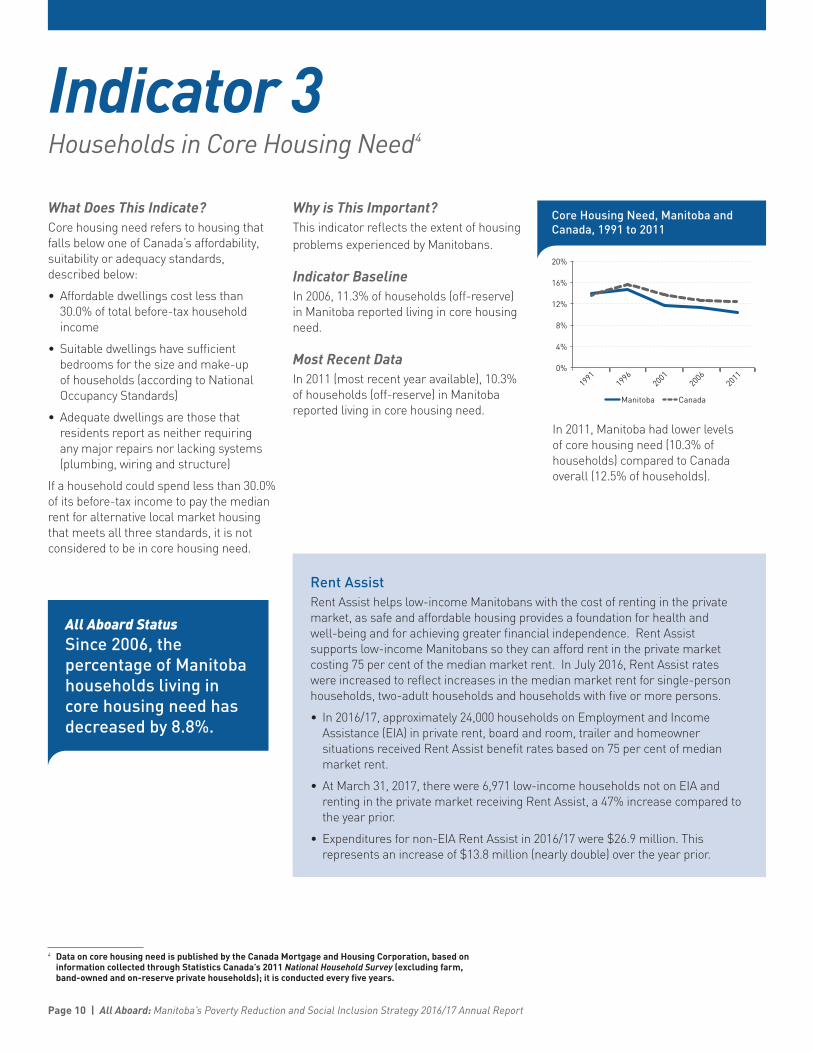
Indicator BaselineIn 2006, 11.3% of households (off‑reserve) in Manitoba reported living in core housing need.
Most Recent DataIn 2011 (most recent year available), 10.3% of households (off‑reserve) in Manitoba reported living in core housing need.
CoreHousingNeed,ManitobaandCanada,1991to2011
0%
4%
8%
12%
16%
20%
1991
1996
2001
2006
2011
Manitoba Canada
In 2011, Manitoba had lower levels of core housing need (10.3% of households) compared to Canada overall (12.5% of households).
All Aboard StatusSince2006,thepercentageofManitobahouseholdslivingincorehousingneedhasdecreasedby8.8%.
RentAssistRent Assist helps low‑income Manitobans with the cost of renting in the private market, as safe and affordable housing provides a foundation for health and well‑being and for achieving greater financial independence. Rent Assist supports low‑income Manitobans so they can afford rent in the private market costing 75 per cent of the median market rent. In July 2016, Rent Assist rates were increased to reflect increases in the median market rent for single‑person households, two‑adult households and households with five or more persons.
• In 2016/17, approximately 24,000 households on Employment and Income Assistance (EIA) in private rent, board and room, trailer and homeowner situations received Rent Assist benefit rates based on 75 per cent of median market rent.
• At March 31, 2017, there were 6,971 low‑income households not on EIA and renting in the private market receiving Rent Assist, a 47% increase compared to the year prior.
• Expenditures for non‑EIA Rent Assist in 2016/17 were $26.9 million. This represents an increase of $13.8 million (nearly double) over the year prior.
4 Data on core housing need is published by the Canada Mortgage and Housing Corporation, based on information collected through Statistics Canada’s 2011 National Household Survey (excluding farm, band‑owned and on‑reserve private households); it is conducted every five years.
Page 10 | All Aboard: Manitoba’s Poverty Reduction and Social Inclusion Strategy 2016/17 Annual Report

Indicator 4Sense of Community Belonging5
What Does This Indicate? Community belonging represents the percentage of population (12 years and over) who report a sense of belonging to their local community as somewhat or very strong (versus somewhat or very weak).
Why is This Important?This indicator measures social attachment to the community and is related to social inclusion.
Indicator BaselineIn 2008, 68.2% of Manitobans (12 years and over) reported a somewhat or very strong sense of belonging to their local community.
Most Recent DataIn 2015 (most recent year available), 71.7% of Manitobans (12 years and over) reported a somewhat or very strong sense of belonging to their local community.6
SenseofCommunityBelonging,ManitobaandCanada,2003to2015
60%
62%
64%
66%
68%
70%
72%
2003
2007
2008
2009
2010
2011
2012
2013
2014
2015
Manitoba Canada
Sense of community belonging in Manitoba has been consistently better than the national average.
All Aboard StatusSince2008,senseofcommunitybelonginginManitobahasbeenstable(increasingby5%).
MentalHealthandAddictionsIn 2016/17, the Government of Manitoba strengthened integration and coordinated approaches to mental health promotion, prevention, support and treatment for Manitobans, in partnership and collaboration with people with lived experience of mental health problems and illnesses, family members, other government departments, service providers and other partners.• Information was collected from the Regional Health Authorities to evaluate the
uptake and effectiveness of employment training and supports delivered by the Regional Health Authorities, under the Labour Market Agreement for Persons with Disabilities between the Governments of Canada (GOC) and Manitoba (GOM), whereby GOC provides funding through GOM to Regional Health Authorities to help clients with mental illness enter and stay in the labour market through access to employment training and skill development.
In 2016/17, the Government of Manitoba has coordinated approaches to mental health services for youth with a focus on Indigenous youth.• In collaboration with Regional Health Authorities and other external stakeholders,
completed the eighth full year of implementation of the Youth Suicide Prevention Strategy with a focus on Indigenous youth and suicide.
• Led a coordinated effort to improve prescription monitoring and surveillance, naloxone distribution and public awareness to address the opiate crisis, including: – Hiring a Coordinator to manage naloxone distribution sites across Manitoba,
including the procurement of an initial 390 naloxone kits immediately upon establishment; and
– Partnering in the launch of a second public awareness campaign concerning the opiate crisis that focused on social media in order to reach a broader population.
5 Data on sense of community belonging is collected by Statistics Canada through the Canadian Community Health Survey (CCHS). Source data for 2003 to 2014: Statistics Canada. Table 105‑0501– Health indicator profile, annual estimates, by age group and sex, Canada, provinces, territories, health regions (2013 boundaries) and peer groups, occasional, CANSIM (database).(accessed: August 14, 2017).
6 Statistics Canada. Table 105‑0508– Canadian health characteristics, annual estimates, by age group and sex, Canada (excluding territories) and provinces, occasional, CANSIM (database).(accessed: August 14, 2017). Note: As a result of 2015 redesign, CCHS has a new collection strategy, a new sample design, and has undergone major content revisions. With all these factors taken together, caution should be taken when comparing data from previous cycles to data released for 2015 and onwards.
All Aboard: Manitoba’s Poverty Reduction and Social Inclusion Strategy 2016/17 Annual Report | Page 11

Indicator 5High School Graduation Rates7
What Does This Indicate? Manitoba’s proxy cohort high school graduation rate is the ratio of the total number of graduates from both public and funded independent high schools each year to the total Grade 9 enrolment in these schools four years prior to the year of graduation.
Why is This Important?High school graduation is generally viewed as the minimum requirement for pursuing additional education and for entry into the world of work.
Indicator BaselineIn 2008, Manitoba’s proxy cohort high school graduation rate was 79.0%.
Most Recent DataIn 2016, Manitoba’s proxy cohort high school graduation rate was 87.8%
ProxyCohortGraduationRate,Manitoba,June2002toJune2016
2002
2004
2006
2008
2010
2012
2016
2014
2003
2005
2007
2009
2011
2015
2013
60%
65%
70%
75%
80%
85%
90%
The proxy cohort high school graduation rate in Manitoba increased by 1.7 percentage points in 2016 (87.8%) from 2015 (86.1%).
All Aboard StatusSince2008,Manitoba’sproxycohorthighschoolgraduationratehasimprovedby8.8percentagepoints.
ElmwoodSchoolStudentSuccessCentre(SSC)“SSC was a huge help for me because it was quiet and peaceful. The teachers were involved more with you in SSC, they did not move onto another until you got the question. Plus they always have fruit if you are hungry and can’t focus. For me SSC was the best place to be if I was mad or upset or I had a problem. If I was to rate it, 10/10.”
– SSC Student
7 Graduation rates are provided annually by the Department of Education and Training. In addition to the proxy cohort rate, the Department also produces a student‑tracked rate. For more information, please see http://www.edu.gov.mb.ca/k12/grad_rates/index.html.
Page 12 | All Aboard: Manitoba’s Poverty Reduction and Social Inclusion Strategy 2016/17 Annual Report
SchoolNourishmentPrograms:ReducingFoodInsecurityAmongChildrenSince 2008 Manitoba Health, Seniors and Active Living has provided funding to the Child Nutrition Council of Manitoba to distribute funds to schools throughout the province on an application basis for school nourishment programs (breakfast, lunch and snack programs).
Manitoba Education and Training supports the Child Nutrition Council of Manitoba with $301 thousand in funding and Indigenous Relations provides $25 thousand to support school nourishment programs in Northern Manitoba. This represents a total government investment of $976 thousand.
In 2016/17, the Child Nutrition Council of Manitoba supported 211 breakfast, snack and lunch programs, reaching over 22,000 students. These programs were in 228 schools and five Summer Learning programs.
ChildNutritionCouncilofManitoba“As a teacher in this program I have seen a significant increase in our attendance by providing healthy breakfast and lunch to our students. My students are happier and healthier by having this food program. This program helps us develop a positive community and learning environment for our students. The grant provides much needed stability in meal planning and preparation. Many of our students do not have access to healthy food. We teach in a very low income, inner city school. By providing healthy food to our students they not only get great meals, they learn more, they attend school more often and interact with each other in a healthy social atmosphere. Some of our students are pregnant or are new mothers and having healthy food helps these young families to grow healthy and strong.”
– Teacher, Inner City School Winnipeg
PeacefulVillageProgram“Peaceful Village program gave me a chance to develop as a student, not just academically but also socially having Peaceful village at our school gave me chances to meet other student who are not in my classes. I made new friends from around the world: Nepal, Pakistan, Sudan, Nigeria and more. It is great connecting with the students since we get to learn about each other’s culture and even language. I learned Arabic and Urdu. Also Peaceful Village makes possible to share our talents and skills. We can volunteer as tutor, helper or cook for everyday is snack some students spend their time dancing singing and creating arts. By trying various activities we can find our new talents beyond academic skills. As a Grade 12 student, I was able to help younger students with their struggling subjects it was convenient since I know what materials they study how tests are like and the teachers styles. This is a great advantage of having peaceful village at our school site. Overall Peaceful Village provides students wonderful experiences and enjoyable memories.”
– Peaceful Village Participant
All Aboard: Manitoba’s Poverty Reduction and Social Inclusion Strategy 2016/17 Annual Report | Page 13
Indicator 6Participation in Adult Learning Programs8
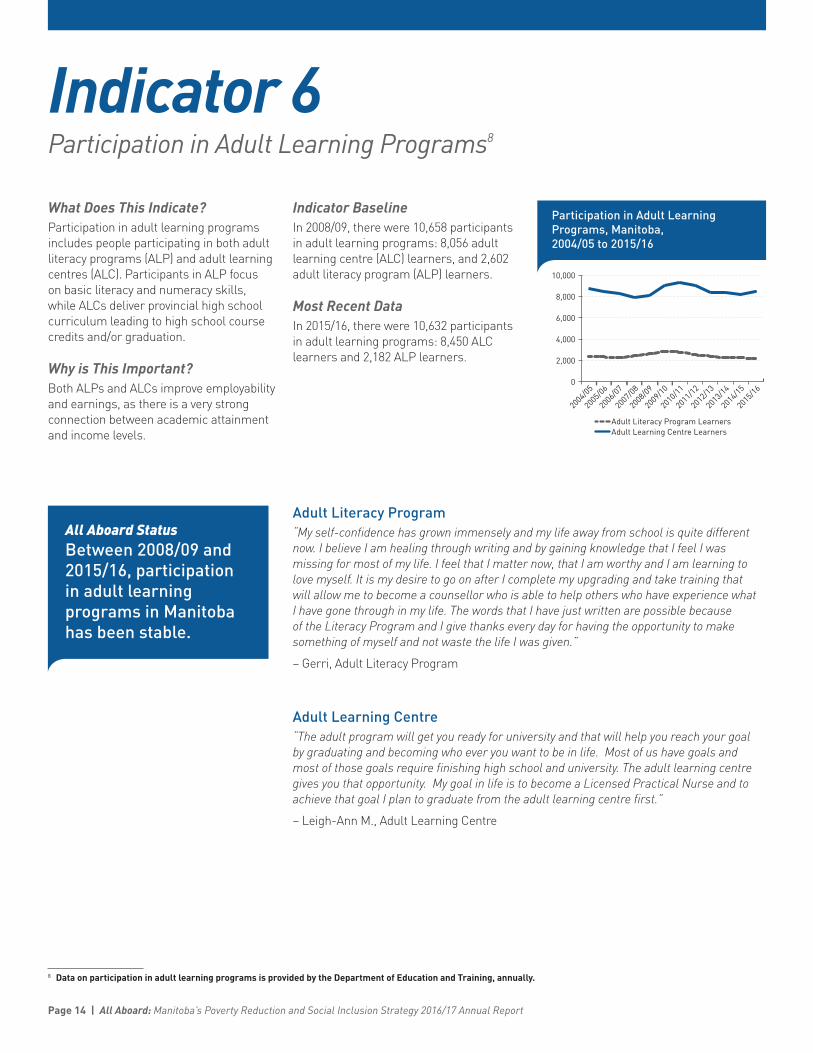
What Does This Indicate? Participation in adult learning programs includes people participating in both adult literacy programs (ALP) and adult learning centres (ALC). Participants in ALP focus on basic literacy and numeracy skills, while ALCs deliver provincial high school curriculum leading to high school course credits and/or graduation.
Why is This Important?Both ALPs and ALCs improve employability and earnings, as there is a very strong connection between academic attainment and income levels.
Indicator BaselineIn 2008/09, there were 10,658 participants in adult learning programs: 8,056 adult learning centre (ALC) learners, and 2,602 adult literacy program (ALP) learners.
Most Recent DataIn 2015/16, there were 10,632 participants in adult learning programs: 8,450 ALC learners and 2,182 ALP learners.
ParticipationinAdultLearningPrograms,Manitoba,2004/05to2015/16
0
2,000
4,000
6,000
8,000
10,000
2004
/05
2005
/06
2006
/07
2007
/08
2008
/09
2009
/10
2010
/11
2011
/12
2012
/13
2013
/14
Adult Literacy Program LearnersAdult Learning Centre Learners
2014
/15
2015
/16
All Aboard StatusBetween2008/09and2015/16,participationinadultlearningprogramsinManitobahasbeenstable.
AdultLiteracyProgram“My self‑confidence has grown immensely and my life away from school is quite different now. I believe I am healing through writing and by gaining knowledge that I feel I was missing for most of my life. I feel that I matter now, that I am worthy and I am learning to love myself. It is my desire to go on after I complete my upgrading and take training that will allow me to become a counsellor who is able to help others who have experience what I have gone through in my life. The words that I have just written are possible because of the Literacy Program and I give thanks every day for having the opportunity to make something of myself and not waste the life I was given.”
– Gerri, Adult Literacy Program
AdultLearningCentre“The adult program will get you ready for university and that will help you reach your goal by graduating and becoming who ever you want to be in life. Most of us have goals and most of those goals require finishing high school and university. The adult learning centre gives you that opportunity. My goal in life is to become a Licensed Practical Nurse and to achieve that goal I plan to graduate from the adult learning centre first.”
– Leigh‑Ann M., Adult Learning Centre
8 Data on participation in adult learning programs is provided by the Department of Education and Training, annually.
Page 14 | All Aboard: Manitoba’s Poverty Reduction and Social Inclusion Strategy 2016/17 Annual Report

Indicator 7Employment Rates9
What Does This Indicate? The employment rate shows the percentage of people (aged 15 and over) who are employed.
Why Is This Important?Employment is an important route out of poverty and social exclusion.
Indicator BaselineIn 2008, 66.3% of all Manitobans (aged 15 and over) were employed.
Most Recent DataIn 2016, 63.4% of all Manitobans (aged 15 and over) were employed.
EmploymentRate,ManitobaandCanada,2001to2016
56%
58%
60%
62%
64%
66%
68%
2001
2002
2003
2004
2005
2006
2007
2008
2009
2010
2012
2011
2015
2016
Manitoba Canada
2013
2014
Manitoba’s employment rate continues to be higher than the national rate.
All Aboard StatusSince2008,Manitoba’semploymentratehasdecreasedby4.4%.
JobsonMarket:PartoftheEIAActionPlanIn 2016/17, the Government of Manitoba developed plans to further improve employment outcomes and increase financial independence for people receiving Employment and Income Assistance (EIA). Many EIA participants have the capacity to work, however, may need supports to prepare for and successfully compete for jobs. In February 2017, the Department of Families introduced a new rapid employment service model in Winnipeg called Jobs on Market, located adjacent to an EIA office.
Jobs on Market has been engaging with clients, fully assessing and identifying their service needs, referring clients to community employment assistance services and monitoring their progress towards employment. On‑site services at Jobs on Market include resume services; on‑site recruitment for temporary labour; and public access workstations, phones and voice mail services to aid in job search activities.
9 Data on employment rates are collected by Statistics Canada through the Labor Force Survey. Statistics Canada. Table 282‑0002‑Labour Force Survey estimates (LFS), by sex and detailed age group, annual (persons unless otherwise noted), CANSIM (database). (accessed: August 14, 2017).
All Aboard: Manitoba’s Poverty Reduction and Social Inclusion Strategy 2016/17 Annual Report | Page 15
RefugeeEmploymentDevelopmentInitiativeIn 2016, the number of refugees arriving in Manitoba exceeded 3,000 – double the average annual levels. Recognizing the gap in employment services and programs for refugee clients with low English language proficiency and skills, Education and Training developed the Refugee Employment Development Initiative (REDI) as a coordinated and collaborative approach between the Government of Manitoba, service providers and businesses. REDI programming includes occupation‑specific training, English for work, a work experience/work placement, and ongoing supports for both individual program participants and employer partners. The ultimate goal of REDI is to integrate refugee job seekers into the Manitoba workforce more quickly, reducing their dependence on income supports. The initiative relies on a partnership with the Department of Families to ensure seamless transition and exit supports from Employment and Income Assistance.
At a cost of over $1 million, there are four Service Providers contracted to deliver REDI pilot projects, with an overall projected goal of 172 distinct clients served through the program:
• Red River College;• Manitoba Institute of Trades and Technology;• Opportunities for Employment; and,• Manitoba Start
AccesstoTradesTrainingApprenticeship Manitoba offers Community Delivered Training (CDT), which provides the opportunity for rural and northern apprentices to gain access to technical training in a designated trade without leaving their home communities. Communities that received CDT in 2016/17 included Lake Manitoba First Nation, Split Lake First Nation, Peguis First Nation and Swan River.
Two bursaries are available to individuals who demonstrate financial need to help them attend trades technical training. The Access to Apprenticeship Bursary is open to all apprentices, and The Tim McLean Memorial Bursary, awarded annually, is open to Indigenous apprentices.
SocialEnterpriseStrategyThe Government of Manitoba is committed to growing employment‑focused social enterprises that provide training and employment opportunities to those with barriers to entering the labour market.
The Manitoba Housing and Renewal Corporation has been an active member of the Social Enterprise Steering Committee, co‑chaired by the Government of Manitoba and the Canadian Community Economic Development Network Manitoba (CCEDNET‑MB), and provides a direct liaison between community and government on related issues. Particular accomplishments include:
• Increasing awareness within the community of the value of social enterprise through various community events
• Enhancing the technical and business skills of social enterprises through province wide “train‑the‑trainer” seminars and online support through the Social Enterprise Institute
• Introducing government small business support staff to the concepts and value of social enterprise
• Growing market opportunities for social enterprise through a procurement support team
The Manitoba Housing and Renewal Corporation remains the lead government agency supporting the strategy and spends $5 to $7 million per year contracting with social enterprises across the province. These social enterprises provide training and employment opportunities to more than 200 individuals per year.
Page 16 | All Aboard: Manitoba’s Poverty Reduction and Social Inclusion Strategy 2016/17 Annual Report

Indicator 8Average Weekly Earnings10
What Does This Indicate? Statistics Canada’s calculation of average weekly earnings is based on a survey that asks people their usual wage or salary at their main job, before taxes and other deductions, including commissions and tips, and excluding farm income and income from self‑employment.
Why Is This Important?Change in this indicator shows changes in average earnings, after inflation.11
Indicator BaselineIn 2008, the average weekly earnings in Manitoba were $797.40 (constant dollars 2016); figures have been adjusted to the most recent year to permit analysis of average earnings after accounting for inflation.
Most Recent DataIn 2016, average weekly earnings in Manitoba were $857.00.
AverageWeeklyEarnings,2016ConstantDollars,ManitobaandCanada,2001to2016
$0
$200
$400
$600
$800
$1000
2001
2003
2005
2007
2009
2011
2013
2002
2004
2006
2008
2010
2012
2014
Manitoba Canada
2015
2016
Average weekly earnings in Manitoba have gone up by approximately 1% in 2016 (after inflation) compared to the previous year.
All Aboard StatusSince2008,Manitoba’saverageweeklyearningshaveincreasedby7.5%(afterinflation).
ReducingFoodInsecurityinRemoteManitobaAffordable Food in Remote Manitoba (AFFIRM) is a retail subsidy which reduces the price of milk, infant formula, fresh vegetables and fresh fruits in remote Northern communities (rail or fly‑in access only) that are not eligible for the federal Nutrition North Canada (NNC) subsidy. Participating stores are required to pass the full subsidy on to the customer.
AFFIRM is currently available in Pukatawagan and Churchill. The AFFIRM subsidy rate in Churchill was increased to offset higher food costs due to rail transportation suspension and the subsequent need to fly food in to the community. For 2017/18 AFFIRM program costs are estimated to be $404 thousand.
10 Data on average weekly earnings are collected by Statistics Canada through the Labour Force Survey. Statistics Canada. Table 282‑0074‑ Labour Force Survey estimates (LFS), wages of employees by job permanence, union coverage, sex and age group, annual (current dollars unless otherwise noted). CANSIM (database). (accessed August 15, 2017).
11 Figures have been adjusted to 2016 constant dollars using Statistics Canada’s Consumer Price Index (CPI) for all items for Manitoba. Statistics Canada. Table 326‑0021‑Consumer Price Index, annual (2002=100 unless otherwise noted). (accessed: August 15, 2017).
All Aboard: Manitoba’s Poverty Reduction and Social Inclusion Strategy 2016/17 Annual Report | Page 17
Indicator 9Minimum Wage Rates12
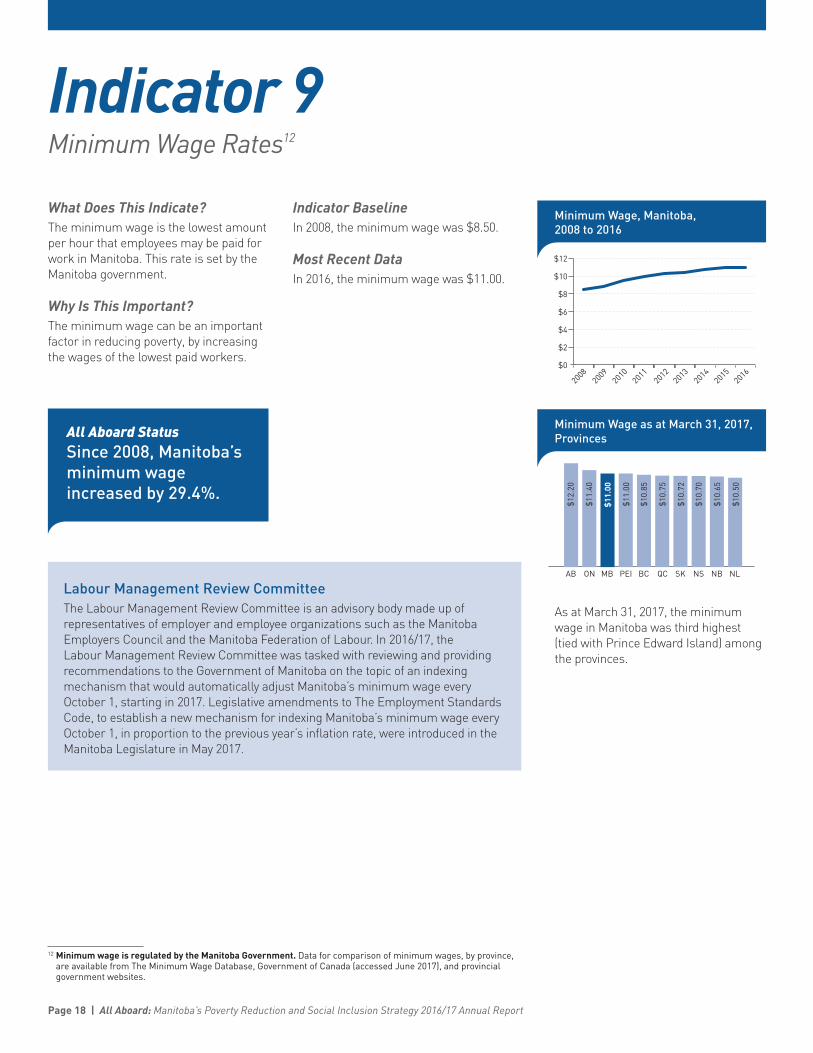
What Does This Indicate? The minimum wage is the lowest amount per hour that employees may be paid for work in Manitoba. This rate is set by the Manitoba government.
Why Is This Important?The minimum wage can be an important factor in reducing poverty, by increasing the wages of the lowest paid workers.
Indicator BaselineIn 2008, the minimum wage was $8.50.
Most Recent DataIn 2016, the minimum wage was $11.00.
MinimumWage,Manitoba,2008to2016
$0
$2
$4
$6
$8
$10
$12
2008
2009
2011
2010
2012
2013
2014
2016
2015
$12.
20
$11.
40
$11.00
$11.
00
$10.
85
$10.
75
$10.
72
$10.
70
$10.
65
$10.
50
AB ON MB NBPEI BC NS NLQC SK
MinimumWageasatMarch31,2017,Provinces
$0
$2
$4
$6
$8
$10
$12
2008
2009
2011
2010
2012
2013
2014
2016
2015
$12.
20
$11.
40
$11.00
$11.
00
$10.
85
$10.
75
$10.
72
$10.
70
$10.
65
$10.
50
AB ON MB NBPEI BC NS NLQC SK
As at March 31, 2017, the minimum wage in Manitoba was third highest (tied with Prince Edward Island) among the provinces.
All Aboard Status Since2008,Manitoba’sminimumwageincreasedby29.4%.
LabourManagementReviewCommitteeThe Labour Management Review Committee is an advisory body made up of representatives of employer and employee organizations such as the Manitoba Employers Council and the Manitoba Federation of Labour. In 2016/17, the Labour Management Review Committee was tasked with reviewing and providing recommendations to the Government of Manitoba on the topic of an indexing mechanism that would automatically adjust Manitoba’s minimum wage every October 1, starting in 2017. Legislative amendments to The Employment Standards Code, to establish a new mechanism for indexing Manitoba’s minimum wage every October 1, in proportion to the previous year’s inflation rate, were introduced in the Manitoba Legislature in May 2017.
12 Minimum wage is regulated by the Manitoba Government. Data for comparison of minimum wages, by province, are available from The Minimum Wage Database, Government of Canada (accessed June 2017), and provincial government websites.
Page 18 | All Aboard: Manitoba’s Poverty Reduction and Social Inclusion Strategy 2016/17 Annual Report
Indicator 10Low‑Income Rates13
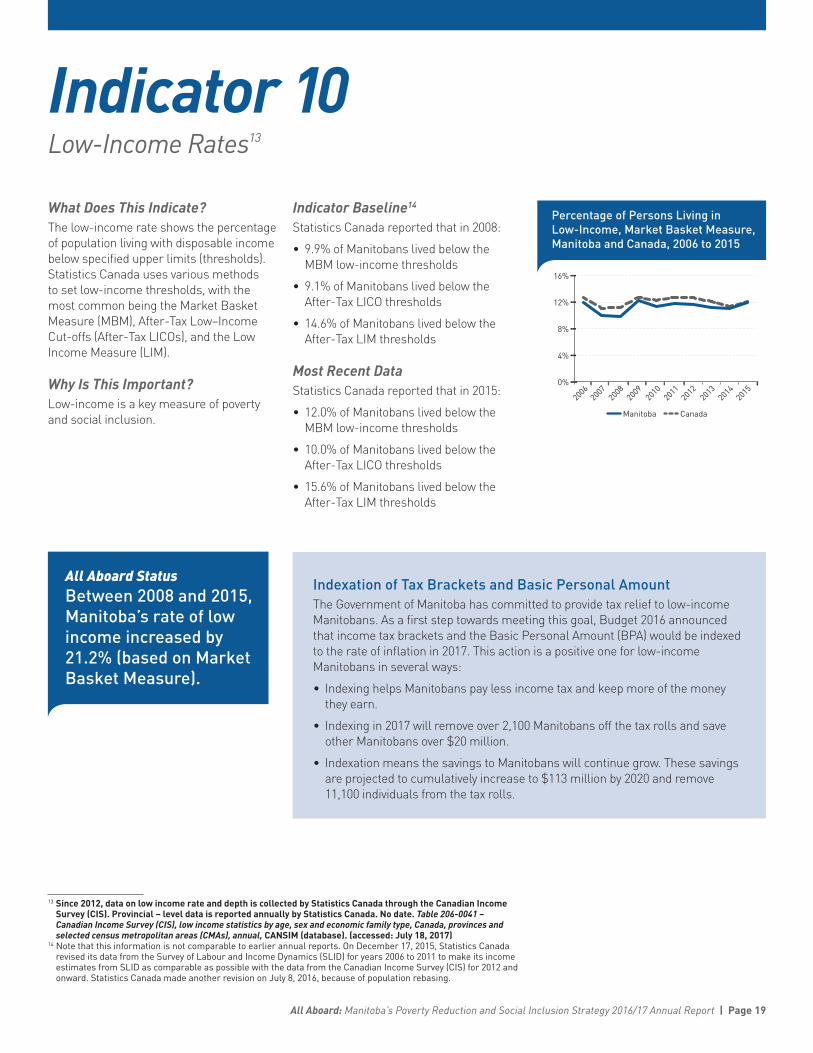
What Does This Indicate? The low‑income rate shows the percentage of population living with disposable income below specified upper limits (thresholds). Statistics Canada uses various methods to set low‑income thresholds, with the most common being the Market Basket Measure (MBM), After‑Tax Low–Income Cut‑offs (After‑Tax LICOs), and the Low Income Measure (LIM).
Why Is This Important?Low‑income is a key measure of poverty and social inclusion.
Indicator Baseline14
Statistics Canada reported that in 2008:
• 9.9% of Manitobans lived below the MBM low‑income thresholds
• 9.1% of Manitobans lived below the After‑Tax LICO thresholds
• 14.6% of Manitobans lived below the After‑Tax LIM thresholds
Most Recent DataStatistics Canada reported that in 2015:
• 12.0% of Manitobans lived below the MBM low‑income thresholds
• 10.0% of Manitobans lived below the After‑Tax LICO thresholds
• 15.6% of Manitobans lived below the After‑Tax LIM thresholds
PercentageofPersonsLivinginLow‑Income,MarketBasketMeasure,ManitobaandCanada,2006to2015
0%
4%
8%
12%
16%
2006
2007
2008
2009
2010
2012
2011
Manitoba Canada
2013
2014
2015
All Aboard StatusBetween2008and2015,Manitoba’srateoflowincomeincreasedby21.2%(basedonMarketBasketMeasure).
IndexationofTaxBracketsandBasicPersonalAmountThe Government of Manitoba has committed to provide tax relief to low‑income Manitobans. As a first step towards meeting this goal, Budget 2016 announced that income tax brackets and the Basic Personal Amount (BPA) would be indexed to the rate of inflation in 2017. This action is a positive one for low‑income Manitobans in several ways:
• Indexing helps Manitobans pay less income tax and keep more of the money they earn.
• Indexing in 2017 will remove over 2,100 Manitobans off the tax rolls and save other Manitobans over $20 million.
• Indexation means the savings to Manitobans will continue grow. These savings are projected to cumulatively increase to $113 million by 2020 and remove 11,100 individuals from the tax rolls.
13 Since 2012, data on low income rate and depth is collected by Statistics Canada through the Canadian Income Survey (CIS). Provincial – level data is reported annually by Statistics Canada. No date. Table 206‑0041 – Canadian Income Survey (CIS), low income statistics by age, sex and economic family type, Canada, provinces and selected census metropolitan areas (CMAs), annual, CANSIM (database). (accessed: July 18, 2017)
14 Note that this information is not comparable to earlier annual reports. On December 17, 2015, Statistics Canada revised its data from the Survey of Labour and Income Dynamics (SLID) for years 2006 to 2011 to make its income estimates from SLID as comparable as possible with the data from the Canadian Income Survey (CIS) for 2012 and onward. Statistics Canada made another revision on July 8, 2016, because of population rebasing.
All Aboard: Manitoba’s Poverty Reduction and Social Inclusion Strategy 2016/17 Annual Report | Page 19

NoClawbackofCanadianChildBenefitThe federal Canada Child Benefit provides families a maximum benefit of $6,400.00 per year for each child under six and $5,400.00 per year for each child over six.
Families on Employment and Income Assistance (EIA) get to keep the full value of the federal Canada Child Benefit and it does not impact the amount of social assistance they receive each month. The monthly value of the Canada Child Benefit for families on EIA in Manitoba 2016/17 is estimated to be $12 million (annualized estimated value of $144 million) supporting approximately 11,400 families with 24,900 children each month.
ImprovingAccesstoBenefitsThe Know Your Benefits pilot project, launched in 2016/17, was initiated by the Manitoba Housing and Renewal Corporation and supported by a number of community organizations. This innovative project provided free tax filing services to Manitoba Housing tenants in Selkirk and Portage la Prairie, with a focus on ensuring that all tax‑related benefits for those living in low‑income situations were received. The scope of the project included providing Manitoba Housing and Renewal Corporation staff, tenants, and other program participants with access to information on the financial benefit of filing taxes, and tightened linkages to other free tax filing services in their communities.
A new web page was also launched to broaden outreach and awareness of additional resources on accessing government and community based supports: www.gov.mb.ca/housing/tenants/tax.html.
The strength of the Know Your Benefits projects stems from collaboration and systems integration between programs across the Province, federal government, and community based organizations in an effort to address poverty and improve outcomes for Manitobans in need.
Get Your Benefits, a clinical tool and list of resources, assists health care providers to assess poverty as a health risk factor and better support clients to address barriers in accessing benefits. Manitoba Health, Seniors and Active Living promotes the use of Get Your Benefits with health professionals, through public health programs (such as Healthy Baby, Families First, Healthy Start for Mom and Me) and in clinical care settings; volunteer programs are being developed with community partners to assist clients with completing forms in order to access eligible benefits.
More information about the Get your Benefits initiative is found at: http://www.gov.mb.ca/health/primarycare/providers/povertytool.html
SocialImpactBonds:AnInnovativeApproachtoAddressComplexSocialIssuesThe Departments of Families and Justice have received mandates to find alternate ways of delivering social services by developing and implementing a made‑in‑Manitoba Social Impact Bond (SIB), which encourages the private and non‑for‑profit sectors to work collaboratively with government and find solutions to pressing social issues that require an innovative approach.
Private investment will be used to fund social interventions and government will provide a financial return to investors, based on improved social outcomes.
In 2016/17, the Departments of Families and Justice have assessed government’s capacity to develop a SIB, initiated discussions with potential service providers, and developed the context for selecting a landmark SIB, including an ongoing framework for soliciting SIB proposals in the coming year.
Page 20 | All Aboard: Manitoba’s Poverty Reduction and Social Inclusion Strategy 2016/17 Annual Report

Indicator 11Income Inequality15
What Does This Indicate? Income inequality is measured using the Gini coefficient, which shows the difference between absolute equality (where everyone shares equally in wealth), and actual income distribution; inequality is expressed as a value ranging from 0 (perfect equality) to 1 (maximum inequality). The Gini coefficient is not necessarily sensitive to changes in income distribution, which can be examined by looking at how after‑tax income is distributed across income groups, using income quintiles or deciles, or as percentage share of average after‑tax income.16
Why Is This Important?This indicator reflects inequality in the distribution of income.
Indicator BaselineIn 2008, Manitoba’s Gini coefficient was 0.305 based on adjusted after‑tax income.17
The average after‑tax incomes of economic families (including persons not in economic families) in each income quintile (constant dollars, 2015) were as follows:
Lowest Second Third Fourth Highest
2008 $16,150 $35,350 $52,900 $75,300 $134,250
Most Recent DataIn 2015, Manitoba’s Gini coefficient was 0.300 based on adjusted after‑tax income (adjusted by Statistics Canada for household size).
The average after‑tax incomes of economic families (including persons not in economic families) in each income quintile (constant dollars, 2015) were as follows:
Lowest Second Third Fourth Highest
2015 $16,750 $37,350 $55,600 $80,550 $139,400
All Aboard StatusBetween2008and2015,Manitoba’sGinicoefficient(basedonadjustedafter‑taxincome)improvedfrom0.305to0.300.
GiniCoefficient,ManitobaandCanada,2006to2015
0.2750.2800.2850.2900.2950.3000.3050.3100.3150.320
2006
2007
2008
2009
2010
2012
2011
Manitoba Canada
2013
2015
2014
Manitoba’s income distribution is consistently more equitable than the national average.
15 Data on Gini coefficient and income distribution by decile (adjusted into income quintiles) is collected by Statistics Canada through the Canadian Income Survey (CIS). Provincial‑level data is reported annually by Statistics Canada. No Date. Table 206‑0031 – Canadian Income Survey (CIS), upper income limit, income share and average of market, total and after‑tax income by economic family type and income decile, Canada and provinces, annual, CANSIM (database). (accessed: July 18, 2017). Statistics Canada. No date. Table 206‑0033 – Canadian Income Survey (CIS), Gini coefficients of adjusted market, total and after‑tax income, Canada and provinces, annual, CANSIM (database). (accessed: July 18, 2017).
16 Statistics Canada defines income deciles and quintiles, as follows: all the units of the population, whether economic families or persons not in an economic family, are ranked from lowest to highest by the value of their household income of a specified income concept. Then, the ranked population is divided into ten groups of equal numbers of units (deciles), or five groups of equal numbers (quintiles).
17 After‑tax income is adjusted by Statistics Canada for household size to consider economies of scale with increasing household size.
All Aboard: Manitoba’s Poverty Reduction and Social Inclusion Strategy 2016/17 Annual Report | Page 21
ProvincialSalesTaxManitoba’s Provincial Sales Tax (PST) rate is currently 8%. It was increased from 7% to 8% beginning July 1, 2013 through June 30, 2023. The increase impacted Manitoba families by an estimated $151 million in 2016. This equates to about $300 per household per year ($25/month). The increase cost businesses about $116 million in 2016.
The increase is estimated to generate $291 million in revenue of which over 52% is attributable to Manitoba families ($150 million), over 40% is attributable to businesses ($116 million), and the remaining 8% is attributable to universities, schools, hospitals and the three levels of government ($23 million).
While there are several tax credits (Personal Tax Credit, Manufacturing Investment Tax Credit, Data Processing Investment Tax Credit, New Rental Housing Construction Tax Credit) that may offset the Provincial Sales Tax, the Government of Manitoba has committed to reducing the PST rate from 8% to 7%.
Seniors’SchoolTaxRebateThe Seniors’ School Tax Rebate benefitted an estimated 34,500 senior homeowners in 2016.
The total school tax savings for these individuals because of the Rebate is estimated to be $10.8 million for the 2016 property tax year.
Eligible seniors below the $40,000 income‑tested threshold are eligible for a full Rebate depending on net school tax paid. Senior households with a family net income of $63,500 and over no longer receive the Rebate. Administration of the Rebate through the income tax system will permit retroactive claims of up to three years.
Page 22 | All Aboard: Manitoba’s Poverty Reduction and Social Inclusion Strategy 2016/17 Annual Report

Indicator 12Post‑secondary Education Participation18
What Does This Indicate? Post‑secondary education participation includes the proportion of the population, 18 to 34 years, who are attending a post‑secondary institution in Manitoba.
Why Is This Important?There is a direct correlation between level of education and earnings.
Indicator BaselineIn 2008/09, 19.6% of 18 to 34 year olds in Manitoba attended a post‑secondary institution in Manitoba, broken down as follows:
2008/09
18 to 24 years 32.9%
25 to 29 years 12.6%
30 to 34 years 6.3%
18 to 34 years 19.6%
Most Recent DataIn 2016/17, 19.6% of 18 to 34 year olds in Manitoba attended a post‑secondary institution in Manitoba.
The percentage of the population (18 to 34 years) who are attending a post‑secondary institution in Manitoba is generally stable.
2016/17
18 to 24 years 34.6%
25 to 29 years 12.0%
30 to 34 years 7.0%
18 to 34 years 19.6%
Between 2008/09 and 2016/17, the proportion of the population (18 to 34 years) who attended a public post‑secondary institution in Manitoba has remained generally stable. However, some fluctuations appear within the age cohorts. In particular, a growth in rate of attendance was reported for 18 to 24 year olds (1.7 percentage point increase).
PercentageofthePopulation(18to34years)WhoAreAttendingaPost‑secondaryInstitution,Manitoba,2008/09to2016/17
2008
/09
2009
/10
2010
/11
2011
/12
2012
/13
2013
/14
2014
/15
2015
/16
2016
/17
0
5
10
15
20
25
Manitoba Canada
All Aboard StatusBetween2008/09and2016/17,theparticipationrateof18to34yearoldsinpost‑secondaryeducationhasremainedstable.
18 Data on post‑secondary education participation is collected by Statistics Canada through the Labour Force Survey, and customized for Manitoba, by age groups, annually.
All Aboard: Manitoba’s Poverty Reduction and Social Inclusion Strategy 2016/17 Annual Report | Page 23
TuitionWaiverProgramThe University of Winnipeg was Manitoba’s first post‑secondary institution to introduce a tuition waiver bursary program to support the cost of post‑secondary education for youth who grew up in foster care. Currently there are nine post‑secondary institutions that offer tuition waivers with a total of 95 waivers available to eligible individuals.
The post‑secondary institutions are responsible for the waiving of tuition. Child and Family Services (CFS) Authorities cover additional living expenses for students under CFS care and those on extensions of care. Since 2012, when CFS supports for individuals reaching the age of 21 are discontinued, Manitoba Education and Training, through the Skills and Employment Partnerships branch has supported 44 individuals through the Tuition Waiver Program at a cost of over $778 thousand. Both part‑time and full‑time students are eligible for support through Manitoba Education and Training’s Tuition Waiver program.
Of the 44 students that have been supported between 2012/13 and 2016/17, 20 have graduated and are employed, 13 are still in school, and 11 did not complete their education.
UniversityCollegeoftheNorth:Student‑In‑CareTuitionWaiverIn March 2017, University College of the North (UCN) and the four Child and Family Services authorities (General, Métis, Northern and Southern) signed a Memorandum of Understanding (MOU) establishing the Student‑In‑Care Tuition Waiver. Under the MOU UCN will offer tuition waivers in each academic year to up to five students who are or will be extended in care, or former youth in care not eligible for an extension of care. In its inaugural year, two students will be supported through the program.
ManitobaScholarshipsandBursariesThe Government of Manitoba is committed to an accessible and sustainable post‑secondary education system with enhanced support for those who need it and when they need it. Financial supports like student loans, and bursaries, grants and scholarships will provide the money needed to students as they attend post‑secondary education and pay for everyday expenses.
There are a number of non‑repayable grants available to students:
• The Manitoba Bursary is a non‑repayable grant that provides up to $2,000 per eligible low‑income student. This bursary mirrors the Canada Student Grant which also provides up to $3,000 for a total support of $5,000 per year beginning 2017/18.
• In 2017/18 a change in the matching formula of the Manitoba Scholarship and Bursary Initiative (MSBI) is estimated to result in up to $20 million in scholarships and bursaries going directly to students each year, with the province matching one‑third of funding raised by post‑secondary institutions through private donors. The changes to the MSBI demonstrate a priority on helping students that are low‑income and demonstrate financial need.
• There are also a number of other financial supports available to students such as Access Bursaries, Return for Service Agreements in health related professions and veterinary medicine, the Manitoba Graduate Scholarships, and Inter‑provincial Training Agreements totalling over $15 million.
Page 24 | All Aboard: Manitoba’s Poverty Reduction and Social Inclusion Strategy 2016/17 Annual Report
Indicator 13Early Development Instrument Scores19
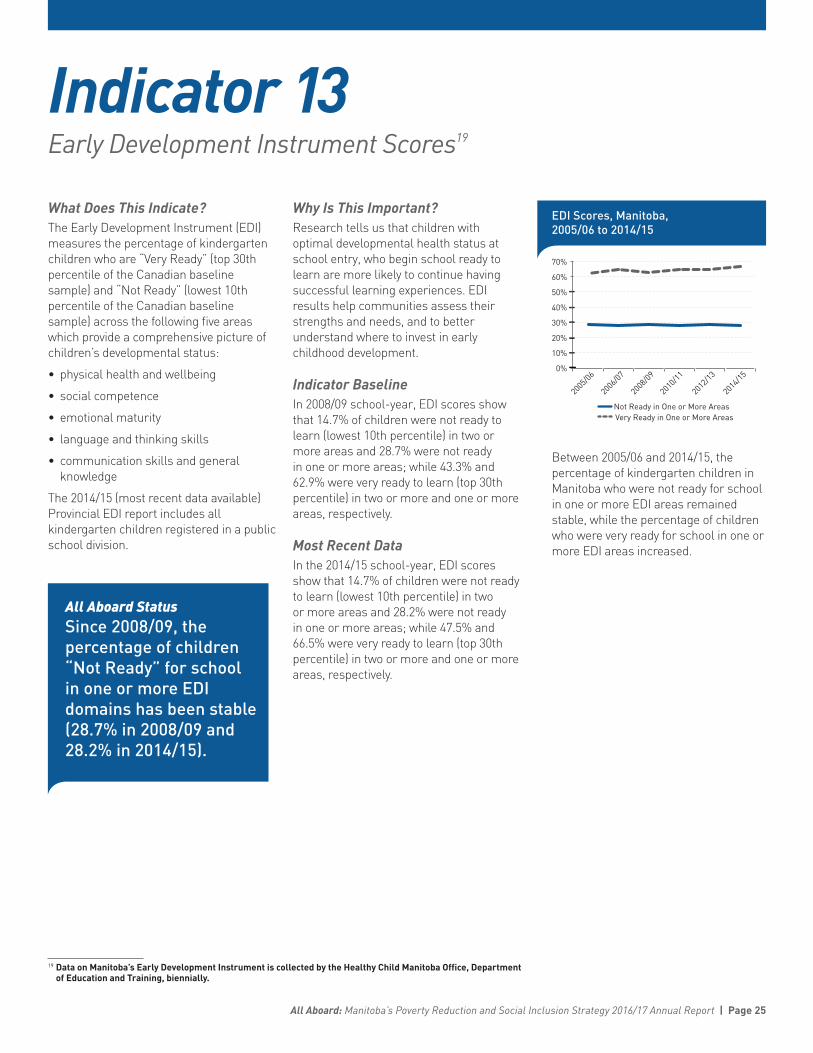
What Does This Indicate? The Early Development Instrument (EDI) measures the percentage of kindergarten children who are “Very Ready” (top 30th percentile of the Canadian baseline sample) and “Not Ready” (lowest 10th percentile of the Canadian baseline sample) across the following five areas which provide a comprehensive picture of children’s developmental status:
• physical health and wellbeing
• social competence
• emotional maturity
• language and thinking skills
• communication skills and general knowledge
The 2014/15 (most recent data available) Provincial EDI report includes all kindergarten children registered in a public school division.
Why Is This Important?Research tells us that children with optimal developmental health status at school entry, who begin school ready to learn are more likely to continue having successful learning experiences. EDI results help communities assess their strengths and needs, and to better understand where to invest in early childhood development.
Indicator BaselineIn 2008/09 school‑year, EDI scores show that 14.7% of children were not ready to learn (lowest 10th percentile) in two or more areas and 28.7% were not ready in one or more areas; while 43.3% and 62.9% were very ready to learn (top 30th percentile) in two or more and one or more areas, respectively.
Most Recent DataIn the 2014/15 school‑year, EDI scores show that 14.7% of children were not ready to learn (lowest 10th percentile) in two or more areas and 28.2% were not ready in one or more areas; while 47.5% and 66.5% were very ready to learn (top 30th percentile) in two or more and one or more areas, respectively.
EDIScores,Manitoba,2005/06to2014/15
0%
10%
20%
30%
40%
50%
60%
70%
2005
/06
2006
/07
2008
/09
2012
/13
2014
/15
2010
/11
Not Ready in One or More AreasVery Ready in One or More Areas
Between 2005/06 and 2014/15, the percentage of kindergarten children in Manitoba who were not ready for school in one or more EDI areas remained stable, while the percentage of children who were very ready for school in one or more EDI areas increased.
All Aboard Status Since2008/09,thepercentageofchildren“NotReady”forschoolinoneormoreEDIdomainshasbeenstable(28.7%in2008/09and28.2%in2014/15).
19 Data on Manitoba’s Early Development Instrument is collected by the Healthy Child Manitoba Office, Department of Education and Training, biennially.
All Aboard: Manitoba’s Poverty Reduction and Social Inclusion Strategy 2016/17 Annual Report | Page 25

Indicator 14Availability of Licensed Child Care20
What Does This Indicate? Availability of licensed child care measures the percentage of children (ages 12 and under) in Manitoba for whom there is a regulated child care space.21
Why Is This Important?This measure shows access to licensed and regulated, quality, affordable child care, which can lead to better outcomes for children. It also gives parents the opportunity to work, pursue training, or go to school, while their children receive care and early learning experiences.
Indicator BaselineIn 2008/09, 16.4% of children under the age of 12 had access to a regulated child care space.
Most Recent DataIn 2016/17, 18.5% of children under the age of 12 had access to a regulated child care space.
AvailabilityofLicensedChildCare,Manitoba,2002/03to2016/17
0%
5%
10%
15%
20%
2002
/03
2004
/05
2006
/07
2008
/09
2010
/11
2012
/13
2003
/04
2005
/06
2007
/08
2009
/10
2011
/12
2013
/14
2014
/15
2016
/17
2015
/16
Compared to the previous 2015/16 period, the availability of licensed child care in Manitoba increased by 2.2% in 2016/17.
The availability of licensed child care (measured as a percentage of children ages 12 and under) has been steadily increasing since 2002/03.
All Aboard StatusSince2008/09,thepercentageofchildreninManitobawhohaveaccesstoaregulatedchildcarespacehasincreasedby12.8% EarlyLearningandChildCareStrategy
In spring 2017, the Department of Families announced the first components of the new Early Learning and Child Care Strategy, currently under development, which included: committing to $6.2 million in funding for up to 739 new licensed child care spaces in 15 community‑based capital projects; increasing the efficiency of the licensed child care system by addressing regulatory barriers for operators; and opening a new application intake for community‑based early learning and child care capital projects.
Manitoba will also finalize an early learning and child care bilateral funding agreement with Canada in the fall of 2017 that will facilitate federal investments in Manitoba’s regulated early learning and child care system over the next three years. The federal investments made under the bilateral agreement will be a component Manitoba’s overarching new Early Learning and Child Care Strategy.
These first components lay the foundation for a balanced approach to supporting and growing the early learning and child care system in Manitoba.
20 Data on the availability of licensed child care spaces is collected by the Department of Families, annually.21 Population of children 0 to 12 is derived from Statistics Canada Labour Force Survey, which does not include
persons living on‑reserve and other Aboriginal settlements, full‑time members of the Canadian Armed Forces, the institutionalized population, and households in extremely remote areas with very low population density.
Page 26 | All Aboard: Manitoba’s Poverty Reduction and Social Inclusion Strategy 2016/17 Annual Report

Indicator 15Number of Children in Care22
What Does This Indicate? Children in care measures the percentage of Manitoba children (17 years and younger) who are in the care of a child and family services agency.
Why Is This Important?An increase in the proportion of children in care (as a percentage of the total child population) may indicate that more families are struggling to provide care and safety for their children. It may also reflect changes in standards and practices in the field.
Indicator BaselineAt March 31, 2008, 2.8% of Manitoba children were in the care of a child and family services agency. However, the 2008 ‑ 2013 numbers were calculated using a different methodology. The Department of Families has discontinued the practice of counting children who are placed at home with parents, guardians or permanent families, where no financial contribution was made to their care, as “children in care”. Therefore, the 2017 figure presented
below cannot be meaningfully compared with the 2008 baseline year. Rather, four years of data is presented here for comparison purposes.
Most Recent DataAt March 31, 2017, 10,714 (3.5%) of Manitoba children were in the care of a child and family services agency. At March 31, 2016, 10,03123 (3.4%) of Manitoba children were in the care of a child and family services agency.
ChildreninCareasaPercentofChildPopulationinManitoba,2013to2017
0 50,000 100,000 150,000 200,000 250,000 300,000 350,000
2016/17
2015/16
2014/15
2013/14
10,714
10,031
9,812
9,755
(3.5%)
(3.4%)
(3.3%)
(3.3%)
Children in Care Child Population
302,468
298,482
295,804
293,900
All Aboard StatusBetween2013/14and2016/2017,thepercentageofManitobachildreninthecareofachildandfamilyservicesagencyincreasedfrom3.3%to3.5%.
FuturesForwardFutures Forward (formerly known as Building Futures) provides services and support for individuals 15‑29 who are, or have been, in care, to assist with their transition into successful independence. This is achieved through a collaborative partnership between several community organizations that offer supports in the following areas: housing, financial management, budgeting, mental health, employment preparation, educational preparation, job search skills, among other services.
22 Data on children in care is collected by the Department of Families, annually. Child population data was provided by the Department of Health, Seniors and Active Living (2015/16 to 2016/17), and by Manitoba Bureau of Statistics (2013/14 to 2014/15).
23 Indicator 15 data presented in the All Aboard Annual Reports for years 2013/14 to 2015/16 differ from those shown here, i.e. the figures included children who were placed at home with parents, guardians, or permanent families in non‑paid care. These figures were adjusted in 2016/17 to reflect current reporting practices, and offer a meaningful year‑over‑year comparison.
All Aboard: Manitoba’s Poverty Reduction and Social Inclusion Strategy 2016/17 Annual Report | Page 27
LegislativeMeasurestoProtectChildrenandYouthIn November 2016, the Government of Manitoba passed The Protecting Children (Information Sharing) Act.
This new law will give service providers greater ability to share information when providing services for supported children in Manitoba. Timely information sharing can improve services for vulnerable or at‑risk children by making sure that children receive the services that they need to be fully integrated within their school and social communities. It can also reduce risk and promote health and well‑being through greater integration of services and supports, such as supports in school, disability services, mental health and addictions supports and other critical government funded services.
In March, 2017, Manitoba introduced The Advocate for Children and Youth Act. This new, stand‑alone legislation expands the mandate of the Children’s Advocate well beyond the child welfare system to include services provided in the mental health and addictions, justice, education, and disability sectors. It also gives the newly named Advocate for Children and Youth the ability to advocate for young adults 18‑21 who are exiting care and who require ongoing supports.
This expanded advocacy mandate will allow the Advocate for Children and Youth to advocate on behalf of children who require better access to a broad range of government services.
Combined, these two new acts enable marginalized children in receiving more timely access to coordinated services and supports. Supporting children’s health and well‑being is critical to setting children on the right path to become healthy adults who are able to contribute to the economic and social vibrancy of Manitoba.
TurnaboutThe Turnabout program promotes reconciliation between the community and children under 12 in conflict with the law including the facilitation and coordination of services for these children and their families.
TheManitobaFetalAlcoholSpectrumDisorder(FASD)YouthJusticeProgramThe Manitoba FASD Youth Justice Program continues to provide assessments for youth involved in the Justice system who may be FASD‑affected. The goal is to build capacity within the family and community while enhancing government and non‑government FASD supports and services.
Page 28 | All Aboard: Manitoba’s Poverty Reduction and Social Inclusion Strategy 2016/17 Annual Report
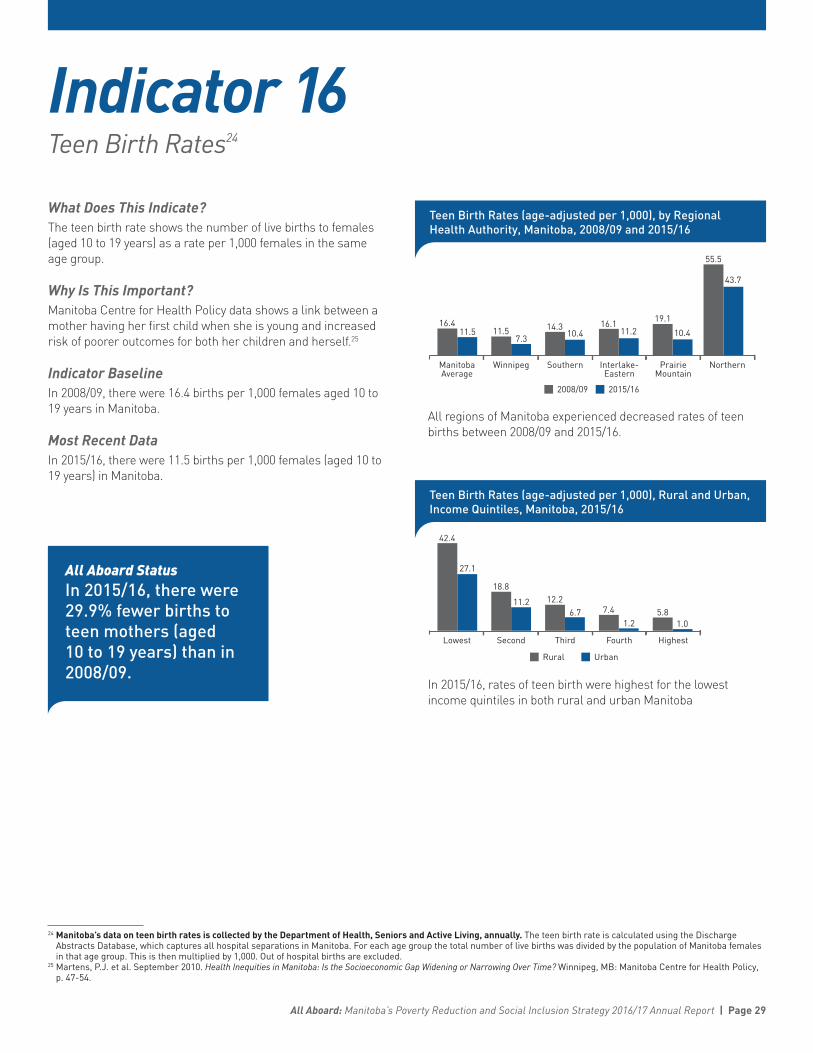
Indicator 16Teen Birth Rates24
What Does This Indicate? The teen birth rate shows the number of live births to females (aged 10 to 19 years) as a rate per 1,000 females in the same age group.
Why Is This Important?Manitoba Centre for Health Policy data shows a link between a mother having her first child when she is young and increased risk of poorer outcomes for both her children and herself.25
Indicator BaselineIn 2008/09, there were 16.4 births per 1,000 females aged 10 to 19 years in Manitoba.
Most Recent DataIn 2015/16, there were 11.5 births per 1,000 females (aged 10 to 19 years) in Manitoba.
TeenBirthRates(age‑adjustedper1,000),byRegionalHealthAuthority,Manitoba,2008/09and2015/16
ManitobaAverage
Winnipeg Southern Interlake-Eastern
Prairie Mountain
Northern
16.411.5 11.5
7.314.3
10.416.1
11.219.1
10.4
2008/09 2015/16
55.5
43.7
All regions of Manitoba experienced decreased rates of teen births between 2008/09 and 2015/16.
TeenBirthRates(age‑adjustedper1,000),RuralandUrban,IncomeQuintiles,Manitoba,2015/16
Lowest Second Third Fourth Highest
42.4
27.1
18.8
11.2 12.26.7 7.4
1.25.8
1.0
Rural Urban
In 2015/16, rates of teen birth were highest for the lowest income quintiles in both rural and urban Manitoba
All Aboard Status In2015/16,therewere29.9%fewerbirthstoteenmothers(aged10to19years)thanin2008/09.
24 Manitoba’s data on teen birth rates is collected by the Department of Health, Seniors and Active Living, annually. The teen birth rate is calculated using the Discharge Abstracts Database, which captures all hospital separations in Manitoba. For each age group the total number of live births was divided by the population of Manitoba females in that age group. This is then multiplied by 1,000. Out of hospital births are excluded.
25 Martens, P.J. et al. September 2010. Health Inequities in Manitoba: Is the Socioeconomic Gap Widening or Narrowing Over Time? Winnipeg, MB: Manitoba Centre for Health Policy, p. 47‑54.
All Aboard: Manitoba’s Poverty Reduction and Social Inclusion Strategy 2016/17 Annual Report | Page 29
ManitobaPrenatalBenefit:AModestIncomeSupplementBenefitsLong‑termChildHealthHealthy Baby is a two‑part program that includes the Manitoba Prenatal Benefit (MPB) and Healthy Baby Community Support Programs.
The MPB is a financial benefit to help low‑income women meet their extra nutritional needs during pregnancy and acts as a mechanism to connect women to health and community resources in their area.
A woman qualifies for benefits if her net family income is less than $32,000. Benefits can begin in the month a woman is 14 weeks pregnant and continue to the month of her estimated date of delivery. Benefits are provided on a sliding scale based on net family income. A woman can receive the benefit for a maximum 7 months per pregnancy; the maximum monthly benefit is $81. Information sheets on pregnancy, postpartum depression, nutrition, baby’s development and the benefits of going to a Healthy Baby Community Support Program are enclosed with monthly payments. Through a consent, the Healthy Child Manitoba Office is able to connect women to community health services and/or Healthy Baby community support programs as a further means of supporting healthy pregnancies.
In 2010, a Manitoba Centre for Health Policy (MCHP) evaluation of the Healthy Baby program reported that receipt of the MPB was associated with a reduction in low birth weight and preterm births, and an increase in breastfeeding initiation. The positive outcomes were reconfirmed by MCHP in 2015 in the PATHS Equity for Children research program. In May 2016, MCHP evaluation results (focusing on the highest‑risk subgroup of participating women on income assistance) were published in a leading scientific journal, Pediatrics. These results generated public profile regarding the positive outcomes of the MPB: $81 per month (less than $3 a day) helps women give birth to fewer premature and low‑weight babies. This expanded evaluation reports even larger, positive MPB effects:
• prevents low birth weight births by 21%
• prevents preterm births by 17.5%
• reduces hospital length of stay
ReducingOut‑of‑PocketMedicalExpensesforManitobanswithLimitedIncomesManitoba’s Pharmacare is a drug benefit program universally accessible to all Manitobans, regardless of age. Pharmacare coverage is based on total (adjusted) family income and the amount paid for eligible prescription drugs. Pharmacare recipients are required to pay a portion of the cost of their eligible prescription drugs, which is the annual Pharmacare deductible. This deductible is based on total family income: those with greater ability to pay (i.e. higher income) are responsible for a higher percentage of their drug expenditures. This means that those with lower family incomes are eligible to receive the highest level of benefit. In 2016/17, 66,690 families received Pharmacare benefits.
In 2016/17, 40 brand drugs and 188 new generic Drug Identification Numbers were added to the Manitoba Formulary (the list of therapeutically effective drugs of proven high quality, approved as eligible benefits under the Pharmacare drug benefit program; it also includes a list of interchangeable drugs).
The Deductible Installment Payment Program for Pharmacare helps reduce financial hardship for individuals and families whose eligible drug costs are a significant portion of their monthly family income. In 2016/17, 975 families enrolled in this program, providing them the option to pay their annual Pharmacare deductible in monthly installments.
The Home Cancer Drug (HCD) Program supports CancerCare Manitoba patients at home. Access to eligible cancer drugs, and specific designated supportive drugs, are provided to cancer patients at no cost. In 2016/17, the number of patients benefiting from this program increased to 8,628 from 8,202 the year prior.
Through a funding agreement with the Winnipeg Regional Health Authority, the Manitoba Pediatric Insulin Pump (MPIP) Program provides youth under 18 years of age, with Type 1 Diabetes, access to insulin pumps. In 2016/17 the number of pumps purchased (158) increased over the prior year (115).
Page 30 | All Aboard: Manitoba’s Poverty Reduction and Social Inclusion Strategy 2016/17 Annual Report
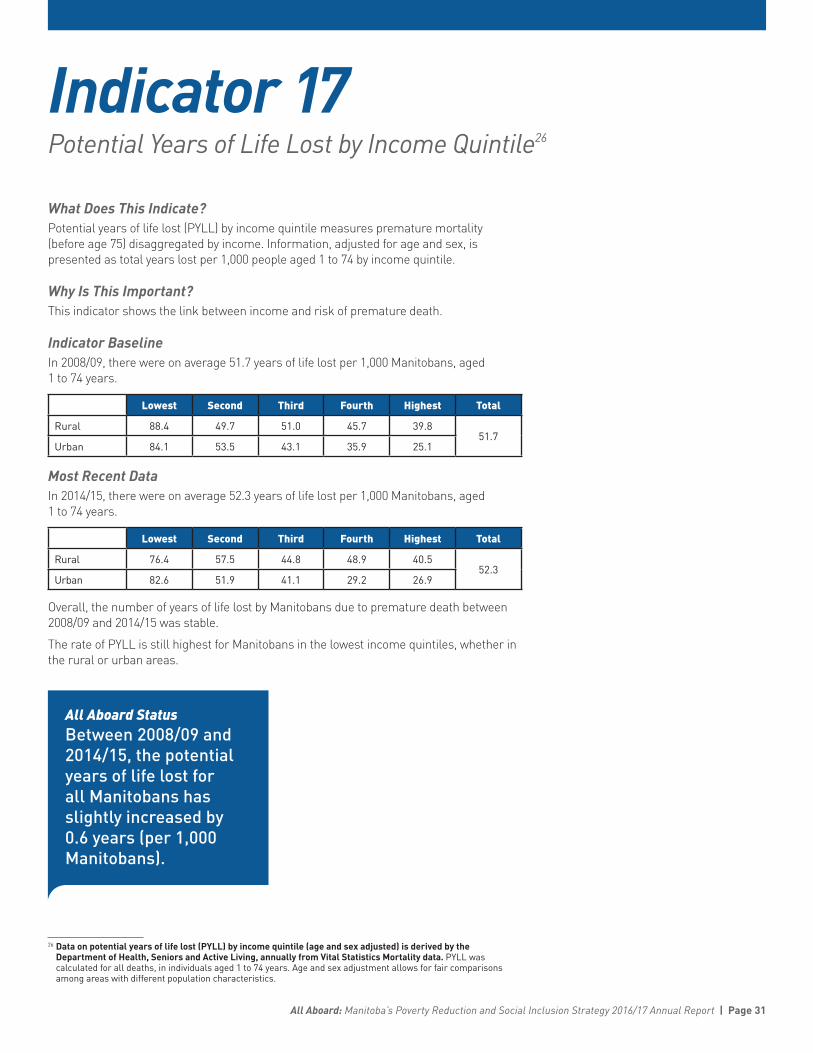
Indicator 17Potential Years of Life Lost by Income Quintile26
What Does This Indicate? Potential years of life lost (PYLL) by income quintile measures premature mortality (before age 75) disaggregated by income. Information, adjusted for age and sex, is presented as total years lost per 1,000 people aged 1 to 74 by income quintile.
Why Is This Important?This indicator shows the link between income and risk of premature death.
Indicator BaselineIn 2008/09, there were on average 51.7 years of life lost per 1,000 Manitobans, aged 1 to 74 years.
Lowest Second Third Fourth Highest Total
Rural 88.4 49.7 51.0 45.7 39.851.7
Urban 84.1 53.5 43.1 35.9 25.1
Most Recent DataIn 2014/15, there were on average 52.3 years of life lost per 1,000 Manitobans, aged 1 to 74 years.
Lowest Second Third Fourth Highest Total
Rural 76.4 57.5 44.8 48.9 40.552.3
Urban 82.6 51.9 41.1 29.2 26.9
Overall, the number of years of life lost by Manitobans due to premature death between 2008/09 and 2014/15 was stable.
The rate of PYLL is still highest for Manitobans in the lowest income quintiles, whether in the rural or urban areas.
All Aboard StatusBetween2008/09and2014/15,thepotentialyearsoflifelostforallManitobanshasslightlyincreasedby0.6years(per1,000Manitobans).
26 Data on potential years of life lost (PYLL) by income quintile (age and sex adjusted) is derived by the Department of Health, Seniors and Active Living, annually from Vital Statistics Mortality data. PYLL was calculated for all deaths, in individuals aged 1 to 74 years. Age and sex adjustment allows for fair comparisons among areas with different population characteristics.
All Aboard: Manitoba’s Poverty Reduction and Social Inclusion Strategy 2016/17 Annual Report | Page 31
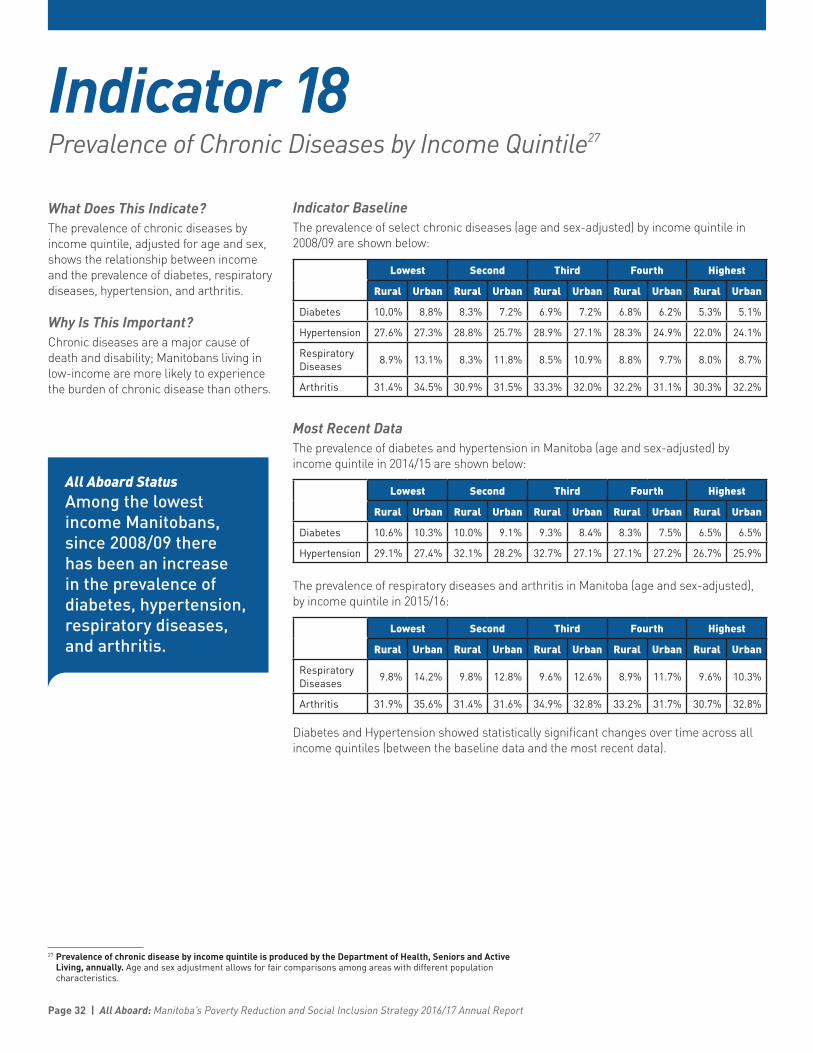
Indicator 18Prevalence of Chronic Diseases by Income Quintile27
What Does This Indicate? The prevalence of chronic diseases by income quintile, adjusted for age and sex, shows the relationship between income and the prevalence of diabetes, respiratory diseases, hypertension, and arthritis.
Why Is This Important?Chronic diseases are a major cause of death and disability; Manitobans living in low‑income are more likely to experience the burden of chronic disease than others.
All Aboard StatusAmongthelowestincomeManitobans,since2008/09therehasbeenanincreaseintheprevalenceofdiabetes,hypertension,respiratorydiseases,andarthritis.
Indicator BaselineThe prevalence of select chronic diseases (age and sex‑adjusted) by income quintile in 2008/09 are shown below:
Lowest Second Third Fourth Highest
Rural Urban Rural Urban Rural Urban Rural Urban Rural Urban
Diabetes 10.0% 8.8% 8.3% 7.2% 6.9% 7.2% 6.8% 6.2% 5.3% 5.1%
Hypertension 27.6% 27.3% 28.8% 25.7% 28.9% 27.1% 28.3% 24.9% 22.0% 24.1%
Respiratory Diseases
8.9% 13.1% 8.3% 11.8% 8.5% 10.9% 8.8% 9.7% 8.0% 8.7%
Arthritis 31.4% 34.5% 30.9% 31.5% 33.3% 32.0% 32.2% 31.1% 30.3% 32.2%
Most Recent DataThe prevalence of diabetes and hypertension in Manitoba (age and sex‑adjusted) by income quintile in 2014/15 are shown below:
Lowest Second Third Fourth Highest
Rural Urban Rural Urban Rural Urban Rural Urban Rural Urban
Diabetes 10.6% 10.3% 10.0% 9.1% 9.3% 8.4% 8.3% 7.5% 6.5% 6.5%
Hypertension 29.1% 27.4% 32.1% 28.2% 32.7% 27.1% 27.1% 27.2% 26.7% 25.9%
The prevalence of respiratory diseases and arthritis in Manitoba (age and sex‑adjusted), by income quintile in 2015/16:
Lowest Second Third Fourth Highest
Rural Urban Rural Urban Rural Urban Rural Urban Rural Urban
Respiratory Diseases
9.8% 14.2% 9.8% 12.8% 9.6% 12.6% 8.9% 11.7% 9.6% 10.3%
Arthritis 31.9% 35.6% 31.4% 31.6% 34.9% 32.8% 33.2% 31.7% 30.7% 32.8%
Diabetes and Hypertension showed statistically significant changes over time across all income quintiles (between the baseline data and the most recent data).
27 Prevalence of chronic disease by income quintile is produced by the Department of Health, Seniors and Active Living, annually. Age and sex adjustment allows for fair comparisons among areas with different population characteristics.
Page 32 | All Aboard: Manitoba’s Poverty Reduction and Social Inclusion Strategy 2016/17 Annual Report

Indicator 19Average Number of People Receiving Co‑ordinated Home Care Services28
What Does This Indicate? The average number of people receiving co‑ordinated home care services shows the average number of Manitobans receiving Manitoba Home Care services (per month). This provides both support for activities of daily living and/or health services.
Why Is This Important?The Home Care program provides services to vulnerable Manitobans, helping them remain in the community.
Indicator BaselineIn 2008/09, 23,075 Manitobans received co‑ordinated home care services, monthly (on average).
Most Recent DataIn 2012/13, 24,514 Manitobans received co‑ordinated home care services, monthly (on average). This is the most recent data on average monthly counts available.
The number of clients receiving co‑ordinated home care (yearly) is increasing. In 2016/17, 41,639 clients received co‑ordinated home care services (yearly)29, up by 8.5% from 2014/15.
All Aboard StatusBetween2008/09and2012/13,theaveragenumberofpeoplereceivingco‑ordinatedhomecareservicesincreasedby6.2%.
Total(Yearly)NumberofPeopleWhoReceivedCo‑ordinatedHomeCareServices
2014/15 2015/16
38,386
40,530
2016/17
41,639
SeniorsandHealthyAgingIn 2016/17, the Government of Manitoba disseminated Social Isolation of Seniors, Volume 1, Understanding the Issue and Finding Solutions and Social Isolation of Seniors, Volume 2, Ideas Exchange Event Toolkit to key stakeholders to inform policy and program development.
28 Data on co‑ordinated home care services is collected by the Department of Health, Seniors and Active Living, annually.
29 Due to a change in the way that home care data is being collected, the data from 2016/17 cannot be compared with the baseline (2008/09) data, which is based on the monthly average.
All Aboard: Manitoba’s Poverty Reduction and Social Inclusion Strategy 2016/17 Annual Report | Page 33

Indicator 20Continuity of Physician Care30
What Does This Indicate? Continuity of physician care (or majority of care) shows the percentage of Manitobans receiving the majority of their ambulatory care (at least 50% of their ambulatory care visits) from the same physician over a two‑year period.
Why Is This Important?This indicator reflects the importance of having a relationship with the same primary care provider or clinic to ensure that people have a home base for ongoing care, co‑ordination and support from someone who knows them and their health needs.
Indicator BaselineFor the two‑year period from 2007/08 to 2008/09, 70.6% of Manitobans received the majority of their care from the same physician.
Most Recent DataFor the two‑year period from 2014/15 to 2015/16, 71.1% of Manitobans received the majority of their care from the same physician.
PercentageofManitobansReceivingMajorityofCarefromtheSamePhysician,byIncomeQuintile,2007/08to2008/09and2014/15to2015/16
Lowest Second Third
Rural
Fourth Highest
58.9 56.163.2 61.9 66.3 63.7
69.8 69.9 69.4 67.7
2007/08 to 2008/09 2014/15 to 2015/16
Lowest Second Third
Urban
Fourth Highest
68.1 66.5 73.1 69.5 74.5 70.0 75.1 76.9 73.9 74.5
Total
70.6 71.1
All Aboard StatusBetweenthetwoyearperiods2007/08to2008/09and2014/15to2015/16,continuityofphysiciancarehasslightlyincreasedby0.5percentagepoint.
FamilyDoctorFinderAt March 31, 2017, the Family Doctor Finder program had matched 96% of registrants without a Primary Care Provider (71,728 people) since program inception in 2013. In 2016/17, on a monthly basis, the program matched 82% ‑ 86% (median) of registrants within 30 days.
30 Data on continuity of physician care (or majority of care) showing the percentage of Manitobans receiving the majority of their ambulatory care (at least 50 per cent of their ambulatory care visits) from the same physician over a two‑year period, is produced by the Department of Health, Seniors and Active Living, annually.
Generally, continuity of care increases as income increases, for both rural and urban Manitobans.
Page 34 | All Aboard: Manitoba’s Poverty Reduction and Social Inclusion Strategy 2016/17 Annual Report

Indicator 21Number of People Using Access Centres31
What Does This Indicate? The number of people using Access Centres measures the number of Manitobans who receive services from an Access Centre (only available in Winnipeg). Note that individuals may receive multiple services or units of service. Units of service comprise an array of health and social service support, including Children’s disability services, Community Living disABILITY Services, MarketAbilities, child development and inclusion support, Employment and Income Assistance services, prenatal/post‑partum referrals, home care, mental health and primary care programming.
All Aboard StatusSince2010/11,thenumberofunitsofserviceprovidedatAccessCentreshasmorethandoubled(167%increase).
Why Is This Important?This indicator reflects the ongoing access to co‑ordinated and comprehensive health and social services from a single site.
Indicator BaselineIn 2010/11, there were 42,175 units of service provided at Access Centres in Manitoba (only available in Winnipeg).
Most Recent DataIn 2016/17, there were 112,761 units of service administered at Access Centres in Winnipeg, with multiple units potentially delivered to one individual.32 This represents an increase of 167% from 2010/11.
The units of service administered in 2016/17 are broken down by Access Centre as follows:
2016/17
River East
Trans-cona
Down-town
NorWestWinnipeg
WestFort
GarrySt.
BonifaceTotal
Primary Care Clinic Visits
11,146 5,595 8,329 9,064 11,627 2,773 7,482 56,016
Public Health Cases
3,511 1,530 3,922 1,635 3,766 3,125 1,611 19,100
Home Care 2,578 6,454 677 – 3,703 2,084 1,733 17,229
Mental Health
464 394 766 347 677 311 79 3,038
Employment & Income Assistance Cases*
2,709 2,219 1,068 1,883 2,277 2,682 12,838
Disability Cases*
1,159 – 42 907 975 1,237 4,320
Child Development Cases*
71 – – 49 58 42 220
Total Visits/Cases 112,761
* Programming administered by the Department of Families at River East and Transcona are collected in aggregate.
In addition to Access Centres, many services are also co‑ordinated at various Health and Social Service Centres in Winnipeg.
31 Data on people using Access Centres is collected by the Department of Health, Seniors and Active Living, and the Department of Families, annually.
32 Immunization data were excluded in the 2015/16 Annual Report because of system change. This information is now included in the 2016/17 data. Data on primary care clinic visits includes only unique patient visits to Physicians, Nurse Practitioners, nurses, and Laboratory. Data on public health cases reflects only the number of family caseloads for the Family First Home Visitors. There are many other primary care services that are being provided such as Speech/Language, Dietician, Audiology, Midwifery, Day Hospital, healthy Aging Resource Team services (among others) that are not reflected in the data shown in this report.
All Aboard: Manitoba’s Poverty Reduction and Social Inclusion Strategy 2016/17 Annual Report | Page 35
IncomeSecurityPromotion–AccessCentresThrough the newly established Income Security Promotion service, patients of the Downtown / Point Douglas My Health Teams receive enhanced access to an inter‑professional team for comprehensive financial management support. Services provided include lifestyle counseling pertaining to budgeting, building self‑management skills, and promoting income tax completion to optimize benefits. Patients are also linked to community resources, such as Supporting Employment & Economic Development (SEED), and other support services suited to their needs. In addition to smoother transitions between providers across the continuum of services (Employment and Income Assistance (EIA), SEED, etc.), patients receive additional support in meeting their individual care plans. This initiative is supported by Manitoba Families (EIA Programs), Manitoba Health, Seniors and Active Living and the Winnipeg Regional Health Authority.
Page 36 | All Aboard: Manitoba’s Poverty Reduction and Social Inclusion Strategy 2016/17 Annual Report
Looking Ahead to 2017/18The Government of Manitoba has committed to developing a renewed poverty reduction strategy over the course of the year ahead.
Public consultations are being planned for 2017/18. The Government of Manitoba will be seeking input from Manitobans through various channels, such as an online survey, written submissions, and in‑person conversations.
The ideas and feedback shared will be used to inform development of the renewed, multi‑year, Manitoba Poverty Reduction Strategy.
Related Documents