i CHARACTERIZATION AND BIO-CONTROL OF FRUIT AND ROOT ROT PATHOGENS OF BELL PEPPER ALIYA TARIQ 08-arid-22 DEPARTMENT OF PLANT PATHOLOGY FACULTY OF CROP & FOOD SCIENCES PIR MEHR ALI SHAH ARID AGRICULTURE UNIVERSITY RAWALPINDI PAKISTAN 2020

Welcome message from author
This document is posted to help you gain knowledge. Please leave a comment to let me know what you think about it! Share it to your friends and learn new things together.
Transcript
i
CHARACTERIZATION AND BIO-CONTROL OF FRUIT AND
ROOT ROT PATHOGENS OF BELL PEPPER
ALIYA TARIQ
08-arid-22
DEPARTMENT OF PLANT PATHOLOGY
FACULTY OF CROP & FOOD SCIENCES
PIR MEHR ALI SHAH
ARID AGRICULTURE UNIVERSITY RAWALPINDI
PAKISTAN
2020
ii
CHARACTERIZATION AND BIO-CONTROL OF FRUIT AND
ROOT ROT PATHOGENS OF BELL PEPPER
by
ALIYA TARIQ
(08-arid-22)
A thesis submitted in partial fulfillment of
the requirement for degree of
Doctor of Philosophy
in
Plant Pathology
DEPARTMENT OF PLANT PATHOLOGY
FACULTY OF CROP & FOOD SCIENCES
PIR MEHR ALI SHAH
ARID AGRICULTURE UNIVERSITY RAWALPINDI
PAKISTAN
2020
iii

iv
v
vi

vii
DEDICATED TO
My Loving Parents
and
Caring Sisters
viii
CONTENTS
Page
List of Tables ix
List of Figures xi
List of Appendix xix
List of Abbreviations xxi
Acknowledgements xxii
ABSTRACT xxiii
Chapter 1 INTRODUCTION 1
Chapter 2 REVIEW OF LITERATURE 5
Chapter 3 MATERIALS AND METHODS 13
3.1 SURVEY FOR THE FRUIT AND ROOT ROT
PATHOGENS
13
3.2 ISOLATION AND PURIFICATION OF PATHOGENS 16
3.3 PRESERVATION OF FUNGI 16
3.4 CULTURAL/MICROSCOPIC CHARACTERISTICS 17
3.5 PATHOGENICITY TEST 17
3.6 GENOMIC DNA EXTRACTION 22
3.7 PCR AMPLIFICATION, SEQUENCING AND
PHYLOGENETIC ANALYSIS
22
3.8 IN VITRO MANAGEMENT OF HIGHLY PREVALENT
FRUIT ROT PATHOGEN WITH NATURAL COMPOUNDS
23
3.9 IN VITRO MANAGEMENT OF HIGHLY PREVALENT
FRUIT AND ROOT ROT PATHOGEN WITH VOLATILE
COMPOUNDS
23
3.10 IN VITRO MANAGEMENT OF HIGHLY PREVALENT
ROOT ROT PATHOGEN WITH ANTAGONISTIC FUNGI
26
Chapter 4 RESULTS AND DISCUSSION 27
4.1 PREVALENCE AND INCIDENCE OF FRUIT ROT
DISEASES
27
4.1.1 Prevalence and Incidence of Fruit Rot Diseases in 27
ix
Greenhouses
4.1.2 Prevalence and Incidence of Fruit Rot Diseases in Open Fields 31
4.2 PREVALENCE AND INCIDENCE OF ROOT ROT
DISEASES
36
4.2.1 Prevalence and Incidence of Root Rot Diseases at Seedling
Stage in Greenhouses
37
4.2.2 Prevalence and Incidence or Root Rot Diseases at Seedling
Stage in Low Plastic Tunnels
41
4.2.3 Prevalence and Incidence of Root Rot Diseases at Maturity
Stage in Greenhouses
44
4.2.4 Prevalence and Incidence of Root Rot Diseases at Maturity
Stage in Open Fields
46
4.3 ISOLATION OF PATHOGENS 51
4.4 PRESERVATION 52
4.5 MORPHOLOGICAL CHARACTERIZATION 52
4.5.1 Morphological Characterization of Colletotrichum truncatum 52
4.5.1.1 Colony diameter 52
4.5.1.2 Colony color and orientation 53
4.5.1.3 Texture 53
4.5.1.4 Conidia 54
4.5.1.5 Setae 54
4.5.1.6 Appressoria 55
4.5.2 Morphological Characterization of Fusarium incarnatum 64
4.5.2.1 Colony diameter 64
4.5.2.2 Colony color 64
4.5.2.3 Texture 65
4.5.2.4 Sporodochia 65
4.5.2.5 Conidia and conidiophores 65
4.5.3 Morphological Characterization of Fusarium proliferatum 71
4.5.3.1 Colony diameter 71
4.5.3.2 Colony color 71
4.5.3.3 Texture 71
x
4.5.3.4 Sporodochia 71
4.5.3.5 Conidia 71
4.5.4 Morphological Characterization of Botrytis cinerea 75
4.5.4.1 Colony diameter 75
4.5.4.2 Colony color 75
4.5.4.3 Texture 76
4.5.4.4 Sclerotia 76
4.5.4.5 Conidia and conidiophores 77
4.5.5 Morphological Characterization of Alternaria alternata 77
4.5.5.1 Colony diameter 77
4.5.5.2 Colony color 87
4.5.5.3 Concentric rings 87
4.5.5.4 Texture 87
4.5.5.5 Conidia and conidiophores 88
4.5.6 Morphological Characterization of Fusarium equiseti 88
4.5.6.1 Colony diameter 88
4.5.6.2 Colony color 94
4.5.6.3 Texture 94
4.5.6.4 Sporodochia 94
4.5.6.5 Conidia and conidiophores 94
4.5.7 Morphological Characterization of Rhizoctonia solani 97
4.5.7.1 Colony diameter 97
4.5.7.2 Colony color 101
4.5.7.3 Texture 101
4.5.7.4 Sclerotia 101
4.5.7.5 Hyphal characteristics 102
4.5.8 Morphological Characterization of Sclerotium rolfsii 109
4.5.8.1 Colony diameter 109
4.5.8.2 Colony color 109
4.5.8.3 Texture 110
4.5.8.4 Sclerotia 110
4.5.8.5 Hyphal characteristics 111
xi
4.6 PATHOGENICITY TEST 112
4.7 MOLECULAR CHARACTERIZATION 128
4.7.1 Molecular Characterization of Colletotrichum truncatum 128
4.7.2 Molecular Characterization of Fusarium spp. 129
4.7.3 Molecular Characterization of Botrytis cinerea 134
4.7.4 Molecular Characterization of Alternaria alternata 136
4.7.5 Molecular Characterization of Fusarium equiseti 137
4.7.6 Molecular Characterization of Rhizoctonia solani 138
4.7.7 Molecular Characterization of Sclerotium rolfsii
(Teleomorph: Athelia rolfsii)
140
4.8 IN-VITRO BIO-CONTROL 141
4.8.1 In-vitro Bio-control using natural compounds 141
4.8.2 In-vitro Bio-control using volatile compounds 143
4.8.3 In-vitro Bio-control using Antagonistic Fungi 147
SUMMARY
LITERATURE CITED
149
152
xii
List of Tables
Table No. Page
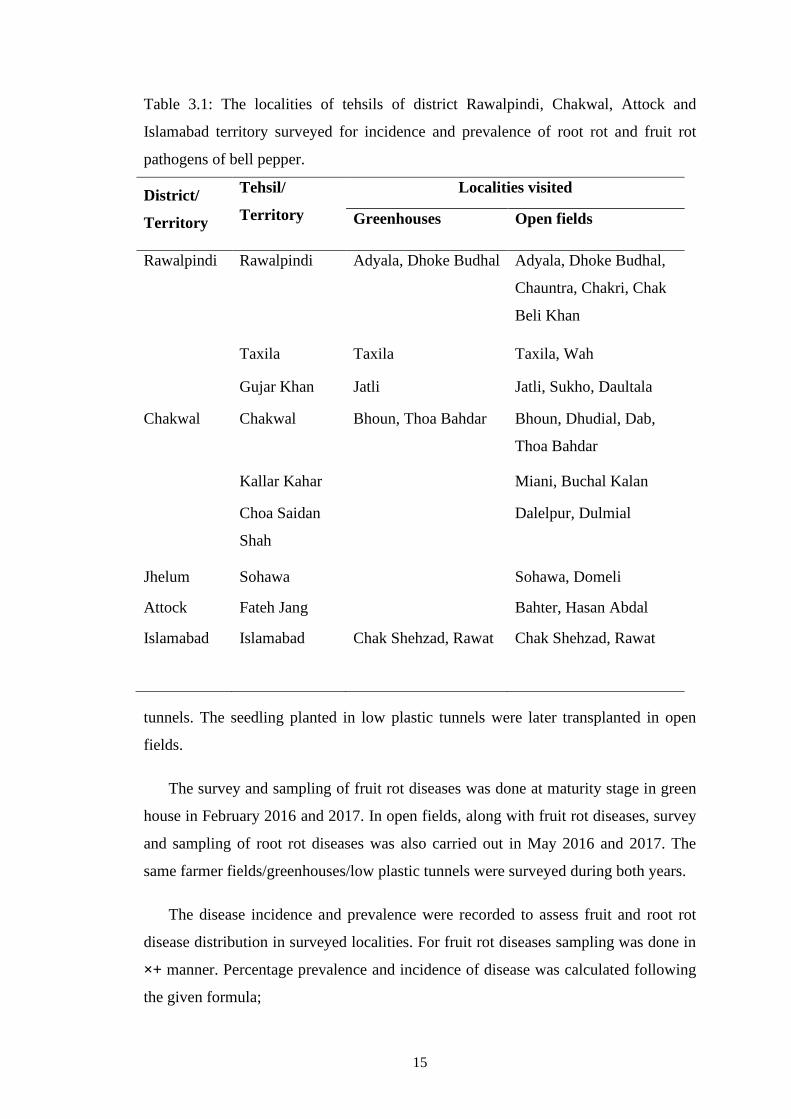
3.1 The localities of tehsils of district Rawalpindi, Chakwal,
Attock and Islamabad territory surveyed for incidence and
prevalence of root rot and fruit rot pathogens of bell pepper
15
3.2 Inoculums potential of fungal spores used for the
pathogenicity test
18
3.3 Disease rating scale (0-5) for Anthracnose disease 19
3.4 Disease rating scale for Fusarium and Botrytis fruit rot 20
3.5 Disease rating scale for Alternaria fruit rot 20
3.6 Disease rating scale for Fusarium root rot 21
3.7 Disease rating scale for Rhizoctonia root rot 21
3.8 Disease rating scale for Sclerotium root rot 22
3.9 Primers used in PCR amplification and sequencing 25
4.1 Location wise mean disease incidence (%) of fruit rot
diseases in greenhouse during January 2016 and 2017
29
4.2 Location wise mean disease incidence (%) of fruit rot
diseases in open fields during May 2016 and 2017
33
4.3 Percent mean disease incidence of root rot diseases in
greenhouse at various locations during November 2015 and
2016
40
4.4 Percent mean disease incidence of root rot diseases in low
plastic tunnels at various locations during February 2016
and 2017
42
4.5 Percent mean disease incidence of root rot diseases in
greenhouse at various locations during February 2015 and
2016
45
4.6 Percent mean root rot disease incidence caused by 3
pathogens in open fields at various locations during May,
2016 and 2017
47
4.7 Cultural Characteristics of Colletotrichum truncatum 58
xiii
4.8 Microscopic Characteristics of Colletotrichum truncatum 61
4.9 Cultural Characteristics of Fusarium incarnatum 67
4.10 Microscopic characteristics of Fusarium incarnatum 69
4.11 Cultural characteristics of Fusarium proliferatum 73
4.12 Microscopic characteristics of Fusarium proliferatum 74
4.13 Cultural characteristics of Botrytis cinerea 80
4.14 Microscopic characteristics of Botrytis cinerea 84
4.15 Cultural and microscopic characteristics of Alternaria
alternata
91
4.16 Cultural and microscopic characteristics of Fusarium
equiseti
98
4.17 Cultural and microscopic characteristic of Rhizoctonia
solani
105
4.18 Cultural and microscopic characteristics of Sclerotium
rolfsii
113
4.19 Percent disease severity index of C. truncatum 121
4.20 Percent disease severity index of Fusarium spp. 122
4.21 Percent disease severity index of Botrytis cinerea 123
4.22 Percent disease severity index of Alternaria alternata 124
4.23 Percent disease severity index of Fusarium equiseti 125
4.24 Percent disease severity index of Rhizoctonia solani 126
4.25 Percent disease severity index of Sclerotium rolfsii 127
xiv
List of Figures
Figure No. Page
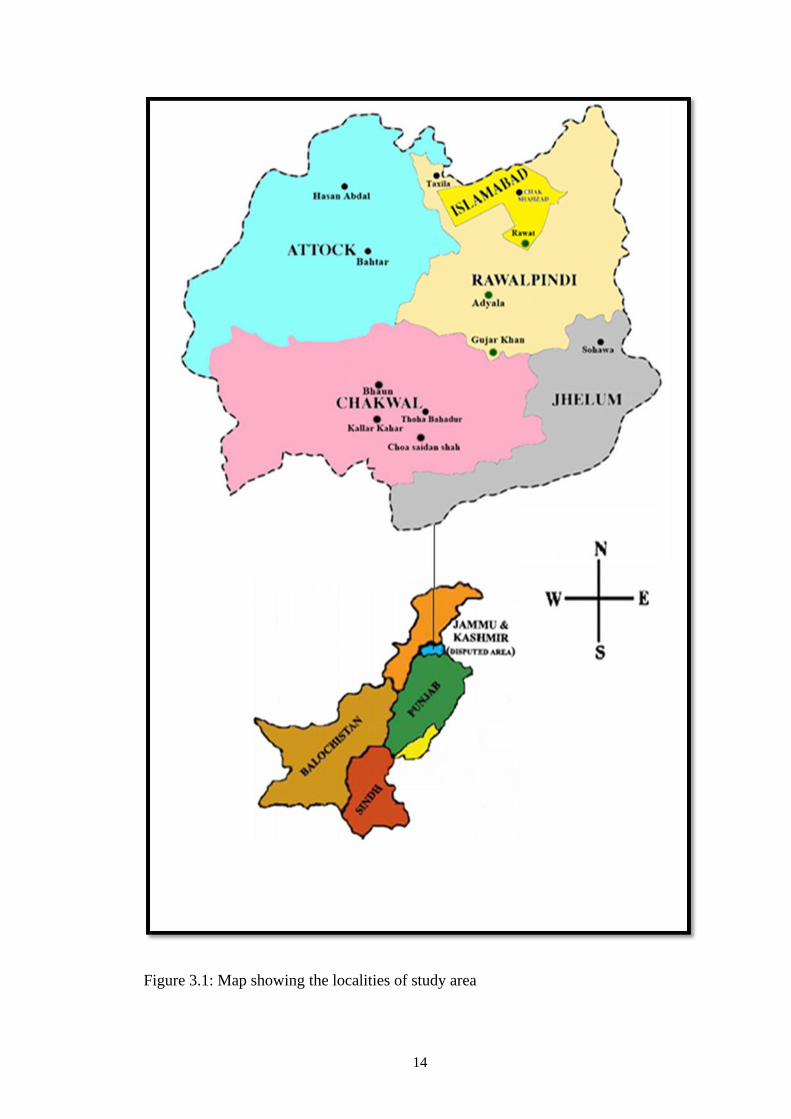
3.1 Map showing the localities of Study area 14
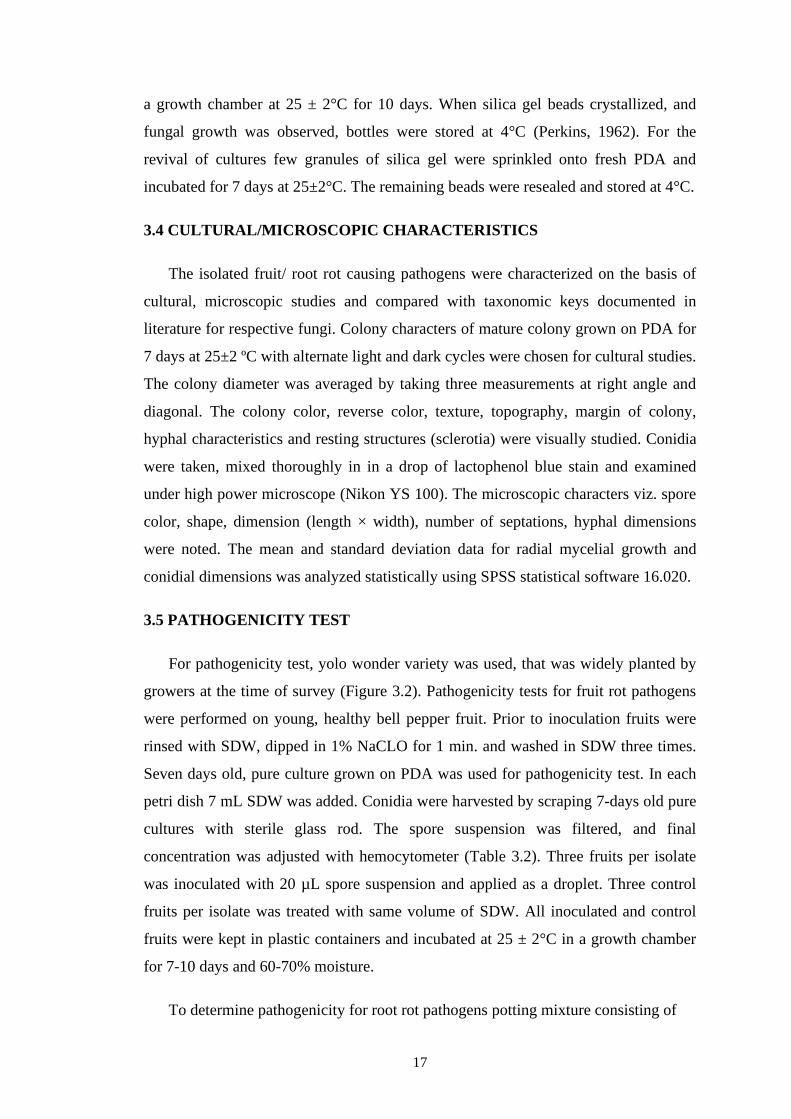
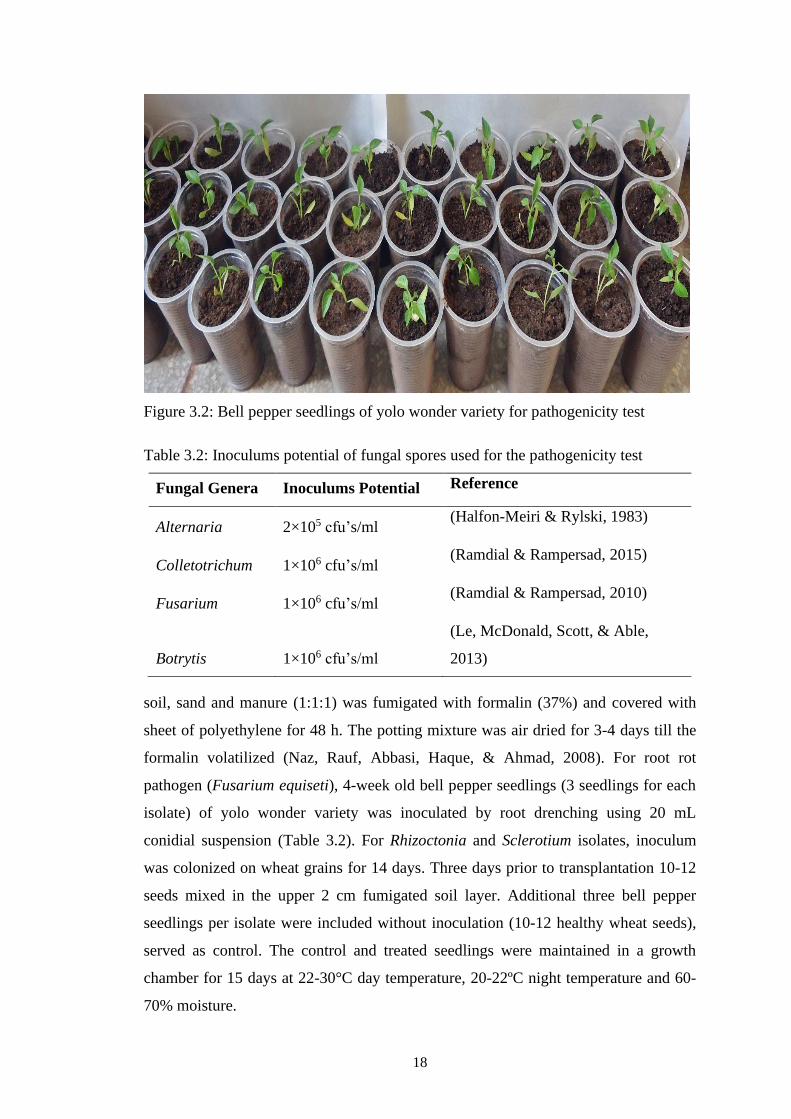
3.2 Bell pepper seedlings of yolo wonder variety for
pathogenicity test
18
4.1 Percent mean disease incidence of various fruit rot diseases
in greenhouses during February 2016 and 2017
27
4.2 Fusarium mold symptoms; a. Water-soaked lesions with a
white-light gray mold b. whitish-gray hyphal growth on the
seeds
28
4.3 Gray mold symptoms; a. Water-soaked spots, yellowish-
brown or grayish-brown lesions b. gray brown conidia and
conidiophores
28
4.4 Black mold symptoms; a. Circular to irregular, sunken
lesions covered with black spores b. fungal growth on
seeds and inner fruit wall
29
4.5 Tehsil wise mean disease incidence (%) of fruit rot
diseases in greenhouse during January 2016 and 2017
30
4.6 Percent mean disease incidence of various fruit rot diseases
in open fields during May 2016 and 2017.
31
4.7 Anthracnose fruit rot; a. Circular to irregularly-shaped,
sunken, brown to black lesions (acervuli) of fungi b.
misshapen and rotted fruit
32
4.8 Tehsil wise mean disease incidence (%) of fruit rot
diseases in open fields during May 2016 and 2017
34
4.9 Percent mean disease incidence of various root rot diseases
in greenhouse during November 2015 and 2016.
37
4.10 Symptoms of Fusarium root rot with dark brown to
black, discolored and rotted roots, stunted growth and
38
xv
wilting
4.11 Roots infected with Rhizoctonia root rot appears brown,
somewhat mushy and plant tops collapsed, formation of
brown-black cankers on stem at or below the soil line
39
4.12 White cottony growth of Sclerotium root rot covered the
infected roots surface
39
4.13 Percent mean disease incidence of various root rot diseases
in greenhouse located in 5 tehsils during November 2015
and 2016
40
4.14 Percent mean disease incidence caused by various root rot
pathogens in low plastic tunnels during February 2016 and
2017
41
4.15 Percent mean disease incidence of various root rot diseases
in low plastic tunnels located in 9 tehsils/territory during
February 2016 and 2017
43
4.16 Percent mean disease incidence caused by various root rot
pathogens in greenhouses during February 2016 and 2017
44
4.17 Percent mean disease incidence of various root rot diseases
in green house located in 5 tehsils during February 2016
and 2017
45
4.18 Percent mean disease incidence of various root rot diseases
in open fields during May 2016 and 2017
46
4.19 Percent mean disease incidence of various root rot diseases
in open fields located in 9 tehsils during May 2016 and
2017
49
4.20 Colonies of various fungi grown on PDA a. Colletotrichum
truncatum. b. Fusarium sp. c. Botrytis cinerea d.
Alternaria alternata e. Rhizoctonia solani f. Sclerotium
rolfsii
51
4.21 a. Colonies of group 1 isolates displayed white to ash gray
colony with small dot like acervuli b. ash gray color in
reverse
55
xvi
4.22 Colonies of group 2 isolates displayed light-dark gray
color, comprised of 4-5 concentric rings, with dense
acervuli b. dark gray to black color in reverse
55
4.23 a. Colonies of group 3 isolates were radiating, dark gray to
black in color, with abundant acervuli b. dark gray to black
in reverse
56
4.24 a. Colonies of group 4 isolates comprised 2-3 concentric
rings, dark gray to black in color, abundant thick acervuli
b. black in reverse
56
4.25 a. Colonies of group 5 isolates were pale gray or light to
dark gray with abundant conidial masses, small scattered
acervuli b. cream to dark gray in reverse
56
4.26 Conidia of C. truncatum (light microscope, x1000) stained
with cotton blue, Scale bar=10 μm
57
4.27 Setae of C. truncatum 57
4.28 Appressoria of C. truncatum 57
4.29 a. Colonies of F. incarnatum having white color b. beige to
pale cream coloration on the reverse side of petri dish
64
4.30 a. Colonies of F. incarnatum having white to light beige
color b. beige coloration on the reverse side of petri dish
65
4.31 Micro-conidia, meso-conidia and macro-conidia of F.
incarnatum (light microscope, x1000) stained with cotton
blue, Scale bar=10 μm
66
4.32 Monophialidic and polyphialidic conidiophores of F.
incarnatum
71
4.33 a. Purple-grey colonies of F. proliferatum b. dark purple
coloration on reverse side of PDA media
72
4.34 Conidia, of F. incarnatum (light microscope, x1000)
stained with cotton blue, Scale bar=10 μm
75
4.35 Monophialidic conidiophores of F. proliferatum b.
Polyphialidic conidiophores of F. proliferatum
75
4.36 Colonies of B. cinerea developed a. aerial mycelial masses 78
xvii
without sporulation b. aerial mycelial masses with
sporulation c. short mycelium without sporulation d. thick
and wooly mycelium e. thin sparse hyphae
4.37 Sclerotia of B. cinerea a. solitary to aggregated sclerotia b.
round sclerotia on whole petri dish c. abundant round to
irregular sclerotia on whole petri dish d. Round sclerotia
predominantly at periphery of petri dish e. Few scattered
sclerotia
79
4.38 Conidia and conidiophores of B. cinerea (light microscope,
x1000) stained with cotton blue, Scale bar=10 μm
87
4.39 a. Light to dark brown colonies of A. alternata with
appressed growth b. Dark brown colonies on the reverse
side of PDA medium
89
4.40 a. Dark brown colonies of A. alternata with appressed
growth b. Black colonies on the reverse side of PDA
medium
89
4.41 Olive brown colonies of A. alternata with velvety texture
b. light to dark brown colonies on the reverse side of PDA
medium
89
4.42 Colonies of A. alternata displayed concentric rings 90
4.43 Conidia and conidiophores of A. alternata, scale bar=10
μm
90
4.44 Conidia of A. alternata, Scale bar=10 μm 90
4.45 a. Light cream colony of F. equiseti b. beige coloration on
the reverse
95
4.46 a. Cream colony of F. equiseti b. beige coloration on the
reverse
95
4.47 a. Light brown colony of F. equiseti b. brown coloration on
the reverse
95
4.48 a. White colony of F. equiseti b. white to light cream
coloration on the reverse
96
xviii
4.49 Conidia of F. equiseti (light microscope, x1000) stained
with cotton blue, Scale bar=10 μm
97
4.50 Chlamydospores of F. equiseti (light microscope, x1000)
stained with cotton blue, Scale bar=10 μm
97
4.51 a. Creamish colony of R. solani, developed aerial sclerotia
at periphery b. creamish brown colony on the reverse side
of petri dish
103
4.52 a. Brown to creamish colony of R. solani b. creamish to
light brown colony on the reverse side of petri dish
103
4.53 a. Light brown colony of R. solani, aerial sclerotia
predominantly at periphery b. creamish brown colony on
reverse side of petri dish
103
4.54 a. Dark brown colony of R. solani, sclerotia scattered on
whole petri dish b. dark brown colony on reverse side of
petri dish
104
4.55 Colony of R. solani developed dark brown aerial sclerotia 104
4.56 Colony of R. solani developed dark brown surface sclerotia
at center of petri dish
104
4.57 Hyphae of R. solani 109
4.58 White to light cream, thin-flat colony of S. rolfsii 111
4.59 Silky-white, fluffy colony of S. rolfsii on PDA medium 111
4.60 a. Sclerotia scattered on whole petri dish b. sclerotia
scattered on periphery of petri dish
112
4.61 Hyphae of Sclerotium rolfsii 112
4.62 Symptoms of anthracnose caused by C. truncatum a.
sunken, water-soaked lesions with acervuli b. white to gray
mycelia with small dot like acervuli
119
4.63 Symptoms of Fusarium fruit rot a. white mycelial growth
surrounded by water-soaked, greenish lesions b. white
mycelial growth surrounded by water-soaked, light brown
necrotic lesions
119
xix
4.64 Symptoms of Botrytis cinerea a. water-soaked lesions b.
grayish-brown hyphae of B. cinerea covered with conidia
and conidiophores
120
4.65 Symptoms of Alternaria alternata; water-soaked, grayish-
black lesions, rotted fruit
120
4.66 Fusarium root rot caused by F. equiseti; symptoms include
leaf chlorosis, wilting and leaf dropping
120
4.67 Root rot caused by R. solani; plant top collapsed, reddish-
brown or black cankers girdle the stem
128
4.68 Root rot caused by S. rolfsii; Poor top growth and wilting
of the leaves
128
4.69 Molecular phylogeny of C. truncatum, generated from a
maximum parsimony analysis tree obtained from the
dataset containing the partial DNA sequences of ITS,
GAPDH, ACT, CHS-1, HIS3 and TUB2 genes
130
4.70 Molecular phylogeny of F. incarnatum, generated from a
maximum parsimony analysis tree obtained from the
dataset containing the partial DNA sequences of EF1- α
gene.
131
4.71 Molecular phylogeny of F. proliferatum, generated from
maximum parsimony analysis tree inferred from the
dataset containing the partial DNA sequences of EF1- α
gene.
132
4.72 Molecular phylogeny of F. incarnatum and F.
proliferatum, generated from a maximum parsimony
analysis tree obtained from the dataset containing the
partial DNA sequences of EF1- α gene
133
xx
4.73 Molecular phylogeny of B. cinerea, generated from a
maximum parsimony analysis tree obtained from the
dataset containing the partial DNA sequences of ITS gene.
135
4.74 Molecular phylogeny of B. cinerea, generated from a
maximum parsimony analysis tree obtained from the
dataset containing the partial DNA sequences of partial
GAPDH gene
136
4.75 Molecular phylogeny of A. alternata, generated from a
maximum parsimony analysis tree obtained from the
dataset containing the partial DNA sequences of beta-
tubulin gene
137
4.76 Molecular phylogeny of F. equiseti, generated from a
maximum parsimony analysis tree obtained from the
dataset containing the partial DNA sequences of partial
TEF gene.
138
4.77 Molecular phylogeny of R. solani, generated from a
maximum parsimony analysis tree obtained from the
dataset containing the partial DNA sequences of RS gene
139
4.78 Molecular phylogeny of S. rolfsii, generated from a
maximum parsimony analysis tree obtained from the
dataset containing the partial DNA sequences of LSU gene
140
4.79 Percent radial mycelial growth inhibition of C. truncatum
after 7 days of incubation at 25°C treated with chitosan,
salicylic acid and calcium chloride. Means showing the
same letters are not significantly different according to the
LSD (P<0.05)
141
4.80 Radial mycelial growth of C. truncatum after 7 days of
incubation at 25°C treated with chitosan (a) 0.5% (b) 1%
(c) 1.5% (d) 2% (e) 2.5%
142
xxi
4.81 Radial mycelial growth of C. truncatum after 7 days of
incubation at 25°C treated with Salicylic acid (a) 0.5 % (b)
1% (c) 1.5 % (d) 2 % (e) 2.5 %
143
4.82 Radial mycelial growth of C. truncatum after 7 days of
incubation at 25°C treated with calcium chloride (a) 0.5%
(b) 1% (c) 1.5% (d) 2% (e) 2.5%
143
4.83 Percent radial mycelial growth inhibition of C. truncatum
at four concentrations of trans-2-hexenal, 1-hexanol and 1-
octen-3-ol after 7 days. Means showing the same letters are
not different significantly according to the LSD (P<0.05)
144
4.84 Percent radial mycelial growth inhibition of F. equiseti at
four concentrations of trans-2-hexenal, 1-hexanol and 1-
octen-3-ol after 7 days. Means showing the same letters are
not different significantly according to the LSD (P<0.05)
144
4.85 Radial mycelial growth of C. truncatum after 7 days of
incubation at 25°C treated with trans-2-hexenal (a) Control
(b) 10 ppm (c) 50 ppm (d) 100 ppm
145
4.86 Radial mycelial growth of C. truncatum after 7 days of
incubation at 25°C treated with 1-hexanol (a) Control (b)
10 ppm (c) 50 ppm (d) 100 ppm
145
4.87 Radial mycelial growth of C. truncatum after 7 days of
incubation at 25°C treated with 1-octen-3-ol (a) Control (b)
10 ppm (c) 50 ppm (d) 100 ppm
145
4.88 Radial mycelial growth of F. equiseti after 7 days of
incubation at 25°C treated with trans-2-hexenal (a) Control
(b) 10 ppm (c) 50 ppm (d) 100 ppm
146
4.89 Radial mycelial growth of F. equiseti after 7 days of
incubation at 25°C treated with 1-hexanol (a) Control (b)
10 ppm (c) 50 ppm (d) 100 ppm
146
4.90 Radial mycelial growth of F. equiseti after 7 days of
incubation at 25°C treated with 1-octen-3-ol (a) Control (b)
146
xxii
10 ppm (c) 50 ppm (d) 100 ppm
4.91 Percent RMGI of antagonistic fungi 147
4.92 Colonies of F. equiseti confronted with antagonistic fungi
after 7 days of incubation at 25°C
148
xxiii
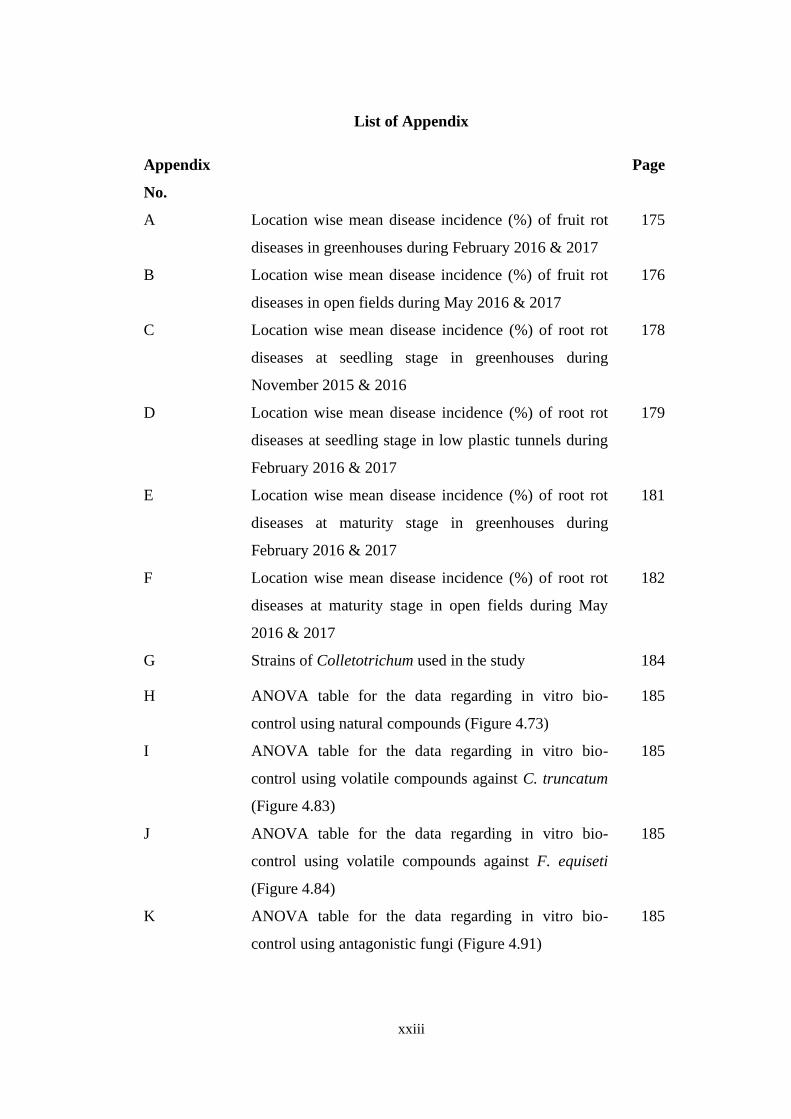
List of Appendix
Appendix
No.
Page
A Location wise mean disease incidence (%) of fruit rot
diseases in greenhouses during February 2016 & 2017
175
B Location wise mean disease incidence (%) of fruit rot
diseases in open fields during May 2016 & 2017
176
C Location wise mean disease incidence (%) of root rot
diseases at seedling stage in greenhouses during
November 2015 & 2016
178
D Location wise mean disease incidence (%) of root rot
diseases at seedling stage in low plastic tunnels during
February 2016 & 2017
179
E Location wise mean disease incidence (%) of root rot
diseases at maturity stage in greenhouses during
February 2016 & 2017
181
F Location wise mean disease incidence (%) of root rot
diseases at maturity stage in open fields during May
2016 & 2017
182
G Strains of Colletotrichum used in the study 184
H ANOVA table for the data regarding in vitro bio-
control using natural compounds (Figure 4.73)
185
I ANOVA table for the data regarding in vitro bio-
control using volatile compounds against C. truncatum
(Figure 4.83)
185
J ANOVA table for the data regarding in vitro bio-
control using volatile compounds against F. equiseti
(Figure 4.84)
185
K ANOVA table for the data regarding in vitro bio-
control using antagonistic fungi (Figure 4.91)
185
xxiv
List of Abbreviations
& And
et al. And others
bp Base pair
BLAST Basic Local Alignment Search Tool
°C Centigrade
CFU Colony forming unit
CV Coefficient of variation
° Degree
DEPC Diethtylpyrocarbonate
DNA Deoxyribonucleic acid
DI Disease incidence
DSI Disease severity index
GAPDH Glyceraldehyde phosphate dehydrogenase
G3PDH Glyceraldehyde-3-phosphate dehydrogenase
g Gram
gL-1 Gram per liter
> Greater than
GLVs Green leaf volatiles
ITS Internal Transcribed Spacer
LSU Large subunit
LSD Least significant difference
≤ Less than or equal to
μL Micro Liter
mL Millilitre
mm Millimeter
mM Millimolar
Mins Minutes
xxv
MEGA Molecular evolutionary genetics analysis
ng/μL Nanogram/microliter
NCBI National Center for Biotechnological
Information
PPM Parts per million
% Percentage
pH Potential hydrogen
± Plus Minus
PCR Polymerase Chain Reaction
PDA Potato Dextrose Agar
RMG Radial mycelial growth
RMGI Radial mycelial growth inhibition
rpm Revolutions per minute
sp. Species
SDW Sterile distilled water
TEF Translation elongation factor
TE Tris EDTA
VOCs Volatile organic compounds
v/v Volume/Volume
xxvi
Acknowledgements
All praises and thanks to “Al-Mighty Allah”, the most gracious and the most
merciful, the source of knowledge and wisdom endowed to mankind, who
conferred me with the power of mind and capability. All respects are for the most
beloved “Holy Prophet “Muhammad (PBUH)”, who is forever a symbol of
direction and torch of guidance for humanity as whole.
I consider it a privilege to express my sincere and deepest gratitude to a very
hardworking, visionary supervisor, Dr. Farah Naz, Associate Professor,
Department of Plant Pathology for her insight advice, constant encouragement,
moral support, scholarly criticism and generous use of her time throughout my
doctoral program.
I wish to extend my sincere gratitude with the profound thanks to the members
of my supervisory committee, Prof. Dr. Abdul Rauf, Professor, Department of
Plant Pathology and Dr. Muhammad Azam Khan, Director Advance Studies for
their thoughtful and consistence guidance and professional expertise.
A special thanks to Dr. Gulshan Irshad, Assistant Professor and Dr. Abid
Riaz, Associate Professor, Department of Plant Pathology for their kind support
and endearment guidance during the whole study period.
I am very thankful to the Higher Education Commission Indigenous Fellowship
(PIN no. 213-55464-2AV2-003) for providing me fund to pursue my Ph.D. at
Department of Plant Pathology, PMAS-Arid Agriculture University Rawalpindi.
Financial assistance received from HEC, under IRSIP program (PIN no. IRSIP 34
Agri 15) is highly acknowledged.
I wish to express gratitude to Prof. Joan Wennstrom Bennett, Distinguished
Professor and Dr. Ning Zhang, Associate Professor, Department of Plant Biology
and Pathology, Rutgers The State University of New Jersey, USA for their
continued support, encouragement and guidance during my research work.

xxvii
I am grateful to my friends Zobia Jabeen and Alveena Mumtaz for their help
and moral support throughout the study period. I am heartily thankful to my
colleagues, Hira Manzoor, Muhammad Anwar and Salman Ghuffar for their
help and memorable company.
Sincere thanks are extended to lab fellows especially Muhammad Shahid,
Dr. Amjad Shahzad, Dr. Abdul Sattar, Dr. Muhammad Fahim Abbas,
Beenish Gul, and Kamran Aslam for their valuable help and support. I am very
thankful to Muhammad Ehsan, Lab Assistant and Arshad Mehmood, Naib Qasid
for their sincere help.
I wish to thank my sisters; Hina Tariq, Aiman Tariq, Mamoona Tariq,
brother-in-law Muhammad Waqas, Samreen Tariq, brother-in-law Usman Arif,
niece Humnah Usman, nephews Shaheer Usman and Hammad Waqas for their
love and sincere prayers throughout my studies. Lastly, I would like to express my
heart-felt gratitude and thanks to my Parents, Mr. and Mrs. Tariq Hussain for all
their deep-rooted love, moral support, encouragement and great patience. This
thesis is truly a fruit of my Parents lifelong affection and prayers.
May Allah Bless them all, Ameen.
ALIYA TARIQ
xxviii
ABSTRACT
Bell pepper (Capsicum annuum L.) belongs to family ‘Solanaceae’ is among
the most popular and highly profitable vegetable throughout the world. Among
various biotic constraints fruit and root rot fungal pathogens contribute the most in
reducing the bell pepper produce qualitatively and quantitatively throughout the
worldwide including Pakistan. No detailed studies prior to this work have been
conducted in Pothohar plateau, Punjab, Pakistan. Consequently, there was a dire
need to conduct a comprehensive study for documenting prevalence and incidence
of fruit and root rot diseases. Moreover, fungicides are being used extensively
against the disastrous fruit and root rot pathogens. These fungicides not only
contaminate the environment but also are health risk for human beings. During
2015-16 and 2016-17 bell pepper cropping season, extensive surveys were
conducted in 9 tehsils/territory of Attock, Chakwal, Jhelum, Rawalpindi and
Islamabad territory. A total of 8 greenhouses and 45 farmer’s fields/low plastic
tunnels were visited at seedling and maturity stage to document fungal pathogen
associated with fruit and root rot of bell pepper and their incidence.
The survey revealed four pathogens viz. Colletotrichum, Fusarium, Botrytis,
and Alternaria were found responsible for fruit rot in bell pepper. In greenhouse,
Botrytis was mainly found associated with fruit rot with 15.13 percent fruit rot
incidence (%FRI) followed by Fusarium (13.63%) and Alternaria (9.69%). In open
fields the Colletotrichum (20.73%) was mainly found associated with fruit rot,
followed by Fusarium (12.04%), Alternaria (8.92%) and Botrytis (6.73%). Three
pathogens viz. Fusarium, Rhizoctonia and Sclerotium were found associated with
root rot. At seedling stage, the mean incidence of Rhizoctonia was the maximum
(19.25%) followed by Fusarium (15.63%) and Sclerotium (4.63%) root rot. In low
plastic tunnels, the overall incidence of Fusarium was the maximum (15.98%)
followed by Rhizoctonia (14.1%) and Sclerotium (7.38%) root rot. At maturity
stage in greenhouses, the incidence of Fusarium was the maximum (9.25%)
followed by Rhizoctonia (6.22%) and Sclerotium (4.94%) root rot. However, in
open fields, the incidence of Sclerotium was the maximum (14.35%) followed by
Fusarium (8.31%) and Rhizoctonia (6.15%) root rot.
xxix
Analysis of fruit and root rot samples employing morphological
characterization, showed prevalence of 8 fungal species (Colletotrichum
truncatum, Fusarium incarnatum, Fusarium proliferatum, Botrytis cinerea,
Alternaria alternata, Fusarium equiseti, Rhizoctonia solani and Sclerotium rolfsii)
belonging to 6 genera. Phylogenetic analysis showed the genetic homology of the
subject isolates with previously submitted isolates in GenBank, confirming the
morphological characterization. Highly virulent isolates of the most prevalent
pathogen from fruit (C. truncatum isolate ACT12) and root (F. equiseti isolate
FJH15) established during the pathogenicity test were selected for in vitro bio-
control trials. Among natural compounds, chitosan was found the most effective
with 55.55% radial mycelial growth inhibition at 2.5% concentration followed by
salicylic acid (53.33%) and calcium chloride (27.77%). All the tested volatiles
completely inhibited the radial mycelial growth at 100 ppm. Out of three
Trichoderma species, T. harzianum was found the most effective with the
maximum percent RMGI of 56.1%, followed by T. viride (53.5%) and T. hamatum
(48.7%). The present study documents the fruit and root rot pathogens in Pothohar
Plateau, Punjab, Pakistan. The morpho-molecular characterization further identifies
pathogens up to specie level. The exploration of bio-control strategies in vitro will
help to develop effective management under field conditions.
1
CHAPTER 1
INTRODUCTION
Bell pepper (Capsicum annuum L.) belongs to the ‘Solanaceae’ family which
includes other highly economic important crops such as potato and tomato (Dias et
al., 2013). It is native to Mexico, Central and South America and cultivated
extensively throughout the tropics, subtropics and temperate regions (Manrique,
1993; Walsh & Hoot, 2001). It is commonly known by various names such as
vegetable paprika, capsicum, bell pepper, sweet pepper and green pepper etc. It is
commonly named as ‘Shimla Mirch’ in Pakistan (Nadeem, Anjum, Khan, Saeed, &
Riaz, 2011). In American English, it is named as ‘Bell Pepper’ or ‘Chili Pepper’. In
British English, all Capsicum species are named as ‘Peppers’. In India and
Australian English, the name ‘Capsicum’ is exclusively used for non-pungent
varieties (Grubben & Denton, 2004).
The genus Capsicum (chili and other pepper) consists of approximately 31
species (Moscone et al., 2006). Among which, Capsicum annum Linn., Capsicum
frutescens Linn., Capsicum pubescens Ruiz & Pavon., Capsicum chinese Jacq. and
Capsicum baccatum Linn. var. pendulum are domesticated worldwide and other
are wild-type species (Basu, De, & De, 2003). The C. annuum is the world’s
extensively cultivated species followed by C. frutescens (Bosland & Votava, 2003).
Commercial bell pepper fruit is of various colors; green, red, yellow, orange,
cream, brown, purple and white depending on the genotype (Jovicich, Cantliffe, &
Vansickle, 2004). Bell pepper is extremely nutritious and have an excellent source
of vitamins A, Vitamin C, Niacin, Thiamine, pyridoxal phosphate, pantothenic
acid, riboflavin, folate, phenolics, polyphenols, flavonoids, beta-carotene, folic
acid, and minerals (iron, calcium, magnesium, phosphorus, zinc and potassium
(Shotorbani, Jamei, & Heidari, 2013). All these compounds are known for their
great antioxidant activity (Nadeem et al., 2011).
In the world, the bell pepper area and production are merged with that of chili
pepper. Hence the pepper (chili pepper and bell pepper) statistics was available as a
whole in the world and Pakistan. Pepper is cultivated worldwide, and Asia is the
2
largest producer contributing 64.1 per cent of the world’s production share by
region followed by America (13.4 %), Europe (12.3%), Africa (9.9%) and Oceania
(0.2%). Aggregate production of chilies and green pepper in world is about
36092631 tonnes with total area harvested and yield is 1987059 hectare and
181638 hectogram/hectare respectively. China the major capsicum producing
country, contributing 17795349 tonnes of the world’s production share followed by
Mexico (3296875 t), Turkey (2608172 t), Indonesia (2359441 t) and Spain
(1277908 t) (FAOSTAT, 2018). In Pakistan, chilies are cultivated on an area of
65275 ha with the production of 148114 t (GOP, 2019). However, the statistical
data regarding only bell pepper area and production was not found in the literature.
Capsicum (chili and bell pepper) contributes a major share among vegetables in
Pakistan. Chili is a valuable cash crop whereas, bell pepper is usually popular
vegetable among small land holders. It was estimated that, in Punjab province the
area under bell pepper has been found higher than the land utilized in planting chili
however, in Sindh province chili cultivation was fairly dominant. In Northern parts
of Khyber Pakhtunkhwa (KPK) province bell pepper cultivation was more as
compared with chili, whereas, in Balochistan province, area under chili was
dominant over bell pepper (Hussain Shah, Fahim, Hameed, & Haque, 2009).
Chilies are cultivated on an area of 54006 ha (Sindh), 6839 ha (Punjab), 4111 ha
(Balochistan) and 319 (KPK) (GOP, 2019).
Green bell pepper is generally cultivated in open fields in summer, while
colored pepper is grown extensively in greenhouse, shade structures and high
tunnels (Elio Jovicich, VanSickle, Cantliffe, & Stoffella, 2005). In controlled
structures, the environmental conditions are modified by lowering the temperature
during the warm season and maintaining a higher temperature during winter.
Consecutively, it provide the optimal conditions for the maximum growth, vigor
with improved quality and yield for good economic return (Jovicich et al., 2004).
Bell pepper is a perishable vegetable and fruit being hollow inside limits the
shelf-life less than a week and limits export to distant markets (Maalekuu, Elkind,
Tuvia-Alkalai, Shalom, & Fallik, 2003). Disease is the major contributing factor
that reduces the shelf life of bell pepper. During long-term storage, the postharvest
3
quality of fruit is affected by various pathological factors. Among which fungal
pathogens are major damaging cause (Hardenburg, Watada, & Wang, 1990) which
results in significant yield losses and reduce the quality of fruit (Rahimi,
Aboutalebi, & Zakerin, 2013). Bell pepper crop is affected by number of diseases
incited by various fungal pathogens such as anthracnose (Colletotrichum capsici
(Synd.) Butler and Bisby), damping-off (Pythium aphanidermatum (Edson) Fitzp.),
root rot (Rhizoctonia solani Kuhn), stem rot (Sclerotium rolfsii Sacc.), fruit rot
(Phytophthora nicotianae Breda de Haan) (Yabuuchi, Kosako, Yano, Hotta, &
Nishiuchi, 1995), white mold (Fusarium solani), gray mold (Botrytis cinerea) and
black mold by Alternaria alternata (Barkai-Golan, 2001). The primary microbial
decay of bell pepper is caused by A. alternata and B. cinerea (Elazar Fallik et al.,
1999).
Fungicides are being used extensively against the disastrous root rot and fruit
rot pathogens. These fungicides contaminate the environment and also have various
harmful effects on human health such as prevalence of multi-nutritional
deficiencies, persistence of toxic residues in the ecosystem and ground water
contamination etc. Moreover, the repetitive fungicide application leads to the
appearance of new resistant pathogenic strains / races and destruction of natural
parasites and predators (Yoon, Cha, & Kim, 2013). The consumer awareness about
hazardous residual effects of these fungicides, food quality and safety has increased
the demands for the development of nonhazardous, ecofriendly alternative
strategies for effective disease management (Faoro, Maffi, Cantu, & Iriti, 2008;
Terry & Joyce, 2004).
Use of natural substances such as edible coating of fresh agricultural products
is one of the promising healthy and environmentally conscience approach (Dhall,
2013). Biodegradable edible coating of polysaccharide chitosan has also been
found promising in the management of anthracnose of various tropical fruits (Ali,
Maqbool, Ramachandran, & Alderson, 2010). It has the innate antimicrobial
activity; improving the shelf life through prevention of excessive moisture loss and
control of gas exchange (Dutta, Tripathi, Mehrotra, & Dutta, 2009). Antagonistic
fungi such as Trichoderma species have the ability to control various soil-borne
4
pathogenic fungi (Whipps & Lumsden, 2001). Similarly, volatile organic
compounds released by fungi (FVOCs) have been recognized as an efficient
biocontrol agents (Morath, Hung, & Bennett, 2012). Green Leaf Volatiles (GLVs)
belonging to family of C6 compounds play a vital role in plant defenses (Scala,
Allmann, Mirabella, Haring, & Schuurink, 2013).
Fruit and root rot diseases of bell pepper are presently, causing significant
losses in Pakistan. Although some work has been conducted on the incidence and
management of fruit and root rot diseases of bell pepper in Pakistan (Abbasi,
Ashraf, Ali, & Butt, 2015; Jabeen, Javaid, Ahmed, & Sharif, 2014; Javaid & Iqbal,
2014; Sahi & Khalid, 2007), but these studies carry limited details regarding
incidence of various casual agents of these diseases. Moreover, no studies have
been carried prior to this work in Pothohar plateau related to incidence, prevalence
and molecular characterization of the pathogens involved. Consequently, there was
a dire need to conduct a comprehensive study for documenting incidence of fruit
and root rot diseases, identification of pathogenic species employing morphological
as well as molecular tools. The development of in vitro, eco-friendly management
approaches for the most prevalent fruit and root rot pathogen. Therefore, the
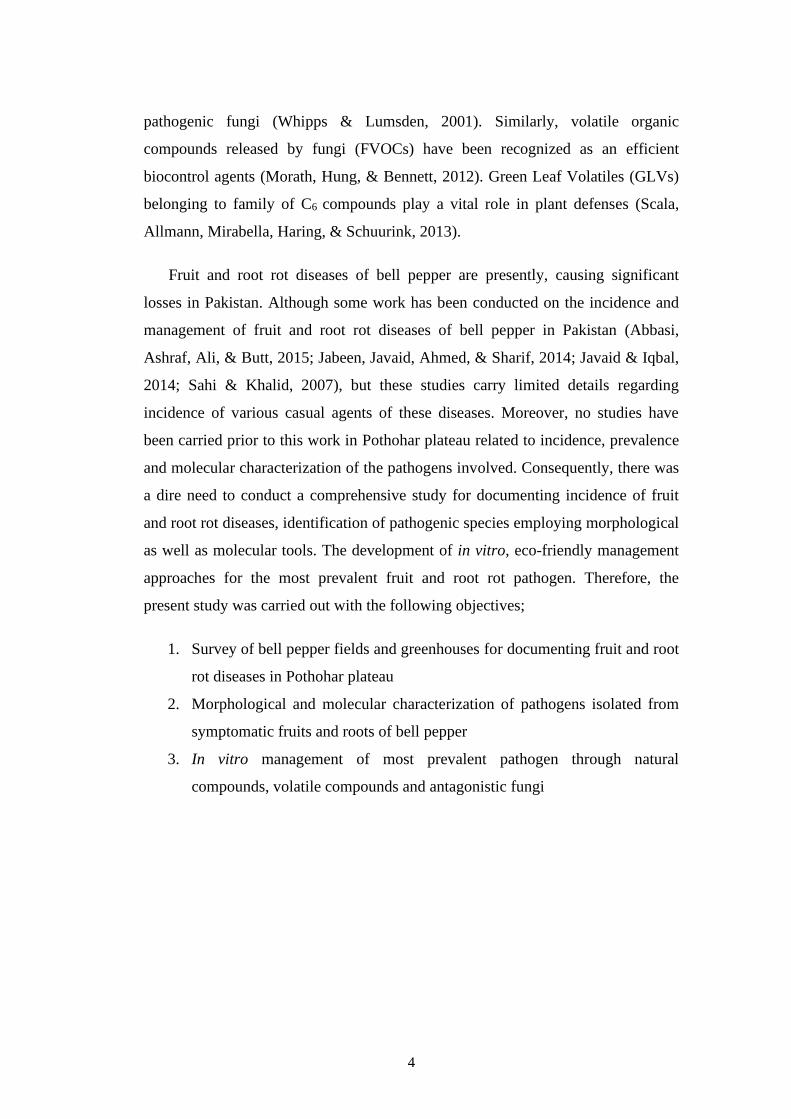
present study was carried out with the following objectives;
1. Survey of bell pepper fields and greenhouses for documenting fruit and root
rot diseases in Pothohar plateau
2. Morphological and molecular characterization of pathogens isolated from
symptomatic fruits and roots of bell pepper
3. In vitro management of most prevalent pathogen through natural
compounds, volatile compounds and antagonistic fungi
5
CHAPTER 2
REVIEW OF LITERATURE
Disease is one of the crucial factor, causing significant reduction in yield and
quality of bell pepper. A wide range of pathogens are responsible for causing
infectious diseases on bell pepper crop, among which, the plant diseases caused by
fungal pathogens are highly important. Pre- and post-emergence damping-off is
caused by a number of fungi belonged to various genera including, Fusarium,
Rhizoctonia, Phythium, Phythopthora and Sclerotium. These fungi are also
responsible to cause root rot, fruit rot, collar rot, stem rot, wilting and canker etc.
Major fruit rot diseases, known to deteriorate the bell pepper fruit quality are;
anthracnose, gray mold, Alternaria fruit rot and Fusarium fruit rot.
Anthracnose is an important disease of pepper; causes considerable yield
reduction worldwide mainly in the tropical and sub-tropical regions (Than,
Prihastuti, Phoulivong, Taylor, & Hyde, 2008) It causes both pre- and postharvest
fruit rots in major producing countries. The marketable yield loss of 100% has been
reported under favorable circumstances of rainy and warm seasons (Lewis Ivey,
Nava-Diaz, & Miller, 2004). Typical symptoms on fruit develop as necrotic,
sunken lesions that coalesce later; making the fruit non-marketable. The presence
of salmon or tan colored conidia within a lesion is a source of secondary inoculum
(Roberts, 2001).
The disease occurring typically on ripened fruit and considered a ‘ripe-rot’
disease (Kim, Oh, & Yang, 1999; Kwon & Lee, 2002). The disease has also been
found on young bell pepper fruit cultivated in the State of Florida and Ohio and
contrasts with previous reports that constricts it a ripe-rot disease (Harp et al.,
2008). Various Colletotrichum species infect pepper fruit at different growth
stages. C. truncatum is widespread usually on red color ripe pepper fruits, whereas
C. gloeosporioides, C. scovillei and C. acutatum are more prevalent on immature
green pepper (Kanto et al., 2014; Than et al., 2008).
Pepper anthracnose is caused by Colletotrichum complex with up to eleven
6
species: C. truncatum (Damm, Woudenberg, Cannon, & Crous, 2009), C.
gloeosporioides (Ramdial & Rampersad, 2015), C. acutatum (Harp, Kuhn, Roberts,
& Pernezny, 2014), C. coccodes (Shin, Xu, Zhang, & Chen, 2000), C. fructicola
(Sharma & Shenoy, 2014), C. siamense (Weir, Johnston, & Damm, 2012), C.
dematium (Than et al., 2008), C. boninense (Diao, Fan, Wang, & Liu, 2013), C.
brevisporum, C. scovillei and C. cliviae (Kanto et al., 2014).
Colletotrichum truncatum was typified, formally described on Phaseolus
lunatus, and has been known to cause anthracnose disease on legume crops, pepper
and many other hosts. C. capsici taxon was synonymized with C. truncatum, based
on morphological characterization and multi-locus phylogenetic approach (Damm
et al., 2009). Regardless, all scientists are not in agreement with this viewpoint
(Hyde et al., 2009). The C. capsici typified by other researchers and causes
anthracnose on a broad host range, including legume and pepper crop (Hyde et al.,
2009; Shenoy et al., 2007). Anthracnose caused by C. truncatum is a significant
disease of bell pepper in Pakistan, infecting 40 to 72% of the fruits and causing a
significant yield reduction (Tariq et al., 2017). The pathogen was previously found
on bell pepper in Mississippi (Roy, Killebrew, & Ratnayake, 1997) and Trinidad
(Ramdial & Rampersad, 2015) and has been reported on chili pepper in many
countries of the world (Katoch, Prabhakar, & Sharma, 2016).
Fruit, crown and stem rot of commercial grown bell pepper in greenhouse was
observed in Hungary. The disease was found to be caused by Fusarium solani
having Nectria haematococca as perfect stage. The same disease was also appeared
in Ontario and British Colombia (Canada) in 1991, where the Fusarium stem and
fruit rot cause up to 50% losses (Jarvis, Khosla, & Barrie, 1994). In England the
disease caused approximately 1% losses (Fletcher, 1994). Internal fruit rot of bell
pepper was emerged as a significant disease in greenhouses of British Columbia in
2002. The seedlings (3%) germinated from seeds were covered with mycelium and
causal agent was found to be Fusarium subglutinans (Wikkebweber & Reinking)
(Utkhede & Mathur, 2003; Utkhede & Mathur, 2004). This suggests that the
pathogen may be seed-transmitted.
The internal fruit rot in Alberta was associated to be caused by Fusarium lactis
7
based on morphological and nucleotide evidence of the β-tubulin, elongation factor
and mitochondrial small sub-unit ribosomal DNA (Yang, Kharbanda, Howard, &
Mirza, 2009). The disease was subsequently found in Saskatchewan in 2006,
Ontario in 2007, Netherlands and Belgium (Frans, Aerts, Van Calenberge, Van
Herck, & Ceusters, 2016). The closely associated fungi Fusarium proliferatum,
Fusarium oxysporum and Fusarium verticillioides have been associated to cause
fruit rot of bell pepper (Utkhede & Mathur, 2003; Yang et al., 2009).
Fruit Rot of bell Pepper in Trinidad (West Indies) was caused by Fusarium
solani. Disease incidence reached 80% with an estimate yield loss of 40 to 60%
(Ramdial & Rampersad, 2010). Fusarium lactis is responsible for causing fruit rot
of pepper in Korea with estimated disease incidence of 5% of 30 tons of harvested
peppers approximately (Choi, Hong, Kim, & Lee, 2011). In open fields of the Mid-
Atlantic regions of the USA, the internal F. lactis causes the fruit rot of bell pepper
ranging between 1% to 50% depending on the cultivar (Kline & Wyenandt, 2014).
F. incarnatum (Desm.) Sacc. causing a fruit rot of bell pepper in Trinidad which
belongs to the F. incarnatum-equiseti species complex. Yield losses were estimated
to be between 20 to 40% in fields (Ramdial, Hosein, & Rampersad, 2016).
Infection initiates when spore of the pathogen enters the flower stigma via air
or insect vector (Kharbanda, Yang, Howard, & Mirza, 2006). Typically, internal
fruit rot symptoms included the appearance of whitish-gray hyphal growth on the
seeds, placenta and inner fruit wall. The external symptoms on outer surface of
fruit occur as greenish to dark brown lesions only in severe infection. The infected
fruits generally show rare or few external disease symptoms such as sunken lesions
and fruits may not be discarded before transport to market, they might be
purchased and consumed (Yang et al., 2010).
Pepper root and basal stem rot has been incited by various strains of Fusarium
oxysporum and Fusarium solani species complex (Joffe & Palti, 1972; Rahin &
Sharif, 1985). Pepper wilting was attributed to be caused by F. oxysporum f. sp.
vasinfectum (Miller, Rowe, & Riedel, 1996), F. oxysporum var. redolens (Rahin &
Sharif, 1985), F. oxysporum f. sp. capsici (Black, Green, Hartman, & Poulos,
8
1993). In Almeria (Spain) F. oxysporum f. sp. radices capsici f. sp. nov was found
to be host specific to pepper plant (Lomas-Cano et al., 2014).
Botrytis fruit rot (also called gray mold or ash mold) caused by B. cinerea
[Botryotinia fuckeliana (de Barry) Whetzel] is a significant post-harvest decay
pathogen of pepper plant (Pernezny, Roberts, Murphy, & Goldberg, 2003). It
causes blight and rot of leaves, flowers and fruits of pepper (Domsch, Gams, &
Anderson, 1980). In capsicum fruit gray mold causes high postharvest losses (20 to
25%) (Fallik, Grinberg, Lomaniec, Lurie, & Lalazar, 1993). The infected tissues
are brown-gray, water-soaking of parenchyma tissues and covers the decayed tissue
with gray-brown conidia and conidiophores with small black sclerotia (Williamson,
Tudzynski, Tudzynski, & van Kan, 2007). Gray mold infection might occur
anywhere on stem-end and blossom-end of the fruit (Snowdon, 1990).
Gray mold on young pepper seedling cause damping-off with water-soaked,
tan-brown lesions near the soil line. Older lesions are girdle with thick, gray-brown
conidia and conidiophores and eventually cause sudden collapse of plant. Under
cool and wet conditions, gray-tan powdery spores frequently appear on dead plant
tissues (Akbudak, Tezcan, Akbudak, & Seniz, 2006). B. cinerea can cause
infection at many developmental stages during flowering, early or mature stages of
fruit development, even seedlings. Following the infection of flowers, B. cinerea
remains latent for long periods until environmental conditions are favorable during
the ripening process, initiates physiochemical and biochemical changes that leading
to fruit rot (Droby & Lichter, 2007).
Black mold of pepper is caused by Alternaria alternata and it infects wide
range of crops worldwide (Snowdon, 1990). The fungus has been reported to cause
allergies, respiratory disorders and also contributes a significant portion of the
aerospora (Green, Mitakakis, & Tovey, 2003). The fungus is of polyphagous nature
and produces toxic metabolites of carcinogenic and teratogenic properties (Woody
& Chu, 1992). The fungus causes fruit rot, black spots on fruit, internal mold of
fruit and blossom end rot. Following infection of flowers via the stigma and the
style, the fungus develops compact masses of hyphae and conidia on seed surface
(Halfon-Meiri & Rylski, 1983). A study was carried out to document fungi causing
9
fruit rot and dieback of chilli in Faisalabad. Among the fungi isolated, 4 were
proved to be pathogenic including C. capsici, C. lunata, F. oxysporum and A.
alternata (Khaleeque & Khan, 1991). In a study carried out on fruit rot of chillies
in Pakistan; A. tenuissima was documented as the causal agent. The pathogen
caused 100% and 55% infection on injured and uninjured fruit respectively at 20-
30°C (Kamal & Tahir-ud-din, 1970).
Damping-off is an important yield constrains that causes the death of
germinating seeds and young seedlings both in fields and nurseries. The most
frequently associated pathogens with damping-off are Fusarium sp., Pythium sp.,
Phytophthora sp. and Rhizoctonia sp. (Lamichhane et al., 2017). Pre-emergence
damping-off occur prior to seed germination; seeds soften, rotted and fail to
germinate. The germinating stems are also affected, and water-soaked lesions
developed at or below the soil line. The lesions later become darken, brown,
reddish-brown or black and quickly girdles the tender and young stems with the
progression of the disease (Landis, 2013). In post-emergence damping-off, the
seedlings wilt and rot after emergence resulting in the decay and death of the
seedlings (Horst, 2013).
In pepper, R. solani mainly cause hypocotyl rot and root rot. The fungus also
infects leaf and fruit near or on the soil line. The most common symptoms are
reddish-brown lesion on stems and roots. The pathogen is active in cool and moist
soils and survive as sclerotia in soil for many years (Vásquez, Tlapal, Yáñez, Pérez,
& Quintos, 2009). AG-4 is the key AG worldwide, associated to cause root rot in
pepper (Mikhail, Sabet, Omar, Asran, & Kasem, 2010). AG-3 is the major agent
causing damping-off disease in directly seeded Capsicum. Additionally, AG-1 also
has been documented from pepper (Bolkan & Ribeiro, 1985). In Turkey, strains of
AG-4, AG-2 type-1, AG-8 as well as binucleate Rhizoctonia sp. (AG-F, AG-A)
have been reported on pepper (Demirci & Doken, 1995; Tuncer & Erdiller, 1990).
Damping-off caused by Pythium species accounting more than 60% death of
seedlings both in main field and nursery (Manoranjitham, Prakasam, Rajappan, &
Amutha, 2000). P. aphanidermatum is associated with pre- and post-emergence
damping-off (Sutton et al., 2006). Affected plants shows the symptoms of stunted
10
growth, leaf chlorosis, leaf dropping and sudden wilting. P. myriotylum and P.
aphanidermatum are reported to cause root rot in the southeastern USA (Chellemi,
Mitchell, Kannwischer-Mitchell, Rayside, & Rosskopf, 2000). P. aphanidermatum
was reported on C. annuum in Australia (Stirling, Eden, & Ashley, 2004), Northern
Italy (Garibaldi, Gilardi, Ortu, & Gullino, 2014) and southeast Spain (de Cara,
Pérez-Hernández, Aguilera-Lirola, & Gómez-Vázquez, 2017).
The oomycete P. capsici Leonian, is the most destructive soil-borne pathogen
on peppers around the world (Hwang & Kim, 1995; Ristaino & Johnston, 1999).
The pathogen causes damping-off, root, crown or fruit rots, stem and leaf blight
depending on the plant stage and can infect all plant parts (Hausbeck & Lamour,
2004). The pathogen dispersed via surface water, water splashing within the soil
and has both sexual and asexual life cycle (Ristaino, Larkin, & Campbell, 1993). P.
capsici survives in soil by means of oospores and also infect roots by producing
motile zoospores. Phytopthora infection and zoospore production peaks during wet
and temperatures between 27 and 32°C (Gevens, Roberts, McGovern, & Kucharek,
2008).
Sclerotium rolfsii is a soil borne fungal pathogen that associated to cause white
mold, southern blight and stem rot. On global perspective, estimated yield loss of
1-60% and 10-20 million dollars have been linked with S. rolfsii (Kator, Hosea, &
Oche, 2015). The disease favors in moist conditions and temperature above 29°C.
Affected plants may emerged singly or grouped in circular patches with early
symptoms appeared as water-soaked spots on crown part and lower stem at or near
the soil line. Diseased foliage turns pale green, chlorosis and wilting and sudden
death. A dense whitish fungal hypha appeared on the crown and lower stem. The
dark brown sclerotia were later produced and serve as inoculums for the next crop
(Remesal, Lucena, Azpilicueta, Landa, & Navas-Cortés, 2010; Xie & Vallad,
2016).
Various negative effects of fungicides have been attributed to their persistent
application (Kookana, Baskaran, & Naidu, 1998). One such environmentally
conscience approach is the edible coating of fresh agricultural products through the
use of natural substances (Dhall, 2013). Chitosan is a ‘crustacean derived plant
11
defense booster’. The polysaccharide is composed of 2-amino-2 deoxy–β-D–
glucosamine. The chitosan is derived from chitin and the primary unit in the chitin
polymer is 2-deoxy-2-acetylamino glucose (Muzzarelli et al., 1986). Chitosan
inhibits with negatively charged molecules of the fungal cell, initiates leakage of
proteinaceous compounds and intracellular electrolytes (Leuba & Stossel, 1986).
The interaction between chitosan and fungi inhibits mRNA and protein synthesis
(Hadwiger, 1999). Application of chitosan coatings induce resistance against
several postharvest pathogens (Benhamou, 1996). Antifungal properties of chitosan
is well-known against various postharvest pathogens (El Ghaouth, Arul, Grenier, &
Asselin, 1992).
Use of volatile organic compounds (VOCs) is among the promising approaches
for biological control of disease (Herrmann, 2010). These are carbon containing
low molecular weight compounds, capable of converting to the gaseous state and
evaporate easily at normal temperature and pressure. Exposure and contact to high
concentrations of volatile such as formaldehyde, benzene, toluene, xylene and
methylene chloride, are ascertained to have harmful effects on human health (Plog,
Niland, & Quinlan, 1996).
Green leaf volatiles (GLVs) contain family of C6 compounds formed from
linolenic or linoleic acids. They are released by plants after tissue damage with the
distinctive fragrance of grass clipping. These GLVs derive from the hydroperoxide
lyase chain of the oxylipin pathway (Matsui, 2006). Aromatic oxylipins as well as
many of volatile compounds were found in essential oils of herbs and spices, in
fruit and vegetables. They are biologically active against various fungi (Tripathi &
Dubey, 2004). (E)-2-hexenal and 1-hexanol have been checked for their anti-
fungal activity against number of postharvest fungal pathogens (Corbo, Lanciotti,
Gardini, Sinigaglia, & Guerzoni, 2000; Cruz et al., 2012; De Lucca, Carter-
Wientjes, Boue, & Bhatnagar, 2011; Gardini, Lanciotti, & Guerzoni, 2001; Neri,
Mari, & Brigati, 2006).
C8 compounds isolated from molds and mushrooms are the most common
oxylipins. The most common reported volatile from fungi is 1-octen-3-ol, also
called as “mushroom alcohol,” or “matsutake alcohol”. It was first found from
12
Tricholoma matsutake mushroom (Wood & Fesler, 1986). It is synthesized via
enzymatic oxidation and linoleic acid cleavage through hydroperoxide lyase and
lipoxygenase and autoxidation of linoleic acid (Combet, Henderson, Eastwood, &
Burton, 2006). 1-Octen-3-ol is a fungal VOCs produced by various fungi
(Fusarium, Aspergillus, Stachybotrys, Penicillium, etc.) and frequently found in
water damaged buildings (Korpi, Järnberg, & Pasanen, 2009; Moularat, Robine,
Ramalho, & Oturan, 2008).
Trichoderma is another excellent eco-friendly, bio-control agent which
produces abundant spores on many substrates. It is a filamentous, free living fungi
and reproduced asexually and has a wide host range and easy growth pattern
(Whipps & Lumsden, 2001). It is an avirulent plant symbiont which kills various
soil borne pathogens through mycoparasitism. It is also a prolific producer of
antifungal compounds, antibiotics, enzymes and secondary metabolites. In vitro
association between C. capsici (isolated from pepper) and T. harzianum displayed
that colony diameter of C. capsici significantly reduced as compared to the control.
The percent radial growth inhibition ranges 44-48.71% (Ekefan, Jama, & Gowen,
2009).
The volatile compounds produced form Trichoderma harzianum, Trichoderma
viride, Trichoderma saturnisporum, Trichoderma reesei showed 30-67% inhibition
of C. capsici isolated from Capsicum frutescence. However, culture filtrate or non-
volatile compounds from T. harzianum, T. reesei and T. saturnisporum inhibits C.
capsici by 21-68%. T. viride at the concentration of 3-4% completely inhibit
mycelial growth (Ajith & Lakshmidevi, 2010). Similarly, both of T. viride and T.
harzianum showed high in vitro antifungal activity against Fusarium solani,
Macrophomina phaseolina and Rhizoctonia solani, and inhibited their radial
mycelial growth by 80-87% (Madbouly & Abdelbacki, 2017).
13
CHAPTER 3
MATERIALS AND METHODS
In the present studies, laboratory work, including isolations, morphological
characterization, preservation, pathogenicity tests and in vitro bio-control through
chitosan and antagonistic fungi were performed at the Fungal Plant Pathology
Laboratory, Department of Plant Pathology, PMAS-Arid Agriculture University
Rawalpindi, Pakistan. Field work was undertaken in bell pepper production fields in
Pothohar Plateau during 2015-16 and 2016-17 crop season. Molecular
characterization and in vitro bio-control through volatile compounds was conducted at
Department of Plant Biology and Pathology, Rutgers, The State University of New
Jersey, USA.
3.1 SURVEY FOR THE FRUIT AND ROOT ROT PATHOGENS
In the present study, farmer’s fields/greenhouses/low plastic tunnels of bell pepper
were surveyed during 2015-16 and 2016-17 for the assessment of prevalence and
incidence and collection of diseased samples. Samples showing typical symptoms of
fruit and root rot were collected after intensive fields inspection in Pothohar Plateau,
which includes Rawalpindi division (Rawalpindi, Chakwal, Jhelum and Attock
district) and Islamabad territory (Figure 3.1). A total of nine tehsils/territory were
visited.
In greenhouse cultivation a total of 8 greenhouses were visited. In open field
cultivation, 5 fields from each tehsil/territory were visited and a total of 45 fields were
surveyed. Survey was carried out twice in greenhouses/low plastic tunnels/open fields
at both seedling and maturity stage. The same number of 8 greenhouses and 45 fields
were visited at both stages (seedling and maturity) and cropping years (2015-16 and
2016-17) (Table 3.1).
For root rot diseases positive/symptomatic sampling (chlorosis, wilting, fallen
seedlings) was done twice; first at seedling stage and second at fruiting
stage/maturity. 30-40 days old seedlings were inspected and sampled during
November 2015 and 2016 in green house and February 2016 and 2017 in low plastic
14
Figure 3.1: Map showing the localities of study area
15
Table 3.1: The localities of tehsils of district Rawalpindi, Chakwal, Attock and
Islamabad territory surveyed for incidence and prevalence of root rot and fruit rot
pathogens of bell pepper.
District/
Territory
Tehsil/
Territory
Localities visited
Greenhouses Open fields
Rawalpindi Rawalpindi Adyala, Dhoke Budhal Adyala, Dhoke Budhal,
Chauntra, Chakri, Chak
Beli Khan
Taxila Taxila Taxila, Wah
Gujar Khan Jatli Jatli, Sukho, Daultala
Chakwal Chakwal Bhoun, Thoa Bahdar Bhoun, Dhudial, Dab,
Thoa Bahdar
Kallar Kahar Miani, Buchal Kalan
Choa Saidan
Shah
Dalelpur, Dulmial
Jhelum Sohawa Sohawa, Domeli
Attock Fateh Jang Bahter, Hasan Abdal
Islamabad Islamabad Chak Shehzad, Rawat Chak Shehzad, Rawat
tunnels. The seedling planted in low plastic tunnels were later transplanted in open
fields.
The survey and sampling of fruit rot diseases was done at maturity stage in green
house in February 2016 and 2017. In open fields, along with fruit rot diseases, survey
and sampling of root rot diseases was also carried out in May 2016 and 2017. The
same farmer fields/greenhouses/low plastic tunnels were surveyed during both years.
The disease incidence and prevalence were recorded to assess fruit and root rot
disease distribution in surveyed localities. For fruit rot diseases sampling was done in
×+ manner. Percentage prevalence and incidence of disease was calculated following
the given formula;
16
Disease prevalence (%) = Locations displayed root/fruit rot symptoms x 100
Total no. of locations visited
Disease Incidence (%) = ____No. of infected fruits/roots ____ x 100
Total no. of fruits/roots observed
From surveyed fields symptomatic/diseased samples were collected carefully. A
total of 360 samples were collected during 2015-16 and 2016-17. At seedling stage, a
total of 32 samples were collected from greenhouse and 95 samples were collected
from low plastic tunnels. At maturity stage, a total of 63 samples were collected from
greenhouses and 170 from open fields. The samples were properly labeled and time,
date, location was indicated and placed in sterile paper bags. Samples were brought
back to the lab. for the isolation of their respective causal pathogen. All samples were
carefully examined and typical symptoms were noted following pepper diseases
compendium (Roberts, Murphy, & Pernezny, 2003).
3.2 ISOLATION AND PURIFICATION OF PATHOGENS
The diseased fruit/root of bell pepper were rinsed under tap water for removal of
dirt and other contaminants, dried completely over sterile filter paper. The
symptomatic portions of fruit/root were cut into 5 to 10 mm2 pieces and tissues were
surface sterilized by dipping in sodium hypochlorite (1% NaCLO) for 1-2 mins,
dipped thrice in sterile distilled water (SDW) and blotted dry under several folds of
filter paper. After that the sterilized tissues were plated on petri dish (90 mm)
containing 9 mL potato dextrose agar (Lab M). The petri plates were incubated in a
growth chamber at 25 ± 2°C for 4-5 days for the growth of fruit/root rot fungi. The
cultures were purified by taking agar plug from actively growing colony edge and
placed on PDA plates. The plates were incubated for 7-10 days at 25 ± 2 ºC. The
whole procedure was performed in aseptic conditions under laminar airflow chamber.
3.3 PRESERVATION OF FUNGI
Pure fungal cultures were maintained on silica gel for long term preservation.
Vials were 1/3 filled with sterilized beads of silica gel. Conidial suspension was
prepared in cold skimmed milk (5% w:v). The vials with silica gel beads were chilled
before use and 100 µL of conidial suspension was added in it. Vials were incubated in
17
a growth chamber at 25 ± 2°C for 10 days. When silica gel beads crystallized, and
fungal growth was observed, bottles were stored at 4°C (Perkins, 1962). For the
revival of cultures few granules of silica gel were sprinkled onto fresh PDA and
incubated for 7 days at 25±2°C. The remaining beads were resealed and stored at 4°C.
3.4 CULTURAL/MICROSCOPIC CHARACTERISTICS
The isolated fruit/ root rot causing pathogens were characterized on the basis of
cultural, microscopic studies and compared with taxonomic keys documented in
literature for respective fungi. Colony characters of mature colony grown on PDA for
7 days at 25±2 ºC with alternate light and dark cycles were chosen for cultural studies.
The colony diameter was averaged by taking three measurements at right angle and
diagonal. The colony color, reverse color, texture, topography, margin of colony,
hyphal characteristics and resting structures (sclerotia) were visually studied. Conidia
were taken, mixed thoroughly in in a drop of lactophenol blue stain and examined
under high power microscope (Nikon YS 100). The microscopic characters viz. spore
color, shape, dimension (length × width), number of septations, hyphal dimensions
were noted. The mean and standard deviation data for radial mycelial growth and
conidial dimensions was analyzed statistically using SPSS statistical software 16.020.
3.5 PATHOGENICITY TEST
For pathogenicity test, yolo wonder variety was used, that was widely planted by
growers at the time of survey (Figure 3.2). Pathogenicity tests for fruit rot pathogens
were performed on young, healthy bell pepper fruit. Prior to inoculation fruits were
rinsed with SDW, dipped in 1% NaCLO for 1 min. and washed in SDW three times.
Seven days old, pure culture grown on PDA was used for pathogenicity test. In each
petri dish 7 mL SDW was added. Conidia were harvested by scraping 7-days old pure
cultures with sterile glass rod. The spore suspension was filtered, and final
concentration was adjusted with hemocytometer (Table 3.2). Three fruits per isolate
was inoculated with 20 µL spore suspension and applied as a droplet. Three control
fruits per isolate was treated with same volume of SDW. All inoculated and control
fruits were kept in plastic containers and incubated at 25 ± 2°C in a growth chamber
for 7-10 days and 60-70% moisture.
To determine pathogenicity for root rot pathogens potting mixture consisting of
18
Figure 3.2: Bell pepper seedlings of yolo wonder variety for pathogenicity test
Table 3.2: Inoculums potential of fungal spores used for the pathogenicity test
Fungal Genera Inoculums Potential Reference
Alternaria 2×10⁵ cfu’s/ml (Halfon-Meiri & Rylski, 1983)
Colletotrichum 1×10⁶ cfu’s/ml (Ramdial & Rampersad, 2015)
Fusarium 1×10⁶ cfu’s/ml (Ramdial & Rampersad, 2010)
Botrytis 1×10⁶ cfu’s/ml
(Le, McDonald, Scott, & Able,
2013)
soil, sand and manure (1:1:1) was fumigated with formalin (37%) and covered with
sheet of polyethylene for 48 h. The potting mixture was air dried for 3-4 days till the
formalin volatilized (Naz, Rauf, Abbasi, Haque, & Ahmad, 2008). For root rot
pathogen (Fusarium equiseti), 4-week old bell pepper seedlings (3 seedlings for each
isolate) of yolo wonder variety was inoculated by root drenching using 20 mL
conidial suspension (Table 3.2). For Rhizoctonia and Sclerotium isolates, inoculum
was colonized on wheat grains for 14 days. Three days prior to transplantation 10-12
seeds mixed in the upper 2 cm fumigated soil layer. Additional three bell pepper
seedlings per isolate were included without inoculation (10-12 healthy wheat seeds),
served as control. The control and treated seedlings were maintained in a growth
chamber for 15 days at 22-30°C day temperature, 20-22ºC night temperature and 60-
70% moisture.
19
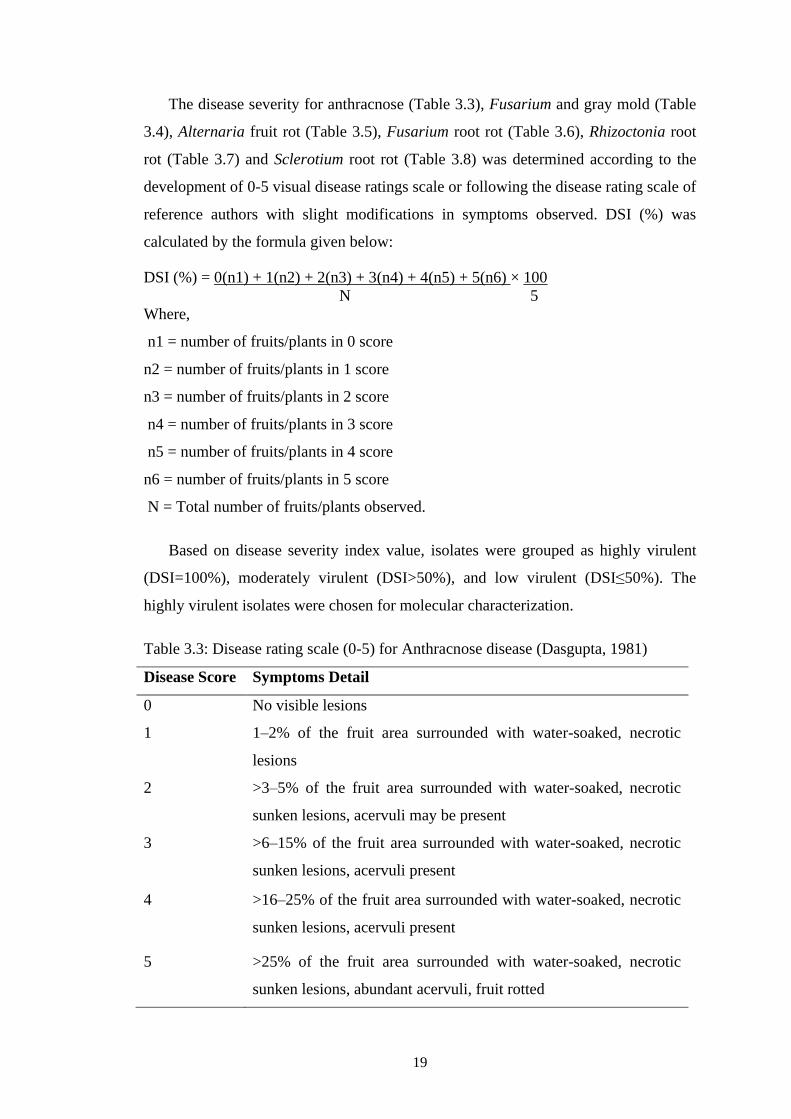
The disease severity for anthracnose (Table 3.3), Fusarium and gray mold (Table
3.4), Alternaria fruit rot (Table 3.5), Fusarium root rot (Table 3.6), Rhizoctonia root
rot (Table 3.7) and Sclerotium root rot (Table 3.8) was determined according to the
development of 0-5 visual disease ratings scale or following the disease rating scale of
reference authors with slight modifications in symptoms observed. DSI (%) was
calculated by the formula given below:
DSI (%) = 0(n1) + 1(n2) + 2(n3) + 3(n4) + 4(n5) + 5(n6) × 100
N 5
Where,
n1 = number of fruits/plants in 0 score
n2 = number of fruits/plants in 1 score
n3 = number of fruits/plants in 2 score
n4 = number of fruits/plants in 3 score
n5 = number of fruits/plants in 4 score
n6 = number of fruits/plants in 5 score
N = Total number of fruits/plants observed.
Based on disease severity index value, isolates were grouped as highly virulent
(DSI=100%), moderately virulent (DSI>50%), and low virulent (DSI≤50%). The
highly virulent isolates were chosen for molecular characterization.
Table 3.3: Disease rating scale (0-5) for Anthracnose disease (Dasgupta, 1981)
Disease Score Symptoms Detail
0 No visible lesions
1 1–2% of the fruit area surrounded with water-soaked, necrotic
lesions
2 >3–5% of the fruit area surrounded with water-soaked, necrotic
sunken lesions, acervuli may be present
3 >6–15% of the fruit area surrounded with water-soaked, necrotic
sunken lesions, acervuli present
4 >16–25% of the fruit area surrounded with water-soaked, necrotic
sunken lesions, acervuli present
5 >25% of the fruit area surrounded with water-soaked, necrotic
sunken lesions, abundant acervuli, fruit rotted
20
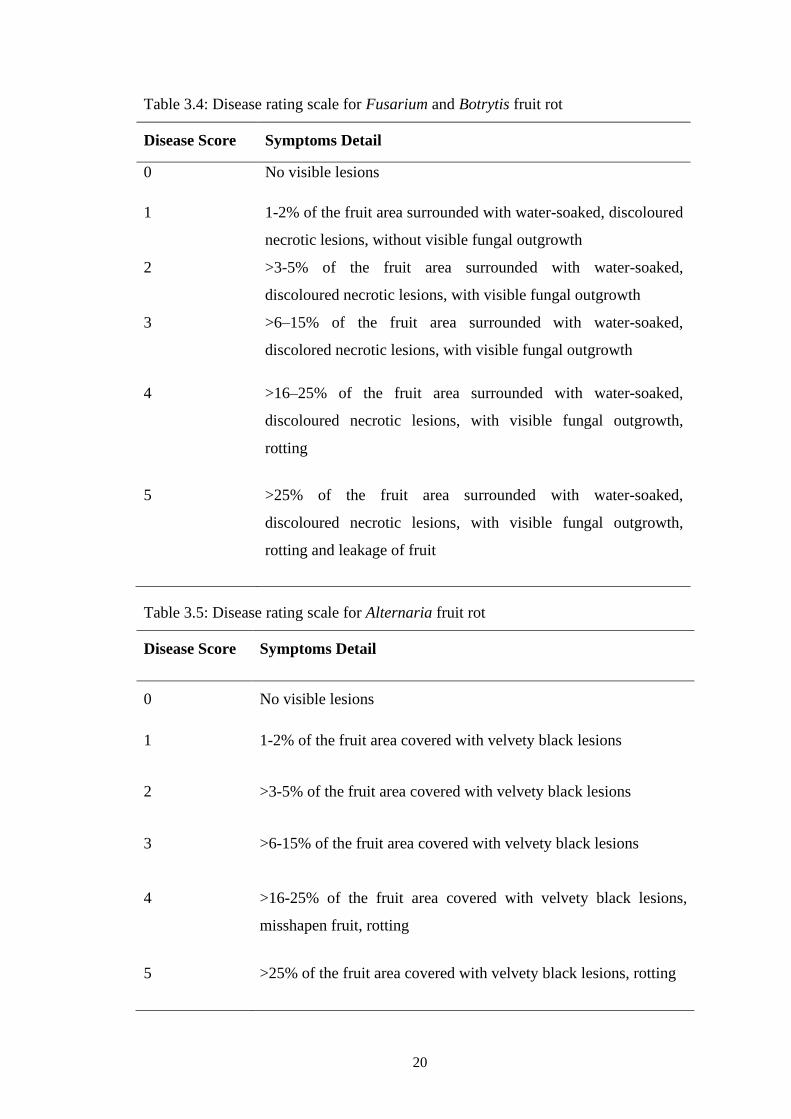
Table 3.4: Disease rating scale for Fusarium and Botrytis fruit rot
Disease Score Symptoms Detail
0 No visible lesions
1 1-2% of the fruit area surrounded with water-soaked, discoloured
necrotic lesions, without visible fungal outgrowth
2 >3-5% of the fruit area surrounded with water-soaked,
discoloured necrotic lesions, with visible fungal outgrowth
3 >6–15% of the fruit area surrounded with water-soaked,
discolored necrotic lesions, with visible fungal outgrowth
4 >16–25% of the fruit area surrounded with water-soaked,
discoloured necrotic lesions, with visible fungal outgrowth,
rotting
5 >25% of the fruit area surrounded with water-soaked,
discoloured necrotic lesions, with visible fungal outgrowth,
rotting and leakage of fruit
Table 3.5: Disease rating scale for Alternaria fruit rot
Disease Score Symptoms Detail
0 No visible lesions
1 1-2% of the fruit area covered with velvety black lesions
2 >3-5% of the fruit area covered with velvety black lesions
3 >6-15% of the fruit area covered with velvety black lesions
4 >16-25% of the fruit area covered with velvety black lesions,
misshapen fruit, rotting
5 >25% of the fruit area covered with velvety black lesions, rotting
21
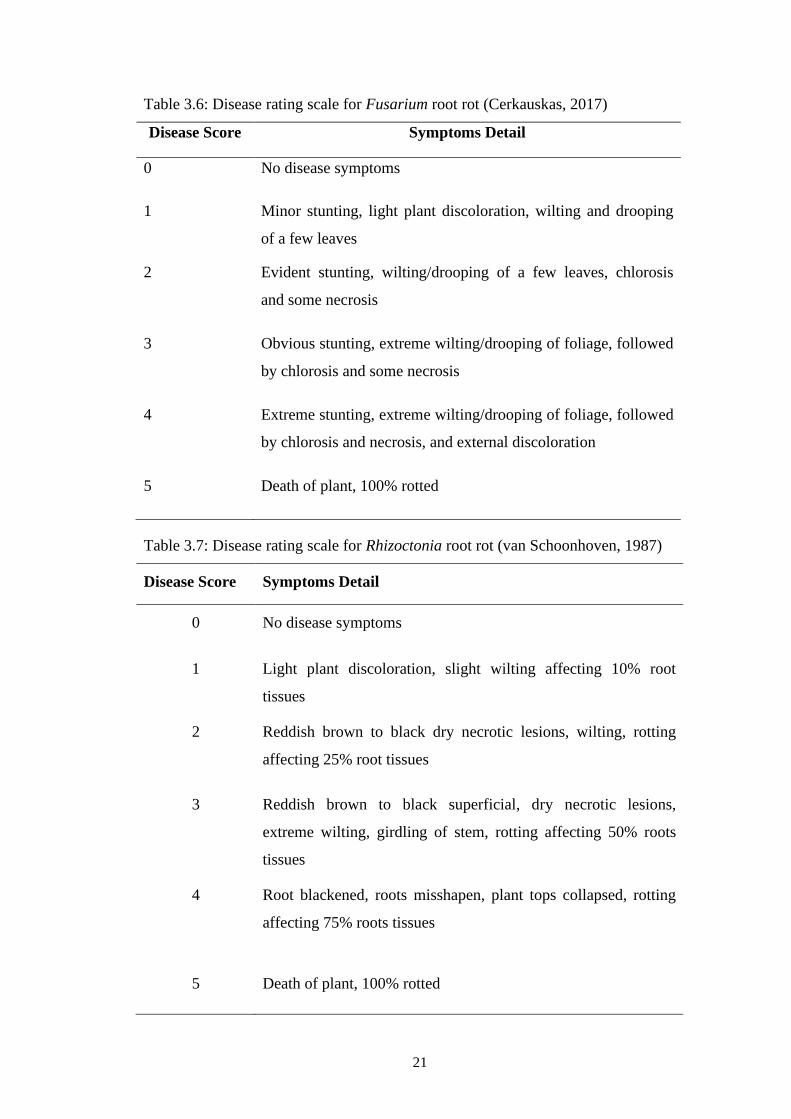
Table 3.6: Disease rating scale for Fusarium root rot (Cerkauskas, 2017)
Disease Score Symptoms Detail
0 No disease symptoms
1 Minor stunting, light plant discoloration, wilting and drooping
of a few leaves
2 Evident stunting, wilting/drooping of a few leaves, chlorosis
and some necrosis
3 Obvious stunting, extreme wilting/drooping of foliage, followed
by chlorosis and some necrosis
4 Extreme stunting, extreme wilting/drooping of foliage, followed
by chlorosis and necrosis, and external discoloration
5 Death of plant, 100% rotted
Table 3.7: Disease rating scale for Rhizoctonia root rot (van Schoonhoven, 1987)
Disease Score Symptoms Detail
0 No disease symptoms
1 Light plant discoloration, slight wilting affecting 10% root
tissues
2 Reddish brown to black dry necrotic lesions, wilting, rotting
affecting 25% root tissues
3 Reddish brown to black superficial, dry necrotic lesions,
extreme wilting, girdling of stem, rotting affecting 50% roots
tissues
4 Root blackened, roots misshapen, plant tops collapsed, rotting
affecting 75% roots tissues
5 Death of plant, 100% rotted
22
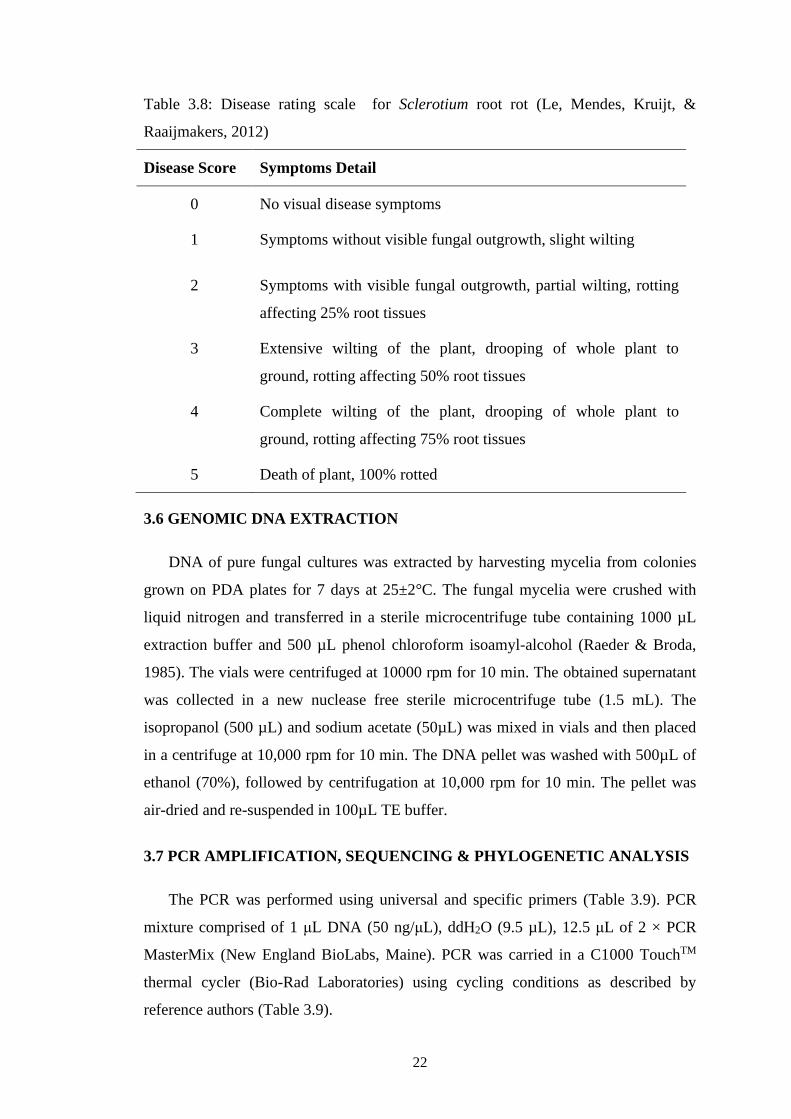
Table 3.8: Disease rating scale for Sclerotium root rot (Le, Mendes, Kruijt, &
Raaijmakers, 2012)
Disease Score Symptoms Detail
0 No visual disease symptoms
1 Symptoms without visible fungal outgrowth, slight wilting
2 Symptoms with visible fungal outgrowth, partial wilting, rotting
affecting 25% root tissues
3 Extensive wilting of the plant, drooping of whole plant to
ground, rotting affecting 50% root tissues
4 Complete wilting of the plant, drooping of whole plant to
ground, rotting affecting 75% root tissues
5 Death of plant, 100% rotted
3.6 GENOMIC DNA EXTRACTION
DNA of pure fungal cultures was extracted by harvesting mycelia from colonies
grown on PDA plates for 7 days at 25±2°C. The fungal mycelia were crushed with
liquid nitrogen and transferred in a sterile microcentrifuge tube containing 1000 µL
extraction buffer and 500 µL phenol chloroform isoamyl-alcohol (Raeder & Broda,
1985). The vials were centrifuged at 10000 rpm for 10 min. The obtained supernatant
was collected in a new nuclease free sterile microcentrifuge tube (1.5 mL). The
isopropanol (500 µL) and sodium acetate (50µL) was mixed in vials and then placed
in a centrifuge at 10,000 rpm for 10 min. The DNA pellet was washed with 500µL of
ethanol (70%), followed by centrifugation at 10,000 rpm for 10 min. The pellet was
air-dried and re-suspended in 100µL TE buffer.
3.7 PCR AMPLIFICATION, SEQUENCING & PHYLOGENETIC ANALYSIS
The PCR was performed using universal and specific primers (Table 3.9). PCR
mixture comprised of 1 μL DNA (50 ng/μL), ddH2O (9.5 µL), 12.5 μL of 2 × PCR
MasterMix (New England BioLabs, Maine). PCR was carried in a C1000 TouchTM
thermal cycler (Bio-Rad Laboratories) using cycling conditions as described by
reference authors (Table 3.9).
23
The amplified product of PCR was purified using ExoSAP-IT (Affymetrix,
California) and sequenced in both directions by Genscript Inc. (Piscataway, New
Jersey) with the same PCR primers. Sequences of the partial forward and reverse
regions were aligned with MUSCLE (Edgar, 2004). The representative isolates of
present study as well as reference sequences from GenBank based on high similarity
index were selected for phylogenetic analysis. Maximum parsimony tree was
generated with MEGA 7 (Felsenstein, 1985; Nei & Kumar, 2000).
3.8 IN VITRO MANAGEMENT OF HIGHLY PREVALENT FRUIT ROT
PATHOGEN WITH NATURAL COMPOUNDS
The in vitro efficacy of natural compounds viz. chitosan, salicylic acid and
calcium chloride was evaluated against highly virulent isolate of Colletotrichum
truncatum (ACT12) using poisoned food technique (Naz et al. 2006). PDA medium
was amended with five concentrations each of natural compounds (Sigma Aldrich)
viz. chitosan (0.5%, 1.0%, 1.5 %, 2.0%, 2.5%), salicylic acid (0.138 gL-1) (0.5%, 1%,
1.5%, 2%, 2.5%) and calcium chloride (0.5%, 1.0%, 1.5 %, 2.0%, 2.5%). The control
plates were inoculated only with pathogen. Chitosan solution was prepared by
dissolving chitosan powder (2 g) in distilled water (100 mL) containing acetic acid
(0.5 ml v/v). The solution was agitated constantly on hotplate magnetic stirrer at 40
°C. The chitosan solution was sterilized for 15 min and pH was adjusted to 5.6 using 1
N NaOH. This stock solution was used to prepare different concentrations of chitosan.
The natural compounds amended plates and control plates were inoculated with
pathogen and incubated at 25±2 ºC. Each treatment was replicated six times. The
colony diameter was monitored daily and then final data (% RMGI) was noted after 7
days (Tiru, Muleta, Bercha, & Adugna, 2013). The data was analyzed statistically
following a completely randomized factorial design using SPSS software 16.020.
Means were separated using LSD test at p≤0.05.
3.9 IN VITRO MANAGEMENT OF HIGHLY PREVALENT FRUIT AND
ROOT ROT PATHOGEN WITH VOLATILE COMPOUNDS
Highly virulent isolate of Fusarium equiseti (FJH15) and Colletotrichum
truncatum (ACT12) was grown on PDA and incubated at 25±2ºC. I plates (100 × 15
mm) were used and one half of the plate contained PDA (10 mL) and other half
contained a sterile glass cover slip (22 mm × 22 mm). Mycelial plugs were taken from
24
7 days actively growing colony and placed onto PDA medium in one half of the I
plates. Liquid aliquots of the volatiles being tested was placed on a sterile glass cover
slip in another half. The amount of each volatile was calculated according to the
density and volume of the container. The volatiles tested were trans-2-hexenal (0.846
g/mL), 1-octen-3-ol (0.83 g/mL) and 1-hexanol (0.82 g/mL) having the concentrations
of 10, 50 and 100 ppm. In control petri plates drop of distilled water was placed on
sterile glass cover slip. Inoculated and control plates were sealed with two layers of
parafilm and incubated at 25°C. The colony diameter was monitored daily and then
final data (% RMGI) was noted after 7 days (Tiru, Muleta, Bercha, & Adugna, 2013).
All treatments were replicated six times. The data was analyzed statistically following
a completely randomized factorial design using SPSS software 16.020. Means were
separated using LSD test at p≤0.05.
3.10 IN VITRO MANAGEMENT OF ROOT ROT PATHOGEN WITH
ANTAGNOSTIC FUNGI
Three Trichoderma species, viz. T. harzianum, T. viride and T. hamatum were
tested employing dual culture technique against highly virulent isolate of F. equiseti
(FJH15). The culture was grown on PDA. Agar discs of 6mm in diameter were taken
from one week old culture of the pathogen or antagonistic fungi and placed 2cm apart
from opposite edges of the petri dish. Both discs were 5 cm apart from each other. In
control treatment, the sterile PDA disc of 6 mm was placed in petri dish instead of
Trichoderma species. The colony diameter was monitored daily and then final data
(% RMGI) was noted after 7 days (Tiru, Muleta, Bercha, & Adugna, 2013). Each
treatment was replicated six times. The data regarding inhibition of percent radial
mycelial growth was analyzed statistically following a completely randomized
factorial design using SPSS software 16.020. Means were separated using Fisher’s
LSD test at p≤0.05.
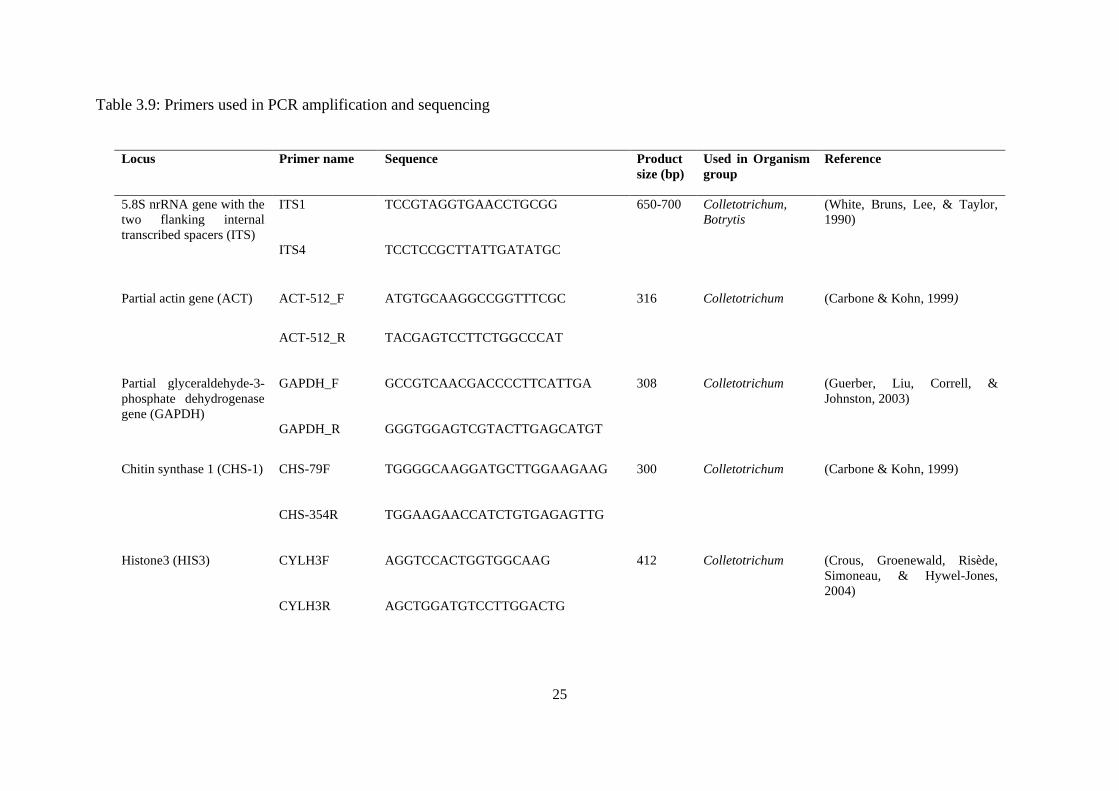
25
Table 3.9: Primers used in PCR amplification and sequencing
Locus Primer name Sequence Product
size (bp)
Used in Organism
group
Reference
5.8S nrRNA gene with the
two flanking internal
transcribed spacers (ITS)
ITS1
TCCGTAGGTGAACCTGCGG
650-700 Colletotrichum,
Botrytis
(White, Bruns, Lee, & Taylor,
1990)
ITS4 TCCTCCGCTTATTGATATGC
Partial actin gene (ACT)
ACT-512_F
ATGTGCAAGGCCGGTTTCGC
316
Colletotrichum (Carbone & Kohn, 1999)
ACT-512_R
TACGAGTCCTTCTGGCCCAT
Partial glyceraldehyde-3-
phosphate dehydrogenase
gene (GAPDH)
GAPDH_F
GCCGTCAACGACCCCTTCATTGA
308 Colletotrichum (Guerber, Liu, Correll, &
Johnston, 2003)
GAPDH_R GGGTGGAGTCGTACTTGAGCATGT
Chitin synthase 1 (CHS-1)
CHS-79F
TGGGGCAAGGATGCTTGGAAGAAG
300 Colletotrichum (Carbone & Kohn, 1999)
CHS-354R
TGGAAGAACCATCTGTGAGAGTTG
Histone3 (HIS3)
CYLH3F
AGGTCCACTGGTGGCAAG
412 Colletotrichum (Crous, Groenewald, Risède,
Simoneau, & Hywel-Jones,
2004) CYLH3R
AGCTGGATGTCCTTGGACTG
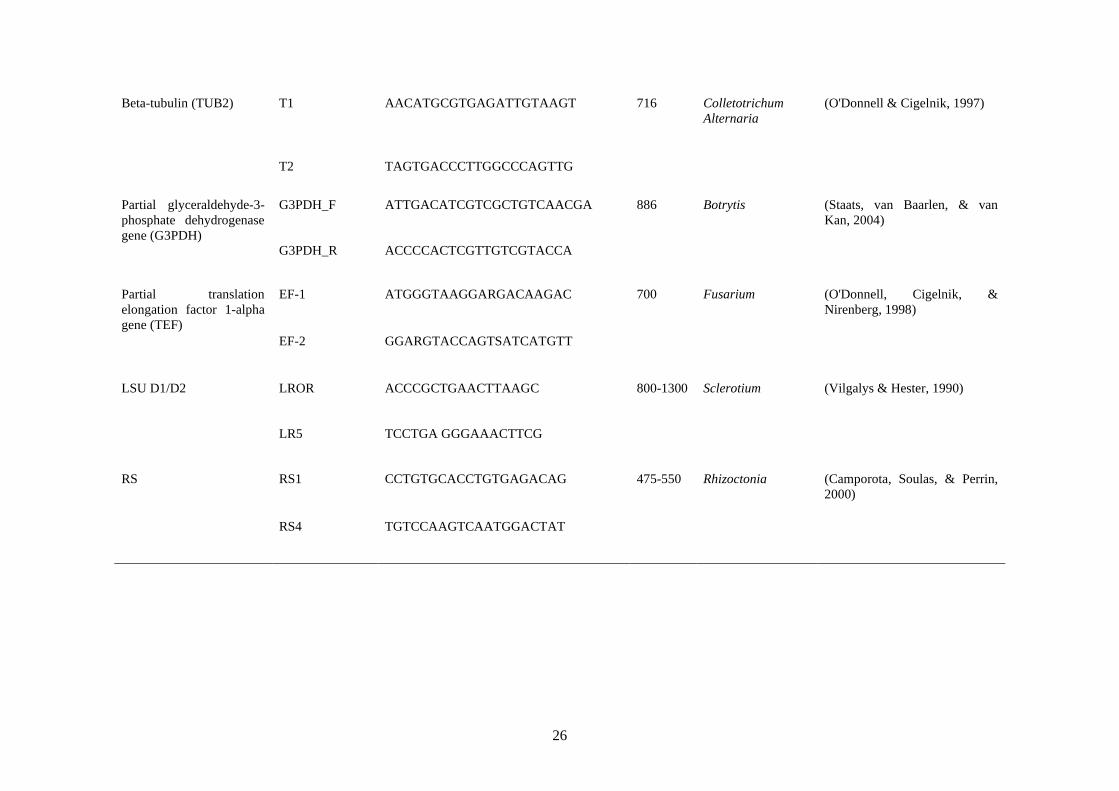
26
Beta-tubulin (TUB2)
T1 AACATGCGTGAGATTGTAAGT 716 Colletotrichum
Alternaria
(O'Donnell & Cigelnik, 1997)
T2
TAGTGACCCTTGGCCCAGTTG
Partial glyceraldehyde-3-
phosphate dehydrogenase
gene (G3PDH)
G3PDH_F
ATTGACATCGTCGCTGTCAACGA
886 Botrytis (Staats, van Baarlen, & van
Kan, 2004)
G3PDH_R ACCCCACTCGTTGTCGTACCA
Partial translation
elongation factor 1-alpha
gene (TEF)
EF-1
ATGGGTAAGGARGACAAGAC 700 Fusarium (O'Donnell, Cigelnik, &
Nirenberg, 1998)
EF-2 GGARGTACCAGTSATCATGTT
LSU D1/D2 LROR
ACCCGCTGAACTTAAGC 800-1300 Sclerotium (Vilgalys & Hester, 1990)
LR5 TCCTGA GGGAAACTTCG
RS RS1
CCTGTGCACCTGTGAGACAG 475-550 Rhizoctonia (Camporota, Soulas, & Perrin,
2000)
RS4 TGTCCAAGTCAATGGACTAT
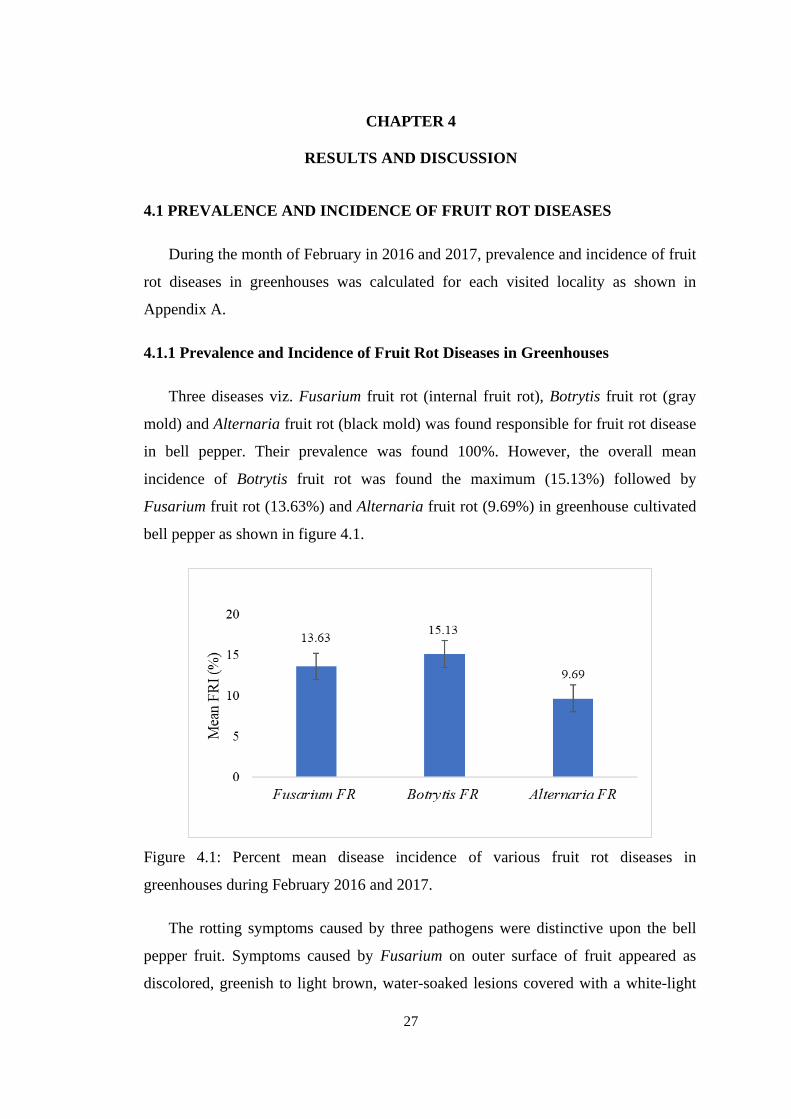
27
CHAPTER 4
RESULTS AND DISCUSSION
4.1 PREVALENCE AND INCIDENCE OF FRUIT ROT DISEASES
During the month of February in 2016 and 2017, prevalence and incidence of fruit
rot diseases in greenhouses was calculated for each visited locality as shown in
Appendix A.
4.1.1 Prevalence and Incidence of Fruit Rot Diseases in Greenhouses
Three diseases viz. Fusarium fruit rot (internal fruit rot), Botrytis fruit rot (gray
mold) and Alternaria fruit rot (black mold) was found responsible for fruit rot disease
in bell pepper. Their prevalence was found 100%. However, the overall mean
incidence of Botrytis fruit rot was found the maximum (15.13%) followed by
Fusarium fruit rot (13.63%) and Alternaria fruit rot (9.69%) in greenhouse cultivated
bell pepper as shown in figure 4.1.
Figure 4.1: Percent mean disease incidence of various fruit rot diseases in
greenhouses during February 2016 and 2017.
The rotting symptoms caused by three pathogens were distinctive upon the bell
pepper fruit. Symptoms caused by Fusarium on outer surface of fruit appeared as
discolored, greenish to light brown, water-soaked lesions covered with a white-light
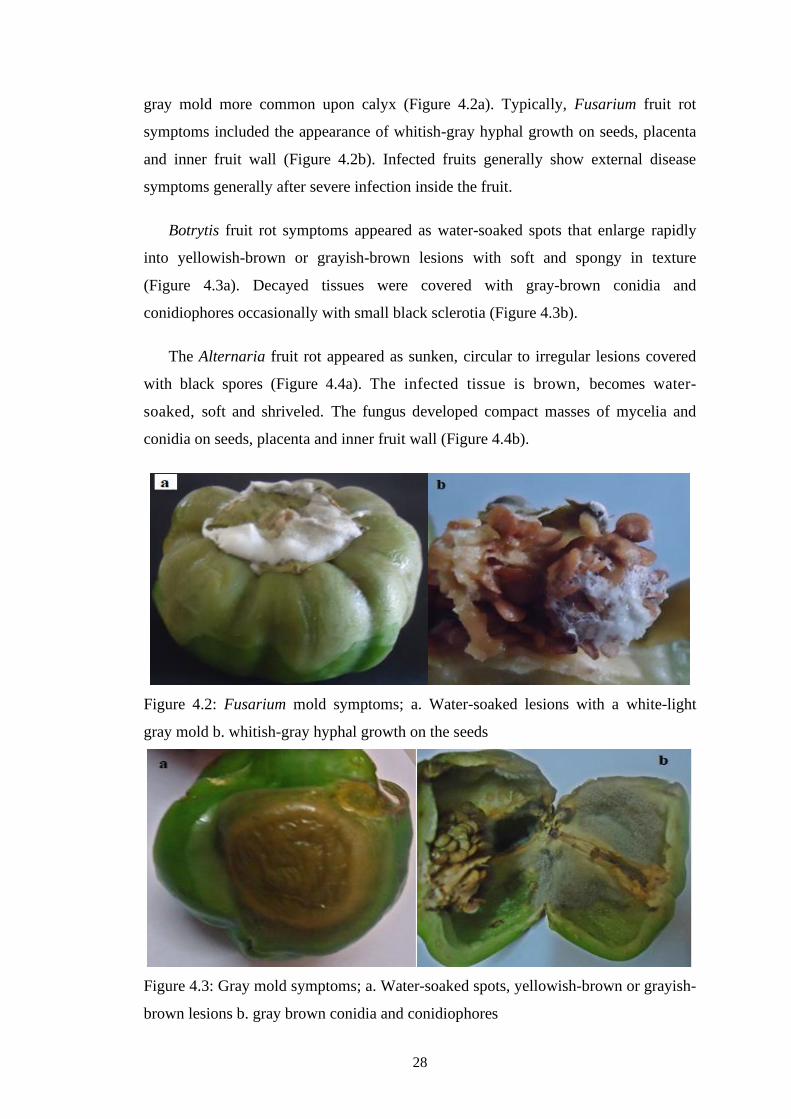
28
gray mold more common upon calyx (Figure 4.2a). Typically, Fusarium fruit rot
symptoms included the appearance of whitish-gray hyphal growth on seeds, placenta
and inner fruit wall (Figure 4.2b). Infected fruits generally show external disease
symptoms generally after severe infection inside the fruit.
Botrytis fruit rot symptoms appeared as water-soaked spots that enlarge rapidly
into yellowish-brown or grayish-brown lesions with soft and spongy in texture
(Figure 4.3a). Decayed tissues were covered with gray-brown conidia and
conidiophores occasionally with small black sclerotia (Figure 4.3b).
The Alternaria fruit rot appeared as sunken, circular to irregular lesions covered
with black spores (Figure 4.4a). The infected tissue is brown, becomes water-
soaked, soft and shriveled. The fungus developed compact masses of mycelia and
conidia on seeds, placenta and inner fruit wall (Figure 4.4b).
Figure 4.2: Fusarium mold symptoms; a. Water-soaked lesions with a white-light
gray mold b. whitish-gray hyphal growth on the seeds
Figure 4.3: Gray mold symptoms; a. Water-soaked spots, yellowish-brown or grayish-
brown lesions b. gray brown conidia and conidiophores
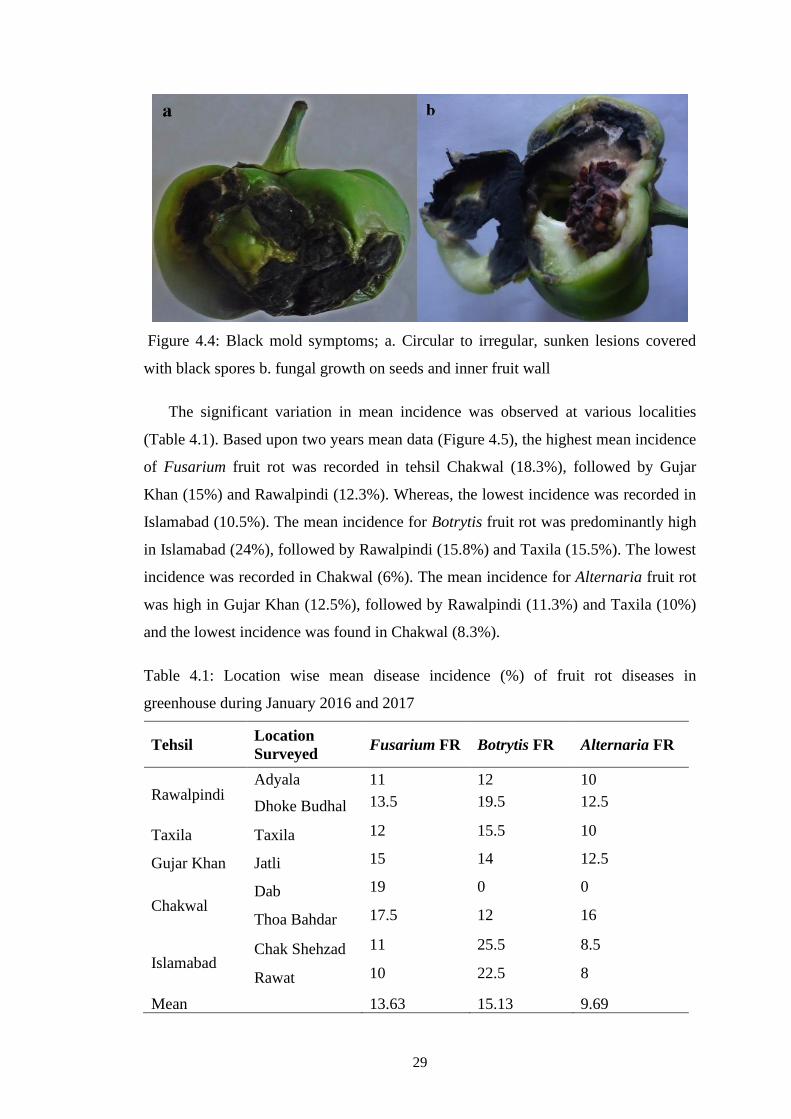
29
Figure 4.4: Black mold symptoms; a. Circular to irregular, sunken lesions covered
with black spores b. fungal growth on seeds and inner fruit wall
The significant variation in mean incidence was observed at various localities
(Table 4.1). Based upon two years mean data (Figure 4.5), the highest mean incidence
of Fusarium fruit rot was recorded in tehsil Chakwal (18.3%), followed by Gujar
Khan (15%) and Rawalpindi (12.3%). Whereas, the lowest incidence was recorded in
Islamabad (10.5%). The mean incidence for Botrytis fruit rot was predominantly high
in Islamabad (24%), followed by Rawalpindi (15.8%) and Taxila (15.5%). The lowest
incidence was recorded in Chakwal (6%). The mean incidence for Alternaria fruit rot
was high in Gujar Khan (12.5%), followed by Rawalpindi (11.3%) and Taxila (10%)
and the lowest incidence was found in Chakwal (8.3%).
Table 4.1: Location wise mean disease incidence (%) of fruit rot diseases in
greenhouse during January 2016 and 2017
Tehsil Location
Surveyed Fusarium FR Botrytis FR Alternaria FR
Rawalpindi Adyala 11 12 10
Dhoke Budhal 13.5 19.5 12.5
Taxila Taxila 12 15.5 10
Gujar Khan Jatli 15 14 12.5
Chakwal Dab 19 0 0
Thoa Bahdar 17.5 12 16
Islamabad Chak Shehzad 11 25.5 8.5
Rawat 10 22.5 8
Mean 13.63 15.13 9.69
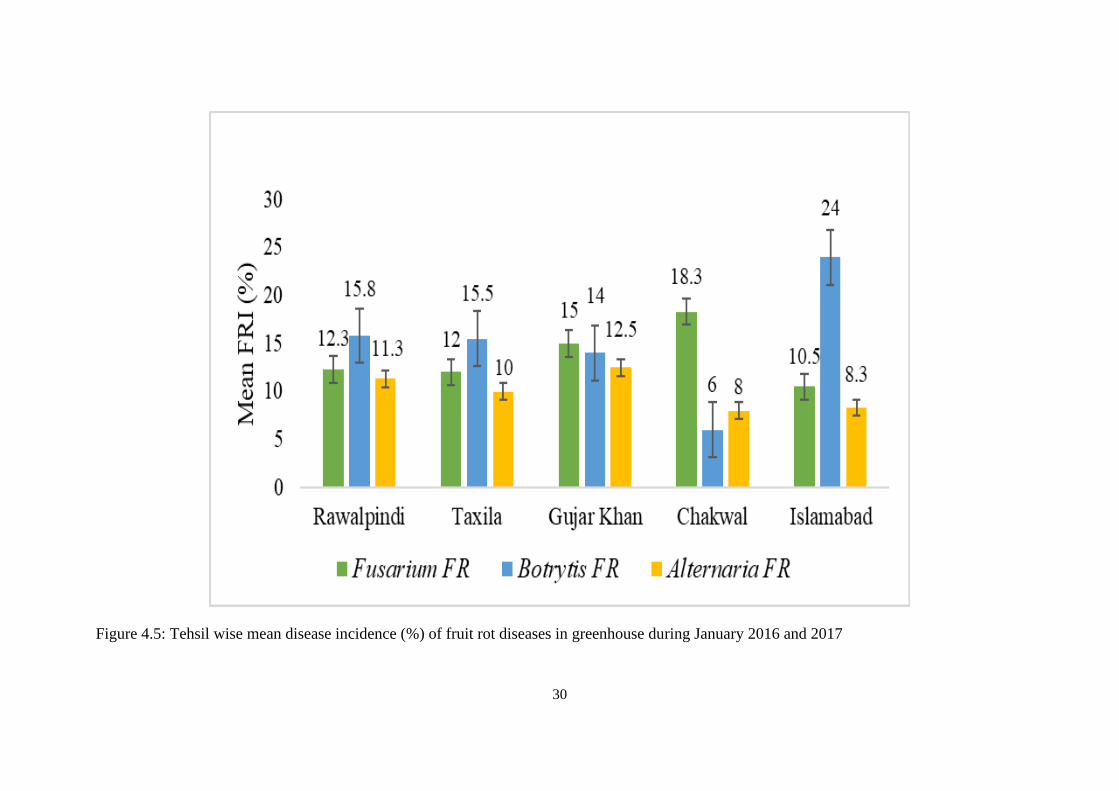
30
Figure 4.5: Tehsil wise mean disease incidence (%) of fruit rot diseases in greenhouse during January 2016 and 2017
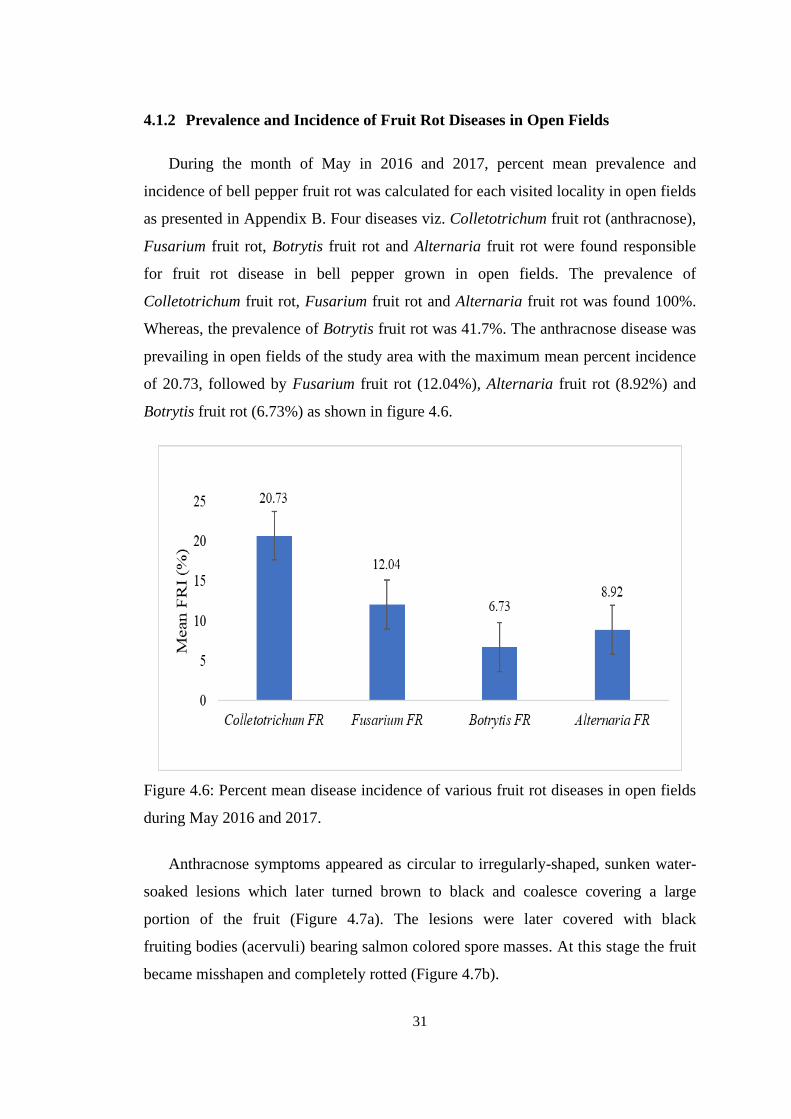
31
4.1.2 Prevalence and Incidence of Fruit Rot Diseases in Open Fields
During the month of May in 2016 and 2017, percent mean prevalence and
incidence of bell pepper fruit rot was calculated for each visited locality in open fields
as presented in Appendix B. Four diseases viz. Colletotrichum fruit rot (anthracnose),
Fusarium fruit rot, Botrytis fruit rot and Alternaria fruit rot were found responsible
for fruit rot disease in bell pepper grown in open fields. The prevalence of
Colletotrichum fruit rot, Fusarium fruit rot and Alternaria fruit rot was found 100%.
Whereas, the prevalence of Botrytis fruit rot was 41.7%. The anthracnose disease was
prevailing in open fields of the study area with the maximum mean percent incidence
of 20.73, followed by Fusarium fruit rot (12.04%), Alternaria fruit rot (8.92%) and
Botrytis fruit rot (6.73%) as shown in figure 4.6.
Figure 4.6: Percent mean disease incidence of various fruit rot diseases in open fields
during May 2016 and 2017.
Anthracnose symptoms appeared as circular to irregularly-shaped, sunken water-
soaked lesions which later turned brown to black and coalesce covering a large
portion of the fruit (Figure 4.7a). The lesions were later covered with black
fruiting bodies (acervuli) bearing salmon colored spore masses. At this stage the fruit
became misshapen and completely rotted (Figure 4.7b).
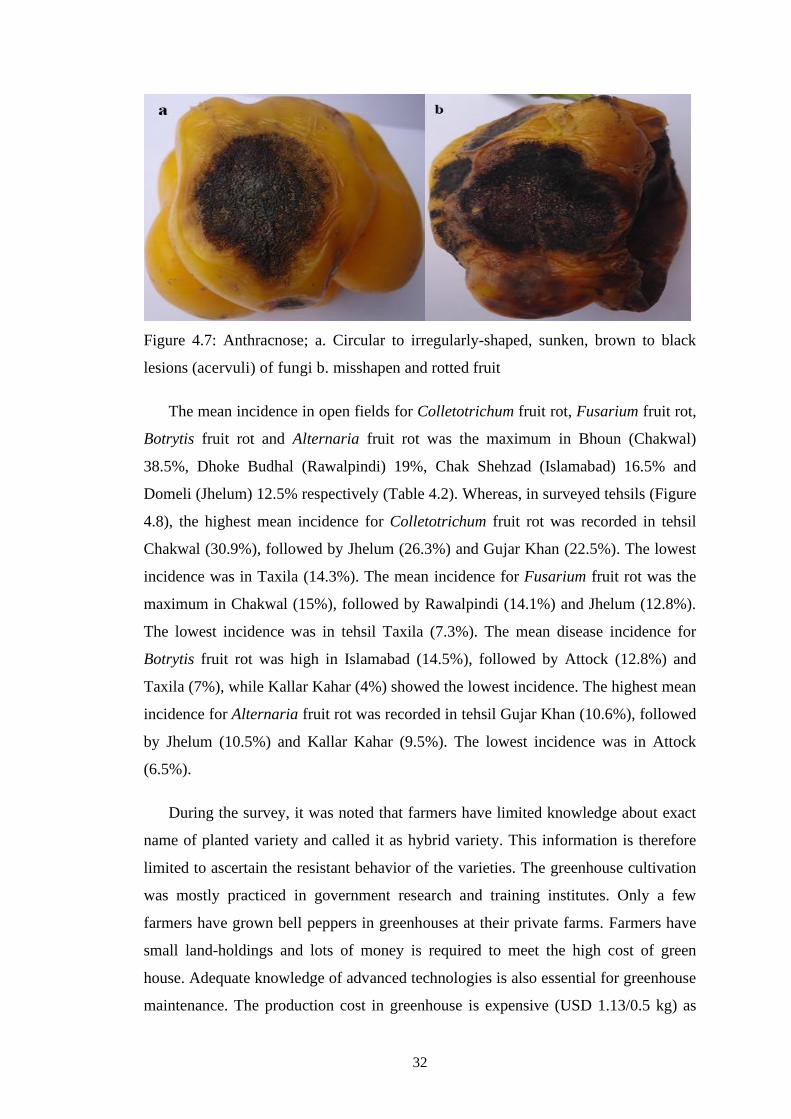
32
Figure 4.7: Anthracnose; a. Circular to irregularly-shaped, sunken, brown to black
lesions (acervuli) of fungi b. misshapen and rotted fruit
The mean incidence in open fields for Colletotrichum fruit rot, Fusarium fruit rot,
Botrytis fruit rot and Alternaria fruit rot was the maximum in Bhoun (Chakwal)
38.5%, Dhoke Budhal (Rawalpindi) 19%, Chak Shehzad (Islamabad) 16.5% and
Domeli (Jhelum) 12.5% respectively (Table 4.2). Whereas, in surveyed tehsils (Figure
4.8), the highest mean incidence for Colletotrichum fruit rot was recorded in tehsil
Chakwal (30.9%), followed by Jhelum (26.3%) and Gujar Khan (22.5%). The lowest
incidence was in Taxila (14.3%). The mean incidence for Fusarium fruit rot was the
maximum in Chakwal (15%), followed by Rawalpindi (14.1%) and Jhelum (12.8%).
The lowest incidence was in tehsil Taxila (7.3%). The mean disease incidence for
Botrytis fruit rot was high in Islamabad (14.5%), followed by Attock (12.8%) and
Taxila (7%), while Kallar Kahar (4%) showed the lowest incidence. The highest mean
incidence for Alternaria fruit rot was recorded in tehsil Gujar Khan (10.6%), followed
by Jhelum (10.5%) and Kallar Kahar (9.5%). The lowest incidence was in Attock
(6.5%).
During the survey, it was noted that farmers have limited knowledge about exact
name of planted variety and called it as hybrid variety. This information is therefore
limited to ascertain the resistant behavior of the varieties. The greenhouse cultivation
was mostly practiced in government research and training institutes. Only a few
farmers have grown bell peppers in greenhouses at their private farms. Farmers have
small land-holdings and lots of money is required to meet the high cost of green
house. Adequate knowledge of advanced technologies is also essential for greenhouse
maintenance. The production cost in greenhouse is expensive (USD 1.13/0.5 kg) as
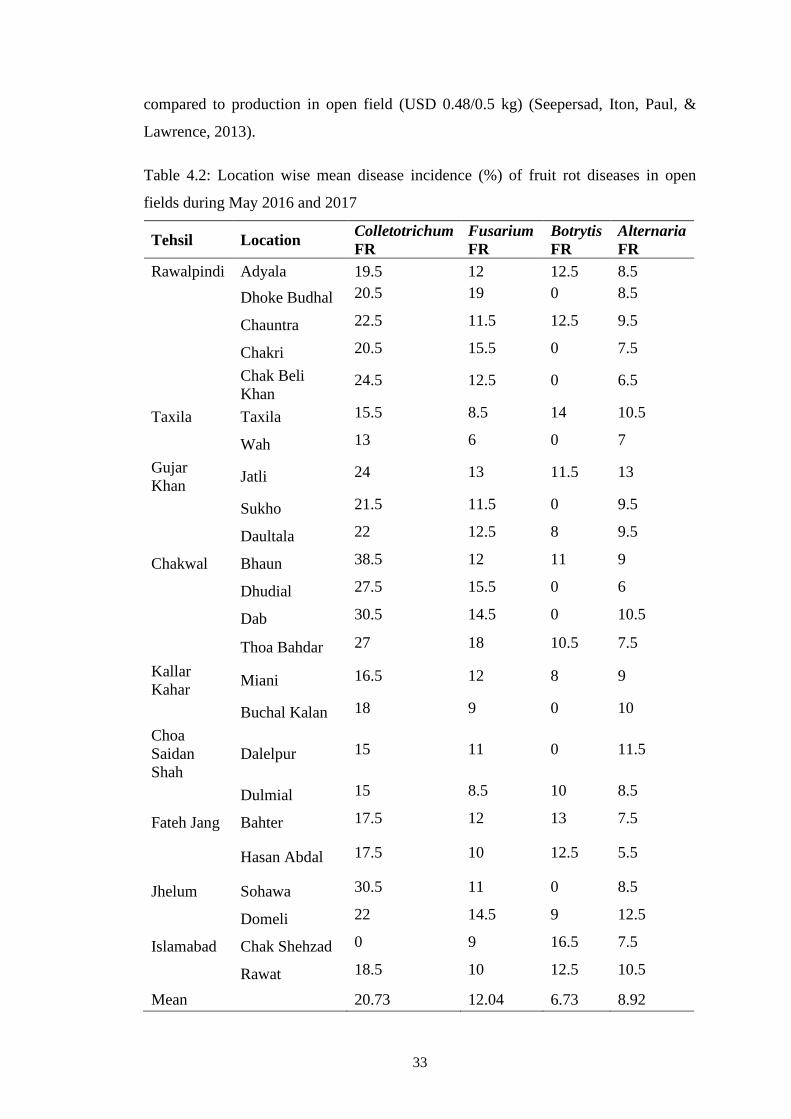
33
compared to production in open field (USD 0.48/0.5 kg) (Seepersad, Iton, Paul, &
Lawrence, 2013).
Table 4.2: Location wise mean disease incidence (%) of fruit rot diseases in open
fields during May 2016 and 2017
Tehsil Location Colletotrichum
FR
Fusarium
FR
Botrytis
FR
Alternaria
FR
Rawalpindi Adyala 19.5 12 12.5 8.5
Dhoke Budhal 20.5 19 0 8.5
Chauntra 22.5 11.5 12.5 9.5
Chakri 20.5 15.5 0 7.5
Chak Beli
Khan 24.5 12.5 0 6.5
Taxila Taxila 15.5 8.5 14 10.5
Wah 13 6 0 7
Gujar
Khan Jatli 24 13 11.5 13
Sukho 21.5 11.5 0 9.5
Daultala 22 12.5 8 9.5
Chakwal Bhaun 38.5 12 11 9
Dhudial 27.5 15.5 0 6
Dab 30.5 14.5 0 10.5
Thoa Bahdar 27 18 10.5 7.5
Kallar
Kahar Miani 16.5 12 8 9
Buchal Kalan 18 9 0 10
Choa
Saidan
Shah
Dalelpur 15 11 0 11.5
Dulmial 15 8.5 10 8.5
Fateh Jang Bahter 17.5 12 13 7.5
Hasan Abdal 17.5 10 12.5 5.5
Jhelum Sohawa 30.5 11 0 8.5
Domeli 22 14.5 9 12.5
Islamabad Chak Shehzad 0 9 16.5 7.5
Rawat 18.5 10 12.5 10.5
Mean 20.73 12.04 6.73 8.92
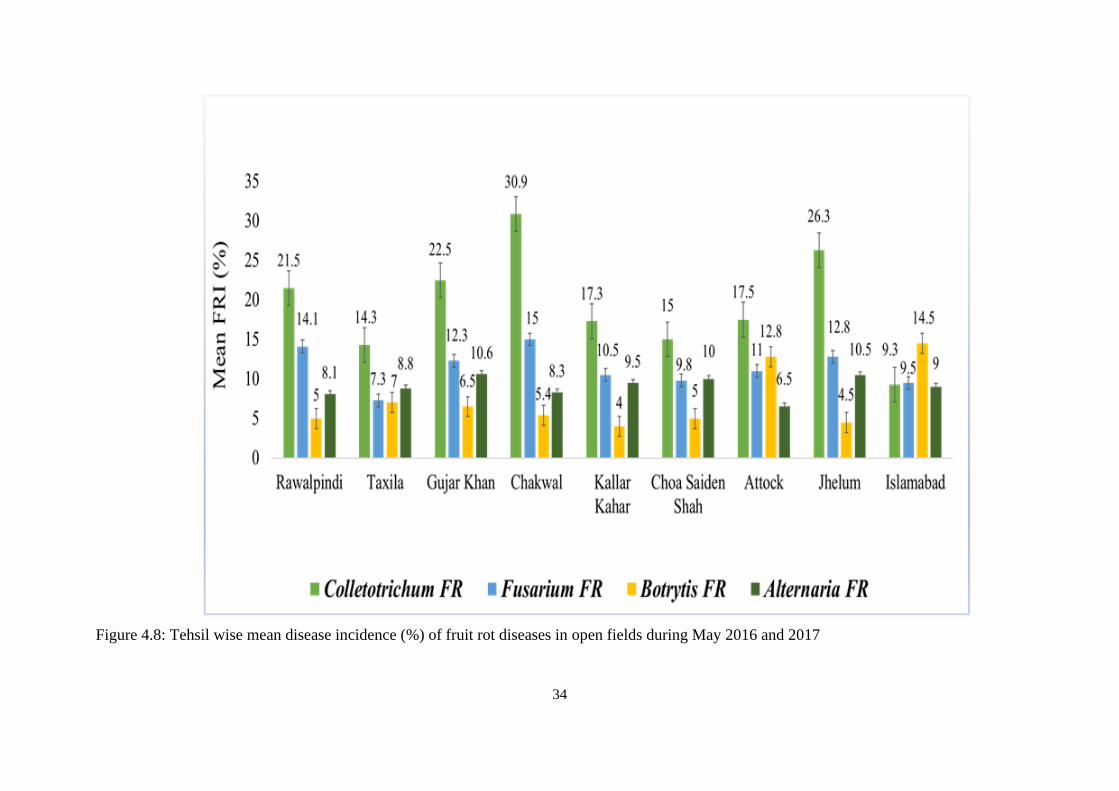
34
Figure 4.8: Tehsil wise mean disease incidence (%) of fruit rot diseases in open fields during May 2016 and 2017
35
Fusarium fruit rot was found prevalent in all visited greenhouses (February) and
open fields (May) during both years (2016 and 2017) (Table 4.1, 4.2). Since,
Fusarium fruit rot might be an internal seed borne disease and availability of disease-
free seeds to the farmers was limited. It seems, if the seeds were treated with an
appropriate systemic fungicide, there would have been no disease. Moreover, the
temperature (25-30°C) favoring the plant growth at fruiting stage is also conducive
for the pathogen growth and sporulation (Frans, Aerts, Van Laethem, & Ceusters,
2017). Temperature plays an important role in pathogen growth, disease
susceptibility of the host and Fusarium fruit rot incidence (Rossi et al., 2009). In
controlled experiment, the maximum growth and sporulation for FLASC (Fusarium
lactis species complex) and F. oxysporum was observed at 25°C (Scott, Gordon,
Shaw, & Koike, 2010; Webb, Brenner, & Jacobsen, 2015) but F.
proliferatum exhibited a maximum sporulation at 30°C (Marin et al., 1999;
Samapundo, Devliehgere, De Meulenaer, & Debevere, 2005).
Mean incidence of Botrytis fruit rot disease in green house (15.13%) was
comparatively high than in open fields, which was 6.73% (Table 4.1, 4.2), that might
be due to availability of conducive environmental conditions including favorable
temperature, higher relative humidity and dense plant canopy in controlled structures.
Whereas, in open fields higher relative humidity and dense plant canopy is less
frequently available. It was observed that the disease incidence was high at relative
humidity from 70-97% and temperature ranged from 17-28°C (Haware, Faris, &
Gowda, 1992). Disease intensity increases with the increase in period of leaf
wetness beyond 12 h/day (Singh & Kapoor, 1985). Botrytis fungus can grow and
survive at wide temperature range but 25°C is the optimum temperature for fungal
growth, infection and sporulation (Mahmood & Sinha, 1990). Dense canopy and
relative humidity of ≥95% for few hours during the day were most favorable for
fungal infection and rapid disease spread (Tripathi & Rathi, 1992). Under cool and
wet conditions, gray-tan powdery spore masses of gray mold frequently appear on
dead plant tissues (Akbudak, Tezcan, Akbudak, & Seniz, 2006).
Alternaria fruit rot was prevalent in all visited tehsils. During survey,
it was noted that fields repeatedly cultivated have more disease incidence than fields
36
newly brought under cultivation. During an in vitro study, the maximum mycelial
growth of Alternaria tenuissima was at 25°C, while the minimum was observed at
10°C (Azad, Singh, & Kumar, 2016). The conidia of A. alternata germinate rapidly in
the presence of moisture and begin to produce toxin even before penetration to the
tissue (Dehpour, Alavi, & Majd, 2007). The minimum wetting period required for the
infection establishment of various Alternaria species in host tissue ranges from 3 to
72 h (Bautista-Baños, 2014).
The mean incidence (20.73%) of anthracnose in open fields has been found the
highest as compared to other fruit rot diseases (Table 4.2). Chakwal had
comparatively more recorded mean incidence (30.9%) as compared to other tehsils
(Figure 4.8). Colletotrichum fruit rot/anthracnose was not observed in visited
greenhouses. The disease only developed followed by a period of wetness or rain and
usually presence of free water on the surface of a plant canopy was not available
under greenhouse conditions. The infection occurs during high humidity (a mean of
80%) and temperatures around 27°C aggravate the rate of infection of anthracnose
disease (Roberts, 2001). The marketable yield loss of 100% has been reported under
favorable circumstances of rainy, humid and warm seasons. However, the duration of
surface wetness >96 h, seems to have the direct effect on the germination, growth and
infection of the pathogen (Than et al., 2008). Moreover, cropping pattern, sanitation
practices and presence of alternate or weed host in crop vicinity effect the incidence
of disease. Colletotrichum truncatum has a wide host range including pepper,
muskmelon, eggplant, grapes, chickpea and various other plant species (Damm,
Woudenberg, Cannon, & Crous, 2009). Use of disease-free planting material, removal
of weeds, infected debris, proper field drainage are important cultural means of
reducing pathogen inoculum and disease losses. Crop rotation for a minimum of 2
years is also advised for susceptible solanaceous crop (Roberts, 2001).
4.2 PREVALENCE AND INCIDENCE OF ROOT ROT DISEASES
For root rot diseases prevalence and incidence was monitored twice; first at
seedling stage and second at fruiting stage/maturity. 30-40 days old seedlings were
inspected and sampled during the month of November 2015 and 2016 in green house
and during February 2016 and 2017 in low plastic tunnels. Root rot diseases were also
documented at fruiting stage during the month of May in 2016 and 2017.
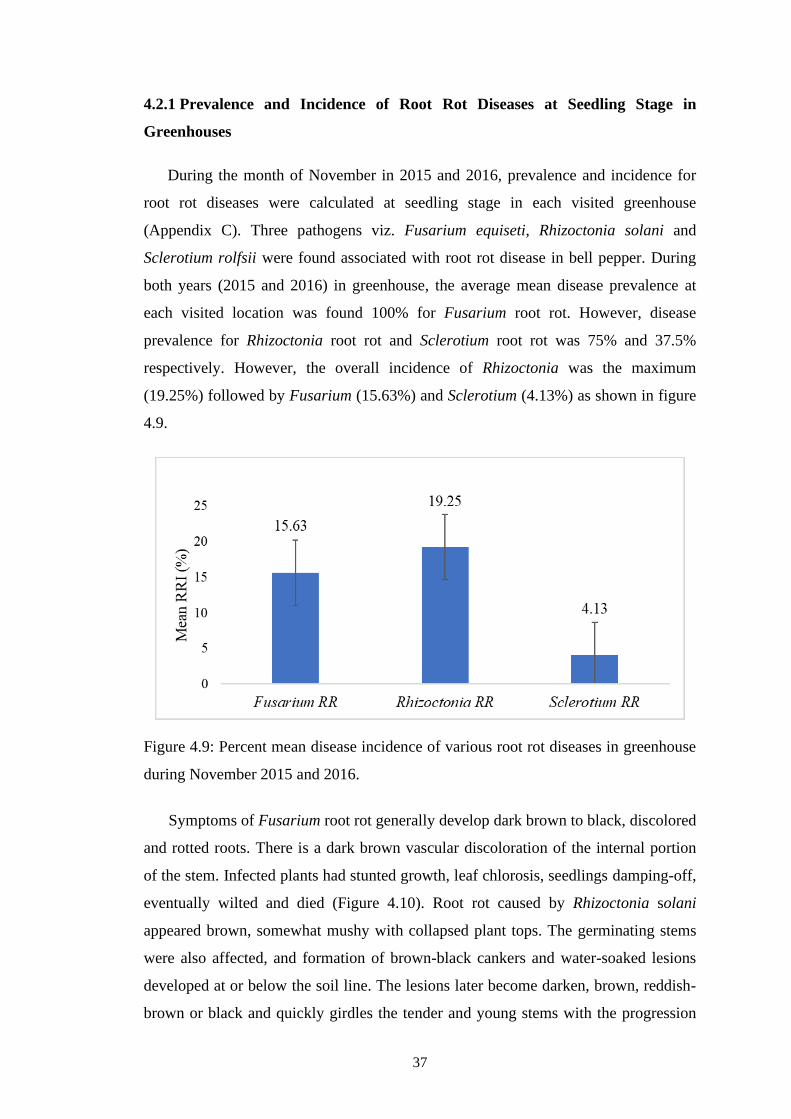
37
4.2.1 Prevalence and Incidence of Root Rot Diseases at Seedling Stage in
Greenhouses
During the month of November in 2015 and 2016, prevalence and incidence for
root rot diseases were calculated at seedling stage in each visited greenhouse
(Appendix C). Three pathogens viz. Fusarium equiseti, Rhizoctonia solani and
Sclerotium rolfsii were found associated with root rot disease in bell pepper. During
both years (2015 and 2016) in greenhouse, the average mean disease prevalence at
each visited location was found 100% for Fusarium root rot. However, disease
prevalence for Rhizoctonia root rot and Sclerotium root rot was 75% and 37.5%
respectively. However, the overall incidence of Rhizoctonia was the maximum
(19.25%) followed by Fusarium (15.63%) and Sclerotium (4.13%) as shown in figure
4.9.
Figure 4.9: Percent mean disease incidence of various root rot diseases in greenhouse
during November 2015 and 2016.
Symptoms of Fusarium root rot generally develop dark brown to black, discolored
and rotted roots. There is a dark brown vascular discoloration of the internal portion
of the stem. Infected plants had stunted growth, leaf chlorosis, seedlings damping-off,
eventually wilted and died (Figure 4.10). Root rot caused by Rhizoctonia solani
appeared brown, somewhat mushy with collapsed plant tops. The germinating stems
were also affected, and formation of brown-black cankers and water-soaked lesions
developed at or below the soil line. The lesions later become darken, brown, reddish-
brown or black and quickly girdles the tender and young stems with the progression
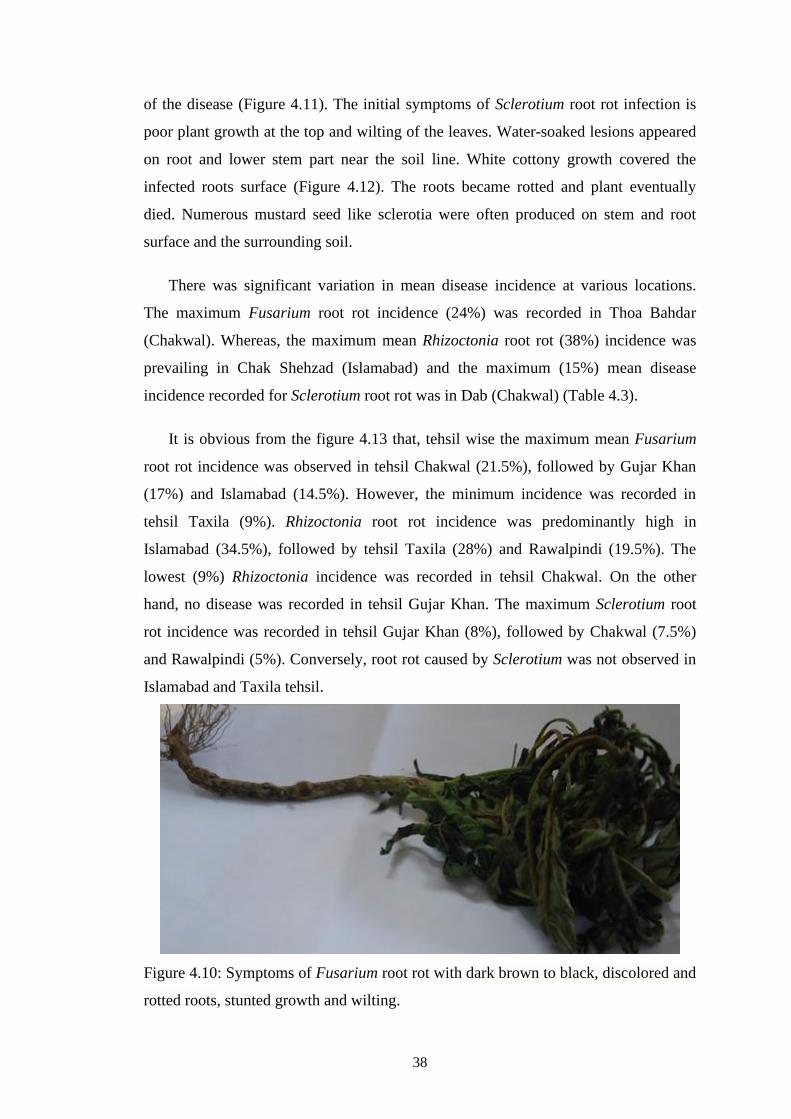
38
of the disease (Figure 4.11). The initial symptoms of Sclerotium root rot infection is
poor plant growth at the top and wilting of the leaves. Water-soaked lesions appeared
on root and lower stem part near the soil line. White cottony growth covered the
infected roots surface (Figure 4.12). The roots became rotted and plant eventually
died. Numerous mustard seed like sclerotia were often produced on stem and root
surface and the surrounding soil.
There was significant variation in mean disease incidence at various locations.
The maximum Fusarium root rot incidence (24%) was recorded in Thoa Bahdar
(Chakwal). Whereas, the maximum mean Rhizoctonia root rot (38%) incidence was
prevailing in Chak Shehzad (Islamabad) and the maximum (15%) mean disease
incidence recorded for Sclerotium root rot was in Dab (Chakwal) (Table 4.3).
It is obvious from the figure 4.13 that, tehsil wise the maximum mean Fusarium
root rot incidence was observed in tehsil Chakwal (21.5%), followed by Gujar Khan
(17%) and Islamabad (14.5%). However, the minimum incidence was recorded in
tehsil Taxila (9%). Rhizoctonia root rot incidence was predominantly high in
Islamabad (34.5%), followed by tehsil Taxila (28%) and Rawalpindi (19.5%). The
lowest (9%) Rhizoctonia incidence was recorded in tehsil Chakwal. On the other
hand, no disease was recorded in tehsil Gujar Khan. The maximum Sclerotium root
rot incidence was recorded in tehsil Gujar Khan (8%), followed by Chakwal (7.5%)
and Rawalpindi (5%). Conversely, root rot caused by Sclerotium was not observed in
Islamabad and Taxila tehsil.
Figure 4.10: Symptoms of Fusarium root rot with dark brown to black, discolored and
rotted roots, stunted growth and wilting.
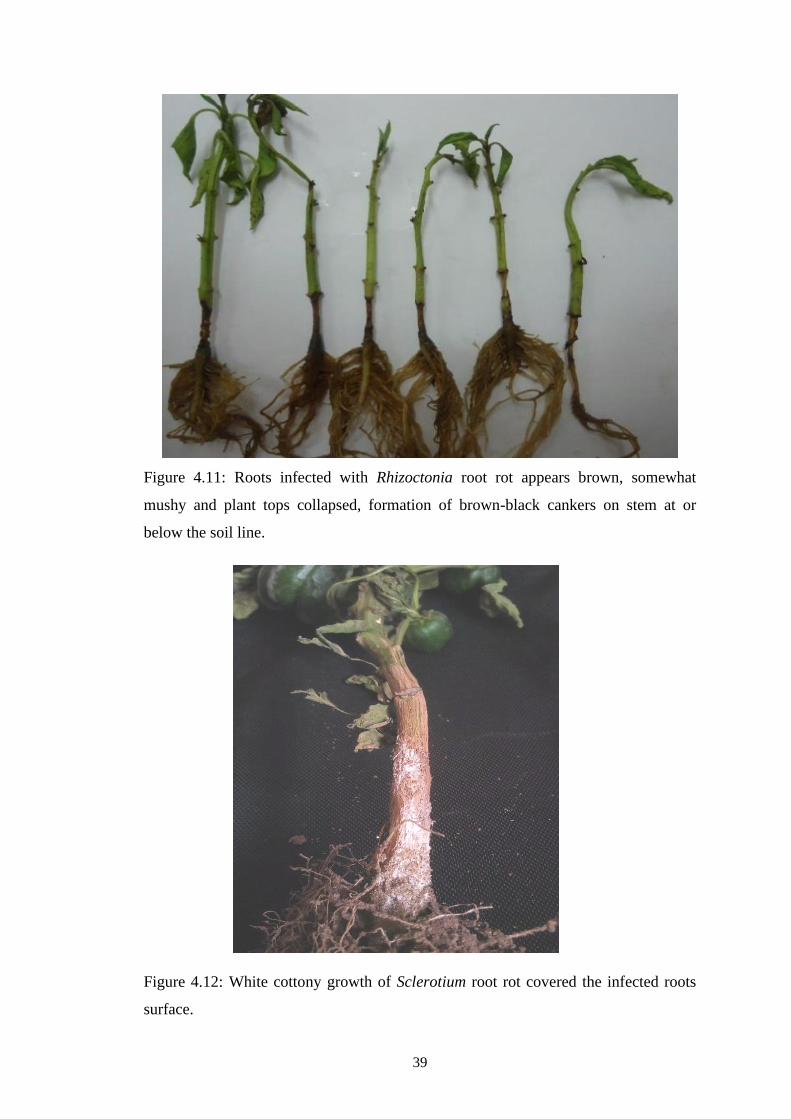
39
Figure 4.11: Roots infected with Rhizoctonia root rot appears brown, somewhat
mushy and plant tops collapsed, formation of brown-black cankers on stem at or
below the soil line.
Figure 4.12: White cottony growth of Sclerotium root rot covered the infected roots
surface.
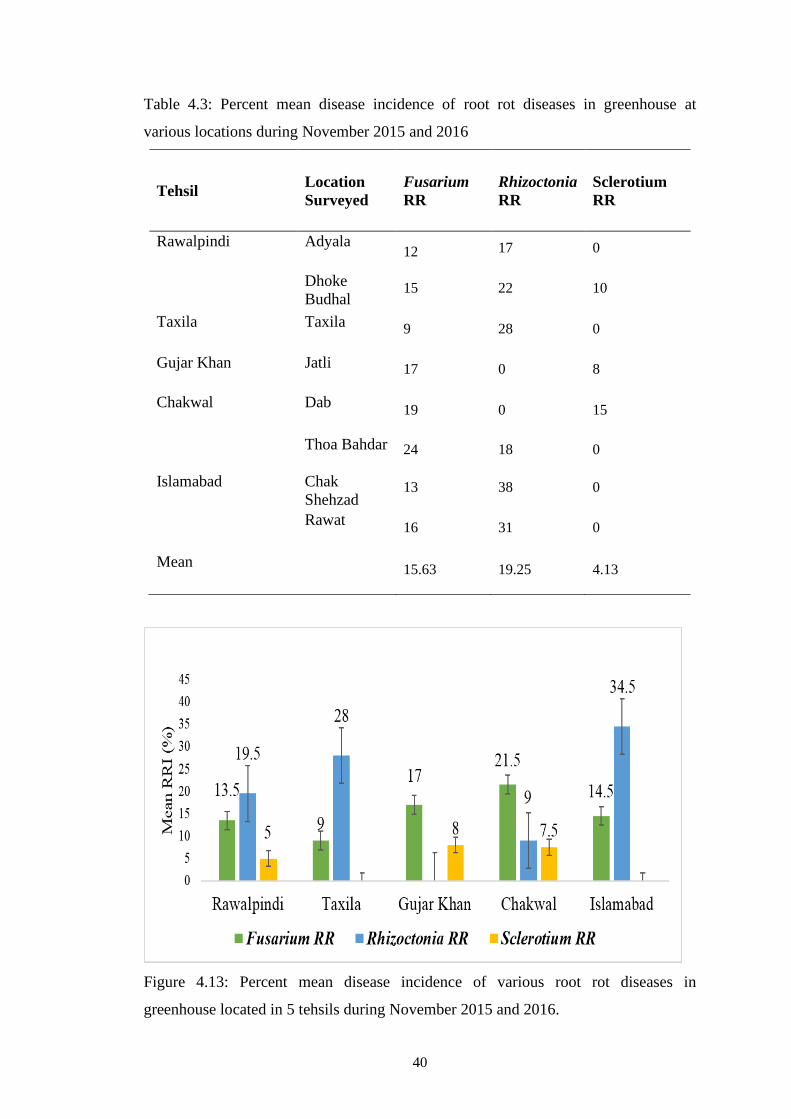
40
Table 4.3: Percent mean disease incidence of root rot diseases in greenhouse at
various locations during November 2015 and 2016
Tehsil Location
Surveyed
Fusarium
RR
Rhizoctonia
RR
Sclerotium
RR
Rawalpindi Adyala 12 17 0
Dhoke
Budhal 15 22 10
Taxila Taxila 9 28 0
Gujar Khan Jatli 17 0 8
Chakwal Dab 19 0 15
Thoa Bahdar 24 18 0
Islamabad Chak
Shehzad 13 38 0
Rawat 16 31 0
Mean 15.63 19.25 4.13
Figure 4.13: Percent mean disease incidence of various root rot diseases in
greenhouse located in 5 tehsils during November 2015 and 2016.
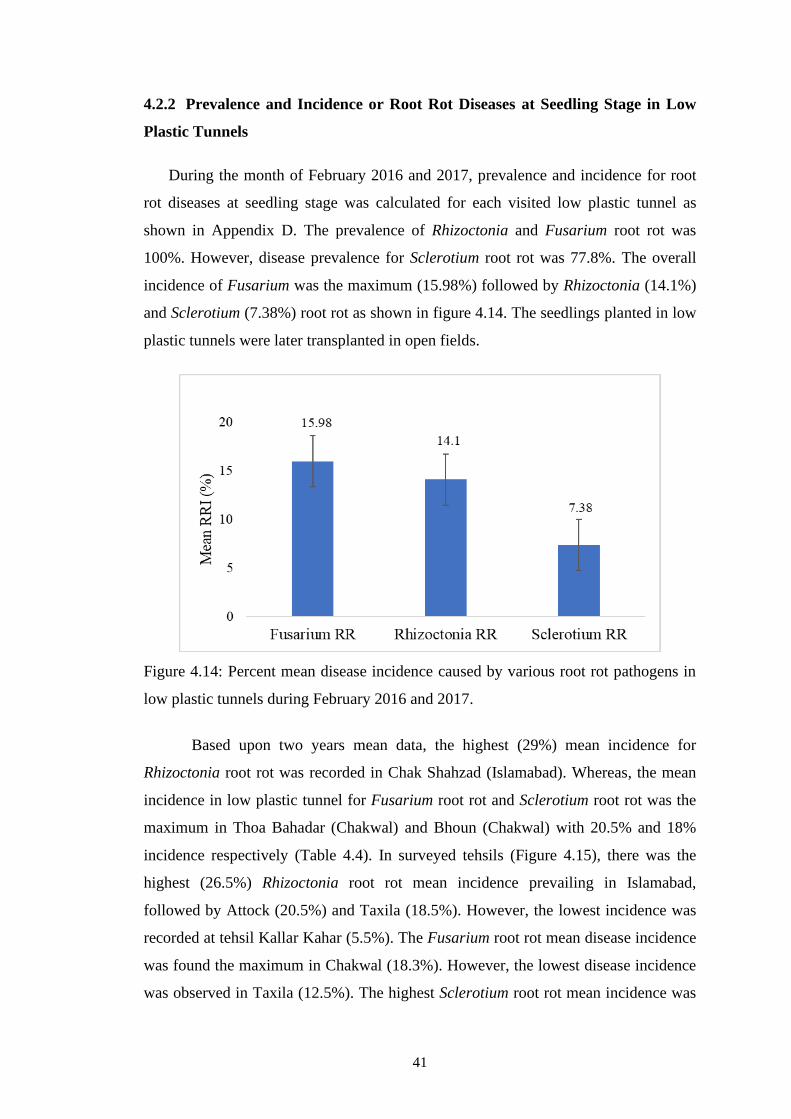
41
4.2.2 Prevalence and Incidence or Root Rot Diseases at Seedling Stage in Low
Plastic Tunnels
During the month of February 2016 and 2017, prevalence and incidence for root
rot diseases at seedling stage was calculated for each visited low plastic tunnel as
shown in Appendix D. The prevalence of Rhizoctonia and Fusarium root rot was
100%. However, disease prevalence for Sclerotium root rot was 77.8%. The overall
incidence of Fusarium was the maximum (15.98%) followed by Rhizoctonia (14.1%)
and Sclerotium (7.38%) root rot as shown in figure 4.14. The seedlings planted in low
plastic tunnels were later transplanted in open fields.
Figure 4.14: Percent mean disease incidence caused by various root rot pathogens in
low plastic tunnels during February 2016 and 2017.
Based upon two years mean data, the highest (29%) mean incidence for
Rhizoctonia root rot was recorded in Chak Shahzad (Islamabad). Whereas, the mean
incidence in low plastic tunnel for Fusarium root rot and Sclerotium root rot was the
maximum in Thoa Bahadar (Chakwal) and Bhoun (Chakwal) with 20.5% and 18%
incidence respectively (Table 4.4). In surveyed tehsils (Figure 4.15), there was the
highest (26.5%) Rhizoctonia root rot mean incidence prevailing in Islamabad,
followed by Attock (20.5%) and Taxila (18.5%). However, the lowest incidence was
recorded at tehsil Kallar Kahar (5.5%). The Fusarium root rot mean disease incidence
was found the maximum in Chakwal (18.3%). However, the lowest disease incidence
was observed in Taxila (12.5%). The highest Sclerotium root rot mean incidence was
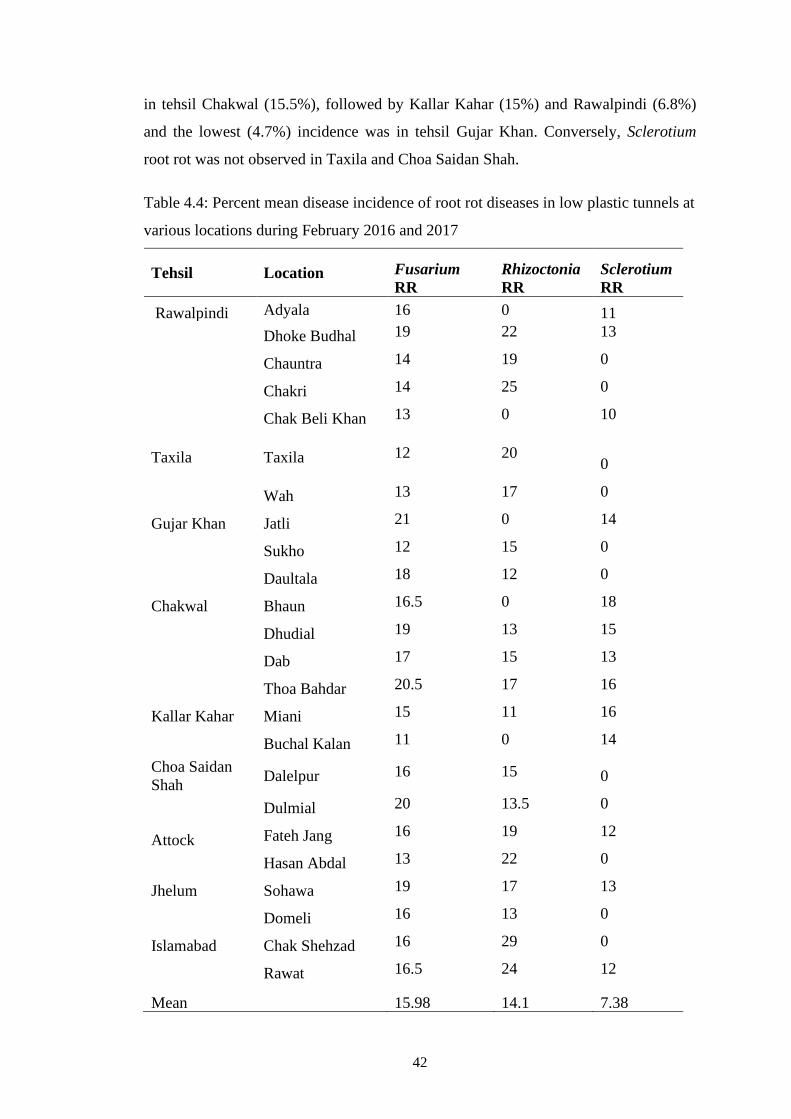
42
in tehsil Chakwal (15.5%), followed by Kallar Kahar (15%) and Rawalpindi (6.8%)
and the lowest (4.7%) incidence was in tehsil Gujar Khan. Conversely, Sclerotium
root rot was not observed in Taxila and Choa Saidan Shah.
Table 4.4: Percent mean disease incidence of root rot diseases in low plastic tunnels at
various locations during February 2016 and 2017
Tehsil Location Fusarium
RR
Rhizoctonia
RR
Sclerotium
RR
Rawalpindi Adyala 16 0 11 Dhoke Budhal 19 22 13
Chauntra 14 19 0
Chakri 14 25 0
Chak Beli Khan 13 0 10
Taxila Taxila 12 20 0
Wah 13 17 0
Gujar Khan Jatli 21 0 14
Sukho 12 15 0
Daultala 18 12 0
Chakwal Bhaun 16.5 0 18
Dhudial 19 13 15
Dab 17 15 13
Thoa Bahdar 20.5 17 16
Kallar Kahar Miani 15 11 16
Buchal Kalan 11 0 14
Choa Saidan
Shah Dalelpur 16 15 0
Dulmial 20 13.5 0
Attock Fateh Jang 16 19 12
Hasan Abdal 13 22 0
Jhelum Sohawa 19 17 13
Domeli 16 13 0
Islamabad Chak Shehzad 16 29 0
Rawat 16.5 24 12
Mean 15.98 14.1 7.38
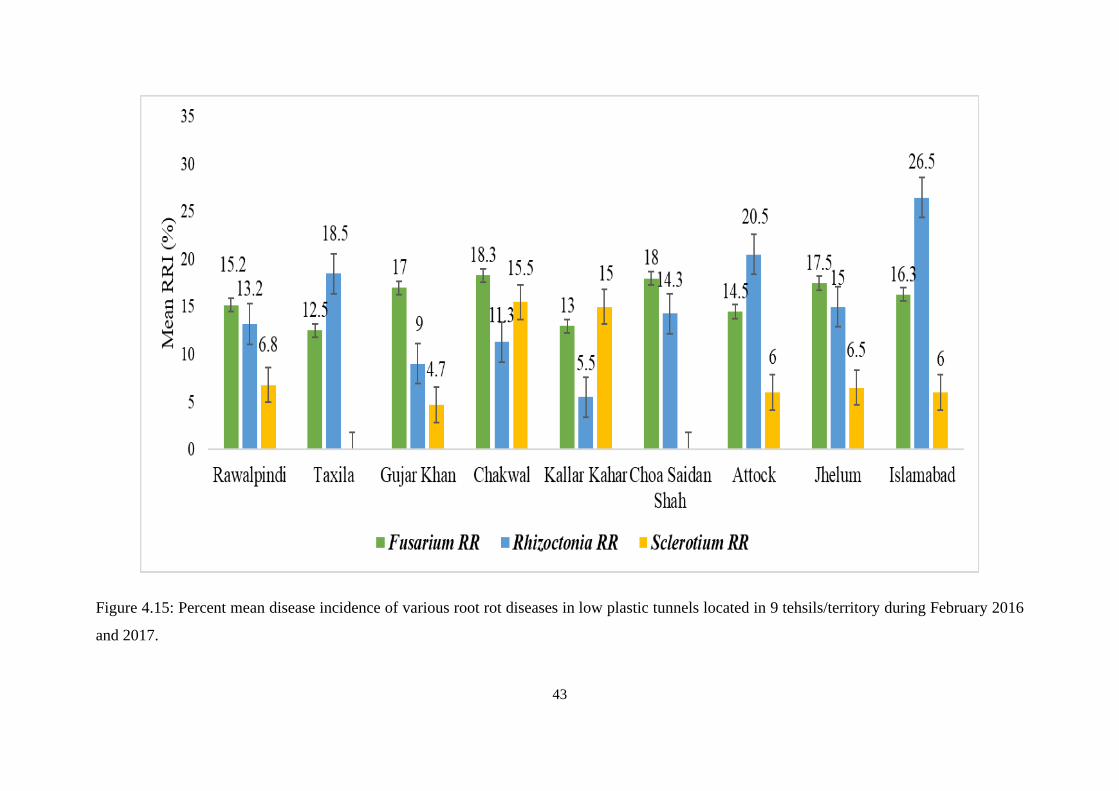
43
Figure 4.15: Percent mean disease incidence of various root rot diseases in low plastic tunnels located in 9 tehsils/territory during February 2016
and 2017.
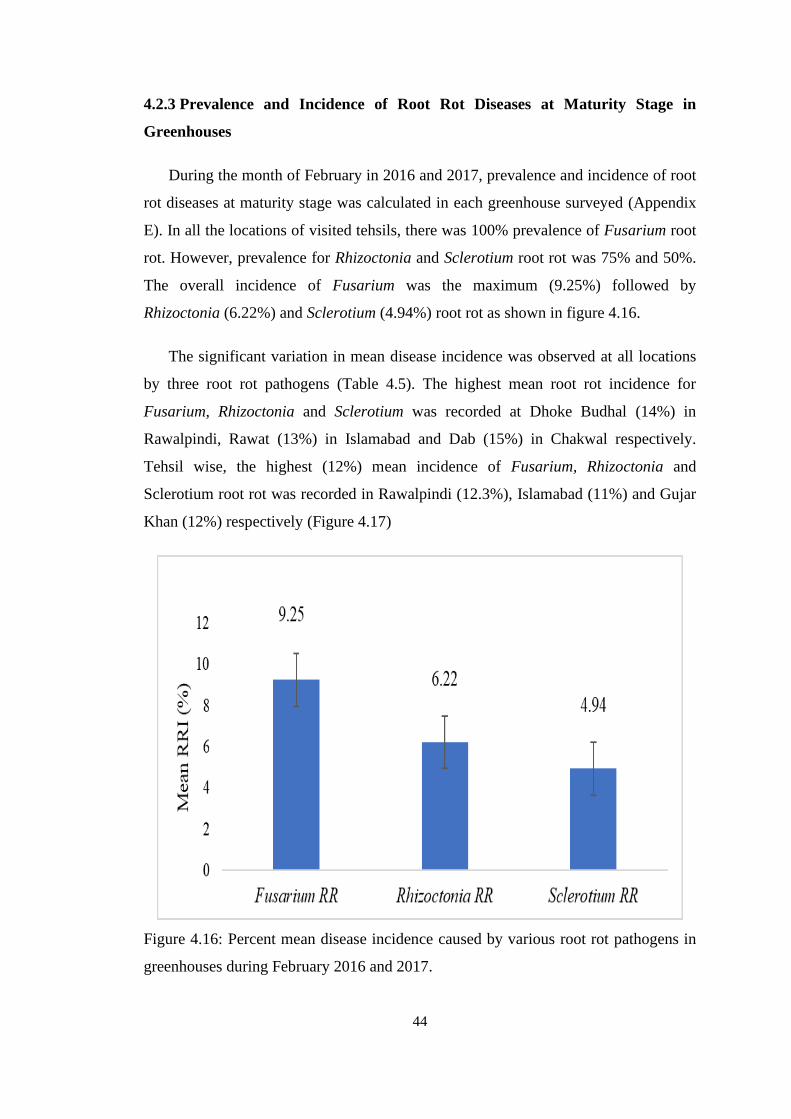
44
4.2.3 Prevalence and Incidence of Root Rot Diseases at Maturity Stage in
Greenhouses
During the month of February in 2016 and 2017, prevalence and incidence of root
rot diseases at maturity stage was calculated in each greenhouse surveyed (Appendix
E). In all the locations of visited tehsils, there was 100% prevalence of Fusarium root
rot. However, prevalence for Rhizoctonia and Sclerotium root rot was 75% and 50%.
The overall incidence of Fusarium was the maximum (9.25%) followed by
Rhizoctonia (6.22%) and Sclerotium (4.94%) root rot as shown in figure 4.16.
The significant variation in mean disease incidence was observed at all locations
by three root rot pathogens (Table 4.5). The highest mean root rot incidence for
Fusarium, Rhizoctonia and Sclerotium was recorded at Dhoke Budhal (14%) in
Rawalpindi, Rawat (13%) in Islamabad and Dab (15%) in Chakwal respectively.
Tehsil wise, the highest (12%) mean incidence of Fusarium, Rhizoctonia and
Sclerotium root rot was recorded in Rawalpindi (12.3%), Islamabad (11%) and Gujar
Khan (12%) respectively (Figure 4.17)
Figure 4.16: Percent mean disease incidence caused by various root rot pathogens in
greenhouses during February 2016 and 2017.
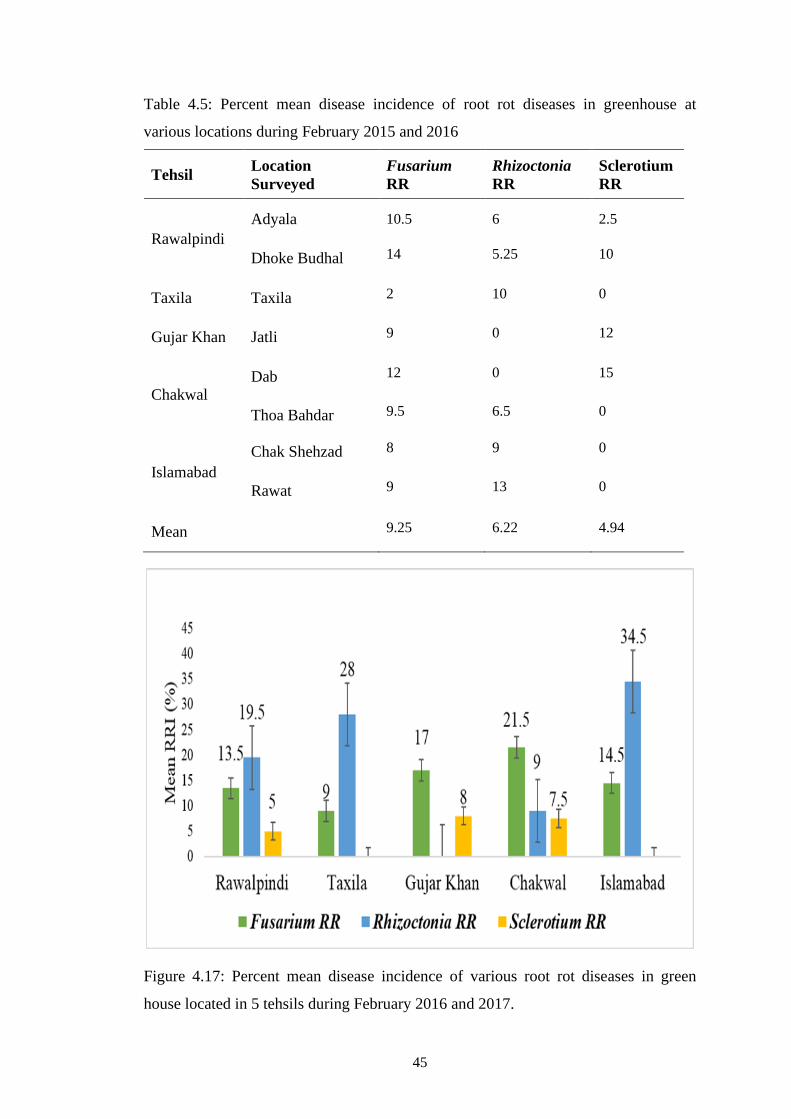
45
Table 4.5: Percent mean disease incidence of root rot diseases in greenhouse at
various locations during February 2015 and 2016
Tehsil Location
Surveyed
Fusarium
RR
Rhizoctonia
RR
Sclerotium
RR
Rawalpindi
Adyala 10.5 6 2.5
Dhoke Budhal 14 5.25 10
Taxila Taxila 2 10 0
Gujar Khan Jatli 9 0 12
Chakwal Dab 12 0 15
Thoa Bahdar 9.5 6.5 0
Islamabad
Chak Shehzad 8 9 0
Rawat 9 13 0
Mean 9.25 6.22 4.94
Figure 4.17: Percent mean disease incidence of various root rot diseases in green
house located in 5 tehsils during February 2016 and 2017.
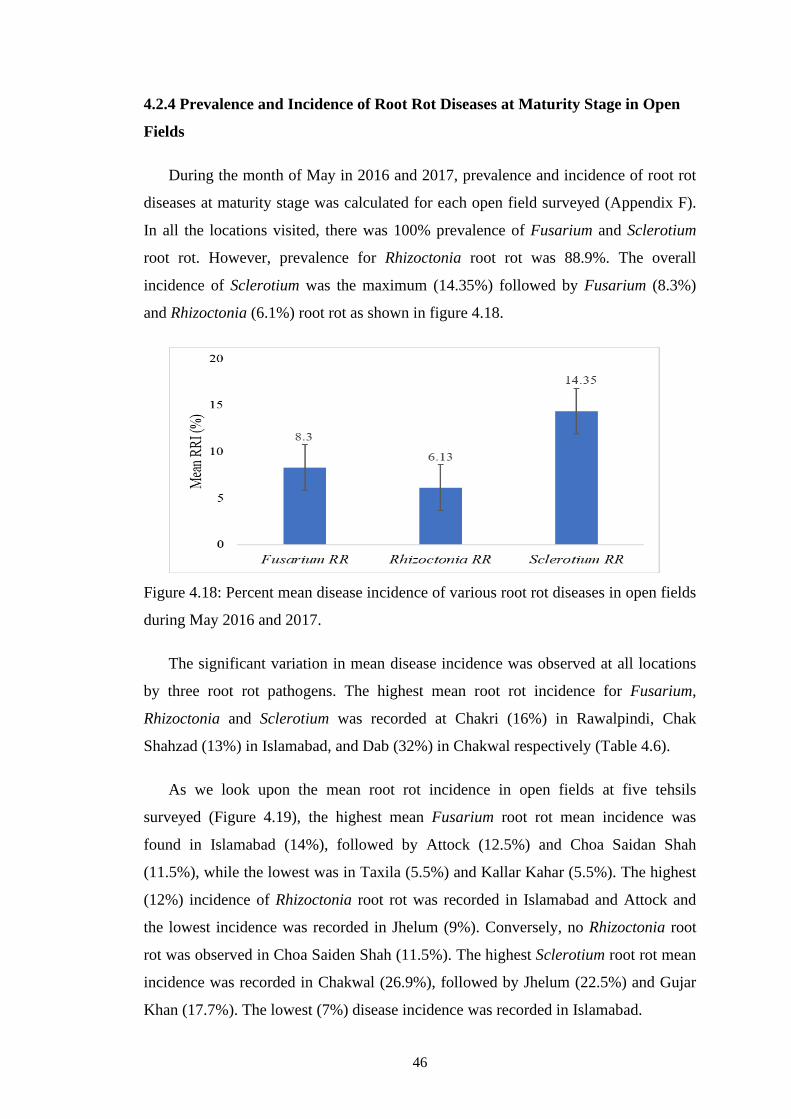
46
4.2.4 Prevalence and Incidence of Root Rot Diseases at Maturity Stage in Open
Fields
During the month of May in 2016 and 2017, prevalence and incidence of root rot
diseases at maturity stage was calculated for each open field surveyed (Appendix F).
In all the locations visited, there was 100% prevalence of Fusarium and Sclerotium
root rot. However, prevalence for Rhizoctonia root rot was 88.9%. The overall
incidence of Sclerotium was the maximum (14.35%) followed by Fusarium (8.3%)
and Rhizoctonia (6.1%) root rot as shown in figure 4.18.
Figure 4.18: Percent mean disease incidence of various root rot diseases in open fields
during May 2016 and 2017.
The significant variation in mean disease incidence was observed at all locations
by three root rot pathogens. The highest mean root rot incidence for Fusarium,
Rhizoctonia and Sclerotium was recorded at Chakri (16%) in Rawalpindi, Chak
Shahzad (13%) in Islamabad, and Dab (32%) in Chakwal respectively (Table 4.6).
As we look upon the mean root rot incidence in open fields at five tehsils
surveyed (Figure 4.19), the highest mean Fusarium root rot mean incidence was
found in Islamabad (14%), followed by Attock (12.5%) and Choa Saidan Shah
(11.5%), while the lowest was in Taxila (5.5%) and Kallar Kahar (5.5%). The highest
(12%) incidence of Rhizoctonia root rot was recorded in Islamabad and Attock and
the lowest incidence was recorded in Jhelum (9%). Conversely, no Rhizoctonia root
rot was observed in Choa Saiden Shah (11.5%). The highest Sclerotium root rot mean
incidence was recorded in Chakwal (26.9%), followed by Jhelum (22.5%) and Gujar
Khan (17.7%). The lowest (7%) disease incidence was recorded in Islamabad.
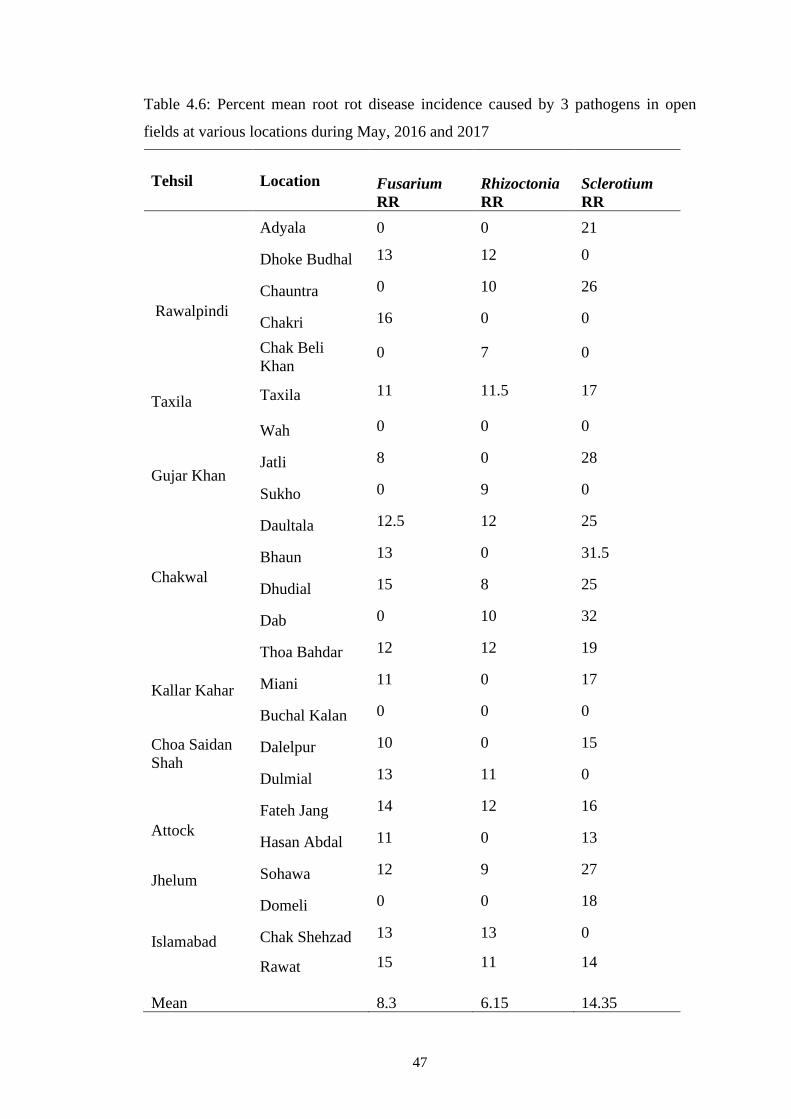
47
Table 4.6: Percent mean root rot disease incidence caused by 3 pathogens in open
fields at various locations during May, 2016 and 2017
Tehsil Location Fusarium
RR
Rhizoctonia
RR
Sclerotium
RR
Rawalpindi
Adyala 0 0 21
Dhoke Budhal 13 12 0
Chauntra 0 10 26
Chakri 16 0 0
Chak Beli
Khan 0 7 0
Taxila
Taxila 11 11.5 17
Wah 0 0 0
Gujar Khan
Jatli 8 0 28
Sukho 0 9 0
Daultala 12.5 12 25
Chakwal
Bhaun 13 0 31.5
Dhudial 15 8 25
Dab 0 10 32
Thoa Bahdar 12 12 19
Kallar Kahar
Miani 11 0 17
Buchal Kalan 0 0 0
Choa Saidan
Shah
Dalelpur 10 0 15
Dulmial 13 11 0
Attock
Fateh Jang 14 12 16
Hasan Abdal 11 0 13
Jhelum
Sohawa 12 9 27
Domeli 0 0 18
Islamabad
Chak Shehzad 13 13 0
Rawat 15 11 14
Mean 8.3 6.15 14.35
48
The high incidence of Rhizoctonia and Fusarium root rot (Table 4.3, Table 4.4) at
seedling stage in greenhouses and low plastic tunnels as compared to surveyed
greenhouse and open fields at maturity (Table 4.5 and 4.6), might be attributed to
repeated cultivation in the same greenhouse/low plastic tunnel or use of same potting
mixture or plots since many years. This lead to accumulation of pathogen inoculum
level in the soil that increase the disease incidence in the next cropping season.
The amount of inoculum in the soil is one of the major factor contributing in high
disease incidence (Buddemeyer, Pfähler, Petersen, & Märländer, 2004). Further,
greenhouses/low plastic tunnels are closed structure to conserve heat. For most of the
day and night, humidity level remains about 90% or greater. Restricted air circulation
results in higher level of atmospheric humidity inside protected greenhouses than
conventional ones. These conditions are ideal for the initiation and proliferation of
disease (Jarvis, 1992). The plastic houses changes the microclimate of crops in
protected cultivation (Coakley, Scherm, & Chakraborty, 1999). These conditions are
also favourable for various diseases including root rot, damping-off, and wilt
(Daughtrey & Horst, 1990; Simone & Momol, 2000).
The higher incidence of Rhizoctonia root rot (Table 4.3 and 4.4) in Islamabad
might be due to the fact that it was comparatively cooler than other visited tehsils. The
climatic conditions prevalent in Islamabad also favored the activation of inoculum
present in the soil and pathogenicity development. The pathogen R. solani is generally
active in cool and moist soils and can survive as sclerotia in unfavorable conditions
for many years (Vásquez, Tlapal, Yáñez, Pérez, & Quintos, 2009). Moreover, the
amount and activation of prevailing R. solani inoculum in the soil is triggered by
excessive soil moisture in protected cultivation (Frank, 1978) which favours the
disease development. This high incidence of Rhizoctonia root rot at seedling stage can
effectively be eliminated by using sterilized potting mixtures in germination trays or
using a virgin land for sowing bell pepper nursery stock.
The highest incidence of Fusarium root rot at seedling stage in green houses and
low plastic tunnels in all visited tehsils (Table 4.3 and Table 4.4) may be attributed to
the prevailing temperature at the time of survey i.e. 20–25°C during the month of
October and 12-22°C during the month of February.
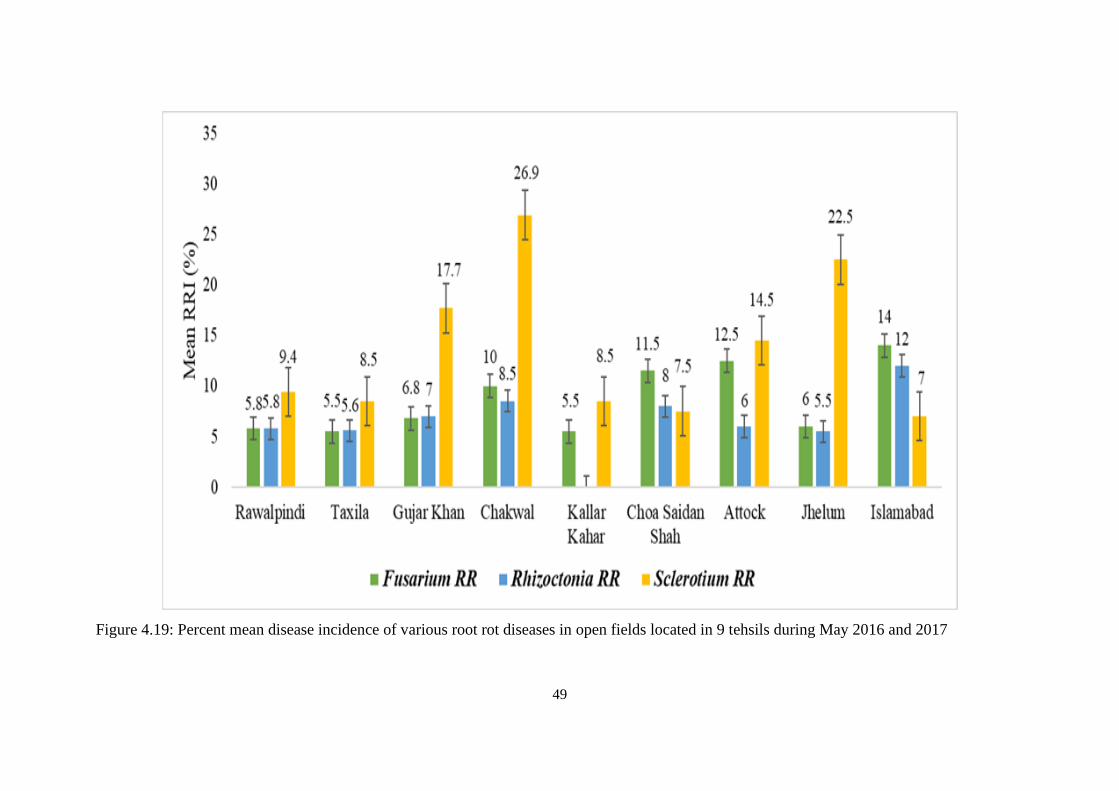
49
Figure 4.19: Percent mean disease incidence of various root rot diseases in open fields located in 9 tehsils during May 2016 and 2017
50
The temperature plays a significant role in incidence, growth and virulence of
Fusarium (Rossi, Scandolara, & Battilani, 2009). Furthermore, in a study it was
shown that the growth of Fusarium sp. was the optimum at 20-25°C, declined
sharply at 35°C and growth completely inhibited at 40°C (Gracia-Garza &
Fravel, 1998; Rekah, Shtienberg, & Katan, 2000).
The highest Fusarium root rot disease incidence in Chakwal in both greenhouse
(15.63%) and low plastic tunnels (15.98) (Table 4.3, 4.4) may be due to high
pathogen’s inoculum level accumulated by repeated cultivation of bell pepper in the
same field. During the survey, it was shared by the farmer that bell pepper is the main
nursery crop which was grown to distribute to the adjacent areas since many years.
The minimum prevalence and incidence of Sclerotium root rot at seedling stage
(Table 4.3, 4.4) as compared with other diseases in green house (2.3%) and low
plastic tunnels (7.28%), may be due to the fact that at the time of survey the
environmental conditions were not favorable for the pathogen development. The
highest mean incidence (14.35%) of Sclerotium root rot in open field (Table 4.6)
during the month of May be attributed to the favorable temperature and humidity for
disease development. The temperature above 29˚C and high humidity are the
conducive environmental conditions for the sclerotium root rot disease development
(Kator, Hosea, & Oche, 2015). Ideal temperature for mycelial growth ranges between
25 to 35oC, and the optimal temperature for sclerotia formation ranges from 27°C to
35°C (Punja, 1985). Mycelial growth is little or none at 10 or 40oC, but sclerotia can
survive at temperature as low as -10oC. Sclerotia germinate well at 25-35% relative
humidity (Edmunds, Gleason, & Wegulo, 2003).
Sclerotium root rot was not observed in Taxila and Choa Saidan Shah (Table 4.3,
4.4), as per observation it might be attributed to cultivation of crop in new fields and
limited or unavailability of plant flora for the growth and proliferation of the
pathogen. During the survey, it was shared by the farmer that, the nursery was planted
for the first time in the planted area. Wheat has been the main crop in visited locations
since decades, however, the introduction of solar tube well scheme and the irrigation
water availability paved the way for cultivation of vegetables crops with higher per
unit area economic returns compared to wheat.
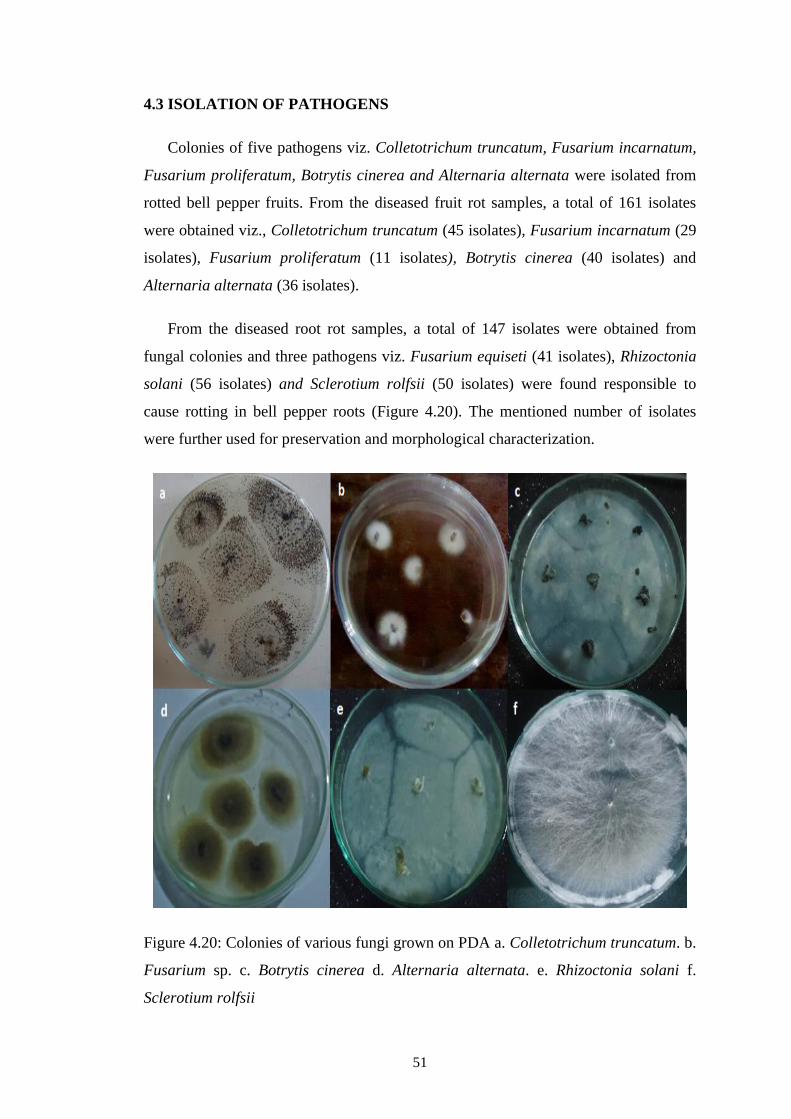
51
4.3 ISOLATION OF PATHOGENS
Colonies of five pathogens viz. Colletotrichum truncatum, Fusarium incarnatum,
Fusarium proliferatum, Botrytis cinerea and Alternaria alternata were isolated from
rotted bell pepper fruits. From the diseased fruit rot samples, a total of 161 isolates
were obtained viz., Colletotrichum truncatum (45 isolates), Fusarium incarnatum (29
isolates), Fusarium proliferatum (11 isolates), Botrytis cinerea (40 isolates) and
Alternaria alternata (36 isolates).
From the diseased root rot samples, a total of 147 isolates were obtained from
fungal colonies and three pathogens viz. Fusarium equiseti (41 isolates), Rhizoctonia
solani (56 isolates) and Sclerotium rolfsii (50 isolates) were found responsible to
cause rotting in bell pepper roots (Figure 4.20). The mentioned number of isolates
were further used for preservation and morphological characterization.
Figure 4.20: Colonies of various fungi grown on PDA a. Colletotrichum truncatum. b.
Fusarium sp. c. Botrytis cinerea d. Alternaria alternata. e. Rhizoctonia solani f.
Sclerotium rolfsii
52
4.4 PRESERVATION
Viability test was performed after 10 days of incubation and before storage of
isolates in refrigerator. Ten isolates of each pathogen were randomly selected from
the preserved isolates. The viability test provided 100% results. The colonies on PDA
media plates were morphologically similar to the original isolates. Silica gel technique
is extremely simple, rapid and inexpensive, can also be used for micro-organisms
other than fungi (Grivell & Jackson, 1969). Preservation using silica gel method
yielded positive survival rate of fungi (Windels, Burnes, & Kommedahl, 1988). Fungi
can be stored successfully up to 11 years on silica gel (Smith & Onions, 1983). Out of
five preservation methods, fungal isolates preserved on silica gel showed the highest
viability after 2 years of storage (Tariq, Naz, Rauf, & Irshad, 2015).
4.5 MORPHOLOGICAL CHARACTERIZATION
4.5.1 Morphological Characterization of Colletotrichum truncatum
Forty-five isolates of Colletotrichum truncatum were selected for morphological
characterization. The isolates were segregated into five groups depending upon their
colony characteristics. Out of 45 isolates; 7 (15.56%), 12 (26.67%), 9 (20%), 7
(15.56%) and 10 (22.22%) were belonged to group 1, group 2, group 3, group 4 and
group 5 respectively. Colletotrichum species are highly variable based on subtle
differences in colony morphology, pigmentation, conidial dimension, appressoria,
presence and shape of setae, pathogenicity, fungicide sensitivity, and various other
traits (Bailey, O'connell, Pring, & Nash, 1992).
4.5.1.1 Colony diameter
The mean colony diameter after 7 days of incubation time at 25±2°C was
shown in Table 4.7. The isolates belonging to the group-2 exhibited the fastest growth
(8.1±0.6 cm). However, the minimum mean colony diameter (5.8±0.5 cm) was noted
in the isolates of group-3. The isolate ACT13 was found the fastest growing (8.4 cm)
in group 1 and ACT24 (7.4 cm) had the slowest mean growth. In group 2, the isolate
ACT21 and ACT37 had the fastest growth (9 cm) and ACT10 (7.5 cm) with the
minimum growth. Among the isolates of group 3, the maximum growth (6.7 cm) was
exhibited by ACT19. Whereas, the least growth (5.2 cm) was shown by ACT23
53
isolate. The isolate ACT6 (8.4 cm) was the fastest growing among the isolates of
group 4 and ACT33 (7.1 cm) was the slowest growing as compared to others. ACT22
(7.2 cm) was the fastest growing within the isolates of group 5. However, ACT4 (5.7
cm) was the slowest growing isolate among the same group.
4.5.1.2 Colony color and orientation
The colonies of isolates of C. truncatum showed variety of colors on PDA i.e. white
to ash gray, ash gray, pale gray, light to dark gray and dark gray to black. The group 1
isolates grown on PDA were ash gray or whitish to ash gray in color with abundant
aerial mycelia, few scattered conidia and dot like partially submerged acervuli. The
colonies were dark gray or ash gray from reverse (Figure 4.21). Group 2 isolates were
light to dark gray or dark gray to black in color with dark gray to black in reverse.
Colonies comprised of 4-5 concentric rings, compact at the center with scattered
acervuli and fluffy at peripheral with dense acervuli and large spore masses in the
center, (Figure 4.22). Group 3 isolates were light gray to black or dark gray to black
in color and dark gray to black in reverse. Colonies were radiating with abundant
acervuli scattered over the colony with few conidial masses near the inoculation point
(Figure 4.23). The isolates of group 4 were dark gray to black in color and black in
reverse. Colonies comprised of only 2-3 concentric rings, abundant thick acervuli
with few conidial masses (Figure 4.24). Group 5 isolates were pale gray or light to
dark gray with cream to dark gray or dark gray to black in reverse. The acervuli were
scattered with abundant light orange conidial masses (Figure 4.25).
Colletotrichum truncatum isolates from bell pepper were grouped by into three
morphological categories depending upon the morphological characteristics of
colonies and spores (Hema Ramdial & Rampersad, 2015). In another study, 88
isolates were recovered from chili pepper that were classified into six morphological
groups based on cultural and morphological characteristics. Out of which, C.
truncatum group contained thirty-two isolates (Liu, Wang, Damm, Crous, & Cai,
2016). However, in the present study the isolates were segregated into five groups
depending upon their colony and microscopic characteristics.
4.5.1.3 Texture
The isolates of C. truncatum showed light fluffy, medium fluffy, thin flat and
54
submerged texture. The colonies of group 1, group 4 and group 5 isolates were
medium fluffy. The isolates of group 2, ACT9, ACT21, ACT37 and ACT42 were
light fluffy. Whereas, rest of all the isolates belonging to group 2 (ACT2, ACT10,
ACT20, ACT26, ACT29, ACT30, ACT35 and ACT41) showed thin sparse growth
pattern. The hyphae of group 3 isolates ACT7, ACT17, ACT19, ACT25, ACT34,
ACT12, ACT23, ACT27 and ACT45 were submerged having sparse growth pattern.
The isolates of C. truncatum in our study showed medium fluffy, light fluffy, thin
sparse and submerged growth pattern. Whereas, all isolates of C. truncatum showed
only moderate aerial mycelia in the study carried out by other scientist (Ramdial &
Rampersad, 2015).
4.5.1.4 Conidia
Microscopic characteristics of C. truncatum was almost same among the five
groups. Hyphae were aseptate, hyaline, smooth walled. C. truncatum produces
hyaline, single celled conidia, slightly constricted in middle and falcate in shape
(Figure 4.26). The overall mean size (L×W) of group 1, 2, 3, 4 and group 5 conidia
was 24.8±2.4×2.4±0.2, 25±1.5×2.5±0.1, 23.4±1.9×2.4±0.2, 26.5±1.1×2.5±0.2 and
25.3±1.7×2.4±0.1 respectively. The longest mean length of conidia in group 1 isolates
was observed in ACT24 (26.8±1.3). The isolate ACT 30 (26±1) and ACT42 (26±1.6)
of group 2 showed the maximum conidial length. Whereas, the isolate ACT 7
(25.3±0.8), ACT33 (27.3±1.1) and AC39 (27±1) belonging to group 3, group 4 and
group 5 respectively showed the longest conidia (Table 4.7). Conidial dimensions in
the present study were found in cognizance with dimensions taken by other scientists
(Damm et al., 2009; Liu et al., 2016).
4.5.1.5 Setae
The isolates from all 5 groups produced setae. The setae originate from acervular
conidiomata that were light-dark brown or black, cylindrical, tapering towards tips
and 3 to 5 septate (Figure 4.27). The mean dimension ranges 82 to 130 × 3.8 to 6 μm
(mean = 104 × 4.6 μm) (Table 4.7). Isolates of group 2 had the longest setae,
averaging 107.8±14.1μm, while isolates of group 4 had the shortest, averaging
100.4±12.7 μm. Setae of group 2 and group 5 were the widest, with an average of
4.7±0.5 μm and 4.7±0.5 μm. Group 3 and group 1 isolates had the narrowest setae,
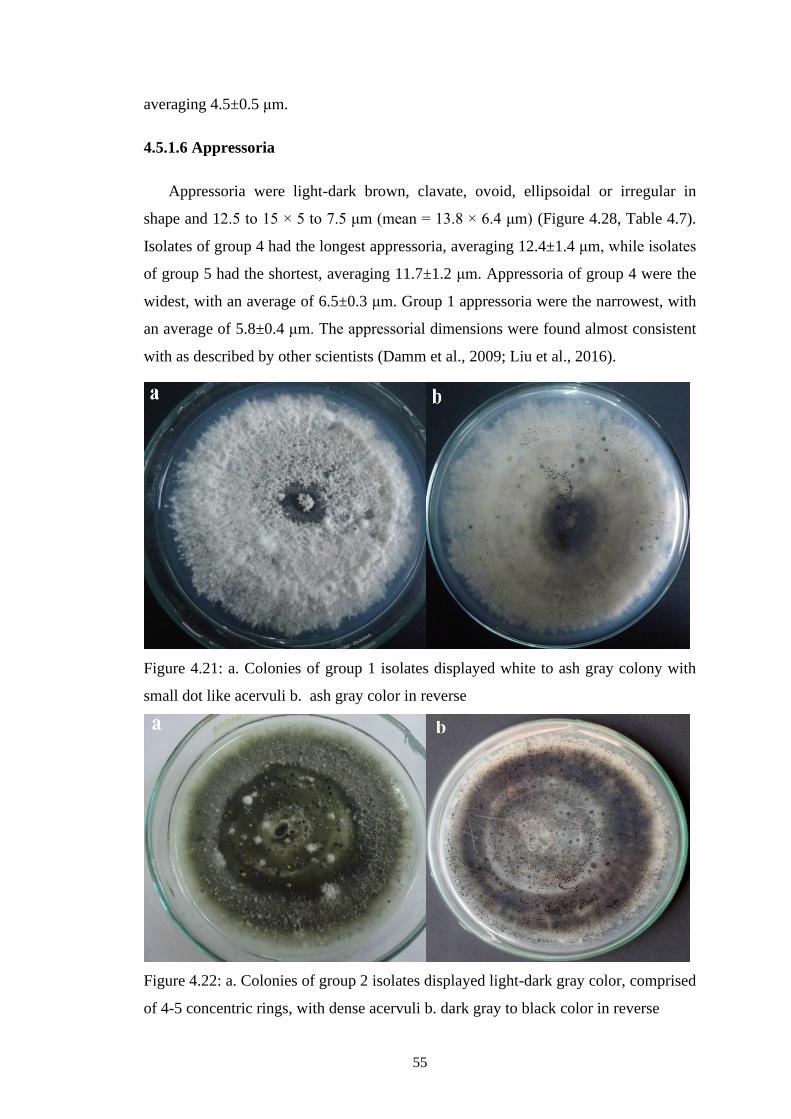
55
averaging 4.5±0.5 μm.
4.5.1.6 Appressoria
Appressoria were light-dark brown, clavate, ovoid, ellipsoidal or irregular in
shape and 12.5 to 15 × 5 to 7.5 μm (mean = 13.8 × 6.4 μm) (Figure 4.28, Table 4.7).
Isolates of group 4 had the longest appressoria, averaging 12.4±1.4 μm, while isolates
of group 5 had the shortest, averaging 11.7±1.2 μm. Appressoria of group 4 were the
widest, with an average of 6.5±0.3 μm. Group 1 appressoria were the narrowest, with
an average of 5.8±0.4 μm. The appressorial dimensions were found almost consistent
with as described by other scientists (Damm et al., 2009; Liu et al., 2016).
Figure 4.21: a. Colonies of group 1 isolates displayed white to ash gray colony with
small dot like acervuli b. ash gray color in reverse
Figure 4.22: a. Colonies of group 2 isolates displayed light-dark gray color, comprised
of 4-5 concentric rings, with dense acervuli b. dark gray to black color in reverse
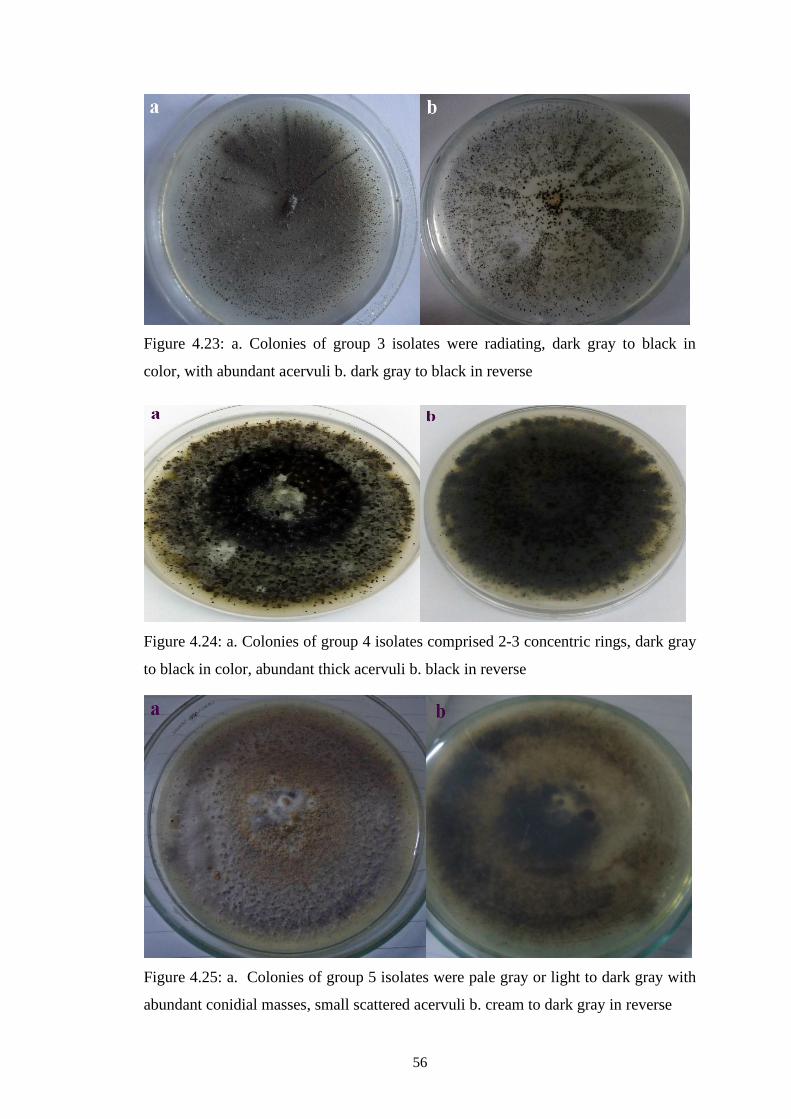
56
Figure 4.23: a. Colonies of group 3 isolates were radiating, dark gray to black in
color, with abundant acervuli b. dark gray to black in reverse
Figure 4.24: a. Colonies of group 4 isolates comprised 2-3 concentric rings, dark gray
to black in color, abundant thick acervuli b. black in reverse
Figure 4.25: a. Colonies of group 5 isolates were pale gray or light to dark gray with
abundant conidial masses, small scattered acervuli b. cream to dark gray in reverse
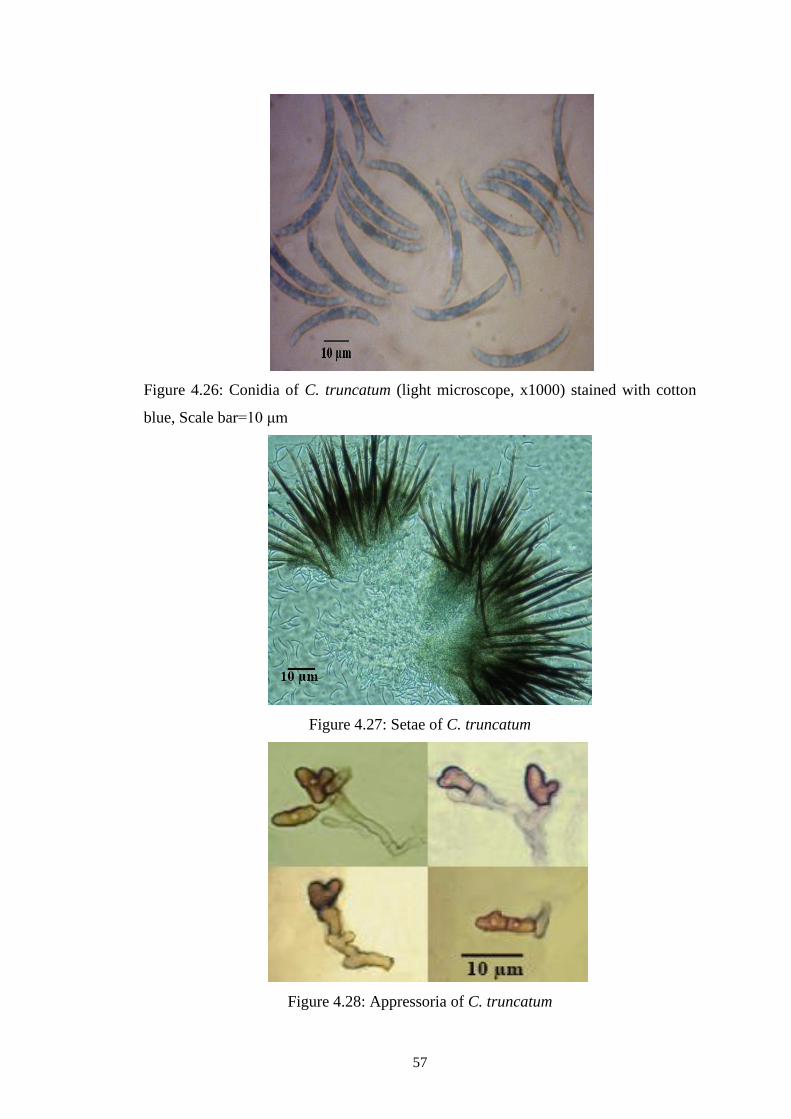
57
Figure 4.26: Conidia of C. truncatum (light microscope, x1000) stained with cotton
blue, Scale bar=10 μm
Figure 4.27: Setae of C. truncatum
Figure 4.28: Appressoria of C. truncatum
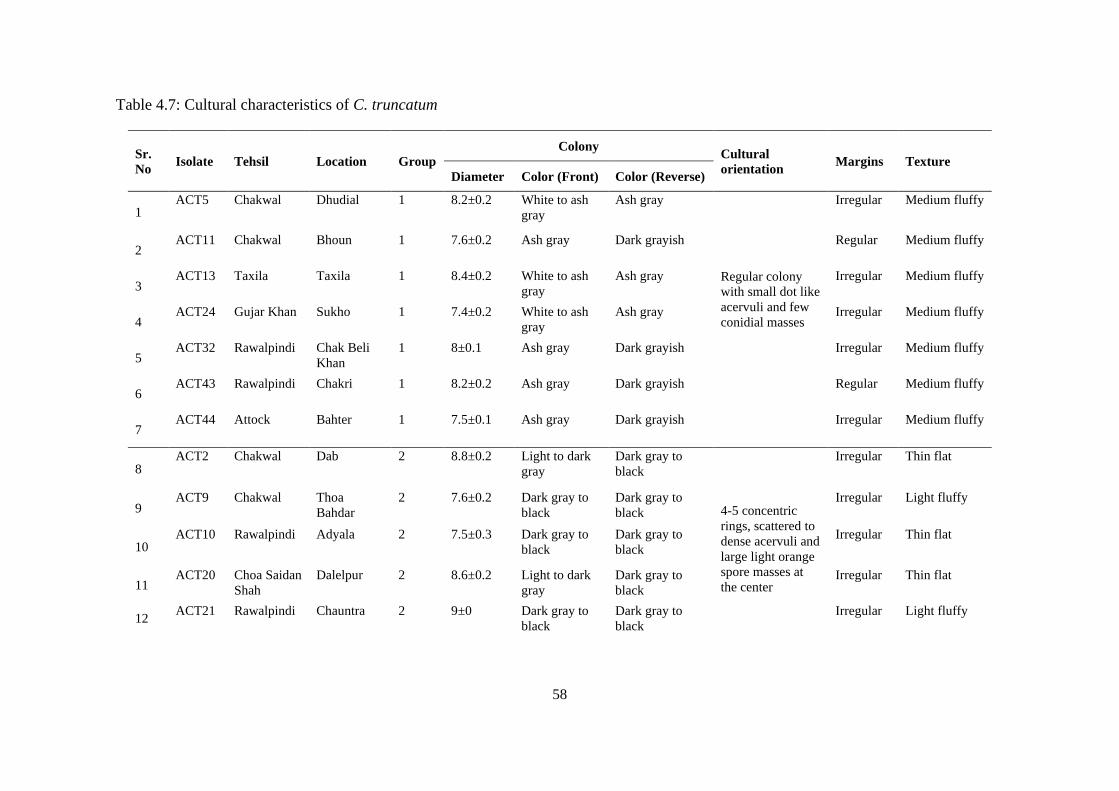
58
Table 4.7: Cultural characteristics of C. truncatum
Sr.
No Isolate Tehsil Location Group
Colony Cultural
orientation Margins Texture
Diameter Color (Front) Color (Reverse)
1 ACT5 Chakwal Dhudial 1 8.2±0.2 White to ash
gray
Ash gray
Regular colony
with small dot like
acervuli and few
conidial masses
Irregular Medium fluffy
2 ACT11 Chakwal Bhoun 1 7.6±0.2 Ash gray Dark grayish Regular Medium fluffy
3 ACT13 Taxila Taxila 1 8.4±0.2 White to ash
gray
Ash gray Irregular Medium fluffy
4 ACT24 Gujar Khan Sukho 1 7.4±0.2 White to ash
gray
Ash gray Irregular Medium fluffy
5 ACT32 Rawalpindi Chak Beli
Khan
1 8±0.1 Ash gray Dark grayish Irregular Medium fluffy
6 ACT43 Rawalpindi Chakri 1 8.2±0.2 Ash gray Dark grayish Regular Medium fluffy
7 ACT44 Attock Bahter 1 7.5±0.1 Ash gray Dark grayish Irregular Medium fluffy
8 ACT2 Chakwal Dab 2 8.8±0.2 Light to dark
gray
Dark gray to
black
4-5 concentric
rings, scattered to
dense acervuli and
large light orange
spore masses at
the center
Irregular Thin flat
9 ACT9 Chakwal Thoa
Bahdar
2 7.6±0.2 Dark gray to
black
Dark gray to
black
Irregular Light fluffy
10 ACT10 Rawalpindi Adyala 2 7.5±0.3 Dark gray to
black
Dark gray to
black
Irregular Thin flat
11 ACT20 Choa Saidan
Shah
Dalelpur 2 8.6±0.2 Light to dark
gray
Dark gray to
black
Irregular Thin flat
12 ACT21 Rawalpindi Chauntra 2 9±0 Dark gray to
black
Dark gray to
black
Irregular Light fluffy
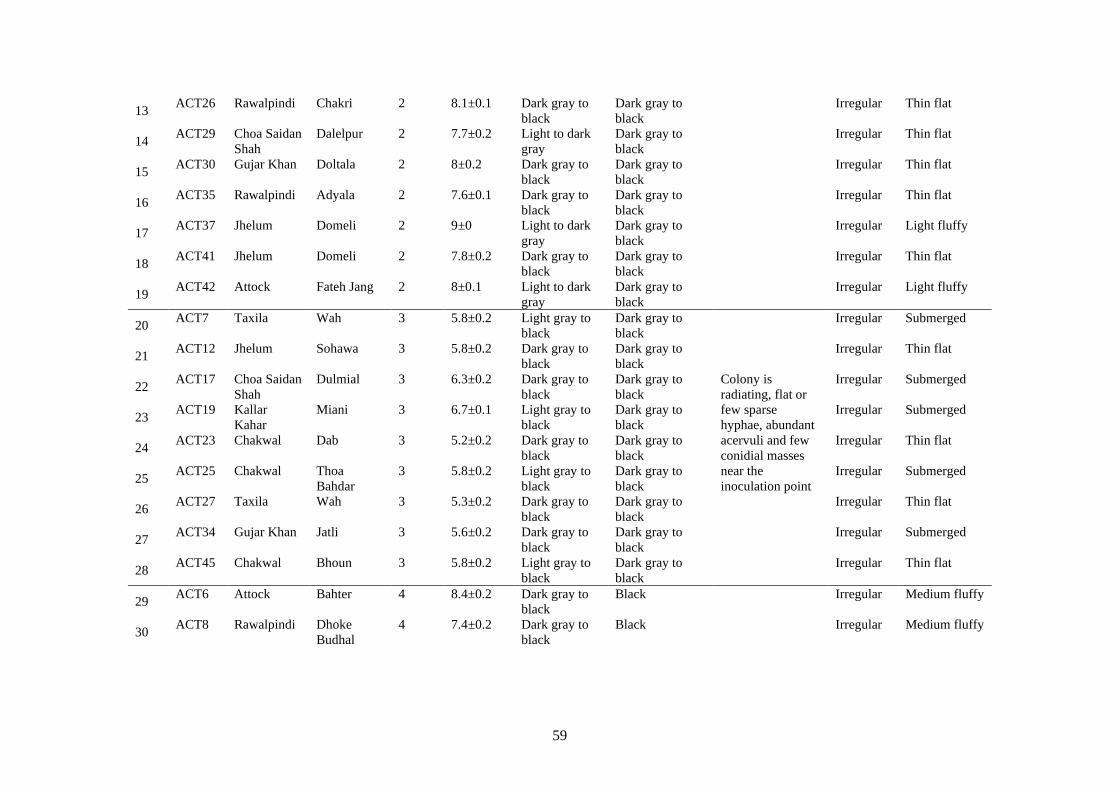
59
13 ACT26 Rawalpindi Chakri 2 8.1±0.1 Dark gray to
black
Dark gray to
black
Irregular Thin flat
14 ACT29 Choa Saidan
Shah
Dalelpur 2 7.7±0.2 Light to dark
gray
Dark gray to
black
Irregular Thin flat
15 ACT30 Gujar Khan Doltala 2 8±0.2 Dark gray to
black
Dark gray to
black
Irregular Thin flat
16 ACT35 Rawalpindi Adyala 2 7.6±0.1 Dark gray to
black
Dark gray to
black
Irregular Thin flat
17 ACT37 Jhelum Domeli 2 9±0 Light to dark
gray
Dark gray to
black
Irregular Light fluffy
18 ACT41 Jhelum Domeli 2 7.8±0.2 Dark gray to
black
Dark gray to
black
Irregular Thin flat
19 ACT42 Attock Fateh Jang 2 8±0.1 Light to dark
gray
Dark gray to
black
Irregular Light fluffy
20 ACT7 Taxila Wah 3 5.8±0.2 Light gray to
black
Dark gray to
black
Colony is
radiating, flat or
few sparse
hyphae, abundant
acervuli and few
conidial masses
near the
inoculation point
Irregular Submerged
21 ACT12 Jhelum Sohawa 3 5.8±0.2 Dark gray to
black
Dark gray to
black
Irregular Thin flat
22 ACT17 Choa Saidan
Shah
Dulmial 3 6.3±0.2 Dark gray to
black
Dark gray to
black
Irregular Submerged
23 ACT19 Kallar
Kahar
Miani 3 6.7±0.1 Light gray to
black
Dark gray to
black
Irregular Submerged
24 ACT23 Chakwal Dab 3 5.2±0.2 Dark gray to
black
Dark gray to
black
Irregular Thin flat
25 ACT25 Chakwal Thoa
Bahdar
3 5.8±0.2 Light gray to
black
Dark gray to
black
Irregular Submerged
26 ACT27 Taxila Wah 3 5.3±0.2 Dark gray to
black
Dark gray to
black
Irregular Thin flat
27 ACT34 Gujar Khan Jatli 3 5.6±0.2 Dark gray to
black
Dark gray to
black
Irregular Submerged
28 ACT45 Chakwal Bhoun 3 5.8±0.2 Light gray to
black
Dark gray to
black
Irregular Thin flat
29 ACT6 Attock Bahter 4 8.4±0.2 Dark gray to
black
Black
Irregular Medium fluffy
30 ACT8 Rawalpindi Dhoke
Budhal
4 7.4±0.2 Dark gray to
black
Black Irregular Medium fluffy
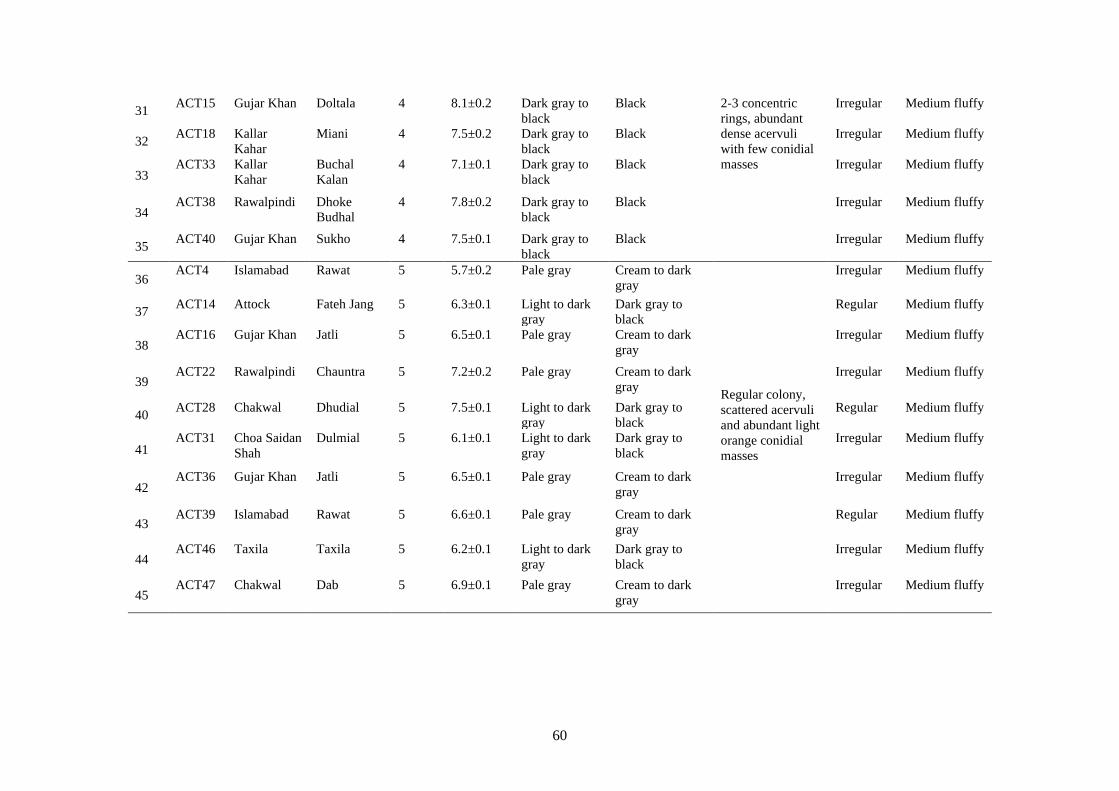
60
31 ACT15 Gujar Khan Doltala 4 8.1±0.2 Dark gray to
black
Black 2-3 concentric
rings, abundant
dense acervuli
with few conidial
masses
Irregular Medium fluffy
32 ACT18 Kallar
Kahar
Miani 4 7.5±0.2 Dark gray to
black
Black Irregular Medium fluffy
33 ACT33 Kallar
Kahar
Buchal
Kalan
4 7.1±0.1 Dark gray to
black
Black Irregular Medium fluffy
34 ACT38 Rawalpindi Dhoke
Budhal
4 7.8±0.2 Dark gray to
black
Black Irregular Medium fluffy
35 ACT40 Gujar Khan Sukho 4 7.5±0.1 Dark gray to
black
Black Irregular Medium fluffy
36 ACT4 Islamabad Rawat 5 5.7±0.2 Pale gray Cream to dark
gray
Regular colony,
scattered acervuli
and abundant light
orange conidial
masses
Irregular Medium fluffy
37 ACT14 Attock Fateh Jang 5 6.3±0.1 Light to dark
gray
Dark gray to
black
Regular Medium fluffy
38 ACT16 Gujar Khan Jatli 5 6.5±0.1 Pale gray Cream to dark
gray
Irregular Medium fluffy
39 ACT22 Rawalpindi Chauntra 5 7.2±0.2 Pale gray Cream to dark
gray
Irregular Medium fluffy
40 ACT28 Chakwal Dhudial 5 7.5±0.1 Light to dark
gray
Dark gray to
black
Regular Medium fluffy
41 ACT31 Choa Saidan
Shah
Dulmial 5 6.1±0.1 Light to dark
gray
Dark gray to
black
Irregular Medium fluffy
42 ACT36 Gujar Khan Jatli 5 6.5±0.1 Pale gray Cream to dark
gray
Irregular Medium fluffy
43 ACT39 Islamabad Rawat 5 6.6±0.1 Pale gray Cream to dark
gray
Regular Medium fluffy
44 ACT46 Taxila Taxila 5 6.2±0.1 Light to dark
gray
Dark gray to
black
Irregular Medium fluffy
45 ACT47 Chakwal Dab 5 6.9±0.1 Pale gray Cream to dark
gray
Irregular Medium fluffy
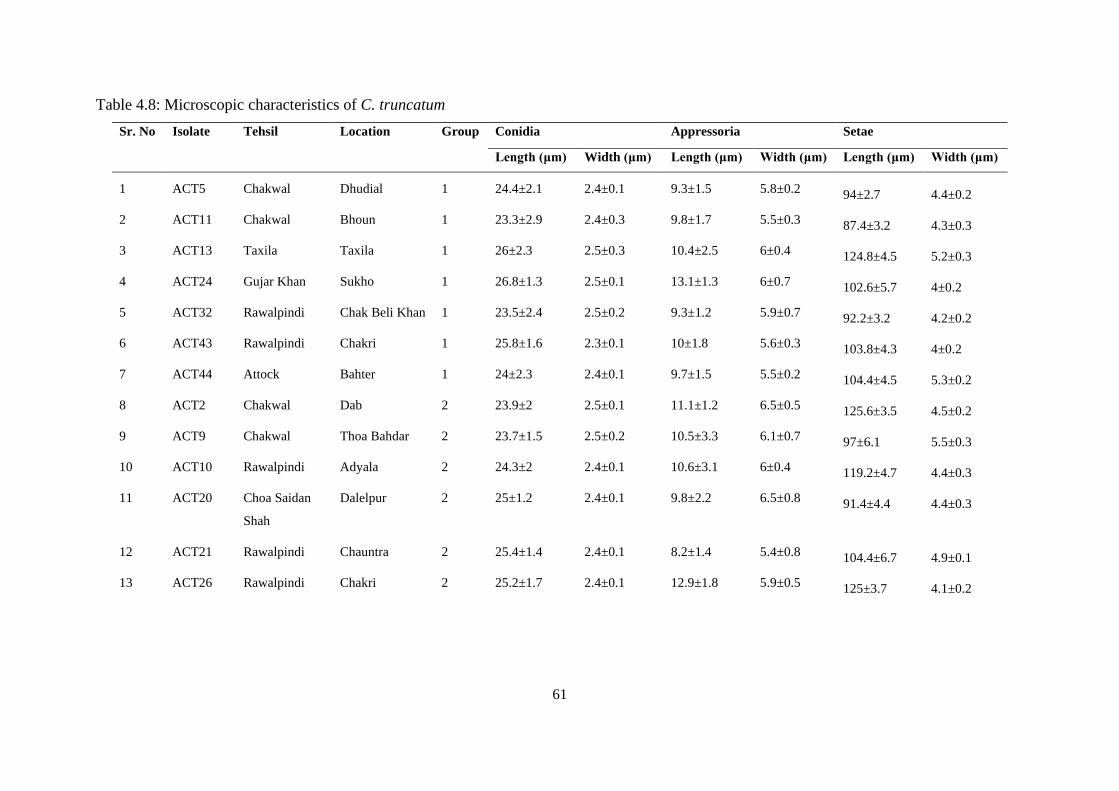
61
Table 4.8: Microscopic characteristics of C. truncatum
Sr. No Isolate Tehsil Location Group Conidia Appressoria Setae
Length (μm) Width (μm) Length (μm) Width (μm) Length (μm) Width (μm)
1 ACT5 Chakwal Dhudial 1 24.4±2.1 2.4±0.1 9.3±1.5 5.8±0.2 94±2.7 4.4±0.2
2 ACT11 Chakwal Bhoun 1 23.3±2.9 2.4±0.3 9.8±1.7 5.5±0.3 87.4±3.2 4.3±0.3
3 ACT13 Taxila Taxila 1 26±2.3 2.5±0.3 10.4±2.5 6±0.4 124.8±4.5 5.2±0.3
4 ACT24 Gujar Khan Sukho 1 26.8±1.3 2.5±0.1 13.1±1.3 6±0.7 102.6±5.7 4±0.2
5 ACT32 Rawalpindi Chak Beli Khan 1 23.5±2.4 2.5±0.2 9.3±1.2 5.9±0.7 92.2±3.2 4.2±0.2
6 ACT43 Rawalpindi Chakri 1 25.8±1.6 2.3±0.1 10±1.8 5.6±0.3 103.8±4.3 4±0.2
7 ACT44 Attock Bahter 1 24±2.3 2.4±0.1 9.7±1.5 5.5±0.2 104.4±4.5 5.3±0.2
8 ACT2 Chakwal Dab 2 23.9±2 2.5±0.1 11.1±1.2 6.5±0.5 125.6±3.5 4.5±0.2
9 ACT9 Chakwal Thoa Bahdar 2 23.7±1.5 2.5±0.2 10.5±3.3 6.1±0.7 97±6.1 5.5±0.3
10 ACT10 Rawalpindi Adyala 2 24.3±2 2.4±0.1 10.6±3.1 6±0.4 119.2±4.7 4.4±0.3
11 ACT20 Choa Saidan
Shah
Dalelpur 2 25±1.2 2.4±0.1 9.8±2.2 6.5±0.8 91.4±4.4 4.4±0.3
12 ACT21 Rawalpindi Chauntra 2 25.4±1.4 2.4±0.1 8.2±1.4 5.4±0.8 104.4±6.7 4.9±0.1
13 ACT26 Rawalpindi Chakri 2 25.2±1.7 2.4±0.1 12.9±1.8 5.9±0.5 125±3.7 4.1±0.2
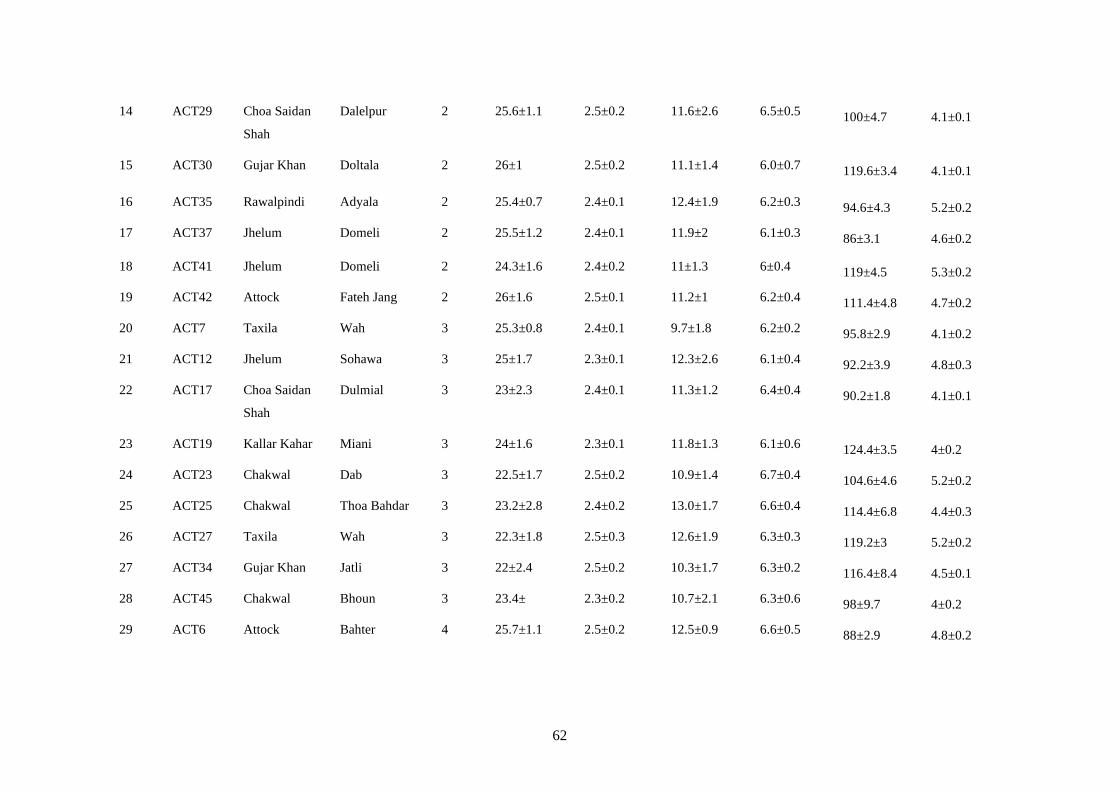
62
14 ACT29 Choa Saidan
Shah
Dalelpur 2 25.6±1.1 2.5±0.2 11.6±2.6 6.5±0.5 100±4.7 4.1±0.1
15 ACT30 Gujar Khan Doltala 2 26±1 2.5±0.2 11.1±1.4 6.0±0.7 119.6±3.4 4.1±0.1
16 ACT35 Rawalpindi Adyala 2 25.4±0.7 2.4±0.1 12.4±1.9 6.2±0.3 94.6±4.3 5.2±0.2
17 ACT37 Jhelum Domeli 2 25.5±1.2 2.4±0.1 11.9±2 6.1±0.3 86±3.1 4.6±0.2
18 ACT41 Jhelum Domeli 2 24.3±1.6 2.4±0.2 11±1.3 6±0.4 119±4.5 5.3±0.2
19 ACT42 Attock Fateh Jang 2 26±1.6 2.5±0.1 11.2±1 6.2±0.4 111.4±4.8 4.7±0.2
20 ACT7 Taxila Wah 3 25.3±0.8 2.4±0.1 9.7±1.8 6.2±0.2 95.8±2.9 4.1±0.2
21 ACT12 Jhelum Sohawa 3 25±1.7 2.3±0.1 12.3±2.6 6.1±0.4 92.2±3.9 4.8±0.3
22 ACT17 Choa Saidan
Shah
Dulmial 3 23±2.3 2.4±0.1 11.3±1.2 6.4±0.4 90.2±1.8 4.1±0.1
23 ACT19 Kallar Kahar Miani 3 24±1.6 2.3±0.1 11.8±1.3 6.1±0.6 124.4±3.5 4±0.2
24 ACT23 Chakwal Dab 3 22.5±1.7 2.5±0.2 10.9±1.4 6.7±0.4 104.6±4.6 5.2±0.2
25 ACT25 Chakwal Thoa Bahdar 3 23.2±2.8 2.4±0.2 13.0±1.7 6.6±0.4 114.4±6.8 4.4±0.3
26 ACT27 Taxila Wah 3 22.3±1.8 2.5±0.3 12.6±1.9 6.3±0.3 119.2±3 5.2±0.2
27 ACT34 Gujar Khan Jatli 3 22±2.4 2.5±0.2 10.3±1.7 6.3±0.2 116.4±8.4 4.5±0.1
28 ACT45 Chakwal Bhoun 3 23.4± 2.3±0.2 10.7±2.1 6.3±0.6 98±9.7 4±0.2
29 ACT6 Attock Bahter 4 25.7±1.1 2.5±0.2 12.5±0.9 6.6±0.5 88±2.9 4.8±0.2
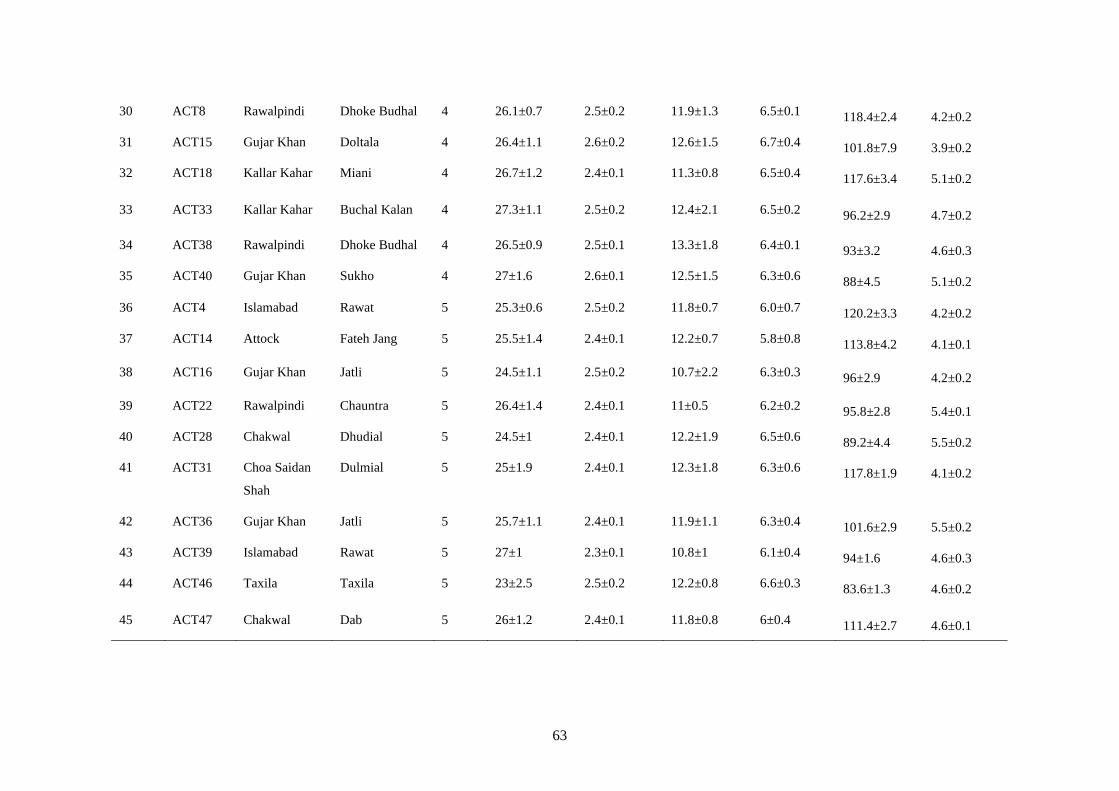
63
30 ACT8 Rawalpindi Dhoke Budhal 4 26.1±0.7 2.5±0.2 11.9±1.3 6.5±0.1 118.4±2.4 4.2±0.2
31 ACT15 Gujar Khan Doltala 4 26.4±1.1 2.6±0.2 12.6±1.5 6.7±0.4 101.8±7.9 3.9±0.2
32 ACT18 Kallar Kahar Miani 4 26.7±1.2 2.4±0.1 11.3±0.8 6.5±0.4 117.6±3.4 5.1±0.2
33 ACT33 Kallar Kahar Buchal Kalan 4 27.3±1.1 2.5±0.2 12.4±2.1 6.5±0.2 96.2±2.9 4.7±0.2
34 ACT38 Rawalpindi Dhoke Budhal 4 26.5±0.9 2.5±0.1 13.3±1.8 6.4±0.1 93±3.2 4.6±0.3
35 ACT40 Gujar Khan Sukho 4 27±1.6 2.6±0.1 12.5±1.5 6.3±0.6 88±4.5 5.1±0.2
36 ACT4 Islamabad Rawat 5 25.3±0.6 2.5±0.2 11.8±0.7 6.0±0.7 120.2±3.3 4.2±0.2
37 ACT14 Attock Fateh Jang 5 25.5±1.4 2.4±0.1 12.2±0.7 5.8±0.8 113.8±4.2 4.1±0.1
38 ACT16 Gujar Khan Jatli 5 24.5±1.1 2.5±0.2 10.7±2.2 6.3±0.3 96±2.9 4.2±0.2
39 ACT22 Rawalpindi Chauntra 5 26.4±1.4 2.4±0.1 11±0.5 6.2±0.2 95.8±2.8 5.4±0.1
40 ACT28 Chakwal Dhudial 5 24.5±1 2.4±0.1 12.2±1.9 6.5±0.6 89.2±4.4 5.5±0.2
41 ACT31 Choa Saidan
Shah
Dulmial 5 25±1.9 2.4±0.1 12.3±1.8 6.3±0.6 117.8±1.9 4.1±0.2
42 ACT36 Gujar Khan Jatli 5 25.7±1.1 2.4±0.1 11.9±1.1 6.3±0.4 101.6±2.9 5.5±0.2
43 ACT39 Islamabad Rawat 5 27±1 2.3±0.1 10.8±1 6.1±0.4 94±1.6 4.6±0.3
44 ACT46 Taxila Taxila 5 23±2.5 2.5±0.2 12.2±0.8 6.6±0.3 83.6±1.3 4.6±0.2
45 ACT47 Chakwal Dab 5 26±1.2 2.4±0.1 11.8±0.8 6±0.4 111.4±2.7 4.6±0.1
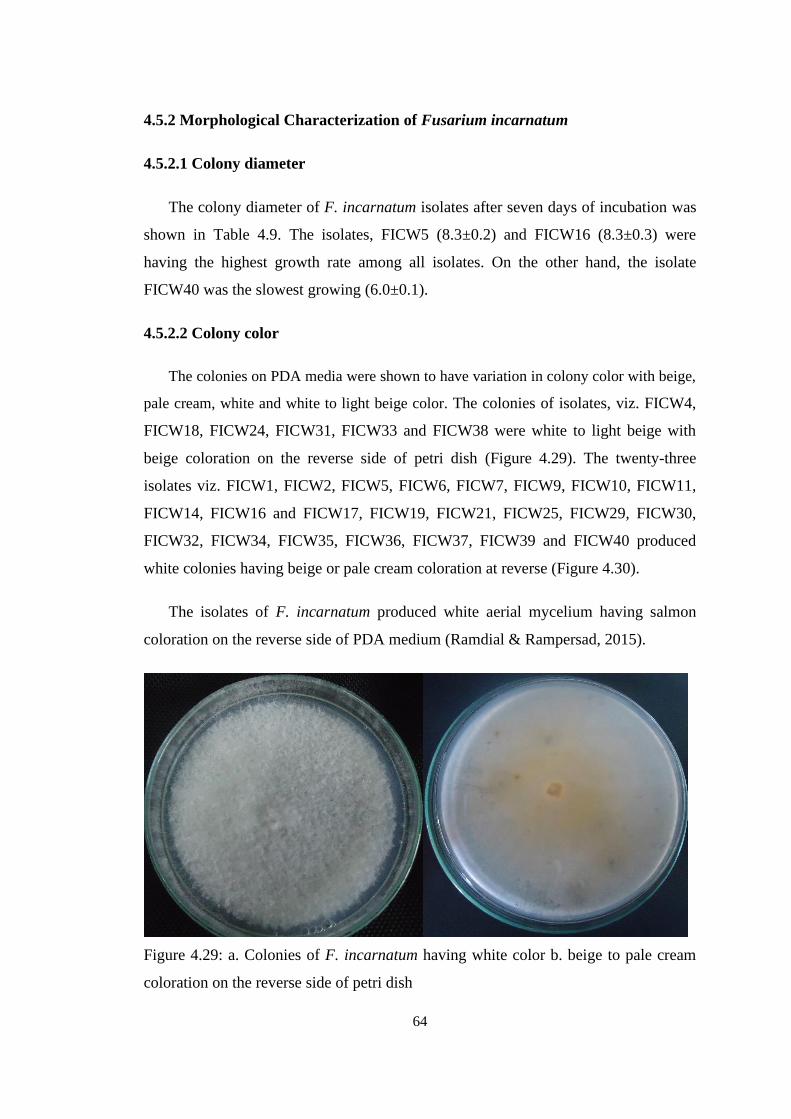
64
4.5.2 Morphological Characterization of Fusarium incarnatum
4.5.2.1 Colony diameter
The colony diameter of F. incarnatum isolates after seven days of incubation was
shown in Table 4.9. The isolates, FICW5 (8.3±0.2) and FICW16 (8.3±0.3) were
having the highest growth rate among all isolates. On the other hand, the isolate
FICW40 was the slowest growing (6.0±0.1).
4.5.2.2 Colony color
The colonies on PDA media were shown to have variation in colony color with beige,
pale cream, white and white to light beige color. The colonies of isolates, viz. FICW4,
FICW18, FICW24, FICW31, FICW33 and FICW38 were white to light beige with
beige coloration on the reverse side of petri dish (Figure 4.29). The twenty-three
isolates viz. FICW1, FICW2, FICW5, FICW6, FICW7, FICW9, FICW10, FICW11,
FICW14, FICW16 and FICW17, FICW19, FICW21, FICW25, FICW29, FICW30,
FICW32, FICW34, FICW35, FICW36, FICW37, FICW39 and FICW40 produced
white colonies having beige or pale cream coloration at reverse (Figure 4.30).
The isolates of F. incarnatum produced white aerial mycelium having salmon
coloration on the reverse side of PDA medium (Ramdial & Rampersad, 2015).
Figure 4.29: a. Colonies of F. incarnatum having white color b. beige to pale cream
coloration on the reverse side of petri dish
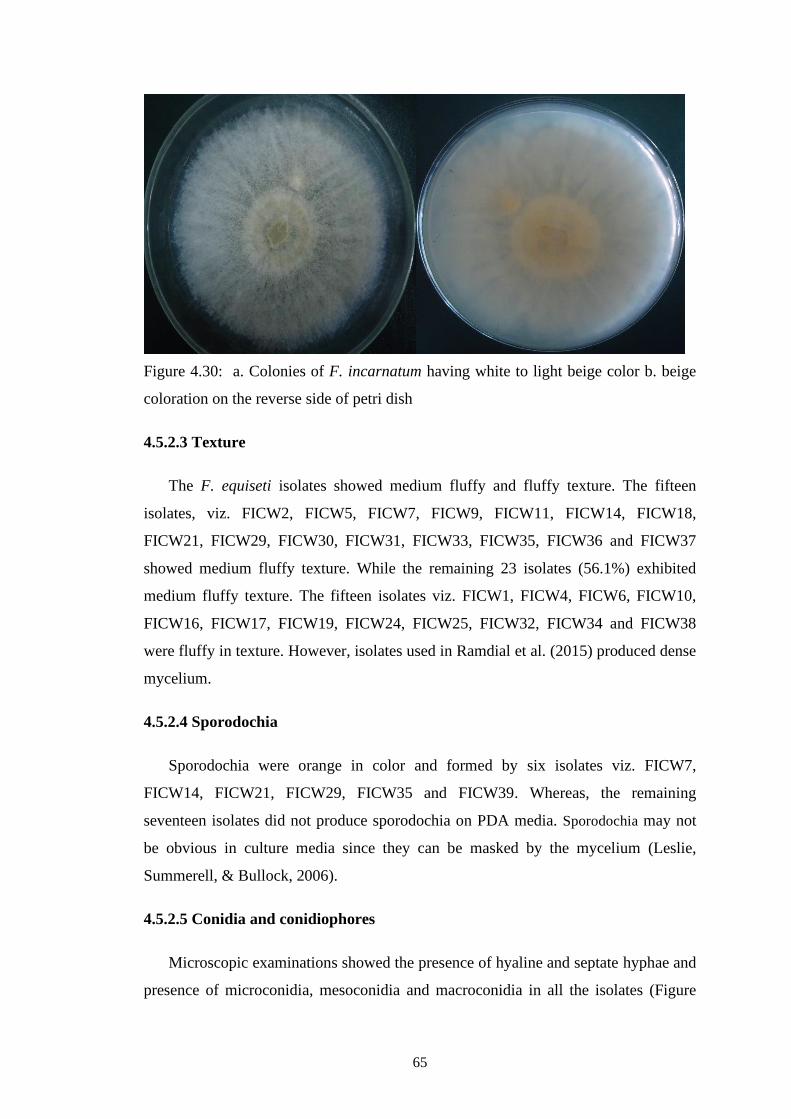
65
Figure 4.30: a. Colonies of F. incarnatum having white to light beige color b. beige
coloration on the reverse side of petri dish
4.5.2.3 Texture
The F. equiseti isolates showed medium fluffy and fluffy texture. The fifteen
isolates, viz. FICW2, FICW5, FICW7, FICW9, FICW11, FICW14, FICW18,
FICW21, FICW29, FICW30, FICW31, FICW33, FICW35, FICW36 and FICW37
showed medium fluffy texture. While the remaining 23 isolates (56.1%) exhibited
medium fluffy texture. The fifteen isolates viz. FICW1, FICW4, FICW6, FICW10,
FICW16, FICW17, FICW19, FICW24, FICW25, FICW32, FICW34 and FICW38
were fluffy in texture. However, isolates used in Ramdial et al. (2015) produced dense
mycelium.
4.5.2.4 Sporodochia
Sporodochia were orange in color and formed by six isolates viz. FICW7,
FICW14, FICW21, FICW29, FICW35 and FICW39. Whereas, the remaining
seventeen isolates did not produce sporodochia on PDA media. Sporodochia may not
be obvious in culture media since they can be masked by the mycelium (Leslie,
Summerell, & Bullock, 2006).
4.5.2.5 Conidia and conidiophores
Microscopic examinations showed the presence of hyaline and septate hyphae and
presence of microconidia, mesoconidia and macroconidia in all the isolates (Figure
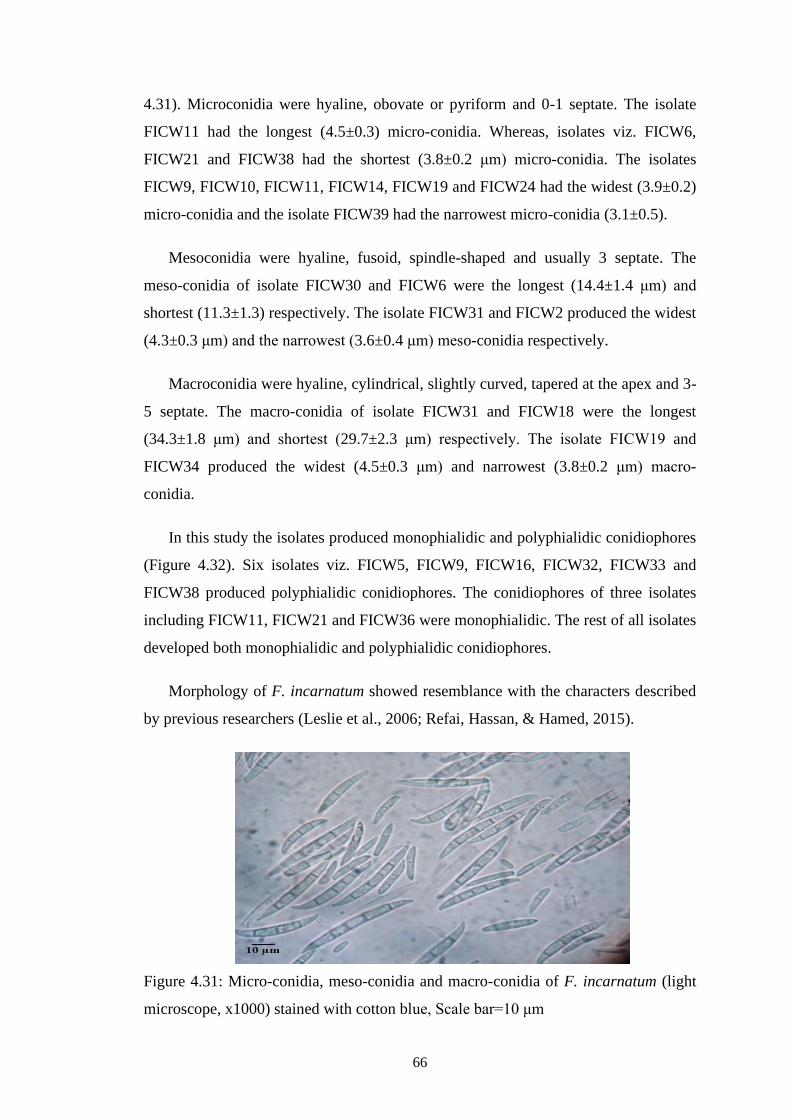
66
4.31). Microconidia were hyaline, obovate or pyriform and 0-1 septate. The isolate
FICW11 had the longest (4.5±0.3) micro-conidia. Whereas, isolates viz. FICW6,
FICW21 and FICW38 had the shortest (3.8±0.2 μm) micro-conidia. The isolates
FICW9, FICW10, FICW11, FICW14, FICW19 and FICW24 had the widest (3.9±0.2)
micro-conidia and the isolate FICW39 had the narrowest micro-conidia (3.1±0.5).
Mesoconidia were hyaline, fusoid, spindle-shaped and usually 3 septate. The
meso-conidia of isolate FICW30 and FICW6 were the longest (14.4±1.4 μm) and
shortest (11.3±1.3) respectively. The isolate FICW31 and FICW2 produced the widest
(4.3±0.3 μm) and the narrowest (3.6±0.4 μm) meso-conidia respectively.
Macroconidia were hyaline, cylindrical, slightly curved, tapered at the apex and 3-
5 septate. The macro-conidia of isolate FICW31 and FICW18 were the longest
(34.3±1.8 μm) and shortest (29.7±2.3 μm) respectively. The isolate FICW19 and
FICW34 produced the widest (4.5±0.3 μm) and narrowest (3.8±0.2 μm) macro-
conidia.
In this study the isolates produced monophialidic and polyphialidic conidiophores
(Figure 4.32). Six isolates viz. FICW5, FICW9, FICW16, FICW32, FICW33 and
FICW38 produced polyphialidic conidiophores. The conidiophores of three isolates
including FICW11, FICW21 and FICW36 were monophialidic. The rest of all isolates
developed both monophialidic and polyphialidic conidiophores.
Morphology of F. incarnatum showed resemblance with the characters described
by previous researchers (Leslie et al., 2006; Refai, Hassan, & Hamed, 2015).
Figure 4.31: Micro-conidia, meso-conidia and macro-conidia of F. incarnatum (light
microscope, x1000) stained with cotton blue, Scale bar=10 μm
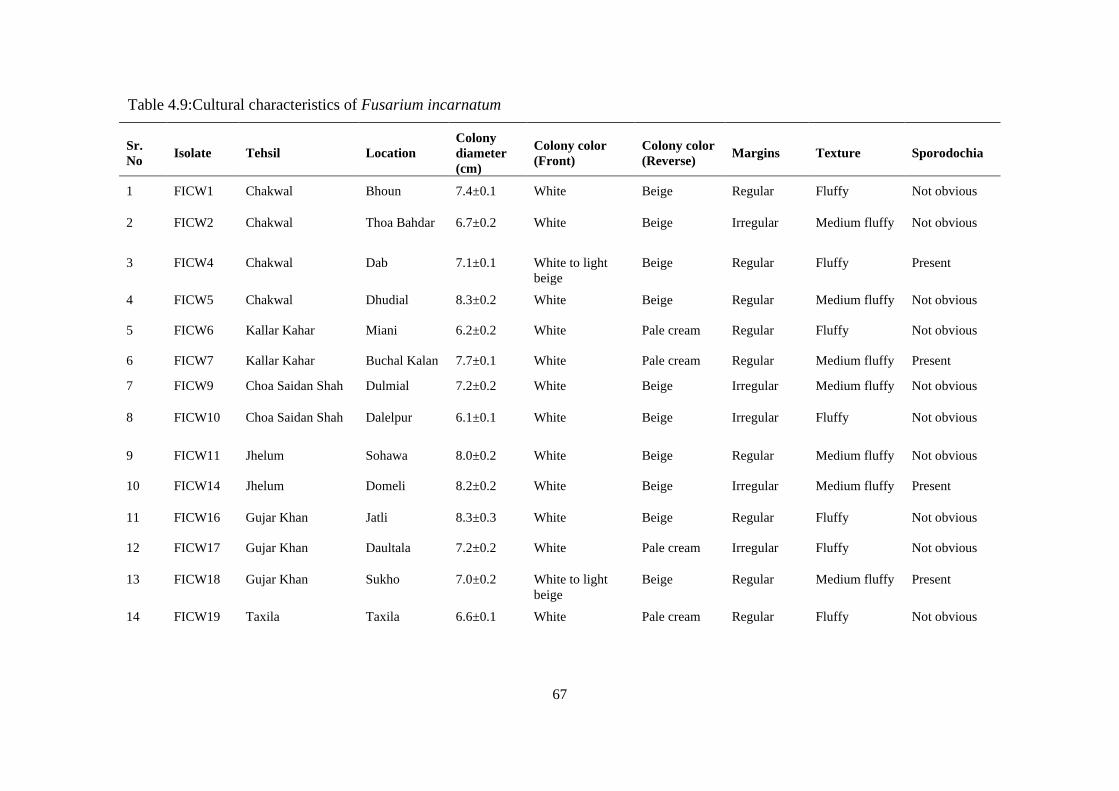
67
Table 4.9:Cultural characteristics of Fusarium incarnatum
Sr.
No Isolate Tehsil Location
Colony
diameter
(cm)
Colony color
(Front)
Colony color
(Reverse) Margins Texture Sporodochia
1 FICW1 Chakwal Bhoun 7.4±0.1 White Beige Regular Fluffy Not obvious
2 FICW2 Chakwal Thoa Bahdar 6.7±0.2 White Beige Irregular Medium fluffy Not obvious
3 FICW4 Chakwal Dab 7.1±0.1 White to light
beige
Beige Regular Fluffy Present
4 FICW5 Chakwal Dhudial 8.3±0.2 White Beige Regular Medium fluffy Not obvious
5 FICW6 Kallar Kahar Miani 6.2±0.2 White Pale cream Regular Fluffy Not obvious
6 FICW7 Kallar Kahar Buchal Kalan 7.7±0.1 White Pale cream Regular Medium fluffy Present
7 FICW9 Choa Saidan Shah Dulmial 7.2±0.2 White Beige Irregular Medium fluffy Not obvious
8 FICW10 Choa Saidan Shah Dalelpur 6.1±0.1 White Beige Irregular Fluffy Not obvious
9 FICW11 Jhelum Sohawa 8.0±0.2 White Beige Regular Medium fluffy Not obvious
10 FICW14 Jhelum Domeli 8.2±0.2 White Beige Irregular Medium fluffy Present
11 FICW16 Gujar Khan Jatli 8.3±0.3 White Beige Regular Fluffy Not obvious
12 FICW17 Gujar Khan Daultala 7.2±0.2 White Pale cream Irregular Fluffy Not obvious
13 FICW18 Gujar Khan Sukho 7.0±0.2 White to light
beige
Beige Regular Medium fluffy Present
14 FICW19 Taxila Taxila 6.6±0.1 White Pale cream Regular Fluffy Not obvious
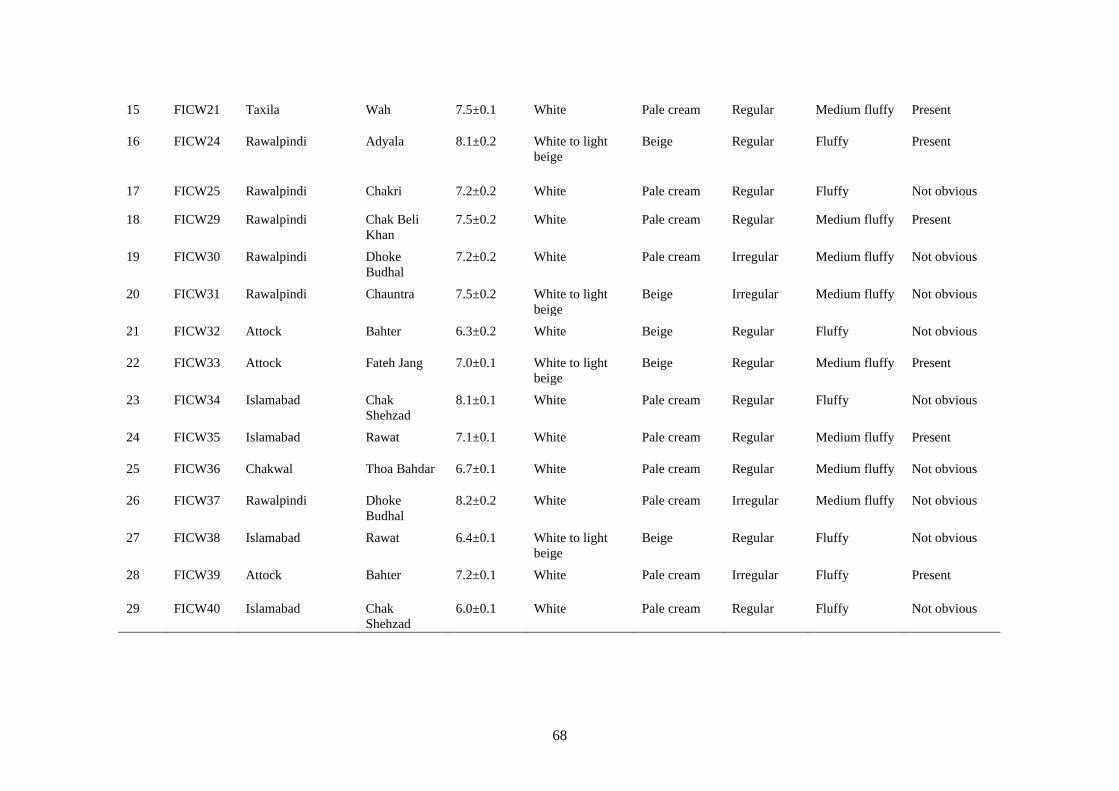
68
15 FICW21 Taxila Wah 7.5±0.1 White Pale cream Regular Medium fluffy Present
16 FICW24 Rawalpindi Adyala 8.1±0.2 White to light
beige
Beige Regular Fluffy Present
17 FICW25 Rawalpindi Chakri 7.2±0.2 White Pale cream Regular Fluffy Not obvious
18 FICW29 Rawalpindi Chak Beli
Khan
7.5±0.2 White Pale cream Regular Medium fluffy Present
19 FICW30 Rawalpindi Dhoke
Budhal
7.2±0.2 White Pale cream Irregular Medium fluffy Not obvious
20 FICW31 Rawalpindi Chauntra 7.5±0.2 White to light
beige
Beige Irregular Medium fluffy Not obvious
21 FICW32 Attock Bahter 6.3±0.2 White Beige Regular Fluffy Not obvious
22 FICW33 Attock Fateh Jang 7.0±0.1 White to light
beige
Beige Regular Medium fluffy Present
23 FICW34 Islamabad Chak
Shehzad
8.1±0.1 White Pale cream Regular Fluffy Not obvious
24 FICW35 Islamabad Rawat 7.1±0.1 White Pale cream Regular Medium fluffy Present
25 FICW36 Chakwal Thoa Bahdar 6.7±0.1 White Pale cream Regular Medium fluffy Not obvious
26 FICW37 Rawalpindi Dhoke
Budhal
8.2±0.2 White Pale cream Irregular Medium fluffy Not obvious
27 FICW38 Islamabad Rawat 6.4±0.1 White to light
beige
Beige Regular Fluffy Not obvious
28 FICW39 Attock Bahter 7.2±0.1 White Pale cream Irregular Fluffy Present
29 FICW40 Islamabad Chak
Shehzad
6.0±0.1 White Pale cream Regular Fluffy Not obvious
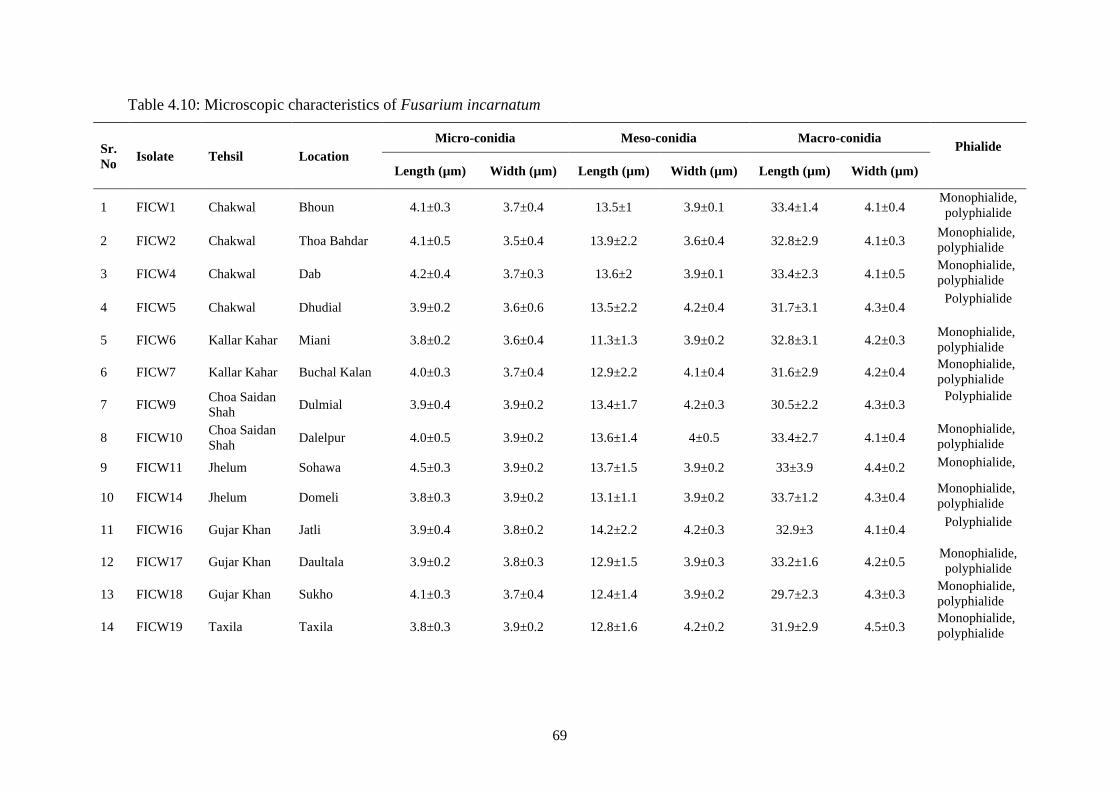
69
Table 4.10: Microscopic characteristics of Fusarium incarnatum
Sr.
No Isolate Tehsil Location
Micro-conidia Meso-conidia Macro-conidia
Phialide
Length (µm) Width (µm) Length (µm) Width (µm) Length (µm) Width (µm)
1 FICW1 Chakwal Bhoun 4.1±0.3 3.7±0.4 13.5±1 3.9±0.1 33.4±1.4 4.1±0.4 Monophialide,
polyphialide
2 FICW2 Chakwal Thoa Bahdar 4.1±0.5 3.5±0.4 13.9±2.2 3.6±0.4 32.8±2.9 4.1±0.3 Monophialide,
polyphialide
3 FICW4 Chakwal Dab 4.2±0.4 3.7±0.3 13.6±2 3.9±0.1 33.4±2.3 4.1±0.5 Monophialide,
polyphialide
4 FICW5 Chakwal Dhudial 3.9±0.2 3.6±0.6 13.5±2.2 4.2±0.4 31.7±3.1 4.3±0.4 Polyphialide
5 FICW6 Kallar Kahar Miani 3.8±0.2 3.6±0.4 11.3±1.3 3.9±0.2 32.8±3.1 4.2±0.3 Monophialide,
polyphialide
6 FICW7 Kallar Kahar Buchal Kalan 4.0±0.3 3.7±0.4 12.9±2.2 4.1±0.4 31.6±2.9 4.2±0.4 Monophialide,
polyphialide
7 FICW9 Choa Saidan
Shah Dulmial 3.9±0.4 3.9±0.2 13.4±1.7 4.2±0.3 30.5±2.2 4.3±0.3
Polyphialide
8 FICW10 Choa Saidan
Shah Dalelpur 4.0±0.5 3.9±0.2 13.6±1.4 4±0.5 33.4±2.7 4.1±0.4
Monophialide,
polyphialide
9 FICW11 Jhelum Sohawa 4.5±0.3 3.9±0.2 13.7±1.5 3.9±0.2 33±3.9 4.4±0.2 Monophialide,
10 FICW14 Jhelum Domeli 3.8±0.3 3.9±0.2 13.1±1.1 3.9±0.2 33.7±1.2 4.3±0.4 Monophialide,
polyphialide
11 FICW16 Gujar Khan Jatli 3.9±0.4 3.8±0.2 14.2±2.2 4.2±0.3 32.9±3 4.1±0.4 Polyphialide
12 FICW17 Gujar Khan Daultala 3.9±0.2 3.8±0.3 12.9±1.5 3.9±0.3 33.2±1.6 4.2±0.5 Monophialide,
polyphialide
13 FICW18 Gujar Khan Sukho 4.1±0.3 3.7±0.4 12.4±1.4 3.9±0.2 29.7±2.3 4.3±0.3 Monophialide,
polyphialide
14 FICW19 Taxila Taxila 3.8±0.3 3.9±0.2 12.8±1.6 4.2±0.2 31.9±2.9 4.5±0.3 Monophialide,
polyphialide
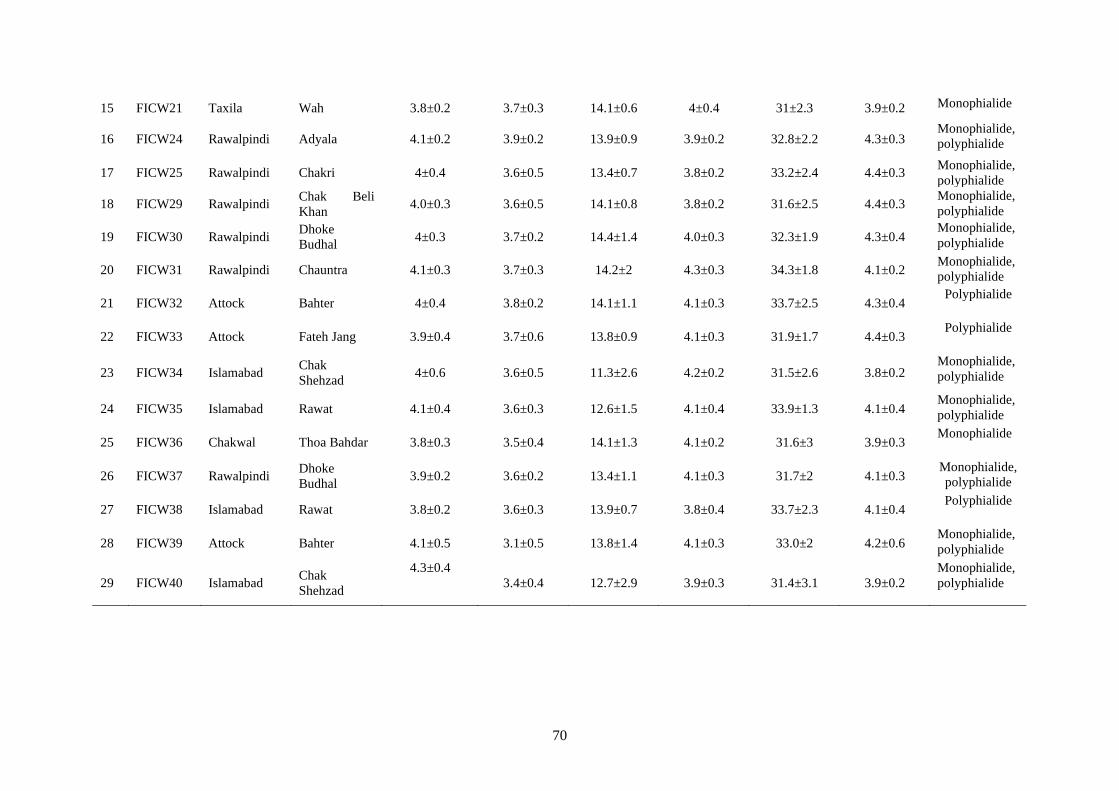
70
15 FICW21 Taxila Wah 3.8±0.2 3.7±0.3 14.1±0.6 4±0.4 31±2.3 3.9±0.2 Monophialide
16 FICW24 Rawalpindi Adyala 4.1±0.2 3.9±0.2 13.9±0.9 3.9±0.2 32.8±2.2 4.3±0.3 Monophialide,
polyphialide
17 FICW25 Rawalpindi Chakri 4±0.4 3.6±0.5 13.4±0.7 3.8±0.2 33.2±2.4 4.4±0.3 Monophialide,
polyphialide
18 FICW29 Rawalpindi Chak Beli
Khan 4.0±0.3 3.6±0.5 14.1±0.8 3.8±0.2 31.6±2.5 4.4±0.3
Monophialide,
polyphialide
19 FICW30 Rawalpindi Dhoke
Budhal 4±0.3 3.7±0.2 14.4±1.4 4.0±0.3 32.3±1.9 4.3±0.4
Monophialide,
polyphialide
20 FICW31 Rawalpindi Chauntra 4.1±0.3 3.7±0.3 14.2±2 4.3±0.3 34.3±1.8 4.1±0.2 Monophialide,
polyphialide
21 FICW32 Attock Bahter 4±0.4 3.8±0.2 14.1±1.1 4.1±0.3 33.7±2.5 4.3±0.4 Polyphialide
22 FICW33 Attock Fateh Jang 3.9±0.4 3.7±0.6 13.8±0.9 4.1±0.3 31.9±1.7 4.4±0.3 Polyphialide
23 FICW34 Islamabad Chak
Shehzad 4±0.6 3.6±0.5 11.3±2.6 4.2±0.2 31.5±2.6 3.8±0.2
Monophialide,
polyphialide
24 FICW35 Islamabad Rawat 4.1±0.4 3.6±0.3 12.6±1.5 4.1±0.4 33.9±1.3 4.1±0.4 Monophialide,
polyphialide
25 FICW36 Chakwal Thoa Bahdar 3.8±0.3 3.5±0.4 14.1±1.3 4.1±0.2 31.6±3 3.9±0.3 Monophialide
26 FICW37 Rawalpindi Dhoke
Budhal 3.9±0.2 3.6±0.2 13.4±1.1 4.1±0.3 31.7±2 4.1±0.3
Monophialide,
polyphialide
27 FICW38 Islamabad Rawat 3.8±0.2 3.6±0.3 13.9±0.7 3.8±0.4 33.7±2.3 4.1±0.4 Polyphialide
28 FICW39 Attock Bahter 4.1±0.5 3.1±0.5 13.8±1.4 4.1±0.3 33.0±2 4.2±0.6 Monophialide,
polyphialide
29 FICW40 Islamabad Chak
Shehzad
4.3±0.4
3.4±0.4 12.7±2.9 3.9±0.3 31.4±3.1 3.9±0.2
Monophialide,
polyphialide
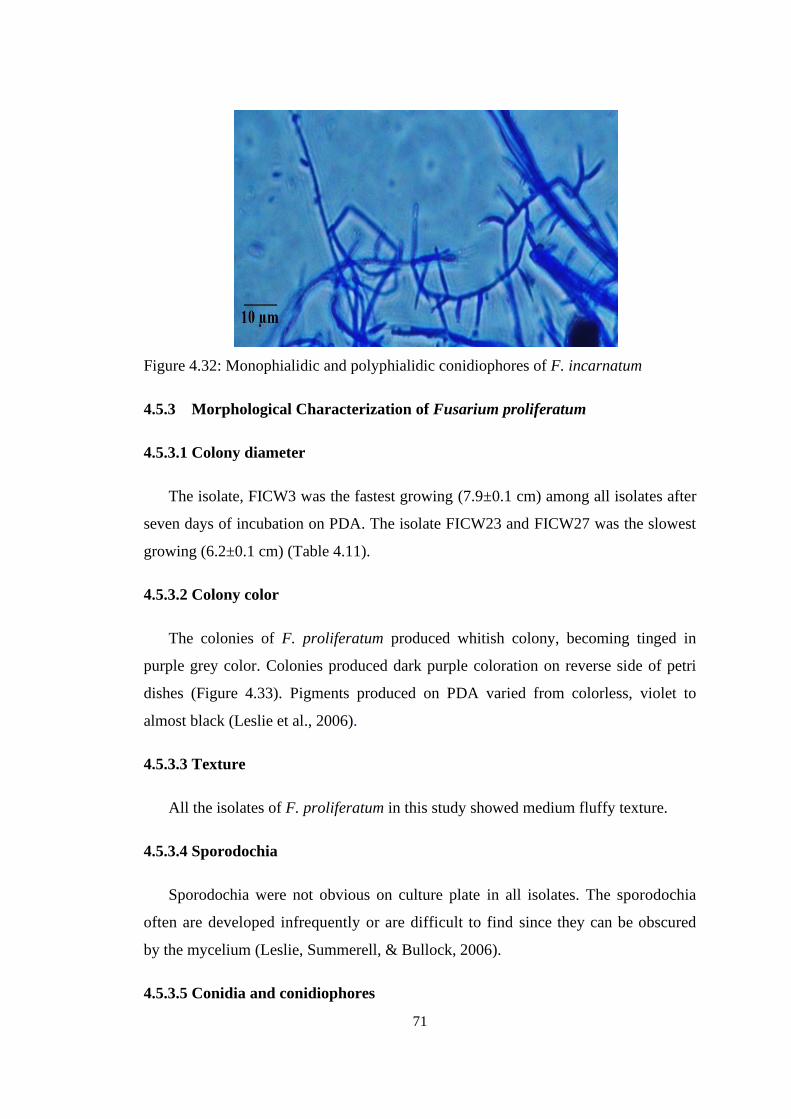
71
Figure 4.32: Monophialidic and polyphialidic conidiophores of F. incarnatum
4.5.3 Morphological Characterization of Fusarium proliferatum
4.5.3.1 Colony diameter
The isolate, FICW3 was the fastest growing (7.9±0.1 cm) among all isolates after
seven days of incubation on PDA. The isolate FICW23 and FICW27 was the slowest
growing (6.2±0.1 cm) (Table 4.11).
4.5.3.2 Colony color
The colonies of F. proliferatum produced whitish colony, becoming tinged in
purple grey color. Colonies produced dark purple coloration on reverse side of petri
dishes (Figure 4.33). Pigments produced on PDA varied from colorless, violet to
almost black (Leslie et al., 2006).
4.5.3.3 Texture
All the isolates of F. proliferatum in this study showed medium fluffy texture.
4.5.3.4 Sporodochia
Sporodochia were not obvious on culture plate in all isolates. The sporodochia
often are developed infrequently or are difficult to find since they can be obscured
by the mycelium (Leslie, Summerell, & Bullock, 2006).
4.5.3.5 Conidia and conidiophores
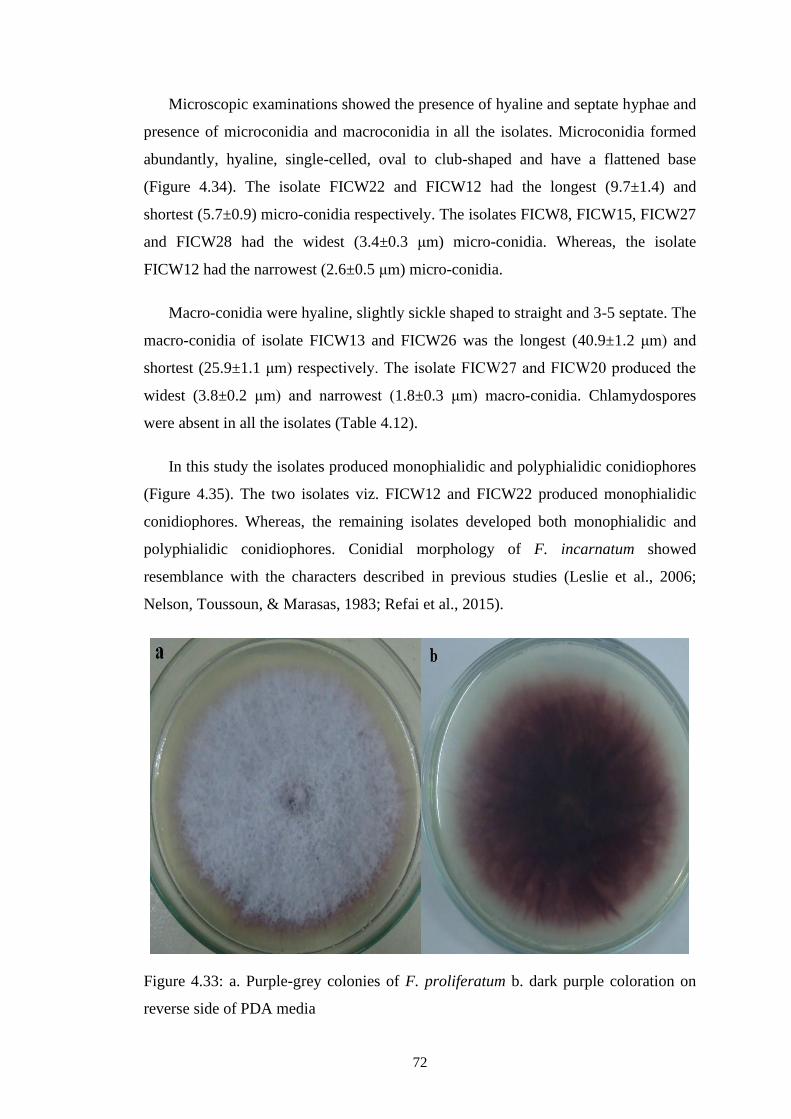
72
Microscopic examinations showed the presence of hyaline and septate hyphae and
presence of microconidia and macroconidia in all the isolates. Microconidia formed
abundantly, hyaline, single-celled, oval to club-shaped and have a flattened base
(Figure 4.34). The isolate FICW22 and FICW12 had the longest (9.7±1.4) and
shortest (5.7±0.9) micro-conidia respectively. The isolates FICW8, FICW15, FICW27
and FICW28 had the widest (3.4±0.3 μm) micro-conidia. Whereas, the isolate
FICW12 had the narrowest (2.6±0.5 μm) micro-conidia.
Macro-conidia were hyaline, slightly sickle shaped to straight and 3-5 septate. The
macro-conidia of isolate FICW13 and FICW26 was the longest (40.9±1.2 μm) and
shortest (25.9±1.1 μm) respectively. The isolate FICW27 and FICW20 produced the
widest (3.8±0.2 μm) and narrowest (1.8±0.3 μm) macro-conidia. Chlamydospores
were absent in all the isolates (Table 4.12).
In this study the isolates produced monophialidic and polyphialidic conidiophores
(Figure 4.35). The two isolates viz. FICW12 and FICW22 produced monophialidic
conidiophores. Whereas, the remaining isolates developed both monophialidic and
polyphialidic conidiophores. Conidial morphology of F. incarnatum showed
resemblance with the characters described in previous studies (Leslie et al., 2006;
Nelson, Toussoun, & Marasas, 1983; Refai et al., 2015).
Figure 4.33: a. Purple-grey colonies of F. proliferatum b. dark purple coloration on
reverse side of PDA media
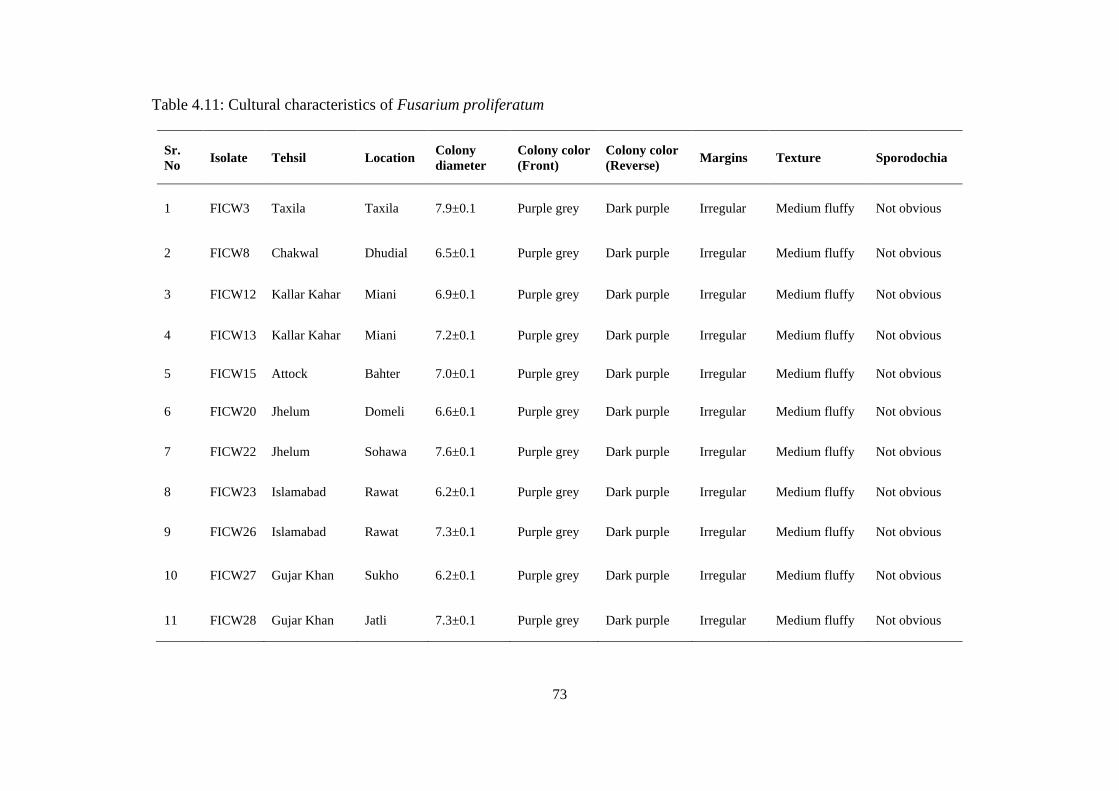
73
Table 4.11: Cultural characteristics of Fusarium proliferatum
Sr.
No Isolate Tehsil Location
Colony
diameter
Colony color
(Front)
Colony color
(Reverse) Margins Texture Sporodochia
1 FICW3 Taxila Taxila 7.9±0.1 Purple grey Dark purple Irregular Medium fluffy Not obvious
2 FICW8 Chakwal Dhudial 6.5±0.1 Purple grey Dark purple Irregular Medium fluffy Not obvious
3 FICW12 Kallar Kahar Miani 6.9±0.1 Purple grey Dark purple Irregular Medium fluffy Not obvious
4 FICW13 Kallar Kahar Miani 7.2±0.1 Purple grey Dark purple Irregular Medium fluffy Not obvious
5 FICW15 Attock Bahter 7.0±0.1 Purple grey Dark purple Irregular Medium fluffy Not obvious
6 FICW20 Jhelum Domeli 6.6±0.1 Purple grey Dark purple Irregular Medium fluffy Not obvious
7 FICW22 Jhelum Sohawa 7.6±0.1 Purple grey Dark purple Irregular Medium fluffy Not obvious
8 FICW23 Islamabad Rawat 6.2±0.1 Purple grey Dark purple Irregular Medium fluffy Not obvious
9 FICW26 Islamabad Rawat 7.3±0.1 Purple grey Dark purple Irregular Medium fluffy Not obvious
10 FICW27 Gujar Khan Sukho 6.2±0.1 Purple grey Dark purple Irregular Medium fluffy Not obvious
11 FICW28 Gujar Khan Jatli 7.3±0.1 Purple grey Dark purple Irregular Medium fluffy Not obvious
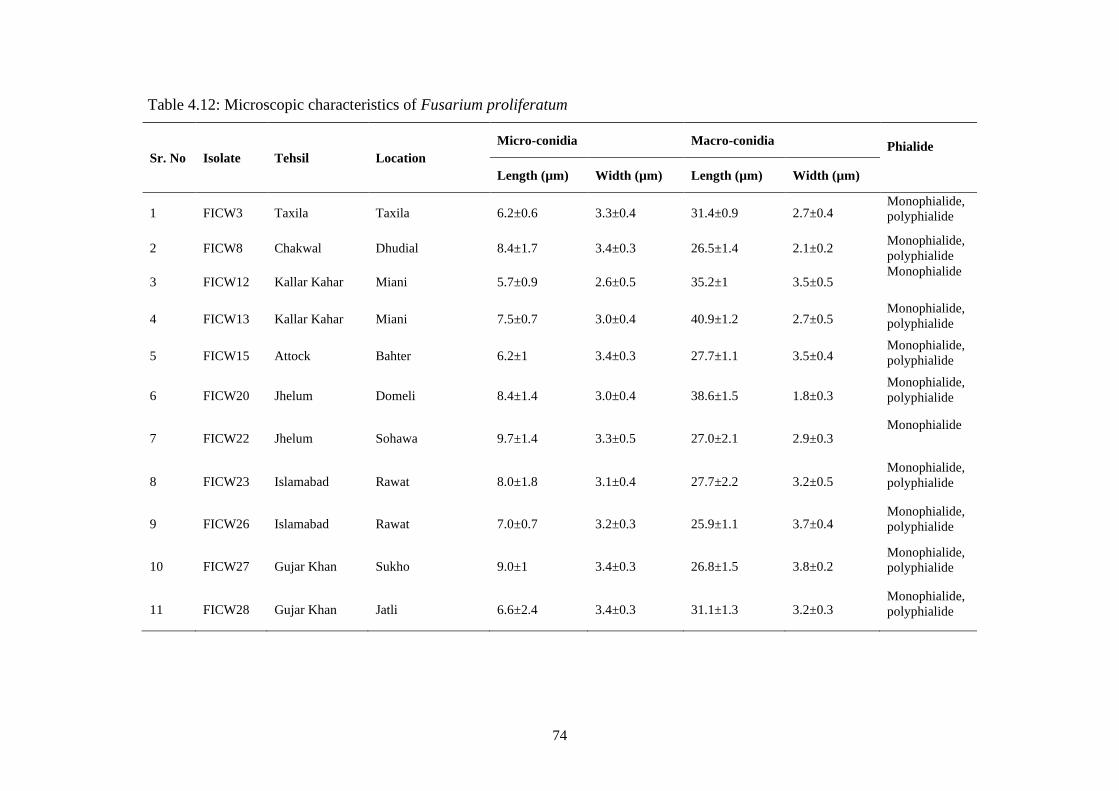
74
Table 4.12: Microscopic characteristics of Fusarium proliferatum
Sr. No Isolate Tehsil Location
Micro-conidia Macro-conidia
Phialide
Length (µm) Width (µm) Length (µm) Width (µm)
1 FICW3 Taxila Taxila 6.2±0.6 3.3±0.4 31.4±0.9 2.7±0.4 Monophialide,
polyphialide
2 FICW8 Chakwal Dhudial 8.4±1.7 3.4±0.3 26.5±1.4 2.1±0.2 Monophialide,
polyphialide
3 FICW12 Kallar Kahar Miani 5.7±0.9 2.6±0.5 35.2±1 3.5±0.5 Monophialide
4 FICW13 Kallar Kahar Miani 7.5±0.7 3.0±0.4 40.9±1.2 2.7±0.5 Monophialide,
polyphialide
5 FICW15 Attock Bahter 6.2±1 3.4±0.3 27.7±1.1 3.5±0.4 Monophialide,
polyphialide
6 FICW20 Jhelum Domeli 8.4±1.4 3.0±0.4 38.6±1.5 1.8±0.3 Monophialide,
polyphialide
7 FICW22 Jhelum Sohawa 9.7±1.4 3.3±0.5 27.0±2.1 2.9±0.3 Monophialide
8 FICW23 Islamabad Rawat 8.0±1.8 3.1±0.4 27.7±2.2 3.2±0.5 Monophialide,
polyphialide
9 FICW26 Islamabad Rawat 7.0±0.7 3.2±0.3 25.9±1.1 3.7±0.4 Monophialide,
polyphialide
10 FICW27 Gujar Khan Sukho 9.0±1 3.4±0.3 26.8±1.5 3.8±0.2 Monophialide,
polyphialide
11 FICW28 Gujar Khan Jatli 6.6±2.4 3.4±0.3 31.1±1.3 3.2±0.3 Monophialide,
polyphialide
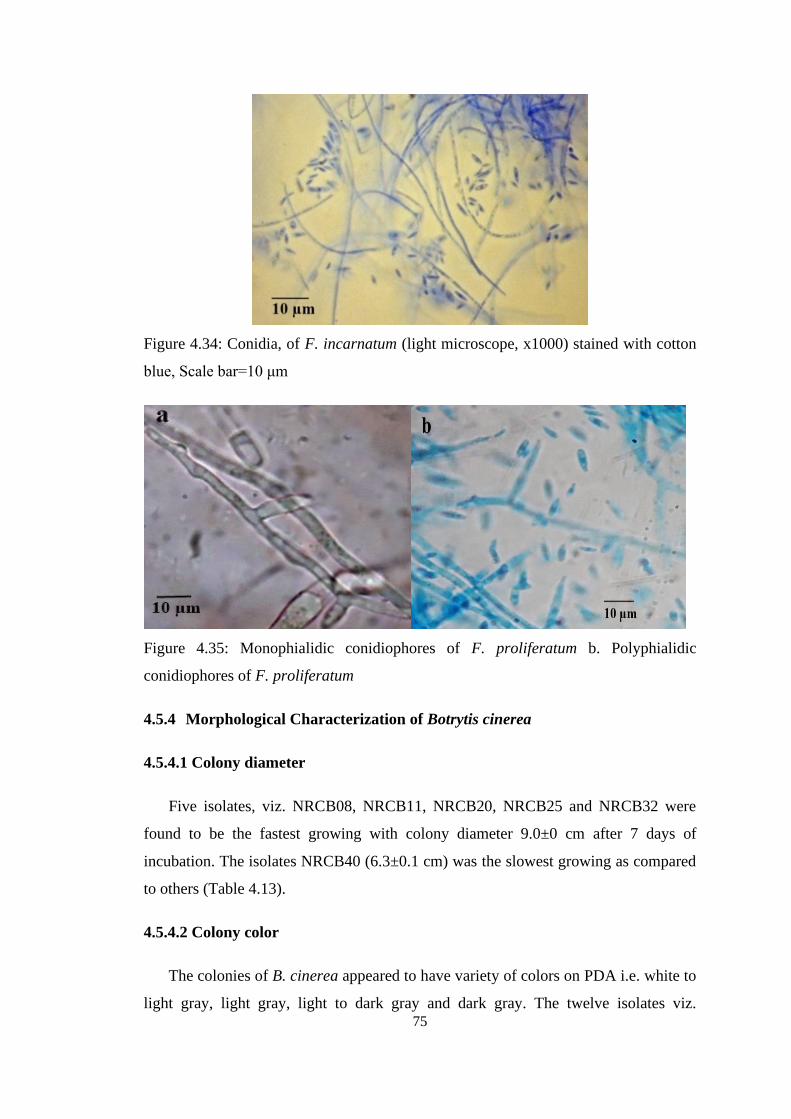
75
Figure 4.34: Conidia, of F. incarnatum (light microscope, x1000) stained with cotton
blue, Scale bar=10 μm
Figure 4.35: Monophialidic conidiophores of F. proliferatum b. Polyphialidic
conidiophores of F. proliferatum
4.5.4 Morphological Characterization of Botrytis cinerea
4.5.4.1 Colony diameter
Five isolates, viz. NRCB08, NRCB11, NRCB20, NRCB25 and NRCB32 were
found to be the fastest growing with colony diameter 9.0±0 cm after 7 days of
incubation. The isolates NRCB40 (6.3±0.1 cm) was the slowest growing as compared
to others (Table 4.13).
4.5.4.2 Colony color
The colonies of B. cinerea appeared to have variety of colors on PDA i.e. white to
light gray, light gray, light to dark gray and dark gray. The twelve isolates viz.
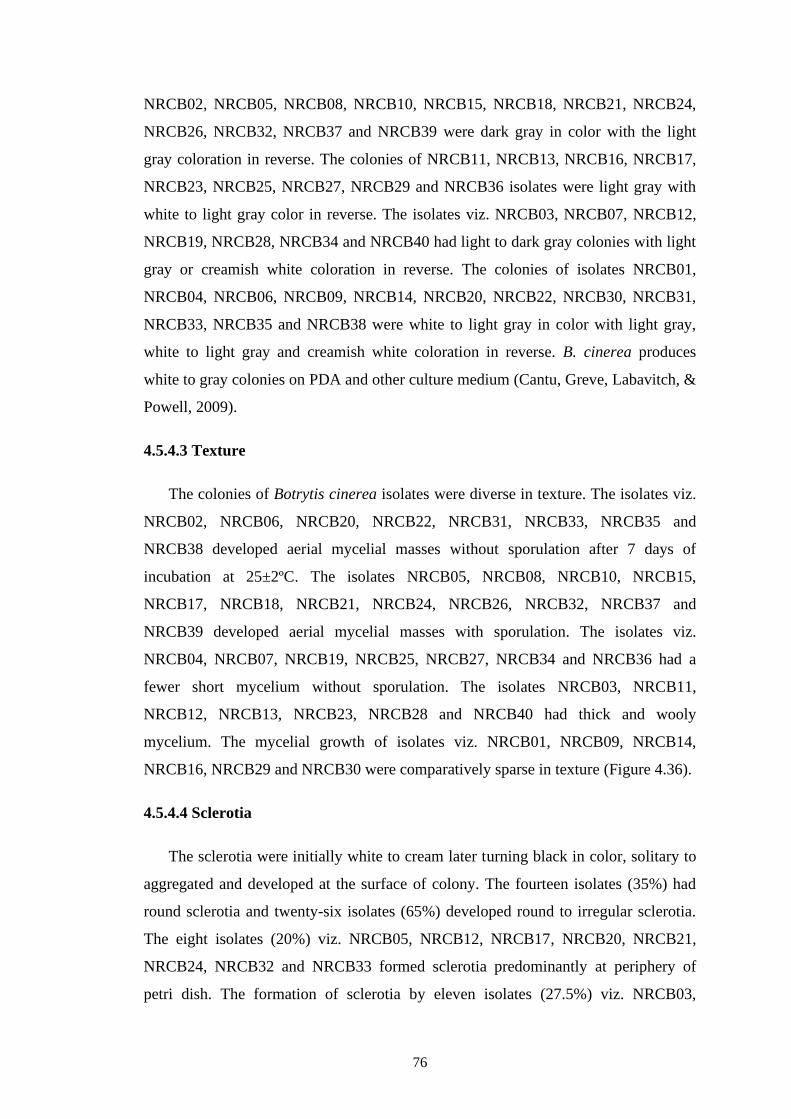
76
NRCB02, NRCB05, NRCB08, NRCB10, NRCB15, NRCB18, NRCB21, NRCB24,
NRCB26, NRCB32, NRCB37 and NRCB39 were dark gray in color with the light
gray coloration in reverse. The colonies of NRCB11, NRCB13, NRCB16, NRCB17,
NRCB23, NRCB25, NRCB27, NRCB29 and NRCB36 isolates were light gray with
white to light gray color in reverse. The isolates viz. NRCB03, NRCB07, NRCB12,
NRCB19, NRCB28, NRCB34 and NRCB40 had light to dark gray colonies with light
gray or creamish white coloration in reverse. The colonies of isolates NRCB01,
NRCB04, NRCB06, NRCB09, NRCB14, NRCB20, NRCB22, NRCB30, NRCB31,
NRCB33, NRCB35 and NRCB38 were white to light gray in color with light gray,
white to light gray and creamish white coloration in reverse. B. cinerea produces
white to gray colonies on PDA and other culture medium (Cantu, Greve, Labavitch, &
Powell, 2009).
4.5.4.3 Texture
The colonies of Botrytis cinerea isolates were diverse in texture. The isolates viz.
NRCB02, NRCB06, NRCB20, NRCB22, NRCB31, NRCB33, NRCB35 and
NRCB38 developed aerial mycelial masses without sporulation after 7 days of
incubation at 25±2ºC. The isolates NRCB05, NRCB08, NRCB10, NRCB15,
NRCB17, NRCB18, NRCB21, NRCB24, NRCB26, NRCB32, NRCB37 and
NRCB39 developed aerial mycelial masses with sporulation. The isolates viz.
NRCB04, NRCB07, NRCB19, NRCB25, NRCB27, NRCB34 and NRCB36 had a
fewer short mycelium without sporulation. The isolates NRCB03, NRCB11,
NRCB12, NRCB13, NRCB23, NRCB28 and NRCB40 had thick and wooly
mycelium. The mycelial growth of isolates viz. NRCB01, NRCB09, NRCB14,
NRCB16, NRCB29 and NRCB30 were comparatively sparse in texture (Figure 4.36).
4.5.4.4 Sclerotia
The sclerotia were initially white to cream later turning black in color, solitary to
aggregated and developed at the surface of colony. The fourteen isolates (35%) had
round sclerotia and twenty-six isolates (65%) developed round to irregular sclerotia.
The eight isolates (20%) viz. NRCB05, NRCB12, NRCB17, NRCB20, NRCB21,
NRCB24, NRCB32 and NRCB33 formed sclerotia predominantly at periphery of
petri dish. The formation of sclerotia by eleven isolates (27.5%) viz. NRCB03,
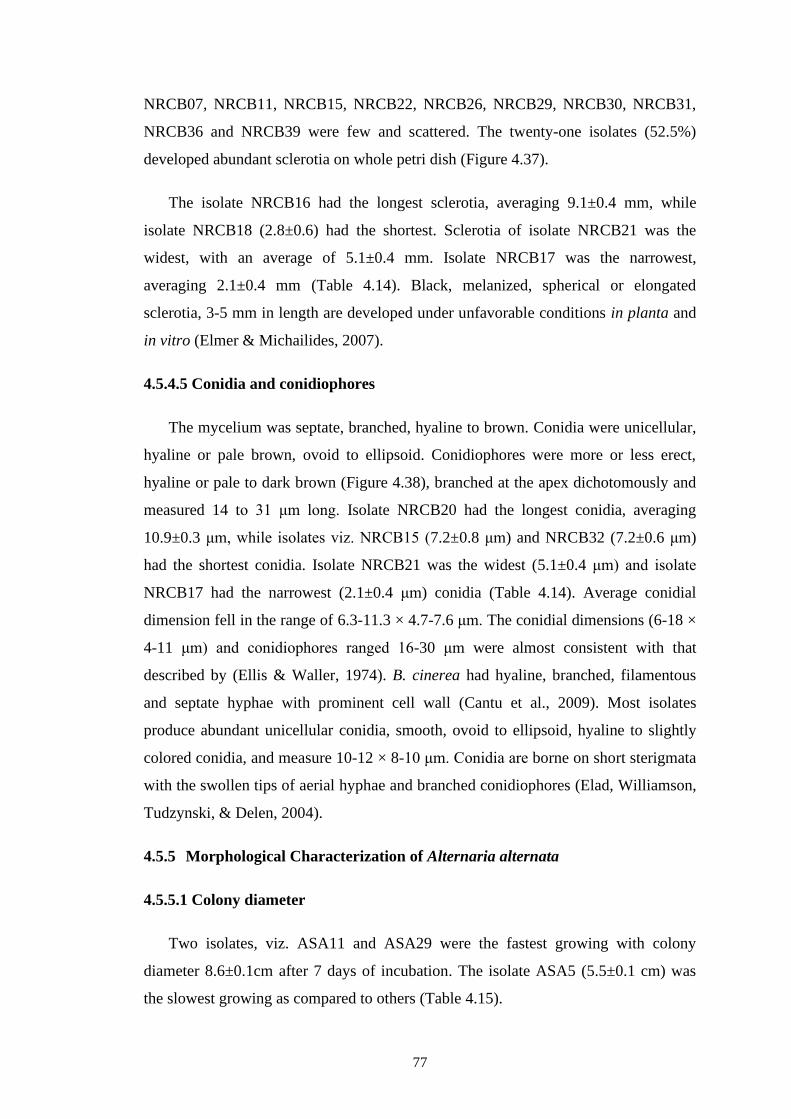
77
NRCB07, NRCB11, NRCB15, NRCB22, NRCB26, NRCB29, NRCB30, NRCB31,
NRCB36 and NRCB39 were few and scattered. The twenty-one isolates (52.5%)
developed abundant sclerotia on whole petri dish (Figure 4.37).
The isolate NRCB16 had the longest sclerotia, averaging 9.1±0.4 mm, while
isolate NRCB18 (2.8±0.6) had the shortest. Sclerotia of isolate NRCB21 was the
widest, with an average of 5.1±0.4 mm. Isolate NRCB17 was the narrowest,
averaging 2.1±0.4 mm (Table 4.14). Black, melanized, spherical or elongated
sclerotia, 3-5 mm in length are developed under unfavorable conditions in planta and
in vitro (Elmer & Michailides, 2007).
4.5.4.5 Conidia and conidiophores
The mycelium was septate, branched, hyaline to brown. Conidia were unicellular,
hyaline or pale brown, ovoid to ellipsoid. Conidiophores were more or less erect,
hyaline or pale to dark brown (Figure 4.38), branched at the apex dichotomously and
measured 14 to 31 μm long. Isolate NRCB20 had the longest conidia, averaging
10.9±0.3 μm, while isolates viz. NRCB15 (7.2±0.8 μm) and NRCB32 (7.2±0.6 μm)
had the shortest conidia. Isolate NRCB21 was the widest (5.1±0.4 μm) and isolate
NRCB17 had the narrowest (2.1±0.4 μm) conidia (Table 4.14). Average conidial
dimension fell in the range of 6.3-11.3 × 4.7-7.6 μm. The conidial dimensions (6-18 ×
4-11 μm) and conidiophores ranged 16-30 μm were almost consistent with that
described by (Ellis & Waller, 1974). B. cinerea had hyaline, branched, filamentous
and septate hyphae with prominent cell wall (Cantu et al., 2009). Most isolates
produce abundant unicellular conidia, smooth, ovoid to ellipsoid, hyaline to slightly
colored conidia, and measure 10-12 × 8-10 μm. Conidia are borne on short sterigmata
with the swollen tips of aerial hyphae and branched conidiophores (Elad, Williamson,
Tudzynski, & Delen, 2004).
4.5.5 Morphological Characterization of Alternaria alternata
4.5.5.1 Colony diameter
Two isolates, viz. ASA11 and ASA29 were the fastest growing with colony
diameter 8.6±0.1cm after 7 days of incubation. The isolate ASA5 (5.5±0.1 cm) was
the slowest growing as compared to others (Table 4.15).
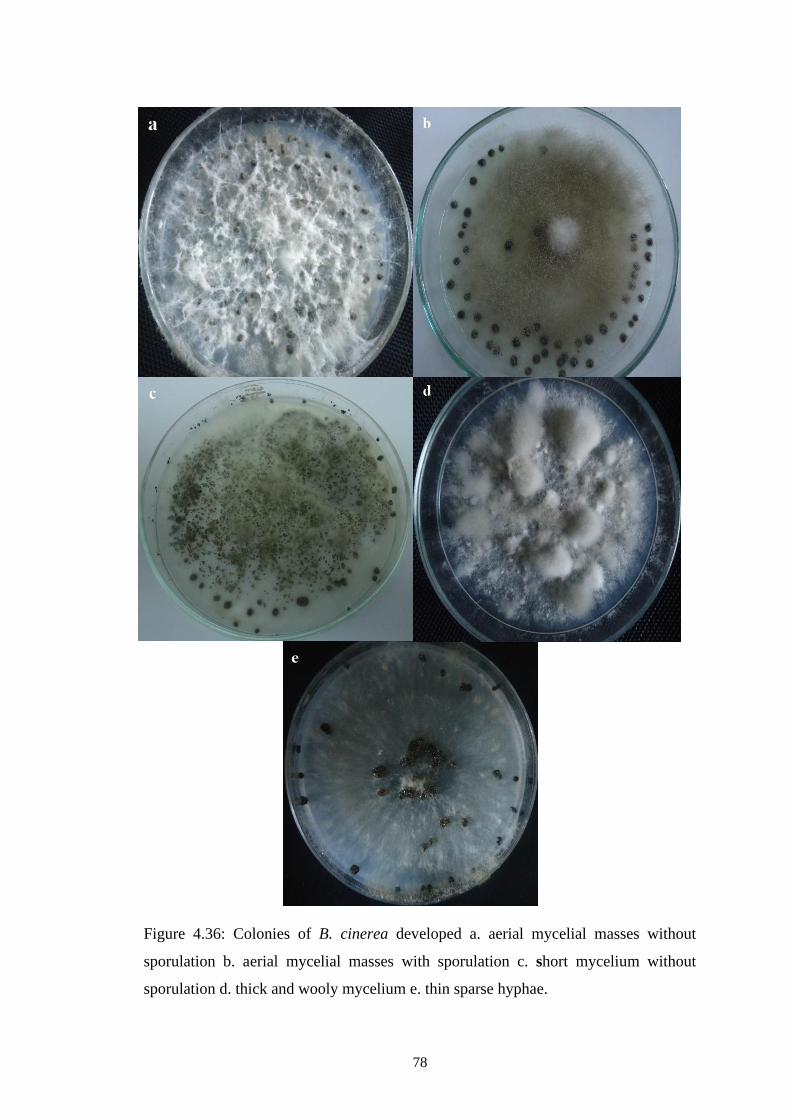
78
Figure 4.36: Colonies of B. cinerea developed a. aerial mycelial masses without
sporulation b. aerial mycelial masses with sporulation c. short mycelium without
sporulation d. thick and wooly mycelium e. thin sparse hyphae.
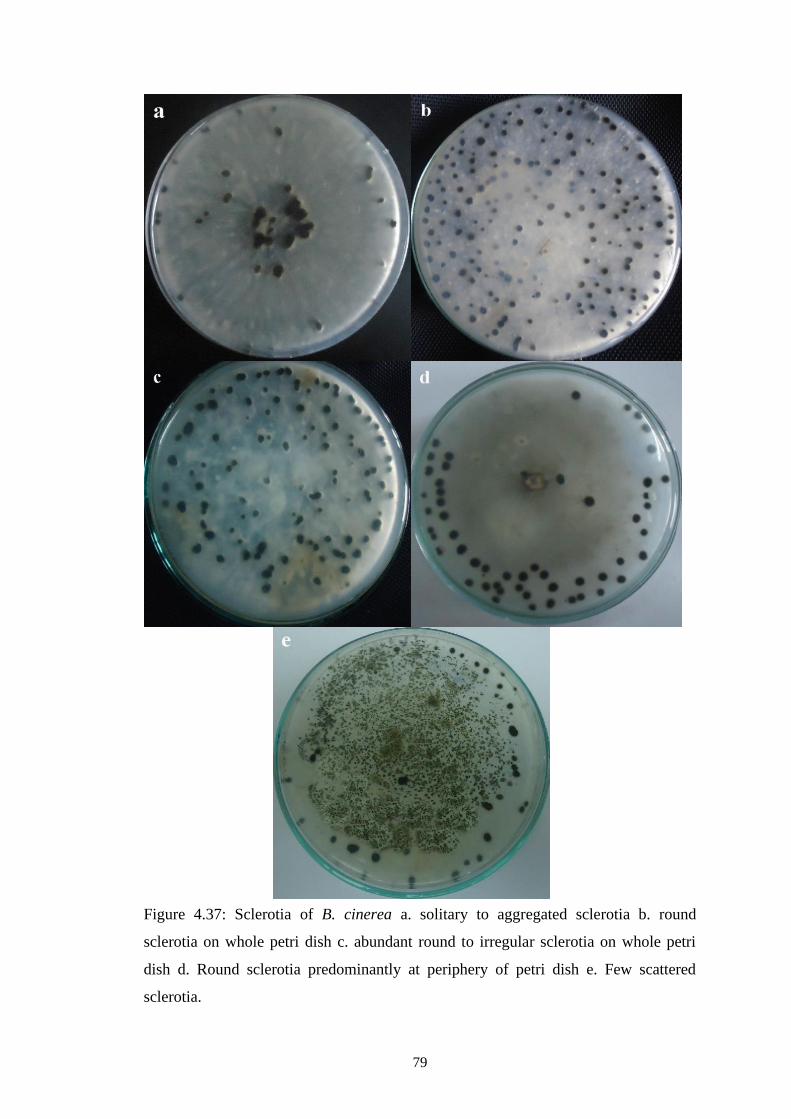
79
Figure 4.37: Sclerotia of B. cinerea a. solitary to aggregated sclerotia b. round
sclerotia on whole petri dish c. abundant round to irregular sclerotia on whole petri
dish d. Round sclerotia predominantly at periphery of petri dish e. Few scattered
sclerotia.
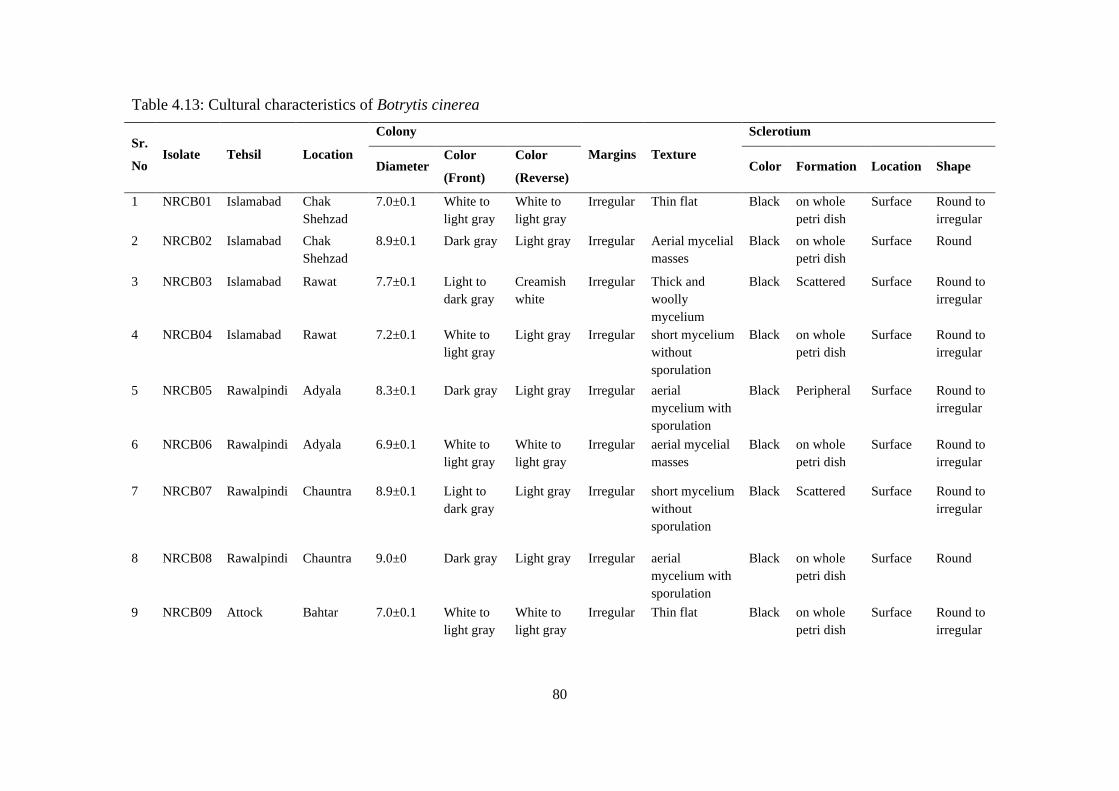
80
Table 4.13: Cultural characteristics of Botrytis cinerea
Sr.
No Isolate Tehsil Location
Colony
Margins Texture
Sclerotium
Diameter Color
(Front)
Color
(Reverse) Color Formation Location Shape
1 NRCB01 Islamabad Chak
Shehzad
7.0±0.1 White to
light gray
White to
light gray
Irregular Thin flat Black on whole
petri dish
Surface Round to
irregular
2 NRCB02 Islamabad Chak
Shehzad
8.9±0.1 Dark gray Light gray Irregular Aerial mycelial
masses
Black on whole
petri dish
Surface Round
3 NRCB03 Islamabad Rawat 7.7±0.1 Light to
dark gray
Creamish
white
Irregular Thick and
woolly
mycelium
Black Scattered Surface Round to
irregular
4 NRCB04 Islamabad Rawat 7.2±0.1 White to
light gray
Light gray Irregular short mycelium
without
sporulation
Black on whole
petri dish
Surface Round to
irregular
5 NRCB05 Rawalpindi Adyala 8.3±0.1 Dark gray Light gray Irregular aerial
mycelium with
sporulation
Black Peripheral Surface Round to
irregular
6 NRCB06 Rawalpindi Adyala 6.9±0.1 White to
light gray
White to
light gray
Irregular aerial mycelial
masses
Black on whole
petri dish
Surface Round to
irregular
7 NRCB07 Rawalpindi Chauntra 8.9±0.1 Light to
dark gray
Light gray Irregular short mycelium
without
sporulation
Black Scattered Surface Round to
irregular
8 NRCB08 Rawalpindi Chauntra 9.0±0 Dark gray Light gray Irregular aerial
mycelium with
sporulation
Black on whole
petri dish
Surface Round
9 NRCB09 Attock Bahtar 7.0±0.1 White to
light gray
White to
light gray
Irregular Thin flat Black on whole
petri dish
Surface Round to
irregular
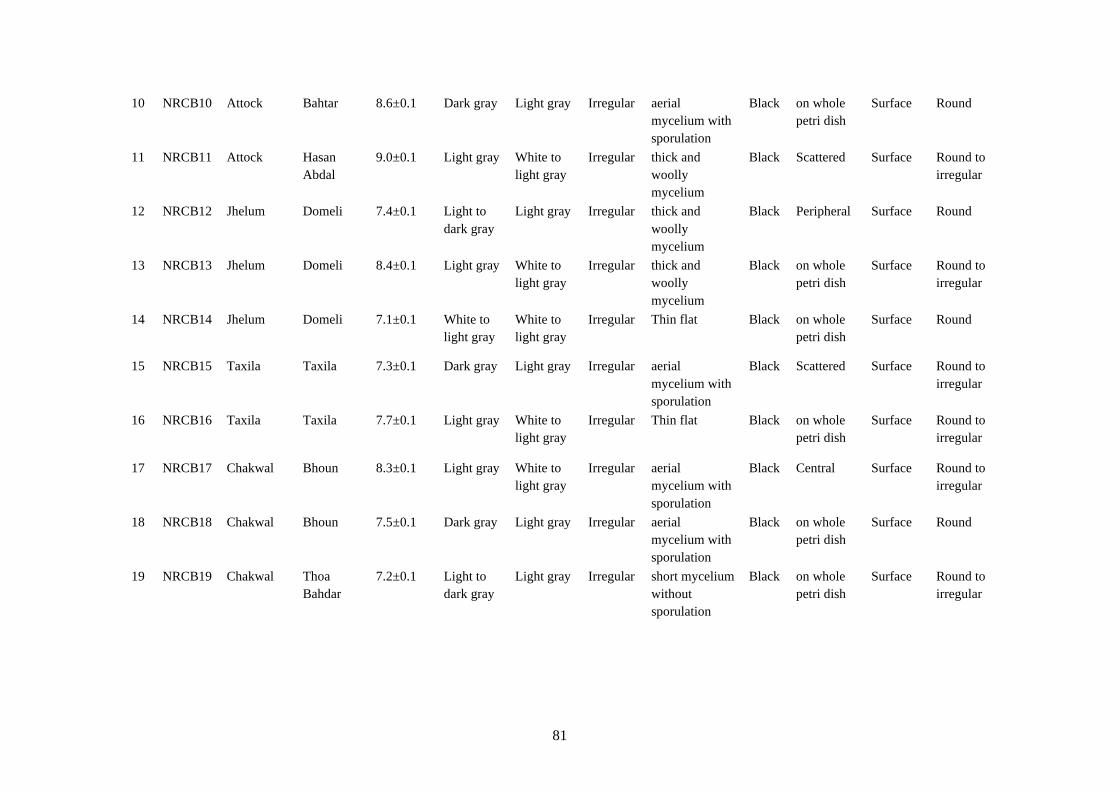
81
10 NRCB10 Attock Bahtar 8.6±0.1 Dark gray Light gray Irregular aerial
mycelium with
sporulation
Black on whole
petri dish
Surface Round
11 NRCB11 Attock Hasan
Abdal
9.0±0.1 Light gray White to
light gray
Irregular thick and
woolly
mycelium
Black Scattered Surface Round to
irregular
12 NRCB12 Jhelum Domeli 7.4±0.1 Light to
dark gray
Light gray Irregular thick and
woolly
mycelium
Black Peripheral Surface Round
13 NRCB13 Jhelum Domeli 8.4±0.1 Light gray White to
light gray
Irregular thick and
woolly
mycelium
Black on whole
petri dish
Surface Round to
irregular
14 NRCB14 Jhelum Domeli 7.1±0.1 White to
light gray
White to
light gray
Irregular Thin flat Black on whole
petri dish
Surface Round
15 NRCB15 Taxila Taxila 7.3±0.1 Dark gray Light gray Irregular aerial
mycelium with
sporulation
Black Scattered Surface Round to
irregular
16 NRCB16 Taxila Taxila 7.7±0.1 Light gray White to
light gray
Irregular Thin flat Black on whole
petri dish
Surface Round to
irregular
17 NRCB17 Chakwal Bhoun 8.3±0.1 Light gray White to
light gray
Irregular aerial
mycelium with
sporulation
Black Central Surface Round to
irregular
18 NRCB18 Chakwal Bhoun 7.5±0.1 Dark gray Light gray Irregular aerial
mycelium with
sporulation
Black on whole
petri dish
Surface Round
19 NRCB19 Chakwal Thoa
Bahdar
7.2±0.1 Light to
dark gray
Light gray Irregular short mycelium
without
sporulation
Black on whole
petri dish
Surface Round to
irregular
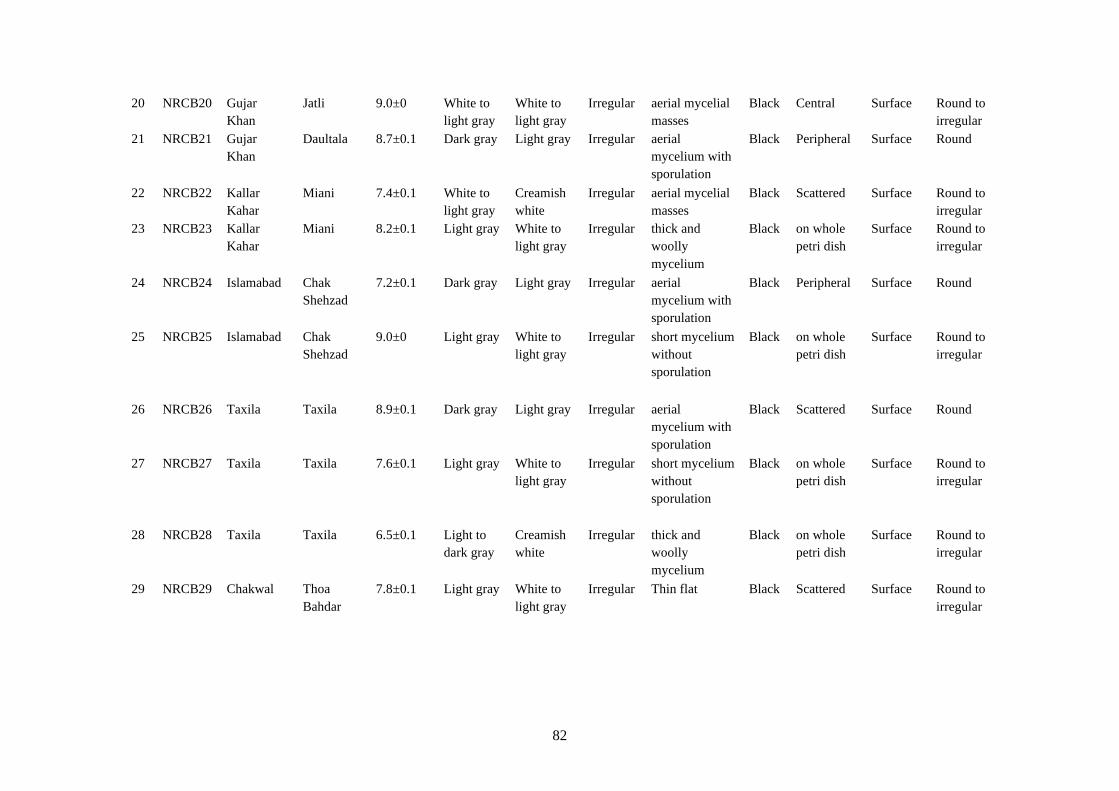
82
20 NRCB20 Gujar
Khan
Jatli 9.0±0 White to
light gray
White to
light gray
Irregular aerial mycelial
masses
Black Central Surface Round to
irregular
21 NRCB21 Gujar
Khan
Daultala 8.7±0.1 Dark gray Light gray Irregular aerial
mycelium with
sporulation
Black Peripheral Surface Round
22 NRCB22 Kallar
Kahar
Miani 7.4±0.1 White to
light gray
Creamish
white
Irregular aerial mycelial
masses
Black Scattered Surface Round to
irregular
23 NRCB23 Kallar
Kahar
Miani 8.2±0.1 Light gray White to
light gray
Irregular thick and
woolly
mycelium
Black on whole
petri dish
Surface Round to
irregular
24 NRCB24 Islamabad Chak
Shehzad
7.2±0.1 Dark gray Light gray Irregular aerial
mycelium with
sporulation
Black Peripheral Surface Round
25 NRCB25 Islamabad Chak
Shehzad
9.0±0 Light gray White to
light gray
Irregular short mycelium
without
sporulation
Black on whole
petri dish
Surface Round to
irregular
26 NRCB26 Taxila Taxila 8.9±0.1 Dark gray Light gray Irregular aerial
mycelium with
sporulation
Black Scattered Surface Round
27 NRCB27 Taxila Taxila 7.6±0.1 Light gray White to
light gray
Irregular short mycelium
without
sporulation
Black on whole
petri dish
Surface Round to
irregular
28 NRCB28 Taxila Taxila 6.5±0.1 Light to
dark gray
Creamish
white
Irregular thick and
woolly
mycelium
Black on whole
petri dish
Surface Round to
irregular
29 NRCB29 Chakwal Thoa
Bahdar
7.8±0.1 Light gray White to
light gray
Irregular Thin flat Black Scattered Surface Round to
irregular
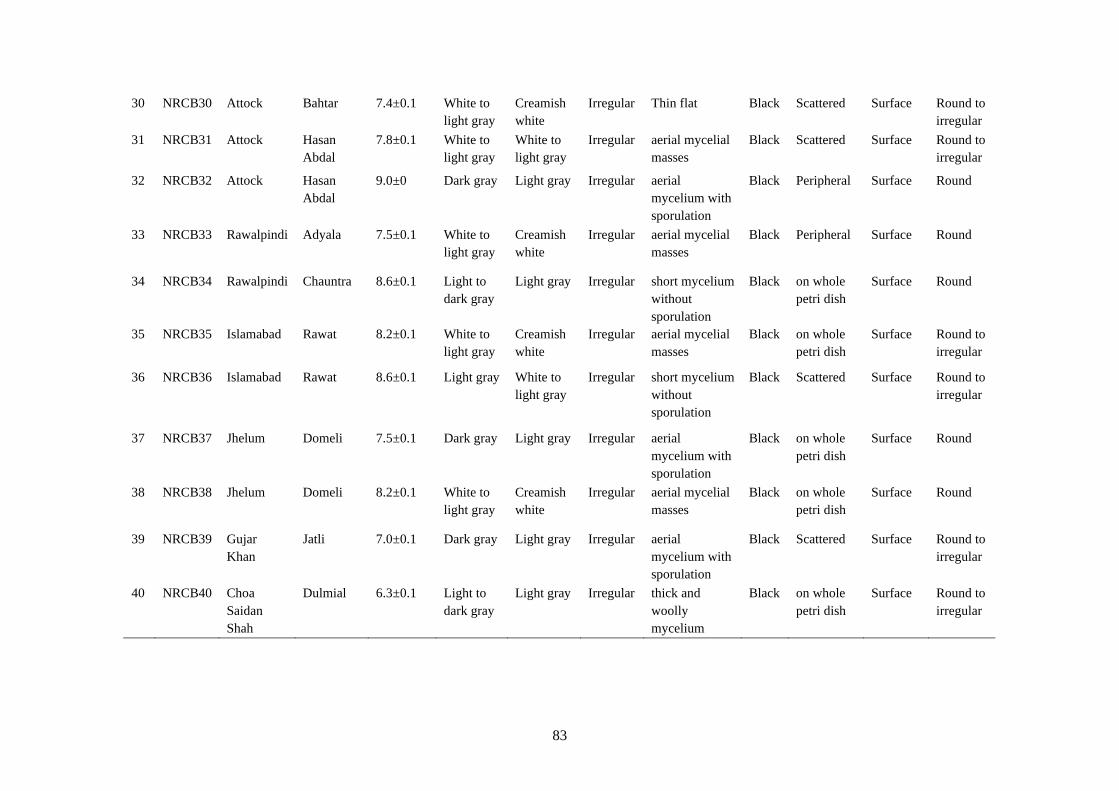
83
30 NRCB30 Attock Bahtar 7.4±0.1 White to
light gray
Creamish
white
Irregular Thin flat Black Scattered Surface Round to
irregular
31 NRCB31 Attock Hasan
Abdal
7.8±0.1 White to
light gray
White to
light gray
Irregular aerial mycelial
masses
Black Scattered Surface Round to
irregular
32 NRCB32 Attock Hasan
Abdal
9.0±0 Dark gray Light gray Irregular aerial
mycelium with
sporulation
Black Peripheral Surface Round
33 NRCB33 Rawalpindi Adyala 7.5±0.1 White to
light gray
Creamish
white
Irregular aerial mycelial
masses
Black Peripheral Surface Round
34 NRCB34 Rawalpindi Chauntra 8.6±0.1 Light to
dark gray
Light gray Irregular short mycelium
without
sporulation
Black on whole
petri dish
Surface Round
35 NRCB35 Islamabad Rawat 8.2±0.1 White to
light gray
Creamish
white
Irregular aerial mycelial
masses
Black on whole
petri dish
Surface Round to
irregular
36 NRCB36 Islamabad Rawat 8.6±0.1 Light gray White to
light gray
Irregular short mycelium
without
sporulation
Black Scattered Surface Round to
irregular
37 NRCB37 Jhelum Domeli 7.5±0.1 Dark gray Light gray Irregular aerial
mycelium with
sporulation
Black on whole
petri dish
Surface Round
38 NRCB38 Jhelum Domeli 8.2±0.1 White to
light gray
Creamish
white
Irregular aerial mycelial
masses
Black on whole
petri dish
Surface Round
39 NRCB39 Gujar
Khan
Jatli 7.0±0.1 Dark gray Light gray Irregular aerial
mycelium with
sporulation
Black Scattered Surface Round to
irregular
40 NRCB40 Choa
Saidan
Shah
Dulmial 6.3±0.1 Light to
dark gray
Light gray Irregular thick and
woolly
mycelium
Black on whole
petri dish
Surface Round to
irregular
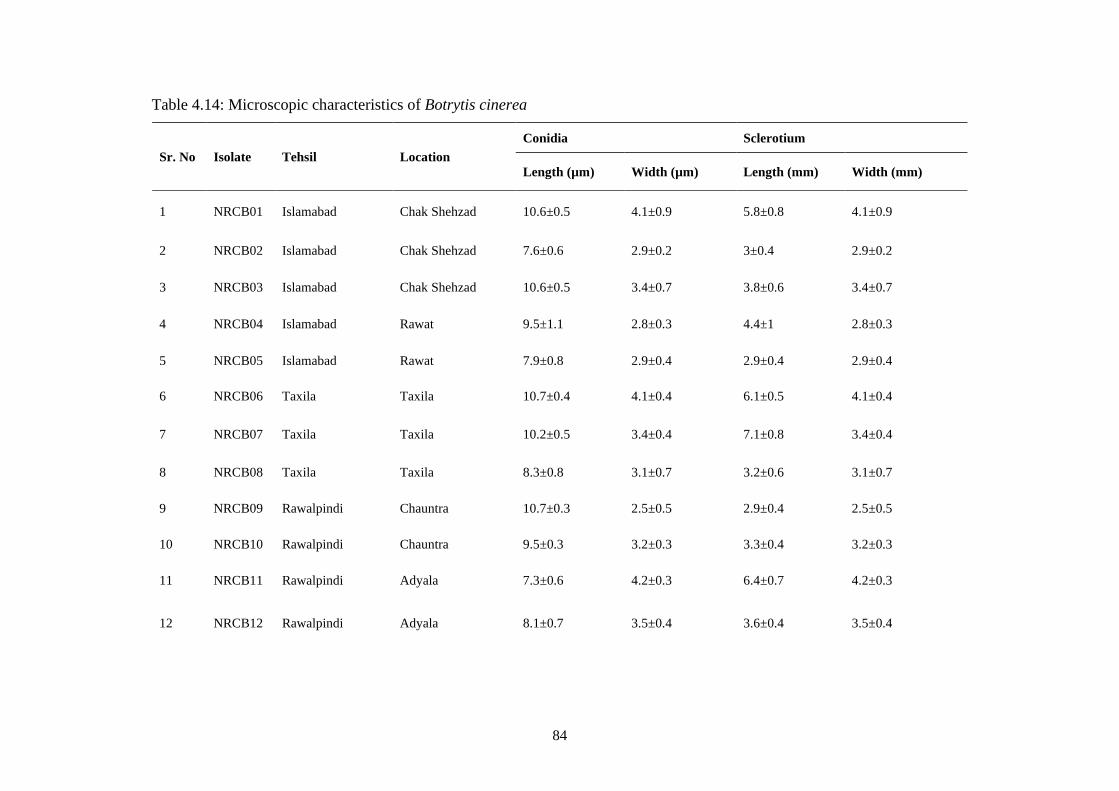
84
Table 4.14: Microscopic characteristics of Botrytis cinerea
Sr. No Isolate Tehsil Location
Conidia Sclerotium
Length (µm) Width (µm) Length (mm) Width (mm)
1 NRCB01 Islamabad Chak Shehzad 10.6±0.5 4.1±0.9 5.8±0.8 4.1±0.9
2 NRCB02 Islamabad Chak Shehzad 7.6±0.6 2.9±0.2 3±0.4 2.9±0.2
3 NRCB03 Islamabad Chak Shehzad 10.6±0.5 3.4±0.7 3.8±0.6 3.4±0.7
4 NRCB04 Islamabad Rawat 9.5±1.1 2.8±0.3 4.4±1 2.8±0.3
5 NRCB05 Islamabad Rawat 7.9±0.8 2.9±0.4 2.9±0.4 2.9±0.4
6 NRCB06 Taxila Taxila 10.7±0.4 4.1±0.4 6.1±0.5 4.1±0.4
7 NRCB07 Taxila Taxila 10.2±0.5 3.4±0.4 7.1±0.8 3.4±0.4
8 NRCB08 Taxila Taxila 8.3±0.8 3.1±0.7 3.2±0.6 3.1±0.7
9 NRCB09 Rawalpindi Chauntra 10.7±0.3 2.5±0.5 2.9±0.4 2.5±0.5
10 NRCB10 Rawalpindi Chauntra 9.5±0.3 3.2±0.3 3.3±0.4 3.2±0.3
11 NRCB11 Rawalpindi Adyala 7.3±0.6 4.2±0.3 6.4±0.7 4.2±0.3
12 NRCB12 Rawalpindi Adyala 8.1±0.7 3.5±0.4 3.6±0.4 3.5±0.4
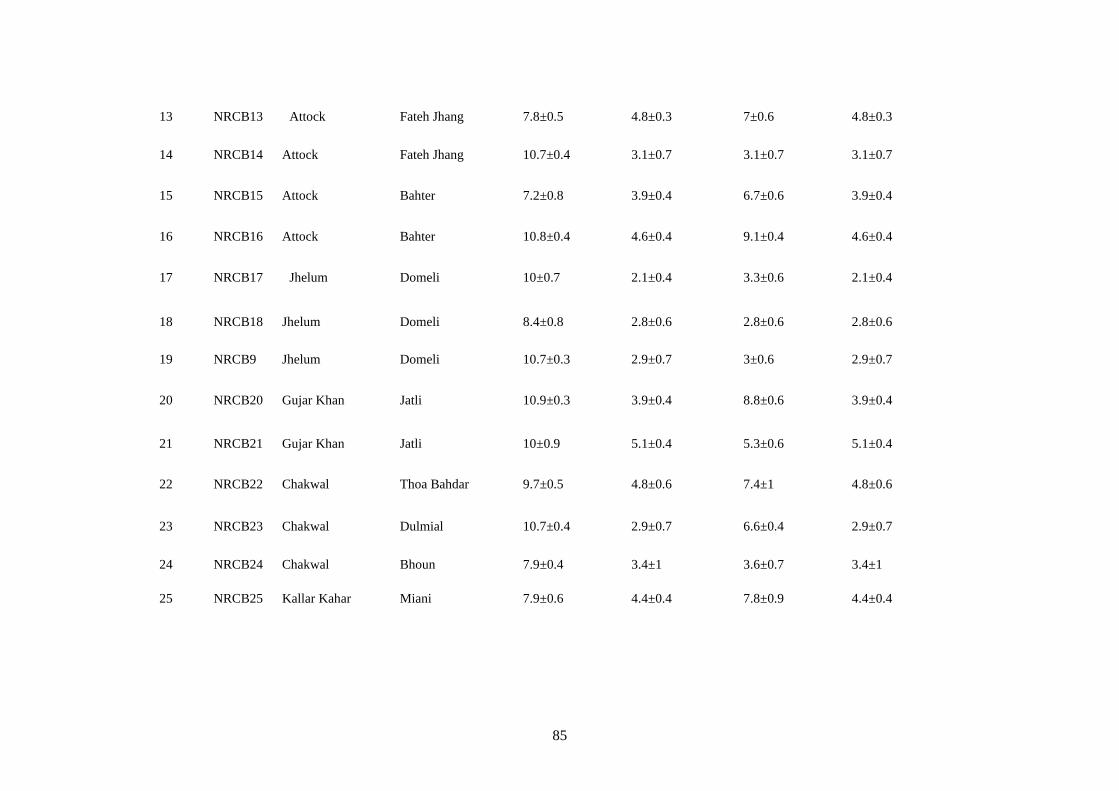
85
13 NRCB13 Attock
Fateh Jhang 7.8±0.5 4.8±0.3 7±0.6 4.8±0.3
14 NRCB14 Attock Fateh Jhang 10.7±0.4 3.1±0.7 3.1±0.7 3.1±0.7
15 NRCB15 Attock Bahter 7.2±0.8 3.9±0.4 6.7±0.6 3.9±0.4
16 NRCB16 Attock Bahter 10.8±0.4 4.6±0.4 9.1±0.4 4.6±0.4
17 NRCB17 Jhelum
Domeli 10±0.7 2.1±0.4 3.3±0.6 2.1±0.4
18 NRCB18 Jhelum Domeli 8.4±0.8 2.8±0.6 2.8±0.6 2.8±0.6
19 NRCB9 Jhelum Domeli 10.7±0.3 2.9±0.7 3±0.6 2.9±0.7
20 NRCB20 Gujar Khan Jatli 10.9±0.3 3.9±0.4 8.8±0.6 3.9±0.4
21 NRCB21 Gujar Khan Jatli 10±0.9 5.1±0.4 5.3±0.6 5.1±0.4
22 NRCB22 Chakwal Thoa Bahdar 9.7±0.5 4.8±0.6 7.4±1 4.8±0.6
23 NRCB23 Chakwal Dulmial 10.7±0.4 2.9±0.7 6.6±0.4 2.9±0.7
24 NRCB24 Chakwal Bhoun 7.9±0.4 3.4±1 3.6±0.7 3.4±1
25 NRCB25 Kallar Kahar Miani 7.9±0.6 4.4±0.4 7.8±0.9 4.4±0.4
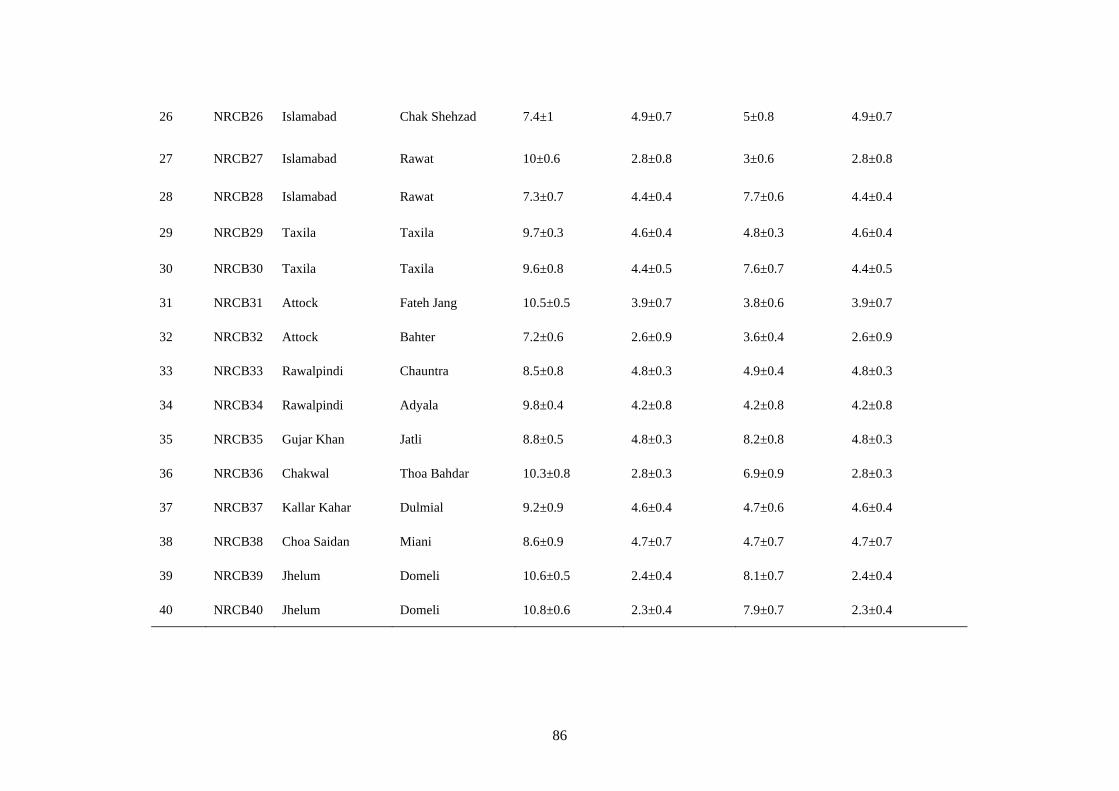
86
26 NRCB26 Islamabad Chak Shehzad 7.4±1 4.9±0.7 5±0.8 4.9±0.7
27 NRCB27 Islamabad Rawat 10±0.6 2.8±0.8 3±0.6 2.8±0.8
28 NRCB28 Islamabad Rawat 7.3±0.7 4.4±0.4 7.7±0.6 4.4±0.4
29 NRCB29 Taxila Taxila 9.7±0.3 4.6±0.4 4.8±0.3 4.6±0.4
30 NRCB30 Taxila Taxila 9.6±0.8 4.4±0.5 7.6±0.7 4.4±0.5
31 NRCB31 Attock Fateh Jang 10.5±0.5 3.9±0.7 3.8±0.6 3.9±0.7
32 NRCB32 Attock Bahter 7.2±0.6 2.6±0.9 3.6±0.4 2.6±0.9
33 NRCB33 Rawalpindi Chauntra 8.5±0.8 4.8±0.3 4.9±0.4 4.8±0.3
34 NRCB34 Rawalpindi Adyala 9.8±0.4 4.2±0.8 4.2±0.8 4.2±0.8
35 NRCB35 Gujar Khan Jatli 8.8±0.5 4.8±0.3 8.2±0.8 4.8±0.3
36 NRCB36 Chakwal Thoa Bahdar 10.3±0.8 2.8±0.3 6.9±0.9 2.8±0.3
37 NRCB37 Kallar Kahar Dulmial 9.2±0.9 4.6±0.4 4.7±0.6 4.6±0.4
38 NRCB38 Choa Saidan Miani 8.6±0.9 4.7±0.7 4.7±0.7 4.7±0.7
39 NRCB39 Jhelum Domeli 10.6±0.5 2.4±0.4 8.1±0.7 2.4±0.4
40 NRCB40 Jhelum Domeli 10.8±0.6 2.3±0.4 7.9±0.7 2.3±0.4
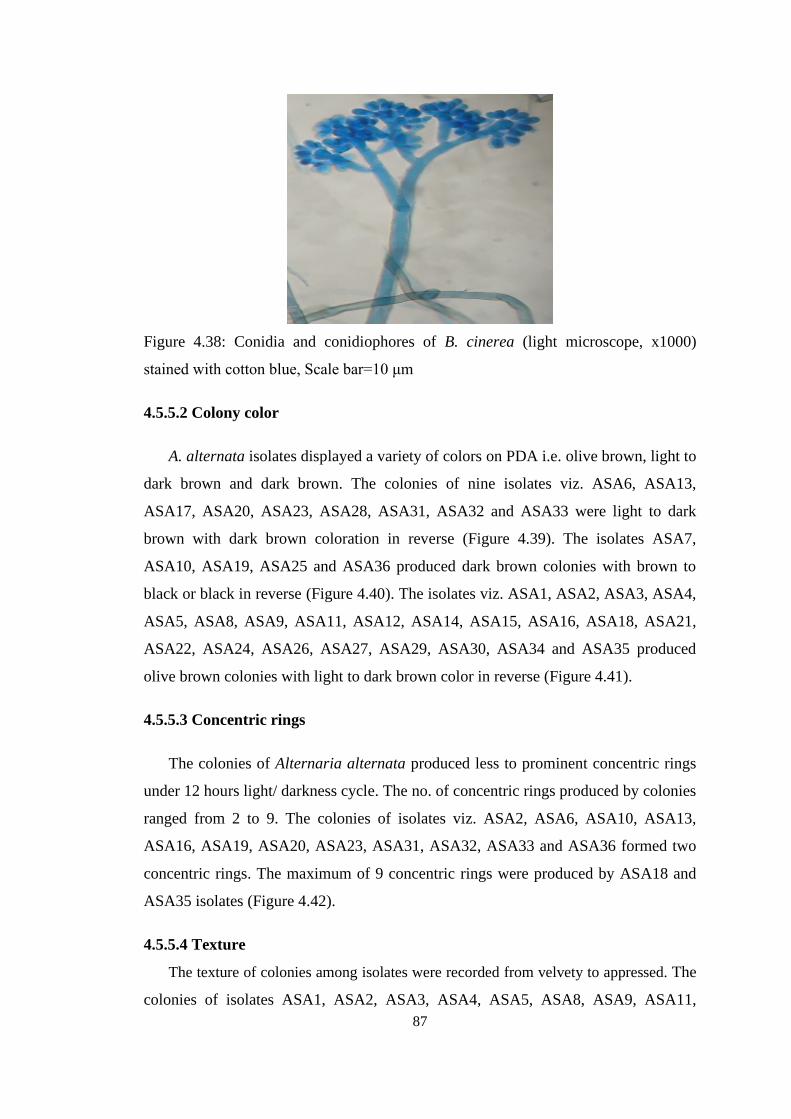
87
Figure 4.38: Conidia and conidiophores of B. cinerea (light microscope, x1000)
stained with cotton blue, Scale bar=10 μm
4.5.5.2 Colony color
A. alternata isolates displayed a variety of colors on PDA i.e. olive brown, light to
dark brown and dark brown. The colonies of nine isolates viz. ASA6, ASA13,
ASA17, ASA20, ASA23, ASA28, ASA31, ASA32 and ASA33 were light to dark
brown with dark brown coloration in reverse (Figure 4.39). The isolates ASA7,
ASA10, ASA19, ASA25 and ASA36 produced dark brown colonies with brown to
black or black in reverse (Figure 4.40). The isolates viz. ASA1, ASA2, ASA3, ASA4,
ASA5, ASA8, ASA9, ASA11, ASA12, ASA14, ASA15, ASA16, ASA18, ASA21,
ASA22, ASA24, ASA26, ASA27, ASA29, ASA30, ASA34 and ASA35 produced
olive brown colonies with light to dark brown color in reverse (Figure 4.41).
4.5.5.3 Concentric rings
The colonies of Alternaria alternata produced less to prominent concentric rings
under 12 hours light/ darkness cycle. The no. of concentric rings produced by colonies
ranged from 2 to 9. The colonies of isolates viz. ASA2, ASA6, ASA10, ASA13,
ASA16, ASA19, ASA20, ASA23, ASA31, ASA32, ASA33 and ASA36 formed two
concentric rings. The maximum of 9 concentric rings were produced by ASA18 and
ASA35 isolates (Figure 4.42).
4.5.5.4 Texture
The texture of colonies among isolates were recorded from velvety to appressed. The
colonies of isolates ASA1, ASA2, ASA3, ASA4, ASA5, ASA8, ASA9, ASA11,
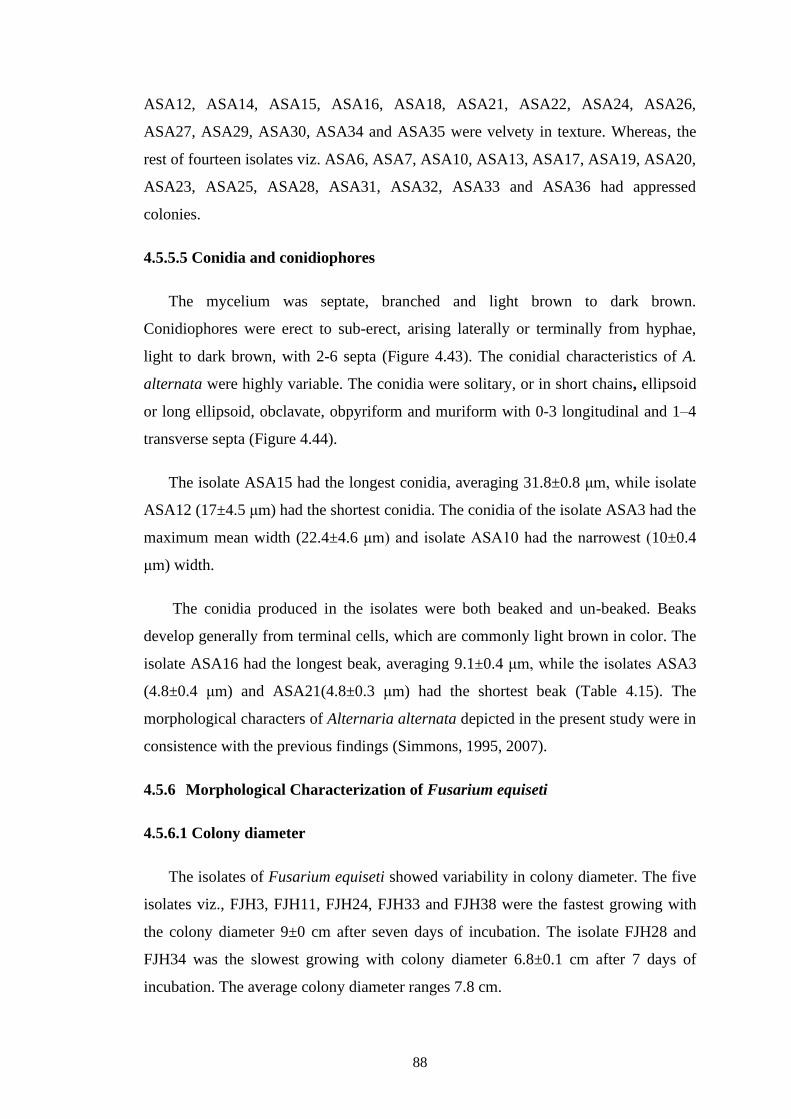
88
ASA12, ASA14, ASA15, ASA16, ASA18, ASA21, ASA22, ASA24, ASA26,
ASA27, ASA29, ASA30, ASA34 and ASA35 were velvety in texture. Whereas, the
rest of fourteen isolates viz. ASA6, ASA7, ASA10, ASA13, ASA17, ASA19, ASA20,
ASA23, ASA25, ASA28, ASA31, ASA32, ASA33 and ASA36 had appressed
colonies.
4.5.5.5 Conidia and conidiophores
The mycelium was septate, branched and light brown to dark brown.
Conidiophores were erect to sub-erect, arising laterally or terminally from hyphae,
light to dark brown, with 2-6 septa (Figure 4.43). The conidial characteristics of A.
alternata were highly variable. The conidia were solitary, or in short chains, ellipsoid
or long ellipsoid, obclavate, obpyriform and muriform with 0-3 longitudinal and 1–4
transverse septa (Figure 4.44).
The isolate ASA15 had the longest conidia, averaging 31.8±0.8 μm, while isolate
ASA12 (17±4.5 μm) had the shortest conidia. The conidia of the isolate ASA3 had the
maximum mean width (22.4±4.6 μm) and isolate ASA10 had the narrowest (10±0.4
μm) width.
The conidia produced in the isolates were both beaked and un-beaked. Beaks
develop generally from terminal cells, which are commonly light brown in color. The
isolate ASA16 had the longest beak, averaging 9.1±0.4 μm, while the isolates ASA3
(4.8±0.4 μm) and ASA21(4.8±0.3 μm) had the shortest beak (Table 4.15). The
morphological characters of Alternaria alternata depicted in the present study were in
consistence with the previous findings (Simmons, 1995, 2007).
4.5.6 Morphological Characterization of Fusarium equiseti
4.5.6.1 Colony diameter
The isolates of Fusarium equiseti showed variability in colony diameter. The five
isolates viz., FJH3, FJH11, FJH24, FJH33 and FJH38 were the fastest growing with
the colony diameter 9±0 cm after seven days of incubation. The isolate FJH28 and
FJH34 was the slowest growing with colony diameter 6.8±0.1 cm after 7 days of
incubation. The average colony diameter ranges 7.8 cm.
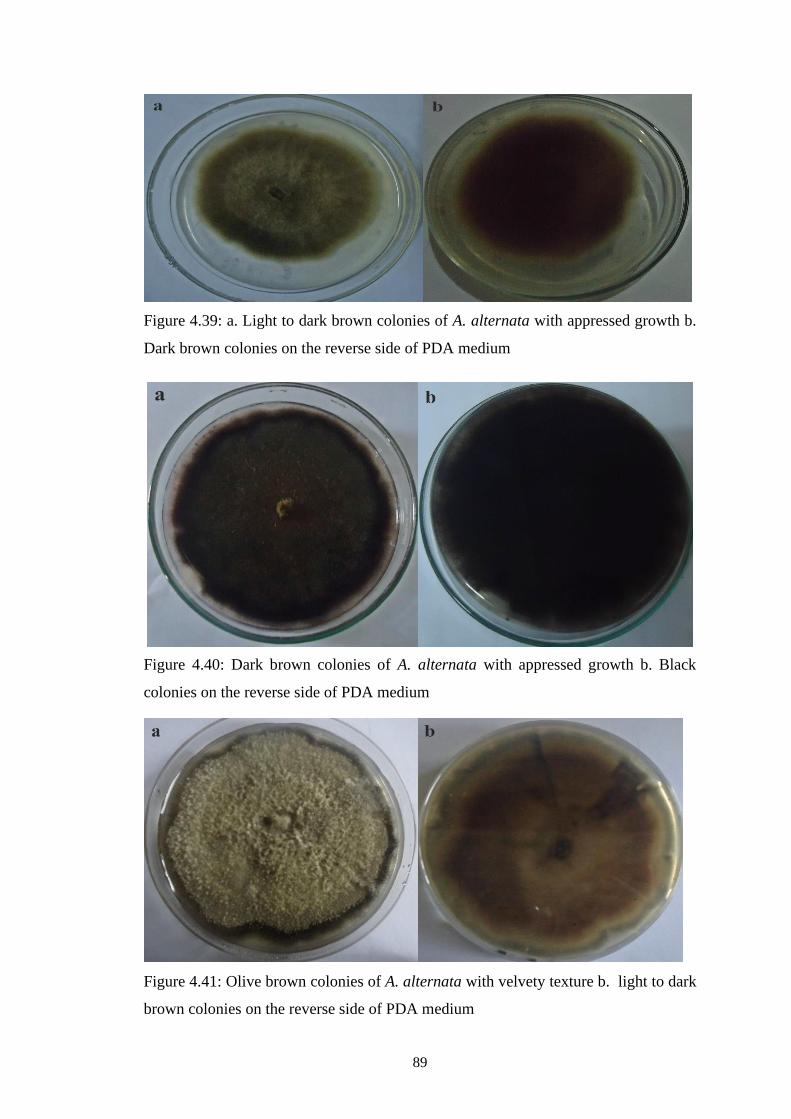
89
Figure 4.39: a. Light to dark brown colonies of A. alternata with appressed growth b.
Dark brown colonies on the reverse side of PDA medium
Figure 4.40: Dark brown colonies of A. alternata with appressed growth b. Black
colonies on the reverse side of PDA medium
Figure 4.41: Olive brown colonies of A. alternata with velvety texture b. light to dark
brown colonies on the reverse side of PDA medium
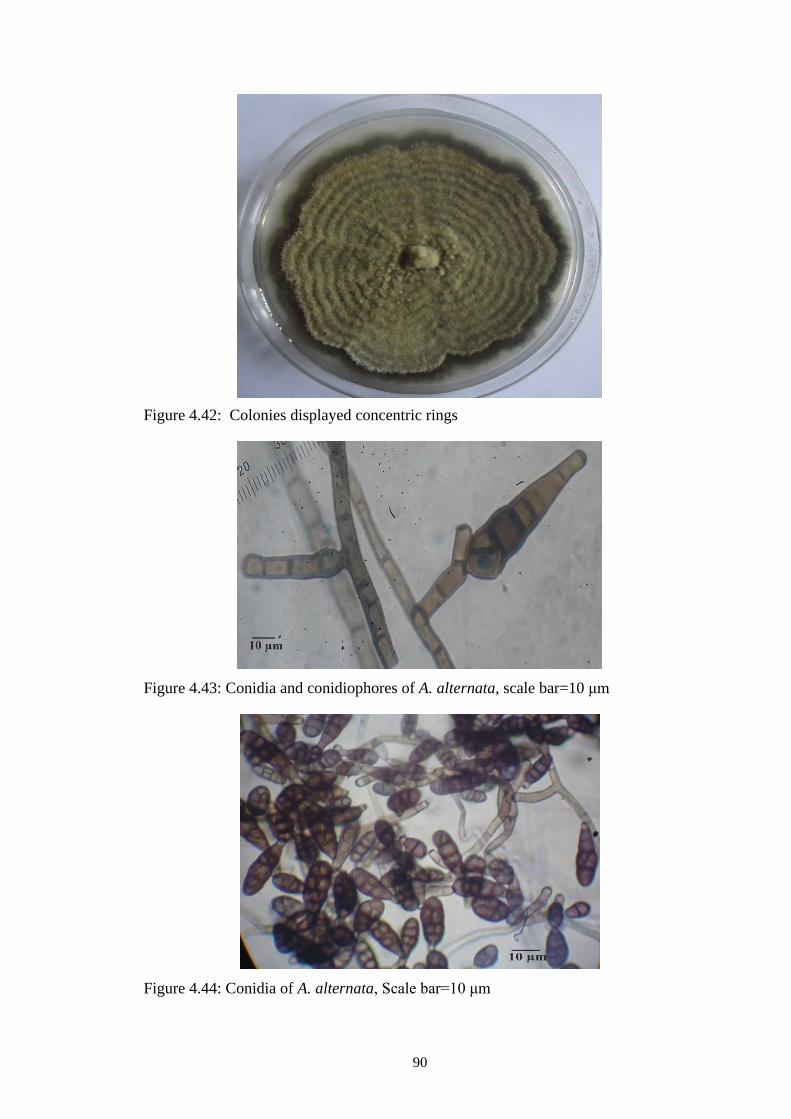
90
Figure 4.42: Colonies displayed concentric rings
Figure 4.43: Conidia and conidiophores of A. alternata, scale bar=10 μm
Figure 4.44: Conidia of A. alternata, Scale bar=10 μm
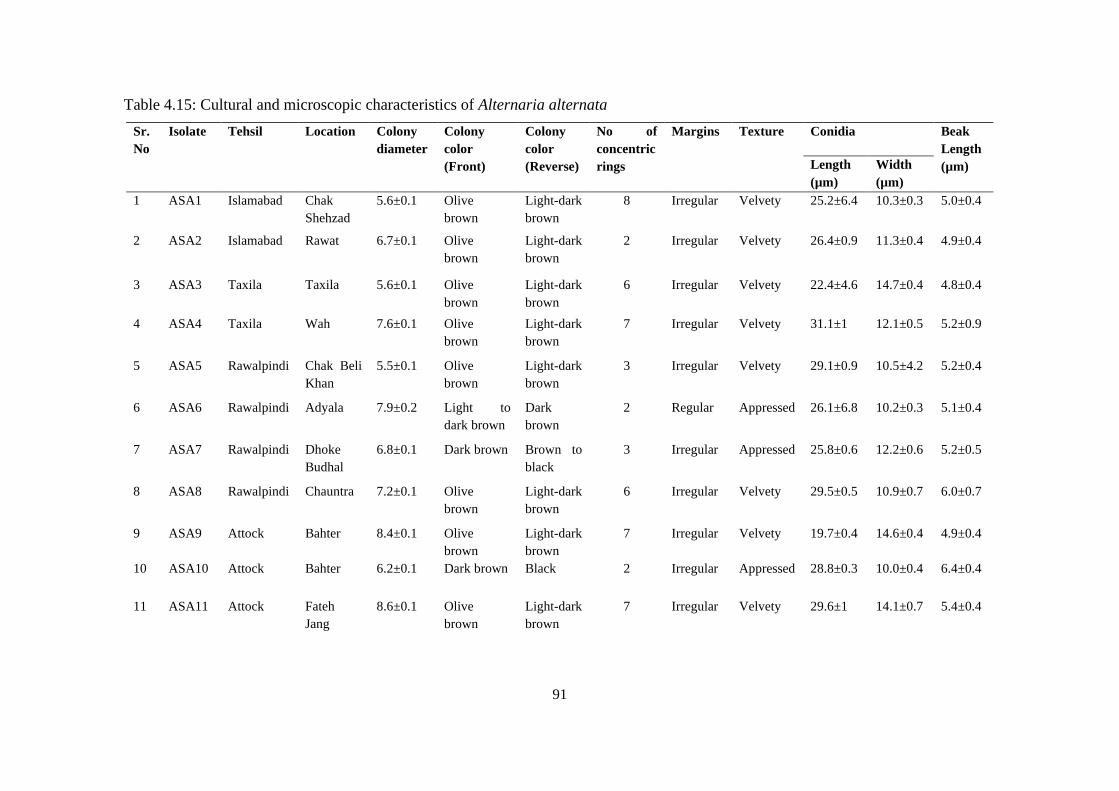
91
Table 4.15: Cultural and microscopic characteristics of Alternaria alternata
Sr.
No
Isolate Tehsil Location Colony
diameter
Colony
color
(Front)
Colony
color
(Reverse)
No of
concentric
rings
Margins Texture Conidia Beak
Length
(µm) Length
(µm)
Width
(µm)
1 ASA1 Islamabad Chak
Shehzad
5.6±0.1 Olive
brown
Light-dark
brown
8 Irregular Velvety 25.2±6.4 10.3±0.3 5.0±0.4
2 ASA2 Islamabad Rawat 6.7±0.1 Olive
brown
Light-dark
brown
2 Irregular Velvety 26.4±0.9 11.3±0.4 4.9±0.4
3 ASA3 Taxila Taxila 5.6±0.1 Olive
brown
Light-dark
brown
6 Irregular Velvety 22.4±4.6 14.7±0.4 4.8±0.4
4 ASA4 Taxila Wah 7.6±0.1 Olive
brown
Light-dark
brown
7 Irregular Velvety 31.1±1 12.1±0.5 5.2±0.9
5 ASA5 Rawalpindi Chak Beli
Khan
5.5±0.1 Olive
brown
Light-dark
brown
3 Irregular Velvety 29.1±0.9 10.5±4.2 5.2±0.4
6 ASA6 Rawalpindi Adyala 7.9±0.2 Light to
dark brown
Dark
brown
2 Regular Appressed 26.1±6.8 10.2±0.3 5.1±0.4
7 ASA7 Rawalpindi Dhoke
Budhal
6.8±0.1 Dark brown Brown to
black
3 Irregular Appressed 25.8±0.6 12.2±0.6 5.2±0.5
8 ASA8 Rawalpindi Chauntra 7.2±0.1 Olive
brown
Light-dark
brown
6 Irregular Velvety 29.5±0.5 10.9±0.7 6.0±0.7
9 ASA9 Attock Bahter 8.4±0.1 Olive
brown
Light-dark
brown
7 Irregular Velvety 19.7±0.4 14.6±0.4 4.9±0.4
10 ASA10 Attock Bahter 6.2±0.1 Dark brown Black 2 Irregular Appressed 28.8±0.3 10.0±0.4 6.4±0.4
11 ASA11 Attock Fateh
Jang
8.6±0.1 Olive
brown
Light-dark
brown
7 Irregular Velvety 29.6±1 14.1±0.7 5.4±0.4
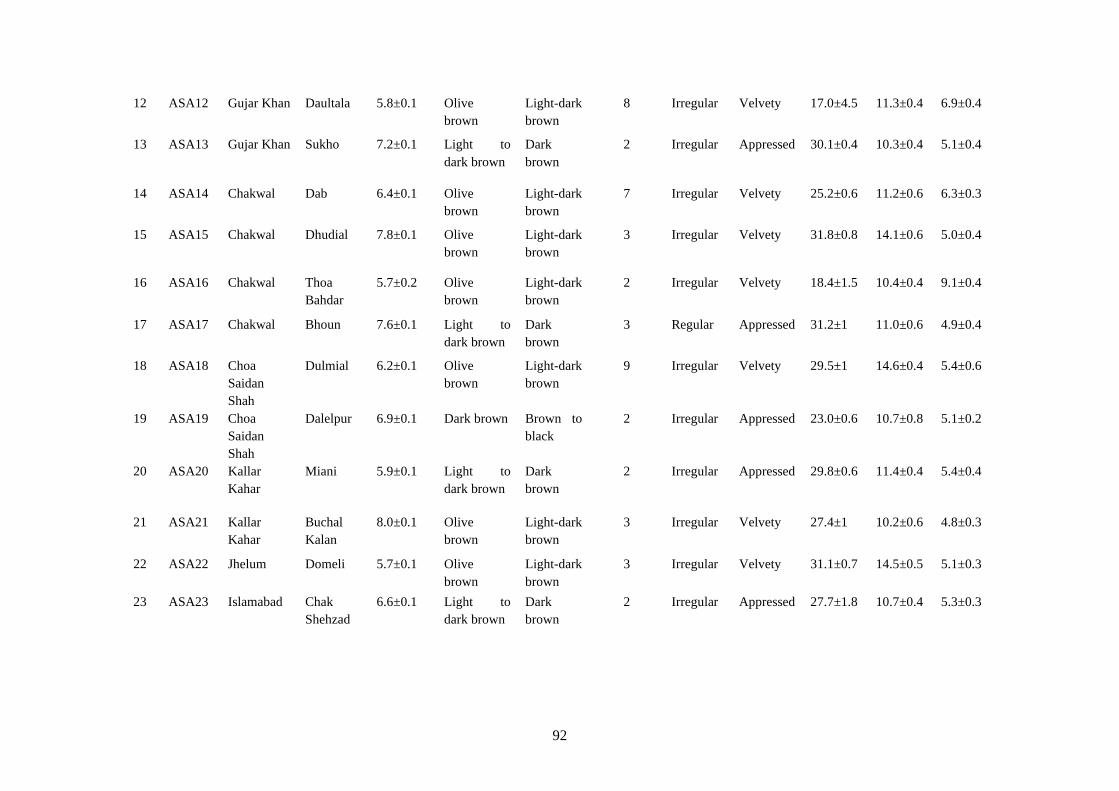
92
12 ASA12 Gujar Khan Daultala 5.8±0.1 Olive
brown
Light-dark
brown
8 Irregular Velvety 17.0±4.5 11.3±0.4 6.9±0.4
13 ASA13 Gujar Khan Sukho 7.2±0.1 Light to
dark brown
Dark
brown
2 Irregular Appressed 30.1±0.4 10.3±0.4 5.1±0.4
14 ASA14 Chakwal Dab 6.4±0.1 Olive
brown
Light-dark
brown
7 Irregular Velvety 25.2±0.6 11.2±0.6 6.3±0.3
15 ASA15 Chakwal Dhudial 7.8±0.1 Olive
brown
Light-dark
brown
3 Irregular Velvety 31.8±0.8 14.1±0.6 5.0±0.4
16 ASA16 Chakwal Thoa
Bahdar
5.7±0.2 Olive
brown
Light-dark
brown
2 Irregular Velvety 18.4±1.5 10.4±0.4 9.1±0.4
17 ASA17 Chakwal Bhoun 7.6±0.1 Light to
dark brown
Dark
brown
3 Regular Appressed 31.2±1 11.0±0.6 4.9±0.4
18 ASA18 Choa
Saidan
Shah
Dulmial 6.2±0.1 Olive
brown
Light-dark
brown
9 Irregular Velvety 29.5±1 14.6±0.4 5.4±0.6
19 ASA19 Choa
Saidan
Shah
Dalelpur 6.9±0.1 Dark brown Brown to
black
2 Irregular Appressed 23.0±0.6 10.7±0.8 5.1±0.2
20 ASA20 Kallar
Kahar
Miani 5.9±0.1 Light to
dark brown
Dark
brown
2 Irregular Appressed 29.8±0.6 11.4±0.4 5.4±0.4
21 ASA21 Kallar
Kahar
Buchal
Kalan
8.0±0.1 Olive
brown
Light-dark
brown
3 Irregular Velvety 27.4±1 10.2±0.6 4.8±0.3
22 ASA22 Jhelum Domeli 5.7±0.1 Olive
brown
Light-dark
brown
3 Irregular Velvety 31.1±0.7 14.5±0.5 5.1±0.3
23 ASA23 Islamabad Chak
Shehzad
6.6±0.1 Light to
dark brown
Dark
brown
2 Irregular Appressed 27.7±1.8 10.7±0.4 5.3±0.3
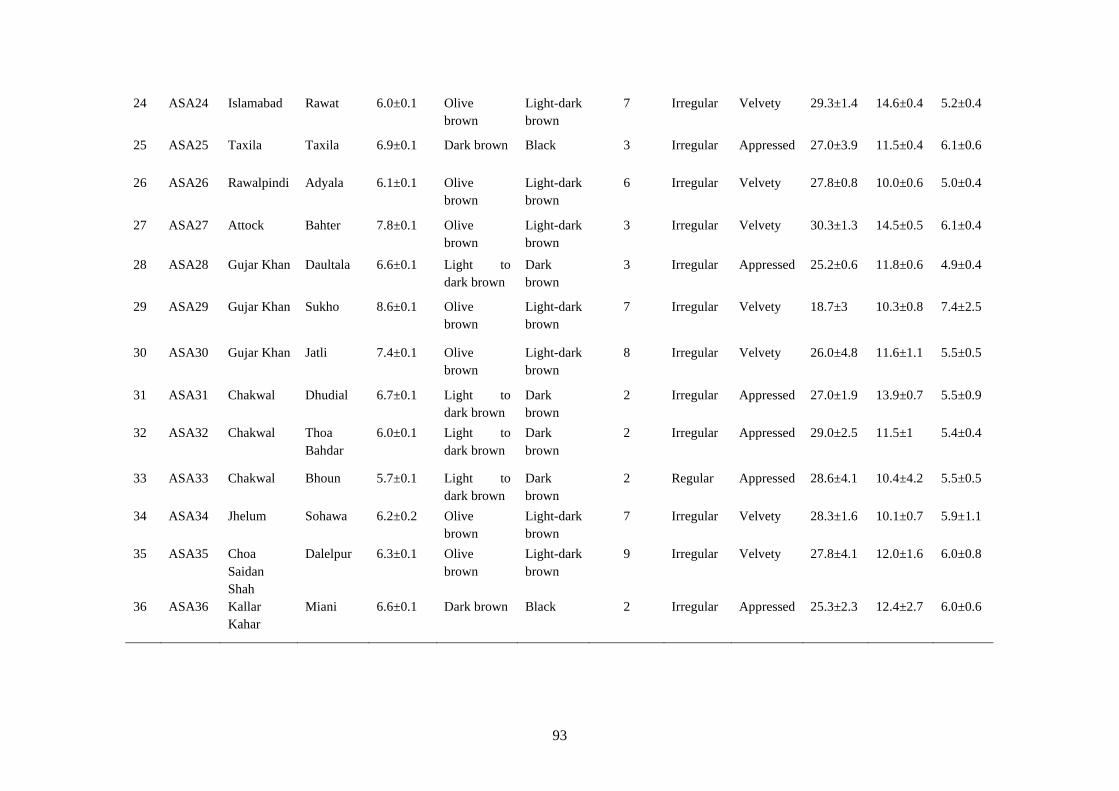
93
24 ASA24 Islamabad Rawat 6.0±0.1 Olive
brown
Light-dark
brown
7 Irregular Velvety 29.3±1.4 14.6±0.4 5.2±0.4
25 ASA25 Taxila Taxila 6.9±0.1 Dark brown Black 3 Irregular Appressed 27.0±3.9 11.5±0.4 6.1±0.6
26 ASA26 Rawalpindi Adyala 6.1±0.1 Olive
brown
Light-dark
brown
6 Irregular Velvety 27.8±0.8 10.0±0.6 5.0±0.4
27 ASA27 Attock Bahter 7.8±0.1 Olive
brown
Light-dark
brown
3 Irregular Velvety 30.3±1.3 14.5±0.5 6.1±0.4
28 ASA28 Gujar Khan Daultala 6.6±0.1 Light to
dark brown
Dark
brown
3 Irregular Appressed 25.2±0.6 11.8±0.6 4.9±0.4
29 ASA29 Gujar Khan Sukho 8.6±0.1 Olive
brown
Light-dark
brown
7 Irregular Velvety 18.7±3 10.3±0.8 7.4±2.5
30 ASA30 Gujar Khan Jatli 7.4±0.1 Olive
brown
Light-dark
brown
8 Irregular Velvety 26.0±4.8 11.6±1.1 5.5±0.5
31 ASA31 Chakwal Dhudial 6.7±0.1 Light to
dark brown
Dark
brown
2 Irregular Appressed 27.0±1.9 13.9±0.7 5.5±0.9
32 ASA32 Chakwal Thoa
Bahdar
6.0±0.1 Light to
dark brown
Dark
brown
2 Irregular Appressed 29.0±2.5 11.5±1 5.4±0.4
33 ASA33 Chakwal Bhoun 5.7±0.1 Light to
dark brown
Dark
brown
2 Regular Appressed 28.6±4.1 10.4±4.2 5.5±0.5
34 ASA34 Jhelum Sohawa 6.2±0.2 Olive
brown
Light-dark
brown
7 Irregular Velvety 28.3±1.6 10.1±0.7 5.9±1.1
35 ASA35 Choa
Saidan
Shah
Dalelpur 6.3±0.1 Olive
brown
Light-dark
brown
9 Irregular Velvety 27.8±4.1 12.0±1.6 6.0±0.8
36 ASA36 Kallar
Kahar
Miani 6.6±0.1 Dark brown Black 2 Irregular Appressed 25.3±2.3 12.4±2.7 6.0±0.6
94
4.5.6.2 Colony color
The colonies were initially white, later turning light cream or cream or light
brown. The isolates, FJH4, FJH19, FJH29, FJH33, FJH34 and FJH41 produced light
cream colonies with beige coloration at reverse (Figure 4.45). The colonies of eight
isolates viz. FJH2, FJH3, FJH5, FJH10, FJH14 and FJH23 were cream in color with
beige coloration at reverse (Figure 4.46). The colonies of isolates FJH1, FJH9, FJH11,
FJH12, FH15, FJH16, FJH17, FJH18, FJH22, FJH26, FJH27, FJH30, FJH32 and
FJH36 were light brown with brown coloration at reverse (Figure 4.47). The isolates
FJH6, FJH7, FJH8, FJH13, FJH20, FJH21, FJH24, FJH25, FJH28, FJH31, FJH35,
FJH39 and FJH40 produced white colonies with light cream or white coloration on
reverse side of petri dish (Figure 4.48).
4.5.6.3 Texture
The Fusarium equiseti isolates showed distinct fluffy and medium fluffy texture.
The eighteen isolates (43.9%), FJH3, FJH4, FJH5, FJH8, FJH9, FJH12, FJH16,
FJH18, FJH19, FJH23, FJH28, FJH29, FJH31, FJH32, FJH35, FJH37, FJH38 and
FJH41 showed fluffy texture. While the remaining 23 isolates (56.1%) exhibited
medium fluffy texture.
4.5.6.4 Sporodochia
Sporodochia were orange in color and formed by nineteen isolates viz. FJH3,
FJH4, FJH5, FJH7, FJH9, FJH11, FJH14, FJH20, FJH21, FJH22, FJH24, FJH25,
FJH27, FJH30, FJH32, FJH35, FJH38, FJH40 and FJH41. Whereas, the remaining
twenty-one isolates did not produce sporodochia on PDA media. Sporodochia may not
be obvious in culture media since they can be masked by the mycelium (Leslie,
Summerell, & Bullock, 2006).
4.5.6.5 Conidia and conidiophores
Microscopic examinations showed the presence of hyaline and septate hyphae and
absence of microconidia in all the isolates. Macro-conidia were hyaline, 5 to 6 septate
and developed on branched conidiophores with dorsiventral curvature having
prominent tapered apical cell and foot shaped basal cells (Figure 4.49).
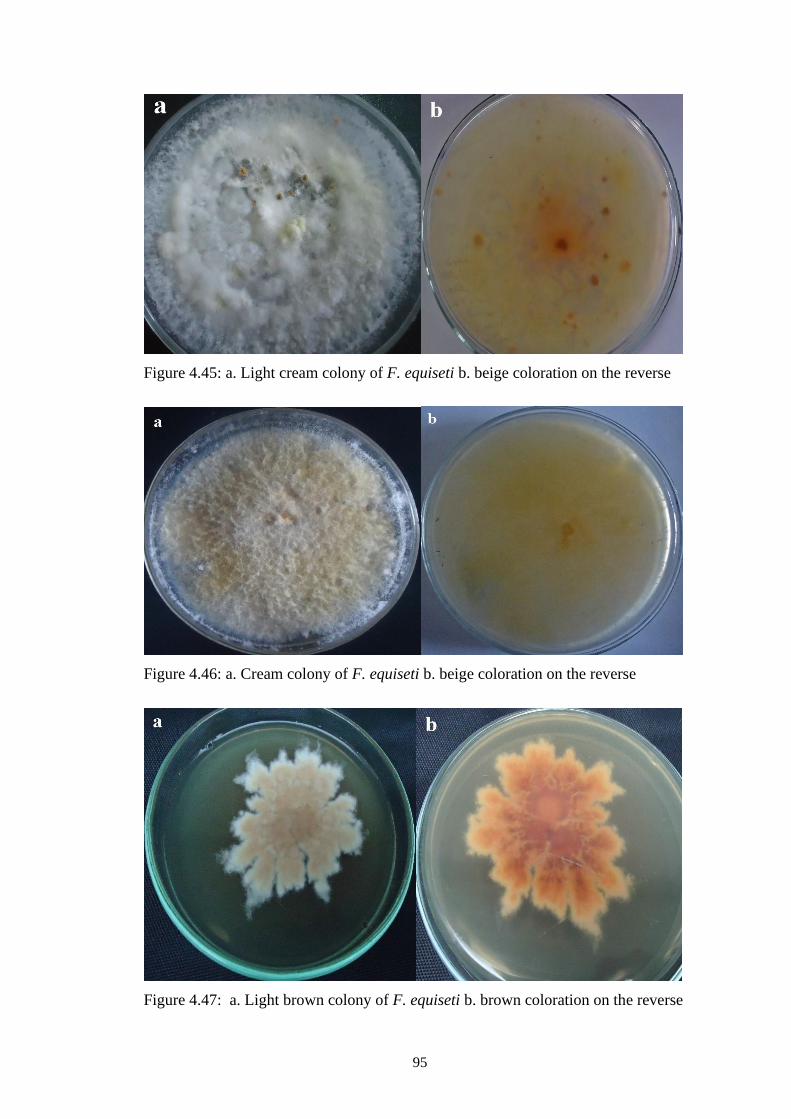
95
Figure 4.45: a. Light cream colony of F. equiseti b. beige coloration on the reverse
Figure 4.46: a. Cream colony of F. equiseti b. beige coloration on the reverse
Figure 4.47: a. Light brown colony of F. equiseti b. brown coloration on the reverse
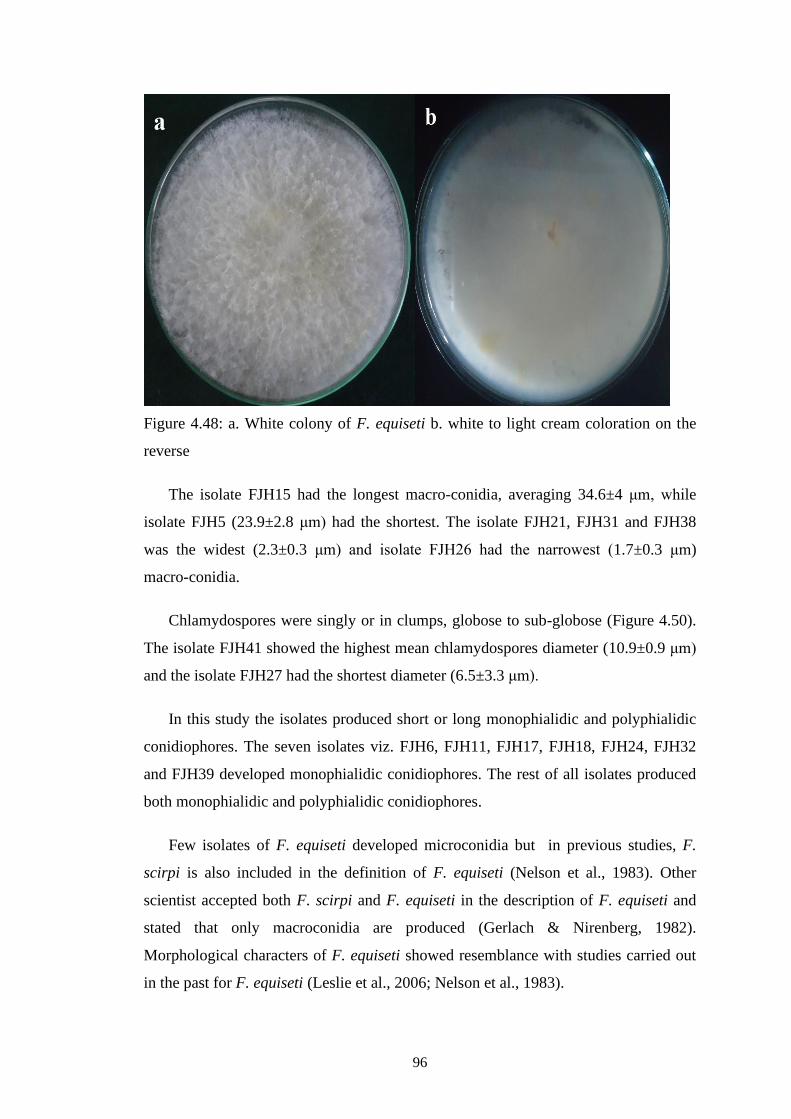
96
Figure 4.48: a. White colony of F. equiseti b. white to light cream coloration on the
reverse
The isolate FJH15 had the longest macro-conidia, averaging 34.6±4 μm, while
isolate FJH5 (23.9±2.8 μm) had the shortest. The isolate FJH21, FJH31 and FJH38
was the widest (2.3±0.3 μm) and isolate FJH26 had the narrowest (1.7±0.3 μm)
macro-conidia.
Chlamydospores were singly or in clumps, globose to sub-globose (Figure 4.50).
The isolate FJH41 showed the highest mean chlamydospores diameter (10.9±0.9 μm)
and the isolate FJH27 had the shortest diameter (6.5±3.3 μm).
In this study the isolates produced short or long monophialidic and polyphialidic
conidiophores. The seven isolates viz. FJH6, FJH11, FJH17, FJH18, FJH24, FJH32
and FJH39 developed monophialidic conidiophores. The rest of all isolates produced
both monophialidic and polyphialidic conidiophores.
Few isolates of F. equiseti developed microconidia but in previous studies, F.
scirpi is also included in the definition of F. equiseti (Nelson et al., 1983). Other
scientist accepted both F. scirpi and F. equiseti in the description of F. equiseti and
stated that only macroconidia are produced (Gerlach & Nirenberg, 1982).
Morphological characters of F. equiseti showed resemblance with studies carried out
in the past for F. equiseti (Leslie et al., 2006; Nelson et al., 1983).
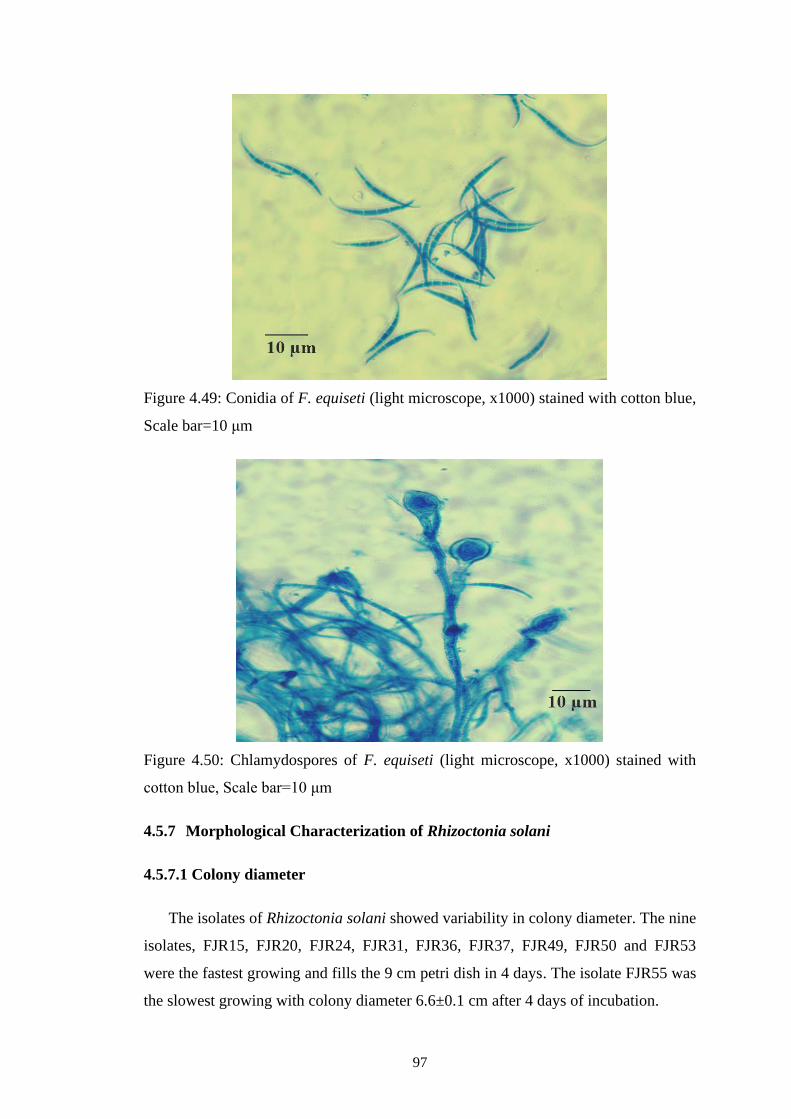
97
Figure 4.49: Conidia of F. equiseti (light microscope, x1000) stained with cotton blue,
Scale bar=10 μm
Figure 4.50: Chlamydospores of F. equiseti (light microscope, x1000) stained with
cotton blue, Scale bar=10 μm
4.5.7 Morphological Characterization of Rhizoctonia solani
4.5.7.1 Colony diameter
The isolates of Rhizoctonia solani showed variability in colony diameter. The nine
isolates, FJR15, FJR20, FJR24, FJR31, FJR36, FJR37, FJR49, FJR50 and FJR53
were the fastest growing and fills the 9 cm petri dish in 4 days. The isolate FJR55 was
the slowest growing with colony diameter 6.6±0.1 cm after 4 days of incubation.
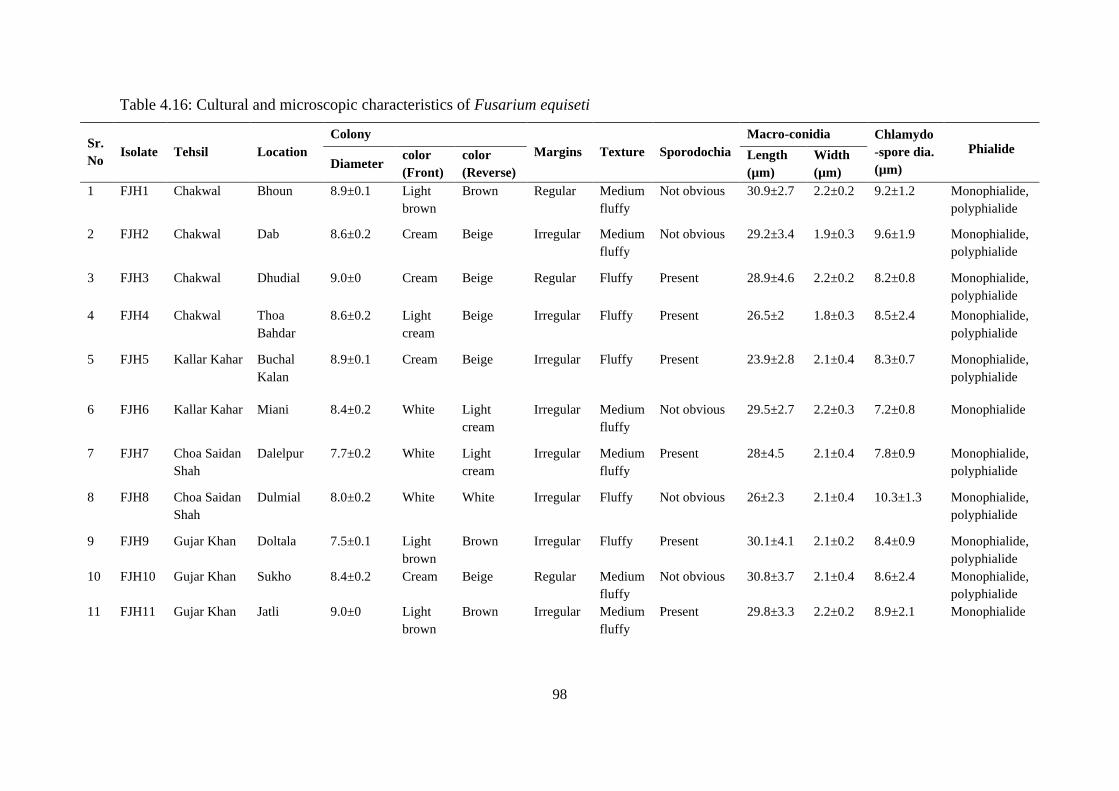
98
Table 4.16: Cultural and microscopic characteristics of Fusarium equiseti
Sr.
No Isolate Tehsil Location
Colony
Margins Texture Sporodochia
Macro-conidia Chlamydo
-spore dia.
(µm)
Phialide
Diameter color
(Front)
color
(Reverse)
Length
(µm)
Width
(µm)
1 FJH1 Chakwal Bhoun 8.9±0.1 Light
brown
Brown Regular Medium
fluffy
Not obvious 30.9±2.7 2.2±0.2 9.2±1.2 Monophialide,
polyphialide
2 FJH2 Chakwal Dab 8.6±0.2 Cream Beige Irregular Medium
fluffy
Not obvious 29.2±3.4 1.9±0.3 9.6±1.9 Monophialide,
polyphialide
3 FJH3 Chakwal Dhudial 9.0±0 Cream Beige Regular Fluffy Present 28.9±4.6 2.2±0.2 8.2±0.8 Monophialide,
polyphialide
4 FJH4 Chakwal Thoa
Bahdar
8.6±0.2 Light
cream
Beige Irregular Fluffy Present 26.5±2 1.8±0.3 8.5±2.4 Monophialide,
polyphialide
5 FJH5 Kallar Kahar Buchal
Kalan
8.9±0.1 Cream Beige Irregular Fluffy Present 23.9±2.8 2.1±0.4 8.3±0.7 Monophialide,
polyphialide
6 FJH6 Kallar Kahar Miani 8.4±0.2 White Light
cream
Irregular Medium
fluffy
Not obvious 29.5±2.7 2.2±0.3 7.2±0.8 Monophialide
7 FJH7 Choa Saidan
Shah
Dalelpur 7.7±0.2 White Light
cream
Irregular Medium
fluffy
Present 28±4.5 2.1±0.4 7.8±0.9 Monophialide,
polyphialide
8 FJH8 Choa Saidan
Shah
Dulmial 8.0±0.2 White White Irregular Fluffy Not obvious 26±2.3 2.1±0.4 10.3±1.3 Monophialide,
polyphialide
9 FJH9 Gujar Khan Doltala 7.5±0.1 Light
brown
Brown Irregular Fluffy Present 30.1±4.1 2.1±0.2 8.4±0.9 Monophialide,
polyphialide
10 FJH10 Gujar Khan Sukho 8.4±0.2 Cream Beige Regular Medium
fluffy
Not obvious 30.8±3.7 2.1±0.4 8.6±2.4 Monophialide,
polyphialide
11 FJH11 Gujar Khan Jatli 9.0±0 Light
brown
Brown Irregular Medium
fluffy
Present 29.8±3.3 2.2±0.2 8.9±2.1 Monophialide
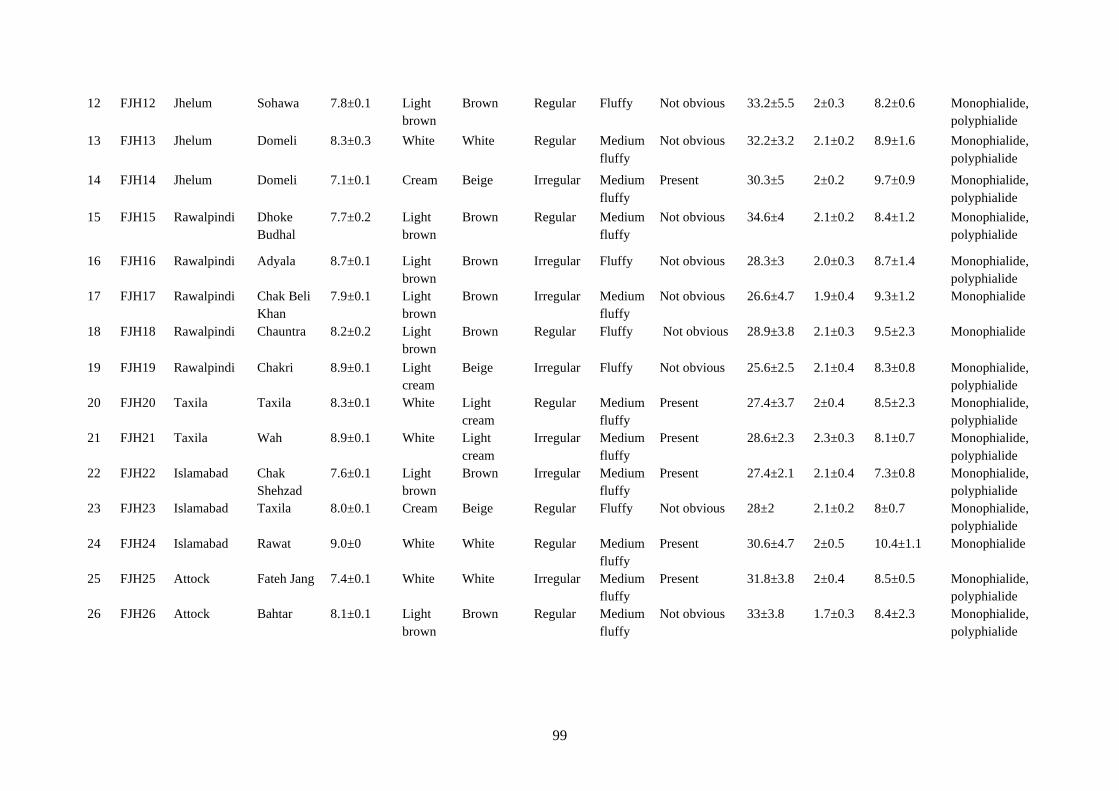
99
12 FJH12 Jhelum Sohawa 7.8±0.1 Light
brown
Brown Regular Fluffy Not obvious 33.2±5.5 2±0.3 8.2±0.6 Monophialide,
polyphialide
13 FJH13 Jhelum Domeli 8.3±0.3 White White Regular Medium
fluffy
Not obvious 32.2±3.2 2.1±0.2 8.9±1.6 Monophialide,
polyphialide
14 FJH14 Jhelum Domeli 7.1±0.1 Cream Beige Irregular Medium
fluffy
Present 30.3±5 2±0.2 9.7±0.9 Monophialide,
polyphialide
15 FJH15 Rawalpindi Dhoke
Budhal
7.7±0.2 Light
brown
Brown Regular Medium
fluffy
Not obvious 34.6±4 2.1±0.2 8.4±1.2 Monophialide,
polyphialide
16 FJH16 Rawalpindi Adyala 8.7±0.1 Light
brown
Brown Irregular Fluffy Not obvious 28.3±3 2.0±0.3 8.7±1.4 Monophialide,
polyphialide
17 FJH17 Rawalpindi Chak Beli
Khan
7.9±0.1 Light
brown
Brown Irregular Medium
fluffy
Not obvious 26.6±4.7 1.9±0.4 9.3±1.2 Monophialide
18 FJH18 Rawalpindi Chauntra 8.2±0.2 Light
brown
Brown Regular Fluffy Not obvious 28.9±3.8 2.1±0.3 9.5±2.3 Monophialide
19 FJH19 Rawalpindi Chakri 8.9±0.1 Light
cream
Beige Irregular Fluffy Not obvious 25.6±2.5 2.1±0.4 8.3±0.8 Monophialide,
polyphialide
20 FJH20 Taxila Taxila 8.3±0.1 White Light
cream
Regular Medium
fluffy
Present 27.4±3.7 2±0.4 8.5±2.3 Monophialide,
polyphialide
21 FJH21 Taxila Wah 8.9±0.1 White Light
cream
Irregular Medium
fluffy
Present 28.6±2.3 2.3±0.3 8.1±0.7 Monophialide,
polyphialide
22 FJH22 Islamabad Chak
Shehzad
7.6±0.1 Light
brown
Brown Irregular Medium
fluffy
Present 27.4±2.1 2.1±0.4 7.3±0.8 Monophialide,
polyphialide
23 FJH23 Islamabad Taxila 8.0±0.1 Cream Beige Regular Fluffy Not obvious 28±2 2.1±0.2 8±0.7 Monophialide,
polyphialide
24 FJH24 Islamabad Rawat 9.0±0 White White Regular Medium
fluffy
Present 30.6±4.7 2±0.5 10.4±1.1 Monophialide
25 FJH25 Attock Fateh Jang 7.4±0.1 White White Irregular Medium
fluffy
Present 31.8±3.8 2±0.4 8.5±0.5 Monophialide,
polyphialide
26 FJH26 Attock Bahtar 8.1±0.1 Light
brown
Brown Regular Medium
fluffy
Not obvious 33±3.8 1.7±0.3 8.4±2.3 Monophialide,
polyphialide
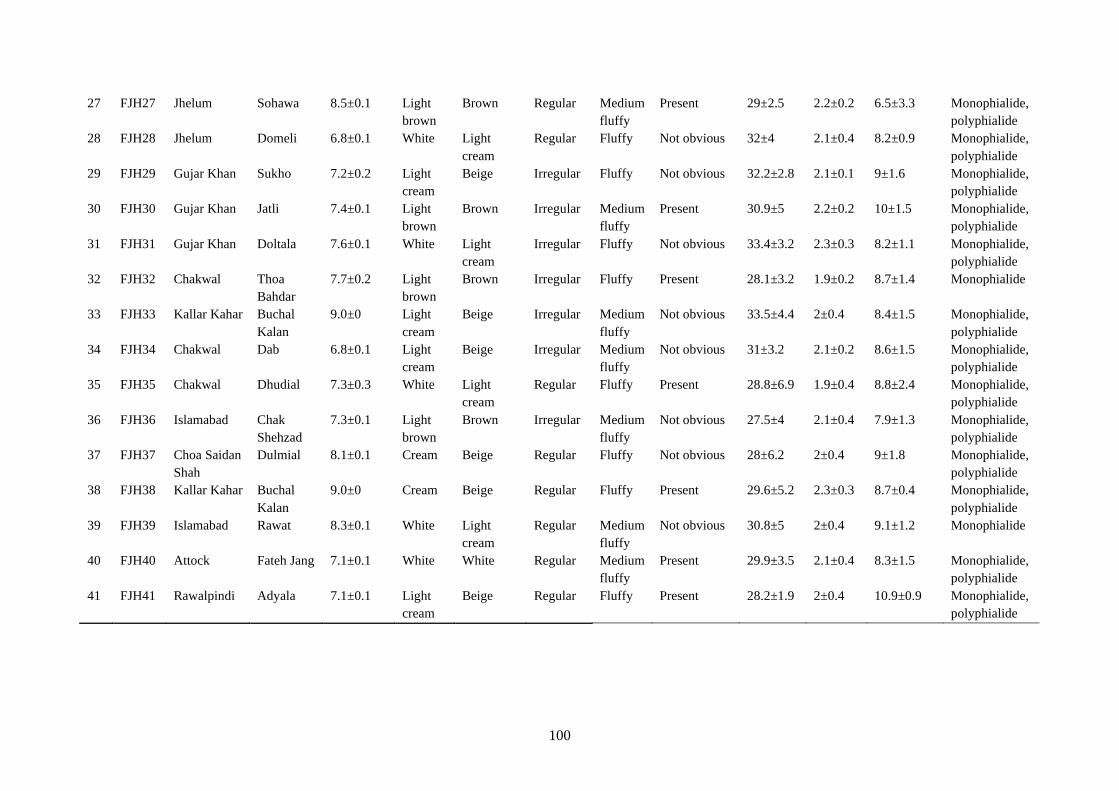
100
27 FJH27 Jhelum Sohawa 8.5±0.1 Light
brown
Brown Regular Medium
fluffy
Present 29±2.5 2.2±0.2 6.5±3.3 Monophialide,
polyphialide
28 FJH28 Jhelum Domeli 6.8±0.1 White Light
cream
Regular Fluffy Not obvious 32±4 2.1±0.4 8.2±0.9 Monophialide,
polyphialide
29 FJH29 Gujar Khan Sukho 7.2±0.2 Light
cream
Beige Irregular Fluffy Not obvious 32.2±2.8 2.1±0.1 9±1.6 Monophialide,
polyphialide
30 FJH30 Gujar Khan Jatli 7.4±0.1 Light
brown
Brown Irregular Medium
fluffy
Present 30.9±5 2.2±0.2 10±1.5 Monophialide,
polyphialide
31 FJH31 Gujar Khan Doltala 7.6±0.1 White Light
cream
Irregular Fluffy Not obvious 33.4±3.2 2.3±0.3 8.2±1.1 Monophialide,
polyphialide
32 FJH32 Chakwal Thoa
Bahdar
7.7±0.2 Light
brown
Brown Irregular Fluffy Present 28.1±3.2 1.9±0.2 8.7±1.4 Monophialide
33 FJH33 Kallar Kahar Buchal
Kalan
9.0±0 Light
cream
Beige Irregular Medium
fluffy
Not obvious 33.5±4.4 2±0.4 8.4±1.5 Monophialide,
polyphialide
34 FJH34 Chakwal Dab 6.8±0.1 Light
cream
Beige Irregular Medium
fluffy
Not obvious 31±3.2 2.1±0.2 8.6±1.5 Monophialide,
polyphialide
35 FJH35 Chakwal Dhudial 7.3±0.3 White Light
cream
Regular Fluffy Present 28.8±6.9 1.9±0.4 8.8±2.4 Monophialide,
polyphialide
36 FJH36 Islamabad Chak
Shehzad
7.3±0.1 Light
brown
Brown Irregular Medium
fluffy
Not obvious 27.5±4 2.1±0.4 7.9±1.3 Monophialide,
polyphialide
37 FJH37 Choa Saidan
Shah
Dulmial 8.1±0.1 Cream Beige Regular Fluffy Not obvious 28±6.2 2±0.4 9±1.8 Monophialide,
polyphialide
38 FJH38 Kallar Kahar Buchal
Kalan
9.0±0 Cream Beige Regular Fluffy Present 29.6±5.2 2.3±0.3 8.7±0.4 Monophialide,
polyphialide
39 FJH39 Islamabad Rawat 8.3±0.1 White Light
cream
Regular Medium
fluffy
Not obvious 30.8±5 2±0.4 9.1±1.2 Monophialide
40 FJH40 Attock Fateh Jang 7.1±0.1 White White Regular Medium
fluffy
Present 29.9±3.5 2.1±0.4 8.3±1.5 Monophialide,
polyphialide
41 FJH41 Rawalpindi Adyala 7.1±0.1 Light
cream
Beige Regular Fluffy Present 28.2±1.9 2±0.4 10.9±0.9 Monophialide,
polyphialide
101
4.5.7.2 Colony color
Colonies were initially white or cream in color, later displayed variation among
different isolates with creamish, brown to creamish, light brown, dark brown color.
The isolates, FJR03, FJR07, FJR14, FJR17, FJR24, FJR25, FJR32, FJR35, FJR42,
FJR52, FJR53 and FJR56 produced creamish colonies with creamish brown or
creamish coloration at reverse (Figure 4.51). The colonies of thirteen isolates viz.
FJR01, FJR04, FJR05, FJR10, FJR11, FJR15, FJR18, FJR19, FJR27, FJR28, FJR37,
FJR48 and FJR51 were brown to creamish with light brown or creamish color at
reverse (Figure 4.52). The isolates, FJR12, FJR13, FJR21, FJR30, FJR31, FJR38,
FJR44, FJR45, FJR46, FJR54 and FJR55 produced light brown colonies with
creamish brown or light brown at reverse (Figure 4.53). The colonies of twenty
isolates, FJR02, FJR06, FJR08, FJR09, FJR16, FJR20, FJR22, FJR23, FJR26, FJR29,
FJR33, FJR34, FJR36, FJR39, FJR40, FJR41, FJR43, FJR47, FJR49 and FJR50 were
dark brown with dark brown color at reverse (Figure 4.54).
The color of a young Rhizoctonia solani colony were initially white, and later
turns to brown. The differences in colony color is caused by differences in pigments
produced by pathogen in the media (Taheri, Gnanamanickam, & Höfte, 2007).
4.5.7.3 Texture
The colonies of R. solani appeared to have variation in texture with fluffy,
medium fluffy and thin flat growth pattern. The colonies of twenty-three isolates
(41.07%), FJR03, FJR04, FJR07, FJR08, FJR10, FJR11, FJR13, FJR14, FJR15,
FJR17, FJR18, FJR19, FJR21, FJR27, FJR28, FJR32, FJR36, FJR37, FJR42, FJR51,
FJR52, FJR53 and FJR56 had heavy vegetative growth showing fluffy appearance of
mycelia. The nineteen isolates (33.92%), FJR01, FJR02, FJR05, FJR06, FJR16,
FJR22, FJR23, FJR26, FJR29, FJR34, FJR38, FJR39, FJR40, FJR43, FJR44, FJR46,
FJR47, FJR48 and FJR50 were medium fluffy. Whereas, the rest of fourteen (25%)
isolates colonies, viz. FJR09, FJR12, FJR20, FJR24, FJR25, FJR30, FJR31, FJR33,
FJR35, FJR41, FJR45, FJR49, FJR54 and FJR55 were thin flat in texture.
4.5.7.4 Sclerotia
102
The color of sclerotia produced by isolates showed variation with light brown to
dark brown color. The twelve isolates (21.43%), FJR03, FJR07, FJR11, FJR15,
FJR17, FJR19, FJR32, FJR35, FJR42, FJR52, FJR53 and FJR56 produced light
brown sclerotia. The rest of forty-four isolates (78.57%) had dark brown sclerotia.
The location of sclerotia of R. solani was on surface or aerial hyphae or at both
surface and aerial hyphae. The fourteen isolates (25%) developed sclerotia on aerial
hyphae (Figure 4.55), twenty-five (44.64%) on surface (Figure 4.56) and seventeen
isolates (30.36%) had sclerotia at both aerial hyphae and surface.
The eighteen isolates (32.14%) viz. FJR03, FJR07, FJR08, FJR13, FJR17, FJR18,
FJR24, FJR25, FJR32, FJR36, FJR39, FJR42, FJR45, FJR46, FJR49, FJR52, FJR53
and FJR56 formed sclerotia at periphery of petri dish. The nine isolates (16.07%),
FJR02, FJR06, FJR16, FJR22, FJR29, FJR33, FJR34, FJR43 and FJR47 had
developed sclerotia at center of petri dish. The sclerotia formed by twenty-nine
isolates (51.79%) were scattered on petri dish.
The sclerotial color ranged from light to dark brown, brown, chocolate brown,
black brown, salmon and dark salmon (Hoa, 1994). The sclerotial formation at
peripheral, central, or scattered (Moni et al., 2016). Isolates of R. solani differed in
morphology, sclerotial abundance, distribution, color, size, shape and type of
aggregation (Mekwatanakarn, Kositratana, Phromraksa, & Zeigler, 1999; Pascual,
Toda, Raymondo, & Hyakumachi, 2000; Rashad, Abdel-Fattah, Hafez, & El-Haddad,
2012).
4.5.7.5 Hyphal characteristics
The hyphal branching of all the 56 isolates of R. solani was at right angle. Hyphae
was septate, trinucleate, slightly constricted at the point of the branching of mycelium
and septum. The hyphal branching at right angle is a known feature of R. solani.
Hyphal width ranged from 6.2 μm to 7.3 μm. The maximum hyphal width (7.3
μm) was observed in isolate FJR55 while the minimum (6.2 μm) was observed in
isolate FJR03. Microscopic examination showed morphological characters coinciding
with Rhizoctonia genus (Sneh, Burpee, & Ogoshi, 1991).
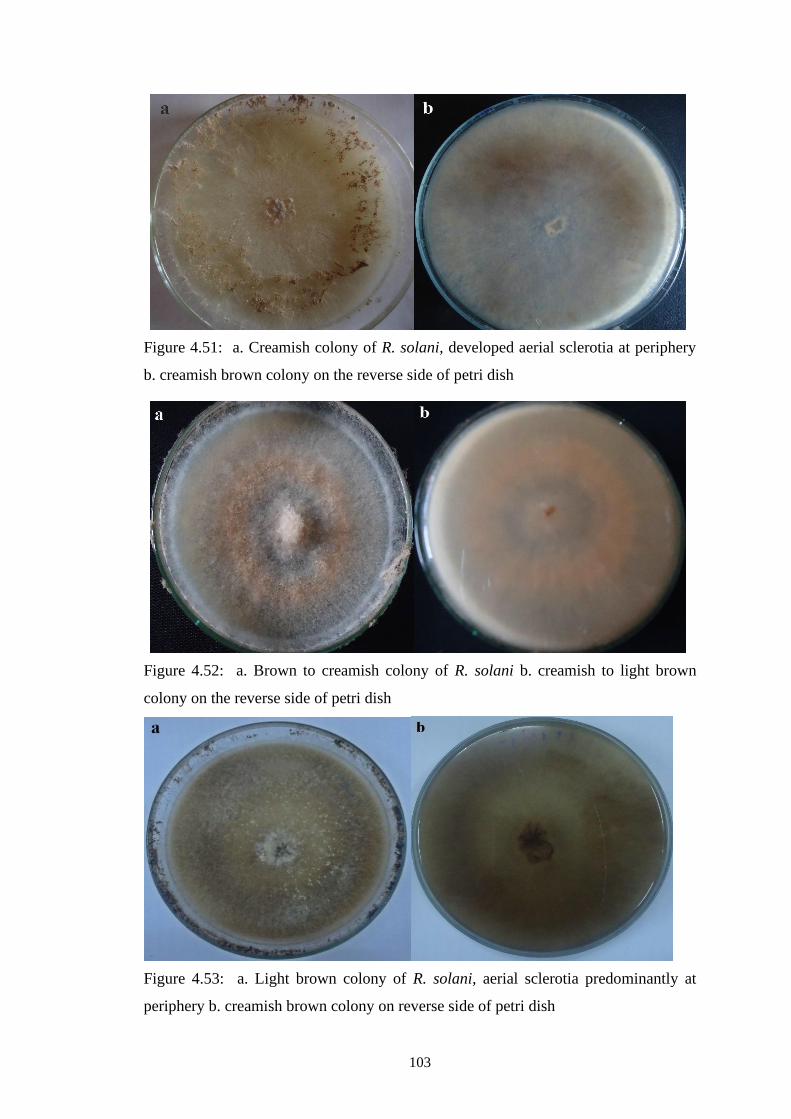
103
Figure 4.51: a. Creamish colony of R. solani, developed aerial sclerotia at periphery
b. creamish brown colony on the reverse side of petri dish
Figure 4.52: a. Brown to creamish colony of R. solani b. creamish to light brown
colony on the reverse side of petri dish
Figure 4.53: a. Light brown colony of R. solani, aerial sclerotia predominantly at
periphery b. creamish brown colony on reverse side of petri dish
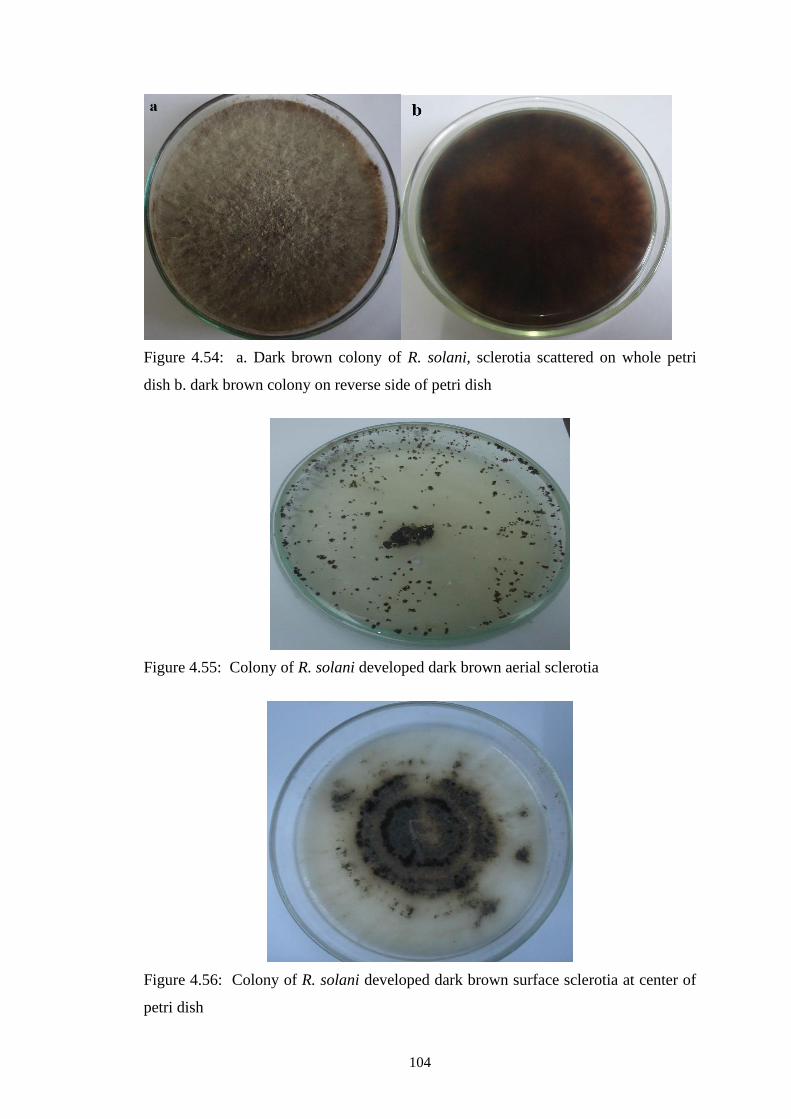
104
Figure 4.54: a. Dark brown colony of R. solani, sclerotia scattered on whole petri
dish b. dark brown colony on reverse side of petri dish
Figure 4.55: Colony of R. solani developed dark brown aerial sclerotia
Figure 4.56: Colony of R. solani developed dark brown surface sclerotia at center of
petri dish
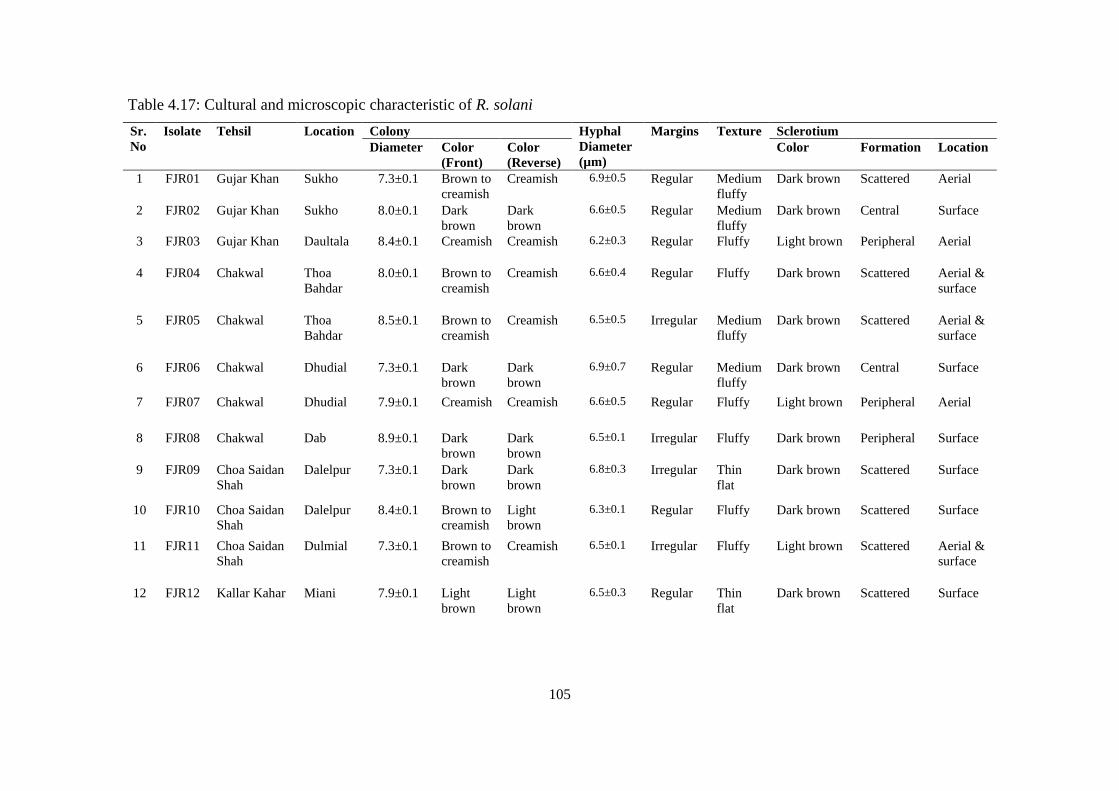
105
Table 4.17: Cultural and microscopic characteristic of R. solani
Sr.
No
Isolate Tehsil Location Colony Hyphal
Diameter
(µm)
Margins Texture Sclerotium
Diameter Color
(Front)
Color
(Reverse)
Color Formation Location
1 FJR01 Gujar Khan Sukho 7.3±0.1 Brown to
creamish
Creamish 6.9±0.5 Regular Medium
fluffy
Dark brown Scattered Aerial
2 FJR02 Gujar Khan Sukho 8.0±0.1 Dark
brown
Dark
brown
6.6±0.5 Regular Medium
fluffy
Dark brown Central Surface
3 FJR03 Gujar Khan Daultala 8.4±0.1 Creamish Creamish 6.2±0.3 Regular Fluffy Light brown Peripheral Aerial
4 FJR04 Chakwal Thoa
Bahdar
8.0±0.1 Brown to
creamish
Creamish 6.6±0.4 Regular Fluffy Dark brown Scattered Aerial &
surface
5 FJR05 Chakwal Thoa
Bahdar
8.5±0.1 Brown to
creamish
Creamish 6.5±0.5 Irregular Medium
fluffy
Dark brown Scattered Aerial &
surface
6 FJR06 Chakwal Dhudial 7.3±0.1 Dark
brown
Dark
brown
6.9±0.7 Regular Medium
fluffy
Dark brown Central Surface
7 FJR07 Chakwal Dhudial 7.9±0.1 Creamish Creamish 6.6±0.5 Regular Fluffy Light brown Peripheral Aerial
8 FJR08 Chakwal Dab 8.9±0.1 Dark
brown
Dark
brown
6.5±0.1 Irregular Fluffy Dark brown Peripheral Surface
9 FJR09 Choa Saidan
Shah
Dalelpur 7.3±0.1 Dark
brown
Dark
brown
6.8±0.3 Irregular Thin
flat
Dark brown Scattered Surface
10 FJR10 Choa Saidan
Shah
Dalelpur 8.4±0.1 Brown to
creamish
Light
brown
6.3±0.1 Regular Fluffy Dark brown Scattered Surface
11 FJR11 Choa Saidan
Shah
Dulmial 7.3±0.1 Brown to
creamish
Creamish 6.5±0.1 Irregular Fluffy Light brown Scattered Aerial &
surface
12 FJR12 Kallar Kahar Miani 7.9±0.1 Light
brown
Light
brown
6.5±0.3 Regular Thin
flat
Dark brown Scattered Surface
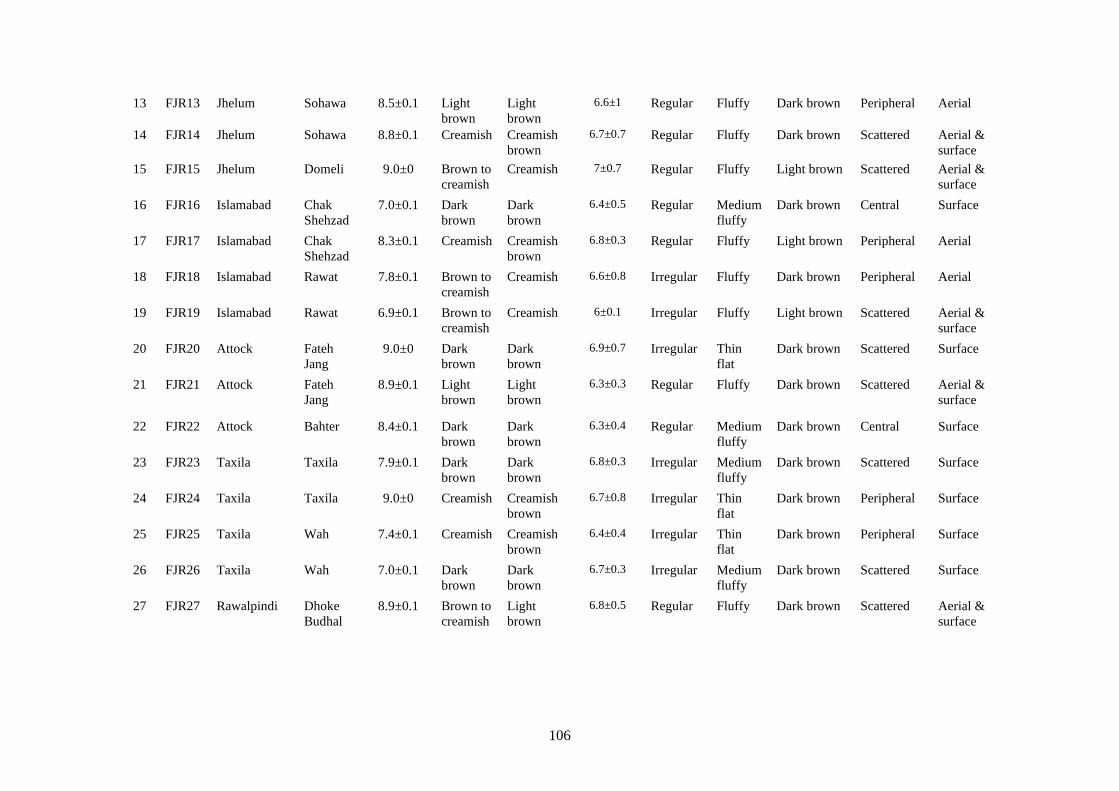
106
13 FJR13 Jhelum Sohawa 8.5±0.1 Light
brown
Light
brown
6.6±1 Regular Fluffy Dark brown Peripheral Aerial
14 FJR14 Jhelum Sohawa 8.8±0.1 Creamish Creamish
brown
6.7±0.7 Regular Fluffy Dark brown Scattered Aerial &
surface
15 FJR15 Jhelum Domeli 9.0±0 Brown to
creamish
Creamish 7±0.7 Regular Fluffy Light brown Scattered Aerial &
surface
16 FJR16 Islamabad Chak
Shehzad
7.0±0.1 Dark
brown
Dark
brown
6.4±0.5 Regular Medium
fluffy
Dark brown Central Surface
17 FJR17 Islamabad Chak
Shehzad
8.3±0.1 Creamish Creamish
brown
6.8±0.3 Regular Fluffy Light brown Peripheral Aerial
18 FJR18 Islamabad Rawat 7.8±0.1 Brown to
creamish
Creamish 6.6±0.8 Irregular Fluffy Dark brown Peripheral Aerial
19 FJR19 Islamabad Rawat 6.9±0.1 Brown to
creamish
Creamish 6±0.1 Irregular Fluffy Light brown Scattered Aerial &
surface
20 FJR20 Attock Fateh
Jang
9.0±0 Dark
brown
Dark
brown
6.9±0.7 Irregular Thin
flat
Dark brown Scattered Surface
21 FJR21 Attock Fateh
Jang
8.9±0.1 Light
brown
Light
brown
6.3±0.3 Regular Fluffy Dark brown Scattered Aerial &
surface
22 FJR22 Attock Bahter 8.4±0.1 Dark
brown
Dark
brown
6.3±0.4 Regular Medium
fluffy
Dark brown Central Surface
23 FJR23 Taxila Taxila 7.9±0.1 Dark
brown
Dark
brown
6.8±0.3 Irregular Medium
fluffy
Dark brown Scattered Surface
24 FJR24 Taxila Taxila 9.0±0 Creamish Creamish
brown
6.7±0.8 Irregular Thin
flat
Dark brown Peripheral Surface
25 FJR25 Taxila Wah 7.4±0.1 Creamish Creamish
brown
6.4±0.4 Irregular Thin
flat
Dark brown Peripheral Surface
26 FJR26 Taxila Wah 7.0±0.1 Dark
brown
Dark
brown
6.7±0.3 Irregular Medium
fluffy
Dark brown Scattered Surface
27 FJR27 Rawalpindi Dhoke
Budhal
8.9±0.1 Brown to
creamish
Light
brown
6.8±0.5 Regular Fluffy Dark brown Scattered Aerial &
surface
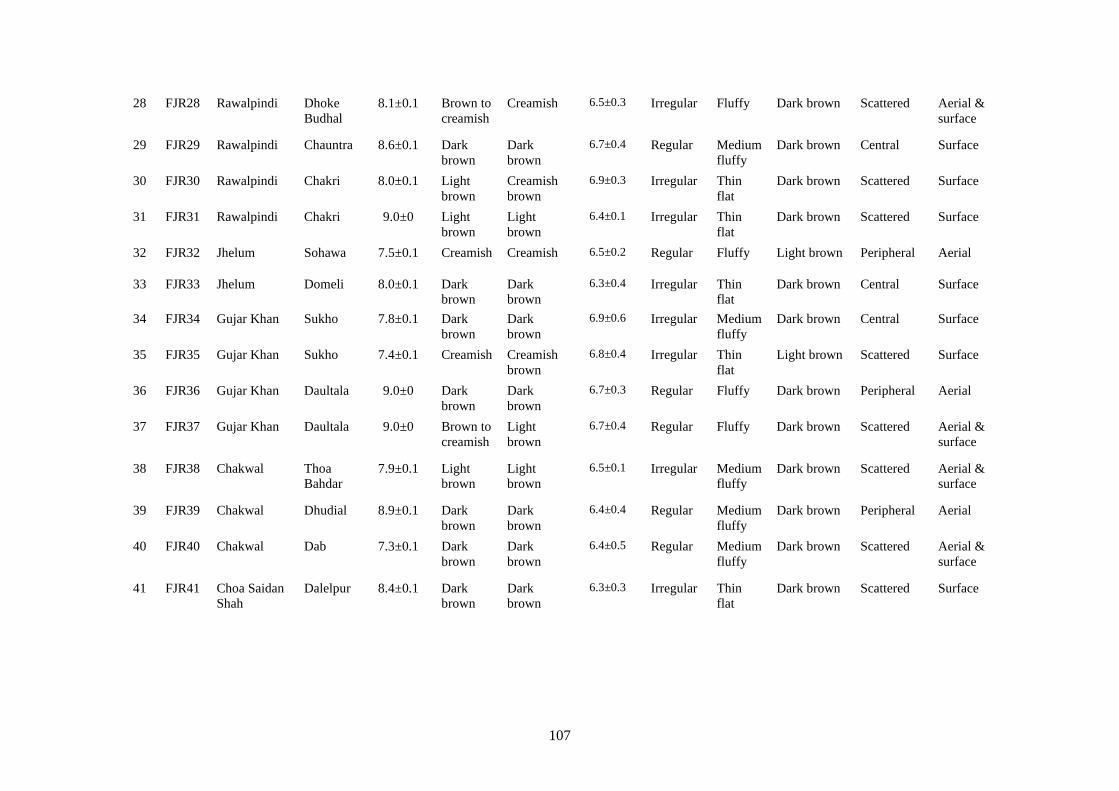
107
28 FJR28 Rawalpindi Dhoke
Budhal
8.1±0.1 Brown to
creamish
Creamish 6.5±0.3 Irregular Fluffy Dark brown Scattered Aerial &
surface
29 FJR29 Rawalpindi Chauntra 8.6±0.1 Dark
brown
Dark
brown
6.7±0.4 Regular Medium
fluffy
Dark brown Central Surface
30 FJR30 Rawalpindi Chakri 8.0±0.1 Light
brown
Creamish
brown
6.9±0.3 Irregular Thin
flat
Dark brown Scattered Surface
31 FJR31 Rawalpindi Chakri 9.0±0 Light
brown
Light
brown
6.4±0.1 Irregular Thin
flat
Dark brown Scattered Surface
32 FJR32 Jhelum Sohawa 7.5±0.1 Creamish Creamish 6.5±0.2 Regular Fluffy Light brown Peripheral Aerial
33 FJR33 Jhelum Domeli 8.0±0.1 Dark
brown
Dark
brown
6.3±0.4 Irregular Thin
flat
Dark brown Central Surface
34 FJR34 Gujar Khan Sukho 7.8±0.1 Dark
brown
Dark
brown
6.9±0.6 Irregular Medium
fluffy
Dark brown Central Surface
35 FJR35 Gujar Khan Sukho 7.4±0.1 Creamish Creamish
brown
6.8±0.4 Irregular Thin
flat
Light brown Scattered Surface
36 FJR36 Gujar Khan Daultala 9.0±0 Dark
brown
Dark
brown
6.7±0.3 Regular Fluffy Dark brown Peripheral Aerial
37 FJR37 Gujar Khan Daultala 9.0±0 Brown to
creamish
Light
brown
6.7±0.4 Regular Fluffy Dark brown Scattered Aerial &
surface
38 FJR38 Chakwal Thoa
Bahdar
7.9±0.1 Light
brown
Light
brown
6.5±0.1 Irregular Medium
fluffy
Dark brown Scattered Aerial &
surface
39 FJR39 Chakwal Dhudial 8.9±0.1 Dark
brown
Dark
brown
6.4±0.4 Regular Medium
fluffy
Dark brown Peripheral Aerial
40 FJR40 Chakwal Dab 7.3±0.1 Dark
brown
Dark
brown
6.4±0.5 Regular Medium
fluffy
Dark brown Scattered Aerial &
surface
41 FJR41 Choa Saidan
Shah
Dalelpur 8.4±0.1 Dark
brown
Dark
brown
6.3±0.3 Irregular Thin
flat
Dark brown Scattered Surface
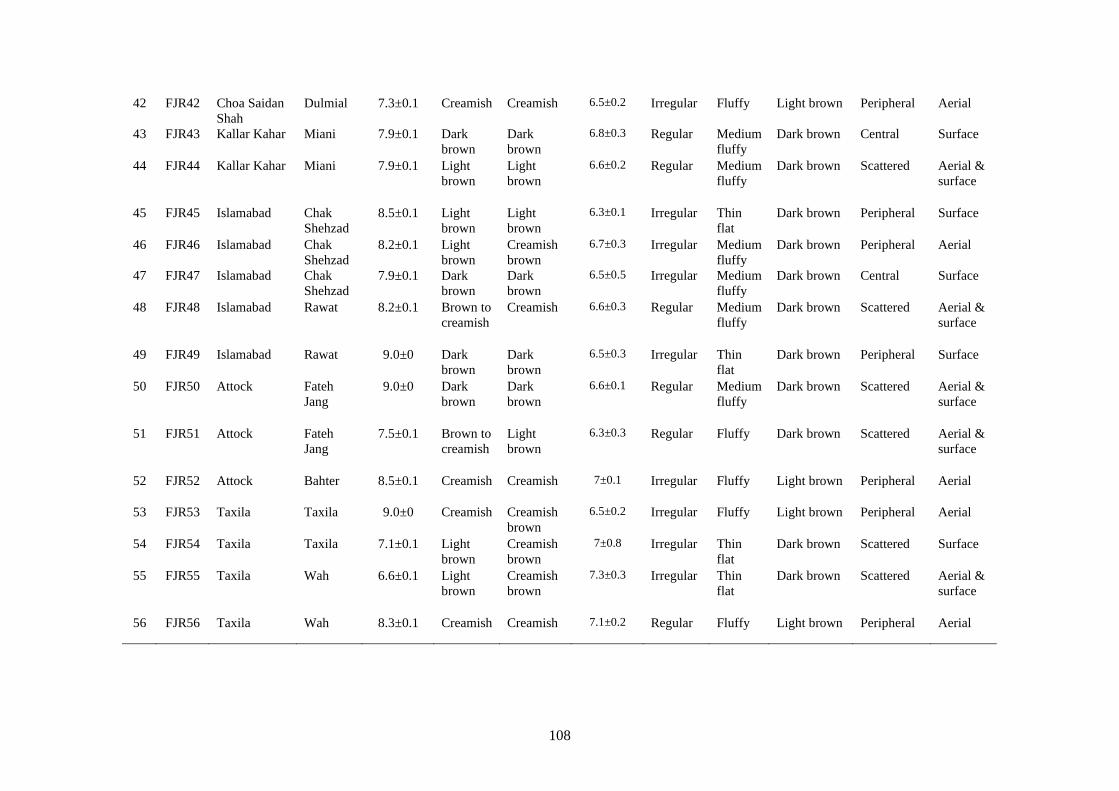
108
42 FJR42 Choa Saidan
Shah
Dulmial 7.3±0.1 Creamish Creamish 6.5±0.2 Irregular Fluffy Light brown Peripheral Aerial
43 FJR43 Kallar Kahar Miani 7.9±0.1 Dark
brown
Dark
brown
6.8±0.3 Regular Medium
fluffy
Dark brown Central Surface
44 FJR44 Kallar Kahar Miani 7.9±0.1 Light
brown
Light
brown
6.6±0.2 Regular Medium
fluffy
Dark brown Scattered Aerial &
surface
45 FJR45 Islamabad Chak
Shehzad
8.5±0.1 Light
brown
Light
brown
6.3±0.1 Irregular Thin
flat
Dark brown Peripheral Surface
46 FJR46 Islamabad Chak
Shehzad
8.2±0.1 Light
brown
Creamish
brown
6.7±0.3 Irregular Medium
fluffy
Dark brown Peripheral Aerial
47 FJR47 Islamabad Chak
Shehzad
7.9±0.1 Dark
brown
Dark
brown
6.5±0.5 Irregular Medium
fluffy
Dark brown Central Surface
48 FJR48 Islamabad Rawat 8.2±0.1 Brown to
creamish
Creamish 6.6±0.3 Regular Medium
fluffy
Dark brown Scattered Aerial &
surface
49 FJR49 Islamabad Rawat 9.0±0 Dark
brown
Dark
brown
6.5±0.3 Irregular Thin
flat
Dark brown Peripheral Surface
50 FJR50 Attock Fateh
Jang
9.0±0 Dark
brown
Dark
brown
6.6±0.1 Regular Medium
fluffy
Dark brown Scattered Aerial &
surface
51 FJR51 Attock Fateh
Jang
7.5±0.1 Brown to
creamish
Light
brown
6.3±0.3 Regular Fluffy Dark brown Scattered Aerial &
surface
52 FJR52 Attock Bahter 8.5±0.1 Creamish Creamish 7±0.1 Irregular Fluffy Light brown Peripheral Aerial
53 FJR53 Taxila Taxila 9.0±0 Creamish Creamish
brown
6.5±0.2 Irregular Fluffy Light brown Peripheral Aerial
54 FJR54 Taxila Taxila 7.1±0.1 Light
brown
Creamish
brown
7±0.8 Irregular Thin
flat
Dark brown Scattered Surface
55 FJR55 Taxila Wah 6.6±0.1 Light
brown
Creamish
brown
7.3±0.3 Irregular Thin
flat
Dark brown Scattered Aerial &
surface
56 FJR56 Taxila Wah 8.3±0.1 Creamish Creamish 7.1±0.2 Regular Fluffy Light brown Peripheral Aerial
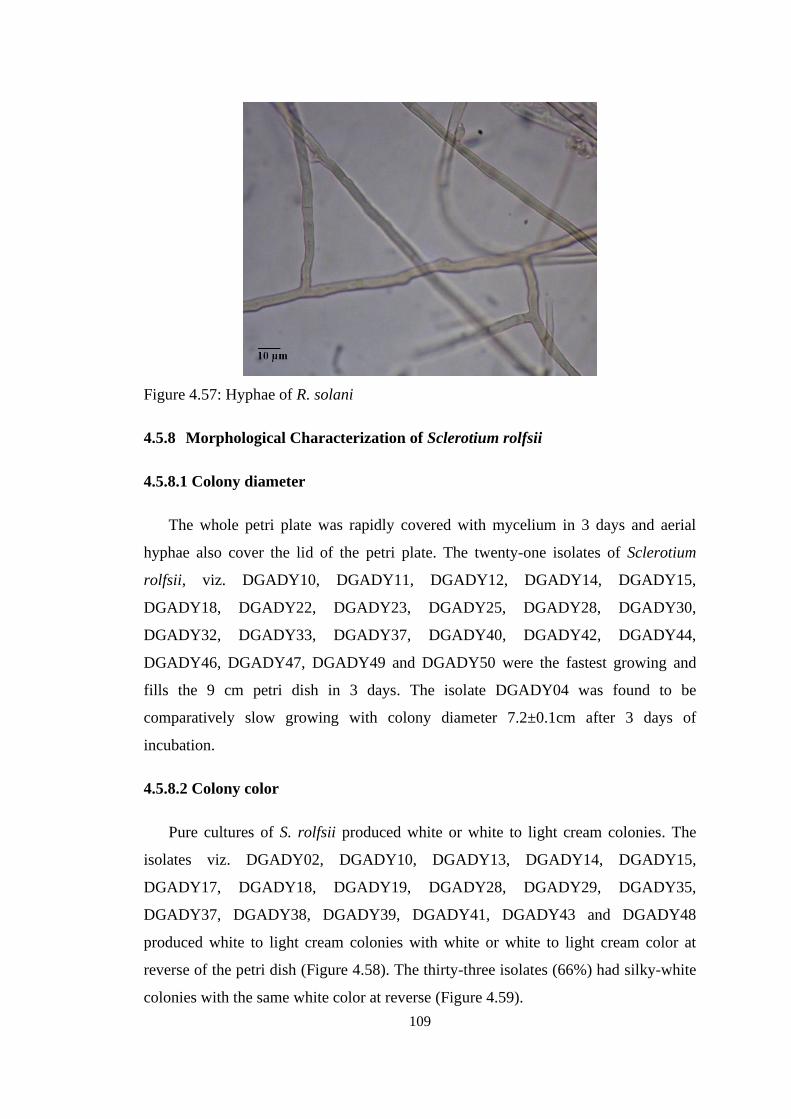
109
Figure 4.57: Hyphae of R. solani
4.5.8 Morphological Characterization of Sclerotium rolfsii
4.5.8.1 Colony diameter
The whole petri plate was rapidly covered with mycelium in 3 days and aerial
hyphae also cover the lid of the petri plate. The twenty-one isolates of Sclerotium
rolfsii, viz. DGADY10, DGADY11, DGADY12, DGADY14, DGADY15,
DGADY18, DGADY22, DGADY23, DGADY25, DGADY28, DGADY30,
DGADY32, DGADY33, DGADY37, DGADY40, DGADY42, DGADY44,
DGADY46, DGADY47, DGADY49 and DGADY50 were the fastest growing and
fills the 9 cm petri dish in 3 days. The isolate DGADY04 was found to be
comparatively slow growing with colony diameter 7.2±0.1cm after 3 days of
incubation.
4.5.8.2 Colony color
Pure cultures of S. rolfsii produced white or white to light cream colonies. The
isolates viz. DGADY02, DGADY10, DGADY13, DGADY14, DGADY15,
DGADY17, DGADY18, DGADY19, DGADY28, DGADY29, DGADY35,
DGADY37, DGADY38, DGADY39, DGADY41, DGADY43 and DGADY48
produced white to light cream colonies with white or white to light cream color at
reverse of the petri dish (Figure 4.58). The thirty-three isolates (66%) had silky-white
colonies with the same white color at reverse (Figure 4.59).
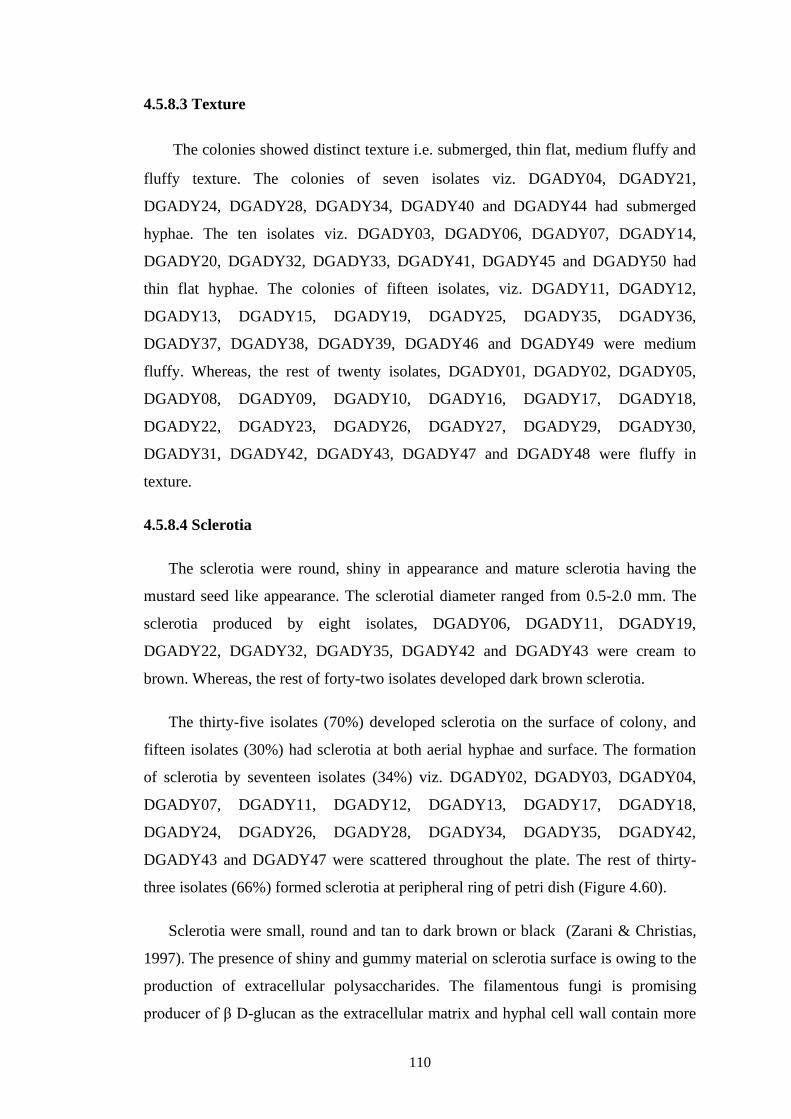
110
4.5.8.3 Texture
The colonies showed distinct texture i.e. submerged, thin flat, medium fluffy and
fluffy texture. The colonies of seven isolates viz. DGADY04, DGADY21,
DGADY24, DGADY28, DGADY34, DGADY40 and DGADY44 had submerged
hyphae. The ten isolates viz. DGADY03, DGADY06, DGADY07, DGADY14,
DGADY20, DGADY32, DGADY33, DGADY41, DGADY45 and DGADY50 had
thin flat hyphae. The colonies of fifteen isolates, viz. DGADY11, DGADY12,
DGADY13, DGADY15, DGADY19, DGADY25, DGADY35, DGADY36,
DGADY37, DGADY38, DGADY39, DGADY46 and DGADY49 were medium
fluffy. Whereas, the rest of twenty isolates, DGADY01, DGADY02, DGADY05,
DGADY08, DGADY09, DGADY10, DGADY16, DGADY17, DGADY18,
DGADY22, DGADY23, DGADY26, DGADY27, DGADY29, DGADY30,
DGADY31, DGADY42, DGADY43, DGADY47 and DGADY48 were fluffy in
texture.
4.5.8.4 Sclerotia
The sclerotia were round, shiny in appearance and mature sclerotia having the
mustard seed like appearance. The sclerotial diameter ranged from 0.5-2.0 mm. The
sclerotia produced by eight isolates, DGADY06, DGADY11, DGADY19,
DGADY22, DGADY32, DGADY35, DGADY42 and DGADY43 were cream to
brown. Whereas, the rest of forty-two isolates developed dark brown sclerotia.
The thirty-five isolates (70%) developed sclerotia on the surface of colony, and
fifteen isolates (30%) had sclerotia at both aerial hyphae and surface. The formation
of sclerotia by seventeen isolates (34%) viz. DGADY02, DGADY03, DGADY04,
DGADY07, DGADY11, DGADY12, DGADY13, DGADY17, DGADY18,
DGADY24, DGADY26, DGADY28, DGADY34, DGADY35, DGADY42,
DGADY43 and DGADY47 were scattered throughout the plate. The rest of thirty-
three isolates (66%) formed sclerotia at peripheral ring of petri dish (Figure 4.60).
Sclerotia were small, round and tan to dark brown or black (Zarani & Christias,
1997). The presence of shiny and gummy material on sclerotia surface is owing to the
production of extracellular polysaccharides. The filamentous fungi is promising
producer of β D-glucan as the extracellular matrix and hyphal cell wall contain more
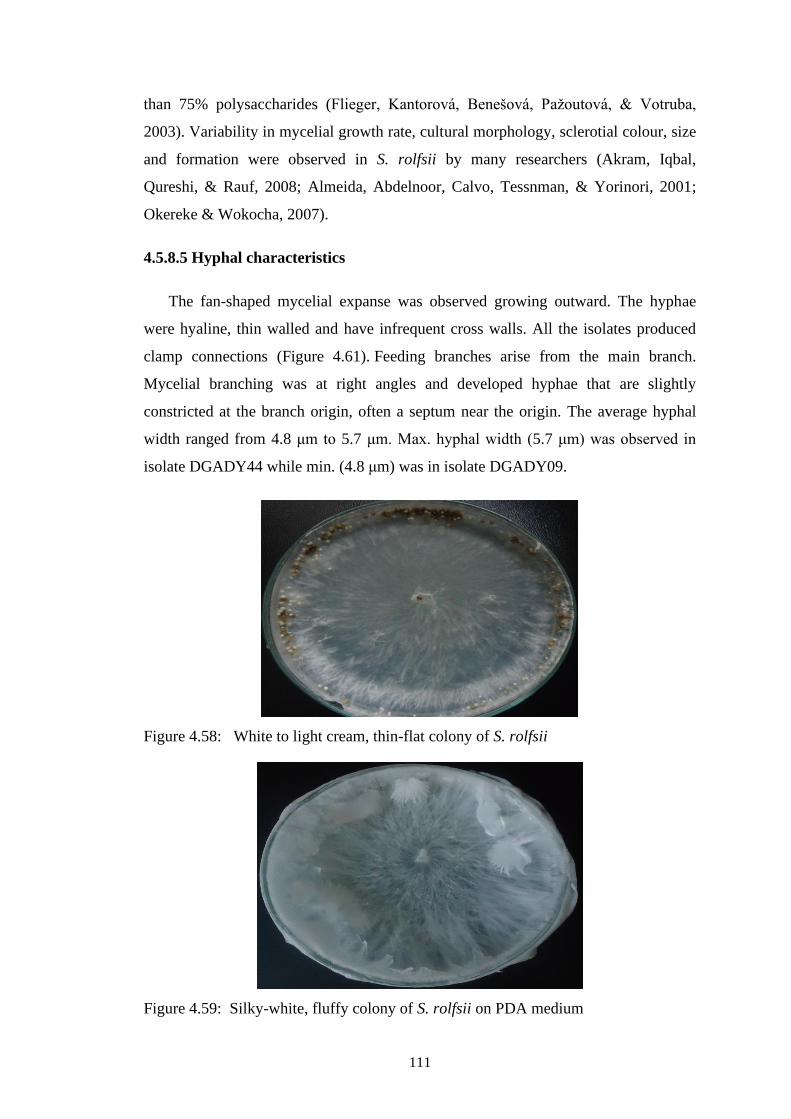
111
than 75% polysaccharides (Flieger, Kantorová, Benešová, Pažoutová, & Votruba,
2003). Variability in mycelial growth rate, cultural morphology, sclerotial colour, size
and formation were observed in S. rolfsii by many researchers (Akram, Iqbal,
Qureshi, & Rauf, 2008; Almeida, Abdelnoor, Calvo, Tessnman, & Yorinori, 2001;
Okereke & Wokocha, 2007).
4.5.8.5 Hyphal characteristics
The fan-shaped mycelial expanse was observed growing outward. The hyphae
were hyaline, thin walled and have infrequent cross walls. All the isolates produced
clamp connections (Figure 4.61). Feeding branches arise from the main branch.
Mycelial branching was at right angles and developed hyphae that are slightly
constricted at the branch origin, often a septum near the origin. The average hyphal
width ranged from 4.8 μm to 5.7 μm. Max. hyphal width (5.7 μm) was observed in
isolate DGADY44 while min. (4.8 μm) was in isolate DGADY09.
Figure 4.58: White to light cream, thin-flat colony of S. rolfsii
Figure 4.59: Silky-white, fluffy colony of S. rolfsii on PDA medium
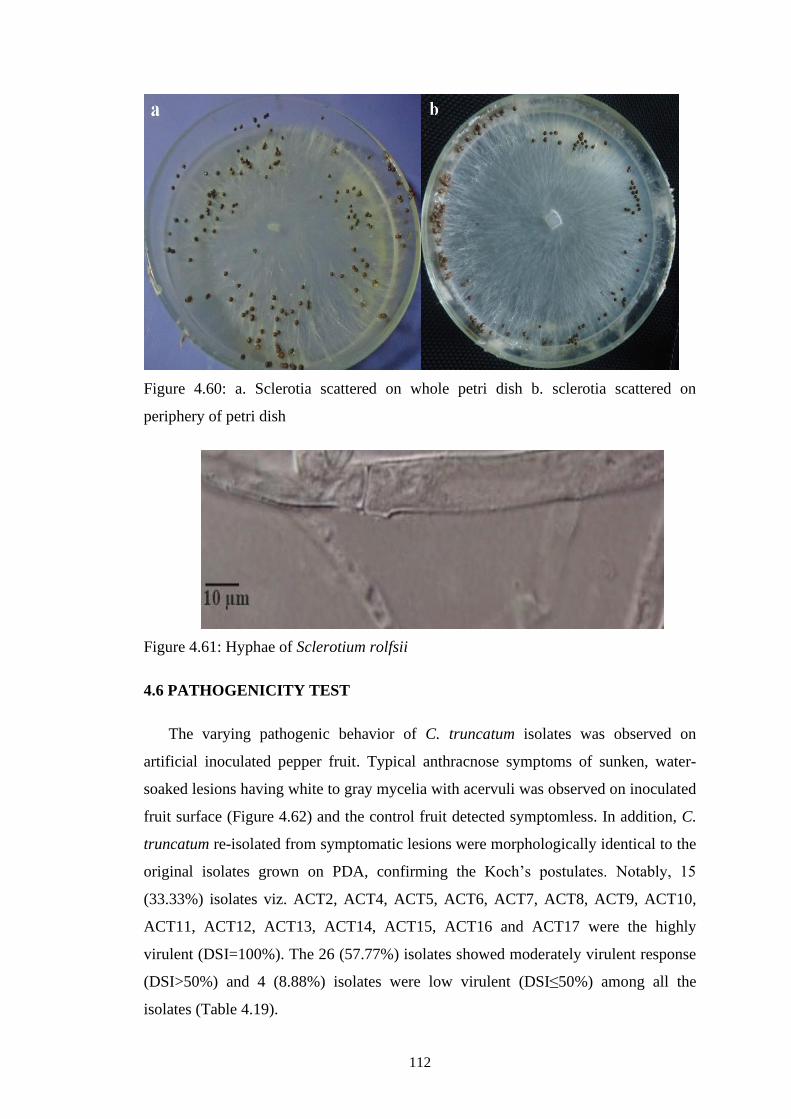
112
Figure 4.60: a. Sclerotia scattered on whole petri dish b. sclerotia scattered on
periphery of petri dish
Figure 4.61: Hyphae of Sclerotium rolfsii
4.6 PATHOGENICITY TEST
The varying pathogenic behavior of C. truncatum isolates was observed on
artificial inoculated pepper fruit. Typical anthracnose symptoms of sunken, water-
soaked lesions having white to gray mycelia with acervuli was observed on inoculated
fruit surface (Figure 4.62) and the control fruit detected symptomless. In addition, C.
truncatum re-isolated from symptomatic lesions were morphologically identical to the
original isolates grown on PDA, confirming the Koch’s postulates. Notably, 15
(33.33%) isolates viz. ACT2, ACT4, ACT5, ACT6, ACT7, ACT8, ACT9, ACT10,
ACT11, ACT12, ACT13, ACT14, ACT15, ACT16 and ACT17 were the highly
virulent (DSI=100%). The 26 (57.77%) isolates showed moderately virulent response
(DSI>50%) and 4 (8.88%) isolates were low virulent (DSI≤50%) among all the
isolates (Table 4.19).
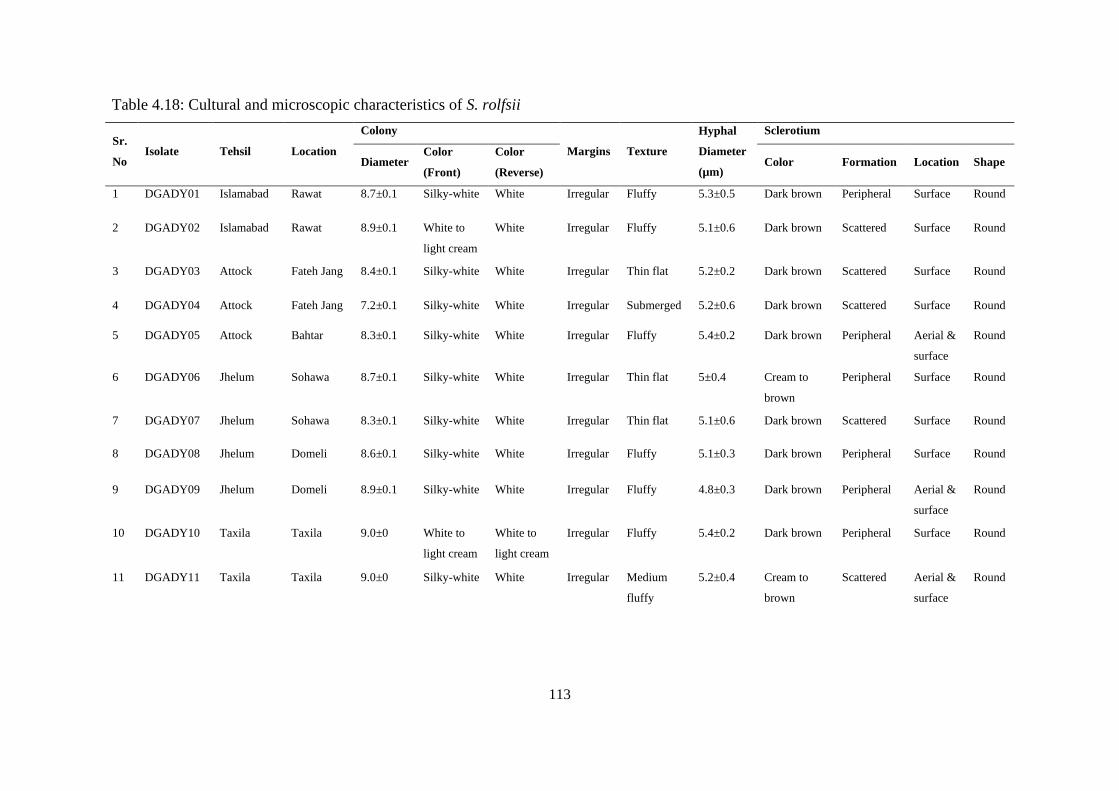
113
Table 4.18: Cultural and microscopic characteristics of S. rolfsii
Sr.
No Isolate Tehsil Location
Colony
Margins Texture
Hyphal
Diameter
(µm)
Sclerotium
Diameter Color
(Front)
Color
(Reverse) Color Formation Location Shape
1 DGADY01 Islamabad Rawat 8.7±0.1 Silky-white White Irregular Fluffy 5.3±0.5 Dark brown Peripheral Surface Round
2 DGADY02 Islamabad Rawat 8.9±0.1 White to
light cream
White Irregular Fluffy 5.1±0.6 Dark brown Scattered Surface Round
3 DGADY03 Attock Fateh Jang 8.4±0.1 Silky-white White Irregular Thin flat 5.2±0.2 Dark brown Scattered Surface Round
4 DGADY04 Attock Fateh Jang 7.2±0.1 Silky-white White Irregular Submerged 5.2±0.6 Dark brown Scattered Surface Round
5 DGADY05 Attock Bahtar 8.3±0.1 Silky-white White Irregular Fluffy 5.4±0.2 Dark brown Peripheral Aerial &
surface
Round
6 DGADY06 Jhelum Sohawa 8.7±0.1 Silky-white White Irregular Thin flat 5±0.4 Cream to
brown
Peripheral Surface Round
7 DGADY07 Jhelum Sohawa 8.3±0.1 Silky-white White Irregular Thin flat 5.1±0.6 Dark brown Scattered Surface Round
8 DGADY08 Jhelum Domeli 8.6±0.1 Silky-white White Irregular Fluffy 5.1±0.3 Dark brown Peripheral Surface Round
9 DGADY09 Jhelum Domeli 8.9±0.1 Silky-white White Irregular Fluffy 4.8±0.3 Dark brown Peripheral Aerial &
surface
Round
10 DGADY10 Taxila Taxila 9.0±0 White to
light cream
White to
light cream
Irregular Fluffy 5.4±0.2 Dark brown Peripheral Surface Round
11 DGADY11 Taxila Taxila 9.0±0 Silky-white White Irregular Medium
fluffy
5.2±0.4 Cream to
brown
Scattered Aerial &
surface
Round
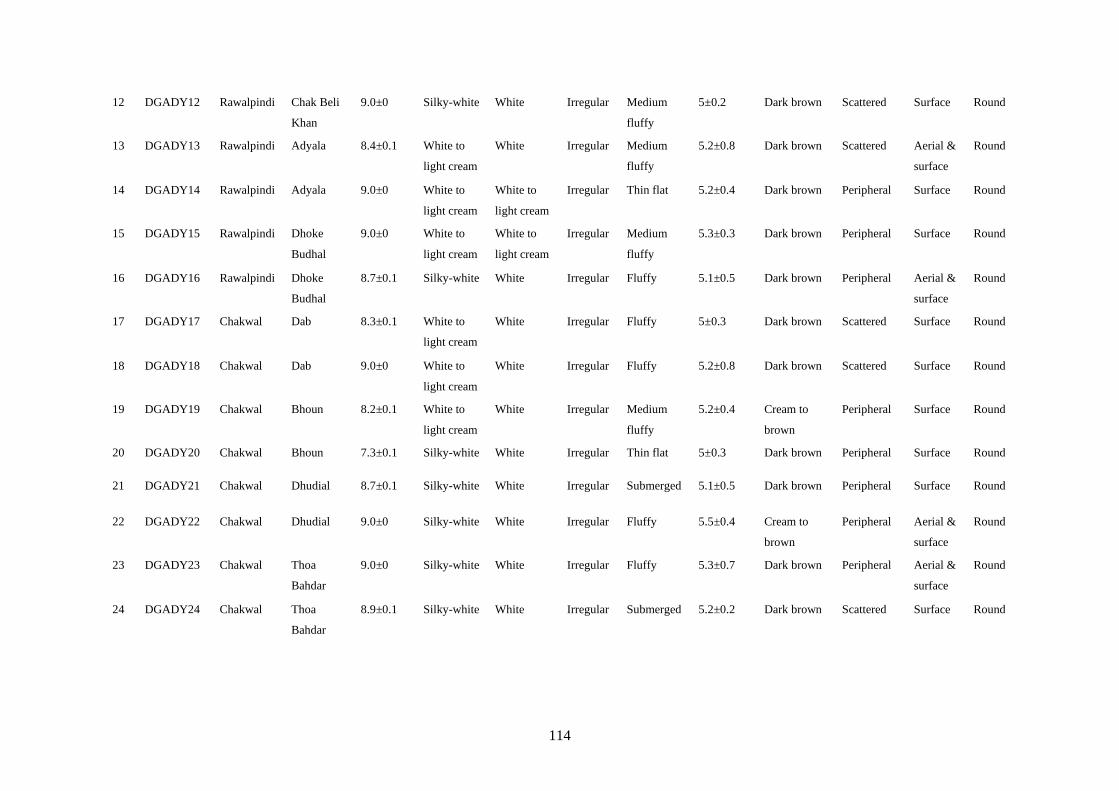
114
12 DGADY12 Rawalpindi Chak Beli
Khan
9.0±0 Silky-white White Irregular Medium
fluffy
5±0.2 Dark brown Scattered Surface Round
13 DGADY13 Rawalpindi Adyala 8.4±0.1 White to
light cream
White Irregular Medium
fluffy
5.2±0.8 Dark brown Scattered Aerial &
surface
Round
14 DGADY14 Rawalpindi Adyala 9.0±0 White to
light cream
White to
light cream
Irregular Thin flat 5.2±0.4 Dark brown Peripheral Surface Round
15 DGADY15 Rawalpindi Dhoke
Budhal
9.0±0 White to
light cream
White to
light cream
Irregular Medium
fluffy
5.3±0.3 Dark brown Peripheral Surface Round
16 DGADY16 Rawalpindi Dhoke
Budhal
8.7±0.1 Silky-white White Irregular Fluffy 5.1±0.5 Dark brown Peripheral Aerial &
surface
Round
17 DGADY17 Chakwal Dab 8.3±0.1 White to
light cream
White Irregular Fluffy 5±0.3 Dark brown Scattered Surface Round
18 DGADY18 Chakwal Dab 9.0±0 White to
light cream
White Irregular Fluffy 5.2±0.8 Dark brown Scattered Surface Round
19 DGADY19 Chakwal Bhoun 8.2±0.1 White to
light cream
White Irregular Medium
fluffy
5.2±0.4 Cream to
brown
Peripheral Surface Round
20 DGADY20 Chakwal Bhoun 7.3±0.1 Silky-white White Irregular Thin flat 5±0.3 Dark brown Peripheral Surface Round
21 DGADY21 Chakwal Dhudial 8.7±0.1 Silky-white White Irregular Submerged 5.1±0.5 Dark brown Peripheral Surface Round
22 DGADY22 Chakwal Dhudial 9.0±0 Silky-white White Irregular Fluffy 5.5±0.4 Cream to
brown
Peripheral Aerial &
surface
Round
23 DGADY23 Chakwal Thoa
Bahdar
9.0±0 Silky-white White Irregular Fluffy 5.3±0.7 Dark brown Peripheral Aerial &
surface
Round
24 DGADY24 Chakwal Thoa
Bahdar
8.9±0.1 Silky-white White Irregular Submerged 5.2±0.2 Dark brown Scattered Surface Round
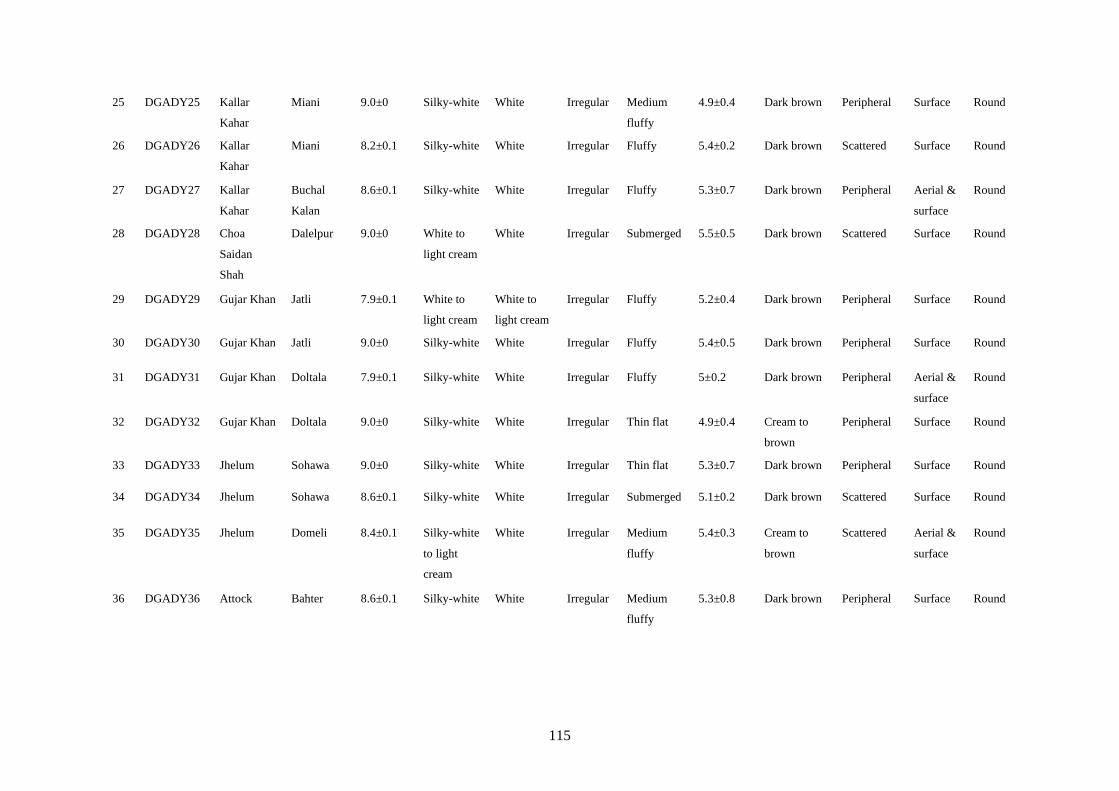
115
25 DGADY25 Kallar
Kahar
Miani 9.0±0 Silky-white White Irregular Medium
fluffy
4.9±0.4 Dark brown Peripheral Surface Round
26 DGADY26 Kallar
Kahar
Miani 8.2±0.1 Silky-white White Irregular Fluffy 5.4±0.2 Dark brown Scattered Surface Round
27 DGADY27 Kallar
Kahar
Buchal
Kalan
8.6±0.1 Silky-white White Irregular Fluffy 5.3±0.7 Dark brown Peripheral Aerial &
surface
Round
28 DGADY28 Choa
Saidan
Shah
Dalelpur 9.0±0 White to
light cream
White Irregular Submerged 5.5±0.5 Dark brown Scattered Surface Round
29 DGADY29 Gujar Khan Jatli 7.9±0.1 White to
light cream
White to
light cream
Irregular Fluffy 5.2±0.4 Dark brown Peripheral Surface Round
30 DGADY30 Gujar Khan Jatli 9.0±0 Silky-white White Irregular Fluffy 5.4±0.5 Dark brown Peripheral Surface Round
31 DGADY31 Gujar Khan Doltala 7.9±0.1 Silky-white White Irregular Fluffy 5±0.2 Dark brown Peripheral Aerial &
surface
Round
32 DGADY32 Gujar Khan Doltala 9.0±0 Silky-white White Irregular Thin flat 4.9±0.4 Cream to
brown
Peripheral Surface Round
33 DGADY33 Jhelum Sohawa 9.0±0 Silky-white White Irregular Thin flat 5.3±0.7 Dark brown Peripheral Surface Round
34 DGADY34 Jhelum Sohawa 8.6±0.1 Silky-white White Irregular Submerged 5.1±0.2 Dark brown Scattered Surface Round
35 DGADY35 Jhelum Domeli 8.4±0.1 Silky-white
to light
cream
White Irregular Medium
fluffy
5.4±0.3 Cream to
brown
Scattered Aerial &
surface
Round
36 DGADY36 Attock Bahter 8.6±0.1 Silky-white White Irregular Medium
fluffy
5.3±0.8 Dark brown Peripheral Surface Round
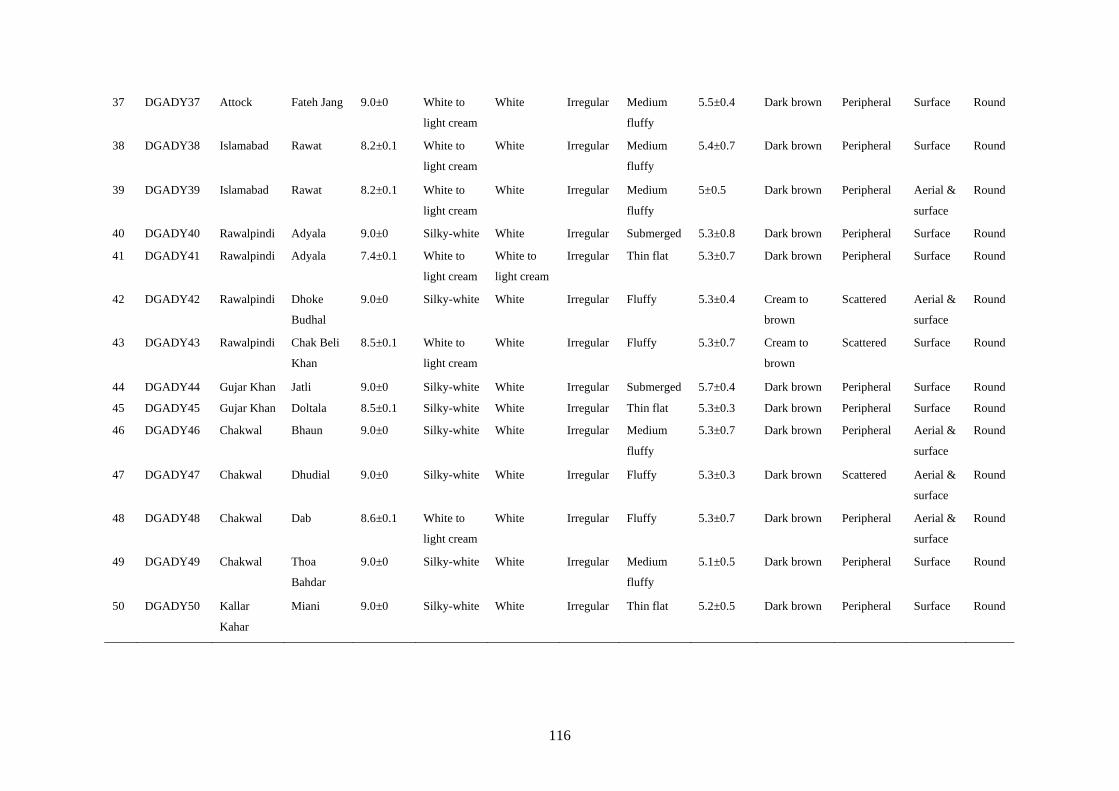
116
37 DGADY37 Attock Fateh Jang 9.0±0 White to
light cream
White Irregular Medium
fluffy
5.5±0.4 Dark brown Peripheral Surface Round
38 DGADY38 Islamabad Rawat 8.2±0.1 White to
light cream
White Irregular Medium
fluffy
5.4±0.7 Dark brown Peripheral Surface Round
39 DGADY39 Islamabad Rawat 8.2±0.1 White to
light cream
White Irregular Medium
fluffy
5±0.5 Dark brown Peripheral Aerial &
surface
Round
40 DGADY40 Rawalpindi Adyala 9.0±0 Silky-white White Irregular Submerged 5.3±0.8 Dark brown Peripheral Surface Round
41 DGADY41 Rawalpindi Adyala 7.4±0.1 White to
light cream
White to
light cream
Irregular Thin flat 5.3±0.7 Dark brown Peripheral Surface Round
42 DGADY42 Rawalpindi Dhoke
Budhal
9.0±0 Silky-white White Irregular Fluffy 5.3±0.4 Cream to
brown
Scattered Aerial &
surface
Round
43 DGADY43 Rawalpindi Chak Beli
Khan
8.5±0.1 White to
light cream
White Irregular Fluffy 5.3±0.7 Cream to
brown
Scattered Surface Round
44 DGADY44 Gujar Khan Jatli 9.0±0 Silky-white White Irregular Submerged 5.7±0.4 Dark brown Peripheral Surface Round
45 DGADY45 Gujar Khan Doltala 8.5±0.1 Silky-white White Irregular Thin flat 5.3±0.3 Dark brown Peripheral Surface Round
46 DGADY46 Chakwal Bhaun 9.0±0 Silky-white White Irregular Medium
fluffy
5.3±0.7 Dark brown Peripheral Aerial &
surface
Round
47 DGADY47 Chakwal Dhudial 9.0±0 Silky-white White Irregular Fluffy 5.3±0.3 Dark brown Scattered Aerial &
surface
Round
48 DGADY48 Chakwal Dab 8.6±0.1 White to
light cream
White Irregular Fluffy 5.3±0.7 Dark brown Peripheral Aerial &
surface
Round
49 DGADY49 Chakwal Thoa
Bahdar
9.0±0 Silky-white White Irregular Medium
fluffy
5.1±0.5 Dark brown Peripheral Surface Round
50 DGADY50 Kallar
Kahar
Miani 9.0±0 Silky-white White Irregular Thin flat 5.2±0.5 Dark brown Peripheral Surface Round
117
In a study, symptoms produced by C. truncatum isolates on artificially inoculated
different pepper cultivars were dry, brown-black lesions. Whereas, C. gloeosporiodes
isolates produced soft, sunken and water-soaked lesions (Hema Ramdial &
Rampersad, 2015). Pathogenicity testing of C. truncatum on pepper developed
abundant black acervuli with setae and on decaying fruits dirty white conidial masses
were produced (Fangling Liu et al., 2016). Pathogenicity of C. truncatum isolates
were evaluated with a cross-inoculation assay using pepper, physic nut and papaya.
The results showed that the isolates could infect the three host, regardless of the
inoculation method (Torres‐Calzada et al., 2018).
The isolates representative of the two colony types (F. incarnatum and F.
proliferatum) showed typical symptoms of Fusarium rot on detached bell pepper fruit.
After 5 days, white mycelial growth surrounded by water-soaked, greenish to light
brown necrotic lesions appeared identical to the symptomatic fruits observed in the
greenhouses and open fields (Figure 4.63). However, no symptoms were shown on
control fruits. Differences in virulence among the isolates were observed. The 10
(25%) isolates viz. FICW3, FICW5, FICW7, FICW8, FICW10, FICW11, FICW12,
FICW15, FICW16 and FICW17 were the highly virulent. The 18 (45%) isolates
exhibited moderately virulent response. However, 12 (30%) showed low virulence
towards disease (Table 4.20). In a study, the isolates of FIESC were inoculated with
105 conidia/mL developed necrotic lesions at the point of inoculation (H Ramdial,
Hosein, & Rampersad, 2016). In another experiment, isolates of F. lactis caused
infection on pepper fruits. Whereas, isolates of F. proliferatum caused internal fruit
infection (Yang, Kharbanda, Howard, & Mirza, 2009).
Pathogenicity test showed that all isolates of B. cinerea were able to infect the bell
pepper fruits. After 5 days, the symptoms produced on artificially inoculated fruits
identical to those observed in the field and showed water-soaked lesions, with
grayish-brown hyphae that were later covered with conidia and conidiophores. The
fruit become soft and rotted (Figure 4.64). However, the degree of aggressiveness
varied among the isolates. Notably, 10 (25%) isolates viz. NRCB03, NRCB07,
NRCB11, NRCB18, NRCB22, NRCB28, NRCB30, NRCB35, NRCB39 and
NRCB40 manifested highly virulent response. In contrast, 28 (70%) isolates were
118
moderate in virulence and only 2 (5%) isolates viz. NRCB16 and NRCB27 exhibited
low virulence (Table 4.21). Three fruits each of C. annuum var. grossum and C.
annuum cv. Madrid were pin-pricked and inoculated with B. cinerea (1×10⁶
conidia/mL). Inoculated fruits developed soft, irregular, grayish-brown lesions
(Huang & Sung, 2017).
All 36 isolates of A. alternata produced typical symptoms on artificially
inoculated bell pepper fruit after 5 days. These symptoms included grayish-black
lesions covered with black spores. The decayed fruit becomes water-soaked, soft and
shriveled (Figure 4.65). The 6 (22.22%) isolates manifested high virulence. In
contrast, 24 (66.66%) isolates were moderately virulent and 4 (11.11%) isolates viz.
ASA7, ASA15, ASA23 and ASA30 showed low virulence (Table 4.22).
The varying pathogenic behavior of F. equiseti isolates was observed on
artificially inoculated young bell pepper seedlings after 10 days. Typical Fusarium
root rot symptoms include leaf chlorosis, wilting and leaf dropping (Figure 4.66).
Infected plants had light to dark brown discolored and rotted roots. Light to dark
brown vascular discoloration of internal portion of stem, resembled those observed in
the field. The 7 (17.07%) isolates viz. FJH4, FJH12, FJH15, FJH16, FJH27, FJH33
and FJH37 were found to be highly virulent. In contrast, 26 (63.41%) isolates
exhibited moderate virulence. However, 9 (21.95%) isolates viz. FJH7, FJH9, FJH14,
FJH18, FJH20, FJH24, FJH25, FJH30 and FJH39 were low virulent (Table 4.23).
After 10 days, the young seedlings of bell pepper inoculated with Rhizoctonia
solani developed reddish-brown or black cankers on stem (Figure 4.67). The lesions
girdle the young stem with the progression of disease and plant tops collapsed. The 6
(10.71%) isolates viz. FJR01, FJR03, FJR04, FJR07, FJR09 and FJR14 were highly
virulent. However, 43 (76.78%) manifested moderate virulence and 7 (12.5%) isolates
were low virulent (Table 4.24).
The symptoms developed by Sclerotium rolfsii on artificial inoculated bell pepper
seedlings after 10 days include poor top growth and wilting of the leaves (Figure
4.68). Water-soaked lesions appeared on roots and lower stem part. White cottony
growth covered the infected root surface. The roots become rotted and plant
eventually died. Notably, 4 (8%) isolates viz. DGADY05, DGADY09, DGADY14
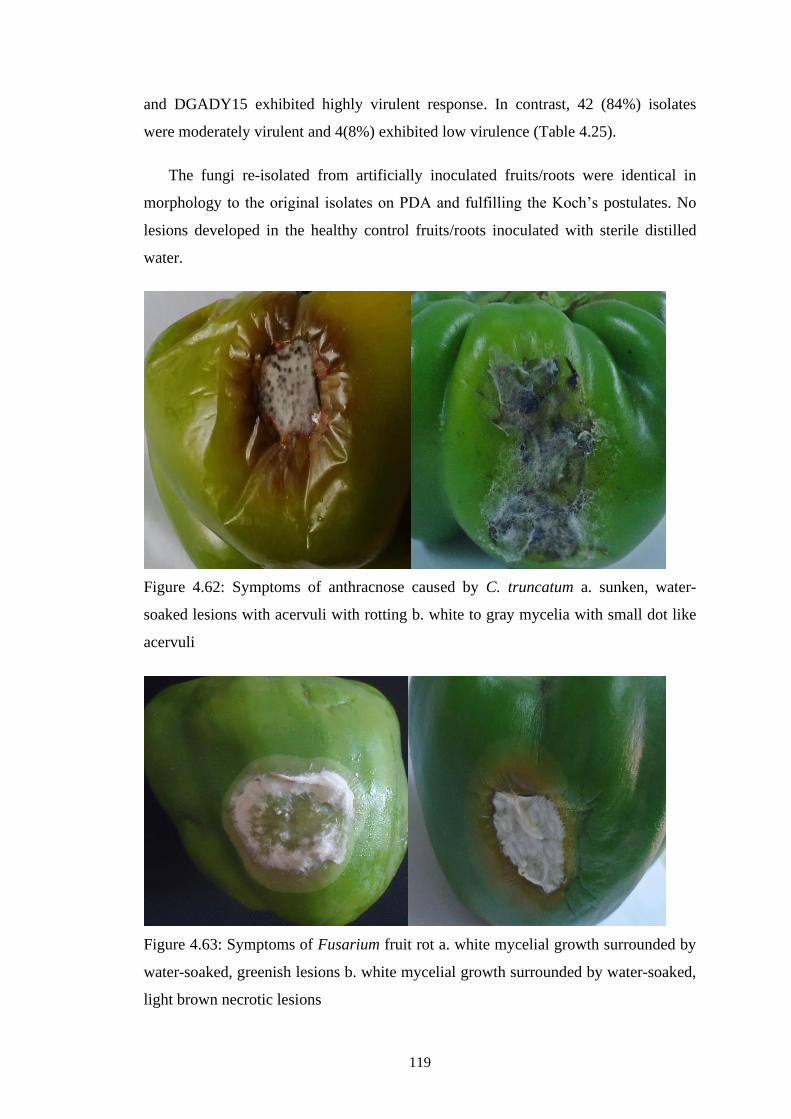
119
and DGADY15 exhibited highly virulent response. In contrast, 42 (84%) isolates
were moderately virulent and 4(8%) exhibited low virulence (Table 4.25).
The fungi re-isolated from artificially inoculated fruits/roots were identical in
morphology to the original isolates on PDA and fulfilling the Koch’s postulates. No
lesions developed in the healthy control fruits/roots inoculated with sterile distilled
water.
Figure 4.62: Symptoms of anthracnose caused by C. truncatum a. sunken, water-
soaked lesions with acervuli with rotting b. white to gray mycelia with small dot like
acervuli
Figure 4.63: Symptoms of Fusarium fruit rot a. white mycelial growth surrounded by
water-soaked, greenish lesions b. white mycelial growth surrounded by water-soaked,
light brown necrotic lesions
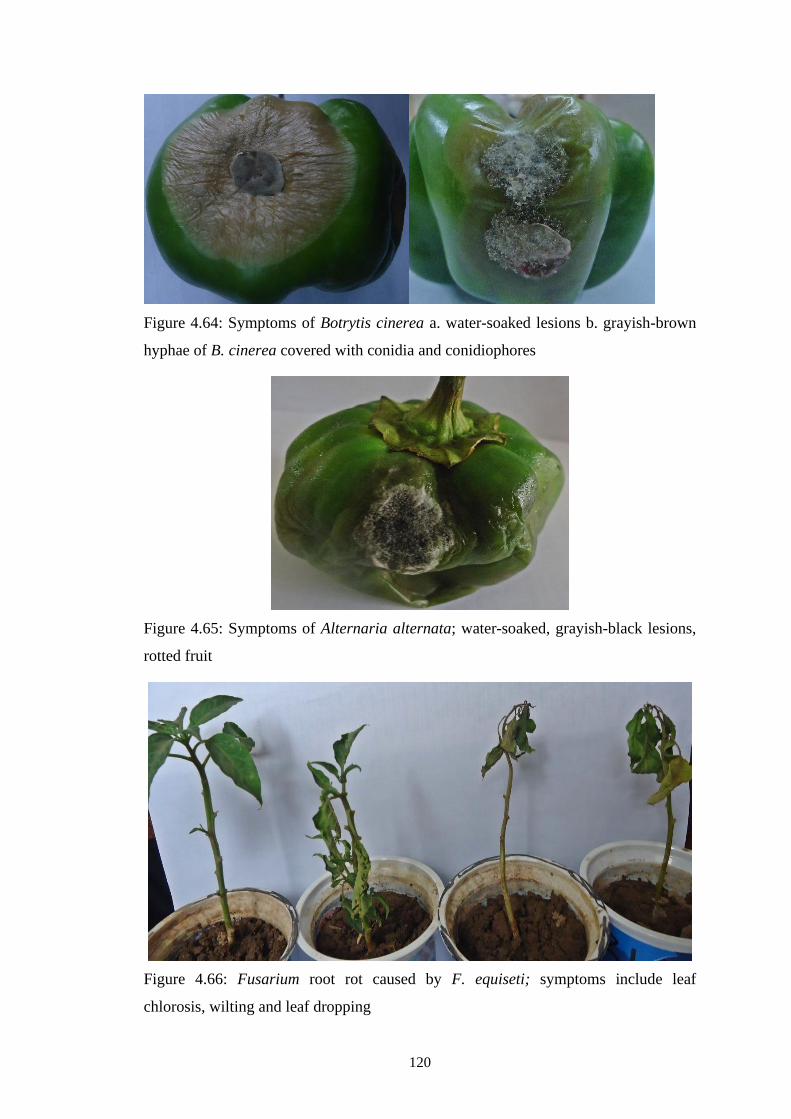
120
Figure 4.64: Symptoms of Botrytis cinerea a. water-soaked lesions b. grayish-brown
hyphae of B. cinerea covered with conidia and conidiophores
Figure 4.65: Symptoms of Alternaria alternata; water-soaked, grayish-black lesions,
rotted fruit
Figure 4.66: Fusarium root rot caused by F. equiseti; symptoms include leaf
chlorosis, wilting and leaf dropping
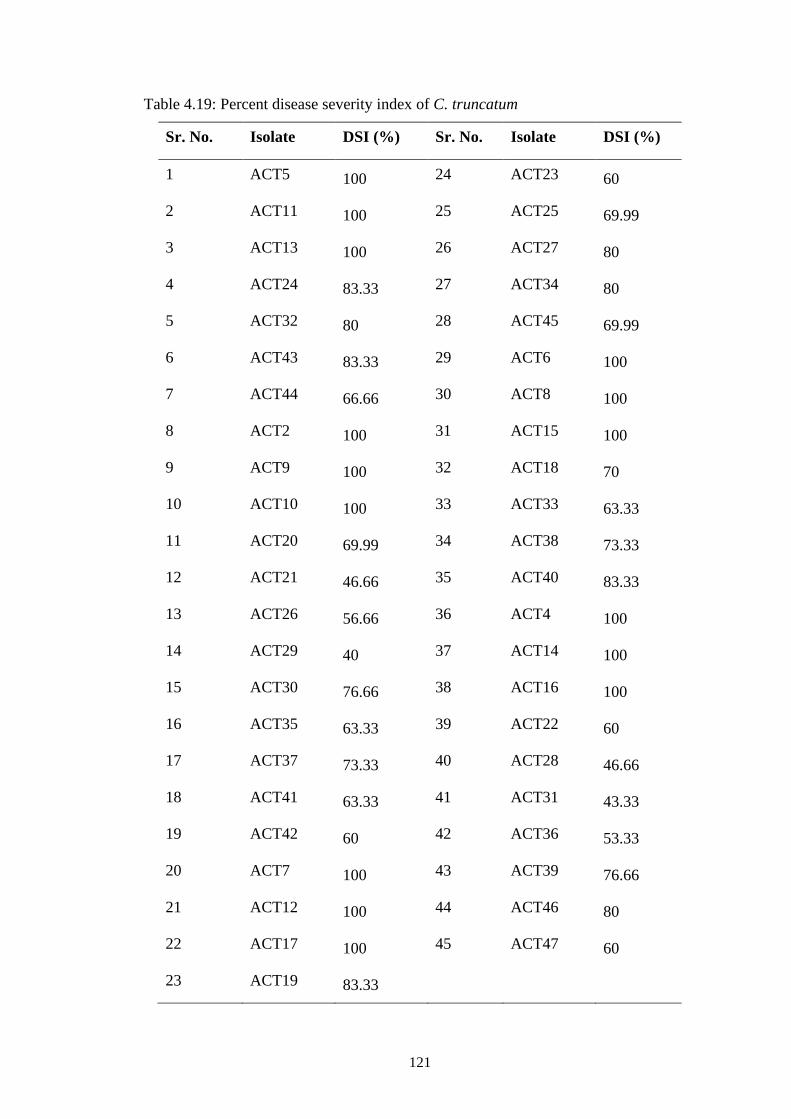
121
Table 4.19: Percent disease severity index of C. truncatum
Sr. No. Isolate DSI (%) Sr. No. Isolate DSI (%)
1 ACT5 100 24 ACT23 60
2 ACT11 100 25 ACT25 69.99
3 ACT13 100 26 ACT27 80
4 ACT24 83.33 27 ACT34 80
5 ACT32 80 28 ACT45 69.99
6 ACT43 83.33 29 ACT6 100
7 ACT44 66.66 30 ACT8 100
8 ACT2 100 31 ACT15 100
9 ACT9 100 32 ACT18 70
10 ACT10 100 33 ACT33 63.33
11 ACT20 69.99 34 ACT38 73.33
12 ACT21 46.66 35 ACT40 83.33
13 ACT26 56.66 36 ACT4 100
14 ACT29 40 37 ACT14 100
15 ACT30 76.66 38 ACT16 100
16 ACT35 63.33 39 ACT22 60
17 ACT37 73.33 40 ACT28 46.66
18 ACT41 63.33 41 ACT31 43.33
19 ACT42 60 42 ACT36 53.33
20 ACT7 100 43 ACT39 76.66
21 ACT12 100 44 ACT46 80
22 ACT17 100 45 ACT47 60
23 ACT19 83.33
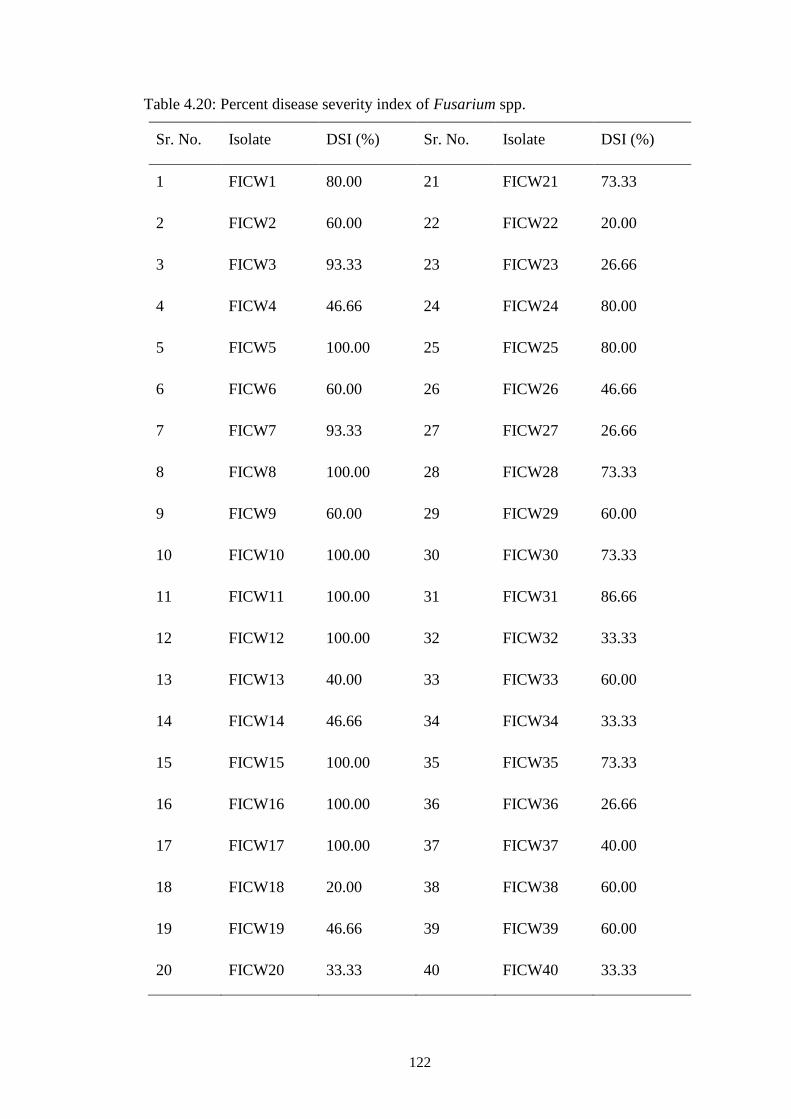
122
Table 4.20: Percent disease severity index of Fusarium spp.
Sr. No. Isolate DSI (%) Sr. No. Isolate DSI (%)
1 FICW1 80.00 21 FICW21 73.33
2 FICW2 60.00 22 FICW22 20.00
3 FICW3 93.33 23 FICW23 26.66
4 FICW4 46.66 24 FICW24 80.00
5 FICW5 100.00 25 FICW25 80.00
6 FICW6 60.00 26 FICW26 46.66
7 FICW7 93.33 27 FICW27 26.66
8 FICW8 100.00 28 FICW28 73.33
9 FICW9 60.00 29 FICW29 60.00
10 FICW10 100.00 30 FICW30 73.33
11 FICW11 100.00 31 FICW31 86.66
12 FICW12 100.00 32 FICW32 33.33
13 FICW13 40.00 33 FICW33 60.00
14 FICW14 46.66 34 FICW34 33.33
15 FICW15 100.00 35 FICW35 73.33
16 FICW16 100.00 36 FICW36 26.66
17 FICW17 100.00 37 FICW37 40.00
18 FICW18 20.00 38 FICW38 60.00
19 FICW19 46.66 39 FICW39 60.00
20 FICW20 33.33 40 FICW40 33.33
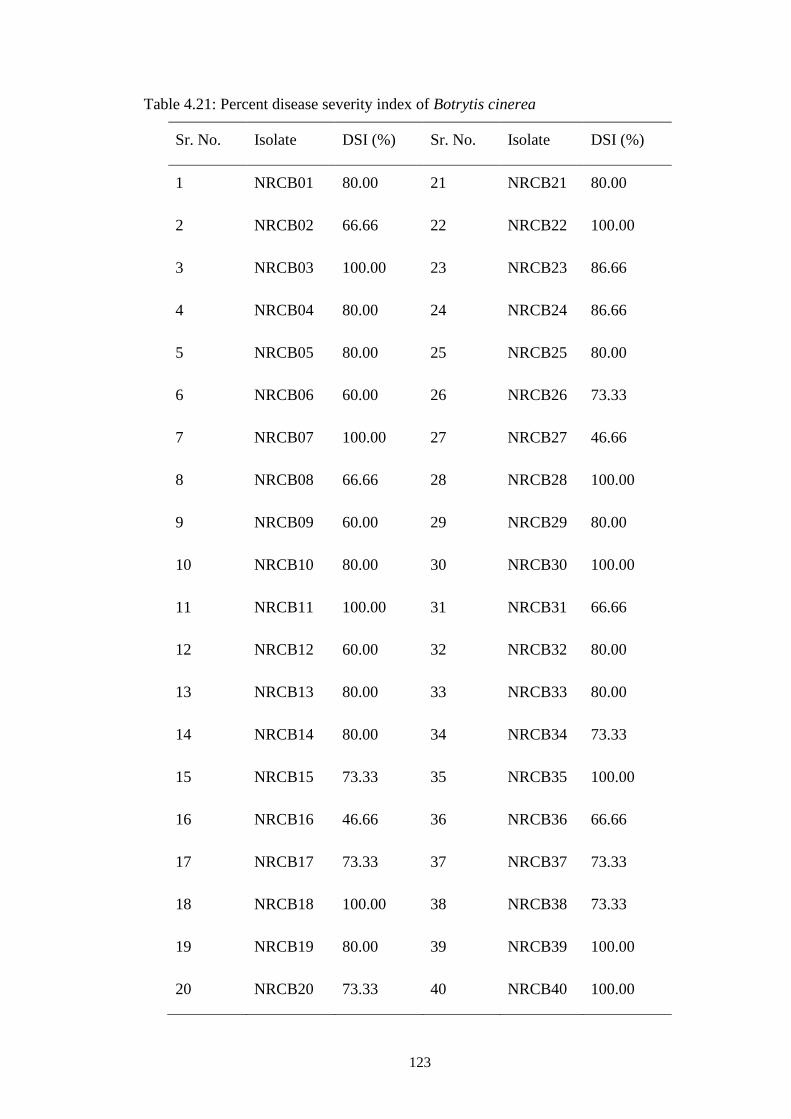
123
Table 4.21: Percent disease severity index of Botrytis cinerea
Sr. No. Isolate DSI (%) Sr. No. Isolate DSI (%)
1 NRCB01 80.00 21 NRCB21 80.00
2 NRCB02 66.66 22 NRCB22 100.00
3 NRCB03 100.00 23 NRCB23 86.66
4 NRCB04 80.00 24 NRCB24 86.66
5 NRCB05 80.00 25 NRCB25 80.00
6 NRCB06 60.00 26 NRCB26 73.33
7 NRCB07 100.00 27 NRCB27 46.66
8 NRCB08 66.66 28 NRCB28 100.00
9 NRCB09 60.00 29 NRCB29 80.00
10 NRCB10 80.00 30 NRCB30 100.00
11 NRCB11 100.00 31 NRCB31 66.66
12 NRCB12 60.00 32 NRCB32 80.00
13 NRCB13 80.00 33 NRCB33 80.00
14 NRCB14 80.00 34 NRCB34 73.33
15 NRCB15 73.33 35 NRCB35 100.00
16 NRCB16 46.66 36 NRCB36 66.66
17 NRCB17 73.33 37 NRCB37 73.33
18 NRCB18 100.00 38 NRCB38 73.33
19 NRCB19 80.00 39 NRCB39 100.00
20 NRCB20 73.33 40 NRCB40 100.00
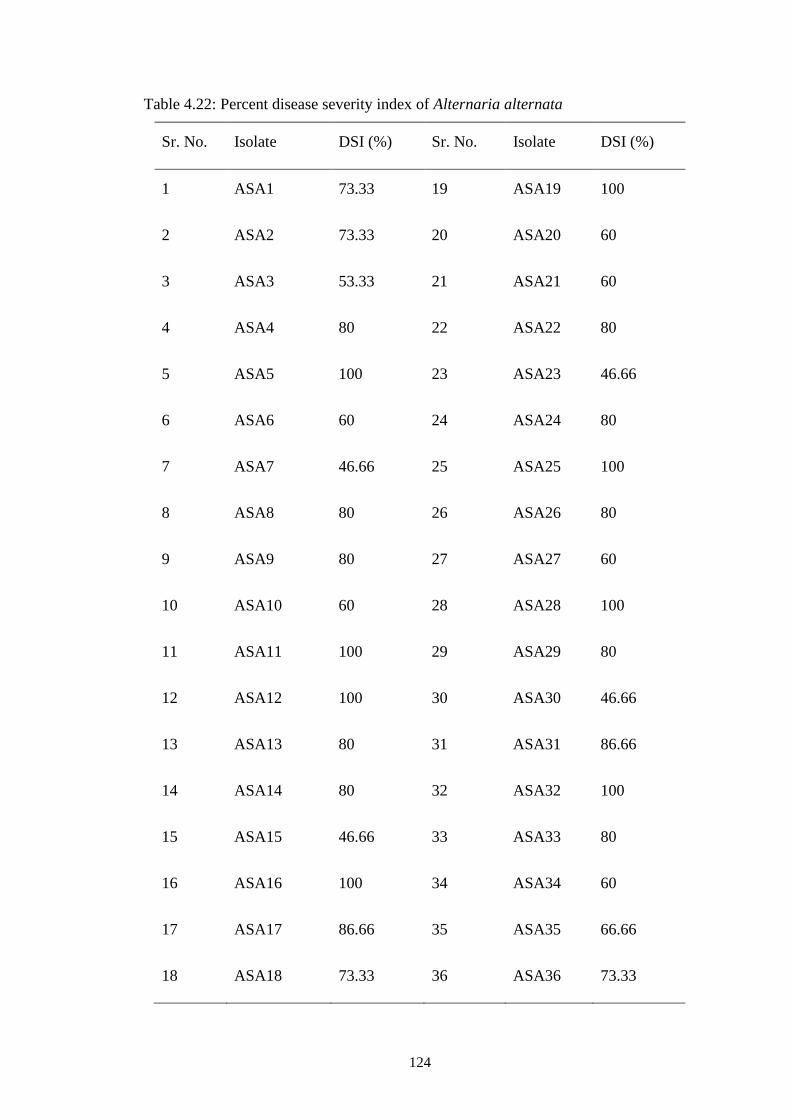
124
Table 4.22: Percent disease severity index of Alternaria alternata
Sr. No. Isolate DSI (%) Sr. No. Isolate DSI (%)
1 ASA1 73.33 19 ASA19 100
2 ASA2 73.33 20 ASA20 60
3 ASA3 53.33 21 ASA21 60
4 ASA4 80 22 ASA22 80
5 ASA5 100 23 ASA23 46.66
6 ASA6 60 24 ASA24 80
7 ASA7 46.66 25 ASA25 100
8 ASA8 80 26 ASA26 80
9 ASA9 80 27 ASA27 60
10 ASA10 60 28 ASA28 100
11 ASA11 100 29 ASA29 80
12 ASA12 100 30 ASA30 46.66
13 ASA13 80 31 ASA31 86.66
14 ASA14 80 32 ASA32 100
15 ASA15 46.66 33 ASA33 80
16 ASA16 100 34 ASA34 60
17 ASA17 86.66 35 ASA35 66.66
18 ASA18 73.33 36 ASA36 73.33
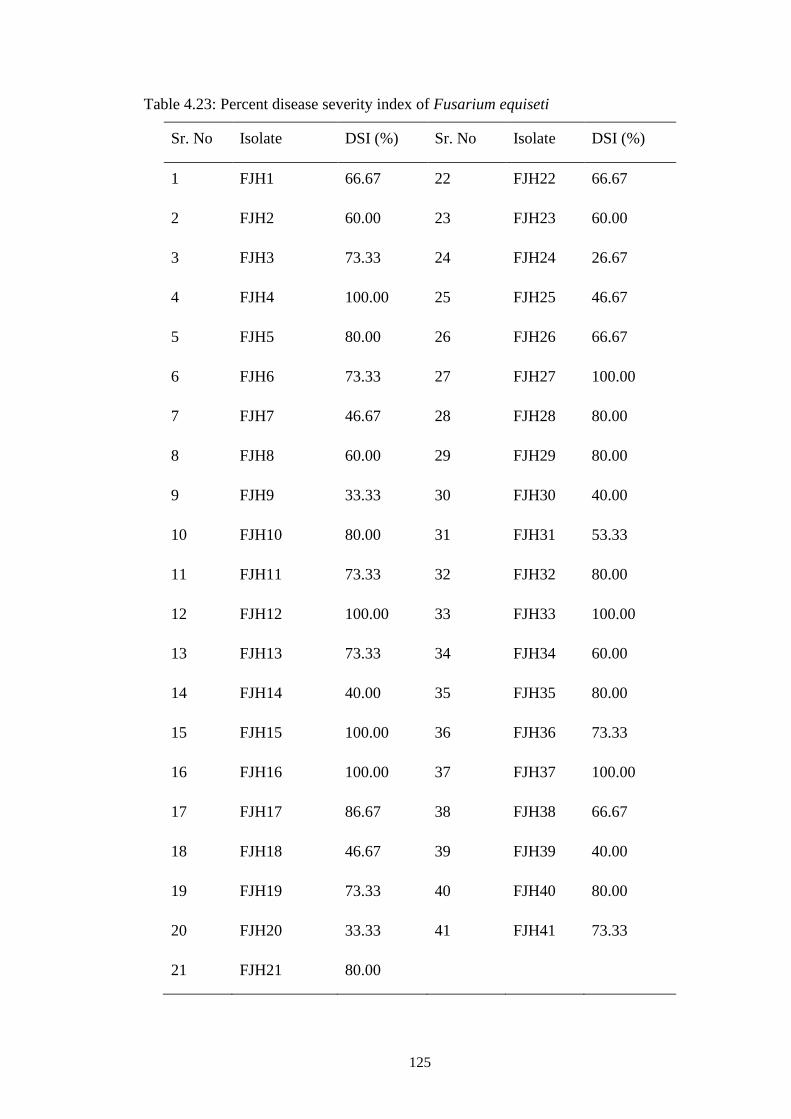
125
Table 4.23: Percent disease severity index of Fusarium equiseti
Sr. No Isolate DSI (%) Sr. No Isolate DSI (%)
1 FJH1 66.67 22 FJH22 66.67
2 FJH2 60.00 23 FJH23 60.00
3 FJH3 73.33 24 FJH24 26.67
4 FJH4 100.00 25 FJH25 46.67
5 FJH5 80.00 26 FJH26 66.67
6 FJH6 73.33 27 FJH27 100.00
7 FJH7 46.67 28 FJH28 80.00
8 FJH8 60.00 29 FJH29 80.00
9 FJH9 33.33 30 FJH30 40.00
10 FJH10 80.00 31 FJH31 53.33
11 FJH11 73.33 32 FJH32 80.00
12 FJH12 100.00 33 FJH33 100.00
13 FJH13 73.33 34 FJH34 60.00
14 FJH14 40.00 35 FJH35 80.00
15 FJH15 100.00 36 FJH36 73.33
16 FJH16 100.00 37 FJH37 100.00
17 FJH17 86.67 38 FJH38 66.67
18 FJH18 46.67 39 FJH39 40.00
19 FJH19 73.33 40 FJH40 80.00
20 FJH20 33.33 41 FJH41 73.33
21 FJH21 80.00
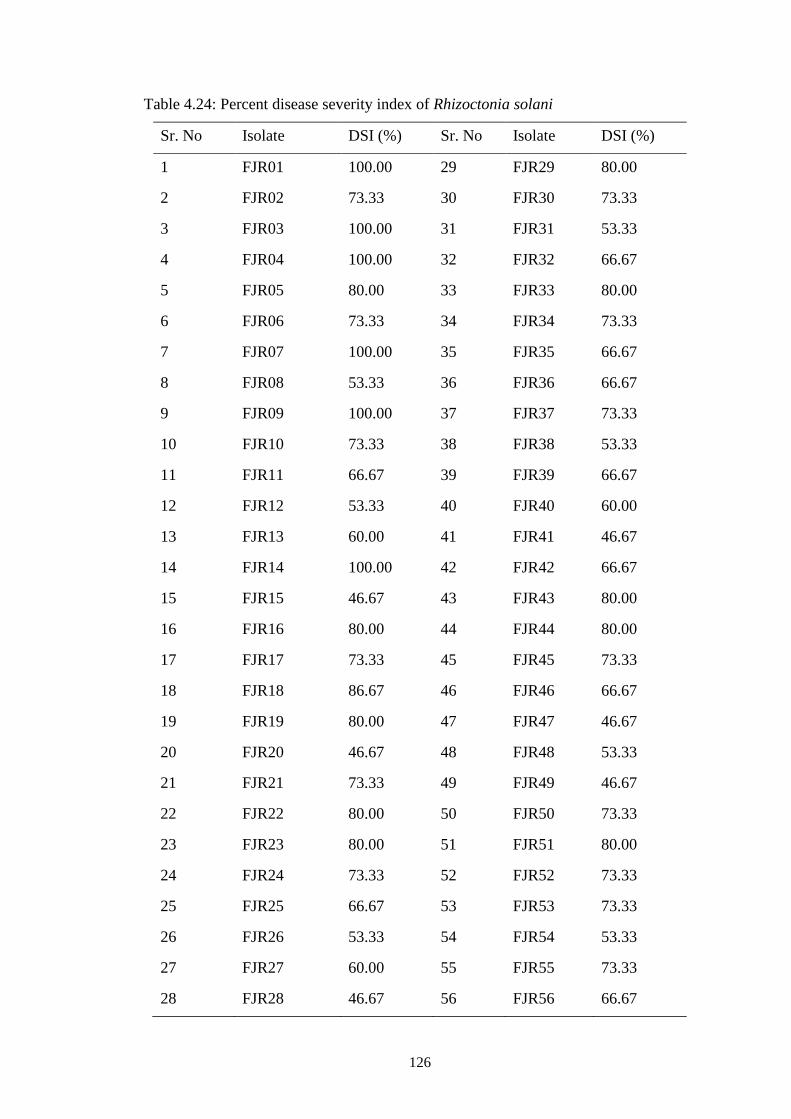
126
Table 4.24: Percent disease severity index of Rhizoctonia solani
Sr. No Isolate DSI (%) Sr. No Isolate DSI (%)
1 FJR01 100.00 29 FJR29 80.00
2 FJR02 73.33 30 FJR30 73.33
3 FJR03 100.00 31 FJR31 53.33
4 FJR04 100.00 32 FJR32 66.67
5 FJR05 80.00 33 FJR33 80.00
6 FJR06 73.33 34 FJR34 73.33
7 FJR07 100.00 35 FJR35 66.67
8 FJR08 53.33 36 FJR36 66.67
9 FJR09 100.00 37 FJR37 73.33
10 FJR10 73.33 38 FJR38 53.33
11 FJR11 66.67 39 FJR39 66.67
12 FJR12 53.33 40 FJR40 60.00
13 FJR13 60.00 41 FJR41 46.67
14 FJR14 100.00 42 FJR42 66.67
15 FJR15 46.67 43 FJR43 80.00
16 FJR16 80.00 44 FJR44 80.00
17 FJR17 73.33 45 FJR45 73.33
18 FJR18 86.67 46 FJR46 66.67
19 FJR19 80.00 47 FJR47 46.67
20 FJR20 46.67 48 FJR48 53.33
21 FJR21 73.33 49 FJR49 46.67
22 FJR22 80.00 50 FJR50 73.33
23 FJR23 80.00 51 FJR51 80.00
24 FJR24 73.33 52 FJR52 73.33
25 FJR25 66.67 53 FJR53 73.33
26 FJR26 53.33 54 FJR54 53.33
27 FJR27 60.00 55 FJR55 73.33
28 FJR28 46.67 56 FJR56 66.67
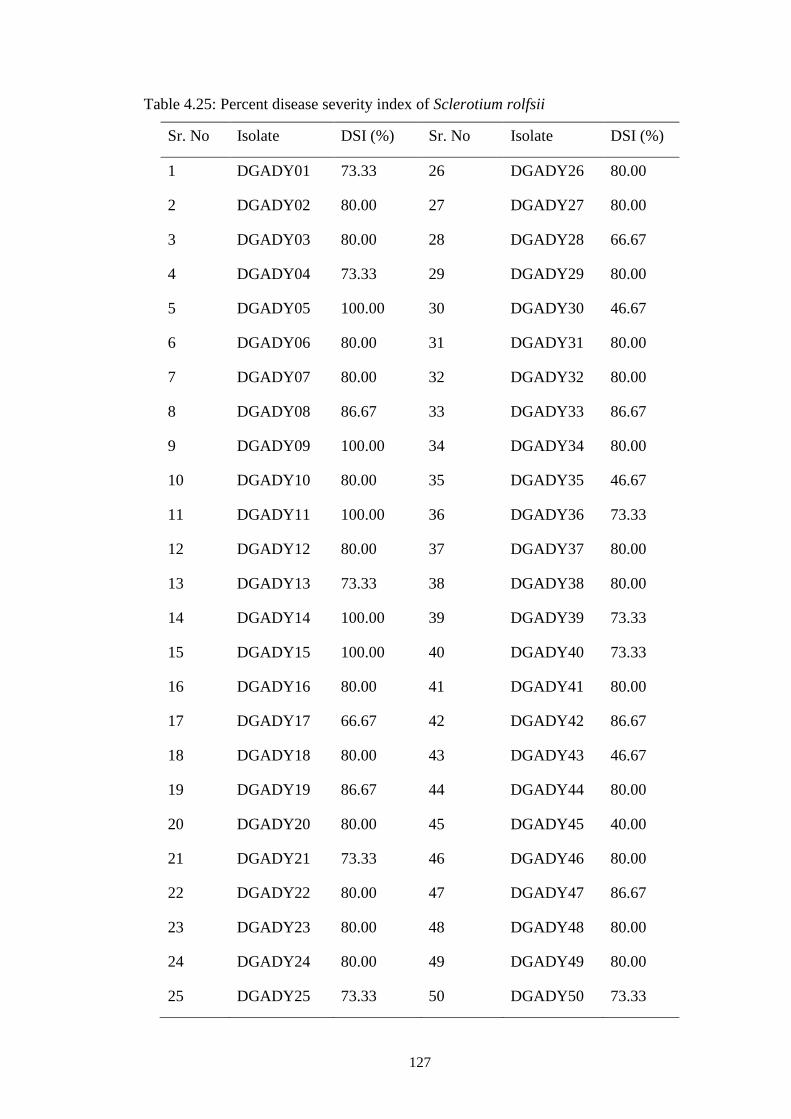
127
Table 4.25: Percent disease severity index of Sclerotium rolfsii
Sr. No Isolate DSI (%) Sr. No Isolate DSI (%)
1 DGADY01 73.33 26 DGADY26 80.00
2 DGADY02 80.00 27 DGADY27 80.00
3 DGADY03 80.00 28 DGADY28 66.67
4 DGADY04 73.33 29 DGADY29 80.00
5 DGADY05 100.00 30 DGADY30 46.67
6 DGADY06 80.00 31 DGADY31 80.00
7 DGADY07 80.00 32 DGADY32 80.00
8 DGADY08 86.67 33 DGADY33 86.67
9 DGADY09 100.00 34 DGADY34 80.00
10 DGADY10 80.00 35 DGADY35 46.67
11 DGADY11 100.00 36 DGADY36 73.33
12 DGADY12 80.00 37 DGADY37 80.00
13 DGADY13 73.33 38 DGADY38 80.00
14 DGADY14 100.00 39 DGADY39 73.33
15 DGADY15 100.00 40 DGADY40 73.33
16 DGADY16 80.00 41 DGADY41 80.00
17 DGADY17 66.67 42 DGADY42 86.67
18 DGADY18 80.00 43 DGADY43 46.67
19 DGADY19 86.67 44 DGADY44 80.00
20 DGADY20 80.00 45 DGADY45 40.00
21 DGADY21 73.33 46 DGADY46 80.00
22 DGADY22 80.00 47 DGADY47 86.67
23 DGADY23 80.00 48 DGADY48 80.00
24 DGADY24 80.00 49 DGADY49 80.00
25 DGADY25 73.33 50 DGADY50 73.33
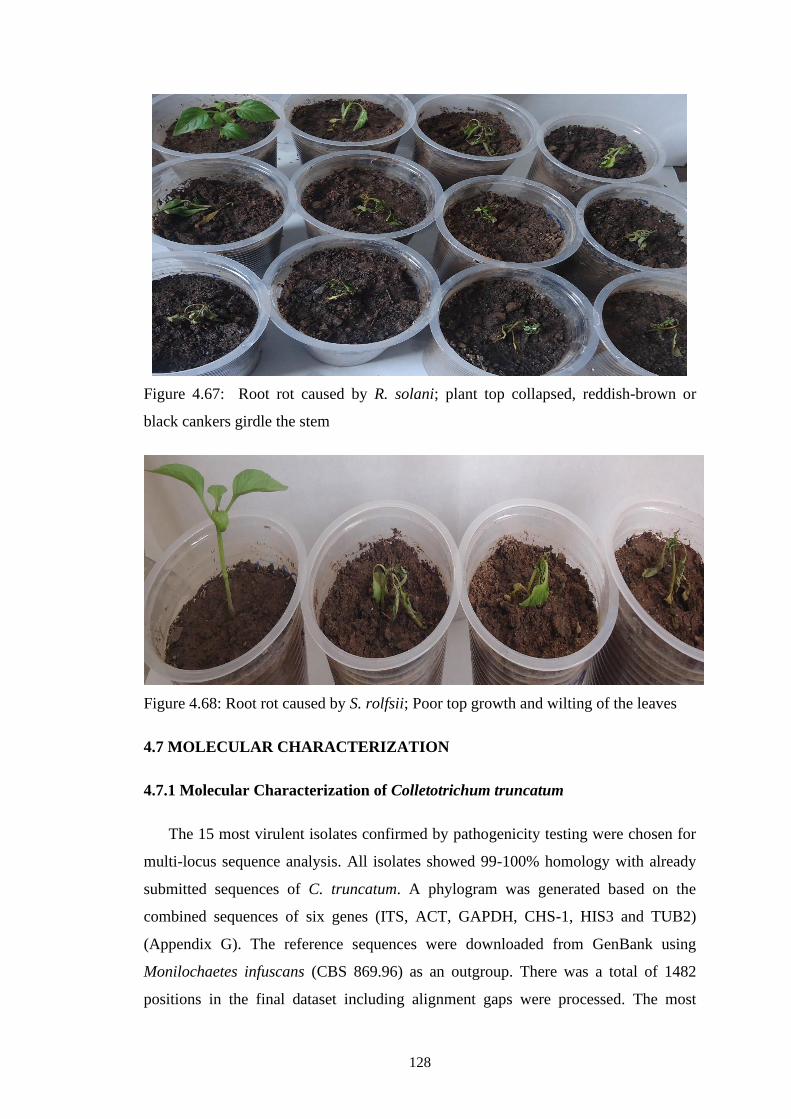
128
Figure 4.67: Root rot caused by R. solani; plant top collapsed, reddish-brown or
black cankers girdle the stem
Figure 4.68: Root rot caused by S. rolfsii; Poor top growth and wilting of the leaves
4.7 MOLECULAR CHARACTERIZATION
4.7.1 Molecular Characterization of Colletotrichum truncatum
The 15 most virulent isolates confirmed by pathogenicity testing were chosen for
multi-locus sequence analysis. All isolates showed 99-100% homology with already
submitted sequences of C. truncatum. A phylogram was generated based on the
combined sequences of six genes (ITS, ACT, GAPDH, CHS-1, HIS3 and TUB2)
(Appendix G). The reference sequences were downloaded from GenBank using
Monilochaetes infuscans (CBS 869.96) as an outgroup. There was a total of 1482
positions in the final dataset including alignment gaps were processed. The most
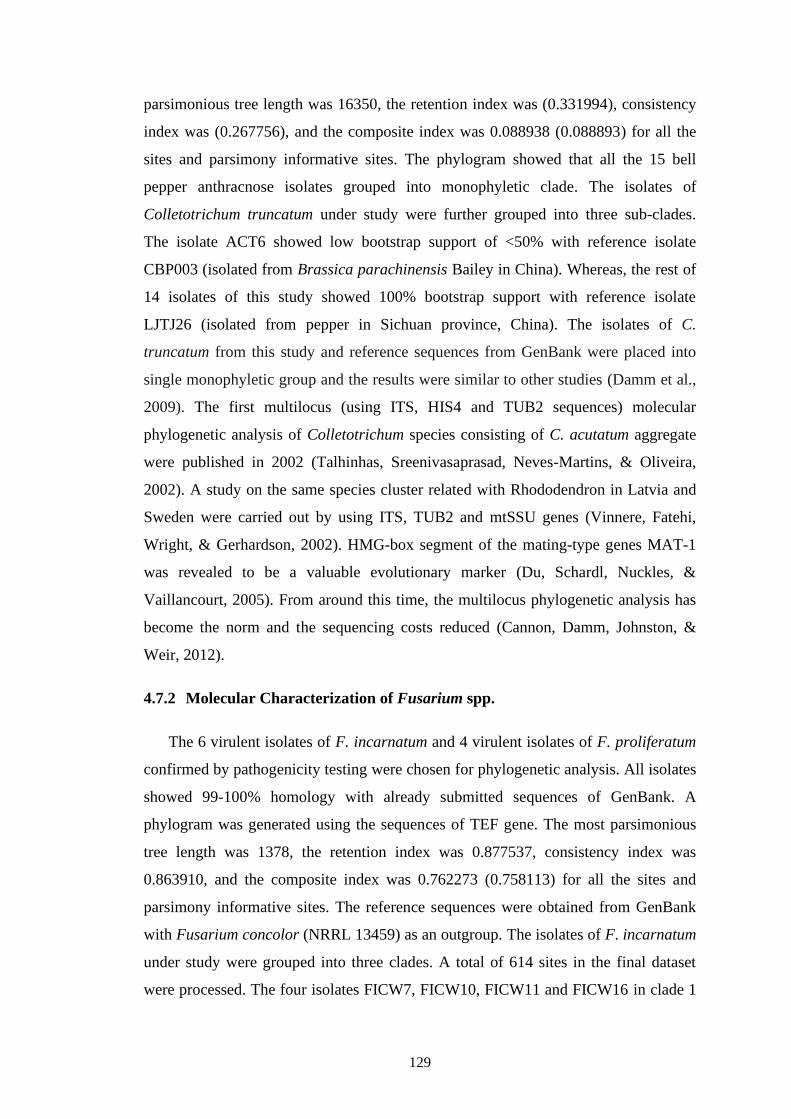
129
parsimonious tree length was 16350, the retention index was (0.331994), consistency
index was (0.267756), and the composite index was 0.088938 (0.088893) for all the
sites and parsimony informative sites. The phylogram showed that all the 15 bell
pepper anthracnose isolates grouped into monophyletic clade. The isolates of
Colletotrichum truncatum under study were further grouped into three sub-clades.
The isolate ACT6 showed low bootstrap support of <50% with reference isolate
CBP003 (isolated from Brassica parachinensis Bailey in China). Whereas, the rest of
14 isolates of this study showed 100% bootstrap support with reference isolate
LJTJ26 (isolated from pepper in Sichuan province, China). The isolates of C.
truncatum from this study and reference sequences from GenBank were placed into
single monophyletic group and the results were similar to other studies (Damm et al.,
2009). The first multilocus (using ITS, HIS4 and TUB2 sequences) molecular
phylogenetic analysis of Colletotrichum species consisting of C. acutatum aggregate
were published in 2002 (Talhinhas, Sreenivasaprasad, Neves-Martins, & Oliveira,
2002). A study on the same species cluster related with Rhododendron in Latvia and
Sweden were carried out by using ITS, TUB2 and mtSSU genes (Vinnere, Fatehi,
Wright, & Gerhardson, 2002). HMG-box segment of the mating-type genes MAT-1
was revealed to be a valuable evolutionary marker (Du, Schardl, Nuckles, &
Vaillancourt, 2005). From around this time, the multilocus phylogenetic analysis has
become the norm and the sequencing costs reduced (Cannon, Damm, Johnston, &
Weir, 2012).
4.7.2 Molecular Characterization of Fusarium spp.
The 6 virulent isolates of F. incarnatum and 4 virulent isolates of F. proliferatum
confirmed by pathogenicity testing were chosen for phylogenetic analysis. All isolates
showed 99-100% homology with already submitted sequences of GenBank. A
phylogram was generated using the sequences of TEF gene. The most parsimonious
tree length was 1378, the retention index was 0.877537, consistency index was
0.863910, and the composite index was 0.762273 (0.758113) for all the sites and
parsimony informative sites. The reference sequences were obtained from GenBank
with Fusarium concolor (NRRL 13459) as an outgroup. The isolates of F. incarnatum
under study were grouped into three clades. A total of 614 sites in the final dataset
were processed. The four isolates FICW7, FICW10, FICW11 and FICW16 in clade 1
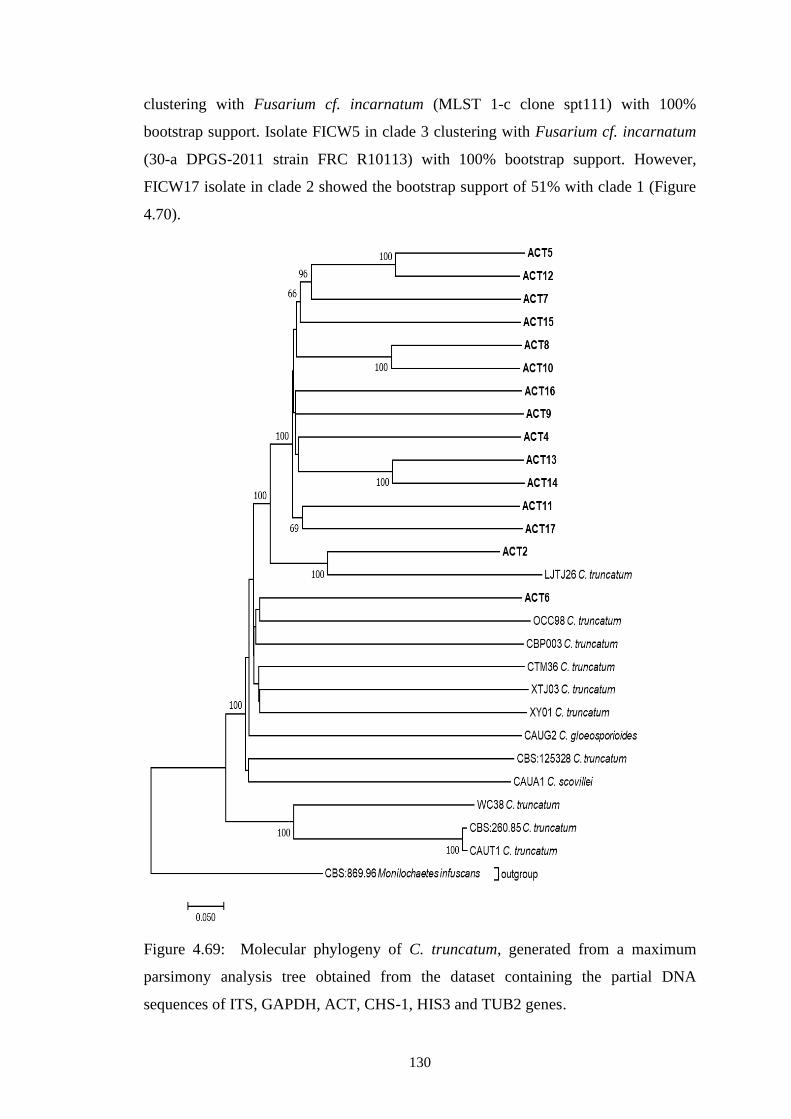
130
clustering with Fusarium cf. incarnatum (MLST 1-c clone spt111) with 100%
bootstrap support. Isolate FICW5 in clade 3 clustering with Fusarium cf. incarnatum
(30-a DPGS-2011 strain FRC R10113) with 100% bootstrap support. However,
FICW17 isolate in clade 2 showed the bootstrap support of 51% with clade 1 (Figure
4.70).
Figure 4.69: Molecular phylogeny of C. truncatum, generated from a maximum
parsimony analysis tree obtained from the dataset containing the partial DNA
sequences of ITS, GAPDH, ACT, CHS-1, HIS3 and TUB2 genes.
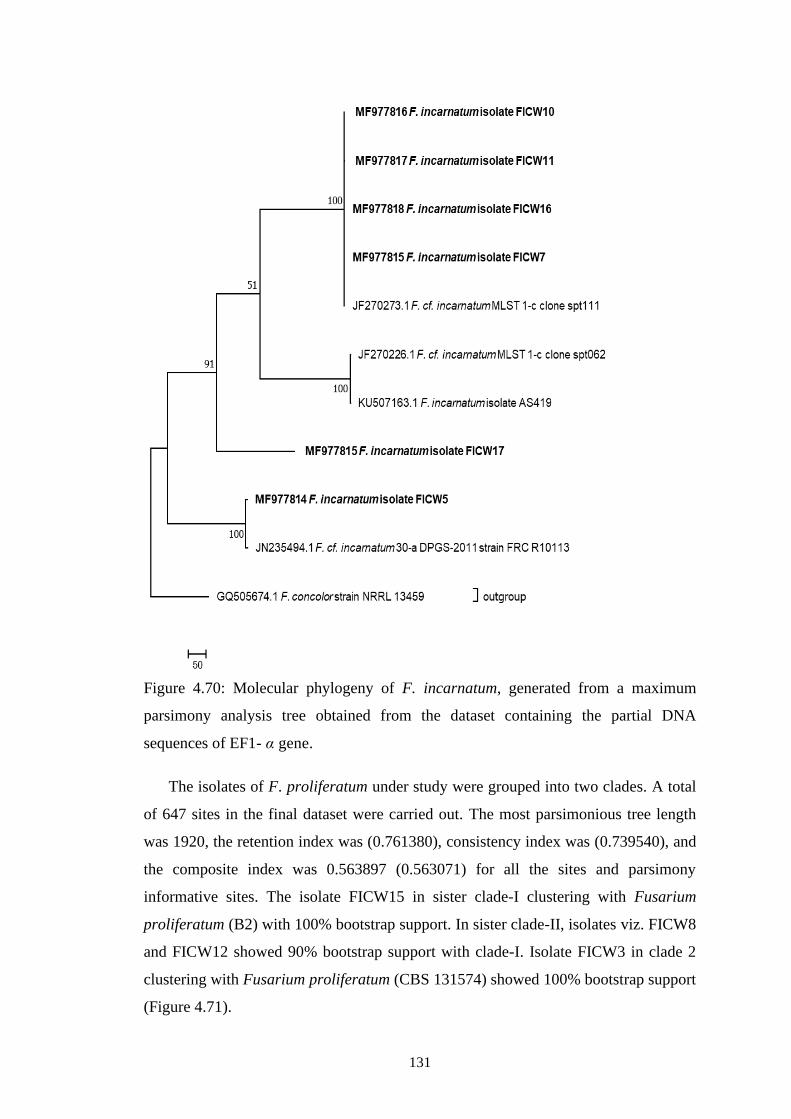
131
Figure 4.70: Molecular phylogeny of F. incarnatum, generated from a maximum
parsimony analysis tree obtained from the dataset containing the partial DNA
sequences of EF1- α gene.
The isolates of F. proliferatum under study were grouped into two clades. A total
of 647 sites in the final dataset were carried out. The most parsimonious tree length
was 1920, the retention index was (0.761380), consistency index was (0.739540), and
the composite index was 0.563897 (0.563071) for all the sites and parsimony
informative sites. The isolate FICW15 in sister clade-I clustering with Fusarium
proliferatum (B2) with 100% bootstrap support. In sister clade-II, isolates viz. FICW8
and FICW12 showed 90% bootstrap support with clade-I. Isolate FICW3 in clade 2
clustering with Fusarium proliferatum (CBS 131574) showed 100% bootstrap support
(Figure 4.71).
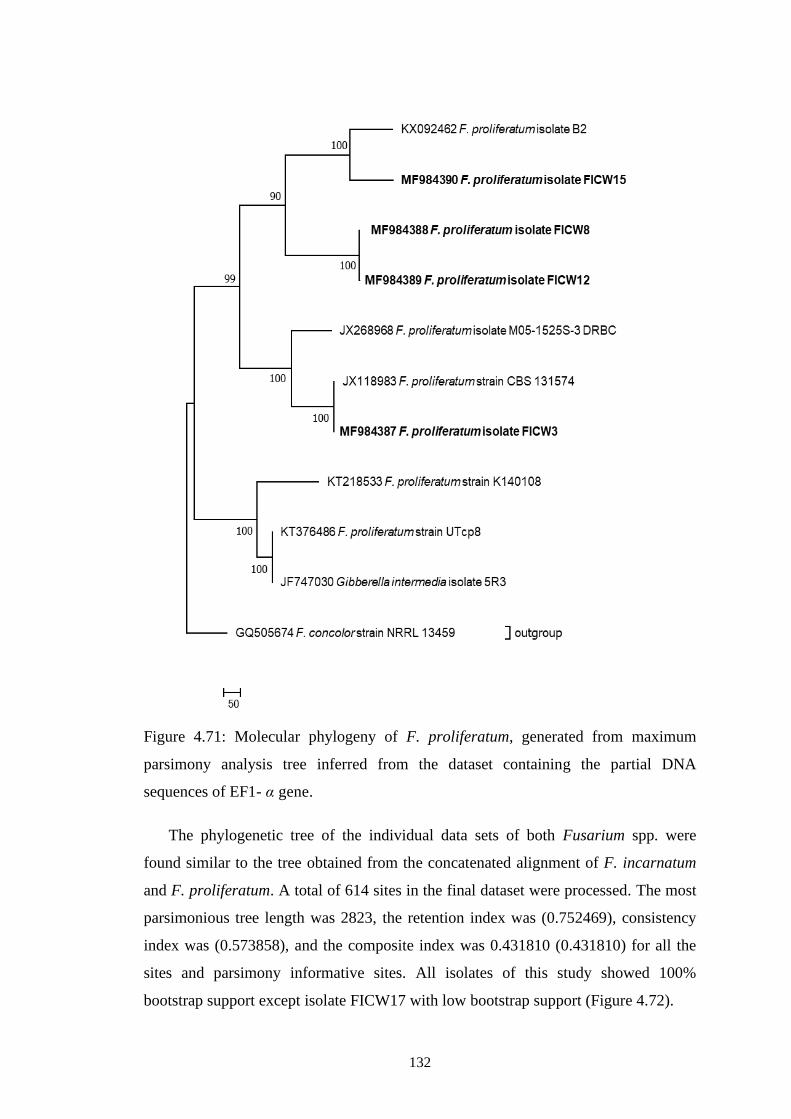
132
Figure 4.71: Molecular phylogeny of F. proliferatum, generated from maximum
parsimony analysis tree inferred from the dataset containing the partial DNA
sequences of EF1- α gene.
The phylogenetic tree of the individual data sets of both Fusarium spp. were
found similar to the tree obtained from the concatenated alignment of F. incarnatum
and F. proliferatum. A total of 614 sites in the final dataset were processed. The most
parsimonious tree length was 2823, the retention index was (0.752469), consistency
index was (0.573858), and the composite index was 0.431810 (0.431810) for all the
sites and parsimony informative sites. All isolates of this study showed 100%
bootstrap support except isolate FICW17 with low bootstrap support (Figure 4.72).
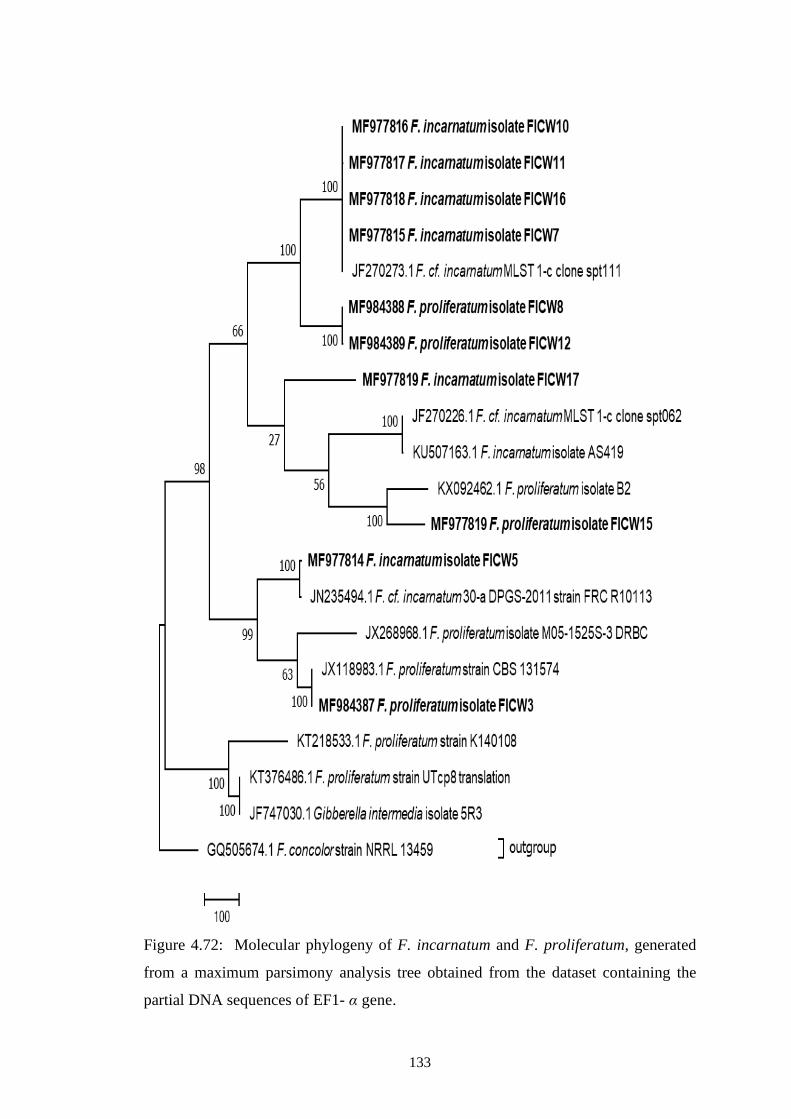
133
Figure 4.72: Molecular phylogeny of F. incarnatum and F. proliferatum, generated
from a maximum parsimony analysis tree obtained from the dataset containing the
partial DNA sequences of EF1- α gene.
134
Internal transcribed spacer (ITS) region is unable to resolve Fusarium spp.
lineages (O’Donnell et al., 2013). Protein coding genes, for example translation
elongation factor (EF-1α), beta-tubulin (TUB), RNA polymerase II subunits (RPB1
and RPB2) have been recommended in general for Fusarium species confirmation
(Geiser et al., 2004). EF-1α gene, however consists of conserved exonic and variable
intronic sequences and is suitable for inferring deep phylogenies, capture more recent
evolutionary and speciation events (Stielow et al., 2015). The EF-1α gene sequence,
with similarity index of 99.4% is a suitable genetic marker for categorizing Fusarium
species (O’Donnell et al., 2015).
4.7.3 Molecular Characterization of Botrytis cinerea
All isolates of B. cinerea showed 99-100% homology with already submitted
sequences of GenBank. A phylogram was generated using the sequences of ITS gene.
The reference sequences were obtained from GenBank with Athelia rolfsii (SR-002)
as an outgroup. A total of 413 sites in the final dataset were processed. The most
parsimonious tree length was 1631, consistency index was (0.649599), the retention
index was (0.763924), and the composite index was 0.497885 (0.496244) for all the
sites and parsimony informative sites. The isolates of B. cinerea were grouped into
three clades. The clade I is subdivided into 2 sister clades. In sister clade I, isolate
NRCB28 and NRCB03 showed close resemblance and 100% bootstrap support with
B. cinerea (isolate KM63) and Botryotinia fuckeliana (isolate bbleafspot). Sister clade
II is further subdivided into 2 sub-clades. The isolate NRCB07 in sub-clade I showed
low bootstrap support (37%) with sub-clade II. Whereas, the isolate NRCB11 in sub-
clade II showed 100% resemblance with Botrytis cinerea isolate Mst9. The isolates
viz. NRCB22 and NRCB35 in clade 2 supported with 100% bootstrap value with B.
cinerea isolates (SCB7-5, BGM005 and BfHN1) (Figure 4.73).
A phylogram was generated using the sequences of partial G3PDH gene. The
reference sequences were obtained from GenBank with Sclerotinia sclerotiorum
(strain 484) as an outgroup. A total of 681 sites in the final dataset were processed.
The most parsimonious tree length was 2335, consistency index was (0.726134), the
retention index was (0.770373), and the composite index was 0.561201 (0.559394)
for all the sites and parsimony informative sites. The isolates of B. cinerea were
grouped into three clades. The clade 1 isolates viz. NRCB22 and NRCB40 showed
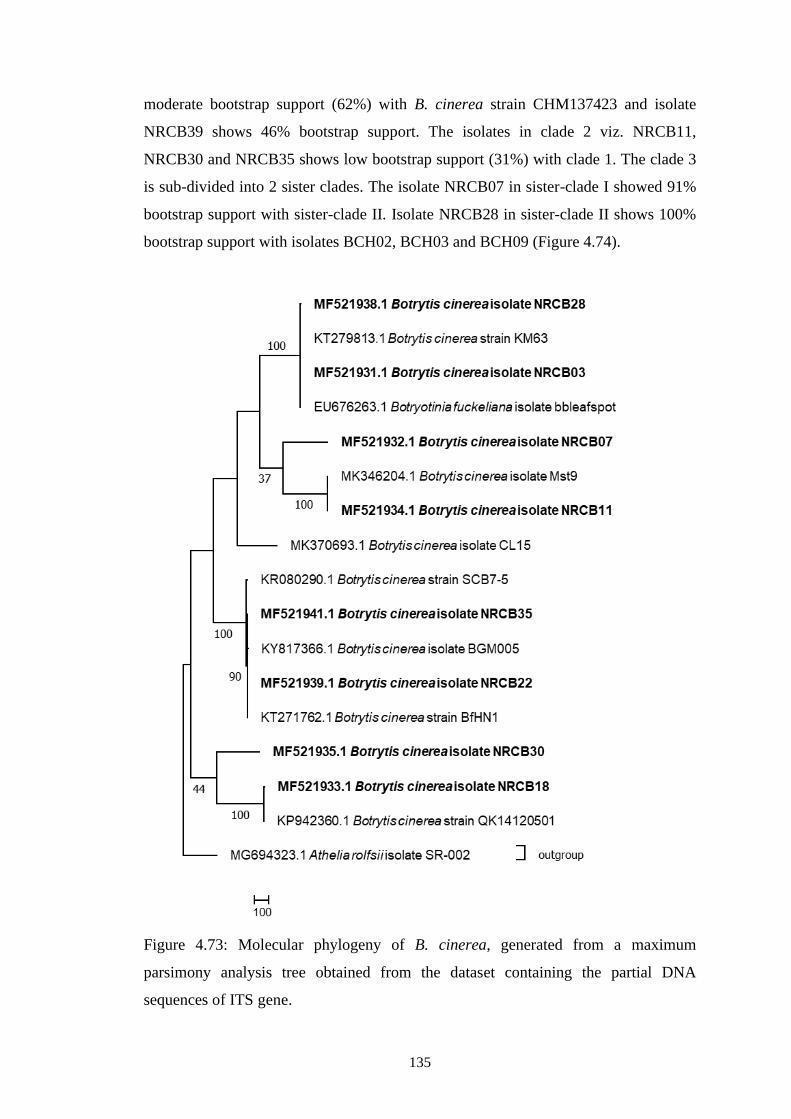
135
moderate bootstrap support (62%) with B. cinerea strain CHM137423 and isolate
NRCB39 shows 46% bootstrap support. The isolates in clade 2 viz. NRCB11,
NRCB30 and NRCB35 shows low bootstrap support (31%) with clade 1. The clade 3
is sub-divided into 2 sister clades. The isolate NRCB07 in sister-clade I showed 91%
bootstrap support with sister-clade II. Isolate NRCB28 in sister-clade II shows 100%
bootstrap support with isolates BCH02, BCH03 and BCH09 (Figure 4.74).
Figure 4.73: Molecular phylogeny of B. cinerea, generated from a maximum
parsimony analysis tree obtained from the dataset containing the partial DNA
sequences of ITS gene.
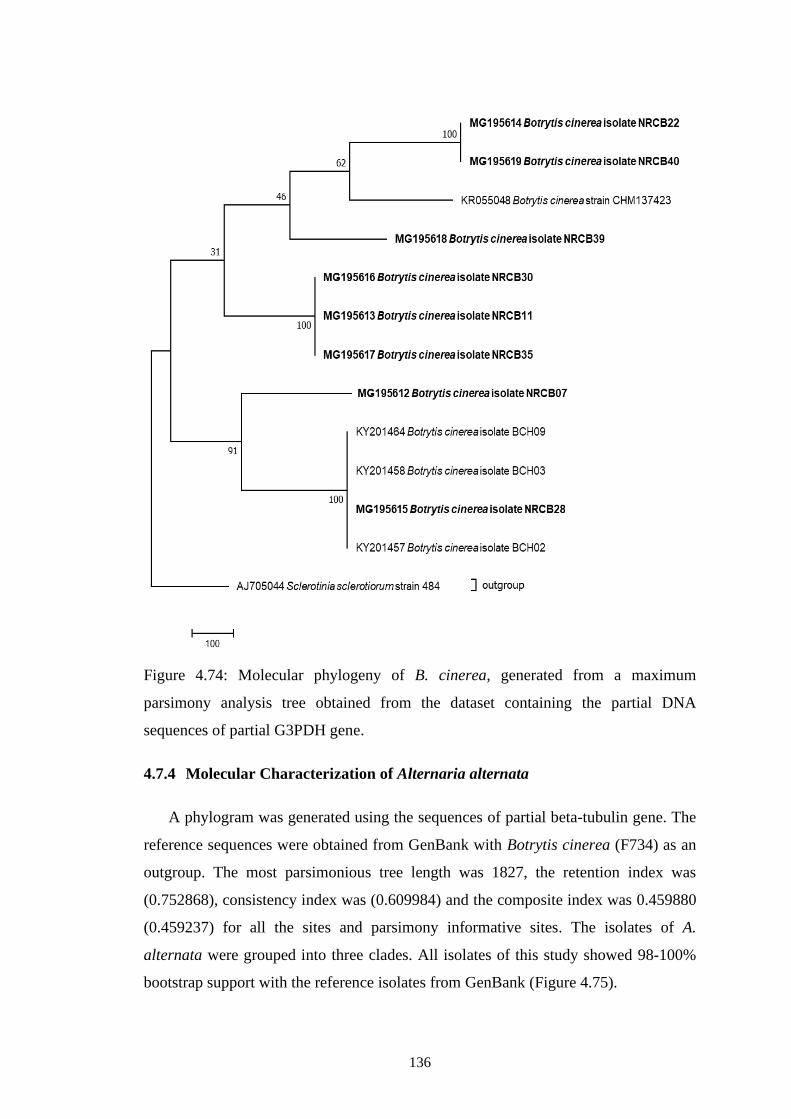
136
Figure 4.74: Molecular phylogeny of B. cinerea, generated from a maximum
parsimony analysis tree obtained from the dataset containing the partial DNA
sequences of partial G3PDH gene.
4.7.4 Molecular Characterization of Alternaria alternata
A phylogram was generated using the sequences of partial beta-tubulin gene. The
reference sequences were obtained from GenBank with Botrytis cinerea (F734) as an
outgroup. The most parsimonious tree length was 1827, the retention index was
(0.752868), consistency index was (0.609984) and the composite index was 0.459880
(0.459237) for all the sites and parsimony informative sites. The isolates of A.
alternata were grouped into three clades. All isolates of this study showed 98-100%
bootstrap support with the reference isolates from GenBank (Figure 4.75).
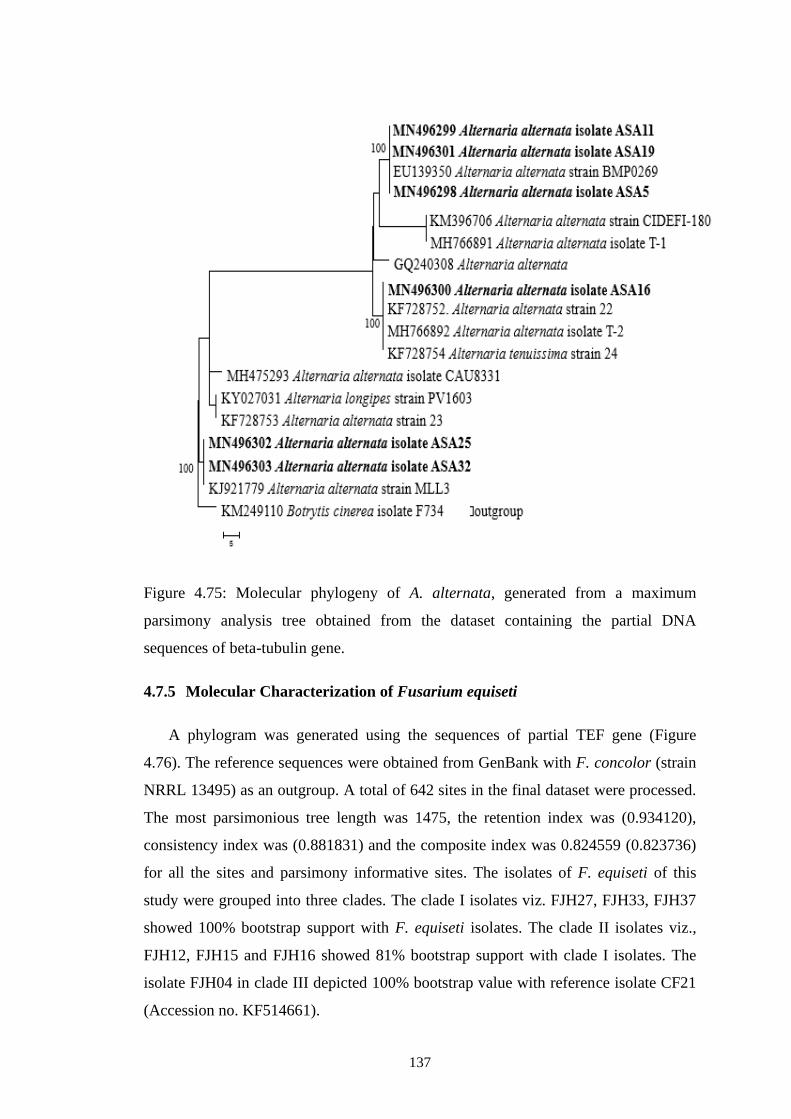
137
Figure 4.75: Molecular phylogeny of A. alternata, generated from a maximum
parsimony analysis tree obtained from the dataset containing the partial DNA
sequences of beta-tubulin gene.
4.7.5 Molecular Characterization of Fusarium equiseti
A phylogram was generated using the sequences of partial TEF gene (Figure
4.76). The reference sequences were obtained from GenBank with F. concolor (strain
NRRL 13495) as an outgroup. A total of 642 sites in the final dataset were processed.
The most parsimonious tree length was 1475, the retention index was (0.934120),
consistency index was (0.881831) and the composite index was 0.824559 (0.823736)
for all the sites and parsimony informative sites. The isolates of F. equiseti of this
study were grouped into three clades. The clade I isolates viz. FJH27, FJH33, FJH37
showed 100% bootstrap support with F. equiseti isolates. The clade II isolates viz.,
FJH12, FJH15 and FJH16 showed 81% bootstrap support with clade I isolates. The
isolate FJH04 in clade III depicted 100% bootstrap value with reference isolate CF21
(Accession no. KF514661).
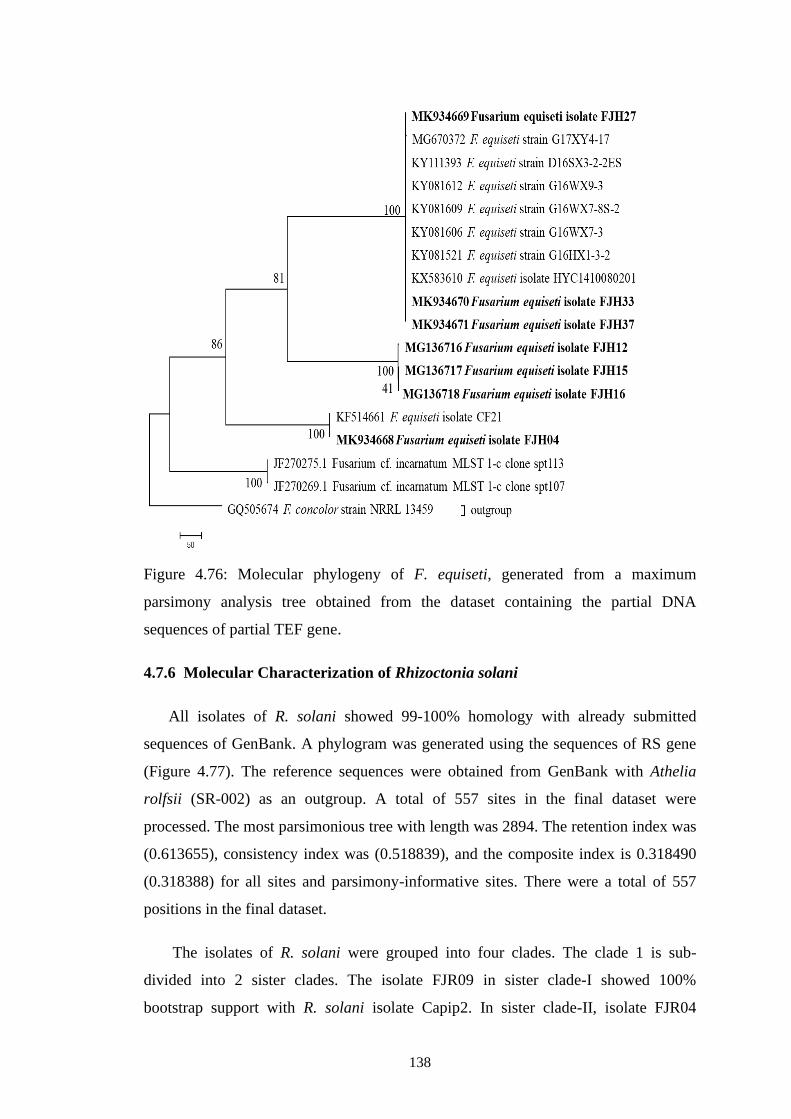
138
Figure 4.76: Molecular phylogeny of F. equiseti, generated from a maximum
parsimony analysis tree obtained from the dataset containing the partial DNA
sequences of partial TEF gene.
4.7.6 Molecular Characterization of Rhizoctonia solani
All isolates of R. solani showed 99-100% homology with already submitted
sequences of GenBank. A phylogram was generated using the sequences of RS gene
(Figure 4.77). The reference sequences were obtained from GenBank with Athelia
rolfsii (SR-002) as an outgroup. A total of 557 sites in the final dataset were
processed. The most parsimonious tree with length was 2894. The retention index was
(0.613655), consistency index was (0.518839), and the composite index is 0.318490
(0.318388) for all sites and parsimony-informative sites. There were a total of 557
positions in the final dataset.
The isolates of R. solani were grouped into four clades. The clade 1 is sub-
divided into 2 sister clades. The isolate FJR09 in sister clade-I showed 100%
bootstrap support with R. solani isolate Capip2. In sister clade-II, isolate FJR04
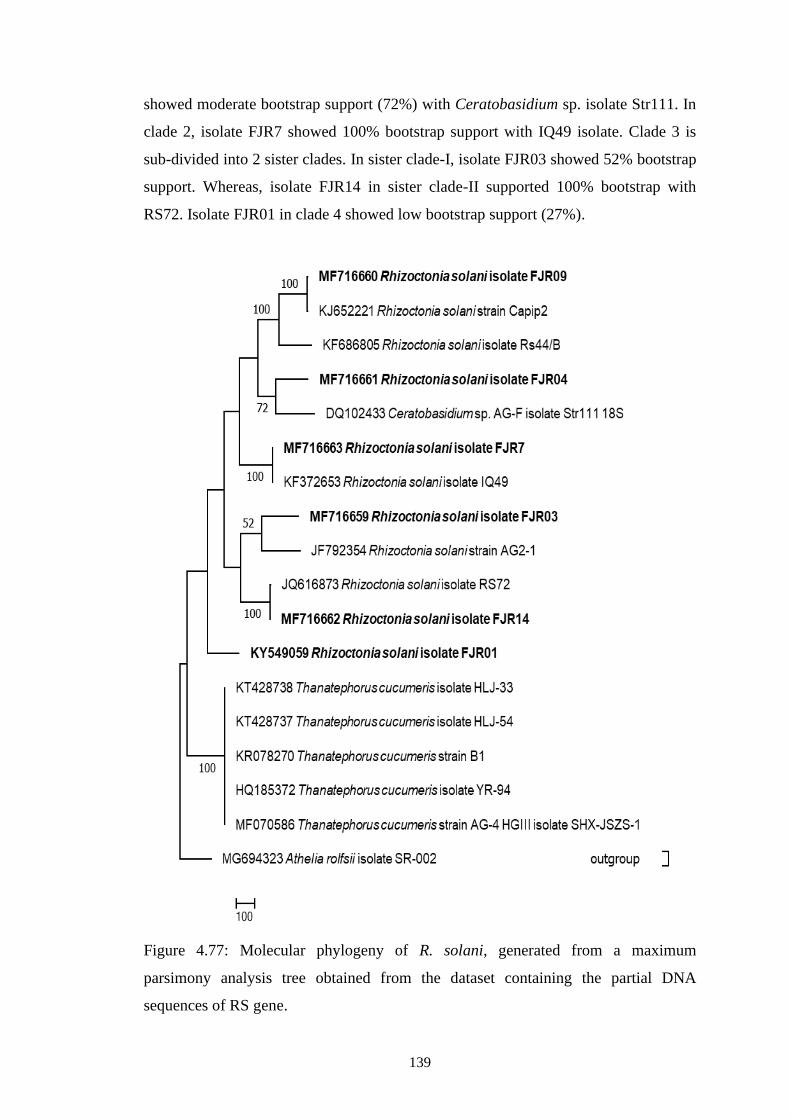
139
showed moderate bootstrap support (72%) with Ceratobasidium sp. isolate Str111. In
clade 2, isolate FJR7 showed 100% bootstrap support with IQ49 isolate. Clade 3 is
sub-divided into 2 sister clades. In sister clade-I, isolate FJR03 showed 52% bootstrap
support. Whereas, isolate FJR14 in sister clade-II supported 100% bootstrap with
RS72. Isolate FJR01 in clade 4 showed low bootstrap support (27%).
Figure 4.77: Molecular phylogeny of R. solani, generated from a maximum
parsimony analysis tree obtained from the dataset containing the partial DNA
sequences of RS gene.
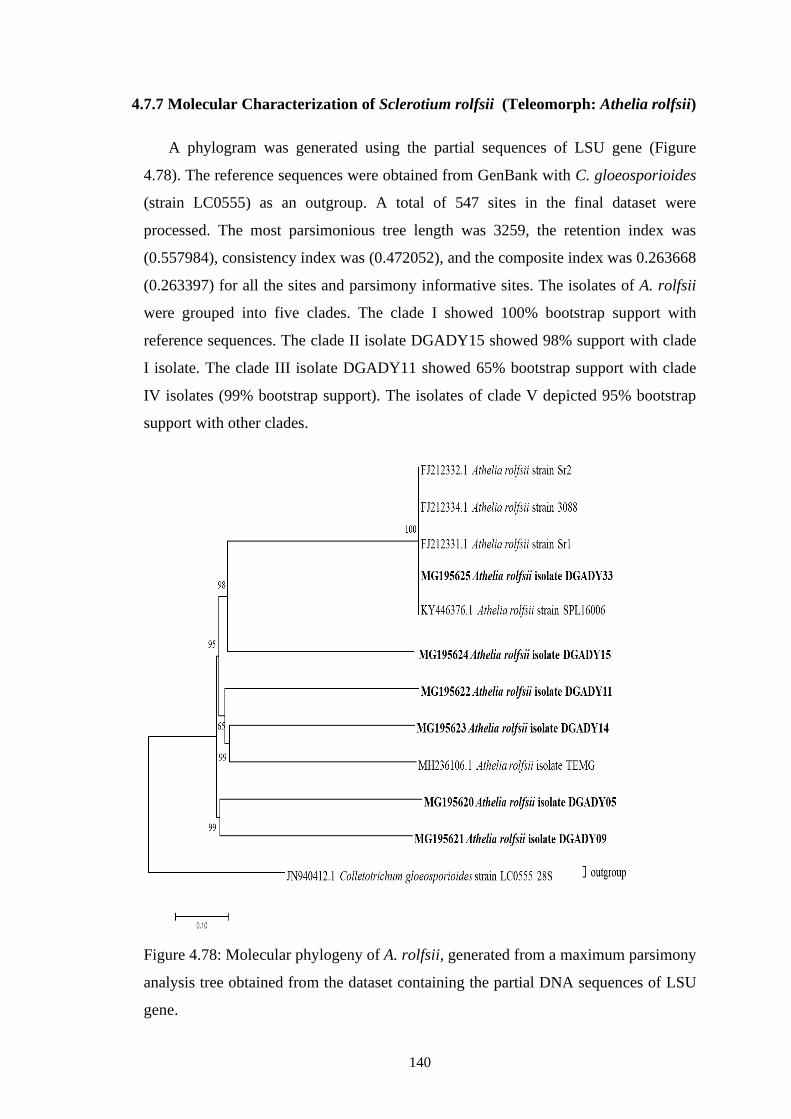
140
4.7.7 Molecular Characterization of Sclerotium rolfsii (Teleomorph: Athelia rolfsii)
A phylogram was generated using the partial sequences of LSU gene (Figure
4.78). The reference sequences were obtained from GenBank with C. gloeosporioides
(strain LC0555) as an outgroup. A total of 547 sites in the final dataset were
processed. The most parsimonious tree length was 3259, the retention index was
(0.557984), consistency index was (0.472052), and the composite index was 0.263668
(0.263397) for all the sites and parsimony informative sites. The isolates of A. rolfsii
were grouped into five clades. The clade I showed 100% bootstrap support with
reference sequences. The clade II isolate DGADY15 showed 98% support with clade
I isolate. The clade III isolate DGADY11 showed 65% bootstrap support with clade
IV isolates (99% bootstrap support). The isolates of clade V depicted 95% bootstrap
support with other clades.
Figure 4.78: Molecular phylogeny of A. rolfsii, generated from a maximum parsimony
analysis tree obtained from the dataset containing the partial DNA sequences of LSU
gene.
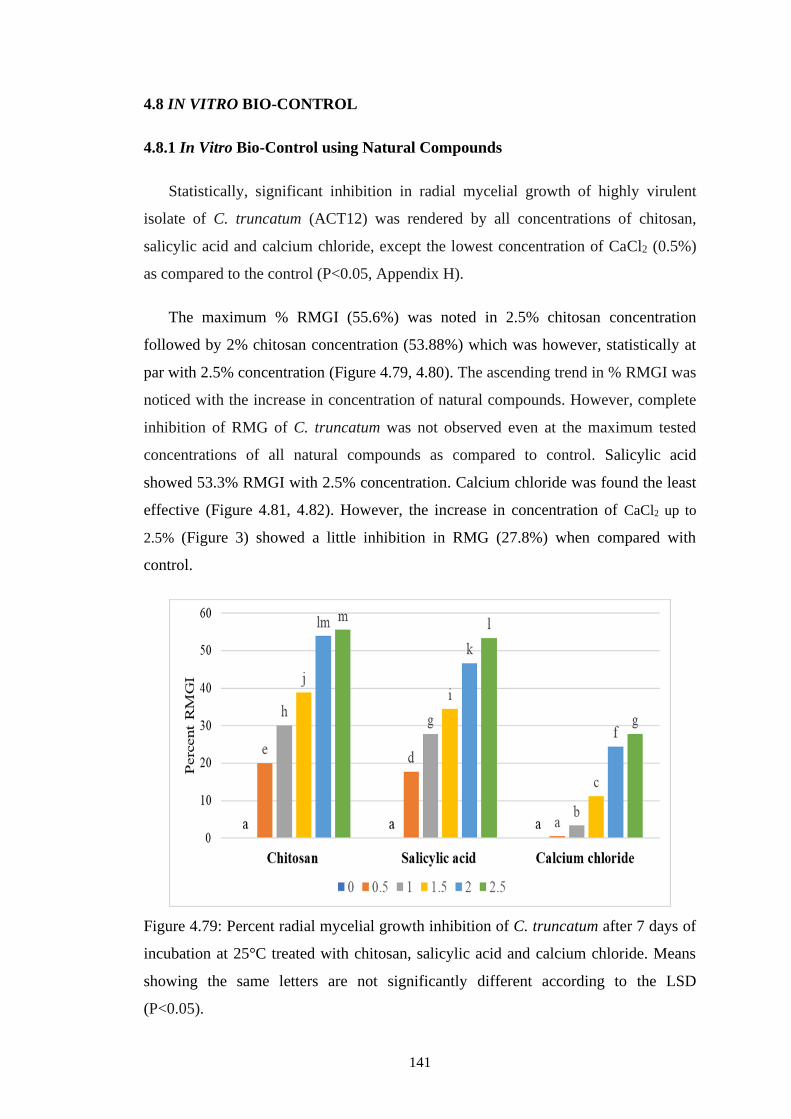
141
4.8 IN VITRO BIO-CONTROL
4.8.1 In Vitro Bio-Control using Natural Compounds
Statistically, significant inhibition in radial mycelial growth of highly virulent
isolate of C. truncatum (ACT12) was rendered by all concentrations of chitosan,
salicylic acid and calcium chloride, except the lowest concentration of CaCl2 (0.5%)
as compared to the control (P<0.05, Appendix H).
The maximum % RMGI (55.6%) was noted in 2.5% chitosan concentration
followed by 2% chitosan concentration (53.88%) which was however, statistically at
par with 2.5% concentration (Figure 4.79, 4.80). The ascending trend in % RMGI was
noticed with the increase in concentration of natural compounds. However, complete
inhibition of RMG of C. truncatum was not observed even at the maximum tested
concentrations of all natural compounds as compared to control. Salicylic acid
showed 53.3% RMGI with 2.5% concentration. Calcium chloride was found the least
effective (Figure 4.81, 4.82). However, the increase in concentration of CaCl2 up to
2.5% (Figure 3) showed a little inhibition in RMG (27.8%) when compared with
control.
Figure 4.79: Percent radial mycelial growth inhibition of C. truncatum after 7 days of
incubation at 25°C treated with chitosan, salicylic acid and calcium chloride. Means
showing the same letters are not significantly different according to the LSD
(P<0.05).
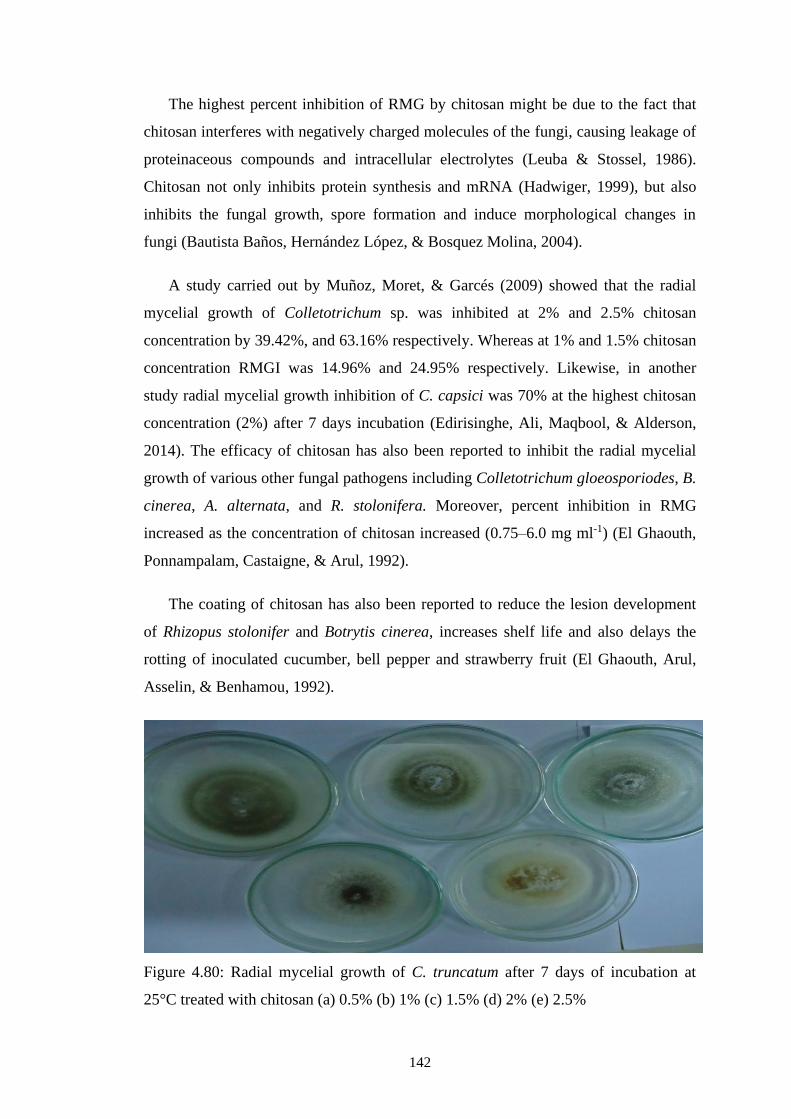
142
The highest percent inhibition of RMG by chitosan might be due to the fact that
chitosan interferes with negatively charged molecules of the fungi, causing leakage of
proteinaceous compounds and intracellular electrolytes (Leuba & Stossel, 1986).
Chitosan not only inhibits protein synthesis and mRNA (Hadwiger, 1999), but also
inhibits the fungal growth, spore formation and induce morphological changes in
fungi (Bautista Baños, Hernández López, & Bosquez Molina, 2004).
A study carried out by Muñoz, Moret, & Garcés (2009) showed that the radial
mycelial growth of Colletotrichum sp. was inhibited at 2% and 2.5% chitosan
concentration by 39.42%, and 63.16% respectively. Whereas at 1% and 1.5% chitosan
concentration RMGI was 14.96% and 24.95% respectively. Likewise, in another
study radial mycelial growth inhibition of C. capsici was 70% at the highest chitosan
concentration (2%) after 7 days incubation (Edirisinghe, Ali, Maqbool, & Alderson,
2014). The efficacy of chitosan has also been reported to inhibit the radial mycelial
growth of various other fungal pathogens including Colletotrichum gloeosporiodes, B.
cinerea, A. alternata, and R. stolonifera. Moreover, percent inhibition in RMG
increased as the concentration of chitosan increased (0.75–6.0 mg ml-1) (El Ghaouth,
Ponnampalam, Castaigne, & Arul, 1992).
The coating of chitosan has also been reported to reduce the lesion development
of Rhizopus stolonifer and Botrytis cinerea, increases shelf life and also delays the
rotting of inoculated cucumber, bell pepper and strawberry fruit (El Ghaouth, Arul,
Asselin, & Benhamou, 1992).
Figure 4.80: Radial mycelial growth of C. truncatum after 7 days of incubation at
25°C treated with chitosan (a) 0.5% (b) 1% (c) 1.5% (d) 2% (e) 2.5%
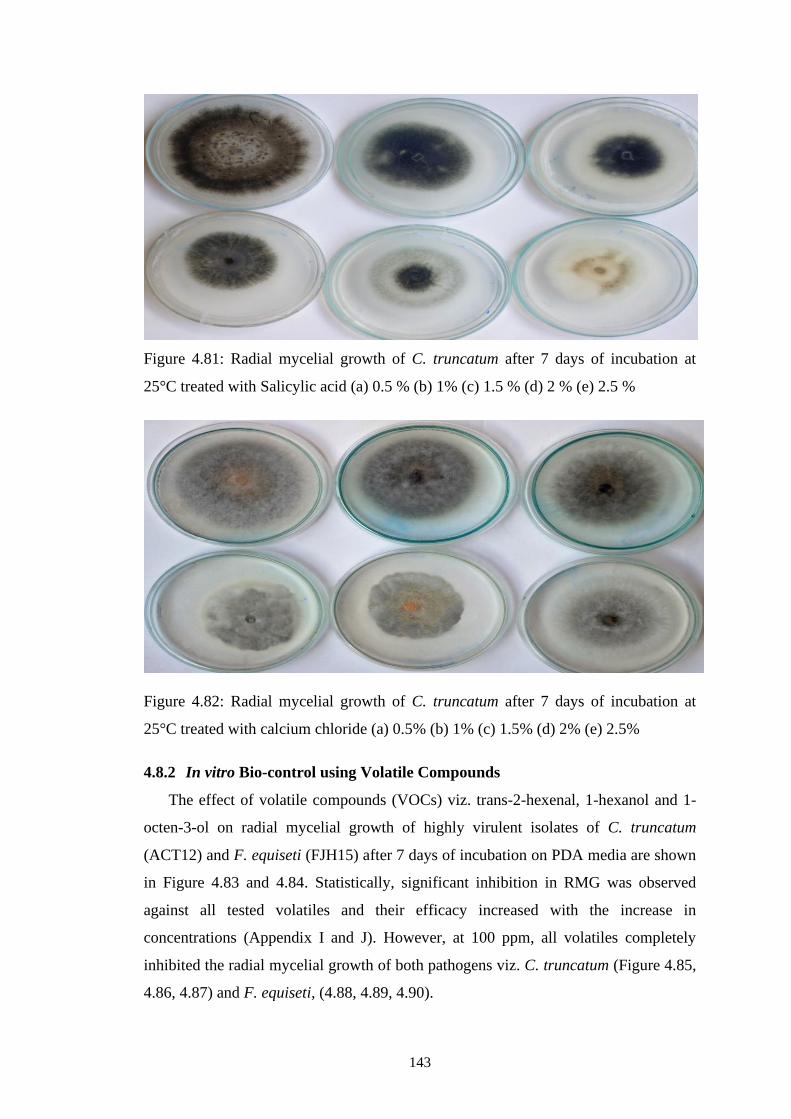
143
Figure 4.81: Radial mycelial growth of C. truncatum after 7 days of incubation at
25°C treated with Salicylic acid (a) 0.5 % (b) 1% (c) 1.5 % (d) 2 % (e) 2.5 %
Figure 4.82: Radial mycelial growth of C. truncatum after 7 days of incubation at
25°C treated with calcium chloride (a) 0.5% (b) 1% (c) 1.5% (d) 2% (e) 2.5%
4.8.2 In vitro Bio-control using Volatile Compounds
The effect of volatile compounds (VOCs) viz. trans-2-hexenal, 1-hexanol and 1-
octen-3-ol on radial mycelial growth of highly virulent isolates of C. truncatum
(ACT12) and F. equiseti (FJH15) after 7 days of incubation on PDA media are shown
in Figure 4.83 and 4.84. Statistically, significant inhibition in RMG was observed
against all tested volatiles and their efficacy increased with the increase in
concentrations (Appendix I and J). However, at 100 ppm, all volatiles completely
inhibited the radial mycelial growth of both pathogens viz. C. truncatum (Figure 4.85,
4.86, 4.87) and F. equiseti, (4.88, 4.89, 4.90).
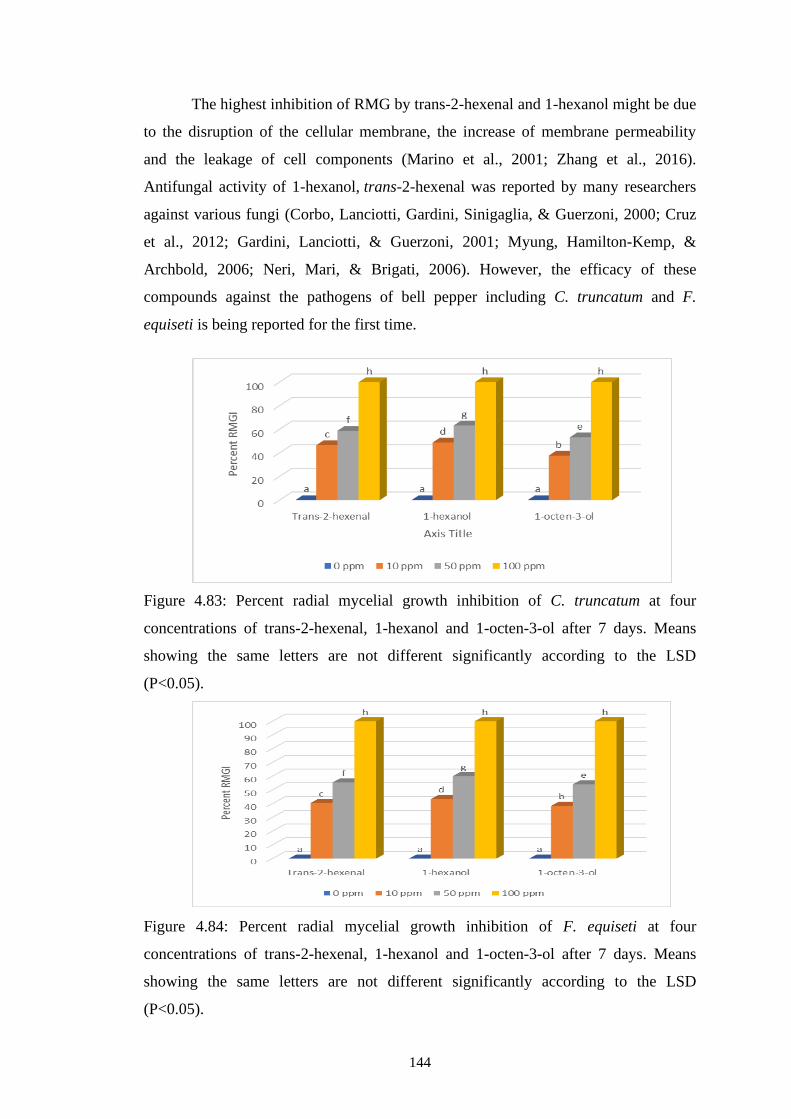
144
The highest inhibition of RMG by trans-2-hexenal and 1-hexanol might be due
to the disruption of the cellular membrane, the increase of membrane permeability
and the leakage of cell components (Marino et al., 2001; Zhang et al., 2016).
Antifungal activity of 1-hexanol, trans-2-hexenal was reported by many researchers
against various fungi (Corbo, Lanciotti, Gardini, Sinigaglia, & Guerzoni, 2000; Cruz
et al., 2012; Gardini, Lanciotti, & Guerzoni, 2001; Myung, Hamilton-Kemp, &
Archbold, 2006; Neri, Mari, & Brigati, 2006). However, the efficacy of these
compounds against the pathogens of bell pepper including C. truncatum and F.
equiseti is being reported for the first time.
Figure 4.83: Percent radial mycelial growth inhibition of C. truncatum at four
concentrations of trans-2-hexenal, 1-hexanol and 1-octen-3-ol after 7 days. Means
showing the same letters are not different significantly according to the LSD
(P<0.05).
Figure 4.84: Percent radial mycelial growth inhibition of F. equiseti at four
concentrations of trans-2-hexenal, 1-hexanol and 1-octen-3-ol after 7 days. Means
showing the same letters are not different significantly according to the LSD
(P<0.05).
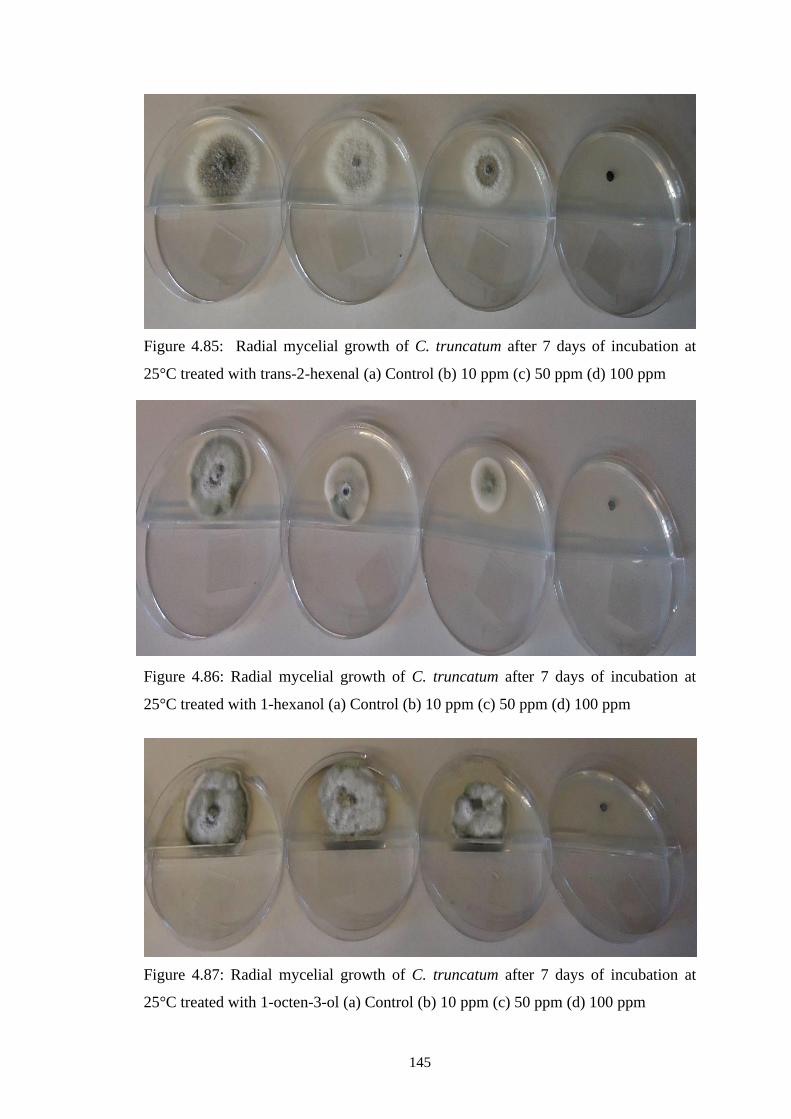
145
Figure 4.85: Radial mycelial growth of C. truncatum after 7 days of incubation at
25°C treated with trans-2-hexenal (a) Control (b) 10 ppm (c) 50 ppm (d) 100 ppm
Figure 4.86: Radial mycelial growth of C. truncatum after 7 days of incubation at
25°C treated with 1-hexanol (a) Control (b) 10 ppm (c) 50 ppm (d) 100 ppm
Figure 4.87: Radial mycelial growth of C. truncatum after 7 days of incubation at
25°C treated with 1-octen-3-ol (a) Control (b) 10 ppm (c) 50 ppm (d) 100 ppm
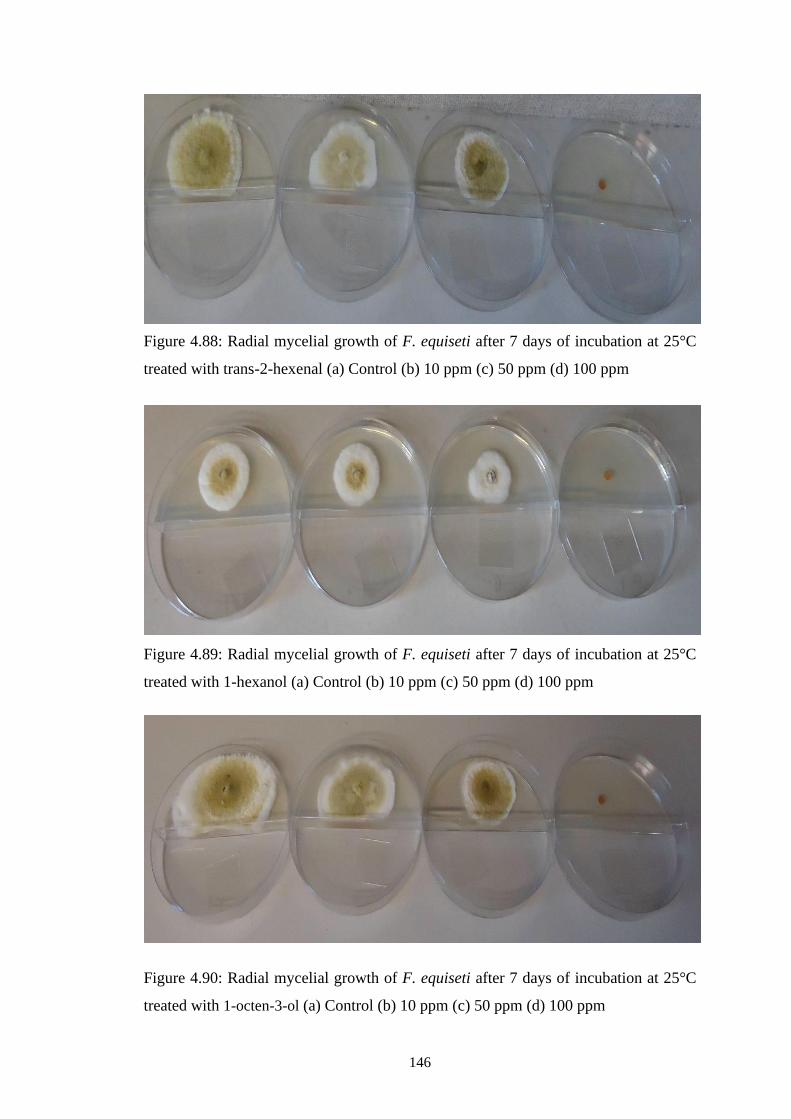
146
Figure 4.88: Radial mycelial growth of F. equiseti after 7 days of incubation at 25°C
treated with trans-2-hexenal (a) Control (b) 10 ppm (c) 50 ppm (d) 100 ppm
Figure 4.89: Radial mycelial growth of F. equiseti after 7 days of incubation at 25°C
treated with 1-hexanol (a) Control (b) 10 ppm (c) 50 ppm (d) 100 ppm
Figure 4.90: Radial mycelial growth of F. equiseti after 7 days of incubation at 25°C
treated with 1-octen-3-ol (a) Control (b) 10 ppm (c) 50 ppm (d) 100 ppm
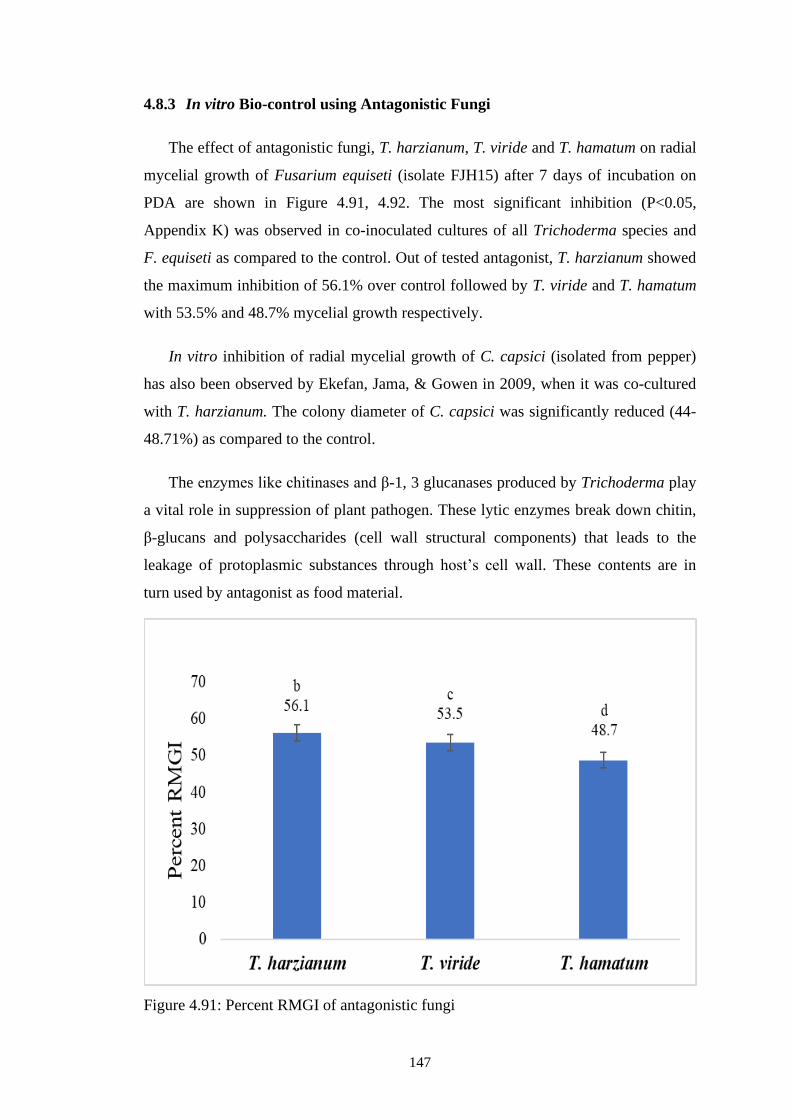
147
4.8.3 In vitro Bio-control using Antagonistic Fungi
The effect of antagonistic fungi, T. harzianum, T. viride and T. hamatum on radial
mycelial growth of Fusarium equiseti (isolate FJH15) after 7 days of incubation on
PDA are shown in Figure 4.91, 4.92. The most significant inhibition (P<0.05,
Appendix K) was observed in co-inoculated cultures of all Trichoderma species and
F. equiseti as compared to the control. Out of tested antagonist, T. harzianum showed
the maximum inhibition of 56.1% over control followed by T. viride and T. hamatum
with 53.5% and 48.7% mycelial growth respectively.
In vitro inhibition of radial mycelial growth of C. capsici (isolated from pepper)
has also been observed by Ekefan, Jama, & Gowen in 2009, when it was co-cultured
with T. harzianum. The colony diameter of C. capsici was significantly reduced (44-
48.71%) as compared to the control.
The enzymes like chitinases and β-1, 3 glucanases produced by Trichoderma play
a vital role in suppression of plant pathogen. These lytic enzymes break down chitin,
β-glucans and polysaccharides (cell wall structural components) that leads to the
leakage of protoplasmic substances through host’s cell wall. These contents are in
turn used by antagonist as food material.
Figure 4.91: Percent RMGI of antagonistic fungi
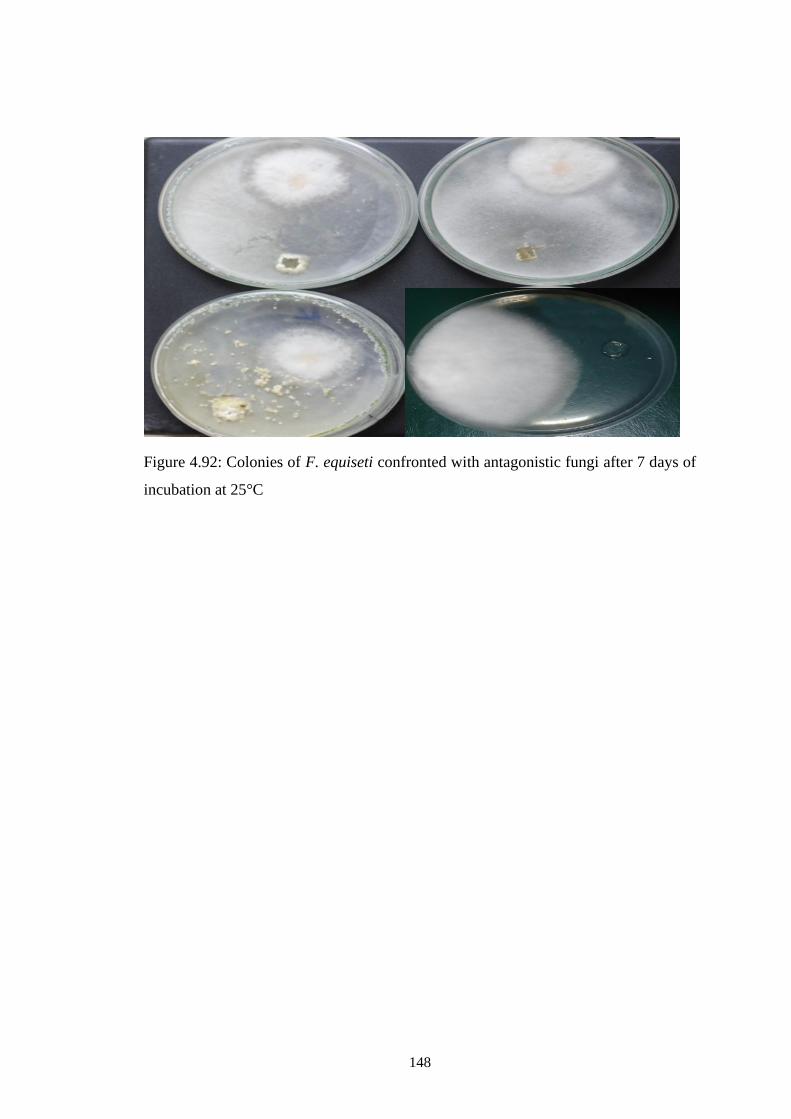
148
Figure 4.92: Colonies of F. equiseti confronted with antagonistic fungi after 7 days of
incubation at 25°C
149
SUMMARY
Bell pepper (Capsicum annuum L.) is an economic and popular crop in Pakistan.
Among various constraints fruit and root rot diseases cause significant yield losses.
No detailed studies prior to this work, with reference to disease documentation was
conducted in Pothohar plateau including Rawalpindi division (Attock, Chakwal,
Jhelum, Rawalpindi) and Islamabad. The study was aimed to assess prevalence and
incidence of fruit and root rot diseases, identification of pathogenic species employing
morphological as well as molecular tools and their pathogenic behavior. Further the in
vitro, eco-friendly management approaches were also explored against the most
prevalent fruit and root rot pathogen.
In the present study, a total of 8 greenhouses and 45 farmer’s fields/low plastic
tunnels of bell pepper were surveyed in 9 tehsils/territory during 2015-16 and 2016-17
for the assessment of percent disease prevalence, incidence and collection of diseased
samples. The same greenhouses/low plastic tunnels/open fields were surveyed at both
crop stages (seedling and maturity stage) and cropping years (2015-16 and 2016-17).
The survey and laboratory isolations revealed that four pathogens viz.
Colletotrichum, Fusarium, Botrytis and Alternaria were responsible to cause fruit rots
in bell pepper. In greenhouse cultivation, their prevalence was found 100%, however
Colletotrichum fruit rot was not observed in the greenhouse. The overall mean
incidence of Botrytis fruit rot was the maximum (15.1%) followed by Fusarium
(13.6%) and Alternaria fruit rot (9.7%) in greenhouse. All the locations surveyed in
open fields showed 100% disease prevalence of Colletotrichum, Fusarium and
Alternaria fruit rot. However, the mean prevalence of Botrytis fruit rot was 41.7%.
The mean incidence of Colletotrichum was the maximum (20.7%), followed by
Fusarium (12.0%), Alternaria (8.9%) and Botrytis fruit rot (6.7%).
Three pathogens viz. Fusarium, Rhizoctonia and Sclerotium were found
responsible for root rot. At seedling stage, the average mean disease prevalence was
found 100% for Fusarium root rot in all visited greenhouses. However, disease
prevalence for Rhizoctonia and Sclerotium root rot was 75% and 37.5% respectively.
The overall mean incidence of Rhizoctonia was the maximum (19.3%) followed by
Fusarium (15.6%) and Sclerotium (4.1%) root rot. In low plastic tunnels at seedling
150
stage, there was 100% disease prevalence for Rhizoctonia and Fusarium root rot.
However, disease prevalence of Sclerotium root rot was 77.8%. The overall incidence
of Fusarium root rot was the maximum (15.98%) followed by Rhizoctonia (14.1%)
and Sclerotium (7.38%). At maturity stage in greenhouse, the prevalence of Fusarium,
Rhizoctonia and Sclerotium root rot was 100%, 75% and 50% respectively. However,
the overall incidence of Fusarium was the maximum (9.25%) followed by
Rhizoctonia (6.22%) and Sclerotium (4.94%) root rot. In open fields, there was 100%
prevalence of Fusarium and Sclerotium root rot. However, prevalence for Rhizoctonia
root rot was 88.9%. The overall incidence of Sclerotium was the maximum (14.35%)
followed by Fusarium (8.3%) and Rhizoctonia (6.1%) root rot.
A total of 308 isolates were recovered from collected diseased samples. Out of
which 161 yielded from fruits viz. Colletotrichum truncatum (45 isolates), Fusarium
incarnatum (29 isolates), Fusarium proliferatum (11 isolates), Botrytis cinerea (40
isolates), Alternaria alternata (36 isolates). 147 isolates were recovered from root viz.
Fusarium equiseti (41 isolates), Rhizoctonia solani (56 isolates) and Sclerotium rolfsii
(50 isolates). Various morphological characters viz. colony color, reverse color,
texture, topography, margin of colony, hyphal characteristics, and resting structures
(sclerotia) were visually studied. The microscopic characters viz. spore color, shape,
size (length × width), number of septations, hyphal dimensions were noted, further
compared and confirmed with the fungal identification keys.
For pathogenicity test, widely planted yolo wonder variety was used. The species
of highly virulent isolates revealed during pathogenicity test were further confirmed
employing molecular tools. The multigene phylogenetic analysis using 6 genes
(internal transcribed spacer (ITS), actin (ACT), glyceraldehyde-3-phosphate
dehydrogenase (GAPDH), Chitin synthase1 (CHS-1), Histone3 (HIS3) and Beta-
tubulin (TUB2) confirmed the virulent isolates as Colletotrichum truncatum. In case
of highly virulent isolates of genus Fusarium nucleotide sequence of TEF gene
confirmed two species i.e. Fusarium incarnatum and Fusarium proliferatum causing
fruit rot. Whereas, Fusarium equiseti was identified as causal pathogen from isolates
belonging to root rot. For the confirmation of Botrytis specie G3PDH and ITS genes
were amplified, and the causal agent identified as Botrytis cinerea. Large subunit gene
(LSU) was used for confirmation of Sclerotium rolfsii, RS for Rhizoctonia solani and
151
beta tubulin (TUB1) for the confirmation of isolates of Alternaria alternata.
Phylogenetic analysis of all isolates revealed genetic homology with previously
reported sequences in GenBank. Molecular characterization of isolates were found in
cognizance with morphological data.
Further, the most prevalent pathogen from fruit (Colletotrichum truncatum) and
root (Fusarium equiseti) was selected for in vitro bio-control using natural substances,
volatile compounds and antagonistic fungi. The natural compound chitosan showed
55.55% radial mycelial growth inhibition (RMGI) at 2.5%, followed by salicylic acid
and calcium chloride with 53.33% and 27.77% RMGI. All the tested volatiles viz. 1-
hexanol, trans-2-hexenal and 1-octen-3-ol at 100 ppm completely inhibited the radial
mycelial growth. Out of the three Trichoderma species, Trichoderma harzianum was
found the most effective with the maximum percent RMGI of 56.1%, followed by
Trichoderma viride (53.5%) and Trichoderma hamatum (48.7%). These findings
revealed the ability of natural compounds, volatile compounds and antagonistic fungi
for in vitro bio-control and need to be used further tested in field conditions for the
management of most disastrous pathogen employing highly virulent isolates identified
in this study.
152
LITERATURE CITED
Abbasi, N. A., Ashraf, S., Ali, I., & Butt, S. J. (2015). Enhancing storage life of
bell pepper by UV-C irradiation and edible coatings. Pakistan Journal of
Agricultural Sciences, 52(2).
Ajith, P., & Lakshmidevi, N. (2010). Effect of volatile and non-volatile
compounds from Trichoderma spp. against Colletotrichum capsici incitant
of anthracnose on bell peppers. Nature and Science, 8(9), 265-269.
Akbudak, N., Tezcan, H., Akbudak, B., & Seniz, V. (2006). The effect of harpin
protein on plant growth parameters, leaf chlorophyll, leaf colour and
percentage rotten fruit of pepper plants inoculated with Botrytis cinerea.
Scientia Horticulturae, 109(2), 107-112.
Akram, A., Iqbal, S. M., Qureshi, R. A., & Rauf, C. A. (2008). Variability among
isolates of Sclerotium rolfsii associated with collar rot disease of chickpea in
Pakistan. Pakistan Journal of Botany, 40(1), 453.
Ali, A., Maqbool, M., Ramachandran, S., & Alderson, P. G. (2010). Gum arabic
as a novel edible coating for enhancing shelf-life and improving
postharvest quality of tomato (Solanum lycopersicum L.) fruit.
Postharvest Biology and Technology, 58(1), 42-47.
Almeida, A., Abdelnoor, R., Calvo, E., Tessnman, D., & Yorinori, J. (2001).
Genotypic diversity among Brazilian isolates of Sclerotium rolfsii. Journal of
Phytopathology, 149(9), 493-502.
Bailey, J., O'connell, R., Pring, R., & Nash, C. (1992). Infection strategies of
Colletotrichum species. Infection strategies of Colletotrichum species, 88-120.
Barkai-Golan, R. (2001). Postharvest diseases of fruits and vegetables:
development and control: Elsevier.
Basu, S. K., De, A. K., & De, A. (2003). Capsicum: historical and botanical
perspectives. Capsicum: The Genus Capsicum, 33, 1-15.
Bautista-Baños, S. (2014). Postharvest Decay: Control Strategies: Elsevier.
153
Bautista Baños, S., Hernández López, M., & Bosquez Molina, E. (2004). Growth
inhibition of selected fungi by chitosan and plant extracts. Revista Mexicana
De Fitopatología, 22(2).
Benhamou, N. (1996). Elicitor-induced plant defence pathways. Trends in Plant
Science, 1(7), 233-240.
Black, L., Green, S., Hartman, G., & Poulos, J. (1993). Pepper diseases: a field
guide (Fr): AVRDC.
Bolkan, H., & Ribeiro, W. (1985). Anastomosis groups and pathogenicity of
Rhizoctonia solani isolates from Brazil. Plant Disease, 69(7), 599-601.
Bosland, P., & Votava, E. (2003). Peppers: vegetable and spice capsicums. CAB
International: Oxford.
Buddemeyer, J., Pfähler, B., Petersen, J., & Märländer, B. (2004). Genetic variation in
susceptibility of maize to Rhizoctonia solani (AG 2-2IIIB)–symptoms and
damage under field conditions in Germany/Genetische Variation in der
Anfälligkeit von Mais gegenüber Rhizoctonia solani (AG 2-2IIIB)–Symptome
und Schäden im Feld in Deutschland. Zeitschrift für Pflanzenkrankheiten und
Pflanzenschutz/Journal of Plant Diseases and Protection, 521-533.
Camporota, P., Soulas, M. L., & Perrin, R. (2000). Identification and
characterization of Rhizoctonia solani using PCR/RFLP and a pine
bioassay.
Cannon, P., Damm, U., Johnston, P., & Weir, B. (2012). Colletotrichum–current
status and future directions. Studies in Mycology, 73, 181-213.
Cantu, D., Greve, L. C., Labavitch, J. M., & Powell, A. L. (2009). Characterization of
the cell wall of the ubiquitous plant pathogen Botrytis cinerea. Mycological
Research, 113(12), 1396-1403.
Carbone, I., & Kohn, L. M. (1999). A method for designing primer sets for
speciation studies in filamentous ascomycetes. Mycologia, 553-556.
Cerkauskas, R. F. (2017). Etiology and management of Fusarium crown and root
154
rot (Fusarium oxysporum) on greenhouse pepper in Ontario, Canada.
Canadian Journal of Plant Pathology, 39(2), 121-132.
Chellemi, D., Mitchell, D., Kannwischer-Mitchell, M., Rayside, P., & Rosskopf,
E. (2000). Pythium spp. associated with bell pepper production in Florida.
Plant Disease, 84(12), 1271-1274.
Choi, H.-W., Hong, S., Kim, W., & Lee, Y. (2011). First report of internal fruit
rot of sweet pepper in Korea caused by Fusarium lactis. Plant Disease,
95(11), 1476-1476.
Coakley, S. M., Scherm, H., & Chakraborty, S. (1999). Climate change and plant
disease management. Annual Review of Phytopathology, 37(1), 399-426.
Combet, E., Henderson, J., Eastwood, D. C., & Burton, K. S. (2006). Eight-
carbon volatiles in mushrooms and fungi: properties, analysis, and
biosynthesis. Mycoscience, 47(6), 317-326.
Corbo, M. R., Lanciotti, R., Gardini, F., Sinigaglia, M., & Guerzoni, M. E.
(2000). Effects of hexanal, trans-2-hexenal, and storage temperature on
shelf life of fresh sliced apples. Journal of Agricultural and Food
Chemistry, 48(6), 2401-2408.
Crous, P. W., Groenewald, J. Z., Risède, J.-M., Simoneau, P., & Hywel-Jones, N.
L. (2004). Calonectria species and their Cylindrocladium anamorphs:
species with sphaeropedunculate vesicles. Studies in Mycology, 50, 415-
430.
Cruz, A. F., Hamel, C., Yang, C., Matsubara, T., Gan, Y., Singh, A. K., Kuwada,
K., & Ishii, T. (2012). Phytochemicals to suppress Fusarium head blight
in wheat–chickpea rotation. Phytochemistry, 78, 72-80.
Damm, U., Woudenberg, J., Cannon, P., & Crous, P. (2009). Colletotrichum
species with curved conidia from herbaceous hosts. Fungal Diversity, 39,
45.
Dasgupta, B. (1981). Sporulation and relative virulence among isolates
155
of Colletotrichum capsici causing anthracnose of betelvine. Indian
Phytopathology, 32, 196-199.
Daughtrey, M., & Horst, P. (1990). Biology and management of diseases of
greenhouse florist crops. In 1991 Recommendations for the integrated
management of greenhouse florist crops. Part II. Management of pests and
crop growth. New York State College of Agriculture and Life Science, Cornell
Univ., Ithaca, NY, 14853.
de Cara, M., Pérez-Hernández, A., Aguilera-Lirola, A., & Gómez-Vázquez, J.
(2017). First Report of Wilting, Root Rot, and Stunting Caused by
Pythium aphanidermatum on Sweet Pepper (Capsicum annuum) in
Southeastern Spain. Plant Disease, 101(6), 1059-1059.
Dehpour, A., Alavi, S., & Majd, A. (2007). Light and scanning electron microscopy
studies on the penetration and infection processes of Alternaria alternata,
causing brown spot on Minneola tangelo in the West Mazandaran—Iran.
World Applied Sciences Journal, 2(1), 68-72.
De Lucca, A., Carter‐Wientjes, C., Boue, S. , & Bhatnagar, D. (2011). Volatile
trans‐2‐hexenal, a soybean aldehyde, inhibits Aspergillus flavus growth
and aflatoxin production in corn. Journal of Food Science, 76(6), M381-
M386.
Demirci, E., & Doken, M. (1995). Anastomosis groups of Rhizoctonia solani
Kuhn and binucleate Rhizoctonia isolates from various crops in Turkiye.
Journal of Turkish Phytopathology.
Dhall, R. (2013). Advances in edible coatings for fresh fruits and vegetables: a
review. Critical Reviews in Food Science and Nutrition, 53(5), 435-450.
Diao, Y., Fan, J., Wang, Z., & Liu, X. (2013). First report of Colletotrichum
boninense causing anthracnose on pepper in China. Plant Disease, 97(1),
138-138.
Dias, G. B., Gomes, V. M., Moraes, T. M., Zottich, U. P., Rabelo, G. R.,
Carvalho, A.O., Moulin, M., Goncalves, L. S. A., Rodrigues, R. & Da
156
Cunha, M. (2013). Characterization of Capsicum species using anatomical
and molecular data. Genetics and Molecular Research, 12, 6488-6501.
Domsch, K. H., Gams, W., & Anderson, T.-H. (1980). Compendium of soil
fungi. Volume 1: Academic Press (London) Ltd.
Droby, S., & Lichter, A. (2007). Post-harvest Botrytis infection: etiology,
development and management. Botrytis: Biology, Pathology and Control
(pp. 349-367): Springer.
Du, M., Schardl, C. L., Nuckles, E. M., & Vaillancourt, L. J. (2005). Using mating-
type gene sequences for improved phylogenetic resolution of Collectotrichum
species complexes. Mycologia, 97(3), 641-658.
Dutta, P., Tripathi, S., Mehrotra, G., & Dutta, J. (2009). Perspectives for
chitosan based antimicrobial films in food applications. Food Chemistry,
114(4), 1173-1182.
Edgar, R. C. (2004). MUSCLE: multiple sequence alignment with high accuracy
and high throughput. Nucleic Acids Research, 32(5), 1792-1797.
Edirisinghe, M., Ali, A., Maqbool, M., & Alderson, P. G. (2014). Chitosan controls
postharvest anthracnose in bell pepper by activating defense-related enzymes.
Journal of Food Science and Technology, 51(12), 4078-4083.
Edmunds, B. A., Gleason, M. L., & Wegulo, S. N. (2003). Resistance of hosta
cultivars to petiole rot caused by Sclerotium rolfsii var. delphinii.
HortTechnology, 13(2), 302-305.
Ekefan, E., Jama, A., & Gowen, S. (2009). Potential of Trichoderma harzianum
isolates in biocontrol of Colletotrichum capsici causing anthracnose of
Pepper (Capsicum spp.) in Nigeria. Journal of Applied Biosciences, 20,
1138-1145.
El Ghaouth, A., Arul, J., Grenier, J., & Asselin, A. (1992)a. Antifungal activity
of chitosan on two postharvest pathogens of strawberry fruits.
Phytopathology, 82(4), 398-402.
157
El Ghaouth, A., Arul, J., Asselin, A., & Benhamou, N. (1992)b. Antifungal activity of
chitosan on post-harvest pathogens: induction of morphological and
cytological alterations in Rhizopus stolonifer. Mycological Research, 96(9),
769-779.
El Ghaouth, A., Ponnampalam, R., Castaigne, F., & Arul, J. (1992). Chitosan coating
to extend the storage life of tomatoes. HortScience, 27(9), 1016-1018.
Elad, Y., Williamson, B., Tudzynski, P., & Delen, N. (2004). Botrytis: biology,
pathology and Control. Springer Science and Business Media.
Ellis, M., & Waller, J. (1974). Sclerotinia fuckeliana (conidial state: Botrytis cinerea).
CMI Descriptions of Pathogenic Fungi and Bacteria.
Elmer, P. A., & Michailides, T. J. (2007). Epidemiology of Botrytis cinerea in
orchard and vine crops. Botrytis: Biology, Pathology and Control (pp. 243-
272): Springer.
Fallik, E., Grinberg, S., Alkalai, S., Yekutieli, O., Wiseblum, A., Regev, R.,
Beres, H. & Bar-Lev, E. (1999). A unique rapid hot water treatment to
improve storage quality of sweet pepper. Postharvest Biology and
Technology, 15(1), 25-32.
Fallik, E., Grinberg, S., Lomaniec, E., Lurie, S., & Lalazar, A. (1993). Effect of
postharvest heat treatment of tomatoes on fruit ripening and decay caused
by Botrytis cinerea. Plant Disease.
Faoro, F., Maffi, D., Cantu, D., & Iriti, M. (2008). Chemical-induced resistance
against powdery mildew in barley: the effects of chitosan and
benzothiadiazole. Biocontrol, 53(2), 387-401.
Felsenstein, J. (1985). Confidence limits on phylogenies: an approach using the
bootstrap. Evolution, 39(4), 783-791.
Fletcher, J. (1994). Fusarium stem and fruit rot of sweet peppers in the
glasshouse. Plant Pathology, 43(1), 225-227.
Flieger, M., Kantorová, M., Benešová, T., Pažoutová, S., & Votruba, J. (2003).
158
Kinetics of soluble glucan production by Claviceps viridis. Folia
Microbiologica, 48(5), 633-638.
Frans, M., Aerts, R., Van Calenberge, B., Van Herck, L., & Ceusters, J. (2016).
Influence of floral morphology and fruit development on internal fruit rot
in bell pepper (Capsicum annuum). 3rd International Symposium on
Postharvest Pathology: Using Science to Increase Food Availability.
Frans, M., Aerts, R., Van Laethem, S., & Ceusters, J. (2017). Environmental effects
on growth and sporulation of Fusarium spp. causing internal fruit rot in bell
pepper. European Journal of Plant Pathology, 149(4), 875-883.
Gardini, F., Lanciotti, R., & Guerzoni, M. (2001). Effect of trans‐2‐hexenal on
the growth of Aspergillus flavus in relation to its concentration,
temperature and water activity. Letters in Applied Microbiology, 33(1),
50-55.
Garibaldi, A., Gilardi, G., Ortu, G., & Gullino, M. L. (2014). First Report of
Root Rot Caused by Pythium aphanidermatum on Bell Pepper (Capsicum
annuum L.) in Italy. Plant Disease, 98(6), 854-854.
Geiser, D. M., del Mar Jiménez-Gasco, M., Kang, S., Makalowska, I., Veeraraghavan,
N., Ward, T. J., Zhang, N., Kuldau, G. A. & O'donnell, K. (2004).
FUSARIUM-ID v. 1.0: a DNA sequence database for identifying Fusarium.
European Journal of Plant Pathology, 110(5-6), 473-479.
Gerlach, W., & Nirenberg, H. (1982). The genus Fusarium--a pictorial atlas.
Mitteilungen aus der Biologischen Bundesanstalt fur Land-und
Forstwirtschaft Berlin-Dahlem (209).
Gevens, A., Roberts, P., McGovern, R., & Kucharek, T. (2008). Vegetable
diseases caused by Phytophthora capsici in Florida. University of Florida,
Extension Digital Information Source SP159.
Gracia-Garza, J., & Fravel, D. (1998). Effect of relative humidity on sporulation of
Fusarium oxysporum in various formulations and effect of water on spore
movement through soil. Phytopathology, 88(6), 544-549.
159
Green, B. J., Mitakakis, T. Z., & Tovey, E. R. (2003). Allergen detection from
11 fungal species before and after germination. Journal of Allergy and
Clinical Immunology, 111(2), 285-289.
Grivell, A., & Jackson, J. (1969). Microbial culture preservation with silica gel.
Microbiology, 58(3), 423-425.
Grubben, G., & Denton, O. A. (2004). Plant resources of tropical Africa 2.
Vegetables. Plant Resources of Tropical Africa 2. Vegetables.
Guerber, J. C., Liu, B., Correll, J. C., & Johnston, P. R. (2003). Characterization
of diversity in Colletotrichum acutatum sensu lato by sequence analysis
of two gene introns, mtDNA and intron RFLPs, and mating compatibility.
Mycologia, 95(5), 872-895.
Hadwiger, L. A. (1999). Host-parasite interactions: elicitation of defense
responses in plants with chitosan. Exs, 87, 185-200.
Halfon-Meiri, A., & Rylski, I. (1983). Internal mold caused in sweet pepper by
Alternaria alternata: Fungal ingress. Phytopathology, 73(1), 67-70.
Hardenburg, R., Watada, A., & Wang, C. (1990). The commercial storage of
fruits, vegetables, florist and nursey stocks. Washington, DC. US
Department of Agriculture, Agriculture Handbook, 66 , 23-25.
Harp, T., Kuhn, P., Roberts, P. D., & Pernezny, K. L. (2014). Management and
cross-infectivity potential of Colletotrichum acutatum causing
anthracnose on bell pepper in Florida. Phytoparasitica, 42(1), 31-39.
Harp, T. L., Pernezny, K., Ivey, M. L. L., Miller, S. A., Kuhn, P. J ., & Datnoff,
L. (2008). The etiology of recent pepper anthracnose outbreaks in Florida.
Crop Protection, 27(10), 1380-1384.
Hausbeck, M. K., & Lamour, K. H. (2004). Phytophthora capsici on vegetable
crops: research progress and management challenges. Plant Disease,
88(12), 1292-1303.
Haware, M., Faris, D., & Gowda, C. (1992). Botrytis gray mold of chickpea: summary
160
proceedings of the BARI/ICRISAT Working Group Meeting to Discuss
Collaborative Research on Botrytis Gray Mold of Chickpea 4-8 Mar 1991
Joydebpur, Bangladesh. International Crops Research Institute for the Semi-
Arid Tropics.
Herrmann, A. (2010). The chemistry and biology of volatiles. Wiley Online
Library.
Horst, R. K. (2013). Westcott's plant disease handbook: Springer.
Hoa, T. (1994). Characterization and Pathogenicity of Rhizoctonia Solani Kuhn
Isolates from Different Rice Zones and Management of Sheath Blight of Rice.
IARI, Division of Mycology and Plant Pathology, New Delhi.
Huang, C., & Sung, I. (2017). First report of Botrytis cinerea causing postharvest fruit
decay of goat-horn sweet pepper in Taiwan. Journal of Plant Pathology,
99(2).
Hussain Shah, T. Y., Fahim, M., Hameed, S., & Haque, M. (2009). Prevalence,
occurrence and distribution of Chili veinal mottle virus in Pakistan.
Pakistan Journal of Botany, 41(2), 955-965.
Hwang, B. K., & Kim, C. H. (1995). Phytophthora blight of pepper and its
control in Korea. Plant Disease (USA).
Hyde, K. D., Cai, L., Cannon, P. F., Crouch, J. A., Crous, P.W., Damm, U.,
Goodwin, P. H., Chen, H., Johnston, P. R., Jones, E. B. G., & Liu, Z. Y.
(2009). Colletotrichum—names in current use. Fungal Diversity, 39(1),
147-182.
Jabeen, N., Javaid, A., Ahmed, E., & Sharif, A. (2014). Management of causal
organism of collar rot of bell pepper (Sclerotium rolfsii) by organic
solvents extracts of Datura metel fruit. Pakistan Journal of
Phytopathology, 26(1), 15-20.
Jarvis, W., Khosla, S., & Barrie, S. (1994). Fusarium stem and fruit rot of sweet
pepper in Ontario greenhouses. Canadian Plant Disease Survey, 74(2),
161
131-134.
Jarvis, W. R. (1992). Managing diseases in greenhouse crops (Vol. 288): APS Press
St. Paul.
Javaid, A., & Iqbal, D. (2014). Management of collar rot of bell pepper
(Capsicum annuum L.) by extracts and dry biomass of Coronopus
didymus shoot. Biological Agriculture & Horticulture, 30(3), 164-172.
Joffe, A., & Palti, J. (1972). Fusarium species of the Martiella section in Israel.
Journal of Phytopathology, 73(2), 123-148.
Jovicich, E. J., Cantliffe, D. J., & Vansickle, J. J. (2004). US imports of colored
bell peppers and the opportunity for greenhouse production of peppers in
Florida. VII International Symposium on Protected Cultivation in Mild
Winter Climates: Production, Pest Management and Global Competition.
(pp. 81-85).
Jovicich, E., VanSickle, J. J., Cantliffe, D. J., & Stoffella, P. J. (2005).
Greenhouse-grown colored peppers: a profitable alternative for vegetable
production in Florida. HortTechnology, 15(2), 355-369.
Kamal, M., & Tahir-ud-din, S. (1970). Studies on. Alternaria rot of chillies in
Pakistan and on the physiological behaviour of the causal organism. West
Pakistan Journal of Agricultural Research, 8(1), 38-49.
Kanto, T., Uematsu, S., Tsukamoto, T., Moriwaki, J., Yamagishi, N., Usami, T.,
& Sato, T. (2014). Anthracnose of sweet pepper caused by Colletotrichum
scovillei in Japan. Journal of General Plant Pathology, 80(1), 73-78.
Katoch, A., Prabhakar, C. S., & Sharma, P. N. (2016). Metageographic
population analysis of Colletotrichum truncatum associated with chili
fruit rot and other hosts using ITS region nucleotide sequences. Journal of
Plant Biochemistry and Biotechnology, 25(1), 64-72.
Kator, L., Hosea, Z., & Oche, O. (2015). Sclerotium rolfsii; causative organism
of southern blight, stem rot, white mold and sclerotia rot disease. Annals
162
of Biological Research, 6(11), 78-89.
Khaleeque, M., & Khan, S. (1991). Fungi associated with fruit-rot and die-back
diseases of chillies in Faisalabad. Pakistan Journal of Phytopathology,
3(1-2), 50-52.
Kharbanda, P., Yang, J., Howard, R., & Mirza, M. (2006). Internal fruit rot of
greenhouse peppers caused by Fusarium lactis-a new disease. The
Greenhouse Business, 5, 11-16.
Kim, K. D., Oh, B., & Yang, J. (1999). Differential Interactions of a
Colletotrichum gloeosporioides isolate with green and red pepper fruits.
Phytoparasitica, 27(2), 97-106.
Kline, L., & Wyenandt, C. (2014). Internal fruit rot and premature seed
germination of field grown colored peppers. Paper presented at the
Proceedings The 22nd international pepper conference. Vina Del Mar (p.
118).
Kookana, R. S., Baskaran, S., & Naidu, R. (1998). Pesticide fate and behaviour
in Australian soils in relation to contamination and management of soil
and water: a review. Soil Research, 36(5), 715-764.
Korpi, A., Järnberg, J., & Pasanen, A.-L. (2009). Microbial volatile organic
compounds. Critical Reviews in Toxicology, 39(2), 139-193.
Kwon, C.-S., & Lee, S.-G. (2002). Occurrence and ecological characteristics of
red pepper anthracnose. Research in Plant Disease, 8(2), 120-123.
Lamichhane, J. R., Dürr, C., Schwanck, A. A., Robin, M. H., Sarthou, J. P.,
Cellier, V., Messean, A. & Aubertot, J. N. (2017). Integrated management
of damping-off diseases. A review. Agronomy for Sustainable
Development, 37(2), 10.
Landis, T. (2013). Forest nursery pests: damping-off. For Nursery Notes, 2, 25-
32.
163
Le, C., Mendes, R., Kruijt, M., & Raaijmakers, J. (2012). Genetic and
phenotypic diversity of Sclerotium rolfsii in groundnut fields in central
Vietnam. Plant Disease, 96(3), 389-397.
Leslie, J. F., Summerell, B. A., & Bullock, S. (2006). The Fusarium laboratory
manual (Vol. 2): Wiley Online Library.
Le, T. D., McDonald, G., Scott, E. S., & Able, A. J. (2013). Infection pathway of
Botrytis cinerea in capsicum fruit (Capsicum annuum L.). Australasian
Plant Pathology, 42(4), 449-459.
Leuba, J., & Stossel, P. (1986). Chitosan and other polyamines: antifungal activity
and interaction with biological membranes. Chitin in Nature and Technology
(pp. 215-222): Springer.
Lewis Ivey, M. L., Nava-Diaz, C., & Miller, S. A. (2004). Identification and
management of Colletotrichum acutatum on immature bell peppers. Plant
Disease, 88(11), 1198-1204.
Liu, F., Tang, G., Zheng, X., Li, Y., Sun, X., Qi, X., Zhou, Y., Xu, J., Chen, H.,
Chang, X., & Zhang, S. (2016). Molecular and phenotypic characterization of
Colletotrichum species associated with anthracnose disease in peppers from
Sichuan Province, China. Scientific Reports, 6, 32761.
Liu, F., Wang, M., Damm, U., Crous, P. W., & Cai, L. (2016). Species boundaries in
plant pathogenic fungi: a Colletotrichum case study. BMC Evolutionary
Biology, 16(1), 81.
Lomas-Cano, T., Palmero-Llamas, D., De Cara, M., García-Rodríguez, C., Boix-
Ruiz, A., Camacho-Ferre, F., & Tello-Marquina, J. (2014). First report of
Fusarium oxysporum on sweet pepper seedlings in Almeria, Spain. Plant
Disease, 98(10), 1435-1435.
Maalekuu, K., Elkind, Y., Tuvia-Alkalai, S., Shalom, Y., & Fallik, E. (2003).
Quality evaluation of three sweet pepper cultivars after prolonged storage.
Advances in Horticultural Science, 187-191.
164
Madbouly, A. K., & Abdelbacki, A. M. (2017). Biocontrol of certain soilborne
diseases and promotion of growth of capsicum annuum using
biofungicides. Pakistan Journal of Botany, 49(1), 371-378.
Mahmood, M., & Sinha, B. (1990). Gray mold disease of bengal gram in Bihar. Final
Technical Bulletin, Tirhut College of Agriculture, Dholi, Bihar, India, 35.
Manoranjitham, S., Prakasam, V., Rajappan, K., & Amutha, G. (2000). Control
of chilli damping-off using bioagents. Journal of Mycology and Plant
Pathology, 30(2), 225-228.
Manrique, L. A. (1993). Greenhouse crops: A review. Journal of Plant Nutrition,
16(12), 2411-2477.
Marin, S., Magan, N., Serra, J., Ramos, A., Canela, R., & Sanchis, V. (1999).
Fumonisin B1 production and growth of Fusarium moniliforme and Fusarium
proliferatum on maize, wheat, and barley grain. Journal of Food Science,
64(5), 921-924.
Matsui, K. (2006). Green leaf volatiles: hydroperoxide lyase pathway of oxylipin
metabolism. Current Opinion in Plant Biology, 9(3), 274-280.
Mekwatanakarn, P., Kositratana, W., Phromraksa, T., & Zeigler, R. (1999). Sexually
fertile Magnaporthe grisea rice pathogens in Thailand. Plant Disease, 83(10),
939-943.
Mikhail, M. S., Sabet, K. K., Omar, M. R., Asran, A. A., & Kasem, K. K. (2010).
Current Rhizoctonia solani anastomosis groups in Egypt and their
pathogenic relation to cotton seedlings. African Journal of Microbiology
Research, 4(5), 386-395.
Miller, S., Rowe, R., & Riedel, R. (1996). Fusarium and Verticillium Wilts of
Tomato, Potato, Pepper, and Eggplant, Department of Plant Pathology,
The Ohio State University, Extention Factsheet: HYG-3122-96.
Moni, Z. R., Ali, M. A., Alam, M. S., Rahman, M. A., Bhuiyan, M. R., Mian, M. S.,
Ifekharuddaula, K. M., Latif, M. A., & Khan, M. A. I. (2016). Morphological
165
and genetical variability among Rhizoctonia solani isolates causing sheath
blight disease of rice. Rice Science, 23(1), 42-50.
Morath, S. U., Hung, R., & Bennett, J. W. (2012). Fungal volatile organic
compounds: a review with emphasis on their biotechnological potential.
Fungal Biology Reviews, 26(2-3), 73-83.
Moscone, E. A., Scaldaferro, M. A., Grabiele, M., Cecchini, N. M., Sánchez
García, Y., Jarret, R., Davina, J. R., Ducasse, D. A., Barboza, G. E., &
Ehrendorfer, F. (2006). The evolution of chili peppers (Capsicum-
Solanaceae): a cytogenetic perspective. Paper presented at the VI
International Solanaceae Conference: Genomics Meets Biodiversity,
745(137-170).
Moularat, S., Robine, E., Ramalho, O., & Oturan, M. A. (2008). Detection of
fungal development in a closed environment through the identification of
specific VOC: demonstration of a specific VOC fingerprint for fungal
development. Science of the Total Environment, 407(1), 139-146.
Muñoz, Z., Moret, A., & Garcés, S. (2009). Assessment of chitosan for inhibition of
Colletotrichum sp. on tomatoes and grapes. Crop Protection, 28(1), 36-40.
Muzzarelli, R., Aiba, S., Fujiwara, Y., Hideshima, T., Hwang, C., Kakizaki, M.,
Izume, M., Minoura, N., Rha, C., & Shouij, T. (1986). Filmogenic
Properties of Chitin/Chitosan'in Chitin in Nature and Technology: Ed
Plenum Press. United States: Blackwell.
Myung, K., Hamilton-Kemp, T. R., & Archbold, D. D. (2006). Biosynthesis of trans-
2-hexenal in response to wounding in strawberry fruit. Journal of Agricultural
and Food Chemistry, 54(4), 1442-1448.
Nadeem, M., Anjum, F. M., Khan, M. R., Saeed, M., & Riaz, A. (2011).
Antioxidant potential of bell pepper (Capsicum annum L.) a review.
Pakistan Journal of Food Science, 21(1-4), 45-51.
Naz, F., Rauf, C. A., Abbasi, N. A., Haque, I., & Ahmad, I. (2008). Influence of
inoculum levels of Rhizoctonia solani and susceptibility on new potato
166
germplasm. Pakistan Journal of Botany, 40(5), 2199-2209.
Nei, M., & Kumar, S. (2000). Molecular evolution and phylogenetics: Oxford
university press.
Nelson, P. E., Toussoun, T. A., & Marasas, W. (1983). Fusarium species: an
illustrated manual for identification.
Neri, F., Mari, M., & Brigati, S. (2006). Control of Penicillium expansum by plant
volatile compounds. Plant Pathology, 55(1), 100-105.
O'Donnell, K., & Cigelnik, E. (1997). Two divergent intragenomic rDNA ITS2
types within a monophyletic lineage of the fungus Fusarium are
nonorthologous. Molecular Phylogenetics and Evolution, 7(1), 103-116.
O'Donnell, K., Cigelnik, E., & Nirenberg, H. I. (1998). Molecular systematics
and phylogeography of the Gibberella fujikuroi species complex.
Mycologia, 90(3), 465-493.
O’Donnell, K., Rooney, A. P., Proctor, R. H., Brown, D. W., McCormick, S. P.,
Ward, T. J., Frandsen, R. J., Lysøe, E., Rehner, S. A., Aoki, T. & Robert, V.A.
(2013). Phylogenetic analyses of RPB1 and RPB2 support a middle
Cretaceous origin for a clade comprising all agriculturally and medically
important fusaria. Fungal Genetics and Biology, 52, 20-31.
O’Donnell, K., Ward, T. J., Robert, V. A., Crous, P. W., Geiser, D. M., & Kang, S.
(2015). DNA sequence-based identification of Fusarium: current status and
future directions. Phytoparasitica, 43(5), 583-595.
Okereke, V., & Wokocha, R. (2007). In vitro growth of four isolates of Sclerotium
rolfsii Sacc in the humid tropics. African Journal of Biotechnology, 6(16).
Pascual, C., Toda, T., Raymondo, A., & Hyakumachi, M. (2000). Characterization by
conventional techniques and PCR of Rhizoctonia solani isolates causing
banded leaf sheath blight in maize. Plant Pathology, 49(1), 108-118.
Perkins, D. D. (1962). Preservation of Neurospora stock cultures with anhydrous
silica gel. Canadian Journal of Microbiology, 8(4), 591-594.
167
Pernezny, K., Roberts, P., Murphy, J., & Goldberg, N. (2003). Compendium of
Pepper Diseases.(pp. 37). St. Paul, Minnedota: The American
Phytopathological Society.
Plog, B. A., Niland, J., & Quinlan, P. (1996). Fundamentals of industrial
hygiene: National Safety Council Ithaca, NY.
Punja, Z. K. (1985). The biology, ecology, and control of Sclerotium rolfsii. Annual
Review of Phytopathology, 23(1), 97-127.
Raeder, U., & Broda, P. (1985). Rapid preparation of DNA from filamentous
fungi. Letters in Applied Microbiology, 1(1), 17-20.
Rahimi, Z., Aboutalebi, A., & Zakerin, A. (2013). Comparison of different
medium for production of sweet pepper transplant. International Research
Journal of Applied and Basic Sciences, 4(2), 307-310.
Rahin, A., & Sharif, F. (1985). A study of pepper wilt in northern Iraq. Ecology
and Management of Soilborne Plant Pathogens, 59-62.
Ramdial, H., Hosein, F., & Rampersad, S. (2016). First report of Fusarium
incarnatum associated with fruit disease of bell peppers in Trinidad. Plant
Disease, 100(2), 526-526.
Ramdial, H., & Rampersad, S. (2010). First report of Fusarium solani causing
fruit rot of sweet pepper in Trinidad. Plant Disease, 94(11), 1375-1375.
Ramdial, H., & Rampersad, S. N. (2015). Characterization of Colletotrichum
spp. causing anthracnose of bell pepper (Capsicum annuum L.) in
Trinidad. Phytoparasitica, 43(1), 37-49.
Rashad, Y., Abdel-Fattah, G., Hafez, E., & El-Haddad, S. (2012). Diversity among
some Egyptian isolates of Rhizoctonia solani based on anastomosis grouping,
molecular identification and virulence on common bean. African Journal of
Microbiology Research, 6(37), 6661-6667.
Rekah, Y., Shtienberg, D., & Katan, J. (2000). Disease development following
infection of tomato and basil foliage by airborne conidia of the soilborne
168
pathogens Fusarium oxysporum f. sp. radicis-lycopersici and F. oxysporum f.
sp. basilici. Phytopathology, 90(12), 1322-1329.
Remesal, E., Lucena, C., Azpilicueta, A., Landa, B. B., & Navas-Cortés, J. A.
(2010). First report of southern blight of pepper caused by Sclerotium
rolfsii in Southern Spain. Plant Disease, 94(2), 280-280.
Ristaino, J. B., & Johnston, S. A. (1999). Ecologically based approaches to
management of Phytophthora blight on bell pepper. Plant Disease,
83(12), 1080-1089.
Ristaino, J. B., Larkin, R. P., & Campbell, C. L. (1993). Spatial and temporal
dynamics of Phytophthora epidemics in commercial bell pepper fields.
Phytopathology, 83(12), 1312-1320.
Roberts, P. (2001). Anthracnose caused by Colletotrichum sp. on pepper: University
of Florida Cooperative Extension Service, Institute of Food and Agricultural
Sciences, EDIS.
Roberts, P. D., Murphy, J. F., & Pernezny, K. (2003). Compendium of pepper
diseases: Minnesota, US: APS Press.
Rossi, V., Scandolara, A., & Battilani, P. (2009). Effect of environmental conditions
on spore production by Fusarium verticillioides, the causal agent of maize ear
rot. European Journal of Plant Pathology, 123(2), 159-169.
Roy, K., Killebrew, J., & Ratnayake, S. (1997). First report of Colletotrichum
capsici on bell pepper in Mississippi. Plant Disease, 81(6), 693-693.
Sahi, I. Y., & Khalid, A. (2007). In vitro biological control of Fusarium
oxysporum causing wilt in Capsicum annuum. Mycopath, 5, 85-88.
Samapundo, S., Devliehgere, F., De Meulenaer, B., & Debevere, J. (2005). Effect of
water activity and temperature on growth and the relationship between
fumonisin production and the radial growth of Fusarium verticillioides and
Fusarium proliferatum on corn. Journal of Food Protection, 68(5), 1054-
1059.
169
Scott, J., Gordon, T., Shaw, D., & Koike, S. (2010). Effect of temperature on severity
of Fusarium wilt of lettuce caused by Fusarium oxysporum f. sp. lactucae.
Plant Disease, 94(1), 13-17.
Scala, A., Allmann, S., Mirabella, R., Haring, M., & Schuurink, R. (2013). Green
leaf volatiles: a plant’s multifunctional weapon against herbivores and
pathogens. International Journal of Molecular Sciences, 14(9), 17781-
17811.
Seepersad, G., Iton, A., Paul, C., & Lawrence, J. (2013). Financial aspects of
greenhouse vegetables production systems in Jamaica and Trinidad & Tobago.
URL http://www. cardi. org/cfc-pa/files/downloads/2013/11/Publ-20-
Financial-Aspects-Greenhouses-Govind-S. pdf.
Sharma, G., & Shenoy, B. D. (2014). Colletotrichum fructicola and C. siamense
are involved in chilli anthracnose in India. Archives of Phytopathology
and Plant protection, 47(10), 1179-1194.
Shenoy, B. D., Jeewon, R., Lam, W. H., Bhat, D. J., Than, P. P., Taylor, P. W.,
& Hyde, K. D. (2007). Morpho-molecular characterisation and
epitypification of Colletotrichum capsici (Glomerellaceae,
Sordariomycetes), the causative agent of anthracnose in chilli. Fungal
Diversity, 27, 197-211.
Shin, H., Xu, T., Zhang, C., & Chen, Z. (2000). The comparative study of
capsicum anthracnose pathogens from Korea with that of China. Journal
of Zhejiang University (Agriculture and Life Sciences), 26(6), 629-634.
Shotorbani, N. Y., Jamei, R., & Heidari, R. (2013). Antioxidant activities of two
sweet pepper Capsicum annuum L. varieties phenolic extracts and the
effects of thermal treatment. Avicenna Journal of Phytomedicine, 3(1),
25.
Simmons, E. G. (1995). Alternaria themes and variations (112-144). Mycotaxon, 55,
55-163.
170
Simmons, E. G. (2007). Alternaria: An Indentification Manual.
Simone, G., & Momol, M. (2000). Vegetable disease recognition and management.
Florida Green-house Vegetable Production Handbook, 3(2), 152-157.
Singh, G., & Kapoor, S. (1985). Role of incubation and photoperiod on the intensiy of
Botrytis gray mold of chickpea. International Chickpea Newsletter.
Smith, D., & Onions, A. H. (1983). A comparison of some preservation techniques for
fungi. Transactions of the British Mycological Society, 81(3), 535-540.
Sneh, B., Burpee, L., & Ogoshi, A. (1991). Identification of Rhizoctonia species: APS
press.
Snowdon, A. L. (1990). A colour atlas of post-harvest diseases and disorders of
fruits and vegetables. Volume 1: General introduction and fruits: Wolfe
Scientific Ltd.
Staats, M., van Baarlen, P., & van Kan, J. A. (2004). Molecular phylogeny of the
plant pathogenic genus Botrytis and the evolution of host specificity.
Molecular Biology and Evolution, 22(2), 333-346.
Stielow, J. B., Levesque, C. A., Seifert, K. A., Meyer, W., Iriny, L., Smits, D.,
Renfurm, R., Verkley, G.J.M., Groenewald, M., Chaduli, D. and Lomascolo,
A., (2015). One fungus, which genes? Development and assessment of
universal primers for potential secondary fungal DNA barcodes. Persoonia:
Molecular Phylogeny and Evolution of Fungi, 35, 242.
Stirling, G., Eden, L., & Ashley, M. (2004). Sudden wilt of capsicum in tropical
and subtropical Australia: a severe form of Pythium root rot exacerbated
by high soil temperatures. Australasian Plant Pathology, 33(3), 357-366.
Sutton, J. C., Sopher, C. R., Owen-Going, T. N., Liu, W., Grodzinski, B., Hall, J.
C., & Benchimol, R. L. (2006). Etiology and epidemiology of Pythium
root rot in hydroponic crops: current knowledge and perspectives. Summa
Phytopathologica, 32(4), 307-321.
Taheri, P., Gnanamanickam, S., & Höfte, M. (2007). Characterization, genetic
171
structure, and pathogenicity of Rhizoctonia spp. associated with rice sheath
diseases in India. Phytopathology, 97(3), 373-383.
Talhinhas, P., Sreenivasaprasad, S., Neves-Martins, J., & Oliveira, H. (2002). Genetic
and morphological characterization of Colletotrichum acutatum causing
anthracnose of lupins. Phytopathology, 92(9), 986-996.
Tariq, A., Naz, F., Rauf, C. A., & Irshad, G. (2015). Long term and least expensive
preservation methods for various fungal cultures. Pakistan Journal of
Phytopathology, 27(2), 147-151.
Tariq, A., Naz, F., Rauf, C., Irshad, G., Abbasi, N., & Khokhar, N. (2017). First
report of anthracnose caused by Colletotrichum truncatum on bell pepper
(Capsicum annuum) in Pakistan. Plant Disease, 101(4), 631-631.
Terry, L. A., & Joyce, D. C. (2004). Elicitors of induced disease resistance in
postharvest horticultural crops: a brief review. Postharvest Biology and
Technology, 32(1), 1-13.
Than, P. P., Prihastuti, H., Phoulivong, S., Taylor, P. W., & Hyde, K. D. (2008).
Chilli anthracnose disease caused by Colletotrichum species. Journal of
Zhejiang University Science, 9(10), 764.
Tiru, M., Muleta, D., Bercha, G., & Adugna, G. (2013). Antagonistic effect of
rhizobacteria against coffee wilt disease caused by Gibberella xylarioides.
Asian Journal of Plant Pathology, 7(3), 109-122.
Torres‐Calzada, C., Tapia‐Tussell, R., Higuera‐Ciapara, I., Huchin‐Poot, E.,
Martin‐Mex, R., Nexticapan‐Garcez, A., & Perez‐Brito, D. (2018).
Characterization of Colletotrichum truncatum from papaya, pepper and physic
nut based on phylogeny, morphology and pathogenicity. Plant Pathology,
67(4), 821-830.
Tripathi, H., & Rathi, Y. (1992). Epidemiology of botrytis gray mold of chickpea.
Botrytis gray mold of chickpea’.(Eds MP Haware, DG Faris, CLL Gowda), 8-
9.
172
Tripathi, P., & Dubey, N. (2004). Exploitation of natural products as an
alternative strategy to control postharvest fungal rotting of fruit and
vegetables. Postharvest Biology and Technology, 32(3), 235-245.
Tuncer, G., & Erdiller, G. (1990). The identification of Rhizoctonia solani Kühn
anastomosis groups isolated from potato and some other crops in Central
Anatolia. Journal of Turkish Phytopathology, 19(2), 89-93.
Utkhede, R., & Mathur, S. (2003). Fusarium fruit rot of greenhouse sweet
peppers in Canada. Plant Disease, 87(1), 100-100.
Utkhede, R., & Mathur, S. (2004). Internal fruit rot caused by Fusarium
subglutinans in greenhouse sweet peppers. Canadian Journal of Plant
Pathology, 26(3), 386-390.
van Schoonhoven, A. (1987). Standard system for the evaluation of bean
germplasm: CIAT.
Vásquez, L., Tlapal, B., Yáñez, M., Pérez, P., & Quintos, E. (2009). Etiology of
pepper wilt disease of'Chile de Agua'(Capsicum annuum L.) in Oaxaca,
México. Revista Fitotecnia Mexicana, 32(2), 127-134.
Vilgalys, R., & Hester, M. (1990). Rapid genetic identification and mapping of
enzymatically amplified ribosomal DNA from several Cryptococcus
species. Journal of Bacteriology, 172(8), 4238-4246.
Vinnere, O., Fatehi, J., Wright, S. A., & Gerhardson, B. (2002). The causal agent of
anthracnose of Rhododendron in Sweden and Latvia. Mycological Research,
106(1), 60-69.
Walsh, B. M., & Hoot, S. B. (2001). Phylogenetic relationships of Capsicum
(Solanaceae) using DNA sequences from two noncoding regions: the
chloroplast atpB-rbcL spacer region and nuclear waxy introns.
International Journal of Plant Sciences, 162(6), 1409-1418.
Webb, K. M., Brenner, T., & Jacobsen, B. J. (2015). Temperature effects on the
interactions of sugar beet with Fusarium yellows caused by Fusarium
173
oxysporum f. sp. betae. Canadian Journal of Plant Pathology, 37(3), 353-362.
Weir, B., Johnston, P., & Damm, U. (2012). The Colletotrichum gloeosporioides
species complex. Studies in Mycology, 73, 115-180.
Whipps, J. M., & Lumsden, R. D. (2001). Commercial use of fungi as plant
disease biological control agents: status and prospects. Fungal Biocontrol
Agents: Progress, Problems and Potential, 9-22.
White, T. J., Bruns, T., Lee, S., & Taylor, J. (1990). Amplification and direct
sequencing of fungal ribosomal RNA genes for phylogenetics. PCR
protocols: a guide to methods and applications, 18(1), 315-322.
Williamson, B., Tudzynski, B., Tudzynski, P., & van Kan, J. A. (2007). Botrytis
cinerea: the cause of grey mould disease. Molecular Plant Pathology,
8(5), 561-580.
Windels, C. E., Burnes, P. M., & Kommedahl, T. (1988). Five-year preservation of
Fusarium species on silica gel and soil. Phytopathology, 78(1), 107-109.
Wood, W. F., & Fesler, M. (1986). Mushroom odors: student synthesis of the
odoriferous compounds of the matsutake mushroom. Journal of Chemical
Education, 63(1), 92.
Woody, M., & Chu, F. (1992). Toxicology of Alternaria mycotoxins. Alternaria:
Biology, Plant Diseases, and Metabolites, 409-434.
Xie, C., & Vallad, G. (2016). Integrated Management of Southern Blight in
Vegetable Production1. University of Florida IFAS Extension.
Yabuuchi, E., Kosako, Y., Yano, I., Hotta, H., & Nishiuchi, Y. (1995). Transfer
of Two Burkholderia and An Alcaligenes Species to Ralstonia Gen. Nov.
Proposal of Ralstonia pickettii (Ralston, Palleroni and Doudoroff 1973)
Comb. Nov., Ralstonia solanacearum (Smith 1896) Comb. Nov. and
Ralstonia eutropha (Davis 1969) Comb. Nov. Microbiology and
immunology, 39(11), 897-904.
Yang, J., Kharbanda, P., Howard, R., & Mirza, M. (2009). Identification and
174
pathogenicity of Fusarium lactis, causal agent of internal fruit rot of
greenhouse sweet pepper in Alberta. Canadian Journal of Plant Pathology,
31(1), 47-56.
Yang, Y., Cao, T., Yang, J., Howard, R. J., Kharbanda, P. D., & Strelkov, S. E.
(2010). Histopathology of internal fruit rot of sweet pepper caused by
Fusarium lactis. Canadian Journal of Plant Pathology, 32(1), 86-97.
Yoon, M. Y., Cha, B., & Kim, J. C. (2013). Recent trends in studies on botanical
fungicides in agriculture. The Plant Pathology Journal, 29(1), 1.
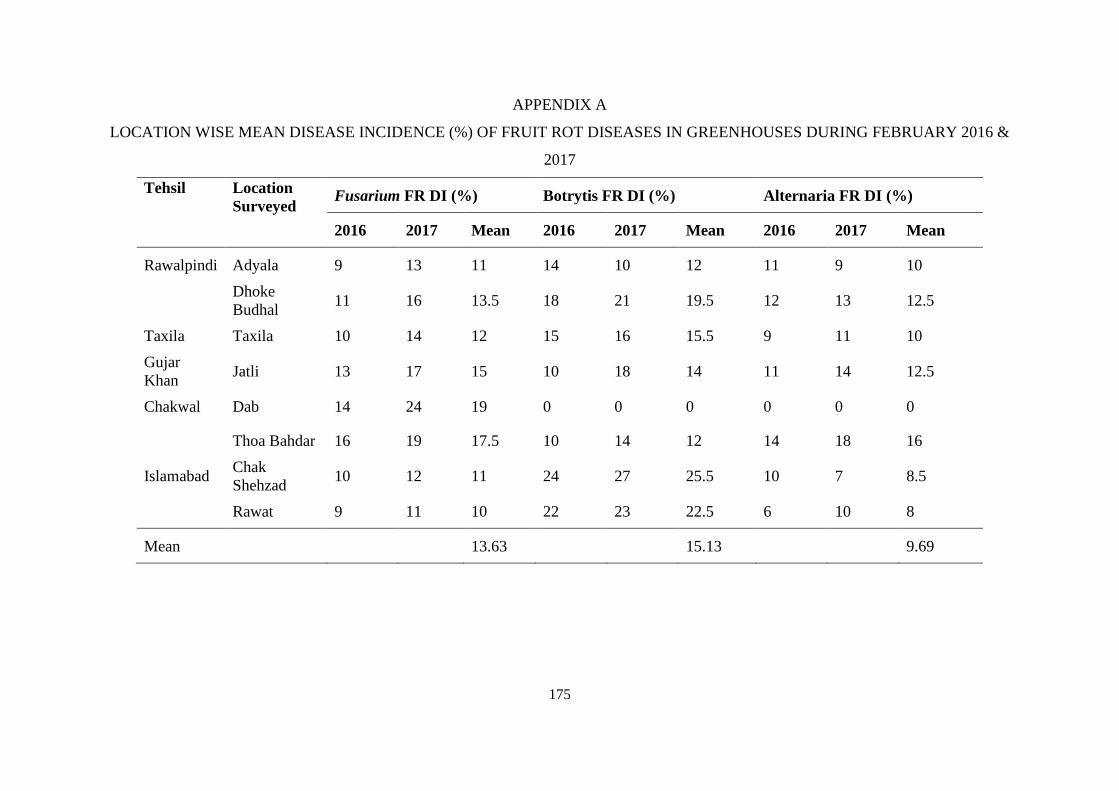
175
APPENDIX A
LOCATION WISE MEAN DISEASE INCIDENCE (%) OF FRUIT ROT DISEASES IN GREENHOUSES DURING FEBRUARY 2016 &
2017
Tehsil Location
Surveyed Fusarium FR DI (%) Botrytis FR DI (%) Alternaria FR DI (%)
2016 2017 Mean 2016 2017 Mean 2016 2017 Mean
Rawalpindi Adyala 9 13 11 14 10 12 11 9 10
Dhoke
Budhal 11 16 13.5 18 21 19.5 12 13 12.5
Taxila Taxila 10 14 12 15 16 15.5 9 11 10
Gujar
Khan Jatli 13 17 15 10 18 14 11 14 12.5
Chakwal Dab 14 24 19 0 0 0 0 0 0
Thoa Bahdar 16 19 17.5 10 14 12 14 18 16
Islamabad Chak
Shehzad 10 12 11 24 27 25.5 10 7 8.5
Rawat 9 11 10 22 23 22.5 6 10 8
Mean 13.63 15.13 9.69
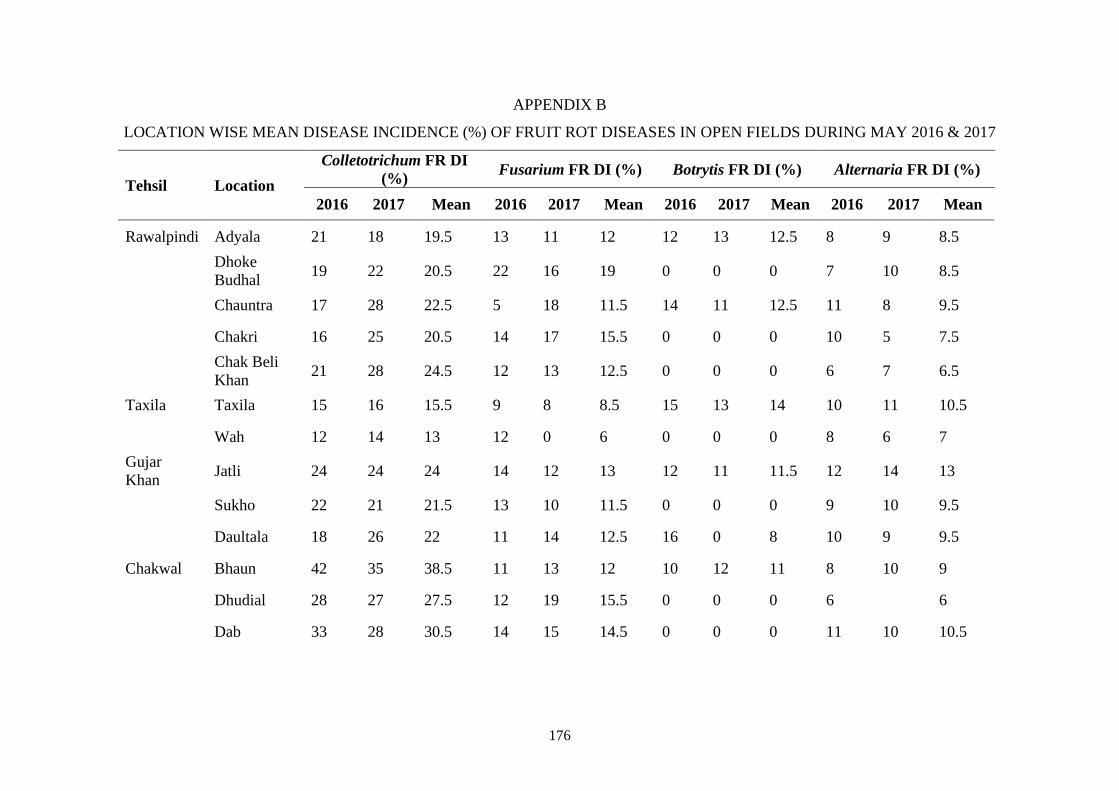
176
APPENDIX B
LOCATION WISE MEAN DISEASE INCIDENCE (%) OF FRUIT ROT DISEASES IN OPEN FIELDS DURING MAY 2016 & 2017
Tehsil Location
Colletotrichum FR DI
(%) Fusarium FR DI (%) Botrytis FR DI (%) Alternaria FR DI (%)
2016 2017 Mean 2016 2017 Mean 2016 2017 Mean 2016 2017 Mean
Rawalpindi Adyala 21 18 19.5 13 11 12 12 13 12.5 8 9 8.5
Dhoke
Budhal 19 22 20.5 22 16 19 0 0 0 7 10 8.5
Chauntra 17 28 22.5 5 18 11.5 14 11 12.5 11 8 9.5
Chakri 16 25 20.5 14 17 15.5 0 0 0 10 5 7.5
Chak Beli
Khan 21 28 24.5 12 13 12.5 0 0 0 6 7 6.5
Taxila Taxila 15 16 15.5 9 8 8.5 15 13 14 10 11 10.5
Wah 12 14 13 12 0 6 0 0 0 8 6 7
Gujar
Khan Jatli 24 24 24 14 12 13 12 11 11.5 12 14 13
Sukho 22 21 21.5 13 10 11.5 0 0 0 9 10 9.5
Daultala 18 26 22 11 14 12.5 16 0 8 10 9 9.5
Chakwal Bhaun 42 35 38.5 11 13 12 10 12 11 8 10 9
Dhudial 28 27 27.5 12 19 15.5 0 0 0 6 6
Dab 33 28 30.5 14 15 14.5 0 0 0 11 10 10.5
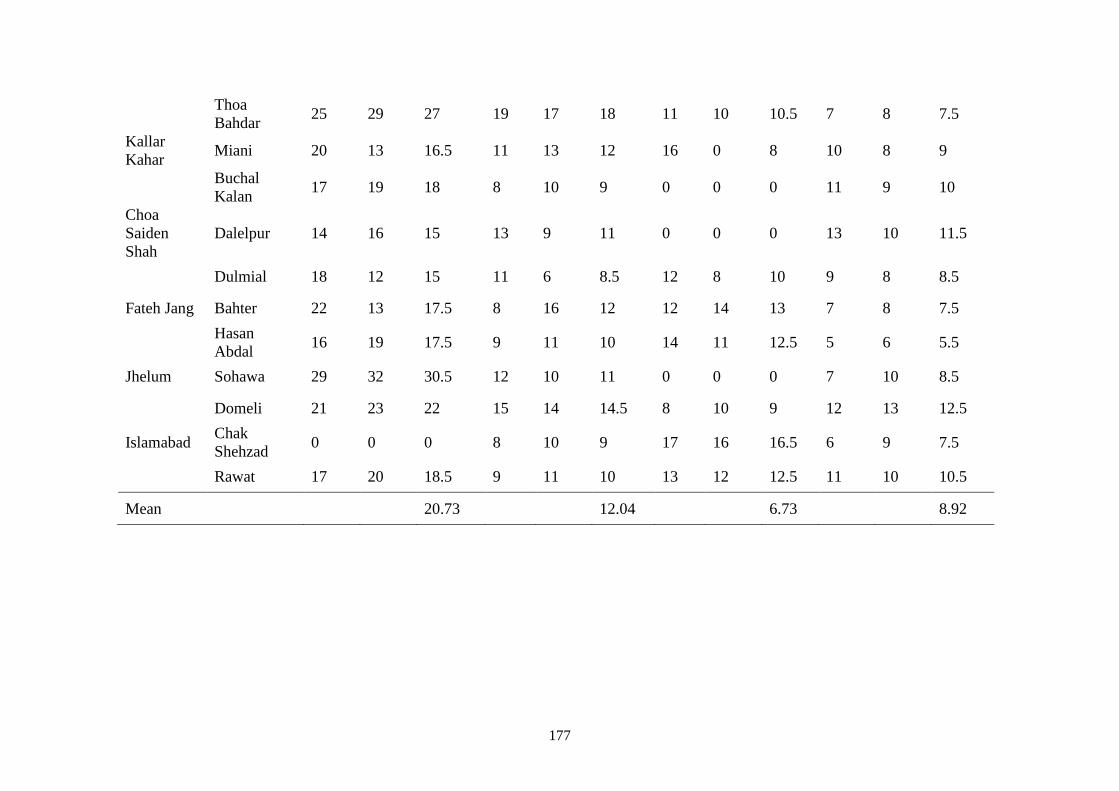
177
Thoa
Bahdar 25 29 27 19 17 18 11 10 10.5 7 8 7.5
Kallar
Kahar Miani 20 13 16.5 11 13 12 16 0 8 10 8 9
Buchal
Kalan 17 19 18 8 10 9 0 0 0 11 9 10
Choa
Saiden
Shah
Dalelpur 14 16 15 13 9 11 0 0 0 13 10 11.5
Dulmial 18 12 15 11 6 8.5 12 8 10 9 8 8.5
Fateh Jang Bahter 22 13 17.5 8 16 12 12 14 13 7 8 7.5
Hasan
Abdal 16 19 17.5 9 11 10 14 11 12.5 5 6 5.5
Jhelum Sohawa 29 32 30.5 12 10 11 0 0 0 7 10 8.5
Domeli 21 23 22 15 14 14.5 8 10 9 12 13 12.5
Islamabad Chak
Shehzad 0 0 0 8 10 9 17 16 16.5 6 9 7.5
Rawat 17 20 18.5 9 11 10 13 12 12.5 11 10 10.5
Mean 20.73 12.04 6.73 8.92
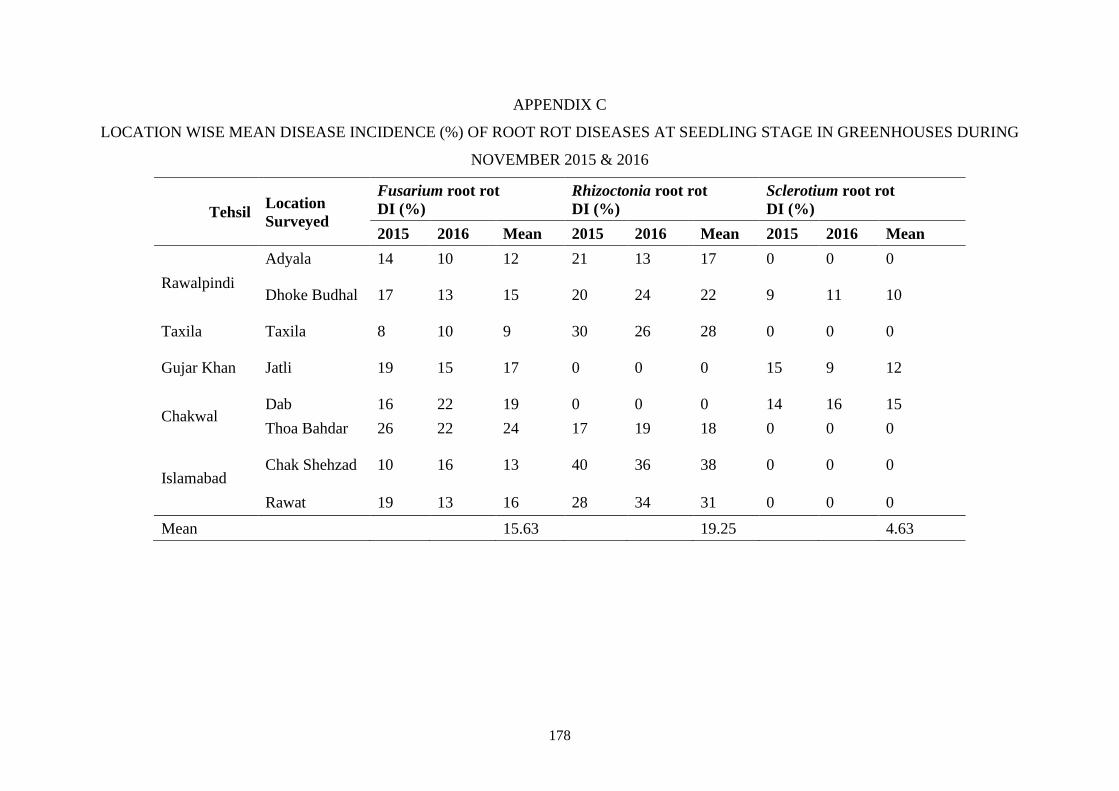
178
APPENDIX C
LOCATION WISE MEAN DISEASE INCIDENCE (%) OF ROOT ROT DISEASES AT SEEDLING STAGE IN GREENHOUSES DURING
NOVEMBER 2015 & 2016
Tehsil Location
Surveyed
Fusarium root rot
DI (%)
Rhizoctonia root rot
DI (%)
Sclerotium root rot
DI (%)
2015 2016 Mean 2015 2016 Mean 2015 2016 Mean
Rawalpindi
Adyala 14 10 12 21 13 17 0 0 0
Dhoke Budhal 17 13 15 20 24 22 9 11 10
Taxila Taxila 8 10 9 30 26 28 0 0 0
Gujar Khan Jatli 19 15 17 0 0 0 15 9 12
Chakwal Dab 16 22 19 0 0 0 14 16 15
Thoa Bahdar 26 22 24 17 19 18 0 0 0
Islamabad Chak Shehzad 10 16 13 40 36 38 0 0 0
Rawat 19 13 16 28 34 31 0 0 0
Mean 15.63 19.25 4.63
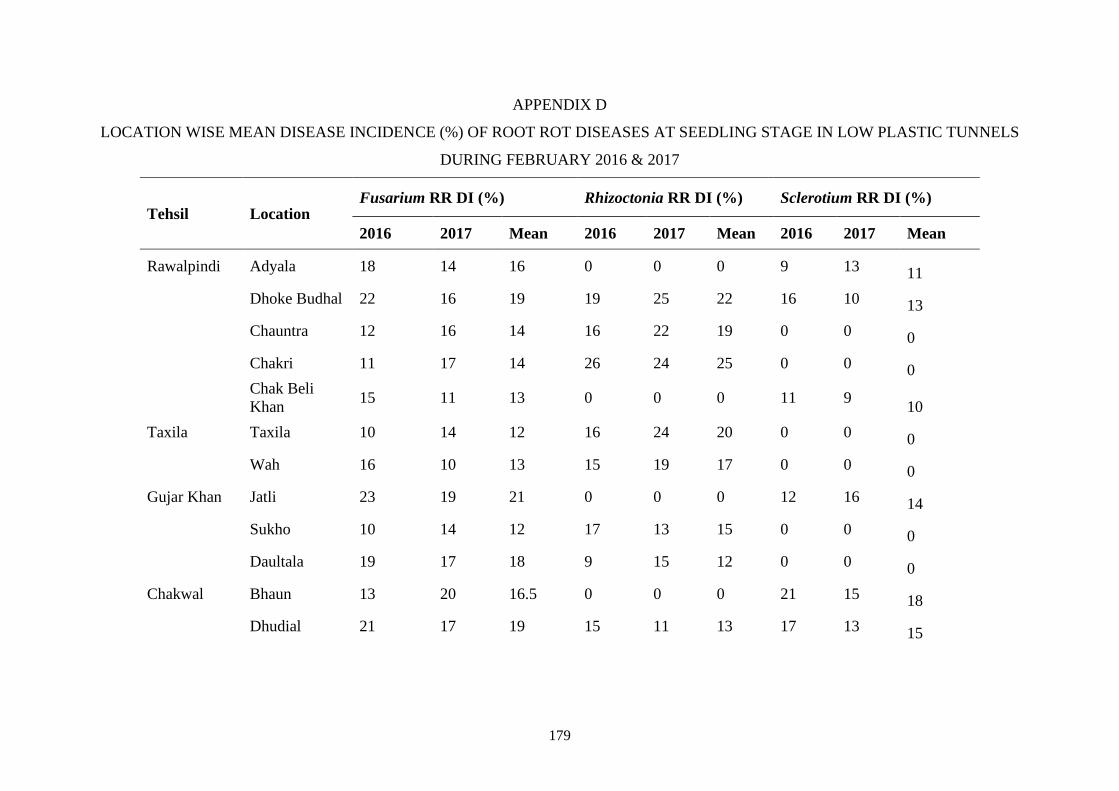
179
APPENDIX D
LOCATION WISE MEAN DISEASE INCIDENCE (%) OF ROOT ROT DISEASES AT SEEDLING STAGE IN LOW PLASTIC TUNNELS
DURING FEBRUARY 2016 & 2017
Tehsil Location Fusarium RR DI (%) Rhizoctonia RR DI (%) Sclerotium RR DI (%)
2016 2017 Mean 2016 2017 Mean 2016 2017 Mean
Rawalpindi Adyala 18 14 16 0 0 0 9 13 11
Dhoke Budhal 22 16 19 19 25 22 16 10 13
Chauntra 12 16 14 16 22 19 0 0 0
Chakri 11 17 14 26 24 25 0 0 0
Chak Beli
Khan 15 11 13 0 0 0 11 9
10
Taxila Taxila 10 14 12 16 24 20 0 0 0
Wah 16 10 13 15 19 17 0 0 0
Gujar Khan Jatli 23 19 21 0 0 0 12 16 14
Sukho 10 14 12 17 13 15 0 0 0
Daultala 19 17 18 9 15 12 0 0 0
Chakwal Bhaun 13 20 16.5 0 0 0 21 15 18
Dhudial 21 17 19 15 11 13 17 13 15
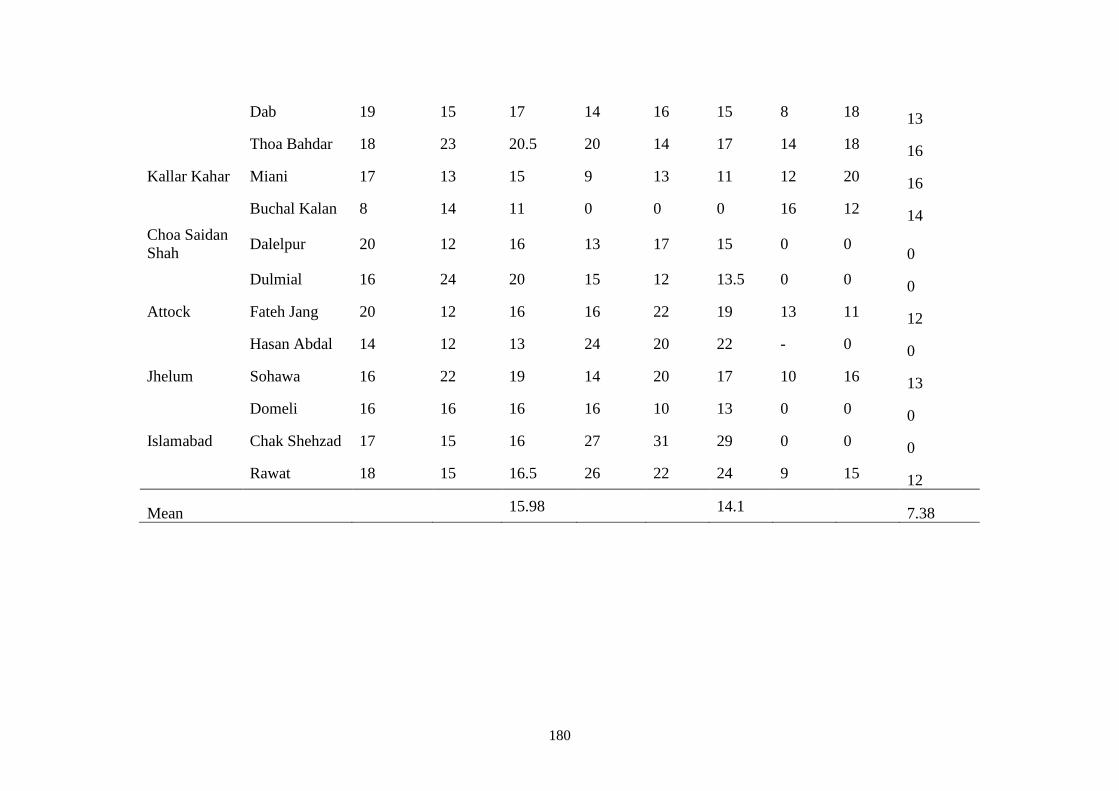
180
Dab 19 15 17 14 16 15 8 18 13
Thoa Bahdar 18 23 20.5 20 14 17 14 18 16
Kallar Kahar Miani 17 13 15 9 13 11 12 20 16
Buchal Kalan 8 14 11 0 0 0 16 12 14
Choa Saidan
Shah Dalelpur 20 12 16 13 17 15 0 0
0
Dulmial 16 24 20 15 12 13.5 0 0 0
Attock Fateh Jang 20 12 16 16 22 19 13 11 12
Hasan Abdal 14 12 13 24 20 22 - 0 0
Jhelum Sohawa 16 22 19 14 20 17 10 16 13
Domeli 16 16 16 16 10 13 0 0 0
Islamabad Chak Shehzad 17 15 16 27 31 29 0 0 0
Rawat 18 15 16.5 26 22 24 9 15 12
Mean 15.98 14.1 7.38
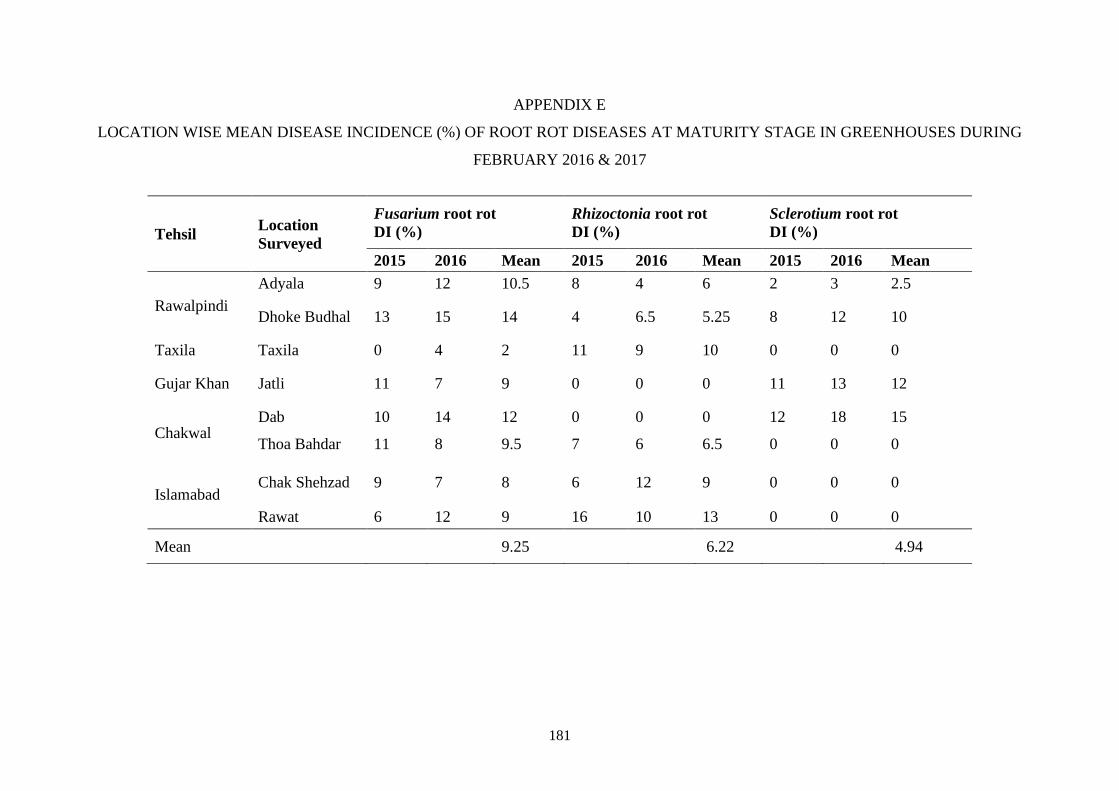
181
APPENDIX E
LOCATION WISE MEAN DISEASE INCIDENCE (%) OF ROOT ROT DISEASES AT MATURITY STAGE IN GREENHOUSES DURING
FEBRUARY 2016 & 2017
Tehsil Location
Surveyed
Fusarium root rot
DI (%)
Rhizoctonia root rot
DI (%)
Sclerotium root rot
DI (%)
2015 2016 Mean 2015 2016 Mean 2015 2016 Mean
Rawalpindi
Adyala 9 12 10.5 8 4 6 2 3 2.5
Dhoke Budhal 13 15 14 4 6.5 5.25 8 12 10
Taxila Taxila 0 4 2 11 9 10 0 0 0
Gujar Khan Jatli 11 7 9 0 0 0 11 13 12
Chakwal Dab 10 14 12 0 0 0 12 18 15
Thoa Bahdar 11 8 9.5 7 6 6.5 0 0 0
Islamabad Chak Shehzad 9 7 8 6 12 9 0 0 0
Rawat 6 12 9 16 10 13 0 0 0
Mean 9.25 6.22 4.94
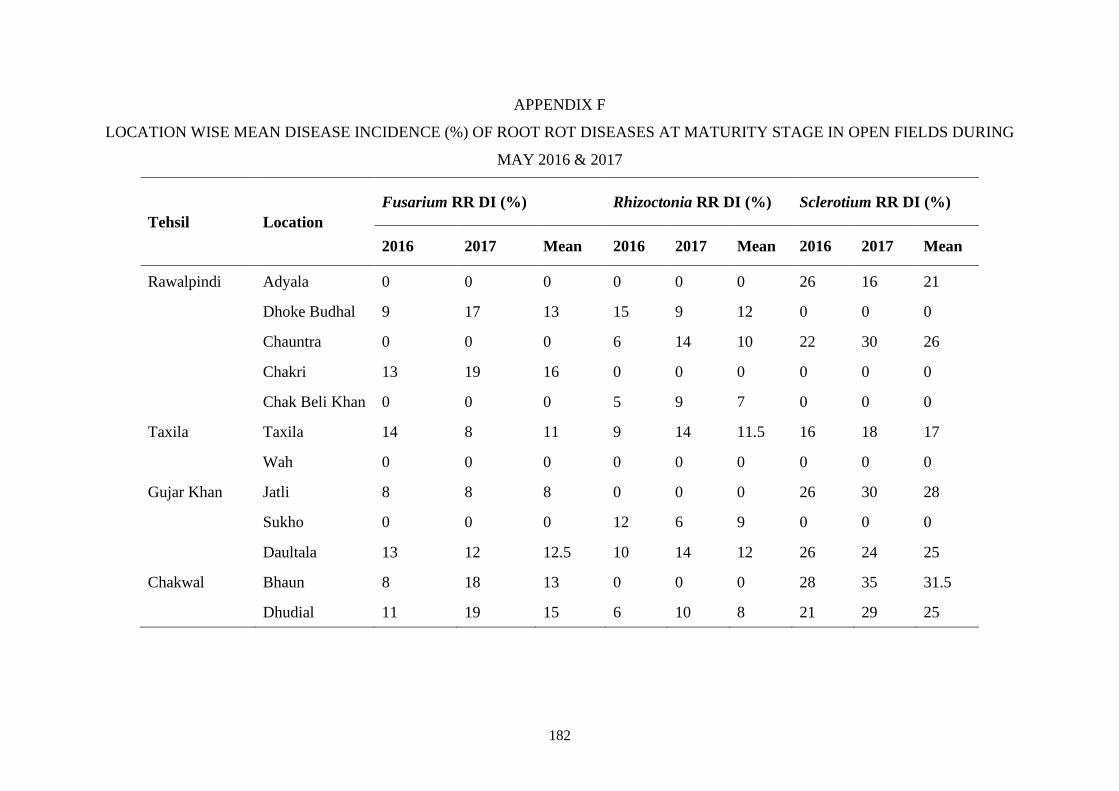
182
APPENDIX F
LOCATION WISE MEAN DISEASE INCIDENCE (%) OF ROOT ROT DISEASES AT MATURITY STAGE IN OPEN FIELDS DURING
MAY 2016 & 2017
Tehsil Location
Fusarium RR DI (%) Rhizoctonia RR DI (%) Sclerotium RR DI (%)
2016 2017 Mean 2016 2017 Mean 2016 2017 Mean
Rawalpindi Adyala 0 0 0 0 0 0 26 16 21
Dhoke Budhal 9 17 13 15 9 12 0 0 0
Chauntra 0 0 0 6 14 10 22 30 26
Chakri 13 19 16 0 0 0 0 0 0
Chak Beli Khan 0 0 0 5 9 7 0 0 0
Taxila Taxila 14 8 11 9 14 11.5 16 18 17
Wah 0 0 0 0 0 0 0 0 0
Gujar Khan Jatli 8 8 8 0 0 0 26 30 28
Sukho 0 0 0 12 6 9 0 0 0
Daultala 13 12 12.5 10 14 12 26 24 25
Chakwal Bhaun 8 18 13 0 0 0 28 35 31.5
Dhudial 11 19 15 6 10 8 21 29 25
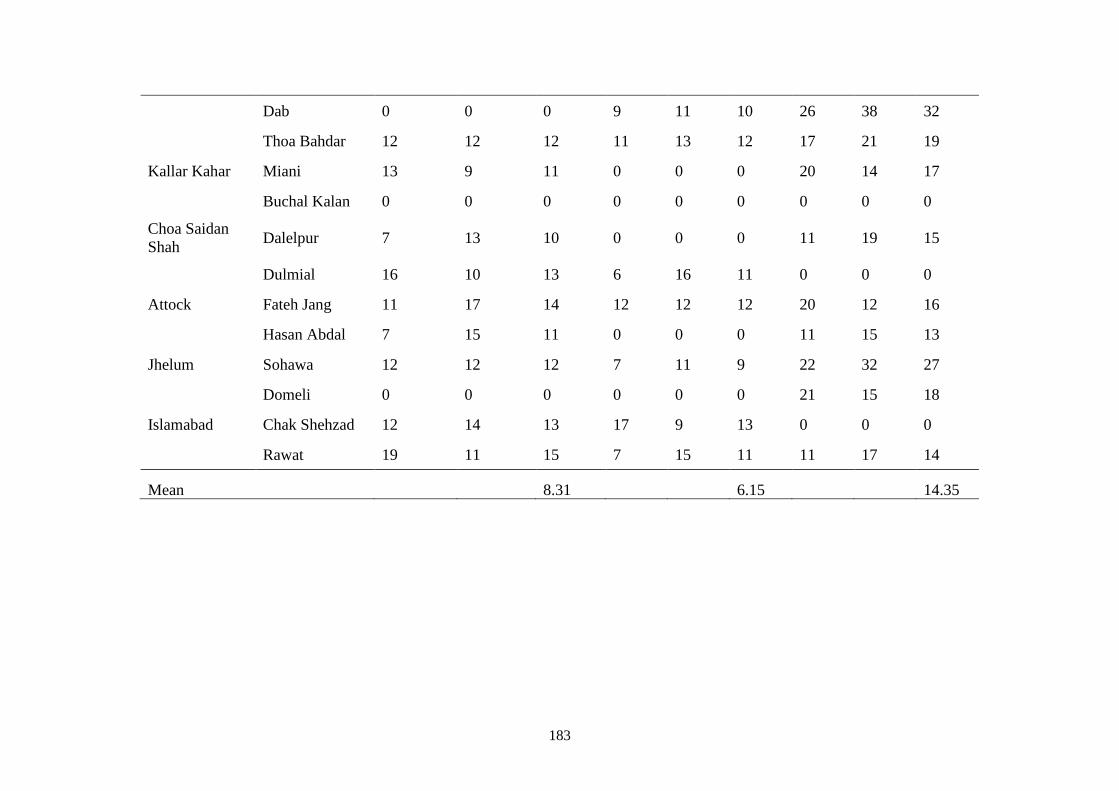
183
Dab 0 0 0 9 11 10 26 38 32
Thoa Bahdar 12 12 12 11 13 12 17 21 19
Kallar Kahar Miani 13 9 11 0 0 0 20 14 17
Buchal Kalan 0 0 0 0 0 0 0 0 0
Choa Saidan
Shah Dalelpur 7 13 10 0 0 0 11 19 15
Dulmial 16 10 13 6 16 11 0 0 0
Attock Fateh Jang 11 17 14 12 12 12 20 12 16
Hasan Abdal 7 15 11 0 0 0 11 15 13
Jhelum Sohawa 12 12 12 7 11 9 22 32 27
Domeli 0 0 0 0 0 0 21 15 18
Islamabad Chak Shehzad 12 14 13 17 9 13 0 0 0
Rawat 19 11 15 7 15 11 11 17 14
Mean 8.31 6.15 14.35
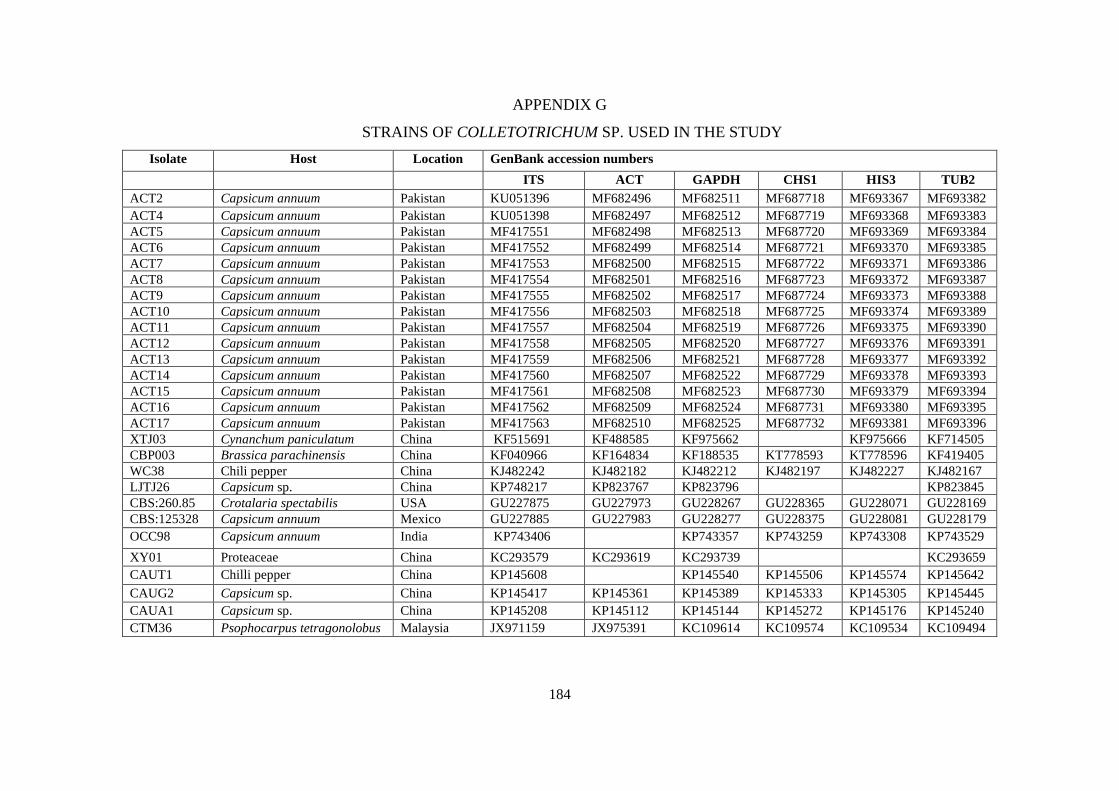
184
APPENDIX G
STRAINS OF COLLETOTRICHUM SP. USED IN THE STUDY
Isolate Host Location GenBank accession numbers
ITS ACT GAPDH CHS1 HIS3 TUB2
ACT2 Capsicum annuum Pakistan KU051396 MF682496 MF682511 MF687718 MF693367 MF693382
ACT4 Capsicum annuum Pakistan KU051398 MF682497 MF682512 MF687719 MF693368 MF693383
ACT5 Capsicum annuum Pakistan MF417551 MF682498 MF682513 MF687720 MF693369 MF693384
ACT6 Capsicum annuum Pakistan MF417552 MF682499 MF682514 MF687721 MF693370 MF693385
ACT7 Capsicum annuum Pakistan MF417553 MF682500 MF682515 MF687722 MF693371 MF693386
ACT8 Capsicum annuum Pakistan MF417554 MF682501 MF682516 MF687723 MF693372 MF693387
ACT9 Capsicum annuum Pakistan MF417555 MF682502 MF682517 MF687724 MF693373 MF693388
ACT10 Capsicum annuum Pakistan MF417556 MF682503 MF682518 MF687725 MF693374 MF693389
ACT11 Capsicum annuum Pakistan MF417557 MF682504 MF682519 MF687726 MF693375 MF693390
ACT12 Capsicum annuum Pakistan MF417558 MF682505 MF682520 MF687727 MF693376 MF693391
ACT13 Capsicum annuum Pakistan MF417559 MF682506 MF682521 MF687728 MF693377 MF693392
ACT14 Capsicum annuum Pakistan MF417560 MF682507 MF682522 MF687729 MF693378 MF693393
ACT15 Capsicum annuum Pakistan MF417561 MF682508 MF682523 MF687730 MF693379 MF693394
ACT16 Capsicum annuum Pakistan MF417562 MF682509 MF682524 MF687731 MF693380 MF693395
ACT17 Capsicum annuum Pakistan MF417563 MF682510 MF682525 MF687732 MF693381 MF693396
XTJ03 Cynanchum paniculatum China KF515691 KF488585 KF975662 KF975666 KF714505
CBP003 Brassica parachinensis China KF040966 KF164834 KF188535 KT778593 KT778596 KF419405
WC38 Chili pepper China KJ482242 KJ482182 KJ482212 KJ482197 KJ482227 KJ482167
LJTJ26 Capsicum sp. China KP748217 KP823767 KP823796 KP823845
CBS:260.85 Crotalaria spectabilis USA GU227875 GU227973 GU228267 GU228365 GU228071 GU228169
CBS:125328 Capsicum annuum Mexico GU227885 GU227983 GU228277 GU228375 GU228081 GU228179
OCC98 Capsicum annuum India KP743406 KP743357 KP743259 KP743308 KP743529
XY01 Proteaceae China KC293579 KC293619 KC293739 KC293659
CAUT1 Chilli pepper China KP145608 KP145540 KP145506 KP145574 KP145642
CAUG2 Capsicum sp. China KP145417 KP145361 KP145389 KP145333 KP145305 KP145445
CAUA1 Capsicum sp. China KP145208 KP145112 KP145144 KP145272 KP145176 KP145240
CTM36 Psophocarpus tetragonolobus Malaysia JX971159 JX975391 KC109614 KC109574 KC109534 KC109494
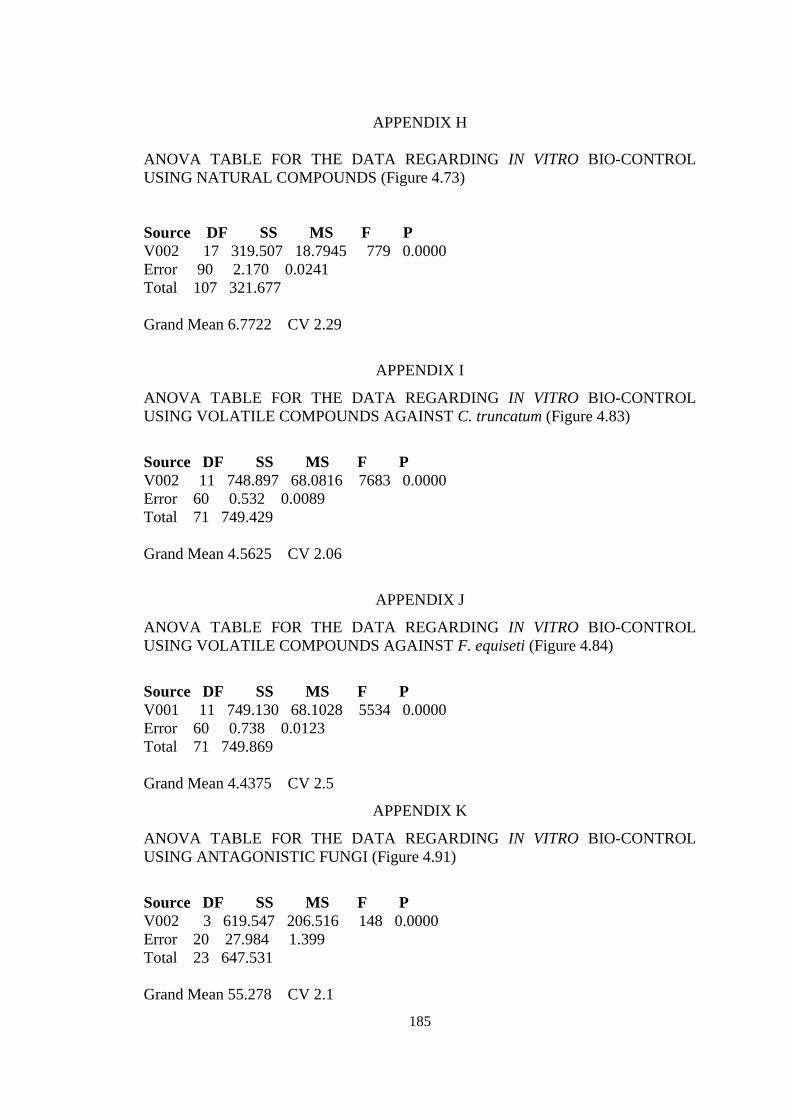
185
APPENDIX H
ANOVA TABLE FOR THE DATA REGARDING IN VITRO BIO-CONTROL
USING NATURAL COMPOUNDS (Figure 4.73)
Source DF SS MS F P
V002 17 319.507 18.7945 779 0.0000
Error 90 2.170 0.0241
Total 107 321.677
Grand Mean 6.7722 CV 2.29
APPENDIX I
ANOVA TABLE FOR THE DATA REGARDING IN VITRO BIO-CONTROL
USING VOLATILE COMPOUNDS AGAINST C. truncatum (Figure 4.83)
Source DF SS MS F P
V002 11 748.897 68.0816 7683 0.0000
Error 60 0.532 0.0089
Total 71 749.429
Grand Mean 4.5625 CV 2.06
APPENDIX J
ANOVA TABLE FOR THE DATA REGARDING IN VITRO BIO-CONTROL
USING VOLATILE COMPOUNDS AGAINST F. equiseti (Figure 4.84)
Source DF SS MS F P
V001 11 749.130 68.1028 5534 0.0000
Error 60 0.738 0.0123
Total 71 749.869
Grand Mean 4.4375 CV 2.5
APPENDIX K
ANOVA TABLE FOR THE DATA REGARDING IN VITRO BIO-CONTROL
USING ANTAGONISTIC FUNGI (Figure 4.91)
Source DF SS MS F P
V002 3 619.547 206.516 148 0.0000
Error 20 27.984 1.399
Total 23 647.531
Grand Mean 55.278 CV 2.1
Related Documents


