SPONSORED BY IN PARTNERSHIP WITH ALIVE ONLINE: OTT Service Providers and Live Streaming Services

Welcome message from author
This document is posted to help you gain knowledge. Please leave a comment to let me know what you think about it! Share it to your friends and learn new things together.
Transcript
SPONSORED BY IN PARTNERSHIP WITH
A L I V E O N L I N E :
OTT Service Providers
and Live Streaming Services
With Drop Shadow
Without Drop Shadow
For Black Background
For Black & White in color
For Black & White in color
For Black & White in white

The State of Live Streaming Services
2
TABLE OF CONTENTS
Executive Summary 3
About the Data 3
What We Looked At and Why 4
The Data 4
Live Enters the Mainstream 4
Creating Service Value 6
Video Streaming Quality 8
Measuring Quality 10
Rebuffering Leads the Quality Equation 10
Bitrate is Perceived as Important 10
Startup Time and Latency 11
Does View of Quality Change after Service Launch? 11
Keeping Track of Quality 12
Picking a CDN 12
Conclusion 13
TABLE OF FIGURES
Brazil Online Event Highlights 2016 4
Type of Live Stream Video Provided 5
How Many Live Streaming Events Provided Per Month? 5
Most Important Screen to Service? 6
Connected Video Device Population Reach 6
How Does Your Service Make Money? 7
Video Formats Streaming Service Delivers 8
How Do the Following Impact Your Video Streaming? 8
Describe “Bad” Video Quality 9
How Important are the Following Quality Parameters? 10
Which of the Following Would You Improve? 11
Engagement in Sports Online Is Most Affected by Poor Quality 11
How Video Performance is Monitored 12
How Important are the Following for Selecting a CDN? 13
The State of Live Streaming Services
3
EXECUTIVE SUMMARYSporting events have driven the evolution of live streaming. Because of their appeal and large fan base, massively scalable and high-quality live streaming events are delivered regularly online.
However, the focus of live delivery is moving away from sports. In our survey of live streaming online video service providers (OVSPs), 56% say their services are focused around live events like awards shows and conferences, while 15% deliver live sports.
Two-thirds of the OVSPs provide more than one simultaneous stream, and a quarter provide six or more. In addition, 56% of respondents say their service delivers six or more events a month, while 14% deliver daily events and 18% run 24x7 or linear channel simulcast services.
The OVSPs primarily target the PC and smartphone with their live streaming services. They should reconsider this platform priority as other screens drive significant video usage.
Thirty-nine percent of OVSPs say their services do not make money and provide only non-monetary value. Thirty-eight percent derive revenue from advertising and sponsorship. Despite the popularity of subscription VOD,only 23% say they use sub-scriptions to monetize their service. 17% leverage pay-per-view to monetize their live streaming service.
Over two-thirds provide multi-camera angles to enhance their service offerings. Interactive features, used by 29% of respondents, constitute the next most popular enhancement. Shockingly, only 9% use targeted dynamic ad insertion.
The standard for live streaming is high definition. Very few OVSPs use higher quality formats like UHD or high frame rates.
Video stream quality and stream reliability are at the top of the list of challenges that impact live
streaming services. Minimizing streaming costs and reducing stream latency are also important.
Video buffering continues to define what people think of as “bad” video. Eighty-six percent of OVSPs cite buffering as being emblematic of quality problems, followed by 60% citing audio sync problems. Surprisingly, just 20% cite video latency as defining bad video quality.
Rebuffering rate is the parameter with which OVSPs are most concerned. Bitrate is the second most important concern.
If OVSPs could improve just one of the quality parameters, 26% would choose rebuffering rate, and 24% would enhance live latency.
Maintaining a quality service requires two fundamental things: know what you’re going to measure to check quality and know how you’re going to measure it. Most OVSPs who participated in this study are not ready to do this. Just 44% have established key performance indicators to track. Only 35% say they’ve planned to have their operations team partner with the CDN to measure service performance.
When choosing a CDN, the most important criteria to consider is its ability to deliver a quality video experience. Price per gigabyte is also important to live streaming OVSPs, as is the ability to scale to peak traffic.
ABOUT THE DATA To better understand how corporations with media assets are delivering to end consumers, nScreenMedia partnered with Broadcasting & Cable and VideoEdge, two NewBay Media brands, to field a survey to 123 company managers with responsibility for the technological implementation of their video streaming service. The respondents were drawn from the following groups:• Broadcast television stations, station groups, or
networks (NBCU, KPBS, Sinclair)
The State of Live Streaming Services
4
• Pay television operation/MSO/MVPD (Dish Network, Charter Spectrum, SureWest)
• Programmers: syndicators, studios, other license holders (Syfy, Endemol, MGM)
• TV services: producer, distributor, talent, television rep firm, or other provider (Adrenaline Films, BBC Worldwide, Katz Television Group)
• New media: digital, Internet, or interactive company (Netflix, Sling TV, AwesomenessTV)
• Other companies with video assets to be delivered to consumers (e.g., American Express, Procter & Gamble).
Survey respondents were based in the United States and drawn from the following disciplines:• Corporate management• Engineering/IT management• Programming management
For simplicity, this report will refer to all survey respondents as OTT video service providers (OVSPs). It will also refer to broadcast TV stations and groups, pay TV providers, and programming and services companies simply as TV companies.
WHAT WE LOOKED AT AND WHYThe objective of the survey was to understand more fully how companies planning to launch (or already providing) a live streaming consumer video service would execute their plans and what expectations they had for the service. The survey covered the following topics:
• The type and quantity of live video to be delivered• How the live video would be monetized, or how
it would contribute to the company’s goals in other ways
• The video resolution of the live streams• The challenges faced in delivering live content• Attitudes towards, and expectations for, a
quality experience• How the technical implementation and
management of the service would be handled
This report is made possible by a generous contribution from Akamai. Though the subject matter of the report is a collaboration between Akamai, NewBay Media, and nScreenMedia, neither Akamai nor NewBay Media influenced the data, analysis, or conclusions presented here.
THE DATA
LIVE ENTERS THE MAINSTREAMSports has been pivotal in advancing the art of live streaming online. Major events like the Olympics and the Super Bowl have pushed the technology forward, forcing technologists to overcome the considerable challenges in streaming live video.
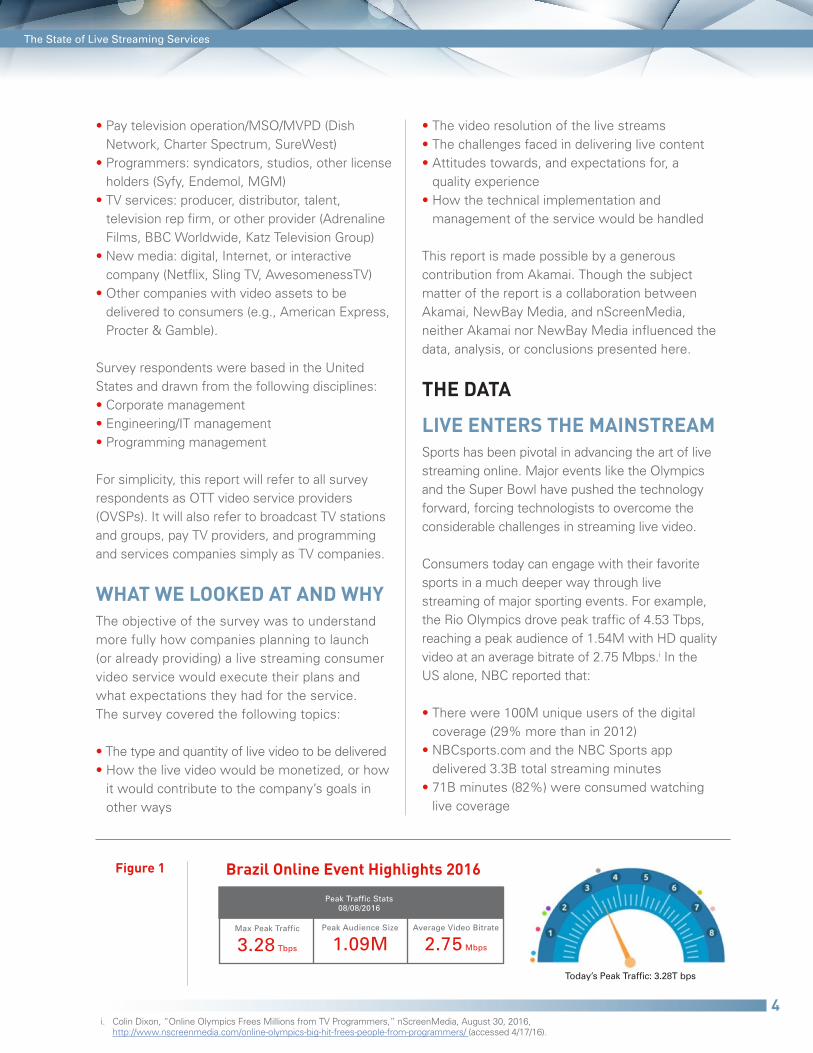
Consumers today can engage with their favorite sports in a much deeper way through live streaming of major sporting events. For example, the Rio Olympics drove peak traffic of 4.53 Tbps, reaching a peak audience of 1.54M with HD quality video at an average bitrate of 2.75 Mbps.i In the US alone, NBC reported that:
• There were 100M unique users of the digital coverage (29% more than in 2012)
• NBCsports.com and the NBC Sports app delivered 3.3B total streaming minutes
• 71B minutes (82%) were consumed watching live coverage
Figure 1
Today’s Peak Traffic: 3.28T bps
Peak Traffic Stats08/08/2016
Max Peak Traffic
3.28 Tbps
Peak Audience Size
1.09MAverage Video Bitrate
2.75 Mbps
Brazil Online Event Highlights 2016
i. Colin Dixon, “Online Olympics Frees Millions from TV Programmers,” nScreenMedia, August 30, 2016, http://www.nscreenmedia.com/online-olympics-big-hit-frees-people-from-programmers/ (accessed 4/17/16).
The State of Live Streaming Services
5
• A third of those who streamed coverage did so from a connected television
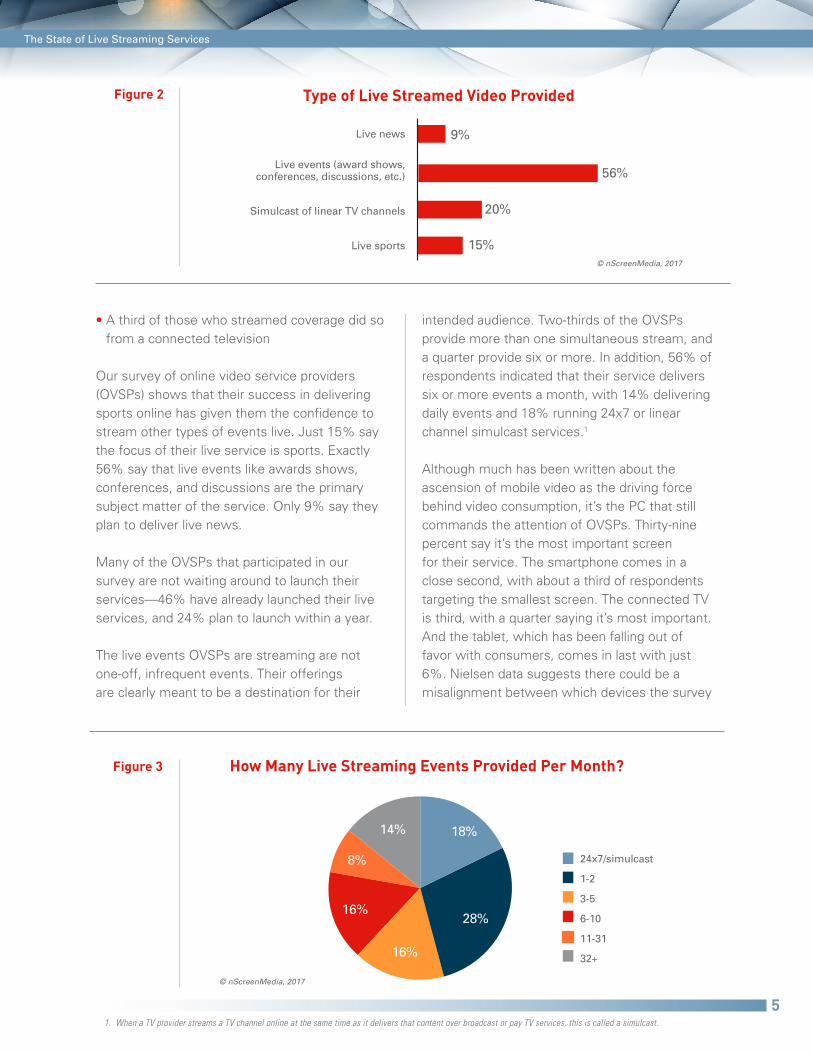
Our survey of online video service providers (OVSPs) shows that their success in delivering sports online has given them the confidence to stream other types of events live. Just 15% say the focus of their live service is sports. Exactly 56% say that live events like awards shows, conferences, and discussions are the primary subject matter of the service. Only 9% say they plan to deliver live news.
Many of the OVSPs that participated in our survey are not waiting around to launch their services—46% have already launched their live services, and 24% plan to launch within a year.
The live events OVSPs are streaming are not one-off, infrequent events. Their offerings are clearly meant to be a destination for their
intended audience. Two-thirds of the OVSPs provide more than one simultaneous stream, and a quarter provide six or more. In addition, 56% of respondents indicated that their service delivers six or more events a month, with 14% delivering daily events and 18% running 24x7 or linear channel simulcast services.1
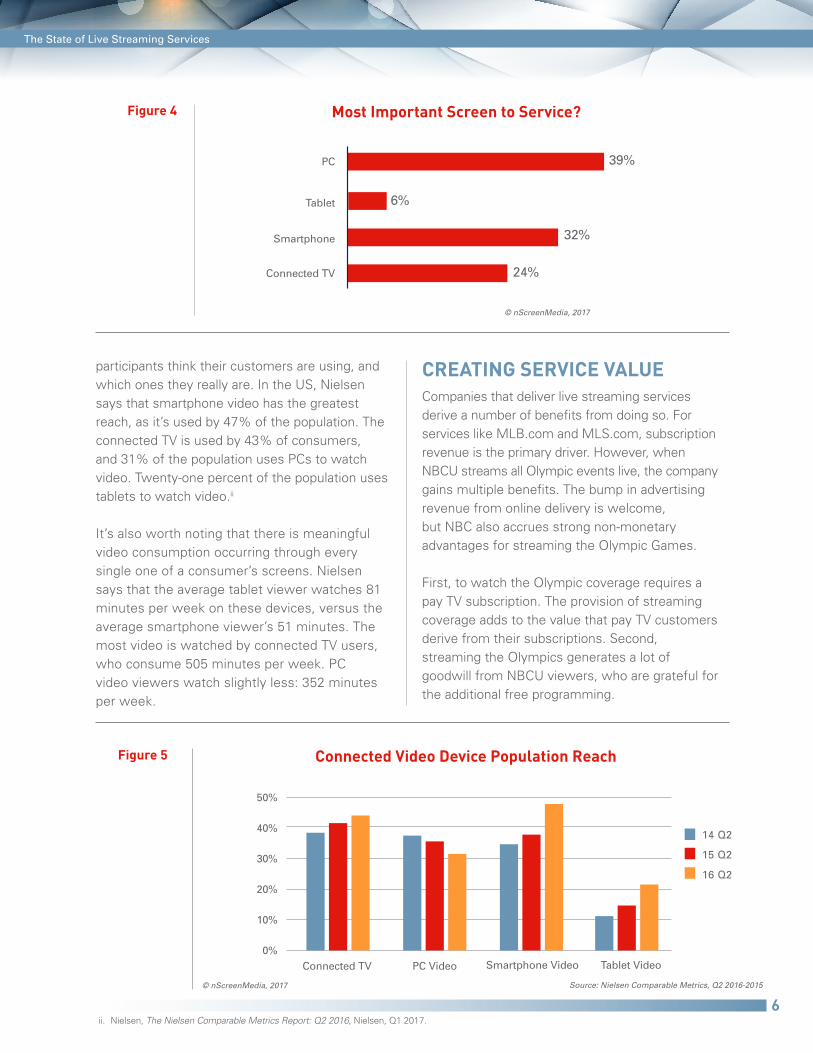
Although much has been written about the ascension of mobile video as the driving force behind video consumption, it’s the PC that still commands the attention of OVSPs. Thirty-nine percent say it’s the most important screen for their service. The smartphone comes in a close second, with about a third of respondents targeting the smallest screen. The connected TV is third, with a quarter saying it’s most important. And the tablet, which has been falling out of favor with consumers, comes in last with just 6%. Nielsen data suggests there could be a misalignment between which devices the survey
Figure 2 Type of Live Streamed Video Provided
Live news
Live events (award shows, conferences, discussions, etc.)
Simulcast of linear TV channels
Live sports
Figure 3 How Many Live Streaming Events Provided Per Month?
9%
56%
20%
15%
1. When a TV provider streams a TV channel online at the same time as it delivers that content over broadcast or pay TV services, this is called a simulcast.
24x7/simulcast
1-2
3-5
6-10
11-31
32+
18%
28%
16%
16%
8%
14%
© nScreenMedia, 2017
© nScreenMedia, 2017
The State of Live Streaming Services
6
participants think their customers are using, and which ones they really are. In the US, Nielsen says that smartphone video has the greatest reach, as it’s used by 47% of the population. The connected TV is used by 43% of consumers, and 31% of the population uses PCs to watch video. Twenty-one percent of the population uses tablets to watch video.ii
It’s also worth noting that there is meaningful video consumption occurring through every single one of a consumer’s screens. Nielsen says that the average tablet viewer watches 81 minutes per week on these devices, versus the average smartphone viewer’s 51 minutes. The most video is watched by connected TV users, who consume 505 minutes per week. PC video viewers watch slightly less: 352 minutes per week.
CREATING SERVICE VALUECompanies that deliver live streaming services derive a number of benefits from doing so. For services like MLB.com and MLS.com, subscription revenue is the primary driver. However, when NBCU streams all Olympic events live, the company gains multiple benefits. The bump in advertising revenue from online delivery is welcome, but NBC also accrues strong non-monetary advantages for streaming the Olympic Games.
First, to watch the Olympic coverage requires a pay TV subscription. The provision of streaming coverage adds to the value that pay TV customers derive from their subscriptions. Second, streaming the Olympics generates a lot of goodwill from NBCU viewers, who are grateful for the additional free programming.
Figure 4
Figure 5
Most Important Screen to Service?
Connected Video Device Population Reach
© nScreenMedia, 2017
PC
Tablet
Smartphone
Connected TV
39%
6%
32%
24%
50%
40%
30%
20%
10%
0%
© nScreenMedia, 2017 Source: Nielsen Comparable Metrics, Q2 2016-2015
14 Q2
15 Q2
16 Q2
Connected TV PC Video Smartphone Video Tablet Video
ii. Nielsen, The Nielsen Comparable Metrics Report: Q2 2016, Nielsen, Q1 2017.
The State of Live Streaming Services
7
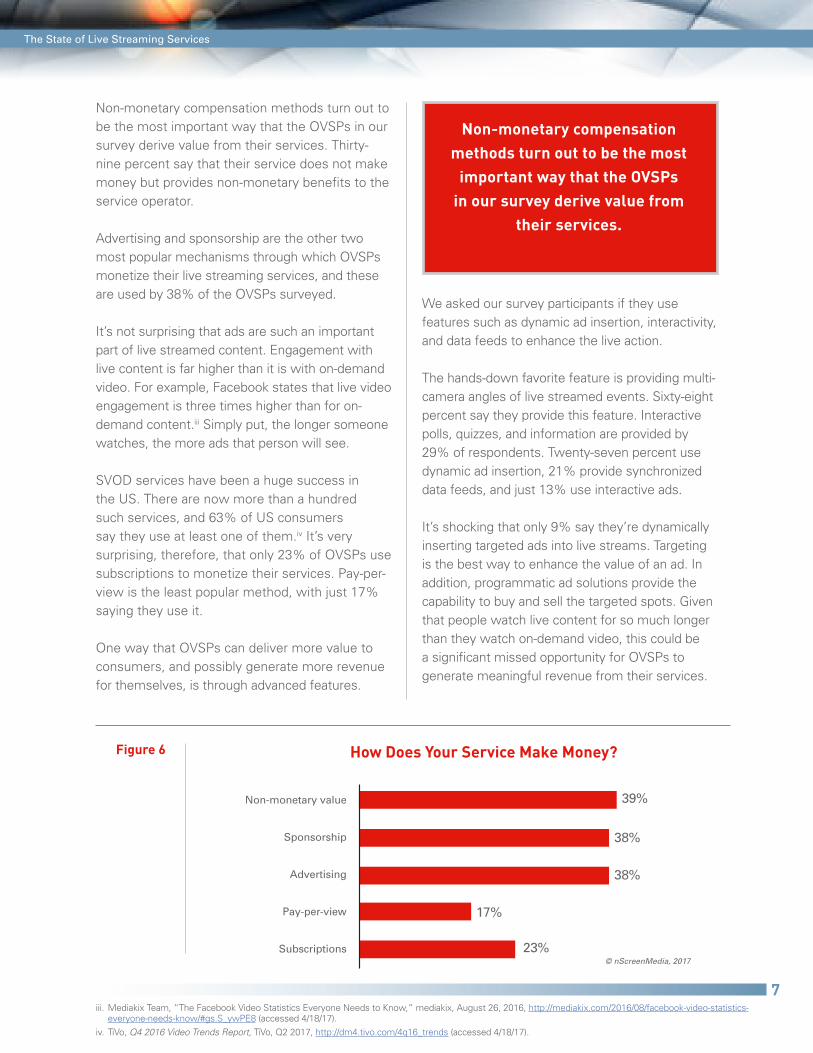
Non-monetary compensation methods turn out to be the most important way that the OVSPs in our survey derive value from their services. Thirty-nine percent say that their service does not make money but provides non-monetary benefits to the service operator.
Advertising and sponsorship are the other two most popular mechanisms through which OVSPs monetize their live streaming services, and these are used by 38% of the OVSPs surveyed.
It’s not surprising that ads are such an important part of live streamed content. Engagement with live content is far higher than it is with on-demand video. For example, Facebook states that live video engagement is three times higher than for on-demand content.iii Simply put, the longer someone watches, the more ads that person will see.
SVOD services have been a huge success in the US. There are now more than a hundred such services, and 63% of US consumers say they use at least one of them.iv It’s very surprising, therefore, that only 23% of OVSPs use subscriptions to monetize their services. Pay-per-view is the least popular method, with just 17% saying they use it.
One way that OVSPs can deliver more value to consumers, and possibly generate more revenue for themselves, is through advanced features.
We asked our survey participants if they use features such as dynamic ad insertion, interactivity, and data feeds to enhance the live action.
The hands-down favorite feature is providing multi-camera angles of live streamed events. Sixty-eight percent say they provide this feature. Interactive polls, quizzes, and information are provided by 29% of respondents. Twenty-seven percent use dynamic ad insertion, 21% provide synchronized data feeds, and just 13% use interactive ads.
It’s shocking that only 9% say they’re dynamically inserting targeted ads into live streams. Targeting is the best way to enhance the value of an ad. In addition, programmatic ad solutions provide the capability to buy and sell the targeted spots. Given that people watch live content for so much longer than they watch on-demand video, this could be a significant missed opportunity for OVSPs to generate meaningful revenue from their services.
Non-monetary compensation methods turn out to be the most
important way that the OVSPs in our survey derive value from
their services.
Figure 6 How Does Your Service Make Money?
iii. Mediakix Team, “The Facebook Video Statistics Everyone Needs to Know,” mediakix, August 26, 2016, http://mediakix.com/2016/08/facebook-video-statistics-everyone-needs-know/#gs.S_ywPE8 (accessed 4/18/17).
iv. TiVo, Q4 2016 Video Trends Report, TiVo, Q2 2017, http://dm4.tivo.com/4q16_trends (accessed 4/18/17).
© nScreenMedia, 2017
Non-monetary value
Sponsorship
Advertising
Pay-per-view
Subscriptions
39%
38%
38%
23%
17%
The State of Live Streaming Services
8
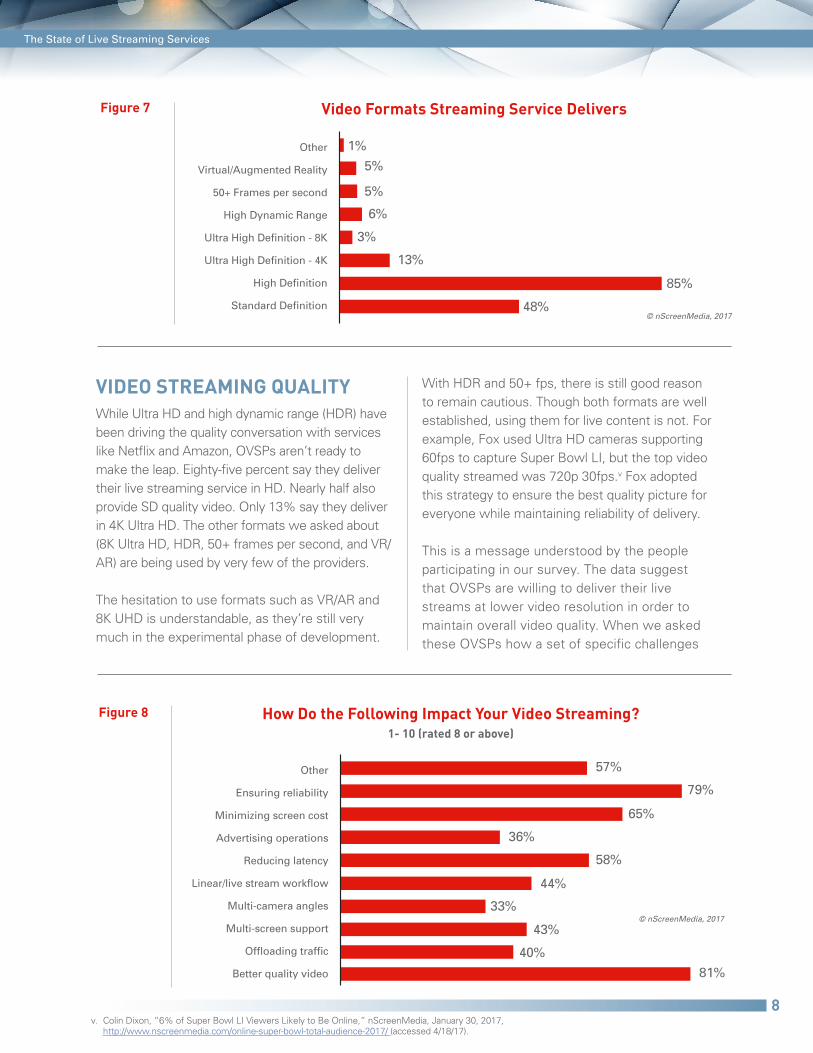
VIDEO STREAMING QUALITYWhile Ultra HD and high dynamic range (HDR) have been driving the quality conversation with services like Netflix and Amazon, OVSPs aren’t ready to make the leap. Eighty-five percent say they deliver their live streaming service in HD. Nearly half also provide SD quality video. Only 13% say they deliver in 4K Ultra HD. The other formats we asked about (8K Ultra HD, HDR, 50+ frames per second, and VR/AR) are being used by very few of the providers.
The hesitation to use formats such as VR/AR and 8K UHD is understandable, as they’re still very much in the experimental phase of development.
With HDR and 50+ fps, there is still good reason to remain cautious. Though both formats are well established, using them for live content is not. For example, Fox used Ultra HD cameras supporting 60fps to capture Super Bowl LI, but the top video quality streamed was 720p 30fps.v Fox adopted this strategy to ensure the best quality picture for everyone while maintaining reliability of delivery.
This is a message understood by the people participating in our survey. The data suggest that OVSPs are willing to deliver their live streams at lower video resolution in order to maintain overall video quality. When we asked these OVSPs how a set of specific challenges
Figure 7 Video Formats Streaming Service Delivers
© nScreenMedia, 2017
Other
Virtual/Augmented Reality
50+ Frames per second
High Dynamic Range
Ultra High Definition - 8K
Ultra High Definition - 4K
High Definition
Standard Definition
5%
5%
6%
3%
1%
85%
48%
13%
Figure 8 How Do the Following Impact Your Video Streaming? 1- 10 (rated 8 or above)
© nScreenMedia, 2017
Other
Ensuring reliability
Minimizing screen cost
Advertising operations
Reducing latency
Linear/live stream workflow
Multi-camera angles
Multi-screen support
Offloading traffic
Better quality video
65%
36%
33%
57%
58%
81%
79%
43%
40%
44%
v. Colin Dixon, “6% of Super Bowl LI Viewers Likely to Be Online,” nScreenMedia, January 30, 2017, http://www.nscreenmedia.com/online-super-bowl-total-audience-2017/ (accessed 4/18/17).
The State of Live Streaming Services
9
impacted their video streaming business, the top two issues were delivering better quality video and ensuring reliability.
Eighty-one percent of OVSPs rate delivering better quality video at “8” or above (on a scale of 1 to 10, with 10 having the greatest impact). Seventy-nine percent rate ensuring reliability at “8” or above. Minimizing streaming costs (65%) is a concern for all video streaming services, not just live ones. And survey participants rated reducing latency, a perennial challenge for all live streaming services, as having the fourth greatest impact.
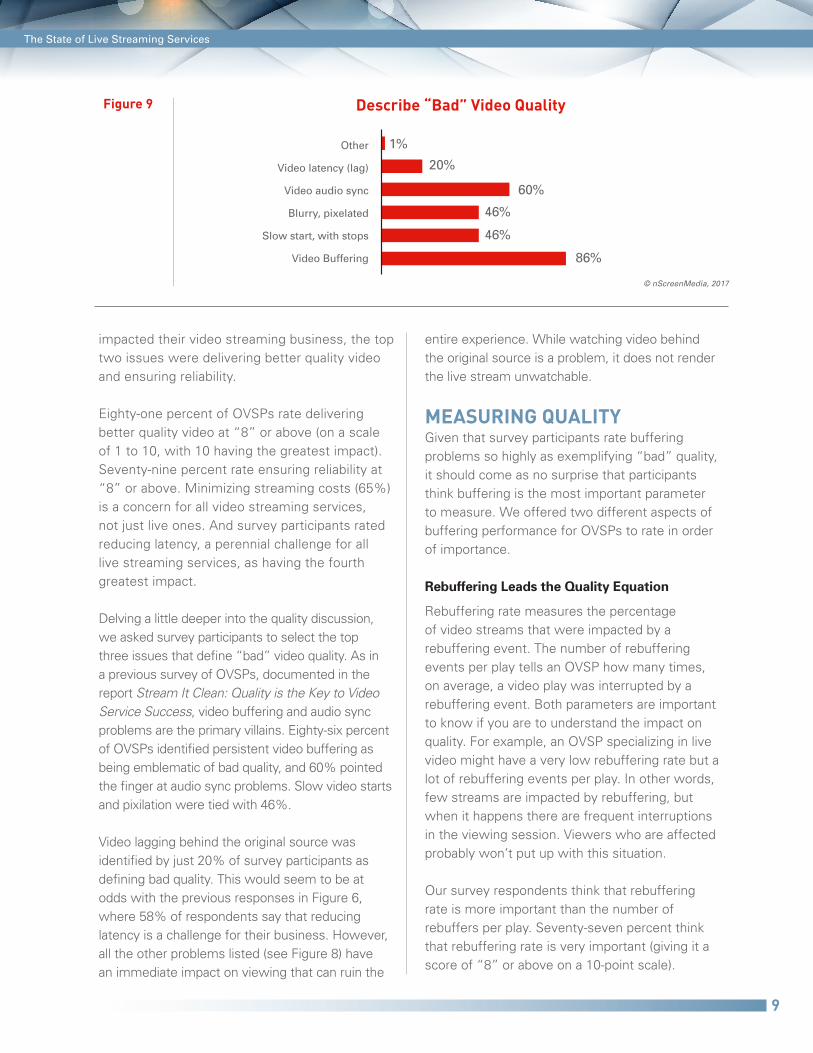
Delving a little deeper into the quality discussion, we asked survey participants to select the top three issues that define “bad” video quality. As in a previous survey of OVSPs, documented in the report Stream It Clean: Quality is the Key to Video Service Success, video buffering and audio sync problems are the primary villains. Eighty-six percent of OVSPs identified persistent video buffering as being emblematic of bad quality, and 60% pointed the finger at audio sync problems. Slow video starts and pixilation were tied with 46%.
Video lagging behind the original source was identified by just 20% of survey participants as defining bad quality. This would seem to be at odds with the previous responses in Figure 6, where 58% of respondents say that reducing latency is a challenge for their business. However, all the other problems listed (see Figure 8) have an immediate impact on viewing that can ruin the
entire experience. While watching video behind the original source is a problem, it does not render the live stream unwatchable.
MEASURING QUALITYGiven that survey participants rate buffering problems so highly as exemplifying “bad” quality, it should come as no surprise that participants think buffering is the most important parameter to measure. We offered two different aspects of buffering performance for OVSPs to rate in order of importance.
Rebuffering Leads the Quality Equation
Rebuffering rate measures the percentage of video streams that were impacted by a rebuffering event. The number of rebuffering events per play tells an OVSP how many times, on average, a video play was interrupted by a rebuffering event. Both parameters are important to know if you are to understand the impact on quality. For example, an OVSP specializing in live video might have a very low rebuffering rate but a lot of rebuffering events per play. In other words, few streams are impacted by rebuffering, but when it happens there are frequent interruptions in the viewing session. Viewers who are affected probably won’t put up with this situation.
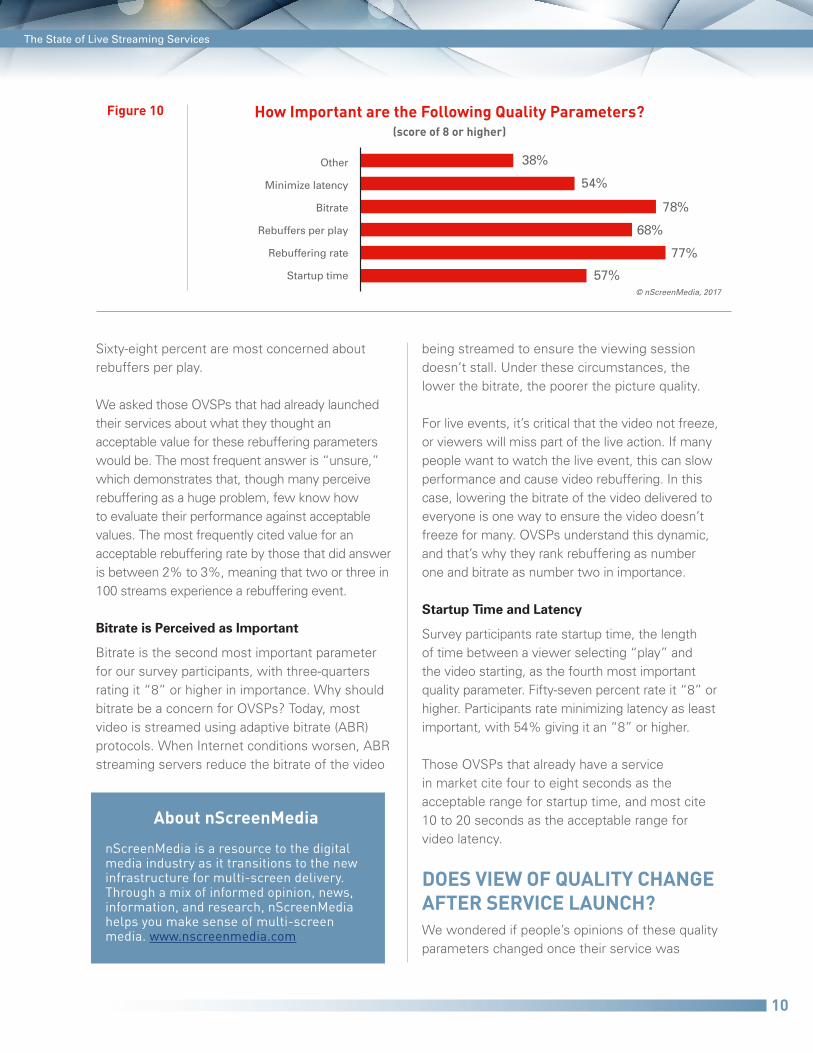
Our survey respondents think that rebuffering rate is more important than the number of rebuffers per play. Seventy-seven percent think that rebuffering rate is very important (giving it a score of “8” or above on a 10-point scale).
Figure 9 Describe “Bad” Video Quality
© nScreenMedia, 2017
Other
Video latency (lag)
Video audio sync
Blurry, pixelated
Slow start, with stops
Video Buffering
20%
60%
46%
46%
1%
86%
The State of Live Streaming Services
10
Sixty-eight percent are most concerned about rebuffers per play.
We asked those OVSPs that had already launched their services about what they thought an acceptable value for these rebuffering parameters would be. The most frequent answer is “unsure,” which demonstrates that, though many perceive rebuffering as a huge problem, few know how to evaluate their performance against acceptable values. The most frequently cited value for an acceptable rebuffering rate by those that did answer is between 2% to 3%, meaning that two or three in 100 streams experience a rebuffering event.
Bitrate is Perceived as Important
Bitrate is the second most important parameter for our survey participants, with three-quarters rating it “8” or higher in importance. Why should bitrate be a concern for OVSPs? Today, most video is streamed using adaptive bitrate (ABR) protocols. When Internet conditions worsen, ABR streaming servers reduce the bitrate of the video
being streamed to ensure the viewing session doesn’t stall. Under these circumstances, the lower the bitrate, the poorer the picture quality.
For live events, it’s critical that the video not freeze, or viewers will miss part of the live action. If many people want to watch the live event, this can slow performance and cause video rebuffering. In this case, lowering the bitrate of the video delivered to everyone is one way to ensure the video doesn’t freeze for many. OVSPs understand this dynamic, and that’s why they rank rebuffering as number one and bitrate as number two in importance.
Startup Time and Latency
Survey participants rate startup time, the length of time between a viewer selecting “play” and the video starting, as the fourth most important quality parameter. Fifty-seven percent rate it “8” or higher. Participants rate minimizing latency as least important, with 54% giving it an “8” or higher.
Those OVSPs that already have a service in market cite four to eight seconds as the acceptable range for startup time, and most cite 10 to 20 seconds as the acceptable range for video latency.
DOES VIEW OF QUALITY CHANGE AFTER SERVICE LAUNCH?We wondered if people’s opinions of these quality parameters changed once their service was
Figure 10 How Important are the Following Quality Parameters? (score of 8 or higher)
© nScreenMedia, 2017
Other
Minimize latency
Bitrate
Rebuffers per play
Rebuffering rate
Startup time
54%
78%
68%
77%
38%
57%
About nScreenMedia
nScreenMedia is a resource to the digital media industry as it transitions to the new infrastructure for multi-screen delivery. Through a mix of informed opinion, news, information, and research, nScreenMedia helps you make sense of multi-screen media. www.nscreenmedia.com
The State of Live Streaming Services
11
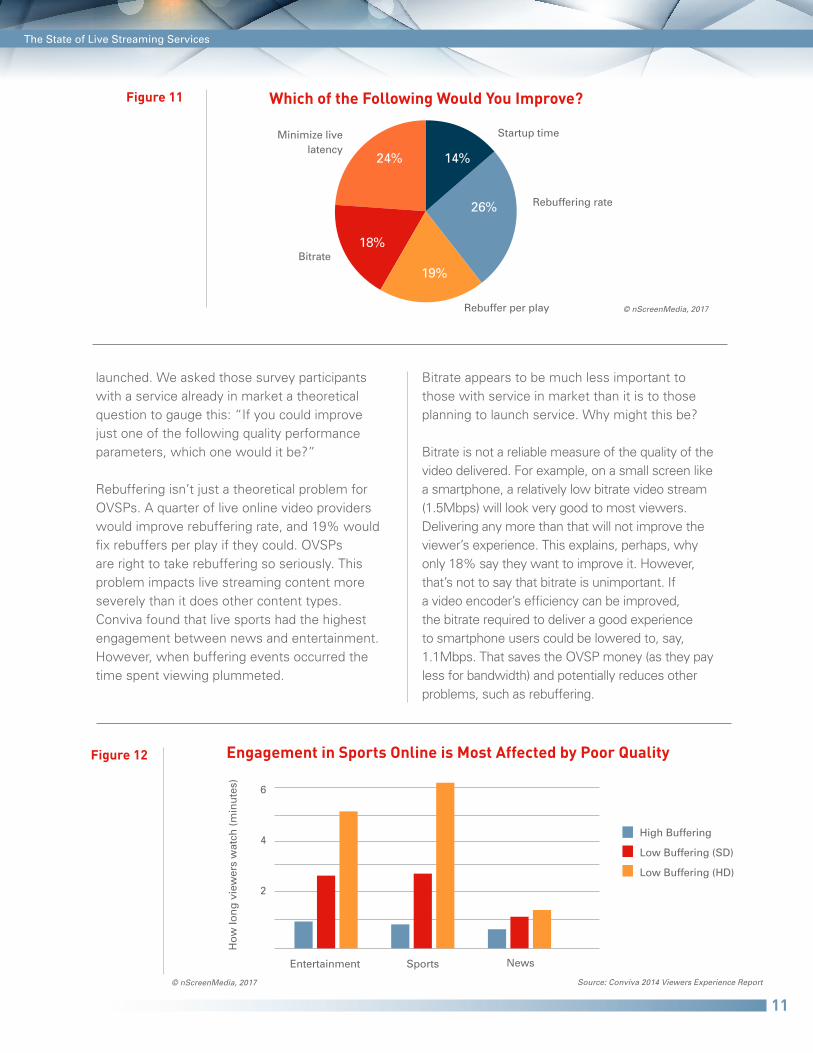
launched. We asked those survey participants with a service already in market a theoretical question to gauge this: “If you could improve just one of the following quality performance parameters, which one would it be?”
Rebuffering isn’t just a theoretical problem for OVSPs. A quarter of live online video providers would improve rebuffering rate, and 19% would fix rebuffers per play if they could. OVSPs are right to take rebuffering so seriously. This problem impacts live streaming content more severely than it does other content types. Conviva found that live sports had the highest engagement between news and entertainment. However, when buffering events occurred the time spent viewing plummeted.
Bitrate appears to be much less important to those with service in market than it is to those planning to launch service. Why might this be?
Bitrate is not a reliable measure of the quality of the video delivered. For example, on a small screen like a smartphone, a relatively low bitrate video stream (1.5Mbps) will look very good to most viewers. Delivering any more than that will not improve the viewer’s experience. This explains, perhaps, why only 18% say they want to improve it. However, that’s not to say that bitrate is unimportant. If a video encoder’s efficiency can be improved, the bitrate required to deliver a good experience to smartphone users could be lowered to, say, 1.1Mbps. That saves the OVSP money (as they pay less for bandwidth) and potentially reduces other problems, such as rebuffering.
Figure 11
Figure 12
Which of the Following Would You Improve?
Engagement in Sports Online is Most Affected by Poor Quality
Rebuffering rate
Startup timeMinimize livelatency
Bitrate
Rebuffer per play
26%
14%
19%
18%
24%
© nScreenMedia, 2017
6
4
2
Source: Conviva 2014 Viewers Experience Report
High Buffering
Low Buffering (SD)
Low Buffering (HD)
Entertainment
How
long
vie
wer
s w
atch
(min
utes
)
Sports News
© nScreenMedia, 2017
The State of Live Streaming Services
12
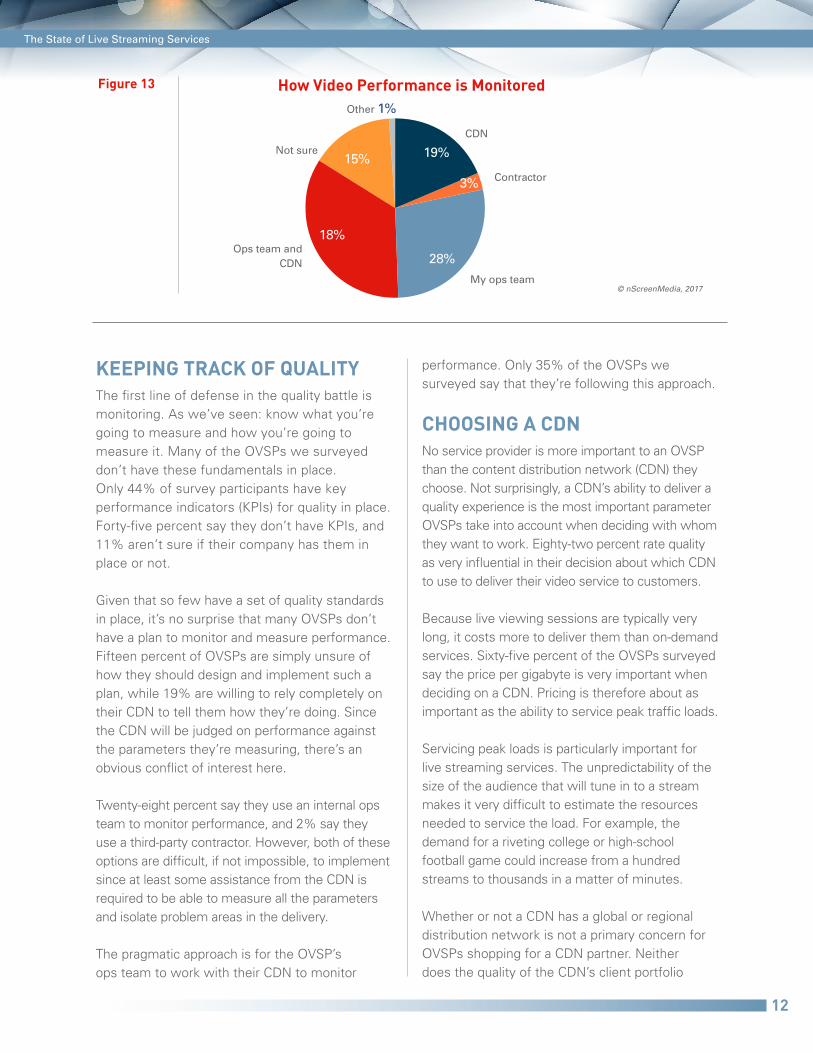
KEEPING TRACK OF QUALITYThe first line of defense in the quality battle is monitoring. As we’ve seen: know what you’re going to measure and how you’re going to measure it. Many of the OVSPs we surveyed don’t have these fundamentals in place. Only 44% of survey participants have key performance indicators (KPIs) for quality in place. Forty-five percent say they don’t have KPIs, and 11% aren’t sure if their company has them in place or not.
Given that so few have a set of quality standards in place, it’s no surprise that many OVSPs don’t have a plan to monitor and measure performance. Fifteen percent of OVSPs are simply unsure of how they should design and implement such a plan, while 19% are willing to rely completely on their CDN to tell them how they’re doing. Since the CDN will be judged on performance against the parameters they’re measuring, there’s an obvious conflict of interest here.
Twenty-eight percent say they use an internal ops team to monitor performance, and 2% say they use a third-party contractor. However, both of these options are difficult, if not impossible, to implement since at least some assistance from the CDN is required to be able to measure all the parameters and isolate problem areas in the delivery.
The pragmatic approach is for the OVSP’s ops team to work with their CDN to monitor
performance. Only 35% of the OVSPs we surveyed say that they’re following this approach.
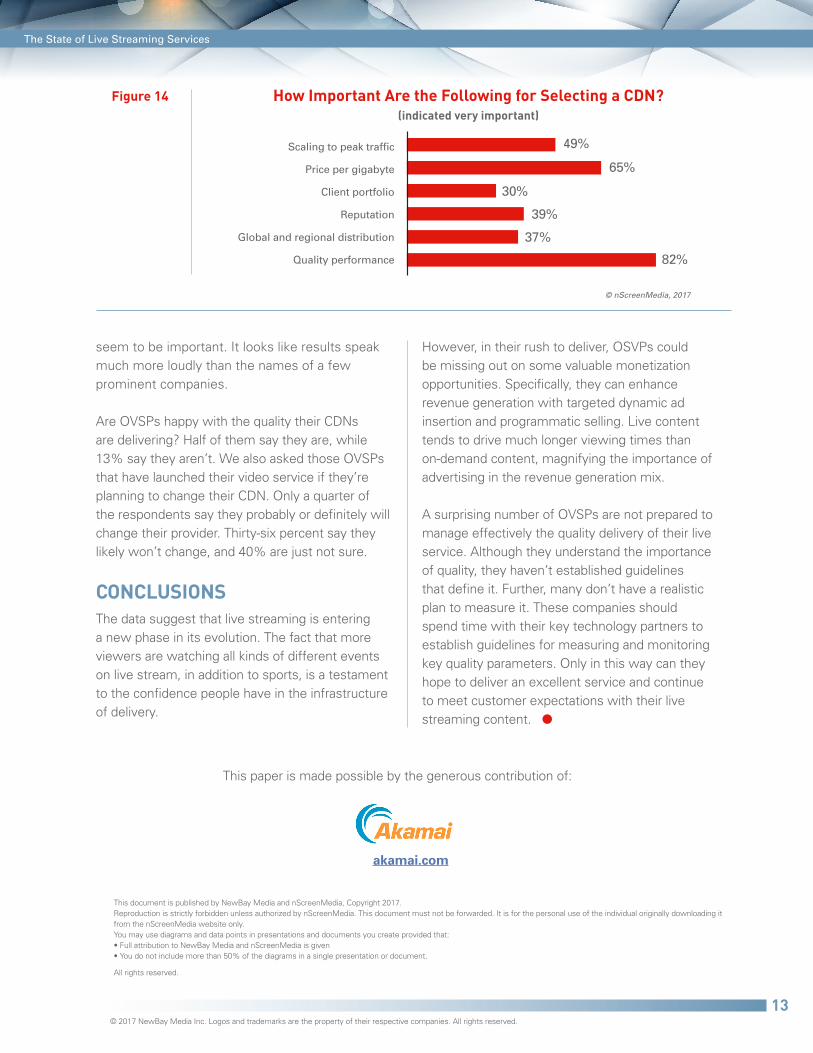
CHOOSING A CDNNo service provider is more important to an OVSP than the content distribution network (CDN) they choose. Not surprisingly, a CDN’s ability to deliver a quality experience is the most important parameter OVSPs take into account when deciding with whom they want to work. Eighty-two percent rate quality as very influential in their decision about which CDN to use to deliver their video service to customers.
Because live viewing sessions are typically very long, it costs more to deliver them than on-demand services. Sixty-five percent of the OVSPs surveyed say the price per gigabyte is very important when deciding on a CDN. Pricing is therefore about as important as the ability to service peak traffic loads.
Servicing peak loads is particularly important for live streaming services. The unpredictability of the size of the audience that will tune in to a stream makes it very difficult to estimate the resources needed to service the load. For example, the demand for a riveting college or high-school football game could increase from a hundred streams to thousands in a matter of minutes.
Whether or not a CDN has a global or regional distribution network is not a primary concern for OVSPs shopping for a CDN partner. Neither does the quality of the CDN’s client portfolio
Figure 13 How Video Performance is Monitored
My ops team
Contractor
CDN
Not sure
Ops team and CDN 28%
3%
19%
Other 1%%
18%
15%
© nScreenMedia, 2017
The State of Live Streaming Services
13
seem to be important. It looks like results speak much more loudly than the names of a few prominent companies.
Are OVSPs happy with the quality their CDNs are delivering? Half of them say they are, while 13% say they aren’t. We also asked those OVSPs that have launched their video service if they’re planning to change their CDN. Only a quarter of the respondents say they probably or definitely will change their provider. Thirty-six percent say they likely won’t change, and 40% are just not sure.
CONCLUSIONSThe data suggest that live streaming is entering a new phase in its evolution. The fact that more viewers are watching all kinds of different events on live stream, in addition to sports, is a testament to the confidence people have in the infrastructure of delivery.
However, in their rush to deliver, OSVPs could be missing out on some valuable monetization opportunities. Specifically, they can enhance revenue generation with targeted dynamic ad insertion and programmatic selling. Live content tends to drive much longer viewing times than on-demand content, magnifying the importance of advertising in the revenue generation mix.
A surprising number of OVSPs are not prepared to manage effectively the quality delivery of their live service. Although they understand the importance of quality, they haven’t established guidelines that define it. Further, many don’t have a realistic plan to measure it. These companies should spend time with their key technology partners to establish guidelines for measuring and monitoring key quality parameters. Only in this way can they hope to deliver an excellent service and continue to meet customer expectations with their live streaming content. ●
Figure 14 How Important Are the Following for Selecting a CDN? (indicated very important)
© nScreenMedia, 2017
Scaling to peak traffic
Price per gigabyte
Client portfolio
Reputation
Global and regional distribution
Quality performance
65%
30%
39%
37%
49%
82%
This document is published by NewBay Media and nScreenMedia, Copyright 2017. Reproduction is strictly forbidden unless authorized by nScreenMedia. This document must not be forwarded. It is for the personal use of the individual originally downloading it from the nScreenMedia website only. You may use diagrams and data points in presentations and documents you create provided that:• Full attribution to NewBay Media and nScreenMedia is given• You do not include more than 50% of the diagrams in a single presentation or document.
All rights reserved.
© 2017 NewBay Media Inc. Logos and trademarks are the property of their respective companies. All rights reserved.
This paper is made possible by the generous contribution of:
akamai.com
Related Documents