Alignment Refinement Technical Memo Lowcountry Rapid Transit Berkeley-Charleston-Dorchester Council of Governments August 10, 2020 5790 Casper Padgett Way, North Charleston, SC 29406 Tel: 843.529.0400 Fax: 843.529.0305.

Welcome message from author
This document is posted to help you gain knowledge. Please leave a comment to let me know what you think about it! Share it to your friends and learn new things together.
Transcript
Alignment Refinement Technical MemoLowcountry Rapid Transit
Berkeley-Charleston-Dorchester Council of Governments
August 10, 2020
5790 Casper Padgett Way, North Charleston, SC 29406
Tel: 843.529.0400 Fax: 843.529.0305.
Alignment Refinement Memo Contents | i
Contents
Executive Summary ...................................................................................................................... 1
1 Document Purpose and Organization .................................................................................... 7
2 LCRT Alignment Development and Refinement to Date ....................................................... 7
2.1 I-26 Fixed Guideway Transit Alternatives Analysis ........................................................ 7
2.2 Lowcountry Rapid Transit Phase 1 ................................................................................. 9
2.3 LCRT Phase 1 and FTA Project Development ............................................................. 14
3 LCRT Phase 2 Alignment Refinement ................................................................................. 14
3.1 Measures ...................................................................................................................... 14
3.2 Maximum Rating and Scoring Refinement ................................................................... 23
4 LCRT Phase 2 Alignment Refinement Results .................................................................... 25
4.1 Key Findings and Recommendations – End to End Alignment Results ....................... 25
4.2 Further Alignment Refinement Analysis (Alternatives 1, 3, 4, 6) .................................. 27
5 Recommendations and Next Steps ..................................................................................... 30
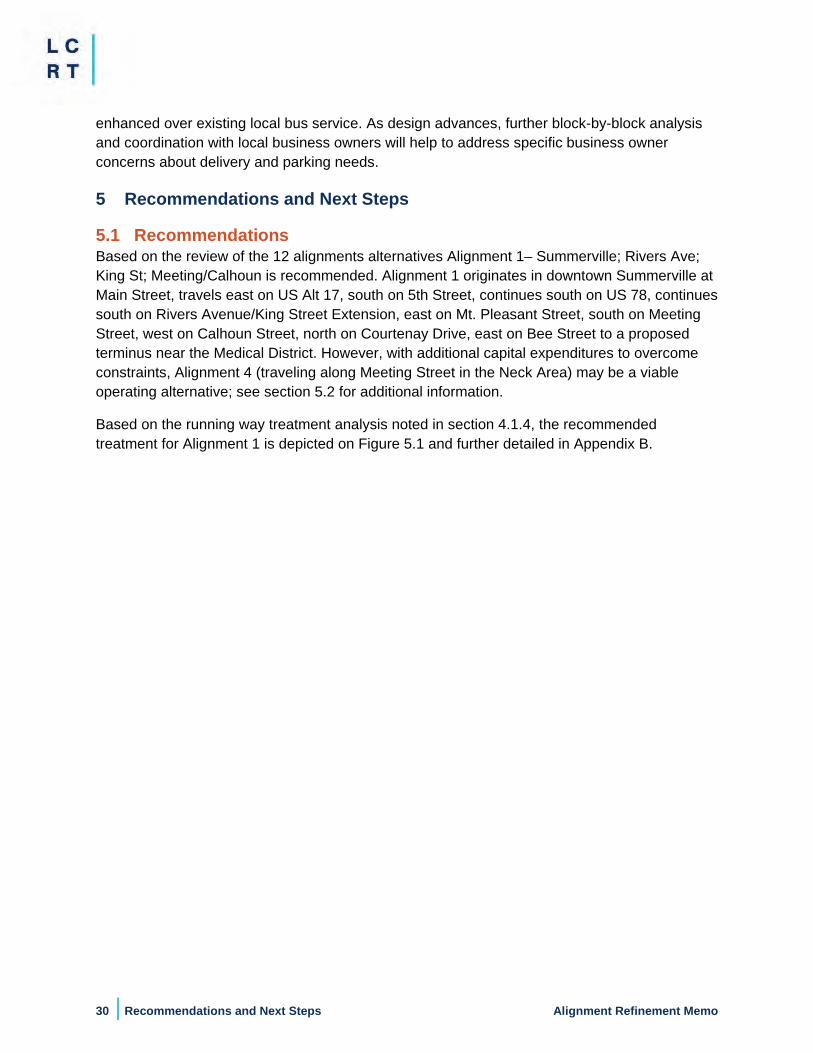
5.1 Recommendations ........................................................................................................ 30
5.2 Next Steps .................................................................................................................... 32
Figures
Figure ES.1 LCRT Alignment Alternatives .................................................................................... 3 Figure ES.2 LCRT Guideway Treatments and Recommended Alignment for Further
Refinement ..................................................................................................................... 6 Figure 2.1 LCRT Alignment Alternatives ..................................................................................... 12 Figure 2.2 Alignment Refinement Process to Date ..................................................................... 13 Figure 5.1 LCRT Guideway Treatments and Recommended Alignment for Further
Refinement ................................................................................................................... 31
ii | Contents Alignment Refinement Memo
Tables
Table ES. 1 Matrix Summary Results ........................................................................................... 4 Table ES. 2 Matrix Summary Results (continued) ........................................................................ 5 Table 2.1 LCRT Phase 1 Alignments .......................................................................................... 11 Table 3.1 LCRT Goals, Evaluation Criteria, and Measurements ................................................ 15 Table 3.2 Measure for Promote Livable, Transit-oriented Development Goal ............................ 16 Table 3.3 Measures for Creating Multimodal System; Travel Choice Goal ................................ 17 Table 3.4 Measures for Minimizing Environmental Impacts and Promote a Healthy Human
Environment Goal......................................................................................................... 18 Table 3.5 Measures for Improving Local, Regional Mobility, Transit Efficiency, and Quality of
Service Goal ................................................................................................................. 21 Table 3.6 Measures for Supporting Economic Development Plans along the Corridor Goal ..... 22 Table 3.7 Measures for Project Viability, Costs, and Implementation Goal ................................ 23 Table 4.1 Ranking of Twelve Alignments .................................................................................... 25
Appendices
Appendix A: Alignment Refinement Criteria and Measures Appendix B: Guideway Treatment Analysis Appendix C: Travel Time and Performance Appendix D: Safety Impact Evaluation Appendix E: Hagood Ave Extension Appendix F: Evaluation Matrix Appendix G: Supplemental Supportive Maps Appendix H: Calhoun Street & US 17/Septima P Clark Parkway Concept Preliminary Analysis
Alignment Refinement Memo Contents | iii
Acronyms and Abbreviations
BCDCOG Berkeley-Charleston-Dorchester Council of Governments BRT bus rapid transit CHATS Charleston Area Transportation Study CIG Capital Investment Grant FTA Federal Transit Administration i-26ALT I-26 Fixed Guideway Transit Alternatives AnalysisLCRT Lowcountry Rapid TransitLPA locally preferred alternativeNEPA National Environmental Policy ActROW right-of-waySTOPS Simplified Trips on Project Software
Alignment Refinement Memo Executive Summary | 1
Executive Summary The Lowcountry Rapid Transit (LCRT) is a bus rapid transit (BRT) system envisioned for the Lowcountry of South Carolina. The purpose of the LCRT project is to provide premium, high-capacity BRT service connecting the Town of Summerville, the City of North Charleston, and the City of Charleston that will address the following objectives:
Improve mobility, accessibility, and connectivity of the transit system and region Promote a cost effective and accessible transit alternative Support land use and transit objectives in the region
The LCRT project was initiated in 2014 with the I-26 Fixed Guideway Transit Alternatives Analysis (i-26ALT), a study conducted by Berkeley-Charleston-Dorchester Council of Governments (BCDCOG) to evaluate transit alternatives for the corridor between Summerville and Charleston. The i-26ALT study identified a recommended alignment and BRT as the preferred mode. The recommended alignment originated in downtown Summerville and terminated at Line Street and Meeting Street in the City of Charleston.
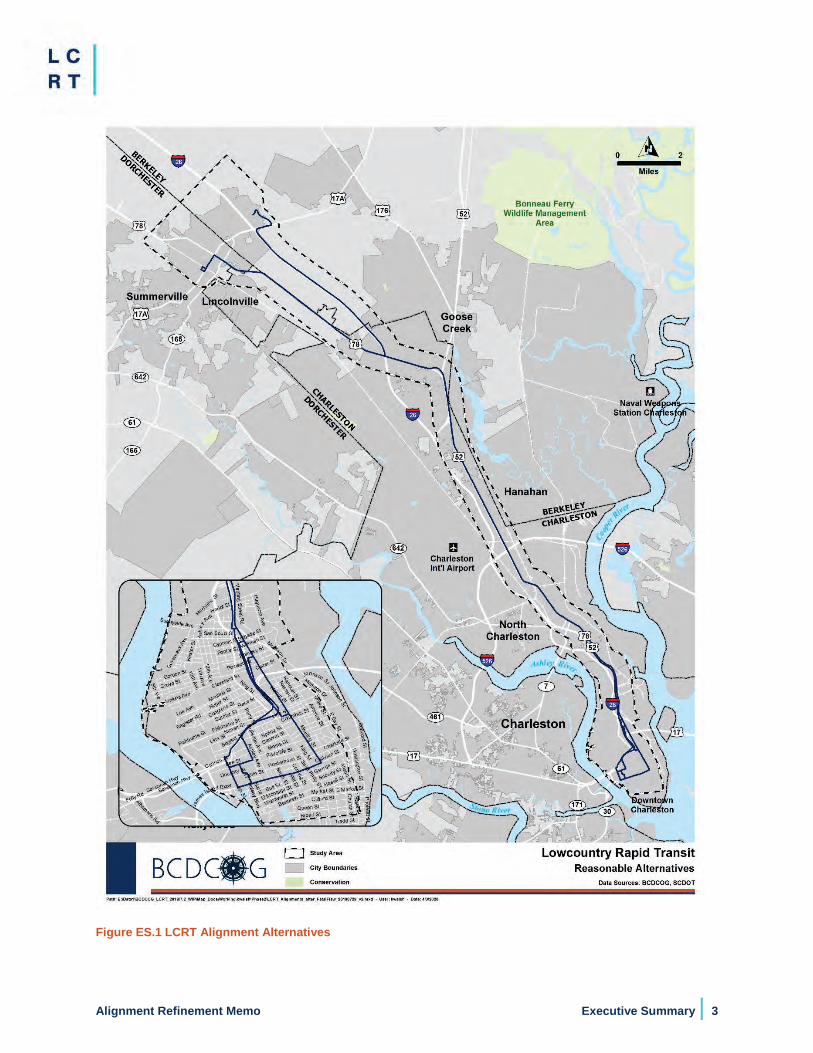
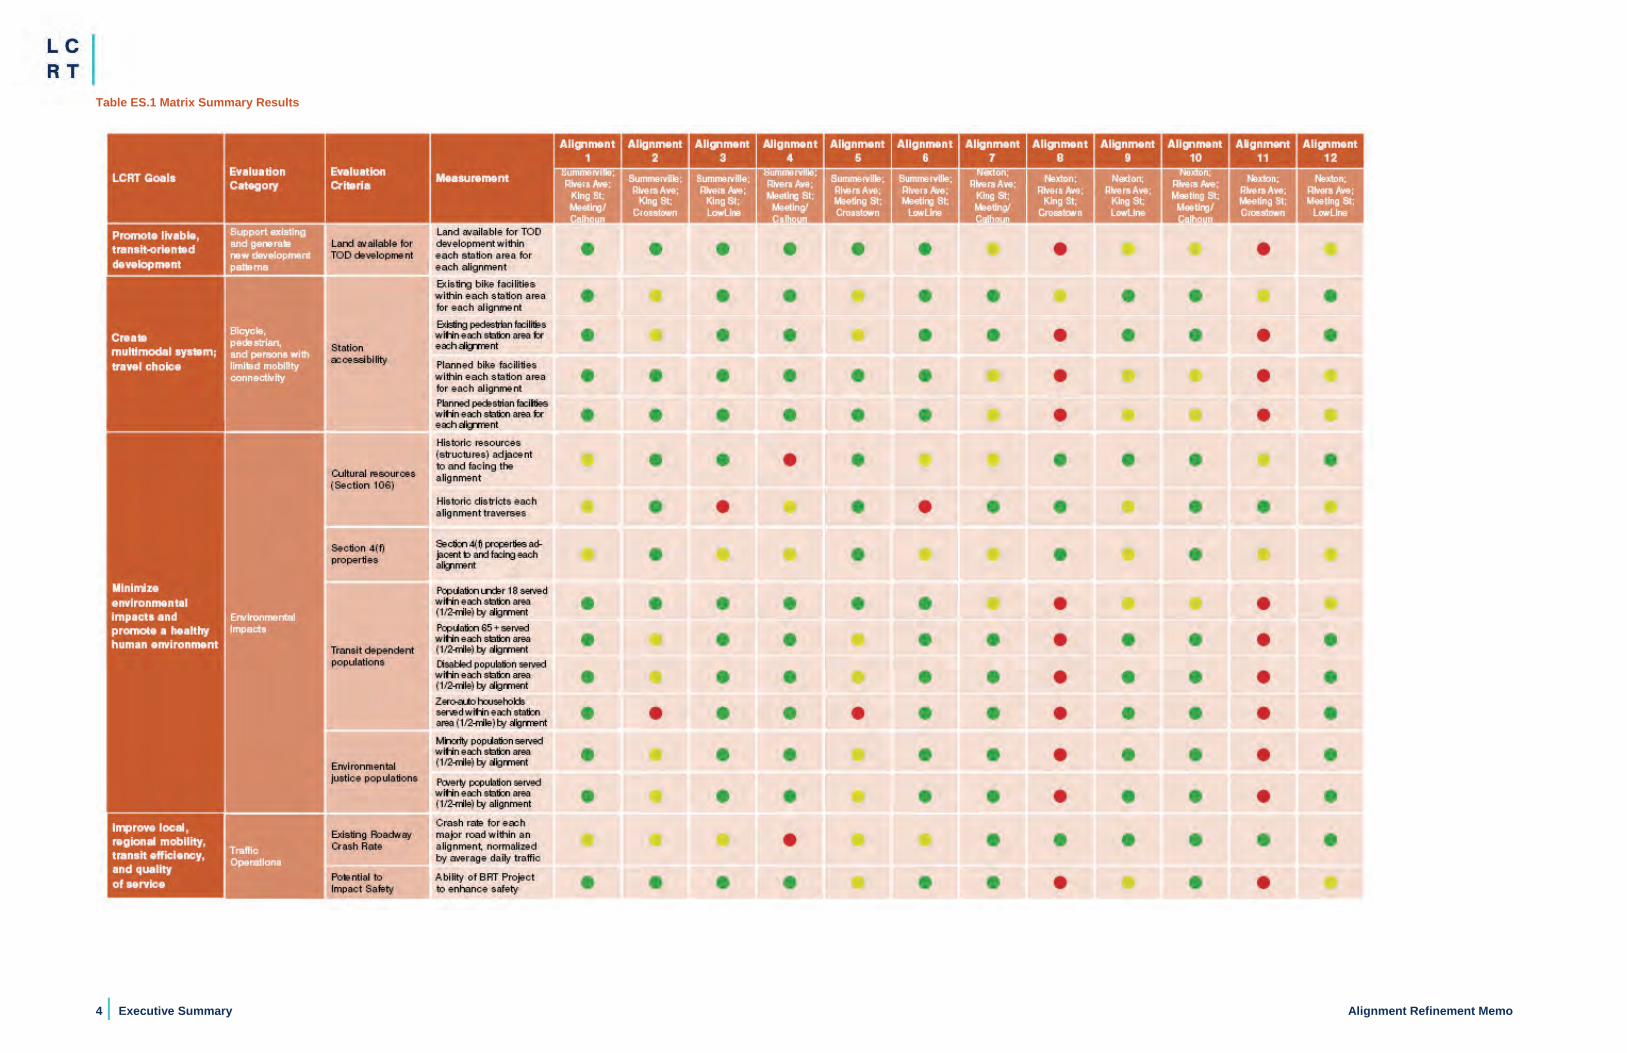
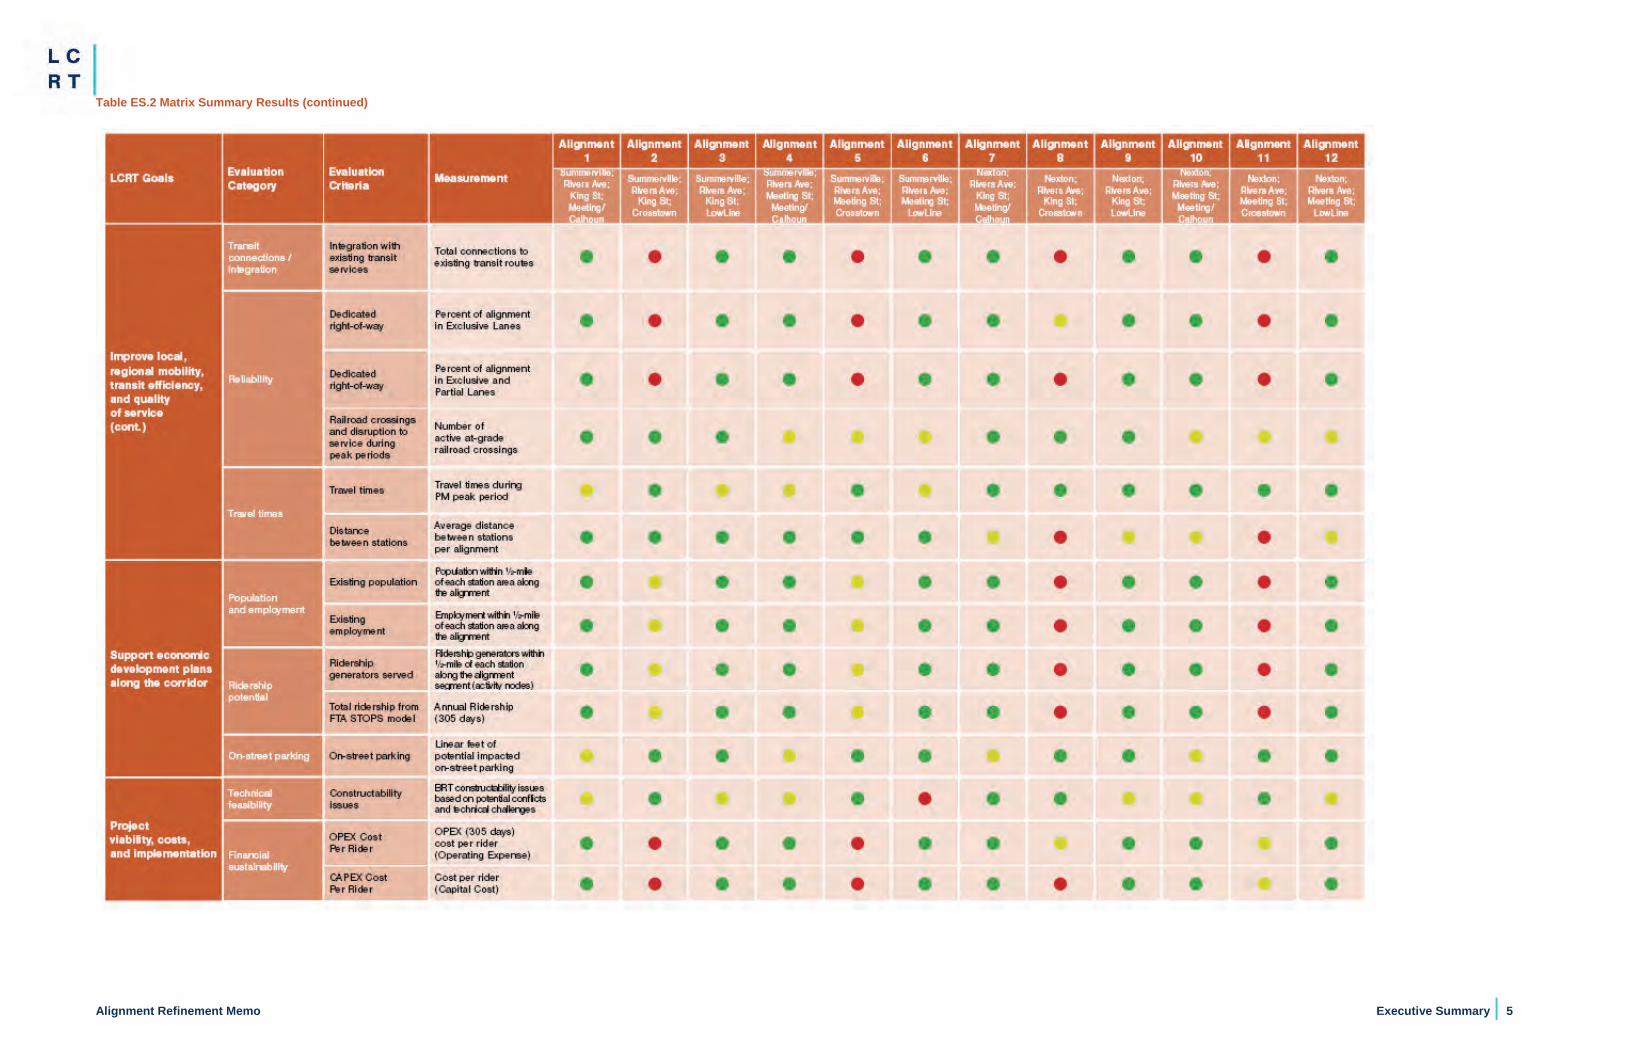
In 2016, Charleston County passed a local sales tax referendum to fund local projects, including transit. As a result of the tax referendum, BCDCOG initiated a four-phase effort to complete the next steps of the BRT project development effort as well as build and operate the BRT. Phase 1 expanded the original i-26ALT study recommendation to ensure the alignment met the project purpose and need, identified the Peninsula end-of-line location, and performed additional engagement with the public and stakeholders. The Phase 1 effort identified 12 alignment alternatives that were recommended to move forward into Phase 2 for further analysis and refinement (Figure ES.1). The 12 alignment alternatives included downtown Summerville and Nexton as northern termini for all alignments; variations included King Street Extension and Meeting Street as travel options in the North Charleston Neck Area, Crosstown, the Lowline, Meeting Street, and Calhoun Street as downtown Charleston variations, and the Medical District as the southern terminus for all alignments. The analysis documented in this memo summarizes the Phase 2 work completed to analyze the 12 alignment alternatives to identify a single alignment that can be further refined for evaluation in the National Environmental Policy Act (NEPA) environmental document for the project. Tables ES.1 and ES.2 illustrate a graphical summary of the analysis results.
Through the Phase 2 analysis, Alignment 1 scored highest of the 12 alignment alternatives. Alignment 1 is the recommended alignment to continue moving through the Federal Transit Administration (FTA) project development process to compete for federal funds in the Capital Investment Grant (CIG) New Starts program. Alignment 1 originates in downtown Summerville at Main Street, travels east on US Alt 17, south on 5th Street, continues south on US 78, continues south on Rivers Avenue/King Street Extension, east on Mt. Pleasant Street, south on Meeting Street, west on Calhoun Street, north on Courtenay Drive, east on Bee Street to a proposed terminus near the Medical District. However, with additional capital expenditure, Alignment 4 (traveling along Meeting Street in the Neck Area) may be a viable operating alternative. See Section 4.2 for additional detail.
2 | Executive Summary Alignment Refinement Memo
A single alignment will need to be further refined through next steps of the LCRT project to meet the FTA project development requirements to compete for federal funds in the CIG New Starts program. Figure ES.2 illustrates the recommended alignment as well as the current proposed running way treatments for the alignment.
The next steps of LCRT project development that will further refine the recommended alignment include finalizing the specific project termini, finalizing the station locations, and detailing the locally preferred alternative (LPA) to advance through NEPA analysis.
Alignment Refinement Memo Executive Summary | 3
Figure ES.1 LCRT Alignment Alternatives
4 | Executive Summary Alignment Refinement Memo
Table ES.1 Matrix Summary Results
Alignment Refinement Memo Executive Summary | 5
Table ES.2 Matrix Summary Results (continued)

6 | Executive Summary Alignment Refinement Memo
Figure ES.2 LCRT Guideway Treatments and Recommended Alignment for Further Refinement
Alignment Refinement Memo Document Purpose and Organization | 7
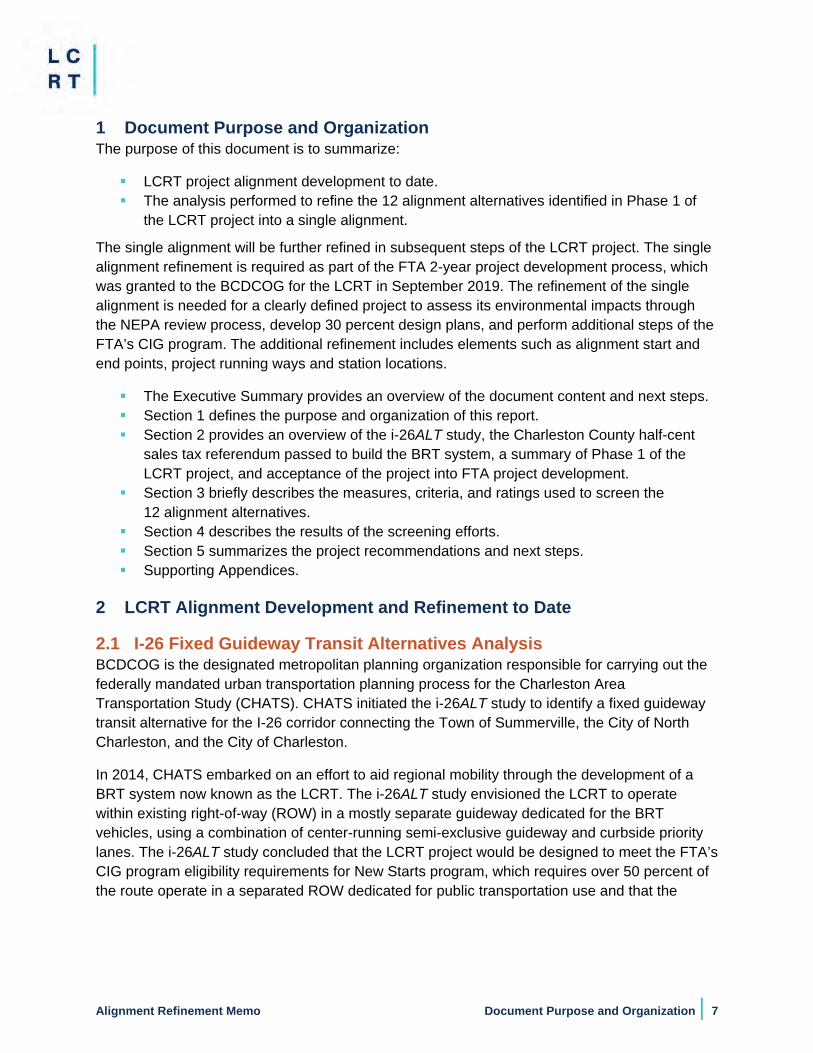
1 Document Purpose and Organization The purpose of this document is to summarize:
LCRT project alignment development to date. The analysis performed to refine the 12 alignment alternatives identified in Phase 1 of
the LCRT project into a single alignment.
The single alignment will be further refined in subsequent steps of the LCRT project. The single alignment refinement is required as part of the FTA 2-year project development process, which was granted to the BCDCOG for the LCRT in September 2019. The refinement of the single alignment is needed for a clearly defined project to assess its environmental impacts through the NEPA review process, develop 30 percent design plans, and perform additional steps of the FTA’s CIG program. The additional refinement includes elements such as alignment start and end points, project running ways and station locations.
The Executive Summary provides an overview of the document content and next steps. Section 1 defines the purpose and organization of this report. Section 2 provides an overview of the i-26ALT study, the Charleston County half-cent
sales tax referendum passed to build the BRT system, a summary of Phase 1 of theLCRT project, and acceptance of the project into FTA project development.
Section 3 briefly describes the measures, criteria, and ratings used to screen the12 alignment alternatives.
Section 4 describes the results of the screening efforts. Section 5 summarizes the project recommendations and next steps. Supporting Appendices.
2 LCRT Alignment Development and Refinement to Date
2.1 I-26 Fixed Guideway Transit Alternatives Analysis BCDCOG is the designated metropolitan planning organization responsible for carrying out the federally mandated urban transportation planning process for the Charleston Area Transportation Study (CHATS). CHATS initiated the i-26ALT study to identify a fixed guideway transit alternative for the I-26 corridor connecting the Town of Summerville, the City of North Charleston, and the City of Charleston.
In 2014, CHATS embarked on an effort to aid regional mobility through the development of a BRT system now known as the LCRT. The i-26ALT study envisioned the LCRT to operate within existing right-of-way (ROW) in a mostly separate guideway dedicated for the BRT vehicles, using a combination of center-running semi-exclusive guideway and curbside priority lanes. The i-26ALT study concluded that the LCRT project would be designed to meet the FTA’s CIG program eligibility requirements for New Starts program, which requires over 50 percent of the route operate in a separated ROW dedicated for public transportation use and that the
8 | LCRT Alignment Development and Refinement to Date Alignment Refinement Memo
project include defined stations, traffic signal priority for buses, and frequent, bi-directional service1.
The 15-month i-26ALT study was initiated in October 2014 and included a comprehensive operational analysis of the Charleston Area Regional Transportation Authority transit system and a fixed guideway transit alternatives analysis of the I-26 corridor. An extensive public involvement campaign was completed to solicit input throughout the process. Public engagement efforts undertaken for the i-26ALT study were focused on identifying the various audiences and stakeholders vested and impacted by the study; educating these groups on the purpose and need for the project, informing them of findings resulting from the analysis, and actively and meaningfully engaging them in the decision making process. Outreach efforts included surveys, public meetings, “Transit Talks,” community meetings, development of a project website and newsletters, and utilization of Mindmixer, Facebook, and Twitter.
The study process incorporated guidelines and methodologies from the FTA CIG program to identify a recommended alternative to move forward into the program’s project development phase. The study identified the overall project purpose and need, a preferred alignment, and a mode that would improve transit service and enhance regional mobility along the I-26 corridor in the Lowcountry of South Carolina primarily traveling within the US 78/US 52 (Rivers Avenue) corridor.
2.1.1 i-26ALT Study Purpose and Goals The purpose of the i-26ALT was to improve transit service and enhance regional mobility along the 22-mile I-26 corridor connecting Summerville, North Charleston, and Charleston. The goals identified in the study were:
Improve mobility, accessibility, safety, and connectivity of the transit system and region Promote a cost effective and financially feasible transit alternative Support local land use objectives Plan for projected growth in an environmentally sustainable manner Respond to community needs and support Support a diverse regional economy
2.1.2 The i-26ALT Study Recommended Alternative The alternatives analysis process for the i-26ALT study included a three-tiered screening process to identify the best mode and alignment for a fixed guideway transit alternative to meet the purpose and goals of the project. The three tiered process included:
Pre-Screening (Fatal Flaw) Screen One (Initial Screening) Screen Two (Detailed Screening)
1 Source: FTA Capital Investment Grant Program Final Interim Policy Guidance, 2016
Alignment Refinement Memo LCRT Alignment Development and Refinement to Date | 9
The study resulted in the recommendation of the following project elements to advance into FTA project development and pursue federal funds for project completion.
Preferred alignment: originating from the northern termini in downtown Summerville, east on Main Street, south on US 78/Rivers Avenue, south on King Street Extension or Carner Avenue/Meeting Street, south on Meeting Street to Line Street at its southern termini.
Alignment length: 23.1 miles Mode: BRT Guideway: mix of exclusive and semi-exclusive Stations: 18 Operating assumptions:
Weekday service: 4:00 AM – 1:00 AM; 10-minute peak, 20-minute non-peak, 30-minute early/late
Saturday: 6:00 AM – 1:00 AM, 20-minute service Sunday: 7:00 AM – 11:00 PM , 30-minute service
For the full i-26ALT study visit https://lowcountryrapidtransit.com/resources.html
2.2 Lowcountry Rapid Transit Phase 1 In November 2016, residents of Charleston County approved a half-cent sales tax referendum to fund transportation projects, including transit. The sales tax will contribute to the LCRT capital construction costs and operating funds to support the first 15 years of service. The LCRT will seek FTA matching funds for the completion of the project.
In 2018, the BCDCOG initiated Phase 1 of a four-phase effort; the phases are as follows:
Phase 1–Advance Planning Phase 2–NEPA/Project Development Phase 3–Engineering Phase 4–Construction Management
The purpose of Phase 1 was to advance the LCRT project into the project development phase of FTA’s CIG program. Phase 1 was composed of several tasks, including:
Confirm and refine the project’s purpose/need and goals/objectives Confirm the overall alignment with special attention to three key areas: the Town of
Summerville (northern terminus), the Neck area, and the Peninsula (southern terminus) Assess the proposed BRT station locations Assess the existing FTA Simplified Trips on Project Software (STOPS) model and use it
to compare ridership among different alignment alternatives Develop corridor design criteria Develop preferred BRT concepts Develop conceptual engineering drawings Assess potential impacts Continue public and stakeholder engagement
10 | LCRT Alignment Development and Refinement to Date Alignment Refinement Memo
2.2.1 Refining Purpose and Need, Developing Goals and Objectives At the beginning of Phase 1, through extensive public and stakeholder engagement, the project team refined the project’s purpose and need2, and from that, developed project goals and objectives.
The purpose of the LCRT project is to provide premium, high capacity BRT service connecting the Town of Summerville, the City of North Charleston, and the City of Charleston that will address the following objectives:
Improve mobility, accessibility, and connectivity of the transit system and region Promote a cost effective and accessible transit alternative Support land use and transit objectives in the region
2.2.2 LCRT Alignment Refinement Process At the beginning of Phase 1, through the advanced planning process, several alignment sections were developed. The purpose of these section options was to evaluate the northern terminus, downtown Summerville or the Nexton development, King Street or Meeting Street in the Neck Area, and options for connecting into the heart of downtown Charleston, including the Medical District.
Through this process the following section options were developed:
Two northern section options, one serving downtown Summerville and the other serving the Nexton development.
One single alignment section option was identified for the center portion of the corridor along Rivers Avenue.
Two alignment section options were identified in the Neck area, running along either King Street or Meeting Street.
Seven separate alignment section options were identified in the Peninsula area south of Mt. Pleasant Street, each of which eventually connected to the Medical District.
These alignment sections were linked in different combinations to create 16 end-to-end alignments. These 16 alignments were then evaluated through a fatal flaw analysis.
The purpose of the fatal flaw analysis was to understand if the LCRT could operate/maneuver in each specific area, in particular in the streets of downtown Charleston and principally south of Mt. Pleasant Street, given the existing constrained ROW and built environment. The fatal flaw analysis focused on the LCRT vehicle operability, including:
Roadway geometry: Are there roadway constraints impacting the ability for a BRT vehicle to make the necessary turns along the route?
Right-of-way availability: Is there sufficient right-of-way availability along the route for a BRT vehicle to operate in exclusive BRT lanes?
BRT operability: Can the roadway accommodate a bi-directional exclusive BRT lane?
2 https://lowcountryrapidtransit.com/docs/LCRT.Purpose_and_Need.pdf
Alignment Refinement Memo LCRT Alignment Development and Refinement to Date | 11
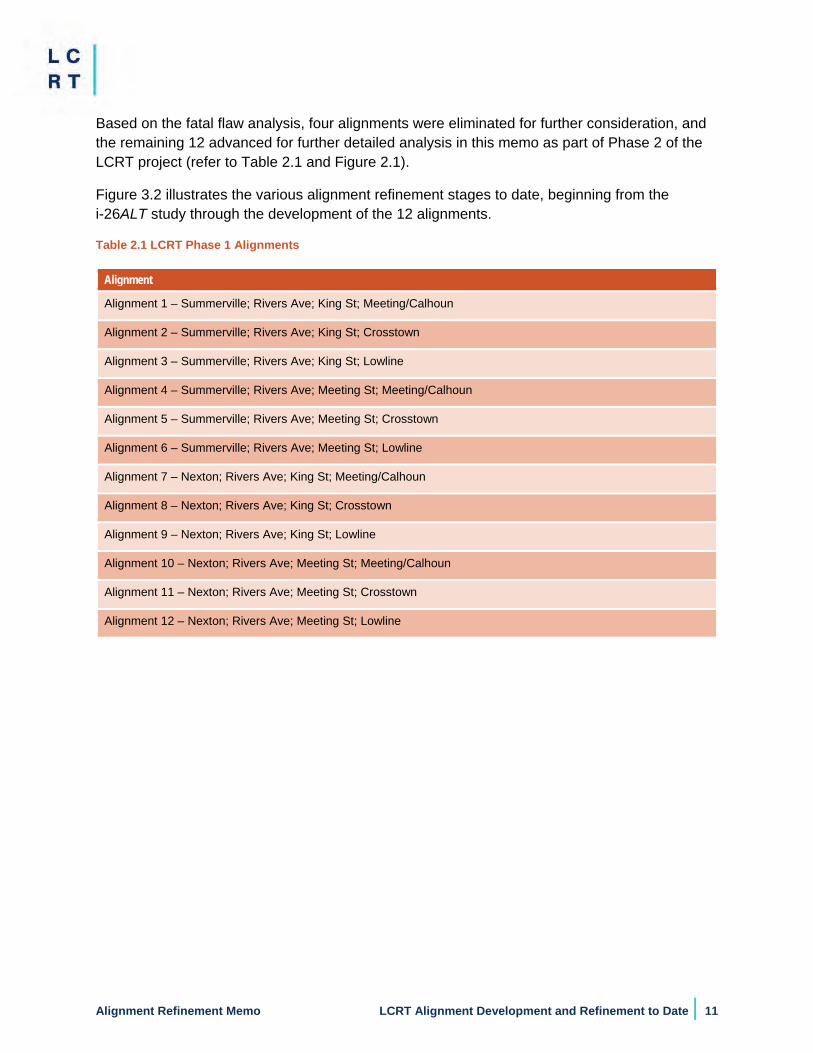
Based on the fatal flaw analysis, four alignments were eliminated for further consideration, and the remaining 12 advanced for further detailed analysis in this memo as part of Phase 2 of the LCRT project (refer to Table 2.1 and Figure 2.1).
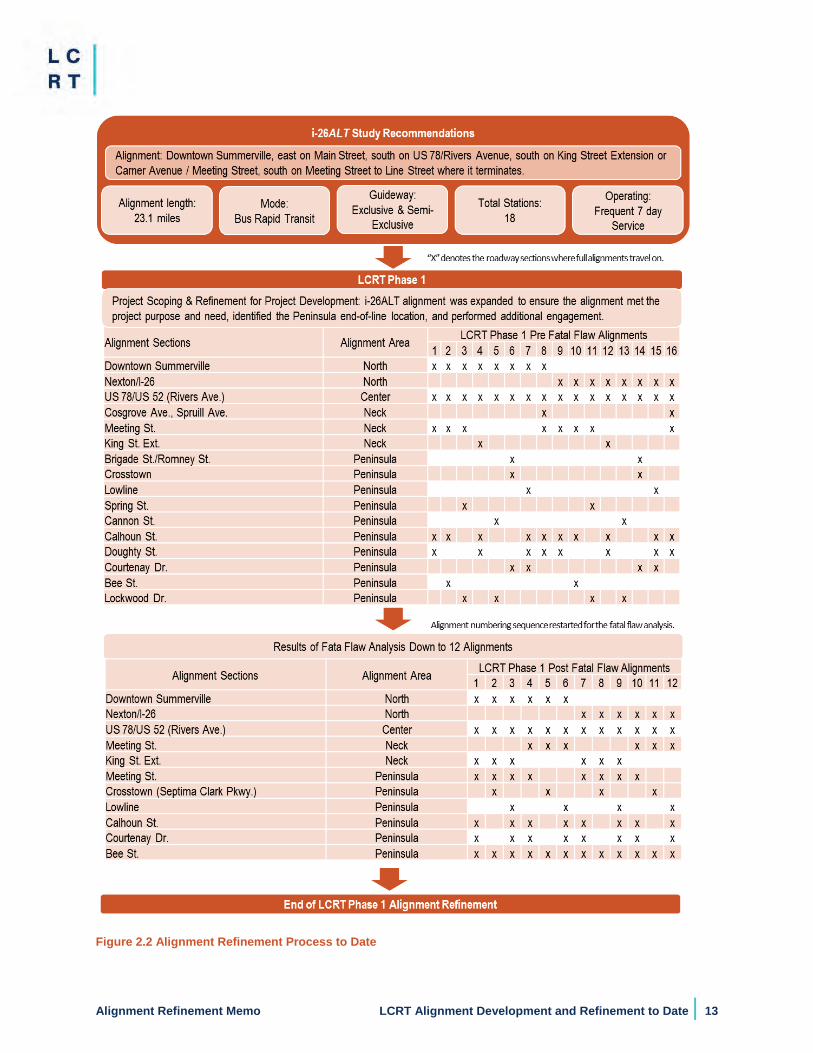
Figure 3.2 illustrates the various alignment refinement stages to date, beginning from the i-26ALT study through the development of the 12 alignments.
Table 2.1 LCRT Phase 1 Alignments
Alignment
Alignment 1 – Summerville; Rivers Ave; King St; Meeting/Calhoun
Alignment 2 – Summerville; Rivers Ave; King St; Crosstown
Alignment 3 – Summerville; Rivers Ave; King St; Lowline
Alignment 4 – Summerville; Rivers Ave; Meeting St; Meeting/Calhoun
Alignment 5 – Summerville; Rivers Ave; Meeting St; Crosstown
Alignment 6 – Summerville; Rivers Ave; Meeting St; Lowline
Alignment 7 – Nexton; Rivers Ave; King St; Meeting/Calhoun
Alignment 8 – Nexton; Rivers Ave; King St; Crosstown
Alignment 9 – Nexton; Rivers Ave; King St; Lowline
Alignment 10 – Nexton; Rivers Ave; Meeting St; Meeting/Calhoun
Alignment 11 – Nexton; Rivers Ave; Meeting St; Crosstown
Alignment 12 – Nexton; Rivers Ave; Meeting St; Lowline
12 | LCRT Alignment Development and Refinement to Date Alignment Refinement Memo
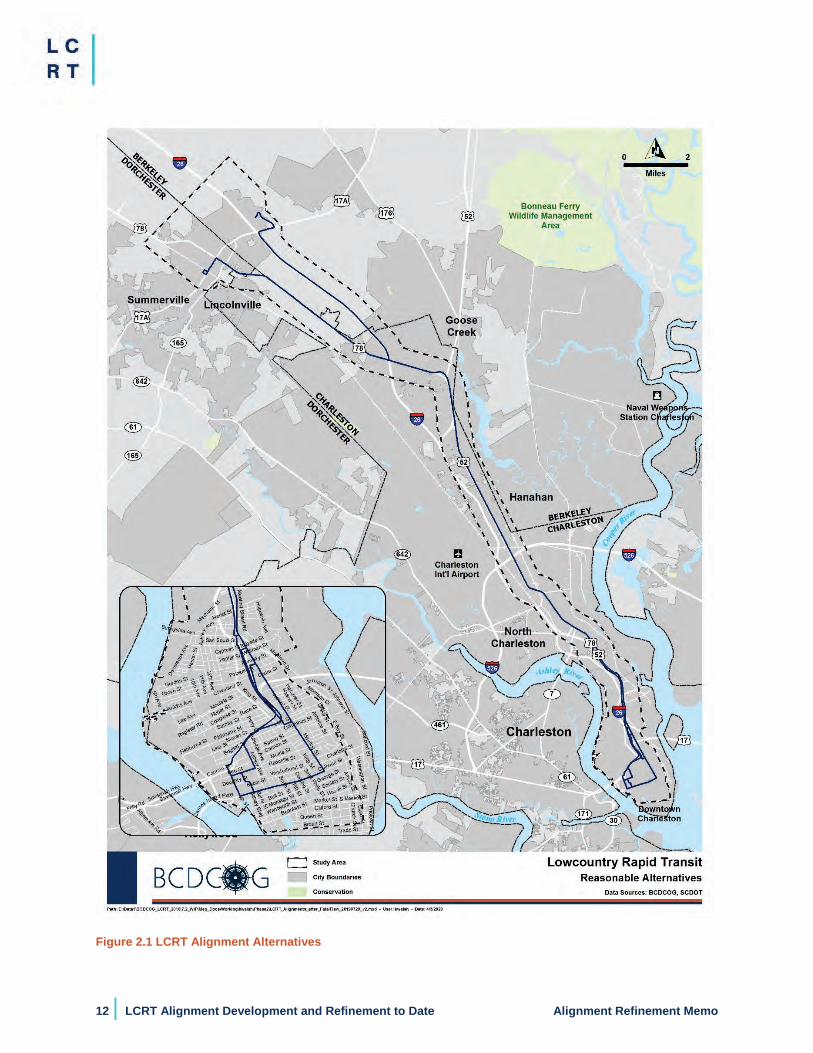
Figure 2.1 LCRT Alignment Alternatives
Alignment Refinement Memo LCRT Alignment Development and Refinement to Date | 13
Figure 2.2 Alignment Refinement Process to Date
14 | LCRT Phase 2 Alignment Refinement Alignment Refinement Memo
2.3 LCRT Phase 1 and FTA Project Development The FTA responded to a Class of Action Determination request on June 11, 2019 with their NEPA determination that the LCRT qualifies for a Documented Categorical Exclusion (DCE). Following this determination, in July 2019, the BCDCOG formally requested FTA approval to allow the LCRT alignment alternatives identified in Phase 1 (Figure 2.1) to enter into the project development process as a New Starts project as a next step to pursuing FTA CIG funding. In September 2019, FTA approved the LCRT to enter into project development.
3 LCRT Phase 2 Alignment Refinement Section 3 summarizes the criteria used to perform the analysis to refine the 12 alignment alternatives from the Phase 1 effort to a single alignment option. The single alignment option will be further analyzed and refined as the LCRT design advances and the DCE is drafted.
To conduct the evaluation of the 12 alignments, a number of measures were identified based on the developed goals and objectives. These measures were chosen on the basis of relevance, priority, FTA criteria, recently completed planning work for the Regional Transit Framework Plan3, industry BRT standards criteria4, and support of the project’s purpose and need.
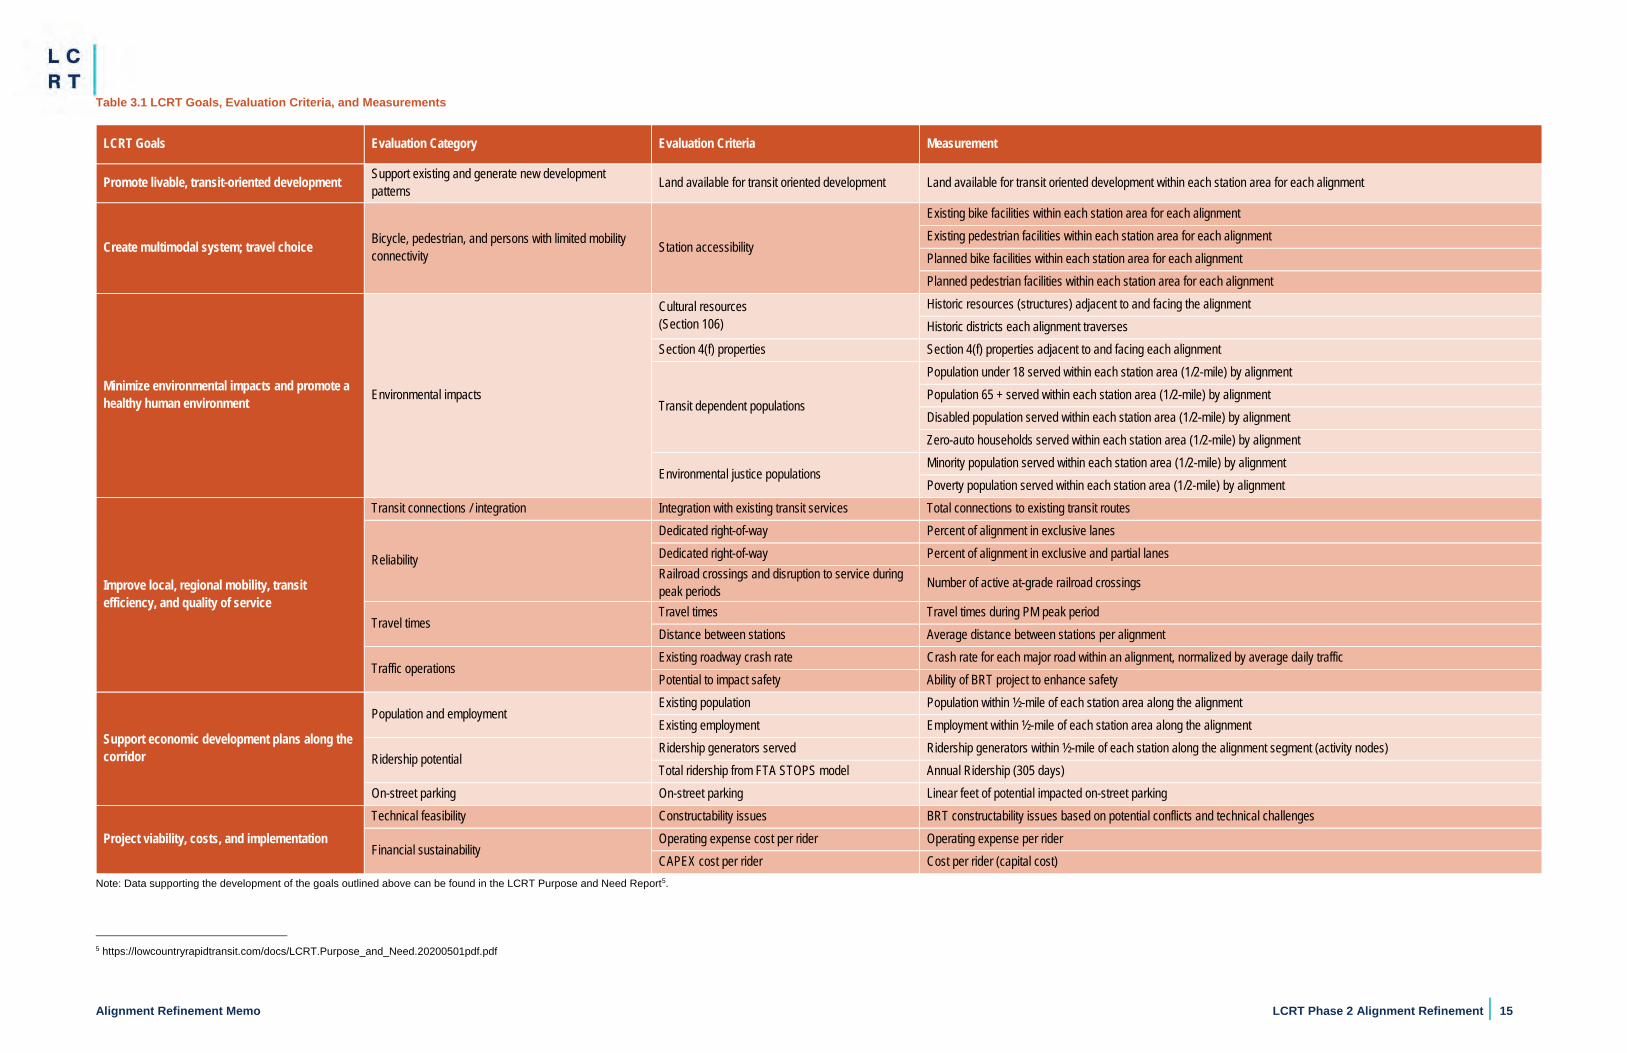
Table 3.1 provides a summary of the criteria used to analyze and refine the 12 alignment alternatives identified in Phase 1 of the LCRT project. Appendix A includes the maps of the individual alignments and associated stations used for the analysis. Appendix A provides greater detail in terms of the measures identified for the Phase 2 refinement effort.
3.1 Measures The subsequent text provides a brief overview of each evaluation measure used in the refinement process. The measures are grouped by the goals developed from the LCRT’s purpose and need discussed in Section 2.1.1.
3 https://bcdcog.com/transportation-planning/framework/ 4 Institute for Transportation and Development Policy
Alignment Refinement Memo LCRT Phase 2 Alignment Refinement | 15
Table 3.1 LCRT Goals, Evaluation Criteria, and Measurements
LCRT Goals Evaluation Category Evaluation Criteria Measurement
Promote livable, transit-oriented development Support existing and generate new development patterns Land available for transit oriented development Land available for transit oriented development within each station area for each alignment
Create multimodal system; travel choice Bicycle, pedestrian, and persons with limited mobility connectivity Station accessibility
Existing bike facilities within each station area for each alignment Existing pedestrian facilities within each station area for each alignment Planned bike facilities within each station area for each alignment Planned pedestrian facilities within each station area for each alignment
Minimize environmental impacts and promote a healthy human environment Environmental impacts
Cultural resources (Section 106)
Historic resources (structures) adjacent to and facing the alignment Historic districts each alignment traverses
Section 4(f) properties Section 4(f) properties adjacent to and facing each alignment
Transit dependent populations
Population under 18 served within each station area (1/2-mile) by alignment Population 65 + served within each station area (1/2-mile) by alignment Disabled population served within each station area (1/2-mile) by alignment Zero-auto households served within each station area (1/2-mile) by alignment
Environmental justice populations Minority population served within each station area (1/2-mile) by alignment Poverty population served within each station area (1/2-mile) by alignment
Improve local, regional mobility, transit efficiency, and quality of service
Transit connections / integration Integration with existing transit services Total connections to existing transit routes
Reliability
Dedicated right-of-way Percent of alignment in exclusive lanes Dedicated right-of-way Percent of alignment in exclusive and partial lanes Railroad crossings and disruption to service during peak periods Number of active at-grade railroad crossings
Travel times Travel times Travel times during PM peak period Distance between stations Average distance between stations per alignment
Traffic operations Existing roadway crash rate Crash rate for each major road within an alignment, normalized by average daily traffic Potential to impact safety Ability of BRT project to enhance safety
Support economic development plans along the corridor
Population and employment Existing population Population within ½-mile of each station area along the alignment Existing employment Employment within ½-mile of each station area along the alignment
Ridership potential Ridership generators served Ridership generators within ½-mile of each station along the alignment segment (activity nodes) Total ridership from FTA STOPS model Annual Ridership (305 days)
On-street parking On-street parking Linear feet of potential impacted on-street parking
Project viability, costs, and implementation Technical feasibility Constructability issues BRT constructability issues based on potential conflicts and technical challenges
Financial sustainability Operating expense cost per rider Operating expense per rider CAPEX cost per rider Cost per rider (capital cost)
Note: Data supporting the development of the goals outlined above can be found in the LCRT Purpose and Need Report5.
5 https://lowcountryrapidtransit.com/docs/LCRT.Purpose_and_Need.20200501pdf.pdf
Alignment Refinement Memo LCRT Phase 2 Alignment Refinement | 16
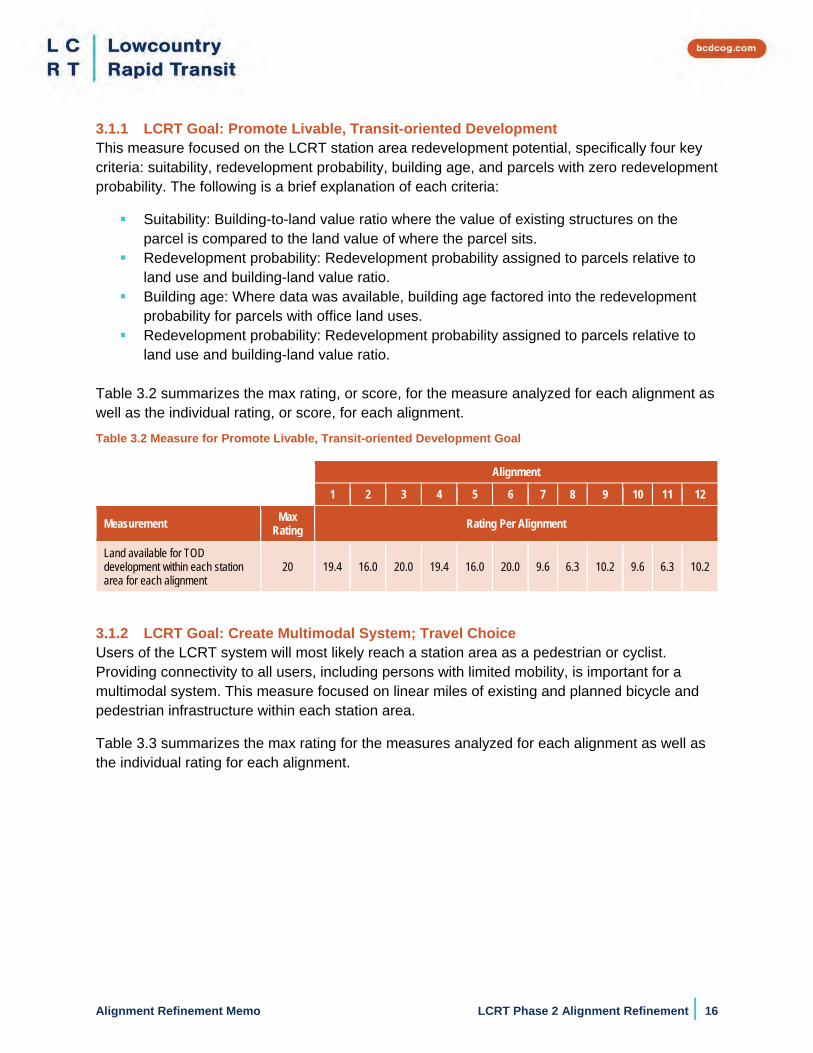
3.1.1 LCRT Goal: Promote Livable, Transit-oriented Development This measure focused on the LCRT station area redevelopment potential, specifically four key criteria: suitability, redevelopment probability, building age, and parcels with zero redevelopment probability. The following is a brief explanation of each criteria:
Suitability: Building-to-land value ratio where the value of existing structures on the parcel is compared to the land value of where the parcel sits.
Redevelopment probability: Redevelopment probability assigned to parcels relative to land use and building-land value ratio.
Building age: Where data was available, building age factored into the redevelopment probability for parcels with office land uses.
Redevelopment probability: Redevelopment probability assigned to parcels relative to land use and building-land value ratio.
Table 3.2 summarizes the max rating, or score, for the measure analyzed for each alignment as well as the individual rating, or score, for each alignment. Table 3.2 Measure for Promote Livable, Transit-oriented Development Goal
Alignment
1 2 3 4 5 6 7 8 9 10 11 12
Measurement Max Rating Rating Per Alignment
Land available for TOD development within each station area for each alignment
20 19.4 16.0 20.0 19.4 16.0 20.0 9.6 6.3 10.2 9.6 6.3 10.2
3.1.2 LCRT Goal: Create Multimodal System; Travel Choice Users of the LCRT system will most likely reach a station area as a pedestrian or cyclist. Providing connectivity to all users, including persons with limited mobility, is important for a multimodal system. This measure focused on linear miles of existing and planned bicycle and pedestrian infrastructure within each station area.
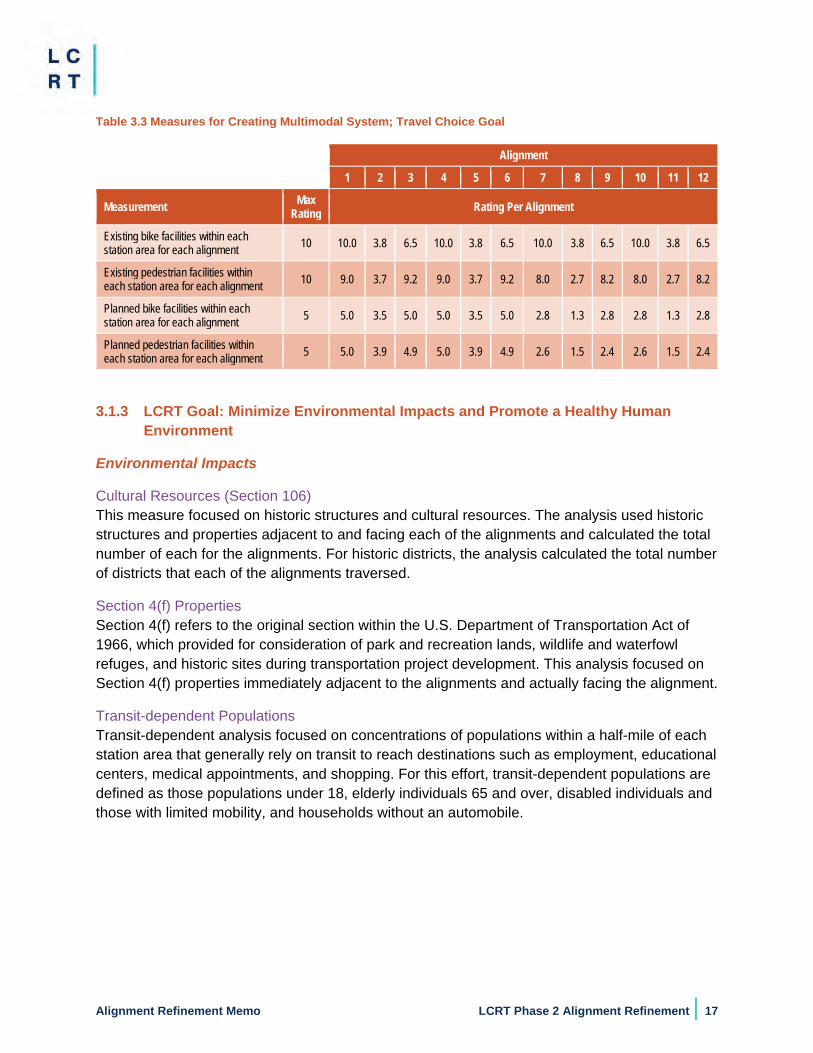
Table 3.3 summarizes the max rating for the measures analyzed for each alignment as well as the individual rating for each alignment.
Alignment Refinement Memo LCRT Phase 2 Alignment Refinement | 17
Table 3.3 Measures for Creating Multimodal System; Travel Choice Goal
Alignment
1 2 3 4 5 6 7 8 9 10 11 12
Measurement Max Rating Rating Per Alignment
Existing bike facilities within each station area for each alignment 10 10.0 3.8 6.5 10.0 3.8 6.5 10.0 3.8 6.5 10.0 3.8 6.5
Existing pedestrian facilities within each station area for each alignment 10 9.0 3.7 9.2 9.0 3.7 9.2 8.0 2.7 8.2 8.0 2.7 8.2
Planned bike facilities within each station area for each alignment 5 5.0 3.5 5.0 5.0 3.5 5.0 2.8 1.3 2.8 2.8 1.3 2.8
Planned pedestrian facilities within each station area for each alignment 5 5.0 3.9 4.9 5.0 3.9 4.9 2.6 1.5 2.4 2.6 1.5 2.4
3.1.3 LCRT Goal: Minimize Environmental Impacts and Promote a Healthy Human Environment
Environmental Impacts
Cultural Resources (Section 106) This measure focused on historic structures and cultural resources. The analysis used historic structures and properties adjacent to and facing each of the alignments and calculated the total number of each for the alignments. For historic districts, the analysis calculated the total number of districts that each of the alignments traversed.
Section 4(f) Properties Section 4(f) refers to the original section within the U.S. Department of Transportation Act of 1966, which provided for consideration of park and recreation lands, wildlife and waterfowl refuges, and historic sites during transportation project development. This analysis focused on Section 4(f) properties immediately adjacent to the alignments and actually facing the alignment.
Transit-dependent Populations Transit-dependent analysis focused on concentrations of populations within a half-mile of each station area that generally rely on transit to reach destinations such as employment, educational centers, medical appointments, and shopping. For this effort, transit-dependent populations are defined as those populations under 18, elderly individuals 65 and over, disabled individuals and those with limited mobility, and households without an automobile.
18 | LCRT Phase 2 Alignment Refinement Alignment Refinement Memo
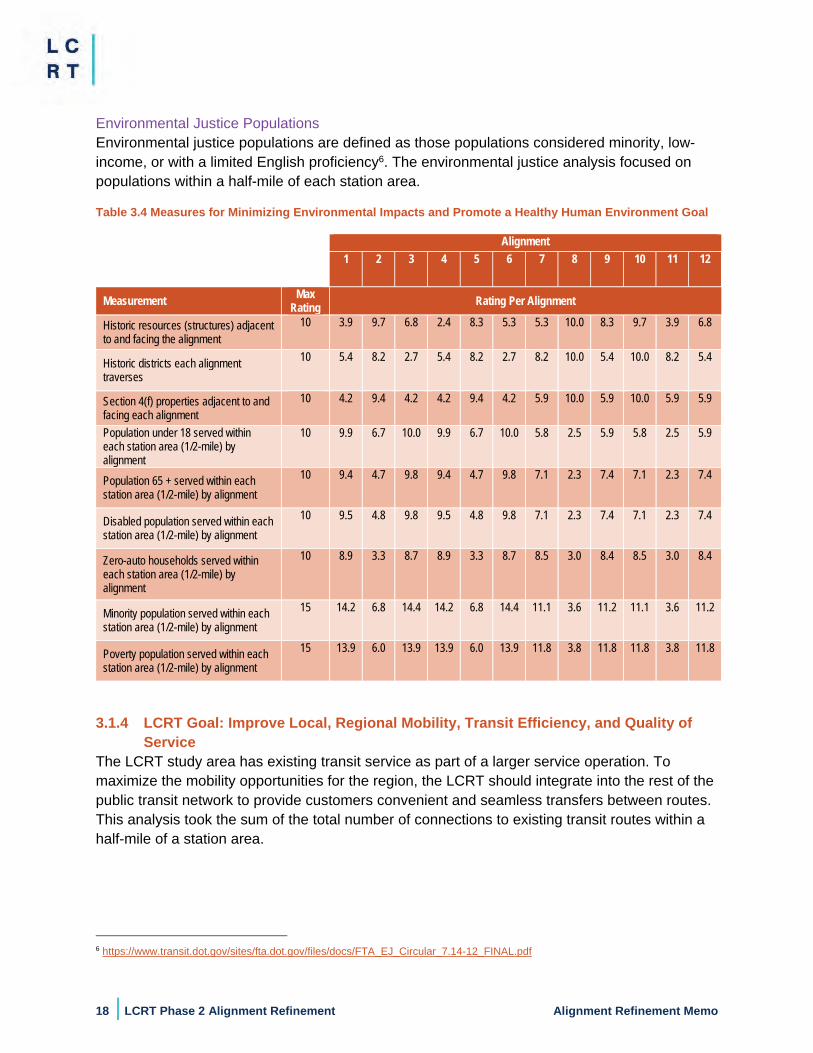
Environmental Justice Populations Environmental justice populations are defined as those populations considered minority, low-income, or with a limited English proficiency6. The environmental justice analysis focused on populations within a half-mile of each station area.
Table 3.4 Measures for Minimizing Environmental Impacts and Promote a Healthy Human Environment Goal
Alignment 1 2 3 4 5 6 7 8 9 10 11 12
Measurement Max Rating Rating Per Alignment
Historic resources (structures) adjacent to and facing the alignment
10 3.9 9.7 6.8 2.4 8.3 5.3 5.3 10.0 8.3 9.7 3.9 6.8
Historic districts each alignment traverses
10 5.4 8.2 2.7 5.4 8.2 2.7 8.2 10.0 5.4 10.0 8.2 5.4
Section 4(f) properties adjacent to and facing each alignment
10 4.2 9.4 4.2 4.2 9.4 4.2 5.9 10.0 5.9 10.0 5.9 5.9
Population under 18 served within each station area (1/2-mile) by alignment
10 9.9 6.7 10.0 9.9 6.7 10.0 5.8 2.5 5.9 5.8 2.5 5.9
Population 65 + served within each station area (1/2-mile) by alignment
10 9.4 4.7 9.8 9.4 4.7 9.8 7.1 2.3 7.4 7.1 2.3 7.4
Disabled population served within each station area (1/2-mile) by alignment
10 9.5 4.8 9.8 9.5 4.8 9.8 7.1 2.3 7.4 7.1 2.3 7.4
Zero-auto households served within each station area (1/2-mile) by alignment
10 8.9 3.3 8.7 8.9 3.3 8.7 8.5 3.0 8.4 8.5 3.0 8.4
Minority population served within each station area (1/2-mile) by alignment
15 14.2 6.8 14.4 14.2 6.8 14.4 11.1 3.6 11.2 11.1 3.6 11.2
Poverty population served within each station area (1/2-mile) by alignment
15 13.9 6.0 13.9 13.9 6.0 13.9 11.8 3.8 11.8 11.8 3.8 11.8
3.1.4 LCRT Goal: Improve Local, Regional Mobility, Transit Efficiency, and Quality of Service
The LCRT study area has existing transit service as part of a larger service operation. To maximize the mobility opportunities for the region, the LCRT should integrate into the rest of the public transit network to provide customers convenient and seamless transfers between routes. This analysis took the sum of the total number of connections to existing transit routes within a half-mile of a station area.
6 https://www.transit.dot.gov/sites/fta.dot.gov/files/docs/FTA_EJ_Circular_7.14-12_FINAL.pdf
Alignment Refinement Memo LCRT Phase 2 Alignment Refinement | 19
Reliability
Dedicated Right-of-Way FTA identifies Fixed Guideway BRT as the majority of the corridor (50 percent or more) operating in a separate, or exclusive, dedicated ROW for public transportation use during peak periods. A semi-exclusive guideway includes portions of dedicated guideway and portions of mixed-traffic. This analysis measured the percent of each alignment in exclusive and semi-exclusive guideway.
This measure included a separate alignment guideway treatment analysis. The resulting LCRT Guideway Treatment Analysis memo is provided in Appendix B and documents the process and recommendations for the most optimal running way treatment for the alignments. Treatments analyzed included dedicated/exclusive, semi-exclusive, or mixed traffic BRT, as well as areas where the BRT should be center running or side running. The memo also describes the process employed to identify the best lane running way treatment for the alignments, potential impacts to vehicular traffic, and identification of potential safety treatments and accessibility improvements. The analysis notes potential parking impacts in certain areas of the corridor depending on the running way treatments.
Railroad Crossings and Disruption to Service during Peak Periods The Charleston region has seen and continues to see sustained growth. Part of that growth includes a very active port system and the active railroad infrastructure required to service the port. Active at-grade railroad crossings could reduce the overall speed and reliability of BRT service. To better understand the potential impact of railroads to speed and reliability of the LCRT BRT service, the total number of active at-grade railroad crossings along each of the 12 alignments was measured. The following summarizes the location and number of existing at-grade railroad crossings that the BRT project crosses.
Downtown Summerville: one crossing along Main Street Rivers Avenue: two crossings (one at Taylor Street, and one near Durant Avenue) King Street: one crossing at Discher Street Meeting Street: three crossings (one at Cherry Hill Lane, one at Milford Street, and one
near Cunnington Avenue)
Travel Times
Travel Times during the PM Peak Period This measure focused on travel time. Travel time relates to how long it would take the LCRT to travel from alignment end point to end point. Travel times were developed for each of the 12 alignments. The travel time by alignment took into account elements such as alignment length, distance between stations, posted travel speed, span of service, LCRT headways, and passenger boarding/alighting time. For more information, see Appendix C.
20 | LCRT Phase 2 Alignment Refinement Alignment Refinement Memo
Average Distance between Stations The measure examined distance between stations to better understand the potential impacts to passengers who would need to walk to stations. The distance between each station for each alignment was measured and an average of the distance for each alignment was determined.
Traffic Operations
Existing Roadway Crash Rate For this measure, the analysis focused on weighted crash rate per alignment normalized by average daily traffic. Crash information was used to better understand the potential for existing crash rates to impact LCRT reliability and user safety. A BRT vehicle in its own lane is still vulnerable to disruptions in travel time at intersections; therefore, dedicated guideway sections are still susceptible to roadway crash rates. The analysis focused on the crash rate per million vehicle miles traveled weighted by length for each alignment within the following areas of the project:
Summerville to University Boulevard both via US 78 and I-26. Rivers Avenue at Cosgrove Avenue to Mount Pleasant Street both via Rivers Avenue
and King Street as well as Rivers Avenue and Meeting Street. Mount Pleasant Street to Hospital District via I-26 and the Crosstown, Meeting Street
and Calhoun Street, and the Lowline, Meeting Street, and Calhoun Street.
Potential to Impact Safety This measure focused on identifying if the proposed alignment design(s) has the potential to impact pedestrian and motorist safety, with an emphasis on each alignment’s potential to improve conditions. Pedestrian safety was based on new signals (especially at locations with a history of pedestrian crashes), the potential to improve pedestrian infrastructure (crosswalks, sidewalks, mid-block crossings), and the potential for median refuges to be installed. Motorist safety was based on new signals (especially at locations with a history of severe or fatal crashes), access control at unsignalized intersections due to medians, and the need for intelligent transportation system countermeasures to aid in the safe operations and maintenance of the dynamic lanes. Data used in this evaluation includes the 2015–2019 crash records provided by SCDOT, and best known design concepts at the time of this evaluation. For more information, see Appendix D.
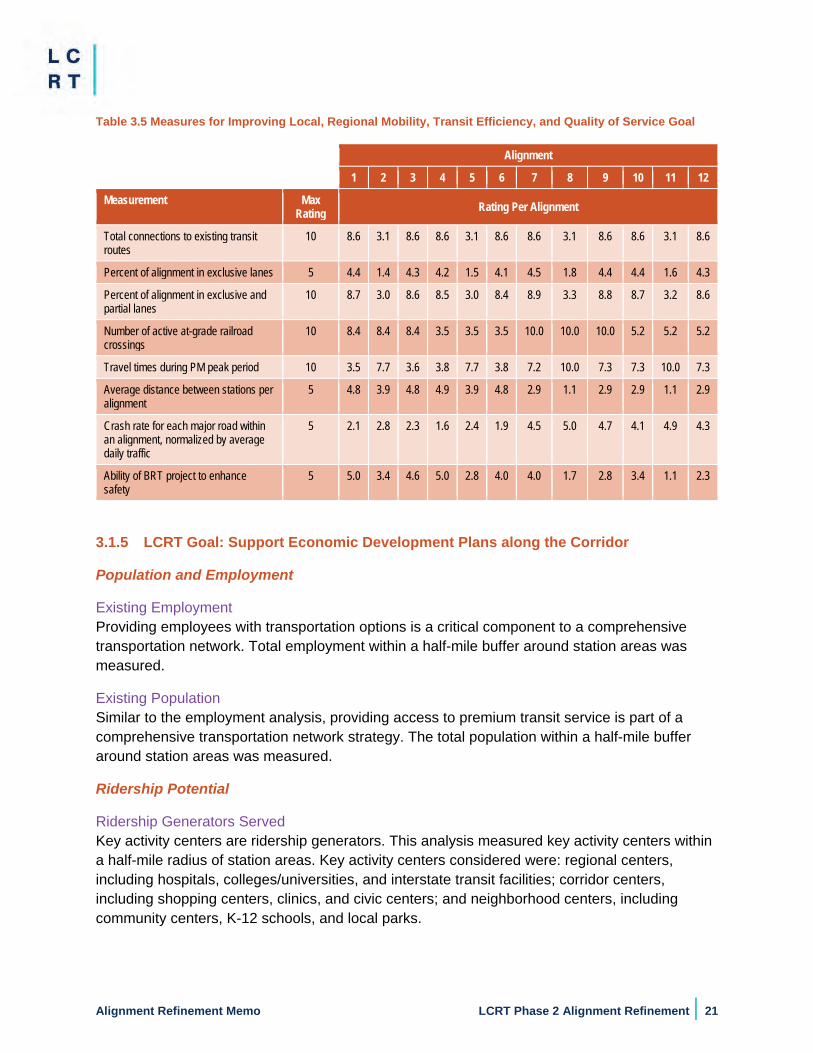
Table 3.5 summarizes the max rating for the measures analyzed for each alignment as well as the individual rating for each alignment.
Alignment Refinement Memo LCRT Phase 2 Alignment Refinement | 21
Table 3.5 Measures for Improving Local, Regional Mobility, Transit Efficiency, and Quality of Service Goal
Alignment
1 2 3 4 5 6 7 8 9 10 11 12
Measurement Max Rating Rating Per Alignment
Total connections to existing transit routes
10 8.6 3.1 8.6 8.6 3.1 8.6 8.6 3.1 8.6 8.6 3.1 8.6
Percent of alignment in exclusive lanes 5 4.4 1.4 4.3 4.2 1.5 4.1 4.5 1.8 4.4 4.4 1.6 4.3
Percent of alignment in exclusive and partial lanes
10 8.7 3.0 8.6 8.5 3.0 8.4 8.9 3.3 8.8 8.7 3.2 8.6
Number of active at-grade railroad crossings
10 8.4 8.4 8.4 3.5 3.5 3.5 10.0 10.0 10.0 5.2 5.2 5.2
Travel times during PM peak period 10 3.5 7.7 3.6 3.8 7.7 3.8 7.2 10.0 7.3 7.3 10.0 7.3
Average distance between stations per alignment
5 4.8 3.9 4.8 4.9 3.9 4.8 2.9 1.1 2.9 2.9 1.1 2.9
Crash rate for each major road within an alignment, normalized by average daily traffic
5 2.1 2.8 2.3 1.6 2.4 1.9 4.5 5.0 4.7 4.1 4.9 4.3
Ability of BRT project to enhance safety
5 5.0 3.4 4.6 5.0 2.8 4.0 4.0 1.7 2.8 3.4 1.1 2.3
3.1.5 LCRT Goal: Support Economic Development Plans along the Corridor
Population and Employment
Existing Employment Providing employees with transportation options is a critical component to a comprehensive transportation network. Total employment within a half-mile buffer around station areas was measured.
Existing Population Similar to the employment analysis, providing access to premium transit service is part of a comprehensive transportation network strategy. The total population within a half-mile buffer around station areas was measured.
Ridership Potential
Ridership Generators Served Key activity centers are ridership generators. This analysis measured key activity centers within a half-mile radius of station areas. Key activity centers considered were: regional centers, including hospitals, colleges/universities, and interstate transit facilities; corridor centers, including shopping centers, clinics, and civic centers; and neighborhood centers, including community centers, K-12 schools, and local parks.
22 | LCRT Phase 2 Alignment Refinement Alignment Refinement Memo
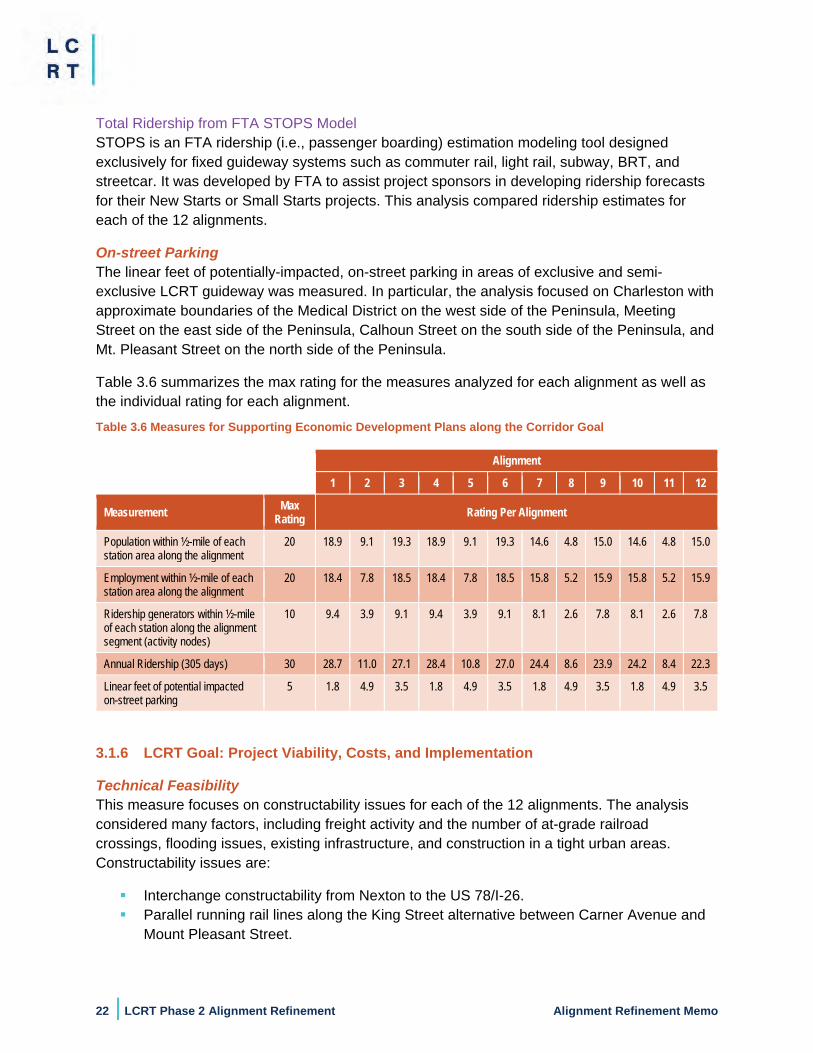
Total Ridership from FTA STOPS Model STOPS is an FTA ridership (i.e., passenger boarding) estimation modeling tool designed exclusively for fixed guideway systems such as commuter rail, light rail, subway, BRT, and streetcar. It was developed by FTA to assist project sponsors in developing ridership forecasts for their New Starts or Small Starts projects. This analysis compared ridership estimates for each of the 12 alignments.
On-street Parking The linear feet of potentially-impacted, on-street parking in areas of exclusive and semi-exclusive LCRT guideway was measured. In particular, the analysis focused on Charleston with approximate boundaries of the Medical District on the west side of the Peninsula, Meeting Street on the east side of the Peninsula, Calhoun Street on the south side of the Peninsula, and Mt. Pleasant Street on the north side of the Peninsula.
Table 3.6 summarizes the max rating for the measures analyzed for each alignment as well as the individual rating for each alignment. Table 3.6 Measures for Supporting Economic Development Plans along the Corridor Goal
Alignment
1 2 3 4 5 6 7 8 9 10 11 12
Measurement Max Rating Rating Per Alignment
Population within ½-mile of each station area along the alignment
20 18.9 9.1 19.3 18.9 9.1 19.3 14.6 4.8 15.0 14.6 4.8 15.0
Employment within ½-mile of each station area along the alignment
20 18.4 7.8 18.5 18.4 7.8 18.5 15.8 5.2 15.9 15.8 5.2 15.9
Ridership generators within ½-mile of each station along the alignment segment (activity nodes)
10 9.4 3.9 9.1 9.4 3.9 9.1 8.1 2.6 7.8 8.1 2.6 7.8
Annual Ridership (305 days) 30 28.7 11.0 27.1 28.4 10.8 27.0 24.4 8.6 23.9 24.2 8.4 22.3
Linear feet of potential impacted on-street parking
5 1.8 4.9 3.5 1.8 4.9 3.5 1.8 4.9 3.5 1.8 4.9 3.5
3.1.6 LCRT Goal: Project Viability, Costs, and Implementation
Technical Feasibility This measure focuses on constructability issues for each of the 12 alignments. The analysis considered many factors, including freight activity and the number of at-grade railroad crossings, flooding issues, existing infrastructure, and construction in a tight urban areas. Constructability issues are:
Interchange constructability from Nexton to the US 78/I-26. Parallel running rail lines along the King Street alternative between Carner Avenue and
Mount Pleasant Street.
Alignment Refinement Memo LCRT Phase 2 Alignment Refinement | 23
Existing and one proposed rail crossing along the Meeting Street alternative between Carner Avenue and Mount Pleasant Street.
Replacement of existing traffic signal mast arms at intersections along the Meeting Street and Calhoun Street alignment in downtown Charleston.
Constructability issues along the Lowline. Flooding and flood mitigation along Calhoun Street in downtown.
Although not a factor in the selection criteria in this subsection, the Hagood Avenue Extension roadway improvement was analyzed per stakeholder request. The results of the analysis are documented in Appendix E.
Financial Sustainability
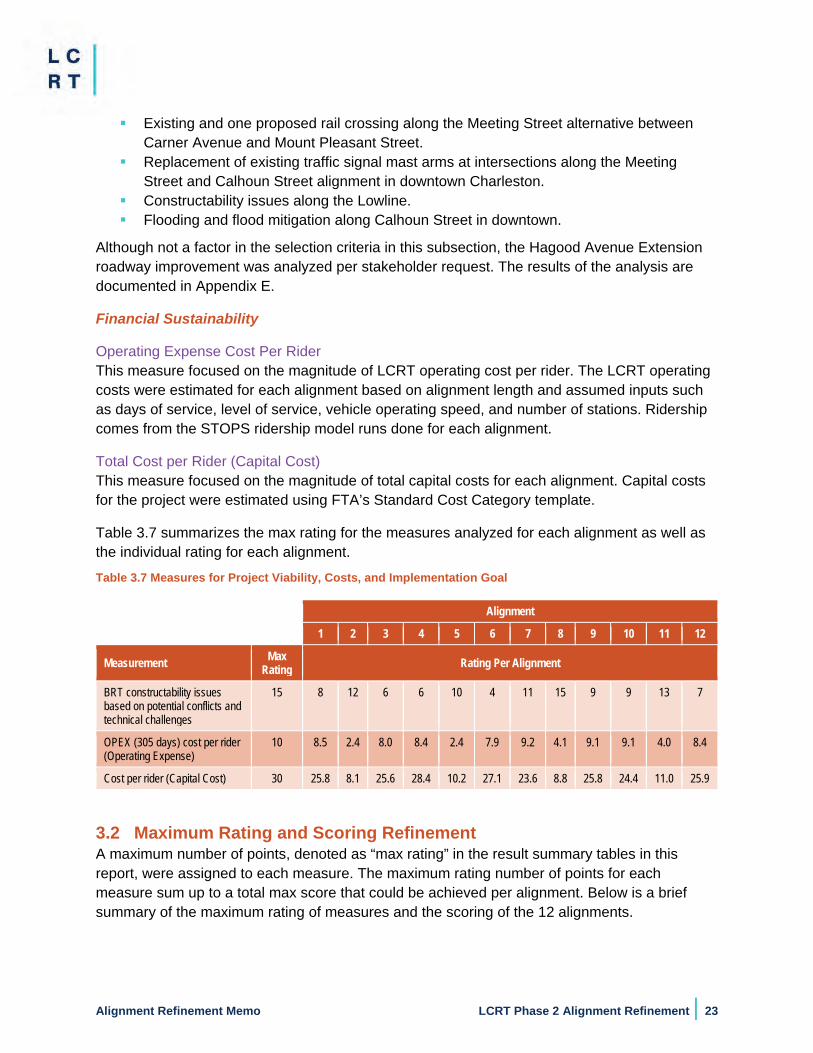
Operating Expense Cost Per Rider This measure focused on the magnitude of LCRT operating cost per rider. The LCRT operating costs were estimated for each alignment based on alignment length and assumed inputs such as days of service, level of service, vehicle operating speed, and number of stations. Ridership comes from the STOPS ridership model runs done for each alignment.
Total Cost per Rider (Capital Cost) This measure focused on the magnitude of total capital costs for each alignment. Capital costs for the project were estimated using FTA’s Standard Cost Category template.
Table 3.7 summarizes the max rating for the measures analyzed for each alignment as well as the individual rating for each alignment. Table 3.7 Measures for Project Viability, Costs, and Implementation Goal
Alignment
1 2 3 4 5 6 7 8 9 10 11 12
Measurement Max Rating Rating Per Alignment
BRT constructability issues based on potential conflicts and technical challenges
15 8 12 6 6 10 4 11 15 9 9 13 7
OPEX (305 days) cost per rider (Operating Expense)
10 8.5 2.4 8.0 8.4 2.4 7.9 9.2 4.1 9.1 9.1 4.0 8.4
Cost per rider (Capital Cost) 30 25.8 8.1 25.6 28.4 10.2 27.1 23.6 8.8 25.8 24.4 11.0 25.9
3.2 Maximum Rating and Scoring Refinement A maximum number of points, denoted as “max rating” in the result summary tables in this report, were assigned to each measure. The maximum rating number of points for each measure sum up to a total max score that could be achieved per alignment. Below is a brief summary of the maximum rating of measures and the scoring of the 12 alignments.
24 | LCRT Phase 2 Alignment Refinement Alignment Refinement Memo
3.2.1 Maximum Rating of Measures The maximum rating developed for each measure to evaluate LCRT alignments is similar to those applied in the CHATS project evaluation criteria and methodology, which were used in evaluating and prioritizing the visionary roadway improvement projects. Variations from the CHATS criteria are due to the purpose and need of this BRT project and the FTA project rating process used to evaluate CIG projects. Established FTA guidelines include an increased level of up-front environmental review during the project development process in order for a project to enter into engineering as part of the competitive CIG program. Although additional emphasis is placed on environmental review, the measures and maximum rating included in the LCRT Phase 2 alignment refinement process incorporate each of the 12 criteria developed for the project evaluation conducted by CHATS.
The measures for this alignment refinement memo were based on the purpose, need, and goals and were scored based on an assessment of their relative value to stakeholders through input gathered since the i-26ALT study and through the current phase of project development. The maximum rating for each measure was based on its prioritization and value under the FTA CIG rating criteria. The maximum rating was assigned by giving a higher maximum possible score to measures with greater priority, and a lower maximum possible score to measures with lesser priority. The maximum rating per LCRT goal is as follows: promote livable, transit-oriented development (20 points); create multimodal system and travel choice (30 points); preserve a healthy environment (110 points); improve local, regional mobility, transit efficiency, and quality of service (50 points); support economic development plans along the corridor (85 points); project viability, costs, and implementation (55 points). Although a single LCRT goal is noted as a mobility measure, in reality mobility measures are contained in other LCRT goals such as supporting economic development plans along the corridor. For example, total employment densities can be supportive to mobility goals as an alignment can connect residents to an area that has a higher job density. The maximum rating demonstrates the focus of the project is on the improvements to the community first while balancing the highest priority criteria of the FTA CIG program. These maximum rating scores ranged from 5 to 30 across each measure and resulted in a total possible score of 350 points, see Appendix F, Evaluation Matrix, for the detailed breakdown of the maximum rating per measure.
3.2.2 Scoring of Measures Once the maximum rating for each measure was defined, each alignment was scored. These scores were based on the value of each alignment’s performance on each measure, for example, potential ridership. The analysis used both quantitative and qualitative measures based on data availability. Qualitative measures received a preliminary score based on individual assessments, while quantitative measures were assessed based on their direct numerical performance, such as total cost. The score for each measure was based on interpolating along a trend line generated by assigning scores to the average value for that criteria and to the values one and two standard deviations away from the average. The average measure value was set to correspond with 60 percent of the highest rated score. Measure values equal to or greater than one standard deviation higher than the average for that measure corresponded to the highest rated score. A measure value one standard deviation below the
Alignment Refinement Memo LCRT Phase 2 Alignment Refinement Results | 25
average corresponded to 40 percent of the highest max rating, and a value two standard deviations below the average corresponded to 20 percent of the highest score. Beyond two standard deviations below the average, the maximum rating went toward zero. The purpose of this methodology was to limit the qualitative subjectivity. Using a method of trend analysis gives repeatability for each of the measures. All but one of the measures, constructability, implemented a value-based comparison. By using the 60, 40, and 20 percent correlations, the method attempted to cause measures above one standard deviation to be less impactful to the score, but measures below one standard deviation to demonstrate a significant loss of points.
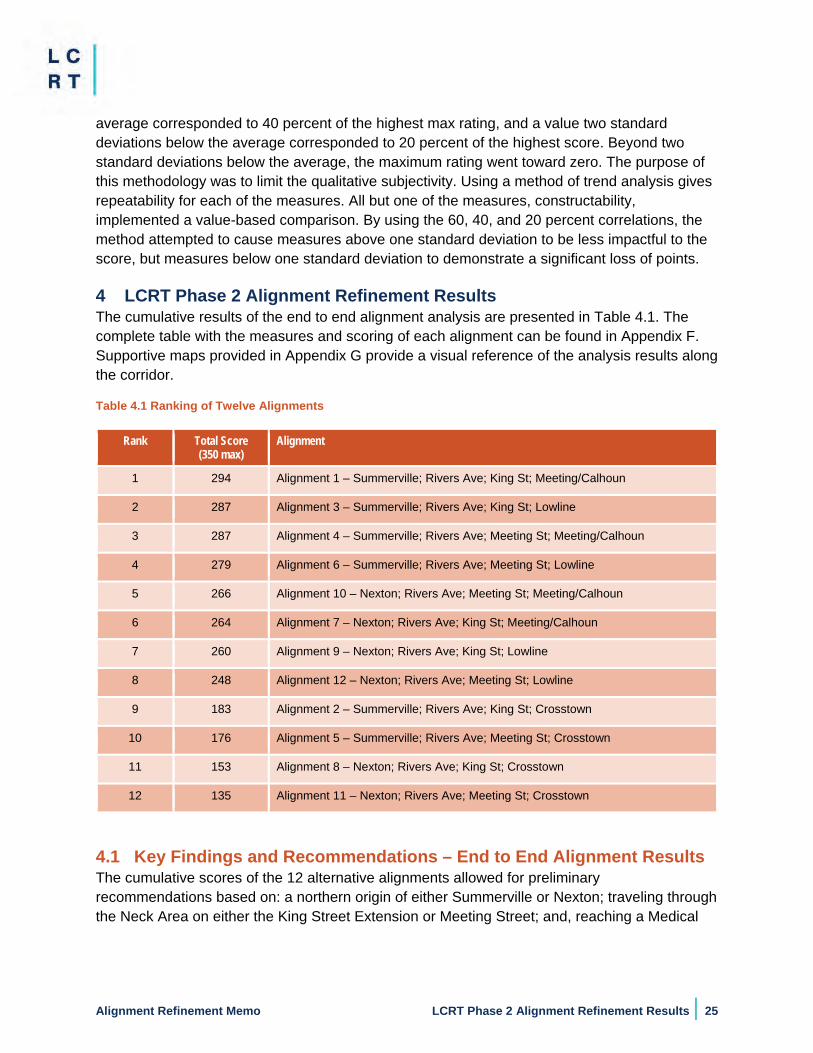
4 LCRT Phase 2 Alignment Refinement Results The cumulative results of the end to end alignment analysis are presented in Table 4.1. The complete table with the measures and scoring of each alignment can be found in Appendix F. Supportive maps provided in Appendix G provide a visual reference of the analysis results along the corridor.
Table 4.1 Ranking of Twelve Alignments
Rank Total Score (350 max)
Alignment
1 294 Alignment 1 – Summerville; Rivers Ave; King St; Meeting/Calhoun
2 287 Alignment 3 – Summerville; Rivers Ave; King St; Lowline
3 287 Alignment 4 – Summerville; Rivers Ave; Meeting St; Meeting/Calhoun
4 279 Alignment 6 – Summerville; Rivers Ave; Meeting St; Lowline
5 266 Alignment 10 – Nexton; Rivers Ave; Meeting St; Meeting/Calhoun
6 264 Alignment 7 – Nexton; Rivers Ave; King St; Meeting/Calhoun
7 260 Alignment 9 – Nexton; Rivers Ave; King St; Lowline
8 248 Alignment 12 – Nexton; Rivers Ave; Meeting St; Lowline
9 183 Alignment 2 – Summerville; Rivers Ave; King St; Crosstown
10 176 Alignment 5 – Summerville; Rivers Ave; Meeting St; Crosstown
11 153 Alignment 8 – Nexton; Rivers Ave; King St; Crosstown
12 135 Alignment 11 – Nexton; Rivers Ave; Meeting St; Crosstown
4.1 Key Findings and Recommendations – End to End Alignment Results The cumulative scores of the 12 alternative alignments allowed for preliminary recommendations based on: a northern origin of either Summerville or Nexton; traveling through the Neck Area on either the King Street Extension or Meeting Street; and, reaching a Medical
26 | LCRT Phase 2 Alignment Refinement Results Alignment Refinement Memo
District peninsula destination via the Crosstown, the Lowline, or Meeting Street and Calhoun Street. The recommendations are discussed below.
All alignments considered included proposed center running BRT along Rivers Avenue in the center section of the corridor and therefore,did not require further analysis. Based on the Guideway Treatment Analysis memo that was conducted (Appendix B), Rivers Avenue in the center of the corridor contains sufficient ROW to provide a dedicated center-running BRT treatment and will also provide several improvements to address existing safety issues within this portion of the corridor. Further, as development and redevelopment occur, this portion of the corridor will become very important to future operations and reliability of the BRT service. For guideway treatments in other portions of the alignment alternatives please refer to Appendix B.
4.1.1 Recommendation: Elimination of Nexton Alignments (Alignments 7, 8, 9, 10, 11, and 12)
The northern alignment alternatives associated with the Nexton alignments (7, 8, 9, 10, 11, and 12) performed well in terms of fewer historic districts, less impacts to traffic operations, and fewer railroad crossings. These alignment alternatives under-performed compared to Summerville alternatives due to several factors:
• Fewer station areas which results in less land available for redevelopment • Fewer transit-dependent and environmental justice populations served • Fewer transit connections to existing service • Less BRT in dedicated guideway • Fewer population densities and employment areas served • Less overall ridership
For these reasons, the Nexton alignments were eliminated from further consideration.
4.1.2 Recommendation: Selection of Summerville Alignments (Alignment 1, 3, 4, and 6) The northern alignment alternatives associated with the Summerville alignment alternatives 1, 3, 4, and 6, performed the best out of the 12 end-to-end alignments. The key functions that cause Summerville alignment alternatives 1, 3, 4, and 6 to score higher than those alternatives originating in Nexton are:
Connects a high number of transit-dependent neighborhoods High overall ridership Capital cost per rider is competitive as compared to other alignments Operating expenses per rider are low as compared to other alignments Summerville alignments have more miles with service traveling on the local roads than
Nexton alignments which travel on the interstate
4.1.3 Recommendation: Elimination of Crosstown Alignments (Alignment 2 and 5) Summerville alignment alternatives 2 and 5 performed the lowest in comparison to the rest of the Summerville alternatives. Alignment alternatives 2 and 5 traveled along the Crosstown. These Crosstown alignments have existing high traffic volumes and, as such, SCDOT will not approve removal of existing general purpose lanes from this roadway. In addition, there is no
Alignment Refinement Memo LCRT Phase 2 Alignment Refinement Results | 27
directional bias in the traffic volume which would support the reduction of one general purpose lane in order to utilize reversible lanes to maintain existing number of lanes in peak hour travel direction. Furthermore, due to the narrow existing ROW, dedicated guideways would require additional ROW purchase. Due to the close proximity of buildings to the existing ROW, acquisition of additional ROW would result in the displacement of these buildings. The number of displacements would be deemed impactful to buildings and area residents and expensive to the extent that the project could not support such impacts. Therefore, the selected method of accommodating BRT on this corridor has been considered to be mixed traffic. The primary advantage of the Crosstown alignment is the ability to bypass downtown traffic using an elevated connection to the I-26 freeway network and therefore would offer some benefits such as lower total trip time. It also bypasses a known flooding issue along Calhoun Street and bypasses downtown traffic from the Medical District to Mt. Pleasant Street. However, it underperformed compared to other alignments due to several factors:
Less re-developable acres than the top performing alignments Lower overall station accessibility compared to the top performing alignments Fewer transit dependent and environmental justice populations Fewer transit connections to existing service Less BRT in dedicated guideway Fewer population and employment densities served Lower overall ridership than the top performing alignments
For these reasons, these Crosstown alternatives were eliminated from further consideration in the alignment recommendation.
4.2 Further Alignment Refinement Analysis (Alternatives 1, 3, 4, 6) As noted above, based on the findings of the cumulative scores of the 12 alignment alternatives, eight of the 12 end-to-end alignments were eliminated. Alignments 1, 3, 4, and 6 are the remaining alignment alternatives and required further analysis both in the Neck Area of the corridor and in the Peninsula/Downtown portion. Alignment alternatives 1 and 4 have two roadway travel options in the Neck Area: traveling on the King Street Extension or on Meeting Street.
4.2.1 Recommendation: Elimination of Lowline Alternatives in the Peninsula Area (Alignments 3 and 6)
The remaining end-to-end alignment alternatives included alignments 3 and 6 utilizing the Lowline in the Peninsula. The Lowline alignment would utilize a city-owned abandoned rail line and create a new, integrated transit and a bike/pedestrian connection to downtown using a bi-directional dedicated BRT lane. While this new connection would not impact existing traffic patterns or parking in the downtown area, several factors determined the decision to eliminate the Lowline alternatives, including:
Long-term master plans include rebuilding this corridor as a park facility with a bicycleand pedestrian focus rather than transit-based focus. While these projects are not yetfunded, community and stakeholder input through the development of the project
28 | LCRT Phase 2 Alignment Refinement Results Alignment Refinement Memo
determined these master planning efforts are an important element in regional master planning activities and, therefore; the Lowline should be retained for that use.
Through additional conversations with the Lowline team, it was requested that if the BRT were to travel in the Lowline alignment the BRT vehicle speeds be capped at 15 mph for bike/pedestrian safety; the 15 mph was slower than estimated for the analysis in this memo. This speed change reduced the estimated advantage of the vehicle traveling in the Lowline versus Meeting/Calhoun alignment. The speed capping would result in slower vehicle speed, limit ability to improve frequency, and limit future system expansion for additional BRT lines using the alignment.
As a former freight rail corridor there is an anticipated existence of hazardous material that may require additional funds for remediation.
4.2.2 King Street Extension (Alignment 1) Similar to Route 78 near Summerville, the King Street Extension is a two-lane local roadway. If this alignment is considered, mixed traffic operations is most appropriate and recommended for the LCRT. While only one railroad crossing occurs along King Street, the relative population and employment densities suggest an investment in BRT on King Street Extension will yield limited ridership productivity but greater travel time reliability. The presence of an elevated I-26 and adjacent railway lines limits the constructability of neighboring lands. There are no anticipated residential or business relocation impacts for the King Street Extension section. The King Street Extension alignment avoids impacting the proposed Mary Davis Memorial park that the Lowcountry Alliance for Model Communities (LAMC) organization has received an Environmental Protection Agency (EPA) grant to build along Meeting Street (the proposed park is bound Meeting Street to the east, Hackemann Avenue to the north, the railroad tracks to the west, and the port access bridge to the south). The local community, which is predominantly an Environmental Justice community, has expressed that the King Street Extension is their preferred alignment as a safer alternative to the Meeting Street alignment. In addition, Alignment 1 proposes a pedestrian bridge to connect King Street Extension to communities along Meeting Street. The pedestrian bridge would provide access for transit dependent populations to cross the road safely and also to connect to the BRT.
4.2.3 Meeting Street (Alignment 4) The cross-section of Meeting Street is similar to the northern and southern portions of Rivers Avenue. Portions of Meeting Street narrow, eliminating the two-way left turn lane common in other locations along the corridor. The street has significant redevelopment and urban intensification opportunities with several environmental justice neighborhoods. Building footprints are often set back from the roadway and fronted by parking. The alignment abuts to and can impact the proposed Mary Davis Memorial park. If this alignment is considered, an exclusive center running alignment with grade crossings is recommended. With three at-grade railroad crossings along this alignment, delay is expected to impact the reliability of BRT vehicles. It is noted that grade separation would have significant costs requiring a commitment of additional capital expenditure and would have environmental impacts to adjacent residential and business parcels requiring relocation.
Alignment Refinement Memo LCRT Phase 2 Alignment Refinement Results | 29
4.2.4 Recommendation: Elimination of Meeting Street and Selection of King Street Extension
It is recommended the LCRT operate on King Street Extension in mixed traffic due to several factors:
The Meeting Street section would have environmental impacts to adjacent residential and business parcels requiring relocation, the King Street Extension would not result in impacts requiring relocation.
The crossing adjacent to Cunnington Avenue, along the Meeting Street section, is constrained by the location of the Bethany Cemetery. This cemetery is a potentially eligible Section 4(f) resource; the footprint of the Meeting Street bridge and associated general purpose lanes would potentially encroach into the boundary of the cemetery.
As observed in CARTA bus delay data, due to existing train traffic at three separate rail crossings on Meeting Street, grade separation would be required at each crossing in order to maintain BRT travel times. These grade separations have projected costs in excess of $80 million and would involve significant coordination with the railroad owners for right-of-way access, design review, and construction scheduling – impacting the overall LCRT BRT project schedule.
Operating along King Street Extension in mixed traffic demonstrates minimal impacts to travel time.
Growth along King Street is expected to increase due to Magnolia and several smaller developments, but traffic through the corridor is not over-capacity.
The King Street Extension alignment avoids impacting the proposed Mary Davis Memorial park.
The local community in the Neck Area has expressed that the King Street Extension is their preferred alignment.
Along King Street Extension, the intersection at Mt. Pleasant Street and King Street, the railroad crossing at Hackemann Avenue, and the railroad crossing at Discher Street show traffic congestion due to increased traffic and rail events. Spot queue jump lanes and queue bypasses would be implemented at these locations in order to address this congestion.
Additional analysis of travel time, delay, and grade separation associated with King Street Extension and Meeting Street sections is included in Appendix B, Attachment C.
Continuing south along the King Street Extension, the LCRT alignment connects to Mt. Pleasant Street and continues further south on Meeting Street then west on Calhoun Street to connect to the Medical District. This Meeting Street/Calhoun Street portion of the alignment would provide a combination of curb-side mixed traffic and reversible peak-hour BRT lane configurations to provide the greatest transit speed and reliability improvements in this area of the corridor while also working within limited ROW. While this alignment would require some removal of on-street parking to accommodate a peak-hour reversible lane, the reversible lane is needed to provide transit time and reliability improvements in the Peninsula and downtown portion of the corridor. Without these changes and improvements, travel time and reliability of the BRT would not be
30 | Recommendations and Next Steps Alignment Refinement Memo
enhanced over existing local bus service. As design advances, further block-by-block analysis and coordination with local business owners will help to address specific business owner concerns about delivery and parking needs.
5 Recommendations and Next Steps
5.1 Recommendations Based on the review of the 12 alignments alternatives Alignment 1– Summerville; Rivers Ave; King St; Meeting/Calhoun is recommended. Alignment 1 originates in downtown Summerville at Main Street, travels east on US Alt 17, south on 5th Street, continues south on US 78, continues south on Rivers Avenue/King Street Extension, east on Mt. Pleasant Street, south on Meeting Street, west on Calhoun Street, north on Courtenay Drive, east on Bee Street to a proposed terminus near the Medical District. However, with additional capital expenditures to overcome constraints, Alignment 4 (traveling along Meeting Street in the Neck Area) may be a viable operating alternative; see section 5.2 for additional information.
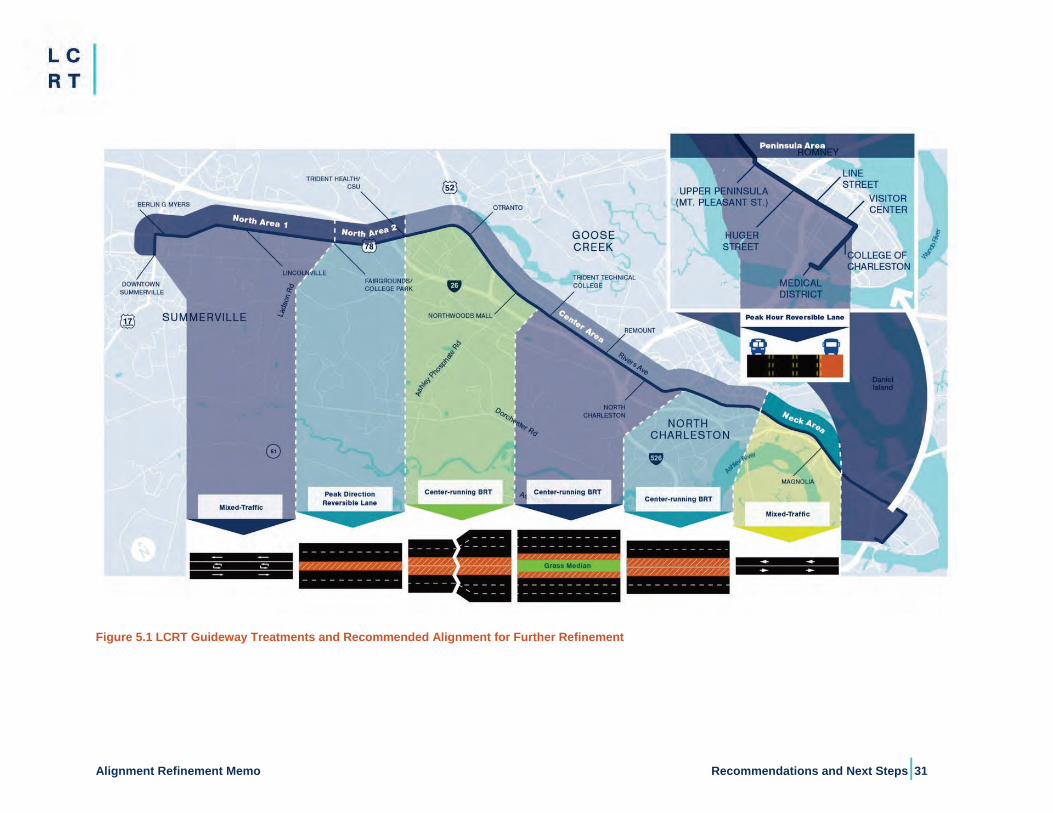
Based on the running way treatment analysis noted in section 4.1.4, the recommended treatment for Alignment 1 is depicted on Figure 5.1 and further detailed in Appendix B.
Alignment Refinement Memo Recommendations and Next Steps|31
Figure 5.1 LCRT Guideway Treatments and Recommended Alignment for Further Refinement
32 | Recommendations and Next Steps Alignment Refinement Memo
5.2 Next Steps The alignment refinement analysis is a critical step in the LCRT BRT project development phase, but there is still work to be done to finalize the project definition. Alignment 1 recommended in this memo will be refined in the next steps of project development to finalize the project termini, station locations, and remaining details of the LPA that will advance through the NEPA analysis.
The alignment and other aspects of the LPA will be subject to more advanced engineering and design decisions. Station locations will continue to be refined through the transit-oriented development study and design process with the general number and locations established to define the LPA.
The existing and subsequent analysis on the recommended alignment, running way, and stations will inform the project definition necessary to initiate environmental review under NEPA. As more detailed environmental analysis and design continues in the NEPA process, more detailed information regarding traffic impacts, parking impacts, and potential mitigation will be further discussed with municipal and roadway operating agencies.
For project definition, FTA requires identification of mode and alignment, as well as a reasonable financial plan that demonstrates design, construction, and operation capacity in the plan. Station locations and costs can change, as long as the funding can support future modifications. As the LCRT project moves through project refinement, a final project definition will be developed for submission to the FTA CIG program. Several key project definition items will be addressed through ongoing project refinement, stakeholder coordination, and public engagement. Key items include, but are not limited to:
An operations plan that refines the LCRT BRT level of service, vehicle capacity, number and location of stations, and total alignment length.
Design guideway treatments for pending alignment areas, intersection geometry, access management, parking plan, utility and railroad coordination.
Design such as the roadway plan, which will be developed to a 30 percent level for FTA CIG submittal, detailed concept plans for the final alignment, and station architecture concept design.
5790 Casper Padgett Way, North Charleston, SC 29406
Tel: 843.529.0400 Fax: 843.529.0305.
Appendix A: Phase 2 Alignment Refinement Criteria & MeasuresLowcountry Rapid Transit
Berkeley-Charleston-Dorchester Council of Governments
August 10, 2020
Alignment Refinement Memo Phase 2 Alignment Refinement Criteria and Measures | A.i
Contents A. Phase 2 Alignment Refinement Criteria and Measures ..................................................... A.1
A.1 Criteria ........................................................................................................................ A.1
A.2 Measures .................................................................................................................... A.3
A.2.1 LCRT Goal: Promote Livable, Transit-oriented Development ............................. A.3
A.2.2 Create Multimodal System; Travel Choice .......................................................... A.7
A.2.3 Bicycle, Pedestrian and Persons with Limited Mobility Connectivity ................... A.7
A.2.4 Preserve a Healthy Environment ......................................................................... A.7
A.2.5 Improve Local, Regional Mobility, Transit Efficiency, and Quality of Service ...... A.8
A.2.6 Support Economic Development Plans Along the Corridor ............................... A.13
A.2.7 Project Viability, Costs, and Implementation ..................................................... A.14
A.3 Maximum Rating and Scoring Refinement ............................................................... A.17
A.3.1 Maximum Rating of Measures ........................................................................... A.17
A.3.2 Scoring of Measures ......................................................................................... A.18
A.4 End-To End Alignment Evaluation ............................................................................ A.20
Tables
Table A.1 LCRT Goals, Evaluation Criteria, and Measurements .............................................. A.2 Table A.2 Station Area Redevelopment Potential – Commercial Uses .................................... A.3 Table A.3 Station Area Redevelopment Potential – Building Age ............................................ A.4 Table A.4 Station Area Redevelopment Potential – Residential Land Uses ............................. A.4 Table A.5 Span of Service by Time Period ............................................................................. A.11 Table A.6 Frequency by Time Period and Day of Week ......................................................... A.12
Figures
Figure A.1 LCRT Revised Station Areas .................................................................................. A.6 Figure 1.2 Downtown Charleston Flooding Typical Areas ...................................................... A.16 Figure 1.3 Example of Score to Demonstrate Standard Deviation ......................................... A.19
Alignment Refinement Memo Phase 2 Alignment Refinement Criteria and Measures | A.1
A. Phase 2 Alignment Refinement Criteria and Measures This appendix summarizes the process taken and measures selected to perform the analysis to refine the 12 alignment options from the Phase 1 effort to a single alignment option. Note that the single alignment option will be further analyzed and refined in subsequent LCRT steps.
The process undertaken is as follows:
Defined evaluation categories to align with project goals/objectives Defined evaluation criteria based on evaluation categories Identified performance measures for each evaluation criteria Determined the calculation for each performance measure Determined the value of each performance measure for each alignment Defined weighting for each performance measure Developed weighted score for each performance measure Summarize weighted scores for each alignment for a total alignment score Eliminate lowest performing alignments
A.1 Criteria To conduct the evaluation of the 12 alignments 30 measures were identified based on the goals of the project purpose and need. These measures were chosen on the basis of relevance, importance, FTA criteria, recently completed planning work for the Regional Transit Framework Plan1, industry BRT standards criteria2, and support of the project’s purpose and need.
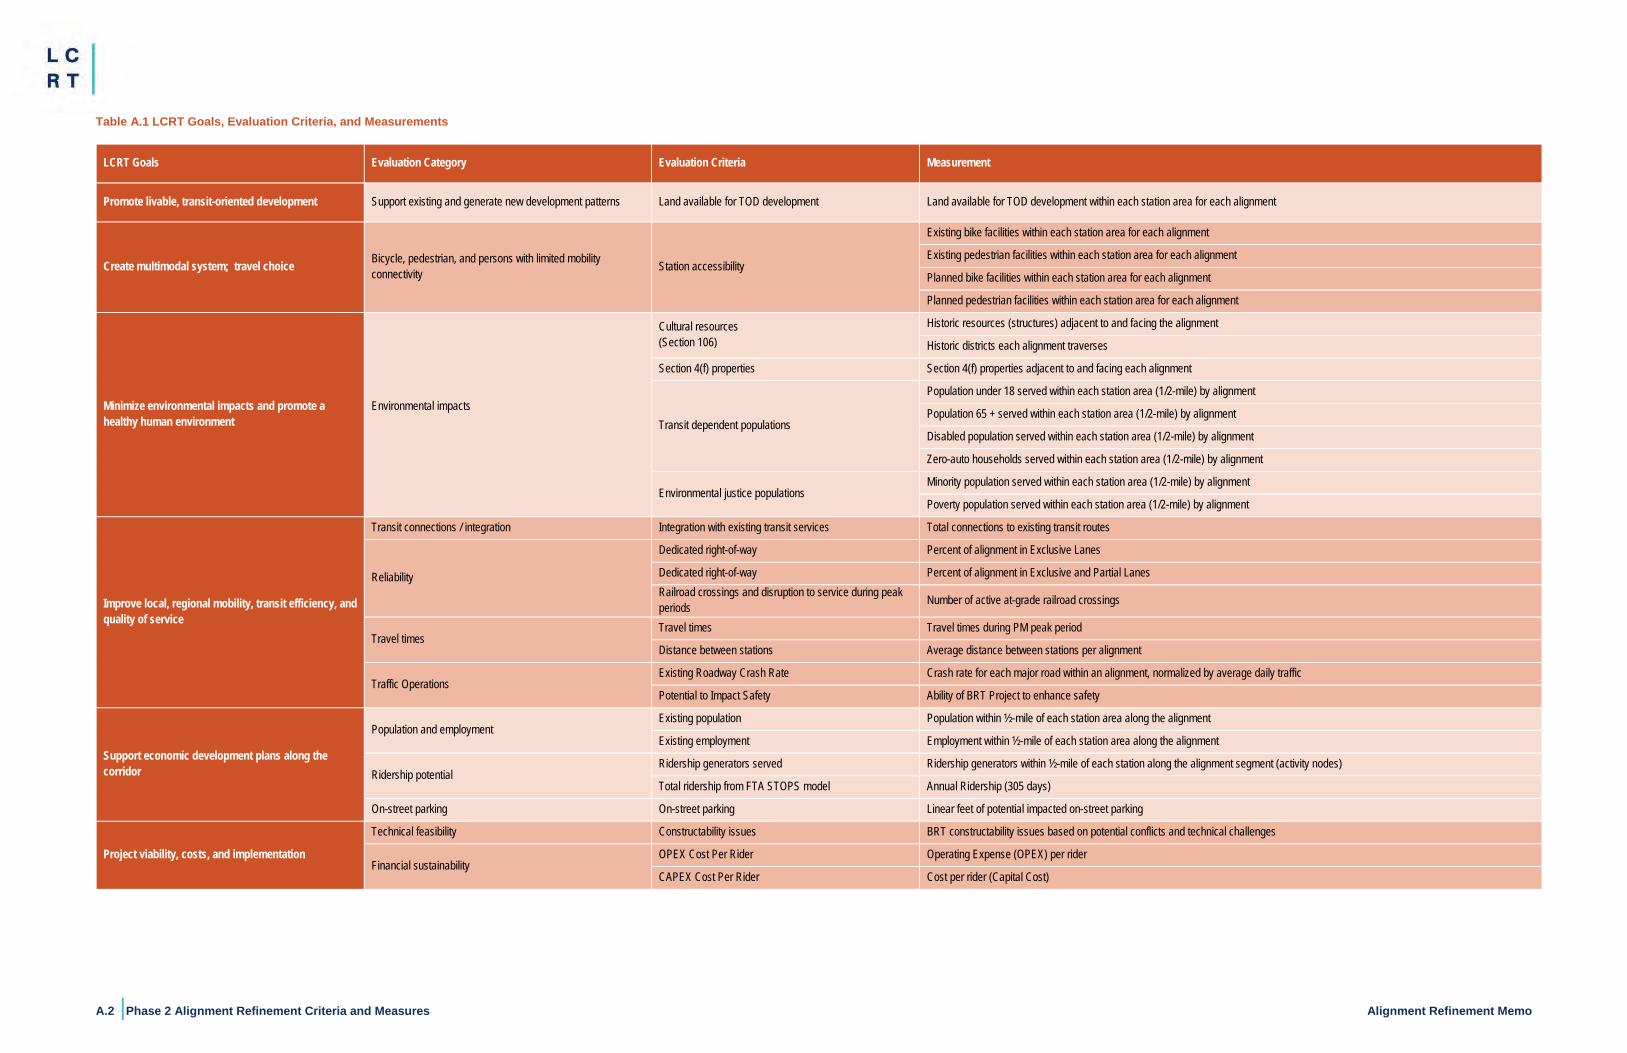
Table A.1 provides a summary of the criteria used to analyze and refine the 12 alignment options identified in Phase 1 of the LCRT project. The maps of the individual alignments and associated stations used for the analysis can be found at the end of this appendix (Appendix A).
1 https://bcdcog.com/transportation-planning/framework/ 2 Institute for Transportation and Development Policy
A.2 |Phase 2 Alignment Refinement Criteria and Measures Alignment Refinement Memo
Table A.1 LCRT Goals, Evaluation Criteria, and Measurements
LCRT Goals Evaluation Category Evaluation Criteria Measurement
Promote livable, transit-oriented development Support existing and generate new development patterns Land available for TOD development Land available for TOD development within each station area for each alignment
Create multimodal system; travel choice Bicycle, pedestrian, and persons with limited mobility connectivity Station accessibility
Existing bike facilities within each station area for each alignment
Existing pedestrian facilities within each station area for each alignment
Planned bike facilities within each station area for each alignment
Planned pedestrian facilities within each station area for each alignment
Minimize environmental impacts and promote a healthy human environment
Environmental impacts
Cultural resources (Section 106)
Historic resources (structures) adjacent to and facing the alignment
Historic districts each alignment traverses
Section 4(f) properties Section 4(f) properties adjacent to and facing each alignment
Transit dependent populations
Population under 18 served within each station area (1/2-mile) by alignment
Population 65 + served within each station area (1/2-mile) by alignment
Disabled population served within each station area (1/2-mile) by alignment
Zero-auto households served within each station area (1/2-mile) by alignment
Environmental justice populations Minority population served within each station area (1/2-mile) by alignment
Poverty population served within each station area (1/2-mile) by alignment
Improve local, regional mobility, transit efficiency, and quality of service
Transit connections / integration Integration with existing transit services Total connections to existing transit routes
Reliability
Dedicated right-of-way Percent of alignment in Exclusive Lanes
Dedicated right-of-way Percent of alignment in Exclusive and Partial Lanes Railroad crossings and disruption to service during peak periods Number of active at-grade railroad crossings
Travel times Travel times Travel times during PM peak period
Distance between stations Average distance between stations per alignment
Traffic Operations Existing Roadway Crash Rate Crash rate for each major road within an alignment, normalized by average daily traffic
Potential to Impact Safety Ability of BRT Project to enhance safety
Support economic development plans along the corridor
Population and employment Existing population Population within ½-mile of each station area along the alignment
Existing employment Employment within ½-mile of each station area along the alignment
Ridership potential Ridership generators served Ridership generators within ½-mile of each station along the alignment segment (activity nodes)
Total ridership from FTA STOPS model Annual Ridership (305 days)
On-street parking On-street parking Linear feet of potential impacted on-street parking
Project viability, costs, and implementation
Technical feasibility Constructability issues BRT constructability issues based on potential conflicts and technical challenges
Financial sustainability OPEX Cost Per Rider Operating Expense (OPEX) per rider
CAPEX Cost Per Rider Cost per rider (Capital Cost)
Alignment Refinement Memo Phase 2 Alignment Refinement Criteria and Measures|A.3
A.2 Measures The subsequent text provides information for each evaluation measure; with each measure grouped by the goals of the LCRT’s purpose and need. This refinement screening is based on the best available information at the time. Additional analysis will be done as part of the overall LCRT process on the single refined alignment, for example, refining the length of the single alignment and narrowing down the total number of station areas in order to make the LCRT a competitive project in the FTA CIG rating criteria.
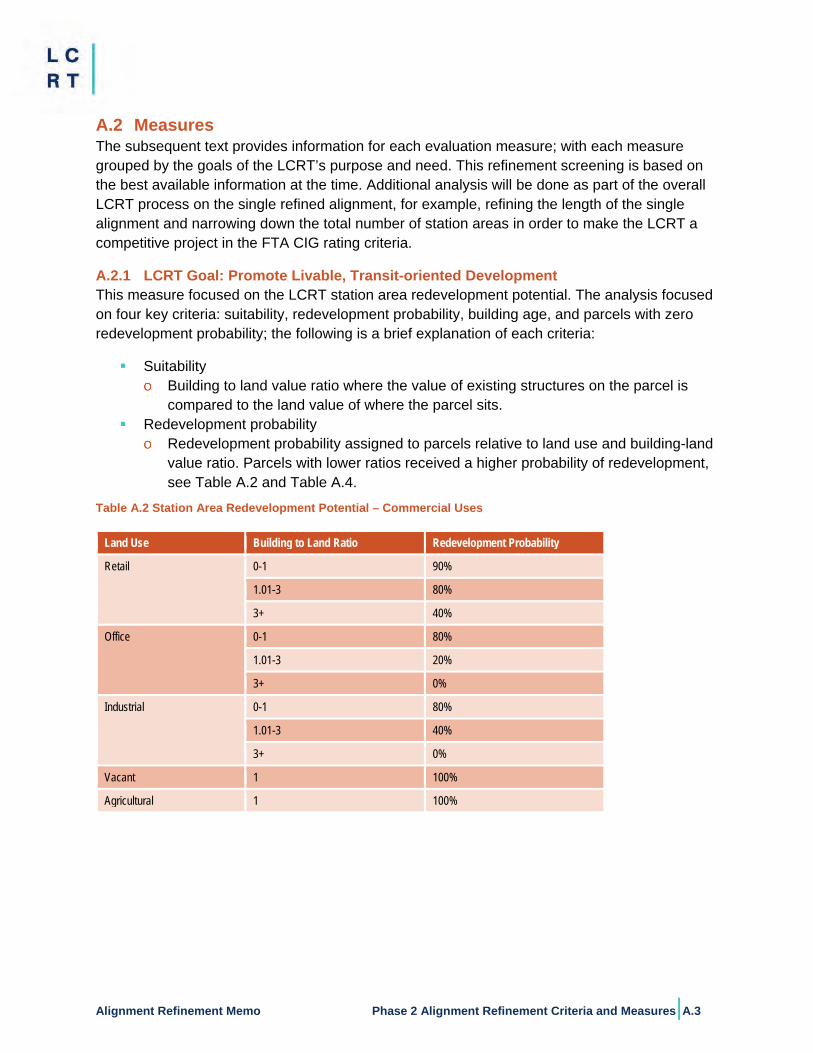
A.2.1 LCRT Goal: Promote Livable, Transit-oriented Development This measure focused on the LCRT station area redevelopment potential. The analysis focused on four key criteria: suitability, redevelopment probability, building age, and parcels with zero redevelopment probability; the following is a brief explanation of each criteria:
Suitability Building to land value ratio where the value of existing structures on the parcel is
compared to the land value of where the parcel sits. Redevelopment probability
Redevelopment probability assigned to parcels relative to land use and building-land value ratio. Parcels with lower ratios received a higher probability of redevelopment, see Table A.2 and Table A.4.
Table A.2 Station Area Redevelopment Potential – Commercial Uses
Land Use Building to Land Ratio Redevelopment Probability
Retail 0-1 90%
1.01-3 80%
3+ 40%
Office 0-1 80%
1.01-3 20%
3+ 0%
Industrial 0-1 80%
1.01-3 40%
3+ 0%
Vacant 1 100%
Agricultural 1 100%
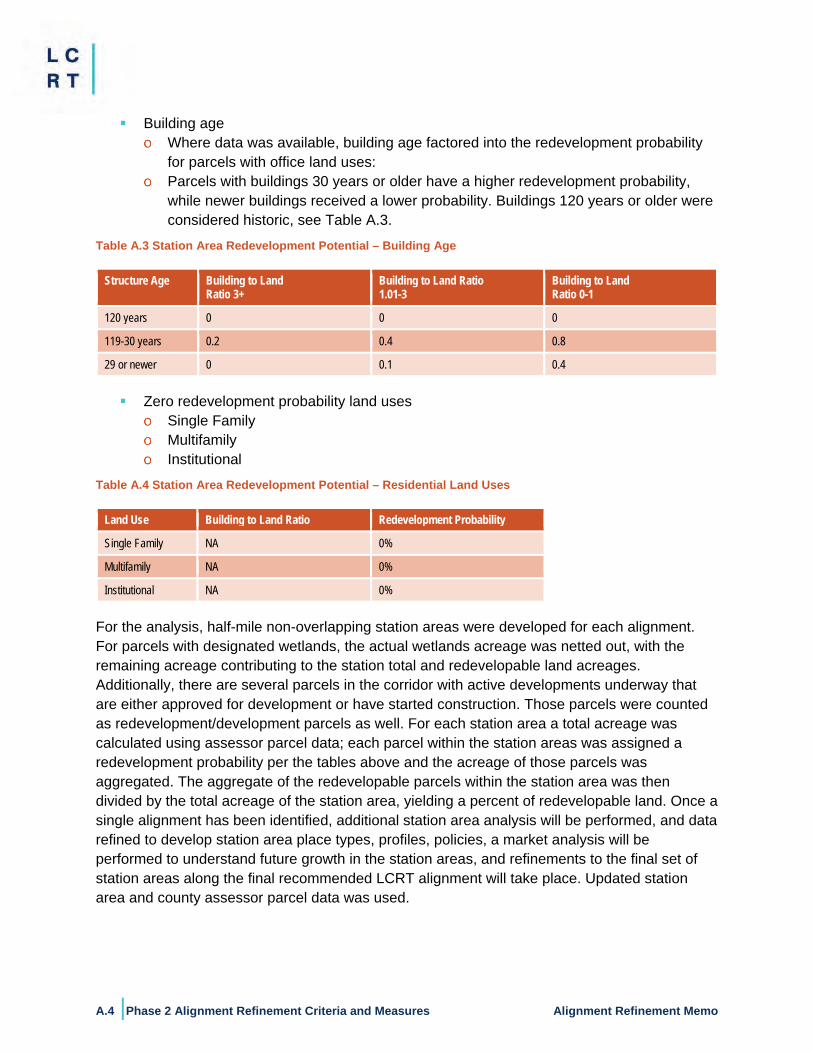
A.4 |Phase 2 Alignment Refinement Criteria and Measures Alignment Refinement Memo
Building ageWhere data was available, building age factored into the redevelopment probability for parcels with office land uses: Parcels with buildings 30 years or older have a higher redevelopment probability, while newer buildings received a lower probability. Buildings 120 years or older were considered historic, see Table A.3.
Table A.3 Station Area Redevelopment Potential – Building Age
Structure Age Building to Land Ratio 3+
Building to Land Ratio 1.01-3
Building to Land Ratio 0-1
120 years 0 0 0
119-30 years 0.2 0.4 0.8
29 or newer 0 0.1 0.4
Zero redevelopment probability land usesSingle Family Multifamily Institutional
Table A.4 Station Area Redevelopment Potential – Residential Land Uses
Land Use Building to Land Ratio Redevelopment Probability
Single Family NA 0%
Multifamily NA 0%
Institutional NA 0%
For the analysis, half-mile non-overlapping station areas were developed for each alignment. For parcels with designated wetlands, the actual wetlands acreage was netted out, with the remaining acreage contributing to the station total and redevelopable land acreages. Additionally, there are several parcels in the corridor with active developments underway that are either approved for development or have started construction. Those parcels were counted as redevelopment/development parcels as well. For each station area a total acreage was calculated using assessor parcel data; each parcel within the station areas was assigned a redevelopment probability per the tables above and the acreage of those parcels was aggregated. The aggregate of the redevelopable parcels within the station area was then divided by the total acreage of the station area, yielding a percent of redevelopable land. Once a single alignment has been identified, additional station area analysis will be performed, and data refined to develop station area place types, profiles, policies, a market analysis will be performed to understand future growth in the station areas, and refinements to the final set of station areas along the final recommended LCRT alignment will take place. Updated station area and county assessor parcel data was used.
Alignment Refinement Memo Phase 2 Alignment Refinement Criteria and Measures|A.5
The station areas used for this analysis came from the updated set of station areas from the LCRT Phase 2 effort. In September 2019 the LCRT TOD study was initiated. The purpose of the study, with community and stakeholder outreach and support, is to identify new and/or refine previously identified LCRT station areas within the LCRT corridor, develop station area place types, profiles, policies, perform a market analysis to understand future growth in the station areas, and refine the final set of station areas along the final recommended LCRT alignment.
Through stakeholder engagement, public workshops, and key informant interviews the TOD study refined several station areas from the initial set of stations identified in the LCRT Phase 1 effort. In January 2020, the LCRT TOD team presented the stakeholder and public engagement work completed to date and coordinated with various LCRT project discipline tasks and BCDCOG staff to further refine the station areas that will be analyzed as part of the TOD study and alignment analysis. Currently 27 station areas are recommended to move forward for additional analysis. Figure A.1 shows the revised station areas. The final set of stations will be refined and documented through the NEPA process being completed for the project and identified in the Project Definition of the Federal Transit Administration (FTA) Capital Investment Grant (CIG) program submittal.
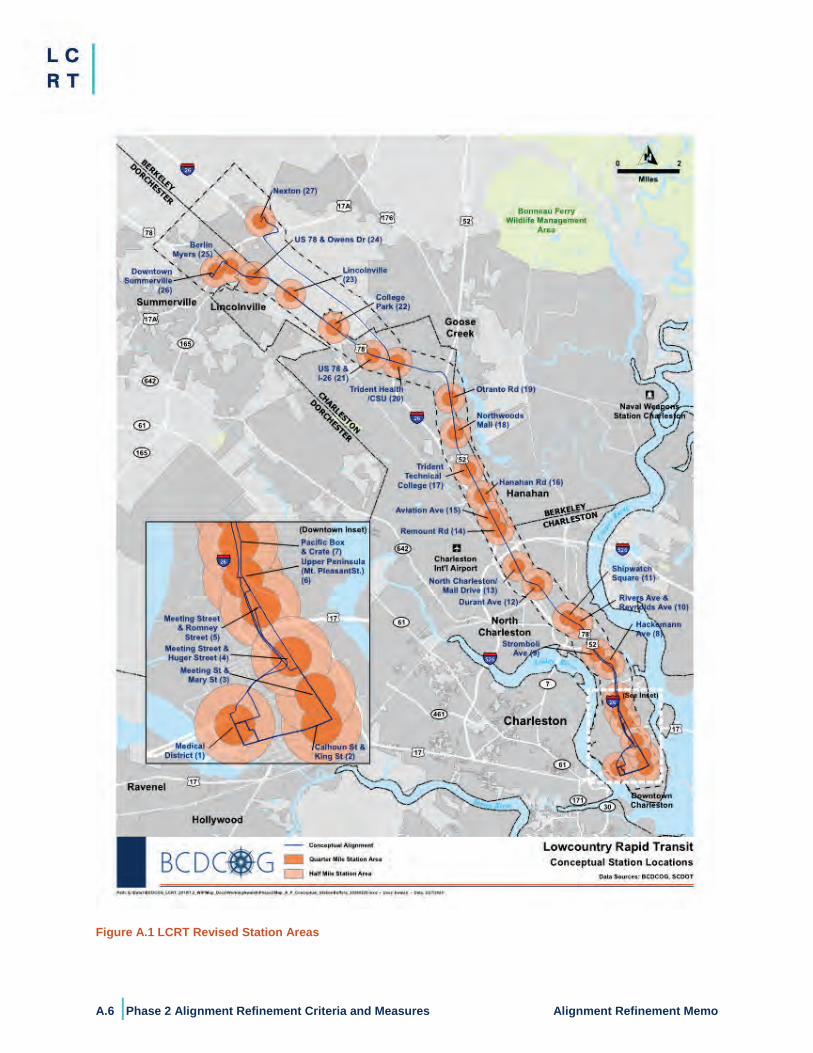
A.6 |Phase 2 Alignment Refinement Criteria and Measures Alignment Refinement Memo
Figure A.1 LCRT Revised Station Areas
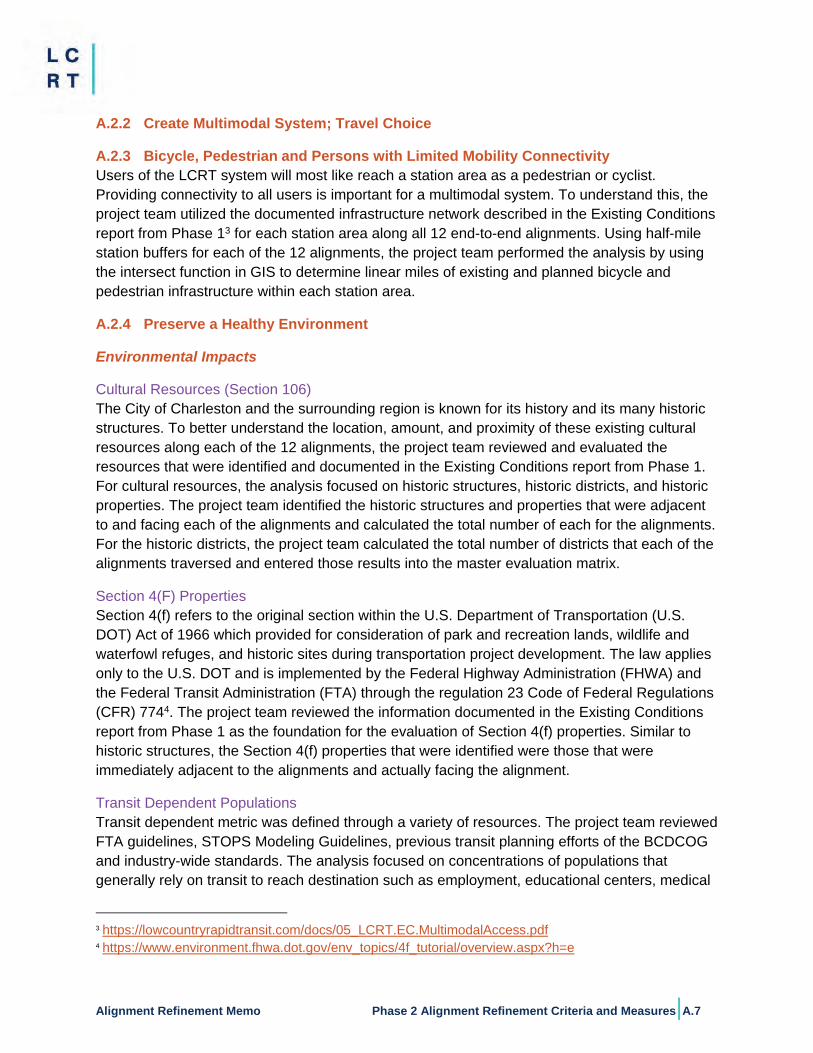
Alignment Refinement Memo Phase 2 Alignment Refinement Criteria and Measures|A.7
A.2.2 Create Multimodal System; Travel Choice
A.2.3 Bicycle, Pedestrian and Persons with Limited Mobility Connectivity Users of the LCRT system will most like reach a station area as a pedestrian or cyclist. Providing connectivity to all users is important for a multimodal system. To understand this, the project team utilized the documented infrastructure network described in the Existing Conditions report from Phase 13 for each station area along all 12 end-to-end alignments. Using half-mile station buffers for each of the 12 alignments, the project team performed the analysis by using the intersect function in GIS to determine linear miles of existing and planned bicycle and pedestrian infrastructure within each station area.
A.2.4 Preserve a Healthy Environment
Environmental Impacts
Cultural Resources (Section 106) The City of Charleston and the surrounding region is known for its history and its many historic structures. To better understand the location, amount, and proximity of these existing cultural resources along each of the 12 alignments, the project team reviewed and evaluated the resources that were identified and documented in the Existing Conditions report from Phase 1. For cultural resources, the analysis focused on historic structures, historic districts, and historic properties. The project team identified the historic structures and properties that were adjacent to and facing each of the alignments and calculated the total number of each for the alignments. For the historic districts, the project team calculated the total number of districts that each of the alignments traversed and entered those results into the master evaluation matrix.
Section 4(F) Properties Section 4(f) refers to the original section within the U.S. Department of Transportation (U.S. DOT) Act of 1966 which provided for consideration of park and recreation lands, wildlife and waterfowl refuges, and historic sites during transportation project development. The law applies only to the U.S. DOT and is implemented by the Federal Highway Administration (FHWA) and the Federal Transit Administration (FTA) through the regulation 23 Code of Federal Regulations (CFR) 7744. The project team reviewed the information documented in the Existing Conditions report from Phase 1 as the foundation for the evaluation of Section 4(f) properties. Similar to historic structures, the Section 4(f) properties that were identified were those that were immediately adjacent to the alignments and actually facing the alignment.
Transit Dependent Populations Transit dependent metric was defined through a variety of resources. The project team reviewed FTA guidelines, STOPS Modeling Guidelines, previous transit planning efforts of the BCDCOG and industry-wide standards. The analysis focused on concentrations of populations that generally rely on transit to reach destination such as employment, educational centers, medical
3 https://lowcountryrapidtransit.com/docs/05_LCRT.EC.MultimodalAccess.pdf 4 https://www.environment.fhwa.dot.gov/env_topics/4f_tutorial/overview.aspx?h=e
A.8 |Phase 2 Alignment Refinement Criteria and Measures Alignment Refinement Memo
appointments, and shopping. Transit dependent analysis focused on concentrations of populations within a half-mile of each station area. For this effort transit dependent populations are defined as those populations under 18, elderly individuals 65+, disabled individuals and those with limited mobility, and households without an automobile. Individuals under 18 years of age are typically more reliant on transit services as they may not be licensed to drive and/or lack access to a private vehicle. Individuals over the age of 64 years of age are more likely to have mobility limitations and thus rely on alternative transportation modes such as transit to access destinations, especially medical facilities. Persons with disabilities often have mobility limitations and are thus reliant on alternative transportation modes such as transit. Households that lack access to automobiles are forced to use alternative transportation modes such as transit to meet their mobility needs. This analysis used the US Census’ American Community Survey (ACS) data.
Environmental Justice Populations Environmental justice (EJ) populations are defined as those populations that are considered minority and those that are below poverty5. The environmental justice analysis focused on populations within a half-mile of each station area. For the purpose of transportation analysis, the term minority refers to any population that does not identify as non-Hispanic white. Minority populations utilize transit services at higher rates than non-Hispanic white populations. Persons below poverty are less likely to have access to private vehicles and thus have a higher propensity to use transit services. This analysis used American Community Survey (ACS) data.
A.2.5 Improve Local, Regional Mobility, Transit Efficiency, and Quality of Service
Traffic Operations
Existing Roadway Crash Rate Safety along this corridor is a primary concern and a focus point for this project. Areas along the corridor, especially along Rivers Avenue have been identified as having higher-than-average crash rates based on historical crash data. For this measure, the analysis focused on weighted crash rate per alignment normalized by average daily traffic. The SCDOT process for determining areas of high crash rates which creates a million vehicle miles traveled (MVMT) which is then compared to statewide averages to determine locations of greatest concern as documented in Appendix C of the Existing Conditions report from Phase 16. The crash information was used to better understand the potential for existing crash rates to impact LCRT reliability and user safety. The purpose of this analysis was to establish a linear crash rate for major roads serving the reasonable alternatives. The analysis focused on the crash rate per million vehicle miles traveled (MVMT) weighted by length for each alignment within the following areas of the project:
5 https://www.transit.dot.gov/sites/fta.dot.gov/files/docs/FTA_EJ_Circular_7.14-12_FINAL.pdf 6 https://lowcountryrapidtransit.com/docs/Appendix_C_Safety_and_Operational_Issues_Memo.pdf
Alignment Refinement Memo Phase 2 Alignment Refinement Criteria and Measures|A.9
Summerville to University Boulevard
Via US 78 Via I-26
Rivers Avenue at Cosgrove Avenue to Mount Pleasant Street
Via Rivers Avenue and King Street Via Rivers Avenue and Meeting Street
Mount Pleasant Street to Hospital District
Via I-26 and the Crosstown Via Meeting Street and Calhoun Street Via the Lowline, Meeting Street, and Calhoun Street
The intent of this metric is to quantify recent crash frequency, to help identify those routes which are less likely to jeopardize reliability and rider safety. Five of the seven sections outlined above consist of some or all shared or partially-shared guideway, which will likely be affected by roadway incidents such as crashes. The remaining two sections consist of a dedicated guideway but it is known from crash records that the majority of crashes on King Street and Meeting Street between Rivers Avenue and Mount Pleasant Street took place at intersections. A BRT vehicle in its own lane is still vulnerable to disruptions in travel time at intersections, and therefore, dedicated guideway sections are still susceptible to roadway crash rates.
Potential to Impact Safety This measure focused on identifying if proposed alignment design(s) has the potential to impact pedestrian and motorist safety, with an emphasis on each alignment’s potential to improve conditions. A qualitative score based on potential to improve safety for both pedestrians and motorists was derived.
This metric is selected as a way to equivalently compare each alignment using concepts at the time of the evaluation. The three sections of each alignment which differ are defined in Section 2.5.2.1 which do not differ between alignments, (i.e., Rivers Avenue between University Boulevard and Cosgrove Avenue) are excluded from this analysis, as they would not affect the cumulative score.
Pedestrian safety was based on new signals (especially at locations with a history of pedestrian crashes), the potential to improve pedestrian infrastructure (crosswalks, sidewalks, mid-block crossings), and the potential for median refuges to be installed. Motorist safety was based on new signals (especially at locations with a history of severe or fatal crashes), access control at unsignalized intersections due to medians, and the need for ITS countermeasures to aid in the safe operations and maintenance of the dynamic lanes.
Data used in this evaluation includes the 2015-2019 crash records provided by SCDOT, and best known design concepts at the time of this evaluation. The safety impact potential was scored for each alignment by first sub-dividing each section outlined above into individual
A.10 |Phase 2 Alignment Refinement Criteria and Measures Alignment Refinement Memo
segments characterized by the assumed design concept for each. For more information, see Appendix D. Once sub-divided, each individual roadway segment of the sections defined above was scored qualitatively on a scale of 1 to 5 for both pedestrian safety and motorist safety.
The pedestrian and motorist scores were then added together to create a score between two and 10 for each individual roadway segment. Those scores were aggregated into a section score weighted by segment length for comparing the different alignment options. The score for each comprehensive LCRT alignment alternative was then calculated by summing these weighted average section scores to arrive at a total cumulative alignment score. See Appendix B for a detailed explanation of how these scores were assigned.
For instance, the cumulative alignment score for Alternative 1 is calculated as the sum of the weighted average section scores for the section of US 78 between the interchange with I-26 and US 17A, the section along Rivers Avenue and King St/King St Extension between Cosgrove Avenue and Mount Pleasant Street, and the section downtown along Meeting Street and Calhoun Street between Mount Pleasant Street and the hospital district.
Transit Connections/Integration The LCRT study areas has existing transit service as part of a larger service operation. To maximize the mobility opportunities for the region, the LCRT should integrate into the rest of the public transit network to provide customers convenient and seamless transfers between routes. This convenience saves travel time for the customers. This analysis took the sum of the total number of connections to existing transit routes within the ½-mile of a station area.
Reliability
Dedicated Right-of-Way The goal of the project is to move vehicles efficiently through the corridor, to accomplish this the project is trying to emulate the features of a rail project with guideway features. Specific to BRT and the CIG program for FTA identifies Fixed Guideway BRT where the majority of the corridor (50% or more) operates in a separate, dedicated right-of-way for public transportation use during peak periods. A semi-exclusive guideway includes portions of dedicated guideway and portions of mixed-traffic. The LCRT project must meet the FTA CIG requirement have at least 50 percent or more its operation in a dedicated guideway. Transit reliability and travel time savings can be directly tied to the treatment of the guideway. The project team for this analysis is using two terms exclusive and partial. Locations where the vehicle travels in its own travel lane it is exclusive. If there is a time dependent aspect where the BRT lane only operates in a direction during a peak hour then it is defined as partial. To complete this analysis, the project team utilized the percent of each alignment in exclusive and partially exclusive guideway.
Railroad Crossings and Disruption to Service during Peak Periods The Charleston region has seen and continues to see sustained growth. Part of that growth includes a very active port system. The Port of Charleston is one of the largest ports in the country and many freight trains come in and out of the Port. There are several very active railroads along this corridor. The activity along each of these lines can have a negative impact
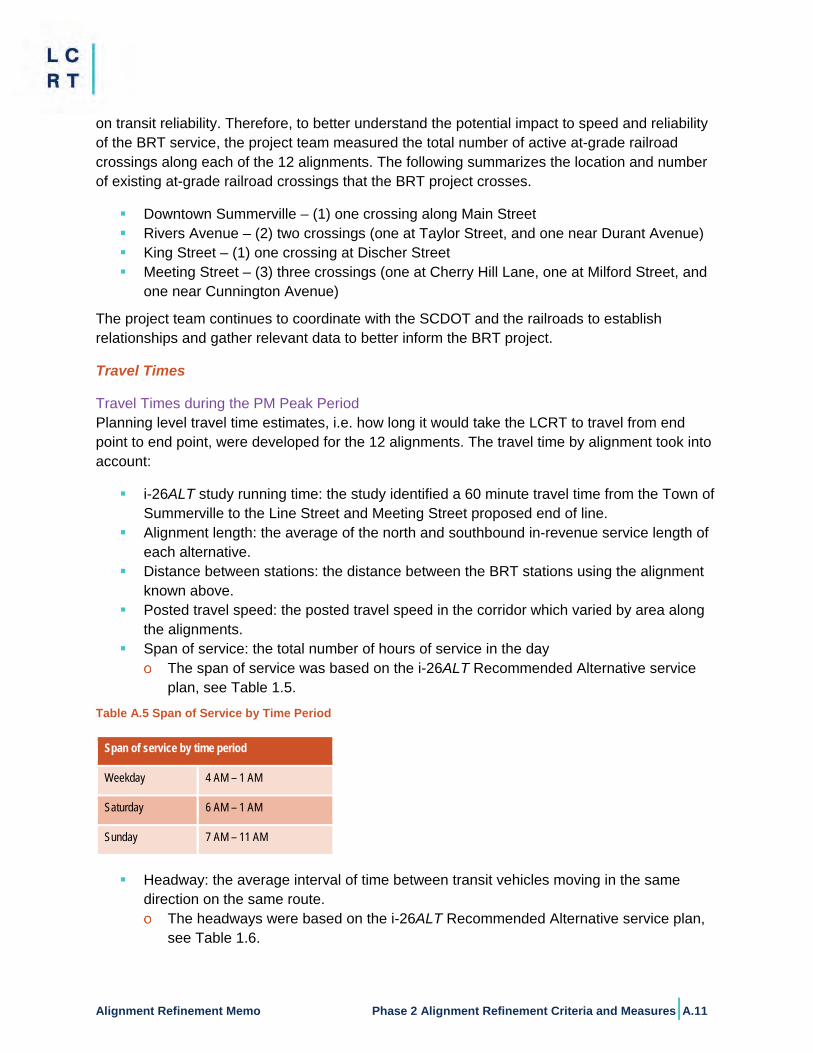
Alignment Refinement Memo Phase 2 Alignment Refinement Criteria and Measures|A.11
on transit reliability. Therefore, to better understand the potential impact to speed and reliability of the BRT service, the project team measured the total number of active at-grade railroad crossings along each of the 12 alignments. The following summarizes the location and number of existing at-grade railroad crossings that the BRT project crosses.
Downtown Summerville – (1) one crossing along Main Street Rivers Avenue – (2) two crossings (one at Taylor Street, and one near Durant Avenue) King Street – (1) one crossing at Discher Street Meeting Street – (3) three crossings (one at Cherry Hill Lane, one at Milford Street, and
one near Cunnington Avenue)
The project team continues to coordinate with the SCDOT and the railroads to establish relationships and gather relevant data to better inform the BRT project.
Travel Times
Travel Times during the PM Peak Period Planning level travel time estimates, i.e. how long it would take the LCRT to travel from end point to end point, were developed for the 12 alignments. The travel time by alignment took into account:
i-26ALT study running time: the study identified a 60 minute travel time from the Town of Summerville to the Line Street and Meeting Street proposed end of line.
Alignment length: the average of the north and southbound in-revenue service length of each alternative.
Distance between stations: the distance between the BRT stations using the alignment known above.
Posted travel speed: the posted travel speed in the corridor which varied by area along the alignments.
Span of service: the total number of hours of service in the day The span of service was based on the i-26ALT Recommended Alternative service
plan, see Table 1.5. Table A.5 Span of Service by Time Period
Span of service by time period
Weekday 4 AM – 1 AM
Saturday 6 AM – 1 AM
Sunday 7 AM – 11 AM
Headway: the average interval of time between transit vehicles moving in the same
direction on the same route. The headways were based on the i-26ALT Recommended Alternative service plan,
see Table 1.6.
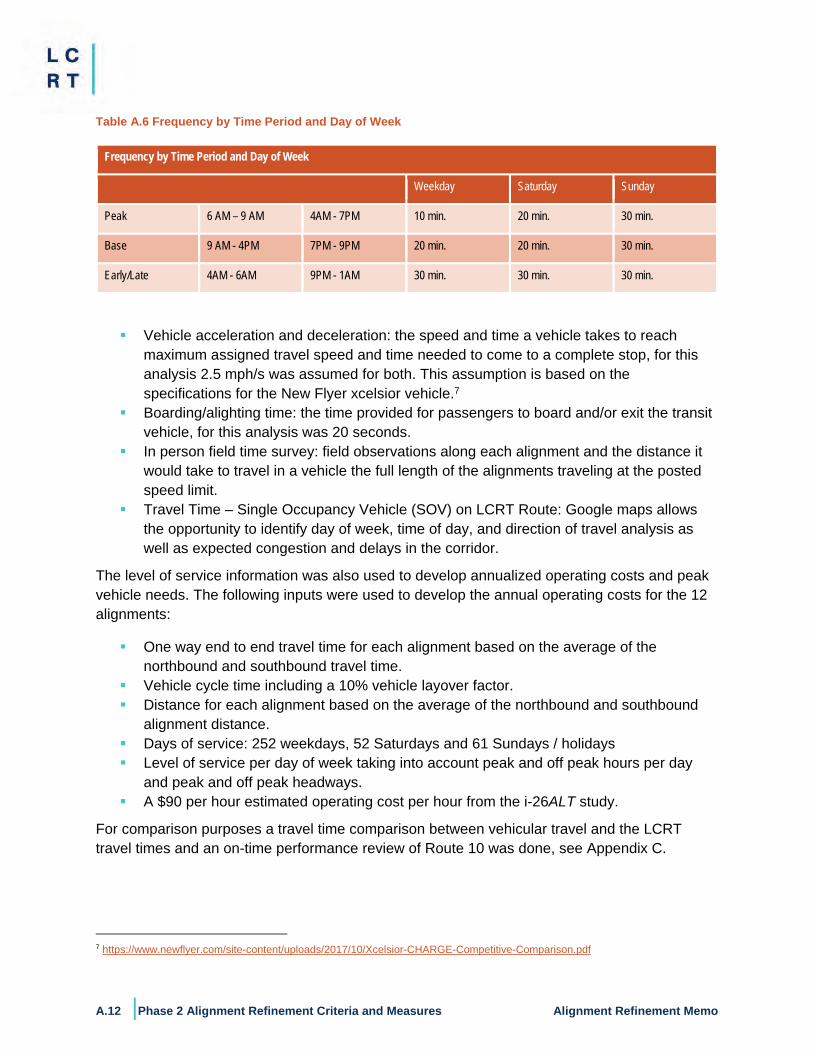
A.12 |Phase 2 Alignment Refinement Criteria and Measures Alignment Refinement Memo
Table A.6 Frequency by Time Period and Day of Week
Vehicle acceleration and deceleration: the speed and time a vehicle takes to reach maximum assigned travel speed and time needed to come to a complete stop, for this analysis 2.5 mph/s was assumed for both. This assumption is based on the specifications for the New Flyer xcelsior vehicle.7
Boarding/alighting time: the time provided for passengers to board and/or exit the transit vehicle, for this analysis was 20 seconds.
In person field time survey: field observations along each alignment and the distance it would take to travel in a vehicle the full length of the alignments traveling at the posted speed limit.
Travel Time – Single Occupancy Vehicle (SOV) on LCRT Route: Google maps allows the opportunity to identify day of week, time of day, and direction of travel analysis as well as expected congestion and delays in the corridor.
The level of service information was also used to develop annualized operating costs and peak vehicle needs. The following inputs were used to develop the annual operating costs for the 12 alignments:
One way end to end travel time for each alignment based on the average of the northbound and southbound travel time.
Vehicle cycle time including a 10% vehicle layover factor. Distance for each alignment based on the average of the northbound and southbound
alignment distance. Days of service: 252 weekdays, 52 Saturdays and 61 Sundays / holidays Level of service per day of week taking into account peak and off peak hours per day
and peak and off peak headways. A $90 per hour estimated operating cost per hour from the i-26ALT study.
For comparison purposes a travel time comparison between vehicular travel and the LCRT travel times and an on-time performance review of Route 10 was done, see Appendix C.
7 https://www.newflyer.com/site-content/uploads/2017/10/Xcelsior-CHARGE-Competitive-Comparison.pdf
Frequency by Time Period and Day of Week
Weekday Saturday Sunday
Peak 6 AM – 9 AM 4AM - 7PM 10 min. 20 min. 30 min.
Base 9 AM - 4PM 7PM - 9PM 20 min. 20 min. 30 min.
Early/Late 4AM - 6AM 9PM - 1AM 30 min. 30 min. 30 min.
Alignment Refinement Memo Phase 2 Alignment Refinement Criteria and Measures|A.13
Average Distance between Stations The distance between stations was used to better understand the potential impacts to passenger who would need to walk to stations. There are industry best practices for station spacing, however, every community is different and these best practices were only used as a guide.
The project team used this guidance to understand the current average distance between stations for each of the 12 alignments. Currently there are 27 total stations and the distance between the stations varies. As the project progresses through the NEPA phase, the project team will utilize this information to optimize the station distances along the preferred alignment. The analysis measured the distance between each station for each alignment and then took an average.
A.2.6 Support Economic Development Plans Along the Corridor
Population and Employment
Existing Employment Providing employees with transportation options is a critical component to a comprehensive transportation network. One of the goals of this project is to ensure that it can serve the major employment hubs within the Charleston region. Several of the region’s largest employers are located along the corridor. To complete this analysis the project team used a ½-mile buffer around the stations, which is considered an industry standard walk shed, or a 10-minute walk from the station stop. The resource used for this analysis was the US Census Longitudinal Employer-Household Dynamics dataset.8
Existing Population Similar to the employment analysis, providing access to premium transit service is part of a comprehensive transportation network and to better understand how the project could serve the existing population, the project team used the sum of the total existing population within ½-mile of each station area (walk shed) along each of the 12 alignments. The resource used for this analysis was the US Census American Community Survey dataset.9
Ridership Potential
Ridership Generators Served Key activity centers are ridership generators. This analysis identified activity centers within the LCRT study area within a ½-mile radius of each station area based on three types of activities: regional centers, corridor centers, and neighborhood centers. Regional centers include hospitals, colleges/universities and interstate transit facilities (e.g. Amtrak). Corridor centers include shopping centers, clinics, and civic centers. Neighborhood centers include community centers, K-12 schools, and local parks.
8 https://lehd.ces.census.gov/data/ 9 https://www.census.gov/programs-surveys/acs
A.14 |Phase 2 Alignment Refinement Criteria and Measures Alignment Refinement Memo
Total Ridership from FTA STOPS Model STOPS is a ridership estimation modeling tool designed exclusively for fixed guide-way systems such as commuter rail, light rail, subway, BRT and streetcar. It was developed by FTA to assist project sponsors in developing ridership forecasts for their New Starts or Small Starts projects. It is also used by FTA to evaluate ridership forecasts for all projects (whether they use STOPS or any other tool) applying for New Starts and Small Starts funds on a level playing field.
STOPS model mimics the standard four-step modeling process used by most planning agencies. Some of the major inputs STOPS model uses include:
Census journey to work trip flow data Transit schedules -general transit feed specification (GTFS) format Local population and employment data Highway travel time data
The model is designed to produce all the travel demand related statistics required for New Starts/Small Starts submission. To support the LCRT ridership analysis, a STOPS model was used to test different alternatives. Several ridership statistics such as daily transit boardings, number of trips that switched modes from auto to transit, reduction in vehicle miles of travel (VMT) and station/stop boardings can be generated for each new alternative being analyzed.
On-Street Parking On-street parking can be a vital asset to businesses and residents. Along the LCRT corridor, the majority of on-street parking is located in the Peninsula. The project is still in the early stages of identifying exactly where the BRT vehicles will operate within the right-of-way along each of these streets, however it is important at a high level to understand where the parking is and how it might be impacted. It is also good to complete this analysis now to better inform the future phases of this project.
To complete this analysis the project team utilized parking data that was compiled during the development of the Charleston Comprehensive Parking Study completed in January 2019. The study boundary and the data ended at Huger Street on the north side of the Peninsula. Since the alignments extend further north along Meeting Street, the project team completed a field visit to supplement the data and to improve its accuracy.
Once the field visit was completed, the project team evaluated the total linear footage of on-street parking that existed along each of the alignments where exclusive and semi-exclusive operations is assumed based on the design to date.
A.2.7 Project Viability, Costs, and Implementation
Technical Feasibility When reviewing each of the alignments and the project’s overall technical feasibility within those alignments, the project team considered many factors, including freight activity and the number of at-grade railroad crossings, flooding issues, existing infrastructure, and construction in a tight
Alignment Refinement Memo Phase 2 Alignment Refinement Criteria and Measures|A.15
urban areas. The score of the measure will later reduce the score based on more impactful issues. For example:
From Nexton to the US 78 / I-26 interchange constructability issues were rated low if abus on shoulder treatment is implemented due the reduced construction investment thatwould be required in comparison to other alignments. (minus 2 points)
Along the King Street alternative, between Carner Avenue and Mount Pleasant Street,parallel running rail lines are located on each side of the roadway. Constructabilityissues are present along this entire section as coordination and approval from eachindividual rail company will be required to perform any work along this section ofroadway. (minus 3 points)
Along the Meeting Street alternative, between Carner Avenue and Mount PleasantStreet, there are three existing and one proposed rail crossings. Each of these railcrossings will require coordination and approval from each individual rail company toperform any construction work in the vicinity of these crossings. There is a significantcost to construction of any overpass, but even simple grade crossing modificationsrequire significant coordination and create construction delays with flagging rules. (minus5 points)
Along the Meeting Street and Calhoun Street alignment in downtown Charleston,construction includes the replacement of existing traffic signal mast arms atintersections, and the addition of mast arms mid-block to accommodate the proposedreversible lane option for BRT. Given the high amount of development and potentialutility impacts, there may be minor constructability issues associated with thisalternative. (minus 2 points)
Along the Lowline, constructability issues include stakeholder coordination withproposed reactivation of the corridor including potential hazardous materials within theformer rail corridor. Along the Meeting Street and Calhoun Street alignment in downtownCharleston, there are existing drainage and flooding issues present, see Figure 1.2(minus 2 points)
From a review of data since 2015 from the City of Charleston, there is on average threeto four times per year that Calhoun Street is closed (Figure 1.2). There are significantmore closures of the side streets between Smith Street and Lockwood Drive, but theseside street closure events are not anticipated to impact the BRT operations. As part ofthe LCRT project, mitigation to address these drainage and flooding issues are apotential requirement of project development which increases the overall costs andpresents constructability issues for this alternative. (minus 2 points)
There were 22 closures of Calhoun Street due to flooding from August 2015 until December 2019. There were also at least 22 events that partially flooding the corridor over the same timespan but did not resulting in traffic closures. As part of the LCRT project, mitigation to address these drainage and flooding issues are a potential requirement of project development which increases the overall costs and presents constructability issues for this alternative. (minus
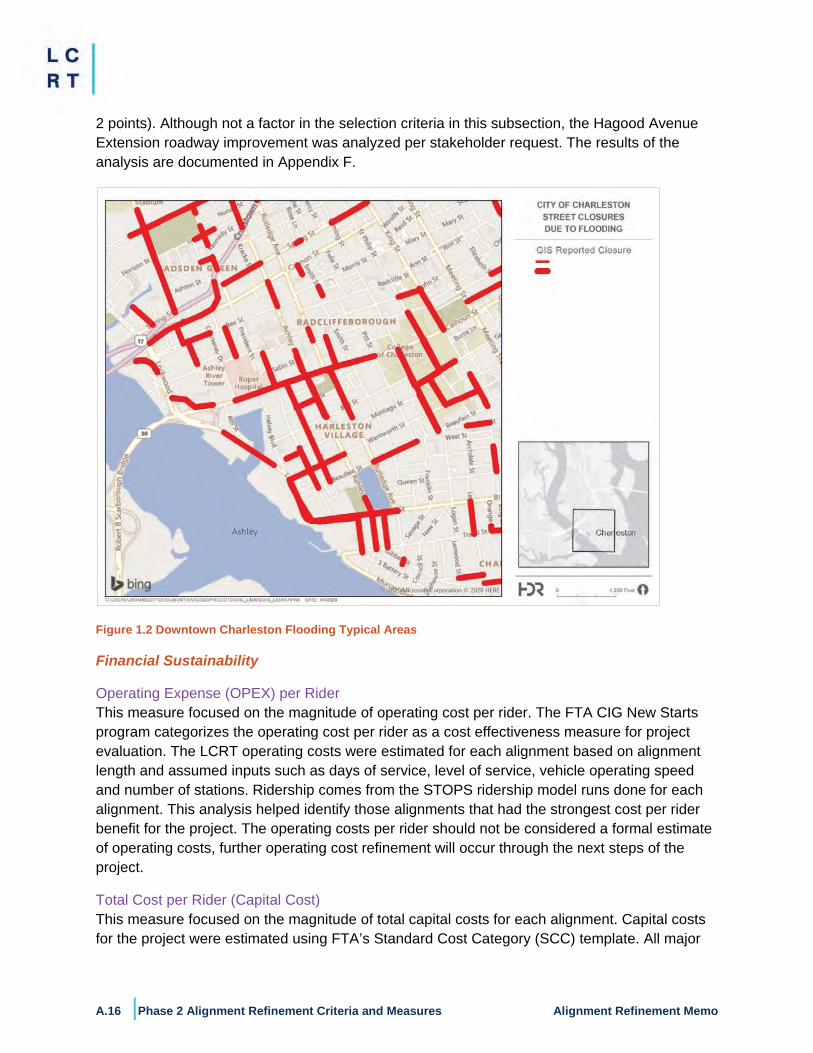
A.16 |Phase 2 Alignment Refinement Criteria and Measures Alignment Refinement Memo
2 points). Although not a factor in the selection criteria in this subsection, the Hagood Avenue Extension roadway improvement was analyzed per stakeholder request. The results of the analysis are documented in Appendix F.
Figure 1.2 Downtown Charleston Flooding Typical Areas
Financial Sustainability
Operating Expense (OPEX) per Rider This measure focused on the magnitude of operating cost per rider. The FTA CIG New Starts program categorizes the operating cost per rider as a cost effectiveness measure for project evaluation. The LCRT operating costs were estimated for each alignment based on alignment length and assumed inputs such as days of service, level of service, vehicle operating speed and number of stations. Ridership comes from the STOPS ridership model runs done for each alignment. This analysis helped identify those alignments that had the strongest cost per rider benefit for the project. The operating costs per rider should not be considered a formal estimate of operating costs, further operating cost refinement will occur through the next steps of the project.
Total Cost per Rider (Capital Cost) This measure focused on the magnitude of total capital costs for each alignment. Capital costs for the project were estimated using FTA’s Standard Cost Category (SCC) template. All major
Alignment Refinement Memo Phase 2 Alignment Refinement Criteria and Measures|A.17
transit investments potentially pursuing federal funding through the FTA grant programs must organize project costs according to the agency’s SCC structure. The SCC ensures that capital cost estimates can be fairly compared from one project to another. The most recent FTA capital costing format was used for providing totals for each category as required for New Starts funding, which the LCRT is expected to pursue. Unit costs for each category were developed based on local data from previous projects. This analysis yielded “order of magnitude” cost estimates to provide a general framework for comparing the alignments. These capital costs should not be considered a formal estimate of costs and are not for programming purposes, additional work is needed in the next phases of the project in order to take them to that level.
Beyond the costs developed for this alternative refinement analysis, an additional estimate was developed to understand order of magnitude capital costs for improvements along US 78, between Berlin G Myers Parkway and the US 78 / I-26 interchange. The current proposed operating configuration has BRT in mixed-traffic. From the intersection with Berlin G Myers Parkway to Market Road, US 78 consists of a two-lane roadway with roadside ditches. Widening the roadway to add exclusive BRT lanes along this section was evaluated. To widen the roadway to allow for exclusive BRT lanes, the project cost would increase by at least $60 million plus soft costs such as professional services, contingencies and contractor mark-ups. The planned improvements would involve widening US 78 from the existing two lanes to a typical section that provides two lanes for general purpose traffic, two lanes for BRT guideways, curb and gutter with closed drainage, and six foot wide sidewalks on both sides of the roadway.
An alternative to the Nexton alignment is to have the BRT operate in a shoulder lane when the speed of the mainline lanes fall below 25 mph. The bus would operate no higher than 40 mph. Bus on shoulder transit operations helps reduce the variability in transit travel speeds and increases reliability. The cost of this addition includes widening the two overpass bridges at Royal Road and College Park Road. The shoulder widths are too narrow to safely operate on the shoulder in these areas. Additionally, several other upgrades including ITS sensors to observe any lane blockages. The cost of this is approximately $45 million plus soft costs.
A.3 Maximum Rating and Scoring RefinementThe analysis reviewed specific measures and areas of each of the 12 alignments in order to understand and highlight key differences in the alignments and to advance one alternative into NEPA analysis and documentation with the intent to make the LCRT a competitive project for the FTA CIG rating criteria. After selection of the measures and the gathering of the data inputs, the next step in the process included scoring each criteria for each alignment. The analysis resulted in a final score per alignment by adding the score for each criteria, with a total possible score of 350 points. After the analysis, the score of each alignment was compared against the others. Only the top ranked alignments were considered to warrant further analysis through the NEPA process.
A.3.1 Maximum Rating of MeasuresUsing the measures identified in this memo, the analysis was completed for the 12 end-to-endalignments, and the stations associated with each one (note: number of station areas varies per
A.18 |Phase 2 Alignment Refinement Criteria and Measures Alignment Refinement Memo
alignment). Points were assigned for each measure based on an assessment of their relative importance to stakeholders input beginning since i-26ALT study (e.g. development of purpose and need as well as stakeholder and community input through Phase 2).
The maximum rating for each measure was based on an assessment of their relative importance to stakeholders, NEPA review, and overall project FTA CIG rating. The maximum rating was assigned by giving a higher maximum possible score to measures with greater priority, and a lower maximum possible score to measures with lesser priority. These maximum rating scores ranged from 5 to 30 and resulted in the total possible score of 350, as mentioned above.
The maximum ratings for each measure used to evaluate LCRT alignments are similar to those applied in the CHATS Long Range Transportation Plan (LRTP) project evaluation criteria and methodology, which are used in evaluating and prioritizing roadway improvement projects. Differences between the LCRT maximum rating and the CHATS LRTP criteria are due to the purpose and need of this BRT project and the FTA rating used to evaluate CIG projects. Established FTA guidelines include an increased level of up-front environmental review during the project development process in order for a project to enter into engineering as part of the competitive CIG program. Although additional emphasis is placed on environmental review, the measures and maximum rating included in the LCRT Phase 2 alignment refinement process incorporate each of the 12 criteria developed for the project evaluation conducted by CHATS.
A.3.2 Scoring of Measures Once the maximum rating for each measure was defined, each alignment was scored. These scores were based on the value of each alignment’s performance on each measure, for example, potential ridership. (It should be noted that the analysis uses both quantitative and qualitative measures, based on data availability. Qualitative measures received a score based on individual assessments as described in Section 2, while quantitative measures were assessed based on their direct numerical performance, such as total project cost.) These values were used to score the alignments between 0 and the maximum score for each measure, based on a statistical method which was developed for the project and is described below.
The score for each measure was based on interpolating along a trend line generated by assigning scores to the average value for that criteria and to the values one and two standard deviations away from the average. The average measure value was set to correspond with 60 percent of the highest rated score. Measure values equal to or greater than one standard deviation higher than the average for that measure corresponded to the highest rated score. A measure value one standard deviation below the average corresponded to 40 percent of the highest max rating, and a value two standard deviations below the average corresponded to 20 percent of the highest score. Beyond two standard deviations below the average, the maximum rating went toward zero.
See Figure 1.3 for an example of how this process was developed and implemented for the “employment” measure. The maximum score for employment was 20 points, which is assigned to correspond with approximately 50,500 jobs; the maximum of 20 points is one standard
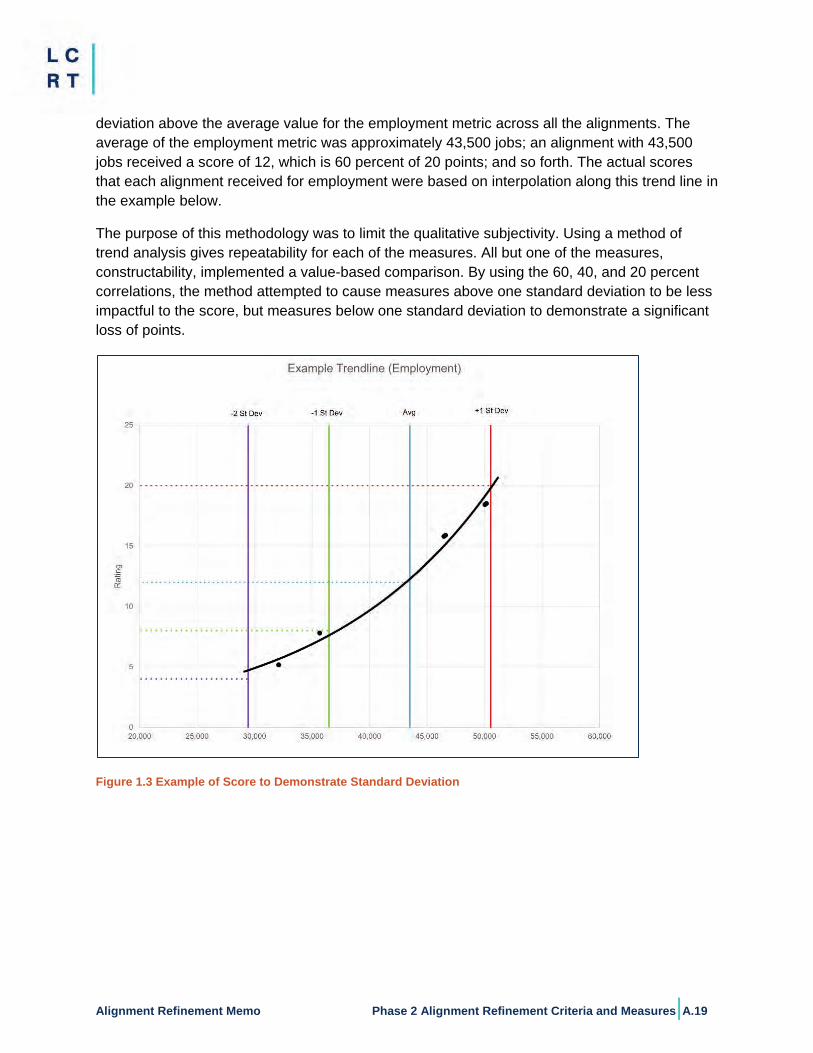
Alignment Refinement Memo Phase 2 Alignment Refinement Criteria and Measures|A.19
deviation above the average value for the employment metric across all the alignments. The average of the employment metric was approximately 43,500 jobs; an alignment with 43,500 jobs received a score of 12, which is 60 percent of 20 points; and so forth. The actual scores that each alignment received for employment were based on interpolation along this trend line in the example below.
The purpose of this methodology was to limit the qualitative subjectivity. Using a method of trend analysis gives repeatability for each of the measures. All but one of the measures, constructability, implemented a value-based comparison. By using the 60, 40, and 20 percent correlations, the method attempted to cause measures above one standard deviation to be less impactful to the score, but measures below one standard deviation to demonstrate a significant loss of points.
Figure 1.3 Example of Score to Demonstrate Standard Deviation
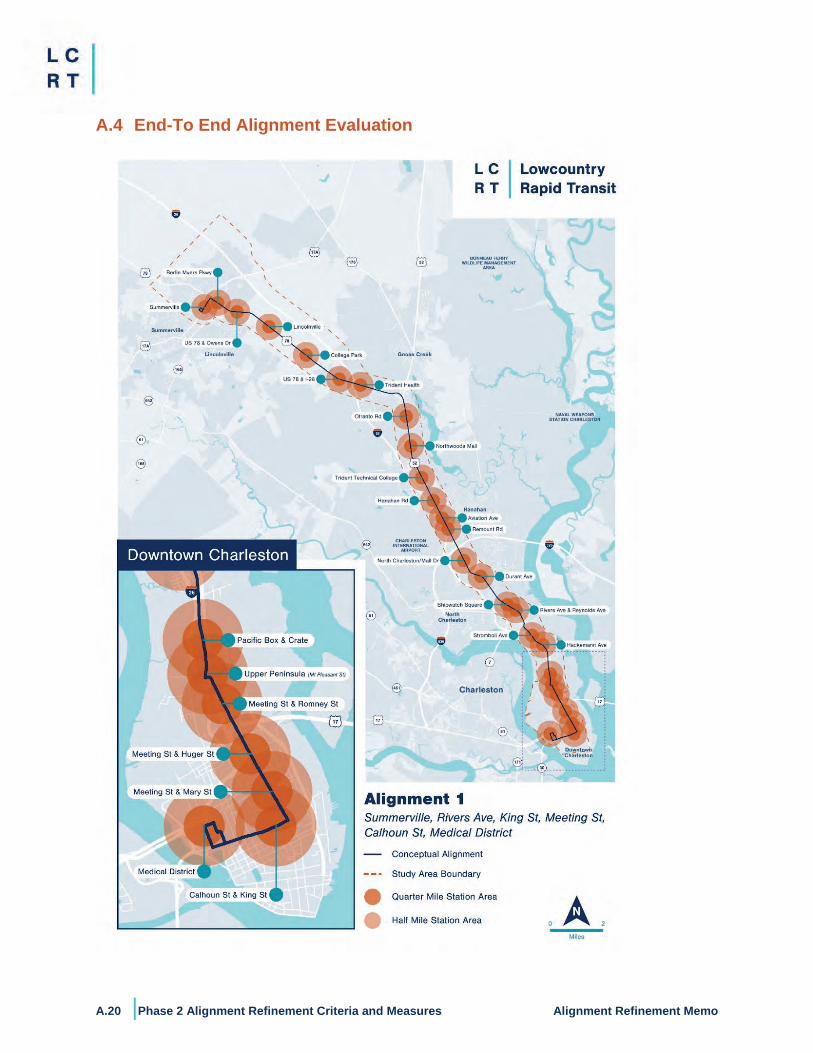
A.20 |Phase 2 Alignment Refinement Criteria and Measures Alignment Refinement Memo
A.4 End-To End Alignment Evaluation
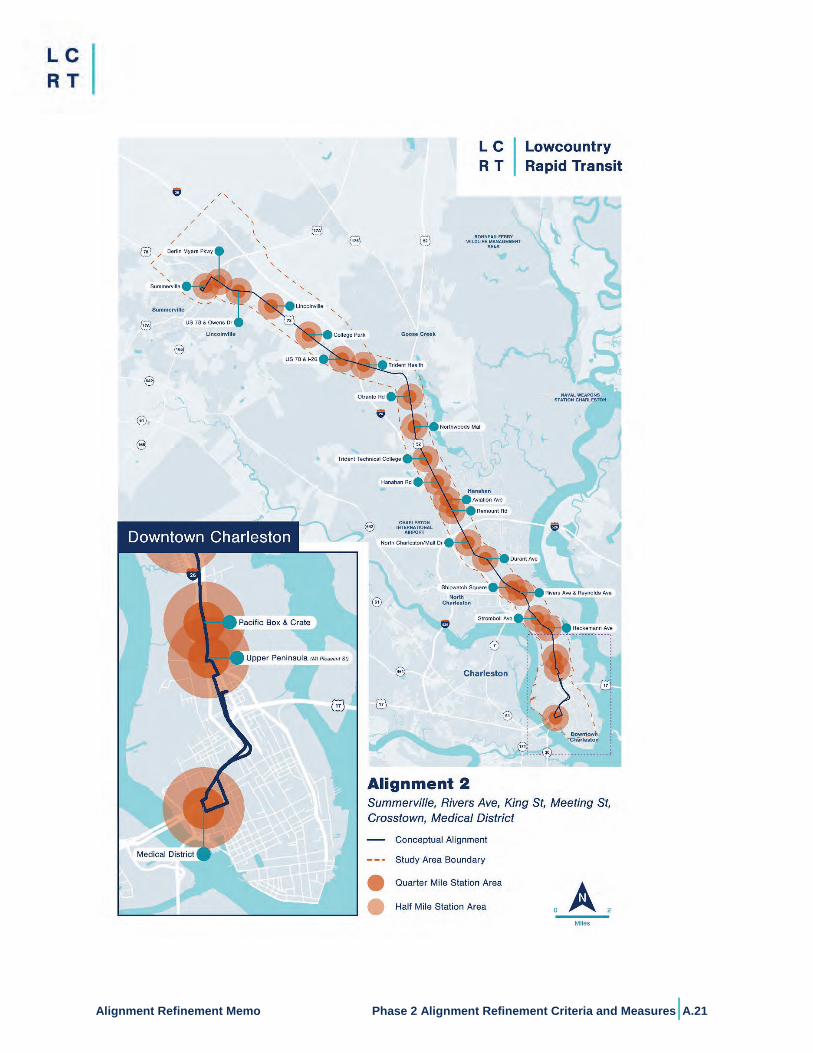
Alignment Refinement Memo Phase 2 Alignment Refinement Criteria and Measures|A.21
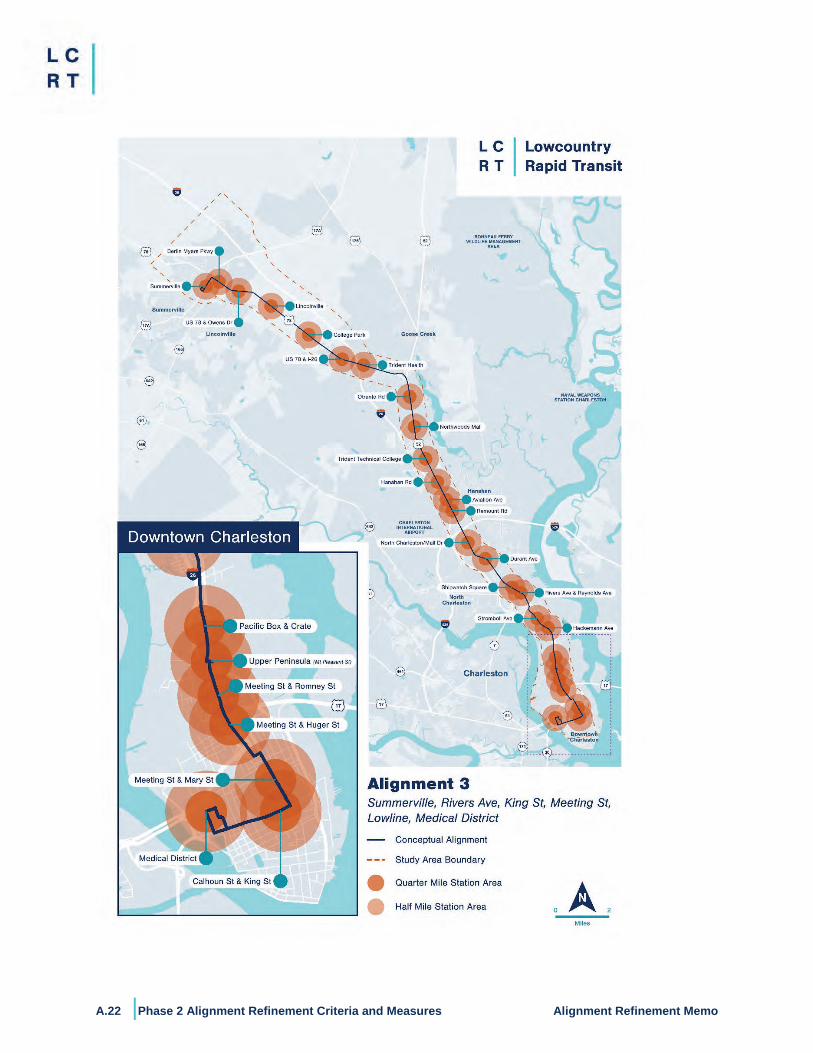
A.22 |Phase 2 Alignment Refinement Criteria and Measures Alignment Refinement Memo

Alignment Refinement Memo Phase 2 Alignment Refinement Criteria and Measures|A.23

A.24 |Phase 2 Alignment Refinement Criteria and Measures Alignment Refinement Memo
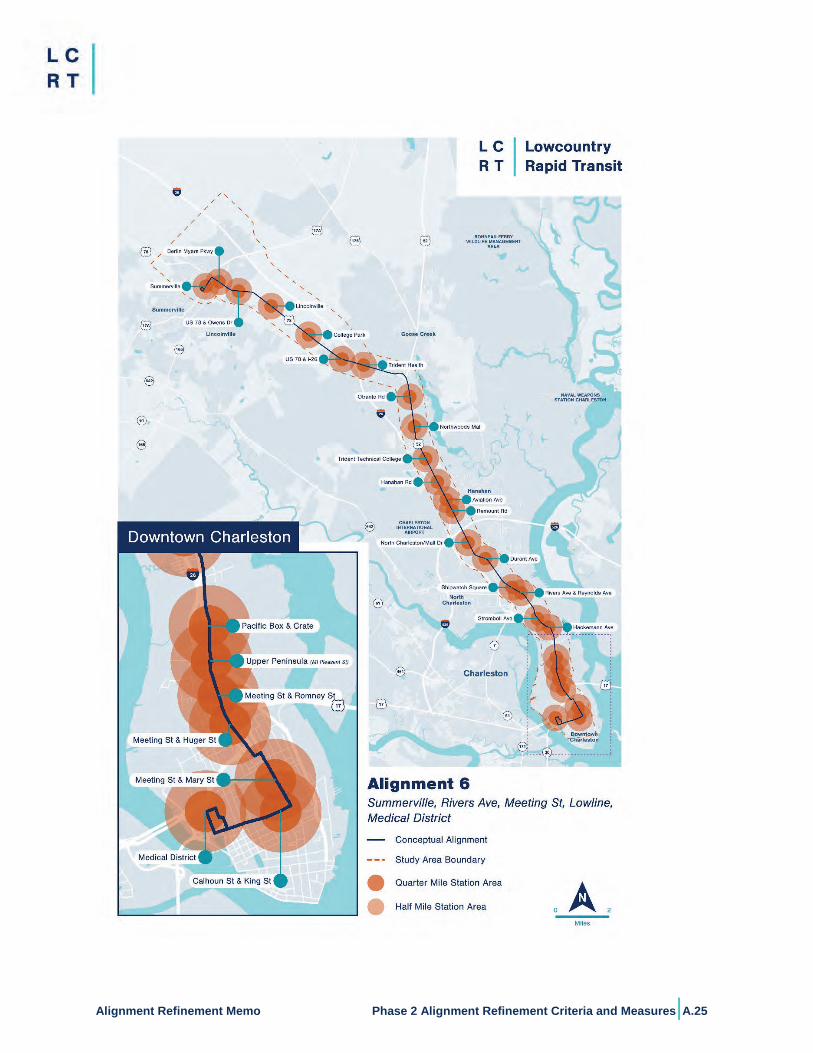
Alignment Refinement Memo Phase 2 Alignment Refinement Criteria and Measures|A.25
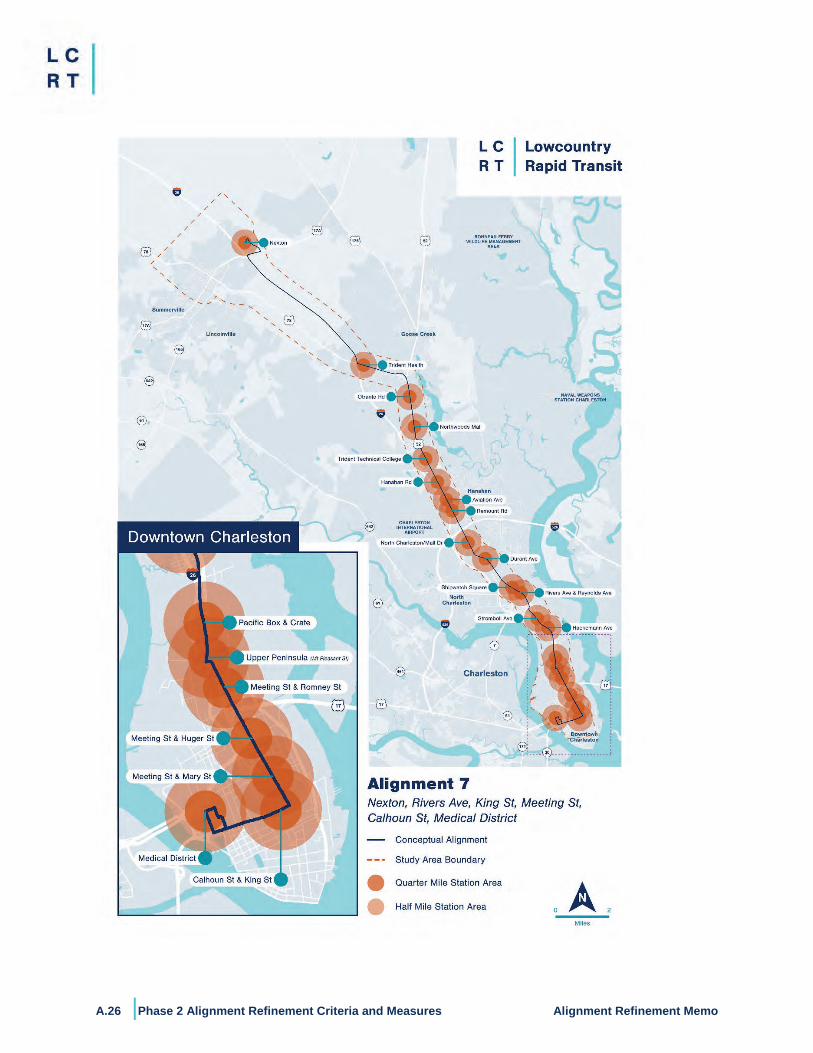
A.26 |Phase 2 Alignment Refinement Criteria and Measures Alignment Refinement Memo

Alignment Refinement Memo Phase 2 Alignment Refinement Criteria and Measures|A.27

A.28 |Phase 2 Alignment Refinement Criteria and Measures Alignment Refinement Memo

Alignment Refinement Memo Phase 2 Alignment Refinement Criteria and Measures|A.29
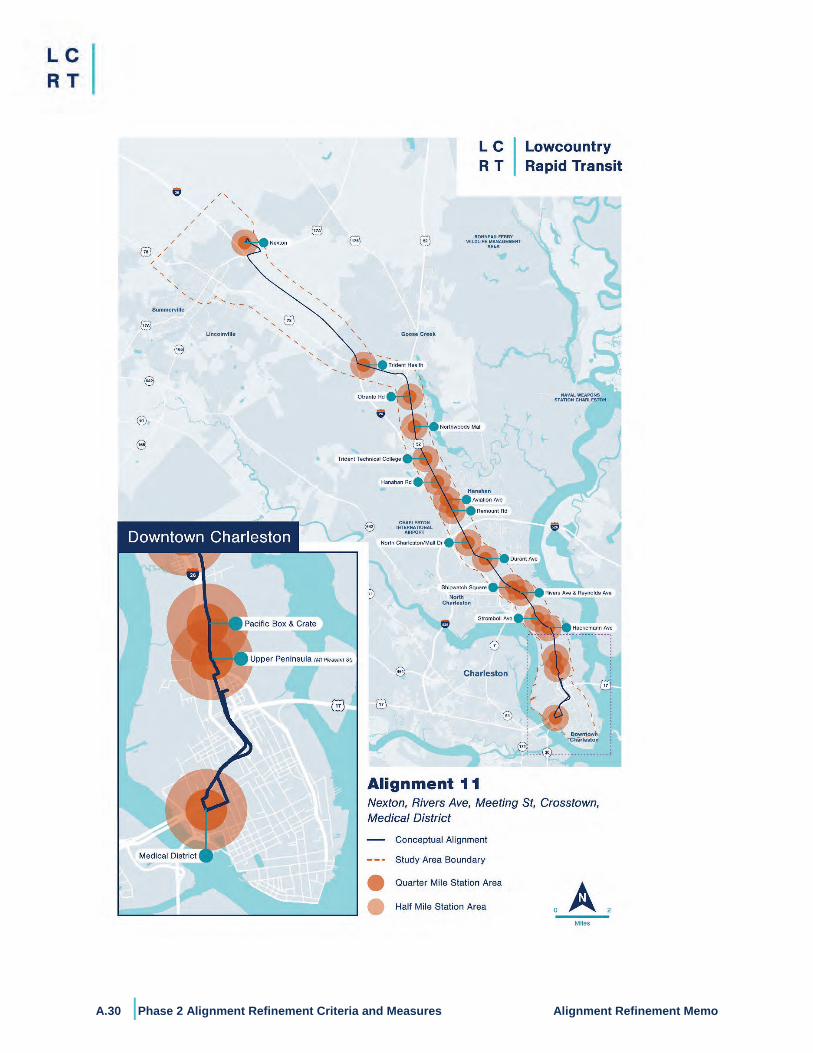
A.30 |Phase 2 Alignment Refinement Criteria and Measures Alignment Refinement Memo
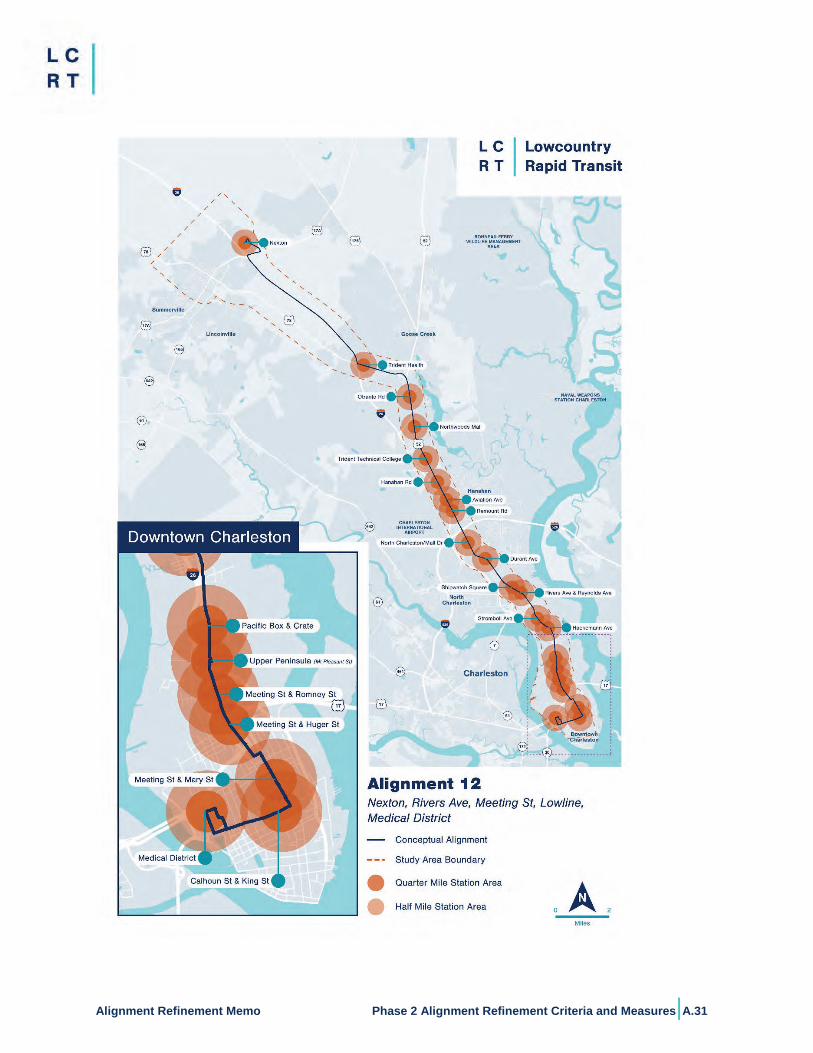
Alignment Refinement Memo Phase 2 Alignment Refinement Criteria and Measures|A.31
5790 Casper Padgett Way, North Charleston, SC 29406
Tel: 843.529.0400 Fax: 843.529.0305.
Appendix B: Guideway Treatment AnalysisLowcountry Rapid Transit
Berkeley-Charleston-Dorchester Council of Governments
August 10, 2020
Guideway Treatment Analysis Contents | B.i
Contents B Guideway Treatment Analysis ....................................................................................................... B.1
B.1 Introduction ............................................................................................................................ B.1
B.2 Background ........................................................................................................................... B.1
B.2.1 Alternatives Analysis Process to Date ............................................................................... B.1
B.2.2 Importance of BRT Guideway and FTA CIG Project Definition Criteria ............................. B.1
B.2.3 NEPA Evaluation ............................................................................................................... B.2
B.3 BRT Guideways ..................................................................................................................... B.3
B.3.1 Exclusive Treatments ......................................................................................................... B.3
B.3.2 Semi-exclusive Treatments ................................................................................................ B.6
B.3.3 Guideway Treatments and Performance ......................................................................... B.12
B.3.4 Center vs Side Running Guideway .................................................................................. B.14
B.3.5 Guideway Enforcement .................................................................................................... B.15
B.4 Planning Approach .............................................................................................................. B.15
B.4.1 Identification of Optimal BRT Running Way Treatments.................................................. B.15
B.4.2 Reasonable Alternatives .................................................................................................. B.18
B.4.3 Evaluation Method ........................................................................................................... B.20
B.4.4 Criteria ............................................................................................................................. B.20
B.5 Evaluation Results ............................................................................................................... B.21
B.5.1 North Area – Summerville/Nexton Alignments Review .................................................... B.22
B.5.2 Center Area – Rivers Avenue Alignment Review ............................................................ B.24
B.5.3 Neck Area – Meeting Street and King Street Alignment Reviews ................................... B.26
B.5.4 Peninsula Area – Meeting/Calhoun, Lowline, Crosstown Alignment Reviews ................. B.29
B.6 Conclusions ......................................................................................................................... B.32
Figures
Figure B.1 BRT Guideway Treatments ................................................................................................ B.3 Figure B.2 Exclusive Guideway for Buses in Disney Springs, Orlando, Florida .................................. B.4 Figure B.3 Minneapolis Metro Red Line in Center Median of Freeway ............................................... B.5 Figure B.4 Semi-exclusive Lanes in Downtown Orlando ..................................................................... B.6 Figure B.5 Queue Jump Lane, with Right Turn Lane to Station .......................................................... B.7
B.ii |Guideway Treatment Analysis Alignment Refinement Memo
Figure B.6 Mixed Traffic Lane Assignment in Metro Transit C Line, Minneapolis, Minnesota ............. B.8 Figure B.7 Kansas City MAX in Peak Hour Shared Lane .................................................................... B.9 Figure B.8 Peak Hour Sign for BAT Lane .......................................................................................... B.10 Figure B.9 Bi-directional BRT Lanes near ART Stop, Albuquerque, New Mexico ............................. B.11 Figure B.10 Reversible Lane Section (between Yellow Lines) in Albuquerque, New Mexico ............ B.12 Figure B.11 LCRT Study Area Character Areas ................................................................................ B.17
Tables
Table B.1 BRT Definitions in Fixing America's Surface Transportation Law Requirements ................ B.2 Table B.2 Summary of Effects of Running Way Elements on System Performance ......................... B.13 Table B.3 Comparison of Center Running vs. Side Running Options ............................................... B.14 Table B.4 Best Lane Alternatives Considered for Each Area Alignment ........................................... B.19 Table B.5 Evaluation Criteria and Rating Approach .......................................................................... B.20 Table B.6 Evaluation Key ................................................................................................................... B.21 Table B.7 Guideway Effectiveness Assessment–North Area ............................................................ B.22 Table B.8 Guideway Effectiveness Assessment–North Area Options ............................................... B.22 Table B.9 Guideway Effectiveness Assessment–North Area Recommendation ............................... B.23 Table B.10 Guideway Effectiveness Assessment–Center Area ........................................................ B.24 Table B.11 Guideway Effectiveness Assessment–Center Area Options ........................................... B.24 Table B.12 Guideway Effectiveness Assessment–Center Area Recommendation ........................... B.25 Table B.13 Guideway Effectiveness Assessment–Neck Area ........................................................... B.26 Table B.14 Guideway Effectiveness Assessment–Neck Area Meeting Street Options ..................... B.26 Table B.15 Guideway Effectiveness Assessment–Neck Area King Street Extension Options .......... B.27 Table B.16 Guideway Effectiveness Assessment–Neck Area Recommendation .............................. B.28 Table B.17 Guideway Effectiveness Assessment–Peninsula Area ................................................... B.29 Table B.18 Guideway Effectiveness Assessment–Peninsula Area Meeting/Calhoun Options .......... B.29 Table B.19 Guideway Effectiveness Assessment–Peninsula Area Lowline Options ......................... B.30 Table B.20 Guideway Effectiveness Assessment–Peninsula Area Crosstown Options .................... B.30 Table B.21 Guideway Effectiveness Assessment–Peninsula Area Recommendation ...................... B.31 Table B.22 Recommended Guideway Treatment per Area ............................................................... B.33
Appendices
Attachment A – Rivers Avenue Safety Summary Attachment B – LCRT Lane Designations Attachment C – Neck Area Additional Analysis
Alignment Refinement Memo Guideway Treatment Analysis|B.iii
Acronyms and Abbreviations
BAT business access and transit BCDCOG Berkeley-Charleston-Dorchester Council of Governments BRT bus rapid transit CIG Capital Investment Grant DCE Documented Categorical Exclusion FTA Federal Transit Administration i-26ALT I-26 Fixed Guideway Transit Alternatives Analysis LCRT Lowcountry Rapid Transit mph miles per hour NEPA National Environmental Policy Act ROW right-of-way TSP transit signal priority

Alignment Refinement Memo Guideway Treatment Analysis|B.1
B Guideway Treatment Analysis
B.1 Introduction The purpose of this memo is to document the process and recommendations for the most optimal guideway treatment for the Lowcountry Rapid Transit (LCRT) project corridor. The memo also describes the multi-step process employed to identify the “best lane” guideway treatment for LCRT; the potential impacts to vehicular traffic within the corridor; and the identification of safety treatments and accessibility improvements along the corridor for all customers (motorized and non-motorized).
B.2 Background The Berkeley-Charleston-Dorchester Council of Governments (BCDCOG) is planning the addition of a bus rapid transit (BRT) system for the LCRT project, serving residents and visitors to Charleston, North Charleston, and Summerville. Funding for the project will likely include a mix of Federal Transit Administration (FTA) funds and local funds.
B.2.1 Alternatives Analysis Process to Date Several planning efforts have been completed as part of the analysis process to this point. These include the I-26 Fixed Guideway Transit Alternatives Analysis (i-26ALT) study, the Alignment Options and Study Area, and the LCRT Phase 1 Analysis. These planning efforts have been a systematic process of increasingly detailed analysis to develop a project that addresses the LCRT’s purpose and need. For this guideway assessment, these past studies help inform the optimal configuration of the proposed corridor to sustain transit reliability into the future while maintaining vehicle throughput and access to adjacent properties by other forms of transportation.
B.2.2 Importance of BRT Guideway and FTA CIG Project Definition Criteria The FTA’s discretionary Capital Investment Grant (CIG) program provides funds for fixed guideway transit investments, including corridor-based BRT projects that emulate the features of a rail project. Specific to BRT and the CIG program, FTA defines two forms of BRT: Fixed guideway BRT and corridor-based BRT. While there are similarities between both forms of BRT project types, there are subtle differences between them that can have a significant effect on a project’s definition and subsequently affect the approach taken when pursuing CIG funds. Table B.1 provides a definitional framework from FTA of what distinguishes a fixed guideway BRT project from a corridor-based BRT project.
The LCRT BRT project is pursuing an exclusive fixed guideway BRT due to funding and its higher level of performance enhancement. Consideration of and conformance to the CIG definition is important in the decision-making process because the project must meet the FTA’s outlined criteria. Many areas of the corridor provide ample right-of-way (ROW) of center medians; dedicated guideways are preferred.
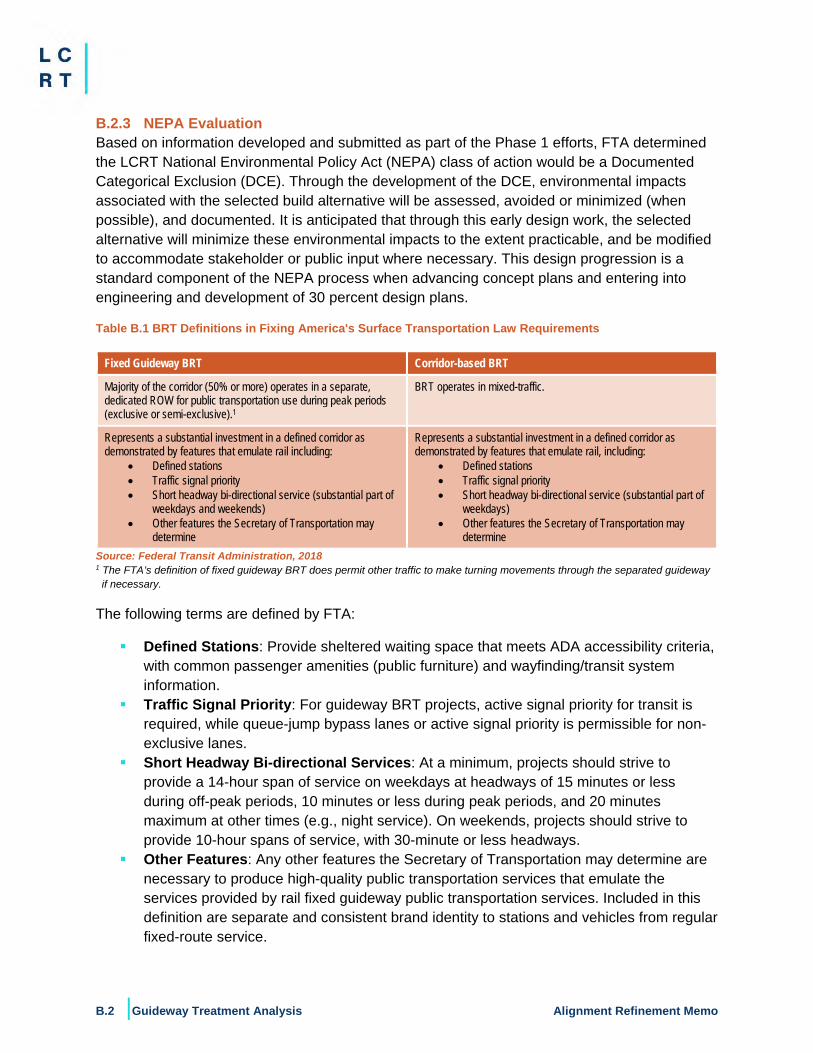
B.2 |Guideway Treatment Analysis Alignment Refinement Memo
B.2.3 NEPA Evaluation Based on information developed and submitted as part of the Phase 1 efforts, FTA determined the LCRT National Environmental Policy Act (NEPA) class of action would be a Documented Categorical Exclusion (DCE). Through the development of the DCE, environmental impacts associated with the selected build alternative will be assessed, avoided or minimized (when possible), and documented. It is anticipated that through this early design work, the selected alternative will minimize these environmental impacts to the extent practicable, and be modified to accommodate stakeholder or public input where necessary. This design progression is a standard component of the NEPA process when advancing concept plans and entering into engineering and development of 30 percent design plans.
Table B.1 BRT Definitions in Fixing America's Surface Transportation Law Requirements
Fixed Guideway BRT Corridor-based BRT
Majority of the corridor (50% or more) operates in a separate, dedicated ROW for public transportation use during peak periods (exclusive or semi-exclusive).1
BRT operates in mixed-traffic.
Represents a substantial investment in a defined corridor as demonstrated by features that emulate rail including:
• Defined stations • Traffic signal priority • Short headway bi-directional service (substantial part of
weekdays and weekends) • Other features the Secretary of Transportation may
determine
Represents a substantial investment in a defined corridor as demonstrated by features that emulate rail, including:
• Defined stations • Traffic signal priority • Short headway bi-directional service (substantial part of
weekdays) • Other features the Secretary of Transportation may
determine Source: Federal Transit Administration, 2018 1 The FTA’s definition of fixed guideway BRT does permit other traffic to make turning movements through the separated guideway
if necessary.
The following terms are defined by FTA:
Defined Stations: Provide sheltered waiting space that meets ADA accessibility criteria, with common passenger amenities (public furniture) and wayfinding/transit system information.
Traffic Signal Priority: For guideway BRT projects, active signal priority for transit is required, while queue-jump bypass lanes or active signal priority is permissible for non-exclusive lanes.
Short Headway Bi-directional Services: At a minimum, projects should strive to provide a 14-hour span of service on weekdays at headways of 15 minutes or less during off-peak periods, 10 minutes or less during peak periods, and 20 minutes maximum at other times (e.g., night service). On weekends, projects should strive to provide 10-hour spans of service, with 30-minute or less headways.
Other Features: Any other features the Secretary of Transportation may determine are necessary to produce high-quality public transportation services that emulate the services provided by rail fixed guideway public transportation services. Included in this definition are separate and consistent brand identity to stations and vehicles from regular fixed-route service.
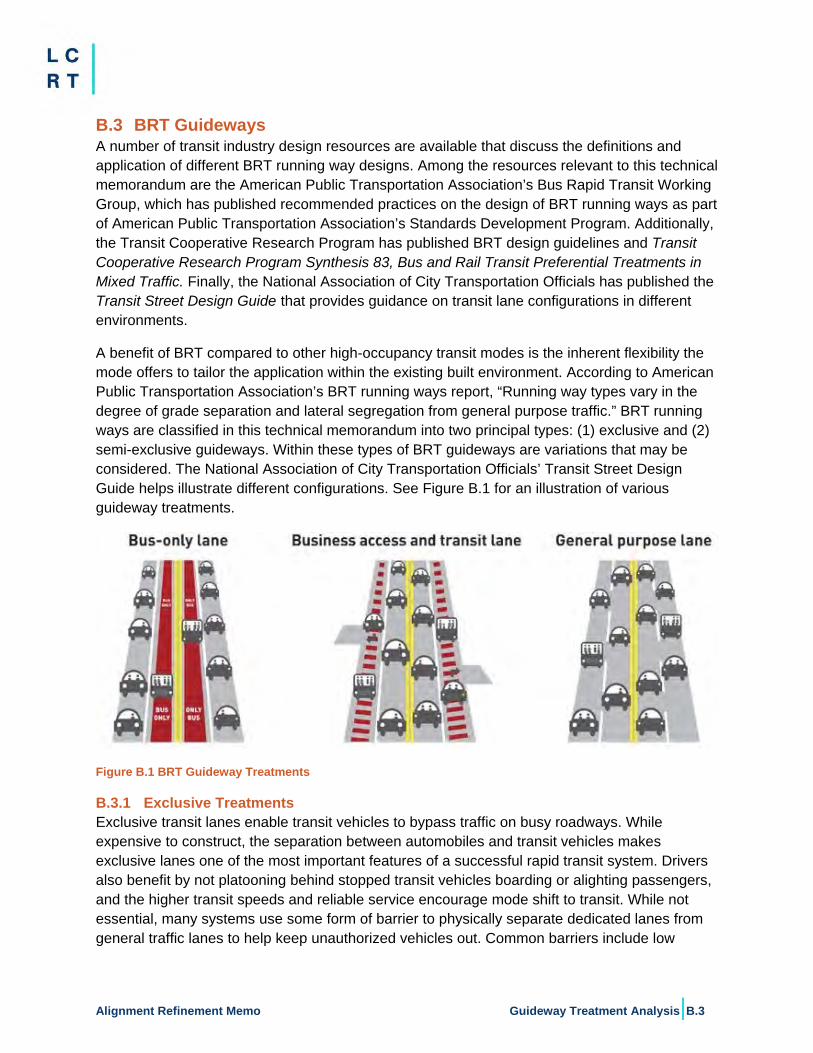
Alignment Refinement Memo Guideway Treatment Analysis|B.3
B.3 BRT Guideways A number of transit industry design resources are available that discuss the definitions and application of different BRT running way designs. Among the resources relevant to this technical memorandum are the American Public Transportation Association’s Bus Rapid Transit Working Group, which has published recommended practices on the design of BRT running ways as part of American Public Transportation Association’s Standards Development Program. Additionally, the Transit Cooperative Research Program has published BRT design guidelines and Transit Cooperative Research Program Synthesis 83, Bus and Rail Transit Preferential Treatments in Mixed Traffic. Finally, the National Association of City Transportation Officials has published the Transit Street Design Guide that provides guidance on transit lane configurations in different environments.
A benefit of BRT compared to other high-occupancy transit modes is the inherent flexibility the mode offers to tailor the application within the existing built environment. According to American Public Transportation Association’s BRT running ways report, “Running way types vary in the degree of grade separation and lateral segregation from general purpose traffic.” BRT running ways are classified in this technical memorandum into two principal types: (1) exclusive and (2) semi-exclusive guideways. Within these types of BRT guideways are variations that may be considered. The National Association of City Transportation Officials’ Transit Street Design Guide helps illustrate different configurations. See Figure B.1 for an illustration of various guideway treatments.
Figure B.1 BRT Guideway Treatments
B.3.1 Exclusive Treatments Exclusive transit lanes enable transit vehicles to bypass traffic on busy roadways. While expensive to construct, the separation between automobiles and transit vehicles makes exclusive lanes one of the most important features of a successful rapid transit system. Drivers also benefit by not platooning behind stopped transit vehicles boarding or alighting passengers, and the higher transit speeds and reliable service encourage mode shift to transit. While not essential, many systems use some form of barrier to physically separate dedicated lanes from general traffic lanes to help keep unauthorized vehicles out. Common barriers include low
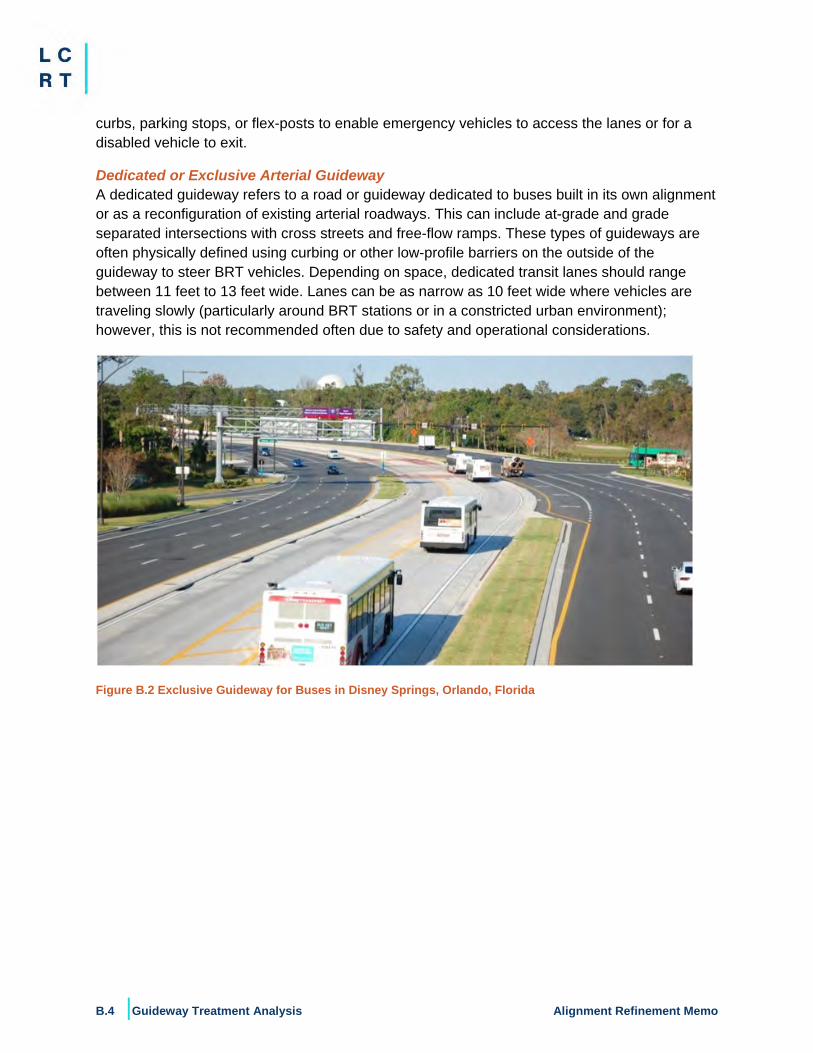
B.4 |Guideway Treatment Analysis Alignment Refinement Memo
curbs, parking stops, or flex-posts to enable emergency vehicles to access the lanes or for a disabled vehicle to exit.
Dedicated or Exclusive Arterial Guideway A dedicated guideway refers to a road or guideway dedicated to buses built in its own alignment or as a reconfiguration of existing arterial roadways. This can include at-grade and grade separated intersections with cross streets and free-flow ramps. These types of guideways are often physically defined using curbing or other low-profile barriers on the outside of the guideway to steer BRT vehicles. Depending on space, dedicated transit lanes should range between 11 feet to 13 feet wide. Lanes can be as narrow as 10 feet wide where vehicles are traveling slowly (particularly around BRT stations or in a constricted urban environment); however, this is not recommended often due to safety and operational considerations.
Figure B.2 Exclusive Guideway for Buses in Disney Springs, Orlando, Florida
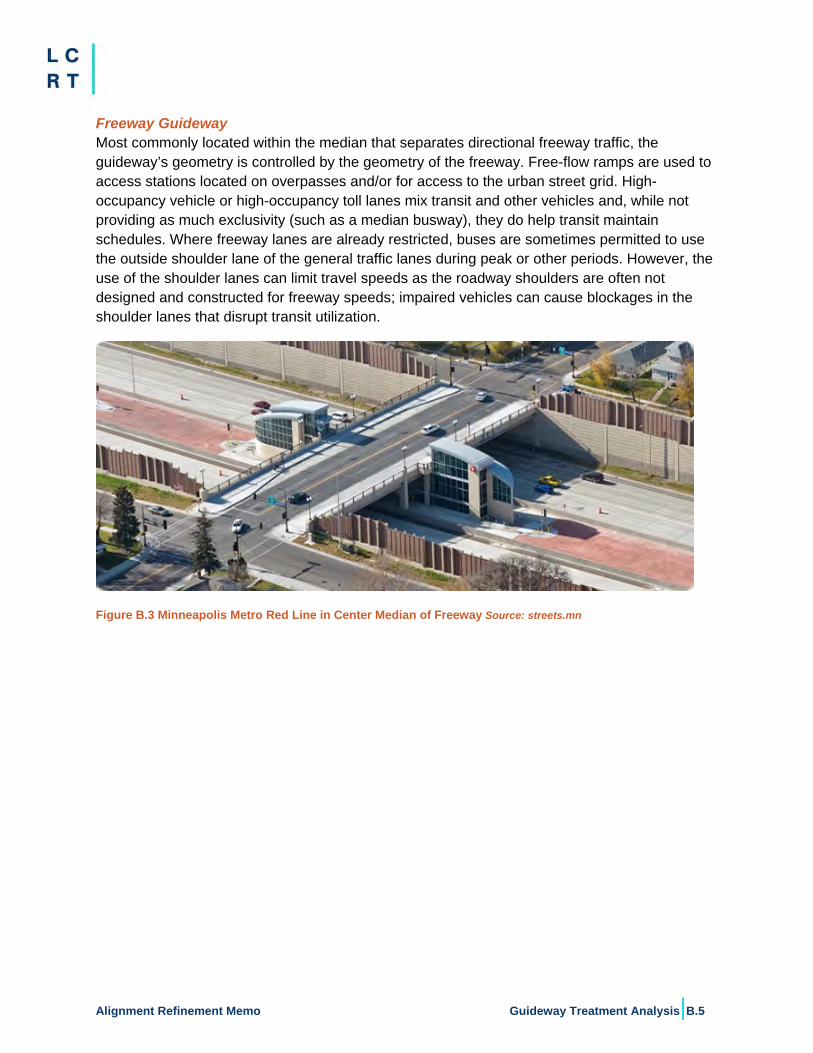
Alignment Refinement Memo Guideway Treatment Analysis|B.5
Freeway Guideway Most commonly located within the median that separates directional freeway traffic, the guideway’s geometry is controlled by the geometry of the freeway. Free-flow ramps are used to access stations located on overpasses and/or for access to the urban street grid. High-occupancy vehicle or high-occupancy toll lanes mix transit and other vehicles and, while not providing as much exclusivity (such as a median busway), they do help transit maintain schedules. Where freeway lanes are already restricted, buses are sometimes permitted to use the outside shoulder lane of the general traffic lanes during peak or other periods. However, the use of the shoulder lanes can limit travel speeds as the roadway shoulders are often not designed and constructed for freeway speeds; impaired vehicles can cause blockages in the shoulder lanes that disrupt transit utilization.
Figure B.3 Minneapolis Metro Red Line in Center Median of Freeway Source: streets.mn
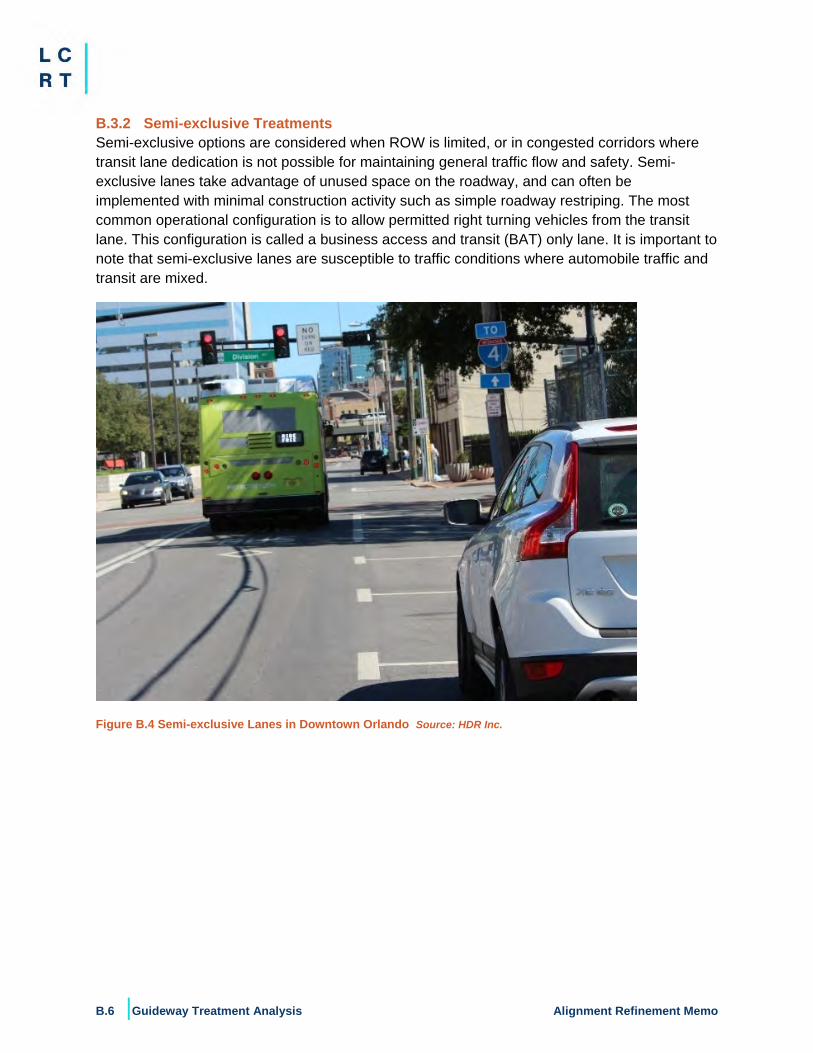
B.6 |Guideway Treatment Analysis Alignment Refinement Memo
B.3.2 Semi-exclusive Treatments Semi-exclusive options are considered when ROW is limited, or in congested corridors where transit lane dedication is not possible for maintaining general traffic flow and safety. Semi-exclusive lanes take advantage of unused space on the roadway, and can often be implemented with minimal construction activity such as simple roadway restriping. The most common operational configuration is to allow permitted right turning vehicles from the transit lane. This configuration is called a business access and transit (BAT) only lane. It is important to note that semi-exclusive lanes are susceptible to traffic conditions where automobile traffic and transit are mixed.
Figure B.4 Semi-exclusive Lanes in Downtown Orlando Source: HDR Inc.
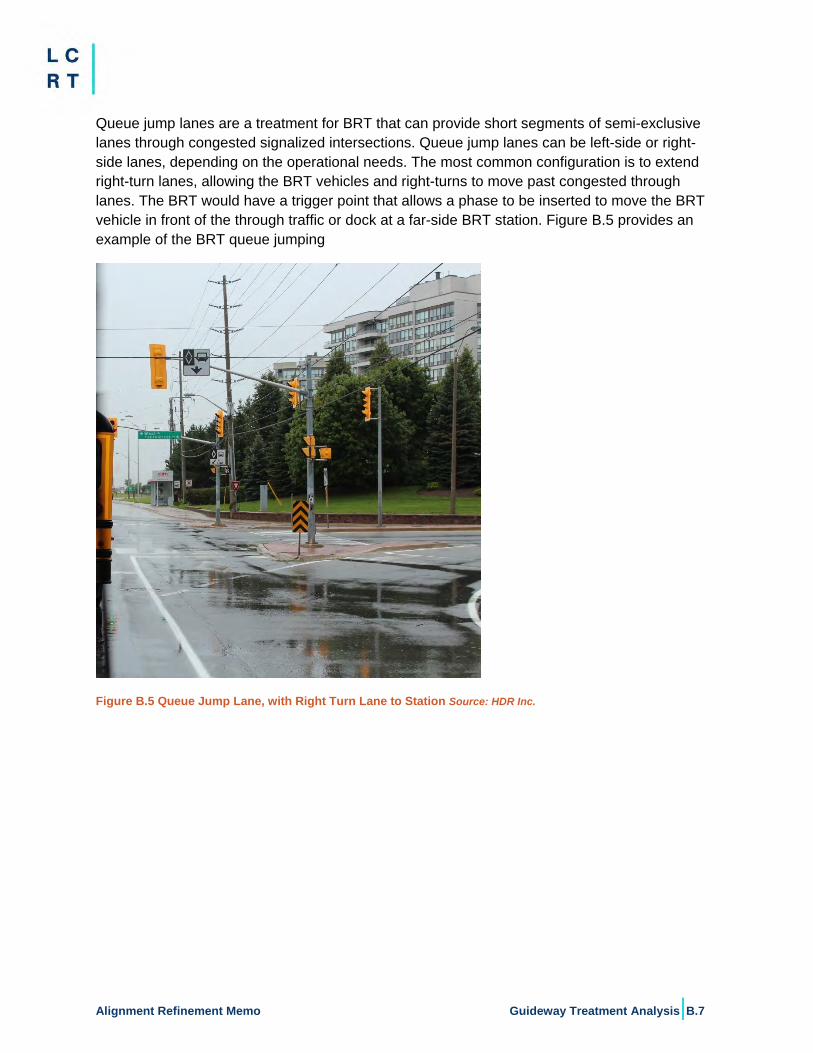
Alignment Refinement Memo Guideway Treatment Analysis|B.7
Queue jump lanes are a treatment for BRT that can provide short segments of semi-exclusive lanes through congested signalized intersections. Queue jump lanes can be left-side or right-side lanes, depending on the operational needs. The most common configuration is to extend right-turn lanes, allowing the BRT vehicles and right-turns to move past congested through lanes. The BRT would have a trigger point that allows a phase to be inserted to move the BRT vehicle in front of the through traffic or dock at a far-side BRT station. Figure B.5 provides an example of the BRT queue jumping
Figure B.5 Queue Jump Lane, with Right Turn Lane to Station Source: HDR Inc.
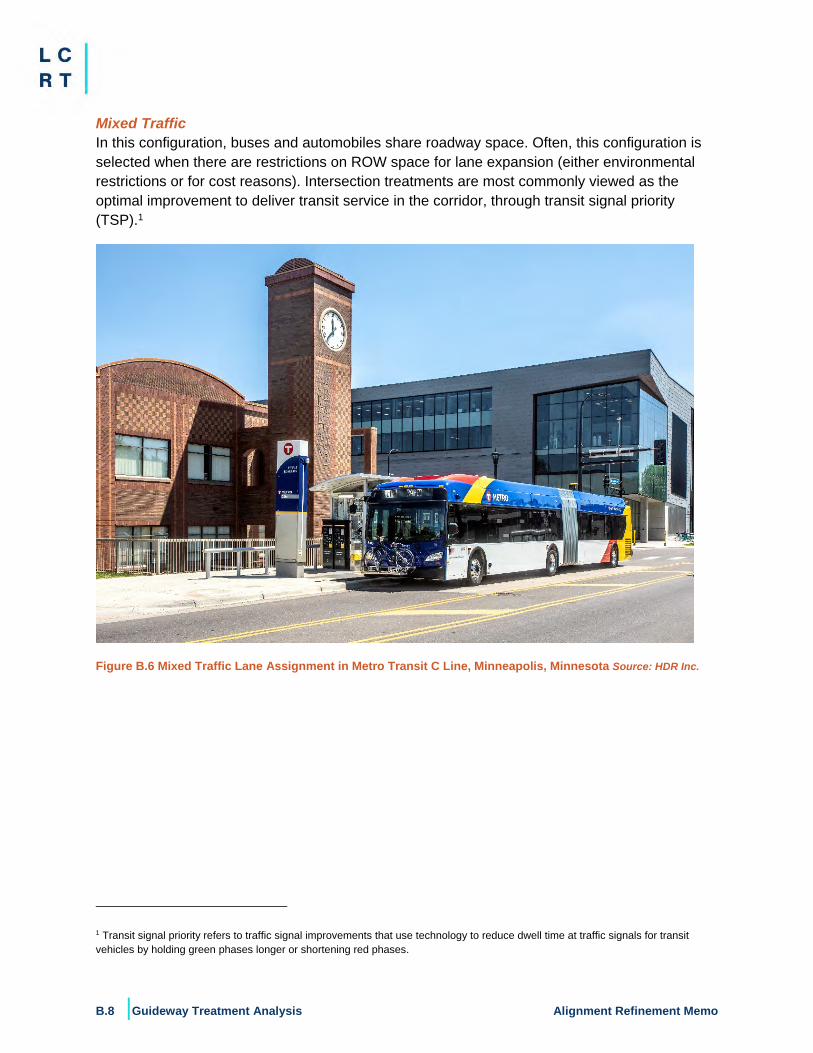
B.8 |Guideway Treatment Analysis Alignment Refinement Memo
Mixed Traffic In this configuration, buses and automobiles share roadway space. Often, this configuration is selected when there are restrictions on ROW space for lane expansion (either environmental restrictions or for cost reasons). Intersection treatments are most commonly viewed as the optimal improvement to deliver transit service in the corridor, through transit signal priority (TSP).1
Figure B.6 Mixed Traffic Lane Assignment in Metro Transit C Line, Minneapolis, Minnesota Source: HDR Inc.
1 Transit signal priority refers to traffic signal improvements that use technology to reduce dwell time at traffic signals for transit vehicles by holding green phases longer or shortening red phases.
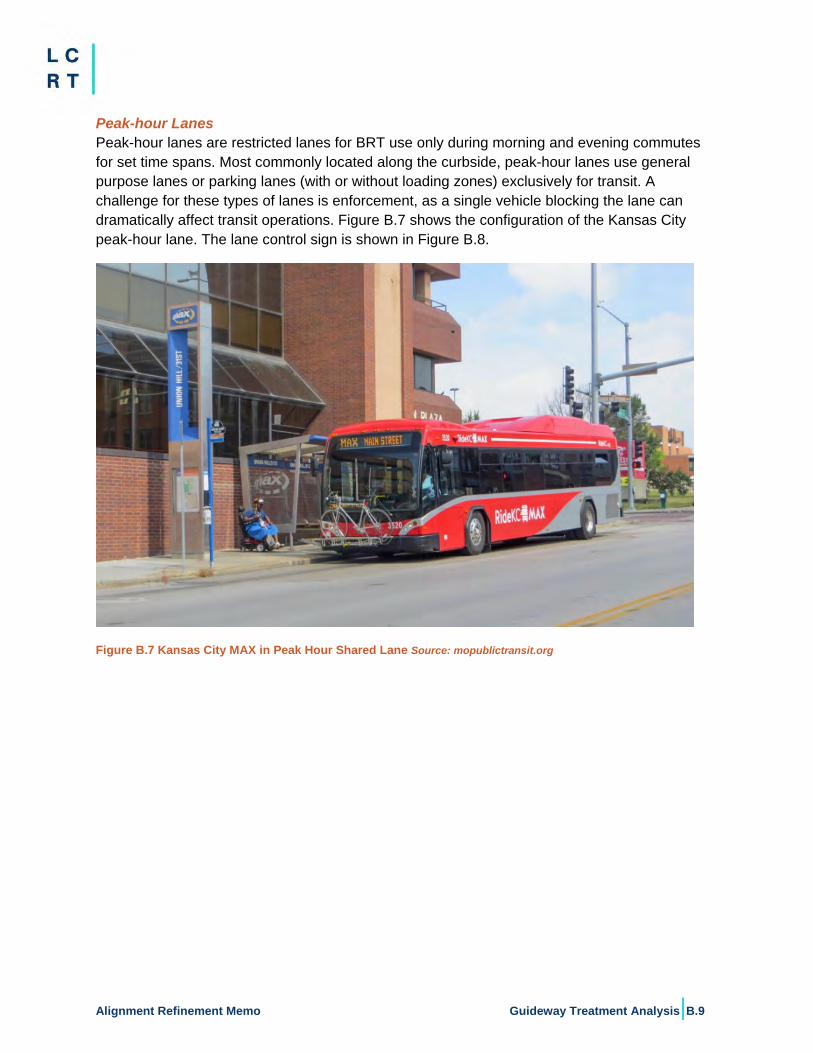
Alignment Refinement Memo Guideway Treatment Analysis|B.9
Peak-hour Lanes Peak-hour lanes are restricted lanes for BRT use only during morning and evening commutes for set time spans. Most commonly located along the curbside, peak-hour lanes use general purpose lanes or parking lanes (with or without loading zones) exclusively for transit. A challenge for these types of lanes is enforcement, as a single vehicle blocking the lane can dramatically affect transit operations. Figure B.7 shows the configuration of the Kansas City peak-hour lane. The lane control sign is shown in Figure B.8.
Figure B.7 Kansas City MAX in Peak Hour Shared Lane Source: mopublictransit.org
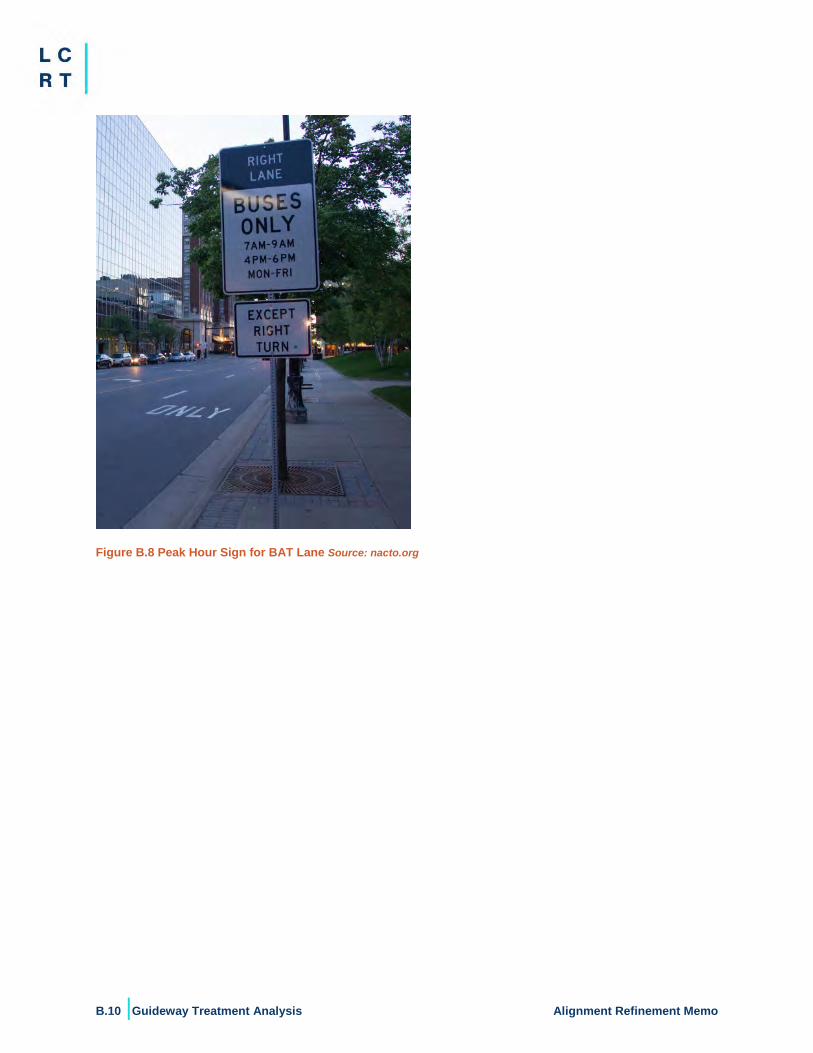
B.10 |Guideway Treatment Analysis Alignment Refinement Memo
Figure B.8 Peak Hour Sign for BAT Lane Source: nacto.org
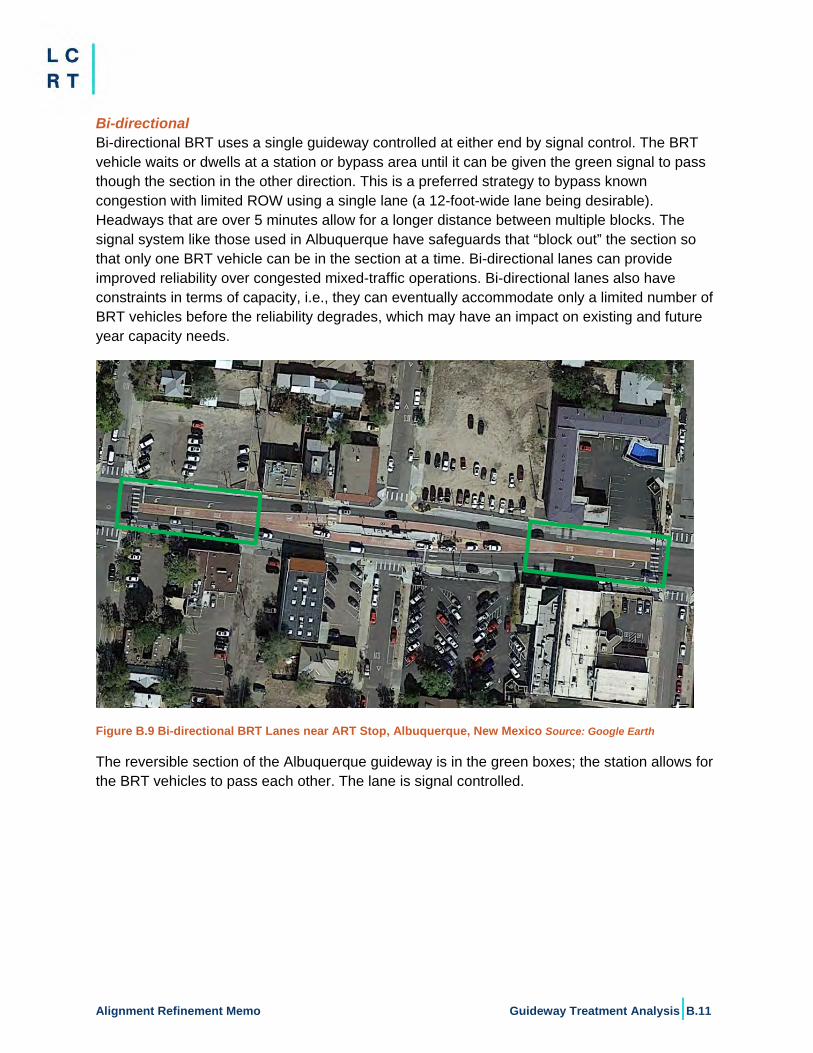
Alignment Refinement Memo Guideway Treatment Analysis|B.11
Bi-directional Bi-directional BRT uses a single guideway controlled at either end by signal control. The BRT vehicle waits or dwells at a station or bypass area until it can be given the green signal to pass though the section in the other direction. This is a preferred strategy to bypass known congestion with limited ROW using a single lane (a 12-foot-wide lane being desirable). Headways that are over 5 minutes allow for a longer distance between multiple blocks. The signal system like those used in Albuquerque have safeguards that “block out” the section so that only one BRT vehicle can be in the section at a time. Bi-directional lanes can provide improved reliability over congested mixed-traffic operations. Bi-directional lanes also have constraints in terms of capacity, i.e., they can eventually accommodate only a limited number of BRT vehicles before the reliability degrades, which may have an impact on existing and future year capacity needs.
Figure B.9 Bi-directional BRT Lanes near ART Stop, Albuquerque, New Mexico Source: Google Earth
The reversible section of the Albuquerque guideway is in the green boxes; the station allows for the BRT vehicles to pass each other. The lane is signal controlled.
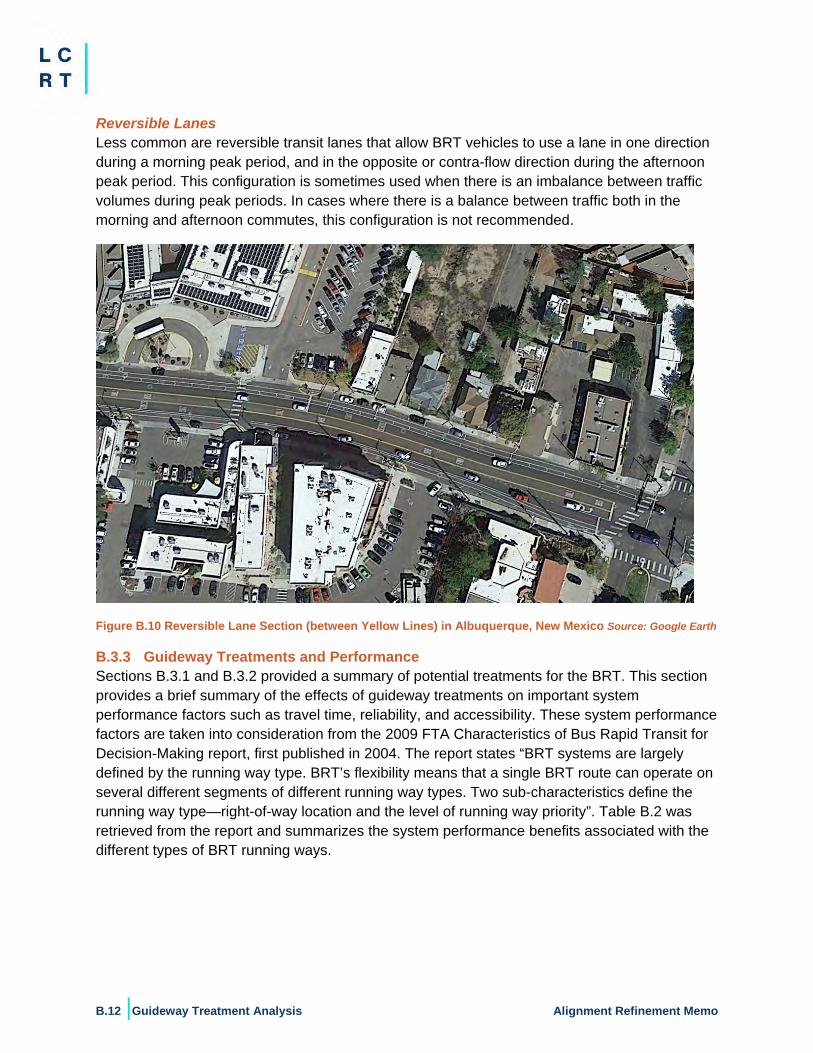
B.12 |Guideway Treatment Analysis Alignment Refinement Memo
Reversible Lanes Less common are reversible transit lanes that allow BRT vehicles to use a lane in one direction during a morning peak period, and in the opposite or contra-flow direction during the afternoon peak period. This configuration is sometimes used when there is an imbalance between traffic volumes during peak periods. In cases where there is a balance between traffic both in the morning and afternoon commutes, this configuration is not recommended.
Figure B.10 Reversible Lane Section (between Yellow Lines) in Albuquerque, New Mexico Source: Google Earth
B.3.3 Guideway Treatments and Performance Sections B.3.1 and B.3.2 provided a summary of potential treatments for the BRT. This section provides a brief summary of the effects of guideway treatments on important system performance factors such as travel time, reliability, and accessibility. These system performance factors are taken into consideration from the 2009 FTA Characteristics of Bus Rapid Transit for Decision-Making report, first published in 2004. The report states “BRT systems are largely defined by the running way type. BRT’s flexibility means that a single BRT route can operate on several different segments of different running way types. Two sub-characteristics define the running way type—right-of-way location and the level of running way priority”. Table B.2 was retrieved from the report and summarizes the system performance benefits associated with the different types of BRT running ways.
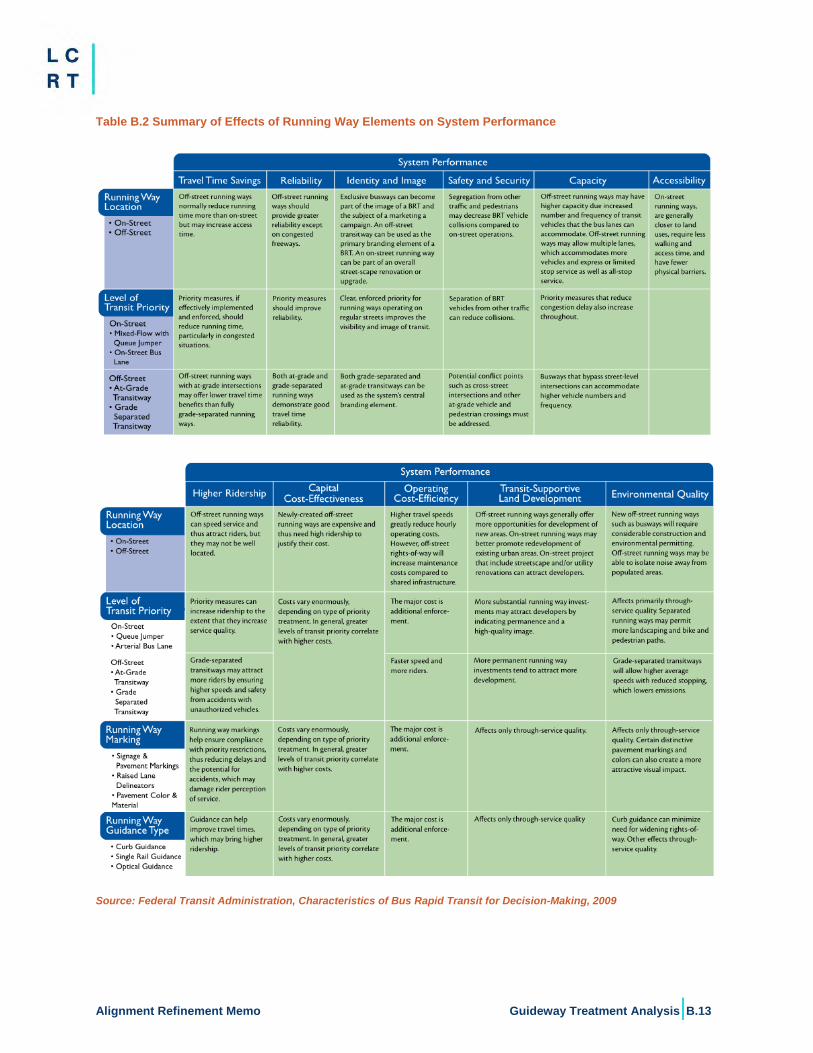
Alignment Refinement Memo Guideway Treatment Analysis|B.13
Table B.2 Summary of Effects of Running Way Elements on System Performance
Source: Federal Transit Administration, Characteristics of Bus Rapid Transit for Decision-Making, 2009
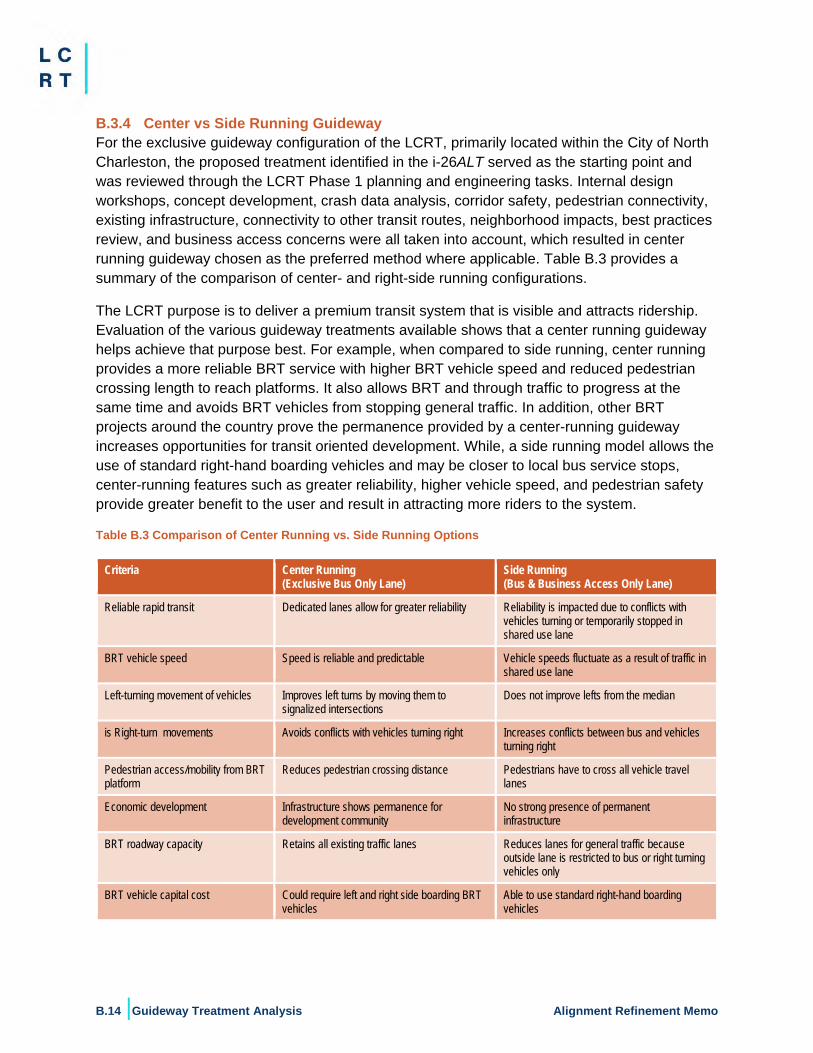
B.14 |Guideway Treatment Analysis Alignment Refinement Memo
B.3.4 Center vs Side Running GuidewayFor the exclusive guideway configuration of the LCRT, primarily located within the City of NorthCharleston, the proposed treatment identified in the i-26ALT served as the starting point andwas reviewed through the LCRT Phase 1 planning and engineering tasks. Internal designworkshops, concept development, crash data analysis, corridor safety, pedestrian connectivity,existing infrastructure, connectivity to other transit routes, neighborhood impacts, best practicesreview, and business access concerns were all taken into account, which resulted in centerrunning guideway chosen as the preferred method where applicable. Table B.3 provides asummary of the comparison of center- and right-side running configurations.
The LCRT purpose is to deliver a premium transit system that is visible and attracts ridership. Evaluation of the various guideway treatments available shows that a center running guideway helps achieve that purpose best. For example, when compared to side running, center running provides a more reliable BRT service with higher BRT vehicle speed and reduced pedestrian crossing length to reach platforms. It also allows BRT and through traffic to progress at the same time and avoids BRT vehicles from stopping general traffic. In addition, other BRT projects around the country prove the permanence provided by a center-running guideway increases opportunities for transit oriented development. While, a side running model allows the use of standard right-hand boarding vehicles and may be closer to local bus service stops, center-running features such as greater reliability, higher vehicle speed, and pedestrian safety provide greater benefit to the user and result in attracting more riders to the system.
Table B.3 Comparison of Center Running vs. Side Running Options
Criteria Center Running (Exclusive Bus Only Lane)
Side Running (Bus & Business Access Only Lane)
Reliable rapid transit Dedicated lanes allow for greater reliability Reliability is impacted due to conflicts with vehicles turning or temporarily stopped in shared use lane
BRT vehicle speed Speed is reliable and predictable Vehicle speeds fluctuate as a result of traffic in shared use lane
Left-turning movement of vehicles Improves left turns by moving them to signalized intersections
Does not improve lefts from the median
is Right-turn movements Avoids conflicts with vehicles turning right Increases conflicts between bus and vehicles turning right
Pedestrian access/mobility from BRT platform
Reduces pedestrian crossing distance Pedestrians have to cross all vehicle travel lanes
Economic development Infrastructure shows permanence for development community
No strong presence of permanent infrastructure
BRT roadway capacity Retains all existing traffic lanes Reduces lanes for general traffic because outside lane is restricted to bus or right turning vehicles only
BRT vehicle capital cost Could require left and right side boarding BRT vehicles
Able to use standard right-hand boarding vehicles
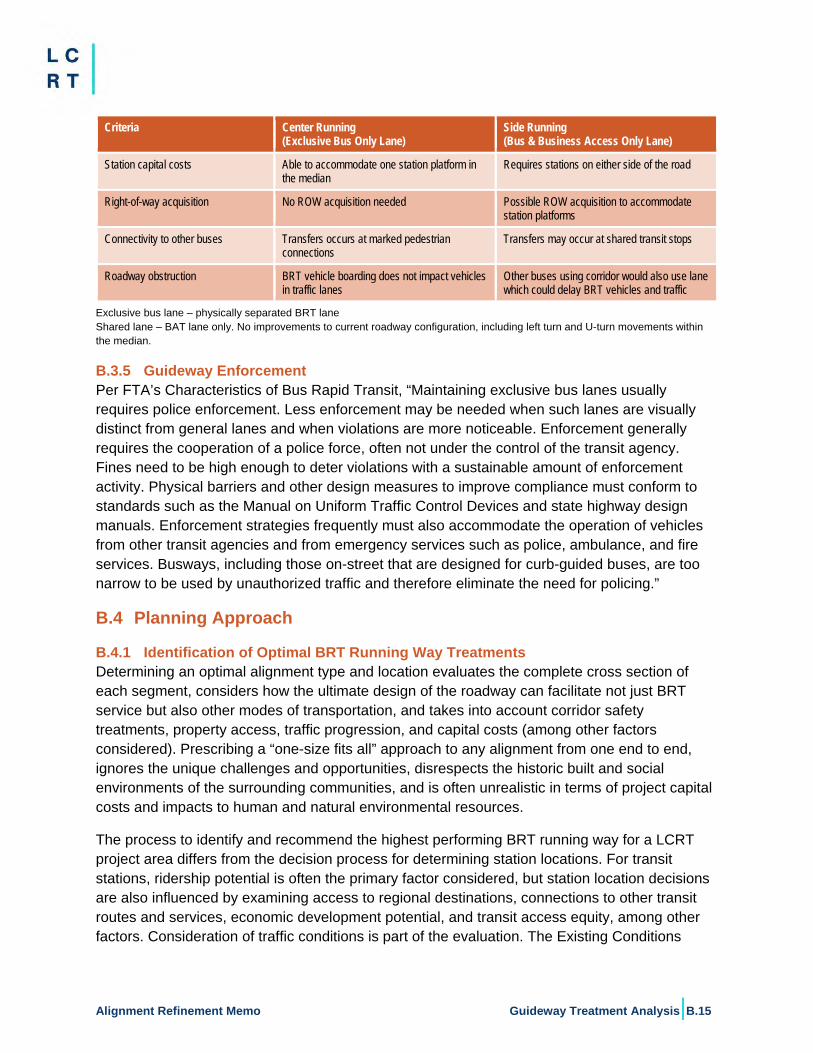
Alignment Refinement Memo Guideway Treatment Analysis|B.15
Criteria Center Running (Exclusive Bus Only Lane)
Side Running (Bus & Business Access Only Lane)
Station capital costs Able to accommodate one station platform in the median
Requires stations on either side of the road
Right-of-way acquisition No ROW acquisition needed Possible ROW acquisition to accommodate station platforms
Connectivity to other buses Transfers occurs at marked pedestrian connections
Transfers may occur at shared transit stops
Roadway obstruction BRT vehicle boarding does not impact vehicles in traffic lanes
Other buses using corridor would also use lane which could delay BRT vehicles and traffic
Exclusive bus lane – physically separated BRT lane Shared lane – BAT lane only. No improvements to current roadway configuration, including left turn and U-turn movements within the median.
B.3.5 Guideway Enforcement Per FTA’s Characteristics of Bus Rapid Transit, “Maintaining exclusive bus lanes usually requires police enforcement. Less enforcement may be needed when such lanes are visually distinct from general lanes and when violations are more noticeable. Enforcement generally requires the cooperation of a police force, often not under the control of the transit agency. Fines need to be high enough to deter violations with a sustainable amount of enforcement activity. Physical barriers and other design measures to improve compliance must conform to standards such as the Manual on Uniform Traffic Control Devices and state highway design manuals. Enforcement strategies frequently must also accommodate the operation of vehicles from other transit agencies and from emergency services such as police, ambulance, and fire services. Busways, including those on-street that are designed for curb-guided buses, are too narrow to be used by unauthorized traffic and therefore eliminate the need for policing.”
B.4 Planning Approach
B.4.1 Identification of Optimal BRT Running Way Treatments Determining an optimal alignment type and location evaluates the complete cross section of each segment, considers how the ultimate design of the roadway can facilitate not just BRT service but also other modes of transportation, and takes into account corridor safety treatments, property access, traffic progression, and capital costs (among other factors considered). Prescribing a “one-size fits all” approach to any alignment from one end to end, ignores the unique challenges and opportunities, disrespects the historic built and social environments of the surrounding communities, and is often unrealistic in terms of project capital costs and impacts to human and natural environmental resources.
The process to identify and recommend the highest performing BRT running way for a LCRT project area differs from the decision process for determining station locations. For transit stations, ridership potential is often the primary factor considered, but station location decisions are also influenced by examining access to regional destinations, connections to other transit routes and services, economic development potential, and transit access equity, among other factors. Consideration of traffic conditions is part of the evaluation. The Existing Conditions
B.16 |Guideway Treatment Analysis Alignment Refinement Memo
Traffic Report Chapter 8 analyzes the current conditions. (https://lowcountryrapidtransit.com/docs/08_LCRT.EC.TrafficConditions.pdf).
As part of the planning process (Phase 1) for the LCRT project, the corridor was subdivided into four planning areas based on a variety of factors including, but not limited to, roadway characteristics and land use. Subdividing a corridor into areas is not an uncommon planning practice, as it helps to distinguish corridor characteristics and urban areas from one another to identify unique needs, opportunities, and challenges. For this analysis, a qualitative assessment of the highest performing guideway configuration was conducted for each planning area. The project purpose and need identified transit benefits as a stated goal. The project team started with the best transit preforming transit guideway treatment and if major logistical or operational issues arose, the treatment type was reduced. For example, a center-running guideway was considered in one area but the associated cost of widening was not feasible; thus, it was ultimately recommended to be mixed traffic. Additionally, the i-26ALT study defined center-running guideways as the preferred treatment. The following is a brief description of the four planning areas, which are illustrated on Figure B.11.
Northern Area Originates from N Main Street (US 17ALT) in downtown Summerville on the west side of I-26 and extends to Nexton Town Center on the east side of I-26, traveling south from Summerville on US 78 and south from Nexton I-26 to the intersection of the US 78 and I-26 interchange.
Center Area Originates from the interchange of US 78 and I-26 traveling south on Rivers Avenue to Carner Avenue where the roadway splits into two roadways, one being the King Street Extension, and the other being Carner Avenue/Meeting Street.
Neck Area Originates where the Rivers Avenue roadway splits into two roadways, one being the King Street Extension, the other Carner Avenue/Meeting Street. The Neck Area ends at Mt. Pleasant Street.
Peninsula (Downtown) Area The Peninsula Area encompasses the City of Charleston’s downtown area from Mt. Pleasant Street to Broad Street.
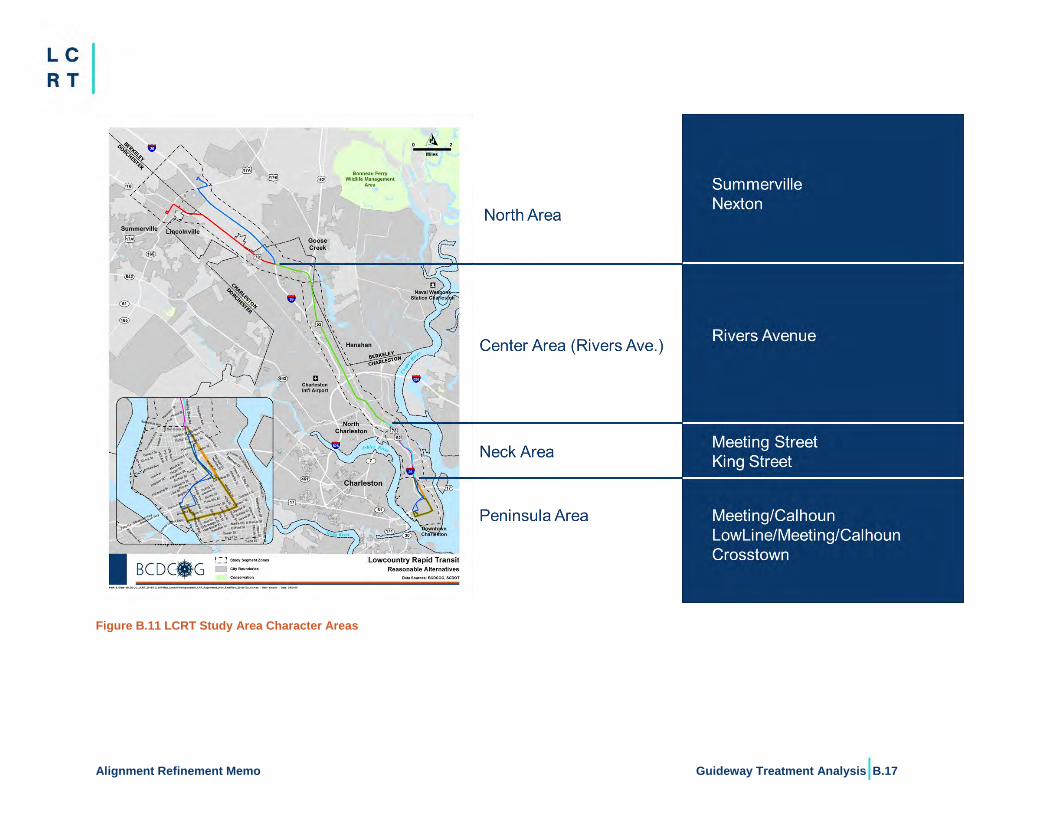
Alignment Refinement Memo Guideway Treatment Analysis|B.17
Figure B.11 LCRT Study Area Character Areas
B.18 |Guideway Treatment Analysis Alignment Refinement Memo
B.4.2 Reasonable Alternatives The evaluation process used a combination of evaluation methods to determine the reasonableness and feasibility of alternatives considered.
The FTA provides project sponsors with guidance for conducting alternatives analyses that discusses reasonable alternatives. While this guidance does not establish rules governing what constitutes a reasonable alternative or range of alternatives, it notes that alternative concepts must be bound in some notion of feasibility and reality for any proposed project. For the purpose of this project, and for identification of the best lane configuration, a definition of reasonable alternatives was established:
Reasonable alternatives include those that are practical or feasible from a technical and fiscal standpoint, and based on common sense. Each alternative should be defined in a way that makes it competitive within the overall set of alternatives under consideration. The alternatives must, within the limits of their technology, respond to the transportation needs in the corridor.
The goal of a guideway evaluation process is to optimize the performance of transit along the streets the BRT vehicle would travel. Each alignment has different opportunities and limitations. Consequently, it is important that each alignment be refined to maximize the use of public ROW, physical facilities, and help enhance transit productivity and performance, while meeting the FTA cost per rider evaluation for the overall project.
Each of the four planning areas had a variety of lane treatment types. Several were eliminated from consideration early in the i-26ALT process; the remaining treatment types were further evaluated.
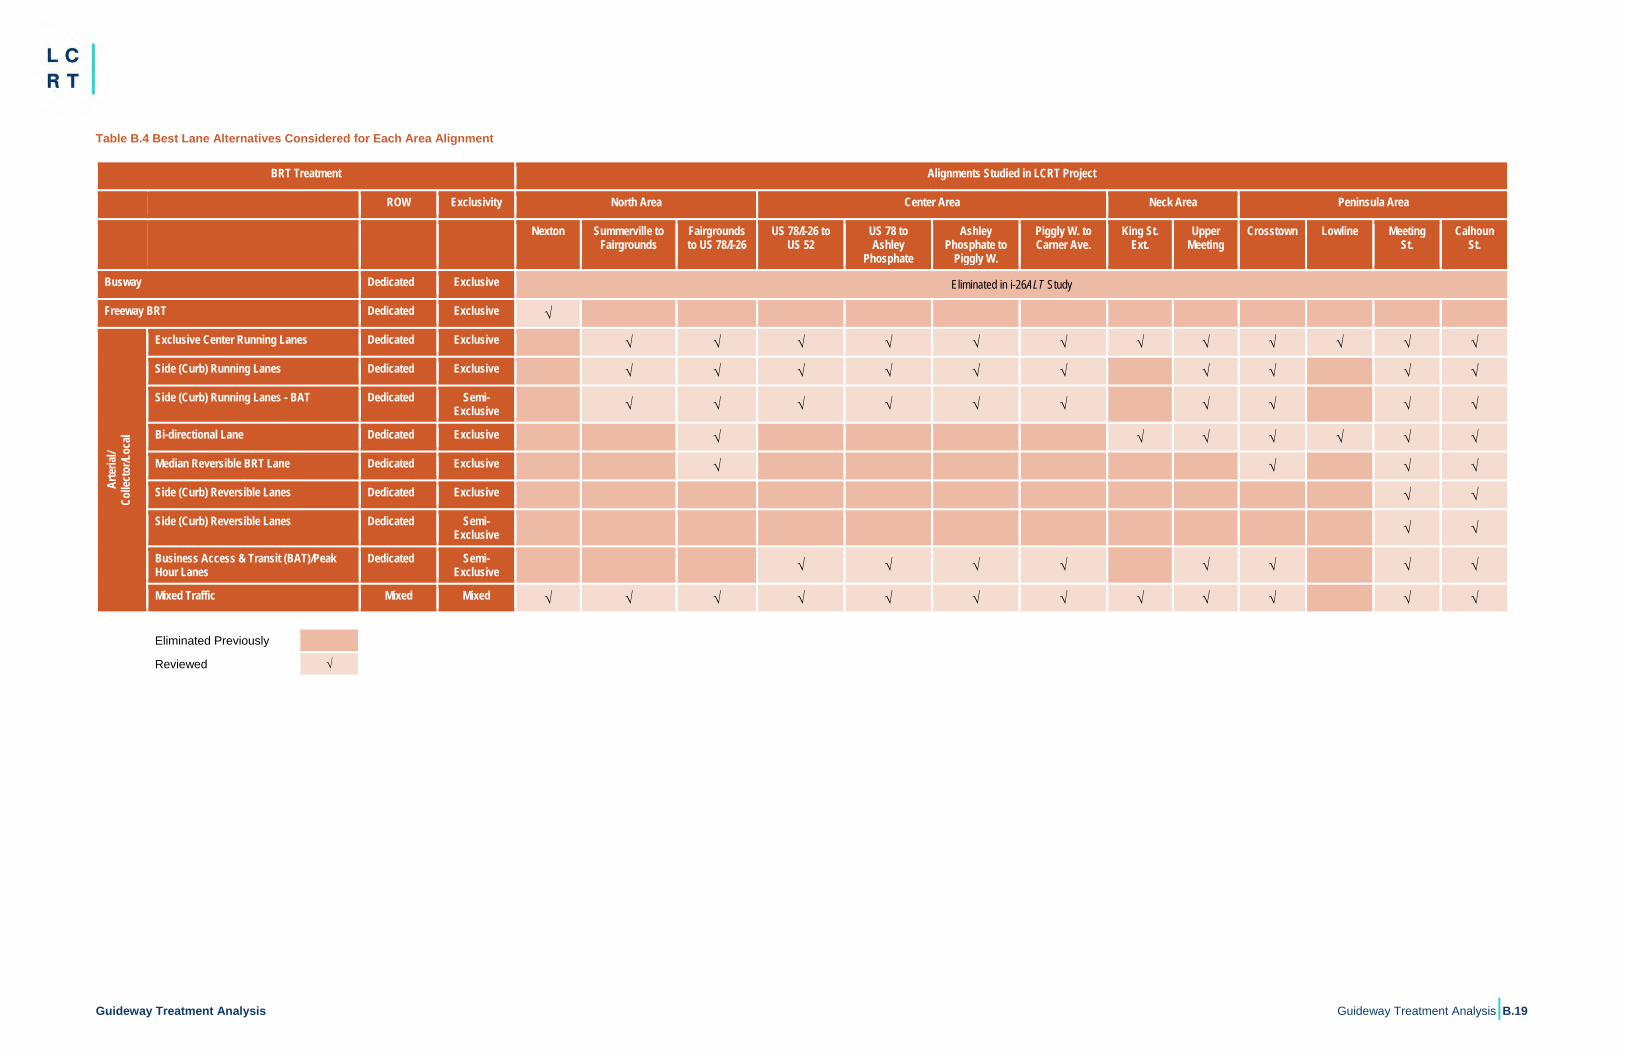
Guideway Treatment Analysis Guideway Treatment Analysis|B.19
Table B.4 Best Lane Alternatives Considered for Each Area Alignment
BRT Treatment Alignments Studied in LCRT Project
ROW Exclusivity North Area Center Area Neck Area Peninsula Area
Nexton Summerville to Fairgrounds
Fairgrounds to US 78/I-26
US 78/I-26 to US 52
US 78 to Ashley
Phosphate
Ashley Phosphate to
Piggly W.
Piggly W. to Carner Ave.
King St. Ext.
Upper Meeting
Crosstown Lowline Meeting St.
Calhoun St.
Busway Dedicated Exclusive Eliminated in i-26ALT Study
Freeway BRT Dedicated Exclusive √
Arte
rial/
Colle
ctor
/Loc
al
Exclusive Center Running Lanes Dedicated Exclusive √ √ √ √ √ √ √ √ √ √ √ √ Side (Curb) Running Lanes Dedicated Exclusive √ √ √ √ √ √ √ √ √ √ Side (Curb) Running Lanes - BAT Dedicated Semi-
Exclusive √ √ √ √ √ √ √ √ √ √
Bi-directional Lane Dedicated Exclusive √ √ √ √ √ √ √ Median Reversible BRT Lane Dedicated Exclusive √ √ √ √ Side (Curb) Reversible Lanes Dedicated Exclusive √ √ Side (Curb) Reversible Lanes Dedicated Semi-
Exclusive √ √
Business Access & Transit (BAT)/Peak Hour Lanes
Dedicated Semi-Exclusive
√ √ √ √ √ √ √ √
Mixed Traffic Mixed Mixed √ √ √ √ √ √ √ √ √ √ √ √
Eliminated Previously
Reviewed √
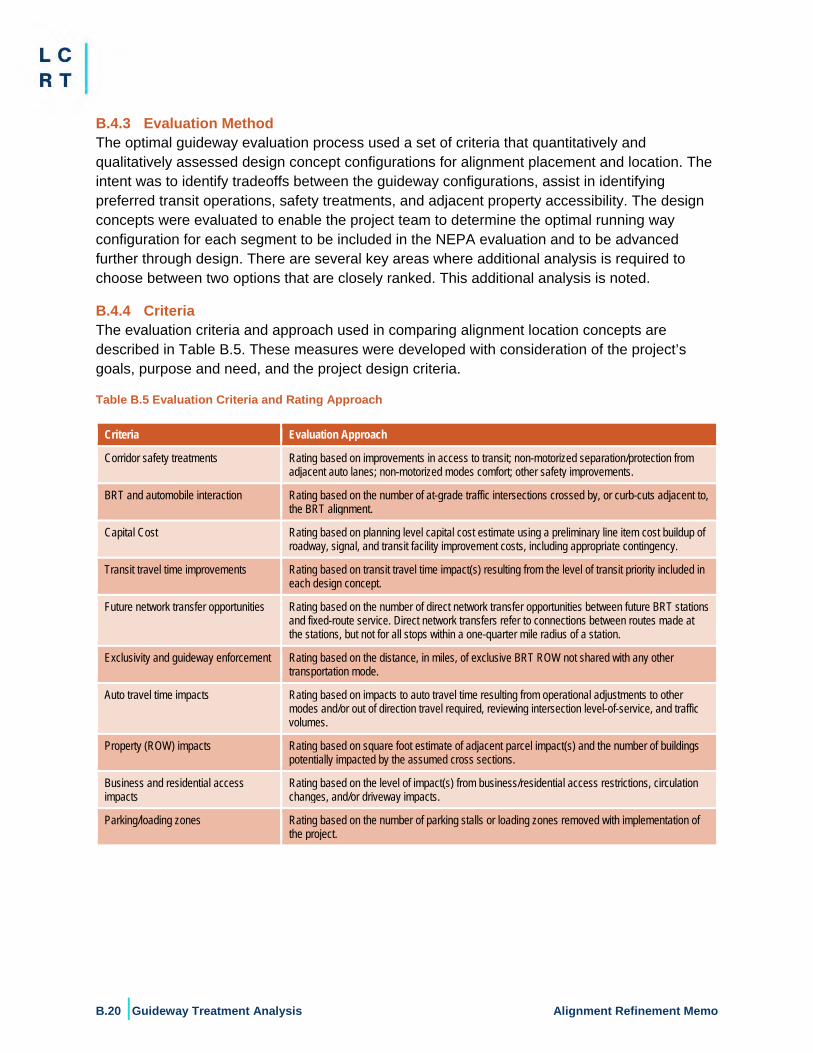
B.20 |Guideway Treatment Analysis Alignment Refinement Memo
B.4.3 Evaluation Method The optimal guideway evaluation process used a set of criteria that quantitatively and qualitatively assessed design concept configurations for alignment placement and location. The intent was to identify tradeoffs between the guideway configurations, assist in identifying preferred transit operations, safety treatments, and adjacent property accessibility. The design concepts were evaluated to enable the project team to determine the optimal running way configuration for each segment to be included in the NEPA evaluation and to be advanced further through design. There are several key areas where additional analysis is required to choose between two options that are closely ranked. This additional analysis is noted.
B.4.4 Criteria The evaluation criteria and approach used in comparing alignment location concepts are described in Table B.5. These measures were developed with consideration of the project’s goals, purpose and need, and the project design criteria.
Table B.5 Evaluation Criteria and Rating Approach
Criteria Evaluation Approach
Corridor safety treatments Rating based on improvements in access to transit; non-motorized separation/protection from adjacent auto lanes; non-motorized modes comfort; other safety improvements.
BRT and automobile interaction Rating based on the number of at-grade traffic intersections crossed by, or curb-cuts adjacent to, the BRT alignment.
Capital Cost Rating based on planning level capital cost estimate using a preliminary line item cost buildup of roadway, signal, and transit facility improvement costs, including appropriate contingency.
Transit travel time improvements Rating based on transit travel time impact(s) resulting from the level of transit priority included in each design concept.
Future network transfer opportunities Rating based on the number of direct network transfer opportunities between future BRT stations and fixed-route service. Direct network transfers refer to connections between routes made at the stations, but not for all stops within a one-quarter mile radius of a station.
Exclusivity and guideway enforcement Rating based on the distance, in miles, of exclusive BRT ROW not shared with any other transportation mode.
Auto travel time impacts Rating based on impacts to auto travel time resulting from operational adjustments to other modes and/or out of direction travel required, reviewing intersection level-of-service, and traffic volumes.
Property (ROW) impacts Rating based on square foot estimate of adjacent parcel impact(s) and the number of buildings potentially impacted by the assumed cross sections.
Business and residential access impacts
Rating based on the level of impact(s) from business/residential access restrictions, circulation changes, and/or driveway impacts.
Parking/loading zones Rating based on the number of parking stalls or loading zones removed with implementation of the project.
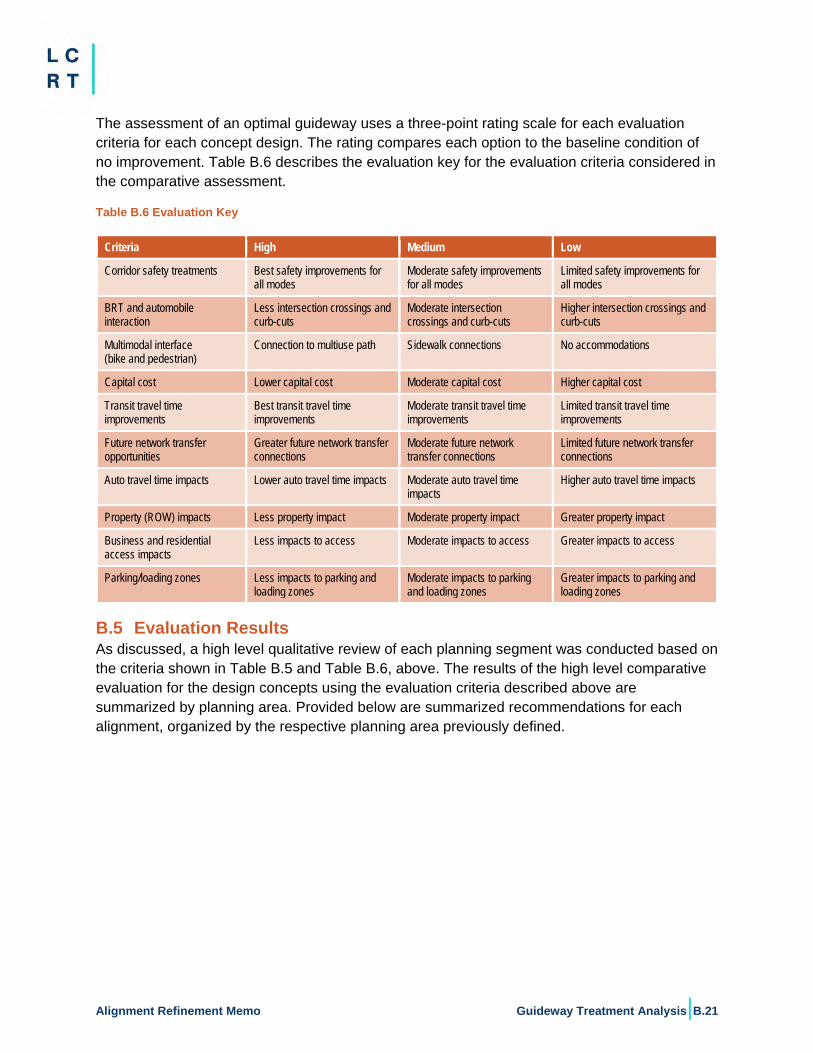
Alignment Refinement Memo Guideway Treatment Analysis|B.21
The assessment of an optimal guideway uses a three-point rating scale for each evaluation criteria for each concept design. The rating compares each option to the baseline condition of no improvement. Table B.6 describes the evaluation key for the evaluation criteria considered in the comparative assessment.
Table B.6 Evaluation Key
Criteria High Medium Low
Corridor safety treatments Best safety improvements for all modes
Moderate safety improvements for all modes
Limited safety improvements for all modes
BRT and automobile interaction
Less intersection crossings and curb-cuts
Moderate intersection crossings and curb-cuts
Higher intersection crossings and curb-cuts
Multimodal interface (bike and pedestrian)
Connection to multiuse path Sidewalk connections No accommodations
Capital cost Lower capital cost Moderate capital cost Higher capital cost
Transit travel time improvements
Best transit travel time improvements
Moderate transit travel time improvements
Limited transit travel time improvements
Future network transfer opportunities
Greater future network transfer connections
Moderate future network transfer connections
Limited future network transfer connections
Auto travel time impacts Lower auto travel time impacts Moderate auto travel time impacts
Higher auto travel time impacts
Property (ROW) impacts Less property impact Moderate property impact Greater property impact
Business and residential access impacts
Less impacts to access Moderate impacts to access Greater impacts to access
Parking/loading zones Less impacts to parking and loading zones
Moderate impacts to parking and loading zones
Greater impacts to parking and loading zones
B.5 Evaluation Results As discussed, a high level qualitative review of each planning segment was conducted based on the criteria shown in Table B.5 and Table B.6, above. The results of the high level comparative evaluation for the design concepts using the evaluation criteria described above are summarized by planning area. Provided below are summarized recommendations for each alignment, organized by the respective planning area previously defined.
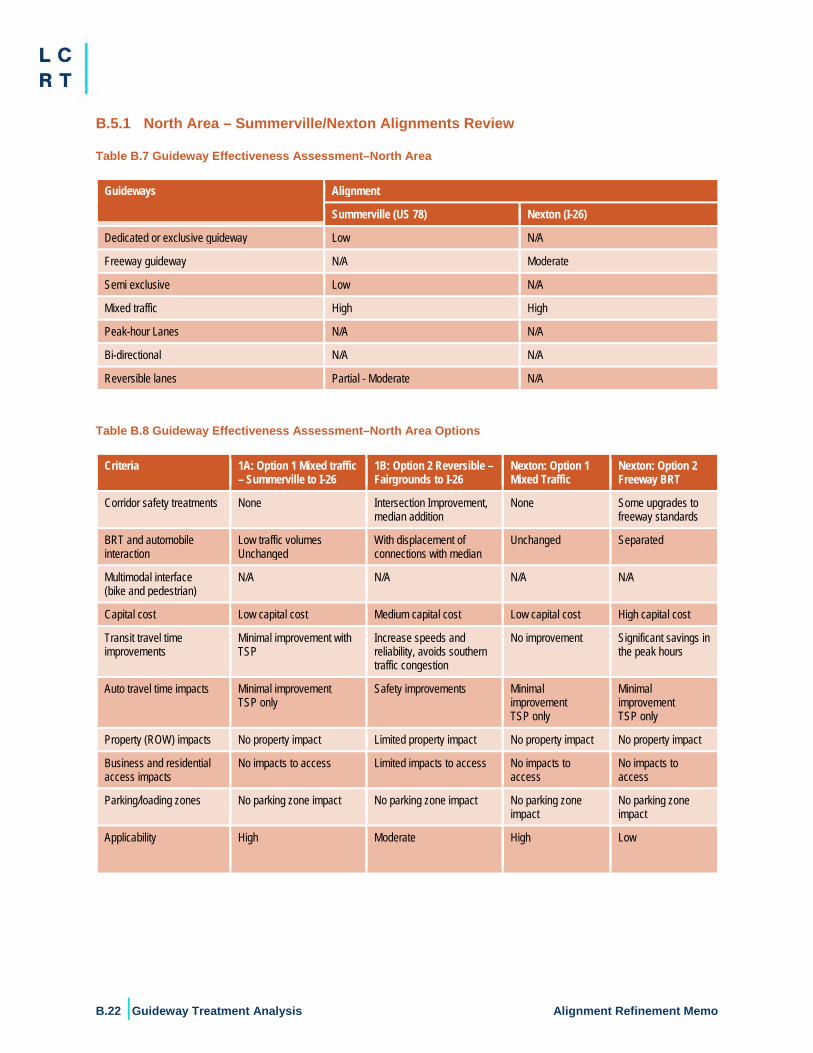
B.22 |Guideway Treatment Analysis Alignment Refinement Memo
B.5.1 North Area – Summerville/Nexton Alignments Review
Table B.7 Guideway Effectiveness Assessment–North Area
Guideways Alignment
Summerville (US 78) Nexton (I-26)
Dedicated or exclusive guideway Low N/A
Freeway guideway N/A Moderate
Semi exclusive Low N/A
Mixed traffic High High
Peak-hour Lanes N/A N/A
Bi-directional N/A N/A
Reversible lanes Partial - Moderate N/A
Table B.8 Guideway Effectiveness Assessment–North Area Options
Criteria 1A: Option 1 Mixed traffic – Summerville to I-26
1B: Option 2 Reversible – Fairgrounds to I-26
Nexton: Option 1 Mixed Traffic
Nexton: Option 2 Freeway BRT
Corridor safety treatments None Intersection Improvement, median addition
None Some upgrades to freeway standards
BRT and automobile interaction
Low traffic volumes Unchanged
With displacement of connections with median
Unchanged Separated
Multimodal interface (bike and pedestrian)
N/A N/A N/A N/A
Capital cost Low capital cost Medium capital cost Low capital cost High capital cost
Transit travel time improvements
Minimal improvement with TSP
Increase speeds and reliability, avoids southern traffic congestion
No improvement Significant savings in the peak hours
Auto travel time impacts Minimal improvement TSP only
Safety improvements Minimal improvement TSP only
Minimal improvement TSP only
Property (ROW) impacts No property impact Limited property impact No property impact No property impact
Business and residential access impacts
No impacts to access Limited impacts to access No impacts to access
No impacts to access
Parking/loading zones No parking zone impact No parking zone impact No parking zone impact
No parking zone impact
Applicability High Moderate High Low
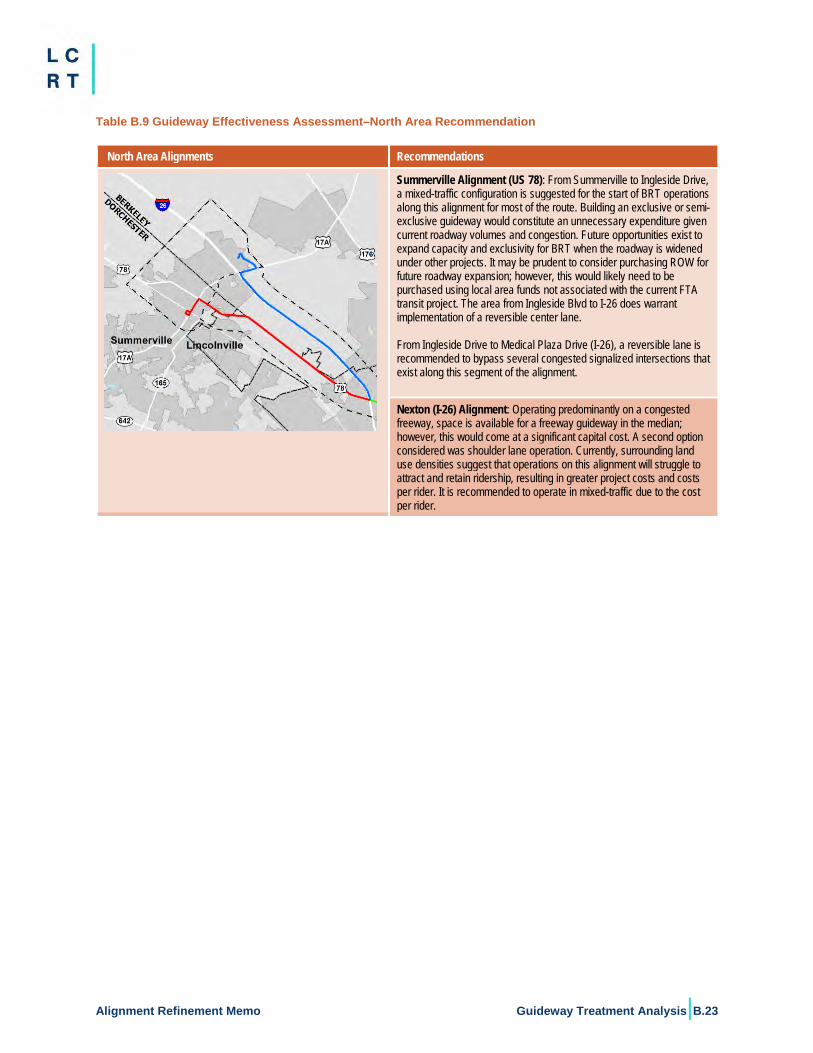
Alignment Refinement Memo Guideway Treatment Analysis|B.23
Table B.9 Guideway Effectiveness Assessment–North Area Recommendation
North Area Alignments Recommendations
Summerville Alignment (US 78): From Summerville to Ingleside Drive, a mixed-traffic configuration is suggested for the start of BRT operations along this alignment for most of the route. Building an exclusive or semi-exclusive guideway would constitute an unnecessary expenditure given current roadway volumes and congestion. Future opportunities exist to expand capacity and exclusivity for BRT when the roadway is widened under other projects. It may be prudent to consider purchasing ROW for future roadway expansion; however, this would likely need to be purchased using local area funds not associated with the current FTA transit project. The area from Ingleside Blvd to I-26 does warrant implementation of a reversible center lane.
From Ingleside Drive to Medical Plaza Drive (I-26), a reversible lane is recommended to bypass several congested signalized intersections that exist along this segment of the alignment.
Nexton (I-26) Alignment: Operating predominantly on a congested freeway, space is available for a freeway guideway in the median; however, this would come at a significant capital cost. A second option considered was shoulder lane operation. Currently, surrounding land use densities suggest that operations on this alignment will struggle to attract and retain ridership, resulting in greater project costs and costs per rider. It is recommended to operate in mixed-traffic due to the cost per rider.
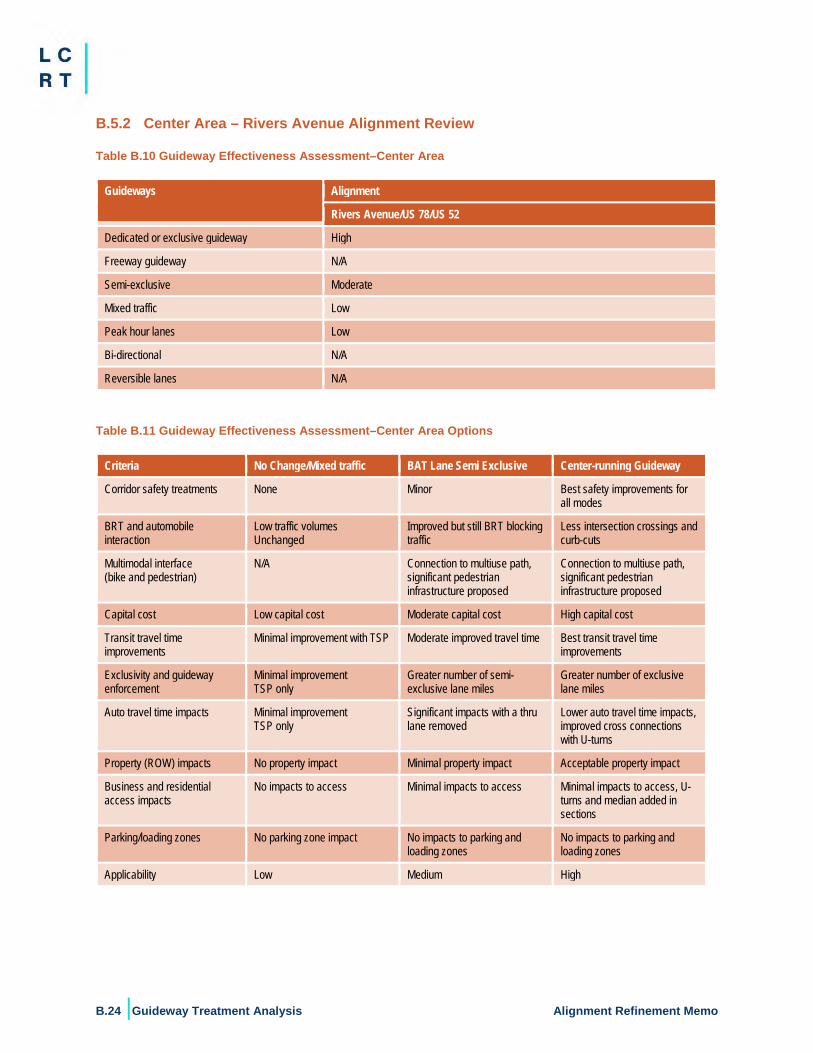
B.24 |Guideway Treatment Analysis Alignment Refinement Memo
B.5.2 Center Area – Rivers Avenue Alignment Review
Table B.10 Guideway Effectiveness Assessment–Center Area
Guideways Alignment
Rivers Avenue/US 78/US 52
Dedicated or exclusive guideway High
Freeway guideway N/A
Semi-exclusive Moderate
Mixed traffic Low
Peak hour lanes Low
Bi-directional N/A
Reversible lanes N/A
Table B.11 Guideway Effectiveness Assessment–Center Area Options
Criteria No Change/Mixed traffic BAT Lane Semi Exclusive Center-running Guideway
Corridor safety treatments None Minor Best safety improvements for all modes
BRT and automobile interaction
Low traffic volumes Unchanged
Improved but still BRT blocking traffic
Less intersection crossings and curb-cuts
Multimodal interface (bike and pedestrian)
N/A Connection to multiuse path, significant pedestrian infrastructure proposed
Connection to multiuse path, significant pedestrian infrastructure proposed
Capital cost Low capital cost Moderate capital cost High capital cost
Transit travel time improvements
Minimal improvement with TSP Moderate improved travel time Best transit travel time improvements
Exclusivity and guideway enforcement
Minimal improvement TSP only
Greater number of semi-exclusive lane miles
Greater number of exclusive lane miles
Auto travel time impacts Minimal improvement TSP only
Significant impacts with a thru lane removed
Lower auto travel time impacts, improved cross connections with U-turns
Property (ROW) impacts No property impact Minimal property impact Acceptable property impact
Business and residential access impacts
No impacts to access Minimal impacts to access Minimal impacts to access, U-turns and median added in sections
Parking/loading zones No parking zone impact No impacts to parking and loading zones
No impacts to parking and loading zones
Applicability Low Medium High
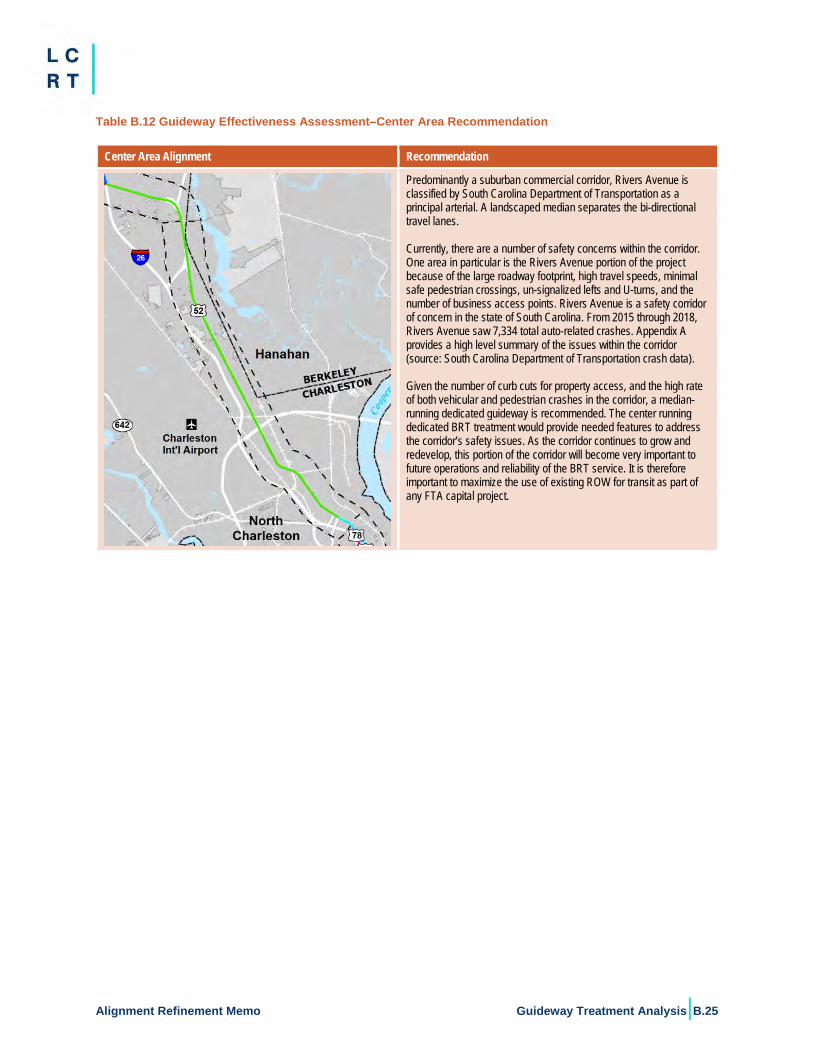
Alignment Refinement Memo Guideway Treatment Analysis|B.25
Table B.12 Guideway Effectiveness Assessment–Center Area Recommendation
Center Area Alignment Recommendation
Predominantly a suburban commercial corridor, Rivers Avenue is classified by South Carolina Department of Transportation as a principal arterial. A landscaped median separates the bi-directional travel lanes. Currently, there are a number of safety concerns within the corridor. One area in particular is the Rivers Avenue portion of the project because of the large roadway footprint, high travel speeds, minimal safe pedestrian crossings, un-signalized lefts and U-turns, and the number of business access points. Rivers Avenue is a safety corridor of concern in the state of South Carolina. From 2015 through 2018, Rivers Avenue saw 7,334 total auto-related crashes. Appendix A provides a high level summary of the issues within the corridor (source: South Carolina Department of Transportation crash data). Given the number of curb cuts for property access, and the high rate of both vehicular and pedestrian crashes in the corridor, a median-running dedicated guideway is recommended. The center running dedicated BRT treatment would provide needed features to address the corridor’s safety issues. As the corridor continues to grow and redevelop, this portion of the corridor will become very important to future operations and reliability of the BRT service. It is therefore important to maximize the use of existing ROW for transit as part of any FTA capital project.
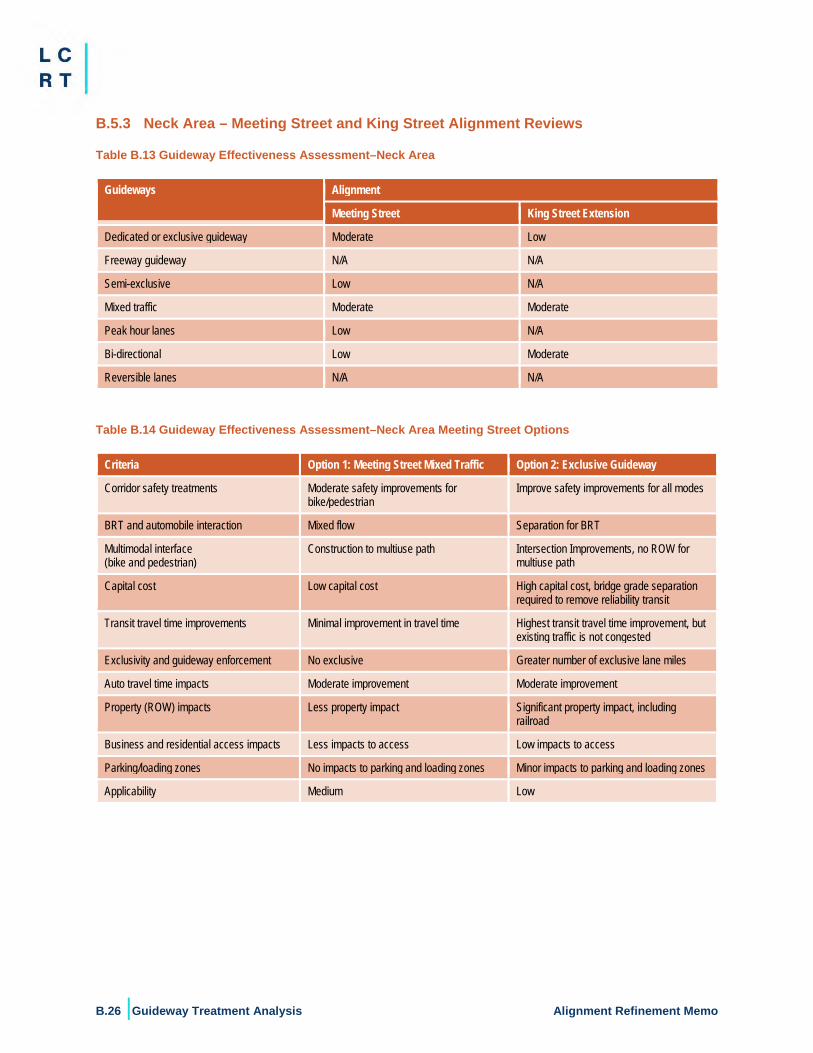
B.26 |Guideway Treatment Analysis Alignment Refinement Memo
B.5.3 Neck Area – Meeting Street and King Street Alignment Reviews Table B.13 Guideway Effectiveness Assessment–Neck Area
Guideways Alignment
Meeting Street King Street Extension
Dedicated or exclusive guideway Moderate Low
Freeway guideway N/A N/A
Semi-exclusive Low N/A
Mixed traffic Moderate Moderate
Peak hour lanes Low N/A
Bi-directional Low Moderate
Reversible lanes N/A N/A
Table B.14 Guideway Effectiveness Assessment–Neck Area Meeting Street Options
Criteria Option 1: Meeting Street Mixed Traffic Option 2: Exclusive Guideway
Corridor safety treatments Moderate safety improvements for bike/pedestrian
Improve safety improvements for all modes
BRT and automobile interaction Mixed flow Separation for BRT
Multimodal interface (bike and pedestrian)
Construction to multiuse path Intersection Improvements, no ROW for multiuse path
Capital cost Low capital cost High capital cost, bridge grade separation required to remove reliability transit
Transit travel time improvements Minimal improvement in travel time Highest transit travel time improvement, but existing traffic is not congested
Exclusivity and guideway enforcement No exclusive Greater number of exclusive lane miles
Auto travel time impacts Moderate improvement Moderate improvement
Property (ROW) impacts Less property impact Significant property impact, including railroad
Business and residential access impacts Less impacts to access Low impacts to access
Parking/loading zones No impacts to parking and loading zones Minor impacts to parking and loading zones
Applicability Medium Low
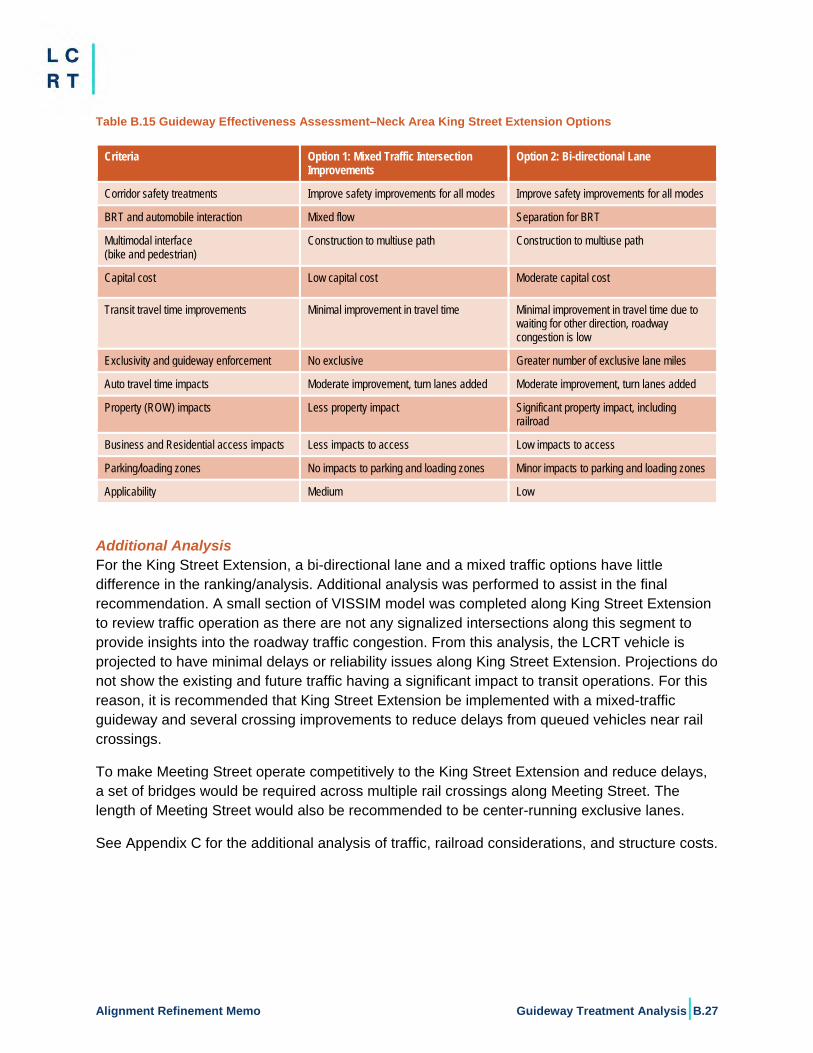
Alignment Refinement Memo Guideway Treatment Analysis|B.27
Table B.15 Guideway Effectiveness Assessment–Neck Area King Street Extension Options
Criteria Option 1: Mixed Traffic Intersection Improvements
Option 2: Bi-directional Lane
Corridor safety treatments Improve safety improvements for all modes Improve safety improvements for all modes
BRT and automobile interaction Mixed flow Separation for BRT
Multimodal interface (bike and pedestrian)
Construction to multiuse path Construction to multiuse path
Capital cost Low capital cost Moderate capital cost
Transit travel time improvements Minimal improvement in travel time Minimal improvement in travel time due to waiting for other direction, roadway congestion is low
Exclusivity and guideway enforcement No exclusive Greater number of exclusive lane miles
Auto travel time impacts Moderate improvement, turn lanes added Moderate improvement, turn lanes added
Property (ROW) impacts Less property impact Significant property impact, including railroad
Business and Residential access impacts Less impacts to access Low impacts to access
Parking/loading zones No impacts to parking and loading zones Minor impacts to parking and loading zones
Applicability Medium Low
Additional Analysis For the King Street Extension, a bi-directional lane and a mixed traffic options have little difference in the ranking/analysis. Additional analysis was performed to assist in the final recommendation. A small section of VISSIM model was completed along King Street Extension to review traffic operation as there are not any signalized intersections along this segment to provide insights into the roadway traffic congestion. From this analysis, the LCRT vehicle is projected to have minimal delays or reliability issues along King Street Extension. Projections do not show the existing and future traffic having a significant impact to transit operations. For this reason, it is recommended that King Street Extension be implemented with a mixed-traffic guideway and several crossing improvements to reduce delays from queued vehicles near rail crossings.
To make Meeting Street operate competitively to the King Street Extension and reduce delays, a set of bridges would be required across multiple rail crossings along Meeting Street. The length of Meeting Street would also be recommended to be center-running exclusive lanes.
See Appendix C for the additional analysis of traffic, railroad considerations, and structure costs.
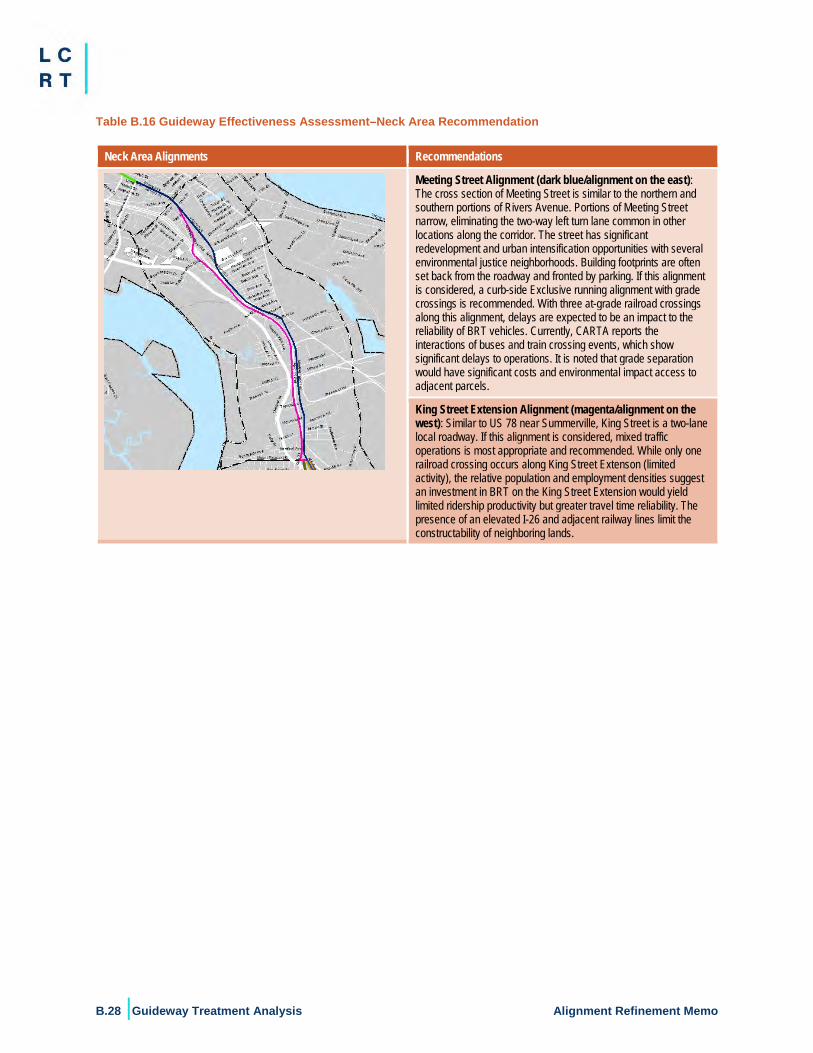
B.28 |Guideway Treatment Analysis Alignment Refinement Memo
Table B.16 Guideway Effectiveness Assessment–Neck Area Recommendation
Neck Area Alignments Recommendations
Meeting Street Alignment (dark blue/alignment on the east): The cross section of Meeting Street is similar to the northern and southern portions of Rivers Avenue. Portions of Meeting Street narrow, eliminating the two-way left turn lane common in other locations along the corridor. The street has significant redevelopment and urban intensification opportunities with several environmental justice neighborhoods. Building footprints are often set back from the roadway and fronted by parking. If this alignment is considered, a curb-side Exclusive running alignment with grade crossings is recommended. With three at-grade railroad crossings along this alignment, delays are expected to be an impact to the reliability of BRT vehicles. Currently, CARTA reports the interactions of buses and train crossing events, which show significant delays to operations. It is noted that grade separation would have significant costs and environmental impact access to adjacent parcels.
King Street Extension Alignment (magenta/alignment on the west): Similar to US 78 near Summerville, King Street is a two-lane local roadway. If this alignment is considered, mixed traffic operations is most appropriate and recommended. While only one railroad crossing occurs along King Street Extenson (limited activity), the relative population and employment densities suggest an investment in BRT on the King Street Extension would yield limited ridership productivity but greater travel time reliability. The presence of an elevated I-26 and adjacent railway lines limit the constructability of neighboring lands.
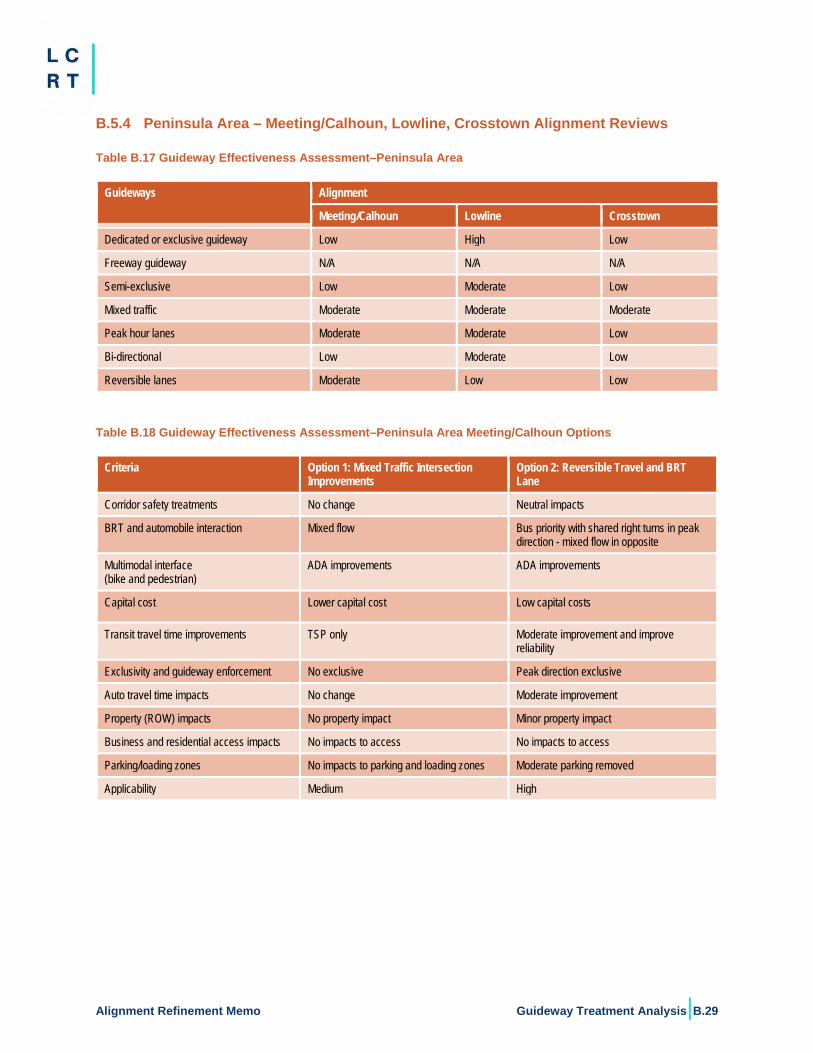
Alignment Refinement Memo Guideway Treatment Analysis|B.29
B.5.4 Peninsula Area – Meeting/Calhoun, Lowline, Crosstown Alignment Reviews
Table B.17 Guideway Effectiveness Assessment–Peninsula Area
Guideways Alignment
Meeting/Calhoun Lowline Crosstown
Dedicated or exclusive guideway Low High Low
Freeway guideway N/A N/A N/A
Semi-exclusive Low Moderate Low
Mixed traffic Moderate Moderate Moderate
Peak hour lanes Moderate Moderate Low
Bi-directional Low Moderate Low
Reversible lanes Moderate Low Low
Table B.18 Guideway Effectiveness Assessment–Peninsula Area Meeting/Calhoun Options
Criteria Option 1: Mixed Traffic Intersection Improvements
Option 2: Reversible Travel and BRT Lane
Corridor safety treatments No change Neutral impacts
BRT and automobile interaction Mixed flow Bus priority with shared right turns in peak direction - mixed flow in opposite
Multimodal interface (bike and pedestrian)
ADA improvements ADA improvements
Capital cost Lower capital cost Low capital costs
Transit travel time improvements TSP only Moderate improvement and improve reliability
Exclusivity and guideway enforcement No exclusive Peak direction exclusive
Auto travel time impacts No change Moderate improvement
Property (ROW) impacts No property impact Minor property impact
Business and residential access impacts No impacts to access No impacts to access
Parking/loading zones No impacts to parking and loading zones Moderate parking removed
Applicability Medium High
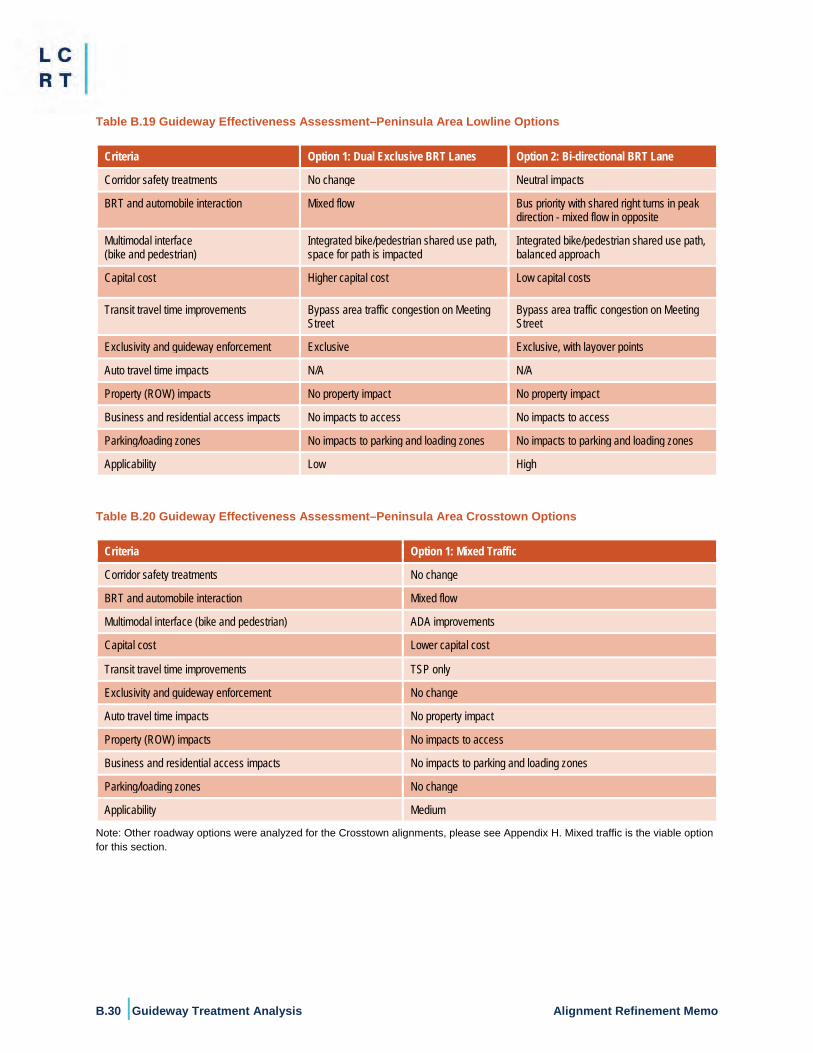
B.30 |Guideway Treatment Analysis Alignment Refinement Memo
Table B.19 Guideway Effectiveness Assessment–Peninsula Area Lowline Options
Criteria Option 1: Dual Exclusive BRT Lanes Option 2: Bi-directional BRT Lane
Corridor safety treatments No change Neutral impacts
BRT and automobile interaction Mixed flow Bus priority with shared right turns in peak direction - mixed flow in opposite
Multimodal interface (bike and pedestrian)
Integrated bike/pedestrian shared use path, space for path is impacted
Integrated bike/pedestrian shared use path, balanced approach
Capital cost Higher capital cost Low capital costs
Transit travel time improvements Bypass area traffic congestion on Meeting Street
Bypass area traffic congestion on Meeting Street
Exclusivity and guideway enforcement Exclusive Exclusive, with layover points
Auto travel time impacts N/A N/A
Property (ROW) impacts No property impact No property impact
Business and residential access impacts No impacts to access No impacts to access
Parking/loading zones No impacts to parking and loading zones No impacts to parking and loading zones
Applicability Low High
Table B.20 Guideway Effectiveness Assessment–Peninsula Area Crosstown Options
Criteria Option 1: Mixed Traffic
Corridor safety treatments No change
BRT and automobile interaction Mixed flow
Multimodal interface (bike and pedestrian) ADA improvements
Capital cost Lower capital cost
Transit travel time improvements TSP only
Exclusivity and guideway enforcement No change
Auto travel time impacts No property impact
Property (ROW) impacts No impacts to access
Business and residential access impacts No impacts to parking and loading zones
Parking/loading zones No change
Applicability Medium
Note: Other roadway options were analyzed for the Crosstown alignments, please see Appendix H. Mixed traffic is the viable option for this section.
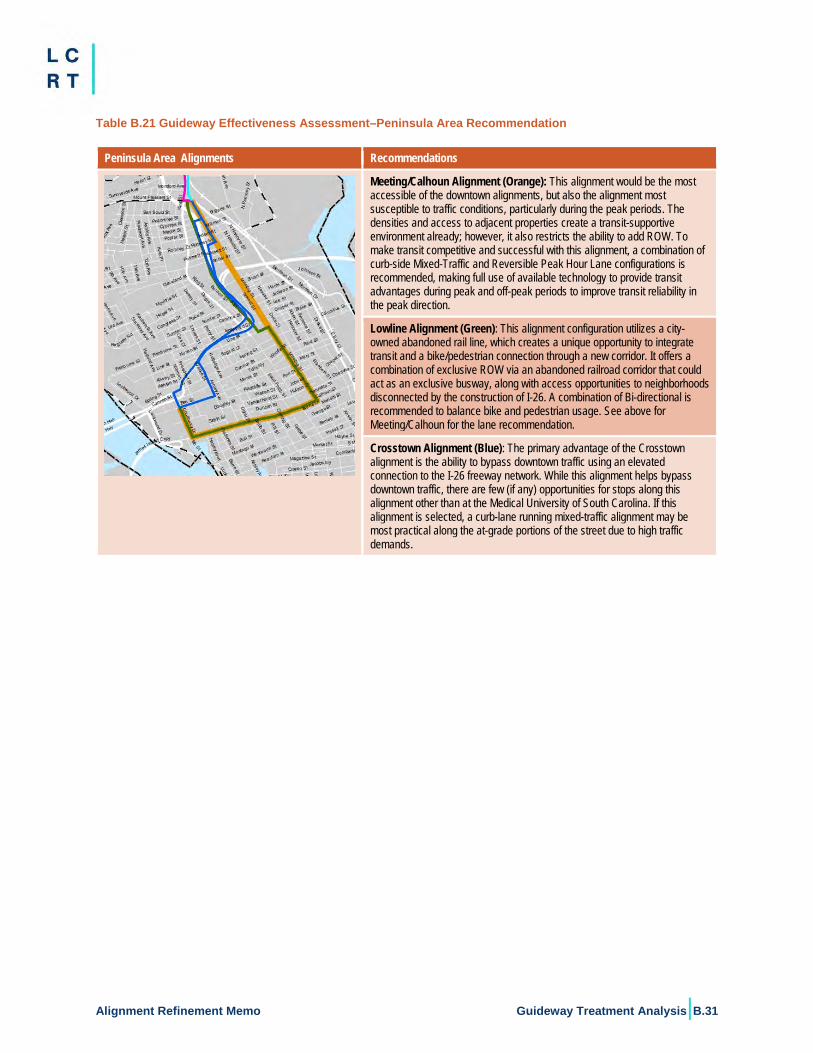
Alignment Refinement Memo Guideway Treatment Analysis|B.31
Table B.21 Guideway Effectiveness Assessment–Peninsula Area Recommendation
Peninsula Area Alignments Recommendations
Meeting/Calhoun Alignment (Orange): This alignment would be the most accessible of the downtown alignments, but also the alignment most susceptible to traffic conditions, particularly during the peak periods. The densities and access to adjacent properties create a transit-supportive environment already; however, it also restricts the ability to add ROW. To make transit competitive and successful with this alignment, a combination of curb-side Mixed-Traffic and Reversible Peak Hour Lane configurations is recommended, making full use of available technology to provide transit advantages during peak and off-peak periods to improve transit reliability in the peak direction.
Lowline Alignment (Green): This alignment configuration utilizes a city-owned abandoned rail line, which creates a unique opportunity to integrate transit and a bike/pedestrian connection through a new corridor. It offers a combination of exclusive ROW via an abandoned railroad corridor that could act as an exclusive busway, along with access opportunities to neighborhoods disconnected by the construction of I-26. A combination of Bi-directional is recommended to balance bike and pedestrian usage. See above for Meeting/Calhoun for the lane recommendation.
Crosstown Alignment (Blue): The primary advantage of the Crosstown alignment is the ability to bypass downtown traffic using an elevated connection to the I-26 freeway network. While this alignment helps bypass downtown traffic, there are few (if any) opportunities for stops along this alignment other than at the Medical University of South Carolina. If this alignment is selected, a curb-lane running mixed-traffic alignment may be most practical along the at-grade portions of the street due to high traffic demands.
B.32 |Guideway Treatment Analysis Alignment Refinement Memo
B.6 Conclusions Charleston’s historical character and unique development patterns, coupled with the length of the desired LCRT corridor present a wide range of urban, suburban, and rural landscapes, all of which a BRT alignment can operate in and serve. The challenge is to find the right combinations of treatments that best balance costs, maximize ridership potential, and minimize impacts, while still keeping the project competitive.
The LCRT project needs to be competitive to score well against other projects across the nation vying for FTA CIG funding. Thus, the project needs to demonstrate ridership that justifies the costs, which is typically done by having at least 50 percent or more of its operation in a dedicated guideway. Having a majority of the project in that dedicated ROW will allow it to have improved transit vehicle speeds, reduced transit travel times, and improved reliability; especially when compared to existing transit services in the region and to other modal choices. Given that the areas within the project study area vary in character and ROW availability, different BRT guideway treatments will need to be applied to each area as appropriate.
Finding an optimal running way treatment is a balance among project attractiveness, cost control, and negative impact reduction. Therefore, in addition to being in its own ROW, the LCRT may need to operate in mixed traffic at times. Operations in mixed traffic makes the vehicles susceptible to traffic delays during peak hours and roadway crashes or other traffic incidents. This may impact on-time performance, service reliability, speed, and customer satisfaction, but may be the best choice given existing conditions. Likewise, side running/mixed-traffic configurations require a station and ROW on both curb sides of the alignment, in turn increasing the cost of the project, compared to a single shared median station.
Along a significant portion of the corridor, the BRT can operate in dedicated ROW along Rivers Avenue from the US 78/I-26 interchange to Carner Avenue as described earlier. Operating in a dedicated guideway offers the following benefits:
Provides faster vehicle speeds that yield greater ridership Qualifies for more FTA streetscape improvements Reduces pedestrian crossing distances with center-running stations Provides infrastructure permanence, which in turn attracts development Reduces conflict with traffic and other transit vehicles, and retains both right- and left-
turn movements for automobiles.
Table B.22 depicts the current recommended running way treatment by segments based on current information and analyses.
Running way treatments and enhancements will continue to be refined for the final preferred project alignment in subsequent phases of the project as more detailed information about field conditions are known and designs are finalized. However, to advance the project forward, these conclusions are more than sufficient to make project decisions and to advance this stage.

Alignment Refinement Memo Guideway Treatment Analysis|B.33
Table B.22 Recommended Guideway Treatment per Area
BRT Treatment Alignments Studied in LCRT Project
ROW Exclusivity North Area Center Area Neck Area Peninsula Area
Nexton Summerville to Fairgrounds
Fairgrounds to US 78/I-26
US 78/I-26 to US 52
US 78 to Ashley
Phosphate
Ashley Phosphate to
Piggly W.
Piggly W. to Carner Ave.
King St. Ext.
Upper Meeting
Crosstown Lowline Meeting St.
Calhoun St.
Busway Dedicated Exclusive Eliminated in i-26ALT Study
Freeway BRT Dedicated Exclusive √
Arte
rial/
Colle
ctor
/Loc
al
Exclusive Center Running Lanes Dedicated Exclusive √ √ √ √ √ √ √ √ √ √ √ √ Side (Curb) Running Lanes Dedicated Exclusive √ √ √ √ √ √ √ √ √ √ Side (Curb) Running Lanes - BAT Dedicated Semi-
exclusive √ √ √ √ √ √ √ √ √ √
Bi-directional Lane Dedicated Exclusive √ √ √ √ √ √ √ Median Reversible BRT Lane Dedicated Exclusive √ √ √ √ Side (Curb) Reversible Lanes Dedicated Exclusive √ √ Side (Curb) Reversible Lanes Dedicated Semi-
exclusive √ √
Business Access & Transit (BAT)/Peak Hour Lanes Dedicated Semi-
exclusive √ √ √ √ √ √ √ √
Mixed Traffic Mixed Mixed √ √ √ √ √ √ √ √ √ √ √ √ Eliminated Previously Reviewed √ Selected √
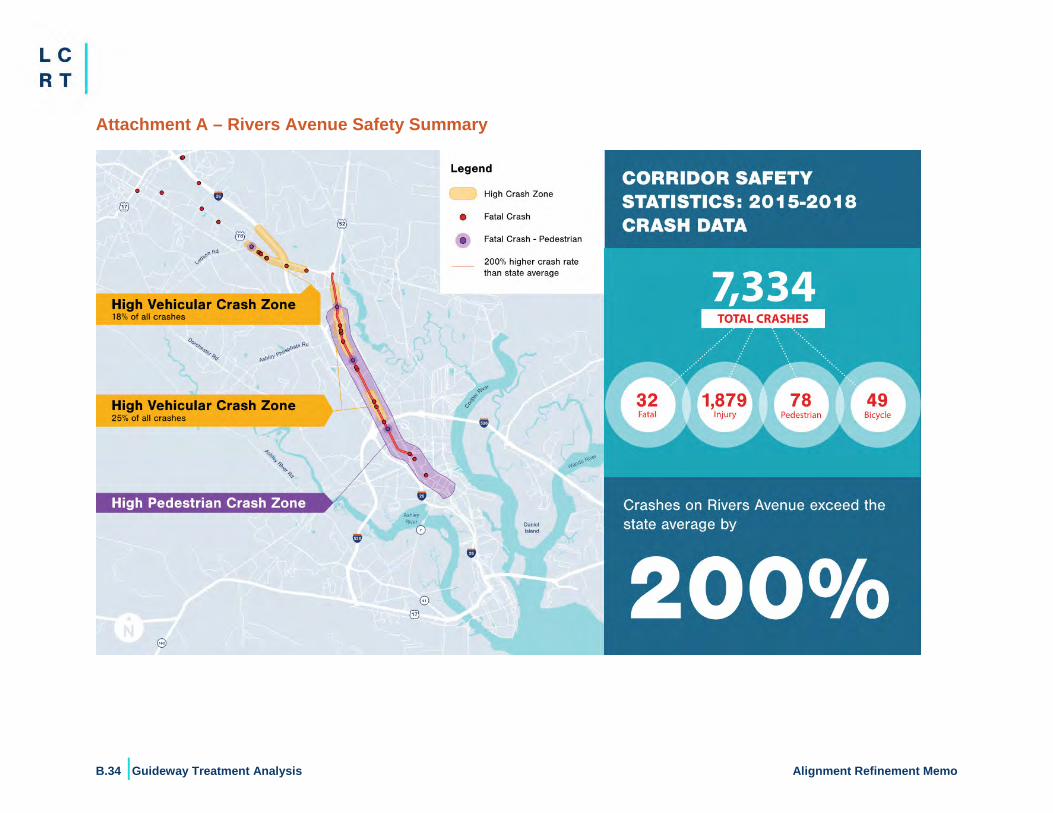
B.34 |Guideway Treatment Analysis Alignment Refinement Memo
Attachment A – Rivers Avenue Safety Summary
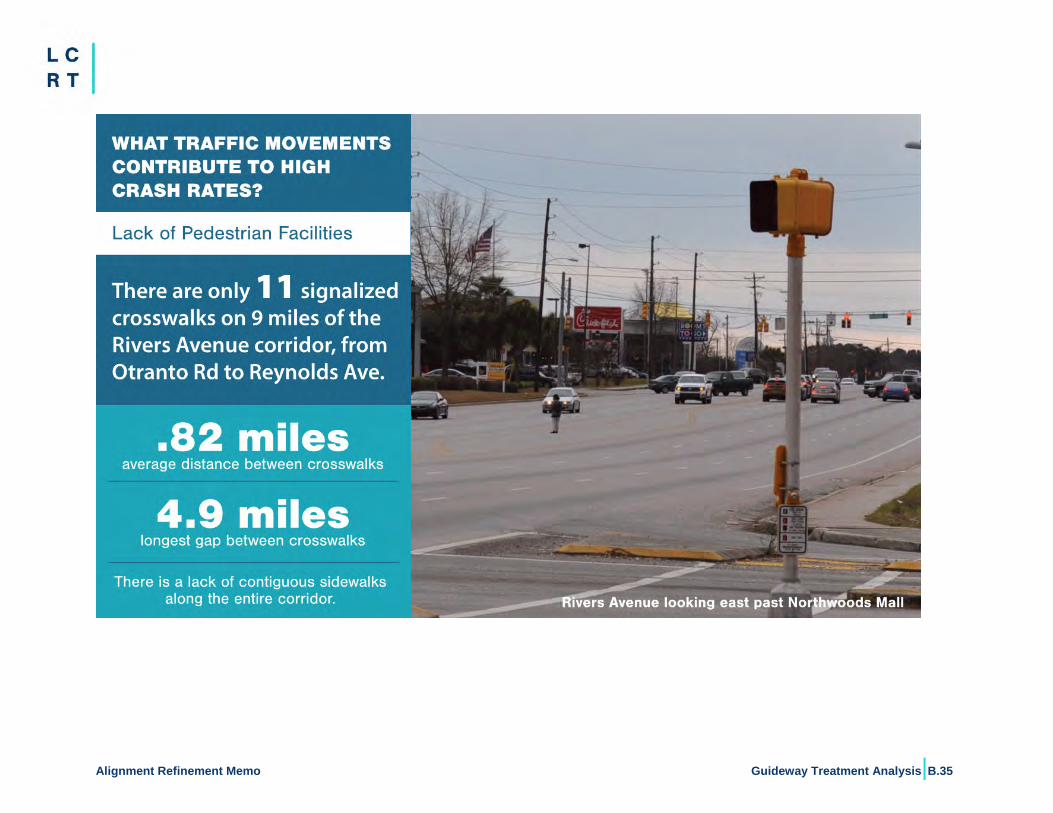
Alignment Refinement Memo Guideway Treatment Analysis|B.35
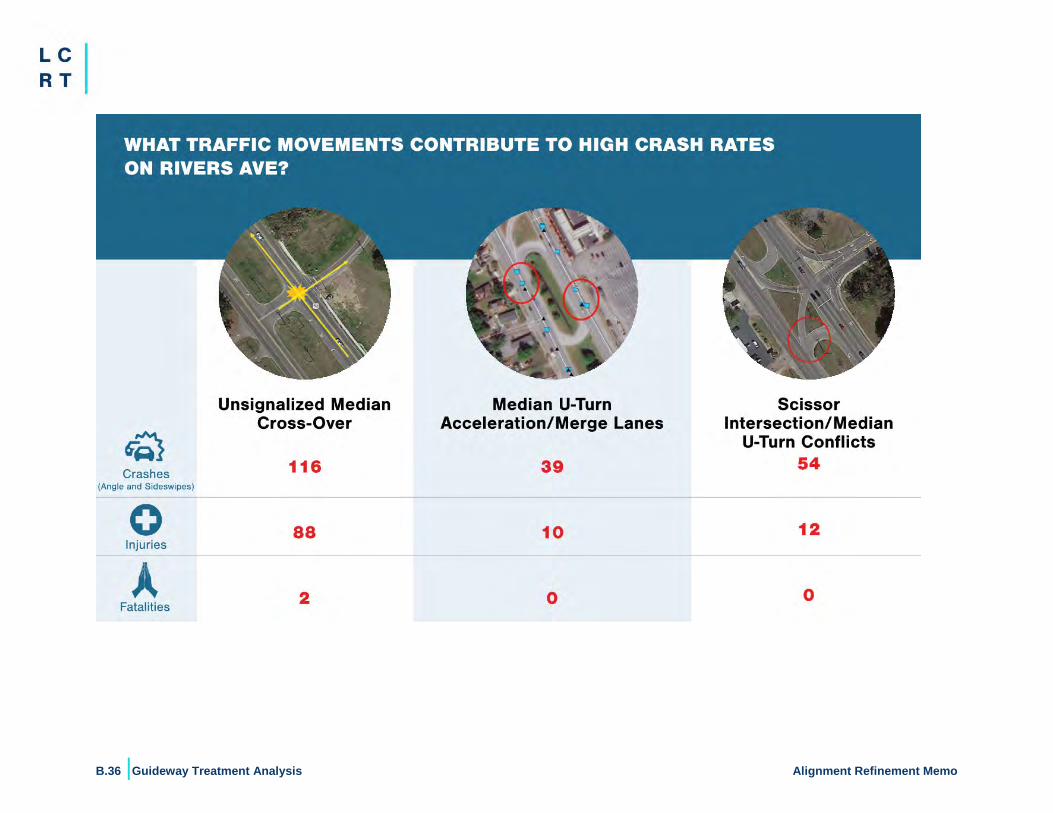
B.36 |Guideway Treatment Analysis Alignment Refinement Memo
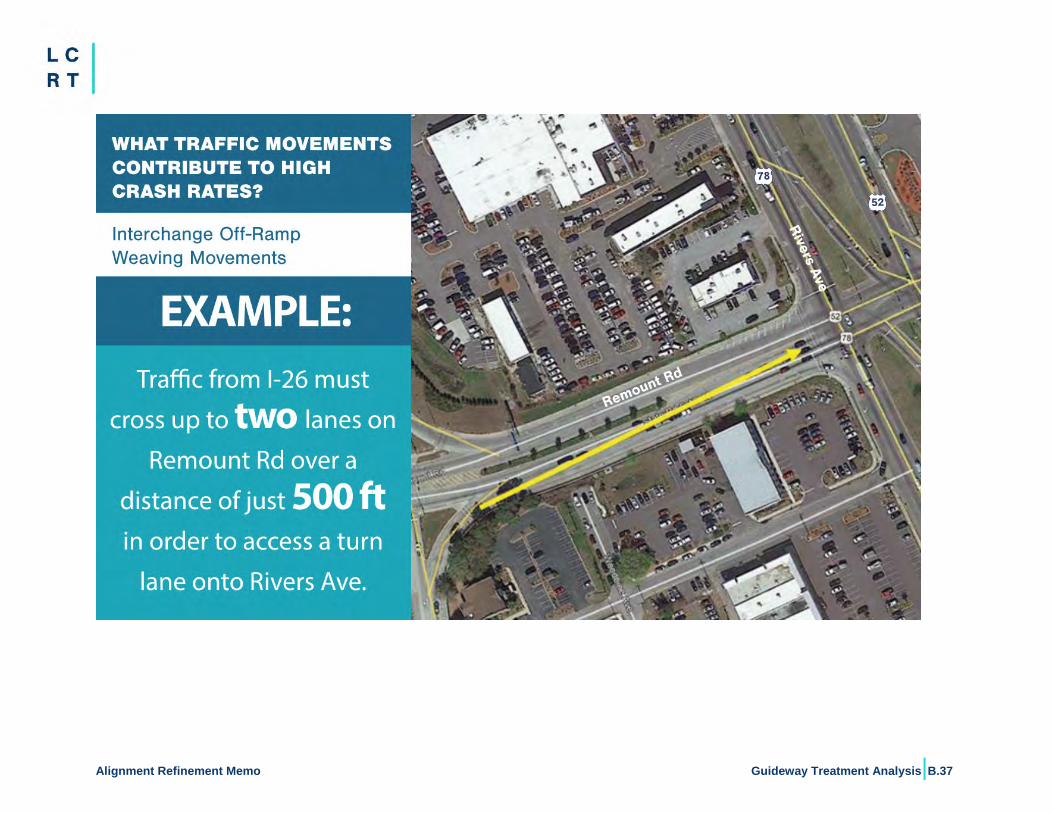
Alignment Refinement Memo Guideway Treatment Analysis|B.37
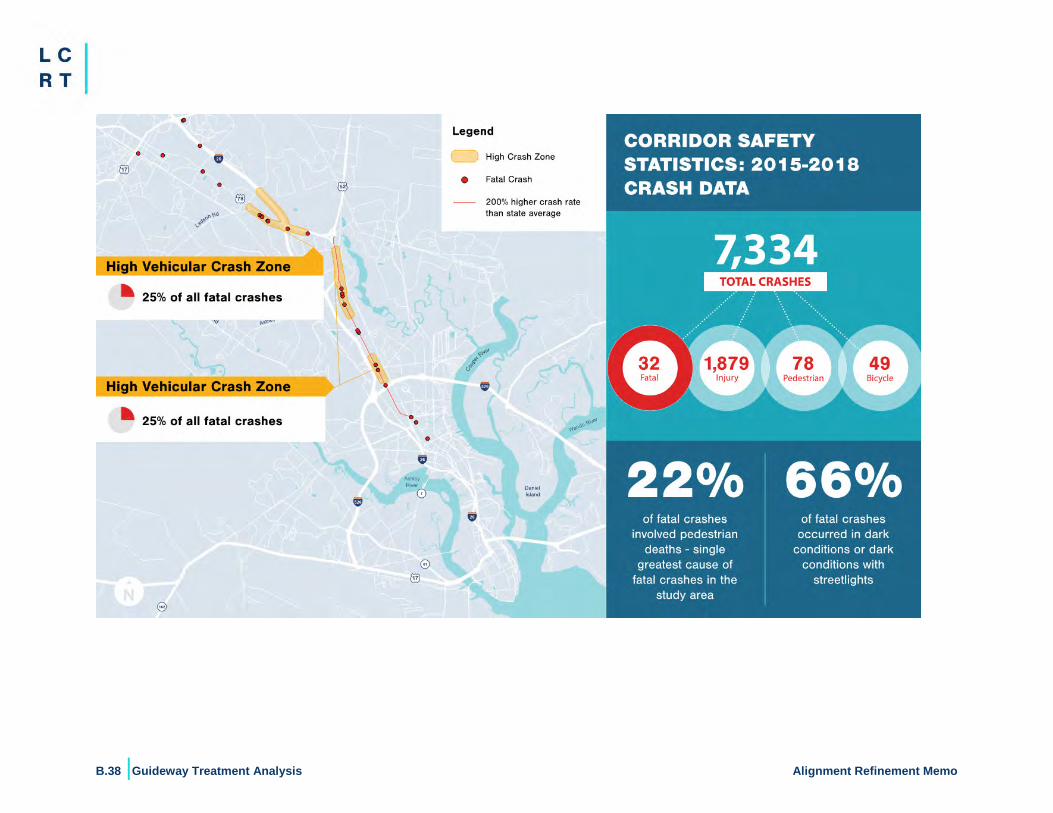
B.38 |Guideway Treatment Analysis Alignment Refinement Memo
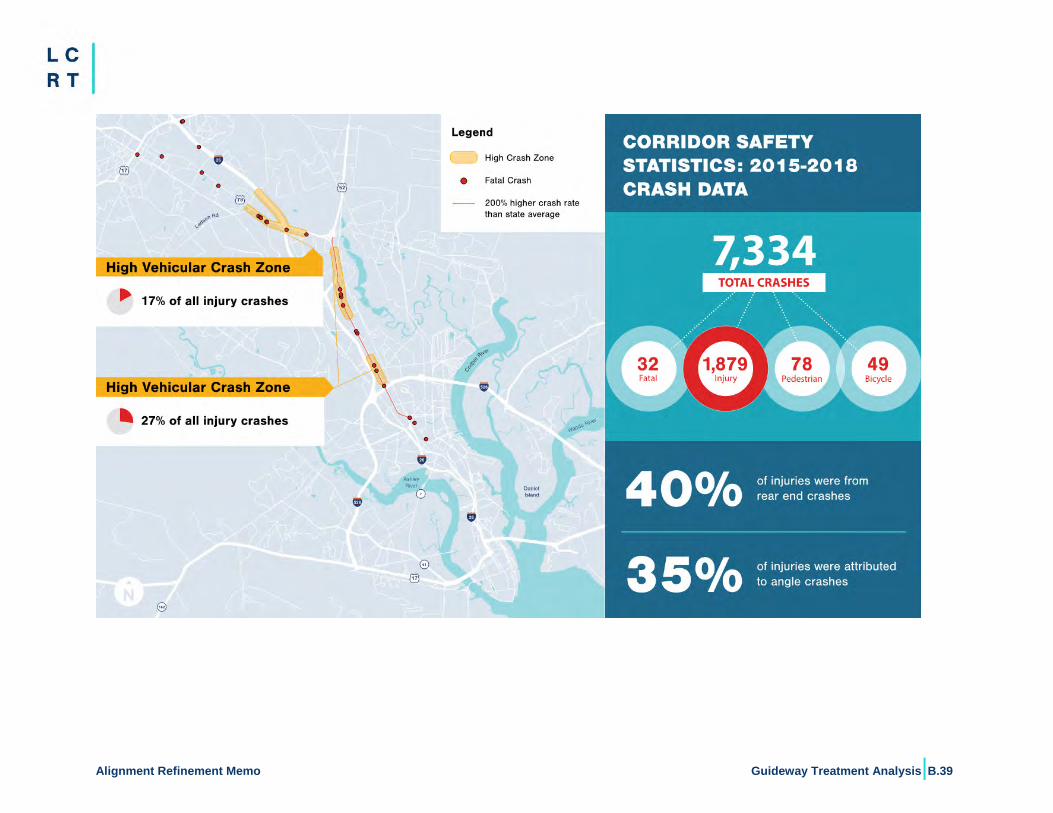
Alignment Refinement Memo Guideway Treatment Analysis|B.39
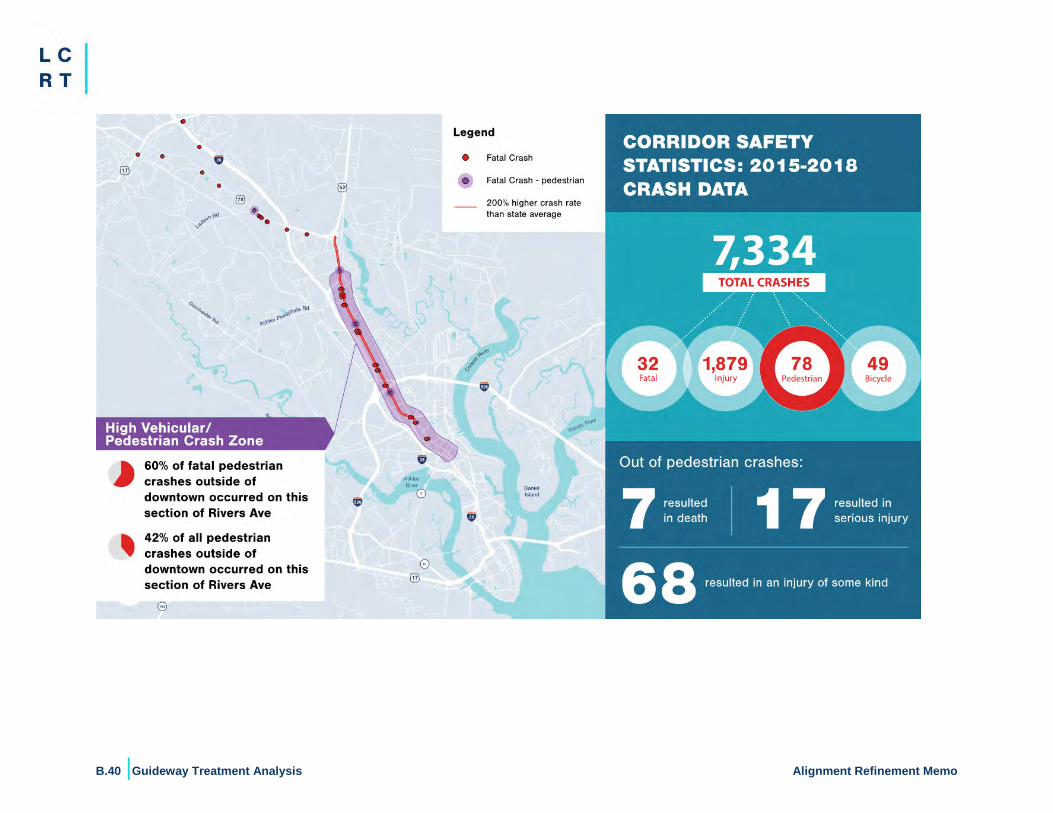
B.40 |Guideway Treatment Analysis Alignment Refinement Memo
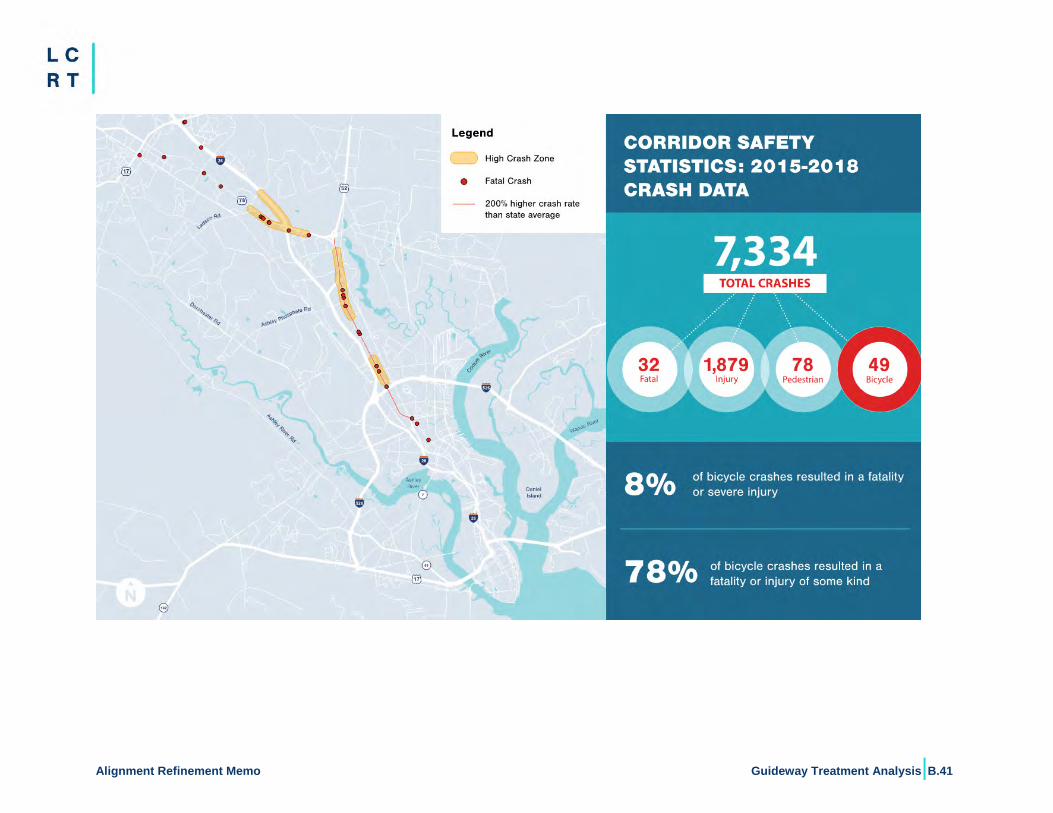
Alignment Refinement Memo Guideway Treatment Analysis|B.41
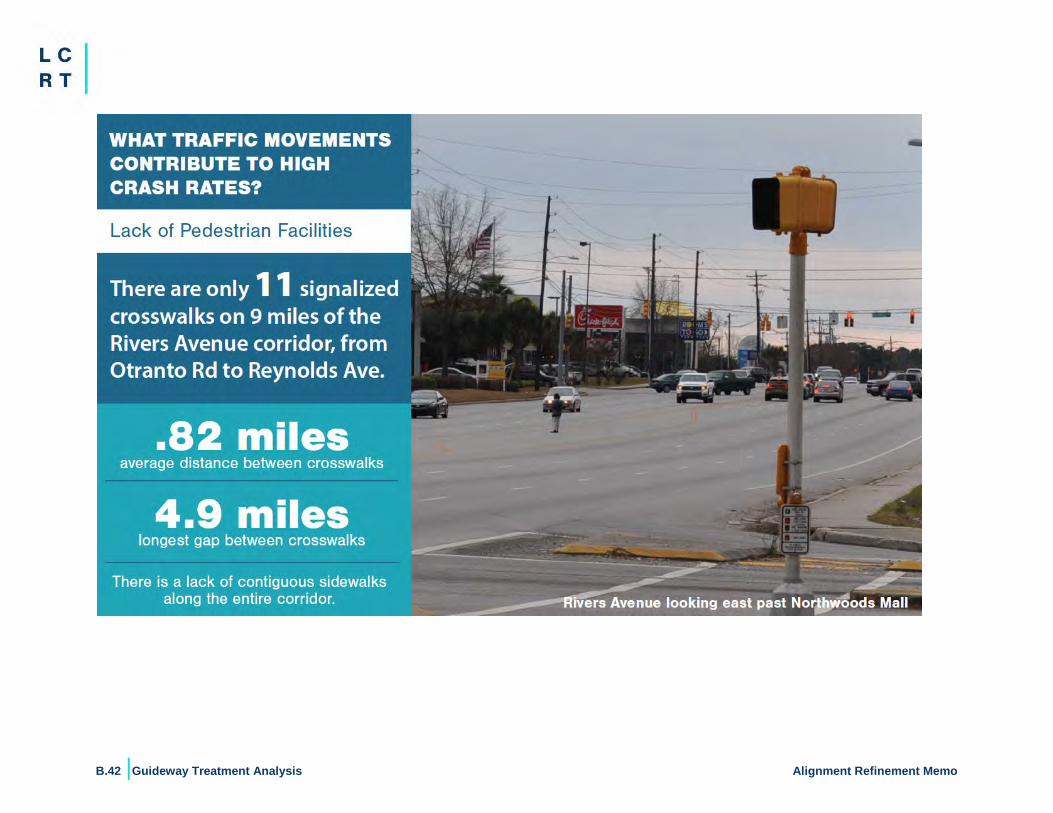
B.42 |Guideway Treatment Analysis Alignment Refinement Memo
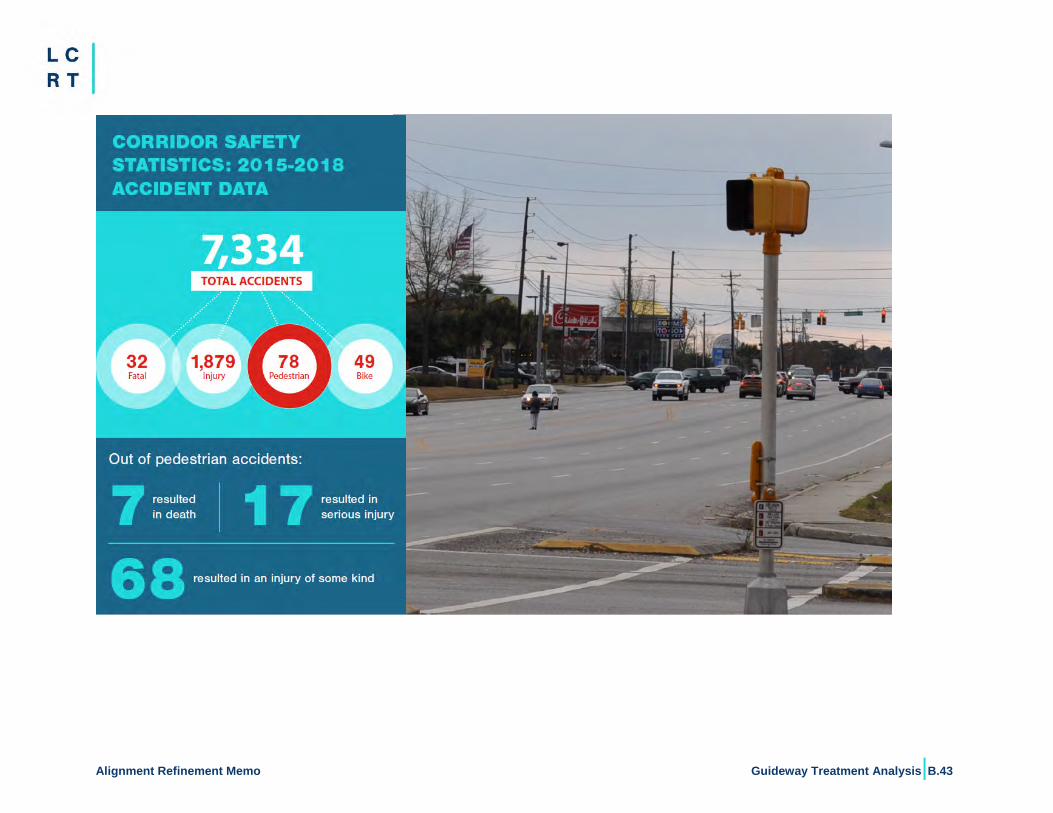
Alignment Refinement Memo Guideway Treatment Analysis|B.43
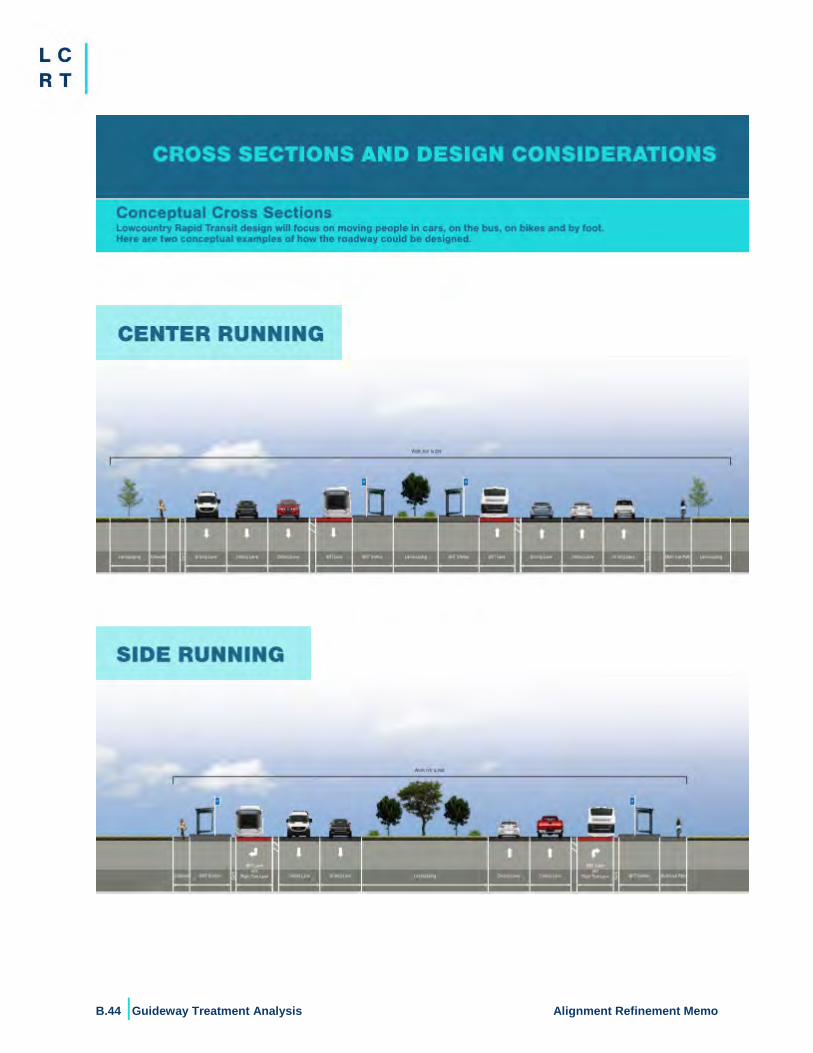
B.44 |Guideway Treatment Analysis Alignment Refinement Memo
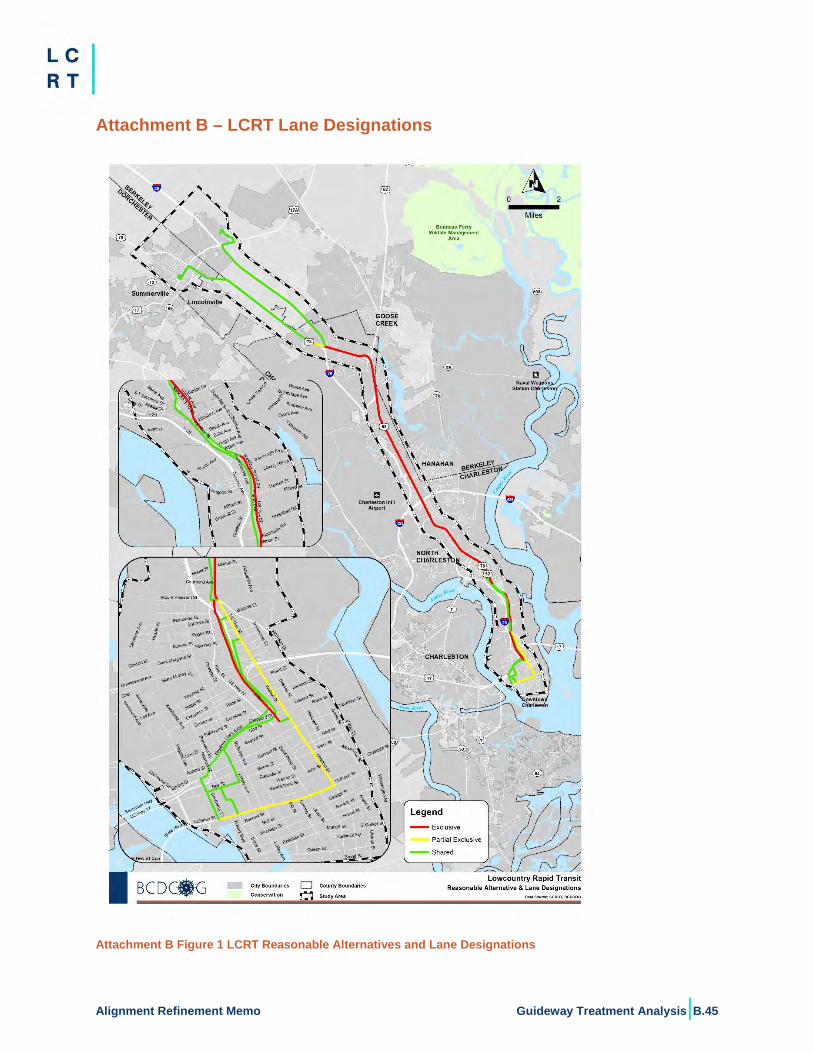
Alignment Refinement Memo Guideway Treatment Analysis|B.45
Attachment B – LCRT Lane Designations
Attachment B Figure 1 LCRT Reasonable Alternatives and Lane Designations
B.46 |Guideway Treatment Analysis Alignment Refinement Memo
Attachment C – Neck Area Additional Analysis
Neck Area Alignments Analysis Through the Neck Area, alignments with King Street Extension and Meeting Street were studied as alternatives. It is recommended the LCRT operate on King Street Extension in mixed traffic due to several factors:
Travel time along King Street Extension demonstrates minimal impacts in mixed traffic. Growth along King Street is expected to increase due to Magnolia and several smaller
developments, but traffic through the corridor is not over-capacity. The intersection at Mt. Pleasant Street and King Street, the railroad crossing at
Hackemann Avenue, and the railroad crossing at Discher Street show traffic congestion due to increased traffic and rail events. Spot queue jump lanes and queue bypasses would need to be implemented in these locations.
Station accessibility for both alignments would require construction of a pedestrian bridge to provide safe access to environmental justice populations.
Meeting Street would require grade separation of three railroad crossings to maintain travel times. These grade separations have projected costs in excess of $80 million, and would involve significant coordination with the railroad owners for ROW access, design review, and construction scheduling – impacting the overall LCRT BRT project schedule. Additionally, the crossing adjacent to Cunnington Avenue is constrained by the location of the Bethany Cemetery, a potentially eligible Section 4(f) resource.
Although not a factor in the selection criteria in this subsection, it is important to note that both the King Street Extension and Meeting Street operate at an acceptable level of service, with 9,700 and 15,800 (2019) average daily traffic, respectively.
Travel Time Analysis
King Street Extension Existing Travel Time Analysis A travel time analysis was conducted using VISSIM microsimulation software to evaluate the existing peak hour travel times on King Street Extension. The travel time was measured in each direction for a segment of King Street Extension between Meeting Street and Heriot Street. The segment is shown in Attachment C Figure 1, below. The overall model was calibrated across the network with Streetlight data and field travel times.
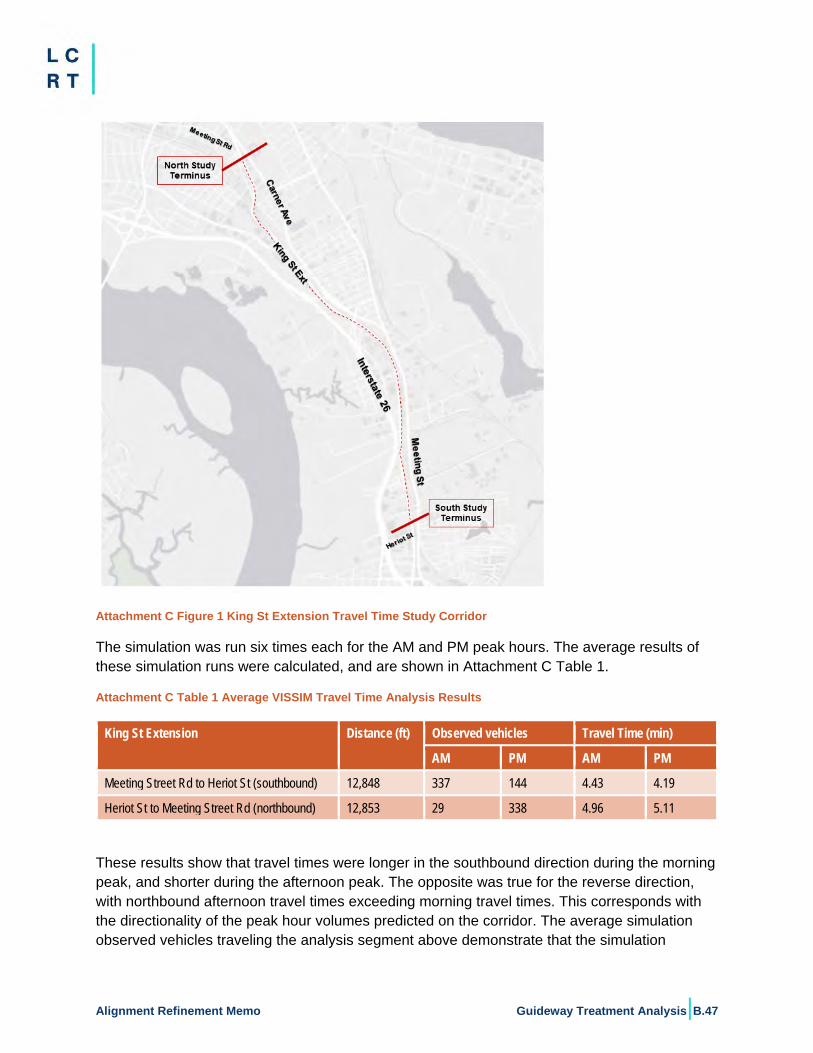
Alignment Refinement Memo Guideway Treatment Analysis|B.47
Attachment C Figure 1 King St Extension Travel Time Study Corridor
The simulation was run six times each for the AM and PM peak hours. The average results of these simulation runs were calculated, and are shown in Attachment C Table 1.
Attachment C Table 1 Average VISSIM Travel Time Analysis Results
King St Extension Distance (ft) Observed vehicles Travel Time (min) AM PM AM PM
Meeting Street Rd to Heriot St (southbound) 12,848 337 144 4.43 4.19 Heriot St to Meeting Street Rd (northbound) 12,853 29 338 4.96 5.11
These results show that travel times were longer in the southbound direction during the morning peak, and shorter during the afternoon peak. The opposite was true for the reverse direction, with northbound afternoon travel times exceeding morning travel times. This corresponds with the directionality of the peak hour volumes predicted on the corridor. The average simulation observed vehicles traveling the analysis segment above demonstrate that the simulation
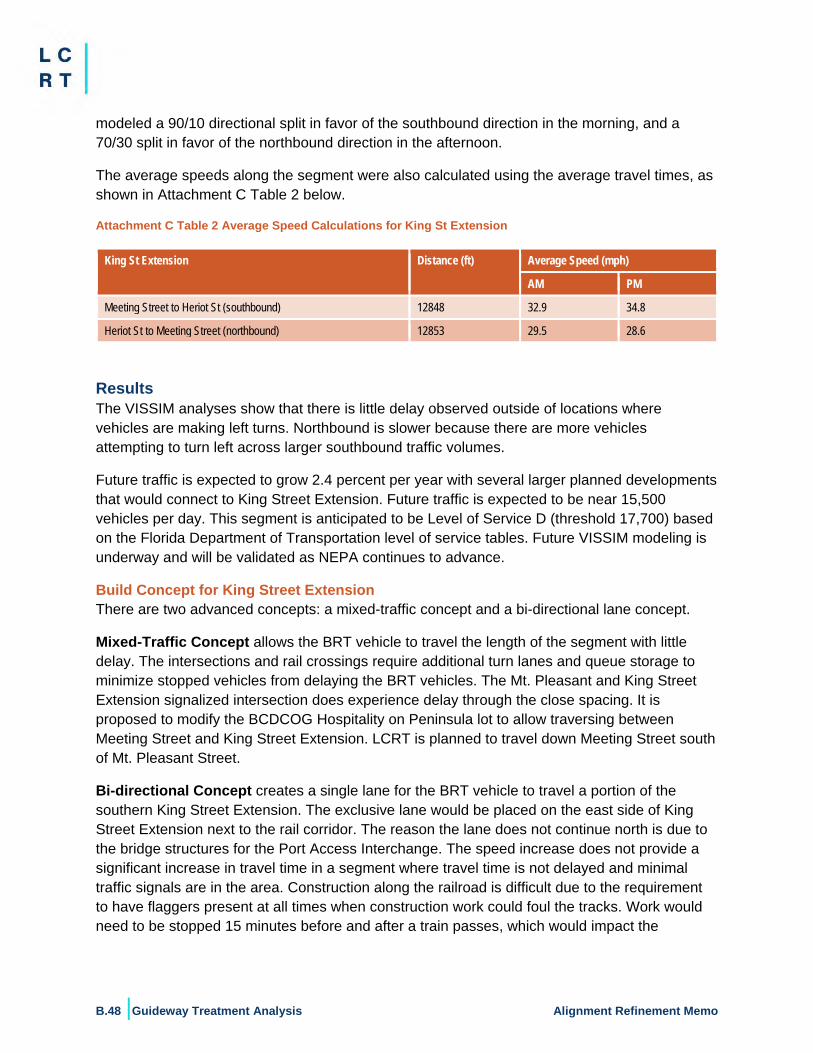
B.48 |Guideway Treatment Analysis Alignment Refinement Memo
modeled a 90/10 directional split in favor of the southbound direction in the morning, and a 70/30 split in favor of the northbound direction in the afternoon.
The average speeds along the segment were also calculated using the average travel times, as shown in Attachment C Table 2 below.
Attachment C Table 2 Average Speed Calculations for King St Extension
King St Extension Distance (ft) Average Speed (mph)
AM PM
Meeting Street to Heriot St (southbound) 12848 32.9 34.8
Heriot St to Meeting Street (northbound) 12853 29.5 28.6
Results The VISSIM analyses show that there is little delay observed outside of locations where vehicles are making left turns. Northbound is slower because there are more vehicles attempting to turn left across larger southbound traffic volumes.
Future traffic is expected to grow 2.4 percent per year with several larger planned developments that would connect to King Street Extension. Future traffic is expected to be near 15,500 vehicles per day. This segment is anticipated to be Level of Service D (threshold 17,700) based on the Florida Department of Transportation level of service tables. Future VISSIM modeling is underway and will be validated as NEPA continues to advance.
Build Concept for King Street Extension There are two advanced concepts: a mixed-traffic concept and a bi-directional lane concept.
Mixed-Traffic Concept allows the BRT vehicle to travel the length of the segment with little delay. The intersections and rail crossings require additional turn lanes and queue storage to minimize stopped vehicles from delaying the BRT vehicles. The Mt. Pleasant and King Street Extension signalized intersection does experience delay through the close spacing. It is proposed to modify the BCDCOG Hospitality on Peninsula lot to allow traversing between Meeting Street and King Street Extension. LCRT is planned to travel down Meeting Street south of Mt. Pleasant Street.
Bi-directional Concept creates a single lane for the BRT vehicle to travel a portion of the southern King Street Extension. The exclusive lane would be placed on the east side of King Street Extension next to the rail corridor. The reason the lane does not continue north is due to the bridge structures for the Port Access Interchange. The speed increase does not provide a significant increase in travel time in a segment where travel time is not delayed and minimal traffic signals are in the area. Construction along the railroad is difficult due to the requirement to have flaggers present at all times when construction work could foul the tracks. Work would need to be stopped 15 minutes before and after a train passes, which would impact the
Alignment Refinement Memo Guideway Treatment Analysis|B.49
construction schedule. This concept would require the acquisition of some ROW from CSX Railroad, which could prove difficult, costly, and result in significant schedule delay.
Recommendation For lane configuration, the Mixed Traffic configuration is recommended, with several intersection improvements along King Street, and traversing the Hospitality on Peninsula lot.
Traffic congestion is not anticipated to be severe. This would reduce risks associated with the bi-directional concept for increased budget
and schedule impacts due to construction near active rail lines, and probable acquisition. The value and benefit to the project is better spent in other areas. Note: improvements to
the intersections of King Street Extension with Hackemann Avenue and Discher Street as well as King Street Extension at Meeting Street are anticipated to make this segment fast and reliable.
Meeting Street Rail Impacts There are three existing at-grade railroad crossings along Meeting Street with an additional future connection scheduled for construction. The heavily utilized rail connections would require grade separation to maintain LCRT travel times. These grade separations have projected costs in excess of $80 million, and would involve significant coordination with multiple railroad owners for ROW access, design review, and construction scheduling – impacting the overall LCRT BRT project schedule. Additionally, any potential redesign for the crossing adjacent to Cunnington Avenue is constrained by the location of the Bethany Cemetery, a potentially eligible Section 4(f) resource. Below is a summary of the rail crossing data from the Existing Conditions Report.
Meeting Street/US 52 SC ID 6258 is a single track, public at-grade crossing located in Charleston SC Charleston County. The primary operating railroad is CSX Transportation DOT Inventory number 632177M, railroad milepost 419.05. The estimated number of trains per day is two switching moves with a maximum time table railroad speed of 10 miles per hour (mph) and highway posted vehicle speed of 45 mph. The crossing’s cantilevered flasher gates are controlled by motion detection circuits. Nearby intersections are not signalized and are not interconnected.
Meeting Street/US 52 SC ID 5245 is a single track, public at-grade crossing located in Charleston SC Charleston County. The primary operating railroad is Norfork Southern Railway Company DOT Inventory number 721394H, railroad milepost 2.8. The estimated number of trains per day is five with a maximum time table railroad speed of 10 mph and highway posted vehicle speed of 45 mph. The crossing’s cantilevered flashers are controlled by motion detection circuits with no gates installed. Nearby intersections are not signalized and are not interconnected.
Meeting Street/US 52 SC ID 6659 is a single track, public at-grade crossing located in Charleston SC Charleston County. The primary operating railroad is CSX Transportation DOT Inventory number 631997G, railroad milepost 392.97. The estimated number of trains per day is one (during PM peak) with five switching moves, a maximum time table railroad speed of 10
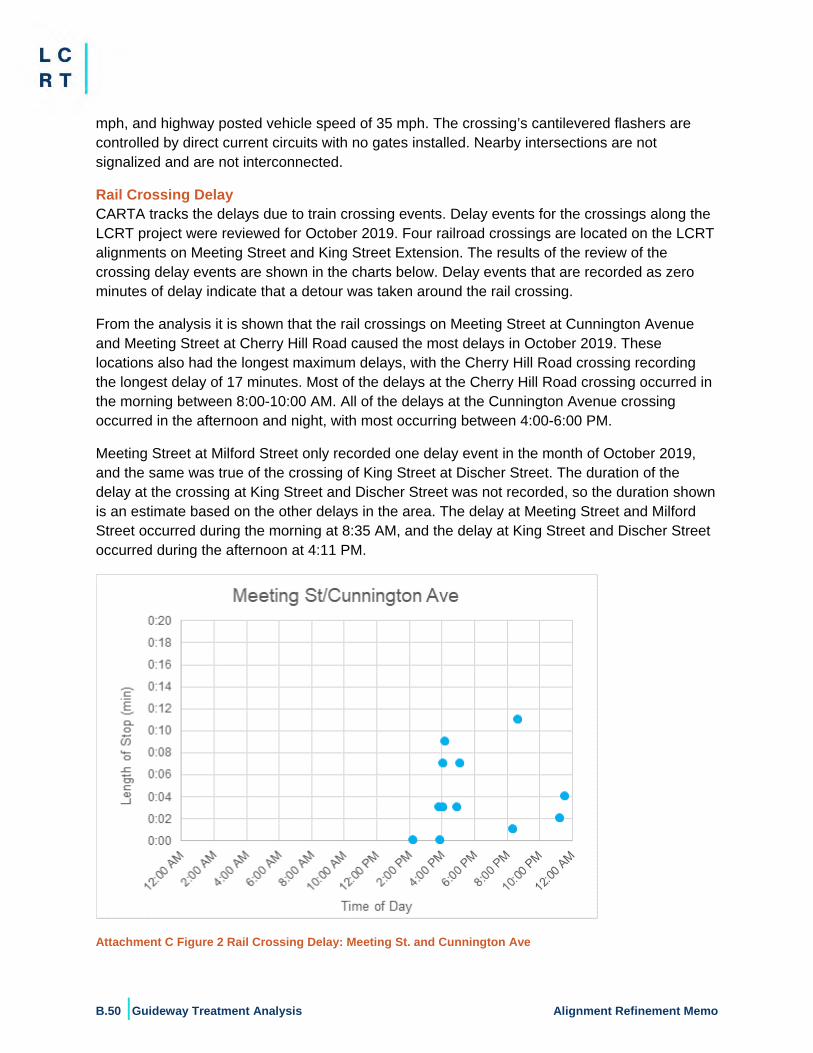
B.50 |Guideway Treatment Analysis Alignment Refinement Memo
mph, and highway posted vehicle speed of 35 mph. The crossing’s cantilevered flashers are controlled by direct current circuits with no gates installed. Nearby intersections are not signalized and are not interconnected.
Rail Crossing Delay CARTA tracks the delays due to train crossing events. Delay events for the crossings along the LCRT project were reviewed for October 2019. Four railroad crossings are located on the LCRT alignments on Meeting Street and King Street Extension. The results of the review of the crossing delay events are shown in the charts below. Delay events that are recorded as zero minutes of delay indicate that a detour was taken around the rail crossing.
From the analysis it is shown that the rail crossings on Meeting Street at Cunnington Avenue and Meeting Street at Cherry Hill Road caused the most delays in October 2019. These locations also had the longest maximum delays, with the Cherry Hill Road crossing recording the longest delay of 17 minutes. Most of the delays at the Cherry Hill Road crossing occurred in the morning between 8:00-10:00 AM. All of the delays at the Cunnington Avenue crossing occurred in the afternoon and night, with most occurring between 4:00-6:00 PM.
Meeting Street at Milford Street only recorded one delay event in the month of October 2019, and the same was true of the crossing of King Street at Discher Street. The duration of the delay at the crossing at King Street and Discher Street was not recorded, so the duration shown is an estimate based on the other delays in the area. The delay at Meeting Street and Milford Street occurred during the morning at 8:35 AM, and the delay at King Street and Discher Street occurred during the afternoon at 4:11 PM.
Attachment C Figure 2 Rail Crossing Delay: Meeting St. and Cunnington Ave
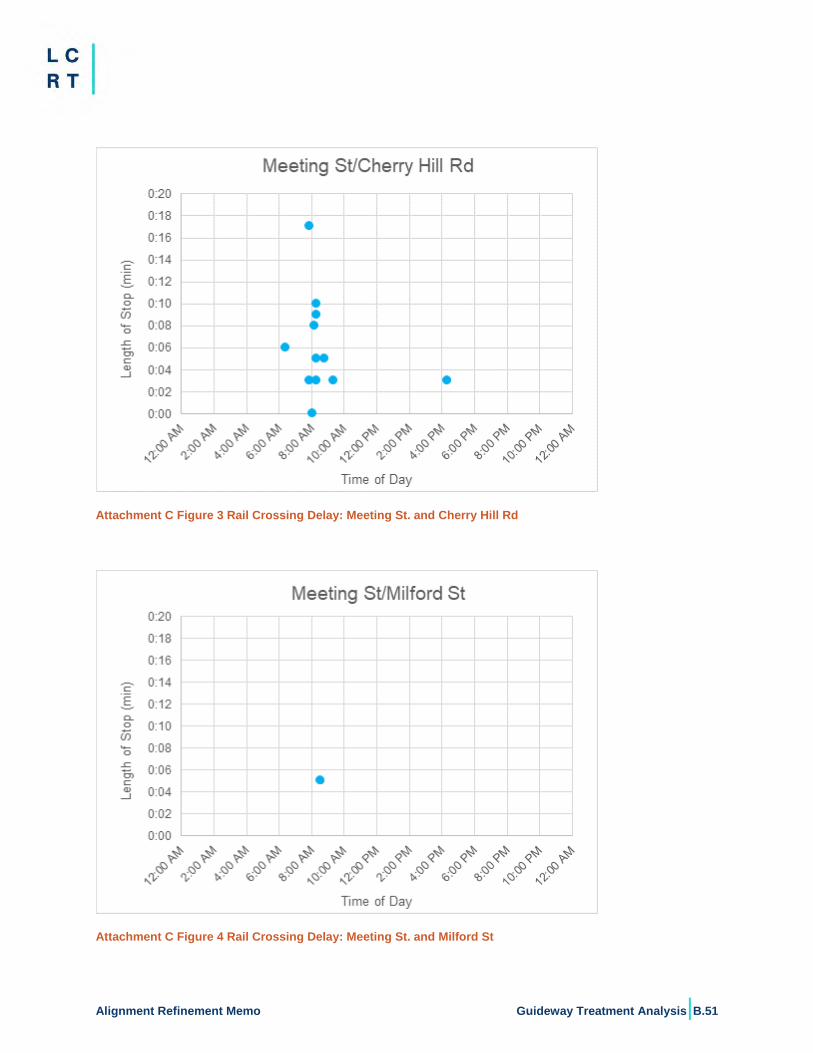
Alignment Refinement Memo Guideway Treatment Analysis|B.51
Attachment C Figure 3 Rail Crossing Delay: Meeting St. and Cherry Hill Rd
Attachment C Figure 4 Rail Crossing Delay: Meeting St. and Milford St
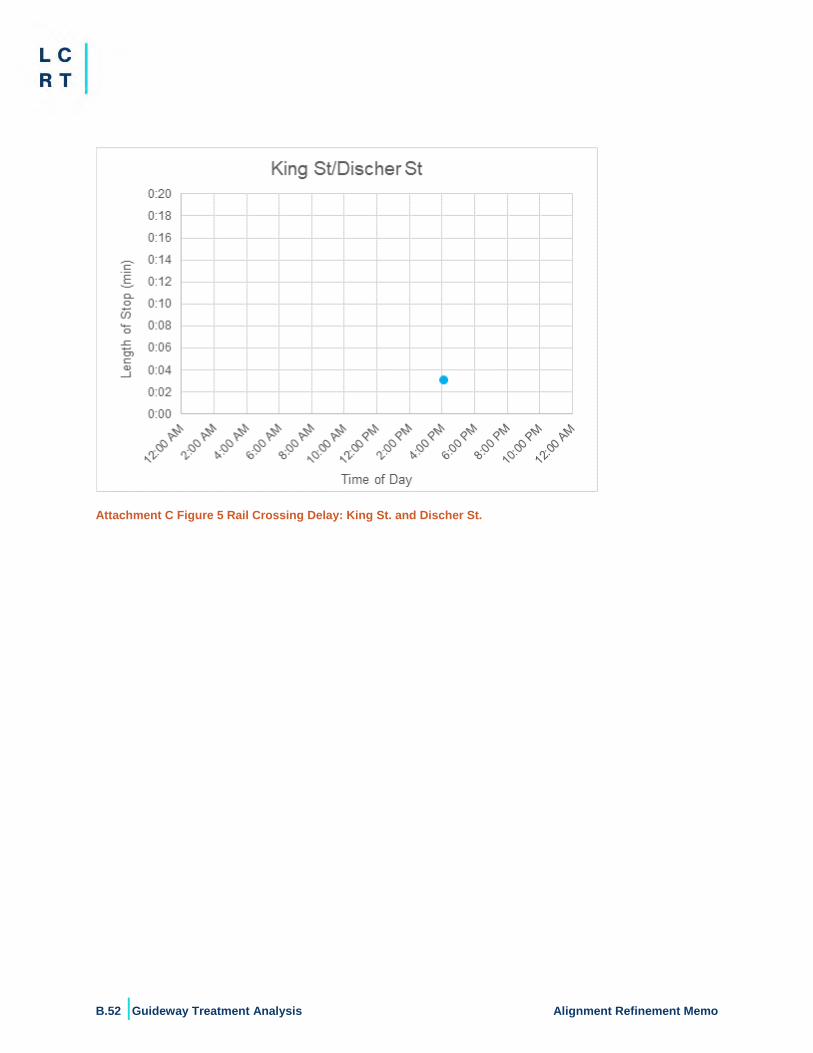
B.52 |Guideway Treatment Analysis Alignment Refinement Memo
Attachment C Figure 5 Rail Crossing Delay: King St. and Discher St.
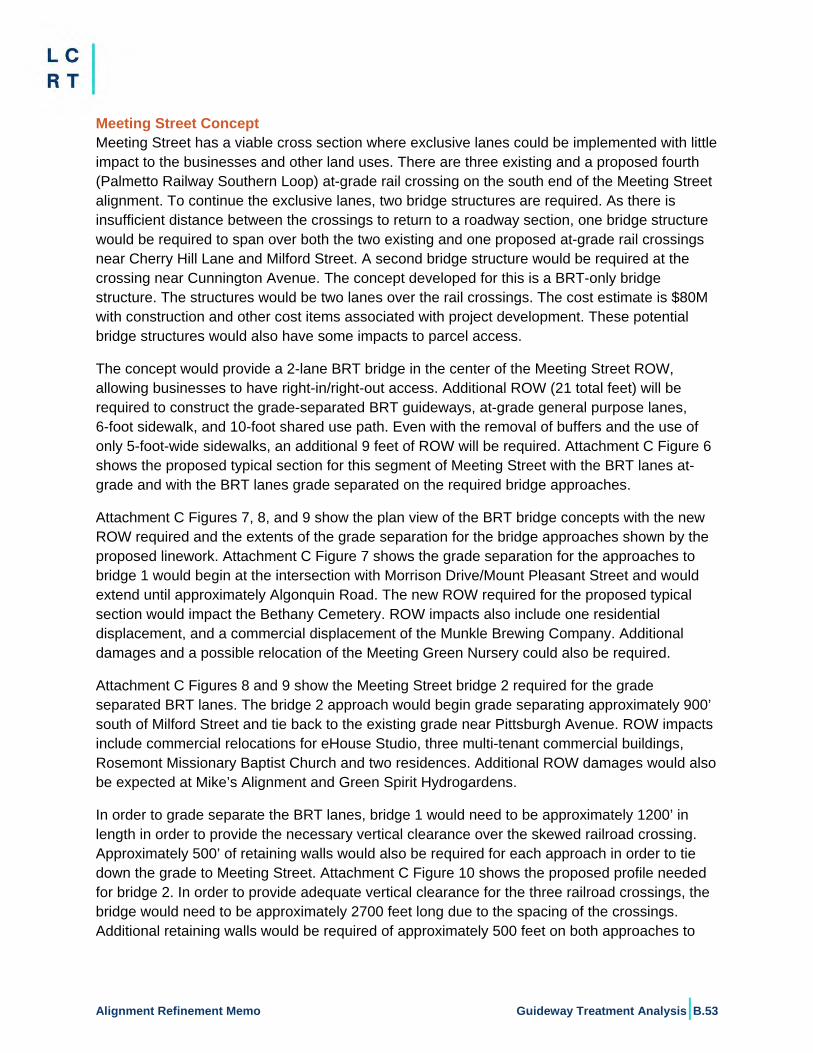
Alignment Refinement Memo Guideway Treatment Analysis|B.53
Meeting Street Concept Meeting Street has a viable cross section where exclusive lanes could be implemented with little impact to the businesses and other land uses. There are three existing and a proposed fourth (Palmetto Railway Southern Loop) at-grade rail crossing on the south end of the Meeting Street alignment. To continue the exclusive lanes, two bridge structures are required. As there is insufficient distance between the crossings to return to a roadway section, one bridge structure would be required to span over both the two existing and one proposed at-grade rail crossings near Cherry Hill Lane and Milford Street. A second bridge structure would be required at the crossing near Cunnington Avenue. The concept developed for this is a BRT-only bridge structure. The structures would be two lanes over the rail crossings. The cost estimate is $80M with construction and other cost items associated with project development. These potential bridge structures would also have some impacts to parcel access.
The concept would provide a 2-lane BRT bridge in the center of the Meeting Street ROW, allowing businesses to have right-in/right-out access. Additional ROW (21 total feet) will be required to construct the grade-separated BRT guideways, at-grade general purpose lanes, 6-foot sidewalk, and 10-foot shared use path. Even with the removal of buffers and the use of only 5-foot-wide sidewalks, an additional 9 feet of ROW will be required. Attachment C Figure 6 shows the proposed typical section for this segment of Meeting Street with the BRT lanes at-grade and with the BRT lanes grade separated on the required bridge approaches.
Attachment C Figures 7, 8, and 9 show the plan view of the BRT bridge concepts with the new ROW required and the extents of the grade separation for the bridge approaches shown by the proposed linework. Attachment C Figure 7 shows the grade separation for the approaches to bridge 1 would begin at the intersection with Morrison Drive/Mount Pleasant Street and would extend until approximately Algonquin Road. The new ROW required for the proposed typical section would impact the Bethany Cemetery. ROW impacts also include one residential displacement, and a commercial displacement of the Munkle Brewing Company. Additional damages and a possible relocation of the Meeting Green Nursery could also be required.
Attachment C Figures 8 and 9 show the Meeting Street bridge 2 required for the grade separated BRT lanes. The bridge 2 approach would begin grade separating approximately 900’ south of Milford Street and tie back to the existing grade near Pittsburgh Avenue. ROW impacts include commercial relocations for eHouse Studio, three multi-tenant commercial buildings, Rosemont Missionary Baptist Church and two residences. Additional ROW damages would also be expected at Mike’s Alignment and Green Spirit Hydrogardens.
In order to grade separate the BRT lanes, bridge 1 would need to be approximately 1200’ in length in order to provide the necessary vertical clearance over the skewed railroad crossing. Approximately 500’ of retaining walls would also be required for each approach in order to tie down the grade to Meeting Street. Attachment C Figure 10 shows the proposed profile needed for bridge 2. In order to provide adequate vertical clearance for the three railroad crossings, the bridge would need to be approximately 2700 feet long due to the spacing of the crossings. Additional retaining walls would be required of approximately 500 feet on both approaches to
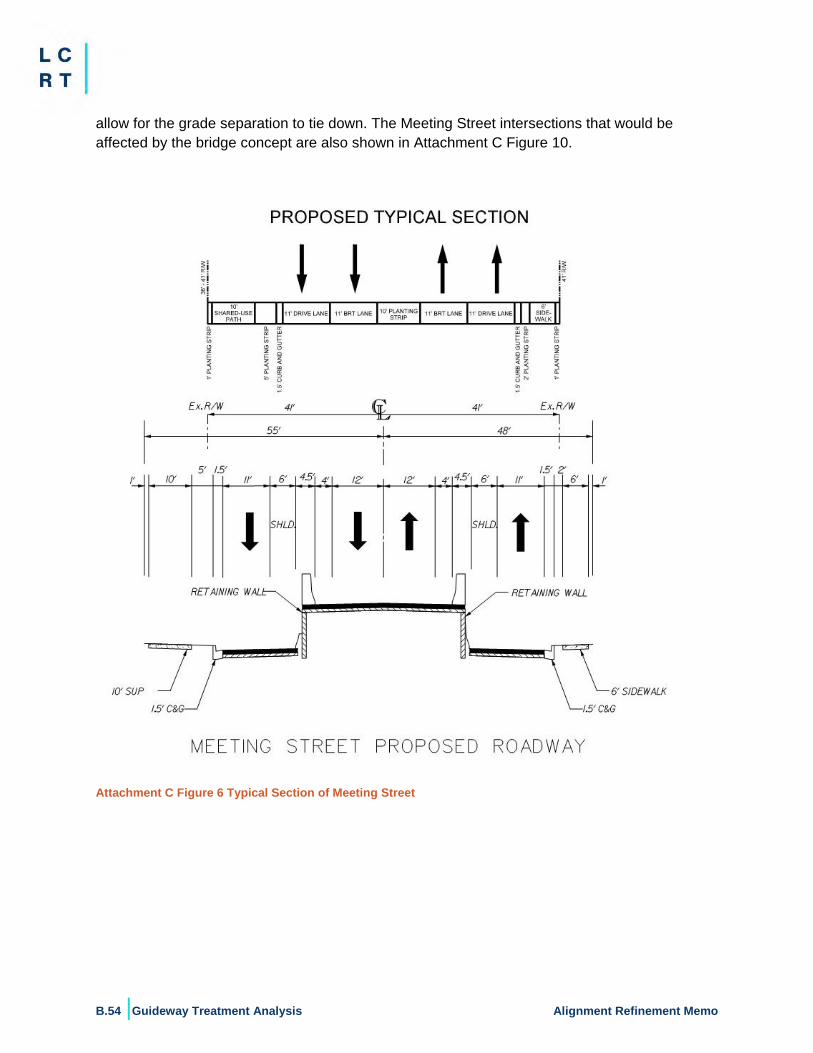
B.54 |Guideway Treatment Analysis Alignment Refinement Memo
allow for the grade separation to tie down. The Meeting Street intersections that would be affected by the bridge concept are also shown in Attachment C Figure 10.
Attachment C Figure 6 Typical Section of Meeting Street
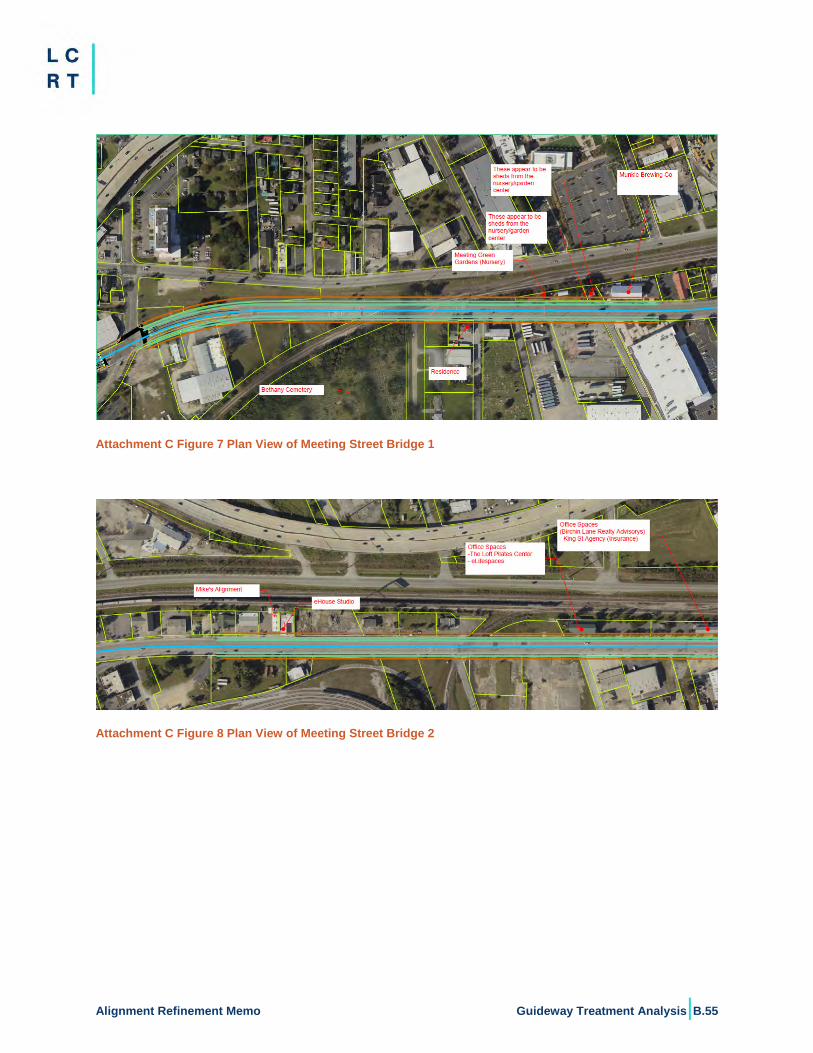
Alignment Refinement Memo Guideway Treatment Analysis|B.55
Attachment C Figure 7 Plan View of Meeting Street Bridge 1
Attachment C Figure 8 Plan View of Meeting Street Bridge 2
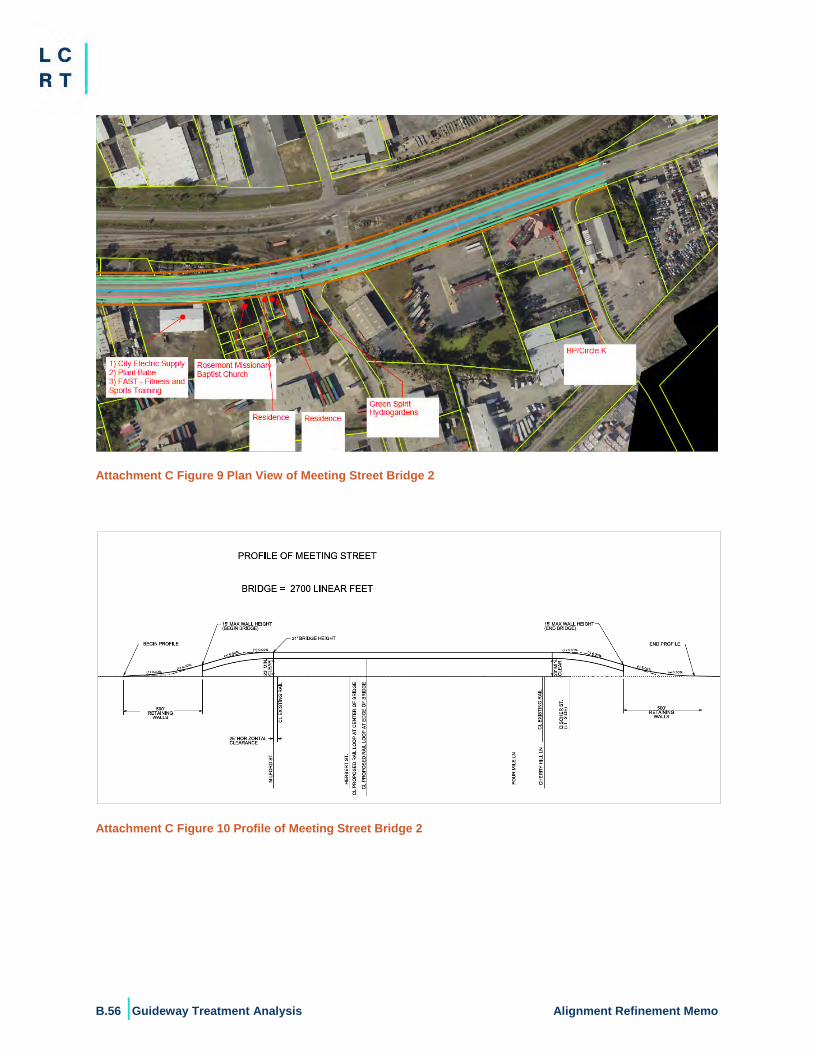
B.56 |Guideway Treatment Analysis Alignment Refinement Memo
Attachment C Figure 9 Plan View of Meeting Street Bridge 2
Attachment C Figure 10 Profile of Meeting Street Bridge 2
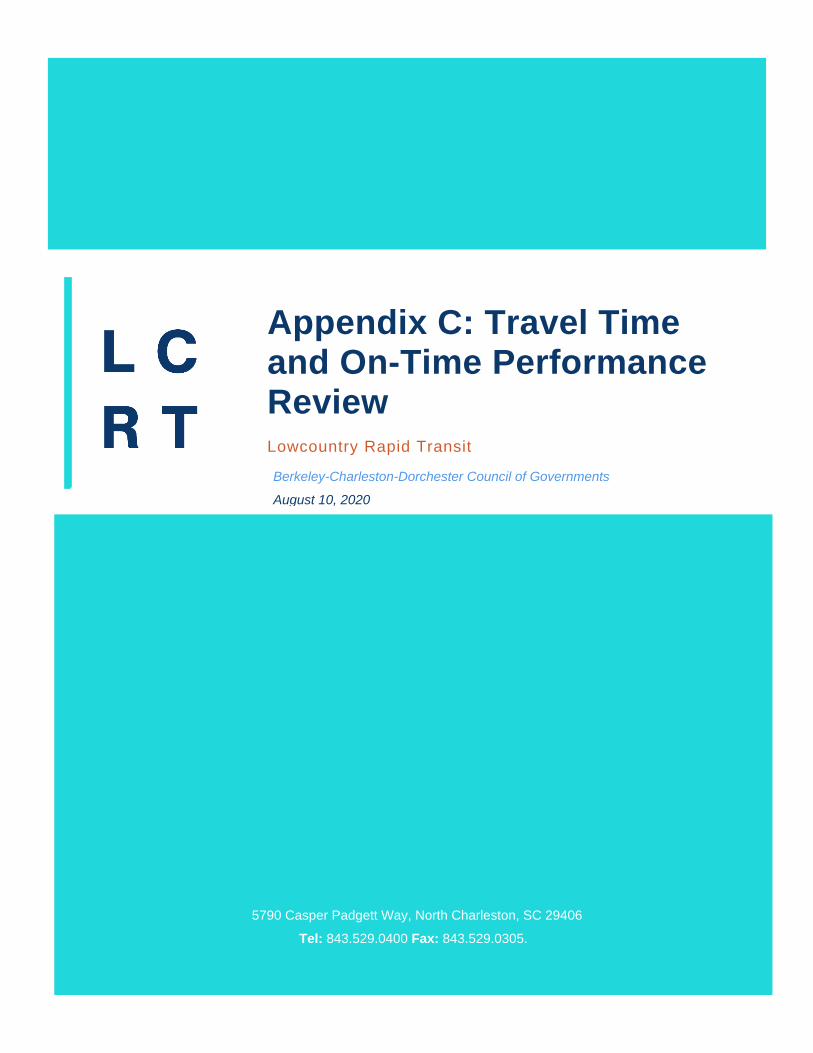
5790 Casper Padgett Way, North Charleston, SC 29406
Tel: 843.529.0400 Fax: 843.529.0305.
Appendix C: Travel Time and On-Time Performance ReviewLowcountry Rapid Transit
Berkeley-Charleston-Dorchester Council of Governments
August 10, 2020
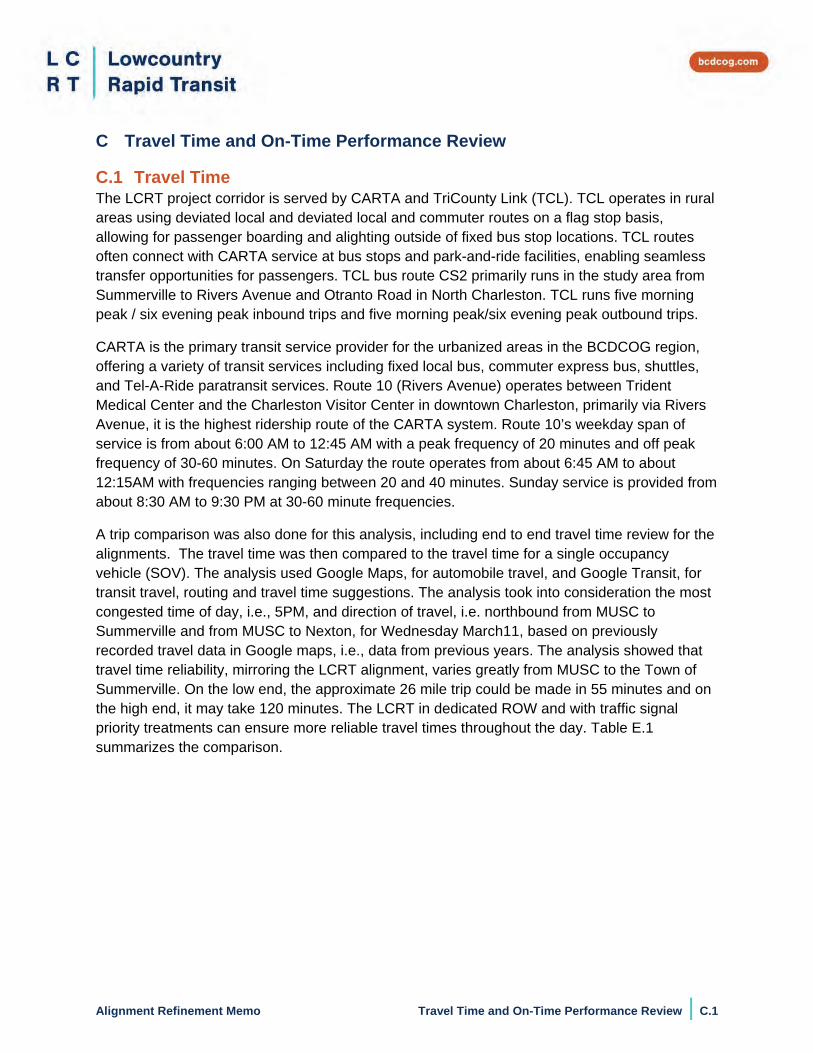
Alignment Refinement Memo Travel Time and On-Time Performance Review | C.1
C Travel Time and On-Time Performance Review
C.1 Travel Time The LCRT project corridor is served by CARTA and TriCounty Link (TCL). TCL operates in rural areas using deviated local and deviated local and commuter routes on a flag stop basis, allowing for passenger boarding and alighting outside of fixed bus stop locations. TCL routes often connect with CARTA service at bus stops and park-and-ride facilities, enabling seamless transfer opportunities for passengers. TCL bus route CS2 primarily runs in the study area from Summerville to Rivers Avenue and Otranto Road in North Charleston. TCL runs five morning peak / six evening peak inbound trips and five morning peak/six evening peak outbound trips.
CARTA is the primary transit service provider for the urbanized areas in the BCDCOG region, offering a variety of transit services including fixed local bus, commuter express bus, shuttles, and Tel-A-Ride paratransit services. Route 10 (Rivers Avenue) operates between Trident Medical Center and the Charleston Visitor Center in downtown Charleston, primarily via Rivers Avenue, it is the highest ridership route of the CARTA system. Route 10’s weekday span of service is from about 6:00 AM to 12:45 AM with a peak frequency of 20 minutes and off peak frequency of 30-60 minutes. On Saturday the route operates from about 6:45 AM to about 12:15AM with frequencies ranging between 20 and 40 minutes. Sunday service is provided from about 8:30 AM to 9:30 PM at 30-60 minute frequencies.
A trip comparison was also done for this analysis, including end to end travel time review for the alignments. The travel time was then compared to the travel time for a single occupancy vehicle (SOV). The analysis used Google Maps, for automobile travel, and Google Transit, for transit travel, routing and travel time suggestions. The analysis took into consideration the most congested time of day, i.e., 5PM, and direction of travel, i.e. northbound from MUSC to Summerville and from MUSC to Nexton, for Wednesday March11, based on previously recorded travel data in Google maps, i.e., data from previous years. The analysis showed that travel time reliability, mirroring the LCRT alignment, varies greatly from MUSC to the Town of Summerville. On the low end, the approximate 26 mile trip could be made in 55 minutes and on the high end, it may take 120 minutes. The LCRT in dedicated ROW and with traffic signal priority treatments can ensure more reliable travel times throughout the day. Table E.1 summarizes the comparison.
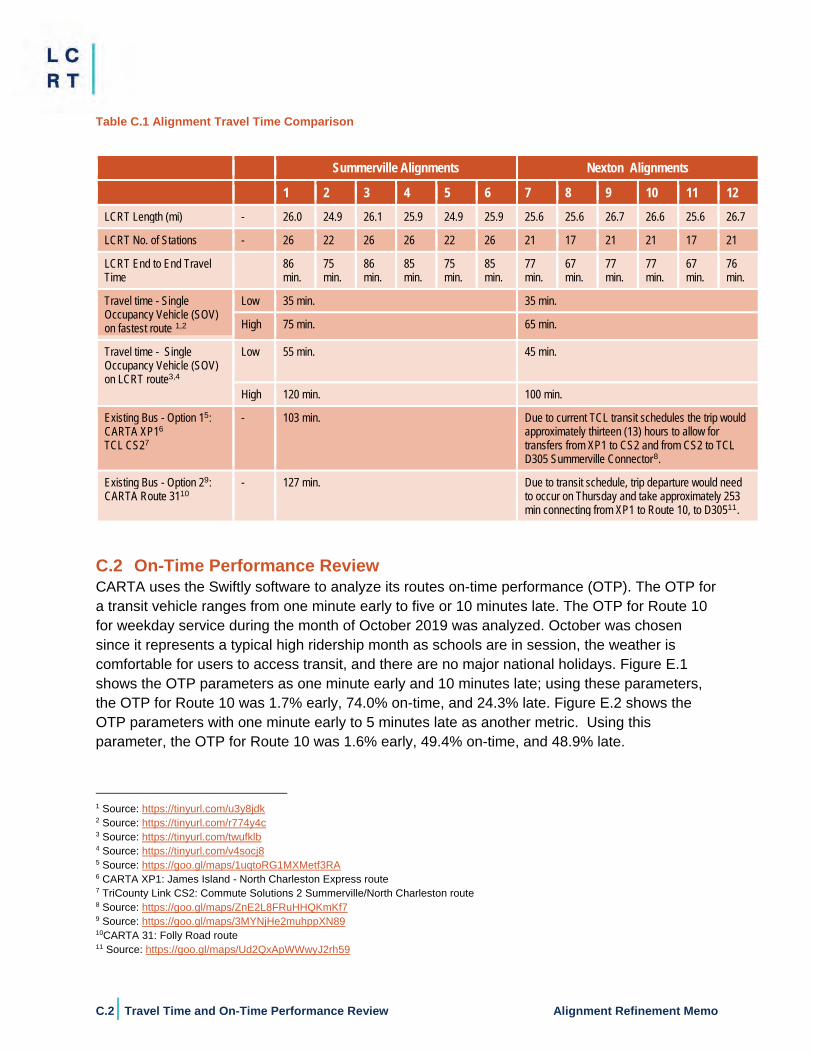
C.2 | Travel Time and On-Time Performance Review Alignment Refinement Memo
Table C.1 Alignment Travel Time Comparison
C.2 On-Time Performance Review CARTA uses the Swiftly software to analyze its routes on-time performance (OTP). The OTP for a transit vehicle ranges from one minute early to five or 10 minutes late. The OTP for Route 10 for weekday service during the month of October 2019 was analyzed. October was chosen since it represents a typical high ridership month as schools are in session, the weather is comfortable for users to access transit, and there are no major national holidays. Figure E.1 shows the OTP parameters as one minute early and 10 minutes late; using these parameters, the OTP for Route 10 was 1.7% early, 74.0% on-time, and 24.3% late. Figure E.2 shows the OTP parameters with one minute early to 5 minutes late as another metric. Using this parameter, the OTP for Route 10 was 1.6% early, 49.4% on-time, and 48.9% late.
1 Source: https://tinyurl.com/u3y8jdk 2 Source: https://tinyurl.com/r774y4c 3 Source: https://tinyurl.com/twufklb 4 Source: https://tinyurl.com/v4socj8 5 Source: https://goo.gl/maps/1uqtoRG1MXMetf3RA 6 CARTA XP1: James Island - North Charleston Express route 7 TriCounty Link CS2: Commute Solutions 2 Summerville/North Charleston route 8 Source: https://goo.gl/maps/ZnE2L8FRuHHQKmKf7 9 Source: https://goo.gl/maps/3MYNjHe2muhppXN89 10CARTA 31: Folly Road route 11 Source: https://goo.gl/maps/Ud2QxApWWwyJ2rh59
Summerville Alignments Nexton Alignments
1 2 3 4 5 6 7 8 9 10 11 12 LCRT Length (mi) - 26.0 24.9 26.1 25.9 24.9 25.9 25.6 25.6 26.7 26.6 25.6 26.7
LCRT No. of Stations - 26 22 26 26 22 26 21 17 21 21 17 21
LCRT End to End Travel Time
86 min.
75 min.
86 min.
85 min.
75 min.
85 min.
77 min.
67 min.
77 min.
77 min.
67 min.
76 min.
Travel time - Single Occupancy Vehicle (SOV) on fastest route 1,2
Low 35 min. 35 min.
High 75 min. 65 min.
Travel time - Single Occupancy Vehicle (SOV) on LCRT route3,4
Low 55 min. 45 min.
High 120 min. 100 min.
Existing Bus - Option 15: CARTA XP16 TCL CS27
- 103 min. Due to current TCL transit schedules the trip would approximately thirteen (13) hours to allow for transfers from XP1 to CS2 and from CS2 to TCL D305 Summerville Connector8.
Existing Bus - Option 29: CARTA Route 3110
- 127 min. Due to transit schedule, trip departure would need to occur on Thursday and take approximately 253 min connecting from XP1 to Route 10, to D30511.
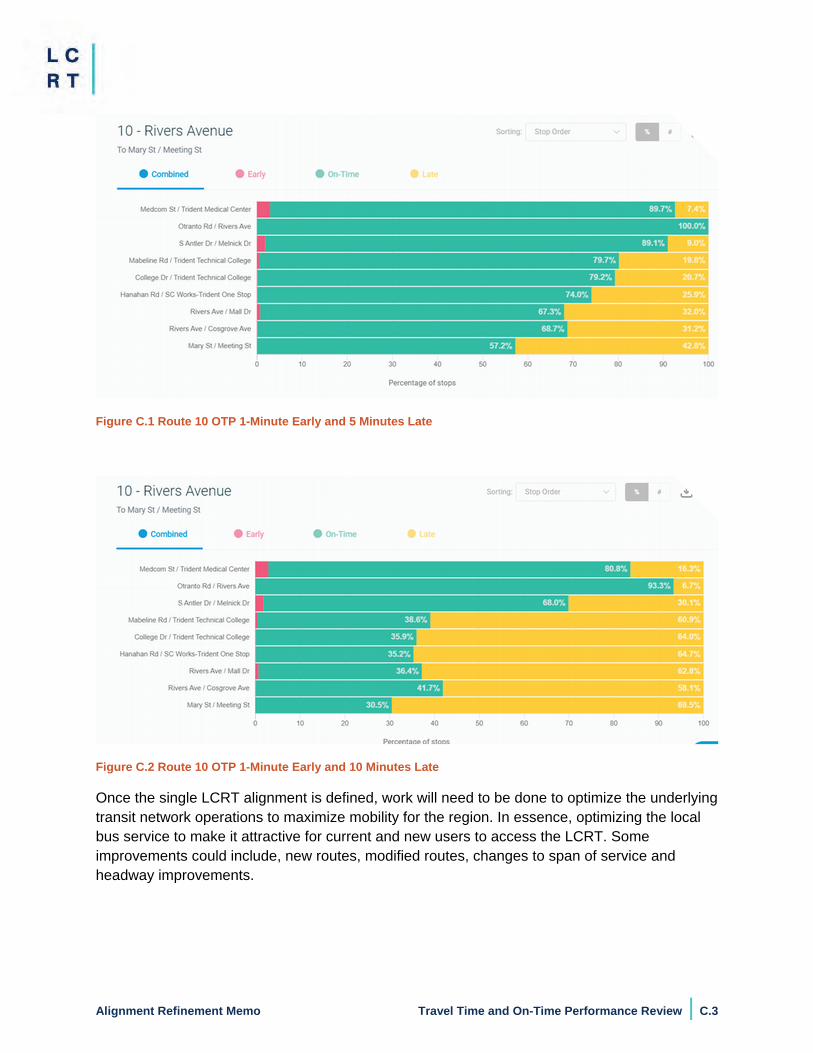
Alignment Refinement Memo Travel Time and On-Time Performance Review | C.3
Figure C.1 Route 10 OTP 1-Minute Early and 5 Minutes Late
Figure C.2 Route 10 OTP 1-Minute Early and 10 Minutes Late
Once the single LCRT alignment is defined, work will need to be done to optimize the underlying transit network operations to maximize mobility for the region. In essence, optimizing the local bus service to make it attractive for current and new users to access the LCRT. Some improvements could include, new routes, modified routes, changes to span of service and headway improvements.
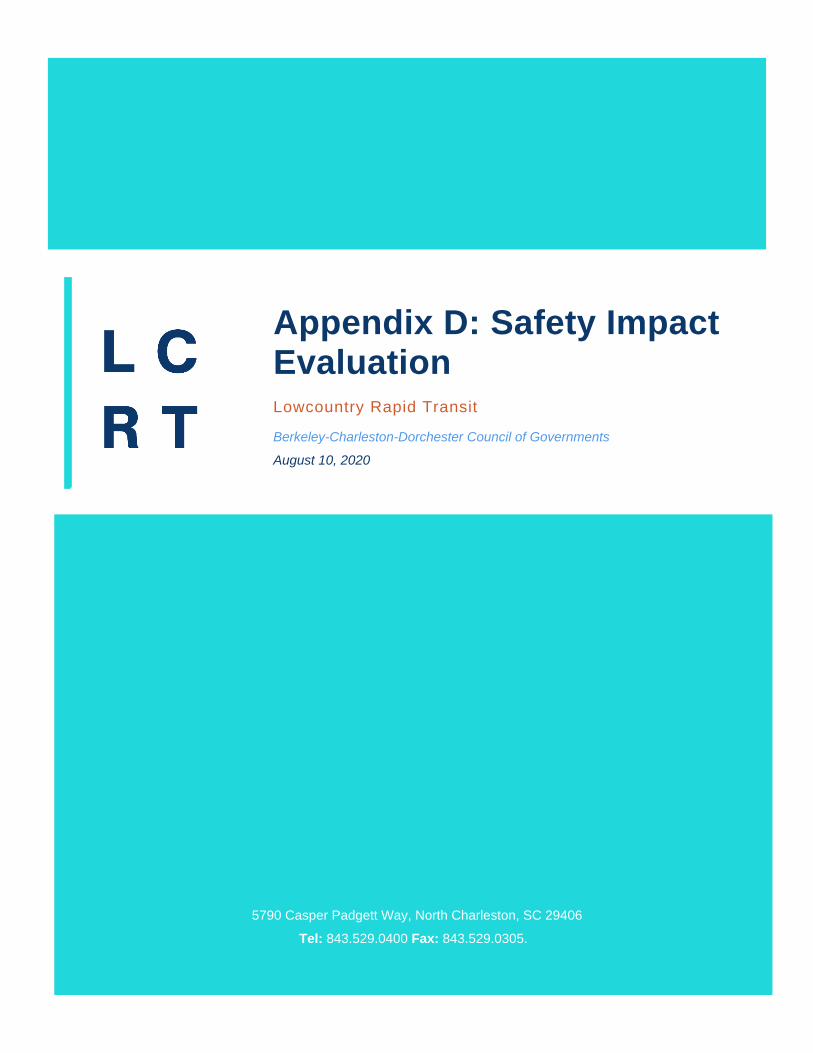
5790 Casper Padgett Way, North Charleston, SC 29406
Tel: 843.529.0400 Fax: 843.529.0305.
Appendix D: Safety Impact EvaluationLowcountry Rapid Transit
Berkeley-Charleston-Dorchester Council of Governments
August 10, 2020
Alignment Refinement Memo Safety Impact Evaluation | D.1
D Safety Impact Evaluation
D.1 Assumptions on Opportunity to Impact Safety Evaluation Measures The opportunity to impact safety evaluation was based on best available alignment concepts at the time of the assessment. The following SCDOT data sources were used in this evaluation:
Crash data for the years 2015-2019 Average daily traffic (ADT) data from the department’s count program stations for the
years 2015-2019.
Because this assessment represents a comparison of alternatives, any segments which are expected to show no differences between alternatives were not evaluated. Therefore, since the concept for much of Rivers Avenue is the same across all alternatives, it was excluded from the evaluation of each alternative. Further analysis could be performed on the Rivers Avenue sections. However, detailed conceptual plans and traffic model data that is presently not available would be needed to include Rivers Avenue in this evaluation.
The local streets in the hospital district in downtown Charleston were not included in this analysis, because minimal differences were expected between alternatives and because crash and ADT data is limited on these streets.
D.2 Safety Impact Potential Scoring The scoring criteria are explained below and summarized in Table D.1
A score of 1 indicates no potential for safety improvements or requires the use of ITS infrastructure to supplement dynamic lanes to maintain safe operations. For example, segments on the freeway have no opportunity to impact pedestrian safety since no pedestrian facilities are present on freeways. Regarding motorist safety, sections receiving a score of 1 have the potential to have a net no-change to crash risk but additional ITS infrastructure may be required to achieve this. For example, the use of dynamic lanes may require the ability to monitor and respond to incidents or to perform an all-clear assessment before time-of-day change take place.
A score of 2 indicates minimal net direct impact to safety based on current concepts, but allows for the potential for safety improvements if needed. For example, while no major improvements are proposed on US 17A, the pedestrian facilities and/or the intersections could be improved if any safety concerns arose.
A score of 3 indicates a moderate potential safety impact, such as the addition of traffic signals and some raised median sections, but may include some shared lane sections or other areas with less safety benefit. For example, the current concept for Carner Avenue includes new signals, but only small sections of raised median, with the rest of the bus lanes being separated by pavement buffers. It received a 3 in both motorist and pedestrian safety impact. Regarding pedestrian safety, a section receiving a score of 3 has safety-improving elements such as new signals, crosswalks, and sidewalk
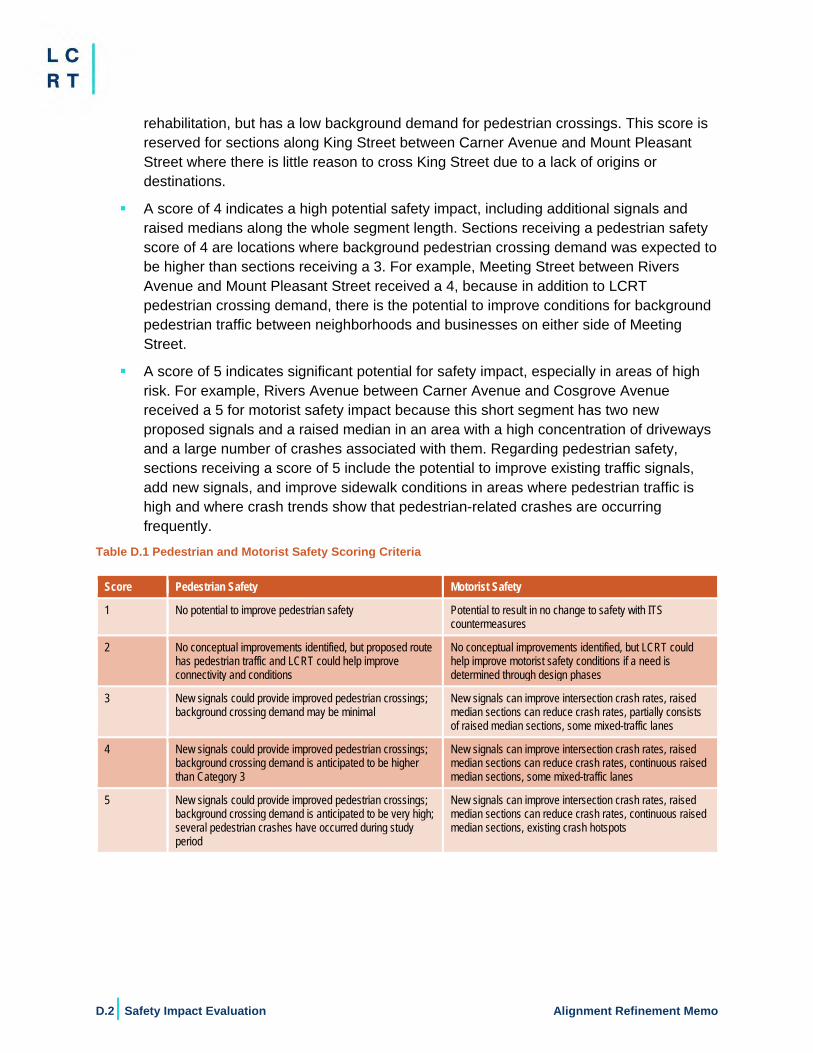
D.2 | Safety Impact Evaluation Alignment Refinement Memo
rehabilitation, but has a low background demand for pedestrian crossings. This score is reserved for sections along King Street between Carner Avenue and Mount Pleasant Street where there is little reason to cross King Street due to a lack of origins or destinations.
A score of 4 indicates a high potential safety impact, including additional signals and raised medians along the whole segment length. Sections receiving a pedestrian safety score of 4 are locations where background pedestrian crossing demand was expected to be higher than sections receiving a 3. For example, Meeting Street between Rivers Avenue and Mount Pleasant Street received a 4, because in addition to LCRT pedestrian crossing demand, there is the potential to improve conditions for background pedestrian traffic between neighborhoods and businesses on either side of Meeting Street.
A score of 5 indicates significant potential for safety impact, especially in areas of high risk. For example, Rivers Avenue between Carner Avenue and Cosgrove Avenue received a 5 for motorist safety impact because this short segment has two new proposed signals and a raised median in an area with a high concentration of driveways and a large number of crashes associated with them. Regarding pedestrian safety, sections receiving a score of 5 include the potential to improve existing traffic signals, add new signals, and improve sidewalk conditions in areas where pedestrian traffic is high and where crash trends show that pedestrian-related crashes are occurring frequently.
Table D.1 Pedestrian and Motorist Safety Scoring Criteria
Score Pedestrian Safety Motorist Safety
1 No potential to improve pedestrian safety Potential to result in no change to safety with ITS countermeasures
2 No conceptual improvements identified, but proposed route has pedestrian traffic and LCRT could help improve connectivity and conditions
No conceptual improvements identified, but LCRT could help improve motorist safety conditions if a need is determined through design phases
3 New signals could provide improved pedestrian crossings; background crossing demand may be minimal
New signals can improve intersection crash rates, raised median sections can reduce crash rates, partially consists of raised median sections, some mixed-traffic lanes
4 New signals could provide improved pedestrian crossings; background crossing demand is anticipated to be higher than Category 3
New signals can improve intersection crash rates, raised median sections can reduce crash rates, continuous raised median sections, some mixed-traffic lanes
5 New signals could provide improved pedestrian crossings; background crossing demand is anticipated to be very high; several pedestrian crashes have occurred during study period
New signals can improve intersection crash rates, raised median sections can reduce crash rates, continuous raised median sections, existing crash hotspots
5790 Casper Padgett Way, North Charleston, SC 29406
Tel: 843.529.0400 Fax: 843.529.0305.
Appendix E: Hagood Avenue Extension AssessmentLowcountry Rapid Transit
Berkeley-Charleston-Dorchester Council of Governments
August 10, 2020
Alignment Refinement Memo Hagood Avenue Extension Assessment | E.1
E Hagood Avenue Extension Assessment For technical feasibility the proposed Hagood Avenue extension, Figure F.1, was reviewed. The Hagood Street Extension will be a new major north-south street connecting the Westside Neighborhood, Gadsden Green and West Edge to the Medical District1.The Hagood Avenue extension appears to be a good connection for the Crosstown Alignment, but it does not make the Alignment any more feasible for LCRT. The roadway modification would not induce a significant change in ridership as the proposed station is in approximately the same location.
The benefits of the Hagood connection for a Crosstown alternative are as follows:
Allows for better circulation in the Medical District, so the circulation can be for Hagood Avenue, Bee Street to Courtenay Drive.
Geometrics may improve Bus flow – although it is not fully exclusive. Could allow for an easier connection from West Edge. Enables a better DASH connection from the Medical District to West Edge.
Cons:
ROW ownership is unknown. If the LCRT is expected to purchase the ROW this could impact the NEPA class of action.
Access along the roadway may slow BRT operations with vehicles trying to enter the parking structure.
SCDOT signal spacing on US 17 are too close for approval. A design variance would be required.
LCRT does not have costs for additional construction for this roadway connection. Schedule impacts for selecting this action would impact both NEPA and design
tasks. There are several design concerns due to lane configuration and vehicles stopping place that will need to be addressed in greater detail for safe traffic flow.
1 Source: http://www.designdivision.org/hagood-street-extension
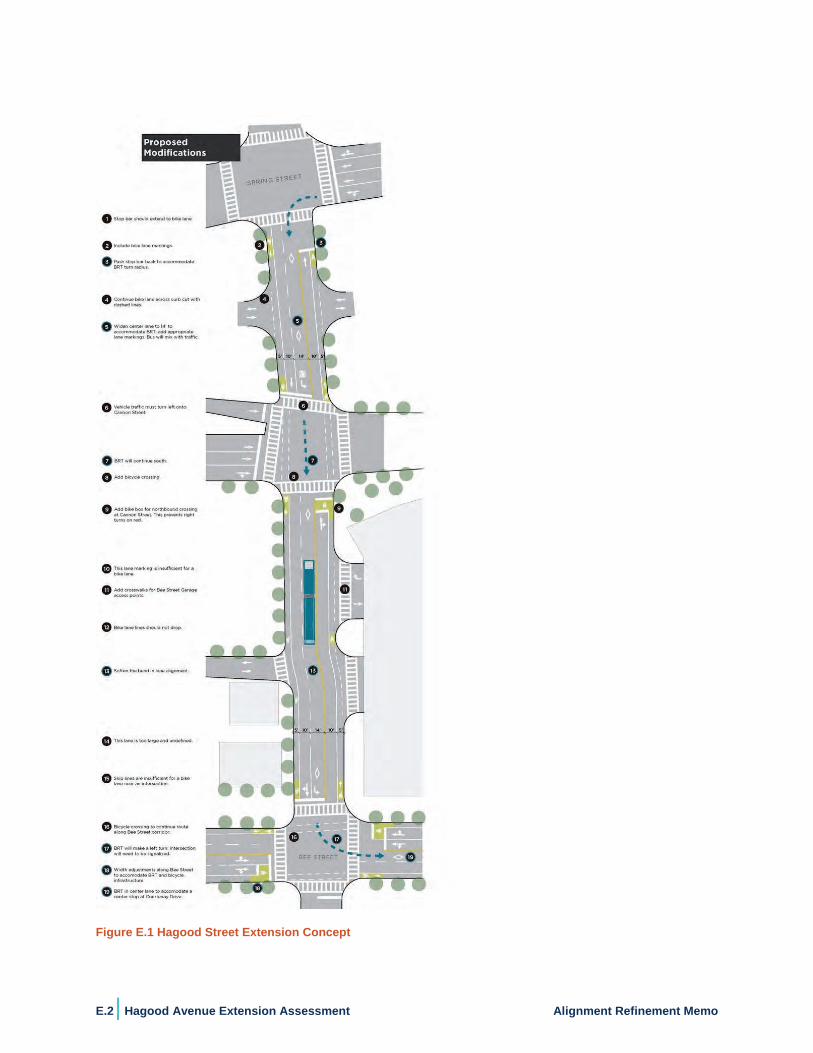
E.2 | Hagood Avenue Extension Assessment Alignment Refinement Memo
Figure E.1 Hagood Street Extension Concept
5790 Casper Padgett Way, North Charleston, SC 29406
Tel: 843.529.0400 Fax: 843.529.0305.
Appendix F: Evaluation Matrix Detailed Results
Lowcountry Rapid Transit
Berkeley-Charleston-Dorchester Council of Governments
August 10, 2020
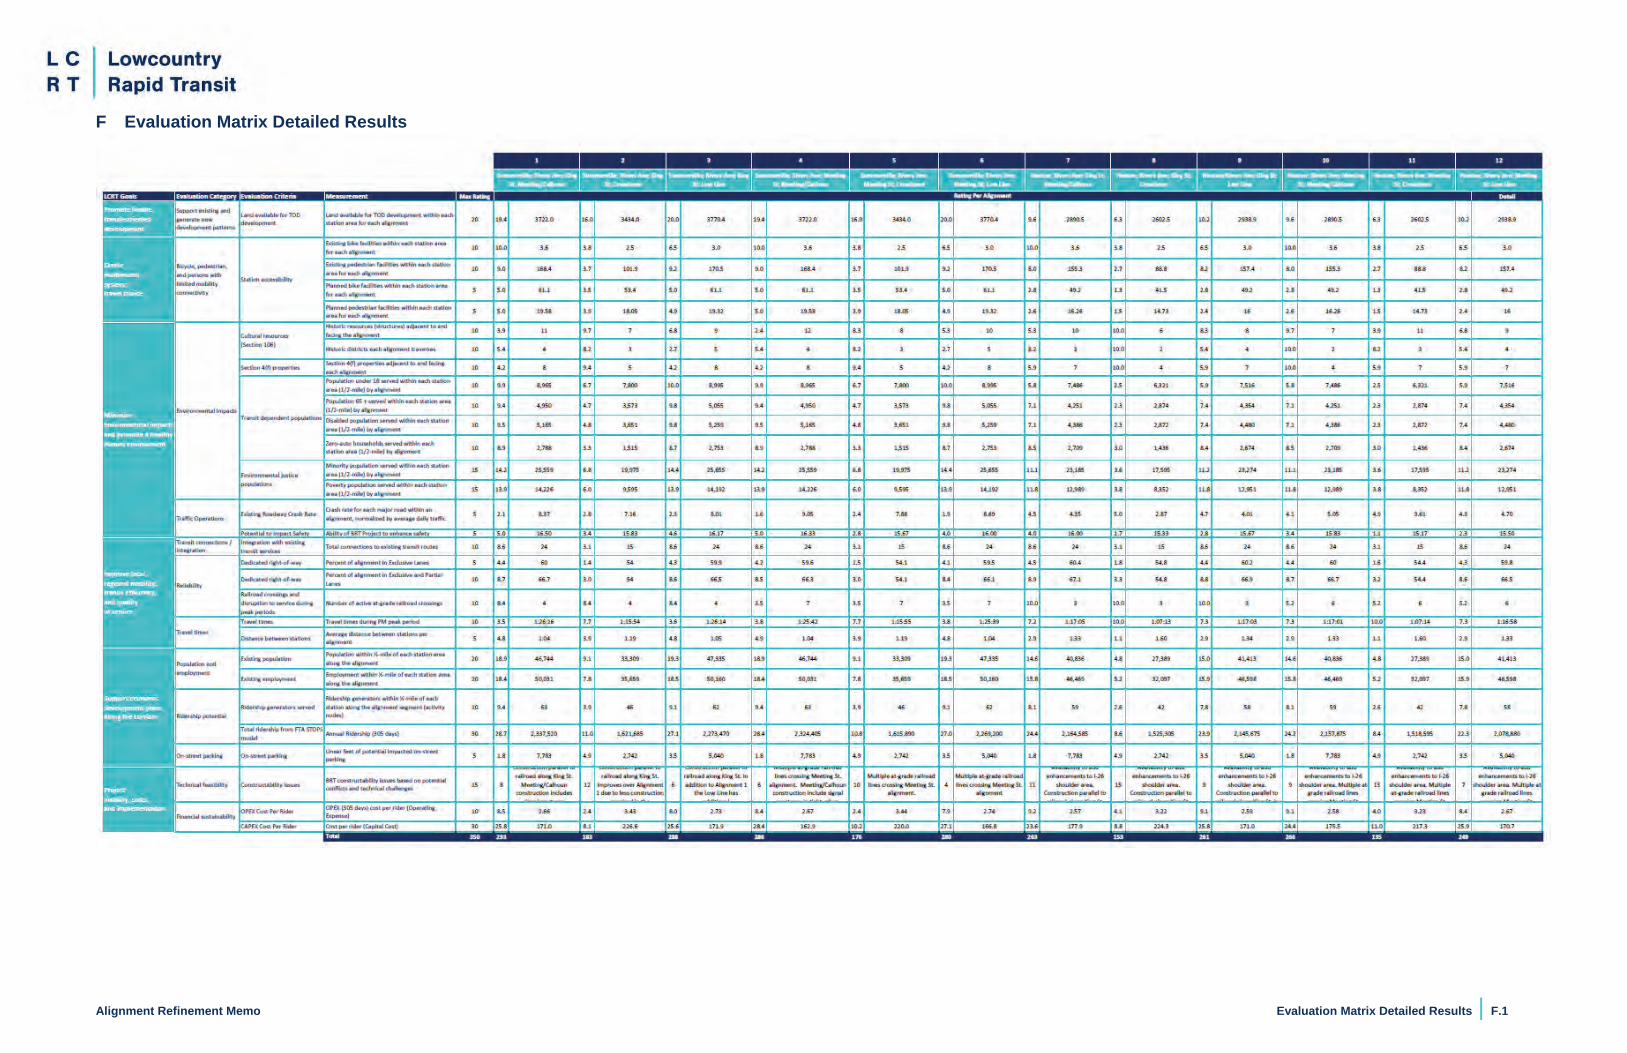
Alignment Refinement Memo Evaluation Matrix Detailed Results | F.1
F Evaluation Matrix Detailed Results
5790 Casper Padgett Way, North Charleston, SC 29406
Tel: 843.529.0400 Fax: 843.529.0305.
Appendix G: Supplemental Supportive MapsLowcountry Rapid Transit
Berkeley-Charleston-Dorchester Council of Governments
August 10, 2020

!(!(
!(
!(
!(
!(
!(
!(
!(
!(
!(!(
!(
!(
!(
!(!(
!(
!(
!(
!(
!(
!(
!(
!(
!(
!(
!?
!?
!?
!?!?!?
!?
!?
165
Summerville
Ravenel
Charleston
NorthCharleston
GooseCreek
Hanahan
CHARLESTON
DORCHESTER
BERKELEYCHARLESTON
Charleston Int'l Airport
DowntownCharleston
"Z
§̈¦
§̈¦
§̈¦26
26
526
£¤78
£¤17
£¤52
§̈¦526
Lincolnville
§̈¦26
£¤17
£¤17
£¤52
£¤78
£¤52
£¤78
642
165
61
642
7
61
461
61
30171
DORCHESTER
BERKELEY
Coope
r River
Ashley River
Stono River
IcNaval Weapons
Station Charleston
Bonneau FerryWildlife Management
Area
£¤17A
£¤17A
£¤176
Hollywood
Lowcountry Rapid Transit
0 2
Miles
O
Path: E:\Data1\BCDCOG_LCRT_2018\7.2_WIP\Map_Docs\Working\cnoone\LCRT.BRT.AlignmentRefinementAnalysis_06.29.2020.mxd - User: cnoone - Date: 7/1/2020
Data Sources: BCDCOG, SCDOT
At-Grade Rail Crossings
!(!(
!(
!(
!(
!(
!(
!?
Rutledge Ave
E Bay St
Huger St
Meeting St
Grove St
Broad St
Coming St
Bull St
Bee St
Wentworth St
Queen St
Nassau St America St
Pitt St
Line St
Savannah Hwy
Gordon St
Beaufain St
Congress StMoultrie St
Drake St
Barre St
Columbus St
George St
Race St
Montagu St
Hest
er S
t
Huguenin Ave
Concord S
tCharlotte St
Anson St
Morris St
Folly Rd Church S
t
Bogard St
Tradd St
Ash
ley Ave
San Souci StBrigade St
Hasell StSociety St
Radcliffe St
10th Ave
Romney St
F St
Jam
esIsland Expy
Heriot St
Vanderhorst St
Hanover St
Meeting S
treet Rd
Johnson St
Poplar St
Market St
Albemarle Rd
S Market St
Lee Ave
Sumter St
4th St
Nunan St
Fishburne St
Cypress St
Halsey Blvd
Cannon St
I
Spring St
12th Ave
Jenkins AveWalnut St
11th Ave
Calhoun St
Smith St
Perry St
Cleveland St
Deve
reau
x Ave
Sunnyside Ave
Sabin St
Cedar St
Washington S
tPrioleau St
Williman St
Morrison Dr
5th Ave
Mecha
nic S
t
Clifford St
Register Rd
State St
Poinsett St
Doughty St
King St
Saint Philip StSaint Andrews Blvd
King St
Line St
Savannah Hwy
Cannon St
Ashley Ave
MorrisonDr
Johnson St
Fishburne St
Legend
!? At-Grade Rail Crossing
Study Area
City Boundaries
Conservation
!( LCRT BRT Station Options
LCRT BRT Alignment Alternatives
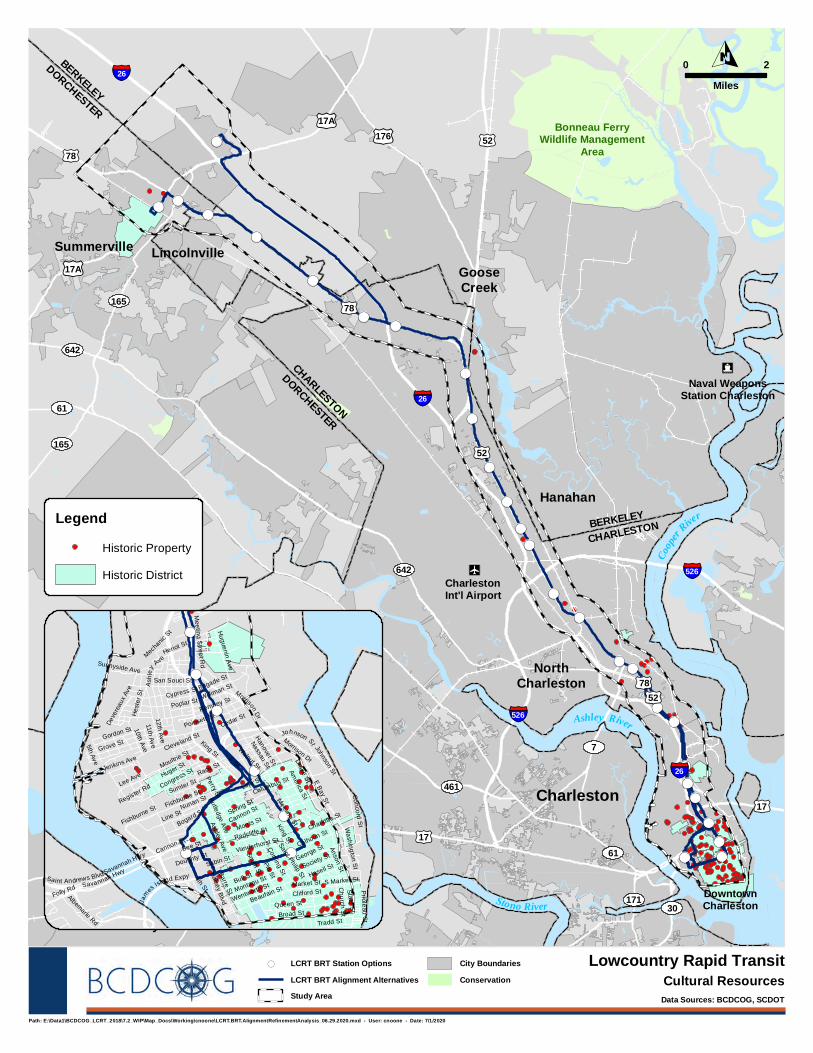
!(!(
!(
!(
!(
!(
!(
!(
!(
!(
!(!(
!(
!(
!(
!(!(
!(
!(
!(
!(
!(
!(
!(
!(
!(
!(
165
Summerville
Ravenel
Charleston
NorthCharleston
GooseCreek
Hanahan
CHARLESTON
DORCHESTER
BERKELEYCHARLESTON
Charleston Int'l Airport
DowntownCharleston
"Z
§̈¦
§̈¦
§̈¦26
26
526
£¤78
£¤17
£¤52
§̈¦526
Lincolnville
§̈¦26
£¤17
£¤17
£¤52
£¤78
£¤52
£¤78
642
165
61
642
7
61
461
61
30171
DORCHESTER
BERKELEY
Coope
r River
Ashley River
Stono River
IcNaval Weapons
Station Charleston
Bonneau FerryWildlife Management
Area
£¤17A
£¤17A
£¤176
Hollywood
Lowcountry Rapid Transit
0 2
Miles
O
Path: E:\Data1\BCDCOG_LCRT_2018\7.2_WIP\Map_Docs\Working\cnoone\LCRT.BRT.AlignmentRefinementAnalysis_06.29.2020.mxd - User: cnoone - Date: 7/1/2020
Data Sources: BCDCOG, SCDOT
Cultural Resources
!(!(
!(
!(
!(
!(
!(
Rutledge Ave
E Bay St
Huger St
Meeting St
Grove St
Broad St
Coming St
Bull St
Bee St
Wentworth St
Queen St
Nassau St America St
Pitt St
Line St
Savannah Hwy
Gordon St
Beaufain St
Congress StMoultrie St
Drake St
Barre St
Columbus St
George St
Race St
Montagu St
Hest
er S
t
Huguenin Ave
Concord S
tCharlotte St
Anson St
Morris St
Folly Rd Church S
t
Bogard St
Tradd St
Ash
ley Ave
San Souci StBrigade St
Hasell StSociety St
Radcliffe St
10th Ave
Romney St
F St
Jam
esIsland Expy
Heriot St
Vanderhorst St
Hanover St
Meeting S
treet Rd
Johnson St
Poplar St
Market St
Albemarle Rd
S Market St
Lee Ave
Sumter St
4th St
Nunan St
Fishburne St
Cypress St
Halsey Blvd
Cannon St
I
Spring St
12th Ave
Jenkins AveWalnut St
11th Ave
Calhoun St
Smith St
Perry St
Cleveland St
Deve
reau
x Ave
Sunnyside Ave
Sabin St
Cedar St
Washington S
tPrioleau St
Williman St
Morrison Dr
5th Ave
Mecha
nic S
t
Clifford St
Register Rd
State St
Poinsett St
Doughty St
King St
Saint Philip StSaint Andrews Blvd
King St
Line St
Savannah Hwy
Cannon St
Ashley Ave
MorrisonDr
Johnson St
Fishburne St
Legend
Historic Property
Historic District
Study Area
City Boundaries
Conservation
!( LCRT BRT Station Options
LCRT BRT Alignment Alternatives
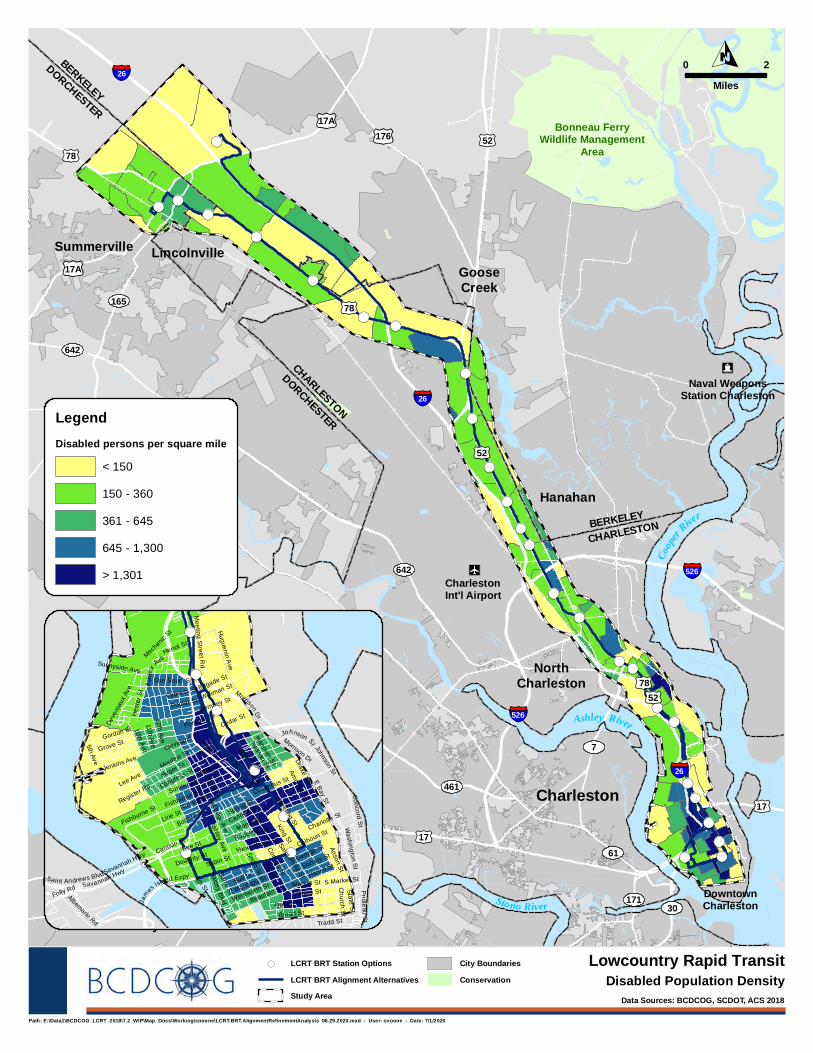
!(!(
!(
!(
!(
!(
!(
!(
!(
!(
!(!(
!(
!(
!(
!(!(
!(
!(
!(
!(
!(
!(
!(
!(
!(
!(
165
Summerville
Ravenel
Charleston
NorthCharleston
GooseCreek
Hanahan
CHARLESTON
DORCHESTER
BERKELEYCHARLESTON
Charleston Int'l Airport
DowntownCharleston
"Z
§̈¦
§̈¦
§̈¦26
26
526
£¤78
£¤17
£¤52
§̈¦526
Lincolnville
§̈¦26
£¤17
£¤17
£¤52
£¤78
£¤52
£¤78
642
165
61
642
7
61
461
61
30171
DORCHESTER
BERKELEY
Coope
r River
Ashley River
Stono River
IcNaval Weapons
Station Charleston
Bonneau FerryWildlife Management
Area
£¤17A
£¤17A
£¤176
Hollywood
Lowcountry Rapid Transit
0 2
Miles
O
Path: E:\Data1\BCDCOG_LCRT_2018\7.2_WIP\Map_Docs\Working\cnoone\LCRT.BRT.AlignmentRefinementAnalysis_06.29.2020.mxd - User: cnoone - Date: 7/1/2020
Data Sources: BCDCOG, SCDOT, ACS 2018
Disabled Population Density
!(!(
!(
!(
!(
!(
!(
Rutledge Ave
E Bay St
Huger St
Meeting St
Grove St
Broad St
Coming St
Bull St
Bee St
Wentworth St
Queen St
Nassau St America St
Pitt St
Line St
Savannah Hwy
Gordon St
Beaufain St
Congress StMoultrie St
Drake St
Barre St
Columbus St
George St
Race St
Montagu St
Hest
er S
t
Huguenin Ave
Concord S
tCharlotte St
Anson St
Morris St
Folly Rd Church S
t
Bogard St
Tradd St
Ash
ley Ave
San Souci StBrigade St
Hasell StSociety St
Radcliffe St
10th Ave
Romney St
F St
Jam
esIsland Expy
Heriot St
Vanderhorst St
Hanover St
Meeting S
treet Rd
Johnson St
Poplar St
Market St
Albemarle Rd
S Market St
Lee Ave
Sumter St
4th St
Nunan St
Fishburne St
Cypress St
Halsey Blvd
Cannon St
I
Spring St
12th Ave
Jenkins AveWalnut St
11th Ave
Calhoun St
Smith St
Perry St
Cleveland St
Deve
reau
x Ave
Sunnyside Ave
Sabin St
Cedar St
Washington S
tPrioleau St
Williman St
Morrison Dr
5th Ave
Mecha
nic S
t
Clifford St
Register Rd
State St
Poinsett St
Doughty St
King St
Saint Philip StSaint Andrews Blvd
King St
Line St
Savannah Hwy
Cannon St
Ashley Ave
MorrisonDr
Johnson St
Fishburne St
LegendDisabled persons per square mile
< 150
150 - 360
361 - 645
645 - 1,300
> 1,301
Study Area
City Boundaries
Conservation
!( LCRT BRT Station Options
LCRT BRT Alignment Alternatives
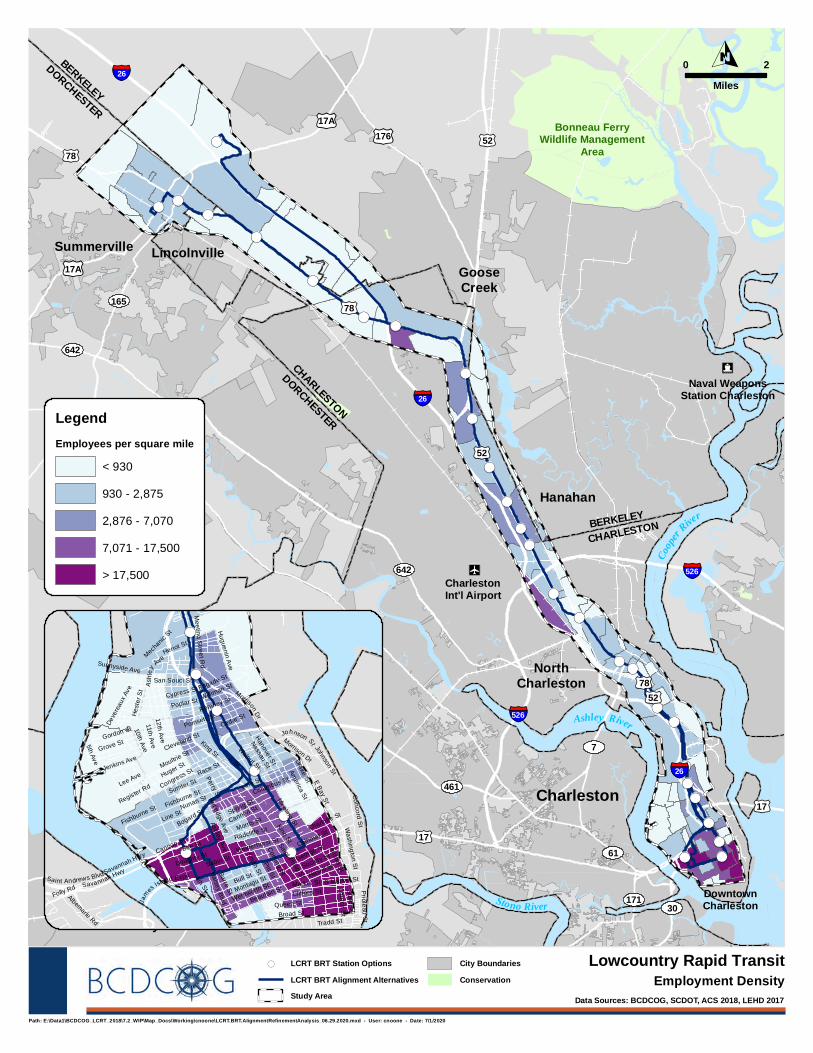
!(!(
!(
!(
!(
!(
!(
!(
!(
!(
!(!(
!(
!(
!(
!(!(
!(
!(
!(
!(
!(
!(
!(
!(
!(
!(
165
Summerville
Ravenel
Charleston
NorthCharleston
GooseCreek
Hanahan
CHARLESTON
DORCHESTER
BERKELEYCHARLESTON
Charleston Int'l Airport
DowntownCharleston
"Z
§̈¦
§̈¦
§̈¦26
26
526
£¤78
£¤17
£¤52
§̈¦526
Lincolnville
§̈¦26
£¤17
£¤17
£¤52
£¤78
£¤52
£¤78
642
165
61
642
7
61
461
61
30171
DORCHESTER
BERKELEY
Coope
r River
Ashley River
Stono River
IcNaval Weapons
Station Charleston
Bonneau FerryWildlife Management
Area
£¤17A
£¤17A
£¤176
Hollywood
Lowcountry Rapid Transit
0 2
Miles
O
Path: E:\Data1\BCDCOG_LCRT_2018\7.2_WIP\Map_Docs\Working\cnoone\LCRT.BRT.AlignmentRefinementAnalysis_06.29.2020.mxd - User: cnoone - Date: 7/1/2020
Data Sources: BCDCOG, SCDOT, ACS 2018, LEHD 2017
Employment Density
!(!(
!(
!(
!(
!(
!(
Rutledge Ave
E Bay St
Huger St
Meeting St
Grove St
Broad St
Coming St
Bull St
Bee St
Wentworth St
Queen St
Nassau St America St
Pitt St
Line St
Savannah Hwy
Gordon St
Beaufain St
Congress StMoultrie St
Drake St
Barre St
Columbus St
George St
Race St
Montagu St
Hest
er S
t
Huguenin Ave
Concord S
tCharlotte St
Anson St
Morris St
Folly Rd Church S
t
Bogard St
Tradd St
Ash
ley Ave
San Souci StBrigade St
Hasell StSociety St
Radcliffe St
10th Ave
Romney St
F St
Jam
esIsland Expy
Heriot St
Vanderhorst St
Hanover St
Meeting S
treet Rd
Johnson St
Poplar St
Market St
Albemarle Rd
S Market St
Lee Ave
Sumter St
4th St
Nunan St
Fishburne St
Cypress St
Halsey Blvd
Cannon St
I
Spring St
12th Ave
Jenkins AveWalnut St
11th Ave
Calhoun St
Smith St
Perry St
Cleveland St
Deve
reau
x Ave
Sunnyside Ave
Sabin St
Cedar St
Washington S
tPrioleau St
Williman St
Morrison Dr
5th Ave
Mecha
nic S
t
Clifford St
Register Rd
State St
Poinsett St
Doughty St
King St
Saint Philip StSaint Andrews Blvd
King St
Line St
Savannah Hwy
Cannon St
Ashley Ave
MorrisonDr
Johnson St
Fishburne St
LegendEmployees per square mile
< 930
930 - 2,875
2,876 - 7,070
7,071 - 17,500
> 17,500
Study Area
City Boundaries
Conservation
!( LCRT BRT Station Options
LCRT BRT Alignment Alternatives
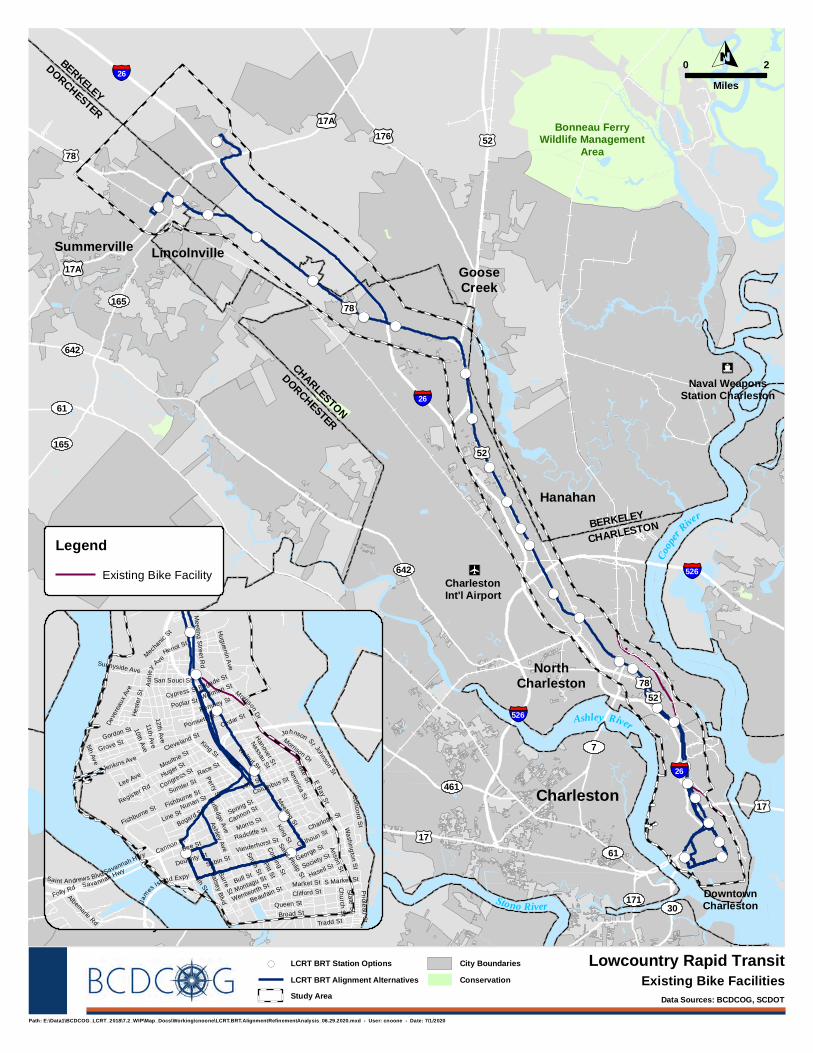
!(!(
!(
!(
!(
!(
!(
!(
!(
!(
!(!(
!(
!(
!(
!(!(
!(
!(
!(
!(
!(
!(
!(
!(
!(
!(
165
Summerville
Ravenel
Charleston
NorthCharleston
GooseCreek
Hanahan
CHARLESTON
DORCHESTER
BERKELEYCHARLESTON
Charleston Int'l Airport
DowntownCharleston
"Z
§̈¦
§̈¦
§̈¦26
26
526
£¤78
£¤17
£¤52
§̈¦526
Lincolnville
§̈¦26
£¤17
£¤17
£¤52
£¤78
£¤52
£¤78
642
165
61
642
7
61
461
61
30171
DORCHESTER
BERKELEY
Coope
r River
Ashley River
Stono River
IcNaval Weapons
Station Charleston
Bonneau FerryWildlife Management
Area
£¤17A
£¤17A
£¤176
Hollywood
Lowcountry Rapid Transit
0 2
Miles
O
Path: E:\Data1\BCDCOG_LCRT_2018\7.2_WIP\Map_Docs\Working\cnoone\LCRT.BRT.AlignmentRefinementAnalysis_06.29.2020.mxd - User: cnoone - Date: 7/1/2020
Data Sources: BCDCOG, SCDOT
Existing Bike Facilities
!(!(
!(
!(
!(
!(
!(
Rutledge Ave
E Bay St
Huger St
Meeting St
Grove St
Broad St
Coming St
Bull St
Bee St
Wentworth St
Queen St
Nassau St America St
Pitt St
Line St
Savannah Hwy
Gordon St
Beaufain St
Congress StMoultrie St
Drake St
Barre St
Columbus St
George St
Race St
Montagu St
Hest
er S
t
Huguenin Ave
Concord S
tCharlotte St
Anson St
Morris St
Folly Rd Church S
t
Bogard St
Tradd St
Ash
ley Ave
San Souci StBrigade St
Hasell StSociety St
Radcliffe St
10th Ave
Romney St
F St
Jam
esIsland Expy
Heriot St
Vanderhorst St
Hanover St
Meeting S
treet Rd
Johnson St
Poplar St
Market St
Albemarle Rd
S Market St
Lee Ave
Sumter St
4th St
Nunan St
Fishburne St
Cypress St
Halsey Blvd
Cannon St
I
Spring St
12th Ave
Jenkins AveWalnut St
11th Ave
Calhoun St
Smith St
Perry St
Cleveland St
Deve
reau
x Ave
Sunnyside Ave
Sabin St
Cedar St
Washington S
tPrioleau St
Williman St
Morrison Dr
5th Ave
Mecha
nic S
t
Clifford St
Register Rd
State St
Poinsett St
Doughty St
King St
Saint Philip StSaint Andrews Blvd
King St
Line St
Savannah Hwy
Cannon St
Ashley Ave
MorrisonDr
Johnson St
Fishburne St
Legend
Existing Bike Facility
Study Area
City Boundaries
Conservation
!( LCRT BRT Station Options
LCRT BRT Alignment Alternatives
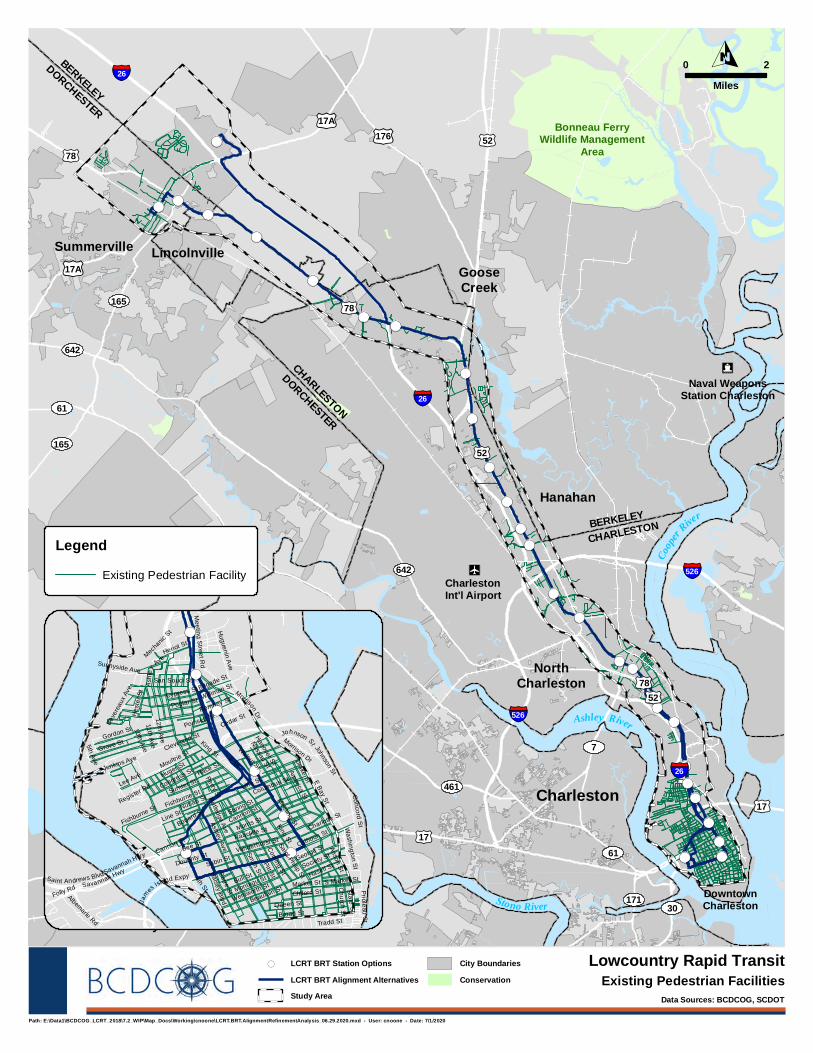
!(!(
!(
!(
!(
!(
!(
!(
!(
!(
!(!(
!(
!(
!(
!(!(
!(
!(
!(
!(
!(
!(
!(
!(
!(
!(
165
Summerville
Ravenel
Charleston
NorthCharleston
GooseCreek
Hanahan
CHARLESTON
DORCHESTER
BERKELEYCHARLESTON
Charleston Int'l Airport
DowntownCharleston
"Z
§̈¦
§̈¦
§̈¦26
26
526
£¤78
£¤17
£¤52
§̈¦526
Lincolnville
§̈¦26
£¤17
£¤17
£¤52
£¤78
£¤52
£¤78
642
165
61
642
7
61
461
61
30171
DORCHESTER
BERKELEY
Coope
r River
Ashley River
Stono River
IcNaval Weapons
Station Charleston
Bonneau FerryWildlife Management
Area
£¤17A
£¤17A
£¤176
Hollywood
Lowcountry Rapid Transit
0 2
Miles
O
Path: E:\Data1\BCDCOG_LCRT_2018\7.2_WIP\Map_Docs\Working\cnoone\LCRT.BRT.AlignmentRefinementAnalysis_06.29.2020.mxd - User: cnoone - Date: 7/1/2020
Data Sources: BCDCOG, SCDOT
Existing Pedestrian Facilities
!(!(
!(
!(
!(
!(
!(
Rutledge Ave
E Bay St
Huger St
Meeting St
Grove St
Broad St
Coming St
Bull St
Bee St
Wentworth St
Queen St
Nassau St America St
Pitt St
Line St
Savannah Hwy
Gordon St
Beaufain St
Congress StMoultrie St
Drake St
Barre St
Columbus St
George St
Race St
Montagu St
Hest
er S
t
Huguenin Ave
Concord S
tCharlotte St
Anson St
Morris St
Folly Rd Church S
t
Bogard St
Tradd St
Ash
ley Ave
San Souci StBrigade St
Hasell StSociety St
Radcliffe St
10th Ave
Romney St
F St
Jam
esIsland Expy
Heriot St
Vanderhorst St
Hanover St
Meeting S
treet Rd
Johnson St
Poplar St
Market St
Albemarle Rd
S Market St
Lee Ave
Sumter St
4th St
Nunan St
Fishburne St
Cypress St
Halsey Blvd
Cannon St
I
Spring St
12th Ave
Jenkins AveWalnut St
11th Ave
Calhoun St
Smith St
Perry St
Cleveland St
Deve
reau
x Ave
Sunnyside Ave
Sabin St
Cedar St
Washington S
tPrioleau St
Williman St
Morrison Dr
5th Ave
Mecha
nic S
t
Clifford St
Register Rd
State St
Poinsett St
Doughty St
King St
Saint Philip StSaint Andrews Blvd
King St
Line St
Savannah Hwy
Cannon St
Ashley Ave
MorrisonDr
Johnson St
Fishburne St
Legend
Existing Pedestrian Facility
Study Area
City Boundaries
Conservation
!( LCRT BRT Station Options
LCRT BRT Alignment Alternatives
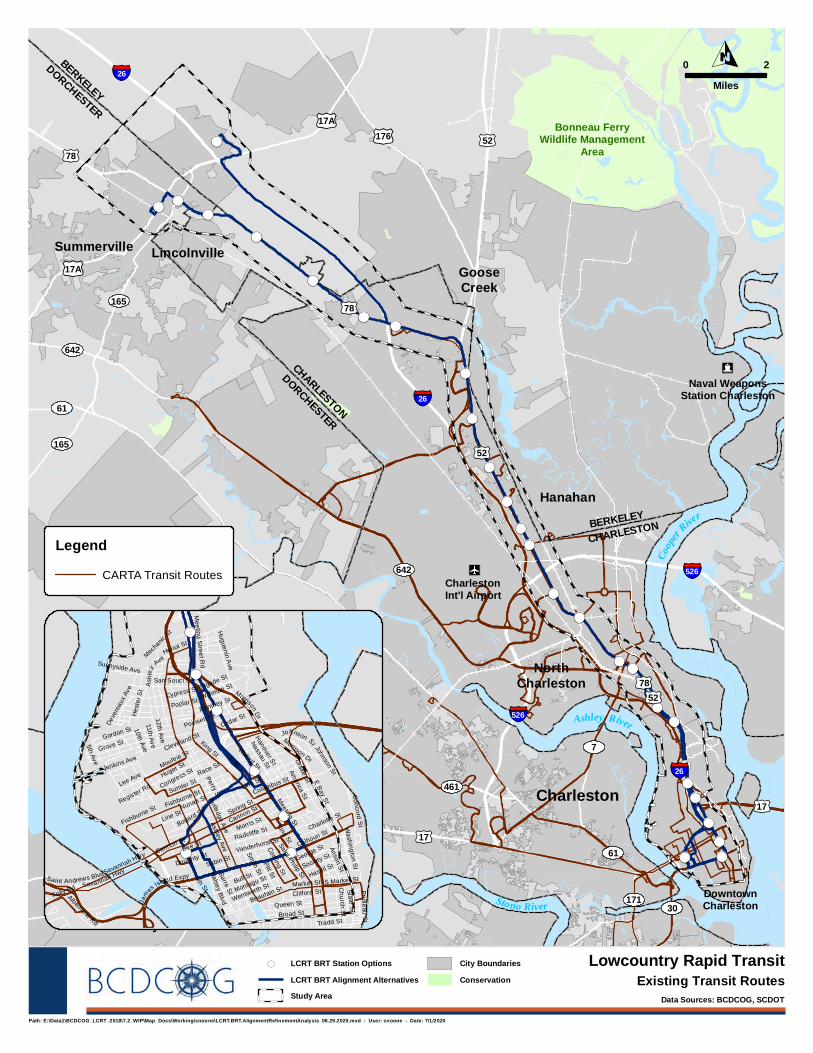
!(!(
!(
!(
!(
!(
!(
!(
!(
!(
!(!(
!(
!(
!(
!(!(
!(
!(
!(
!(
!(
!(
!(
!(
!(
!(
165
Summerville
Ravenel
Charleston
NorthCharleston
GooseCreek
Hanahan
CHARLESTON
DORCHESTER
BERKELEYCHARLESTON
Charleston Int'l Airport
DowntownCharleston
"Z
§̈¦
§̈¦
§̈¦26
26
526
£¤78
£¤17
£¤52
§̈¦526
Lincolnville
§̈¦26
£¤17
£¤17
£¤52
£¤78
£¤52
£¤78
642
165
61
642
7
61
461
61
30171
DORCHESTER
BERKELEY
Coope
r River
Ashley River
Stono River
IcNaval Weapons
Station Charleston
Bonneau FerryWildlife Management
Area
£¤17A
£¤17A
£¤176
Hollywood
Lowcountry Rapid Transit
0 2
Miles
O
Path: E:\Data1\BCDCOG_LCRT_2018\7.2_WIP\Map_Docs\Working\cnoone\LCRT.BRT.AlignmentRefinementAnalysis_06.29.2020.mxd - User: cnoone - Date: 7/1/2020
Data Sources: BCDCOG, SCDOT
Existing Transit Routes
!(!(
!(
!(
!(
!(
!(
Rutledge Ave
E Bay St
Huger St
Meeting St
Grove St
Broad St
Coming St
Bull St
Bee St
Wentworth St
Queen St
Nassau St America St
Pitt St
Line St
Savannah Hwy
Gordon St
Beaufain St
Congress StMoultrie St
Drake St
Barre St
Columbus St
George St
Race St
Montagu St
Hest
er S
t
Huguenin Ave
Concord S
tCharlotte St
Anson St
Morris St
Folly Rd Church S
t
Bogard St
Tradd St
Ash
ley Ave
San Souci StBrigade St
Hasell StSociety St
Radcliffe St
10th Ave
Romney St
F St
Jam
esIsland Expy
Heriot St
Vanderhorst St
Hanover St
Meeting S
treet Rd
Johnson St
Poplar St
Market St
Albemarle Rd
S Market St
Lee Ave
Sumter St
4th St
Nunan St
Fishburne St
Cypress St
Halsey Blvd
Cannon St
I
Spring St
12th Ave
Jenkins AveWalnut St
11th Ave
Calhoun St
Smith St
Perry St
Cleveland St
Deve
reau
x Ave
Sunnyside Ave
Sabin St
Cedar St
Washington S
tPrioleau St
Williman St
Morrison Dr
5th Ave
Mecha
nic S
t
Clifford St
Register Rd
State St
Poinsett St
Doughty St
King St
Saint Philip StSaint Andrews Blvd
King St
Line St
Savannah Hwy
Cannon St
Ashley Ave
MorrisonDr
Johnson St
Fishburne St
Legend
CARTA Transit Routes
Study Area
City Boundaries
Conservation
!( LCRT BRT Station Options
LCRT BRT Alignment Alternatives
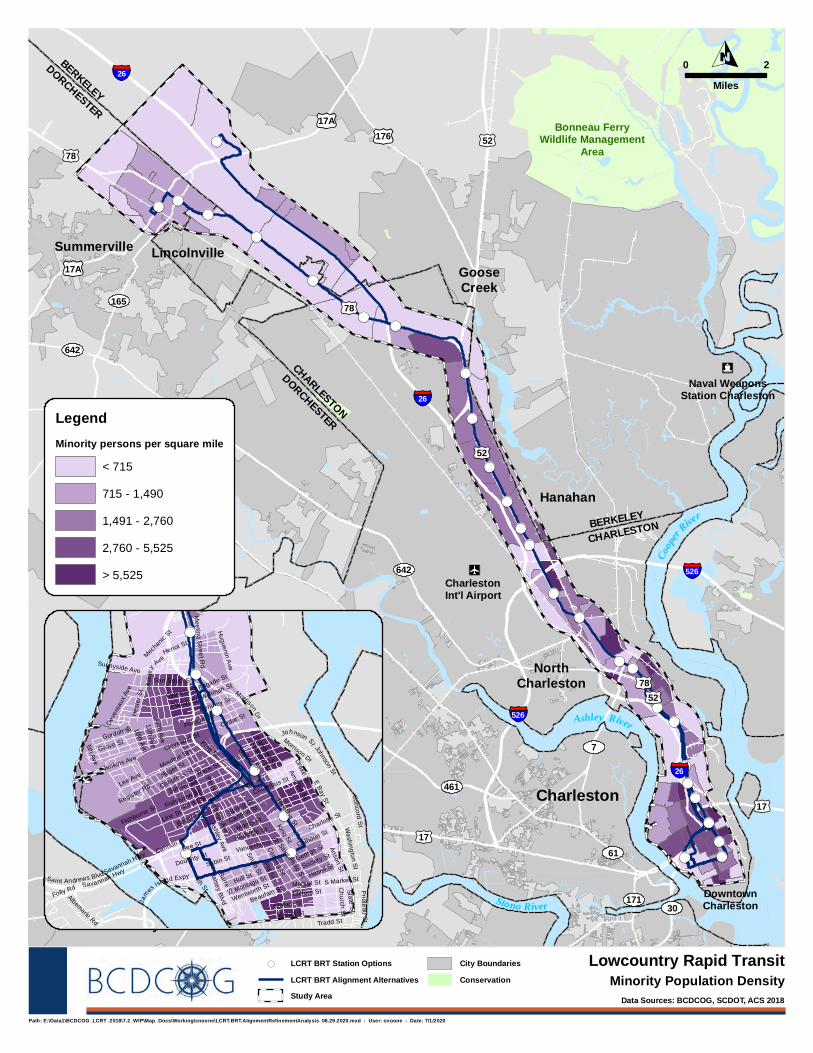
!(!(
!(
!(
!(
!(
!(
!(
!(
!(
!(!(
!(
!(
!(
!(!(
!(
!(
!(
!(
!(
!(
!(
!(
!(
!(
165
Summerville
Ravenel
Charleston
NorthCharleston
GooseCreek
Hanahan
CHARLESTON
DORCHESTER
BERKELEYCHARLESTON
Charleston Int'l Airport
DowntownCharleston
"Z
§̈¦
§̈¦
§̈¦26
26
526
£¤78
£¤17
£¤52
§̈¦526
Lincolnville
§̈¦26
£¤17
£¤17
£¤52
£¤78
£¤52
£¤78
642
165
61
642
7
61
461
61
30171
DORCHESTER
BERKELEY
Coope
r River
Ashley River
Stono River
IcNaval Weapons
Station Charleston
Bonneau FerryWildlife Management
Area
£¤17A
£¤17A
£¤176
Hollywood
Lowcountry Rapid Transit
0 2
Miles
O
Path: E:\Data1\BCDCOG_LCRT_2018\7.2_WIP\Map_Docs\Working\cnoone\LCRT.BRT.AlignmentRefinementAnalysis_06.29.2020.mxd - User: cnoone - Date: 7/1/2020
Data Sources: BCDCOG, SCDOT, ACS 2018
Minority Population Density
!(!(
!(
!(
!(
!(
!(
Rutledge Ave
E Bay St
Huger St
Meeting St
Grove St
Broad St
Coming St
Bull St
Bee St
Wentworth St
Queen St
Nassau St America St
Pitt St
Line St
Savannah Hwy
Gordon St
Beaufain St
Congress StMoultrie St
Drake St
Barre St
Columbus St
George St
Race St
Montagu St
Hest
er S
t
Huguenin Ave
Concord S
tCharlotte St
Anson St
Morris St
Folly Rd Church S
t
Bogard St
Tradd St
Ash
ley Ave
San Souci StBrigade St
Hasell StSociety St
Radcliffe St
10th Ave
Romney St
F St
Jam
esIsland Expy
Heriot St
Vanderhorst St
Hanover St
Meeting S
treet Rd
Johnson St
Poplar St
Market St
Albemarle Rd
S Market St
Lee Ave
Sumter St
4th St
Nunan St
Fishburne St
Cypress St
Halsey Blvd
Cannon St
I
Spring St
12th Ave
Jenkins AveWalnut St
11th Ave
Calhoun St
Smith St
Perry St
Cleveland St
Deve
reau
x Ave
Sunnyside Ave
Sabin St
Cedar St
Washington S
tPrioleau St
Williman St
Morrison Dr
5th Ave
Mecha
nic S
t
Clifford St
Register Rd
State St
Poinsett St
Doughty St
King St
Saint Philip StSaint Andrews Blvd
King St
Line St
Savannah Hwy
Cannon St
Ashley Ave
MorrisonDr
Johnson St
Fishburne St
LegendMinority persons per square mile
< 715
715 - 1,490
1,491 - 2,760
2,760 - 5,525
> 5,525
Study Area
City Boundaries
Conservation
!( LCRT BRT Station Options
LCRT BRT Alignment Alternatives
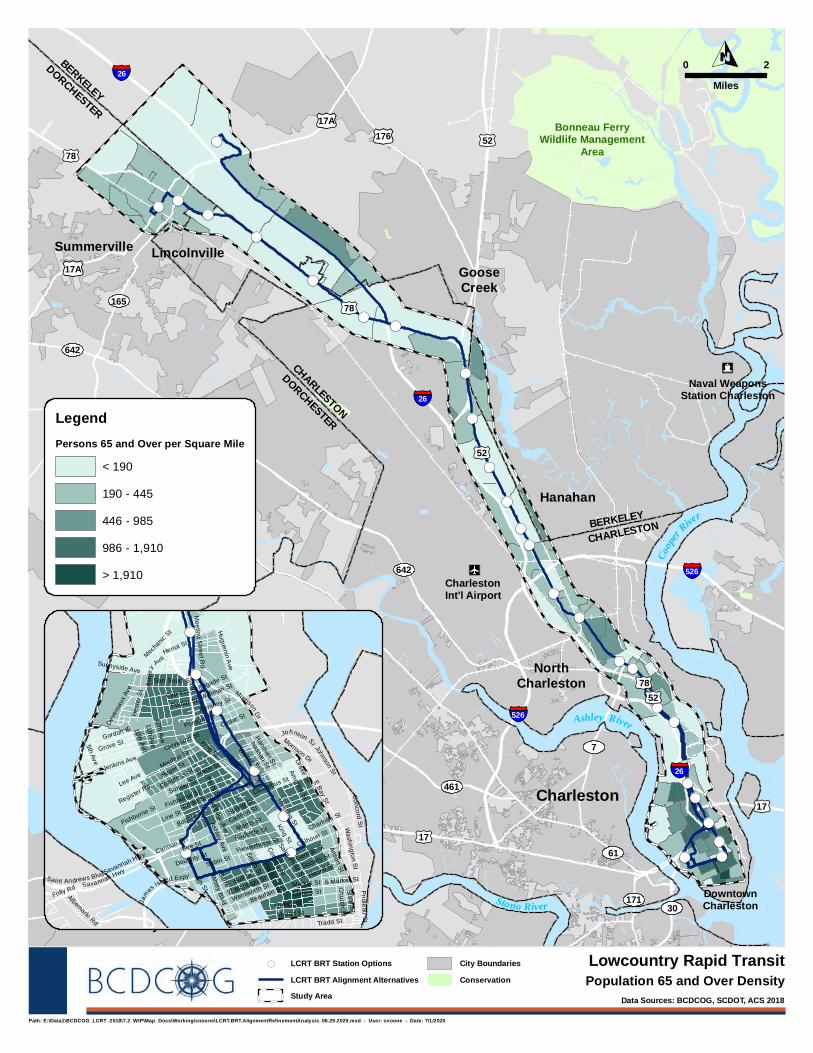
!(!(
!(
!(
!(
!(
!(
!(
!(
!(
!(!(
!(
!(
!(
!(!(
!(
!(
!(
!(
!(
!(
!(
!(
!(
!(
165
Summerville
Ravenel
Charleston
NorthCharleston
GooseCreek
Hanahan
CHARLESTON
DORCHESTER
BERKELEYCHARLESTON
Charleston Int'l Airport
DowntownCharleston
"Z
§̈¦
§̈¦
§̈¦26
26
526
£¤78
£¤17
£¤52
§̈¦526
Lincolnville
§̈¦26
£¤17
£¤17
£¤52
£¤78
£¤52
£¤78
642
165
61
642
7
61
461
61
30171
DORCHESTER
BERKELEY
Coope
r River
Ashley River
Stono River
IcNaval Weapons
Station Charleston
Bonneau FerryWildlife Management
Area
£¤17A
£¤17A
£¤176
Hollywood
Lowcountry Rapid Transit
0 2
Miles
O
Path: E:\Data1\BCDCOG_LCRT_2018\7.2_WIP\Map_Docs\Working\cnoone\LCRT.BRT.AlignmentRefinementAnalysis_06.29.2020.mxd - User: cnoone - Date: 7/1/2020
Data Sources: BCDCOG, SCDOT, ACS 2018
Population 65 and Over Density
!(!(
!(
!(
!(
!(
!(
Rutledge Ave
E Bay St
Huger St
Meeting St
Grove St
Broad St
Coming St
Bull St
Bee St
Wentworth St
Queen St
Nassau St America St
Pitt St
Line St
Savannah Hwy
Gordon St
Beaufain St
Congress StMoultrie St
Drake St
Barre St
Columbus St
George St
Race St
Montagu St
Hest
er S
t
Huguenin Ave
Concord S
tCharlotte St
Anson St
Morris St
Folly Rd Church S
t
Bogard St
Tradd St
Ash
ley Ave
San Souci StBrigade St
Hasell StSociety St
Radcliffe St
10th Ave
Romney St
F St
Jam
esIsland Expy
Heriot St
Vanderhorst St
Hanover St
Meeting S
treet Rd
Johnson St
Poplar St
Market St
Albemarle Rd
S Market St
Lee Ave
Sumter St
4th St
Nunan St
Fishburne St
Cypress St
Halsey Blvd
Cannon St
I
Spring St
12th Ave
Jenkins AveWalnut St
11th Ave
Calhoun St
Smith St
Perry St
Cleveland St
Deve
reau
x Ave
Sunnyside Ave
Sabin St
Cedar St
Washington S
tPrioleau St
Williman St
Morrison Dr
5th Ave
Mecha
nic S
t
Clifford St
Register Rd
State St
Poinsett St
Doughty St
King St
Saint Philip StSaint Andrews Blvd
King St
Line St
Savannah Hwy
Cannon St
Ashley Ave
MorrisonDr
Johnson St
Fishburne St
LegendPersons 65 and Over per Square Mile
< 190
190 - 445
446 - 985
986 - 1,910
> 1,910
Study Area
City Boundaries
Conservation
!( LCRT BRT Station Options
LCRT BRT Alignment Alternatives
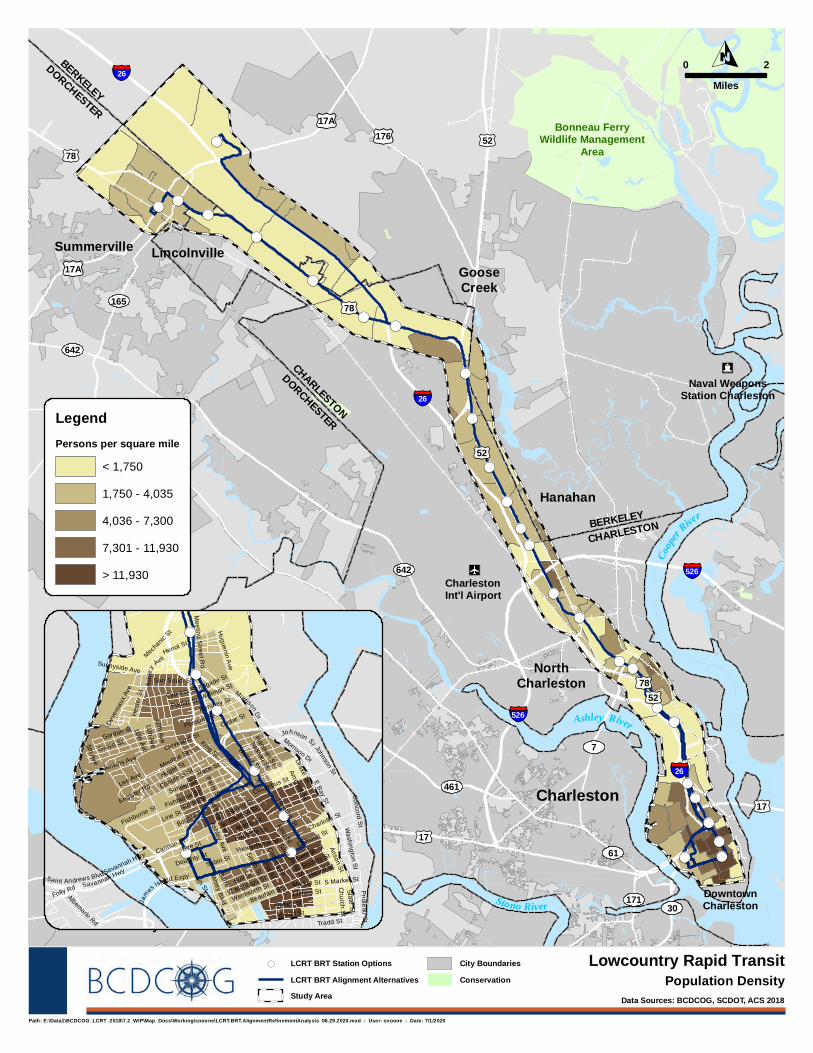
!(!(
!(
!(
!(
!(
!(
!(
!(
!(
!(!(
!(
!(
!(
!(!(
!(
!(
!(
!(
!(
!(
!(
!(
!(
!(
165
Summerville
Ravenel
Charleston
NorthCharleston
GooseCreek
Hanahan
CHARLESTON
DORCHESTER
BERKELEYCHARLESTON
Charleston Int'l Airport
DowntownCharleston
"Z
§̈¦
§̈¦
§̈¦26
26
526
£¤78
£¤17
£¤52
§̈¦526
Lincolnville
§̈¦26
£¤17
£¤17
£¤52
£¤78
£¤52
£¤78
642
165
61
642
7
61
461
61
30171
DORCHESTER
BERKELEY
Coope
r River
Ashley River
Stono River
IcNaval Weapons
Station Charleston
Bonneau FerryWildlife Management
Area
£¤17A
£¤17A
£¤176
Hollywood
Lowcountry Rapid Transit
0 2
Miles
O
Path: E:\Data1\BCDCOG_LCRT_2018\7.2_WIP\Map_Docs\Working\cnoone\LCRT.BRT.AlignmentRefinementAnalysis_06.29.2020.mxd - User: cnoone - Date: 7/1/2020
Data Sources: BCDCOG, SCDOT, ACS 2018
Population Density
!(!(
!(
!(
!(
!(
!(
Rutledge Ave
E Bay St
Huger St
Meeting St
Grove St
Broad St
Coming St
Bull St
Bee St
Wentworth St
Queen St
Nassau St America St
Pitt St
Line St
Savannah Hwy
Gordon St
Beaufain St
Congress StMoultrie St
Drake St
Barre St
Columbus St
George St
Race St
Montagu St
Hest
er S
t
Huguenin Ave
Concord S
tCharlotte St
Anson St
Morris St
Folly Rd Church S
t
Bogard St
Tradd St
Ash
ley Ave
San Souci StBrigade St
Hasell StSociety St
Radcliffe St
10th Ave
Romney St
F St
Jam
esIsland Expy
Heriot St
Vanderhorst St
Hanover St
Meeting S
treet Rd
Johnson St
Poplar St
Market St
Albemarle Rd
S Market St
Lee Ave
Sumter St
4th St
Nunan St
Fishburne St
Cypress St
Halsey Blvd
Cannon St
I
Spring St
12th Ave
Jenkins AveWalnut St
11th Ave
Calhoun St
Smith St
Perry St
Cleveland St
Deve
reau
x Ave
Sunnyside Ave
Sabin St
Cedar St
Washington S
tPrioleau St
Williman St
Morrison Dr
5th Ave
Mecha
nic S
t
Clifford St
Register Rd
State St
Poinsett St
Doughty St
King St
Saint Philip StSaint Andrews Blvd
King St
Line St
Savannah Hwy
Cannon St
Ashley Ave
MorrisonDr
Johnson St
Fishburne St
LegendPersons per square mile
< 1,750
1,750 - 4,035
4,036 - 7,300
7,301 - 11,930
> 11,930
Study Area
City Boundaries
Conservation
!( LCRT BRT Station Options
LCRT BRT Alignment Alternatives
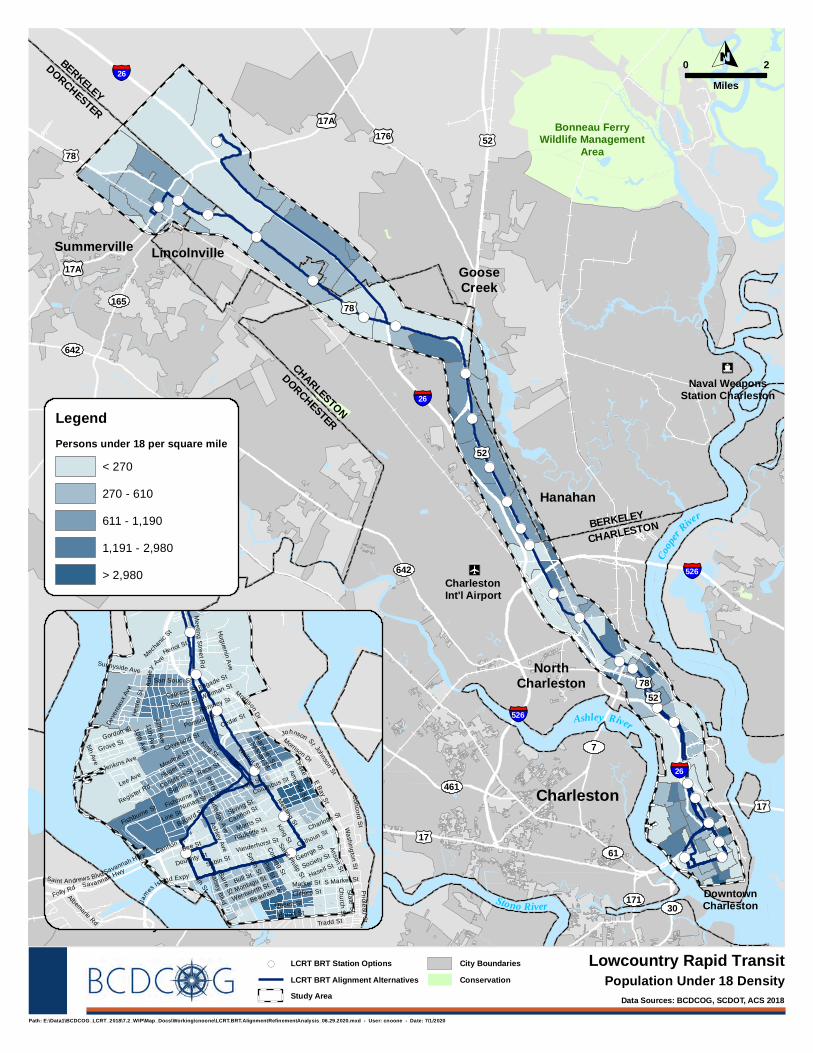
!(!(
!(
!(
!(
!(
!(
!(
!(
!(
!(!(
!(
!(
!(
!(!(
!(
!(
!(
!(
!(
!(
!(
!(
!(
!(
165
Summerville
Ravenel
Charleston
NorthCharleston
GooseCreek
Hanahan
CHARLESTON
DORCHESTER
BERKELEYCHARLESTON
Charleston Int'l Airport
DowntownCharleston
"Z
§̈¦
§̈¦
§̈¦26
26
526
£¤78
£¤17
£¤52
§̈¦526
Lincolnville
§̈¦26
£¤17
£¤17
£¤52
£¤78
£¤52
£¤78
642
165
61
642
7
61
461
61
30171
DORCHESTER
BERKELEY
Coope
r River
Ashley River
Stono River
IcNaval Weapons
Station Charleston
Bonneau FerryWildlife Management
Area
£¤17A
£¤17A
£¤176
Hollywood
Lowcountry Rapid Transit
0 2
Miles
O
Path: E:\Data1\BCDCOG_LCRT_2018\7.2_WIP\Map_Docs\Working\cnoone\LCRT.BRT.AlignmentRefinementAnalysis_06.29.2020.mxd - User: cnoone - Date: 7/1/2020
Data Sources: BCDCOG, SCDOT, ACS 2018
Population Under 18 Density
!(!(
!(
!(
!(
!(
!(
Rutledge Ave
E Bay St
Huger St
Meeting St
Grove St
Broad St
Coming St
Bull St
Bee St
Wentworth St
Queen St
Nassau St America St
Pitt St
Line St
Savannah Hwy
Gordon St
Beaufain St
Congress StMoultrie St
Drake St
Barre St
Columbus St
George St
Race St
Montagu St
Hest
er S
t
Huguenin Ave
Concord S
tCharlotte St
Anson St
Morris St
Folly Rd Church S
t
Bogard St
Tradd St
Ash
ley Ave
San Souci StBrigade St
Hasell StSociety St
Radcliffe St
10th Ave
Romney St
F St
Jam
esIsland Expy
Heriot St
Vanderhorst St
Hanover St
Meeting S
treet Rd
Johnson St
Poplar St
Market St
Albemarle Rd
S Market St
Lee Ave
Sumter St
4th St
Nunan St
Fishburne St
Cypress St
Halsey Blvd
Cannon St
I
Spring St
12th Ave
Jenkins AveWalnut St
11th Ave
Calhoun St
Smith St
Perry St
Cleveland St
Deve
reau
x Ave
Sunnyside Ave
Sabin St
Cedar St
Washington S
tPrioleau St
Williman St
Morrison Dr
5th Ave
Mecha
nic S
t
Clifford St
Register Rd
State St
Poinsett St
Doughty St
King St
Saint Philip StSaint Andrews Blvd
King St
Line St
Savannah Hwy
Cannon St
Ashley Ave
MorrisonDr
Johnson St
Fishburne St
LegendPersons under 18 per square mile
< 270
270 - 610
611 - 1,190
1,191 - 2,980
> 2,980
Study Area
City Boundaries
Conservation
!( LCRT BRT Station Options
LCRT BRT Alignment Alternatives
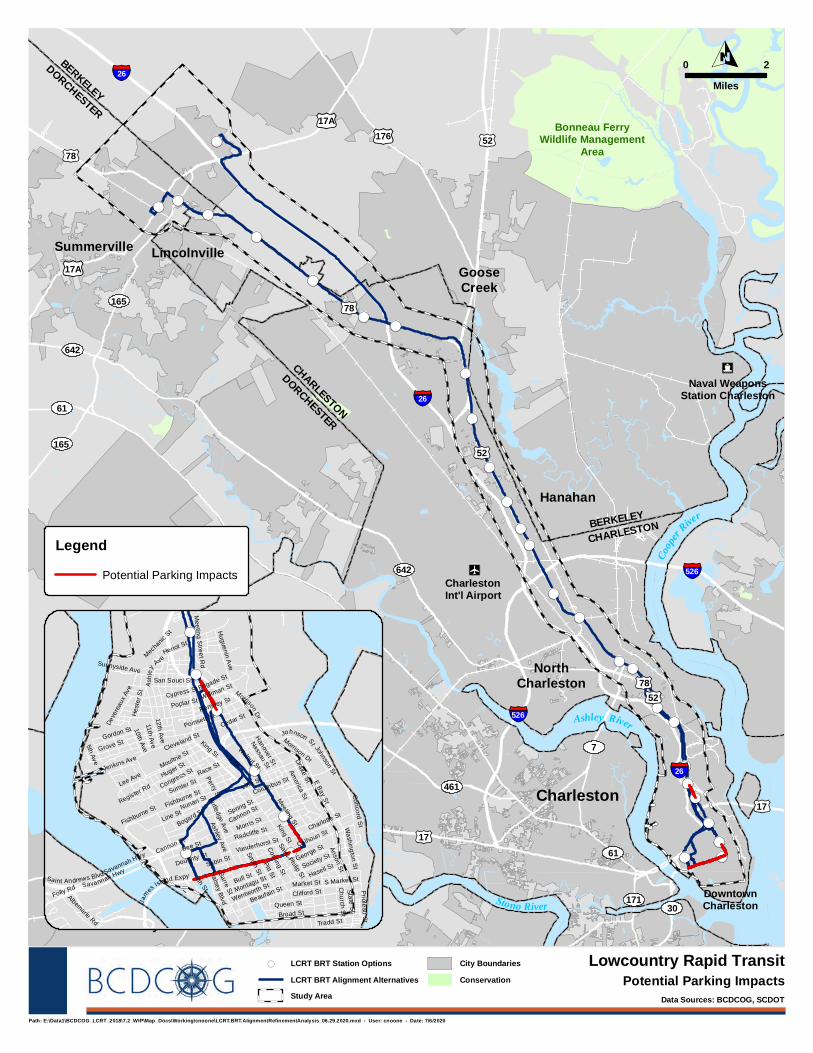
!(!(
!(
!(
!(
!(
!(
!(
!(
!(
!(!(
!(
!(
!(
!(!(
!(
!(
!(
!(
!(
!(
!(
!(
!(
!(
165
Summerville
Ravenel
Charleston
NorthCharleston
GooseCreek
Hanahan
CHARLESTON
DORCHESTER
BERKELEYCHARLESTON
Charleston Int'l Airport
DowntownCharleston
"Z
§̈¦
§̈¦
§̈¦26
26
526
£¤78
£¤17
£¤52
§̈¦526
Lincolnville
§̈¦26
£¤17
£¤17
£¤52
£¤78
£¤52
£¤78
642
165
61
642
7
61
461
61
30171
DORCHESTER
BERKELEY
Coope
r River
Ashley River
Stono River
IcNaval Weapons
Station Charleston
Bonneau FerryWildlife Management
Area
£¤17A
£¤17A
£¤176
Hollywood
Lowcountry Rapid Transit
0 2
Miles
O
Path: E:\Data1\BCDCOG_LCRT_2018\7.2_WIP\Map_Docs\Working\cnoone\LCRT.BRT.AlignmentRefinementAnalysis_06.29.2020.mxd - User: cnoone - Date: 7/6/2020
Data Sources: BCDCOG, SCDOT
Potential Parking Impacts
!(!(
!(
!(
!(
!(
!(
Rutledge Ave
E Bay St
Huger St
Meeting St
Grove St
Broad St
Coming St
Bull St
Bee St
Wentworth St
Queen St
Nassau St America St
Pitt St
Line St
Savannah Hwy
Gordon St
Beaufain St
Congress StMoultrie St
Drake St
Barre St
Columbus St
George St
Race St
Montagu St
Hest
er S
t
Huguenin Ave
Concord S
tCharlotte St
Anson St
Morris St
Folly Rd Church S
t
Bogard St
Tradd St
Ash
ley Ave
San Souci StBrigade St
Hasell StSociety St
Radcliffe St
10th Ave
Romney St
F St
Jam
esIsland Expy
Heriot St
Vanderhorst St
Hanover St
Meeting S
treet Rd
Johnson St
Poplar St
Market St
Albemarle Rd
S Market St
Lee Ave
Sumter St
4th St
Nunan St
Fishburne St
Cypress St
Halsey Blvd
Cannon St
I
Spring St
12th Ave
Jenkins AveWalnut St
11th Ave
Calhoun St
Smith St
Perry St
Cleveland St
Deve
reau
x Ave
Sunnyside Ave
Sabin St
Cedar St
Washington S
tPrioleau St
Williman St
Morrison Dr
5th Ave
Mecha
nic S
t
Clifford St
Register Rd
State St
Poinsett St
Doughty St
King St
Saint Philip StSaint Andrews Blvd
King St
Line St
Savannah Hwy
Cannon St
Ashley Ave
MorrisonDr
Johnson St
Fishburne St
Legend
Potential Parking Impacts
Study Area
City Boundaries
Conservation
!( LCRT BRT Station Options
LCRT BRT Alignment Alternatives
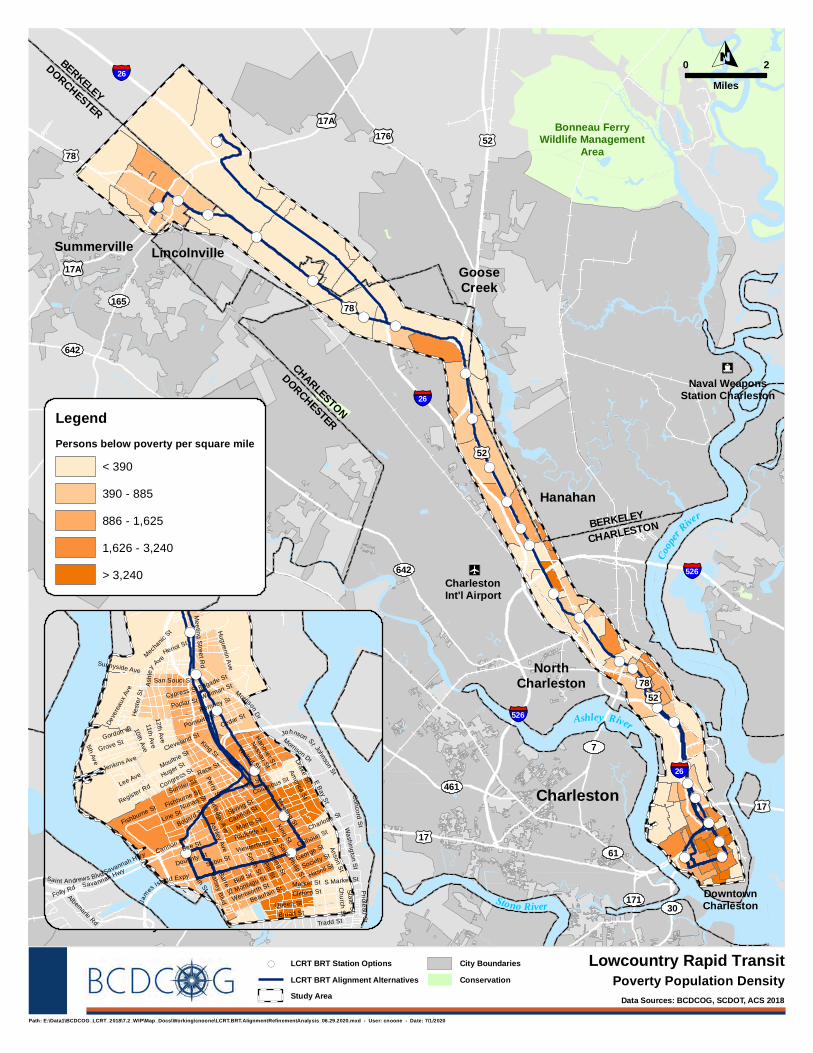
!(!(
!(
!(
!(
!(
!(
!(
!(
!(
!(!(
!(
!(
!(
!(!(
!(
!(
!(
!(
!(
!(
!(
!(
!(
!(
165
Summerville
Ravenel
Charleston
NorthCharleston
GooseCreek
Hanahan
CHARLESTON
DORCHESTER
BERKELEYCHARLESTON
Charleston Int'l Airport
DowntownCharleston
"Z
§̈¦
§̈¦
§̈¦26
26
526
£¤78
£¤17
£¤52
§̈¦526
Lincolnville
§̈¦26
£¤17
£¤17
£¤52
£¤78
£¤52
£¤78
642
165
61
642
7
61
461
61
30171
DORCHESTER
BERKELEY
Coope
r River
Ashley River
Stono River
IcNaval Weapons
Station Charleston
Bonneau FerryWildlife Management
Area
£¤17A
£¤17A
£¤176
Hollywood
Lowcountry Rapid Transit
0 2
Miles
O
Path: E:\Data1\BCDCOG_LCRT_2018\7.2_WIP\Map_Docs\Working\cnoone\LCRT.BRT.AlignmentRefinementAnalysis_06.29.2020.mxd - User: cnoone - Date: 7/1/2020
Data Sources: BCDCOG, SCDOT, ACS 2018
Poverty Population Density
!(!(
!(
!(
!(
!(
!(
Rutledge Ave
E Bay St
Huger St
Meeting St
Grove St
Broad St
Coming St
Bull St
Bee St
Wentworth St
Queen St
Nassau St America St
Pitt St
Line St
Savannah Hwy
Gordon St
Beaufain St
Congress StMoultrie St
Drake St
Barre St
Columbus St
George St
Race St
Montagu St
Hest
er S
t
Huguenin Ave
Concord S
tCharlotte St
Anson St
Morris St
Folly Rd Church S
t
Bogard St
Tradd St
Ash
ley Ave
San Souci StBrigade St
Hasell StSociety St
Radcliffe St
10th Ave
Romney St
F St
Jam
esIsland Expy
Heriot St
Vanderhorst St
Hanover St
Meeting S
treet Rd
Johnson St
Poplar St
Market St
Albemarle Rd
S Market St
Lee Ave
Sumter St
4th St
Nunan St
Fishburne St
Cypress St
Halsey Blvd
Cannon St
I
Spring St
12th Ave
Jenkins AveWalnut St
11th Ave
Calhoun St
Smith St
Perry St
Cleveland St
Deve
reau
x Ave
Sunnyside Ave
Sabin St
Cedar St
Washington S
tPrioleau St
Williman St
Morrison Dr
5th Ave
Mecha
nic S
t
Clifford St
Register Rd
State St
Poinsett St
Doughty St
King St
Saint Philip StSaint Andrews Blvd
King St
Line St
Savannah Hwy
Cannon St
Ashley Ave
MorrisonDr
Johnson St
Fishburne St
LegendPersons below poverty per square mile
< 390
390 - 885
886 - 1,625
1,626 - 3,240
> 3,240
Study Area
City Boundaries
Conservation
!( LCRT BRT Station Options
LCRT BRT Alignment Alternatives
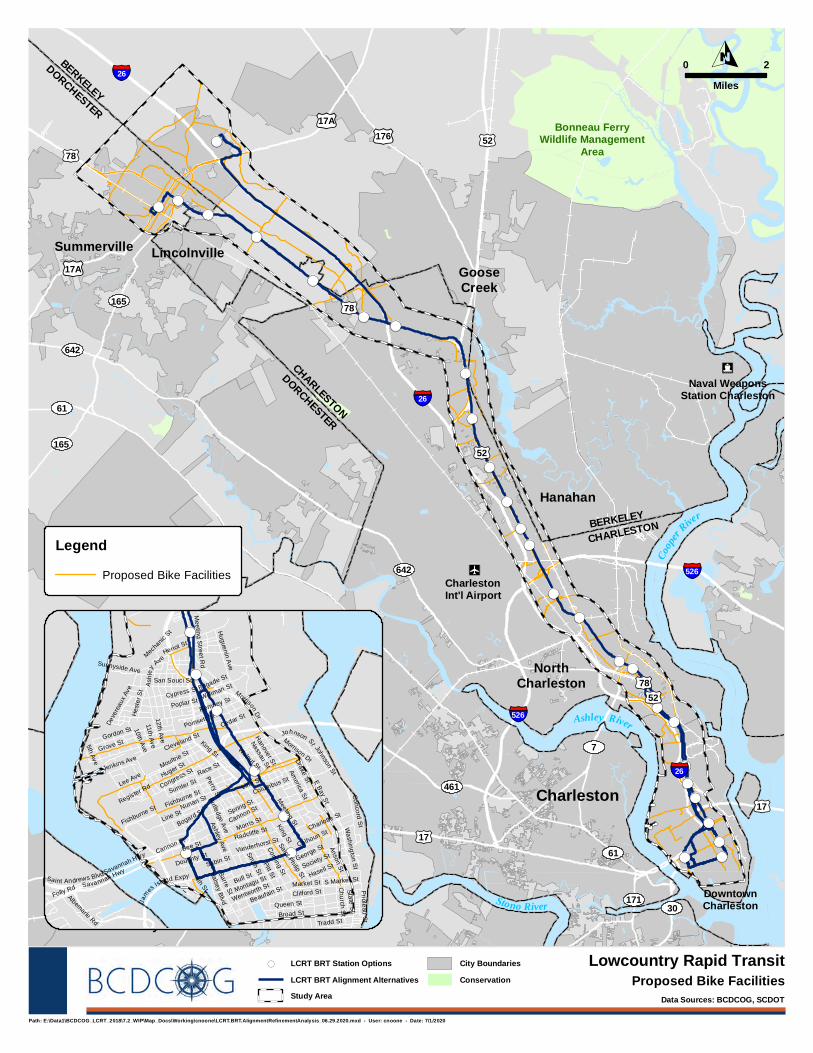
!(!(
!(
!(
!(
!(
!(
!(
!(
!(
!(!(
!(
!(
!(
!(!(
!(
!(
!(
!(
!(
!(
!(
!(
!(
!(
165
Summerville
Ravenel
Charleston
NorthCharleston
GooseCreek
Hanahan
CHARLESTON
DORCHESTER
BERKELEYCHARLESTON
Charleston Int'l Airport
DowntownCharleston
"Z
§̈¦
§̈¦
§̈¦26
26
526
£¤78
£¤17
£¤52
§̈¦526
Lincolnville
§̈¦26
£¤17
£¤17
£¤52
£¤78
£¤52
£¤78
642
165
61
642
7
61
461
61
30171
DORCHESTER
BERKELEY
Coope
r River
Ashley River
Stono River
IcNaval Weapons
Station Charleston
Bonneau FerryWildlife Management
Area
£¤17A
£¤17A
£¤176
Hollywood
Lowcountry Rapid Transit
0 2
Miles
O
Path: E:\Data1\BCDCOG_LCRT_2018\7.2_WIP\Map_Docs\Working\cnoone\LCRT.BRT.AlignmentRefinementAnalysis_06.29.2020.mxd - User: cnoone - Date: 7/1/2020
Data Sources: BCDCOG, SCDOT
Proposed Bike Facilities
!(!(
!(
!(
!(
!(
!(
Rutledge Ave
E Bay St
Huger St
Meeting St
Grove St
Broad St
Coming St
Bull St
Bee St
Wentworth St
Queen St
Nassau St America St
Pitt St
Line St
Savannah Hwy
Gordon St
Beaufain St
Congress StMoultrie St
Drake St
Barre St
Columbus St
George St
Race St
Montagu St
Hest
er S
t
Huguenin Ave
Concord S
tCharlotte St
Anson St
Morris St
Folly Rd Church S
t
Bogard St
Tradd St
Ash
ley Ave
San Souci StBrigade St
Hasell StSociety St
Radcliffe St
10th Ave
Romney St
F St
Jam
esIsland Expy
Heriot St
Vanderhorst St
Hanover St
Meeting S
treet Rd
Johnson St
Poplar St
Market St
Albemarle Rd
S Market St
Lee Ave
Sumter St
4th St
Nunan St
Fishburne St
Cypress St
Halsey Blvd
Cannon St
I
Spring St
12th Ave
Jenkins AveWalnut St
11th Ave
Calhoun St
Smith St
Perry St
Cleveland St
Deve
reau
x Ave
Sunnyside Ave
Sabin St
Cedar St
Washington S
tPrioleau St
Williman St
Morrison Dr
5th Ave
Mecha
nic S
t
Clifford St
Register Rd
State St
Poinsett St
Doughty St
King St
Saint Philip StSaint Andrews Blvd
King St
Line St
Savannah Hwy
Cannon St
Ashley Ave
MorrisonDr
Johnson St
Fishburne St
Legend
Proposed Bike Facilities
Study Area
City Boundaries
Conservation
!( LCRT BRT Station Options
LCRT BRT Alignment Alternatives
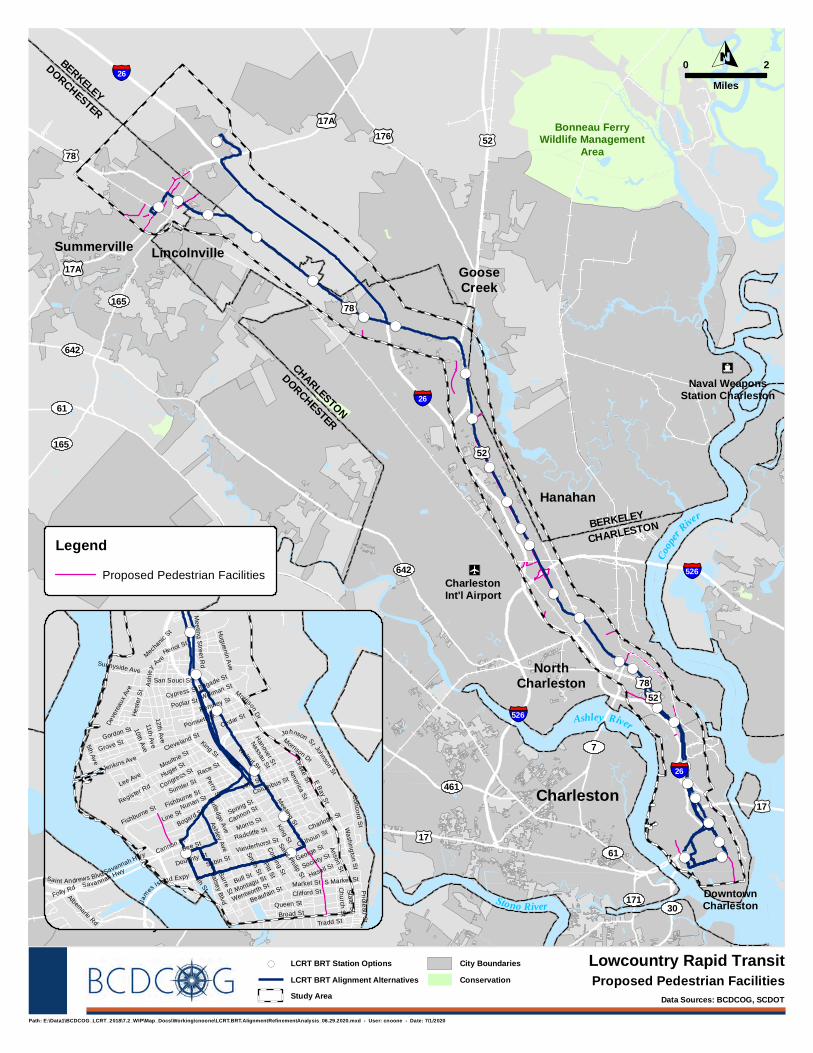
!(!(
!(
!(
!(
!(
!(
!(
!(
!(
!(!(
!(
!(
!(
!(!(
!(
!(
!(
!(
!(
!(
!(
!(
!(
!(
165
Summerville
Ravenel
Charleston
NorthCharleston
GooseCreek
Hanahan
CHARLESTON
DORCHESTER
BERKELEYCHARLESTON
Charleston Int'l Airport
DowntownCharleston
"Z
§̈¦
§̈¦
§̈¦26
26
526
£¤78
£¤17
£¤52
§̈¦526
Lincolnville
§̈¦26
£¤17
£¤17
£¤52
£¤78
£¤52
£¤78
642
165
61
642
7
61
461
61
30171
DORCHESTER
BERKELEY
Coope
r River
Ashley River
Stono River
IcNaval Weapons
Station Charleston
Bonneau FerryWildlife Management
Area
£¤17A
£¤17A
£¤176
Hollywood
Lowcountry Rapid Transit
0 2
Miles
O
Path: E:\Data1\BCDCOG_LCRT_2018\7.2_WIP\Map_Docs\Working\cnoone\LCRT.BRT.AlignmentRefinementAnalysis_06.29.2020.mxd - User: cnoone - Date: 7/1/2020
Data Sources: BCDCOG, SCDOT
Proposed Pedestrian Facilities
!(!(
!(
!(
!(
!(
!(
Rutledge Ave
E Bay St
Huger St
Meeting St
Grove St
Broad St
Coming St
Bull St
Bee St
Wentworth St
Queen St
Nassau St America St
Pitt St
Line St
Savannah Hwy
Gordon St
Beaufain St
Congress StMoultrie St
Drake St
Barre St
Columbus St
George St
Race St
Montagu St
Hest
er S
t
Huguenin Ave
Concord S
tCharlotte St
Anson St
Morris St
Folly Rd Church S
t
Bogard St
Tradd St
Ash
ley Ave
San Souci StBrigade St
Hasell StSociety St
Radcliffe St
10th Ave
Romney St
F St
Jam
esIsland Expy
Heriot St
Vanderhorst St
Hanover St
Meeting S
treet Rd
Johnson St
Poplar St
Market St
Albemarle Rd
S Market St
Lee Ave
Sumter St
4th St
Nunan St
Fishburne St
Cypress St
Halsey Blvd
Cannon St
I
Spring St
12th Ave
Jenkins AveWalnut St
11th Ave
Calhoun St
Smith St
Perry St
Cleveland St
Deve
reau
x Ave
Sunnyside Ave
Sabin St
Cedar St
Washington S
tPrioleau St
Williman St
Morrison Dr
5th Ave
Mecha
nic S
t
Clifford St
Register Rd
State St
Poinsett St
Doughty St
King St
Saint Philip StSaint Andrews Blvd
King St
Line St
Savannah Hwy
Cannon St
Ashley Ave
MorrisonDr
Johnson St
Fishburne St
Legend
Proposed Pedestrian Facilities
Study Area
City Boundaries
Conservation
!( LCRT BRT Station Options
LCRT BRT Alignment Alternatives
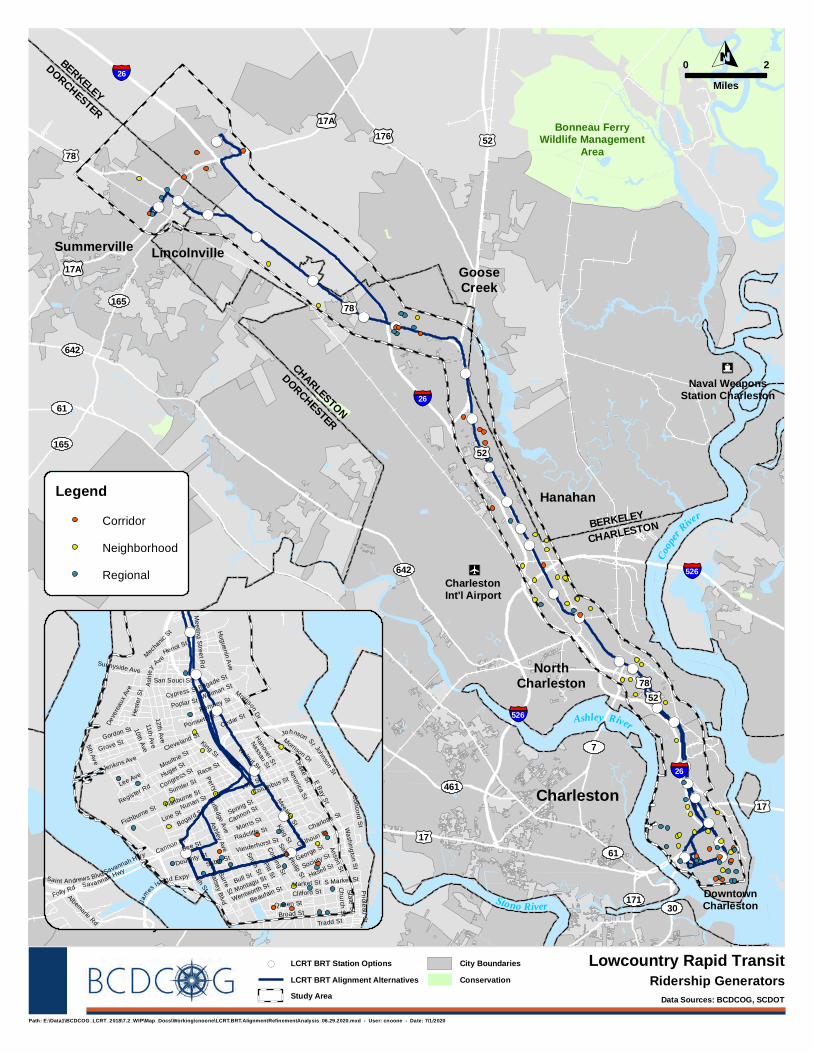
!(!(
!(
!(
!(
!(
!(
!(
!(
!(
!(!(
!(
!(
!(
!(!(
!(
!(
!(
!(
!(
!(
!(
!(
!(
!(
165
Summerville
Ravenel
Charleston
NorthCharleston
GooseCreek
Hanahan
CHARLESTON
DORCHESTER
BERKELEYCHARLESTON
Charleston Int'l Airport
DowntownCharleston
"Z
§̈¦
§̈¦
§̈¦26
26
526
£¤78
£¤17
£¤52
§̈¦526
Lincolnville
§̈¦26
£¤17
£¤17
£¤52
£¤78
£¤52
£¤78
642
165
61
642
7
61
461
61
30171
DORCHESTER
BERKELEY
Coope
r River
Ashley River
Stono River
IcNaval Weapons
Station Charleston
Bonneau FerryWildlife Management
Area
£¤17A
£¤17A
£¤176
Hollywood
Lowcountry Rapid Transit
0 2
Miles
O
Path: E:\Data1\BCDCOG_LCRT_2018\7.2_WIP\Map_Docs\Working\cnoone\LCRT.BRT.AlignmentRefinementAnalysis_06.29.2020.mxd - User: cnoone - Date: 7/1/2020
Data Sources: BCDCOG, SCDOT
Ridership Generators
!(!(
!(
!(
!(
!(
!(
Rutledge Ave
E Bay St
Huger St
Meeting St
Grove St
Broad St
Coming St
Bull St
Bee St
Wentworth St
Queen St
Nassau St America St
Pitt St
Line St
Savannah Hwy
Gordon St
Beaufain St
Congress StMoultrie St
Drake St
Barre St
Columbus St
George St
Race St
Montagu St
Hest
er S
t
Huguenin Ave
Concord S
tCharlotte St
Anson St
Morris St
Folly Rd Church S
t
Bogard St
Tradd St
Ash
ley Ave
San Souci StBrigade St
Hasell StSociety St
Radcliffe St
10th Ave
Romney St
F St
Jam
esIsland Expy
Heriot St
Vanderhorst St
Hanover St
Meeting S
treet Rd
Johnson St
Poplar St
Market St
Albemarle Rd
S Market St
Lee Ave
Sumter St
4th St
Nunan St
Fishburne St
Cypress St
Halsey Blvd
Cannon St
I
Spring St
12th Ave
Jenkins AveWalnut St
11th Ave
Calhoun St
Smith St
Perry St
Cleveland St
Deve
reau
x Ave
Sunnyside Ave
Sabin St
Cedar St
Washington S
tPrioleau St
Williman St
Morrison Dr
5th Ave
Mecha
nic S
t
Clifford St
Register Rd
State St
Poinsett St
Doughty St
King St
Saint Philip StSaint Andrews Blvd
King St
Line St
Savannah Hwy
Cannon St
Ashley Ave
MorrisonDr
Johnson St
Fishburne St
Legend
Corridor
Neighborhood
Regional
Study Area
City Boundaries
Conservation
!( LCRT BRT Station Options
LCRT BRT Alignment Alternatives
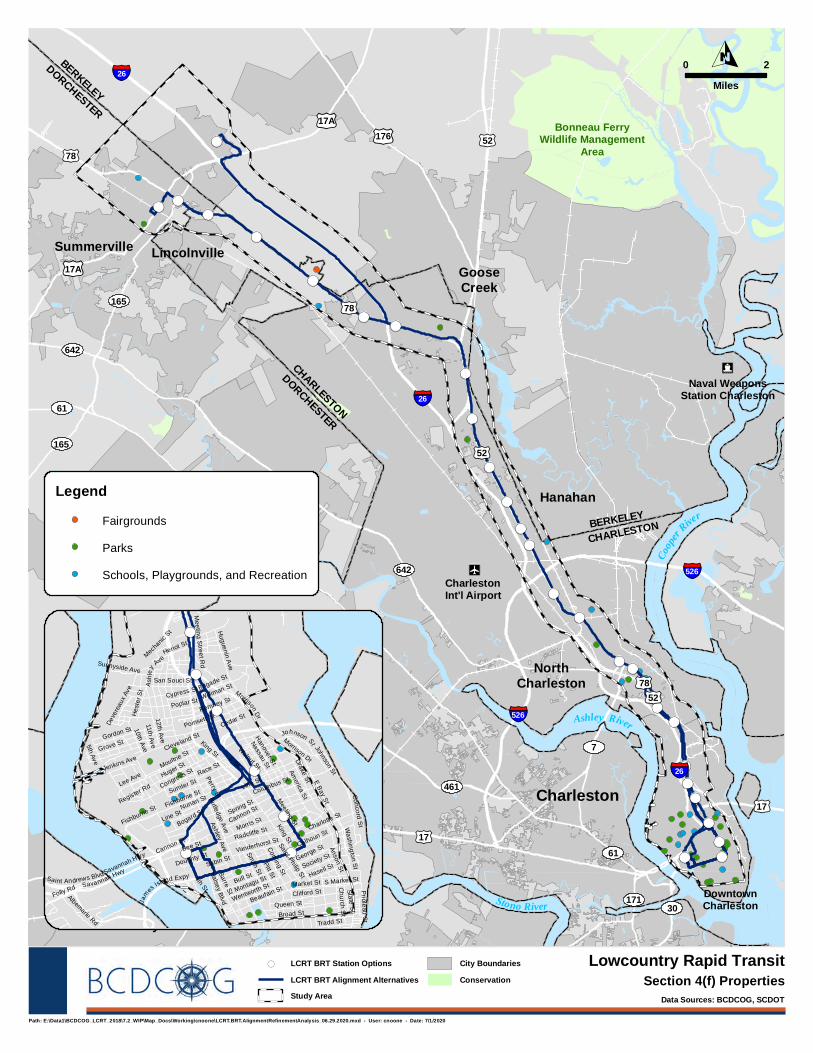
!(!(
!(
!(
!(
!(
!(
!(
!(
!(
!(!(
!(
!(
!(
!(!(
!(
!(
!(
!(
!(
!(
!(
!(
!(
!(
165
Summerville
Ravenel
Charleston
NorthCharleston
GooseCreek
Hanahan
CHARLESTON
DORCHESTER
BERKELEYCHARLESTON
Charleston Int'l Airport
DowntownCharleston
"Z
§̈¦
§̈¦
§̈¦26
26
526
£¤78
£¤17
£¤52
§̈¦526
Lincolnville
§̈¦26
£¤17
£¤17
£¤52
£¤78
£¤52
£¤78
642
165
61
642
7
61
461
61
30171
DORCHESTER
BERKELEY
Coope
r River
Ashley River
Stono River
IcNaval Weapons
Station Charleston
Bonneau FerryWildlife Management
Area
£¤17A
£¤17A
£¤176
Hollywood
Lowcountry Rapid Transit
0 2
Miles
O
Path: E:\Data1\BCDCOG_LCRT_2018\7.2_WIP\Map_Docs\Working\cnoone\LCRT.BRT.AlignmentRefinementAnalysis_06.29.2020.mxd - User: cnoone - Date: 7/1/2020
Data Sources: BCDCOG, SCDOT
Section 4(f) Properties
!(!(
!(
!(
!(
!(
!(
Rutledge Ave
E Bay St
Huger St
Meeting St
Grove St
Broad St
Coming St
Bull St
Bee St
Wentworth St
Queen St
Nassau St America St
Pitt St
Line St
Savannah Hwy
Gordon St
Beaufain St
Congress StMoultrie St
Drake St
Barre St
Columbus St
George St
Race St
Montagu St
Hest
er S
t
Huguenin Ave
Concord S
tCharlotte St
Anson St
Morris St
Folly Rd Church S
t
Bogard St
Tradd St
Ash
ley Ave
San Souci StBrigade St
Hasell StSociety St
Radcliffe St
10th Ave
Romney St
F St
Jam
esIsland Expy
Heriot St
Vanderhorst St
Hanover St
Meeting S
treet Rd
Johnson St
Poplar St
Market St
Albemarle Rd
S Market St
Lee Ave
Sumter St
4th St
Nunan St
Fishburne St
Cypress St
Halsey Blvd
Cannon St
I
Spring St
12th Ave
Jenkins AveWalnut St
11th Ave
Calhoun St
Smith St
Perry St
Cleveland St
Deve
reau
x Ave
Sunnyside Ave
Sabin St
Cedar St
Washington S
tPrioleau St
Williman St
Morrison Dr
5th Ave
Mecha
nic S
t
Clifford St
Register Rd
State St
Poinsett St
Doughty St
King St
Saint Philip StSaint Andrews Blvd
King St
Line St
Savannah Hwy
Cannon St
Ashley Ave
MorrisonDr
Johnson St
Fishburne St
Legend
Fairgrounds
Parks
Schools, Playgrounds, and Recreation
Study Area
City Boundaries
Conservation
!( LCRT BRT Station Options
LCRT BRT Alignment Alternatives
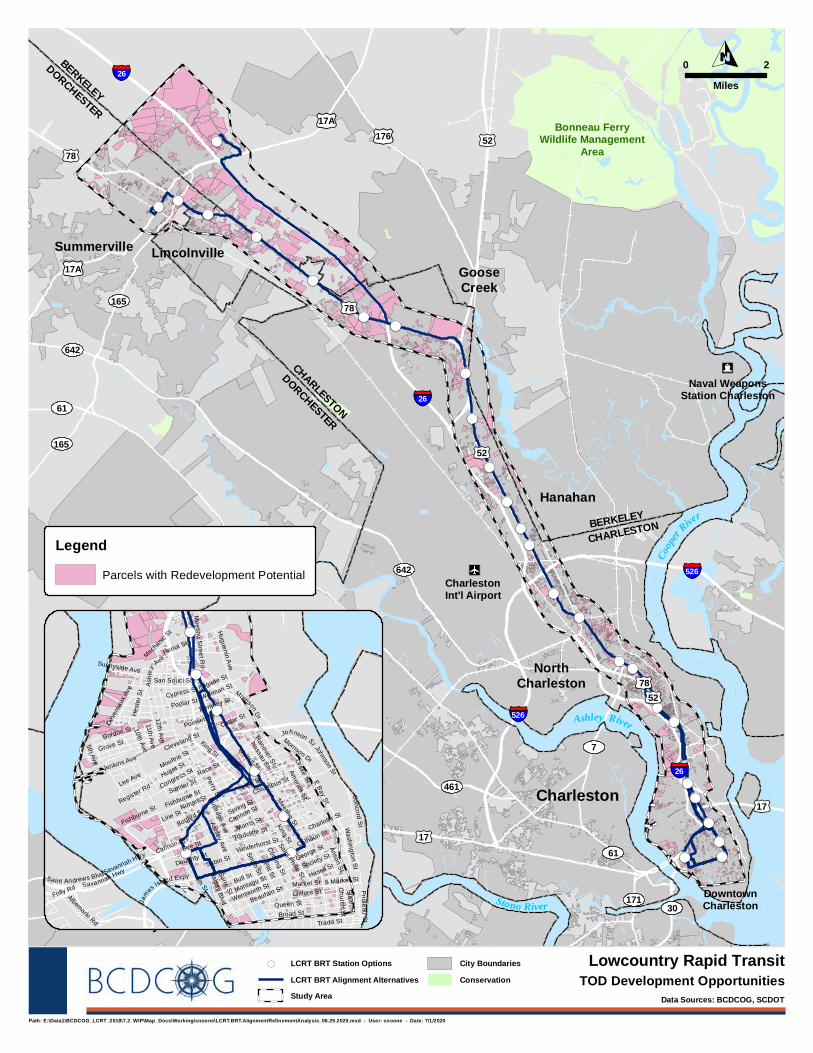
!(!(
!(
!(
!(
!(
!(
!(
!(
!(
!(!(
!(
!(
!(
!(!(
!(
!(
!(
!(
!(
!(
!(
!(
!(
!(
165
Summerville
Ravenel
Charleston
NorthCharleston
GooseCreek
Hanahan
CHARLESTON
DORCHESTER
BERKELEYCHARLESTON
Charleston Int'l Airport
DowntownCharleston
"Z
§̈¦
§̈¦
§̈¦26
26
526
£¤78
£¤17
£¤52
§̈¦526
Lincolnville
§̈¦26
£¤17
£¤17
£¤52
£¤78
£¤52
£¤78
642
165
61
642
7
61
461
61
30171
DORCHESTER
BERKELEY
Coope
r River
Ashley River
Stono River
IcNaval Weapons
Station Charleston
Bonneau FerryWildlife Management
Area
£¤17A
£¤17A
£¤176
Hollywood
Lowcountry Rapid Transit
0 2
Miles
O
Path: E:\Data1\BCDCOG_LCRT_2018\7.2_WIP\Map_Docs\Working\cnoone\LCRT.BRT.AlignmentRefinementAnalysis_06.29.2020.mxd - User: cnoone - Date: 7/1/2020
Data Sources: BCDCOG, SCDOT
TOD Development Opportunities
!(!(
!(
!(
!(
!(
!(
Rutledge Ave
E Bay St
Huger St
Meeting St
Grove St
Broad St
Coming St
Bull St
Bee St
Wentworth St
Queen St
Nassau St America St
Pitt St
Line St
Savannah Hwy
Gordon St
Beaufain St
Congress StMoultrie St
Drake St
Barre St
Columbus St
George St
Race St
Montagu St
Hest
er S
t
Huguenin Ave
Concord S
tCharlotte St
Anson St
Morris St
Folly Rd Church S
t
Bogard St
Tradd St
Ash
ley Ave
San Souci StBrigade St
Hasell StSociety St
Radcliffe St
10th Ave
Romney St
F St
Jam
esIsland Expy
Heriot St
Vanderhorst St
Hanover St
Meeting S
treet Rd
Johnson St
Poplar St
Market St
Albemarle Rd
S Market St
Lee Ave
Sumter St
4th St
Nunan St
Fishburne St
Cypress St
Halsey Blvd
Cannon St
I
Spring St
12th Ave
Jenkins AveWalnut St
11th Ave
Calhoun St
Smith St
Perry St
Cleveland St
Deve
reau
x Ave
Sunnyside Ave
Sabin St
Cedar St
Washington S
tPrioleau St
Williman St
Morrison Dr
5th Ave
Mecha
nic S
t
Clifford St
Register Rd
State St
Poinsett St
Doughty St
King St
Saint Philip StSaint Andrews Blvd
King St
Line St
Savannah Hwy
Cannon St
Ashley Ave
MorrisonDr
Johnson St
Fishburne St
Legend
Parcels with Redevelopment Potential
Study Area
City Boundaries
Conservation
!( LCRT BRT Station Options
LCRT BRT Alignment Alternatives
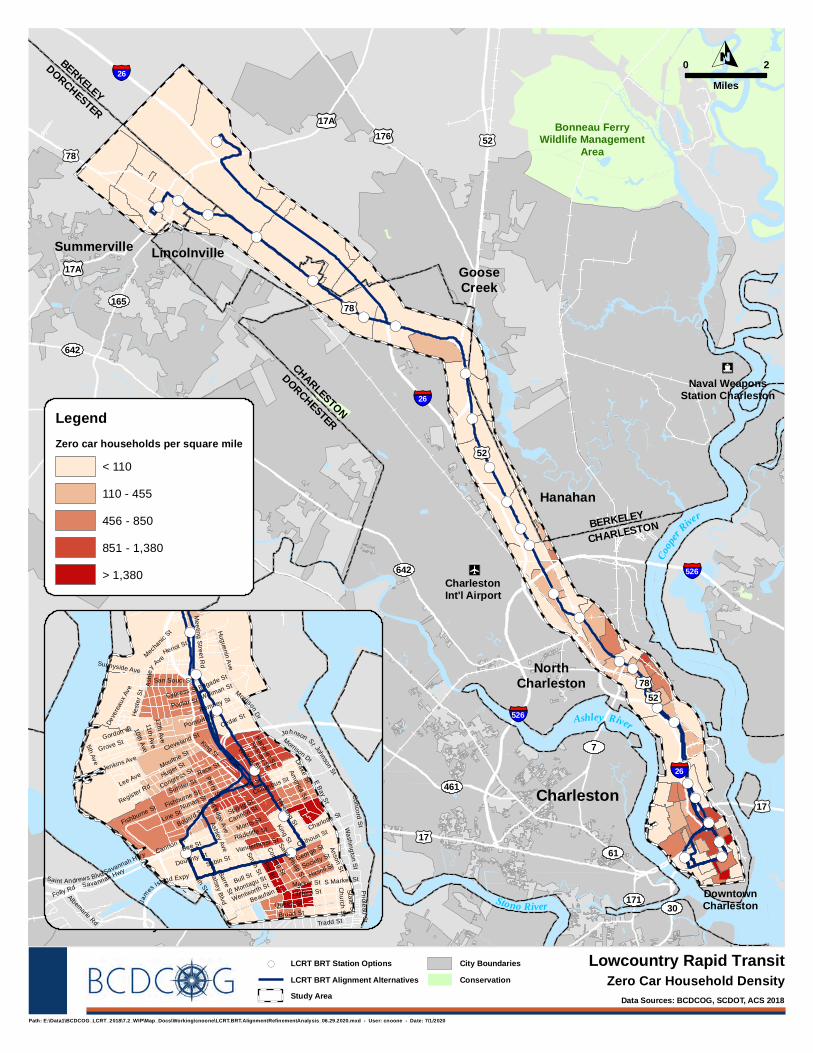
!(!(
!(
!(
!(
!(
!(
!(
!(
!(
!(!(
!(
!(
!(
!(!(
!(
!(
!(
!(
!(
!(
!(
!(
!(
!(
165
Summerville
Ravenel
Charleston
NorthCharleston
GooseCreek
Hanahan
CHARLESTON
DORCHESTER
BERKELEYCHARLESTON
Charleston Int'l Airport
DowntownCharleston
"Z
§̈¦
§̈¦
§̈¦26
26
526
£¤78
£¤17
£¤52
§̈¦526
Lincolnville
§̈¦26
£¤17
£¤17
£¤52
£¤78
£¤52
£¤78
642
165
61
642
7
61
461
61
30171
DORCHESTER
BERKELEY
Coope
r River
Ashley River
Stono River
IcNaval Weapons
Station Charleston
Bonneau FerryWildlife Management
Area
£¤17A
£¤17A
£¤176
Hollywood
Lowcountry Rapid Transit
0 2
Miles
O
Path: E:\Data1\BCDCOG_LCRT_2018\7.2_WIP\Map_Docs\Working\cnoone\LCRT.BRT.AlignmentRefinementAnalysis_06.29.2020.mxd - User: cnoone - Date: 7/1/2020
Data Sources: BCDCOG, SCDOT, ACS 2018
Zero Car Household Density
!(!(
!(
!(
!(
!(
!(
Rutledge Ave
E Bay St
Huger St
Meeting St
Grove St
Broad St
Coming St
Bull St
Bee St
Wentworth St
Queen St
Nassau St America St
Pitt St
Line St
Savannah Hwy
Gordon St
Beaufain St
Congress StMoultrie St
Drake St
Barre St
Columbus St
George St
Race St
Montagu St
Hest
er S
t
Huguenin Ave
Concord S
tCharlotte St
Anson St
Morris St
Folly Rd Church S
t
Bogard St
Tradd St
Ash
ley Ave
San Souci StBrigade St
Hasell StSociety St
Radcliffe St
10th Ave
Romney St
F St
Jam
esIsland Expy
Heriot St
Vanderhorst St
Hanover St
Meeting S
treet Rd
Johnson St
Poplar St
Market St
Albemarle Rd
S Market St
Lee Ave
Sumter St
4th St
Nunan St
Fishburne St
Cypress St
Halsey Blvd
Cannon St
I
Spring St
12th Ave
Jenkins AveWalnut St
11th Ave
Calhoun St
Smith St
Perry St
Cleveland St
Deve
reau
x Ave
Sunnyside Ave
Sabin St
Cedar St
Washington S
tPrioleau St
Williman St
Morrison Dr
5th Ave
Mecha
nic S
t
Clifford St
Register Rd
State St
Poinsett St
Doughty St
King St
Saint Philip StSaint Andrews Blvd
King St
Line St
Savannah Hwy
Cannon St
Ashley Ave
MorrisonDr
Johnson St
Fishburne St
LegendZero car households per square mile
< 110
110 - 455
456 - 850
851 - 1,380
> 1,380
Study Area
City Boundaries
Conservation
!( LCRT BRT Station Options
LCRT BRT Alignment Alternatives
5790 Casper Padgett Way, North Charleston, SC 29406
Tel: 843.529.0400 Fax: 843.529.0305.
Appendix H: Calhoun Street & US 17/Septima P Clark Parkway Concept Preliminary AnalysisLowcountry Rapid Transit
Berkeley-Charleston-Dorchester Council of Governments
August 10, 2020
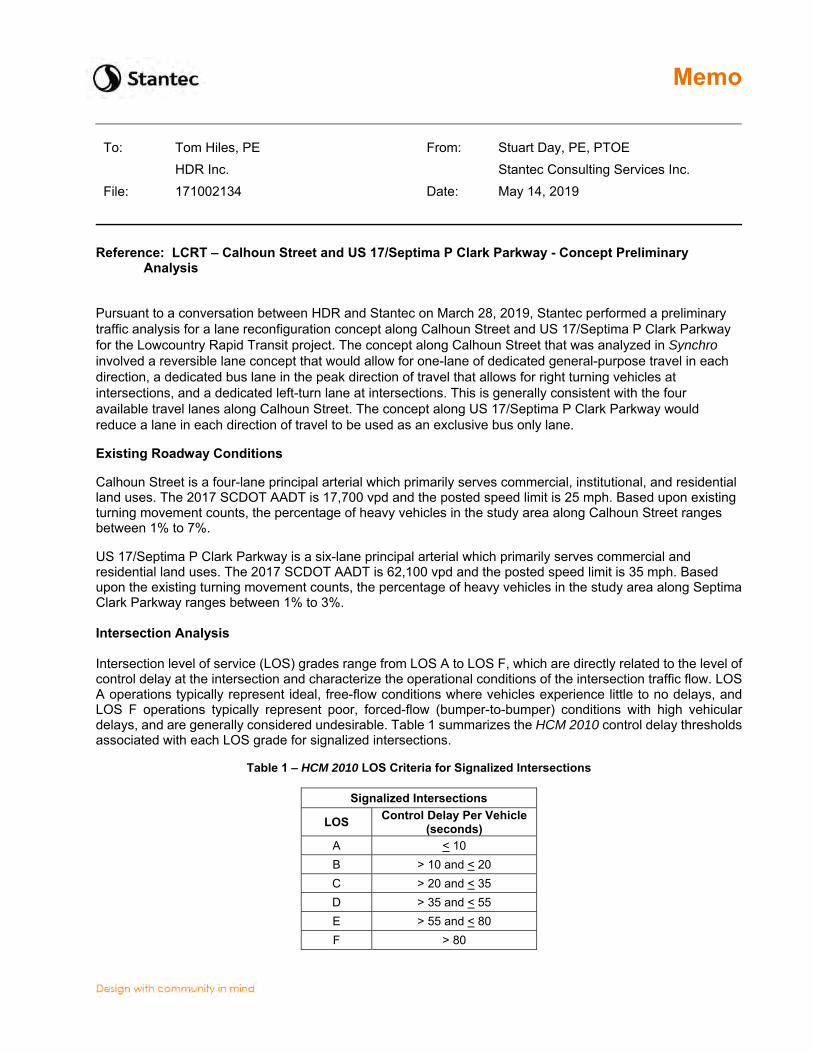
Memo
To: Tom Hiles, PE From: Stuart Day, PE, PTOE HDR Inc. Stantec Consulting Services Inc. File: 171002134 Date: May 14, 2019
Reference: LCRT – Calhoun Street and US 17/Septima P Clark Parkway - Concept Preliminary Analysis
Pursuant to a conversation between HDR and Stantec on March 28, 2019, Stantec performed a preliminary traffic analysis for a lane reconfiguration concept along Calhoun Street and US 17/Septima P Clark Parkway for the Lowcountry Rapid Transit project. The concept along Calhoun Street that was analyzed in Synchro involved a reversible lane concept that would allow for one-lane of dedicated general-purpose travel in each direction, a dedicated bus lane in the peak direction of travel that allows for right turning vehicles at intersections, and a dedicated left-turn lane at intersections. This is generally consistent with the four available travel lanes along Calhoun Street. The concept along US 17/Septima P Clark Parkway would reduce a lane in each direction of travel to be used as an exclusive bus only lane.
Existing Roadway Conditions
Calhoun Street is a four-lane principal arterial which primarily serves commercial, institutional, and residential land uses. The 2017 SCDOT AADT is 17,700 vpd and the posted speed limit is 25 mph. Based upon existing turning movement counts, the percentage of heavy vehicles in the study area along Calhoun Street ranges between 1% to 7%.
US 17/Septima P Clark Parkway is a six-lane principal arterial which primarily serves commercial and residential land uses. The 2017 SCDOT AADT is 62,100 vpd and the posted speed limit is 35 mph. Based upon the existing turning movement counts, the percentage of heavy vehicles in the study area along Septima Clark Parkway ranges between 1% to 3%. Intersection Analysis Intersection level of service (LOS) grades range from LOS A to LOS F, which are directly related to the level of control delay at the intersection and characterize the operational conditions of the intersection traffic flow. LOS A operations typically represent ideal, free-flow conditions where vehicles experience little to no delays, and LOS F operations typically represent poor, forced-flow (bumper-to-bumper) conditions with high vehicular delays, and are generally considered undesirable. Table 1 summarizes the HCM 2010 control delay thresholds associated with each LOS grade for signalized intersections.
Table 1 – HCM 2010 LOS Criteria for Signalized Intersections
Signalized Intersections
LOS Control Delay Per Vehicle (seconds)
A < 10 B > 10 and < 20 C > 20 and < 35 D > 35 and < 55 E > 55 and < 80 F > 80
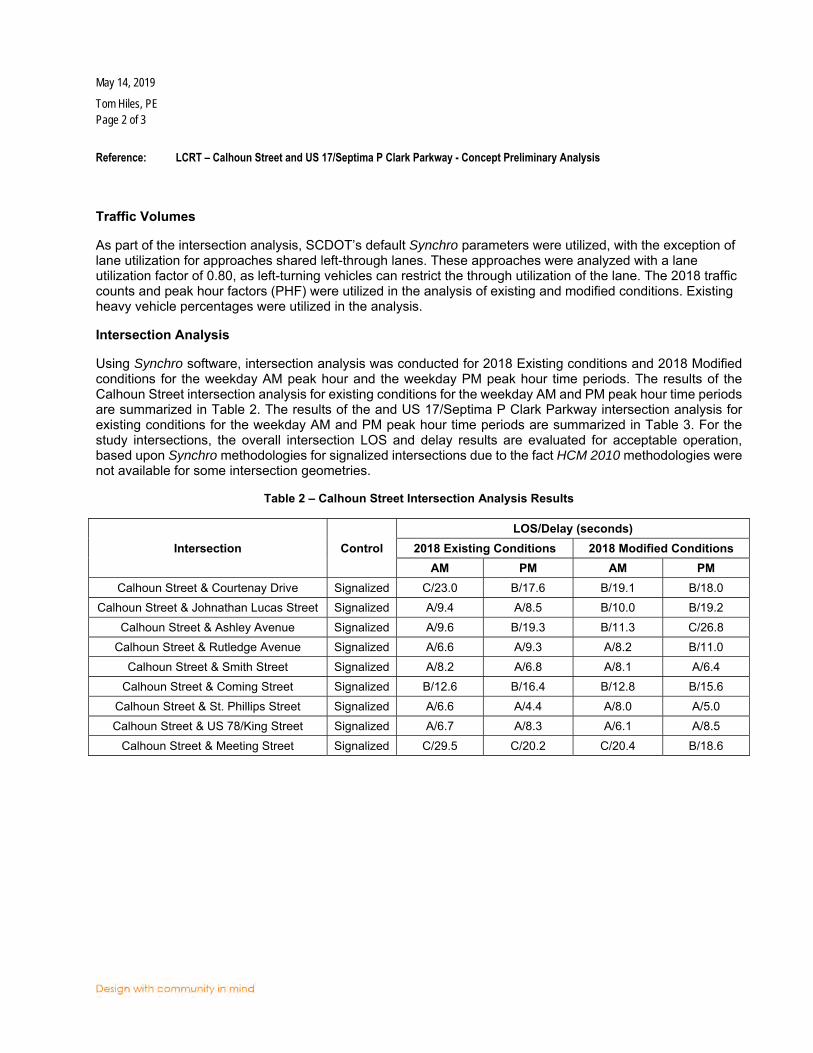
May 14, 2019
Tom Hiles, PE Page 2 of 3
Reference: LCRT – Calhoun Street and US 17/Septima P Clark Parkway - Concept Preliminary Analysis
Traffic Volumes
As part of the intersection analysis, SCDOT’s default Synchro parameters were utilized, with the exception of lane utilization for approaches shared left-through lanes. These approaches were analyzed with a lane utilization factor of 0.80, as left-turning vehicles can restrict the through utilization of the lane. The 2018 traffic counts and peak hour factors (PHF) were utilized in the analysis of existing and modified conditions. Existing heavy vehicle percentages were utilized in the analysis.
Intersection Analysis
Using Synchro software, intersection analysis was conducted for 2018 Existing conditions and 2018 Modified conditions for the weekday AM peak hour and the weekday PM peak hour time periods. The results of the Calhoun Street intersection analysis for existing conditions for the weekday AM and PM peak hour time periods are summarized in Table 2. The results of the and US 17/Septima P Clark Parkway intersection analysis for existing conditions for the weekday AM and PM peak hour time periods are summarized in Table 3. For the study intersections, the overall intersection LOS and delay results are evaluated for acceptable operation, based upon Synchro methodologies for signalized intersections due to the fact HCM 2010 methodologies were not available for some intersection geometries.
Table 2 – Calhoun Street Intersection Analysis Results
Intersection Control LOS/Delay (seconds)
2018 Existing Conditions 2018 Modified Conditions AM PM AM PM
Calhoun Street & Courtenay Drive Signalized C/23.0 B/17.6 B/19.1 B/18.0 Calhoun Street & Johnathan Lucas Street Signalized A/9.4 A/8.5 B/10.0 B/19.2
Calhoun Street & Ashley Avenue Signalized A/9.6 B/19.3 B/11.3 C/26.8 Calhoun Street & Rutledge Avenue Signalized A/6.6 A/9.3 A/8.2 B/11.0
Calhoun Street & Smith Street Signalized A/8.2 A/6.8 A/8.1 A/6.4 Calhoun Street & Coming Street Signalized B/12.6 B/16.4 B/12.8 B/15.6
Calhoun Street & St. Phillips Street Signalized A/6.6 A/4.4 A/8.0 A/5.0 Calhoun Street & US 78/King Street Signalized A/6.7 A/8.3 A/6.1 A/8.5
Calhoun Street & Meeting Street Signalized C/29.5 C/20.2 C/20.4 B/18.6
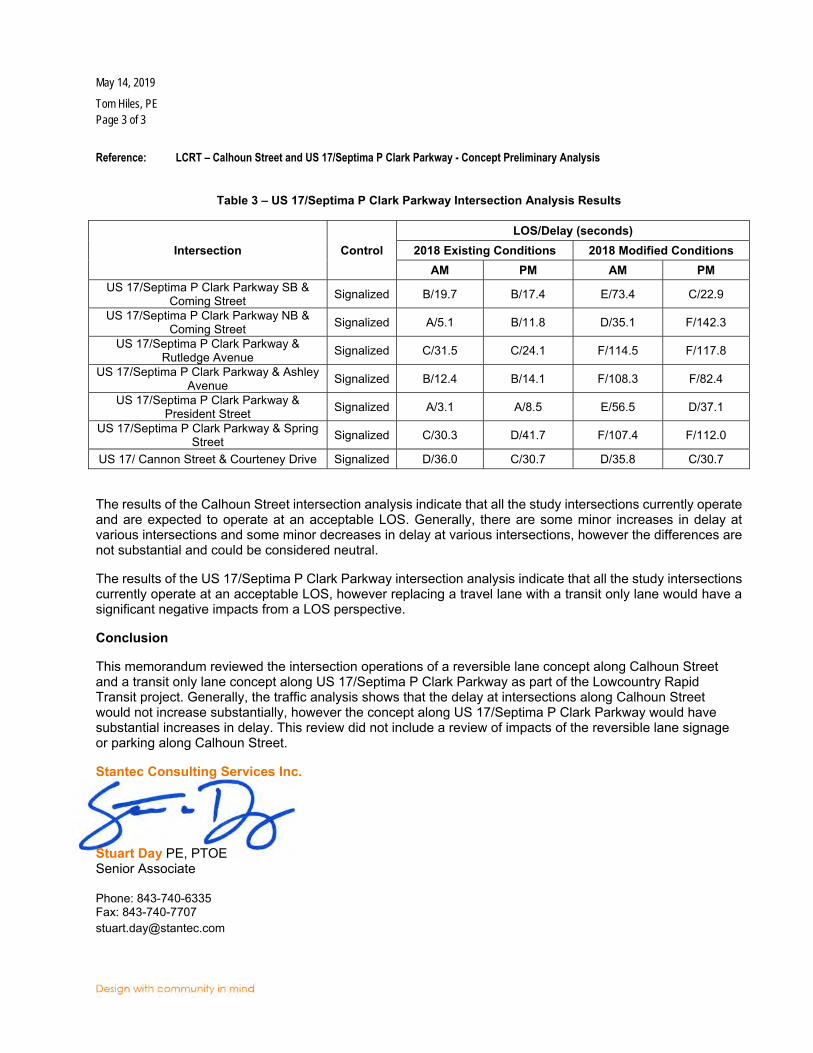
May 14, 2019
Tom Hiles, PE Page 3 of 3
Reference: LCRT – Calhoun Street and US 17/Septima P Clark Parkway - Concept Preliminary Analysis
Table 3 – US 17/Septima P Clark Parkway Intersection Analysis Results
Intersection Control LOS/Delay (seconds)
2018 Existing Conditions 2018 Modified Conditions AM PM AM PM
US 17/Septima P Clark Parkway SB & Coming Street Signalized B/19.7 B/17.4 E/73.4 C/22.9
US 17/Septima P Clark Parkway NB & Coming Street Signalized A/5.1 B/11.8 D/35.1 F/142.3
US 17/Septima P Clark Parkway & Rutledge Avenue Signalized C/31.5 C/24.1 F/114.5 F/117.8
US 17/Septima P Clark Parkway & Ashley Avenue Signalized B/12.4 B/14.1 F/108.3 F/82.4
US 17/Septima P Clark Parkway & President Street Signalized A/3.1 A/8.5 E/56.5 D/37.1
US 17/Septima P Clark Parkway & Spring Street Signalized C/30.3 D/41.7 F/107.4 F/112.0
US 17/ Cannon Street & Courteney Drive Signalized D/36.0 C/30.7 D/35.8 C/30.7
The results of the Calhoun Street intersection analysis indicate that all the study intersections currently operate and are expected to operate at an acceptable LOS. Generally, there are some minor increases in delay at various intersections and some minor decreases in delay at various intersections, however the differences are not substantial and could be considered neutral.
The results of the US 17/Septima P Clark Parkway intersection analysis indicate that all the study intersections currently operate at an acceptable LOS, however replacing a travel lane with a transit only lane would have a significant negative impacts from a LOS perspective.
Conclusion
This memorandum reviewed the intersection operations of a reversible lane concept along Calhoun Street and a transit only lane concept along US 17/Septima P Clark Parkway as part of the Lowcountry Rapid Transit project. Generally, the traffic analysis shows that the delay at intersections along Calhoun Street would not increase substantially, however the concept along US 17/Septima P Clark Parkway would have substantial increases in delay. This review did not include a review of impacts of the reversible lane signage or parking along Calhoun Street.
Stantec Consulting Services Inc.
Stuart Day PE, PTOE Senior Associate
Phone: 843-740-6335 Fax: 843-740-7707 [email protected]
Related Documents