adfa, p. 1, 2011. © Springer-Verlag Berlin Heidelberg 2011 Aligning and Comparing Data on Emotions Experienced during Learning with MetaTutor Jason M. Harley, François Bouchet, and Roger Azevedo McGill University, Laboratory for the Study of Metacognition and Advanced Learning Technologies, Montreal, Canada {[email protected]} Abstract. In this study we aligned and compared self-report and on-line emo- tions data on 67 college students’ emotions at five different points in time over the course of their interactions with MetaTutor. Self-reported emotion data as well as facial expression data were converged and analyzed. Results across channels revealed that neutral and positively-valenced basic and learner- centered emotional states represented the majority of emotional states experi- enced with MetaTutor. The self-report results revealed a decline in the intensity of positively-valenced and neutral states across the learning session. The facial expression results revealed a substantial decrease in the number of learners’ with neutral facial expressions from time one to time two, but a fairly stable pattern for the remainder of the session, with participants who experienced oth- er basic emotional states, transitioning back to a state of neutral between self- reports. Agreement between channels was 75.6%. Keywords: Emotions, affect, intelligent tutoring systems, pedagogical agents 1 Emotions during Learning with ITSs Effective learning and students’ experience of emotions are critically related [e.g., 1,2]. For ITS research, this translates into a recognized need to design systems with embodied pedagogical agents (PAs) that use AI algorithms to detect, model, and adapt to changes in learners’ emotional fluctuations, in order to promote adaptive emotional states that will facilitate learning [3-5]. Despite the recent surge in interdis- ciplinary research on emotions and affective computing [6], little is known about many important facets of learners’ emotional experiences with ITSs, such as how learners’ emotions fluctuate over time (e.g., over the course of a learning session) and how different components (behavioral, physiological, and experiential) of emotions align. Identifying patterns in learners’ emotional experiences over time is critical to understanding how learners’ feel as they progress temporally through the learning session. In particular, such finer-grained analyses provide valuable diagnostic infor- mation regarding events or time segments to focus system changes on, such as chang- es to the rules used to determine system dynamics or the creation of new PA- delivered emotional interventions. It is equally paramount to assess the convergence of different methods for measuring emotions in order to establish convergent validity

Welcome message from author
This document is posted to help you gain knowledge. Please leave a comment to let me know what you think about it! Share it to your friends and learn new things together.
Transcript
adfa, p. 1, 2011.
© Springer-Verlag Berlin Heidelberg 2011
Aligning and Comparing Data on Emotions Experienced
during Learning with MetaTutor
Jason M. Harley, François Bouchet, and Roger Azevedo
McGill University, Laboratory for the Study of Metacognition and
Advanced Learning Technologies, Montreal, Canada
Abstract. In this study we aligned and compared self-report and on-line emo-
tions data on 67 college students’ emotions at five different points in time over
the course of their interactions with MetaTutor. Self-reported emotion data as
well as facial expression data were converged and analyzed. Results across
channels revealed that neutral and positively-valenced basic and learner-
centered emotional states represented the majority of emotional states experi-
enced with MetaTutor. The self-report results revealed a decline in the intensity
of positively-valenced and neutral states across the learning session. The facial
expression results revealed a substantial decrease in the number of learners’
with neutral facial expressions from time one to time two, but a fairly stable
pattern for the remainder of the session, with participants who experienced oth-
er basic emotional states, transitioning back to a state of neutral between self-
reports. Agreement between channels was 75.6%.
Keywords: Emotions, affect, intelligent tutoring systems, pedagogical agents
1 Emotions during Learning with ITSs
Effective learning and students’ experience of emotions are critically related [e.g.,
1,2]. For ITS research, this translates into a recognized need to design systems with
embodied pedagogical agents (PAs) that use AI algorithms to detect, model, and
adapt to changes in learners’ emotional fluctuations, in order to promote adaptive
emotional states that will facilitate learning [3-5]. Despite the recent surge in interdis-
ciplinary research on emotions and affective computing [6], little is known about
many important facets of learners’ emotional experiences with ITSs, such as how
learners’ emotions fluctuate over time (e.g., over the course of a learning session) and
how different components (behavioral, physiological, and experiential) of emotions
align. Identifying patterns in learners’ emotional experiences over time is critical to
understanding how learners’ feel as they progress temporally through the learning
session. In particular, such finer-grained analyses provide valuable diagnostic infor-
mation regarding events or time segments to focus system changes on, such as chang-
es to the rules used to determine system dynamics or the creation of new PA-
delivered emotional interventions. It is equally paramount to assess the convergence
of different methods for measuring emotions in order to establish convergent validity
between methodologies and to further our psychological theories of emotions regard-
ing, for example, the loose or tight coupling of different emotional expression com-
ponents [7]. Answering these questions will help ITS researchers design more effec-
tive emotionally adaptive ITSs with improved calibration between the emotion-
regulating prompts provided by PAs and learners’ emotional states. Furthermore, this
important user-diagnostic information will also help reduce the negative outcomes
associated with mis-calibrations between participants’ experienced emotional states
and ITSs’ understanding of them [3-5].
1.1 Research Objectives
There were three primary purposes of this study. (1) To examine learners’ emotional
responses across the MetaTutor learning session to determine which emotions were
most prominently experienced and whether they changed as the learning session un-
folded. (2) To examine whether significant differences in learners’ emotional experi-
ences existed between MetaTutor’s two PAs scaffolding conditions: prompt and feed-
back (PF) and control (C). (3) To examine whether there was convergent evidence of
learners’ emotional experiences between the two emotion measurement methods we
used: automatic facial expression analysis (FaceReader 5.0 [8]), and an in-session,
concurrent, emotional state self-report measure (Emotions-Value questionnaire).
2 Methods
2.1 Participants
67 undergraduate students from a large, public university in North America partici-
pated in this study. Participants (82.8% female, 72.4% Caucasian) were randomly
assigned to either the C or PF condition.
2.2 MetaTutor and Apparatus
MetaTutor [9] is a multi-agent ITS and hypermedia learning environment which
consists of 38 pages of text and static diagrams organized by a table of contents dis-
played in the left pane of the environment. The version of MetaTutor used in this
experiment is comprised of material on the human circulatory system, which it is
designed to teach participants about during their interactions with four embedded,
pedagogical agents (PAs). The four PAs’ instructional scaffolding varied depending
on the experimental condition learners were assigned to (aside from PA scaffolding,
the C and PF conditions were identical). In the PF condition, learners were prompted
by the PAs to use specific self-regulatory processes (e.g., to metacognitively monitor
their emerging understanding of the topic or deploy a specific cognitive learning
strategy such as re-reading or coordinating informational sources), and were given
feedback about their use of those processes. In the C condition, participants did not
receive prompts or feedback.
A Logitech Orbit AF webcam was used to record the participants’ faces during
their interaction with MetaTutor. In accordance with FaceReader’s guidelines, the
camera was mounted above the monitor of the computer participants were using, in
order to capture their faces, but not obstruct the screen. Videos were recorded as
WMV files with a resolution of 1600x1200, and 12.1 frames per second on average.
2.3 Measures and Materials
FaceReader 5.0. FaceReader [8] analyzes participants’ facial expressions and pro-
vides a classification of their emotional states using an Active Appearance Model
which models participants’ facial expressions, and an artificial neural network with
seven discrete outputs, corresponding to Ekman and Friesen’s six basic emotions [10]
in addition to neutral, that classifies participants’ constellations of facial expressions.
FaceReader has been validated through comparison with human coders [11]. Videos
recorded during the two sessions of the experiment (with an average length of 40 and
100 minutes respectively) were imported and used to calibrate FaceReader with Gen-
eral or Asian face models. Videos of the second session (when the learning occurred)
were then analyzed with the “smoothen classification” parameter enabled.
Emotions-Value Questionnaire (EV). During the learning session, participants were
asked on five occasions (see section 2.4) by a PA to complete the EV questionnaire,
for which each participant responded to 20 items: 19 items on emotions and 1 item on
task value which was not considered in this analysis. These items were on a 5-point
Likert scale ranging from “Strongly Disagree” to “Strongly Agree.” One example
item is: “right now I feel engaged.” The 19 emotions that are measured using the EV
represent an exhaustive list of discrete basic and learner-centered emotions that ap-
pear in the research and theories of a variety of emotion researchers [e.g., 2, 12]. Def-
initions, based on these researchers’ work and operationalizations of these emotions,
were used to create a digital, definition hand out that was provided in a side panel to
participants every time they filled out an electronic version of the EV embedded in
MetaTutor. The instructions and wording of the questions were based on a subscale of
Pekrun et al. [13] academic emotions questionnaire (AEQ) which assesses partici-
pants’ concurrent, ‘right now’ state-emotions as opposed to emotions generated from
prospective or retrospective focal points. The majority of the 19 emotions can be con-
ceptualized into different quadrants along the axis of valence (positive/negative) and
activation (activating/deactivating) [2, 13].
2.4 Experimental Procedure
During Day One of the experiment, which took approximately 30 minutes, partici-
pants read and signed the informed consent form, took a pretest on the human circula-
tory system, completed a demographics questionnaire, and several self-report
measures (e.g., AEQ trait emotions) on a computer with their face being video rec-
orded. For Day Two, we collected video, audio, eye-tracking, and physiological data
on each participant while they used MetaTutor for about 90 min to learn about the
human circulatory system. At the beginning of the learning session participants set up
two sub goals for learning about the human circulatory system and proceeded to inter-
act with MetaTutor and its learning content for one hour; half-way through, they were
asked to complete the concurrent state AEQ and then invited to take a five-minute
break. At the end of their learning session, learners filled out the post-test measure
and a series of self-report measures, including the retrospective state AEQ. Days One
and Two occurred at least one hour apart from each other and no more than four days
apart. The first time participants filled out the EV was at the beginning of the learning
session after they had successfully set two sub goals. The following occasions oc-
curred regularly every 14 minutes during the on hour learning session, with the fifth
EV being administered just before learners’ took the post-test. Participants had as
much time as necessary to fill out the EV on each occasion.
2.5 Data Analysis
FaceReader 5.0. FaceReader provides a score between 0 and 1, for each frame of
each participant’s video for each of Ekman's six basic emotions, in addition to neutral.
FaceReader also provides information about the dominant emotional state (computed
with a proprietary algorithm using the scores of the seven emotional states in the pre-
vious frames) and timestamp information regarding the on and offset of the hierar-
chical rankings of these states. In these analyses, we aligned FaceReader’s dominant
state with the EV by extracting log information corresponding to the 10 seconds of
video footage of participants right before they were asked to fill in each of the EVs.
We selected the primary dominant state defined as the state reported as dominant
during the majority of the 10 seconds. In 80.7% of the cases, no other unique emotion
was dominant for more than 3s, which makes it unnecessary to consider the possibil-
ity of a secondary co-occurring emotion [14]. Moreover, in 92.9% of the remaining
situations, neutral was either the primary or secondary dominant emotion.
67 participants were analyzed, but nine of them were excluded from our sam-
ple because their dominant state in the 10s for at least three of the five EVs were iden-
tified as “Unknown” by FaceReader (this situation generally occurs when the partici-
pant’s face is not sufficiently oriented towards the webcam, e.g. when they look down
to type on the keyboard).
In order to evaluate the agreement between the self-reported emotions in the 5
EVs and the dominant emotion identified by FaceReader during the 10s before, we
started by defining a mapping between the 13 non-basic emotions from the EV onto
the 6 basic emotions in addition to neutral that are used by FaceReader to classify
participants’ emotions. Using work from Pekrun et al. [2, 13] on the AEQ, (1) all
positively valenced activating emotions (enjoyment, hope, pride, curiosity and eure-
ka) were associated with happy; among the negatively valenced activating emotions,
(2) frustration was grouped with anger, (3) anxiety with fear and (4) contempt with
disgust, and (5) all negatively valenced deactivating emotions (hopelessness and
boredom) were associated with sadness, while the (6 and 7) non-valenced emotions
(neutral and surprise) were kept as two distinct categories. Two additional emotions
(confusion and shame) used in the EV could not be associated to any basic emotions
and were therefore discarded for this analysis.
Given these seven groups of emotions, we defined that there was an agreement
between FaceReader’s dominant emotion and the EV if and only if one of the emo-
tions associated to FaceReader’s dominant emotion was rated with a score of 3 or
more (out of 5) in the EV (e.g., if the dominant emotion according to FaceReader is
anger, either anger or frustration need to have a score of 3 or more in the EV). The 20
(out of 290) occurrences of “Unknown” were excluded from this analysis.
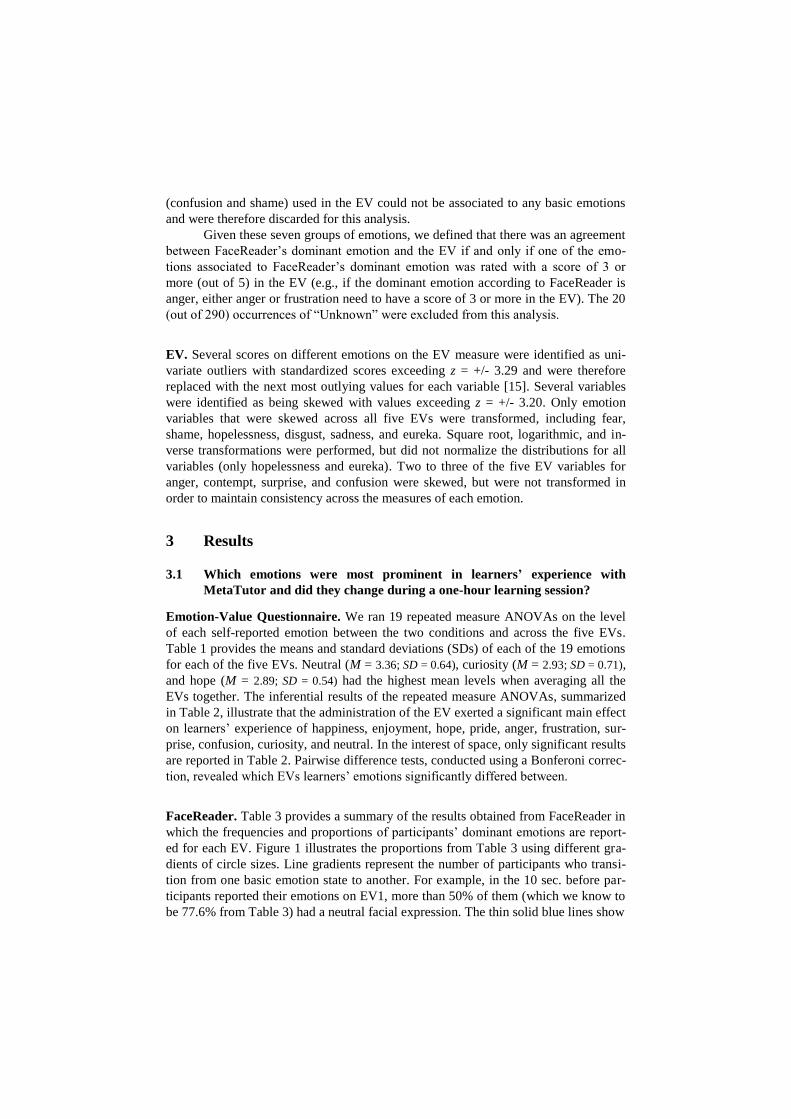
EV. Several scores on different emotions on the EV measure were identified as uni-
variate outliers with standardized scores exceeding z = +/- 3.29 and were therefore
replaced with the next most outlying values for each variable [15]. Several variables
were identified as being skewed with values exceeding z = +/- 3.20. Only emotion
variables that were skewed across all five EVs were transformed, including fear,
shame, hopelessness, disgust, sadness, and eureka. Square root, logarithmic, and in-
verse transformations were performed, but did not normalize the distributions for all
variables (only hopelessness and eureka). Two to three of the five EV variables for
anger, contempt, surprise, and confusion were skewed, but were not transformed in
order to maintain consistency across the measures of each emotion.
3 Results
3.1 Which emotions were most prominent in learners’ experience with
MetaTutor and did they change during a one-hour learning session?
Emotion-Value Questionnaire. We ran 19 repeated measure ANOVAs on the level
of each self-reported emotion between the two conditions and across the five EVs.
Table 1 provides the means and standard deviations (SDs) of each of the 19 emotions
for each of the five EVs. Neutral (M = 3.36; SD = 0.64), curiosity (M = 2.93; SD = 0.71),
and hope (M = 2.89; SD = 0.54) had the highest mean levels when averaging all the
EVs together. The inferential results of the repeated measure ANOVAs, summarized
in Table 2, illustrate that the administration of the EV exerted a significant main effect
on learners’ experience of happiness, enjoyment, hope, pride, anger, frustration, sur-
prise, confusion, curiosity, and neutral. In the interest of space, only significant results
are reported in Table 2. Pairwise difference tests, conducted using a Bonferoni correc-
tion, revealed which EVs learners’ emotions significantly differed between.
FaceReader. Table 3 provides a summary of the results obtained from FaceReader in
which the frequencies and proportions of participants’ dominant emotions are report-
ed for each EV. Figure 1 illustrates the proportions from Table 3 using different gra-
dients of circle sizes. Line gradients represent the number of participants who transi-
tion from one basic emotion state to another. For example, in the 10 sec. before par-
ticipants reported their emotions on EV1, more than 50% of them (which we know to
be 77.6% from Table 3) had a neutral facial expression. The thin solid blue lines show
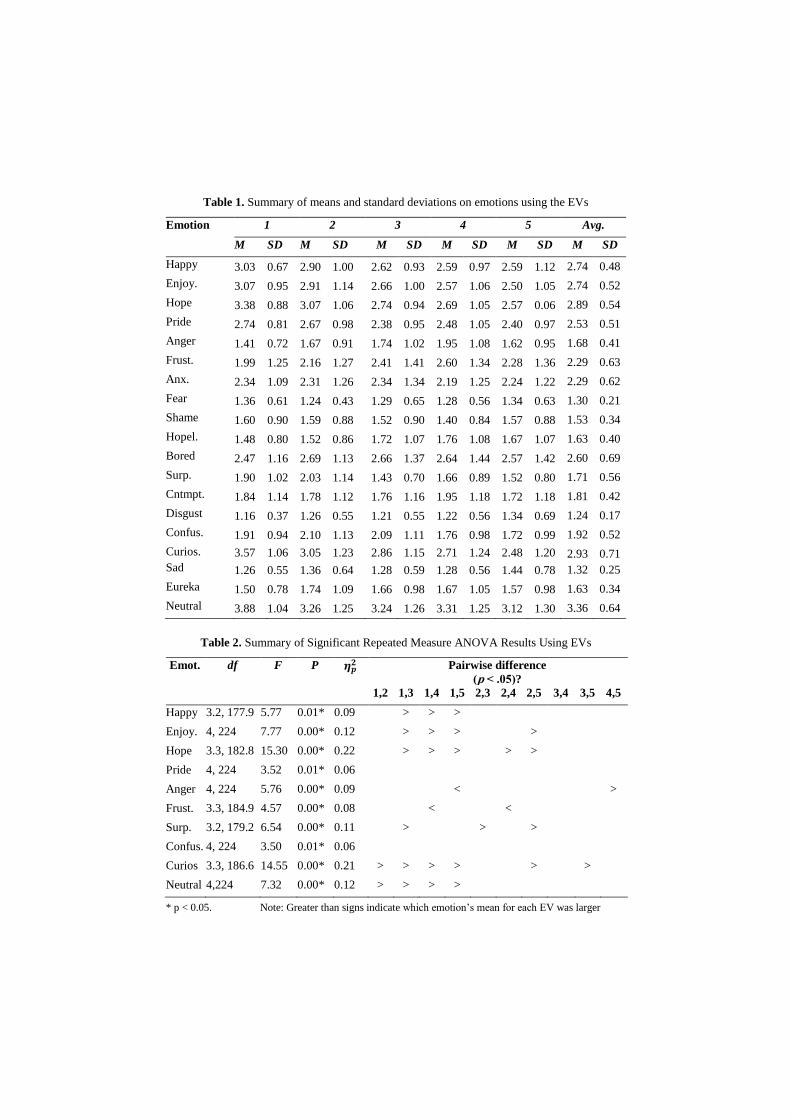
Table 1. Summary of means and standard deviations on emotions using the EVs
Emotion 1 2 3 4 5 Avg.
M SD M SD M SD M SD M SD M SD
Happy 3.03 0.67 2.90 1.00 2.62 0.93 2.59 0.97 2.59 1.12 2.74 0.48
Enjoy. 3.07 0.95 2.91 1.14 2.66 1.00 2.57 1.06 2.50 1.05 2.74 0.52
Hope 3.38 0.88 3.07 1.06 2.74 0.94 2.69 1.05 2.57 0.06 2.89 0.54
Pride 2.74 0.81 2.67 0.98 2.38 0.95 2.48 1.05 2.40 0.97 2.53 0.51
Anger 1.41 0.72 1.67 0.91 1.74 1.02 1.95 1.08 1.62 0.95 1.68 0.41
Frust. 1.99 1.25 2.16 1.27 2.41 1.41 2.60 1.34 2.28 1.36 2.29 0.63
Anx. 2.34 1.09 2.31 1.26 2.34 1.34 2.19 1.25 2.24 1.22 2.29 0.62
Fear 1.36 0.61 1.24 0.43 1.29 0.65 1.28 0.56 1.34 0.63 1.30 0.21
Shame 1.60 0.90 1.59 0.88 1.52 0.90 1.40 0.84 1.57 0.88 1.53 0.34
Hopel. 1.48 0.80 1.52 0.86 1.72 1.07 1.76 1.08 1.67 1.07 1.63 0.40
Bored 2.47 1.16 2.69 1.13 2.66 1.37 2.64 1.44 2.57 1.42 2.60 0.69
Surp. 1.90 1.02 2.03 1.14 1.43 0.70 1.66 0.89 1.52 0.80 1.71 0.56
Cntmpt. 1.84 1.14 1.78 1.12 1.76 1.16 1.95 1.18 1.72 1.18 1.81 0.42
Disgust 1.16 0.37 1.26 0.55 1.21 0.55 1.22 0.56 1.34 0.69 1.24 0.17
Confus. 1.91 0.94 2.10 1.13 2.09 1.11 1.76 0.98 1.72 0.99 1.92 0.52
Curios. 3.57 1.06 3.05 1.23 2.86 1.15 2.71 1.24 2.48 1.20 2.93 0.71
Sad 1.26 0.55 1.36 0.64 1.28 0.59 1.28 0.56 1.44 0.78 1.32 0.25
Eureka 1.50 0.78 1.74 1.09 1.66 0.98 1.67 1.05 1.57 0.98 1.63 0.34
Neutral 3.88 1.04 3.26 1.25 3.24 1.26 3.31 1.25 3.12 1.30 3.36 0.64
Table 2. Summary of Significant Repeated Measure ANOVA Results Using EVs
Emot. df F P Pairwise difference
(p < .05)?
1,2 1,3 1,4 1,5 2,3 2,4 2,5 3,4 3,5 4,5
Happy 3.2, 177.9 5.77 0.01* 0.09 > > >
Enjoy. 4, 224 7.77 0.00* 0.12 > > > >
Hope 3.3, 182.8 15.30 0.00* 0.22 > > > > >
Pride 4, 224 3.52 0.01* 0.06
Anger 4, 224 5.76 0.00* 0.09 < >
Frust. 3.3, 184.9 4.57 0.00* 0.08 < <
Surp. 3.2, 179.2 6.54 0.00* 0.11 > > >
Confus. 4, 224 3.50 0.01* 0.06
Curios 3.3, 186.6 14.55 0.00* 0.21 > > > > > >
Neutral 4,224 7.32 0.00* 0.12 > > > >
* p < 0.05. Note: Greater than signs indicate which emotion’s mean for each EV was larger
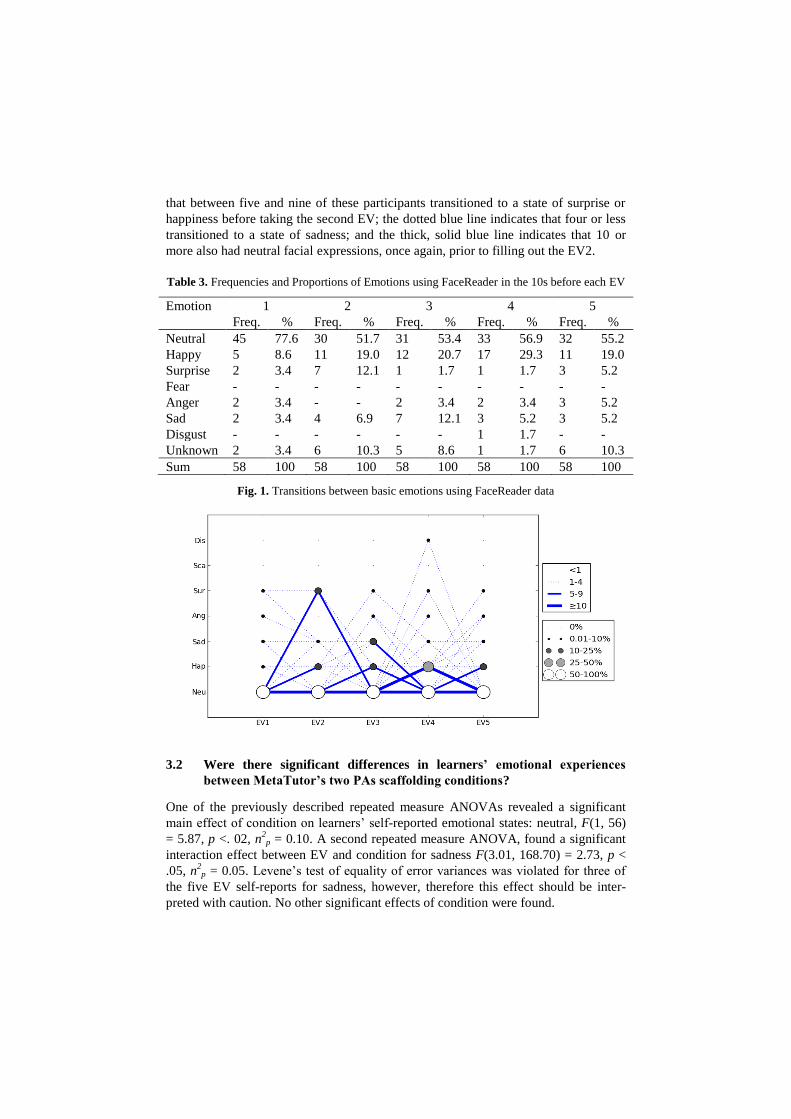
that between five and nine of these participants transitioned to a state of surprise or
happiness before taking the second EV; the dotted blue line indicates that four or less
transitioned to a state of sadness; and the thick, solid blue line indicates that 10 or
more also had neutral facial expressions, once again, prior to filling out the EV2.
Table 3. Frequencies and Proportions of Emotions using FaceReader in the 10s before each EV
Emotion 1 2 3 4 5
Freq. % Freq. % Freq. % Freq. % Freq. %
Neutral 45 77.6 30 51.7 31 53.4 33 56.9 32 55.2
Happy 5 8.6 11 19.0 12 20.7 17 29.3 11 19.0
Surprise 2 3.4 7 12.1 1 1.7 1 1.7 3 5.2
Fear - - - - - - - - - -
Anger 2 3.4 - - 2 3.4 2 3.4 3 5.2
Sad 2 3.4 4 6.9 7 12.1 3 5.2 3 5.2
Disgust - - - - - - 1 1.7 - -
Unknown 2 3.4 6 10.3 5 8.6 1 1.7 6 10.3
Sum 58 100 58 100 58 100 58 100 58 100
Fig. 1. Transitions between basic emotions using FaceReader data
3.2 Were there significant differences in learners’ emotional experiences
between MetaTutor’s two PAs scaffolding conditions?
One of the previously described repeated measure ANOVAs revealed a significant
main effect of condition on learners’ self-reported emotional states: neutral, F(1, 56)
= 5.87, p <. 02, n2p = 0.10. A second repeated measure ANOVA, found a significant
interaction effect between EV and condition for sadness F(3.01, 168.70) = 2.73, p <
.05, n2p = 0.05. Levene’s test of equality of error variances was violated for three of
the five EV self-reports for sadness, however, therefore this effect should be inter-
preted with caution. No other significant effects of condition were found.
3.3 Is there converging evidence of learners’ emotional experiences between
self-report and on-line measures?
Using the method described above to compare self-reported and classified (through
FaceReader) emotions, we established an agreement rate1 of 75.6%, suggesting that
FaceReader can be used reasonably well to assess learner’s emotions, even if it cannot
provide a fine-grained identification of non-basic (i.e., learner-centered) emotions.
4 Discussion
In response to our first research question (which emotions are most prominent in
learners’ experience with MetaTutor and do they change as the learning session un-
folds?) we found that neutral, curiosity and hope had the highest mean levels when
averaging all the EVs together. We also noted that of the 19 emotions assessed using
the EV, learners’ experience of happiness, enjoyment, hope, pride, anger, frustration,
surprise, confusion, curiosity, and neutral meaningfully differed across the learning
session, while the others remained more stable. In looking at these fluctuations more
closely a pattern emerges in which learners’ positive, activating emotions and neutral
states tended to decline as the session progressed, most notably, between the admin-
istration of EV1 and EV3. These patterns draw our attention to a need for an interven-
tion to sustain higher levels of positive emotions (e.g., curiosity, engagement) and
neutral states. Another pattern that ran in the opposite direction was the negative,
activating emotions anger and frustration, which gradually increased as the session
progressed and peaked just before participants filled out the EV4.
In examining the results from FaceReader we observed, similarly, that neu-
tral and a positive activating emotion, happiness, made up the largest proportions of
participants’ emotional experiences. In particular, most participants embodied a neu-
tral state at each of the EVs, though a substantial proportion of them transitioned to a
positive state; the majority of which either transitioned back to a state of neutral or
another emotional state before the next EV was administered. It is notable that, simi-
lar to the EV self-report analyses in which participants reported low mean levels of
negative emotions, few participants facially embodied negative emotions and those
who did didn’t tend to remain fixed in that state. For example, all of the participants
who embodied a sad facial expression before EV3 transitioned to a neutral state be-
fore EV4. In summary, these results are favorable, especially considering that MetaT-
utor is not presently designed using gamification features (e.g., points, story elements)
or to provide interventions that specifically aim to improve or sustain learners’ (adap-
tive) emotions. Furthermore, most students were not biology majors2 and the content
was not designed to be related to a specific course for those who were.
In general, the answer to our second research question, did significant differ-
ences in learners’ emotional experiences exist between MetaTutor’s two PAs scaf-
1 Because learners were not asked to provide their dominant emotion among the 19 proposed,
it is not possible to provide a kappa value. 2 93% of students majored in non-biology fields (e.g., psychology, economics, engineering).
folding conditions, is no. Overall, given the low level of negative emotions reported
and observed facially, this suggests that at the very least, the more advanced and
adaptive feedback that MetaTutor’s PAs are providing are not being responded to
with negative feelings.
This study also demonstrated that different emotion (behavioral and experien-
tial) measurement methodologies (facial expressions analyses and self-report) can be
effectively aligned and produce convergent results. This is particularly notable be-
cause of the differences between these two measures. Specifically, the EV assesses
the level (e.g., intensity) of a set of potential emotional experiences concurrently,
while FaceReader assesses which emotional state learners’ are in based on fit with
pre-learned facial expressions. Furthermore, these two methods are based on different
theories of emotion and use different sub sets of discrete emotions. As a result, de-
spite the strong agreement rate (75.6%), there are some differences in terms of the
overall patterns, such as the decline in mean levels of positive activating emotions
when they are measured separately with the EV vs. the increase in learners’ facial
expressions of happiness (up to EV 4). This apparent variation in patterns may be the
result of subtle differences between the facial embodiment of an emotion and its psy-
chological experience and corresponding self-report. For example, a participant may
smile and self-report a 3 on the EV regarding a feeling of pride. In this example, the
learner reported experiencing a moderate intensity level of a positive activating emo-
tion (pride) related to FaceReader’s classification of happiness as the dominant emo-
tional state, which would be counted as an agreement between the methods.
In conclusion, the high agreement rate we found between methods and conver-
gent results (e.g., that neutral and positively-valenced basic and learner-centered emo-
tional states represented the majority of emotional states experienced with MetaTutor)
bolsters the validity of our emotion assessments and provides a strong foundation to
make valid and reliable diagnostic examinations of learners’ emotions at discrete
points during learning with MetaTutor. Conceptually and theoretically, our results
provide evidence that the experiential and behavioral components of emotions are
tightly coupled. Educationally, improved measurement strategies of emotions will
lead to better calibrated interventions that can be designed to support and sustain
adaptive emotional states during learning with ITSs.
5 Acknowledgements
The research presented in this paper has been supported by a doctoral fellowship
from the Fonds Québécois de recherche - Société et culture (FQRSC) awarded to the
first author and the National Science Foundation (DRL 1008282) awarded to the third
author.
References
1. Chauncey Strain, A., Azevedo, R., & D’Mello, S.: Using a False Biofeed-
back Methodology to Explore Relationships Among Learners’ Affect, Met-
acognition, and Performance. Contemporary Ed. Psych. 38, 22-39 (2013)
2. Pekrun, R., Goetz, T., Frenzel-Anne, C., Petra, B., & Perry, R. P.: Measur-
ing Emotions in Students’ Learning and Performance: The Achievement
Emotions Questionnaire (AEQ). Contemporary. Ed. Psych. 36, 34-48 (2011)
3. D’Mello, S. K., Lehman, B., & Graesser, A.: A Motivationally Supportive
Affect-Sensitive AutoTutor. In: Calvo, R. A., D’Mello, S.K. (eds.) New per-
spectives on affect and learning tech., pp. 113-126. Springer, NY (2011)
4. Robinson, J., McGuiggan, S. W., & Lester, J.: Evaluating the Consequences
of Affective Feedback in ITSs. In Cohn, J., Nijholt, A., Pantic, M. (eds.)
Proceedings of the 3rd
Int. Conference on Affective Computing & Intelligent
Interaction, pp. 37-42. IEEE, Amsterdam, The Netherlands (2009)
5. Woolf, B., Arroyo, I., Muldner, K., Burleson, W., Cooper, D., Dolan, R., &
Christopherson, R. M.: The Effect of Motivational Learning Companions on
Low-Achieving Students and Students with Learning Disabilities. In Alev-
en, V., Kay J., Mostow, J. (eds.) Proceedings of the 10th Int. Conference on
ITS, pp. 327-337. Springer-Verlag, Berlin, Heidelberg (2010)
6. Calvo, R.A. & D’Mello, S.K. (eds.) New Perspectives on Affect and Learn-
ing Technologies. Springer, Amsterdam (2011)
7. Gross, J. J., & Barret, L. F: Emotion Generation and Emotion Regulation:
One or Two Depends On Your Point of View. Emotion Rev., 3, 8-16 (2011)
8. VicarVision: FaceReader 5.0 [Computer software]. Noldus Information
Technology, Wageningen, the Netherlands (2012)
9. Azevedo, R., Behnagh, R., Duffy, M., Harley, J., & Trevors, G.: Metacogni-
tion and SRL in Student-Centered Leaning Environments. In Jonassen, D.,
Land, S. (eds.) Theoretical foundations of student-centered learning envi-
ronments (2nd ed.), pp. 171-197. Routledge, New York (2012)
10. Ekman, P.: An Argument for Basic Emotions. Cognition & Emotion, 6,
169–200 (1992)
11. Terzis, V., Moridis, C.N., Economides, A.A.: Measuring Instant Emotions
During a Self-Assessment Test: The Use of FaceReader. Proceedings of the
7th Inter. Conf. on Methods and Techniques in Behavioral Research, pp.
18:1–18:4. ACM, New York, NY, USA (2010)
12. D’Mello, S. K., Lehman, B., & Person, N. Monitoring Affective States Dur-
ing Effortful Problem Solving Activities. International Journal of Artificial
Intelligence in Education, 20, 361-389 (2010)
13. Pekrun, R., Goetz, T., Titz, W., & Perry, R.: Academic Achievement Emo-
tions in Students’ Self-Regulated Learning and Achievement: A Program of
Quantitative and Qualitative Research. Ed. Psychologist, 37, 91-206 (2002)
14. Harley, J.M, Bouchet, F., & Azevedo, R. Measuring learners’ co-occurring
emotional responses during their interaction with a pedagogical agent in
MetaTutor. In Cerri, S. A., Clancey, W. J., Papadourakis, G., Panourgia K.
(eds.), Proceedings of the 11th International Conference on Intelligent Tu-
toring Systems, pp. 40-45). Springer-Verlag, Berlin, Heidelberg (2012)
15. Tabachnick, B. G., & Fidell, L. S. Using Multivariate Statistics (5th
ed.).
Pearson Education/ Allyn and Bacon, Boston, MA (2007)
Related Documents