Algorithm for application Algorithm for application of internal standard on of internal standard on ICP-MS transient signals ICP-MS transient signals Stefanova, V., Kmetov, V., Stefanova, V., Kmetov, V., Plovdiv/BG Plovdiv/BG UNIVERSITY OF PLOVDIV Paissii Hilendarski, UNIVERSITY OF PLOVDIV Paissii Hilendarski, Department of Analytical Chemistry Department of Analytical Chemistry , , 24 Tsar Assen St., BG 4000 Plovdiv, BULGARIA 24 Tsar Assen St., BG 4000 Plovdiv, BULGARIA

Algorithm for application of internal standard on ICP-MS transient signals Stefanova, V., Kmetov, V., Plovdiv/BG UNIVERSITY OF PLOVDIV Paissii Hilendarski,
Dec 18, 2015
Welcome message from author
This document is posted to help you gain knowledge. Please leave a comment to let me know what you think about it! Share it to your friends and learn new things together.
Transcript

Algorithm for Algorithm for application of internal application of internal
standard on ICP-MS standard on ICP-MS transient signalstransient signals
Stefanova, V., Kmetov, V., Stefanova, V., Kmetov, V., Plovdiv/BGPlovdiv/BG
UNIVERSITY OF PLOVDIV Paissii Hilendarski,UNIVERSITY OF PLOVDIV Paissii Hilendarski, Department of Analytical ChemistryDepartment of Analytical Chemistry, , 24 Tsar Assen St., BG 4000 Plovdiv, BULGARIA24 Tsar Assen St., BG 4000 Plovdiv, BULGARIA
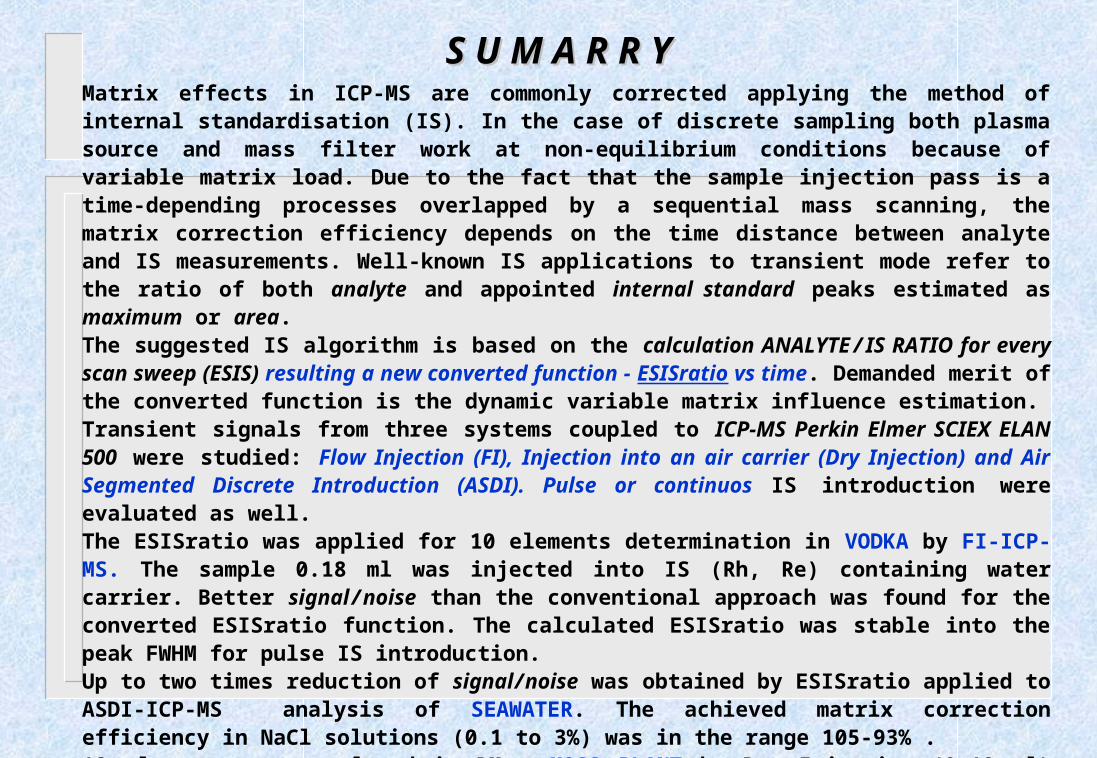
S U M A R R YS U M A R R Y Matrix effects in ICP-MS are commonly corrected applying the method of internal standardisation (IS). In the case of discrete sampling both plasma source and mass filter work at non-equilibrium conditions because of variable matrix load. Due to the fact that the sample injection pass is a time-depending processes overlapped by a sequential mass scanning, the matrix correction efficiency depends on the time distance between analyte and IS measurements. Well-known IS applications to transient mode refer to the ratio of both analyte and appointed internal standard peaks estimated as maximum or area. The suggested IS algorithm is based on the calculation ANALYTE / IS RATIO for every scan sweep (ESIS) resulting a new converted function - ESISratio vs time. Demanded merit of the converted function is the dynamic variable matrix influence estimation.Transient signals from three systems coupled to ICP-MS Perkin Elmer SCIEX ELAN 500 were studied: Flow Injection (FI), Injection into an air carrier (Dry Injection) and Air Segmented Discrete Introduction (ASDI). Pulse or continuos IS introduction were evaluated as well. The ESISratio was applied for 10 elements determination in VODKA by FI-ICP-MS. The sample 0.18 ml was injected into IS (Rh, Re) containing water carrier. Better signal / noise than the conventional approach was found for the converted ESISratio function. The calculated ESISratio was stable into the peak FWHM for pulse IS introduction. Up to two times reduction of signal / noise was obtained by ESISratio applied to ASDI-ICP-MS analysis of SEAWATER. The achieved matrix correction efficiency in NaCl solutions (0.1 to 3%) was in the range 105-93% .12 elements were analysed in RM - MOSS PLANT by Dry Injection (0,18 ml) with a good agreement to the reference values. Up to 6 times better Determination limits were obtained by the ESISratio function after selecting of appropriate plateau region.

Three discrete sample introduction systems have been tested: ASDI, Dry Injection and Flow Injection. First two systems gave plateau shaped profiles due to the removed sample/carrier inter-diffusion and allow pulse introduction of IS only. IS introduction by FI could be pulse or continuous.
water
water
air
air
sample
sample
sample
air
air water
water
ASDI
01000020000300004000050000
0 4 8 12 16 20 24 28 32 36 40 44
DryInj
0
10000
20000
30000
40000
50000
0 4 8 12 16 20 24 28 32 36 40 44
FI
IS
01000020000300004000050000
0 4 8 12 16 20 24 28 32 36 40 44
Air Segmented Discrete introduction mode (ASDI) [1]
Dry Injection mode (DryInj) [2,3]
Flow Injection mode (FI) [4-8]
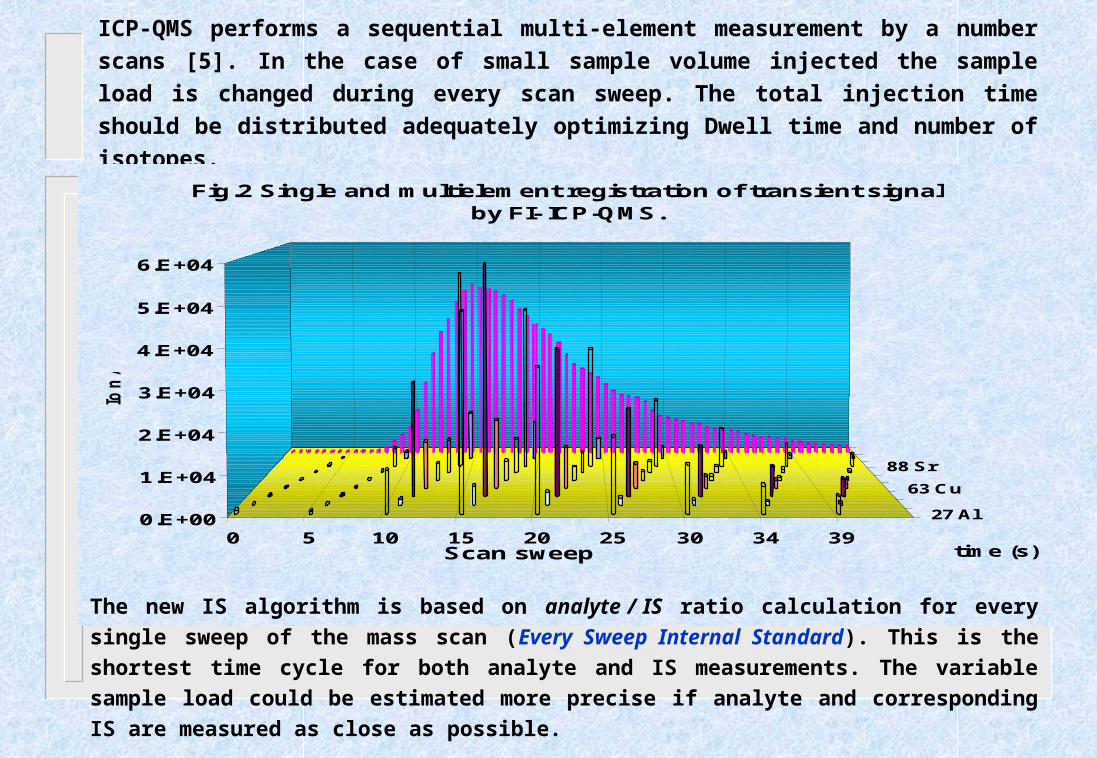
ICP-QMS performs a sequential multi-element measurement by a number scans [5]. In
the case of small sample volume injected the sample load is changed during every
scan sweep. The total injection time should be distributed adequately optimizing Dwell
time and number of isotopes.
0 5 10 15 20 25 30 34 39
27 Al
63 Cu
88 Sr
0.E+00
1.E+04
2.E+04
3.E+04
4.E+04
5.E+04
6.E+04
Ion
/s
time (s)
Fig.2 Single and multielement registration of transient signal by FI- ICP-QMS.
Scan sweep
The new IS algorithm is based on analyte / IS ratio calculation for every single sweep of the
mass scan (Every Sweep Internal Standard). This is the shortest time cycle for both analyte
and IS measurements. The variable sample load could be estimated more precise if analyte
and corresponding IS are measured as close as possible.
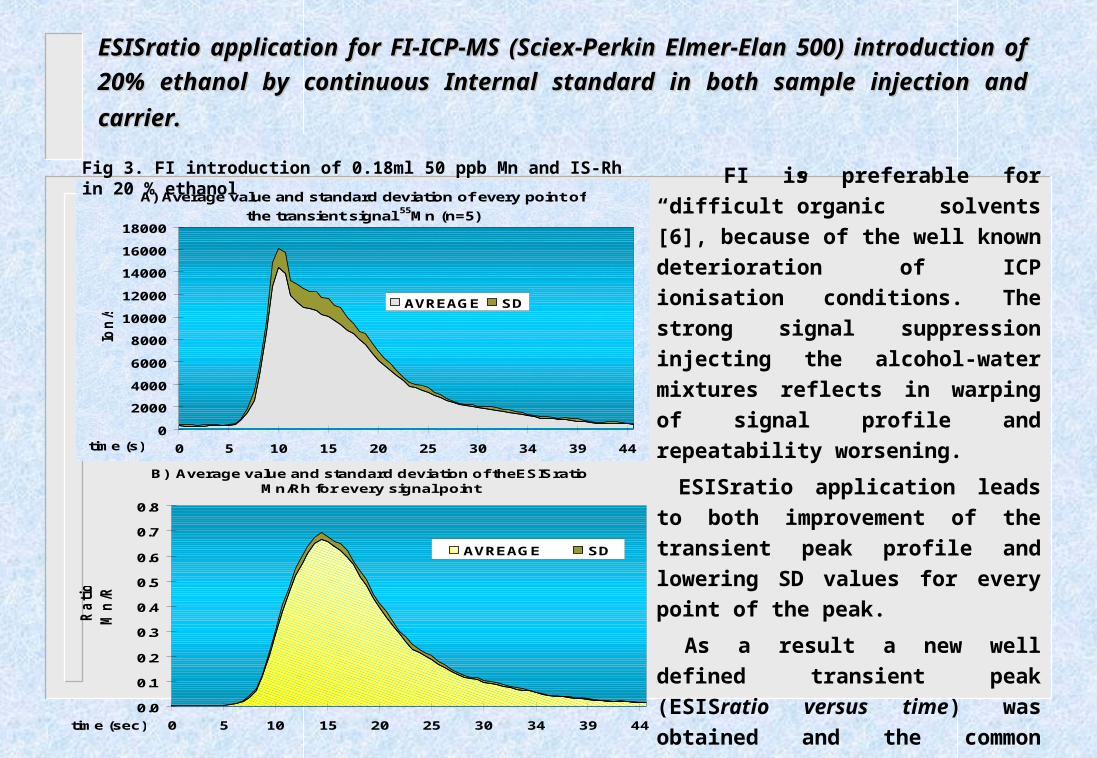
ESISratio application for FI-ICP-MS (Sciex-Perkin Elmer-Elan 500) introduction of ESISratio application for FI-ICP-MS (Sciex-Perkin Elmer-Elan 500) introduction of
20% ethanol by continuous Internal standard in both sample injection and carrier.20% ethanol by continuous Internal standard in both sample injection and carrier.
A) Average value and standard deviation of every point of
the transient signal 55Mn (n=5)
0
2000
4000
6000
8000
10000
12000
14000
16000
18000
0 5 10 15 20 25 30 34 39 44time (s)
Ion
/s
AVREAGE SD
B) Average value and standard deviation of theESISratio Mn/Rh for every signal point
0.0
0.1
0.2
0.3
0.4
0.5
0.6
0.7
0.8
0 5 10 15 20 25 30 34 39 44time (sec)
Ra
tio
Mn
/Rh
AVREAGE SD
FI is preferable for “difficult”organic
solvents [6], because of the well
known deterioration of ICP ionisation
conditions. The strong signal
suppression injecting the alcohol-
water mixtures reflects in warping of
signal profile and repeatability
worsening.
ESISratio application leads to both
improvement of the transient peak
profile and lowering SD values for
every point of the peak.
As a result a new well defined
transient peak (ESISratio versus time)
was obtained and the common
treatment procedures as PEAK
MAXIMUM or AREA could be
adequately applied on it.
Fig 3. FI introduction of 0.18ml 50 ppb Mn and IS-Rh in 20 % ethanol

Fig. 5. RSD of 5 injections Vodka + 50 ppb Standard using different IS algorithms
0
2
4
6
8
10
Al/Rh Cr/Rh Mn/Rh Cu/Rh As/Rh Zn/Rh Sr/Rh Cd/Rh Ba/Rh Pb/Re
RS
D%
Peak Maximum Peak Area
ESIS FWHM (10 points) pulse IS Area ESIS continuous IS
ESISratio application for FI-ICP-MS pulse IS introduction in sample injectionESISratio application for FI-ICP-MS pulse IS introduction in sample injection..
ESISratio was calculated for sample
injection peaks of 0,18 ml Vodka
spiked with 50 ppb Cd and Rh (IS) [7].
The region of stable ratio was
observed into the FWHM zone of the
sample peak [5]. The sum of ratios in
FWHM zone was used as quantitative
variance for further calibration and
analysis. At the optimized conditions
the constant ratio zone includes 10
points per peak.
The IS application using conventional
peak maximum and area calculation
were compared to ESISratio for both
cases pulse and continuous IS
introduction. The best obtained
repeatability shows calculation of the
peak area after ESIS application
(continuous IS introduction)
Fig.4. FI introduction 5 injections of 0.18 ml Vodka + 50 ppb Cd and IS - Rh
0
20000
40000
60000
80000
100000
1 inj 2 inj 3 inj 4 inj 5 inj
Ion
/s
0
0.1
0.2
0.3
0.4
0.5
0.6
0.7
0.8
Rat
io (
Cd
/Rh
)
Rh
Cd
Cd/Rh
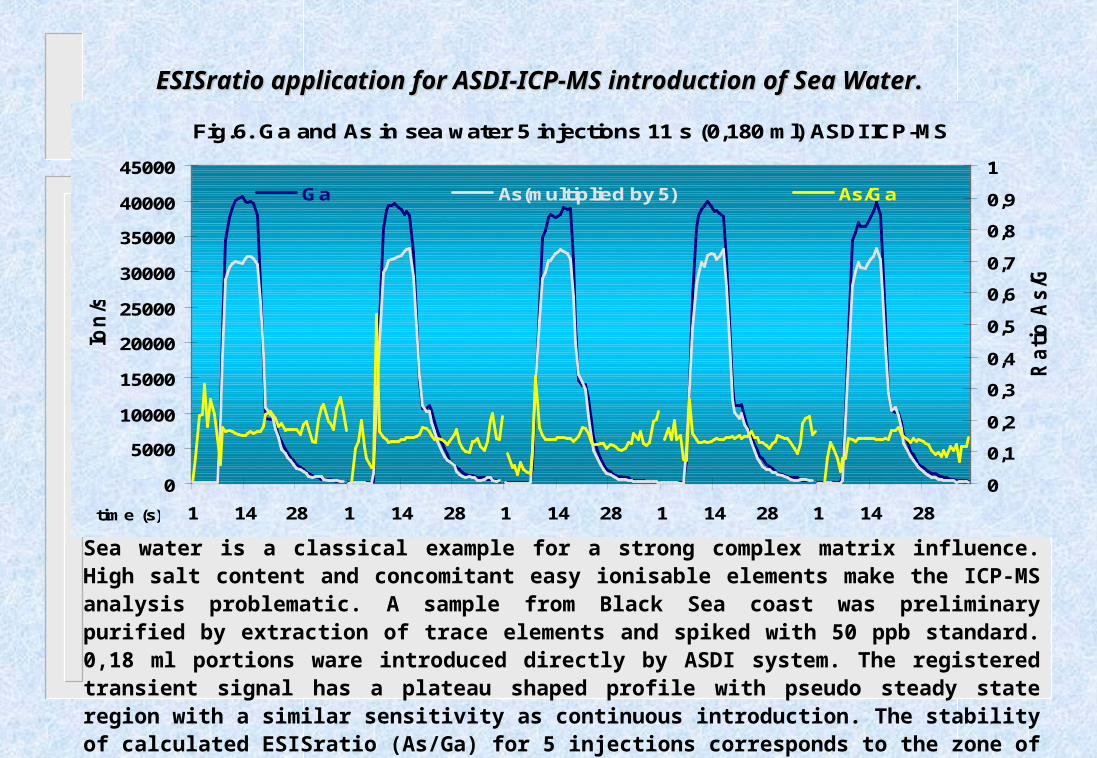
Fig.6. Ga and As in sea water 5 injections 11 s (0,180 ml) ASDI ICP-MS
0
5000
10000
15000
20000
25000
30000
35000
40000
45000
1 14 28 1 14 28 1 14 28 1 14 28 1 14 28time (s)
Ion
/s
0
0,1
0,2
0,3
0,4
0,5
0,6
0,7
0,8
0,9
1
Ra
tio
As
/Ga
Ga As(multiplied by 5) As/Ga
ESISratio application for ASDI-ICP-MS introduction of Sea WaterESISratio application for ASDI-ICP-MS introduction of Sea Water..
Sea water is a classical example for a strong complex matrix influence. High salt content and concomitant easy ionisable elements make the ICP-MS analysis problematic. A sample from Black Sea coast was preliminary purified by extraction of trace elements and spiked with 50 ppb standard. 0,18 ml portions ware introduced directly by ASDI system. The registered transient signal has a plateau shaped profile with pseudo steady state region with a similar sensitivity as continuous introduction. The stability of calculated ESISratio (As/Ga) for 5 injections corresponds to the zone of the signal plateau Fig.6.

ESISratio statistical evaluation of the stability zone for Sea WaterESISratio statistical evaluation of the stability zone for Sea Water.
0.00
0.50
1.00
1.50
2.00
2.50
3.00
3.50RS
D %
Fig.7 ESISratio RSD of 5 ASDI injections (0.18 ml) of sea water spiked with 50 ppb standard
Peak Max 2.73 3.42 2.91 3.01 3.31
Integration total 1.95 2.13 2.46 2.94 2.93
Integration FWHM 1.80 2.05 1.49 1.65 2.39
Integration Plateau 1.75 1.99 1.62 1.48 1.71
Co/Ga Cu/Ga As/Ga Cd/Rh Pb/Rh
The appropriate ESISratio stability
zone was estimate comparing the
ratio RSD of 5 injections sea water
using three different time intervals:
• total injection 7,2-31.3 s
• injection FWHM 8,8-25.6 s
• injection plateau 9,6-17.6 s
The obtained RSD slightly
decrease in the order :
TOTAL INJECTION
> FWHM
> SIGNAL PLATEAU.

ESISratio matrix correction efficiency for ASDI-ICP-MS analysis ofESISratio matrix correction efficiency for ASDI-ICP-MS analysis ofhigh salt content solutions. high salt content solutions.
Fig.8 Matrix supression correction by ESISratio. ASDI introduction of Pb (50 ppb) in
the presence of NaCl
0
20
40
60
80
100
120
0 0.5 1 1.5 2 2.5 3 NaCl % in the injected solution
sig
na
l %
ch
an
ge
Pb Pb/Rh
A very strong suppression of
ion signal for 208Pb up to 80 %
in comparison with the water
standards was corrected using
Pb / Rh ESISratio. The obtained
ratio change was in the range
105-93% for the tested matrix
loaded solutions.
The cleaning effect of washing
carrier solvent prevents the
nebulisation system blocking.
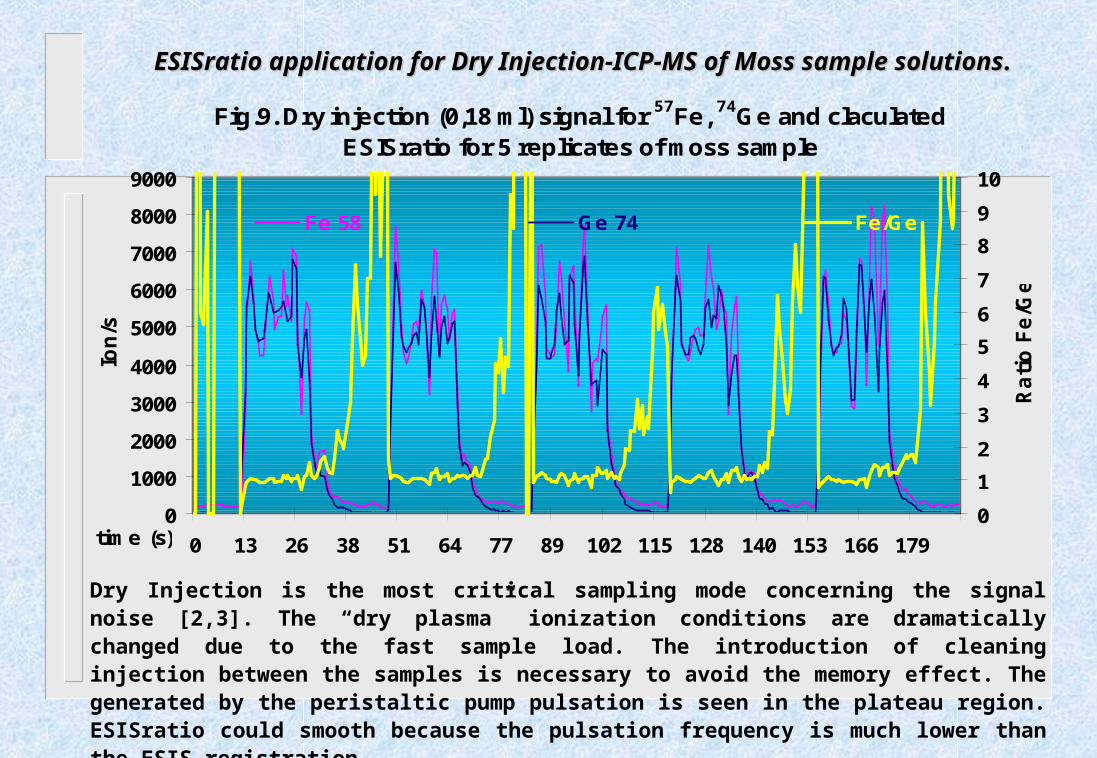
Fig.9. Dry injection (0,18 ml) signal for 57Fe, 74Ge and claculated ESISratio for 5 replicates of moss sample
0
1000
2000
3000
4000
5000
6000
7000
8000
9000
0 13 26 38 51 64 77 89 102 115 128 140 153 166 179time (s)
Ion
/s
0
1
2
3
4
5
6
7
8
9
10
Ra
tio
Fe
/Ge
Fe 58 Ge 74 Fe/Ge
ESISratio application for Dry Injection-ICP-MS of Moss sample solutionsESISratio application for Dry Injection-ICP-MS of Moss sample solutions..
Dry Injection is the most critical sampling mode concerning the signal noise [2,3]. The “dry plasma” ionization conditions are dramatically changed due to the fast sample load. The introduction of cleaning injection between the samples is necessary to avoid the memory effect. The generated by the peristaltic pump pulsation is seen in the plateau region. ESISratio could smooth because the pulsation frequency is much lower than the ESIS registration.
ESISratio statistical evaluation of the stability zone for ESISratio statistical evaluation of the stability zone for Dry Injection-ICP-MS analysis of Moss sampleDry Injection-ICP-MS analysis of Moss sample.
The determination of the ESISratio stability zone was estimated by RSD comparison of four different sample zones ( 5 injections of moss solution): I) total injection; ii) FWHM; iii) signal plateau; iv) part of the signal plateau.
As a zone with maximum ESISratio stability appeared to be the first part of the plateau region 15 sweeps (from 14-23 s). Further decrease of the integration zone to 10 sweeps reflects in repeatability worsening as well. The selected final ESISratio region covers about 70% of the plateau zone and 50 % of the total analyte signal. Because of the strong signal pulsation it was difficult to estimate FWHM of the peak.
The optimized conditions were applied in Dry injection- ICP-MS Moss Reference material analysis. The injected sample was with dilution factor DF=100 and volume 0,18ml. Nine isotopes per injection at 60ms dwell time were measured. Two set parameters were created for elements with low and high masses respectively. 74Ge and 166Er were chosen as appropriate internal standards [9]. ESISratio application was carried out by integration of 15 sweeps. The raw data were transferred to the external PC and all calculations were made using MS Excel 97.
Limits of determination obtained by ESISratio algorithm were close to common peak area calculation and 2 to 6 times better than peak maximum (Fig. 10).
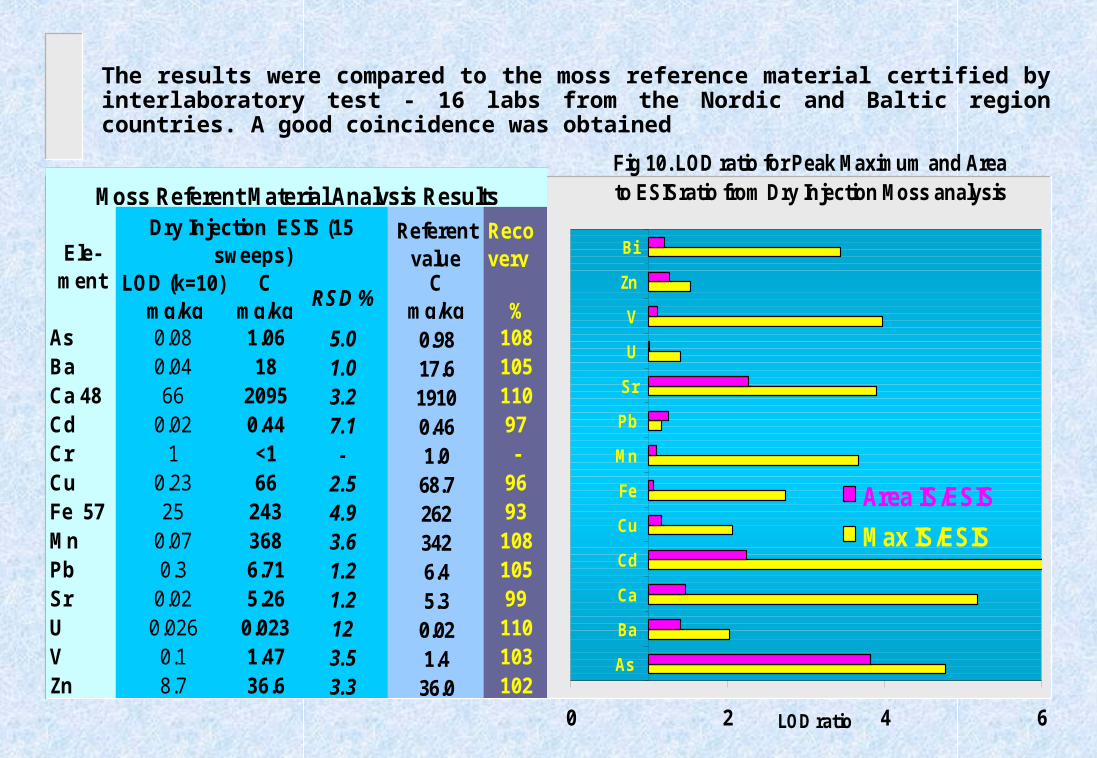
The results were compared to the moss reference material certified by interlaboratory test - 16 labs from the Nordic and Baltic region countries. A good coincidence was obtained
Referent value
Recovery
LOD (k=10) mg/kg
C mg/kg
RSD %C
mg/kg %As 0.08 1.06 5.0 0.98 108Ba 0.04 18 1.0 17.6 105Ca 48 66 2095 3.2 1910 110Cd 0.02 0.44 7.1 0.46 97Cr 1 <1 - 1.0 -Cu 0.23 66 2.5 68.7 96Fe 57 25 243 4.9 262 93Mn 0.07 368 3.6 342 108Pb 0.3 6.71 1.2 6.4 105Sr 0.02 5.26 1.2 5.3 99U 0.026 0.023 12 0.02 110V 0.1 1.47 3.5 1.4 103Zn 8.7 36.6 3.3 36.0 102
Ele-ment
Dry Injection ESIS (15 sweeps)
Moss Referent Material Analysis ResultsFig 10. LOD ratio for Peak Maximum and Area to ESISratio from Dry Injection Moss analysis
0 2 4 6
As
Ba
Ca
Cd
Cu
Fe
Mn
Pb
Sr
U
V
Zn
Bi
LOD ratio
Area IS/ESIS
Max IS/ESIS

ConclusionsConclusions ESISratio algorithm for transient signals generated by 3 injection systems coupled to ICP-MS Perkin Elmer Sciex ELAN 500 was tested.
• Flow InjectionFlow Injection was tested by both continuous and pulse IS introduction.ESISratio with continuous IS converts the transient peak signal / time into ratio / time. The converted peak has better profile and lower noise due to the dynamic matrix effect correction for every scan sweep. The ESISratio peak could be estimated as common area or maximum. ESISratio with pulse IS shows a zone of stable ratio corresponding of FWHM.For most of the elements tested signal/noise ratio decrease in the order Peak Maximum > Peak Area > ESIS pulse > ESIS continuous. The best results for FI -ICP-MS analysis of Vodka were obtained by continuous IS introduction and calculation of converted Peak Area.
•ASDI-ICP-MS ASDI-ICP-MS was tested introducing sea water. The ESISratio stability zone was determined to be in the signal plateau. The repeatability improvement up to 2 times in comparison with Peak Maximum was achieved.The ESISratio algorithm was effective in strong matrix suppression correction. The obtained change of the ESISratio Pb/Rh was in the range 105-93% for NaCl 0.1-3%

•Dry Injection -ICP-MSDry Injection -ICP-MS was applied for Moss sample analysis. The registered transient signals were burdened with strong pulsation generated by peristaltic pump. The ESISratio algorithm allowed to reduce significantly the periodic noise improving the figures of merit. The ESISratio stability zone selection for Dry injection was found to be the most critical in comparison to other introduction systems studied. For 0,18 ml injection and 9 isotopes at 60ms dwell time it was found that the ESISratio stability zone is ~70% of the signal plateau region which corresponds to 15 sweeps.
The obtained recovery of analytical results for Moss RM were in the range 93-110%. The ESIS application improves LOD in comparison with conventional transient signal peak maximum and area IS by averaged factors up to 6 and 3 respectively.
Acknowledgements:Acknowledgements:the authors would like to express their special thanks to:the authors would like to express their special thanks to:
• German Chemical Society, EWCoPS Organazing Committee and TEAM Ltd Bulgaria
for thegrant in conference participation and finacial support given to Veselin Kmetov
• Prof. L. Yurukova from the Institute of Botany at BG Academy of Science for Moss RM supplied
REFERENCESREFERENCES
1. Stefanova V., Kmetov V., Futekov L., JAAS, 12, 1271, (1997)
2. Houk, R.S., Thompson, J.J., Biomed.Mass.Spectrom., 10, 107 (1983)
3. Beauchemin D., Analyst,118, 815 (1993)
4. McClenathan D. M., Ray S. J., Hieftje G. M., JAAS, 16, 987 (2001)
5. Denoyer E.R., Atom. Spec, 15, 1, 7 (1994)
6. Dressler V.L., Pozebon D., Curtius A.J., Anal.Chim.Acta, 379, 1-2, 175 (1998)
7. Stefanova V., Kmetov V., Futekov L., Georgieva D., Analytical Laboratory, 6, 1, 43 (1997)
8.Benkhedda K., Infante H.G., Ivanova E., Adams F.C., JAAS, 15, 10, 1349 (2000)
9.Vanhaecke F., Vavhoe H., Dams R., Vandecasteele C., Talanta, 39, 7, 737 (1992)
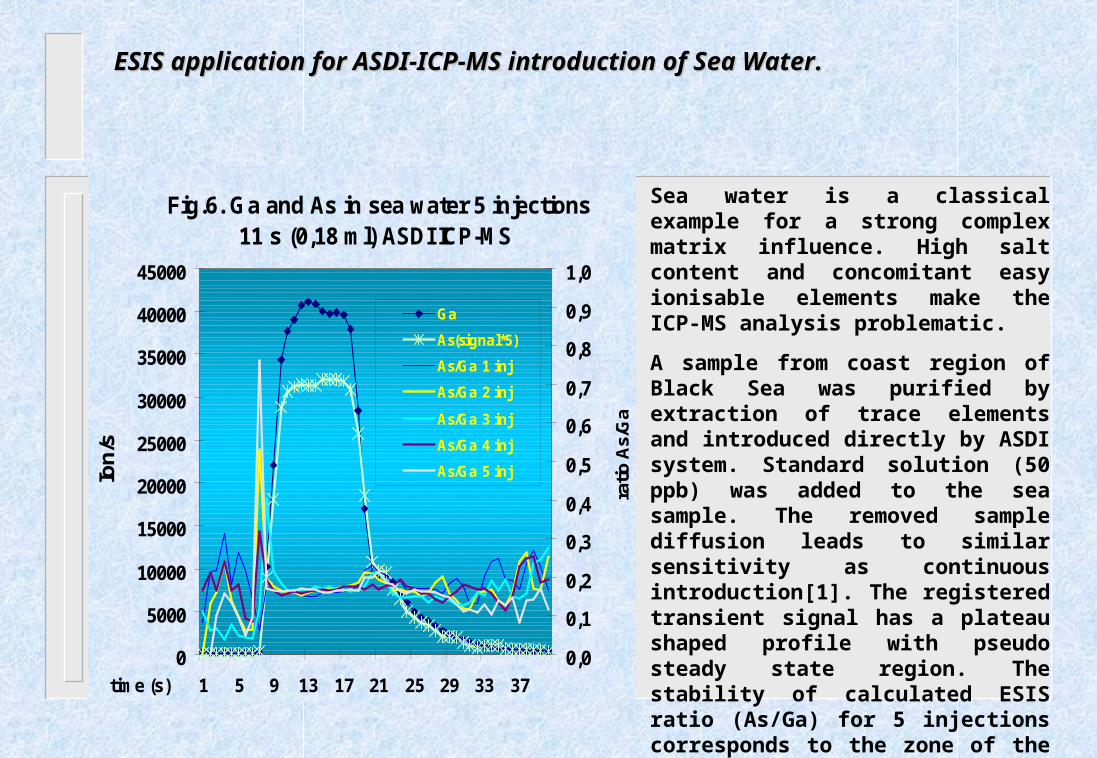
Fig.6. Ga and As in sea water 5 injections 11 s (0,18 ml) ASDI ICP-MS
0
5000
10000
15000
20000
25000
30000
35000
40000
45000
1 5 9 13 17 21 25 29 33 37time (s)
Ion
/s
0,0
0,1
0,2
0,3
0,4
0,5
0,6
0,7
0,8
0,9
1,0
ratio
As/
Ga
Ga
As(signal*5)
As/Ga 1 inj
As/Ga 2 inj
As/Ga 3 inj
As/Ga 4 inj
As/Ga 5 inj
ESIS application for ASDI-ICP-MS introduction of Sea WaterESIS application for ASDI-ICP-MS introduction of Sea Water..
Sea water is a classical example for a strong complex matrix influence. High salt content and concomitant easy ionisable elements make the ICP-MS analysis problematic.
A sample from coast region of Black Sea was purified by extraction of trace elements and introduced directly by ASDI system. Standard solution (50 ppb) was added to the sea sample. The removed sample diffusion leads to similar sensitivity as continuous introduction[1]. The registered transient signal has a plateau shaped profile with pseudo steady state region. The stability of calculated ESIS ratio (As/Ga) for 5 injections corresponds to the zone of the signal plateau Fig.6.
Related Documents