Algeria: Inward and Outward FDI 39.5 Population (million) 2,381,741 Area (Km2) 998 Coastline (Km) Petroleum, natural gas, iron ore, phosphate, uranium, lead Natural resources I – Inward Investments In 2014, Algeria succeeded in attracting FDIs worth 1488 million dollars according to UNCTAD estimations, which represent 3.4% of the Arab total for the same year. FDI balances incoming to Algeria amounted to some 26.8 billion dollars by the end of 2014, which represent 3.6% of the Arab total for the same period. As for Algeria's activity in terms of new FDIs (greenfield), the FDI Markets database published by the Financial Times for the period from January 2003 to May 2015 shows the following: • 375 FDI projects are being implemented in Algeria by 306 Arab and foreign companies. It is estimated that the total investment cost of these projects, which employ roughly 93,000 workers is about $ 68 billion. • UAE, Spain, France, Vietnam, Switzerland, Egypt, UK, USA, China and Luxembourg respectively were on the list of the most important countries investing in Algeria, in terms of investment cost of the projects. The share of UAE, Spain and France accounted for around 43% of the total. • Arab and foreign investments incoming to Algeria are concentrated in the coal, oil and gas sector with a percentage of 28.1%, while 21.1% are in the minerals sector and 19.6% in the real estate sector. • Emirates International Investment Company LLC came on top of the list of the 10 most important companies investing in Algeria where it implements a huge project with an investment cost estimated at around 5 billion dollars. II – Outward Investments The UNCTAD did not detect any outward investment flows from Algeria in 2014. Outward FDI balances from Algeria amounted to some 1.7 billion dollars by the end of 2014, which represent 0.2% of the Arab total for the same period. As for Algeria's investment activity abroad according to the FDI Markets database for the period from January 2003 to May 2015, it was as follows: • The number of Algerian FDI projects abroad amounted to 15 projects that are being implemented by Algerian companies. Estimations reveal that the overall investment cost of those projects, which employ some 3 thousand workers, is close to 1.7 billion dollars. • Yemen, Côte d'Ivoire, Dominican Republic, Tunisia, Spain, Iraq, USA, Sri Lanka and Italy respectively were on the list of the most important countries receiving Algerian investments, in terms of investment cost of the projects. The share of Yemen, Côte d'Ivoire and Dominican Republic accounted for around 75% of the total. • Sonatrach oil company came on top of list of the most important Algerian companies investing abroad, as it is implementing 6 projects with an investment cost estimated at 1.2 billion dollars approximately.

Welcome message from author
This document is posted to help you gain knowledge. Please leave a comment to let me know what you think about it! Share it to your friends and learn new things together.
Transcript

Algeria: Inward and Outward FDI
39.5 Population (million)
2,381,741 Area (Km2)
998 Coastline (Km)
Petroleum, natural gas,
iron ore, phosphate,
uranium, lead Natural resources
I – Inward Investments In 2014, Algeria succeeded in attracting FDIs worth 1488 million dollars according to UNCTAD estimations, which represent 3.4% of the Arab total for the same year. FDI balances incoming to Algeria amounted to some 26.8 billion dollars by the end of 2014, which represent 3.6% of the Arab total for the same period. As for Algeria's activity in terms of new FDIs (greenfield), the FDI Markets database published by the Financial Times for the period from January 2003 to May 2015 shows the following: • 375 FDI projects are being implemented in Algeria by 306 Arab and foreign companies. It is estimated that the total investment cost of these projects, which employ roughly 93,000 workers is about $ 68 billion. • UAE, Spain, France, Vietnam, Switzerland, Egypt, UK, USA, China and Luxembourg respectively were on the list of the most important countries investing in Algeria, in terms of investment cost of the projects. The share of UAE, Spain and France accounted for around 43% of the total. • Arab and foreign investments incoming to Algeria are concentrated in the coal, oil and gas sector with a percentage of 28.1%, while 21.1% are in the minerals sector and 19.6% in the real estate sector. • Emirates International Investment Company LLC came on top of the list of the 10 most important companies investing in Algeria where it implements a huge project with an investment cost estimated at around 5 billion dollars.
II – Outward Investments The UNCTAD did not detect any outward investment flows from Algeria in 2014. Outward FDI balances from Algeria amounted to some 1.7 billion dollars by the end of 2014, which represent 0.2% of the Arab total for the same period. As for Algeria's investment activity abroad according to the FDI Markets database for the period from January 2003 to May 2015, it was as follows: • The number of Algerian FDI projects abroad amounted to 15 projects that are being implemented by Algerian companies. Estimations reveal that the overall investment cost of those projects, which employ some 3 thousand workers, is close to 1.7 billion dollars. • Yemen, Côte d'Ivoire, Dominican Republic, Tunisia, Spain, Iraq, USA, Sri Lanka and Italy respectively were on the list of the most important countries receiving Algerian investments, in terms of investment cost of the projects. The share of Yemen, Côte d'Ivoire and Dominican Republic accounted for around 75% of the total. • Sonatrach oil company came on top of list of the most important Algerian companies investing abroad, as it is implementing 6 projects with an investment cost estimated at 1.2 billion dollars approximately.

Algeria: FDI Greenfield Projects
Source: Tables and Figures in this page: FDI Intelligence from The Financial Times
Rank Company Projects Jobs CreatedCost
(Million $)
1 Emirates International Investment Company
1 3,000 5,000
2 Vietnam Oil and Gas Corporation (PetroVietnam)
2 1,999 4,743
3 Repsol SA 2 839 3,565
4 Jelmoli Holding AG 5 4,500 3,539
5 Total Co. 3 961 3,465
6 Orascom Group 6 3,541 2,814
7 ArcelorMittal 3 4,349 2,447
8 British Petroleum (BP) 3 485 2,384
9 Grupo Ortiz Construccion y Servicios Del Mediterraneo
4 2,434 2,049
10 China National Petroleum (CNPC) 2 291 1,991
Other Companies 344 70,754 36,043
375 93,153 68,040Total
Top 10 companies investing in Algeria between January 2003 and May 2015
Rank Sector Companies ProjectsJobs
CreatedCost
(Million $)%
of Total
1 Coal, Oil and Natural Gas 22 28 6,489 19,130 282 Metals 17 21 16,486 14,371 213 Real Estate 14 19 14,199 13,343 204 Chemicals 12 14 3,863 7,294 115 Hotels & Tourism 8 12 5,826 2,678 46 Building & Construction Materials 9 14 3,726 2,238 37 Business Services 39 39 1,814 1,599 28 Automotive OEM 20 28 14,728 1,252 29 Textiles 9 9 3,678 997 110 Warehousing & Storage 2 3 1,786 858 1
Others 159 188 20,558 4,282 6
306 375 93,153 68,040 Total
Inward investment in Algeria by the sectoral distribution between January 2003 and May 2015
Inward investment in Algeria by the sectoral distribution between January 2003 and May 2015
Coal, Oil and Natural Gas
28.1%
Metals21.1%
Real Estate19.6%
Chemicals10.7%
Hotels & Tourism3.9%
Building & Construction
Materials3.3%
Business Services2.3%
Automotive OEM1.8%
Textiles1.5%
Warehousing & Storage
1.3%Others6.3%
RankExporting Countries
No. Companies
No. Projects
No. Jobs
Cost (Million $)
1 Emirates 25 26 11,561 15,2802 Spain 20 24 6,702 7,8603 France 62 81 10,011 5,9504 Vietnam 2 2 1,999 4,7435 Switzerland 7 12 5,874 4,5386 Egypt 9 11 7,350 4,1787 UK 18 24 2,033 3,7388 US 31 34 3,210 3,3039 China 12 12 9,566 2,658
10 Luxembourg 1 3 4,349 2,44711 Qatar 2 2 3,089 2,15012 Turkey 5 5 4,628 1,94113 Russia 3 4 580 1,34614 Tunisia 17 22 2,018 1,13215 Saudi Arabia 8 13 3,464 93316 Germany 14 17 4,922 66917 Canada 7 7 597 64518 Ireland 4 4 354 47819 Singapore 1 1 425 46820 Bermuda 1 1 214 44321 Brazil 1 1 214 44322 Bahamas 1 1 214 44323 South Africa 1 1 638 35024 Libya 1 1 819 32125 Australia 1 1 1,012 27026 South Korea 7 10 2,651 23427 Italia 6 6 815 21928 Myanmar (Burma) 1 1 342 16029 Iran 4 4 1,268 15230 Morocco 6 7 437 129
Others 28 37 1,797 422306 375 93,153 68,040
Inward investment in Algeria between January 2003 and May 2015
Total
Rank Hosting Countries Companies ProjectsJobs
CreatedCost
(Million $)
1 Yemen 1 1 214 8502 Côte d'Ivoire 1 1 1,147 2003 dominican republic 1 1 36 2004 Tunisia 1 2 858 1175 Spain 2 2 209 866 Iraq 1 1 270 457 United States 1 1 106 358 Sri Lanka 1 1 64 359 Italia 1 1 6 31
10 UK 1 1 91 2211 France 1 1 24 2212 Nigeria 1 2 36 22
15 3,061 1,665
Algeria Outwards' Investmentbetween January 2003 and May 2015
Total
Rank Company ProjectsJobs
CreatedCost
(Million $)
1 Sonatrach 6 440 1,196
2 Cevital 6 2,521 412
3 Union Bank 3 100 57
15 3,061 1,665
Top important Algerian companies investing abroad between January 2003 and May 2015
Total
Top countries investing in Algeria between January 2003 and May 2015
Emirates22.5%
Spain11.6%
France8.7%
Vietnam7.0%
Switzerland6.7% Egypt
6.1%UK
5.5%
US4.9%
China3.9%
Luxembourg3.6%
Others19.6%
Top countries receiving investment from Algeria between January 2003 and May 2015
to whom51.1%
Côte d'Ivoire12.0%
dominican republic12.0% Tunisia
7.0%
Spain5.1% Iraq
2.7%
US2.1%
Sri Lanka2.1%
Italia1.8%
UK1.3%
Others2.7%
125
Source of Tables and Figures in this page: International Trade Center
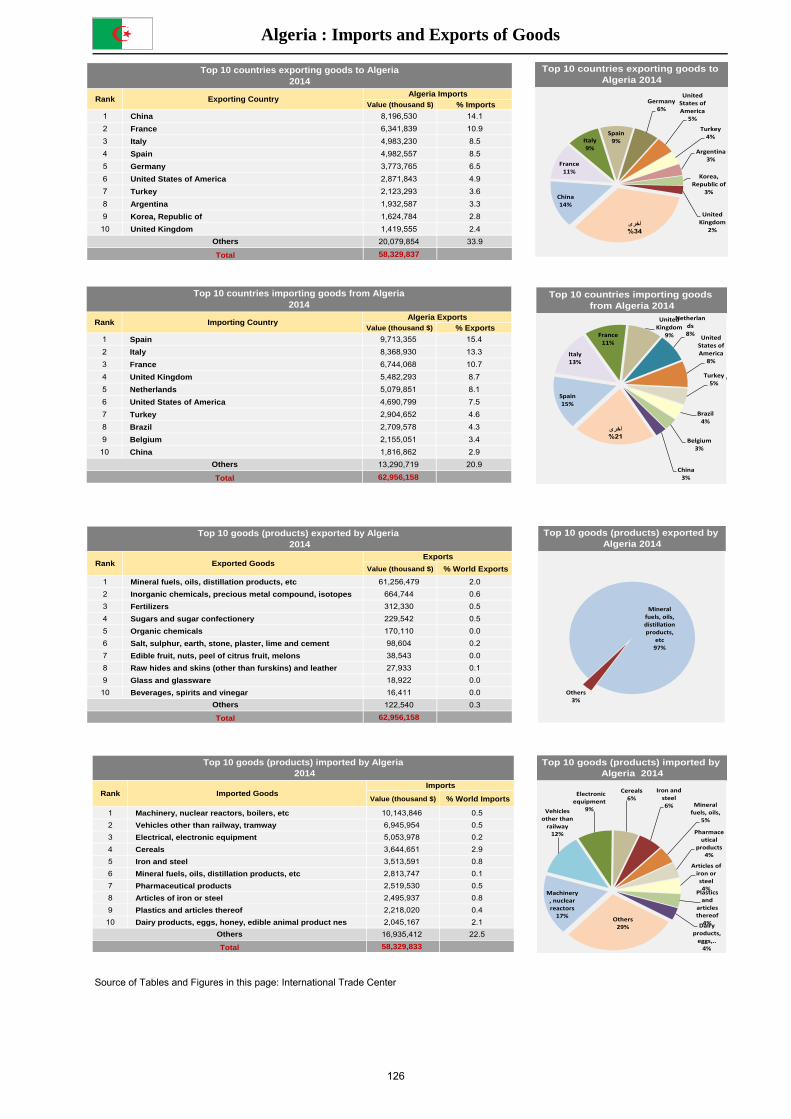
Algeria : Imports and Exports of Goods
United States of America
Top 10 countries exporting goods to Algeria 2014
China14%
France11%
Italy9%
Spain9%
Germany6%
United States of America
5%
Turkey4%
Argentina3%
Korea, Republic of
3%
United Kingdom
2%
United States of America
Top 10 countries importing goods from Algeria 2014
Spain15%
Italy13%
France11%
United Kingdom
9%
Netherlands8%
United States of America
8%
Turkey5%
Brazil4%
Belgium3%
China3%
Top 10 goods (products) exported by Algeria 2014
Mineral fuels, oils, distillation products,
etc97%
Others3%
Top 10 goods (products) imported by Algeria 2014
Machinery, nuclear reactors
17%
Vehicles other than
railway 12%
Electronic equipment
9%
Cereals6%
Iron and steel6% Mineral
fuels, oils, 5%
Pharmaceutical
products4%
Articles of iron or steel4%
Plastics and
articles thereof
4%Dairy products,
eggs,..4%
Others29%
Value (thousand $) % World Exports
1 Mineral fuels, oils, distillation products, etc 61,256,479 2.02 Inorganic chemicals, precious metal compound, isotopes 664,744 0.63 Fertilizers 312,330 0.54 Sugars and sugar confectionery 229,542 0.55 Organic chemicals 170,110 0.06 Salt, sulphur, earth, stone, plaster, lime and cement 98,604 0.27 Edible fruit, nuts, peel of citrus fruit, melons 38,543 0.08 Raw hides and skins (other than furskins) and leather 27,933 0.19 Glass and glassware 18,922 0.0
10 Beverages, spirits and vinegar 16,411 0.0122,540 0.3
62,956,158Total
Top 10 goods (products) exported by Algeria 2014
Rank Exported GoodsExports
Others
Value (thousand $) % World Imports
1 Machinery, nuclear reactors, boilers, etc 10,143,846 0.52 Vehicles other than railway, tramway 6,945,954 0.53 Electrical, electronic equipment 5,053,978 0.24 Cereals 3,644,651 2.95 Iron and steel 3,513,591 0.86 Mineral fuels, oils, distillation products, etc 2,813,747 0.17 Pharmaceutical products 2,519,530 0.58 Articles of iron or steel 2,495,937 0.89 Plastics and articles thereof 2,218,020 0.4
10 Dairy products, eggs, honey, edible animal product nes 2,045,167 2.116,935,412 22.558,329,833Total
Top 10 goods (products) imported by Algeria 2014
Rank Imported GoodsImports
Others
Value (thousand $) % Imports1 China 8,196,530 14.12 France 6,341,839 10.93 Italy 4,983,230 8.54 Spain 4,982,557 8.55 Germany 3,773,765 6.56 United States of America 2,871,843 4.97 Turkey 2,123,293 3.68 Argentina 1,932,587 3.39 Korea, Republic of 1,624,784 2.8
10 United Kingdom 1,419,555 2.420,079,854 33.958,329,837
Others
Total
Rank Exporting CountryAlgeria Imports
Top 10 countries exporting goods to Algeria2014
Value (thousand $) % Exports1 Spain 9,713,355 15.42 Italy 8,368,930 13.33 France 6,744,068 10.74 United Kingdom 5,482,293 8.75 Netherlands 5,079,851 8.16 United States of America 4,690,799 7.57 Turkey 2,904,652 4.68 Brazil 2,709,578 4.39 Belgium 2,155,051 3.4
10 China 1,816,862 2.913,290,719 20.962,956,158Total
Top 10 countries importing goods from Algeria2014
Rank Importing CountryAlgeria Exports
Others
126
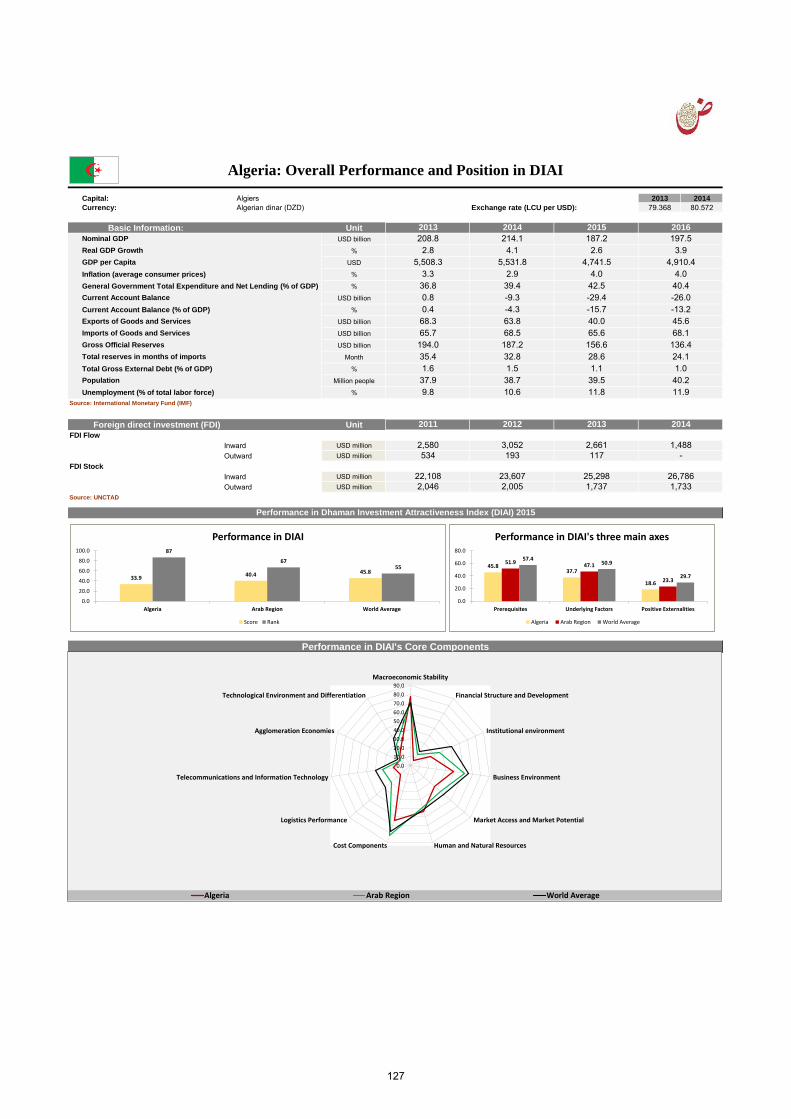
Capital: Algiers 2013 2014Currency: Algerian dinar (DZD) Exchange rate (LCU per USD): 79.368 80.572
Basic Information: UnitUSD billion
%
USD
%
%
USD billion
%
USD billion
USD billion
USD billion
Month
%
Million people
%
Foreign direct investment (FDI) UnitFDI Flow
Inward USD millionOutward USD million
FDI StockInward USD millionOutward USD million
Source: UNCTAD
Technological Environment and Differentiation
2,046 1,7331,737
193
23,6072,005
117
25,298
2014
1,488-
26,786
Algeria: Overall Performance and Position in DIAI
534
22,108
2013
2,661
2013208.82.8
5,508.33.3
2014214.14.1
5,531.82.9
36.80.80.4
11.8
39.4-9.3-4.3
-29.4-15.740.065.6
1.637.99.8
38.7
40.4-26.0-13.245.6
2015187.22.6
4,741.54.042.5
2016197.53.9
4,910.44.0
40.211.9
1.139.5
63.868.5187.232.81.5 1.0
Performance in Dhaman Investment Attractiveness Index (DIAI) 2015
Performance in DIAI's Core Components
68.365.7194.035.4
68.1136.424.1
156.628.6
2012
3,052
2011
2,580
10.6
Nominal GDP
Real GDP Growth
GDP per Capita
Inflation (average consumer prices)
General Government Total Expenditure and Net Lending (% of GDP)
Current Account Balance
Current Account Balance (% of GDP)
Exports of Goods and Services
Imports of Goods and Services
Gross Official Reserves
Total reserves in months of imports
Total Gross External Debt (% of GDP)
Population
Unemployment (% of total labor force)Source: International Monetary Fund (IMF)
45.8 37.7
18.6
51.9 47.1
23.3
57.4 50.9
29.7
0.0
20.0
40.0
60.0
80.0
Prerequisites Underlying Factors Positive Externalities
Performance in DIAI's three main axes
Algeria Arab Region World Average
0.0
10.0
20.0
30.0
40.0
50.0
60.0
70.0
80.0
90.0
Macroeconomic Stability
Financial Structure and Development
Institutional environment
Business Environment
Market Access and Market Potential
Human and Natural ResourcesCost Components
Logistics Performance
Telecommunications and Information Technology
Agglomeration Economies
Technological Environment and Differentiation
Algeria Arab Region World Average
33.9 40.4 45.8
87
67 55
0.0
20.0
40.0
60.0
80.0
100.0
Algeria Arab Region World Average
Performance in DIAI
Score Rank
127
Related Documents