Published by the non-profit Great Minds. Copyright © 2015 Great Minds. No part of this work may be reproduced, sold, or commercialized, in whole or in part, without written permission from Great Minds. Non-commercial use is licensed pursuant to a Creative Commons Attribution-NonCommercial-ShareAlike 4.0 license; for more information, go to http://greatminds.net/maps/math/copyright. “Great Minds” and “Eureka Math” are registered trademarks of Great Minds. Printed in the U.S.A. This book may be purchased from the publisher at eureka-math.org 10 9 8 7 6 5 4 3 2 1 Eureka Math ™ Algebra I, Module 5 Student File_A Contains copy-ready classwork and homework A Story of Functions ®

Welcome message from author
This document is posted to help you gain knowledge. Please leave a comment to let me know what you think about it! Share it to your friends and learn new things together.
Transcript
Published by the non-profit Great Minds.
Copyright © 2015 Great Minds. No part of this work may be reproduced, sold, or commercialized, in whole or in part, without written permission from Great Minds. Non-commercial use is licensed pursuant to a Creative Commons Attribution-NonCommercial-ShareAlike 4.0 license; for more information, go to http://greatminds.net/maps/math/copyright. “Great Minds” and “Eureka Math” are registered trademarks of Great Minds.
Printed in the U.S.A. This book may be purchased from the publisher at eureka-math.org 10 9 8 7 6 5 4 3 2 1
Eureka Math™
Algebra I, Module 5
Student File_AContains copy-ready classwork and homework
A Story of Functions®
M5 Lesson 1 ALGEBRA I
Lesson 1: Analyzing a Graph
Lesson 1: Analyzing a Graph
Classwork
Opening Exercise
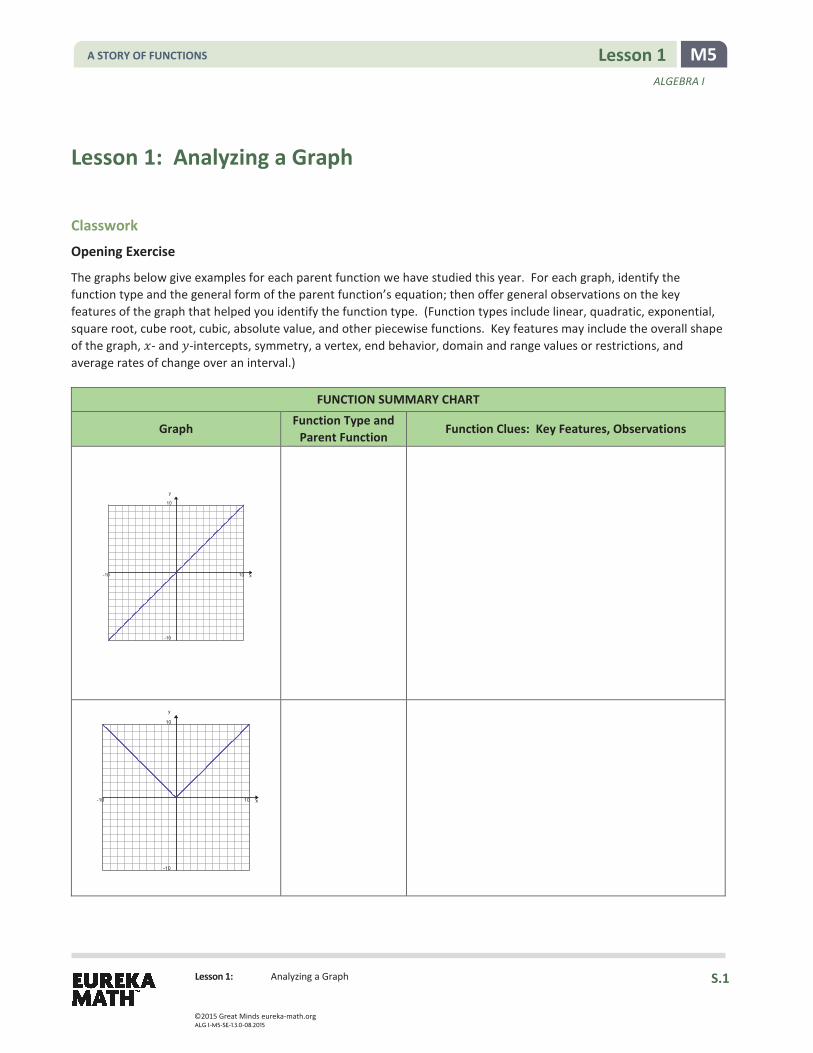
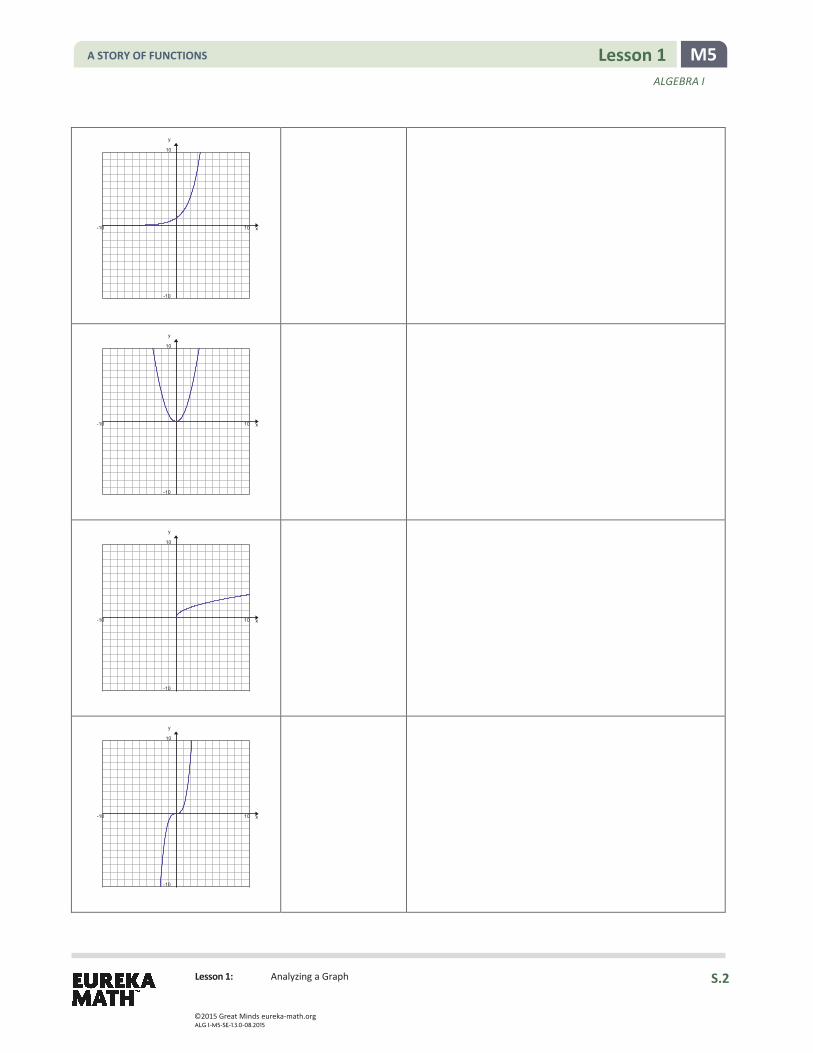
The graphs below give examples for each parent function we have studied this year. For each graph, identify the function type and the general form of the parent function’s equation; then offer general observations on the key features of the graph that helped you identify the function type. (Function types include linear, quadratic, exponential, square root, cube root, cubic, absolute value, and other piecewise functions. Key features may include the overall shape of the graph, 𝑥𝑥- and 𝑦𝑦-intercepts, symmetry, a vertex, end behavior, domain and range values or restrictions, and average rates of change over an interval.)
FUNCTION SUMMARY CHART
Graph Function Type and
Parent Function Function Clues: Key Features, Observations
-10 10
-10
10
x
y
-10 10
-10
10
x
y
A STORY OF FUNCTIONS
©20 15 G re at Min ds eureka-math.org ALG I-M5-SE-1.3.0-08.2015
S.1
M5 Lesson 1 ALGEBRA I
Lesson 1: Analyzing a Graph
-10 10
-10
10
x
y
-10 10
-10
10
x
y
-10 10
-10
10
x
y
-10 10
-10
10
x
y
A STORY OF FUNCTIONS
©20 15 G re at Min ds eureka-math.org ALG I-M5-SE-1.3.0-08.2015
S.2
M5 Lesson 1 ALGEBRA I
Lesson 1: Analyzing a Graph
Example 1
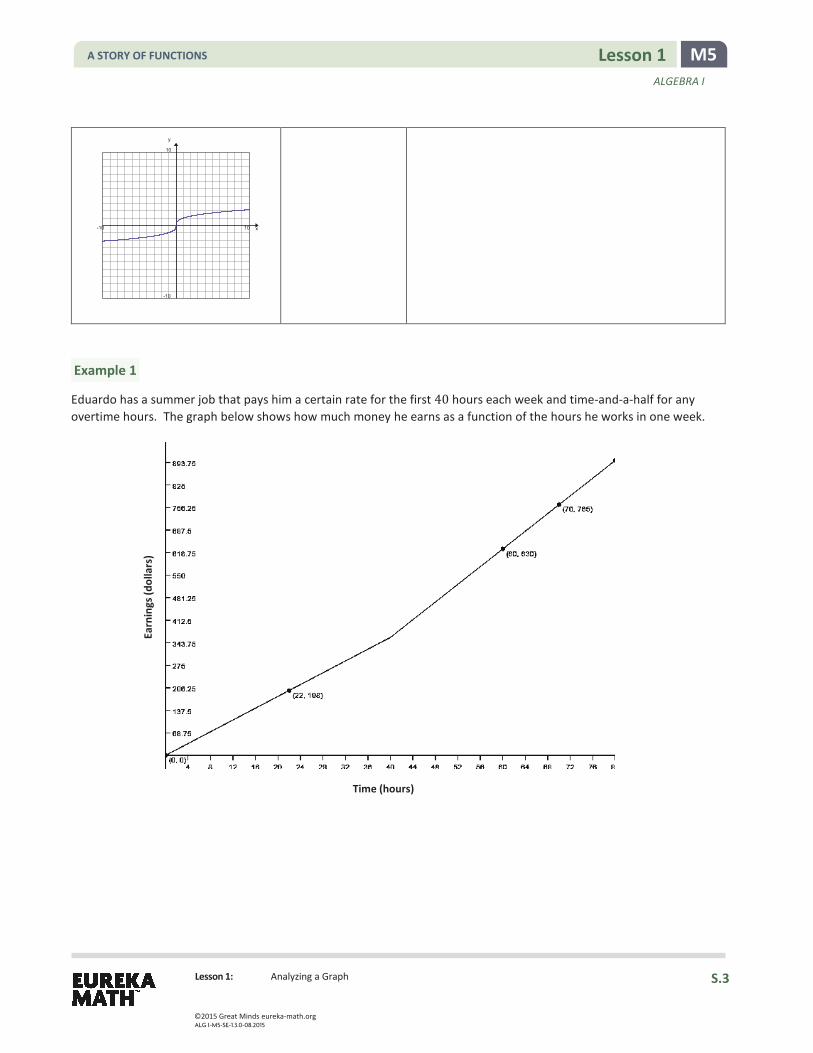
Eduardo has a summer job that pays him a certain rate for the first 40 hours each week and time-and-a-half for any overtime hours. The graph below shows how much money he earns as a function of the hours he works in one week.
-10 10
-10
10
x
y
Time (hours)
Earn
ings
(dol
lars
)
A STORY OF FUNCTIONS
©20 15 G re at Min ds eureka-math.org ALG I-M5-SE-1.3.0-08.2015
S.3

M5 Lesson 1 ALGEBRA I
Lesson 1: Analyzing a Graph
Exercises
1. Write the function in analytical (symbolic) form for the graph in Example 1. a. What is the equation for the first piece of the graph?
b. What is the equation for the second piece of the graph?
c. What are the domain restrictions for the context?
d. Explain the domain in the context of the problem.
For each graph below use the questions and identified ordered pairs to help you formulate an equation to represent it.
2. Function type:
Parent function:
Transformations:
Equation:
A STORY OF FUNCTIONS
©20 15 G re at Min ds eureka-math.org ALG I-M5-SE-1.3.0-08.2015
S.4
M5 Lesson 1 ALGEBRA I
Lesson 1: Analyzing a Graph
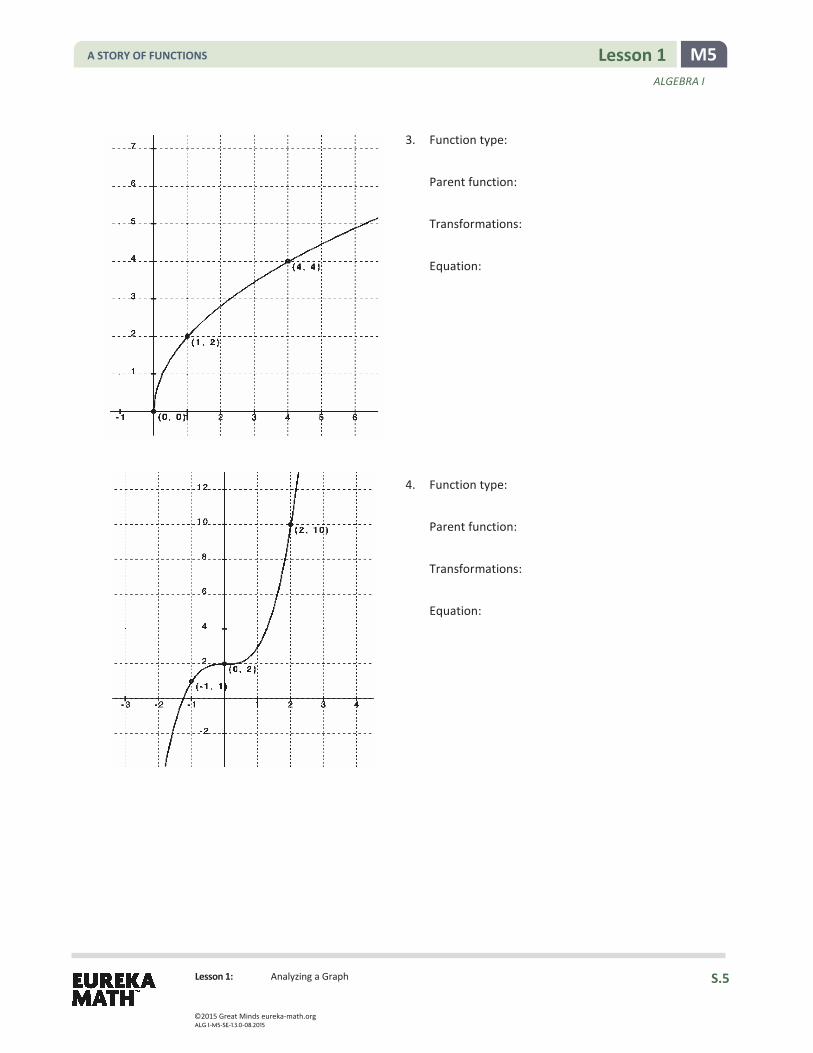
3. Function type:
Parent function:
Transformations:
Equation:
4. Function type:
Parent function:
Transformations:
Equation:
A STORY OF FUNCTIONS
©20 15 G re at Min ds eureka-math.org ALG I-M5-SE-1.3.0-08.2015
S.5
M5 Lesson 1 ALGEBRA I
Lesson 1: Analyzing a Graph
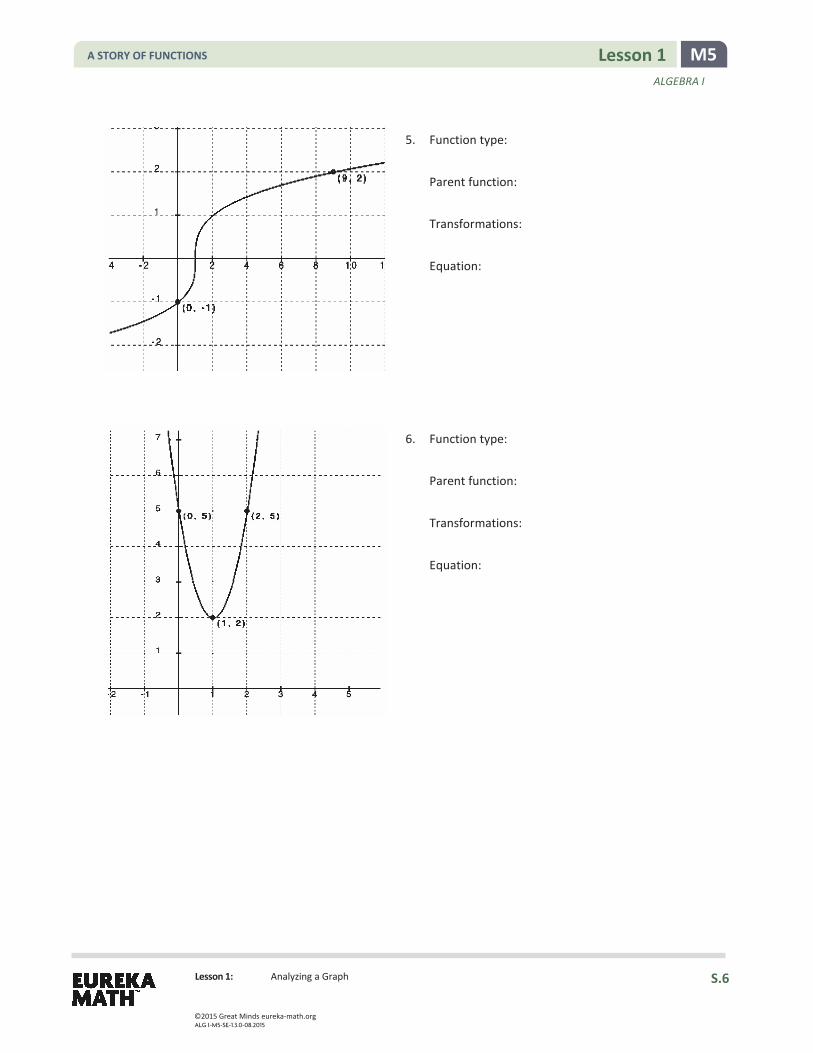
5. Function type:
Parent function:
Transformations:
Equation:
6. Function type:
Parent function:
Transformations:
Equation:
A STORY OF FUNCTIONS
©20 15 G re at Min ds eureka-math.org ALG I-M5-SE-1.3.0-08.2015
S.6
M5 Lesson 1 ALGEBRA I
Lesson 1: Analyzing a Graph
Time (seconds)
Dist
ance
from
star
ting
line
(feet
)
(0, 0) (12, 0)
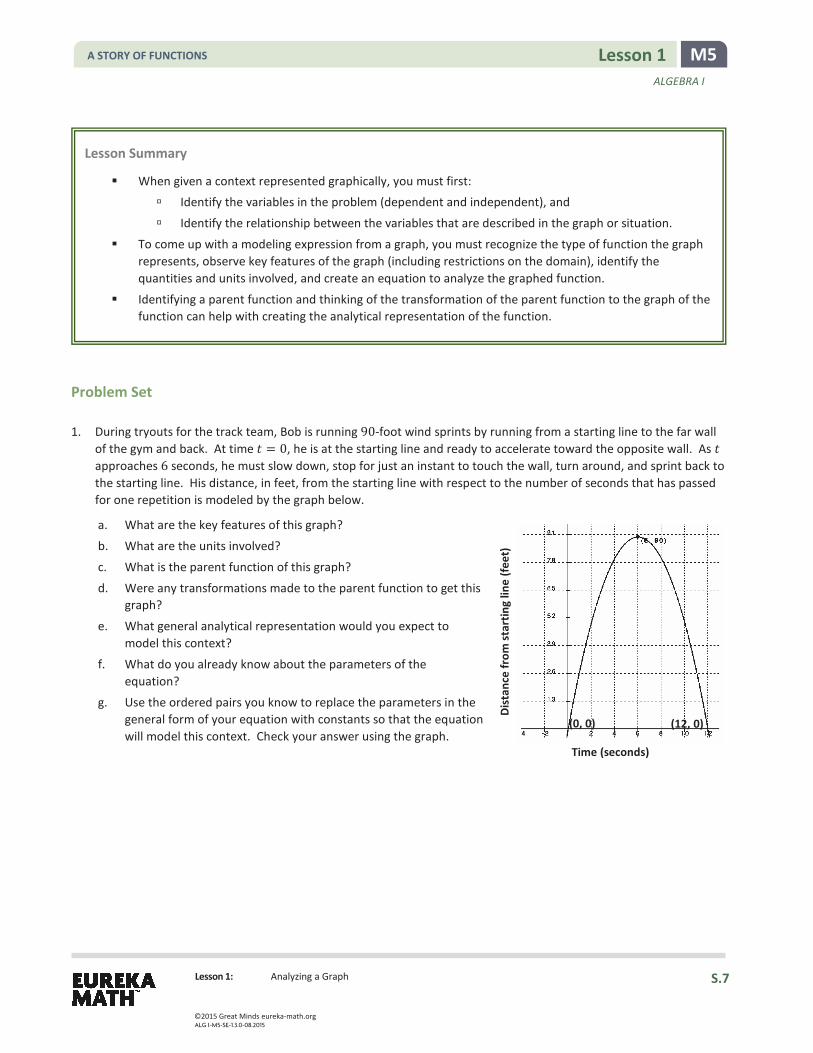
Problem Set 1. During tryouts for the track team, Bob is running 90-foot wind sprints by running from a starting line to the far wall
of the gym and back. At time 𝑡𝑡 = 0, he is at the starting line and ready to accelerate toward the opposite wall. As 𝑡𝑡 approaches 6 seconds, he must slow down, stop for just an instant to touch the wall, turn around, and sprint back to the starting line. His distance, in feet, from the starting line with respect to the number of seconds that has passed for one repetition is modeled by the graph below.
a. What are the key features of this graph?
b. What are the units involved?
c. What is the parent function of this graph?
d. Were any transformations made to the parent function to get this graph?
e. What general analytical representation would you expect to model this context?
f. What do you already know about the parameters of the equation?
g. Use the ordered pairs you know to replace the parameters in the general form of your equation with constants so that the equation will model this context. Check your answer using the graph.
Lesson Summary
When given a context represented graphically, you must first: Identify the variables in the problem (dependent and independent), and
Identify the relationship between the variables that are described in the graph or situation.
To come up with a modeling expression from a graph, you must recognize the type of function the graph represents, observe key features of the graph (including restrictions on the domain), identify the quantities and units involved, and create an equation to analyze the graphed function.
Identifying a parent function and thinking of the transformation of the parent function to the graph of the function can help with creating the analytical representation of the function.
A STORY OF FUNCTIONS
©20 15 G re at Min ds eureka-math.org ALG I-M5-SE-1.3.0-08.2015
S.7

M5 Lesson 1 ALGEBRA I
Lesson 1: Analyzing a Graph
2. Spencer and McKenna are on a long-distance bicycle ride. Spencer leaves one hour before McKenna. The graph below shows each rider’s distance in miles from his or her house as a function of time since McKenna left on her bicycle to catch up with Spencer. (Note: Parts (e), (f), and (g) are challenge problems.)
a. Which function represents Spencer’s distance? Which function represents McKenna’s distance? Explain your reasoning.
b. Estimate when McKenna catches up to Spencer. How far have they traveled at that point in time?
c. One rider is speeding up as time passes and the other one is slowing down. Which one is which, and how can you tell from the graphs?
d. According to the graphs, what type of function would best model each rider’s distance?
e. Create a function to model each rider’s distance as a function of the time since McKenna started riding her bicycle. Use the data points labeled on the graph to create a precise model for each rider’s distance.
f. What is the meaning of the 𝑥𝑥- and 𝑦𝑦-intercepts of each rider in the context of this problem?
g. Estimate which rider is traveling faster 30 minutes after McKenna started riding. Show work to support your answer.
A STORY OF FUNCTIONS
©20 15 G re at Min ds eureka-math.org ALG I-M5-SE-1.3.0-08.2015
S.8
Lesson 2: Analyzing a Data Set
M5 Lesson 2 ALGEBRA I
Lesson 2: Analyzing a Data Set
Classwork
Opening Exercise
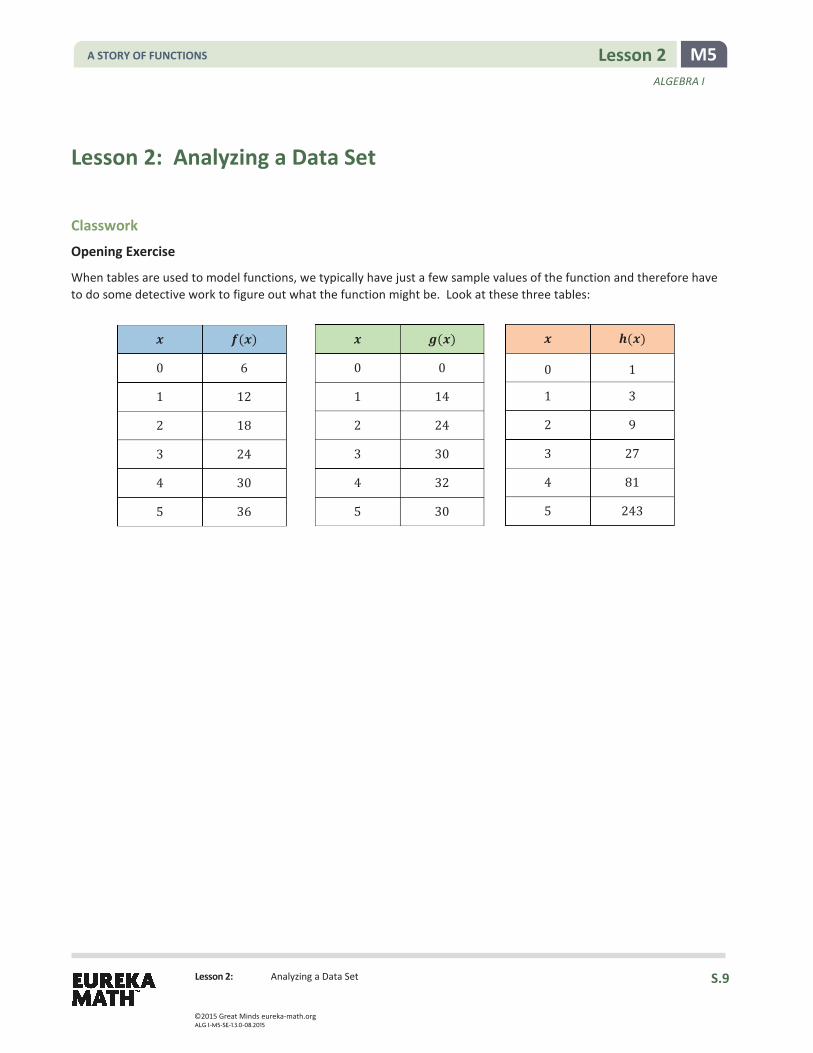
When tables are used to model functions, we typically have just a few sample values of the function and therefore have to do some detective work to figure out what the function might be. Look at these three tables:
𝒙𝒙 𝒇𝒇(𝒙𝒙)
0 6
1 12
2 18
3 24
4 30
5 36
𝒙𝒙 𝒈𝒈(𝒙𝒙)
0 0
1 14
2 24
3 30
4 32
5 30
𝒙𝒙 𝒉𝒉(𝒙𝒙)
0 1
1 3
2 9
3 27
4 81
5 243
A STORY OF FUNCTIONS
©20 15 G re at Min ds eureka-math.org ALG I-M5-SE-1.3.0-08.2015
S.9

Lesson 2: Analyzing a Data Set
M5 Lesson 2 ALGEBRA I
Example 1
Noam and Athena had an argument about whether it would take longer to get from NYC to Boston and back by car or by train. To settle their differences, they made separate, nonstop round trips from NYC to Boston. On the trip, at the end of each hour, both recorded the number of miles they had traveled from their starting points in NYC. The tables below show their travel times, in hours, and the distances from their starting points, in miles. The first table shows Noam’s travel time and distance from the starting point, and the second represents Athena’s. Use both data sets to justify your answers to the questions below.
Time in Hours Noam’s Distance Time in Hours Athena’s Distance
0 0 0 0 1 55 1 81 2 110 2 144 3 165 3 189 4 220 4 216 5 165 5 225 6 110 6 216 7 55 7 189 8 0 8 144 9 81 10 0
a. Who do you think is driving, and who is riding the train? Explain your answer in the context of the problem.
b. According to the data, how far apart are Boston and New York City? Explain mathematically.
A STORY OF FUNCTIONS
©20 15 G re at Min ds eureka-math.org ALG I-M5-SE-1.3.0-08.2015
S.10
Lesson 2: Analyzing a Data Set
M5 Lesson 2 ALGEBRA I
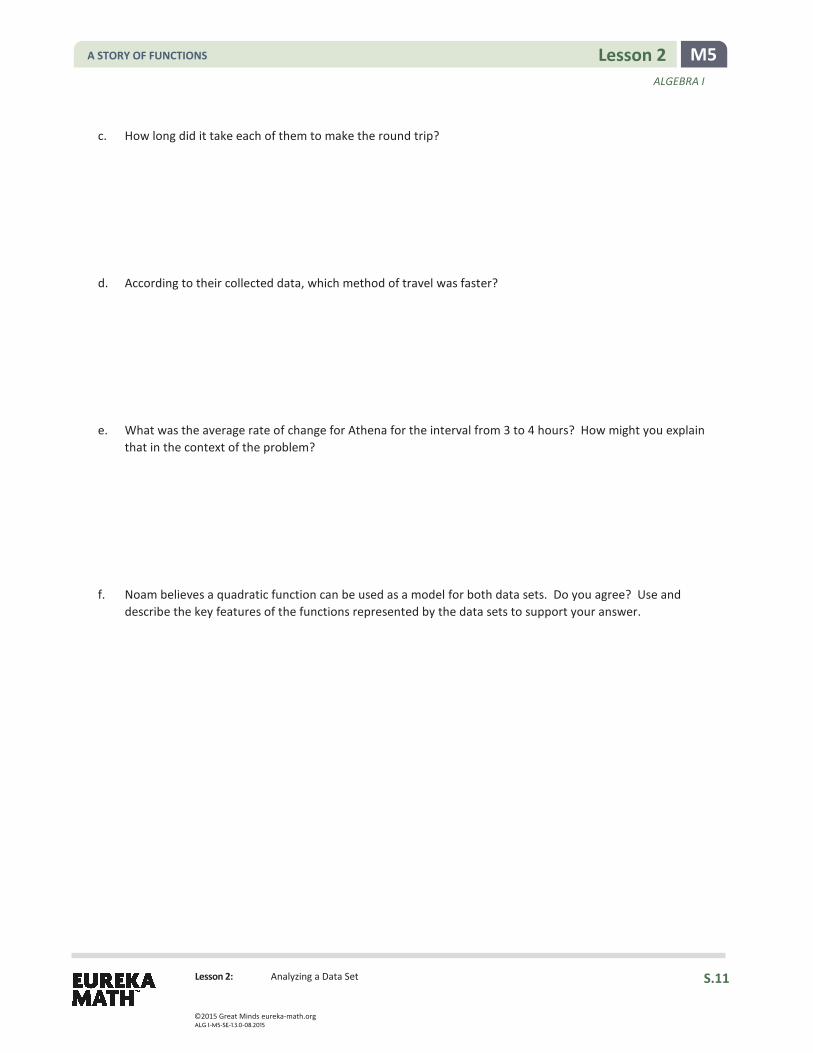
c. How long did it take each of them to make the round trip?
d. According to their collected data, which method of travel was faster?
e. What was the average rate of change for Athena for the interval from 3 to 4 hours? How might you explain
that in the context of the problem?
f. Noam believes a quadratic function can be used as a model for both data sets. Do you agree? Use and describe the key features of the functions represented by the data sets to support your answer.
A STORY OF FUNCTIONS
©20 15 G re at Min ds eureka-math.org ALG I-M5-SE-1.3.0-08.2015
S.11
Lesson 2: Analyzing a Data Set
M5 Lesson 2 ALGEBRA I
Exercises
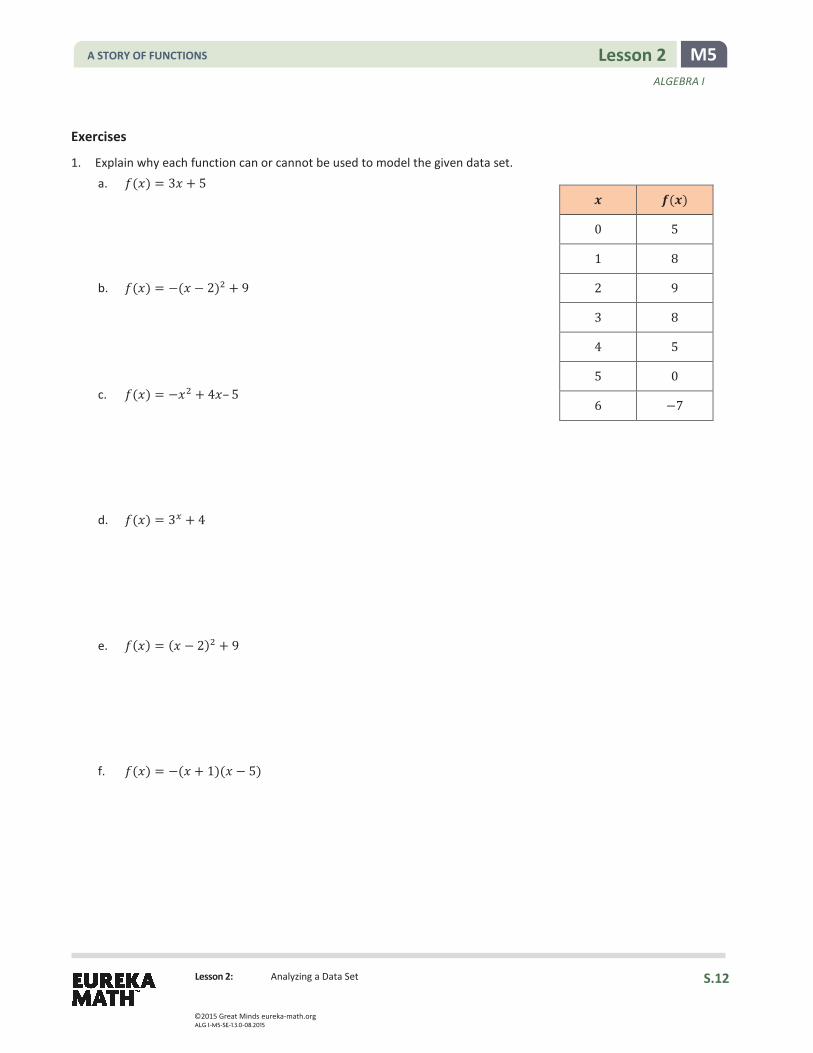
1. Explain why each function can or cannot be used to model the given data set. a. 𝑓𝑓(𝑥𝑥) = 3𝑥𝑥 + 5
b. 𝑓𝑓(𝑥𝑥) = −(𝑥𝑥 − 2)2 + 9
c. 𝑓𝑓(𝑥𝑥) = −𝑥𝑥2 + 4𝑥𝑥– 5
d. 𝑓𝑓(𝑥𝑥) = 3𝑥𝑥 + 4
e. 𝑓𝑓(𝑥𝑥) = (𝑥𝑥 − 2)2 + 9
f. 𝑓𝑓(𝑥𝑥) = −(𝑥𝑥 + 1)(𝑥𝑥 − 5)
𝒙𝒙 𝒇𝒇(𝒙𝒙)
0 5
1 8
2 9
3 8
4 5
5 0
6 −7
A STORY OF FUNCTIONS
©20 15 G re at Min ds eureka-math.org ALG I-M5-SE-1.3.0-08.2015
S.12
Lesson 2: Analyzing a Data Set
M5 Lesson 2 ALGEBRA I
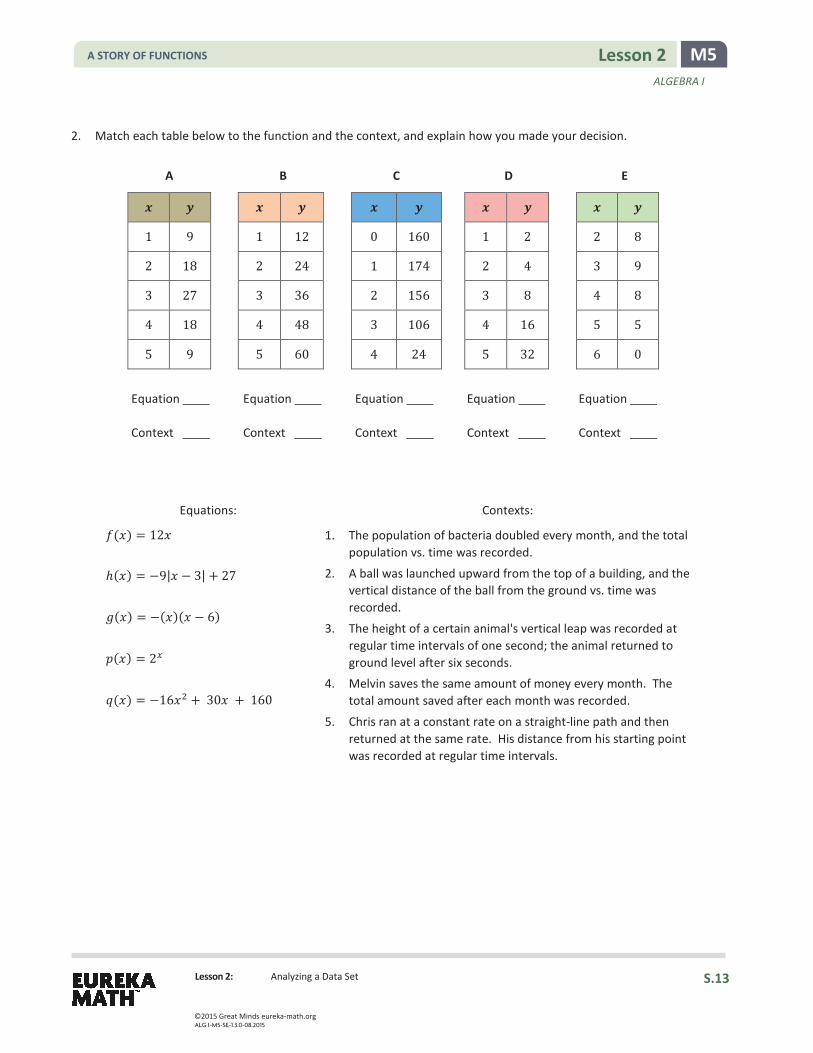
2. Match each table below to the function and the context, and explain how you made your decision.
Equations:
𝑓𝑓(𝑥𝑥) = 12𝑥𝑥
ℎ(𝑥𝑥) = −9|𝑥𝑥 − 3| + 27
𝑔𝑔(𝑥𝑥) = −(𝑥𝑥)(𝑥𝑥 − 6)
𝑝𝑝(𝑥𝑥) = 2𝑥𝑥
𝑞𝑞(𝑥𝑥) = −16𝑥𝑥2 + 30𝑥𝑥 + 160
Contexts:
1. The population of bacteria doubled every month, and the total population vs. time was recorded.
2. A ball was launched upward from the top of a building, and the vertical distance of the ball from the ground vs. time was recorded.
3. The height of a certain animal's vertical leap was recorded at regular time intervals of one second; the animal returned to ground level after six seconds.
4. Melvin saves the same amount of money every month. The total amount saved after each month was recorded.
5. Chris ran at a constant rate on a straight-line path and then returned at the same rate. His distance from his starting point was recorded at regular time intervals.
A
𝒙𝒙 𝒚𝒚
1 9
2 18
3 27
4 18
5 9
B
𝒙𝒙 𝒚𝒚
1 12
2 24
3 36
4 48
5 60
C
𝒙𝒙 𝒚𝒚
0 160
1 174
2 156
3 106
4 24
D
𝒙𝒙 𝒚𝒚
1 2
2 4
3 8
4 16
5 32
E
𝒙𝒙 𝒚𝒚
2 8
3 9
4 8
5 5
6 0
Equation Context
Equation Context
Equation Context
Equation Context
Equation Context
A STORY OF FUNCTIONS
©20 15 G re at Min ds eureka-math.org ALG I-M5-SE-1.3.0-08.2015
S.13
Lesson 2: Analyzing a Data Set
M5 Lesson 2 ALGEBRA I
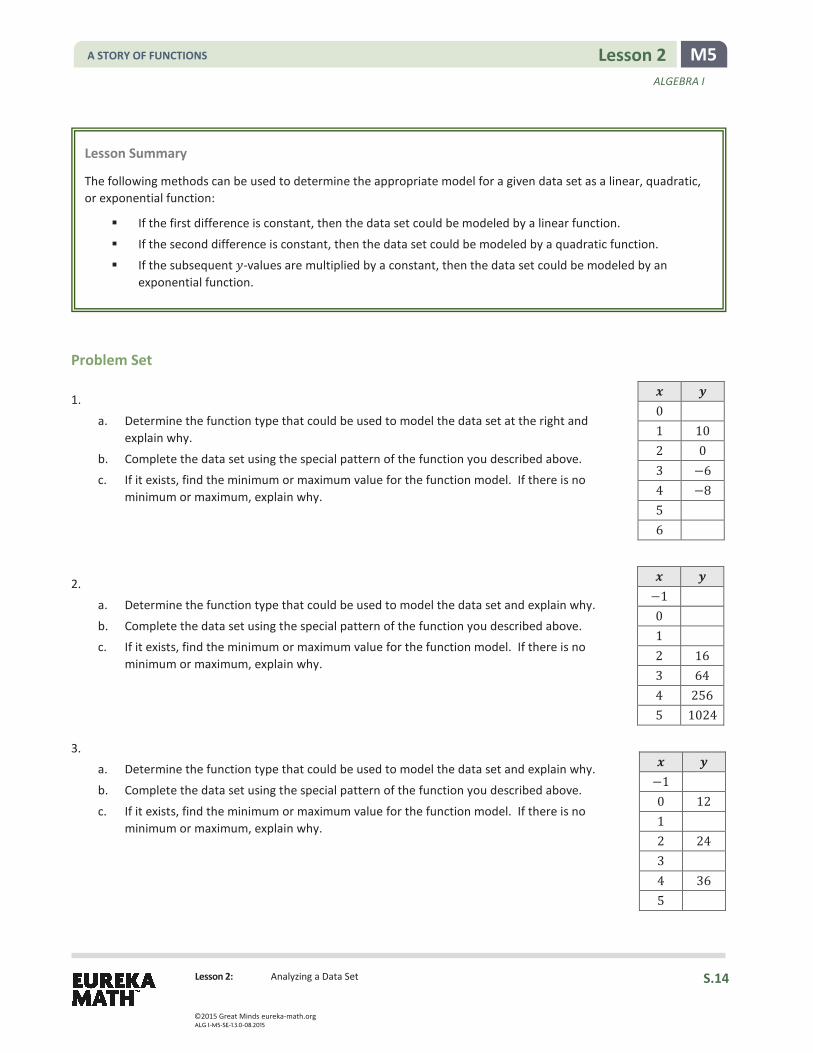
Problem Set 1.
a. Determine the function type that could be used to model the data set at the right and explain why.
b. Complete the data set using the special pattern of the function you described above. c. If it exists, find the minimum or maximum value for the function model. If there is no
minimum or maximum, explain why.
2.
a. Determine the function type that could be used to model the data set and explain why.
b. Complete the data set using the special pattern of the function you described above. c. If it exists, find the minimum or maximum value for the function model. If there is no
minimum or maximum, explain why.
3. a. Determine the function type that could be used to model the data set and explain why.
b. Complete the data set using the special pattern of the function you described above.
c. If it exists, find the minimum or maximum value for the function model. If there is no minimum or maximum, explain why.
Lesson Summary
The following methods can be used to determine the appropriate model for a given data set as a linear, quadratic, or exponential function:
If the first difference is constant, then the data set could be modeled by a linear function.
If the second difference is constant, then the data set could be modeled by a quadratic function.
If the subsequent 𝑦𝑦-values are multiplied by a constant, then the data set could be modeled by an exponential function.
𝒙𝒙 𝒚𝒚 −1 0 1 2 16 3 64 4 256 5 1024
𝒙𝒙 𝒚𝒚 −1 0 12 1 2 24 3 4 36 5
𝒙𝒙 𝒚𝒚 0 1 10 2 0 3 −6 4 −8 5 6
A STORY OF FUNCTIONS
©20 15 G re at Min ds eureka-math.org ALG I-M5-SE-1.3.0-08.2015
S.14
Lesson 2: Analyzing a Data Set
M5 Lesson 2 ALGEBRA I
4. Circle all the function types that could possibly be used to model a context if the given statement applies.
a. When 𝑥𝑥-values are at regular intervals, the first difference of 𝑦𝑦-values is not constant.
Linear Function Quadratic Function Exponential Function Absolute Value Function
b. When 𝑥𝑥-values are at regular intervals, the second difference of 𝑦𝑦-values is not constant.
Linear Function Quadratic Function Exponential Function Absolute Value Function
c. When 𝑥𝑥-values are at regular intervals, the quotient of any two consecutive 𝑦𝑦-values is a constant that is not equal to 0 or 1.
Linear Function Quadratic Function Exponential Function Absolute Value Function
d. There may be up to two different 𝑥𝑥-values for 𝑦𝑦 = 0.
Linear Function Quadratic Function Exponential Function Absolute Value Function
A STORY OF FUNCTIONS
©20 15 G re at Min ds eureka-math.org ALG I-M5-SE-1.3.0-08.2015
S.15

Lesson 3: Analyzing a Verbal Description
M5 Lesson 3 ALGEBRA I
Lesson 3: Analyzing a Verbal Description
Classwork Read the example problems below and discuss a problem-solving strategy with a partner or small group.
Example 1
Gregory plans to purchase a video game player. He has $500 in his savings account and plans to save $20 per week from his allowance until he has enough money to buy the player. He needs to figure out how long it will take. What type of function should he use to model this problem? Justify your answer mathematically.
Example 2
One of the highlights in a car show event is a car driving up a ramp and flying over approximately five cars placed end-to-end. The ramp is 8 ft at its highest point, and there is an upward speed of 88 ft/sec before it leaves the top of the ramp. What type of function can best model the height, ℎ, in feet, of the car 𝑡𝑡 seconds after leaving the end of the ramp? Justify your answer mathematically.
Example 3
Margie got $1,000 from her grandmother to start her college fund. She is opening a new savings account and finds out that her bank offers a 2% annual interest rate, compounded monthly. What type of function would best represent the amount of money in Margie’s account? Justify your answer mathematically.
A STORY OF FUNCTIONS
©20 15 G re at Min ds eureka-math.org ALG I-M5-SE-1.3.0-08.2015
S.16

Lesson 3: Analyzing a Verbal Description
M5 Lesson 3 ALGEBRA I
Exercises
1. City workers recorded the number of squirrels in a park over a period of time. At the first count, there were 15 pairs of male and female squirrels (30 squirrels total). After 6 months, the city workers recorded a total of 60 squirrels, and after a year, there were 120.
a. What type of function can best model the population of squirrels recorded over a period of time, assuming the same growth rate and that no squirrel dies?
b. Write a function that represents the population of squirrels recorded over 𝑥𝑥 number of years. Explain how you
determined your function.
2. A rectangular photograph measuring 8 in by 10 in is surrounded by a frame with a uniform width, 𝑥𝑥.
a. What type of function can best represent the area of the picture and the frame in terms of 𝑥𝑥 (the unknown frame’s width)? Explain mathematically how you know.
b. Write an equation in standard form representing the area of the picture and the frame. Explain how you arrive at your equation.
A STORY OF FUNCTIONS
©20 15 G re at Min ds eureka-math.org ALG I-M5-SE-1.3.0-08.2015
S.17

Lesson 3: Analyzing a Verbal Description
M5 Lesson 3 ALGEBRA I
3. A ball is tossed up in the air at an initial rate of 50 ft/sec from 5 ft off the ground.
a. What type of function models the height (ℎ, in feet) of the ball after 𝑡𝑡 seconds?
b. Explain what is happening to the height of the ball as it travels over a period of time (in 𝑡𝑡 seconds).
c. What function models the height, ℎ (in feet), of the ball over a period of time (in 𝑡𝑡 seconds)?
4. A population of insects is known to triple in size every month. At the beginning of a scientific research project, there were 200 insects. a. What type of function models the population of the insects after 𝑡𝑡 years?
b. Write a function that models the population growth of the insects after 𝑡𝑡 years.
A STORY OF FUNCTIONS
©20 15 G re at Min ds eureka-math.org ALG I-M5-SE-1.3.0-08.2015
S.18
Lesson 3: Analyzing a Verbal Description
M5 Lesson 3 ALGEBRA I
Problem Set 1. The costs to purchase school spirit posters are as follows: two posters for $5, four posters for $9, six posters for
$13, eight posters for $17, and so on.
a. What type of function would best represent the cost of the total number of posters purchased? b. What function represents the cost of the total number of posters purchased? How did you know? Justify your
reasoning.
c. If you have $40 to spend, write an inequality to find the maximum number of posters you could buy.
2. NYC Sports Gym had 425 members in 2011. Based on statistics, the total number of memberships increases by 2% annually.
a. What type of function models the total number of memberships in this situation?
b. If the trend continues, what function represents the total number of memberships in 𝑛𝑛 years? How did you know? Justify your reasoning.
3. Derek throws a baseball upward from an initial height of 3 ft. The baseball hits the ground after 2 seconds.
a. What was the initial velocity of the baseball?
b. What is the function that models the height, ℎ (in feet), of the baseball over a period of time 𝑡𝑡 (in seconds)?
c. At what time did the baseball reach its maximum height? What was the maximum height of the baseball?
Lesson Summary
The following methods can be used to recognize a function type from a word problem:
1. If a problem requires repeated addition or subtraction of a constant value, then it is represented by a linear function.
2. If a problem involves free-falling motion of an object or an area, then it is represented by a quadratic function.
3. If a problem is about population growth or compound interest, then it is represented by an exponential function.
A STORY OF FUNCTIONS
©20 15 G re at Min ds eureka-math.org ALG I-M5-SE-1.3.0-08.2015
S.19

M5 Lesson 4 ALGEBRA I
Lesson 4: Modeling a Context from a Graph
Leg Length (feet)
Wal
king
Spe
ed o
f an
Anim
al (f
t/se
c)
(0, 0)
Lesson 4: Modeling a Context from a Graph
Classwork
Example 1
Read the problem below. Your teacher will walk you through the process of using the steps in the modeling cycle to guide your solution.
The relationship between the length of one of the legs, in feet, of an animal and its walking speed, in feet per second, can be modeled by the graph below. Note: This function applies to walking not running speed. Obviously, a cheetah has shorter legs than a giraffe but can run much faster. However, in a walking race, the giraffe has the advantage.
A T-Rex’s leg length was 20 ft. What was the T-Rex’s speed in ft/sec?
A STORY OF FUNCTIONS
©20 15 G re at Min ds eureka-math.org ALG I-M5-SE-1.3.0-08.2015
S.20
M5 Lesson 4 ALGEBRA I
Lesson 4: Modeling a Context from a Graph
Exercises
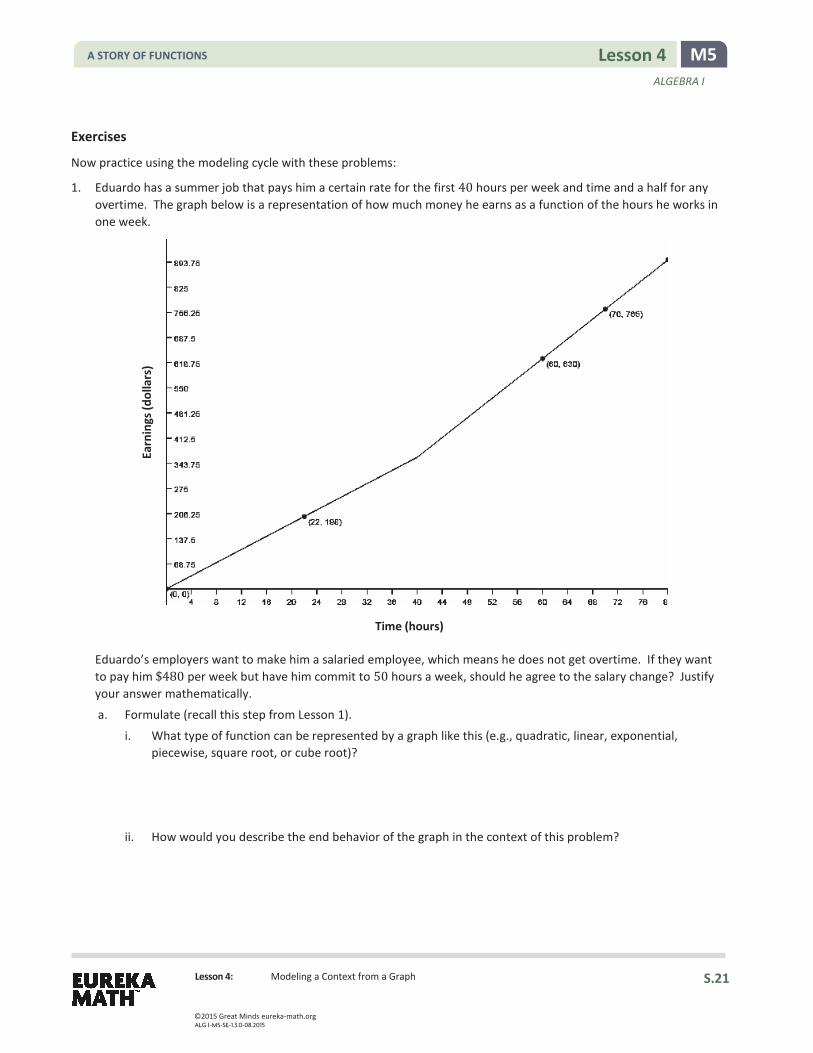
Now practice using the modeling cycle with these problems:
1. Eduardo has a summer job that pays him a certain rate for the first 40 hours per week and time and a half for any overtime. The graph below is a representation of how much money he earns as a function of the hours he works in one week.
Eduardo’s employers want to make him a salaried employee, which means he does not get overtime. If they want to pay him $480 per week but have him commit to 50 hours a week, should he agree to the salary change? Justify your answer mathematically.
a. Formulate (recall this step from Lesson 1).
i. What type of function can be represented by a graph like this (e.g., quadratic, linear, exponential, piecewise, square root, or cube root)?
ii. How would you describe the end behavior of the graph in the context of this problem?
Time (hours)
Earn
ings
(dol
lars
)
A STORY OF FUNCTIONS
©20 15 G re at Min ds eureka-math.org ALG I-M5-SE-1.3.0-08.2015
S.21
M5 Lesson 4 ALGEBRA I
Lesson 4: Modeling a Context from a Graph
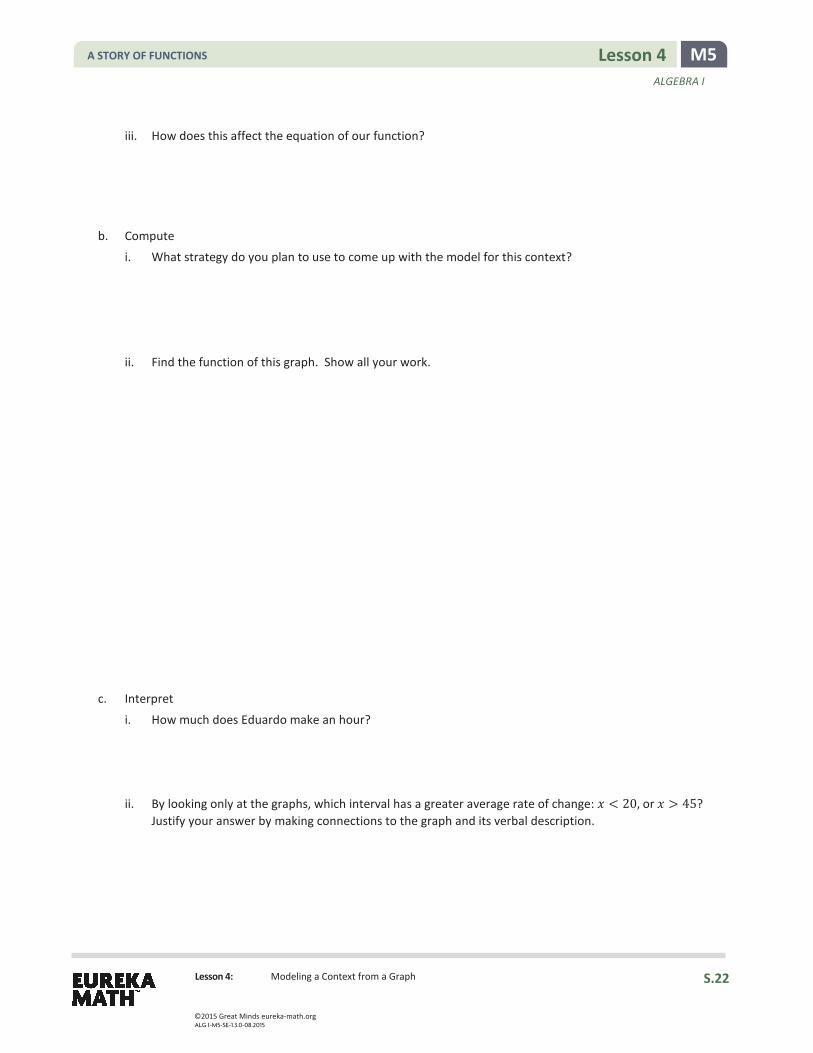
iii. How does this affect the equation of our function?
b. Compute
i. What strategy do you plan to use to come up with the model for this context?
ii. Find the function of this graph. Show all your work.
c. Interpret
i. How much does Eduardo make an hour?
ii. By looking only at the graphs, which interval has a greater average rate of change: 𝑥𝑥 < 20, or 𝑥𝑥 > 45? Justify your answer by making connections to the graph and its verbal description.
A STORY OF FUNCTIONS
©20 15 G re at Min ds eureka-math.org ALG I-M5-SE-1.3.0-08.2015
S.22

M5 Lesson 4 ALGEBRA I
Lesson 4: Modeling a Context from a Graph
iii. Eduardo’s employers want to make Eduardo a salaried employee, which means he does not get overtime. If they want to pay him $480 per week but have him commit to 50 hours a week, should he agree to the salary change? Justify your answer mathematically.
d. Validate
How can you check to make sure your function models the graph accurately?
2. The cross-section view of a deep river gorge is modeled by the graph shown below where both height and distance are measured in miles. How long is a bridge that spans the gorge from the point labeled (1,0) to the other side? How high above the bottom of the gorge is the bridge?
a. Formulate
i. What type of function can be represented by a graph like this (e.g., quadratic, linear, exponential, piecewise, square root, or cube root)?
(0,5)
(1,0)
(3,2)
1 2 30-2
-1
1
2
3
4
5
6
7
0
y
Heig
ht in
mile
s
Distance in miles
A STORY OF FUNCTIONS
©20 15 G re at Min ds eureka-math.org ALG I-M5-SE-1.3.0-08.2015
S.23

M5 Lesson 4 ALGEBRA I
Lesson 4: Modeling a Context from a Graph
ii. What are the quantities in this problem?
iii. How would you describe the end behavior of the graph?
iv. What is a general form for this function type?
v. How does knowing the function type and end behavior affect the equation of the function for this graph?
vi. What is the equation we would use to model this graph?
A STORY OF FUNCTIONS
©20 15 G re at Min ds eureka-math.org ALG I-M5-SE-1.3.0-08.2015
S.24
M5 Lesson 4 ALGEBRA I
Lesson 4: Modeling a Context from a Graph
b. Compute
i. What are the key features of the graph that can be used to determine the equation?
ii. Which key features of the function must be determined?
iii. Calculate the missing key features and check for accuracy with your graph.
c. Interpret
i. What domain makes sense for this context? Explain.
ii. How wide is the bridge with one side located at (1,0)?
iii. How high is the bridge above the bottom of the gorge?
A STORY OF FUNCTIONS
©20 15 G re at Min ds eureka-math.org ALG I-M5-SE-1.3.0-08.2015
S.25
M5 Lesson 4 ALGEBRA I
Lesson 4: Modeling a Context from a Graph
iv. Suppose the gorge is exactly 3.5 miles wide from its two highest points. Find the average rate of change for the interval from 𝑥𝑥 = 0 to 𝑥𝑥 = 3.5, [0, 3.5]. Explain this phenomenon. Are there other intervals that will behave similarly?
d. Validate
How can you check to make sure that your function models the graph accurately?
3. Now compare four representations that may be involved in the modeling process. How is each useful for each phase of the modeling cycle? Explain the advantages and disadvantages of each.
A STORY OF FUNCTIONS
©20 15 G re at Min ds eureka-math.org ALG I-M5-SE-1.3.0-08.2015
S.26

M5 Lesson 4 ALGEBRA I
Lesson 4: Modeling a Context from a Graph
Problem Set 1. During tryouts for the track team, Bob is running 90-foot wind sprints by running from a starting line to the far wall
of the gym and back. At time 𝑡𝑡 = 0, he is at the starting line and ready to accelerate toward the opposite wall. As 𝑡𝑡 approaches 6 seconds, he must slow down, stop for just an instant to touch the wall, then turn around, and sprint back to the starting line. His distance, in feet, from the starting line with respect to the number of seconds that has passed for one repetition is modeled by the graph below.
(Note: You may refer to Lesson 1, Problem Set #1 to help answer this question.)
How far was Bob from the starting line at 2 seconds? 6.5 seconds? (Distances, in feet, should be represented to the nearest tenth.)
Lesson Summary
When modeling from a graph use the full modeling cycle:
FORMULATE: Identify the variables involved, classify the type of graph presented, point out the visible key features, and create a different representation of the relationship if needed.
COMPUTE: Decontextualize the graph from the application and analyze it. You might have to find a symbolic or tabular representation of the graph to further analyze it.
INTERPRET: Contextualize the features of the function and your results and make sense of them in the context provided.
V heck your results with the context. Do your answers make sense? Are the calculations accurate? Are there possibilities for error?
REPORT: Clearly write your results.
A STORY OF FUNCTIONS
©20 15 G re at Min ds eureka-math.org ALG I-M5-SE-1.3.0-08.2015
S.27
CALIDATE:

M5 Lesson 4 ALGEBRA I
Lesson 4: Modeling a Context from a Graph
2. Kyle and Abed each threw a baseball across a field. The height of the balls (in feet) is described by functions 𝐴𝐴 and 𝐾𝐾, where 𝑡𝑡 is the number of seconds the baseball is in the air. 𝐾𝐾 models the height of Kyle’s baseball (equation below), and 𝐴𝐴 models the height of Abed’s baseball (graph below).
𝐾𝐾(𝑡𝑡) = −16𝑡𝑡2 + 66𝑡𝑡 + 6.
a. Which ball was in the air for a longer period of time?
b. Whose ball goes higher?
c. How high was Abed’s ball when he threw it?
A STORY OF FUNCTIONS
©20 15 G re at Min ds eureka-math.org ALG I-M5-SE-1.3.0-08.2015
S.28

Lesson 5: Modeling from a Sequence
M5 Lesson 5 ALGEBRA I
Lesson 5: Modeling from a Sequence
Classwork
Opening Exercise
A soccer coach is getting her students ready for the season by introducing them to High Intensity Interval Training (HIIT). She presents the table below with a list of exercises for a HIIT training circuit and the length of time that must be spent on each exercise before the athlete gets a short time to rest. The rest times increase as students complete more exercises in the circuit. Study the chart and answer the questions below. How long would the tenth exercise be? If a player had 30 minutes of actual gym time during a period, how many exercises could she get done? Explain your answers.
Exercise Number Length of Exercise Time Length of Rest Time
Exercise 1 0.5 minutes 0.25 minutes
Exercise 2 0.75 minutes 0.5 minutes
Exercise 3 1 minute 1 minutes
Exercise 4 1.25 minutes 2 minutes
Exercise 5 1.5 minutes 4 minutes
A STORY OF FUNCTIONS
©20 15 G re at Min ds eureka-math.org ALG I-M5-SE-1.3.0-08.2015
S.29
Lesson 5: Modeling from a Sequence
M5 Lesson 5 ALGEBRA I
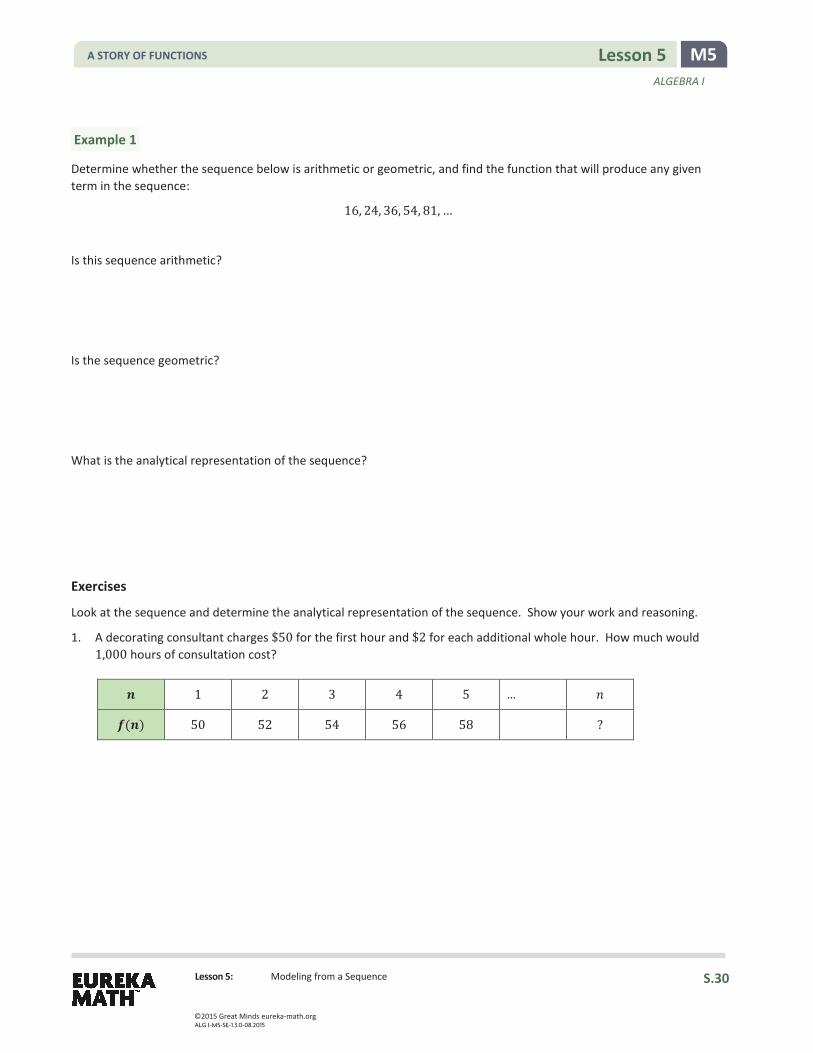
Example 1
Determine whether the sequence below is arithmetic or geometric, and find the function that will produce any given term in the sequence:
16, 24, 36, 54, 81, …
Is this sequence arithmetic?
Is the sequence geometric?
What is the analytical representation of the sequence?
Exercises
Look at the sequence and determine the analytical representation of the sequence. Show your work and reasoning.
1. A decorating consultant charges $50 for the first hour and $2 for each additional whole hour. How much would 1,000 hours of consultation cost?
𝒏𝒏 1 2 3 4 5 … 𝑛𝑛
𝒇𝒇(𝒏𝒏) 50 52 54 56 58 ?
A STORY OF FUNCTIONS
©20 15 G re at Min ds eureka-math.org ALG I-M5-SE-1.3.0-08.2015
S.30
Lesson 5: Modeling from a Sequence
M5 Lesson 5 ALGEBRA I
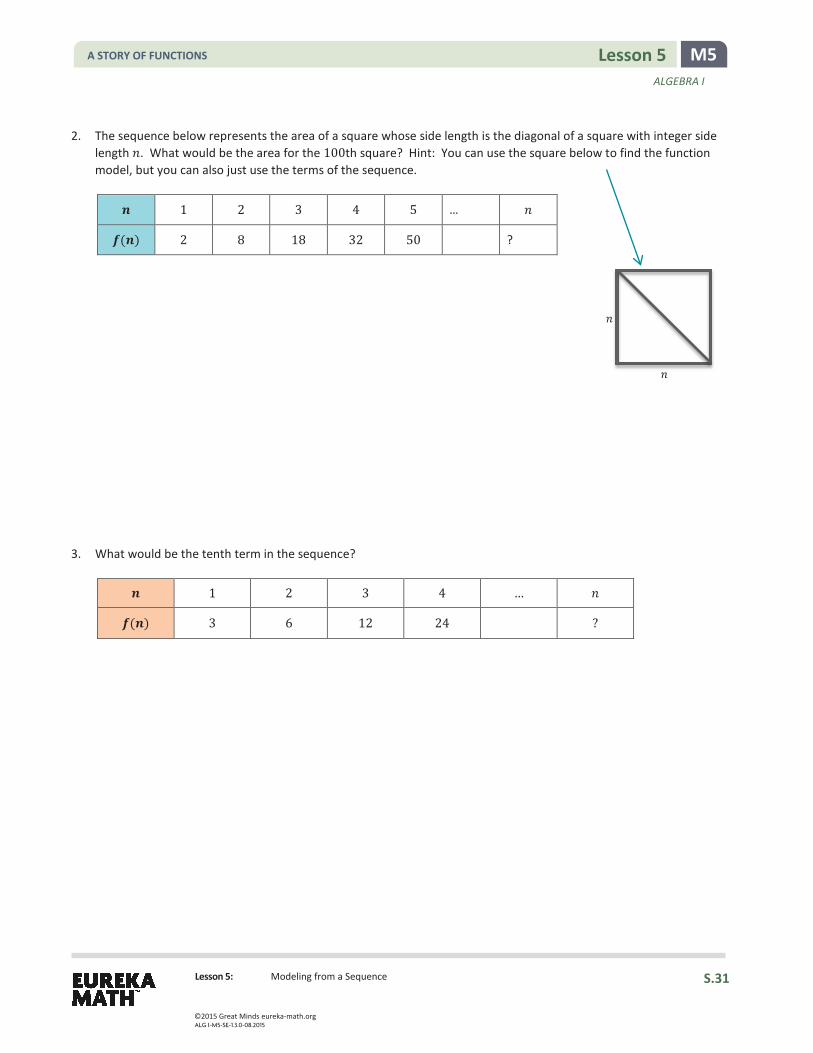
2. The sequence below represents the area of a square whose side length is the diagonal of a square with integer side length 𝑛𝑛. What would be the area for the 100th square? Hint: You can use the square below to find the function model, but you can also just use the terms of the sequence.
𝒏𝒏 1 2 3 4 5 … 𝑛𝑛
𝒇𝒇(𝒏𝒏) 2 8 18 32 50 ?
3. What would be the tenth term in the sequence?
𝒏𝒏 1 2 3 4 … 𝑛𝑛
𝒇𝒇(𝒏𝒏) 3 6 12 24 ?
𝑛𝑛
𝑛𝑛
A STORY OF FUNCTIONS
©20 15 G re at Min ds eureka-math.org ALG I-M5-SE-1.3.0-08.2015
S.31
Lesson 5: Modeling from a Sequence
M5 Lesson 5 ALGEBRA I
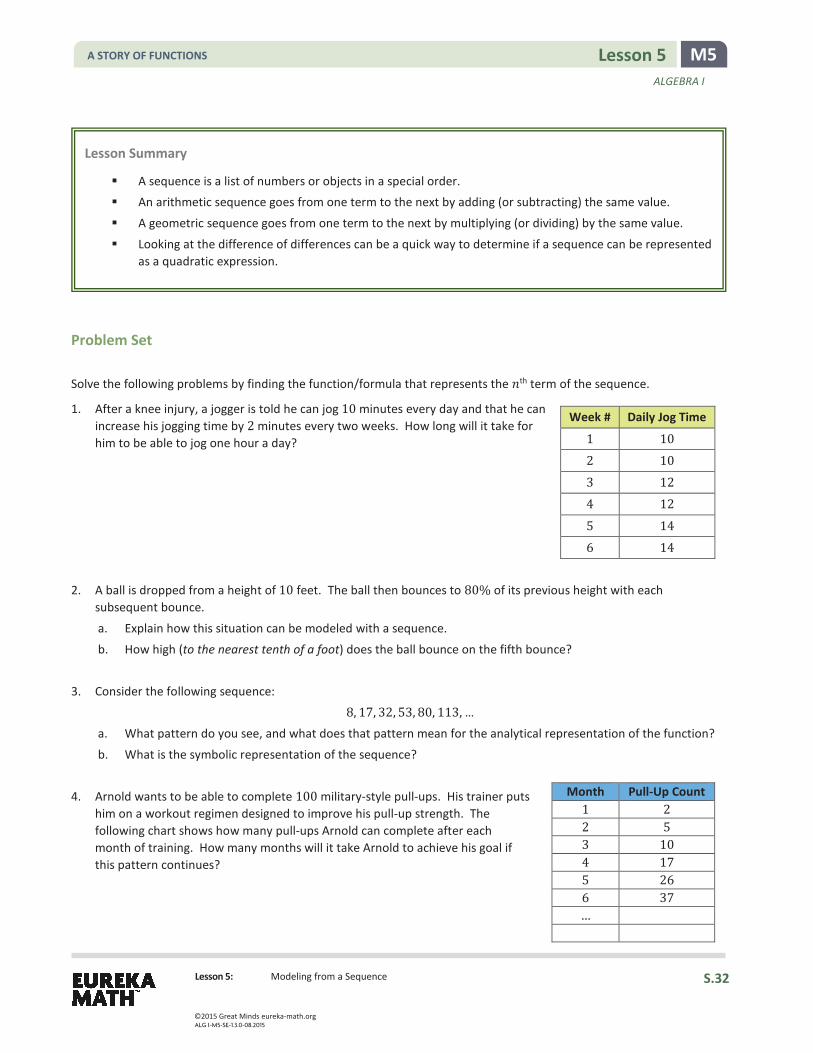
Problem Set Solve the following problems by finding the function/formula that represents the 𝑛𝑛th term of the sequence.
1. After a knee injury, a jogger is told he can jog 10 minutes every day and that he can increase his jogging time by 2 minutes every two weeks. How long will it take for him to be able to jog one hour a day?
2. A ball is dropped from a height of 10 feet. The ball then bounces to 80% of its previous height with each subsequent bounce.
a. Explain how this situation can be modeled with a sequence.
b. How high (to the nearest tenth of a foot) does the ball bounce on the fifth bounce?
3. Consider the following sequence:
8, 17, 32, 53, 80, 113, …
a. What pattern do you see, and what does that pattern mean for the analytical representation of the function?
b. What is the symbolic representation of the sequence?
4. Arnold wants to be able to complete 100 military-style pull-ups. His trainer puts
him on a workout regimen designed to improve his pull-up strength. The following chart shows how many pull-ups Arnold can complete after each month of training. How many months will it take Arnold to achieve his goal if this pattern continues?
Lesson Summary
A sequence is a list of numbers or objects in a special order. An arithmetic sequence goes from one term to the next by adding (or subtracting) the same value.
A geometric sequence goes from one term to the next by multiplying (or dividing) by the same value.
Looking at the difference of differences can be a quick way to determine if a sequence can be represented as a quadratic expression.
Week # Daily Jog Time
1 10 2 10 3 12 4 12 5 14 6 14
Month Pull-Up Count 1 2 2 5 3 10 4 17 5 26 6 37 …
A STORY OF FUNCTIONS
©20 15 G re at Min ds eureka-math.org ALG I-M5-SE-1.3.0-08.2015
S.32

Lesson 6: Modeling a Context from Data
M5 Lesson 6 ALGEBRA I
Lesson 6: Modeling a Context from Data
Classwork
Opening Exercise
a. Identify the type of function that each table appears to represent (e.g., quadratic, linear, exponential, square root).
b. Explain how you were able to identify the function.
c. Find the symbolic representation of the function.
d. Plot the graphs of your data.
A
𝒙𝒙 𝒚𝒚
1 5
2 7
3 9
4 11
5 13
B
𝒙𝒙 𝒚𝒚
1 6
2 9
3 13.5
4 20.25
5 30.375
C
𝒙𝒙 𝒚𝒚
1 3
2 12
3 27
4 48
5 75
A STORY OF FUNCTIONS
©20 15 G re at Min ds eureka-math.org ALG I-M5-SE-1.3.0-08.2015
S.33
Lesson 6: Modeling a Context from Data
M5 Lesson 6 ALGEBRA I
Example 1
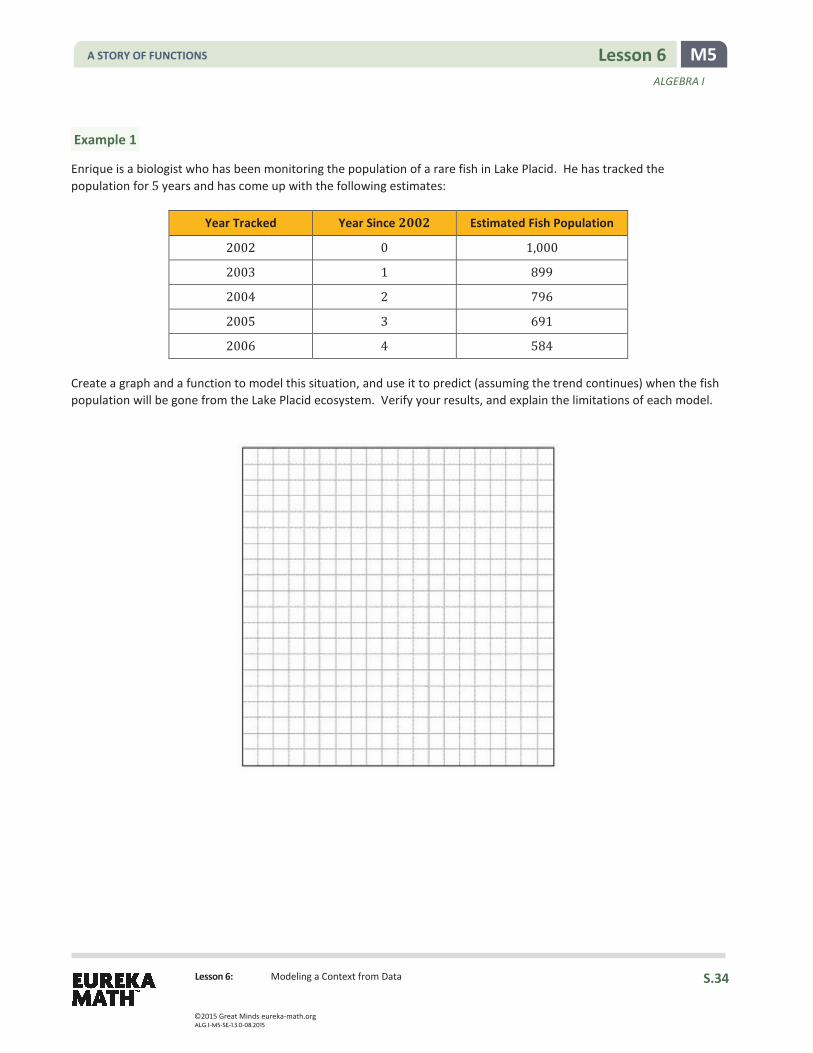
Enrique is a biologist who has been monitoring the population of a rare fish in Lake Placid. He has tracked the population for 5 years and has come up with the following estimates:
Year Tracked Year Since 𝟐𝟐𝟐𝟐𝟐𝟐𝟐𝟐 Estimated Fish Population
2002 0 1,000
2003 1 899
2004 2 796
2005 3 691
2006 4 584
Create a graph and a function to model this situation, and use it to predict (assuming the trend continues) when the fish population will be gone from the Lake Placid ecosystem. Verify your results, and explain the limitations of each model.
A STORY OF FUNCTIONS
©20 15 G re at Min ds eureka-math.org ALG I-M5-SE-1.3.0-08.2015
S.34
Lesson 6: Modeling a Context from Data
M5 Lesson 6 ALGEBRA I
Exercises
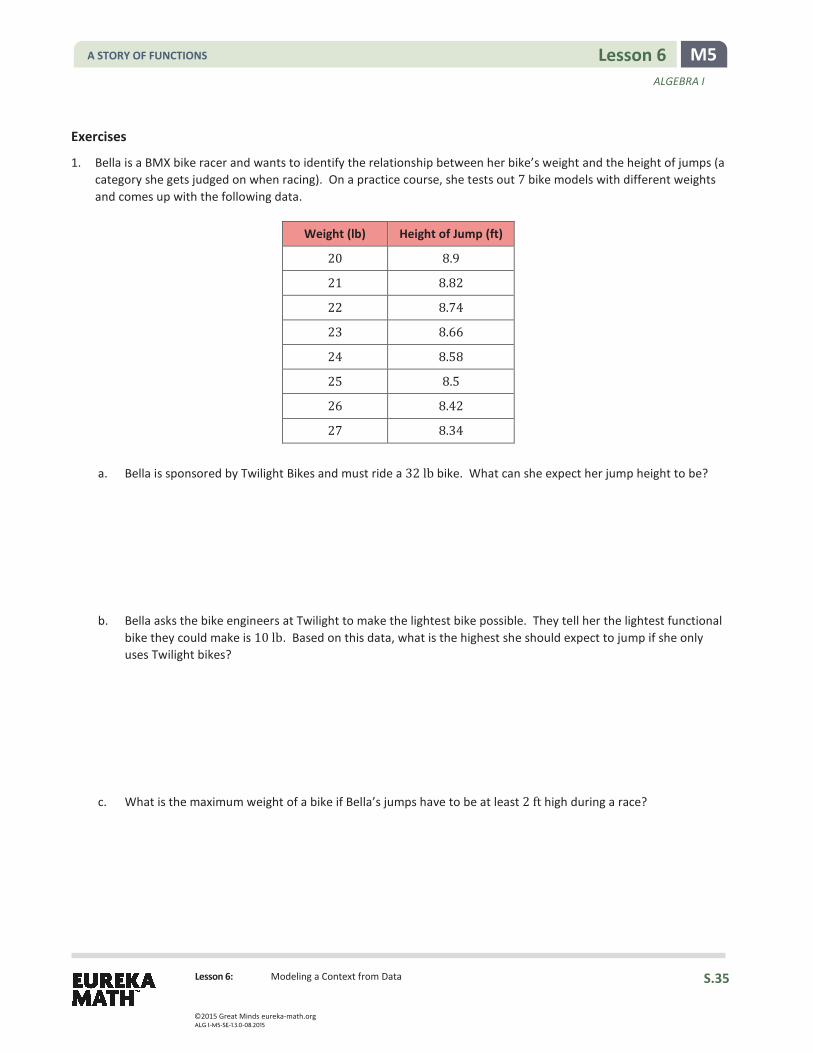
1. Bella is a BMX bike racer and wants to identify the relationship between her bike’s weight and the height of jumps (a category she gets judged on when racing). On a practice course, she tests out 7 bike models with different weights and comes up with the following data.
Weight (lb) Height of Jump (ft)
20 8.9
21 8.82
22 8.74
23 8.66
24 8.58
25 8.5
26 8.42
27 8.34
a. Bella is sponsored by Twilight Bikes and must ride a 32 lb bike. What can she expect her jump height to be?
b. Bella asks the bike engineers at Twilight to make the lightest bike possible. They tell her the lightest functional bike they could make is 10 lb. Based on this data, what is the highest she should expect to jump if she only uses Twilight bikes?
c. What is the maximum weight of a bike if Bella’s jumps have to be at least 2 ft high during a race?
A STORY OF FUNCTIONS
©20 15 G re at Min ds eureka-math.org ALG I-M5-SE-1.3.0-08.2015
S.35
Lesson 6: Modeling a Context from Data
M5 Lesson 6 ALGEBRA I
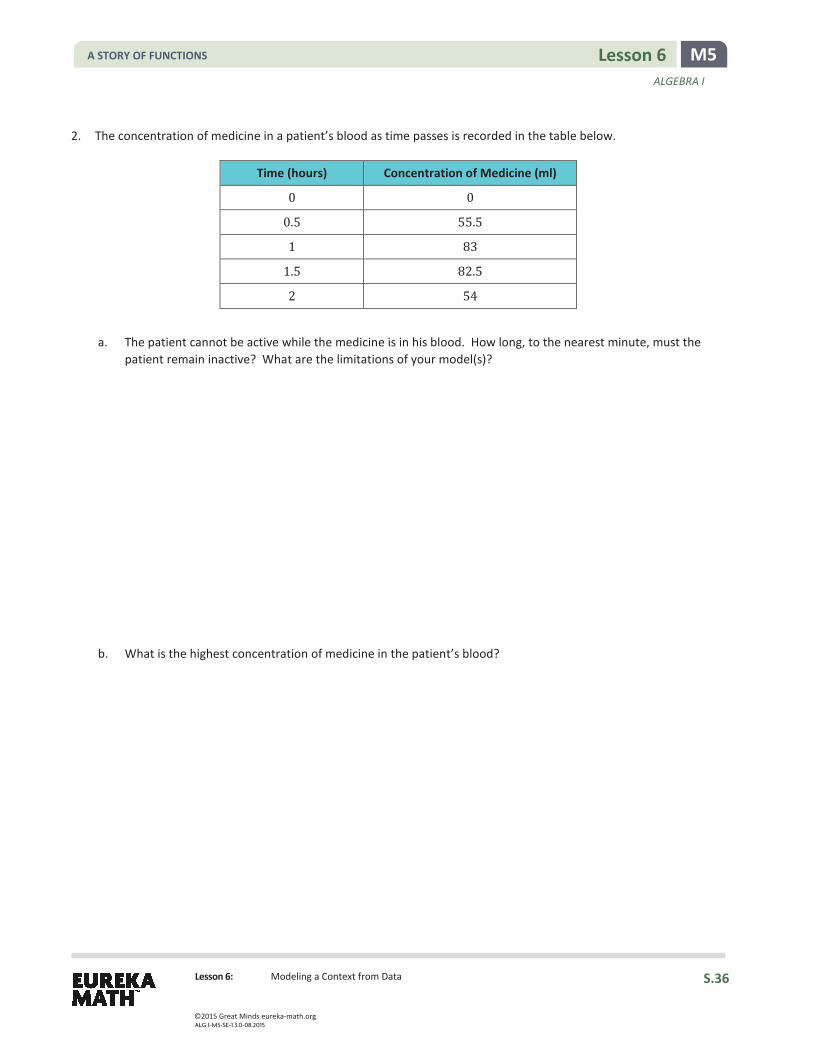
2. The concentration of medicine in a patient’s blood as time passes is recorded in the table below.
Time (hours) Concentration of Medicine (ml)
0 0
0.5 55.5
1 83
1.5 82.5
2 54
a. The patient cannot be active while the medicine is in his blood. How long, to the nearest minute, must the patient remain inactive? What are the limitations of your model(s)?
b. What is the highest concentration of medicine in the patient’s blood?
A STORY OF FUNCTIONS
©20 15 G re at Min ds eureka-math.org ALG I-M5-SE-1.3.0-08.2015
S.36
Lesson 6: Modeling a Context from Data
M5 Lesson 6 ALGEBRA I
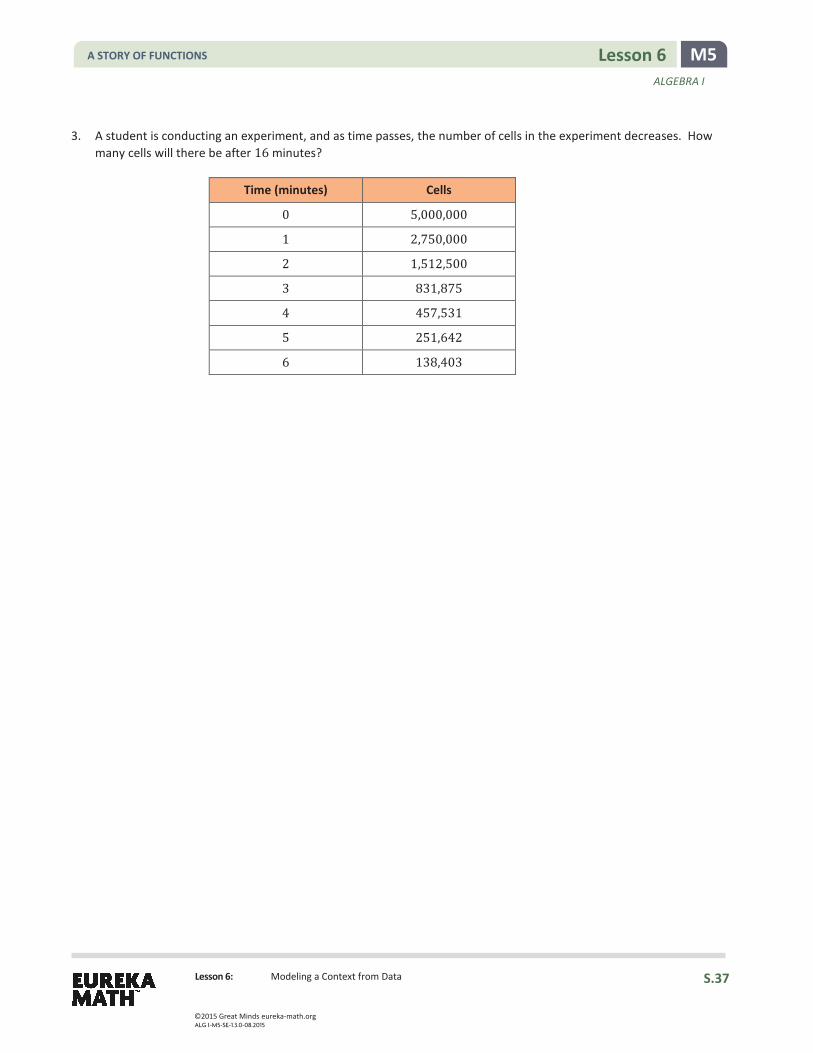
3. A student is conducting an experiment, and as time passes, the number of cells in the experiment decreases. How many cells will there be after 16 minutes?
Time (minutes) Cells
0 5,000,000
1 2,750,000
2 1,512,500
3 831,875
4 457,531
5 251,642
6 138,403
A STORY OF FUNCTIONS
©20 15 G re at Min ds eureka-math.org ALG I-M5-SE-1.3.0-08.2015
S.37

Lesson 6: Modeling a Context from Data
M5 Lesson 6 ALGEBRA I
Problem Set Research linear, quadratic, and exponential functions using the Internet. For each of the three types of functions, provide an example of a problem/situation you found on the Internet where that function was used to model the situation or answer the problem. Include the actual function used in the example and web page where you found the example.
Lesson Summary
When given a data set, strategies that could be used to determine the type of function that describes the relationship between the data are
Determine the variables involved and plot the points.
After making sure the 𝑥𝑥-values are given at regular intervals, look for common differences between the data points—first and second.
Determine the type of sequence the data models first, and then use the general form of the function equation to find the parameters for the symbolic representation of the function.
A STORY OF FUNCTIONS
©20 15 G re at Min ds eureka-math.org ALG I-M5-SE-1.3.0-08.2015
S.38
Lesson 7: Modeling a Context from Data
M5 Lesson 7 ALGEBRA I
Lesson 7: Modeling a Context from Data
Classwork
Opening Exercise
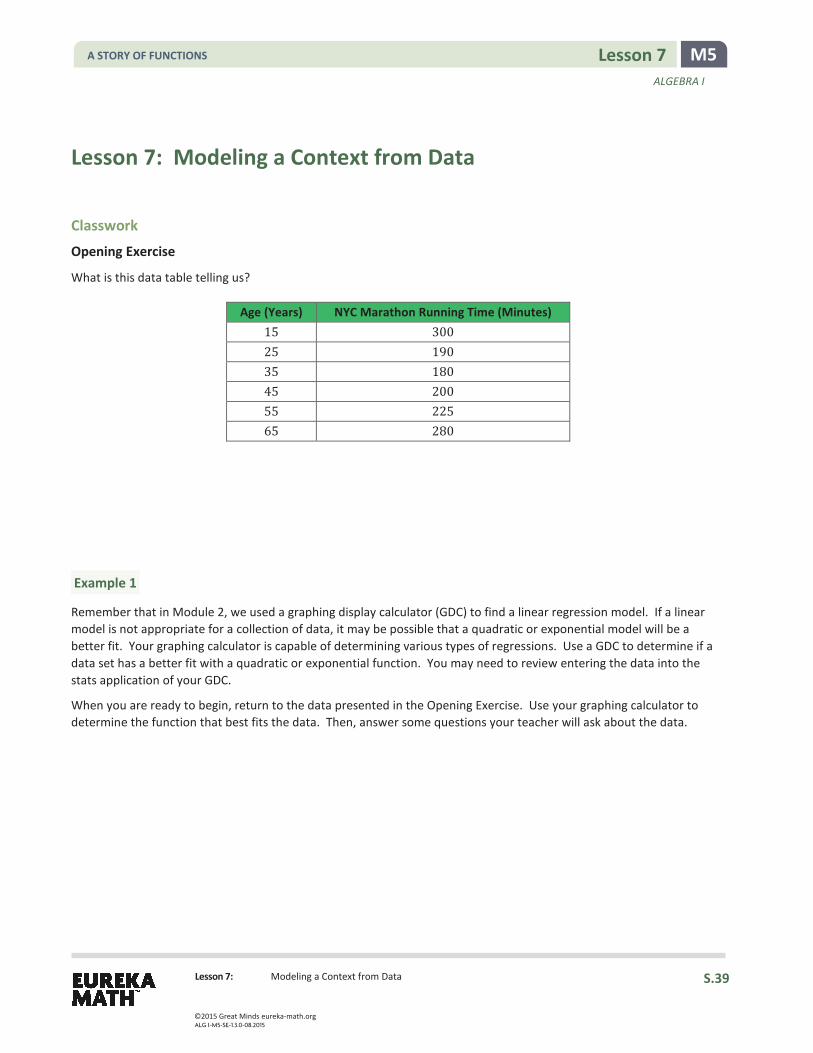
What is this data table telling us?
Age (Years) NYC Marathon Running Time (Minutes) 15 300 25 190 35 180 45 200 55 225 65 280
Example 1
Remember that in Module 2, we used a graphing display calculator (GDC) to find a linear regression model. If a linear model is not appropriate for a collection of data, it may be possible that a quadratic or exponential model will be a better fit. Your graphing calculator is capable of determining various types of regressions. Use a GDC to determine if a data set has a better fit with a quadratic or exponential function. You may need to review entering the data into the stats application of your GDC.
When you are ready to begin, return to the data presented in the Opening Exercise. Use your graphing calculator to determine the function that best fits the data. Then, answer some questions your teacher will ask about the data.
A STORY OF FUNCTIONS
©20 15 G re at Min ds eureka-math.org ALG I-M5-SE-1.3.0-08.2015
S.39
Lesson 7: Modeling a Context from Data
M5 Lesson 7 ALGEBRA I
Exercises
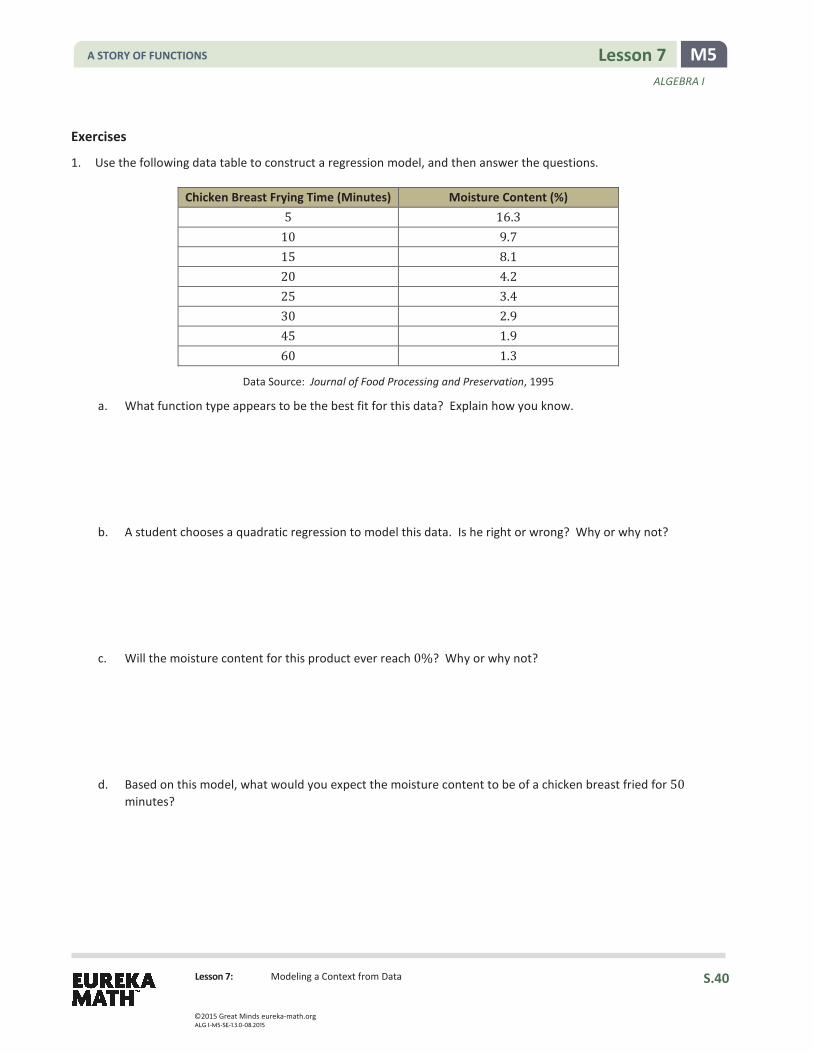
1. Use the following data table to construct a regression model, and then answer the questions.
Chicken Breast Frying Time (Minutes) Moisture Content (%) 5 16.3
10 9.7 15 8.1 20 4.2 25 3.4 30 2.9 45 1.9 60 1.3
Data Source: Journal of Food Processing and Preservation, 1995
a. What function type appears to be the best fit for this data? Explain how you know.
b. A student chooses a quadratic regression to model this data. Is he right or wrong? Why or why not?
c. Will the moisture content for this product ever reach 0%? Why or why not?
d. Based on this model, what would you expect the moisture content to be of a chicken breast fried for 50 minutes?
A STORY OF FUNCTIONS
©20 15 G re at Min ds eureka-math.org ALG I-M5-SE-1.3.0-08.2015
S.40
Lesson 7: Modeling a Context from Data
M5 Lesson 7 ALGEBRA I
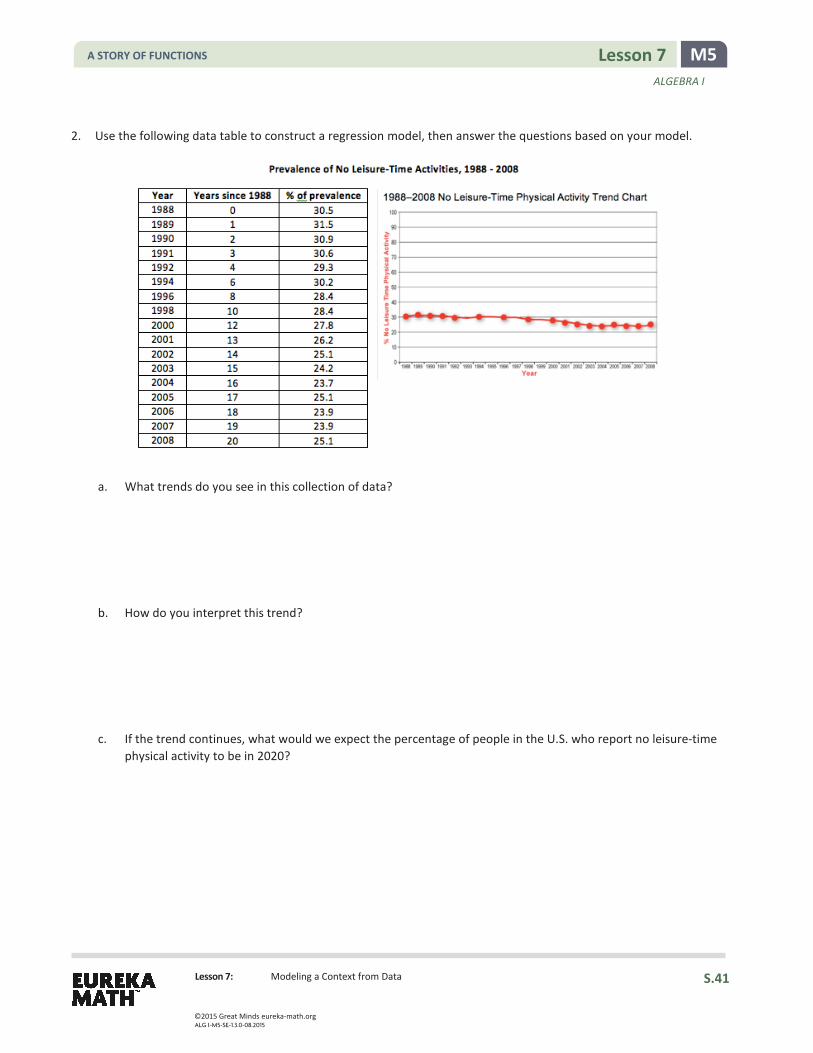
2. Use the following data table to construct a regression model, then answer the questions based on your model.
a. What trends do you see in this collection of data?
b. How do you interpret this trend?
c. If the trend continues, what would we expect the percentage of people in the U.S. who report no leisure-time
physical activity to be in 2020?
A STORY OF FUNCTIONS
©20 15 G re at Min ds eureka-math.org ALG I-M5-SE-1.3.0-08.2015
S.41
Lesson 7: Modeling a Context from Data
M5 Lesson 7 ALGEBRA I
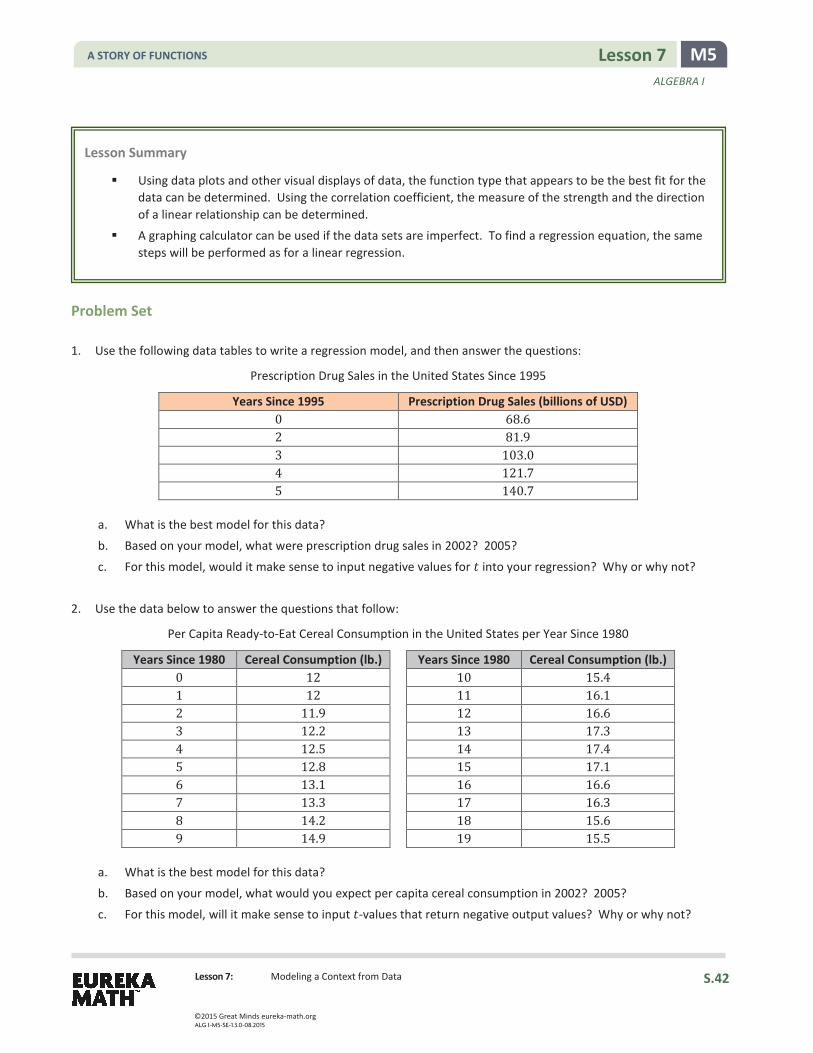
Problem Set 1. Use the following data tables to write a regression model, and then answer the questions:
Prescription Drug Sales in the United States Since 1995
Years Since 1995 Prescription Drug Sales (billions of USD) 0 68.6 2 81.9 3 103.0 4 121.7 5 140.7
a. What is the best model for this data?
b. Based on your model, what were prescription drug sales in 2002? 2005?
c. For this model, would it make sense to input negative values for 𝑡𝑡 into your regression? Why or why not?
2. Use the data below to answer the questions that follow:
Per Capita Ready-to-Eat Cereal Consumption in the United States per Year Since 1980
Years Since 1980 Cereal Consumption (lb.) Years Since 1980 Cereal Consumption (lb.) 0 12 10 15.4 1 12 11 16.1 2 11.9 12 16.6 3 12.2 13 17.3 4 12.5 14 17.4 5 12.8 15 17.1 6 13.1 16 16.6 7 13.3 17 16.3 8 14.2 18 15.6 9 14.9 19 15.5
a. What is the best model for this data?
b. Based on your model, what would you expect per capita cereal consumption in 2002? 2005?
c. For this model, will it make sense to input 𝑡𝑡-values that return negative output values? Why or why not?
Lesson Summary
Using data plots and other visual displays of data, the function type that appears to be the best fit for the data can be determined. Using the correlation coefficient, the measure of the strength and the direction of a linear relationship can be determined.
A graphing calculator can be used if the data sets are imperfect. To find a regression equation, the same steps will be performed as for a linear regression.
A STORY OF FUNCTIONS
©20 15 G re at Min ds eureka-math.org ALG I-M5-SE-1.3.0-08.2015
S.42
Lesson 8: Modeling a Context from a Verbal Description
M5 Lesson 8 ALGEBRA I
Lesson 8: Modeling a Context from a Verbal Description
Classwork
Example 1
Christine has $500 to deposit in a savings account, and she is trying to decide between two banks. Bank A offers 10% annual interest compounded quarterly. Rather than compounding interest for smaller accounts, Bank B offers to add $15 quarterly to any account with a balance of less than $1,000 for every quarter, as long as there are no withdrawals. Christine has decided that she will neither withdraw, nor make a deposit for a number of years.
Develop a model that will help Christine decide which bank to use.
Example 2
Alex designed a new snowboard. He wants to market it and make a profit. The total initial cost for manufacturing set-up, advertising, etc. is $500,000, and the materials to make the snowboards cost $100 per board.
The demand function for selling a similar snowboard is 𝐷𝐷(𝑝𝑝) = 50,000 − 100𝑝𝑝, where 𝑝𝑝 represents the selling price (in dollars) of each snowboard.
a. Write an expression for each of the following in terms of 𝑝𝑝.
Demand Function (number of units that will sell)
Revenue [(number of units that will sell)(price per unit, 𝑝𝑝)]
Total Cost (cost for producing the snowboards)
A STORY OF FUNCTIONS
©20 15 G re at Min ds eureka-math.org ALG I-M5-SE-1.3.0-08.2015
S.43

Lesson 8: Modeling a Context from a Verbal Description
M5 Lesson 8 ALGEBRA I
b. Write an expression to represent the profit.
c. What is the selling price of the snowboard that will give the maximum profit?
d. What is the maximum profit Alex can make?
Exercises
Alvin just turned 16 years old. His grandmother told him that she will give him $10,000 to buy any car he wants whenever he is ready. Alvin wants to be able to buy his dream car by his 21st birthday, and he wants a 2009 Avatar Z, which he could purchase today for $25,000. The car depreciates (reduces in value) at a rate is 15% per year. He wants to figure out how long it would take for his $10,000 to be enough to buy the car, without investing the $10,000.
1. Write the function that models the depreciated value of the car after 𝑛𝑛 number of years.
a. Will he be able to afford to buy the car when he turns 21? Explain why
or why not.
b. Given the same rate of depreciation, after how many years will the value of the car be less than $5,000?
After 𝒏𝒏 years Value of the Car
1
2
3
4
5
6
A STORY OF FUNCTIONS
©20 15 G re at Min ds eureka-math.org ALG I-M5-SE-1.3.0-08.2015
S.44
Lesson 8: Modeling a Context from a Verbal Description
M5 Lesson 8 ALGEBRA I
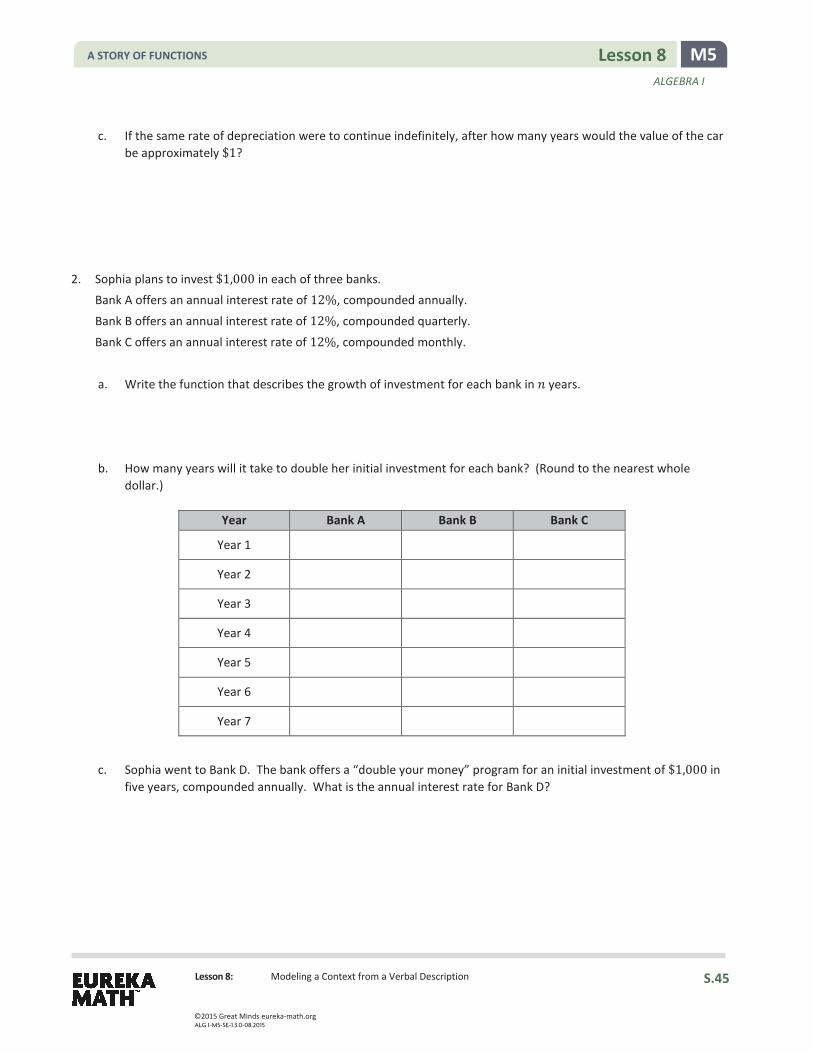
c. If the same rate of depreciation were to continue indefinitely, after how many years would the value of the car be approximately $1?
2. Sophia plans to invest $1,000 in each of three banks. Bank A offers an annual interest rate of 12%, compounded annually.
Bank B offers an annual interest rate of 12%, compounded quarterly.
Bank C offers an annual interest rate of 12%, compounded monthly.
a. Write the function that describes the growth of investment for each bank in 𝑛𝑛 years.
b. How many years will it take to double her initial investment for each bank? (Round to the nearest whole dollar.)
Year Bank A Bank B Bank C
Year 1
Year 2
Year 3
Year 4
Year 5
Year 6
Year 7
c. Sophia went to Bank D. The bank offers a “double your money” program for an initial investment of $1,000 in five years, compounded annually. What is the annual interest rate for Bank D?
A STORY OF FUNCTIONS
©20 15 G re at Min ds eureka-math.org ALG I-M5-SE-1.3.0-08.2015
S.45
Lesson 8: Modeling a Context from a Verbal Description
M5 Lesson 8 ALGEBRA I
Problem Set 1. Maria invested $10,000 in the stock market. Unfortunately, the value of her investment has been dropping at an
average rate of 3% each year.
a. Write the function that best models the situation. b. If the trend continues, how much will her investment be worth in 5 years?
c. Given the situation, what should she do with her investment?
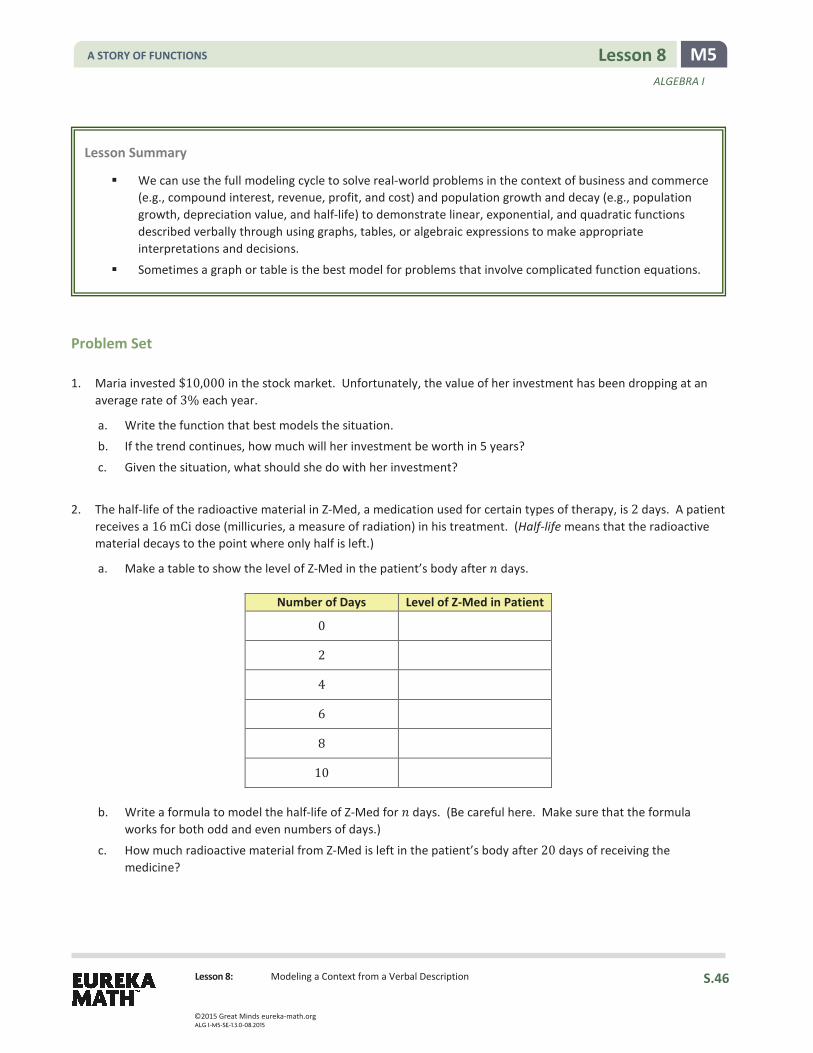
2. The half-life of the radioactive material in Z-Med, a medication used for certain types of therapy, is 2 days. A patient receives a 16 mCi dose (millicuries, a measure of radiation) in his treatment. (Half-life means that the radioactive material decays to the point where only half is left.)
a. Make a table to show the level of Z-Med in the patient’s body after 𝑛𝑛 days.
Number of Days Level of Z-Med in Patient
0
2
4
6
8
10
b. Write a formula to model the half-life of Z-Med for 𝑛𝑛 days. (Be careful here. Make sure that the formula works for both odd and even numbers of days.)
c. How much radioactive material from Z-Med is left in the patient’s body after 20 days of receiving the medicine?
Lesson Summary
We can use the full modeling cycle to solve real-world problems in the context of business and commerce (e.g., compound interest, revenue, profit, and cost) and population growth and decay (e.g., population growth, depreciation value, and half-life) to demonstrate linear, exponential, and quadratic functions described verbally through using graphs, tables, or algebraic expressions to make appropriate interpretations and decisions.
Sometimes a graph or table is the best model for problems that involve complicated function equations.
A STORY OF FUNCTIONS
©20 15 G re at Min ds eureka-math.org ALG I-M5-SE-1.3.0-08.2015
S.46

Lesson 8: Modeling a Context from a Verbal Description
M5 Lesson 8 ALGEBRA I
3. Suppose a male and a female of a certain species of animal were taken to a deserted island. The population of this species quadruples (multiplies by 4) every year. Assume that the animals have an abundant food supply and that there are no predators on the island.
a. What is an equation that can be used to model the population of the species?
b. What will the population of the species be after 5 years?
After 𝒏𝒏 years Population
0
1
2
3
4
5
c. Write an equation to find how many years it will take for the population of the animals to exceed 1 million. Find the number of years, either by using the equation or a table.
After 𝒏𝒏 years Population
0
1
2
3
4
5
6
7
8
9
10
4. The revenue of a company for a given month is represented as 𝑅𝑅(𝑥𝑥) = 1,500𝑥𝑥 − 𝑥𝑥2 and its costs as 𝐶𝐶(𝑥𝑥) = 1,500 + 1,000𝑥𝑥. What is the selling price, 𝑥𝑥, of its product that would yield the maximum profit? Show or explain your answer.
A STORY OF FUNCTIONS
©20 15 G re at Min ds eureka-math.org ALG I-M5-SE-1.3.0-08.2015
S.47

Lesson 9: Modeling a Context from a Verbal Description
M5 Lesson 9 ALGEBRA I
Lesson 9: Modeling a Context from a Verbal Description
Classwork
Opening Exercise
What does it mean to attend to precision when modeling in mathematics?
Example 1
Marymount Township secured the construction of a power plant, which opened in 1990. Once the power plant opened in 1990, the population of Marymount increased by about 20% each year for the first ten years and then increased by 5% each year after that.
a. If the population was 150,000 people in 2010, what was the population in 2000?
b. How should you round your answer? Explain.
c. What was the population in 1990?
A STORY OF FUNCTIONS
©20 15 G re at Min ds eureka-math.org ALG I-M5-SE-1.3.0-08.2015
S.48
Lesson 9: Modeling a Context from a Verbal Description
M5 Lesson 9 ALGEBRA I
Example 2
If the trend continued, what would the population be in 2009?
Exercises
1. A tortoise and a hare are having a race. The tortoise moves at 4 miles per hour. The hare travels at 10 miles per hour. Halfway through the race, the hare decides to take a 5-hour nap and then gets up and continues at 10 miles per hour. a. If the race is 40 miles long, who won the race? Support your answer with mathematical evidence.
b. How long (in miles) would the race have to be for there to be a tie between the two creatures, if the same situation (as described in Exercise 1) happened?
A STORY OF FUNCTIONS
©20 15 G re at Min ds eureka-math.org ALG I-M5-SE-1.3.0-08.2015
S.49

Lesson 9: Modeling a Context from a Verbal Description
M5 Lesson 9 ALGEBRA I
2. The graph on the right represents the value 𝑉𝑉 of a popular stock. Its initial value was $12/share on day 0.
Note: The calculator uses 𝑋𝑋 to represent 𝑡𝑡, and 𝑌𝑌 to represent 𝑉𝑉. a. How many days after its initial value at time 𝑡𝑡 = 0 did the
stock price return to $12 per share?
b. Write a quadratic equation representing the value of this stock over time.
c. Use this quadratic equation to predict the stock’s value after 15 days.
A STORY OF FUNCTIONS
©20 15 G re at Min ds eureka-math.org ALG I-M5-SE-1.3.0-08.2015
S.50
Lesson 9: Modeling a Context from a Verbal Description
M5 Lesson 9 ALGEBRA I
Problem Set 1. According to the Center for Disease Control and Prevention, the breast cancer rate for women has decreased at
0.9% per year between 2000 and 2009.
a. If 192,370 women were diagnosed with invasive breast cancer in 2009, how many were diagnosed in 2005? For this problem, assume that there is no change in population from 2005 and 2009.
b. According to the American Cancer Society, in 2005 there were 211,240 people diagnosed with breast cancer. In a written response, communicate how precise and accurate your solution in part (a) is, and explain why.
2. The functions 𝑓𝑓 and 𝑔𝑔 represent the population of two different kinds of bacteria, where 𝑥𝑥 is the time (in hours) and
𝑓𝑓 and 𝑔𝑔 are the number of bacteria (in thousands). 𝑓𝑓(𝑥𝑥) = 2𝑥𝑥2 + 7 and 𝑔𝑔(𝑥𝑥) = 2𝑥𝑥.
a. Between the third and sixth hour, which bacteria had a faster rate of growth?
b. Will the population of 𝑔𝑔 ever exceed the population of 𝑓𝑓? If so, at what hour?
Lesson Summary
The full modeling cycle is used to interpret the function and its graph, compute for the rate of change over an interval, and attend to precision to solve real-world problems in the context of population growth and decay and other problems in geometric sequences or forms of linear, exponential, and quadratic functions.
A STORY OF FUNCTIONS
©20 15 G re at Min ds eureka-math.org ALG I-M5-SE-1.3.0-08.2015
S.51
Related Documents