Alexandria City Public Schools Redistricting: Draft Options* December 2016 Preface The following document contains DRAFT Options for the Redistricting Review Committee to review and analyze. These options only serve as the starting point for creating viable scenarios that meet the project objectives and adhere to ACPS redistricting criteria. The options that are shown account for planned changes to facilities as identified in the ACPS facilities master plan. One question that always arises is, “How do these boundaries account for changes that happen in different years?” This is a good question and one that applies to this particular process. The table to the right shows the planned facility changes that the Review Committee is planning for. The best approach to redistricting is to first build a plan that factors in all of the planned changes, and then to determine how to phase in boundaries incrementally to account for each year’s change in facilities and capacity. Planning for the out-year of the timeframe is best because boundaries can be incrementally phased in to account for annual changes and students are only moved once during the process. In the instance of ACPS, the committee is charged to build a plan that takes ACPS out to 2019-20. The 2019-20 year is the target year because this is when Douglas MacArthur moves to a temporary building during its modernization. Even though 2019-20 is the final target year, the table above reflects that most of the school facility changes will occur for the 2018-19 school year. It is very likely that 2018-19 will be the year that most students are affected as a result of this redistricting plan, with smaller numbers of students possibly affected in 2017-18 and in 2019-20. 2016-17 Capacity and Utilization Statistics The table below shows the 2016-17 K-5 capacity for ACPS elementary schools. Pre-Kindergarten classrooms are not included in these capacity figures. Also, the 6-8 grade classrooms at Jefferson-Houston and Patrick Henry are not included in the K-5 capacity figures. The 2019-20 K-5 grade capacity figures are also represented in the table below. As stated in the Long Range Educational Facilities Plan, the target range for school utilization is between 90-110%. Elementary School 2016-17 K-5 Capacity 2019-20 K-5 Capacity 2016-17 K-5 Enrollment 2016-17 K-5 Enrolled Utilization 2016-17 K-5 Live-In 2016-17 K-5 Live-In Utilization (2016-17 Capacity) Charles Barrett 500 500 464 93% 357 71% Cora Kelly 371 371 407 110% 339 91% Douglas MacArthur 554 775 704 127% 678 122% George Mason 368 368 555 151% 565 154% James K Polk 756 850 773 102% 740 98% Jefferson-Houston 407 407 361 89% 383 94% John Adams 634 595 871 137% 762 120% Lyles-Crouch 375 375 436 116% 401 107% Matthew Maury 350 350 417 119% 373 107% Mount Vernon 755 755 880 117% 857 114% Patrick Henry 592 728 557 94% 552 93% Samuel W Tucker 620 620 790 127% 1055 170% William Ramsay 716 716 876 122% 972 136% New ES NA 638 NA NA NA NA Divisionwide 6998 8048 8091 116% 8034 115% Source: ACPS 10/31/2016 enrollment School K-5 Capacity New 6-8 Capacity Opening School Year John Adams*** 595 2018-19 James Polk 850 2017-18 New West ES 638 2018-19 Patrick Henry K-8* 728 234 2018-19 New Douglas McArthur** 775 2021-22 *6-8 grade students living in Patrick Henry zone are assumed to attend Patrick Henry ACPS - Planned Facility Changes **Douglas MacArthur moves to swing building in 2019-20 *** John Adams' K-5 capacity will decrease to 595 in 2018-19 to accommodate 20 Pre-K classes. 1 *Note: This redistricting handout now incorporates the new 2016-17 ACPS enrollment data.

Welcome message from author
This document is posted to help you gain knowledge. Please leave a comment to let me know what you think about it! Share it to your friends and learn new things together.
Transcript
Alexandria City Public Schools Redistricting: Draft Options* December 2016
Preface The following document contains DRAFT Options for the Redistricting Review Committee to review and analyze. These options only serve as the starting point for creating viable scenarios that meet the project objectives and adhere to ACPS redistricting criteria. The options that are shown account for planned changes to facilities as identified in the ACPS facilities master plan.
One question that always arises is, “How do these boundaries account for changes that happen in different years?” This is a good question and one that applies to this particular process.
The table to the right shows the planned facility changes that the Review Committee is planning for. The best approach to redistricting is to first build a plan that factors in all of the planned changes, and then to determine how to phase in boundaries incrementally to account for each year’s change in facilities and capacity. Planning for the out-year of the timeframe is best because boundaries can be incrementally phased in to account for annual changes and students are only moved once during the process. In the instance of ACPS, the committee is charged to build a plan that takes ACPS out to 2019-20. The 2019-20 year is the target year because this is when Douglas MacArthur moves to a temporary building during its modernization.
Even though 2019-20 is the final target year, the table above reflects that most of the school facility changes will occur for the 2018-19 school year. It is very likely that 2018-19 will be the year that most students are affected as a result of this redistricting plan, with smaller numbers of students possibly affected in 2017-18 and in 2019-20.
2016-17 Capacity and Utilization Statistics
The table below shows the 2016-17 K-5 capacity for ACPS elementary schools. Pre-Kindergarten classrooms are not included in these capacity figures. Also, the 6-8 grade classrooms at Jefferson-Houston and Patrick Henry are not included in the K-5 capacity figures. The 2019-20 K-5 grade capacity figures are also represented in the table below. As stated in the Long Range Educational Facilities Plan, the target range for school utilization is between 90-110%.
Elementary School2016-17 K-5
Capacity2019-20 K-5
Capacity2016-17 K-5 Enrollment
2016-17 K-5 Enrolled
Utilization
2016-17 K-5 Live-In
2016-17 K-5 Live-In
Utilization (2016-17 Capacity)
Charles Barrett 500 500 464 93% 357 71%Cora Kelly 371 371 407 110% 339 91%Douglas MacArthur 554 775 704 127% 678 122%George Mason 368 368 555 151% 565 154%James K Polk 756 850 773 102% 740 98%Jefferson-Houston 407 407 361 89% 383 94%John Adams 634 595 871 137% 762 120%Lyles-Crouch 375 375 436 116% 401 107%Matthew Maury 350 350 417 119% 373 107%Mount Vernon 755 755 880 117% 857 114%Patrick Henry 592 728 557 94% 552 93%Samuel W Tucker 620 620 790 127% 1055 170%William Ramsay 716 716 876 122% 972 136%New ES NA 638 NA NA NA NADivisionwide 6998 8048 8091 116% 8034 115%
Source: ACPS 10/31/2016 enrollment
School K-5 Capacity New 6-8 CapacityOpening School
Year
John Adams*** 595 2018-19
James Polk 850 2017-18New West ES 638 2018-19Patrick Henry K-8* 728 234 2018-19New Douglas McArthur** 775 2021-22
*6-8 grade students living in Patrick Henry zone are assumed to attend Patrick Henry
ACPS - Planned Facility Changes
**Douglas MacArthur moves to swing building in 2019-20*** John Adams' K-5 capacity will decrease to 595 in 2018-19 to accommodate 20 Pre-K classes.
1
*Note: This redistricting handout now incorporates the new 2016-17 ACPS enrollment data.

Alexandria City Public Schools Redistricting: Draft Options December 2016
Option Utilization Statistics
Note: As stated in the Long Range Educational Facilities Plan, the target range for school utilization is between 90-110%.
Elementary School2016-17 K-5
Capacity2019-20 K-5
Capacity2016-17 K-5
Live-In
Option 7 K-5
Live-In
Option 8 K-5
Live-In
Option 9 K-5
Live-In
Charles Barrett 500 500 357 573 489 489Cora Kelly 371 371 339 339 339 339Douglas MacArthur 554 775 678 772 710 710George Mason 368 368 565 391 433 433James K Polk 756 850 740 777 803 777Jefferson-Houston 407 407 383 383 383 383John Adams 634 595 762 582 591 591Lyles-Crouch 375 375 401 401 401 401Matthew Maury 350 350 373 373 373 373Mount Vernon 755 755 857 733 857 857Patrick Henry 592 728 552 762 738 762Samuel W Tucker 620 620 1055 628 626 628William Ramsay 716 716 972 717 717 717New ES NA 638 NA 603 574 574Divisionwide 6998 8048 8034 8034 8034 8034
Source: ACPS 10/31/2016 enrollment
Elementary School2016-17 K-5
Capacity2019-20 K-5
Capacity
2016-17 K-5 Live-In
Utilization (2016-17 Capacity)
Option 7 Live-In
Utilization
Option 8 Live-In
Utilization
Option 9 Live-In
Utilization
Charles Barrett 500 500 71% 115% 98% 98%Cora Kelly 371 371 91% 91% 91% 91%Douglas MacArthur 554 775 122% 100% 92% 92%George Mason 368 368 154% 106% 118% 118%James K Polk * 756 850 98% 91% (103%) 94% (106%) 91% (103%)Jefferson-Houston 407 407 94% 94% 94% 94%John Adams 634 595 120% 98% 99% 99%Lyles-Crouch 375 375 107% 107% 107% 107%Matthew Maury 350 350 107% 107% 107% 107%Mount Vernon 755 755 114% 97% 114% 114%Patrick Henry 592 728 93% 105% 101% 105%Samuel W Tucker 620 620 170% 101% 101% 101%William Ramsay 716 716 136% 100% 100% 100%New ES NA 638 NA 95% 90% 90%Divisionwide 6998 8048 115% 100% 100% 100%Source: ACPS 10/31/2016 enrollment. *James K. Polk data in parenthesis reflects utilization if Polk capacity addition does not occur.
2
Note: Option utilization is based on 2019-20 capacity.

Alexandria City Public Schools Redistricting: Draft Options December 2016
Option Impacts
Total K-5 ES 2016-17 live-in population moved to new boundary.
Key: Green represents K-5 students who live in the zone and are not impacted by the option. Pink represents the number of K-5 students who live in the zone and are impacted by the option. *Sample size is too small to report.
OptionTotal K-5Live-In
Impacted7 17148 14279 1349
ES 2016-17 Zone Option 7Total K-5 Live-In
Charles Barrett Charles Barrett 357Cora Kelly Cora Kelly 339Douglas MacArthur Douglas MacArthur 678George Mason Charles Barrett 216George Mason Douglas MacArthur 82George Mason George Mason 234George Mason Mount Vernon 33James K Polk James K Polk 560James K Polk William Ramsay 180Jefferson-Houston Jefferson-Houston 383John Adams Douglas MacArthur 12John Adams John Adams 582John Adams New ES 168Lyles Crouch Lyles Crouch 401Matthew Maury Matthew Maury 373Mount Vernon George Mason 157Mount Vernon Mount Vernon 700Patrick Henry James K Polk *Patrick Henry Patrick Henry 548Samuel W Tucker James K Polk 213Samuel W Tucker Patrick Henry 214Samuel W Tucker Samuel W Tucker 628William Ramsay New ES 435
William Ramsay William Ramsay 537Anything with an asterisk (*) indicates a size that is toosmall to report.
ES 2016-17 Zone Option 8Total K-5 Live-In
Charles Barrett Charles Barrett 357Cora Kelly Cora Kelly 339Douglas MacArthur Douglas MacArthur 678George Mason Charles Barrett 132George Mason George Mason 433James K Polk James K Polk 560James K Polk William Ramsay 180Jefferson-Houston Jefferson-Houston 383John Adams Douglas MacArthur 32John Adams John Adams 591John Adams New ES 139Lyles Crouch Lyles Crouch 401Matthew Maury Matthew Maury 373Mount Vernon Mount Vernon 857Patrick Henry James K Polk 80Patrick Henry Patrick Henry 472Samuel W Tucker James K Polk 163Samuel W Tucker Patrick Henry 266Samuel W Tucker Samuel W Tucker 626William Ramsay New ES 435William Ramsay William Ramsay 537
3

Alexandria City Public Schools Redistricting: Draft Options December 2016
Key: Green represents K-5 students who live in the zone and are not impacted by the option. Pink represents the number of K-5 students who live in the zone and are impacted by the option. *Sample size is too small to report.
ES 2016-17 Zone Option 9Total K-5 Live-In
Charles Barrett Charles Barrett 357Cora Kelly Cora Kelly 339Douglas MacArthur Douglas MacArthur 678George Mason Charles Barrett 132George Mason George Mason 433James K Polk James K Polk 560James K Polk William Ramsay 180Jefferson-Houston Jefferson-Houston 383John Adams Douglas MacArthur 32John Adams John Adams 591John Adams New ES 139Lyles Crouch Lyles Crouch 401Matthew Maury Matthew Maury 373Mount Vernon Mount Vernon 857Patrick Henry James K Polk *Patrick Henry Patrick Henry 548Samuel W Tucker James K Polk 213Samuel W Tucker Patrick Henry 214Samuel W Tucker Samuel W Tucker 628William Ramsay New ES 435William Ramsay William Ramsay 537
too small to report.
4

Alexandria City Public Schools Redistricting: Draft Options December 2016
2016-17 Ethnicity Statistics
Elementary School2016-17 K-5
Enrolled Black %
2016-17 K-5 Enrolled White %
2016-17 K-5 Enrolled
Hispanic %
2016-17 K-5 Enrolled Asian %
2016-17 K-5 Enrolled Other %
Charles Barrett 14% 50% 30% 3% 4%Cora Kelly 21% 8% 69% * *Douglas MacArthur 22% 51% 20% 2% 5%George Mason 6% 58% 33% * 3%James K Polk 39% 23% 31% 5% 3%Jefferson-Houston 65% 12% 18% * 4%John Adams 32% 19% 36% 9% 3%Lyles-Crouch 29% 55% 8% 3% 6%Matthew Maury 28% 57% 8% * 5%Mount Vernon 6% 33% 57% 1% 2%Patrick Henry 51% 10% 31% 6% 3%Samuel W Tucker 39% 25% 25% 7% 3%William Ramsay 23% 10% 57% 7% 3%New ES NA NA NA NA NADivisionwide 28% 30% 35% 4% 3%Source: ACPS 10/31/2016 enrollment* Sample Size is too small to report
Elementary School2016-17 K-5
Live-In Black %
2016-17 K-5 Live-In
White %
2016-17 K-5 Live-In
Hispanic %
2016-17 K-5 Live-In Asian %
2016-17 K-5 Live-In Other %
Charles Barrett 12% 43% 39% * 4%Cora Kelly 15% 9% 73% * *Douglas MacArthur 21% 53% 20% 2% 5%George Mason 5% 56% 36% * 2%James K Polk 37% 24% 31% 5% 3%Jefferson-Houston 51% 24% 20% * 4%John Adams 32% 21% 32% 12% 3%Lyles-Crouch 28% 55% 7% 3% 6%Matthew Maury 37% 50% 8% * 4%Mount Vernon 6% 37% 53% 2% 2%Patrick Henry 52% 10% 30% 5% 3%Samuel W Tucker 39% 23% 27% 7% 3%William Ramsay 23% 12% 56% 6% 2%New ES NA NA NA NA NADivisionwide 28% 30% 35% 4% 3%Source: ACPS 10/31/2016 enrollment* Sample Size is too small to report
5
Alexandria City Public Schools Redistricting: Draft Options December 2016
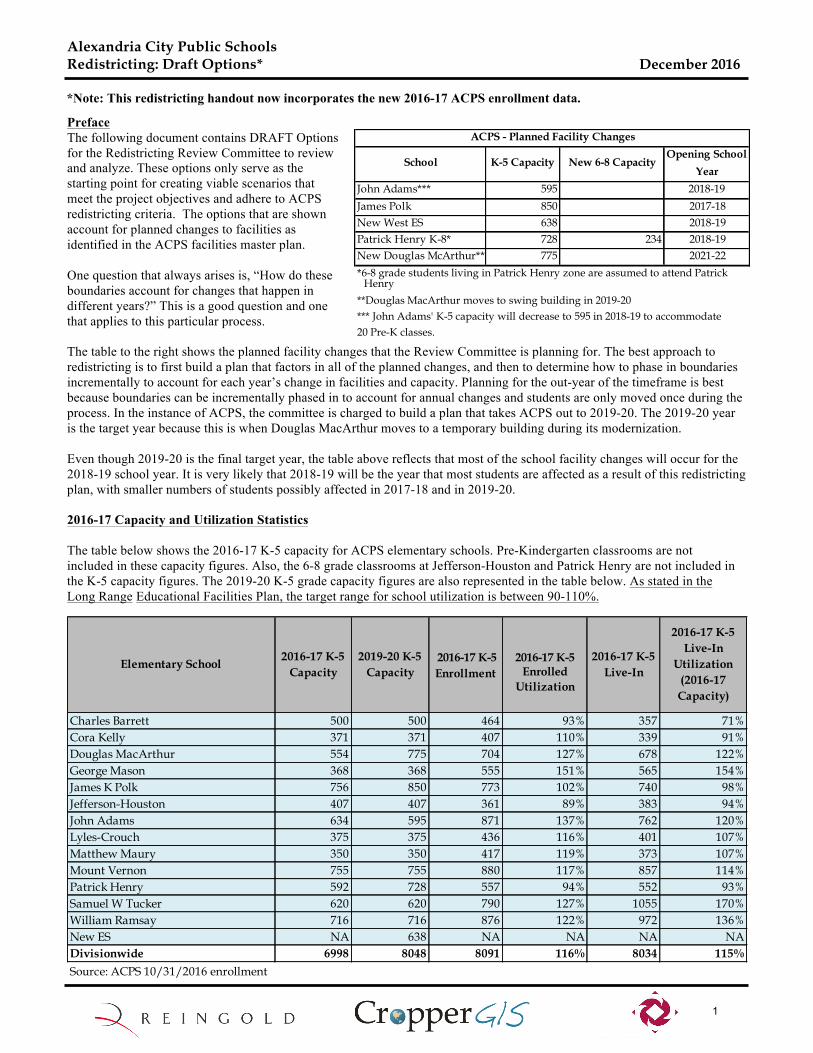
Option Ethnicity Statistics
Elementary SchoolOption 8 Black %
Option 8 White %
Option 8 Hispanic
%
Option 8 Asian %
Option 8 Other %
Charles Barrett 10% 46% 38% * 4%Cora Kelly 15% 9% 73% * *Douglas MacArthur 22% 52% 19% 2% 5%George Mason 5% 57% 36% * 2%James K Polk 37% 20% 35% 4% 3%Jefferson-Houston 51% 24% 20% * 4%John Adams 25% 23% 38% 13% *Lyles-Crouch 28% 55% 7% 3% 6%Matthew Maury 37% 50% 8% * 4%Mount Vernon 6% 37% 53% 2% 2%Patrick Henry 50% 12% 30% 5% 3%Samuel W Tucker 34% 33% 21% 9% 3%William Ramsay 32% 10% 50% 6% 2%New ES 32% 14% 44% 7% 3%Divisionwide 28% 30% 35% 4% 3%Source: ACPS 10/31/2016 enrollment* Sample Size is too small to report
Elementary SchoolOption 7 Black %
Option 7 White %
Option 7 Hispanic
%
Option 7 Asian %
Option 7 Other %
Charles Barrett 10% 29% 57% * 3%Cora Kelly 15% 9% 73% * *Douglas MacArthur 19% 55% 19% 2% 5%George Mason * 58% 38% * *James K Polk * 35% 22% 36% 4% 3%Jefferson-Houston 51% 24% 20% * 4%John Adams 25% 23% 38% 13% *Lyles-Crouch 28% 55% 7% 3% 6%Matthew Maury 37% 50% 8% * 4%Mount Vernon 7% 46% 44% 1% 3%Patrick Henry 48% 13% 29% 6% 3%Samuel W Tucker 38% 29% 22% 8% 3%William Ramsay 32% 10% 50% 6% 2%New ES 33% 15% 42% 7% 3%Divisionwide 28% 30% 35% 4% 3%Source: ACPS 10/31/2016 enrollment* Sample Size is too small to report
6

Alexandria City Public Schools Redistricting: Draft Options December 2016
2016-17 Gender Statistics
Elementary SchoolOption 9 Black %
Option 9 White %
Option 9 Hispanic
%
Option 9 Asian %
Option 9 Other %
Charles Barrett 10% 46% 38% * 4%Cora Kelly 15% 9% 73% * *Douglas MacArthur 22% 52% 19% 2% 5%George Mason 5% 57% 36% * 2%James K Polk 35% 22% 36% 4% 3%Jefferson-Houston 51% 24% 20% * 4%John Adams 25% 23% 38% 13% *Lyles-Crouch 28% 55% 7% 3% 6%Matthew Maury 37% 50% 8% * 4%Mount Vernon 6% 37% 53% 2% 2%Patrick Henry 48% 13% 29% 6% 3%Samuel W Tucker 38% 29% 22% 8% 3%William Ramsay 32% 10% 50% 6% 2%New ES 32% 14% 44% 7% 3%Divisionwide 28% 30% 35% 4% 3%Source: ACPS 10/31/2016 enrollment* Sample Size is too small to report
Elementary School2016-17 K-5
Enrolled Female %
2016-17 K-5 Enrolled Male %
2016-17 K-5 Live-In
Female %
2016-17 K-5 Live-In Male %
Charles Barrett 49% 51% 50% 50%Cora Kelly 44% 56% 45% 55%Douglas MacArthur 50% 50% 50% 50%George Mason 50% 50% 49% 51%James K Polk 45% 55% 44% 56%Jefferson-Houston 47% 53% 51% 49%John Adams 47% 53% 49% 51%Lyles-Crouch 49% 51% 50% 50%Matthew Maury 50% 50% 48% 52%Mount Vernon 51% 48% 52% 48%Patrick Henry 50% 50% 47% 53%Samuel W Tucker 53% 47% 51% 49%William Ramsay 47% 53% 46% 54%New ES NA NA NA NADivisionwide 49% 51% 49% 51%Source: ACPS 10/31/2016 enrollment
7
Alexandria City Public Schools Redistricting: Draft Options December 2016
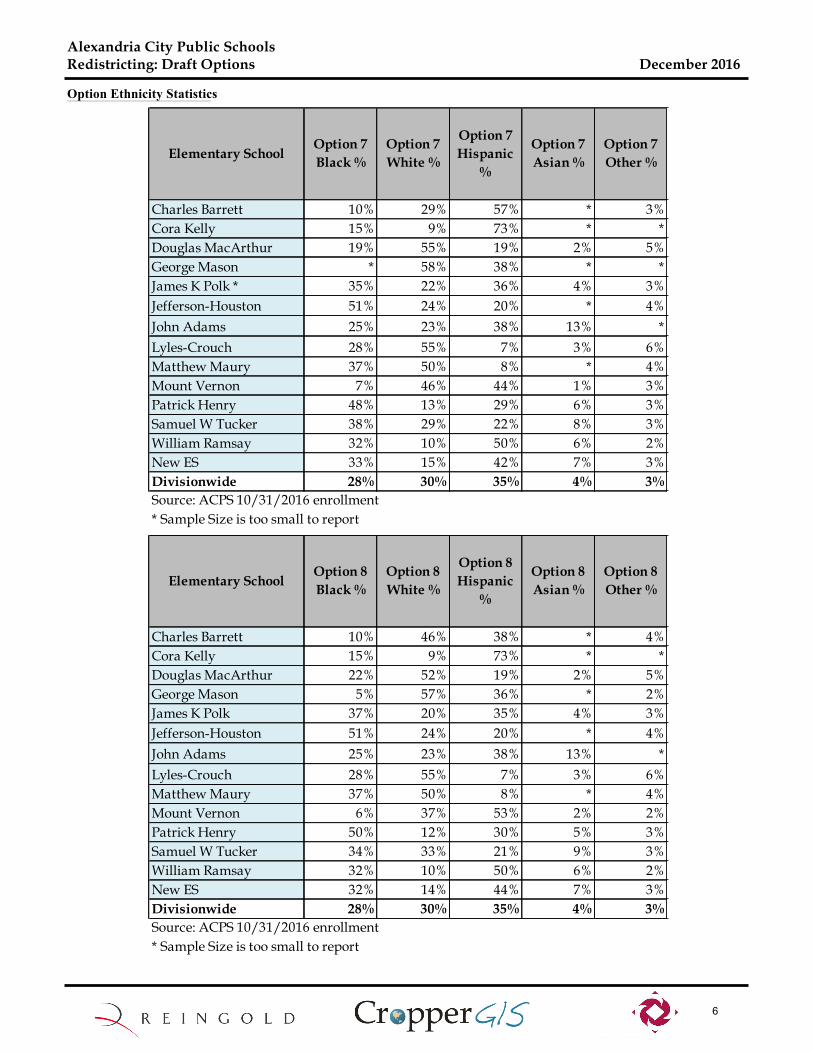
Option Gender Statistics
Source: ACPS 10/31/2016 enrollment
ELL Statistics
Elementary SchoolOption 7 Female %
Option 7 Male %
Option 8 Female %
Option 8 Male %
Option 9 Female %
Option 9 Male %
Charles Barrett 50% 50% 49% 51% 49% 51%Cora Kelly 45% 55% 45% 55% 45% 55%Douglas MacArthur 50% 50% 49% 51% 49% 51%George Mason 49% 51% 50% 50% 50% 50%James K Polk 46% 54% 45% 55% 46% 54%Jefferson-Houston 51% 49% 51% 49% 51% 49%John Adams 49% 51% 49% 51% 49% 51%Lyles-Crouch 50% 50% 50% 50% 50% 50%Matthew Maury 48% 52% 48% 52% 48% 52%Mount Vernon 52% 48% 52% 48% 52% 48%Patrick Henry 48% 52% 50% 50% 48% 52%Samuel W Tucker 51% 49% 50% 50% 51% 49%William Ramsay 47% 53% 47% 53% 47% 53%New ES 46% 54% 47% 53% 47% 53%Divisionwide 49% 51% 49% 51% 49% 51%
Elementary School2016-17
Enrolled K-5 ELL %
2016-17 K-5 Live-In ELL
%
Option 7 ELL %
Option 8 ELL %
Option 9 ELL %
Charles Barrett 21% 29% 43% 28% 28%Cora Kelly 57% 54% 54% 54% 54%Douglas MacArthur 16% 15% 14% 15% 15%George Mason 24% 25% 31% 26% 26%James K Polk 41% 42% 43% 42% 43%Jefferson-Houston 17% 15% 15% 15% 15%John Adams 51% 50% 52% 51% 51%Lyles-Crouch 8% 8% 8% 8% 8%Matthew Maury 7% 5% 5% 5% 5%Mount Vernon 44% 42% 32% 42% 42%Patrick Henry 39% 40% 40% 41% 40%Samuel W Tucker 36% 37% 32% 31% 32%William Ramsay 64% 63% 56% 56% 56%New ES NA NA 62% 64% 64%Divisionwide 36% 36% 36% 36% 36%Source: ACPS 10/31/2016 enrollment. ELL stands for English-Language Learner.
8
Alexandria City Public Schools Redistricting: Draft Options December 2016
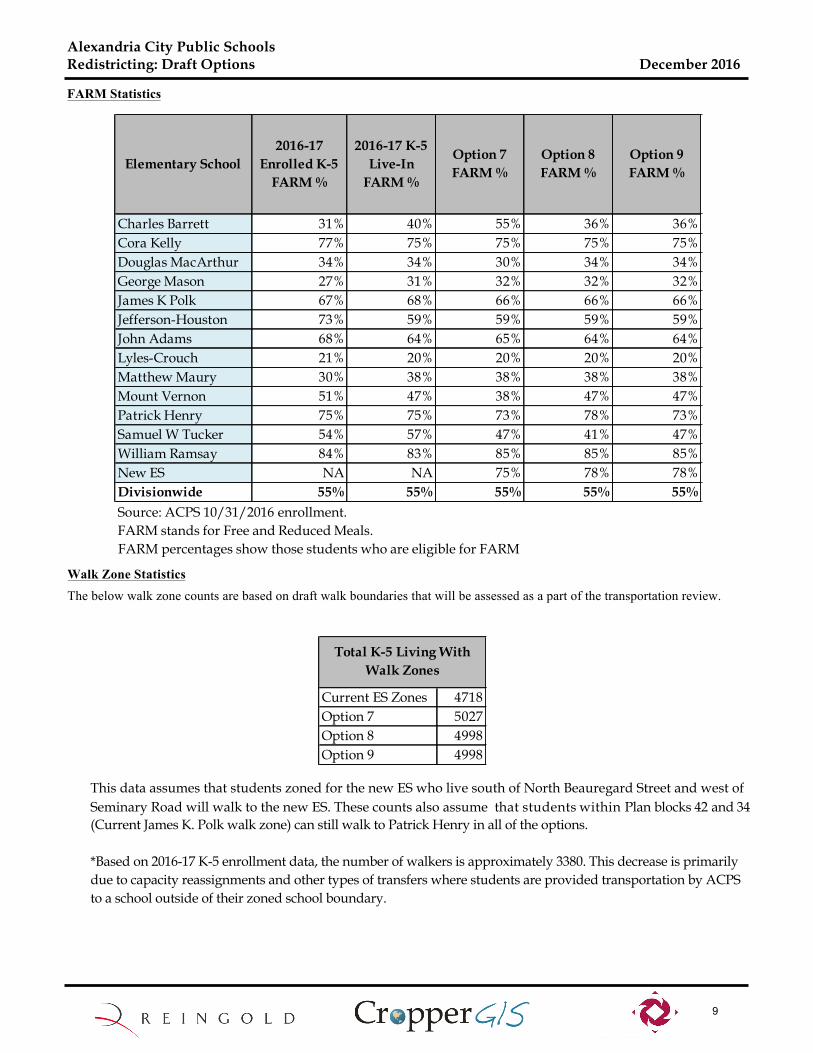
FARM Statistics
Walk Zone Statistics The below walk zone counts are based on draft walk boundaries that will be assessed as a part of the transportation review.
<>
Total K-5 Living With Walk Zones
Current ES Zones 4718Option 7 5027Option 8 4998Option 9 4998
Elementary School2016-17
Enrolled K-5 FARM %
2016-17 K-5 Live-In
FARM %
Option 7 FARM %
Option 8 FARM %
Option 9 FARM %
Charles Barrett 31% 40% 55% 36% 36%Cora Kelly 77% 75% 75% 75% 75%Douglas MacArthur 34% 34% 30% 34% 34%George Mason 27% 31% 32% 32% 32%James K Polk 67% 68% 66% 66% 66%Jefferson-Houston 73% 59% 59% 59% 59%John Adams 68% 64% 65% 64% 64%Lyles-Crouch 21% 20% 20% 20% 20%Matthew Maury 30% 38% 38% 38% 38%Mount Vernon 51% 47% 38% 47% 47%Patrick Henry 75% 75% 73% 78% 73%Samuel W Tucker 54% 57% 47% 41% 47%William Ramsay 84% 83% 85% 85% 85%New ES NA NA 75% 78% 78%Divisionwide 55% 55% 55% 55% 55%
Source: ACPS 10/31/2016 enrollment. FARM stands for Free and Reduced Meals. FARM percentages show those students who are eligible for FARM
9
This data assumes that students zoned for the new ES who live south of North Beauregard Street and west of Seminary Road will walk to the new ES. These counts also assume that students within Plan blocks 42 and 34 (Current James K. Polk walk zone) can still walk to Patrick Henry in all of the options.
*Based on 2016-17 K-5 enrollment data, the number of walkers is approximately 3380. This decrease is primarilydue to capacity reassignments and other types of transfers where students are provided transportation by ACPS to a school outside of their zoned school boundary.

")
")
")
")
_̂
")
")
")
")
#*
")
#*
")
")
")
")
!(
")
8
9
721
13
20
5
110
4
74
11
105
80
15
111
68
114
9332
59
51
3
113
12
87
43
92
86
85
90
106
1
9972
2
88
91
71
98
30
81
50
73
1029
62
6
33
18
67
94
25
109
44
61
100
82
34
70
116
49
22
35
64
45
28
63
54
17
103
112
23
26
47
56
69
89 101
52
27
95
60
24
39
97
102
48
104
41
107
66
42
40
46
84
37
78
119
76
16
79
83
55
36
115
19
53
31
122
57
65
118
120
117
121
14
96
38
75
108
77
58
New ESJohn Adams ES
Cora Kelly ES
Lyles-Crouch ES
George Mason ES Mount Vernon ES
Patrick Henry ES
James K. Polk ES
T.C. Williams HS
Matthew Maury ES
William Ramsay ES
Charles Barrett ES
Samuel W. Tucker ESJefferson-Houston ES
Douglas MacArthur ES
Minnie Howard Ninth Grade School
PITT
LEE
RUSSELL
ROYA
L
GLEBE
EISENHOWER
FAIR
FAX
TANEY
ALFR
EDHE
NRY
BEAUREGARD
PRINCEPICKETT
MOUNT VERNON
UNIO
N
WEST
JORD
AN
POTOMAC
WINDSOR
HOWA
RD
DAWES
VAN
DORN QUEEN
MAIN LINE
WHEELER
MONROE
REED
POLK
CAPITAL BELTWAY
KEY
PRINCESS
YALE
SAIN
T ASA
PH
PEGRAM
LURAY
WYTHE
DEWITT
NELSON
KING
ORONOCO
34TH
UTAH
SEMINARY
VINE
MADISON
FARM
HUME
EDSALL
PAYN
E
GREEN
CAMERON MILLS
TRINITY
HOLLY
DAVIS
MILL
RYNE
X
CRESTWOOD
KLIN
G
28TH
STEVENSON
VIRGINIA
SPRING
GUNSTON
DUKE
LINDEN
STEVENS
ALEXANDRIA
ABIN
GDON
OWEN
36TH
SKYH
ILL
ALLISON
RICHMOND
STAF
FORD
EARLY
BEVERLEY
TELEGRAPH
DOGWOOD
KNAP
P
TAYL
OR RU
N
UPLAND
ASHBY
OXFORD
PRESTON
BAYLISSTROTTER
SHOP
CAMBRIDGE
PATRICK
LESLIE
CLERMONT
DOVEJAMIESON
35TH
PAXT
ON
RAYBURN
CLIFF
HILLTOP
EVANS
TAFT
METRO
VICA
R
32ND
MARTIN CEDAR
VASSAR ELM
JUNIOR
EDISO
N
GAILL
ARD
PARK
COLUMBUS
SOME
RVEL
LE
ROTH
PALM
ER
JONES POINT
DALE
DEL RAY
QUAK
ER
TAYLOR
ARELL
HARRISON
STAD
IUM
SLAT
ERS
STUL
TZ
FROST
KENMORE
IVOR
SEATON
TYLER
LA GRANDE
CHURCH
MOSS
COLONEL ELLIS
CALLAHAN
WEST
VIEW
GILDEN
FLOYDVA
LLEY
USHER
RUFFNER
IVY
HOOFFS RUN
TRENT
ROSSER
23RD
DEANERYWOODLAND
ROAN
MAURY
EARL
CAMPUS
BRUC
E
DAY
JEFFERSON DAVIS
PELH
AM
OASIS
BRENMAN PARK
VENABLE
MANDEVILLE
JEFFERSON
GRIFFITH
ELIZ
ABET
H
QUAY
LA SALLE
BRADLEY
OSAGELARSTAN
NAGY MALCOLM
WATKINS MILL
CLERMONT
QUAK
ER
KING
PATR
ICK
TANEY
PATRICK
KING POTOMAC
ROSSER
PICKE
TT
TAYLOR RUN
H olmes Run
Back L ick Run Cameron Run
Potom
a cRi
ver
Lucky Run
P ikeBr
anc h
Four Mi le Ru n
Four Mile Run Creek
Long Branch
F our M i le Run
LegendType") ES#* MS_̂ HS!( 9th Grade School
Planning Blocks
ES Boundaries 2016-17Charles BarrettCora KellyDouglas MacArthurGeorge MasonJames K PolkJefferson-Houston
John AdamsLyles CrouchMatthew MauryMount VernonPatrick HenrySamuel W TuckerWilliam Ramsay
0 0.5 10.25Miles4Data Sources: Alexandria City Public Schools, VA
Cartographer: ATC, November 2016.
Alexandria City Public Schools, VAElementary Boundaries 2016-17
Plan Block IDs
Map Note: The pink labels show the Plan Block IDs.
")
")
")
")
_̂
")
")
")
")
#*
")
#*
")
")
")
")
!(
")
46
7
83
7418
1
2
126
68
234
36
74
339
122
8
20
161
49
0
215
43
068
50
0
126
17
24
21
50
0
31120
1882
37
43
9
9
117
76
2577
33
98
3
2
51
0
104
13
57
232
78
61
20
18
100
101
31
46
57
6
4
163
135
18
154
112
232
58
760
6
8
18
50
14
86
87
41
78
281
75
6
12139
0
50
25
87
7
168
8
151
14
68
28
185
98
27
163
13
17
55
1
9168
11
54
97
98
221
5
15765
68
50
10
160
0
6
New ESJohn Adams ES
Cora Kelly ES
Lyles-Crouch ES
George Mason ES Mount Vernon ES
Patrick Henry ES
James K. Polk ES
T.C. Williams HS
Matthew Maury ES
William Ramsay ES
Charles Barrett ES
Samuel W. Tucker ESJefferson-Houston ES
Douglas MacArthur ES
Minnie Howard Ninth Grade School
PITT
LEE
RUSSELL
ROYA
L
GLEBE
EISENHOWER
FAIR
FAX
TANEY
ALFR
EDHE
NRY
BEAUREGARD
PRINCEPICKETT
MOUNT VERNON
HENRY G SHIRLEY MEMORIAL
UNIO
N
WEST
JORD
AN
POTOMAC
WINDSORHOWA
RD
DAWES
VAN
DORN QUEEN
MAIN LINE
WHEELER
MONROE
REED
POLK
CAPITAL BELTWAY
KEY
PRINCESS
YALE
SAIN
T ASA
PH
PEGRAM
WYTHE
DEWITT
NELSON
KING
ORONOCO
34TH
UTAH
SEMINARY
VINE
MADISON
FARM
HUME
EDSALL
PAYN
E
GREEN
CAMERON MILLS
TRINITY
HOLLY
DAVIS
MILL
RYNE
X
CRESTWOOD
28TH
STEVENSON
VIRGINIA
SPRING
GUNSTON
DUKE
LINDEN
STEVENS
ALEXANDRIA
ABIN
GDON
GEORGE WASHINGTON MEMORIAL
OWEN
36TH
SKYHILL
ALLISON
RICHMOND
STAF
FORD
EARLY
FORD BEVERLEY
TELEGRAPH
DOGWOOD
KNAP
P
TAYL
OR RU
N
UPLAND
ASHBY
OXFORD
WAYNE
PRESTON
BAYLISSTROTTER
SHOP
CAMBRIDGE
PATRICK
LESLIE
CLERMONT
DOVEJAMIESON
35TH
PAXT
ON
RAYBURN
CLIFF
HILLTOP
EVANS
TAFT
METRO
VICA
R
32ND
MARTIN CEDAR
VASSAR ELM
JUNIOR
EDISO
N
GAILL
ARD
PARK
COLUMBUS
SOME
RVEL
LE
ROTH
MARINA
PALM
ER
JONES POINT
DALE
DEL RAY
QUAK
ER
ARELL
HARRISON
STAD
IUM
SLAT
ERS
STUL
TZ
FROST
KENMORE
ELLIC
OTT
IVOR
SEATON
TYLER
LA GRANDE
CHURCH
MOSS
COLONEL ELLIS
CALLAHAN
WEST
VIEW
GILDEN
FLOYDVA
LLEY
USHER
RUFFNER
IVY
HOOFFS RUN
TRENT
ROSSER
23RD
DEANERYWOODLAND
ROAN
MAURY
EARL
CAMPUS
DAY
JEFFERSON DAVIS
PELH
AM
OASIS
BRENMAN PARK
VENABLE
MANDEVILLE
JEFFERSON
GRIFFITH
SEAY
ELIZ
ABET
H
QUAY
LA SALLE
BRADLEY
OSAGELARSTAN
NAGY MALCOLM
WATKINS MILL
PATR
ICK
PATRICK
QUAK
ER
KINGHENRY
PICKE
TT
TANEY
TAYLOR RUN
CLERMONT
POTOMAC
ROSSER
H olmes Run
Back L ick Run Cameron Run
Potom
a cRi
ver
Lucky Run
P ikeBr
anc h
Four Mi le Ru n
Four Mile Run Creek
Long Branch
F our M i le Run
LegendType") ES#* MS_̂ HS!( 9th Grade School
Planning Blocks
ES Boundaries 2016-17Charles BarrettCora KellyDouglas MacArthurGeorge MasonJames K PolkJefferson-Houston
John AdamsLyles CrouchMatthew MauryMount VernonPatrick HenrySamuel W TuckerWilliam Ramsay
0 0.5 10.25Miles4Data Sources: Alexandria City Public Schools, VA
Date of Student Data = 10/31/2016Cartographer: ATC, November 2016.
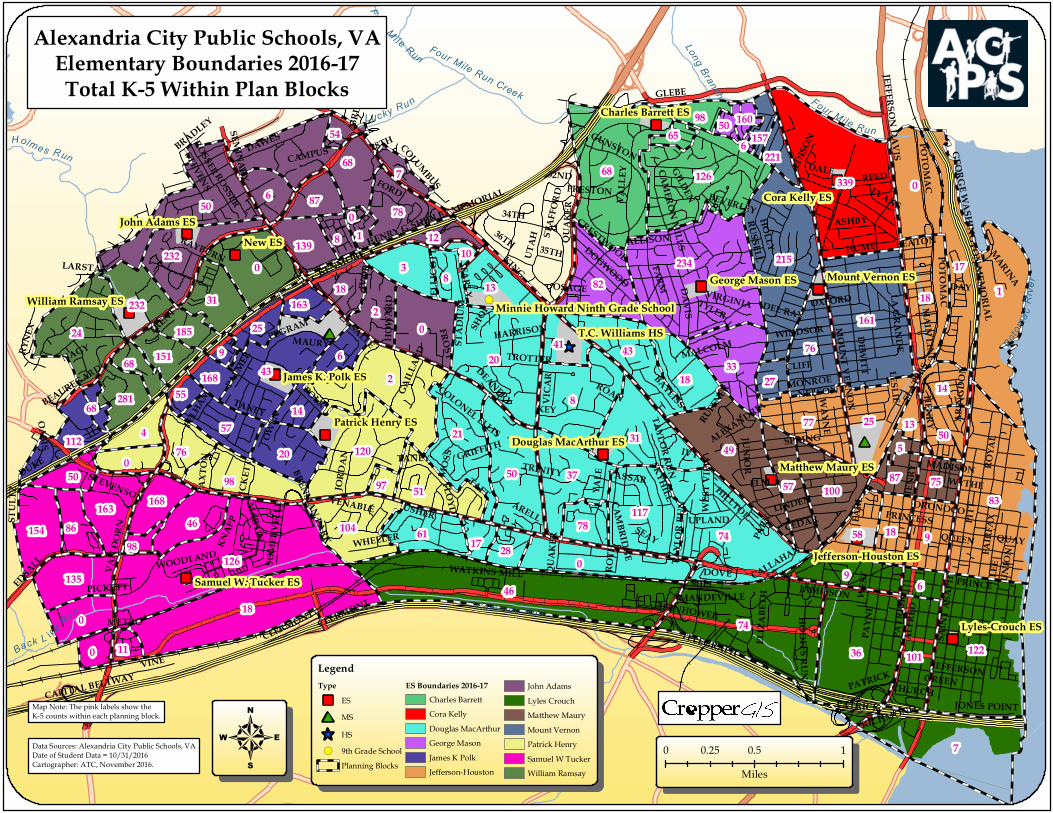
Alexandria City Public Schools, VAElementary Boundaries 2016-17Total K-5 Within Plan Blocks
Map Note: The pink labels show the K-5 counts within each planning block.
")
")
")
")
_̂
")
")
")
")
#*
")
#*
")
")
")
")
!(
")
46
7
83
7418
1
2
126
68
234
36
74
339
122
8
20
161
49
0
215
43
068
50
0
126
17
24
21
50
0
31120
1882
37
43
9
9
117
76
2577
33
98
3
2
51
0
104
13
57
232
78
61
20
18
100
101
31
46
57
6
4
163
135
18
154
112
232
58
760
6
8
18
50
14
86
87
41
78
281
75
6
12139
0
50
25
87
7
168
8
151
14
68
28
185
98
27
163
13
17
55
1
9168
11
54
97
98
221
5
15765
68
50
10
160
0
6
New ESJohn Adams ES
Cora Kelly ES
Lyles-Crouch ES
George Mason ES Mount Vernon ES
Patrick Henry ES
James K. Polk ES
T.C. Williams HS
Matthew Maury ES
William Ramsay ES
Charles Barrett ES
Samuel W. Tucker ESJefferson-Houston ES
Douglas MacArthur ES
Minnie Howard Ninth Grade School
PITT
LEE
RUSSELL
ROYA
L
GLEBE
EISENHOWER
FAIR
FAX
TANEY
ALFR
EDHE
NRY
BEAUREGARD
PRINCEPICKETT
MOUNT VERNON
HENRY G SHIRLEY MEMORIAL
UNIO
N
WEST
JORD
AN
POTOMAC
WINDSORHOWA
RD
DAWES
VAN
DORN QUEEN
MAIN LINE
WHEELER
MONROE
REED
POLK
CAPITAL BELTWAY
KEY
PRINCESS
YALE
SAIN
T ASA
PH
PEGRAM
WYTHE
DEWITT
NELSON
KING
ORONOCO
34TH
UTAH
SEMINARY
VINE
MADISON
FARM
HUME
PAYN
E
EDSALL
GREEN
CAMERON MILLS
TRINITY
HOLLY
DAVIS
MILL
RYNE
X
CRESTWOOD
28TH
VIRGINIA
STEVENSON
SPRING
GUNSTON
DUKE
LINDEN
STEVENS
ALEXANDRIA ABIN
GDON
GEORGE WASHINGTON MEM
ORIAL
OWEN
36TH
SKYHILL
ALLISON
RICHMOND
STAF
FORD
EARLY
FORD BEVERLEY
TELEGRAPH
DOGWOOD
KNAP
P
TAYL
OR RU
N
UPLAND
ASHBY
OXFORD
WAYNE
PRESTON
BAYLISSTROTTER
SHOP
CAMBRIDGE
PATRICK
LESLIE
CLERMONT
DOVEJAMIESON
35TH
PAXT
ON
RAYBURN
CLIFF
HILLTOP
EVANS
TAFT
METRO
VICA
R
32ND
MARTIN CEDAR
VASSAR ELM
JUNIOR
EDISO
N
GAILL
ARD
PARK
COLUMBUS
SOME
RVEL
LE
ROTH
MARINA
PALM
ER
JONES POINT
DALE
DEL RAY
QUAK
ER
ARELL
HARRISON
STAD
IUM
SLAT
ERS
FROST
KENMORE
ELLI
COTT
IVOR
SEATON
TYLER
LA GRANDE
CHURCH
MOSS
COLONEL ELLIS
CALLAHAN
WEST
VIEW
GILDEN
FLOYDVA
LLEY
USHER
RUFFNER
IVY
HOOFFS RUN
TRENT
ROSSER
23RD
DEANERY
WOODLAND
ROAN
MAURY
EARL
CAMPUS
DAY
JEFFERSON DAVIS
PELH
AM
OASIS
BRENMAN PARK
VENABLE
MANDEVILLE
JEFFERSON
GRIFFITH
SEAY
ELIZ
ABET
H
QUAY
LA SALLE
BRADLEY
OSAGELARSTAN
NAGY MALCOLM
WATKINS MILL
PATR
ICK
PATRICK
QUAK
ER
KINGHENRY
PICKE
TT
TANEY
TAYLOR RUN
CLERMONT
POTOMAC
ROSSER
H olmes Run
Back L ick Run Cameron Run
Potom
acRi
ver
Lu cky Ru n Fou r M ile Ru n
Pike
Bra n
ch
Four Mile Run Creek
Long Branch
Fo ur Mi l e Run
LegendType") ES#* MS_̂ HS!( 9th Grade School
ES Boundaries 2016-17Planning Blocks
Option 7 Boundaries 2019-20Charles BarrettCora KellyDouglas MacArthurGeorge MasonJames K PolkJefferson-HoustonJohn Adams
Lyles CrouchMatthew MauryMount VernonNew ESPatrick HenrySamuel W TuckerWilliam Ramsay
0 0.5 10.25Miles4
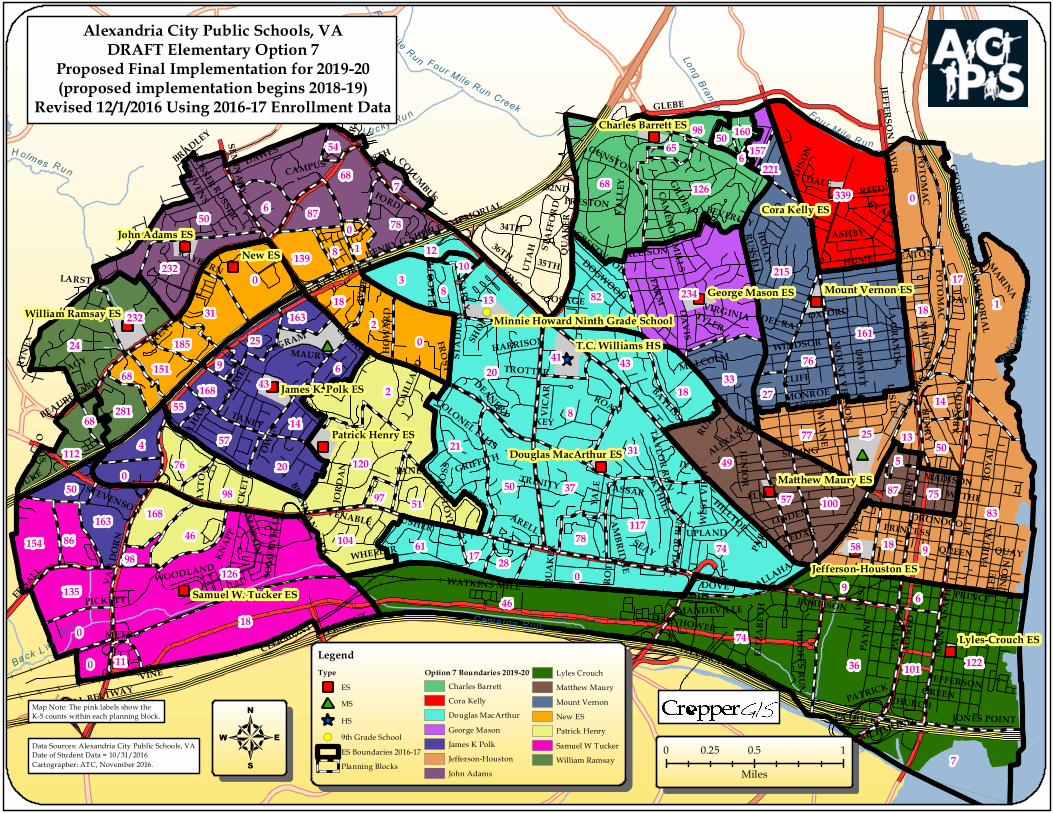
Map Note: The pink labels show the K-5 counts within each planning block.
Alexandria City Public Schools, VADRAFT Elementary Option 7
Proposed Final Implementation for 2019-20(proposed implementation begins 2018-19)
Revised 12/1/2016 Using 2016-17 Enrollment Data
Data Sources: Alexandria City Public Schools, VADate of Student Data = 10/31/2016Cartographer: ATC, November 2016.

")
")
")
")
_̂
")
")
")
")
#*
")
#*
")
")
")
")
!(
")
46
7
83
7418
1
2
126
68
234
36
74
339
122
8
20
161
49
0
215
43
068
50
0
126
17
24
21
50
0
31120
1882
37
43
9
9
117
76
2577
33
98
3
2
51
0
104
13
57
232
78
61
20
18
100
101
31
46
57
6
4
163
135
18
154
112
232
58
760
6
8
18
50
14
86
87
41
78
281
75
6
12139
0
50
25
87
7
168
8
151
14
68
28
185
98
27
163
13
17
55
1
9168
11
54
97
98
221
5
15765
68
50
10
160
0
6
New ESJohn Adams ES
Cora Kelly ES
Lyles-Crouch ES
George Mason ES Mount Vernon ES
Patrick Henry ES
James K. Polk ES
T.C. Williams HS
Matthew Maury ES
William Ramsay ES
Charles Barrett ES
Samuel W. Tucker ESJefferson-Houston ES
Douglas MacArthur ES
Minnie Howard Ninth Grade School
PITT
LEE
RUSSELL
ROYA
L
GLEBE
EISENHOWER
FAIR
FAX
TANEY
ALFR
EDHE
NRY
BEAUREGARD
PRINCEPICKETT
MOUNT VERNON
HENRY G SHIRLEY MEMORIAL
UNIO
N
WEST
JORD
AN
POTOMAC
WINDSORHOWA
RD
DAWES
VAN
DORN QUEEN
MAIN LINE
WHEELER
MONROE
REED
POLK
CAPITAL BELTWAY
KEY
PRINCESS
YALE
SAIN
T ASA
PH
PEGRAM
WYTHE
DEWITT
NELSON
KING
ORONOCO
34TH
UTAH
SEMINARY
VINE
MADISON
FARM
HUME
PAYN
E
EDSALL
GREEN
CAMERON MILLS
TRINITY
HOLLY
DAVIS
MILL
RYNE
X
CRESTWOOD
28TH
VIRGINIA
STEVENSON
SPRING
GUNSTON
DUKE
LINDEN
STEVENS
ALEXANDRIA ABIN
GDON
GEORGE WASHINGTON MEM
ORIAL
OWEN
36TH
SKYHILL
ALLISON
RICHMOND
STAF
FORD
EARLY
FORD BEVERLEY
TELEGRAPH
DOGWOOD
KNAP
P
TAYL
OR RU
N
UPLAND
ASHBY
OXFORD
WAYNE
PRESTON
BAYLISSTROTTER
SHOP
CAMBRIDGE
PATRICK
LESLIE
CLERMONT
DOVEJAMIESON
35TH
PAXT
ON
RAYBURN
CLIFF
HILLTOP
EVANS
TAFT
METRO
VICA
R
32ND
MARTIN CEDAR
VASSAR ELM
JUNIOR
EDISO
N
GAILL
ARD
PARK
COLUMBUS
SOME
RVEL
LE
ROTH
MARINA
PALM
ER
JONES POINT
DALE
DEL RAY
QUAK
ER
ARELL
HARRISON
STAD
IUM
SLAT
ERS
FROST
KENMORE
ELLI
COTT
IVOR
SEATON
TYLER
LA GRANDE
CHURCH
MOSS
COLONEL ELLIS
CALLAHAN
WEST
VIEW
GILDEN
FLOYDVA
LLEY
USHER
RUFFNER
IVY
HOOFFS RUN
TRENT
ROSSER
23RD
DEANERY
WOODLAND
ROAN
MAURY
EARL
CAMPUS
DAY
JEFFERSON DAVIS
PELH
AM
OASIS
BRENMAN PARK
VENABLE
MANDEVILLE
JEFFERSON
GRIFFITH
SEAY
ELIZ
ABET
H
QUAY
LA SALLE
BRADLEY
OSAGELARSTAN
NAGY MALCOLM
WATKINS MILL
PATR
ICK
PATRICK
QUAK
ER
KINGHENRY
PICKE
TT
TANEY
TAYLOR RUN
CLERMONT
POTOMAC
ROSSER
H olmes Run
Back L ick Run Cameron Run
Potom
acRi
ver
Lu cky Ru n Fou r M ile Ru n
Pike
Bra n
ch
Four Mile Run Creek
Long Branch
Fo ur Mi l e Run
LegendType") ES#* MS_̂ HS!( 9th Grade School
ES Boundaries 2016-17Planning Blocks
Option 8 Boundaries 2019-20Charles BarrettCora KellyDouglas MacArthurGeorge MasonJames K PolkJefferson-HoustonJohn Adams
Lyles CrouchMatthew MauryMount VernonNew ESPatrick HenrySamuel W TuckerWilliam Ramsay
0 0.5 10.25Miles4
Map Note: The pink labels show the K-5 counts within each planning block.
Data Sources: Alexandria City Public Schools, VADate of Student Data = 10/31/2016Cartographer: ATC, November 2016.
Alexandria City Public Schools, VADRAFT Elementary Option 8
Proposed Final Implementation for 2019-20(proposed implementation begins 2018-19)
Revised 12/1/2016 Using 2016-17 Enrollment Data

")
")
")
")
_̂
")
")
")
")
#*
")
#*
")
")
")
")
!(
")
46
7
83
7418
1
2
126
68
234
36
74
339
122
8
20
161
49
0
215
43
068
50
0
126
17
24
21
50
0
31120
1882
37
43
9
9
117
76
2577
33
98
3
2
51
0
104
13
57
232
78
61
20
18
100
101
31
46
57
6
4
163
135
18
154
112
232
58
760
6
8
18
50
14
86
87
41
78
281
75
6
12139
0
50
25
87
7
168
8
151
14
68
28
185
98
27
163
13
17
55
1
9168
11
54
97
98
221
5
15765
68
50
10
160
0
6
New ESJohn Adams ES
Cora Kelly ES
Lyles-Crouch ES
George Mason ES Mount Vernon ES
Patrick Henry ES
James K. Polk ES
T.C. Williams HS
Matthew Maury ES
William Ramsay ES
Charles Barrett ES
Samuel W. Tucker ESJefferson-Houston ES
Douglas MacArthur ES
Minnie Howard Ninth Grade School
PITT
LEE
RUSSELL
ROYA
L
GLEBE
EISENHOWER
FAIR
FAX
TANEY
ALFR
EDHE
NRY
BEAUREGARD
PRINCEPICKETT
MOUNT VERNON
HENRY G SHIRLEY MEMORIAL
UNIO
N
WEST
JORD
AN
POTOMAC
WINDSORHOWA
RD
DAWES
VAN
DORN QUEEN
MAIN LINE
WHEELER
MONROE
REED
POLK
CAPITAL BELTWAY
KEY
PRINCESS
YALE
SAIN
T ASA
PH
PEGRAM
WYTHE
DEWITT
NELSON
KING
ORONOCO
34TH
UTAH
SEMINARY
VINE
MADISON
FARM
HUME
PAYN
E
EDSALL
GREEN
CAMERON MILLS
TRINITY
HOLLY
DAVIS
MILL
RYNE
X
CRESTWOOD
28TH
VIRGINIA
STEVENSON
SPRING
GUNSTON
DUKE
LINDEN
STEVENS
ALEXANDRIA ABIN
GDON
GEORGE WASHINGTON MEM
ORIAL
OWEN
36TH
SKYHILL
ALLISON
RICHMOND
STAF
FORD
EARLY
FORD BEVERLEY
TELEGRAPH
DOGWOOD
KNAP
P
TAYL
OR RU
N
UPLAND
ASHBY
OXFORD
WAYNE
PRESTON
BAYLISSTROTTER
SHOP
CAMBRIDGE
PATRICK
LESLIE
CLERMONT
DOVEJAMIESON
35TH
PAXT
ON
RAYBURN
CLIFF
HILLTOP
EVANS
TAFT
METRO
VICA
R
32ND
MARTIN CEDAR
VASSAR ELM
JUNIOR
EDISO
N
GAILL
ARD
PARK
COLUMBUS
SOME
RVEL
LE
ROTH
MARINA
PALM
ER
JONES POINT
DALE
DEL RAY
QUAK
ER
ARELL
HARRISON
STAD
IUM
SLAT
ERS
FROST
KENMORE
ELLI
COTT
IVOR
SEATON
TYLER
LA GRANDE
CHURCH
MOSS
COLONEL ELLIS
CALLAHAN
WEST
VIEW
GILDEN
FLOYDVA
LLEY
USHER
RUFFNER
IVY
HOOFFS RUN
TRENT
ROSSER
23RD
DEANERY
WOODLAND
ROAN
MAURY
EARL
CAMPUS
DAY
JEFFERSON DAVIS
PELH
AM
OASIS
BRENMAN PARK
VENABLE
MANDEVILLE
JEFFERSON
GRIFFITH
SEAY
ELIZ
ABET
H
QUAY
LA SALLE
BRADLEY
OSAGELARSTAN
NAGY MALCOLM
WATKINS MILL
PATR
ICK
PATRICK
QUAK
ER
KINGHENRY
PICKE
TT
TANEY
TAYLOR RUN
CLERMONT
POTOMAC
ROSSER
H olmes Run
Back L ick Run Cameron Run
Potom
acRi
ver
Lu cky Ru n Fou r M ile Ru n
Pike
Bra n
ch
Four Mile Run Creek
Long Branch
Fo ur Mi l e Run
LegendType") ES#* MS_̂ HS!( 9th Grade School
ES Boundaries 2016-17Planning Blocks
Option 9 Boundaries 2019-20Charles BarrettCora KellyDouglas MacArthurGeorge MasonJames K PolkJefferson-HoustonJohn Adams
Lyles CrouchMatthew MauryMount VernonNew ESPatrick HenrySamuel W TuckerWilliam Ramsay
0 0.5 10.25Miles4
Map Note: The pink labels show the K-5 counts within each planning block.
Data Sources: Alexandria City Public Schools, VADate of Student Data = 10/31/2016Cartographer: ATC, November 2016.
Alexandria City Public Schools, VADRAFT Elementary Option 9
Proposed Final Implementation for 2019-20(proposed implementation begins 2018-19)
Revised 12/1/2016 Using 2016-17 Enrollment Data
Related Documents