Welcome message from author
This document is posted to help you gain knowledge. Please leave a comment to let me know what you think about it! Share it to your friends and learn new things together.
Transcript

Institutional Equities
This page has been intentionally left blank

Institutional Equities
Alcoholic Beverage Sector
Initi
atin
g C
over
age
Good Food, Great Drinks India ranks among the most attractive alcoholic beverage markets in the world. Within the Indian consumer space too we expect alcoholic beverages to be the fastest-growing sub-sector during the period FY18-FY21E. We expect operating earnings to be in the vicinity of 22%, well ahead of its peers in food and personal care sectors. Several drivers such as demographics, increase in per capita spending on the back of lifestyle and premiumisation driven by improved affordability and continued innovation are driving substantial growth for the sector. Although regulation challenges are still fairly high, the responsible and sustainable strategy adopted by most companies is giving them adequate leverage with policy makers and we believe this aspect should not be a major impediment to earnings growth. We initiate coverage on the alcoholic beverage sector with a positive view and our key investment recommendations are United Breweries (UBL) and United Spirits (USL).
Robust fundamentals underpin the opportunity: Per capita consumption increase in the region of 2%-3%, which coupled with new consumer addition of a similar magnitude, should support attractive high single-digit volume growth. Although the current consumption in the country is skewed in favour of spirits, we expect beer to outpace industry growth considering that it is biased towards affluence and has a great appeal with women and youth.
Affordable luxury: Consumer evolution, lifestyles and continued increase in disposable income has resulted in most Indian consumers trading up significantly in the alcoholic beverage segment and we believe this momentum will only gain further strength with ‘less is more’ becoming a more prevalent theme. Several new innovation and product launches in the premium portfolio have also provided a further fillip to this trend, and we expect premiumisation to contribute as much as 30%-50% to annual growth of the industry.
Regulation challenges are modest: Apart from taxation, we do not envisage any major regulation challenges to the sector as most state governments appear to be much more progressive in their outlook towards alcohol purchase and consumption. If the distribution side gets a small fillip, as seen recently in Uttar Pradesh or UP, there could be significant uplift in growth rate. Governments are also mindful of price elasticity and some recent behaviour suggests that they will not be fairly disruptive in their approach.
Margin expansion likely to sustain: Despite price controls and stiff taxation challenges, most companies have managed to report margin gains over the past decade. Considering that the top-line outlook is considerably improved, we expect these trends to continue and sustain the current pace of annual expansion by 50bps-100 bps over FY18-FY21E.
Valuations attractive after consolidation: Despite reporting significantly improved earnings performance in the past 12 months, stocks of alcoholic beverages companies have largely moved sideways in line with sluggish markets. This consolidation has significantly improved their valuations and they are now trading in line or below historical valuation averages. Considering that growth will be significantly above historical averages and ahead of peers in the consumer space, we find the valuations to be attractive for the sector and have assigned Buy rating on United Breweries and United Spirits.
View: Positive
Vijay Chugh Research Analyst [email protected] +91-22-3926 8064
Company Rating Market cap
CMP (Rs)
Target price (Rs)
Up/ Down (%)
EPS (Rs) P/E (x) RoCE (%)
Rsbn US$bn FY19E FY20E FY21E FY19E FY20E FY21E FY19E FY20E FY21E
United Breweries Buy 329.2 4.6 1,237 1,525 23 22.3 27.6 33.3 55.4 44.9 37.2 28.2 29.4 29.8
United Spirits Buy 457.8 6.4 641 765 19 10.1 13.9 16.6 63.7 46.0 38.6 20.0 22.5 23.4
Source: Nirmal Bang Institutional Equities Research
13 December 2018
Institutional Equities
4 Alcoholic Beverage Sector
Table of Content
Indian alcoholic beverages could outpace food and tobacco sectors’ growth by about 300bps ………………………………………………………………………….…………………………………….…05
March of the premium Indian consumer continues…………………………………………………….....06
Digital is a key part of consumer outreach…………………………………………………..………….....07
Regulation headwinds for the industry have moderated……………………………………………….....08
Revenue growth for alcoholic beverages staging a comeback………………………………….……....10
Valuation and recommendation…………………………………………………………….……...…..…...12
Overall risks to our rating…………………………………………………………………….……...…..…...14
Companies
United Breweries …………………………….…………………………………………………...…….…….17
United Spirits ………………………………………………………………….……………….…..…....……35
Institutional Equities
5 Alcoholic Beverage Sector
“There is nothing which has yet been contrived by man, by which so much happiness is produced as by a good tavern or inn.” - Samuel Johnson
Indian alcoholic beverages could outpace food and tobacco sectors’ growth by about 300bps
Indian food and beverage sector has grown substantially in the past few years spurred by vast changes in consumer preferences along with equally innovative and product and service offering by companies. Moderate food inflation, health and social media have played a key role in improving the risk appetite of Indian consumers and increasingly consider premiumisation. All these factors, in our opinion, will support early-teen growth for the sector. Within the food and beverage space, we find alcoholic beverage companies best placed to exploit this S curve opportunity. There is a fair bit of latent demand in the sector which had witnessed growth of a mere 2% as opposed to 4% reported by the food and tobacco companies for the period FY14-FY18. In our opinion, driven by a multitude of factors such as lifestyle, affordability and moderating regulating challenges, the sector is well poised to deliver growth in mid-teens (12%-15%) which is around 300bps higher than our expectation from the food and tobacco sectors.
Globally too, India ranks among the most attractive alcoholic beverage market. Global alcoholic beverage market is estimated in the region of US$1.4trn. From a regional perspective, Asia Pacific is the largest and fastest-growing market led by countries such as China, India and Japan. The Indian alcoholic beverages market is estimated to be in the region of US$30bn which is approximately 2% of the global market. Per capita consumption trend is estimated to see an increase of 2%-3%, which coupled with healthy new consumer addition of a similar magnitude, increase in occasion-based drinking and significant growth in disposable income should translate into high single-digit and low-teen growth well ahead of global growth estimated to be in the range of 3%-4%. Overall consumption occasions have gone up fairly significantly from merely being a late night affair to now being a more mainstream affair along with food. We are also witnessing new types of consumption occasions such as festivals and concerts. .The sector could see addition of 500mn new consumers over the next decade, a large part of this coming from India and Africa.
Exhibit 1: Percentage of current drinkers among the total population (15+ years) in WHO region and the world in 2016
WHO region (%) 2000 2005 2010 2016
AFR 39.1 36.8 34.6 32.2
AMR 63.5 60.5 57.8 54.1
EMR 4.0 3.7 3.4 2.9
EUR 70.1 68.4 64.6 59.9
SEAR 33.2 32.2 33.7 33.1
WPR 51.5 48.8 54.8 53.8
World 47.6 45.1 45.5 43.0
Source: WHO Report, 2018
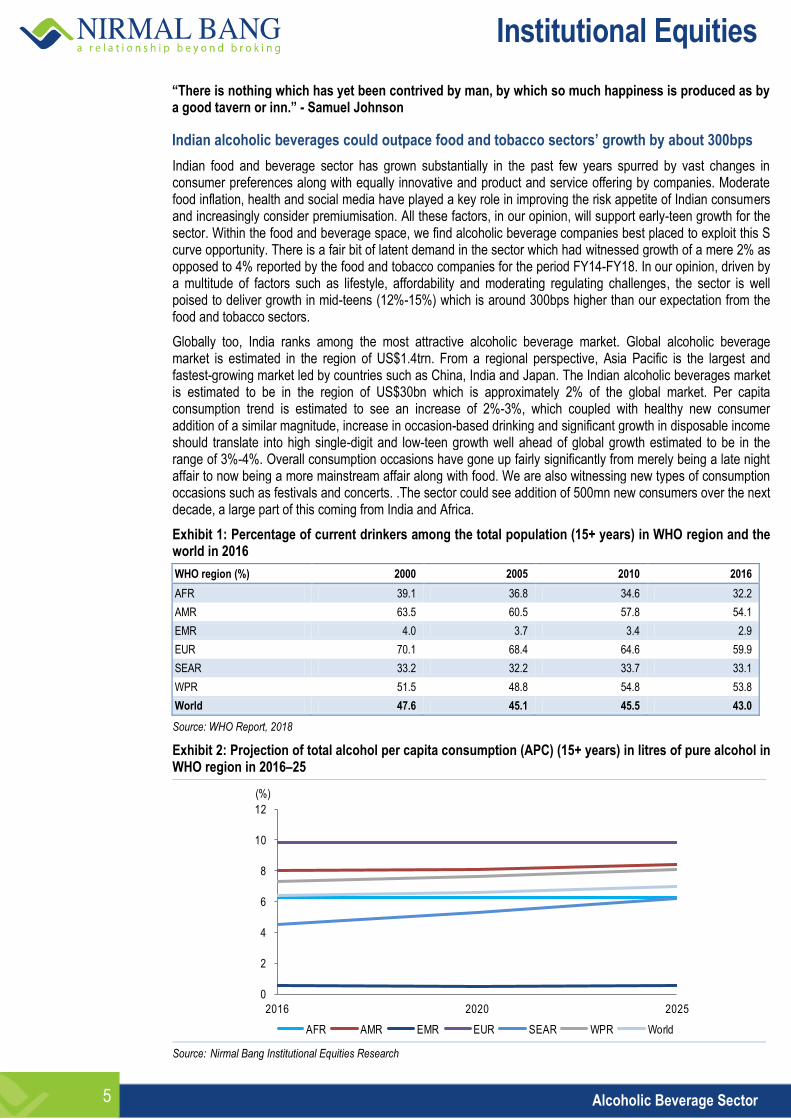
Exhibit 2: Projection of total alcohol per capita consumption (APC) (15+ years) in litres of pure alcohol in WHO region in 2016–25
Source: Nirmal Bang Institutional Equities Research
0
2
4
6
8
10
12
2016 2020 2025
AFR AMR EMR EUR SEAR WPR World
(%)
Institutional Equities
6 Alcoholic Beverage Sector
Exhibit 3: Alcohol per capita consumption projection in litres of pure alcohol
(Ltr) 2016 2020 2025
AFR 6.3 6.3 6.3
AMR 8.0 8.1 8.4
EMR 0.6 0.5 0.6
EUR 9.8 9.8 9.8
SEAR 4.5 5.3 6.2
WPR 7.3 7.6 8.1
World 6.4 6.6 7.0
Source: WHO Report, 2018
March of the premium Indian consumer continues
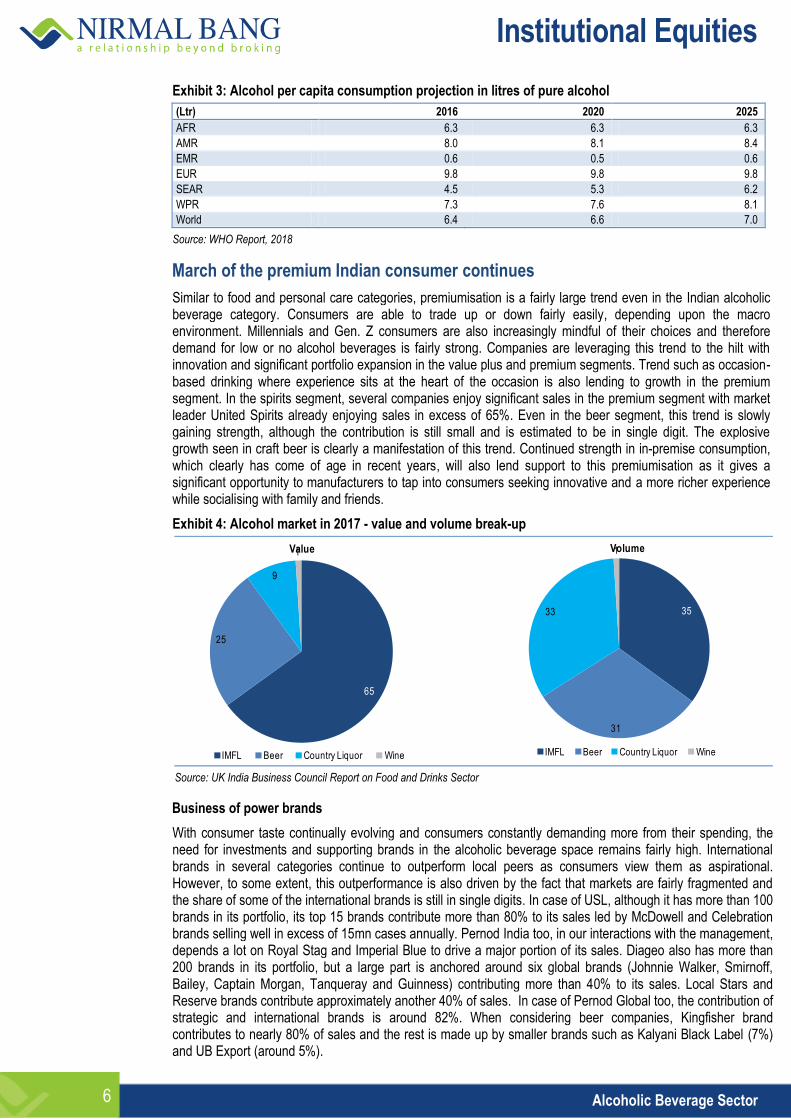
Similar to food and personal care categories, premiumisation is a fairly large trend even in the Indian alcoholic beverage category. Consumers are able to trade up or down fairly easily, depending upon the macro environment. Millennials and Gen. Z consumers are also increasingly mindful of their choices and therefore demand for low or no alcohol beverages is fairly strong. Companies are leveraging this trend to the hilt with innovation and significant portfolio expansion in the value plus and premium segments. Trend such as occasion-based drinking where experience sits at the heart of the occasion is also lending to growth in the premium segment. In the spirits segment, several companies enjoy significant sales in the premium segment with market leader United Spirits already enjoying sales in excess of 65%. Even in the beer segment, this trend is slowly gaining strength, although the contribution is still small and is estimated to be in single digit. The explosive growth seen in craft beer is clearly a manifestation of this trend. Continued strength in in-premise consumption, which clearly has come of age in recent years, will also lend support to this premiumisation as it gives a significant opportunity to manufacturers to tap into consumers seeking innovative and a more richer experience while socialising with family and friends.
Exhibit 4: Alcohol market in 2017 - value and volume break-up
Source: UK India Business Council Report on Food and Drinks Sector
Business of power brands
With consumer taste continually evolving and consumers constantly demanding more from their spending, the need for investments and supporting brands in the alcoholic beverage space remains fairly high. International brands in several categories continue to outperform local peers as consumers view them as aspirational. However, to some extent, this outperformance is also driven by the fact that markets are fairly fragmented and the share of some of the international brands is still in single digits. In case of USL, although it has more than 100 brands in its portfolio, its top 15 brands contribute more than 80% to its sales led by McDowell and Celebration brands selling well in excess of 15mn cases annually. Pernod India too, in our interactions with the management, depends a lot on Royal Stag and Imperial Blue to drive a major portion of its sales. Diageo also has more than 200 brands in its portfolio, but a large part is anchored around six global brands (Johnnie Walker, Smirnoff, Bailey, Captain Morgan, Tanqueray and Guinness) contributing more than 40% to its sales. Local Stars and Reserve brands contribute approximately another 40% of sales. In case of Pernod Global too, the contribution of strategic and international brands is around 82%. When considering beer companies, Kingfisher brand contributes to nearly 80% of sales and the rest is made up by smaller brands such as Kalyani Black Label (7%) and UB Export (around 5%).
65
25
9
1
IMFL Beer Country Liquor Wine
Value
35
31
33
1
IMFL Beer Country Liquor Wine
Volume
Institutional Equities
7 Alcoholic Beverage Sector
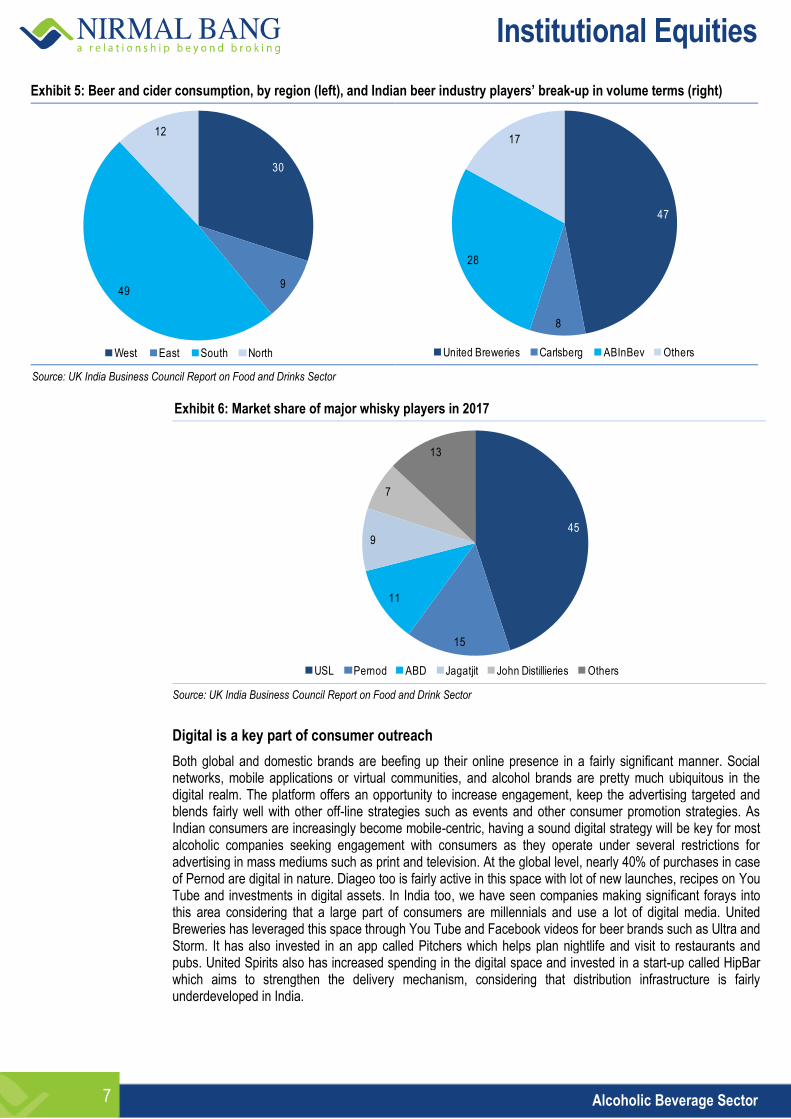
Exhibit 5: Beer and cider consumption, by region (left), and Indian beer industry players’ break-up in volume terms (right)
Source: UK India Business Council Report on Food and Drinks Sector
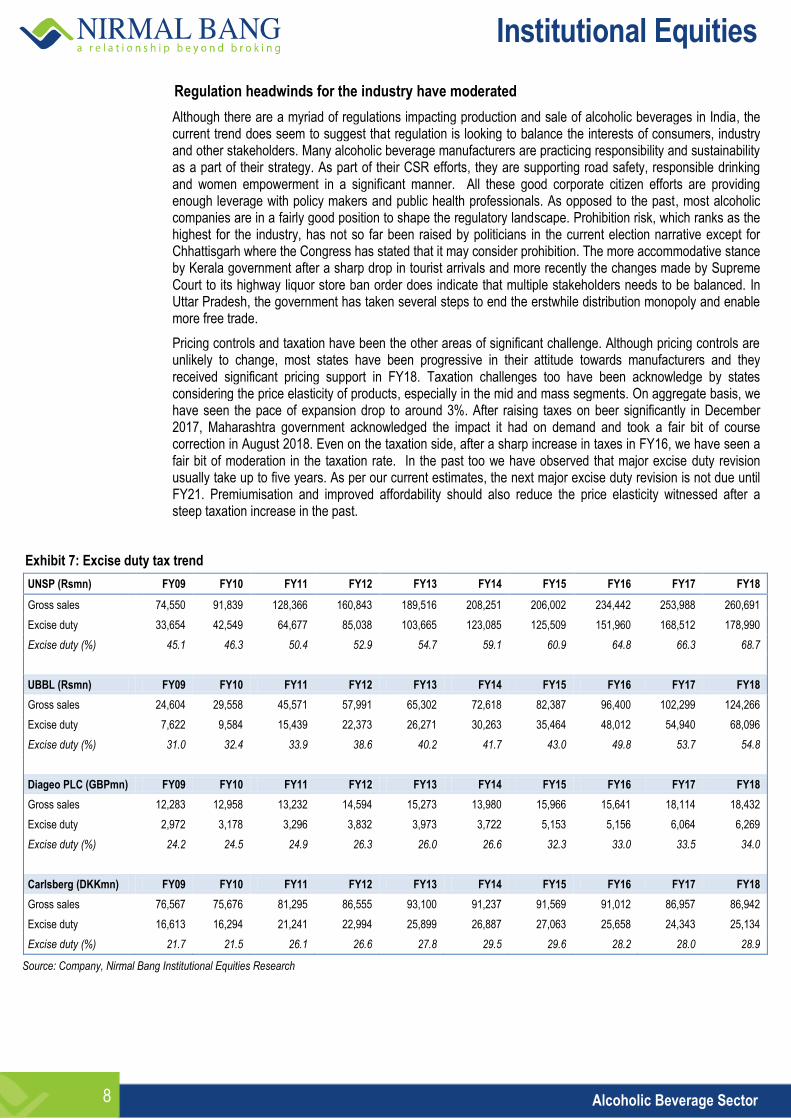
Exhibit 6: Market share of major whisky players in 2017
Source: UK India Business Council Report on Food and Drink Sector
Digital is a key part of consumer outreach
Both global and domestic brands are beefing up their online presence in a fairly significant manner. Social networks, mobile applications or virtual communities, and alcohol brands are pretty much ubiquitous in the digital realm. The platform offers an opportunity to increase engagement, keep the advertising targeted and blends fairly well with other off-line strategies such as events and other consumer promotion strategies. As Indian consumers are increasingly become mobile-centric, having a sound digital strategy will be key for most alcoholic companies seeking engagement with consumers as they operate under several restrictions for advertising in mass mediums such as print and television. At the global level, nearly 40% of purchases in case of Pernod are digital in nature. Diageo too is fairly active in this space with lot of new launches, recipes on You Tube and investments in digital assets. In India too, we have seen companies making significant forays into this area considering that a large part of consumers are millennials and use a lot of digital media. United Breweries has leveraged this space through You Tube and Facebook videos for beer brands such as Ultra and Storm. It has also invested in an app called Pitchers which helps plan nightlife and visit to restaurants and pubs. United Spirits also has increased spending in the digital space and invested in a start-up called HipBar which aims to strengthen the delivery mechanism, considering that distribution infrastructure is fairly underdeveloped in India.
30
949
12
West East South North
47
8
28
17
United Breweries Carlsberg ABInBev Others
45
15
11
9
7
13
USL Pernod ABD Jagatjit John Distillieries Others
Institutional Equities
8 Alcoholic Beverage Sector
Regulation headwinds for the industry have moderated
Although there are a myriad of regulations impacting production and sale of alcoholic beverages in India, the current trend does seem to suggest that regulation is looking to balance the interests of consumers, industry and other stakeholders. Many alcoholic beverage manufacturers are practicing responsibility and sustainability as a part of their strategy. As part of their CSR efforts, they are supporting road safety, responsible drinking and women empowerment in a significant manner. All these good corporate citizen efforts are providing enough leverage with policy makers and public health professionals. As opposed to the past, most alcoholic companies are in a fairly good position to shape the regulatory landscape. Prohibition risk, which ranks as the highest for the industry, has not so far been raised by politicians in the current election narrative except for Chhattisgarh where the Congress has stated that it may consider prohibition. The more accommodative stance by Kerala government after a sharp drop in tourist arrivals and more recently the changes made by Supreme Court to its highway liquor store ban order does indicate that multiple stakeholders needs to be balanced. In Uttar Pradesh, the government has taken several steps to end the erstwhile distribution monopoly and enable more free trade.
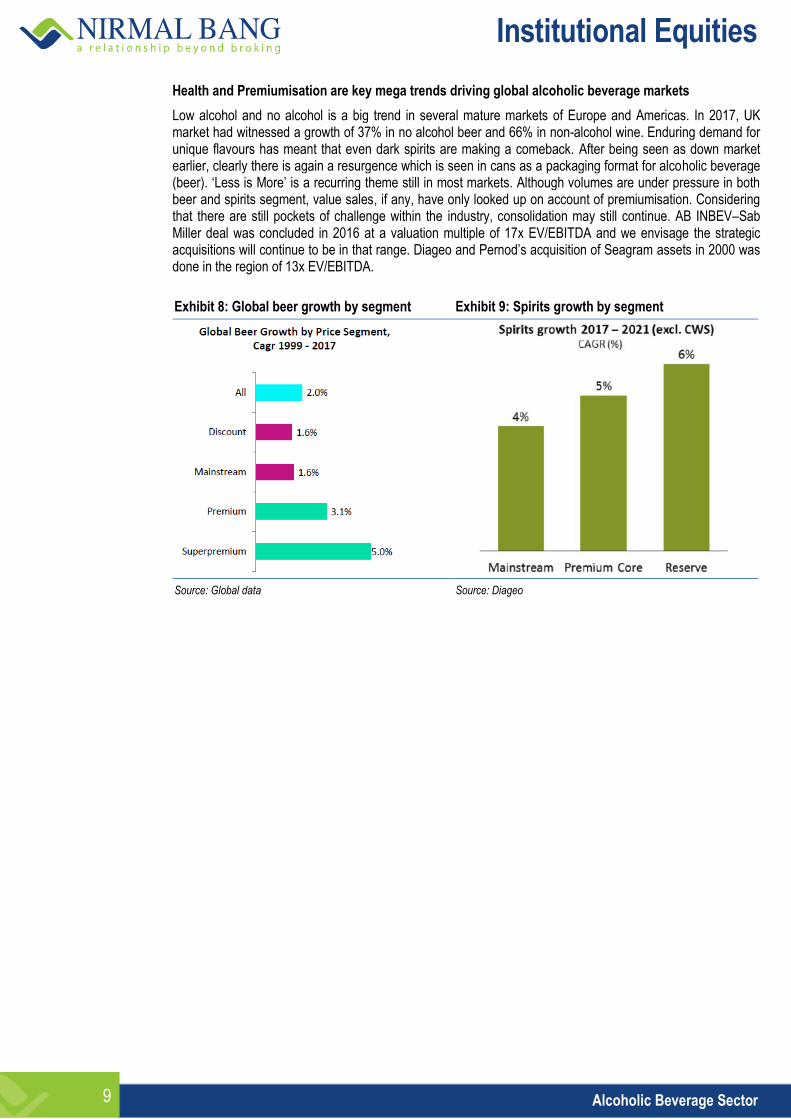
Pricing controls and taxation have been the other areas of significant challenge. Although pricing controls are unlikely to change, most states have been progressive in their attitude towards manufacturers and they received significant pricing support in FY18. Taxation challenges too have been acknowledge by states considering the price elasticity of products, especially in the mid and mass segments. On aggregate basis, we have seen the pace of expansion drop to around 3%. After raising taxes on beer significantly in December 2017, Maharashtra government acknowledged the impact it had on demand and took a fair bit of course correction in August 2018. Even on the taxation side, after a sharp increase in taxes in FY16, we have seen a fair bit of moderation in the taxation rate. In the past too we have observed that major excise duty revision usually take up to five years. As per our current estimates, the next major excise duty revision is not due until FY21. Premiumisation and improved affordability should also reduce the price elasticity witnessed after a steep taxation increase in the past.
Exhibit 7: Excise duty tax trend
UNSP (Rsmn) FY09 FY10 FY11 FY12 FY13 FY14 FY15 FY16 FY17 FY18
Gross sales 74,550 91,839 128,366 160,843 189,516 208,251 206,002 234,442 253,988 260,691
Excise duty 33,654 42,549 64,677 85,038 103,665 123,085 125,509 151,960 168,512 178,990
Excise duty (%) 45.1 46.3 50.4 52.9 54.7 59.1 60.9 64.8 66.3 68.7
UBBL (Rsmn) FY09 FY10 FY11 FY12 FY13 FY14 FY15 FY16 FY17 FY18
Gross sales 24,604 29,558 45,571 57,991 65,302 72,618 82,387 96,400 102,299 124,266
Excise duty 7,622 9,584 15,439 22,373 26,271 30,263 35,464 48,012 54,940 68,096
Excise duty (%) 31.0 32.4 33.9 38.6 40.2 41.7 43.0 49.8 53.7 54.8
Diageo PLC (GBPmn) FY09 FY10 FY11 FY12 FY13 FY14 FY15 FY16 FY17 FY18
Gross sales 12,283 12,958 13,232 14,594 15,273 13,980 15,966 15,641 18,114 18,432
Excise duty 2,972 3,178 3,296 3,832 3,973 3,722 5,153 5,156 6,064 6,269
Excise duty (%) 24.2 24.5 24.9 26.3 26.0 26.6 32.3 33.0 33.5 34.0
Carlsberg (DKKmn) FY09 FY10 FY11 FY12 FY13 FY14 FY15 FY16 FY17 FY18
Gross sales 76,567 75,676 81,295 86,555 93,100 91,237 91,569 91,012 86,957 86,942
Excise duty 16,613 16,294 21,241 22,994 25,899 26,887 27,063 25,658 24,343 25,134
Excise duty (%) 21.7 21.5 26.1 26.6 27.8 29.5 29.6 28.2 28.0 28.9
Source: Company, Nirmal Bang Institutional Equities Research
Institutional Equities
9 Alcoholic Beverage Sector
Health and Premiumisation are key mega trends driving global alcoholic beverage markets
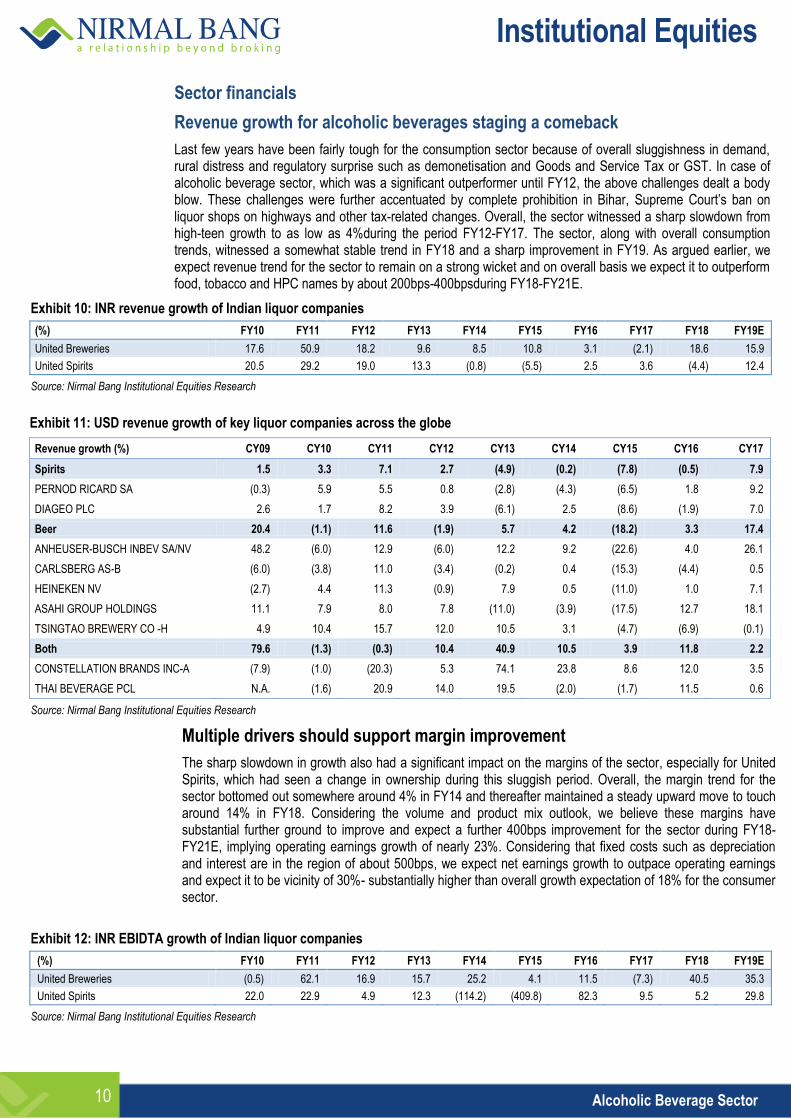
Low alcohol and no alcohol is a big trend in several mature markets of Europe and Americas. In 2017, UK market had witnessed a growth of 37% in no alcohol beer and 66% in non-alcohol wine. Enduring demand for unique flavours has meant that even dark spirits are making a comeback. After being seen as down market earlier, clearly there is again a resurgence which is seen in cans as a packaging format for alcoholic beverage (beer). ‘Less is More’ is a recurring theme still in most markets. Although volumes are under pressure in both beer and spirits segment, value sales, if any, have only looked up on account of premiumisation. Considering that there are still pockets of challenge within the industry, consolidation may still continue. AB INBEV–Sab Miller deal was concluded in 2016 at a valuation multiple of 17x EV/EBITDA and we envisage the strategic acquisitions will continue to be in that range. Diageo and Pernod’s acquisition of Seagram assets in 2000 was done in the region of 13x EV/EBITDA.
Exhibit 8: Global beer growth by segment Exhibit 9: Spirits growth by segment
Source: Global data Source: Diageo
Institutional Equities
10 Alcoholic Beverage Sector
Sector financials
Revenue growth for alcoholic beverages staging a comeback
Last few years have been fairly tough for the consumption sector because of overall sluggishness in demand, rural distress and regulatory surprise such as demonetisation and Goods and Service Tax or GST. In case of alcoholic beverage sector, which was a significant outperformer until FY12, the above challenges dealt a body blow. These challenges were further accentuated by complete prohibition in Bihar, Supreme Court’s ban on liquor shops on highways and other tax-related changes. Overall, the sector witnessed a sharp slowdown from high-teen growth to as low as 4%during the period FY12-FY17. The sector, along with overall consumption trends, witnessed a somewhat stable trend in FY18 and a sharp improvement in FY19. As argued earlier, we expect revenue trend for the sector to remain on a strong wicket and on overall basis we expect it to outperform food, tobacco and HPC names by about 200bps-400bpsduring FY18-FY21E.
Exhibit 10: INR revenue growth of Indian liquor companies
(%) FY10 FY11 FY12 FY13 FY14 FY15 FY16 FY17 FY18 FY19E
United Breweries 17.6 50.9 18.2 9.6 8.5 10.8 3.1 (2.1) 18.6 15.9
United Spirits 20.5 29.2 19.0 13.3 (0.8) (5.5) 2.5 3.6 (4.4) 12.4
Source: Nirmal Bang Institutional Equities Research
Exhibit 11: USD revenue growth of key liquor companies across the globe
Revenue growth (%) CY09 CY10 CY11 CY12 CY13 CY14 CY15 CY16 CY17
Spirits 1.5 3.3 7.1 2.7 (4.9) (0.2) (7.8) (0.5) 7.9
PERNOD RICARD SA (0.3) 5.9 5.5 0.8 (2.8) (4.3) (6.5) 1.8 9.2
DIAGEO PLC 2.6 1.7 8.2 3.9 (6.1) 2.5 (8.6) (1.9) 7.0
Beer 20.4 (1.1) 11.6 (1.9) 5.7 4.2 (18.2) 3.3 17.4
ANHEUSER-BUSCH INBEV SA/NV 48.2 (6.0) 12.9 (6.0) 12.2 9.2 (22.6) 4.0 26.1
CARLSBERG AS-B (6.0) (3.8) 11.0 (3.4) (0.2) 0.4 (15.3) (4.4) 0.5
HEINEKEN NV (2.7) 4.4 11.3 (0.9) 7.9 0.5 (11.0) 1.0 7.1
ASAHI GROUP HOLDINGS 11.1 7.9 8.0 7.8 (11.0) (3.9) (17.5) 12.7 18.1
TSINGTAO BREWERY CO -H 4.9 10.4 15.7 12.0 10.5 3.1 (4.7) (6.9) (0.1)
Both 79.6 (1.3) (0.3) 10.4 40.9 10.5 3.9 11.8 2.2
CONSTELLATION BRANDS INC-A (7.9) (1.0) (20.3) 5.3 74.1 23.8 8.6 12.0 3.5
THAI BEVERAGE PCL N.A. (1.6) 20.9 14.0 19.5 (2.0) (1.7) 11.5 0.6
Source: Nirmal Bang Institutional Equities Research
Multiple drivers should support margin improvement
The sharp slowdown in growth also had a significant impact on the margins of the sector, especially for United Spirits, which had seen a change in ownership during this sluggish period. Overall, the margin trend for the sector bottomed out somewhere around 4% in FY14 and thereafter maintained a steady upward move to touch around 14% in FY18. Considering the volume and product mix outlook, we believe these margins have substantial further ground to improve and expect a further 400bps improvement for the sector during FY18-FY21E, implying operating earnings growth of nearly 23%. Considering that fixed costs such as depreciation and interest are in the region of about 500bps, we expect net earnings growth to outpace operating earnings and expect it to be vicinity of 30%- substantially higher than overall growth expectation of 18% for the consumer sector.
Exhibit 12: INR EBIDTA growth of Indian liquor companies
(%) FY10 FY11 FY12 FY13 FY14 FY15 FY16 FY17 FY18 FY19E
United Breweries (0.5) 62.1 16.9 15.7 25.2 4.1 11.5 (7.3) 40.5 35.3
United Spirits 22.0 22.9 4.9 12.3 (114.2) (409.8) 82.3 9.5 5.2 29.8
Source: Nirmal Bang Institutional Equities Research
Institutional Equities
11 Alcoholic Beverage Sector
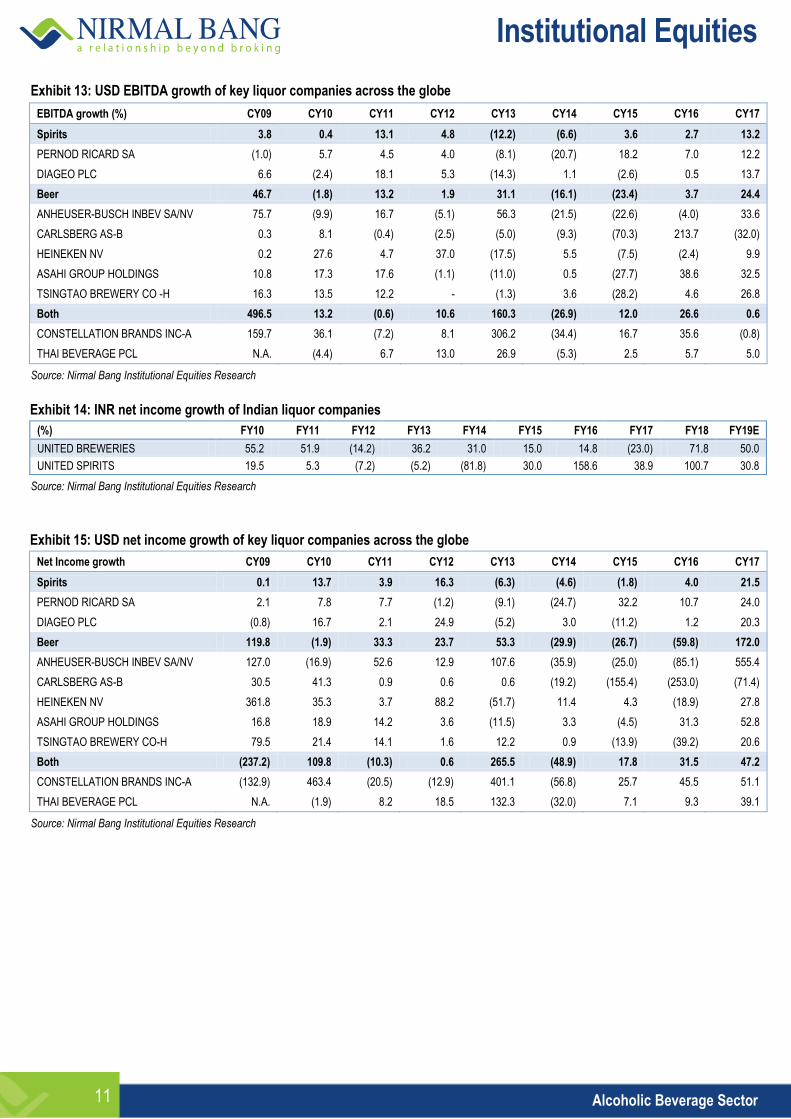
Exhibit 13: USD EBITDA growth of key liquor companies across the globe
EBITDA growth (%) CY09 CY10 CY11 CY12 CY13 CY14 CY15 CY16 CY17
Spirits 3.8 0.4 13.1 4.8 (12.2) (6.6) 3.6 2.7 13.2
PERNOD RICARD SA (1.0) 5.7 4.5 4.0 (8.1) (20.7) 18.2 7.0 12.2
DIAGEO PLC 6.6 (2.4) 18.1 5.3 (14.3) 1.1 (2.6) 0.5 13.7
Beer 46.7 (1.8) 13.2 1.9 31.1 (16.1) (23.4) 3.7 24.4
ANHEUSER-BUSCH INBEV SA/NV 75.7 (9.9) 16.7 (5.1) 56.3 (21.5) (22.6) (4.0) 33.6
CARLSBERG AS-B 0.3 8.1 (0.4) (2.5) (5.0) (9.3) (70.3) 213.7 (32.0)
HEINEKEN NV 0.2 27.6 4.7 37.0 (17.5) 5.5 (7.5) (2.4) 9.9
ASAHI GROUP HOLDINGS 10.8 17.3 17.6 (1.1) (11.0) 0.5 (27.7) 38.6 32.5
TSINGTAO BREWERY CO -H 16.3 13.5 12.2 - (1.3) 3.6 (28.2) 4.6 26.8
Both 496.5 13.2 (0.6) 10.6 160.3 (26.9) 12.0 26.6 0.6
CONSTELLATION BRANDS INC-A 159.7 36.1 (7.2) 8.1 306.2 (34.4) 16.7 35.6 (0.8)
THAI BEVERAGE PCL N.A. (4.4) 6.7 13.0 26.9 (5.3) 2.5 5.7 5.0
Source: Nirmal Bang Institutional Equities Research
Exhibit 14: INR net income growth of Indian liquor companies
(%) FY10 FY11 FY12 FY13 FY14 FY15 FY16 FY17 FY18 FY19E
UNITED BREWERIES 55.2 51.9 (14.2) 36.2 31.0 15.0 14.8 (23.0) 71.8 50.0
UNITED SPIRITS 19.5 5.3 (7.2) (5.2) (81.8) 30.0 158.6 38.9 100.7 30.8
Source: Nirmal Bang Institutional Equities Research
Exhibit 15: USD net income growth of key liquor companies across the globe
Net Income growth CY09 CY10 CY11 CY12 CY13 CY14 CY15 CY16 CY17
Spirits 0.1 13.7 3.9 16.3 (6.3) (4.6) (1.8) 4.0 21.5
PERNOD RICARD SA 2.1 7.8 7.7 (1.2) (9.1) (24.7) 32.2 10.7 24.0
DIAGEO PLC (0.8) 16.7 2.1 24.9 (5.2) 3.0 (11.2) 1.2 20.3
Beer 119.8 (1.9) 33.3 23.7 53.3 (29.9) (26.7) (59.8) 172.0
ANHEUSER-BUSCH INBEV SA/NV 127.0 (16.9) 52.6 12.9 107.6 (35.9) (25.0) (85.1) 555.4
CARLSBERG AS-B 30.5 41.3 0.9 0.6 0.6 (19.2) (155.4) (253.0) (71.4)
HEINEKEN NV 361.8 35.3 3.7 88.2 (51.7) 11.4 4.3 (18.9) 27.8
ASAHI GROUP HOLDINGS 16.8 18.9 14.2 3.6 (11.5) 3.3 (4.5) 31.3 52.8
TSINGTAO BREWERY CO-H 79.5 21.4 14.1 1.6 12.2 0.9 (13.9) (39.2) 20.6
Both (237.2) 109.8 (10.3) 0.6 265.5 (48.9) 17.8 31.5 47.2
CONSTELLATION BRANDS INC-A (132.9) 463.4 (20.5) (12.9) 401.1 (56.8) 25.7 45.5 51.1
THAI BEVERAGE PCL N.A. (1.9) 8.2 18.5 132.3 (32.0) 7.1 9.3 39.1
Source: Nirmal Bang Institutional Equities Research
Institutional Equities
12 Alcoholic Beverage Sector
Valuation and recommendation
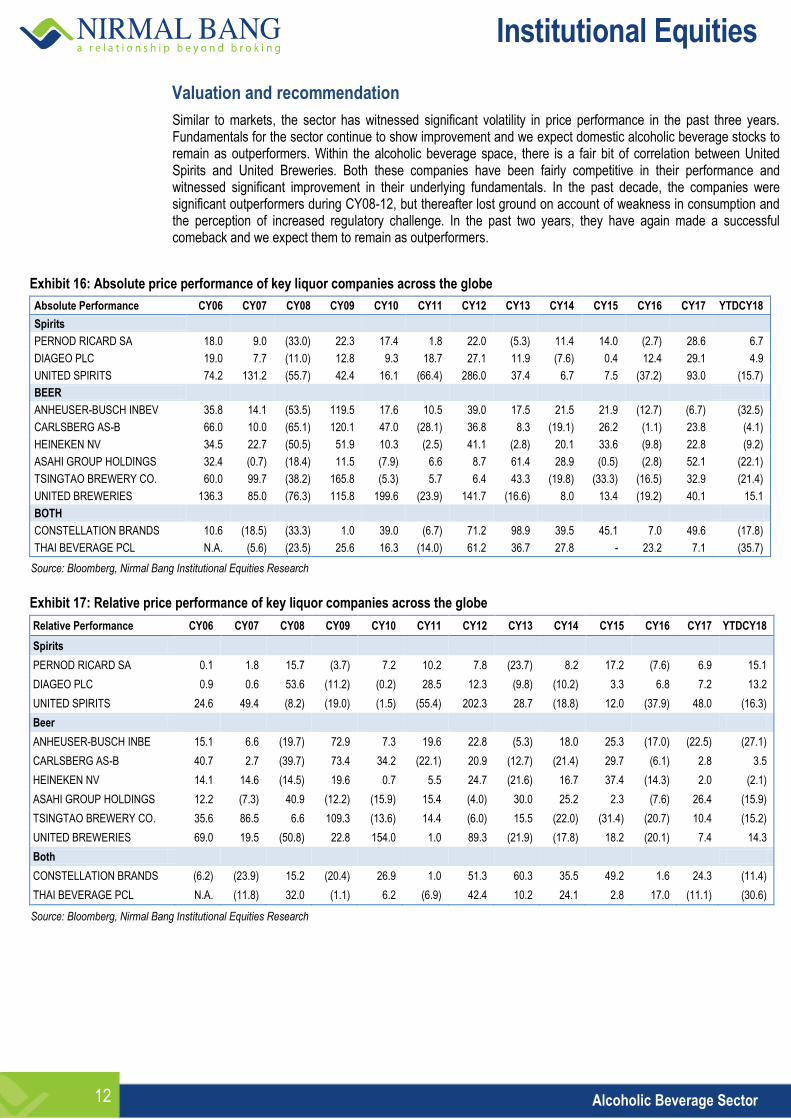
Similar to markets, the sector has witnessed significant volatility in price performance in the past three years. Fundamentals for the sector continue to show improvement and we expect domestic alcoholic beverage stocks to remain as outperformers. Within the alcoholic beverage space, there is a fair bit of correlation between United Spirits and United Breweries. Both these companies have been fairly competitive in their performance and witnessed significant improvement in their underlying fundamentals. In the past decade, the companies were significant outperformers during CY08-12, but thereafter lost ground on account of weakness in consumption and the perception of increased regulatory challenge. In the past two years, they have again made a successful comeback and we expect them to remain as outperformers.
Exhibit 16: Absolute price performance of key liquor companies across the globe
Absolute Performance CY06 CY07 CY08 CY09 CY10 CY11 CY12 CY13 CY14 CY15 CY16 CY17 YTDCY18
Spirits
PERNOD RICARD SA 18.0 9.0 (33.0) 22.3 17.4 1.8 22.0 (5.3) 11.4 14.0 (2.7) 28.6 6.7
DIAGEO PLC 19.0 7.7 (11.0) 12.8 9.3 18.7 27.1 11.9 (7.6) 0.4 12.4 29.1 4.9
UNITED SPIRITS 74.2 131.2 (55.7) 42.4 16.1 (66.4) 286.0 37.4 6.7 7.5 (37.2) 93.0 (15.7)
BEER
ANHEUSER-BUSCH INBEV 35.8 14.1 (53.5) 119.5 17.6 10.5 39.0 17.5 21.5 21.9 (12.7) (6.7) (32.5)
CARLSBERG AS-B 66.0 10.0 (65.1) 120.1 47.0 (28.1) 36.8 8.3 (19.1) 26.2 (1.1) 23.8 (4.1)
HEINEKEN NV 34.5 22.7 (50.5) 51.9 10.3 (2.5) 41.1 (2.8) 20.1 33.6 (9.8) 22.8 (9.2)
ASAHI GROUP HOLDINGS 32.4 (0.7) (18.4) 11.5 (7.9) 6.6 8.7 61.4 28.9 (0.5) (2.8) 52.1 (22.1)
TSINGTAO BREWERY CO. 60.0 99.7 (38.2) 165.8 (5.3) 5.7 6.4 43.3 (19.8) (33.3) (16.5) 32.9 (21.4)
UNITED BREWERIES 136.3 85.0 (76.3) 115.8 199.6 (23.9) 141.7 (16.6) 8.0 13.4 (19.2) 40.1 15.1
BOTH
CONSTELLATION BRANDS 10.6 (18.5) (33.3) 1.0 39.0 (6.7) 71.2 98.9 39.5 45.1 7.0 49.6 (17.8)
THAI BEVERAGE PCL N.A. (5.6) (23.5) 25.6 16.3 (14.0) 61.2 36.7 27.8 - 23.2 7.1 (35.7)
Source: Bloomberg, Nirmal Bang Institutional Equities Research
Exhibit 17: Relative price performance of key liquor companies across the globe
Relative Performance CY06 CY07 CY08 CY09 CY10 CY11 CY12 CY13 CY14 CY15 CY16 CY17 YTDCY18
Spirits
PERNOD RICARD SA 0.1 1.8 15.7 (3.7) 7.2 10.2 7.8 (23.7) 8.2 17.2 (7.6) 6.9 15.1
DIAGEO PLC 0.9 0.6 53.6 (11.2) (0.2) 28.5 12.3 (9.8) (10.2) 3.3 6.8 7.2 13.2
UNITED SPIRITS 24.6 49.4 (8.2) (19.0) (1.5) (55.4) 202.3 28.7 (18.8) 12.0 (37.9) 48.0 (16.3)
Beer
ANHEUSER-BUSCH INBE 15.1 6.6 (19.7) 72.9 7.3 19.6 22.8 (5.3) 18.0 25.3 (17.0) (22.5) (27.1)
CARLSBERG AS-B 40.7 2.7 (39.7) 73.4 34.2 (22.1) 20.9 (12.7) (21.4) 29.7 (6.1) 2.8 3.5
HEINEKEN NV 14.1 14.6 (14.5) 19.6 0.7 5.5 24.7 (21.6) 16.7 37.4 (14.3) 2.0 (2.1)
ASAHI GROUP HOLDINGS 12.2 (7.3) 40.9 (12.2) (15.9) 15.4 (4.0) 30.0 25.2 2.3 (7.6) 26.4 (15.9)
TSINGTAO BREWERY CO. 35.6 86.5 6.6 109.3 (13.6) 14.4 (6.0) 15.5 (22.0) (31.4) (20.7) 10.4 (15.2)
UNITED BREWERIES 69.0 19.5 (50.8) 22.8 154.0 1.0 89.3 (21.9) (17.8) 18.2 (20.1) 7.4 14.3
Both
CONSTELLATION BRANDS (6.2) (23.9) 15.2 (20.4) 26.9 1.0 51.3 60.3 35.5 49.2 1.6 24.3 (11.4)
THAI BEVERAGE PCL N.A. (11.8) 32.0 (1.1) 6.2 (6.9) 42.4 10.2 24.1 2.8 17.0 (11.1) (30.6)
Source: Bloomberg, Nirmal Bang Institutional Equities Research
Institutional Equities
13 Alcoholic Beverage Sector
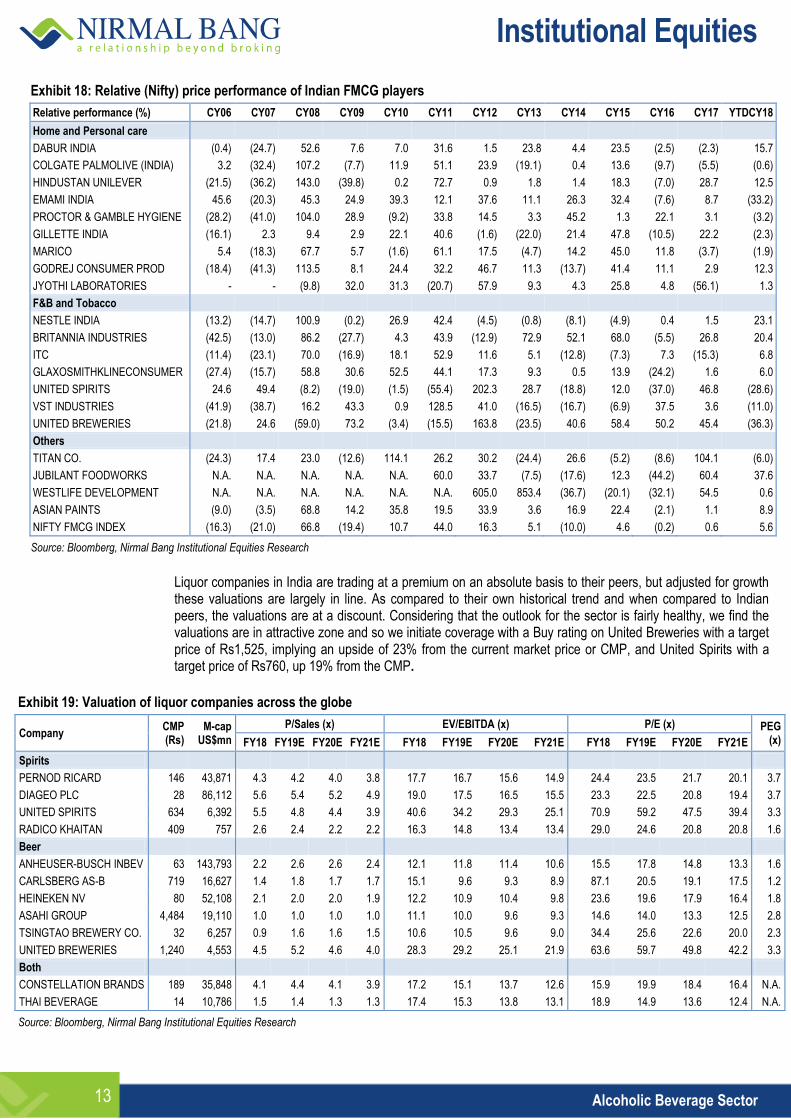
Exhibit 18: Relative (Nifty) price performance of Indian FMCG players
Relative performance (%) CY06 CY07 CY08 CY09 CY10 CY11 CY12 CY13 CY14 CY15 CY16 CY17 YTDCY18
Home and Personal care
DABUR INDIA (0.4) (24.7) 52.6 7.6 7.0 31.6 1.5 23.8 4.4 23.5 (2.5) (2.3) 15.7
COLGATE PALMOLIVE (INDIA) 3.2 (32.4) 107.2 (7.7) 11.9 51.1 23.9 (19.1) 0.4 13.6 (9.7) (5.5) (0.6)
HINDUSTAN UNILEVER (21.5) (36.2) 143.0 (39.8) 0.2 72.7 0.9 1.8 1.4 18.3 (7.0) 28.7 12.5
EMAMI INDIA 45.6 (20.3) 45.3 24.9 39.3 12.1 37.6 11.1 26.3 32.4 (7.6) 8.7 (33.2)
PROCTOR & GAMBLE HYGIENE (28.2) (41.0) 104.0 28.9 (9.2) 33.8 14.5 3.3 45.2 1.3 22.1 3.1 (3.2)
GILLETTE INDIA (16.1) 2.3 9.4 2.9 22.1 40.6 (1.6) (22.0) 21.4 47.8 (10.5) 22.2 (2.3)
MARICO 5.4 (18.3) 67.7 5.7 (1.6) 61.1 17.5 (4.7) 14.2 45.0 11.8 (3.7) (1.9)
GODREJ CONSUMER PROD (18.4) (41.3) 113.5 8.1 24.4 32.2 46.7 11.3 (13.7) 41.4 11.1 2.9 12.3
JYOTHI LABORATORIES - - (9.8) 32.0 31.3 (20.7) 57.9 9.3 4.3 25.8 4.8 (56.1) 1.3
F&B and Tobacco
NESTLE INDIA (13.2) (14.7) 100.9 (0.2) 26.9 42.4 (4.5) (0.8) (8.1) (4.9) 0.4 1.5 23.1
BRITANNIA INDUSTRIES (42.5) (13.0) 86.2 (27.7) 4.3 43.9 (12.9) 72.9 52.1 68.0 (5.5) 26.8 20.4
ITC (11.4) (23.1) 70.0 (16.9) 18.1 52.9 11.6 5.1 (12.8) (7.3) 7.3 (15.3) 6.8
GLAXOSMITHKLINECONSUMER (27.4) (15.7) 58.8 30.6 52.5 44.1 17.3 9.3 0.5 13.9 (24.2) 1.6 6.0
UNITED SPIRITS 24.6 49.4 (8.2) (19.0) (1.5) (55.4) 202.3 28.7 (18.8) 12.0 (37.0) 46.8 (28.6)
VST INDUSTRIES (41.9) (38.7) 16.2 43.3 0.9 128.5 41.0 (16.5) (16.7) (6.9) 37.5 3.6 (11.0)
UNITED BREWERIES (21.8) 24.6 (59.0) 73.2 (3.4) (15.5) 163.8 (23.5) 40.6 58.4 50.2 45.4 (36.3)
Others
TITAN CO. (24.3) 17.4 23.0 (12.6) 114.1 26.2 30.2 (24.4) 26.6 (5.2) (8.6) 104.1 (6.0)
JUBILANT FOODWORKS N.A. N.A. N.A. N.A. N.A. 60.0 33.7 (7.5) (17.6) 12.3 (44.2) 60.4 37.6
WESTLIFE DEVELOPMENT N.A. N.A. N.A. N.A. N.A. N.A. 605.0 853.4 (36.7) (20.1) (32.1) 54.5 0.6
ASIAN PAINTS (9.0) (3.5) 68.8 14.2 35.8 19.5 33.9 3.6 16.9 22.4 (2.1) 1.1 8.9
NIFTY FMCG INDEX (16.3) (21.0) 66.8 (19.4) 10.7 44.0 16.3 5.1 (10.0) 4.6 (0.2) 0.6 5.6
Source: Bloomberg, Nirmal Bang Institutional Equities Research
Liquor companies in India are trading at a premium on an absolute basis to their peers, but adjusted for growth these valuations are largely in line. As compared to their own historical trend and when compared to Indian peers, the valuations are at a discount. Considering that the outlook for the sector is fairly healthy, we find the valuations are in attractive zone and so we initiate coverage with a Buy rating on United Breweries with a target price of Rs1,525, implying an upside of 23% from the current market price or CMP, and United Spirits with a target price of Rs760, up 19% from the CMP.
Exhibit 19: Valuation of liquor companies across the globe
Company CMP (Rs)
M-cap US$mn
P/Sales (x) EV/EBITDA (x) P/E (x) PEG (x) FY18 FY19E FY20E FY21E FY18 FY19E FY20E FY21E FY18 FY19E FY20E FY21E
Spirits
PERNOD RICARD 146 43,871 4.3 4.2 4.0 3.8 17.7 16.7 15.6 14.9 24.4 23.5 21.7 20.1 3.7
DIAGEO PLC 28 86,112 5.6 5.4 5.2 4.9 19.0 17.5 16.5 15.5 23.3 22.5 20.8 19.4 3.7
UNITED SPIRITS 634 6,392 5.5 4.8 4.4 3.9 40.6 34.2 29.3 25.1 70.9 59.2 47.5 39.4 3.3
RADICO KHAITAN 409 757 2.6 2.4 2.2 2.2 16.3 14.8 13.4 13.4 29.0 24.6 20.8 20.8 1.6
Beer
ANHEUSER-BUSCH INBEV 63 143,793 2.2 2.6 2.6 2.4 12.1 11.8 11.4 10.6 15.5 17.8 14.8 13.3 1.6
CARLSBERG AS-B 719 16,627 1.4 1.8 1.7 1.7 15.1 9.6 9.3 8.9 87.1 20.5 19.1 17.5 1.2
HEINEKEN NV 80 52,108 2.1 2.0 2.0 1.9 12.2 10.9 10.4 9.8 23.6 19.6 17.9 16.4 1.8
ASAHI GROUP 4,484 19,110 1.0 1.0 1.0 1.0 11.1 10.0 9.6 9.3 14.6 14.0 13.3 12.5 2.8
TSINGTAO BREWERY CO. 32 6,257 0.9 1.6 1.6 1.5 10.6 10.5 9.6 9.0 34.4 25.6 22.6 20.0 2.3
UNITED BREWERIES 1,240 4,553 4.5 5.2 4.6 4.0 28.3 29.2 25.1 21.9 63.6 59.7 49.8 42.2 3.3
Both
CONSTELLATION BRANDS 189 35,848 4.1 4.4 4.1 3.9 17.2 15.1 13.7 12.6 15.9 19.9 18.4 16.4 N.A.
THAI BEVERAGE 14 10,786 1.5 1.4 1.3 1.3 17.4 15.3 13.8 13.1 18.9 14.9 13.6 12.4 N.A.
Source: Bloomberg, Nirmal Bang Institutional Equities Research
Institutional Equities
14 Alcoholic Beverage Sector
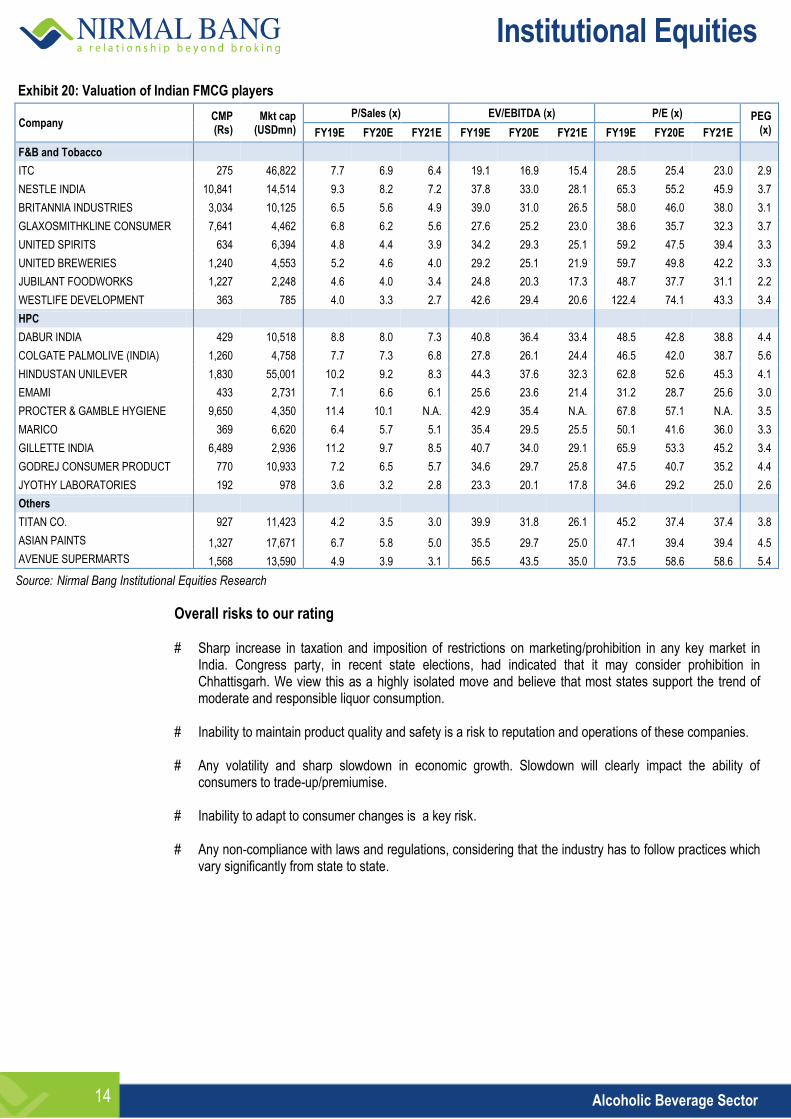
Exhibit 20: Valuation of Indian FMCG players
Company CMP (Rs)
Mkt cap (USDmn)
P/Sales (x) EV/EBITDA (x) P/E (x) PEG (x) FY19E FY20E FY21E FY19E FY20E FY21E FY19E FY20E FY21E
F&B and Tobacco
ITC 275 46,822 7.7 6.9 6.4 19.1 16.9 15.4 28.5 25.4 23.0 2.9
NESTLE INDIA 10,841 14,514 9.3 8.2 7.2 37.8 33.0 28.1 65.3 55.2 45.9 3.7
BRITANNIA INDUSTRIES 3,034 10,125 6.5 5.6 4.9 39.0 31.0 26.5 58.0 46.0 38.0 3.1
GLAXOSMITHKLINE CONSUMER 7,641 4,462 6.8 6.2 5.6 27.6 25.2 23.0 38.6 35.7 32.3 3.7
UNITED SPIRITS 634 6,394 4.8 4.4 3.9 34.2 29.3 25.1 59.2 47.5 39.4 3.3
UNITED BREWERIES 1,240 4,553 5.2 4.6 4.0 29.2 25.1 21.9 59.7 49.8 42.2 3.3
JUBILANT FOODWORKS 1,227 2,248 4.6 4.0 3.4 24.8 20.3 17.3 48.7 37.7 31.1 2.2
WESTLIFE DEVELOPMENT 363 785 4.0 3.3 2.7 42.6 29.4 20.6 122.4 74.1 43.3 3.4
HPC
DABUR INDIA 429 10,518 8.8 8.0 7.3 40.8 36.4 33.4 48.5 42.8 38.8 4.4
COLGATE PALMOLIVE (INDIA) 1,260 4,758 7.7 7.3 6.8 27.8 26.1 24.4 46.5 42.0 38.7 5.6
HINDUSTAN UNILEVER 1,830 55,001 10.2 9.2 8.3 44.3 37.6 32.3 62.8 52.6 45.3 4.1
EMAMI 433 2,731 7.1 6.6 6.1 25.6 23.6 21.4 31.2 28.7 25.6 3.0
PROCTER & GAMBLE HYGIENE 9,650 4,350 11.4 10.1 N.A. 42.9 35.4 N.A. 67.8 57.1 N.A. 3.5
MARICO 369 6,620 6.4 5.7 5.1 35.4 29.5 25.5 50.1 41.6 36.0 3.3
GILLETTE INDIA 6,489 2,936 11.2 9.7 8.5 40.7 34.0 29.1 65.9 53.3 45.2 3.4
GODREJ CONSUMER PRODUCT 770 10,933 7.2 6.5 5.7 34.6 29.7 25.8 47.5 40.7 35.2 4.4
JYOTHY LABORATORIES 192 978 3.6 3.2 2.8 23.3 20.1 17.8 34.6 29.2 25.0 2.6
Others
TITAN CO. 927 11,423 4.2 3.5 3.0 39.9 31.8 26.1 45.2 37.4 37.4 3.8
ASIAN PAINTS 1,327 17,671 6.7 5.8 5.0 35.5 29.7 25.0 47.1 39.4 39.4 4.5
AVENUE SUPERMARTS 1,568 13,590 4.9 3.9 3.1 56.5 43.5 35.0 73.5 58.6 58.6 5.4
Source: Nirmal Bang Institutional Equities Research
Overall risks to our rating # Sharp increase in taxation and imposition of restrictions on marketing/prohibition in any key market in
India. Congress party, in recent state elections, had indicated that it may consider prohibition in Chhattisgarh. We view this as a highly isolated move and believe that most states support the trend of moderate and responsible liquor consumption.
# Inability to maintain product quality and safety is a risk to reputation and operations of these companies. # Any volatility and sharp slowdown in economic growth. Slowdown will clearly impact the ability of
consumers to trade-up/premiumise. # Inability to adapt to consumer changes is a key risk. # Any non-compliance with laws and regulations, considering that the industry has to follow practices which
vary significantly from state to state.
Institutional Equities
15 Alcoholic Beverage Sector
CCoommppaannyy SSeeccttiioonn
Institutional Equities
16 Alcoholic Beverage Sector
This page has been intentionally left blank
Institutional Equities
Initi
atin
g C
over
age
Reuters: UBBW.BO; Bloomberg: UBBL IN
United Breweries
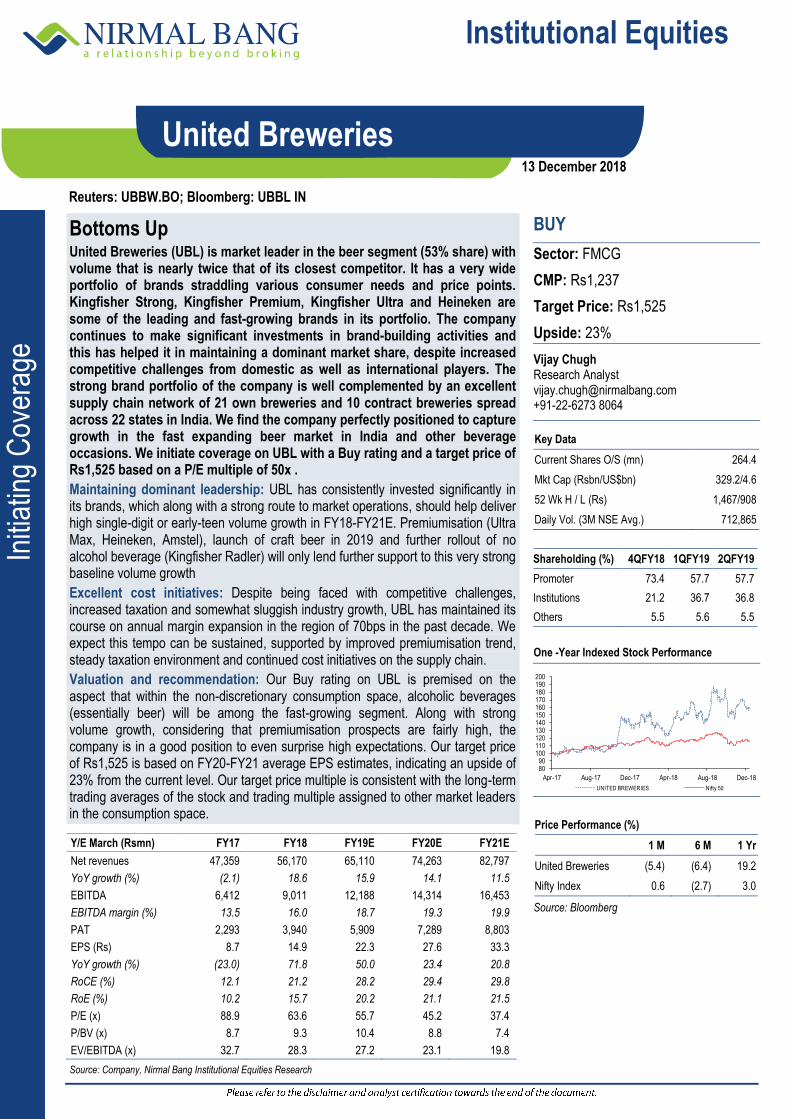
Bottoms Up United Breweries (UBL) is market leader in the beer segment (53% share) with volume that is nearly twice that of its closest competitor. It has a very wide portfolio of brands straddling various consumer needs and price points. Kingfisher Strong, Kingfisher Premium, Kingfisher Ultra and Heineken are some of the leading and fast-growing brands in its portfolio. The company continues to make significant investments in brand-building activities and this has helped it in maintaining a dominant market share, despite increased competitive challenges from domestic as well as international players. The strong brand portfolio of the company is well complemented by an excellent supply chain network of 21 own breweries and 10 contract breweries spread across 22 states in India. We find the company perfectly positioned to capture growth in the fast expanding beer market in India and other beverage occasions. We initiate coverage on UBL with a Buy rating and a target price of Rs1,525 based on a P/E multiple of 50x .
Maintaining dominant leadership: UBL has consistently invested significantly in its brands, which along with a strong route to market operations, should help deliver high single-digit or early-teen volume growth in FY18-FY21E. Premiumisation (Ultra Max, Heineken, Amstel), launch of craft beer in 2019 and further rollout of no alcohol beverage (Kingfisher Radler) will only lend further support to this very strong baseline volume growth
Excellent cost initiatives: Despite being faced with competitive challenges, increased taxation and somewhat sluggish industry growth, UBL has maintained its course on annual margin expansion in the region of 70bps in the past decade. We expect this tempo can be sustained, supported by improved premiumisation trend, steady taxation environment and continued cost initiatives on the supply chain.
Valuation and recommendation: Our Buy rating on UBL is premised on the aspect that within the non-discretionary consumption space, alcoholic beverages (essentially beer) will be among the fast-growing segment. Along with strong volume growth, considering that premiumisation prospects are fairly high, the company is in a good position to even surprise high expectations. Our target price of Rs1,525 is based on FY20-FY21 average EPS estimates, indicating an upside of 23% from the current level. Our target price multiple is consistent with the long-term trading averages of the stock and trading multiple assigned to other market leaders in the consumption space.
BUY
Sector: FMCG
CMP: Rs1,237
Target Price: Rs1,525
Upside: 23%
Vijay Chugh Research Analyst [email protected] +91-22-6273 8064
Key Data
Current Shares O/S (mn) 264.4
Mkt Cap (Rsbn/US$bn) 329.2/4.6
52 Wk H / L (Rs) 1,467/908
Daily Vol. (3M NSE Avg.) 712,865
Shareholding (%) 4QFY18 1QFY19 2QFY19
Promoter 73.4 57.7 57.7
Institutions 21.2 36.7 36.8
Others 5.5 5.6 5.5
One -Year Indexed Stock Performance
8090
100110120130140150160170180190200
Apr-17 Aug-17 Dec-17 Apr-18 Aug-18 Dec-18
UNITED BREWERIES Nifty 50
Price Performance (%)
1 M 6 M 1 Yr
United Breweries (5.4) (6.4) 19.2
Nifty Index 0.6 (2.7) 3.0
Source: Bloomberg
Y/E March (Rsmn) FY17 FY18 FY19E FY20E FY21E
Net revenues 47,359 56,170 65,110 74,263 82,797
YoY growth (%) (2.1) 18.6 15.9 14.1 11.5
EBITDA 6,412 9,011 12,188 14,314 16,453
EBITDA margin (%) 13.5 16.0 18.7 19.3 19.9
PAT 2,293 3,940 5,909 7,289 8,803
EPS (Rs) 8.7 14.9 22.3 27.6 33.3
YoY growth (%) (23.0) 71.8 50.0 23.4 20.8
RoCE (%) 12.1 21.2 28.2 29.4 29.8
RoE (%) 10.2 15.7 20.2 21.1 21.5
P/E (x) 88.9 63.6 55.7 45.2 37.4
P/BV (x) 8.7 9.3 10.4 8.8 7.4
EV/EBITDA (x) 32.7 28.3 27.2 23.1 19.8
Source: Company, Nirmal Bang Institutional Equities Research
13 December 2018

Institutional Equities
United Breweries 18
Investment thesis
Beer has potential to become fast-growing category in the food and beverage space
Although Kingfisher and other beer brands have been in existence for a fairly long period in India, considering the pricing and regulation challenges the size of overall market is still fairly small from a regional and global pool perspective. The global beer market is estimated to be in excess of 2,000mn hecto litre and India’s contribution to the overall pool is fairly insignificant at around 1%. (China’s contribution is in excess of 25%). Urbanisation and emerging middle class consumer, in our opinion, will increasingly consider beer as a good alternate to spirits and other beverage choices and it is this aspect it will be the strongest driver of growth. Considering the low alcohol content, beer is also perceived to be more safe and healthier by most new and existing consumers of alcoholic beverages. This aspect too, in our opinion, is fairly important considering that consumer choices continue to evolve towards more premium and healthier options within the alcoholic beverage space. In the past three years, the market has seen expansion by 11% despite a myriad of regulation challenges, and as these challenges moderate and consumer confidence continues to hold up we expect growth to remain in early teens for the industry. We expect UBL with its wide portfolio and distribution capabilities to outperform.
Exhibit 1: Beer industry’s volume growth
225235
263 270280
294
337360
0
50
100
150
200
250
300
350
400
FY11 FY12 FY13 FY14 FY15 FY16 FY17 FY18
(mn cases)
Source: Company, Nirmal Bang Institutional Equities Research
Exhibit 2: Strong product portfolio
Source: Nirmal Bang Institutional Equities Research
Institutional Equities
United Breweries 19
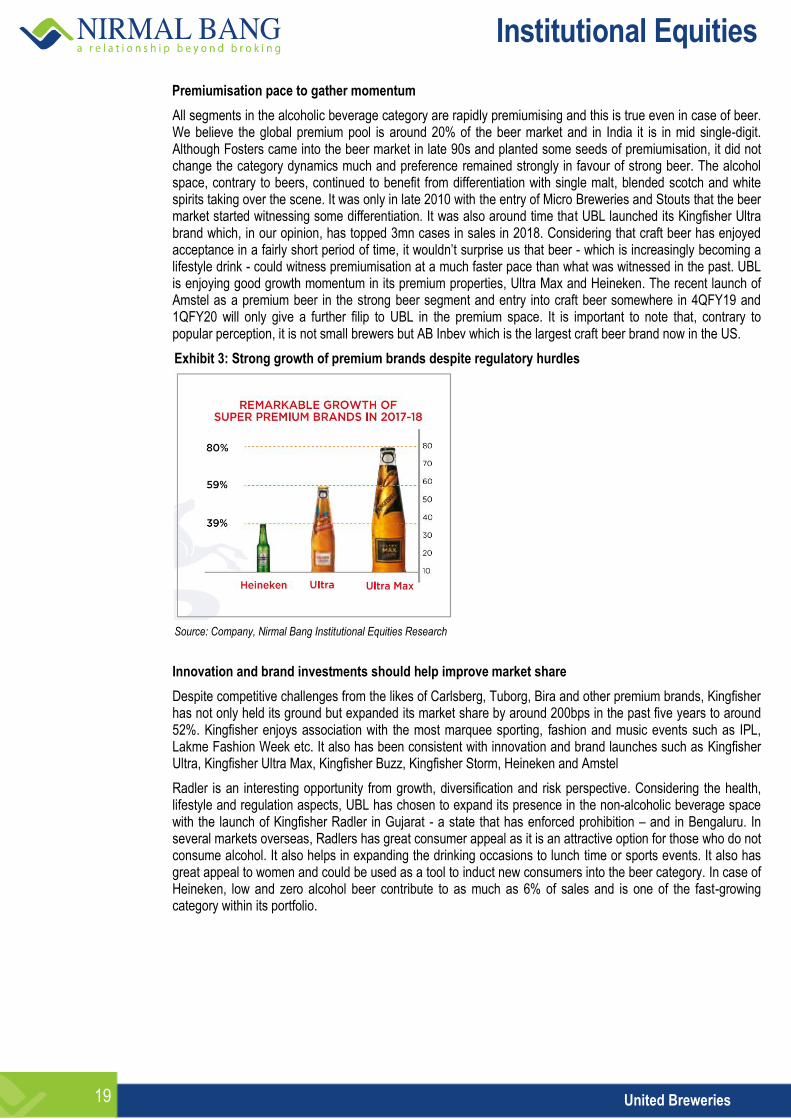
Premiumisation pace to gather momentum
All segments in the alcoholic beverage category are rapidly premiumising and this is true even in case of beer. We believe the global premium pool is around 20% of the beer market and in India it is in mid single-digit. Although Fosters came into the beer market in late 90s and planted some seeds of premiumisation, it did not change the category dynamics much and preference remained strongly in favour of strong beer. The alcohol space, contrary to beers, continued to benefit from differentiation with single malt, blended scotch and white spirits taking over the scene. It was only in late 2010 with the entry of Micro Breweries and Stouts that the beer market started witnessing some differentiation. It was also around time that UBL launched its Kingfisher Ultra brand which, in our opinion, has topped 3mn cases in sales in 2018. Considering that craft beer has enjoyed acceptance in a fairly short period of time, it wouldn’t surprise us that beer - which is increasingly becoming a lifestyle drink - could witness premiumisation at a much faster pace than what was witnessed in the past. UBL is enjoying good growth momentum in its premium properties, Ultra Max and Heineken. The recent launch of Amstel as a premium beer in the strong beer segment and entry into craft beer somewhere in 4QFY19 and 1QFY20 will only give a further filip to UBL in the premium space. It is important to note that, contrary to popular perception, it is not small brewers but AB Inbev which is the largest craft beer brand now in the US.
Exhibit 3: Strong growth of premium brands despite regulatory hurdles
Source: Company, Nirmal Bang Institutional Equities Research
Innovation and brand investments should help improve market share
Despite competitive challenges from the likes of Carlsberg, Tuborg, Bira and other premium brands, Kingfisher has not only held its ground but expanded its market share by around 200bps in the past five years to around 52%. Kingfisher enjoys association with the most marquee sporting, fashion and music events such as IPL, Lakme Fashion Week etc. It also has been consistent with innovation and brand launches such as Kingfisher Ultra, Kingfisher Ultra Max, Kingfisher Buzz, Kingfisher Storm, Heineken and Amstel
Radler is an interesting opportunity from growth, diversification and risk perspective. Considering the health, lifestyle and regulation aspects, UBL has chosen to expand its presence in the non-alcoholic beverage space with the launch of Kingfisher Radler in Gujarat - a state that has enforced prohibition – and in Bengaluru. In several markets overseas, Radlers has great consumer appeal as it is an attractive option for those who do not consume alcohol. It also helps in expanding the drinking occasions to lunch time or sports events. It also has great appeal to women and could be used as a tool to induct new consumers into the beer category. In case of Heineken, low and zero alcohol beer contribute to as much as 6% of sales and is one of the fast-growing category within its portfolio.
Institutional Equities
United Breweries 20
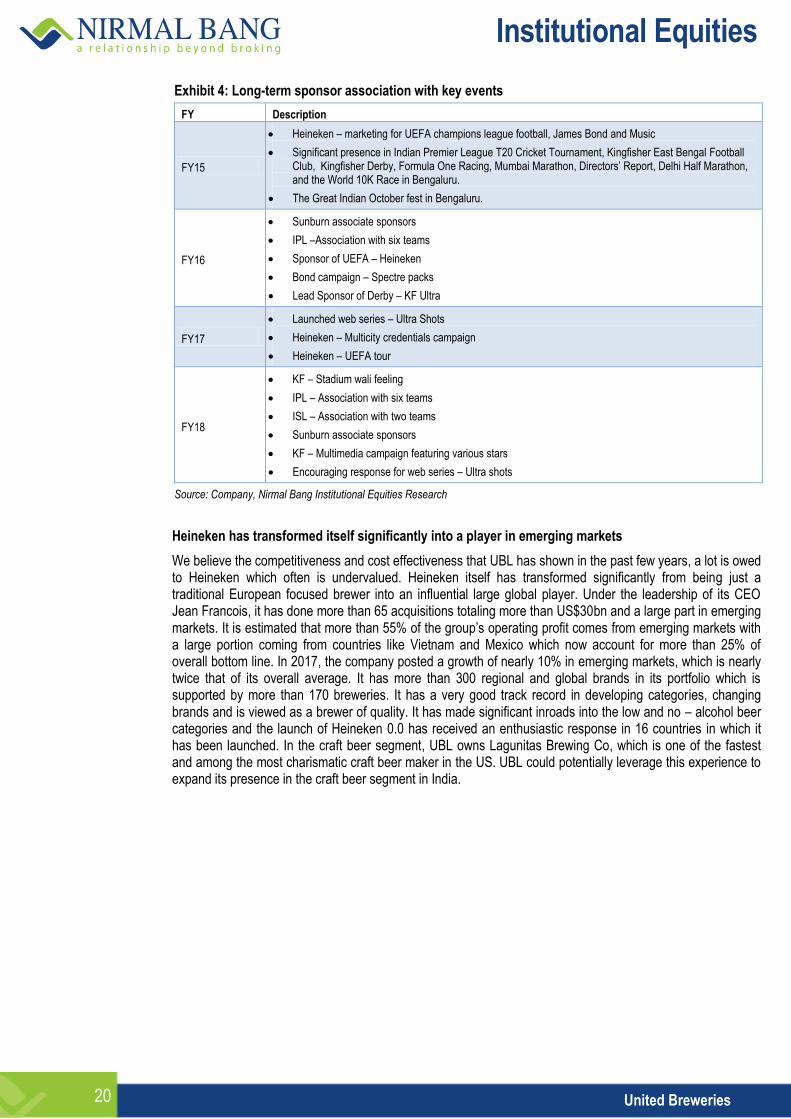
Exhibit 4: Long-term sponsor association with key events
FY Description
FY15
Heineken – marketing for UEFA champions league football, James Bond and Music
Significant presence in Indian Premier League T20 Cricket Tournament, Kingfisher East Bengal Football Club, Kingfisher Derby, Formula One Racing, Mumbai Marathon, Directors’ Report, Delhi Half Marathon, and the World 10K Race in Bengaluru.
The Great Indian October fest in Bengaluru.
FY16
Sunburn associate sponsors
IPL –Association with six teams
Sponsor of UEFA – Heineken
Bond campaign – Spectre packs
Lead Sponsor of Derby – KF Ultra
FY17
Launched web series – Ultra Shots
Heineken – Multicity credentials campaign
Heineken – UEFA tour
FY18
KF – Stadium wali feeling
IPL – Association with six teams
ISL – Association with two teams
Sunburn associate sponsors
KF – Multimedia campaign featuring various stars
Encouraging response for web series – Ultra shots
Source: Company, Nirmal Bang Institutional Equities Research
Heineken has transformed itself significantly into a player in emerging markets
We believe the competitiveness and cost effectiveness that UBL has shown in the past few years, a lot is owed to Heineken which often is undervalued. Heineken itself has transformed significantly from being just a traditional European focused brewer into an influential large global player. Under the leadership of its CEO Jean Francois, it has done more than 65 acquisitions totaling more than US$30bn and a large part in emerging markets. It is estimated that more than 55% of the group’s operating profit comes from emerging markets with a large portion coming from countries like Vietnam and Mexico which now account for more than 25% of overall bottom line. In 2017, the company posted a growth of nearly 10% in emerging markets, which is nearly twice that of its overall average. It has more than 300 regional and global brands in its portfolio which is supported by more than 170 breweries. It has a very good track record in developing categories, changing brands and is viewed as a brewer of quality. It has made significant inroads into the low and no – alcohol beer categories and the launch of Heineken 0.0 has received an enthusiastic response in 16 countries in which it has been launched. In the craft beer segment, UBL owns Lagunitas Brewing Co, which is one of the fastest and among the most charismatic craft beer maker in the US. UBL could potentially leverage this experience to expand its presence in the craft beer segment in India.
Institutional Equities
United Breweries 21
Financial performance
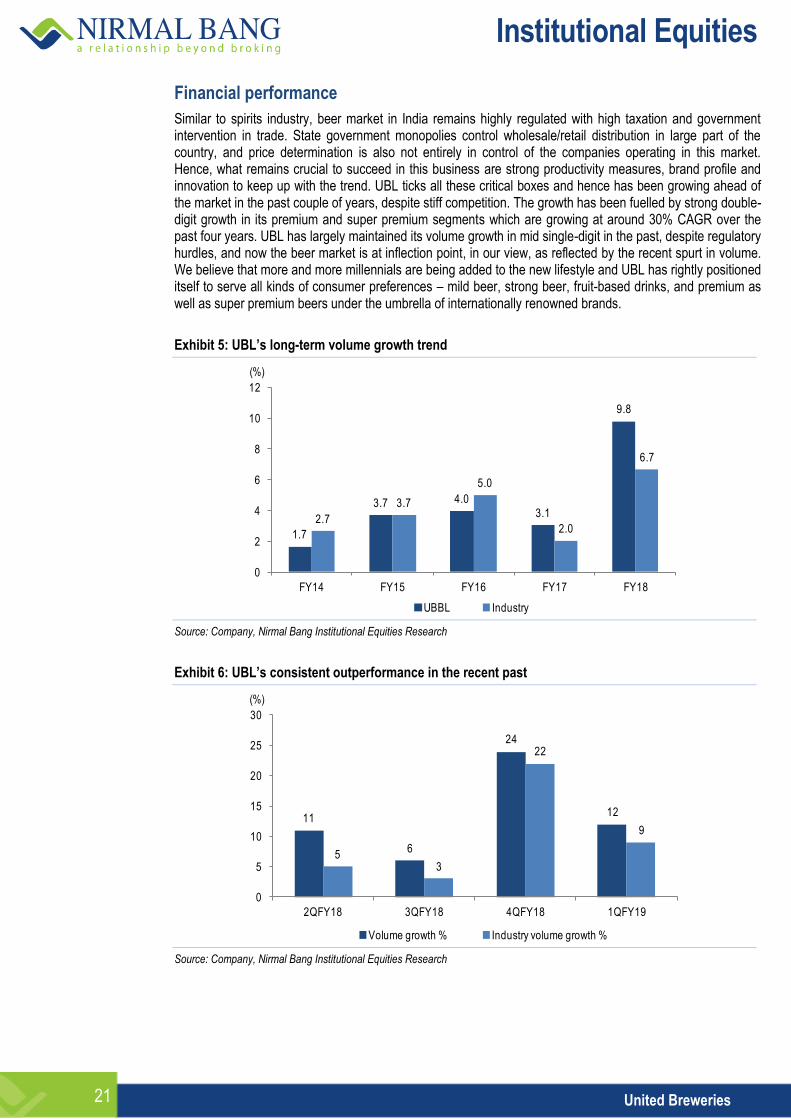
Similar to spirits industry, beer market in India remains highly regulated with high taxation and government intervention in trade. State government monopolies control wholesale/retail distribution in large part of the country, and price determination is also not entirely in control of the companies operating in this market. Hence, what remains crucial to succeed in this business are strong productivity measures, brand profile and innovation to keep up with the trend. UBL ticks all these critical boxes and hence has been growing ahead of the market in the past couple of years, despite stiff competition. The growth has been fuelled by strong double-digit growth in its premium and super premium segments which are growing at around 30% CAGR over the past four years. UBL has largely maintained its volume growth in mid single-digit in the past, despite regulatory hurdles, and now the beer market is at inflection point, in our view, as reflected by the recent spurt in volume. We believe that more and more millennials are being added to the new lifestyle and UBL has rightly positioned itself to serve all kinds of consumer preferences – mild beer, strong beer, fruit-based drinks, and premium as well as super premium beers under the umbrella of internationally renowned brands.
Exhibit 5: UBL’s long-term volume growth trend
1.7
3.7 4.0
3.1
9.8
2.7
3.7
5.0
2.0
6.7
0
2
4
6
8
10
12
FY14 FY15 FY16 FY17 FY18
UBBL Industry
(%)
Source: Company, Nirmal Bang Institutional Equities Research
Exhibit 6: UBL’s consistent outperformance in the recent past
11
6
24
12
53
22
9
0
5
10
15
20
25
30
2QFY18 3QFY18 4QFY18 1QFY19
Volume growth % Industry volume growth %
(%)
Source: Company, Nirmal Bang Institutional Equities Research
Institutional Equities
United Breweries 22
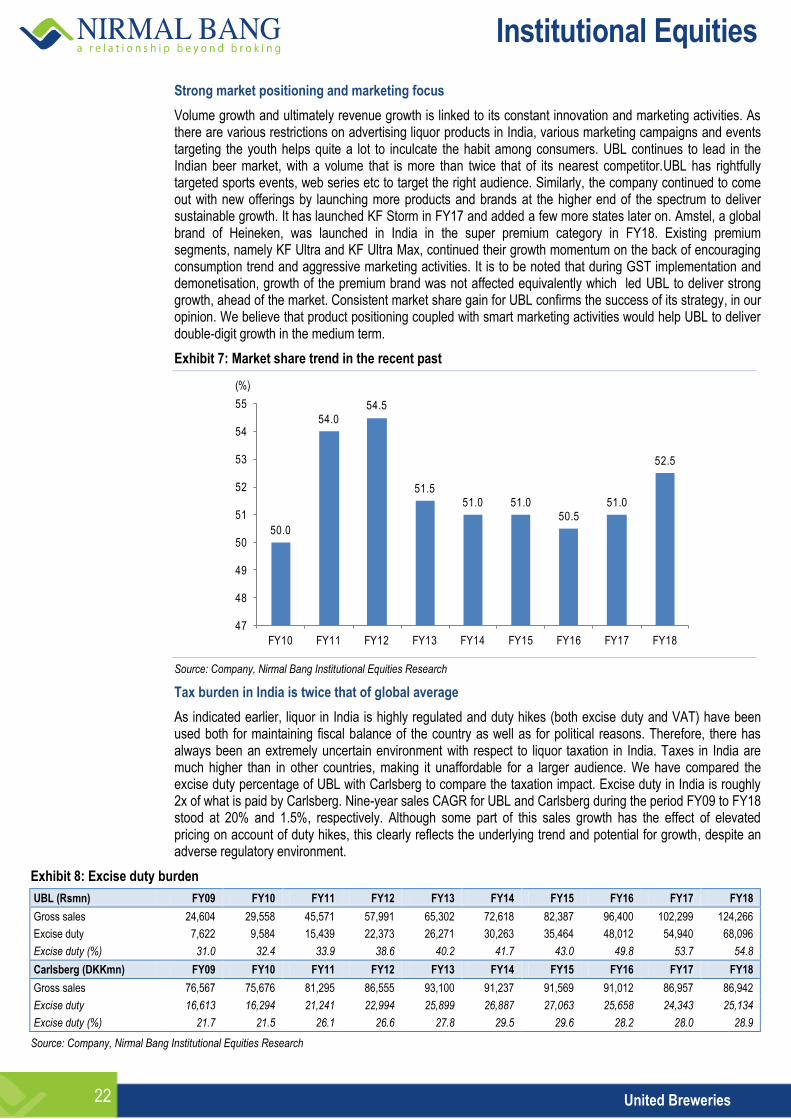
Strong market positioning and marketing focus
Volume growth and ultimately revenue growth is linked to its constant innovation and marketing activities. As there are various restrictions on advertising liquor products in India, various marketing campaigns and events targeting the youth helps quite a lot to inculcate the habit among consumers. UBL continues to lead in the Indian beer market, with a volume that is more than twice that of its nearest competitor.UBL has rightfully targeted sports events, web series etc to target the right audience. Similarly, the company continued to come out with new offerings by launching more products and brands at the higher end of the spectrum to deliver sustainable growth. It has launched KF Storm in FY17 and added a few more states later on. Amstel, a global brand of Heineken, was launched in India in the super premium category in FY18. Existing premium segments, namely KF Ultra and KF Ultra Max, continued their growth momentum on the back of encouraging consumption trend and aggressive marketing activities. It is to be noted that during GST implementation and demonetisation, growth of the premium brand was not affected equivalently which led UBL to deliver strong growth, ahead of the market. Consistent market share gain for UBL confirms the success of its strategy, in our opinion. We believe that product positioning coupled with smart marketing activities would help UBL to deliver double-digit growth in the medium term.
Exhibit 7: Market share trend in the recent past
50.0
54.054.5
51.551.0 51.0
50.551.0
52.5
47
48
49
50
51
52
53
54
55
FY10 FY11 FY12 FY13 FY14 FY15 FY16 FY17 FY18
(%)
Source: Company, Nirmal Bang Institutional Equities Research
Tax burden in India is twice that of global average
As indicated earlier, liquor in India is highly regulated and duty hikes (both excise duty and VAT) have been used both for maintaining fiscal balance of the country as well as for political reasons. Therefore, there has always been an extremely uncertain environment with respect to liquor taxation in India. Taxes in India are much higher than in other countries, making it unaffordable for a larger audience. We have compared the excise duty percentage of UBL with Carlsberg to compare the taxation impact. Excise duty in India is roughly 2x of what is paid by Carlsberg. Nine-year sales CAGR for UBL and Carlsberg during the period FY09 to FY18 stood at 20% and 1.5%, respectively. Although some part of this sales growth has the effect of elevated pricing on account of duty hikes, this clearly reflects the underlying trend and potential for growth, despite an adverse regulatory environment.
Exhibit 8: Excise duty burden
UBL (Rsmn) FY09 FY10 FY11 FY12 FY13 FY14 FY15 FY16 FY17 FY18
Gross sales 24,604 29,558 45,571 57,991 65,302 72,618 82,387 96,400 102,299 124,266
Excise duty 7,622 9,584 15,439 22,373 26,271 30,263 35,464 48,012 54,940 68,096
Excise duty (%) 31.0 32.4 33.9 38.6 40.2 41.7 43.0 49.8 53.7 54.8
Carlsberg (DKKmn) FY09 FY10 FY11 FY12 FY13 FY14 FY15 FY16 FY17 FY18
Gross sales 76,567 75,676 81,295 86,555 93,100 91,237 91,569 91,012 86,957 86,942
Excise duty 16,613 16,294 21,241 22,994 25,899 26,887 27,063 25,658 24,343 25,134
Excise duty (%) 21.7 21.5 26.1 26.6 27.8 29.5 29.6 28.2 28.0 28.9
Source: Company, Nirmal Bang Institutional Equities Research
Institutional Equities
United Breweries 23
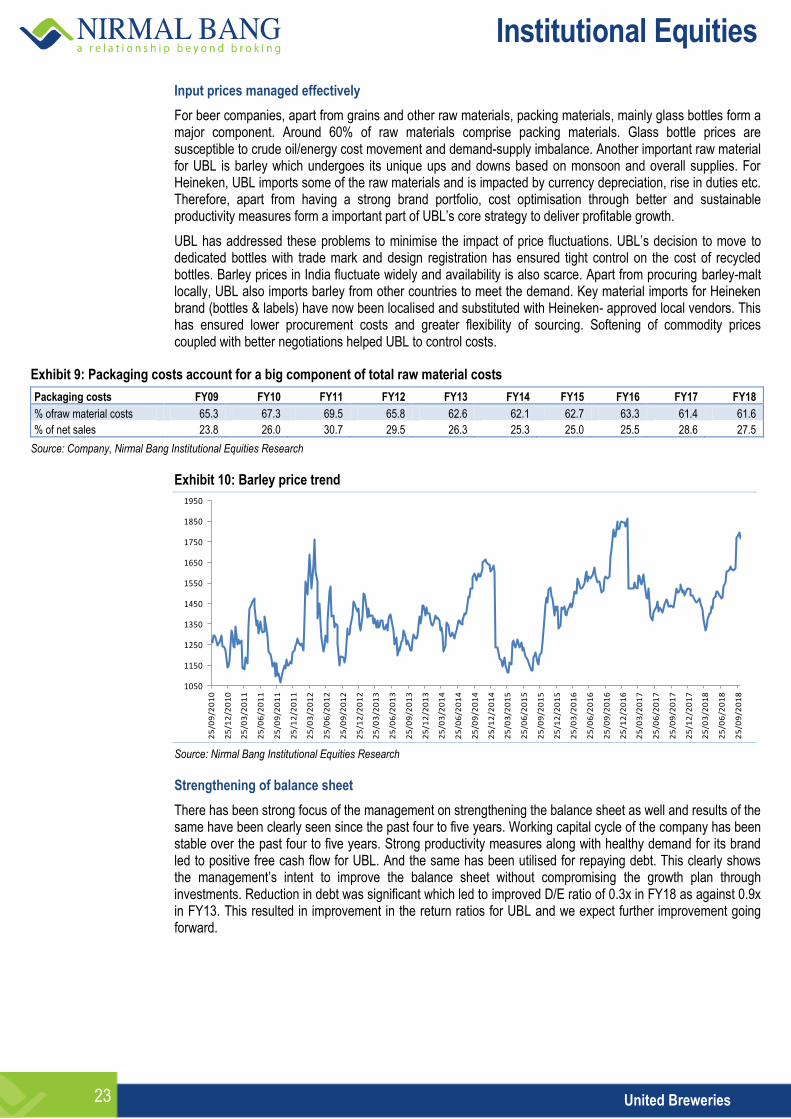
Input prices managed effectively
For beer companies, apart from grains and other raw materials, packing materials, mainly glass bottles form a major component. Around 60% of raw materials comprise packing materials. Glass bottle prices are susceptible to crude oil/energy cost movement and demand-supply imbalance. Another important raw material for UBL is barley which undergoes its unique ups and downs based on monsoon and overall supplies. For Heineken, UBL imports some of the raw materials and is impacted by currency depreciation, rise in duties etc. Therefore, apart from having a strong brand portfolio, cost optimisation through better and sustainable productivity measures form a important part of UBL’s core strategy to deliver profitable growth.
UBL has addressed these problems to minimise the impact of price fluctuations. UBL’s decision to move to dedicated bottles with trade mark and design registration has ensured tight control on the cost of recycled bottles. Barley prices in India fluctuate widely and availability is also scarce. Apart from procuring barley-malt locally, UBL also imports barley from other countries to meet the demand. Key material imports for Heineken brand (bottles & labels) have now been localised and substituted with Heineken- approved local vendors. This has ensured lower procurement costs and greater flexibility of sourcing. Softening of commodity prices coupled with better negotiations helped UBL to control costs.
Exhibit 9: Packaging costs account for a big component of total raw material costs
Packaging costs FY09 FY10 FY11 FY12 FY13 FY14 FY15 FY16 FY17 FY18
% ofraw material costs 65.3 67.3 69.5 65.8 62.6 62.1 62.7 63.3 61.4 61.6
% of net sales 23.8 26.0 30.7 29.5 26.3 25.3 25.0 25.5 28.6 27.5
Source: Company, Nirmal Bang Institutional Equities Research
Exhibit 10: Barley price trend
1050
1150
1250
1350
1450
1550
1650
1750
1850
1950
25
/09
/20
10
25
/12
/20
10
25
/03
/20
11
25
/06
/20
11
25
/09
/20
11
25
/12
/20
11
25
/03
/20
12
25
/06
/20
12
25
/09
/20
12
25
/12
/20
12
25
/03
/20
13
25
/06
/20
13
25
/09
/20
13
25
/12
/20
13
25
/03
/20
14
25
/06
/20
14
25
/09
/20
14
25
/12
/20
14
25
/03
/20
15
25
/06
/20
15
25
/09
/20
15
25
/12
/20
15
25
/03
/20
16
25
/06
/20
16
25
/09
/20
16
25
/12
/20
16
25
/03
/20
17
25
/06
/20
17
25
/09
/20
17
25
/12
/20
17
25
/03
/20
18
25
/06
/20
18
25
/09
/20
18
Source: Nirmal Bang Institutional Equities Research
Strengthening of balance sheet
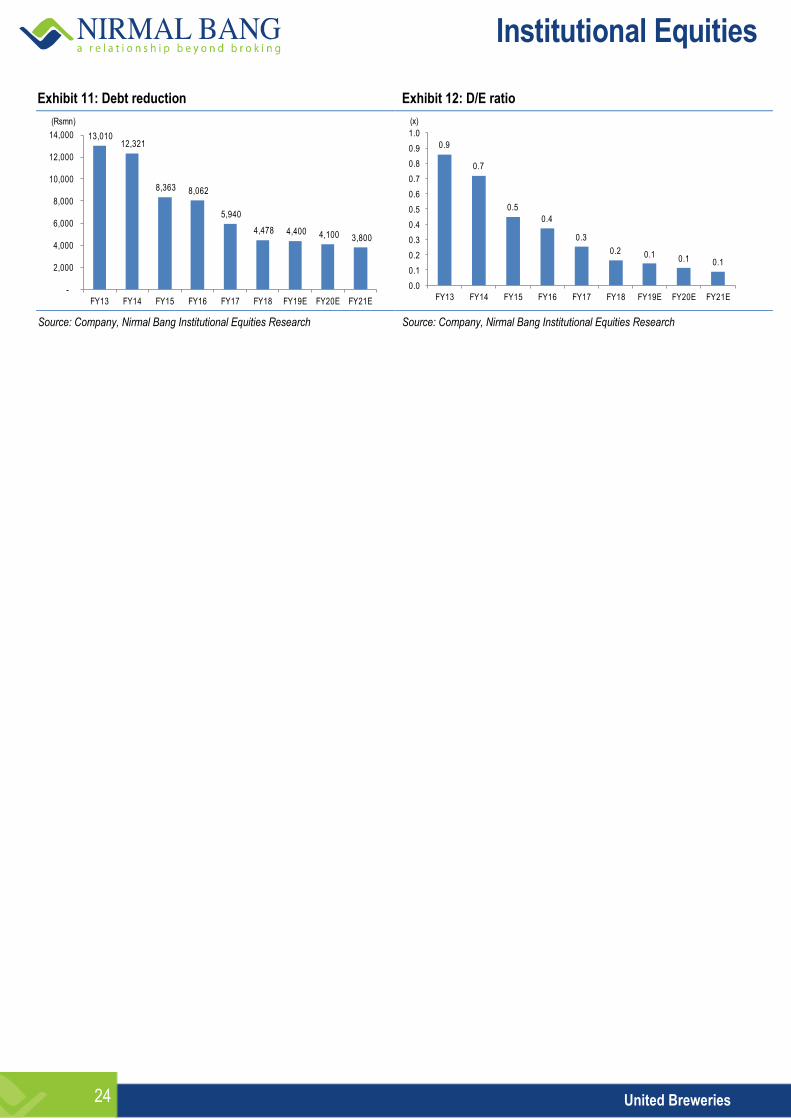
There has been strong focus of the management on strengthening the balance sheet as well and results of the same have been clearly seen since the past four to five years. Working capital cycle of the company has been stable over the past four to five years. Strong productivity measures along with healthy demand for its brand led to positive free cash flow for UBL. And the same has been utilised for repaying debt. This clearly shows the management’s intent to improve the balance sheet without compromising the growth plan through investments. Reduction in debt was significant which led to improved D/E ratio of 0.3x in FY18 as against 0.9x in FY13. This resulted in improvement in the return ratios for UBL and we expect further improvement going forward.
Institutional Equities
United Breweries 24
Exhibit 11: Debt reduction Exhibit 12: D/E ratio
13,010 12,321
8,363 8,062
5,940
4,478 4,400 4,100 3,800
-
2,000
4,000
6,000
8,000
10,000
12,000
14,000
FY13 FY14 FY15 FY16 FY17 FY18 FY19E FY20E FY21E
(Rsmn)
0.9
0.7
0.5
0.4
0.3
0.2 0.1 0.1 0.1
0.0
0.1
0.2
0.3
0.4
0.5
0.6
0.7
0.8
0.9
1.0
FY13 FY14 FY15 FY16 FY17 FY18 FY19E FY20E FY21E
(x)
Source: Company, Nirmal Bang Institutional Equities Research Source: Company, Nirmal Bang Institutional Equities Research
Institutional Equities
United Breweries 25
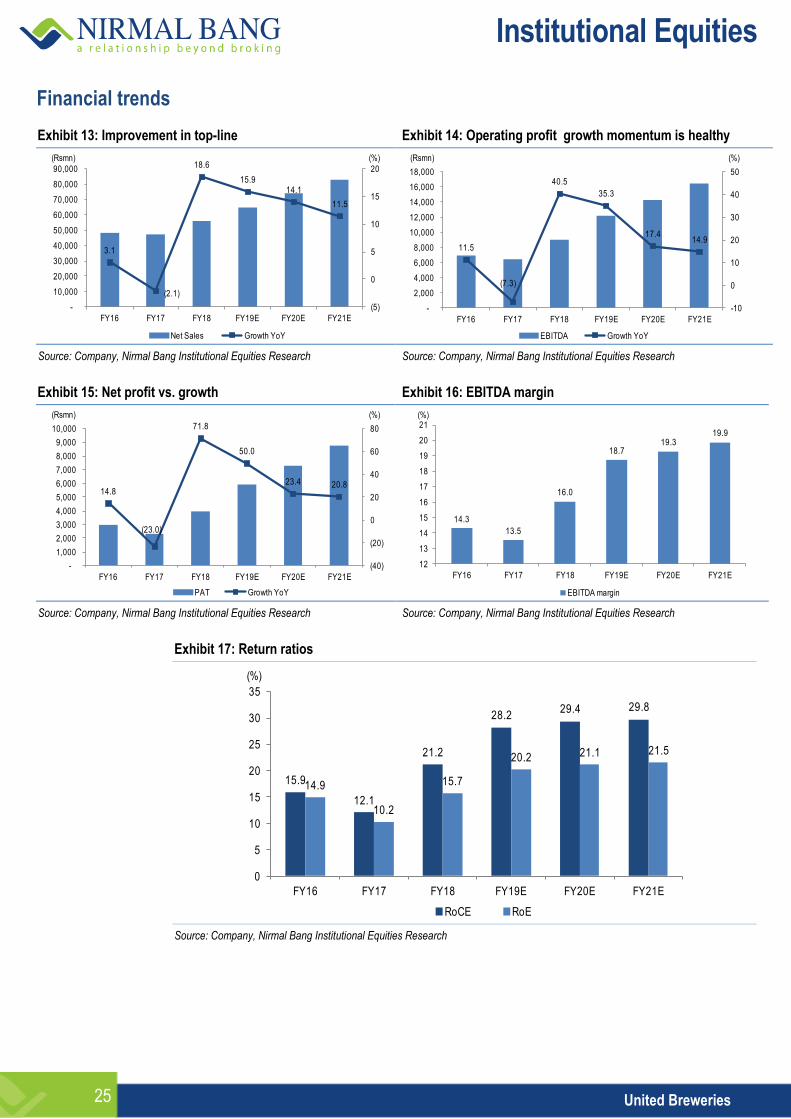
Financial trends
Exhibit 13: Improvement in top-line Exhibit 14: Operating profit growth momentum is healthy
3.1
(2.1)
18.6
15.9 14.1
11.5
(5)
0
5
10
15
20
-
10,000
20,000
30,000
40,000
50,000
60,000
70,000
80,000
90,000
FY16 FY17 FY18 FY19E FY20E FY21E
Net Sales Growth YoY
(Rsmn) (%)
11.5
(7.3)
40.5
35.3
17.4 14.9
-10
0
10
20
30
40
50
-
2,000
4,000
6,000
8,000
10,000
12,000
14,000
16,000
18,000
FY16 FY17 FY18 FY19E FY20E FY21E
EBITDA Growth YoY
(Rsmn) (%)
Source: Company, Nirmal Bang Institutional Equities Research Source: Company, Nirmal Bang Institutional Equities Research
Exhibit 15: Net profit vs. growth Exhibit 16: EBITDA margin
14.8
(23.0)
71.8
50.0
23.4 20.8
(40)
(20)
0
20
40
60
80
-
1,000
2,000
3,000
4,000
5,000
6,000
7,000
8,000
9,000
10,000
FY16 FY17 FY18 FY19E FY20E FY21E
PAT Growth YoY
(Rsmn) (%)
14.3
13.5
16.0
18.719.3
19.9
12
13
14
15
16
17
18
19
20
21
FY16 FY17 FY18 FY19E FY20E FY21E
EBITDA margin
(%)
Source: Company, Nirmal Bang Institutional Equities Research Source: Company, Nirmal Bang Institutional Equities Research
Exhibit 17: Return ratios
15.9
12.1
21.2
28.229.4 29.8
14.9
10.2
15.7
20.2 21.1 21.5
0
5
10
15
20
25
30
35
FY16 FY17 FY18 FY19E FY20E FY21E
RoCE RoE
(%)
Source: Company, Nirmal Bang Institutional Equities Research

Institutional Equities
United Breweries 26
Exhibit 18: Our estimates versus consensus estimates
Particulars
FY19E FY20E FY21E
Our estimate (Rsmn)
Consensus estimate
(Rsmn)
Variance (%)
Our estimate (Rsmn)
Consensus estimate
(Rsmn)
Variance (%)
Our estimate (Rsmn)
Consensus estimate
(Rsmn)
Variance (%)
Sales 65,110 64,486 1.0 74,263 73,464 1.1 82,797 83,235 (0.5)
EBITDA 12,188 11,731 3.9 14,314 13,557 5.6 16,453 15,875 3.6
Net income 5,909 5,862 0.8 7,289 6,955 4.8 8,803 8,421 4.5
Source: Bloomberg, Nirmal Bang Institutional Equities Research

Institutional Equities
United Breweries 27
Valuation and recommendation Liquor industry across the globe is susceptible to regulatory and taxation hurdles and hence the share price performance remained quite volatile with some years of exceptional outperformance and on the other hand, sudden slump on account of any of the adverse events. Compared to the global scenario, Indian companies had faced manifold challenges and growth was hampered for quite some time. However, considering the penetration potential and positive consumption environment, these companies bounced back on every downfall, outperforming broader indices and adding significant value to shareholders’ wealth.
Exhibit 19: Absolute price performance history of key Indian and global players
Alcohol Companies (%) CY07 CY08 CY09 CY10 CY11 CY12 CY13 CY14 CY15 CY16 CY17 YTDCY18
Spirits
PERNOD RICARD SA 9 (33) 22 17 2 22 (5) 11 14 (3) 29 7
DIAGEO PLC 8 (11) 13 9 19 27 12 (8) - 12 29 5
UNITED SPIRITS 131 (56) 42 16 (66) 286 37 7 7 (37) 93 (16)
Beers/Mix
ANHEUSER-BUSCH INBEV SA/NV 14 (53) 120 18 11 39 18 21 22 (13) (7) (32)
CARLSBERG AS-B 10 (65) 120 47 (28) 37 8 (19) 26 (1) 24 (4)
HEINEKEN NV 23 (50) 52 10 (3) 41 (3) 20 34 (10) 23 (9)
ASAHI GROUP HOLDINGS (1) (18) 11 (8) 7 9 61 29 (1) (3) 52 (22)
TSINGTAO BREWERY CO -H 100 (38) 166 (5) 6 6 43 (20) (33) (17) 33 (21)
CONSTELLATION BRANDS INC-A (19) (33) 1 39 (7) 71 99 39 45 7 50 (18)
THAI BEVERAGE PCL (6) (24) 26 16 (14) 61 37 28 - 23 7 (36)
UNITED BREWERIES L 85 (76) 116 200 (24) 142 (17) 8 13 (19) 40 15
Indices
Nifty FMCG 22 (20) 42 31 9 49 12 18 - - 31 11
Nifty 50 55 (52) 76 18 (25) 28 7 31 (4) 1 30 1
MSCI WORLD 7 (42) 27 10 (8) 13 24 3 (3) 5 20 (7)
Source: Bloomberg, Nirmal Bang Institutional Equities
Exhibit 20: Relative price performance history of key Indian and global players
Alcohol Companies (%) CY07 CY08 CY09 CY10 CY11 CY12 CY13 CY14 CY15 CY16 CY17 YTDCY18
Spirits
PERNOD RICARD SA 2 16 (4) 7 10 8 (24) 8 17 (8) 7 15
DIAGEO PLC 1 54 (11) - 28 12 (10) (10) 3 7 7 13
UNITED SPIRITS 49 (8) (19) (2) (55) 202 29 (19) 12 (38) 48 (16)
Beers/Mix
ANHEUSER-BUSCH INBEV SA/NV 7 (20) 73 7 20 23 (5) 18 25 (17) (23) (27)
CARLSBERG AS-B 3 (40) 73 34 (22) 21 (13) (21) 30 (6) 3 3
HEINEKEN NV 15 (14) 20 1 6 25 (22) 17 37 (14) 2 (2)
ASAHI GROUP HOLDINGS (7) 41 (12) (16) 15 (4) 30 25 2 (8) 26 (16)
TSINGTAO BREWERY CO-H 86 7 109 (14) 14 (6) 15 (22) (31) (21) 10 (15)
CONSTELLATION BRANDS INC-A (24) 15 (20) 27 1 51 60 36 49 2 24 (11)
THAI BEVERAGE PCL (12) 32 (1) 6 (7) 42 10 24 3 17 (11) (31)
UNITED BREWERIES 20 (51) 23 154 1 89 (22) (18) 18 (20) 7 14
Indices
Nifty FMCG (21) 67 (19) 11 44 16 5 (10) 5 (1) 1 10
Source: Bloomberg, Nirmal Bang Institutional Equities
Institutional Equities
United Breweries 28
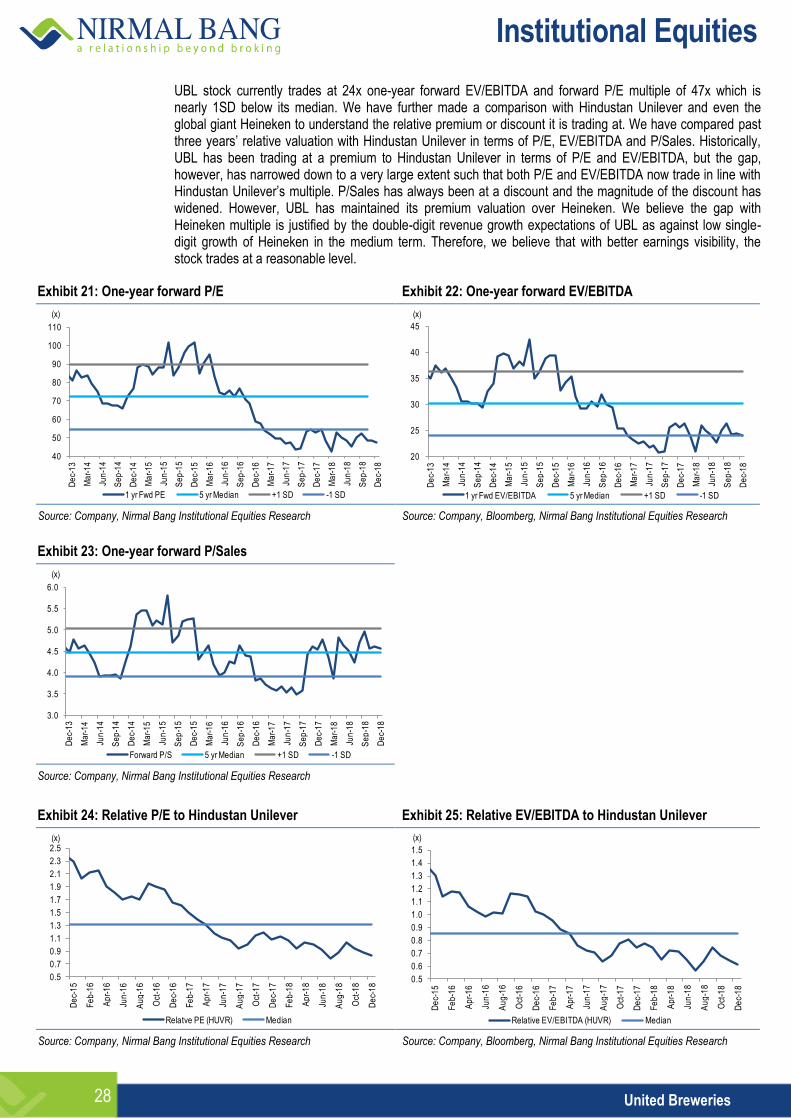
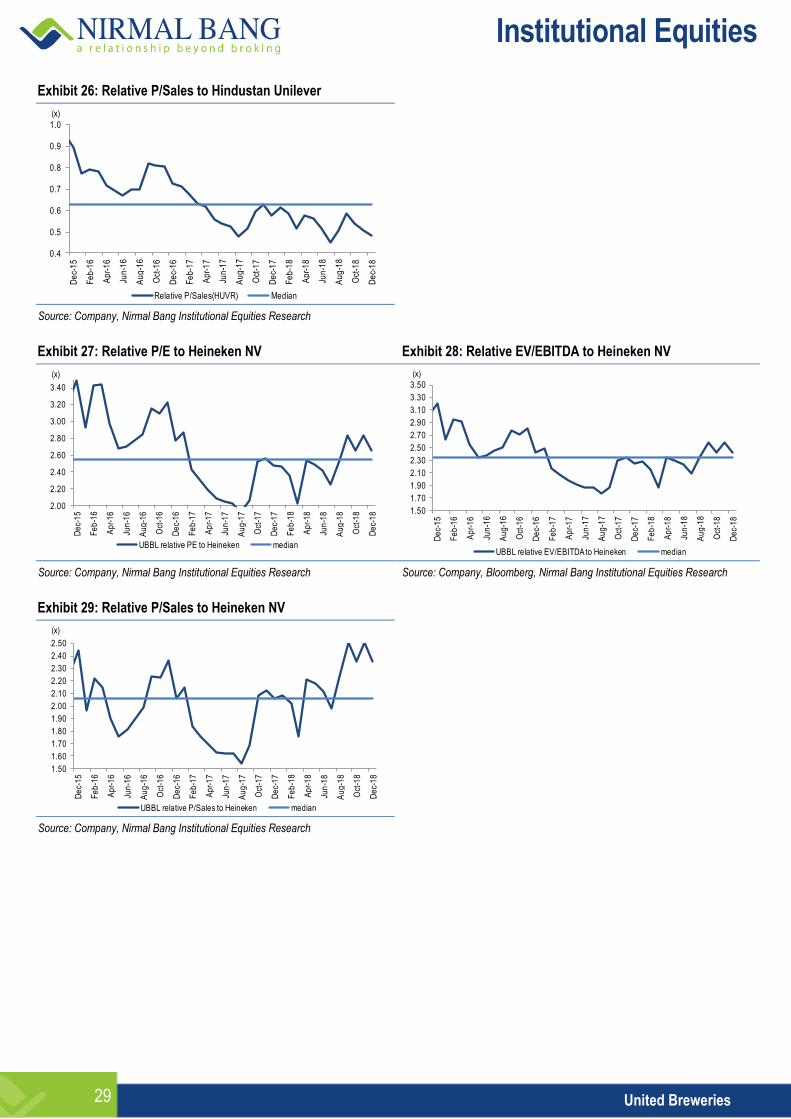
UBL stock currently trades at 24x one-year forward EV/EBITDA and forward P/E multiple of 47x which is nearly 1SD below its median. We have further made a comparison with Hindustan Unilever and even the global giant Heineken to understand the relative premium or discount it is trading at. We have compared past three years’ relative valuation with Hindustan Unilever in terms of P/E, EV/EBITDA and P/Sales. Historically, UBL has been trading at a premium to Hindustan Unilever in terms of P/E and EV/EBITDA, but the gap, however, has narrowed down to a very large extent such that both P/E and EV/EBITDA now trade in line with Hindustan Unilever’s multiple. P/Sales has always been at a discount and the magnitude of the discount has widened. However, UBL has maintained its premium valuation over Heineken. We believe the gap with Heineken multiple is justified by the double-digit revenue growth expectations of UBL as against low single-digit growth of Heineken in the medium term. Therefore, we believe that with better earnings visibility, the stock trades at a reasonable level.
Exhibit 21: One-year forward P/E Exhibit 22: One-year forward EV/EBITDA
40
50
60
70
80
90
100
110
De
c-1
3
Ma
r-1
4
Jun
-14
Se
p-1
4
De
c-1
4
Ma
r-1
5
Jun
-15
Se
p-1
5
De
c-1
5
Ma
r-1
6
Jun
-16
Se
p-1
6
De
c-1
6
Ma
r-1
7
Jun
-17
Se
p-1
7
De
c-1
7
Ma
r-1
8
Jun
-18
Se
p-1
8
De
c-1
8
1 yr Fwd PE 5 yr Median +1 SD -1 SD
(x)
20
25
30
35
40
45
De
c-1
3
Ma
r-1
4
Jun
-14
Se
p-1
4
De
c-1
4
Ma
r-1
5
Jun
-15
Se
p-1
5
De
c-1
5
Ma
r-1
6
Jun
-16
Se
p-1
6
De
c-1
6
Ma
r-1
7
Jun
-17
Se
p-1
7
De
c-1
7
Ma
r-1
8
Jun
-18
Se
p-1
8
De
c-1
8
1 yr Fwd EV/EBITDA 5 yr Median +1 SD -1 SD
(x)
Source: Company, Nirmal Bang Institutional Equities Research Source: Company, Bloomberg, Nirmal Bang Institutional Equities Research
Exhibit 23: One-year forward P/Sales
3.0
3.5
4.0
4.5
5.0
5.5
6.0
De
c-1
3
Ma
r-1
4
Jun
-14
Se
p-1
4
De
c-1
4
Ma
r-1
5
Jun
-15
Se
p-1
5
De
c-1
5
Ma
r-1
6
Jun
-16
Se
p-1
6
De
c-1
6
Ma
r-1
7
Jun
-17
Se
p-1
7
De
c-1
7
Ma
r-1
8
Jun
-18
Se
p-1
8
De
c-1
8
Forward P/S 5 yr Median +1 SD -1 SD
(x)
Source: Company, Nirmal Bang Institutional Equities Research
Exhibit 24: Relative P/E to Hindustan Unilever Exhibit 25: Relative EV/EBITDA to Hindustan Unilever
0.5
0.7
0.9
1.1
1.3
1.5
1.7
1.9
2.1
2.3
2.5
De
c-1
5
Fe
b-1
6
Ap
r-1
6
Jun
-16
Au
g-1
6
Oct
-16
De
c-1
6
Fe
b-1
7
Ap
r-1
7
Jun
-17
Au
g-1
7
Oct
-17
De
c-1
7
Fe
b-1
8
Ap
r-1
8
Jun
-18
Au
g-1
8
Oct
-18
De
c-1
8
Relatve PE (HUVR) Median
(x)
0.5
0.6
0.7
0.8
0.9
1.0
1.1
1.2
1.3
1.4
1.5
De
c-1
5
Fe
b-1
6
Ap
r-1
6
Jun
-16
Au
g-1
6
Oct
-16
De
c-1
6
Fe
b-1
7
Ap
r-1
7
Jun
-17
Au
g-1
7
Oct
-17
De
c-1
7
Fe
b-1
8
Ap
r-1
8
Jun
-18
Au
g-1
8
Oct
-18
De
c-1
8
Relative EV/EBITDA (HUVR) Median
(x)
Source: Company, Nirmal Bang Institutional Equities Research Source: Company, Bloomberg, Nirmal Bang Institutional Equities Research
Institutional Equities
United Breweries 29
Exhibit 26: Relative P/Sales to Hindustan Unilever
0.4
0.5
0.6
0.7
0.8
0.9
1.0
De
c-1
5
Fe
b-1
6
Ap
r-1
6
Jun
-16
Au
g-1
6
Oct
-16
De
c-1
6
Fe
b-1
7
Ap
r-1
7
Jun
-17
Au
g-1
7
Oct
-17
De
c-1
7
Fe
b-1
8
Ap
r-1
8
Jun
-18
Au
g-1
8
Oct
-18
De
c-1
8
Relative P/Sales(HUVR) Median
(x)
Source: Company, Nirmal Bang Institutional Equities Research
Exhibit 27: Relative P/E to Heineken NV Exhibit 28: Relative EV/EBITDA to Heineken NV
2.00
2.20
2.40
2.60
2.80
3.00
3.20
3.40
De
c-1
5
Fe
b-1
6
Ap
r-1
6
Jun
-16
Au
g-1
6
Oct
-16
De
c-1
6
Fe
b-1
7
Ap
r-1
7
Jun
-17
Au
g-1
7
Oct
-17
De
c-1
7
Fe
b-1
8
Ap
r-1
8
Jun
-18
Au
g-1
8
Oct
-18
De
c-1
8
UBBL relative PE to Heineken median
(x)
1.50
1.70
1.90
2.10
2.30
2.50
2.70
2.90
3.10
3.30
3.50
De
c-1
5
Fe
b-1
6
Ap
r-1
6
Jun
-16
Au
g-1
6
Oct
-16
De
c-1
6
Fe
b-1
7
Ap
r-1
7
Jun
-17
Au
g-1
7
Oct
-17
De
c-1
7
Fe
b-1
8
Ap
r-1
8
Jun
-18
Au
g-1
8
Oct
-18
De
c-1
8
UBBL relative EV/EBITDA to Heineken median
(x)
Source: Company, Nirmal Bang Institutional Equities Research Source: Company, Bloomberg, Nirmal Bang Institutional Equities Research
Exhibit 29: Relative P/Sales to Heineken NV
1.50
1.60
1.70
1.80
1.90
2.00
2.10
2.20
2.30
2.40
2.50
De
c-1
5
Fe
b-1
6
Ap
r-1
6
Jun
-16
Au
g-1
6
Oct
-16
De
c-1
6
Fe
b-1
7
Ap
r-1
7
Jun
-17
Au
g-1
7
Oct
-17
De
c-1
7
Fe
b-1
8
Ap
r-1
8
Jun
-18
Au
g-1
8
Oct
-18
De
c-1
8
UBBL relative P/Sales to Heineken median
(x)
Source: Company, Nirmal Bang Institutional Equities Research
Institutional Equities
United Breweries 30
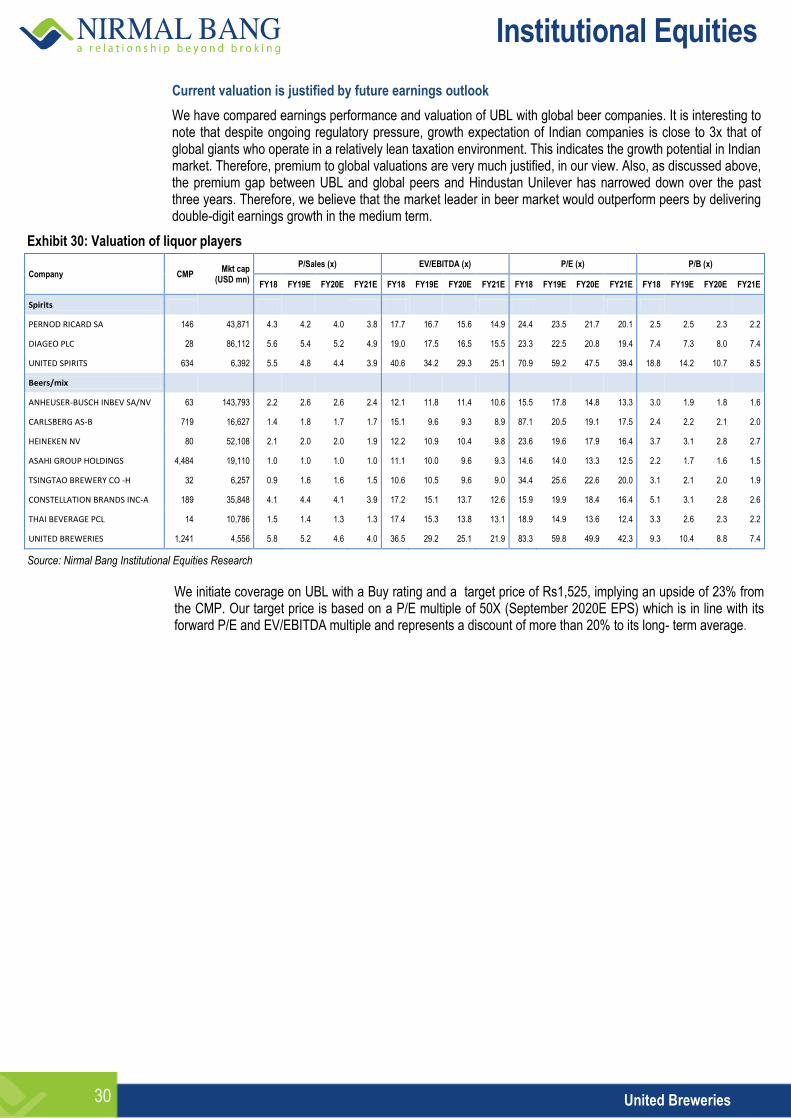
Current valuation is justified by future earnings outlook
We have compared earnings performance and valuation of UBL with global beer companies. It is interesting to note that despite ongoing regulatory pressure, growth expectation of Indian companies is close to 3x that of global giants who operate in a relatively lean taxation environment. This indicates the growth potential in Indian market. Therefore, premium to global valuations are very much justified, in our view. Also, as discussed above, the premium gap between UBL and global peers and Hindustan Unilever has narrowed down over the past three years. Therefore, we believe that the market leader in beer market would outperform peers by delivering double-digit earnings growth in the medium term.
Exhibit 30: Valuation of liquor players
Company CMP Mkt cap
(USD mn)
P/Sales (x) EV/EBITDA (x) P/E (x) P/B (x)
FY18 FY19E FY20E FY21E FY18 FY19E FY20E FY21E FY18 FY19E FY20E FY21E FY18 FY19E FY20E FY21E
Spirits
PERNOD RICARD SA 146 43,871 4.3 4.2 4.0 3.8 17.7 16.7 15.6 14.9 24.4 23.5 21.7 20.1 2.5 2.5 2.3 2.2
DIAGEO PLC 28 86,112 5.6 5.4 5.2 4.9 19.0 17.5 16.5 15.5 23.3 22.5 20.8 19.4 7.4 7.3 8.0 7.4
UNITED SPIRITS 634 6,392 5.5 4.8 4.4 3.9 40.6 34.2 29.3 25.1 70.9 59.2 47.5 39.4 18.8 14.2 10.7 8.5
Beers/mix
ANHEUSER-BUSCH INBEV SA/NV 63 143,793 2.2 2.6 2.6 2.4 12.1 11.8 11.4 10.6 15.5 17.8 14.8 13.3 3.0 1.9 1.8 1.6
CARLSBERG AS-B 719 16,627 1.4 1.8 1.7 1.7 15.1 9.6 9.3 8.9 87.1 20.5 19.1 17.5 2.4 2.2 2.1 2.0
HEINEKEN NV 80 52,108 2.1 2.0 2.0 1.9 12.2 10.9 10.4 9.8 23.6 19.6 17.9 16.4 3.7 3.1 2.8 2.7
ASAHI GROUP HOLDINGS 4,484 19,110 1.0 1.0 1.0 1.0 11.1 10.0 9.6 9.3 14.6 14.0 13.3 12.5 2.2 1.7 1.6 1.5
TSINGTAO BREWERY CO -H 32 6,257 0.9 1.6 1.6 1.5 10.6 10.5 9.6 9.0 34.4 25.6 22.6 20.0 3.1 2.1 2.0 1.9
CONSTELLATION BRANDS INC-A 189 35,848 4.1 4.4 4.1 3.9 17.2 15.1 13.7 12.6 15.9 19.9 18.4 16.4 5.1 3.1 2.8 2.6
THAI BEVERAGE PCL 14 10,786 1.5 1.4 1.3 1.3 17.4 15.3 13.8 13.1 18.9 14.9 13.6 12.4 3.3 2.6 2.3 2.2
UNITED BREWERIES 1,241 4,556 5.8 5.2 4.6 4.0 36.5 29.2 25.1 21.9 83.3 59.8 49.9 42.3 9.3 10.4 8.8 7.4
Source: Nirmal Bang Institutional Equities Research
We initiate coverage on UBL with a Buy rating and a target price of Rs1,525, implying an upside of 23% from the CMP. Our target price is based on a P/E multiple of 50X (September 2020E EPS) which is in line with its forward P/E and EV/EBITDA multiple and represents a discount of more than 20% to its long- term average.
Institutional Equities
United Breweries 31
Risks
We are assuming that the liquor industry is at inflection point as the worst in terms of regulations and taxation is over and increasing millennial population would largely drive growth for premium category. However, any event or announcement hurting the consumer sentiment or plan could be detrimental to our earnings estimates.
We expect inflation to remain at a moderate level in the next couple of years, and any sharp increase thereafter could hurt discretionary spending of consumers and incremental growth could be impacted to a reasonable extent.
Although, we acknowledge the competition in the spirits market, aggressive strategy on account of the second-largest player or any other peer in terms of new brands or competitive pricing could lead to variation in our estimates.
We are banking on the changing lifestyle of the consumer, but any disruption caused to this trend on account of health awareness etc could lead to a different picture altogether.
Institutional Equities
United Breweries 32
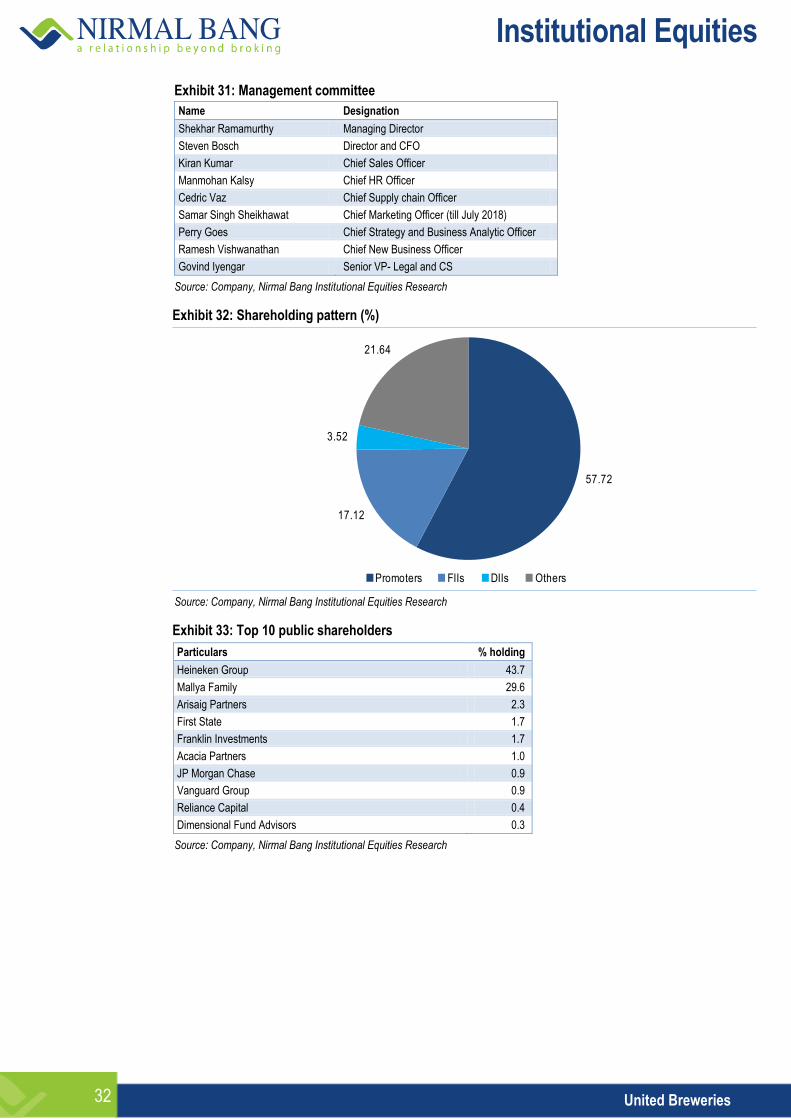
Exhibit 31: Management committee
Name Designation
Shekhar Ramamurthy Managing Director
Steven Bosch Director and CFO
Kiran Kumar Chief Sales Officer
Manmohan Kalsy Chief HR Officer
Cedric Vaz Chief Supply chain Officer
Samar Singh Sheikhawat Chief Marketing Officer (till July 2018)
Perry Goes Chief Strategy and Business Analytic Officer
Ramesh Vishwanathan Chief New Business Officer
Govind Iyengar Senior VP- Legal and CS
Source: Company, Nirmal Bang Institutional Equities Research
Exhibit 32: Shareholding pattern (%)
57.72
17.12
3.52
21.64
Promoters FIIs DIIs Others Source: Company, Nirmal Bang Institutional Equities Research
Exhibit 33: Top 10 public shareholders
Particulars % holding
Heineken Group 43.7
Mallya Family 29.6
Arisaig Partners 2.3
First State 1.7
Franklin Investments 1.7
Acacia Partners 1.0
JP Morgan Chase 0.9
Vanguard Group 0.9
Reliance Capital 0.4
Dimensional Fund Advisors 0.3
Source: Company, Nirmal Bang Institutional Equities Research
Institutional Equities
United Breweries 33
Financials (consolidated)
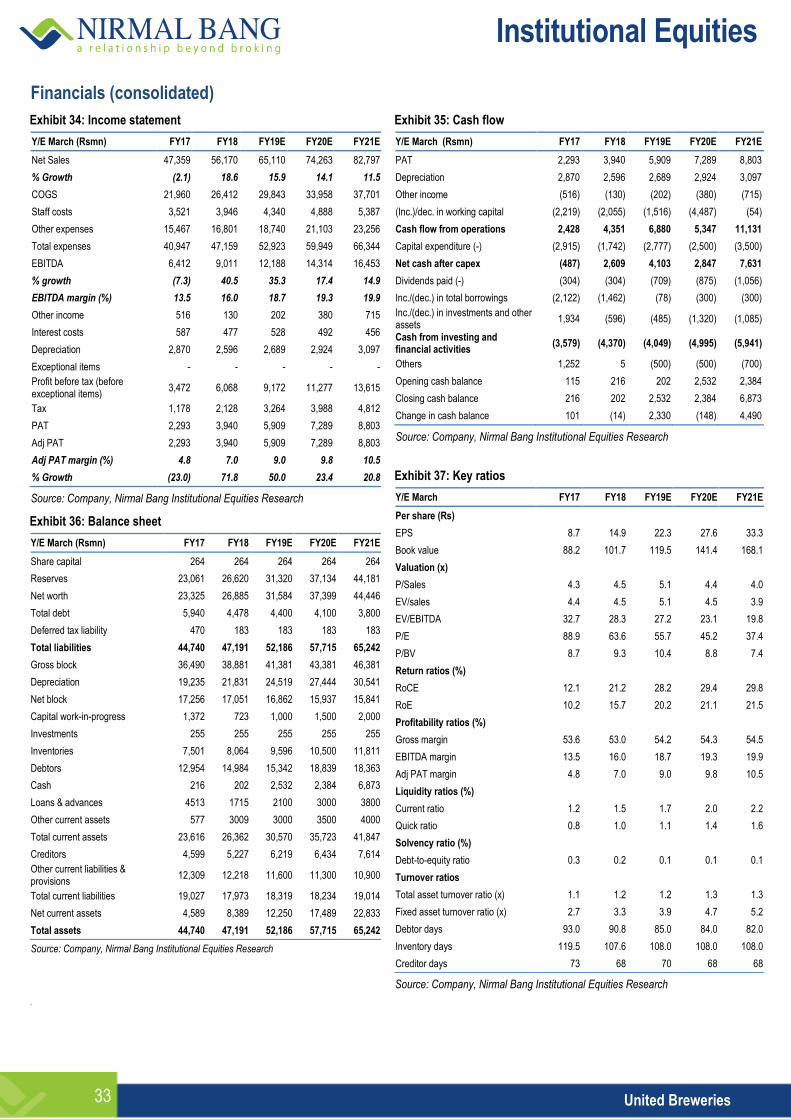
Exhibit 34: Income statement
Y/E March (Rsmn) FY17 FY18 FY19E FY20E FY21E
Net Sales 47,359 56,170 65,110 74,263 82,797
% Growth (2.1) 18.6 15.9 14.1 11.5
COGS 21,960 26,412 29,843 33,958 37,701
Staff costs 3,521 3,946 4,340 4,888 5,387
Other expenses 15,467 16,801 18,740 21,103 23,256
Total expenses 40,947 47,159 52,923 59,949 66,344
EBITDA 6,412 9,011 12,188 14,314 16,453
% growth (7.3) 40.5 35.3 17.4 14.9
EBITDA margin (%) 13.5 16.0 18.7 19.3 19.9
Other income 516 130 202 380 715
Interest costs 587 477 528 492 456
Depreciation 2,870 2,596 2,689 2,924 3,097
Exceptional items - - - - -
Profit before tax (before exceptional items)
3,472 6,068 9,172 11,277 13,615
Tax 1,178 2,128 3,264 3,988 4,812
PAT 2,293 3,940 5,909 7,289 8,803
Adj PAT 2,293 3,940 5,909 7,289 8,803
Adj PAT margin (%) 4.8 7.0 9.0 9.8 10.5
% Growth (23.0) 71.8 50.0 23.4 20.8
Source: Company, Nirmal Bang Institutional Equities Research
Exhibit 36: Balance sheet
Y/E March (Rsmn) FY17 FY18 FY19E FY20E FY21E
Share capital 264 264 264 264 264
Reserves 23,061 26,620 31,320 37,134 44,181
Net worth 23,325 26,885 31,584 37,399 44,446
Total debt 5,940 4,478 4,400 4,100 3,800
Deferred tax liability 470 183 183 183 183
Total liabilities 44,740 47,191 52,186 57,715 65,242
Gross block 36,490 38,881 41,381 43,381 46,381
Depreciation 19,235 21,831 24,519 27,444 30,541
Net block 17,256 17,051 16,862 15,937 15,841
Capital work-in-progress 1,372 723 1,000 1,500 2,000
Investments 255 255 255 255 255
Inventories 7,501 8,064 9,596 10,500 11,811
Debtors 12,954 14,984 15,342 18,839 18,363
Cash 216 202 2,532 2,384 6,873
Loans & advances 4513 1715 2100 3000 3800
Other current assets 577 3009 3000 3500 4000
Total current assets 23,616 26,362 30,570 35,723 41,847
Creditors 4,599 5,227 6,219 6,434 7,614
Other current liabilities & provisions
12,309 12,218 11,600 11,300 10,900
Total current liabilities 19,027 17,973 18,319 18,234 19,014
Net current assets 4,589 8,389 12,250 17,489 22,833
Total assets 44,740 47,191 52,186 57,715 65,242
Source: Company, Nirmal Bang Institutional Equities Research
Exhibit 35: Cash flow
Y/E March (Rsmn) FY17 FY18 FY19E FY20E FY21E
PAT 2,293 3,940 5,909 7,289 8,803
Depreciation 2,870 2,596 2,689 2,924 3,097
Other income (516) (130) (202) (380) (715)
(Inc.)/dec. in working capital (2,219) (2,055) (1,516) (4,487) (54)
Cash flow from operations 2,428 4,351 6,880 5,347 11,131
Capital expenditure (-) (2,915) (1,742) (2,777) (2,500) (3,500)
Net cash after capex (487) 2,609 4,103 2,847 7,631
Dividends paid (-) (304) (304) (709) (875) (1,056)
Inc./(dec.) in total borrowings (2,122) (1,462) (78) (300) (300)
Inc./(dec.) in investments and other assets
1,934 (596) (485) (1,320) (1,085)
Cash from investing and financial activities
(3,579) (4,370) (4,049) (4,995) (5,941)
Others 1,252 5 (500) (500) (700)
Opening cash balance 115 216 202 2,532 2,384
Closing cash balance 216 202 2,532 2,384 6,873
Change in cash balance 101 (14) 2,330 (148) 4,490
Source: Company, Nirmal Bang Institutional Equities Research
Exhibit 37: Key ratios
Y/E March FY17 FY18 FY19E FY20E FY21E
Per share (Rs)
EPS 8.7 14.9 22.3 27.6 33.3
Book value 88.2 101.7 119.5 141.4 168.1
Valuation (x)
P/Sales 4.3 4.5 5.1 4.4 4.0
EV/sales 4.4 4.5 5.1 4.5 3.9
EV/EBITDA 32.7 28.3 27.2 23.1 19.8
P/E 88.9 63.6 55.7 45.2 37.4
P/BV 8.7 9.3 10.4 8.8 7.4
Return ratios (%)
RoCE 12.1 21.2 28.2 29.4 29.8
RoE 10.2 15.7 20.2 21.1 21.5
Profitability ratios (%)
Gross margin 53.6 53.0 54.2 54.3 54.5
EBITDA margin 13.5 16.0 18.7 19.3 19.9
Adj PAT margin 4.8 7.0 9.0 9.8 10.5
Liquidity ratios (%)
Current ratio 1.2 1.5 1.7 2.0 2.2
Quick ratio 0.8 1.0 1.1 1.4 1.6
Solvency ratio (%)
Debt-to-equity ratio 0.3 0.2 0.1 0.1 0.1
Turnover ratios
Total asset turnover ratio (x) 1.1 1.2 1.2 1.3 1.3
Fixed asset turnover ratio (x) 2.7 3.3 3.9 4.7 5.2
Debtor days 93.0 90.8 85.0 84.0 82.0
Inventory days 119.5 107.6 108.0 108.0 108.0
Creditor days 73 68 70 68 68
Source: Company, Nirmal Bang Institutional Equities Research
r

Institutional Equities
United Breweries 34
This page has been intentionally left blank
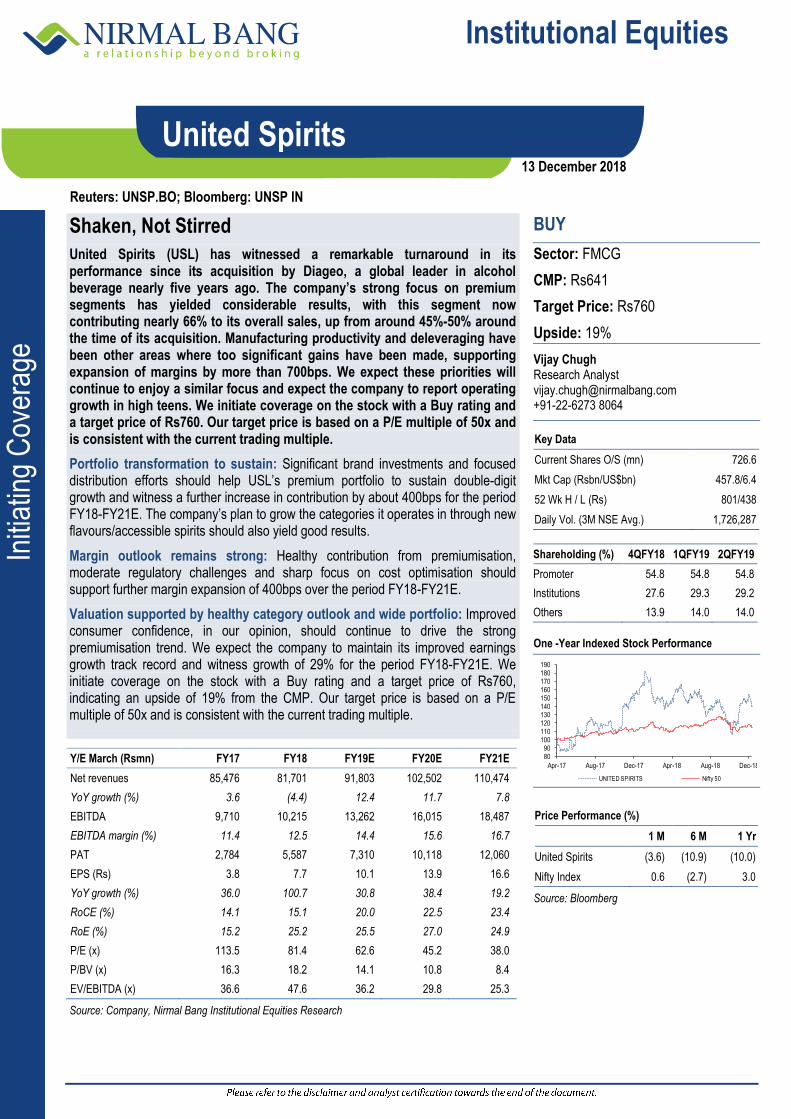
Institutional Equities
Initi
atin
g C
over
age
Reuters: UNSP.BO; Bloomberg: UNSP IN
United Spirits
Shaken, Not Stirred
United Spirits (USL) has witnessed a remarkable turnaround in its performance since its acquisition by Diageo, a global leader in alcohol beverage nearly five years ago. The company’s strong focus on premium segments has yielded considerable results, with this segment now contributing nearly 66% to its overall sales, up from around 45%-50% around the time of its acquisition. Manufacturing productivity and deleveraging have been other areas where too significant gains have been made, supporting expansion of margins by more than 700bps. We expect these priorities will continue to enjoy a similar focus and expect the company to report operating growth in high teens. We initiate coverage on the stock with a Buy rating and a target price of Rs760. Our target price is based on a P/E multiple of 50x and is consistent with the current trading multiple.
Portfolio transformation to sustain: Significant brand investments and focused distribution efforts should help USL’s premium portfolio to sustain double-digit growth and witness a further increase in contribution by about 400bps for the period FY18-FY21E. The company’s plan to grow the categories it operates in through new flavours/accessible spirits should also yield good results.
Margin outlook remains strong: Healthy contribution from premiumisation, moderate regulatory challenges and sharp focus on cost optimisation should support further margin expansion of 400bps over the period FY18-FY21E.
Valuation supported by healthy category outlook and wide portfolio: Improved consumer confidence, in our opinion, should continue to drive the strong premiumisation trend. We expect the company to maintain its improved earnings growth track record and witness growth of 29% for the period FY18-FY21E. We initiate coverage on the stock with a Buy rating and a target price of Rs760, indicating an upside of 19% from the CMP. Our target price is based on a P/E multiple of 50x and is consistent with the current trading multiple.
BUY
Sector: FMCG
CMP: Rs641
Target Price: Rs760
Upside: 19%
Vijay Chugh Research Analyst [email protected] +91-22-6273 8064
Key Data
Current Shares O/S (mn) 726.6
Mkt Cap (Rsbn/US$bn) 457.8/6.4
52 Wk H / L (Rs) 801/438
Daily Vol. (3M NSE Avg.) 1,726,287
Shareholding (%) 4QFY18 1QFY19 2QFY19
Promoter 54.8 54.8 54.8
Institutions 27.6 29.3 29.2
Others 13.9 14.0 14.0
One -Year Indexed Stock Performance
8090
100110120130140150160170180190
Apr-17 Aug-17 Dec-17 Apr-18 Aug-18 Dec-18
UNITED SPIRITS Nifty 50
Price Performance (%)
1 M 6 M 1 Yr
United Spirits (3.6) (10.9) (10.0)
Nifty Index 0.6 (2.7) 3.0
Source: Bloomberg
Y/E March (Rsmn) FY17 FY18 FY19E FY20E FY21E
Net revenues 85,476 81,701 91,803 102,502 110,474
YoY growth (%) 3.6 (4.4) 12.4 11.7 7.8
EBITDA 9,710 10,215 13,262 16,015 18,487
EBITDA margin (%) 11.4 12.5 14.4 15.6 16.7
PAT 2,784 5,587 7,310 10,118 12,060
EPS (Rs) 3.8 7.7 10.1 13.9 16.6
YoY growth (%) 36.0 100.7 30.8 38.4 19.2
RoCE (%) 14.1 15.1 20.0 22.5 23.4
RoE (%) 15.2 25.2 25.5 27.0 24.9
P/E (x) 113.5 81.4 62.6 45.2 38.0
P/BV (x) 16.3 18.2 14.1 10.8 8.4
EV/EBITDA (x) 36.6 47.6 36.2 29.8 25.3
Source: Company, Nirmal Bang Institutional Equities Research
13 December 2018
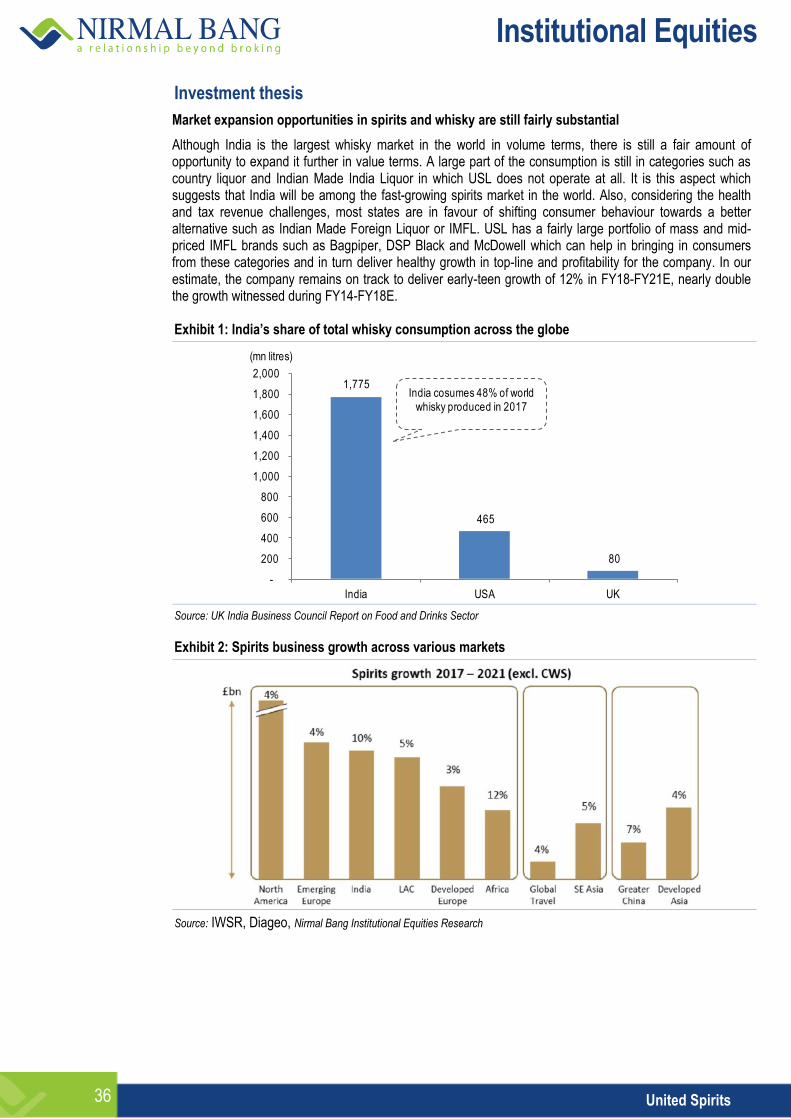
Institutional Equities
36 United Spirits
Investment thesis
Market expansion opportunities in spirits and whisky are still fairly substantial
Although India is the largest whisky market in the world in volume terms, there is still a fair amount of opportunity to expand it further in value terms. A large part of the consumption is still in categories such as country liquor and Indian Made India Liquor in which USL does not operate at all. It is this aspect which suggests that India will be among the fast-growing spirits market in the world. Also, considering the health and tax revenue challenges, most states are in favour of shifting consumer behaviour towards a better alternative such as Indian Made Foreign Liquor or IMFL. USL has a fairly large portfolio of mass and mid-priced IMFL brands such as Bagpiper, DSP Black and McDowell which can help in bringing in consumers from these categories and in turn deliver healthy growth in top-line and profitability for the company. In our estimate, the company remains on track to deliver early-teen growth of 12% in FY18-FY21E, nearly double the growth witnessed during FY14-FY18E.
Exhibit 1: India’s share of total whisky consumption across the globe
1,775
465
80
-
200
400
600
800
1,000
1,200
1,400
1,600
1,800
2,000
India USA UK
India cosumes 48% of world whisky produced in 2017
(mn litres)
Source: UK India Business Council Report on Food and Drinks Sector
Exhibit 2: Spirits business growth across various markets
Source: IWSR, Diageo, Nirmal Bang Institutional Equities Research
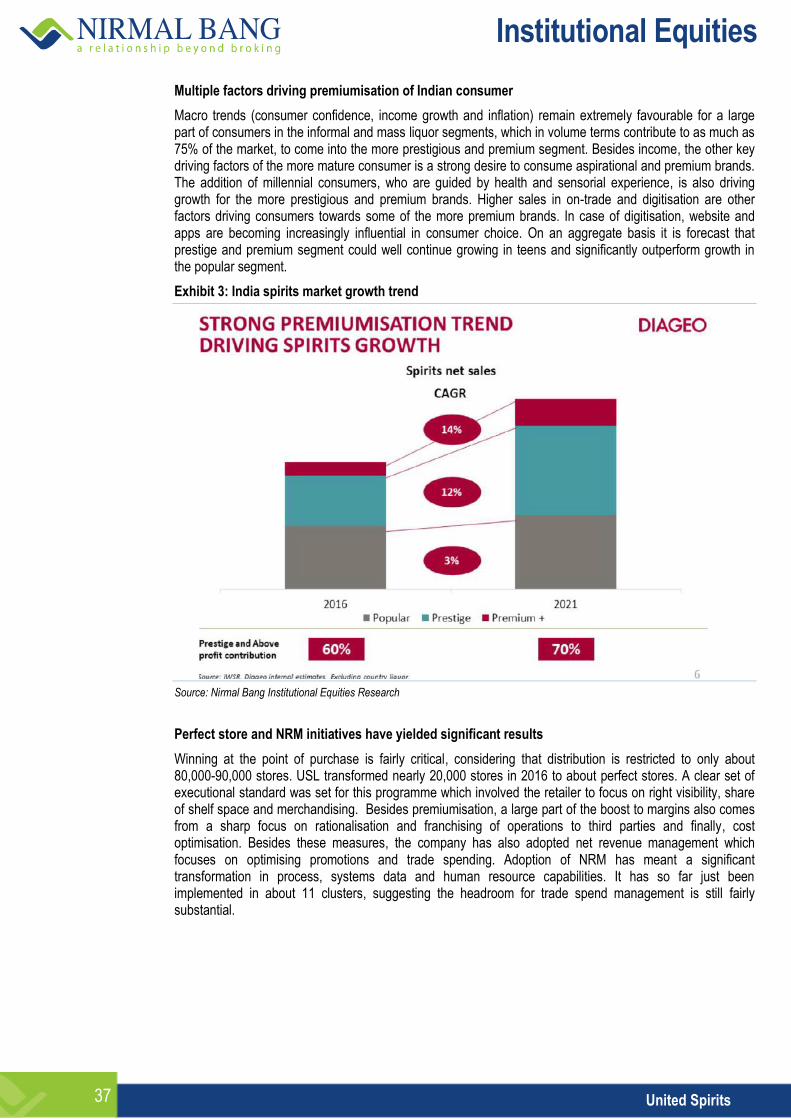
Institutional Equities
37 United Spirits
Multiple factors driving premiumisation of Indian consumer
Macro trends (consumer confidence, income growth and inflation) remain extremely favourable for a large part of consumers in the informal and mass liquor segments, which in volume terms contribute to as much as 75% of the market, to come into the more prestigious and premium segment. Besides income, the other key driving factors of the more mature consumer is a strong desire to consume aspirational and premium brands. The addition of millennial consumers, who are guided by health and sensorial experience, is also driving growth for the more prestigious and premium brands. Higher sales in on-trade and digitisation are other factors driving consumers towards some of the more premium brands. In case of digitisation, website and apps are becoming increasingly influential in consumer choice. On an aggregate basis it is forecast that prestige and premium segment could well continue growing in teens and significantly outperform growth in the popular segment.
Exhibit 3: India spirits market growth trend
Source: Nirmal Bang Institutional Equities Research
Perfect store and NRM initiatives have yielded significant results
Winning at the point of purchase is fairly critical, considering that distribution is restricted to only about 80,000-90,000 stores. USL transformed nearly 20,000 stores in 2016 to about perfect stores. A clear set of executional standard was set for this programme which involved the retailer to focus on right visibility, share of shelf space and merchandising. Besides premiumisation, a large part of the boost to margins also comes from a sharp focus on rationalisation and franchising of operations to third parties and finally, cost optimisation. Besides these measures, the company has also adopted net revenue management which focuses on optimising promotions and trade spending. Adoption of NRM has meant a significant transformation in process, systems data and human resource capabilities. It has so far just been implemented in about 11 clusters, suggesting the headroom for trade spend management is still fairly substantial.

Institutional Equities
38 United Spirits
Exhibit 4: Market share of major whisky players in 2017
45
15
11
9
7
13
USL Pernod ABD Jagatjit John Distillieries Others Source: UK India Business Council Report on Food and Drink Sector
Responsibility strategy adopted by the company is moderating regulatory headwinds
USL, taking cue from its parent, has created social aspects and public relations organisations and responsibility programmes as it seeks to build partnerships with government leaders and public health professionals. Harmful alcohol consumption, binge drinking and drunk driving are some areas where USL has extensively collaborated with government and public health professionals. This collaboration has certainly created significant positive equity for the company as well as the industry and has helped in reducing the rhetoric around prohibition. Globally, Diageo has adopted the United Nations and World Health Organisation or WHO goal of reducing harmful drinking by 10%. Although the risk of prohibition cannot be ruled out, importantly now that Congress is the winning party in Chhattisgarh where this aspect was a part of its election manifesto, but taking a more larger picture most state governments are in favour of moderation and responsible liquor consumption
Diageo’s capabilities are unmatched in the liquor space
Among the top 100 brands in the liquor space, nearly a fifth are Diageo brands, making it by far the biggest owner of brands selling more than 3mn cases a year. Globally, the business is built around six brands, namely Johnnie Walker, Smirnoff, Baileys, Captain Morgan, Tanqueray and Guinness. Although nearly two-thirds of its sales come from premium and luxury brands, it has a very good presence in the mid-market and value brands which shape future drinking habits. The company is among the world’s leading advertiser and has often received many accolades for its campaigns. Social media is accelerating awareness and understanding of various global brands and this certainly helps brands like that of Diageo significantly. Scotch whisky, which contributes nearly 25% to its top-line, was underperforming earlier, but has witnessed a significant turnaround since 2015, helping to uplift the overall growth rate from being virtually flat to around 5% in 2018.
Exhibit 5: Diageo financial trend
Source: Diageo, Nirmal Bang Institutional Equities Research
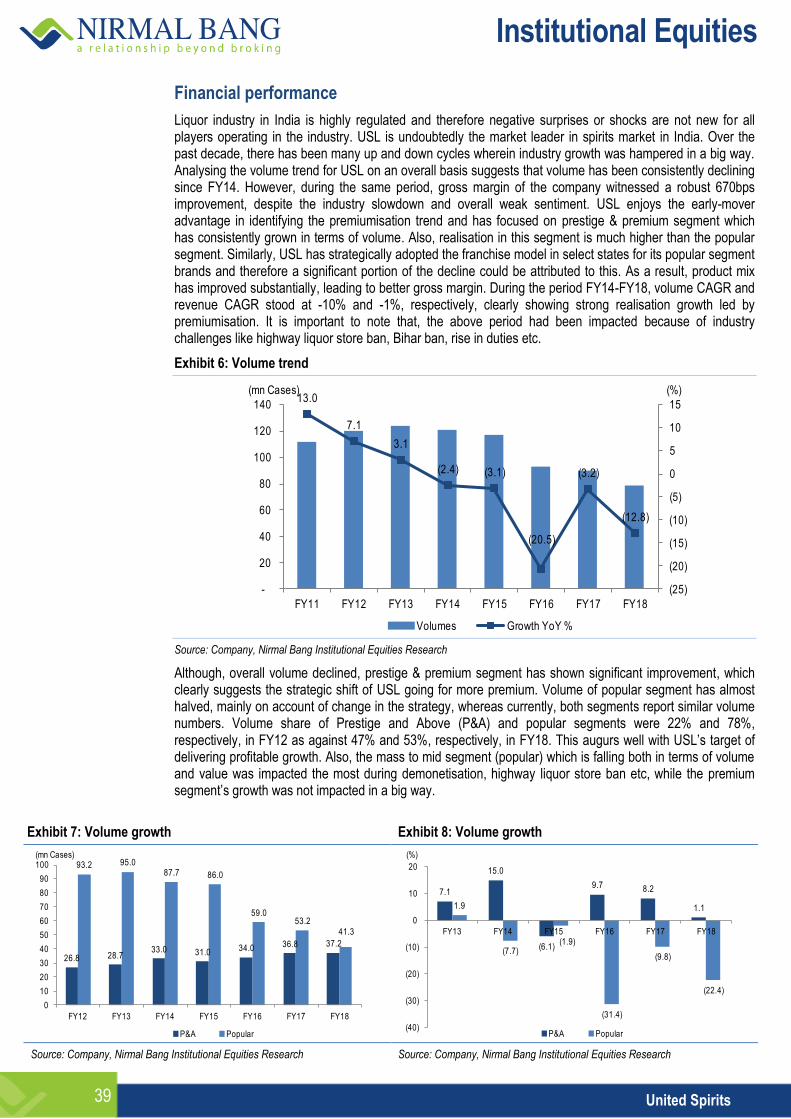
Institutional Equities
39 United Spirits
Financial performance
Liquor industry in India is highly regulated and therefore negative surprises or shocks are not new for all players operating in the industry. USL is undoubtedly the market leader in spirits market in India. Over the past decade, there has been many up and down cycles wherein industry growth was hampered in a big way. Analysing the volume trend for USL on an overall basis suggests that volume has been consistently declining since FY14. However, during the same period, gross margin of the company witnessed a robust 670bps improvement, despite the industry slowdown and overall weak sentiment. USL enjoys the early-mover advantage in identifying the premiumisation trend and has focused on prestige & premium segment which has consistently grown in terms of volume. Also, realisation in this segment is much higher than the popular segment. Similarly, USL has strategically adopted the franchise model in select states for its popular segment brands and therefore a significant portion of the decline could be attributed to this. As a result, product mix has improved substantially, leading to better gross margin. During the period FY14-FY18, volume CAGR and revenue CAGR stood at -10% and -1%, respectively, clearly showing strong realisation growth led by premiumisation. It is important to note that, the above period had been impacted because of industry challenges like highway liquor store ban, Bihar ban, rise in duties etc.
Exhibit 6: Volume trend
13.0
7.1
3.1
(2.4) (3.1)
(20.5)
(3.2)
(12.8)
(25)
(20)
(15)
(10)
(5)
0
5
10
15
-
20
40
60
80
100
120
140
FY11 FY12 FY13 FY14 FY15 FY16 FY17 FY18
Volumes Growth YoY %
(mn Cases) (%)
Source: Company, Nirmal Bang Institutional Equities Research
Although, overall volume declined, prestige & premium segment has shown significant improvement, which clearly suggests the strategic shift of USL going for more premium. Volume of popular segment has almost halved, mainly on account of change in the strategy, whereas currently, both segments report similar volume numbers. Volume share of Prestige and Above (P&A) and popular segments were 22% and 78%, respectively, in FY12 as against 47% and 53%, respectively, in FY18. This augurs well with USL’s target of delivering profitable growth. Also, the mass to mid segment (popular) which is falling both in terms of volume and value was impacted the most during demonetisation, highway liquor store ban etc, while the premium segment’s growth was not impacted in a big way.
Exhibit 7: Volume growth Exhibit 8: Volume growth
26.8 28.733.0 31.0 34.0 36.8 37.2
93.2 95.087.7 86.0
59.053.2
41.3
0
10
20
30
40
50
60
70
80
90
100
FY12 FY13 FY14 FY15 FY16 FY17 FY18
P&A Popular
(mn Cases)
7.1
15.0
(6.1)
9.7 8.2
1.1 1.9
(7.7)(1.9)
(31.4)
(9.8)
(22.4)
(40)
(30)
(20)
(10)
0
10
20
FY13 FY14 FY15 FY16 FY17 FY18
P&A Popular
(%)
Source: Company, Nirmal Bang Institutional Equities Research Source: Company, Nirmal Bang Institutional Equities Research
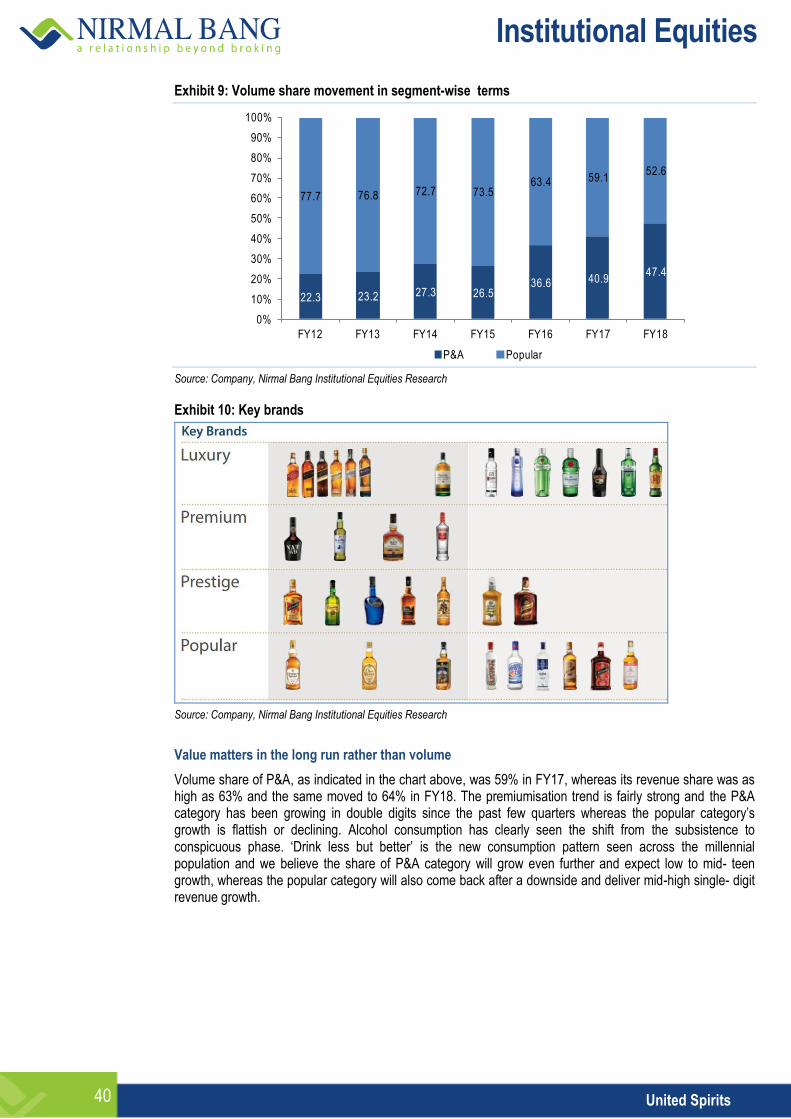
Institutional Equities
40 United Spirits
Exhibit 9: Volume share movement in segment-wise terms
22.3 23.2 27.3 26.536.6 40.9
47.4
77.7 76.8 72.7 73.563.4 59.1
52.6
0%
10%
20%
30%
40%
50%
60%
70%
80%
90%
100%
FY12 FY13 FY14 FY15 FY16 FY17 FY18
P&A Popular
Source: Company, Nirmal Bang Institutional Equities Research
Exhibit 10: Key brands
Source: Company, Nirmal Bang Institutional Equities Research
Value matters in the long run rather than volume
Volume share of P&A, as indicated in the chart above, was 59% in FY17, whereas its revenue share was as high as 63% and the same moved to 64% in FY18. The premiumisation trend is fairly strong and the P&A category has been growing in double digits since the past few quarters whereas the popular category’s growth is flattish or declining. Alcohol consumption has clearly seen the shift from the subsistence to conspicuous phase. ‘Drink less but better’ is the new consumption pattern seen across the millennial population and we believe the share of P&A category will grow even further and expect low to mid- teen growth, whereas the popular category will also come back after a downside and deliver mid-high single- digit revenue growth.
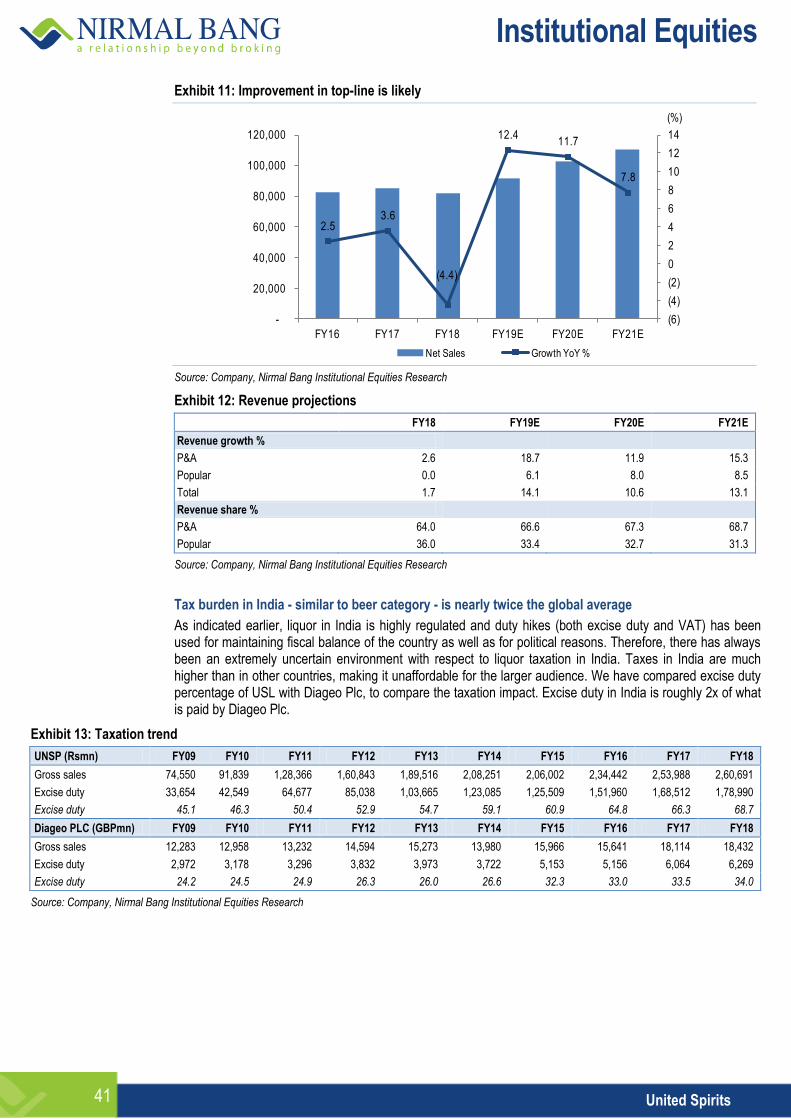
Institutional Equities
41 United Spirits
Exhibit 11: Improvement in top-line is likely
2.5 3.6
(4.4)
12.4 11.7
7.8
(6)
(4)
(2)
0
2
4
6
8
10
12
14
-
20,000
40,000
60,000
80,000
100,000
120,000
FY16 FY17 FY18 FY19E FY20E FY21E
Net Sales Growth YoY %
(%)
Source: Company, Nirmal Bang Institutional Equities Research
Exhibit 12: Revenue projections
FY18 FY19E FY20E FY21E
Revenue growth %
P&A 2.6 18.7 11.9 15.3
Popular 0.0 6.1 8.0 8.5
Total 1.7 14.1 10.6 13.1
Revenue share %
P&A 64.0 66.6 67.3 68.7
Popular 36.0 33.4 32.7 31.3
Source: Company, Nirmal Bang Institutional Equities Research
Tax burden in India - similar to beer category - is nearly twice the global average
As indicated earlier, liquor in India is highly regulated and duty hikes (both excise duty and VAT) has been used for maintaining fiscal balance of the country as well as for political reasons. Therefore, there has always been an extremely uncertain environment with respect to liquor taxation in India. Taxes in India are much higher than in other countries, making it unaffordable for the larger audience. We have compared excise duty percentage of USL with Diageo Plc, to compare the taxation impact. Excise duty in India is roughly 2x of what is paid by Diageo Plc.
Exhibit 13: Taxation trend
UNSP (Rsmn) FY09 FY10 FY11 FY12 FY13 FY14 FY15 FY16 FY17 FY18
Gross sales 74,550 91,839 1,28,366 1,60,843 1,89,516 2,08,251 2,06,002 2,34,442 2,53,988 2,60,691
Excise duty 33,654 42,549 64,677 85,038 1,03,665 1,23,085 1,25,509 1,51,960 1,68,512 1,78,990
Excise duty 45.1 46.3 50.4 52.9 54.7 59.1 60.9 64.8 66.3 68.7
Diageo PLC (GBPmn) FY09 FY10 FY11 FY12 FY13 FY14 FY15 FY16 FY17 FY18
Gross sales 12,283 12,958 13,232 14,594 15,273 13,980 15,966 15,641 18,114 18,432
Excise duty 2,972 3,178 3,296 3,832 3,973 3,722 5,153 5,156 6,064 6,269
Excise duty 24.2 24.5 24.9 26.3 26.0 26.6 32.3 33.0 33.5 34.0
Source: Company, Nirmal Bang Institutional Equities Research
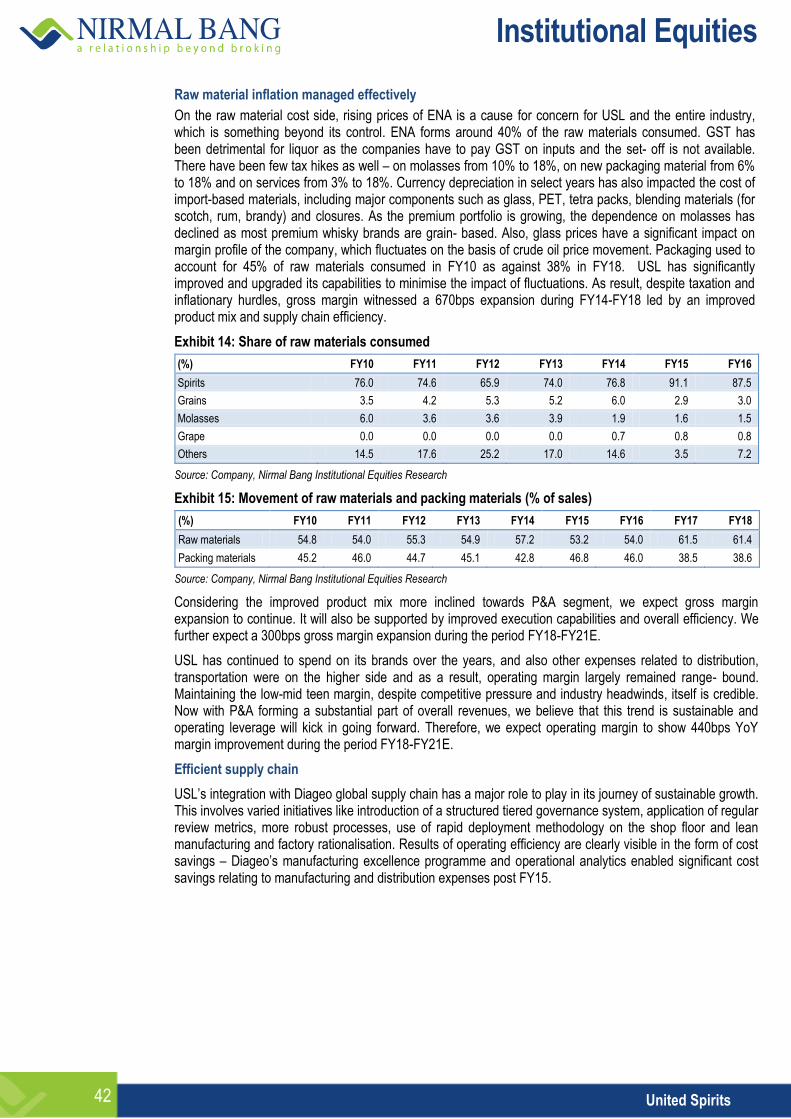
Institutional Equities
42 United Spirits
Raw material inflation managed effectively
On the raw material cost side, rising prices of ENA is a cause for concern for USL and the entire industry, which is something beyond its control. ENA forms around 40% of the raw materials consumed. GST has been detrimental for liquor as the companies have to pay GST on inputs and the set- off is not available. There have been few tax hikes as well – on molasses from 10% to 18%, on new packaging material from 6% to 18% and on services from 3% to 18%. Currency depreciation in select years has also impacted the cost of import-based materials, including major components such as glass, PET, tetra packs, blending materials (for scotch, rum, brandy) and closures. As the premium portfolio is growing, the dependence on molasses has declined as most premium whisky brands are grain- based. Also, glass prices have a significant impact on margin profile of the company, which fluctuates on the basis of crude oil price movement. Packaging used to account for 45% of raw materials consumed in FY10 as against 38% in FY18. USL has significantly improved and upgraded its capabilities to minimise the impact of fluctuations. As result, despite taxation and inflationary hurdles, gross margin witnessed a 670bps expansion during FY14-FY18 led by an improved product mix and supply chain efficiency.
Exhibit 14: Share of raw materials consumed
(%) FY10 FY11 FY12 FY13 FY14 FY15 FY16
Spirits 76.0 74.6 65.9 74.0 76.8 91.1 87.5
Grains 3.5 4.2 5.3 5.2 6.0 2.9 3.0
Molasses 6.0 3.6 3.6 3.9 1.9 1.6 1.5
Grape 0.0 0.0 0.0 0.0 0.7 0.8 0.8
Others 14.5 17.6 25.2 17.0 14.6 3.5 7.2
Source: Company, Nirmal Bang Institutional Equities Research
Exhibit 15: Movement of raw materials and packing materials (% of sales)
(%) FY10 FY11 FY12 FY13 FY14 FY15 FY16 FY17 FY18
Raw materials 54.8 54.0 55.3 54.9 57.2 53.2 54.0 61.5 61.4
Packing materials 45.2 46.0 44.7 45.1 42.8 46.8 46.0 38.5 38.6
Source: Company, Nirmal Bang Institutional Equities Research
Considering the improved product mix more inclined towards P&A segment, we expect gross margin expansion to continue. It will also be supported by improved execution capabilities and overall efficiency. We further expect a 300bps gross margin expansion during the period FY18-FY21E.
USL has continued to spend on its brands over the years, and also other expenses related to distribution, transportation were on the higher side and as a result, operating margin largely remained range- bound. Maintaining the low-mid teen margin, despite competitive pressure and industry headwinds, itself is credible. Now with P&A forming a substantial part of overall revenues, we believe that this trend is sustainable and operating leverage will kick in going forward. Therefore, we expect operating margin to show 440bps YoY margin improvement during the period FY18-FY21E.
Efficient supply chain
USL’s integration with Diageo global supply chain has a major role to play in its journey of sustainable growth. This involves varied initiatives like introduction of a structured tiered governance system, application of regular review metrics, more robust processes, use of rapid deployment methodology on the shop floor and lean manufacturing and factory rationalisation. Results of operating efficiency are clearly visible in the form of cost savings – Diageo’s manufacturing excellence programme and operational analytics enabled significant cost savings relating to manufacturing and distribution expenses post FY15.
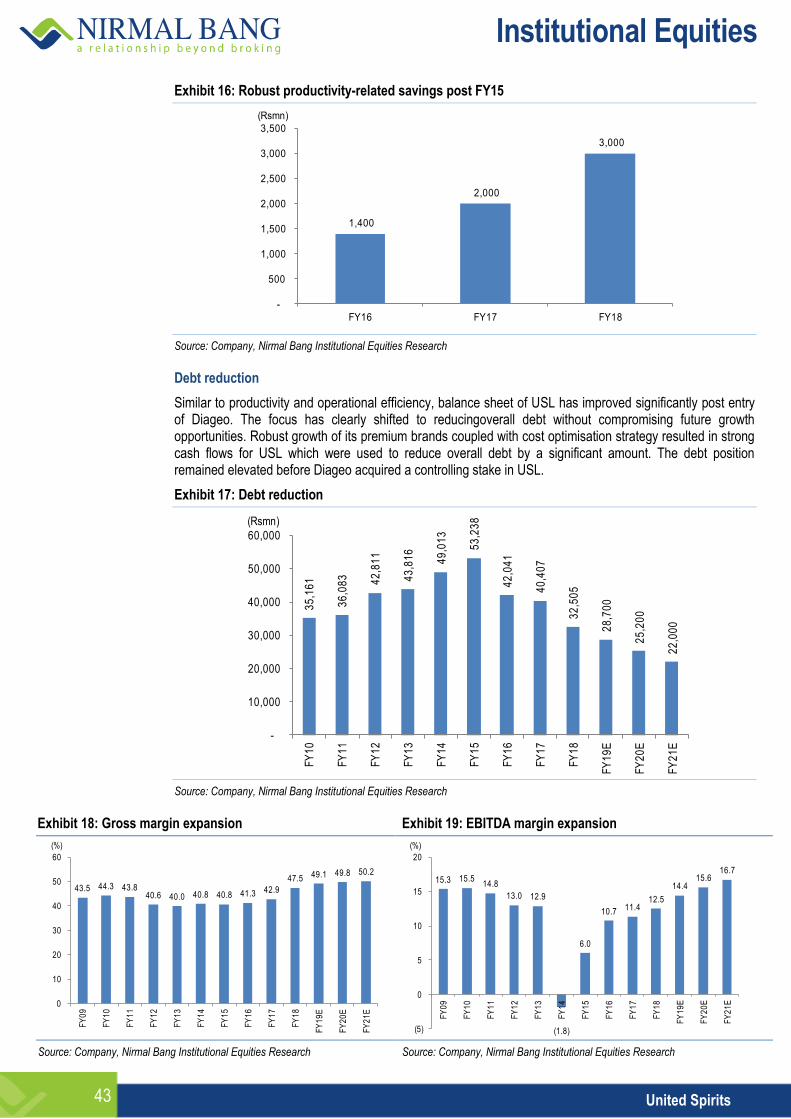
Institutional Equities
43 United Spirits
Exhibit 16: Robust productivity-related savings post FY15
1,400
2,000
3,000
-
500
1,000
1,500
2,000
2,500
3,000
3,500
FY16 FY17 FY18
(Rsmn)
Source: Company, Nirmal Bang Institutional Equities Research Debt reduction
Similar to productivity and operational efficiency, balance sheet of USL has improved significantly post entry of Diageo. The focus has clearly shifted to reducingoverall debt without compromising future growth opportunities. Robust growth of its premium brands coupled with cost optimisation strategy resulted in strong cash flows for USL which were used to reduce overall debt by a significant amount. The debt position remained elevated before Diageo acquired a controlling stake in USL.
Exhibit 17: Debt reduction
35
,16
1
36
,08
3
42
,81
1
43
,81
6
49
,01
3
53
,23
8
42
,04
1
40
,40
7
32
,50
5
28
,70
0
25
,20
0
22
,00
0
-
10,000
20,000
30,000
40,000
50,000
60,000
FY
10
FY
11
FY
12
FY
13
FY
14
FY
15
FY
16
FY
17
FY
18
FY
19
E
FY
20
E
FY
21
E
(Rsmn)
Source: Company, Nirmal Bang Institutional Equities Research
Exhibit 18: Gross margin expansion Exhibit 19: EBITDA margin expansion
43.5 44.3 43.840.6 40.0 40.8 40.8 41.3 42.9
47.5 49.1 49.8 50.2
0
10
20
30
40
50
60
FY
09
FY
10
FY
11
FY
12
FY
13
FY
14
FY
15
FY
16
FY
17
FY
18
FY
19
E
FY
20
E
FY
21
E
(%)
15.3 15.5 14.8
13.0 12.9
(1.8)
6.0
10.7 11.4 12.5
14.4 15.6
16.7
(5)
0
5
10
15
20
FY
09
FY
10
FY
11
FY
12
FY
13
FY
14
FY
15
FY
16
FY
17
FY
18
FY
19
E
FY
20
E
FY
21
E
(%)
Source: Company, Nirmal Bang Institutional Equities Research Source: Company, Nirmal Bang Institutional Equities Research

Institutional Equities
44 United Spirits
Exhibit 20: Improvement in top-line likely Exhibit 21: Operating profit to continue its growth momentum
2.5 3.6
(4.4)
12.4 11.7
7.8
(6)
(4)
(2)
0
2
4
6
8
10
12
14
-
20,000
40,000
60,000
80,000
100,000
120,000
FY16 FY17 FY18 FY19E FY20E FY21E
Net Sales Growth YoY %
(%)(Rsmn)
82.3
9.55.2
29.8
20.815.4
0
10
20
30
40
50
60
70
80
90
-
2,000
4,000
6,000
8,000
10,000
12,000
14,000
16,000
18,000
20,000
FY16 FY17 FY18 FY19E FY20E FY21E
EBITDA Growth YoY %
(Rsmn) (%)
Source: Company, Nirmal Bang Institutional Equities Research Source: Company, Nirmal Bang Institutional Equities Research
Exhibit 22: Net profit vs. growth Exhibit 23: Margin trending upwards
158.6
38.9
100.7
30.838.4
19.2
0
20
40
60
80
100
120
140
160
180
-
2,000
4,000
6,000
8,000
10,000
12,000
14,000
FY16 FY17 FY18 FY19E FY20E FY21E
Adj PAT Growth YoY %
(Rsmn) (%)
41.3 42.9
47.5 49.1 49.8 50.2
10.7 11.4 12.514.4 15.6 16.7
0
10
20
30
40
50
60
FY16 FY17 FY18 FY19E FY20E FY21E
Gross margin EBITDA margin
(%)
Source: Company, Nirmal Bang Institutional Equities Research Source: Company, Nirmal Bang Institutional Equities Research
Exhibit 24: Return ratios
11.914.1
15.1
20.0
22.5 23.4
11.0
15.2
25.2 25.527.0
24.9
0
5
10
15
20
25
30
FY16 FY17 FY18 FY19E FY20E FY21E
RoCE RoE
(%)
Source: Company, Nirmal Bang Institutional Equities Research
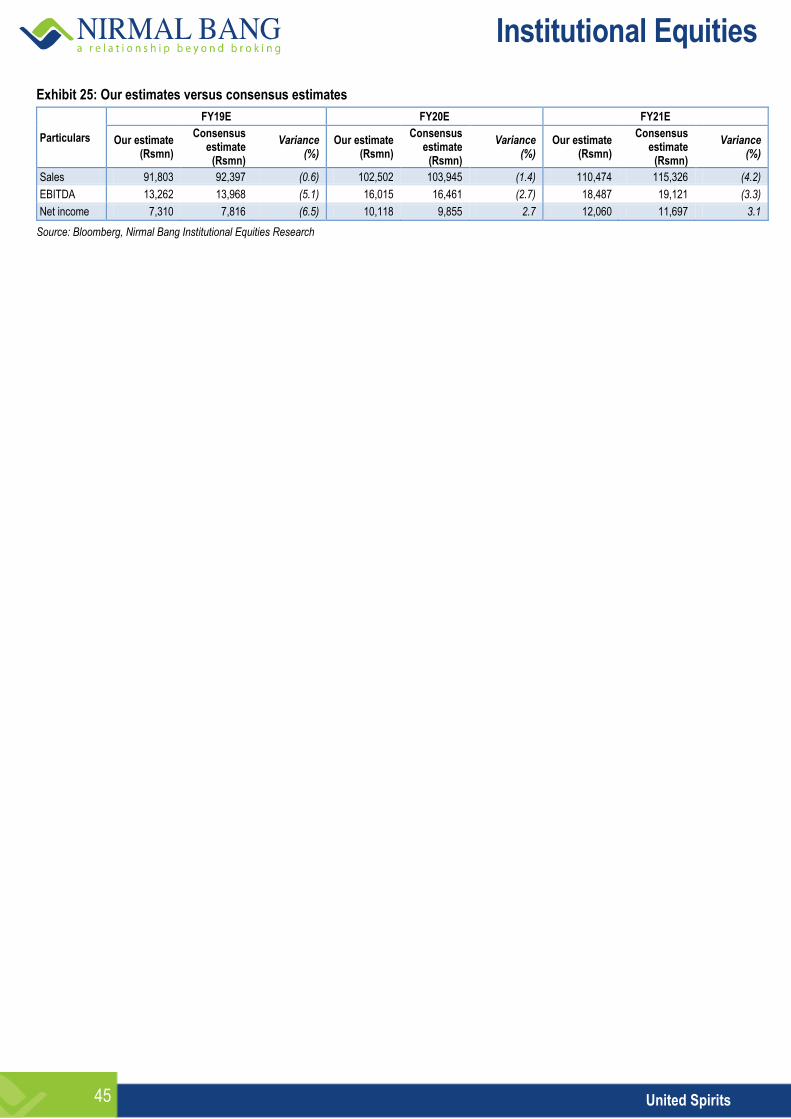
Institutional Equities
45 United Spirits
Exhibit 25: Our estimates versus consensus estimates
Particulars
FY19E FY20E FY21E
Our estimate (Rsmn)
Consensus estimate
(Rsmn)
Variance (%)
Our estimate (Rsmn)
Consensus estimate
(Rsmn)
Variance (%)
Our estimate (Rsmn)
Consensus estimate
(Rsmn)
Variance (%)
Sales 91,803 92,397 (0.6) 102,502 103,945 (1.4) 110,474 115,326 (4.2)
EBITDA 13,262 13,968 (5.1) 16,015 16,461 (2.7) 18,487 19,121 (3.3)
Net income 7,310 7,816 (6.5) 10,118 9,855 2.7 12,060 11,697 3.1
Source: Bloomberg, Nirmal Bang Institutional Equities Research
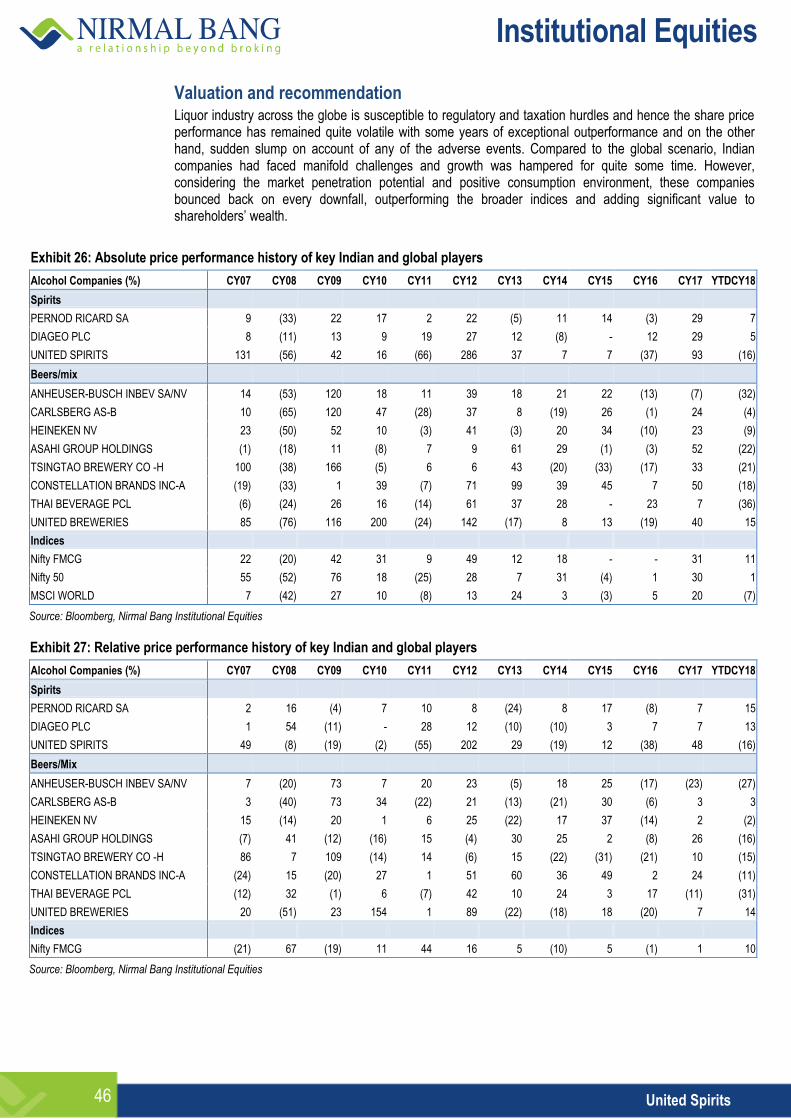
Institutional Equities
46 United Spirits
Valuation and recommendation Liquor industry across the globe is susceptible to regulatory and taxation hurdles and hence the share price performance has remained quite volatile with some years of exceptional outperformance and on the other hand, sudden slump on account of any of the adverse events. Compared to the global scenario, Indian companies had faced manifold challenges and growth was hampered for quite some time. However, considering the market penetration potential and positive consumption environment, these companies bounced back on every downfall, outperforming the broader indices and adding significant value to shareholders’ wealth.
Exhibit 26: Absolute price performance history of key Indian and global players
Alcohol Companies (%) CY07 CY08 CY09 CY10 CY11 CY12 CY13 CY14 CY15 CY16 CY17 YTDCY18
Spirits
PERNOD RICARD SA 9 (33) 22 17 2 22 (5) 11 14 (3) 29 7
DIAGEO PLC 8 (11) 13 9 19 27 12 (8) - 12 29 5
UNITED SPIRITS 131 (56) 42 16 (66) 286 37 7 7 (37) 93 (16)
Beers/mix
ANHEUSER-BUSCH INBEV SA/NV 14 (53) 120 18 11 39 18 21 22 (13) (7) (32)
CARLSBERG AS-B 10 (65) 120 47 (28) 37 8 (19) 26 (1) 24 (4)
HEINEKEN NV 23 (50) 52 10 (3) 41 (3) 20 34 (10) 23 (9)
ASAHI GROUP HOLDINGS (1) (18) 11 (8) 7 9 61 29 (1) (3) 52 (22)
TSINGTAO BREWERY CO -H 100 (38) 166 (5) 6 6 43 (20) (33) (17) 33 (21)
CONSTELLATION BRANDS INC-A (19) (33) 1 39 (7) 71 99 39 45 7 50 (18)
THAI BEVERAGE PCL (6) (24) 26 16 (14) 61 37 28 - 23 7 (36)
UNITED BREWERIES 85 (76) 116 200 (24) 142 (17) 8 13 (19) 40 15
Indices
Nifty FMCG 22 (20) 42 31 9 49 12 18 - - 31 11
Nifty 50 55 (52) 76 18 (25) 28 7 31 (4) 1 30 1
MSCI WORLD 7 (42) 27 10 (8) 13 24 3 (3) 5 20 (7)
Source: Bloomberg, Nirmal Bang Institutional Equities
Exhibit 27: Relative price performance history of key Indian and global players
Alcohol Companies (%) CY07 CY08 CY09 CY10 CY11 CY12 CY13 CY14 CY15 CY16 CY17 YTDCY18
Spirits
PERNOD RICARD SA 2 16 (4) 7 10 8 (24) 8 17 (8) 7 15
DIAGEO PLC 1 54 (11) - 28 12 (10) (10) 3 7 7 13
UNITED SPIRITS 49 (8) (19) (2) (55) 202 29 (19) 12 (38) 48 (16)
Beers/Mix
ANHEUSER-BUSCH INBEV SA/NV 7 (20) 73 7 20 23 (5) 18 25 (17) (23) (27)
CARLSBERG AS-B 3 (40) 73 34 (22) 21 (13) (21) 30 (6) 3 3
HEINEKEN NV 15 (14) 20 1 6 25 (22) 17 37 (14) 2 (2)
ASAHI GROUP HOLDINGS (7) 41 (12) (16) 15 (4) 30 25 2 (8) 26 (16)
TSINGTAO BREWERY CO -H 86 7 109 (14) 14 (6) 15 (22) (31) (21) 10 (15)
CONSTELLATION BRANDS INC-A (24) 15 (20) 27 1 51 60 36 49 2 24 (11)
THAI BEVERAGE PCL (12) 32 (1) 6 (7) 42 10 24 3 17 (11) (31)
UNITED BREWERIES 20 (51) 23 154 1 89 (22) (18) 18 (20) 7 14
Indices
Nifty FMCG (21) 67 (19) 11 44 16 5 (10) 5 (1) 1 10
Source: Bloomberg, Nirmal Bang Institutional Equities
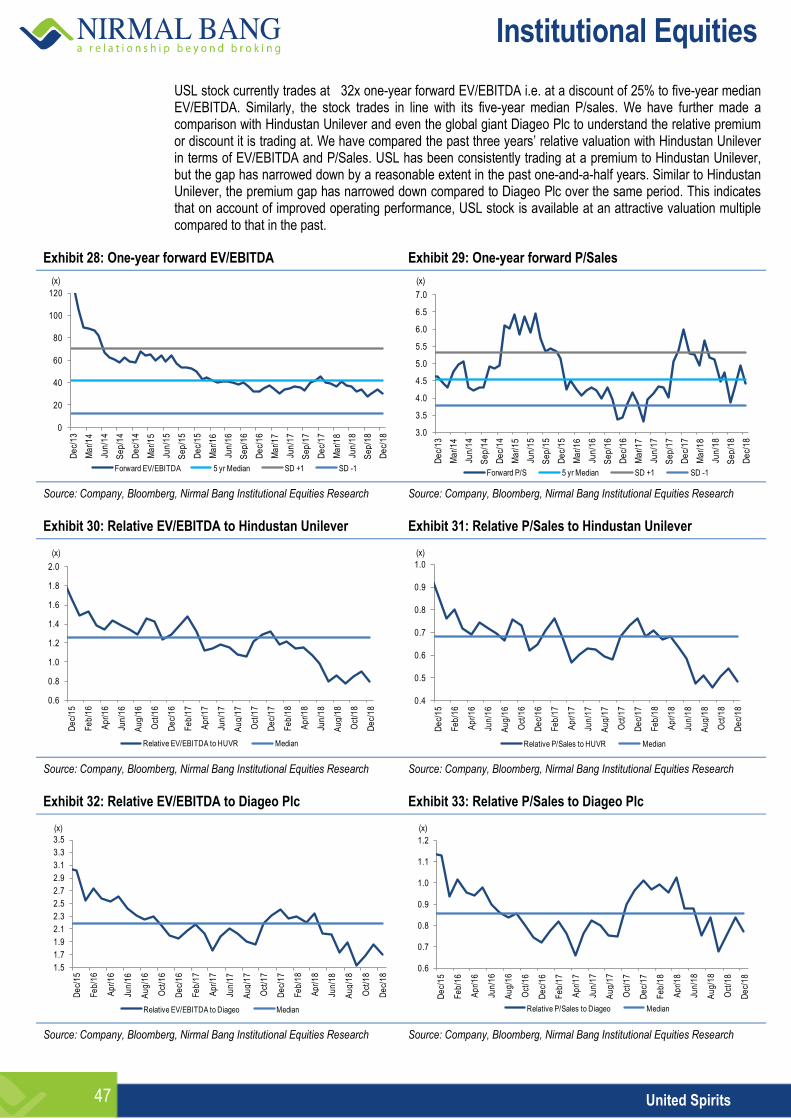
Institutional Equities
47 United Spirits
USL stock currently trades at 32x one-year forward EV/EBITDA i.e. at a discount of 25% to five-year median EV/EBITDA. Similarly, the stock trades in line with its five-year median P/sales. We have further made a comparison with Hindustan Unilever and even the global giant Diageo Plc to understand the relative premium or discount it is trading at. We have compared the past three years’ relative valuation with Hindustan Unilever in terms of EV/EBITDA and P/Sales. USL has been consistently trading at a premium to Hindustan Unilever, but the gap has narrowed down by a reasonable extent in the past one-and-a-half years. Similar to Hindustan Unilever, the premium gap has narrowed down compared to Diageo Plc over the same period. This indicates that on account of improved operating performance, USL stock is available at an attractive valuation multiple compared to that in the past.
Exhibit 28: One-year forward EV/EBITDA Exhibit 29: One-year forward P/Sales
0
20
40
60
80
100
120
De
c/1
3
Ma
r/1
4
Jun
/14
Se
p/1
4
De
c/1
4
Ma
r/1
5
Jun
/15
Se
p/1
5
De
c/1
5
Ma
r/1
6
Jun
/16
Se
p/1
6
De
c/1
6
Ma
r/1
7
Jun
/17
Se
p/1
7
De
c/1
7
Ma
r/1
8
Jun
/18
Se
p/1
8
De
c/1
8
Forward EV/EBITDA 5 yr Median SD +1 SD -1
(x)
3.0
3.5
4.0
4.5
5.0
5.5
6.0
6.5
7.0
De
c/1
3
Ma
r/1
4
Jun
/14
Se
p/1
4
De
c/1
4
Ma
r/1
5
Jun
/15
Se
p/1
5
De
c/1
5
Ma
r/1
6
Jun
/16
Se
p/1
6
De
c/1
6
Ma
r/1
7
Jun
/17
Se
p/1
7
De
c/1
7
Ma
r/1
8
Jun
/18
Se
p/1
8
De
c/1
8
Forward P/S 5 yr Median SD +1 SD -1
(x)
Source: Company, Bloomberg, Nirmal Bang Institutional Equities Research Source: Company, Bloomberg, Nirmal Bang Institutional Equities Research
Exhibit 30: Relative EV/EBITDA to Hindustan Unilever Exhibit 31: Relative P/Sales to Hindustan Unilever
0.6
0.8
1.0
1.2
1.4
1.6
1.8
2.0
De
c/1
5
Fe
b/1
6
Ap
r/1
6
Jun
/16
Au
g/1
6
Oct
/16
De
c/1
6
Fe
b/1
7
Ap
r/1
7
Jun
/17
Au
g/1
7
Oct
/17
De
c/1
7
Fe
b/1
8
Ap
r/1
8
Jun
/18
Au
g/1
8
Oct
/18
De
c/1
8
Relative EV/EBITDA to HUVR Median
(x)
0.4
0.5
0.6
0.7
0.8
0.9
1.0
De
c/1
5
Fe
b/1
6
Ap
r/1
6
Jun
/16
Au
g/1
6
Oct
/16
De
c/1
6
Fe
b/1
7
Ap
r/1
7
Jun
/17
Au
g/1
7
Oct
/17
De
c/1
7
Fe
b/1
8
Ap
r/1
8
Jun
/18
Au
g/1
8
Oct
/18
De
c/1
8Relative P/Sales to HUVR Median
(x)
Source: Company, Bloomberg, Nirmal Bang Institutional Equities Research Source: Company, Bloomberg, Nirmal Bang Institutional Equities Research
Exhibit 32: Relative EV/EBITDA to Diageo Plc Exhibit 33: Relative P/Sales to Diageo Plc
1.5
1.7
1.9
2.1
2.3
2.5
2.7
2.9
3.1
3.3
3.5
De
c/1
5
Fe
b/1
6
Ap
r/1
6
Jun
/16
Au
g/1
6
Oct
/16
De
c/1
6
Fe
b/1
7
Ap
r/1
7
Jun
/17
Au
g/1
7
Oct
/17
De
c/1
7
Fe
b/1
8
Ap
r/1
8
Jun
/18
Au
g/1
8
Oct
/18
De
c/1
8
Relative EV/EBITDA to Diageo Median
(x)
0.6
0.7
0.8
0.9
1.0
1.1
1.2
De
c/1
5
Fe
b/1
6
Ap
r/1
6
Jun
/16
Au
g/1
6
Oct
/16
De
c/1
6
Fe
b/1
7
Ap
r/1
7
Jun
/17
Au
g/1
7
Oct
/17
De
c/1
7
Fe
b/1
8
Ap
r/1
8
Jun
/18
Au
g/1
8
Oct
/18
De
c/1
8
Relative P/Sales to Diageo Median
(x)
Source: Company, Bloomberg, Nirmal Bang Institutional Equities Research Source: Company, Bloomberg, Nirmal Bang Institutional Equities Research
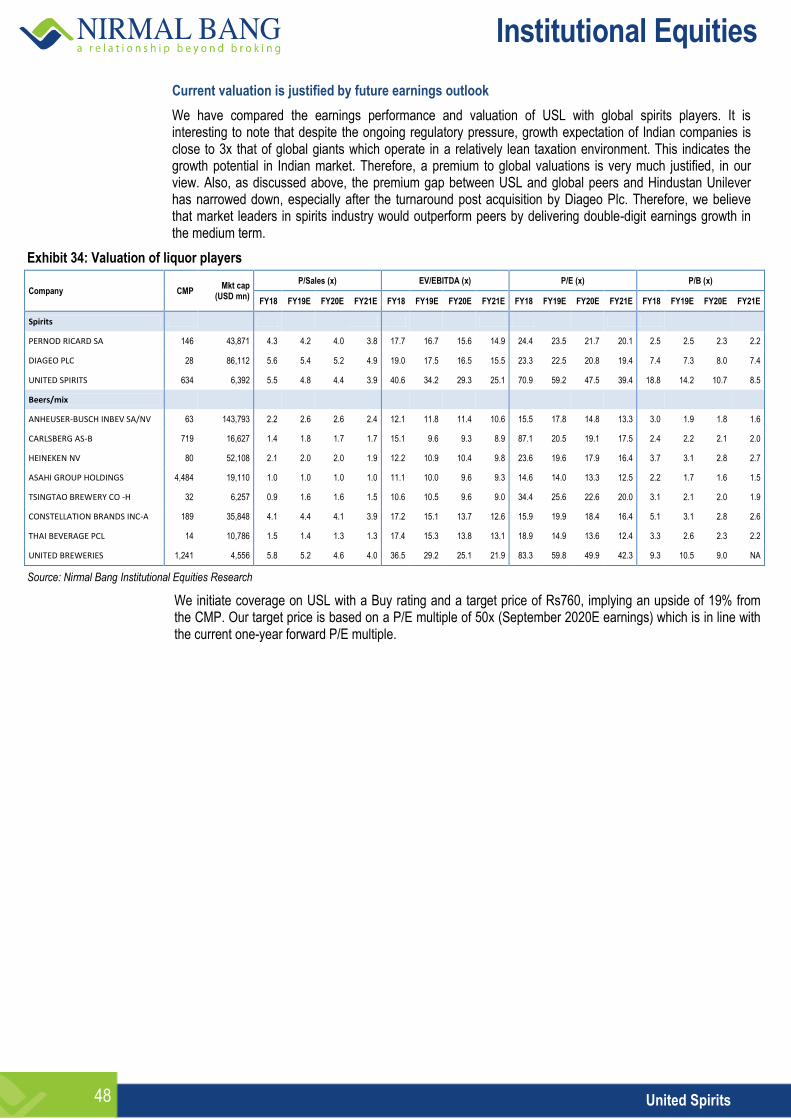
Institutional Equities
48 United Spirits
Current valuation is justified by future earnings outlook
We have compared the earnings performance and valuation of USL with global spirits players. It is interesting to note that despite the ongoing regulatory pressure, growth expectation of Indian companies is close to 3x that of global giants which operate in a relatively lean taxation environment. This indicates the growth potential in Indian market. Therefore, a premium to global valuations is very much justified, in our view. Also, as discussed above, the premium gap between USL and global peers and Hindustan Unilever has narrowed down, especially after the turnaround post acquisition by Diageo Plc. Therefore, we believe that market leaders in spirits industry would outperform peers by delivering double-digit earnings growth in the medium term.
Exhibit 34: Valuation of liquor players
Company CMP Mkt cap
(USD mn)
P/Sales (x) EV/EBITDA (x) P/E (x) P/B (x)
FY18 FY19E FY20E FY21E FY18 FY19E FY20E FY21E FY18 FY19E FY20E FY21E FY18 FY19E FY20E FY21E
Spirits
PERNOD RICARD SA 146 43,871 4.3 4.2 4.0 3.8 17.7 16.7 15.6 14.9 24.4 23.5 21.7 20.1 2.5 2.5 2.3 2.2
DIAGEO PLC 28 86,112 5.6 5.4 5.2 4.9 19.0 17.5 16.5 15.5 23.3 22.5 20.8 19.4 7.4 7.3 8.0 7.4
UNITED SPIRITS 634 6,392 5.5 4.8 4.4 3.9 40.6 34.2 29.3 25.1 70.9 59.2 47.5 39.4 18.8 14.2 10.7 8.5
Beers/mix
ANHEUSER-BUSCH INBEV SA/NV 63 143,793 2.2 2.6 2.6 2.4 12.1 11.8 11.4 10.6 15.5 17.8 14.8 13.3 3.0 1.9 1.8 1.6
CARLSBERG AS-B 719 16,627 1.4 1.8 1.7 1.7 15.1 9.6 9.3 8.9 87.1 20.5 19.1 17.5 2.4 2.2 2.1 2.0
HEINEKEN NV 80 52,108 2.1 2.0 2.0 1.9 12.2 10.9 10.4 9.8 23.6 19.6 17.9 16.4 3.7 3.1 2.8 2.7
ASAHI GROUP HOLDINGS 4,484 19,110 1.0 1.0 1.0 1.0 11.1 10.0 9.6 9.3 14.6 14.0 13.3 12.5 2.2 1.7 1.6 1.5
TSINGTAO BREWERY CO -H 32 6,257 0.9 1.6 1.6 1.5 10.6 10.5 9.6 9.0 34.4 25.6 22.6 20.0 3.1 2.1 2.0 1.9
CONSTELLATION BRANDS INC-A 189 35,848 4.1 4.4 4.1 3.9 17.2 15.1 13.7 12.6 15.9 19.9 18.4 16.4 5.1 3.1 2.8 2.6
THAI BEVERAGE PCL 14 10,786 1.5 1.4 1.3 1.3 17.4 15.3 13.8 13.1 18.9 14.9 13.6 12.4 3.3 2.6 2.3 2.2
UNITED BREWERIES 1,241 4,556 5.8 5.2 4.6 4.0 36.5 29.2 25.1 21.9 83.3 59.8 49.9 42.3 9.3 10.5 9.0 NA
Source: Nirmal Bang Institutional Equities Research
We initiate coverage on USL with a Buy rating and a target price of Rs760, implying an upside of 19% from the CMP. Our target price is based on a P/E multiple of 50x (September 2020E earnings) which is in line with the current one-year forward P/E multiple.
Institutional Equities
49 United Spirits
Risks
We are assuming that the liquor industry is at inflection point as the worst in terms of regulations and taxation is over and the rising millennial population would largely drive growth for premium categories, but any event or announcement hurting the consumer sentiment could be detrimental to our earnings estimates. Congress party’s plan of imposing prohibition in Chhattisgarh, in our opinion, should largely be seen as state-specific issue. On a more aggregate basis, we believe most state governments favour moderation and responsible consumption of liquor.
We expect inflation to remain at a moderate level in the next couple of years and any sharp increase thereafter could hurt discretionary spending by consumers and incremental growth could be impacted to a reasonable extent.
Although, we acknowledge the competition in the spirits market, aggressive strategy on account of the second-largest player or any other peer in terms of new brands or competitive pricing could led to a variation in our estimates.
We are banking on the changing lifestyle of the consumer, but any disruption caused to this trend on account of health awareness etc, could lead to a different picture altogether.
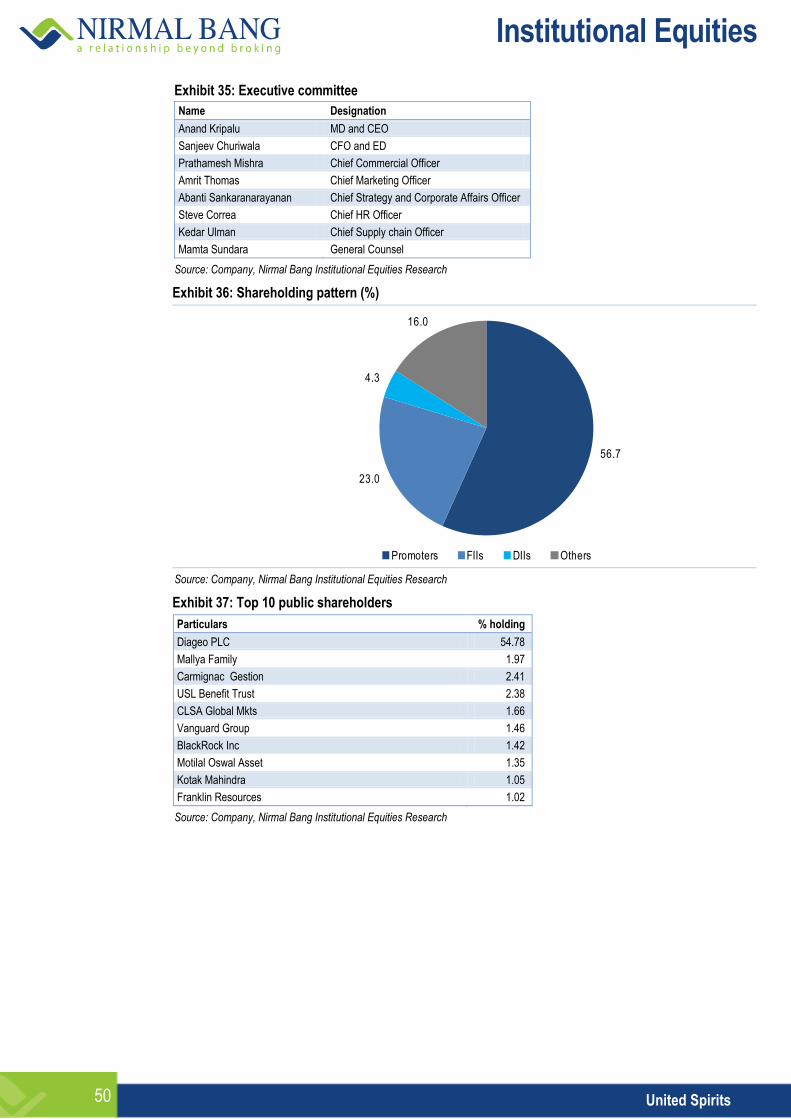
Institutional Equities
50 United Spirits
Exhibit 35: Executive committee
Name Designation
Anand Kripalu MD and CEO
Sanjeev Churiwala CFO and ED
Prathamesh Mishra Chief Commercial Officer
Amrit Thomas Chief Marketing Officer
Abanti Sankaranarayanan Chief Strategy and Corporate Affairs Officer
Steve Correa Chief HR Officer
Kedar Ulman Chief Supply chain Officer
Mamta Sundara General Counsel
Source: Company, Nirmal Bang Institutional Equities Research
Exhibit 36: Shareholding pattern (%)
56.7
23.0
4.3
16.0
Promoters FIIs DIIs Others Source: Company, Nirmal Bang Institutional Equities Research
Exhibit 37: Top 10 public shareholders
Particulars % holding
Diageo PLC 54.78
Mallya Family 1.97
Carmignac Gestion 2.41
USL Benefit Trust 2.38
CLSA Global Mkts 1.66
Vanguard Group 1.46
BlackRock Inc 1.42
Motilal Oswal Asset 1.35
Kotak Mahindra 1.05
Franklin Resources 1.02
Source: Company, Nirmal Bang Institutional Equities Research
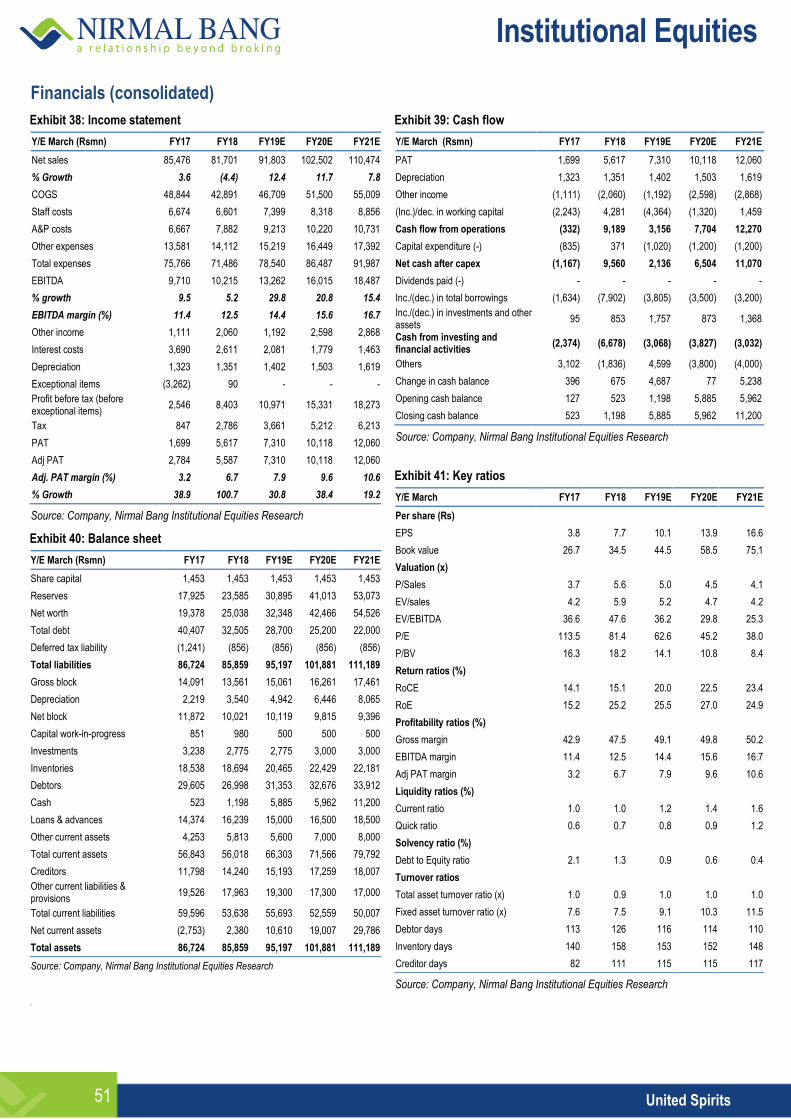
Institutional Equities
51 United Spirits
Financials (consolidated)
Exhibit 38: Income statement
Y/E March (Rsmn) FY17 FY18 FY19E FY20E FY21E
Net sales 85,476 81,701 91,803 102,502 110,474
% Growth 3.6 (4.4) 12.4 11.7 7.8
COGS 48,844 42,891 46,709 51,500 55,009
Staff costs 6,674 6,601 7,399 8,318 8,856
A&P costs 6,667 7,882 9,213 10,220 10,731
Other expenses 13,581 14,112 15,219 16,449 17,392
Total expenses 75,766 71,486 78,540 86,487 91,987
EBITDA 9,710 10,215 13,262 16,015 18,487
% growth 9.5 5.2 29.8 20.8 15.4
EBITDA margin (%) 11.4 12.5 14.4 15.6 16.7
Other income 1,111 2,060 1,192 2,598 2,868
Interest costs 3,690 2,611 2,081 1,779 1,463
Depreciation 1,323 1,351 1,402 1,503 1,619
Exceptional items (3,262) 90 - - -
Profit before tax (before exceptional items)
2,546 8,403 10,971 15,331 18,273
Tax 847 2,786 3,661 5,212 6,213
PAT 1,699 5,617 7,310 10,118 12,060
Adj PAT 2,784 5,587 7,310 10,118 12,060
Adj. PAT margin (%) 3.2 6.7 7.9 9.6 10.6
% Growth 38.9 100.7 30.8 38.4 19.2
Source: Company, Nirmal Bang Institutional Equities Research
Exhibit 40: Balance sheet
Y/E March (Rsmn) FY17 FY18 FY19E FY20E FY21E
Share capital 1,453 1,453 1,453 1,453 1,453
Reserves 17,925 23,585 30,895 41,013 53,073
Net worth 19,378 25,038 32,348 42,466 54,526
Total debt 40,407 32,505 28,700 25,200 22,000
Deferred tax liability (1,241) (856) (856) (856) (856)
Total liabilities 86,724 85,859 95,197 101,881 111,189
Gross block 14,091 13,561 15,061 16,261 17,461
Depreciation 2,219 3,540 4,942 6,446 8,065
Net block 11,872 10,021 10,119 9,815 9,396
Capital work-in-progress 851 980 500 500 500
Investments 3,238 2,775 2,775 3,000 3,000
Inventories 18,538 18,694 20,465 22,429 22,181
Debtors 29,605 26,998 31,353 32,676 33,912
Cash 523 1,198 5,885 5,962 11,200
Loans & advances 14,374 16,239 15,000 16,500 18,500
Other current assets 4,253 5,813 5,600 7,000 8,000
Total current assets 56,843 56,018 66,303 71,566 79,792
Creditors 11,798 14,240 15,193 17,259 18,007
Other current liabilities & provisions
19,526 17,963 19,300 17,300 17,000
Total current liabilities 59,596 53,638 55,693 52,559 50,007
Net current assets (2,753) 2,380 10,610 19,007 29,786
Total assets 86,724 85,859 95,197 101,881 111,189
Source: Company, Nirmal Bang Institutional Equities Research
Exhibit 39: Cash flow
Y/E March (Rsmn) FY17 FY18 FY19E FY20E FY21E
PAT 1,699 5,617 7,310 10,118 12,060
Depreciation 1,323 1,351 1,402 1,503 1,619
Other income (1,111) (2,060) (1,192) (2,598) (2,868)
(Inc.)/dec. in working capital (2,243) 4,281 (4,364) (1,320) 1,459
Cash flow from operations (332) 9,189 3,156 7,704 12,270
Capital expenditure (-) (835) 371 (1,020) (1,200) (1,200)
Net cash after capex (1,167) 9,560 2,136 6,504 11,070
Dividends paid (-) - - - - -
Inc./(dec.) in total borrowings (1,634) (7,902) (3,805) (3,500) (3,200)
Inc./(dec.) in investments and other assets
95 853 1,757 873 1,368
Cash from investing and financial activities
(2,374) (6,678) (3,068) (3,827) (3,032)
Others 3,102 (1,836) 4,599 (3,800) (4,000)
Change in cash balance 396 675 4,687 77 5,238
Opening cash balance 127 523 1,198 5,885 5,962
Closing cash balance 523 1,198 5,885 5,962 11,200
Source: Company, Nirmal Bang Institutional Equities Research
Exhibit 41: Key ratios
Y/E March FY17 FY18 FY19E FY20E FY21E
Per share (Rs)
EPS 3.8 7.7 10.1 13.9 16.6
Book value 26.7 34.5 44.5 58.5 75.1
Valuation (x)
P/Sales 3.7 5.6 5.0 4.5 4.1
EV/sales 4.2 5.9 5.2 4.7 4.2
EV/EBITDA 36.6 47.6 36.2 29.8 25.3
P/E 113.5 81.4 62.6 45.2 38.0
P/BV 16.3 18.2 14.1 10.8 8.4
Return ratios (%)
RoCE 14.1 15.1 20.0 22.5 23.4
RoE 15.2 25.2 25.5 27.0 24.9
Profitability ratios (%)
Gross margin 42.9 47.5 49.1 49.8 50.2
EBITDA margin 11.4 12.5 14.4 15.6 16.7
Adj PAT margin 3.2 6.7 7.9 9.6 10.6
Liquidity ratios (%)
Current ratio 1.0 1.0 1.2 1.4 1.6
Quick ratio 0.6 0.7 0.8 0.9 1.2
Solvency ratio (%)
Debt to Equity ratio 2.1 1.3 0.9 0.6 0.4
Turnover ratios
Total asset turnover ratio (x) 1.0 0.9 1.0 1.0 1.0
Fixed asset turnover ratio (x) 7.6 7.5 9.1 10.3 11.5
Debtor days 113 126 116 114 110
Inventory days 140 158 153 152 148
Creditor days 82 111 115 115 117
Source: Company, Nirmal Bang Institutional Equities Research
r
Institutional Equities
52 United Spirits
Disclaimer
Stock Ratings Absolute Returns
BUY > 15%
ACCUMULATE -5% to15%
SELL < -5%
DISCLOSURES
This Report is published by Nirmal Bang Equities Private Limited (hereinafter referred to as “NBEPL”) for private circulation. NBEPL is a registered Research Analyst under SEBI (Research Analyst) Regulations, 2014 having Registration no. INH000001436. NBEPL is also a registered Stock Broker with National Stock Exchange of India Limited and BSE Limited in cash and derivatives segments. NBEPL has other business divisions with independent research teams separated by Chinese walls, and therefore may, at times, have different or contrary views on stocks and markets. NBEPL or its associates have not been debarred / suspended by SEBI or any other regulatory authority for accessing / dealing in securities Market. NBEPL, its associates or analyst or his relatives do not hold any financial interest in the subject company. NBEPL or its associates or Analyst do not have any conflict or material conflict of interest at the time of publication of the research report with the subject company. NBEPL or its associates or Analyst or his relatives do not hold beneficial ownership of 1% or more in the subject company at the end of the month immediately preceding the date of publication of this research report. NBEPL or its associates / analyst has not received any compensation / managed or co-managed public offering of securities of the company covered by Analyst during the past twelve months. NBEPL or its associates have not received any compensation or other benefits from the company covered by Analyst or third party in connection with the research report. Analyst has not served as an officer, director or employee of Subject Company and NBEPL / analyst has not been engaged in market making activity of the subject company. Analyst Certification: We, Vijay Chugh, the Independent Research Analyst is the author of this report, hereby certify that the views expressed in this research report accurately reflects our personal views about the subject securities, issuers, products, sectors or industries. It is also certified that no part of the compensation of the analyst(s) was, is, or will be directly or indirectly related to the inclusion of specific recommendations or views in this research. The analyst(s) principally responsible for the preparation of this research report and has taken reasonable care to achieve and maintain independence and objectivity in making any recommendations.
Institutional Equities
53 United Spirits
DISCLAIMER This report is for the personal information of the authorized recipient and does not construe to be any investment, legal or taxation advice to you. NBEPL is not soliciting any action based upon it. Nothing in this research shall be construed as a solicitation to buy or sell any security or product, or to engage in or refrain from engaging in any such transaction. In preparing this research, we did not take into account the investment objectives, financial situation and particular needs of the reader.
This research has been prepared for the general use of the clients of NBEPL and must not be copied, either in whole or in part, or distributed or redistributed to any other person in any form. If you are not the intended recipient you must not use or disclose the information in this research in any way. Though disseminated to all the customers simultaneously, not all customers may receive this report at the same time. NBEPL will not treat recipients as customers by virtue of their receiving this report. This report is not directed or intended for distribution to or use by any person or entity resident in a state, country or any jurisdiction, where such distribution, publication, availability or use would be contrary to law, regulation or which would subject NBEPL & its group companies to registration or licensing requirements within such jurisdictions. The report is based on the information obtained from sources believed to be reliable, but we do not make any representation or warranty that it is accurate, complete or up-to-date and it should not be relied upon as such. We accept no obligation to correct or update the information or opinions in it. NBEPL or any of its affiliates or employees shall not be in any way responsible for any loss or damage that may arise to any person from any inadvertent error in the information contained in this report. NBEPL or any of its affiliates or employees do not provide, at any time, any express or implied warranty of any kind, regarding any matter pertaining to this report, including without limitation the implied warranties of merchantability, fitness for a particular purpose, and non-infringement. The recipients of this report should rely on their own investigations.
This information is subject to change without any prior notice. NBEPL reserves its absolute discretion and right to make or refrain from making modifications and alterations to this statement from time to time. Nevertheless, NBEPL is committed to providing independent and transparent recommendations to its clients, and would be happy to provide information in response to specific client queries.
Before making an investment decision on the basis of this research, the reader needs to consider, with or without the assistance of an adviser, whether the advice is appropriate in light of their particular investment needs, objectives and financial circumstances. There are risks involved in securities trading. The price of securities can and does fluctuate, and an individual security may even become valueless. International investors are reminded of the additional risks inherent in international investments, such as currency fluctuations and international stock market or economic conditions, which may adversely affect the value of the investment. Opinions expressed are subject to change without any notice. Neither the company nor the director or the employees of NBEPL accept any liability whatsoever for any direct, indirect, consequential or other loss arising from any use of this research and/or further communication in relation to this research. Here it may be noted that neither NBEPL, nor its directors, employees, agents or representatives shall be liable for any damages whether direct or indirect, incidental, special or consequential including lost revenue or lost profit that may arise from or in connection with the use of the information contained in this report.
This report is prepared by Independent Research Analyst, Mr. Vijay Chugh who is registered with SEBI as ‘Research Analyst’ having registration no. INH000005209. As represented by Third Party Research Analyst, there is no material conflict of interest of him. We reviewed the third party research report for material fact and information before distribution of the same.
Copyright of this document vests exclusively with NBEPL. Our reports are also available on www.nirmalbang.com
Access all our reports on Bloomberg, Thomson Reuters and Factset.
Team Details:
Name Email Id Direct Line
Rahul Arora CEO [email protected] -
Girish Pai Head of Research [email protected] +91 22 3926 8017 / 18
Dealing
Ravi Jagtiani Dealing Desk [email protected] +91 22 3926 8230, +91 22 6636 8833
Pradeep Kasat Dealing Desk [email protected] +91 22 3926 8100/8101, +91 22 6636 8831
Michael Pillai Dealing Desk [email protected] +91 22 3926 8102/8103, +91 22 6636 8830
Nirmal Bang Equities Pvt. Ltd.
Correspondence Address
B-2, 301/302, Marathon Innova, Nr. Peninsula Corporate Park,
Lower Parel (W), Mumbai-400013. Board No. : 91 22 3926 8000/1; Fax. : 022 3926 8010
Related Documents