1 ALBERTA CHILDREN’S HOSPITAL PEDIATRIC TRAUMA PROGRAM ANNUAL REPORT 2008 – 2009 ACH Trauma Program Staff Dr. Vincent Grant ..................................................................... Medical Director Sherry MacGillivray ........................... Regional Pediatric Trauma Coordinator Maria Vivas (until September 2008) .............................................. Data Analyst Jennifer Perez (started September 2008) ..................................... Data Analyst

Welcome message from author
This document is posted to help you gain knowledge. Please leave a comment to let me know what you think about it! Share it to your friends and learn new things together.
Transcript
1
ALBERTA CHILDREN’S HOSPITAL
PEDIATRIC TRAUMA PROGRAM
ANNUAL REPORT
2008 – 2009
ACH Trauma Program Staff
Dr. Vincent Grant ..................................................................... Medical Director
Sherry MacGillivray ........................... Regional Pediatric Trauma Coordinator
Maria Vivas (until September 2008) .............................................. Data Analyst
Jennifer Perez (started September 2008) ..................................... Data Analyst
2
TABLE OF CONTENTS
1. Introduction .................................................................................................... 3
2. Clinical Care .................................................................................................. 5
3. Education ...................................................................................................... 7 4. Research ..................................................................................................... 10
5. Quality Assurance ....................................................................................... 11
6. Future Planning .......................................................................................... 12
APPENDICES
Appendix A: Trauma Quality Indicators ......................................................... 13
Appendix B: Major Trauma Statistics ............................................................ 29
3
1. Introduction The year 2008-2009 was a year of consolidation for areas of strength within the Pediatric Trauma Program at the Alberta Children’s Hospital (ACH). However, advocating for new funding for initiatives related to the trauma expansion proposal remained a priority. As a reminder, the trauma expansion proposal was produced from the most recent Trauma Association of Canada Accreditation and highlighted several key initiatives to both improve and enhance trauma care for the 0-14 year old population that we currently serve, as well as undertake key steps to build toward the repatriation of the 15-17 year old population. During 2008-2009, patients in the 15-17 year old population who were initially stabilized at the Foothills Medical Centre were starting to be transferred on a case by case basis to the ACH for the remainder of their in-patient care. Although this new procedure highlighted some communication issues between the two Centres, it also allowed for opportunity to better collaborate with our adult trauma colleagues. Once the final elements of the trauma expansion proposal become funded, full care for the 15-17 year old blunt trauma population will become the responsibility of the ACH. The clinical and academic successes of the Pediatric Trauma Program have been highlighted recently by the use of 7 pediatric trauma patients and their families for the ACH Foundation Radiothon, further raising the profile of the Program. The ACH Foundation also funded the Pediatric Trauma Beading Program, a landmark program allowing trauma patients to earn special beads throughout their in-patient stay for every diagnostic test and treatment modality they have had to endure during their hospital stay. The ACH Trauma Program was also an integral partner in the development of the Alberta Provincial Trauma Committee. As a Level 1 Pediatric Trauma Centre, the ACH Trauma Program has been a leader in the development and mentorship of new Level 3 Trauma Centres across the Province. Red Deer and Lethbridge have attained current status as Level 3 Trauma Centres in Southern Alberta. Medicine Hat is expected to attain this status next year. The ACH Trauma Program has continued to provide educational opportunities for both ACH clinical staff as well as outreach education to rural and regional providers. On-going education provided by the Pediatric Trauma Program includes: mock trauma codes for the ED and OR, monthly Pediatric Trauma Rounds, twice yearly Trauma Nursing Core Courses (TNCC) and outreach education to Southern Alberta by partnering with KIDSIM™, the Pediatric Human Patient Simulation Program at ACH. We would like to thank all of our trauma educators for outstanding teaching throughout the year. The ACH Trauma Program was also very successful on a national scale, with several invited presentations and workshops at provincial and national conferences.
4
Finally, the ACH Trauma Program started to display some research productivity in the areas of trauma and injury prevention, all signs of a successful and maturing program. Our main goals continue to be strong clinical care, excellence and leadership in pediatric trauma education both within the Alberta Children’s Hospital and to our regional partners, on-going advocacy in injury prevention and continued productivity in quality assurance and research. We wish to thank all of the staff at the Alberta Children’s Hospital who have had an impact on the Pediatric Trauma Program, and who continue to support our goals in caring for critically injured children and youth. In particular, a great deal of thanks goes to the nurses, physicians, respiratory therapists, and other front-line staff who remain devoted to the care of these children and their families, as well as all of the other staff who make excellence in pediatric trauma care at the Alberta Children’s Hospital a veritable “team effort”. NOTE: The patients included in this report are those with an Injury Severity Score (ISS) > 12 and who are admitted to the hospital or die in the emergency department at the Alberta Children’s Hospital (ACH). Patients who die at the scene of their traumatic event are not represented in this report. ISS is an anatomical scoring tool that provides an overall score for patients with single or multiple system injuries. The ISS captured in the Alberta Trauma Registry ranges between 12 and 75. The assumption is the higher the ISS score, the more serious the injury suffered.
5
2. Clinical Care Identifying ways to improve the clinical care of the trauma patient at the Alberta Children’s Hospital (ACH) is a major focus of the Pediatric Trauma Program. Over the past year the following activities have been carried out:
i) Trauma In-patient Unit • Unit 4 continued to be the ACH trauma unit. This has allowed the
care of all traumatic injuries to be consolidated within one group of care providers, who continue to show dedication and excellence in the care they provide.
ii) Pediatric In-patient Trauma Service
• A dedicated in-patient trauma service, to provide and direct the primary clinical care of multiply injured trauma patients, continues to be led by the Division of Pediatric General Surgery. They provide attending physician coverage for this service 24 hours a day, 7 days a week, 365 days a year.
iii) Pediatric Trauma Nurse Practitioner
• This position continues to support both the in-patient trauma service, as well as the medical needs of rehabilitation patients in the hospital and a significant role on the Brain Injury Team.
iv) Trauma Team Activation Guidelines (Code 77)
• A complete overhaul of the trauma team activation guidelines was instituted in October 2007. These guidelines are continuously monitored for ‘over’ and ‘under’ triage and for any issues that arise.
v) Trauma Team Composition (Code 77)
• A complete overhaul of the trauma team composition was also instituted in October 2007. The members of the Trauma Team are monitored for timely responses to the Code 77 call.
vi) Pediatric Massive Transfusion Protocol
• Significant progress was made on the development of a pediatric massive transfusion protocol. This was modeled after the adult massive transfusion protocol being used at the FMC, and was a successful collaboration between the Pediatric Trauma Committee, Anesthesia, Hematology and Hematopathology. Endorsement and implementation are expected for next year.
vii) Trauma Beading Program
• Thanks to a generous grant from the Alberta Children’s Hospital Foundation, a Trauma Beading Program for major trauma patients was started. The opportunity for admitted trauma patients to mark and remember their journey by earning beads for length of hospital
6
stay, diagnostic tests and treatment modalities was well received by trauma patients and their families. This program, administered by the Pediatric Trauma Program and operationalized by the ACH Child Life Specialists, has been a huge success. We would like to extend our gratitude to the ACH Foundation and the ACH Child Life Specialists for making this important program a reality.
viii) Liaising with Regional, Provincial and National Groups
• Provincial Trauma Committee - Members • Interdisciplinary Trauma Network of Canada - Members • Trauma Association of Canada - Members • National Emergency Nurses Association - Members • Canadian Hospitals Injury Prevention & Reporting Prevention
Programs (CHIRPP) - Members
ix) Trauma Expansion Plan • Several of the initiatives listed above were part of a formal Trauma
Expansion Plan at the Alberta Children’s Hospital. Phase 1 of the Plan was designed to represent enhancements required for clinical excellence in the current patient volume at ACH for the 0-14 year population. These objectives contain several important steps that must be fulfilled prior to entertaining expansion of the trauma population to the 15-17 year population.
• Outstanding issues from Phase 1 for 2009-10: o Implementation of a designated trauma team leader roster -
awaiting funding o Funding for specialized equipment for larger trauma patients
and outfitting of the second ED trauma bay (two beds) - awaiting funding
o Enhancement of in-patient nursing staffing to allow for the expansion of in-patient stays expected with the 15-17 year old population - awaiting funding
o Enhancement of Diagnostic Imaging staffing to ensure appropriate response time for patients requiring urgent CT (16 hrs/day x 7 days/week) in-house CT response (with appropriate on-call response for other hours) - awaiting funding
o Improvements in rehabilitation coverage and services o Development of protocols to address thoracic, vascular
surgery and interventional radiology medical coverage o A written no refusal policy for trauma patients
x) Revised Drug Manual for Emergency Department Nursing
• Completed and approved
7
3. Education
i) Trauma Rounds • April 2008 - Dr. Izabela Sztukowski - “Thoracic Trauma in the
Pediatric Patient”
• May 2008 - Dr. Dominic Cave - “Seven Questions, Less Answers: Factor V11a in Pediatric Trauma”
• June 2008 - Dr. Gavin Burgess - “Bedside Ultrasound in Pediatric
Trauma” • September 2008 - Dr. Vince Grant - “The Pediatric Trauma Program
– what were the kids up to last year?” • October 2008 - Dr. Jeremy Luntley - “Pre-hospital Airway
Management” • December 2008 - Dr. Mike Betzner - “Aeromedical Transport Issues” • February 2009 - Dr. Clare Gallagher - “Neurotrauma Monitoring” • March 2009 - Dr. Brent Hagel - “An Overview of the Bicyclist Risk
Factor Study”
ii) Trauma Nursing Core Course The Trauma Nursing Core Course (TNCC) continues to be held at ACH twice per year. This course is designed for nurses caring for patients in any part of the trauma spectrum and has been very well received. This course is funded by a generous grant from the Alberta Children’s Hospital Foundation and will continue in the future.
iii) Outreach Education This year the partnership between the ACH Trauma Program and KIDSIM™, the Pediatric Human Patient Simulation Program, continued to deliver education to both regional and rural partners. The following centres were visited in 2008-09: Black Diamond, Drumheller, Vulcan, Strathmore, Red Deer, Lethbridge, High River, Claresholm, Banff and Airdrie. These very popular educational sessions are expected to expand and continue in the future.
iv) Mock Trauma Codes Regular mock trauma codes provided residents, ED physicians, Anesthetists, Surgeons, ED nurses, OR nurses, respiratory therapists, nursing aides and unit clerks with an opportunity to learn from simulated trauma cases.
8
v) Emergency Nursing Trauma Education Sessions Monthly trauma education sessions were held for ED nurses on a voluntary sign-up basis. Trauma statistics, common mechanisms of injury and trauma assessments were the focus, but round table discussions and procedures were encouraged. These sessions were very well received and will continue in the future.
vi) Emergency Trauma Simulation Sessions Monthly trauma simulation sessions were held for ED nurses on a voluntary sign-up basis in conjunction with residents rotating through the Pediatric Emergency Medicine rotation, as well as Emergency Medicine residents in general. Human Patient Simulators were used to replicate the assessment and management of trauma patients in real time in an interprofessional environment. These sessions were very well received and will continue in the future.
vii) Trauma Unit and PICU Nursing Trauma Simulation Sessions
Monthly trauma sessions, using simulation, continued for the trauma unit nurses and were also started for the PICU nurses to provide trauma education. These trauma sessions were held monthly and were very well received and will continue in the future.
viii) Other Nursing Sessions Trauma education was included in General Nursing Orientation for new PICU and ED nurses at the ACH as well as LPN’s and nursing students. This year pediatric trauma was introduced with simulation to the adult ED nurses in the Calgary area.
ix) University of Calgary, Department of Pediatrics Postgraduate
Medical Education Program o Academic half-day devoted to Pediatric Trauma - Dr. V. Grant
x) University of Calgary, Department of Emergency Medicine
Postgraduate Medical Education Program o Academic half-day devoted to Pediatric Trauma - Dr. V. Grant o Academic half-day devoted to Non-accidental Trauma in
Children - Dr. V. Grant
xi) University of Calgary, Undergraduate Medical Education o Course VI (Human Development Course) Lecture on the
Approach to Pediatric Trauma - Dr. V. Grant
xii) University of Calgary Rural Emergency Medicine Conference o Pediatric Trauma Lecture - Dr. V. Grant o Pediatric Trauma skills station - Sherry MacGillivray
9
xiii) Advanced Pediatric Life Support Course o Trauma Lecture - Dr. V. Grant
xiv) Calgary Health Region Regional Trauma Program Grand Rounds
(April 2008) o Dr. V. Grant - “Pediatric Trauma Care in the Calgary Health
Region: What your little sibling’s been up to” (April 2008)
xv) Trauma Association of Canada Annual Scientific Meeting (Whistler, BC - April 2008)
o Dr. V. Grant - Moderator of Pediatric Trauma Concurrent Sessions
o Dr. V. Grant - Organizing Committee o Sherry MacGillivray and Maria Vivas – Oral and Poster
presentations on the “Implementation of a New Data Management System in an Attempt to Minimize Delays in Completion of a Trauma centre Database”
o Dr. V. Grant - Presentation: “Imaging Modalities in Pediatric Blunt Abdominal Trauma”
xvi) Canadian Association of Emergency Physicians’ Annual
Conference (Ottawa, ON - June 2008) o Dr. V. Grant - Presentation: “Pediatric Trauma Update” o Dr. V. Grant - Workshop: “Pediatric Trauma Resuscitation
Workshop”
10
4. Research The following research projects were in progress during 2008/2009:
PUBLICATIONS: 1) Thakore S, Tram J, Hagel BE
, Kyle T, Senger T, Belanger F. Injuries among wheeled shoe users: a comparison with other non-motorized wheeled activities. In Press: Paediatrics and Child Health
2) Macpherson AK, White HL, Mongeon S, Grant VJ, Osmond M, Lipskie T, Mackay MJ. Examining the sensitivity of an injury surveillance program using population-based estimates. Injury Prevention 2008;14:262-5.
ABSTRACTS: 1) MacGillivray SA, Vivas M, Grant VJ. Implementation of a new data
management system in an attempt to minimize delay in completion of a trauma centre database. J Trauma 2008; 64(2):545.
2) Ranson MK, Laupland KB, Walker DG, Dyer D, Findlay C, Vivas M, Grant V,
Kirkpatrick AW. Costs of severe injury in the Calgary Health Region. J Trauma 2008;64(2):552.
IN PROGRESS: 1) Karkhaneh M, Rowe BH, Voaklander D, Saunders D, Hagel BE
. The effect of bike helmet legislation on helmet use, head injuries and cycling habits.
2) Hagel BE
, Rowe BH, Voaklander D, Kyle T. Does visibility influence the risk of injury in cyclists?
3) Russell K, Meeuwisse W, Emery CA, Nettel-Aguirre A, Hagel BE
. The relationship between injuries and terrain park equipment use among pediatric and adult snowboarders in Alberta.
11
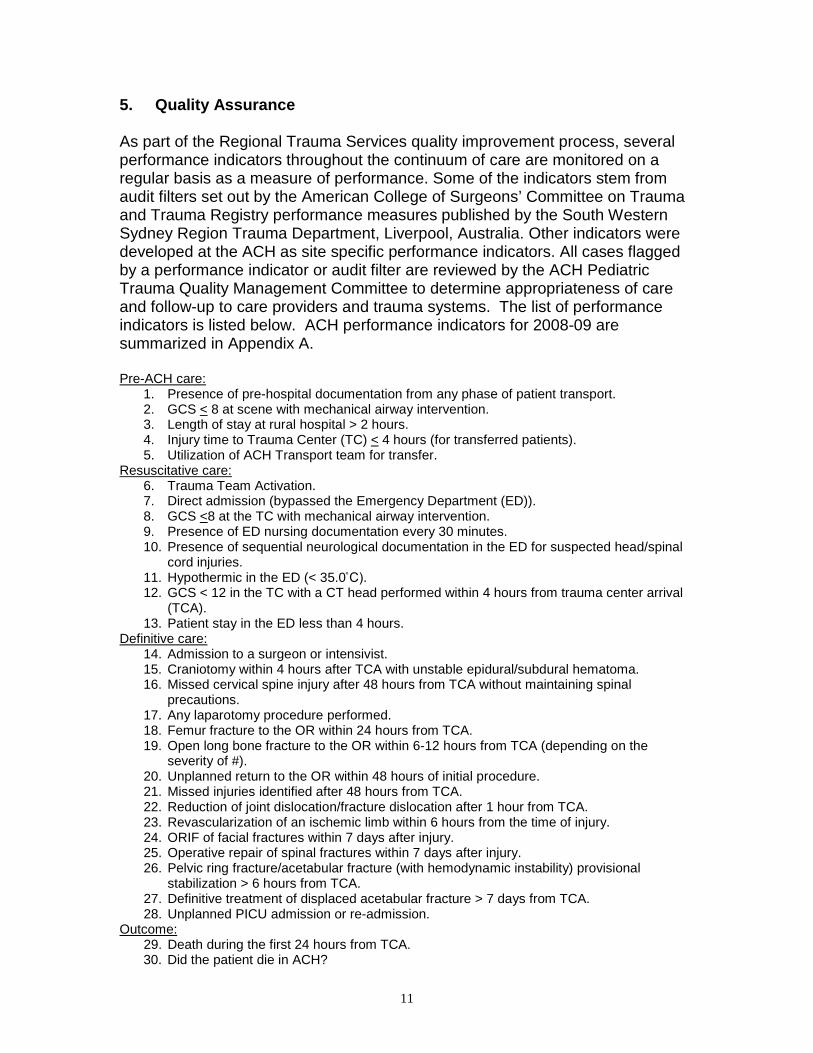
5. Quality Assurance As part of the Regional Trauma Services quality improvement process, several performance indicators throughout the continuum of care are monitored on a regular basis as a measure of performance. Some of the indicators stem from audit filters set out by the American College of Surgeons’ Committee on Trauma and Trauma Registry performance measures published by the South Western Sydney Region Trauma Department, Liverpool, Australia. Other indicators were developed at the ACH as site specific performance indicators. All cases flagged by a performance indicator or audit filter are reviewed by the ACH Pediatric Trauma Quality Management Committee to determine appropriateness of care and follow-up to care providers and trauma systems. The list of performance indicators is listed below. ACH performance indicators for 2008-09 are summarized in Appendix A.
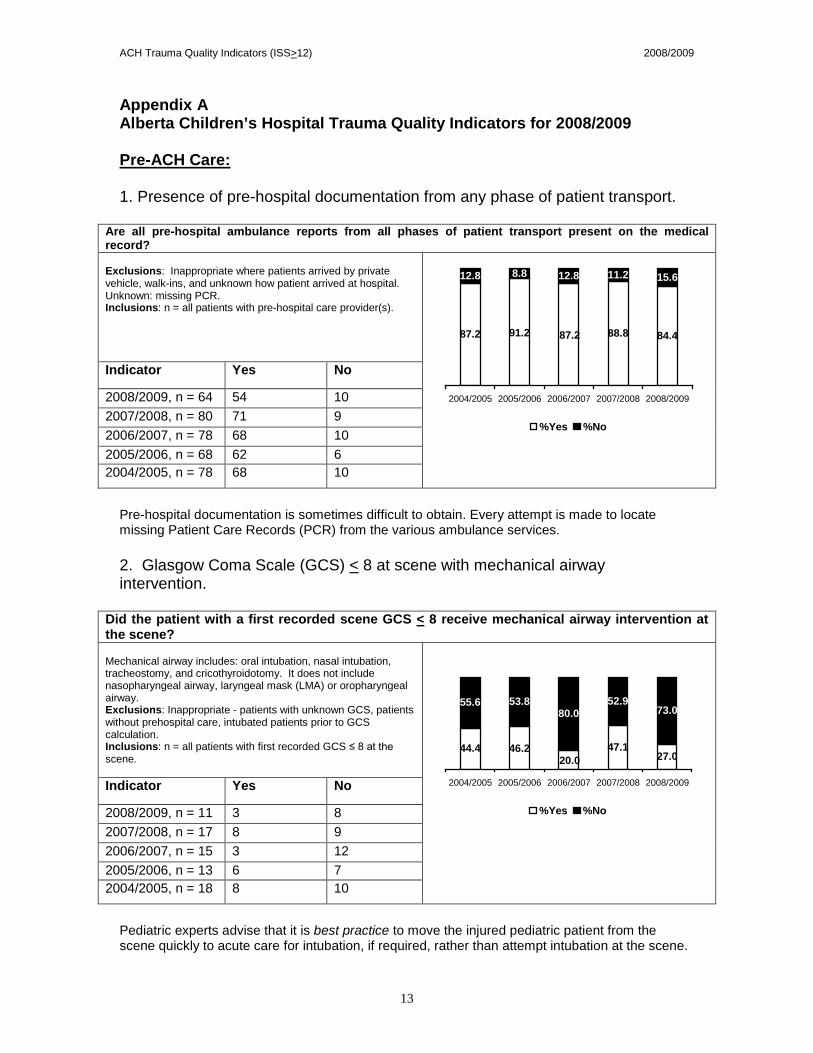
1. Presence of pre-hospital documentation from any phase of patient transport. Pre-ACH care:
2. GCS < 8 at scene with mechanical airway intervention. 3. Length of stay at rural hospital > 2 hours. 4. Injury time to Trauma Center (TC) < 4 hours (for transferred patients). 5. Utilization of ACH Transport team for transfer.
6. Trauma Team Activation. Resuscitative care:
7. Direct admission (bypassed the Emergency Department (ED)). 8. GCS <8 at the TC with mechanical airway intervention. 9. Presence of ED nursing documentation every 30 minutes. 10. Presence of sequential neurological documentation in the ED for suspected head/spinal
cord injuries. 11. Hypothermic in the ED (< 35.0˚C). 12. GCS < 12 in the TC with a CT head performed within 4 hours from trauma center arrival
(TCA). 13. Patient stay in the ED less than 4 hours.
14. Admission to a surgeon or intensivist. Definitive care:
15. Craniotomy within 4 hours after TCA with unstable epidural/subdural hematoma. 16. Missed cervical spine injury after 48 hours from TCA without maintaining spinal
precautions. 17. Any laparotomy procedure performed. 18. Femur fracture to the OR within 24 hours from TCA. 19. Open long bone fracture to the OR within 6-12 hours from TCA (depending on the
severity of #). 20. Unplanned return to the OR within 48 hours of initial procedure. 21. Missed injuries identified after 48 hours from TCA. 22. Reduction of joint dislocation/fracture dislocation after 1 hour from TCA. 23. Revascularization of an ischemic limb within 6 hours from the time of injury. 24. ORIF of facial fractures within 7 days after injury. 25. Operative repair of spinal fractures within 7 days after injury. 26. Pelvic ring fracture/acetabular fracture (with hemodynamic instability) provisional
stabilization > 6 hours from TCA. 27. Definitive treatment of displaced acetabular fracture > 7 days from TCA. 28. Unplanned PICU admission or re-admission.
29. Death during the first 24 hours from TCA. Outcome:
30. Did the patient die in ACH?
12
6. Future Planning The 2009-2010 year will focus on the following activities: • Revising the Pediatric Trauma Expansion Proposal to ensure it continues to
be up to date, as well as continuing to actively advocate for provincial / regional funding. Key areas requiring implementation include:
o Implementation of a designated trauma team leader roster o Funding for specialized equipment for larger trauma patients and outfitting of the second ED trauma bay (two beds) o Enhancement of in-patient nursing staffing to allow for the expansion of in-patient stays expected with the 15-17 year old population o Enhancement of Diagnostic Imaging staffing to ensure appropriate response time for patients requiring urgent CT (16 hrs/day x 7 days/week) in-house CT response (with appropriate on-call response for other hours) o Improvements in rehabilitation coverage and services o Development of protocols to address thoracic, vascular surgery and interventional radiology medical coverage o A written no refusal policy for trauma patients
• Addressing new issues identified in data collection re. the needs of 15-17 year old trauma patients and impact on current operations, human resources and equipment with the goal of eventual repatriation
• Continuing to focus on Pediatric Trauma Education o Improving and enhancing Pediatric Trauma Rounds o Continuing regular TNCC courses twice yearly at ACH o Continuing Mock Trauma Cases in the ED, OR and include ICU as much as possible o Continuing excellence in pediatric trauma outreach education within the Calgary Health Region and throughout Southern Alberta and Southeastern British Columbia
• Continuing advocacy of injury prevention initiatives • Continuing leadership on a regional, provincial and national level • Developing an active pediatric trauma research program • Continuing excellence in quality assurance leadership • Developing good clinical documentation tools for trauma care providers • Focusing on improving communication with all of the services impacted in
trauma delivery through the Trauma Committee • Establishing and growing connections with other Canadian Pediatric
Trauma Programs to work collaboratively on research, quality assurance projects and improving standards of care for pediatric trauma patients
ACH Trauma Quality Indicators (ISS>12) 2008/2009
13
Appendix A Alberta Children’s Hospital Trauma Quality Indicators for 2008/2009
Pre-ACH Care:
1. Presence of pre-hospital documentation from any phase of patient transport.
Are all pre-hospital ambulance reports from all phases of patient transport present on the medical record? Exclusions: Inappropriate where patients arrived by private vehicle, walk-ins, and unknown how patient arrived at hospital. Unknown: missing PCR. Inclusions: n = all patients with pre-hospital care provider(s).
84.4
11.2 15.6
88.891.287.2 87.2
12.8 8.8 12.8
2004/2005 2005/2006 2006/2007 2007/2008 2008/2009
%Yes %No
Indicator Yes No
2008/2009, n = 64 54 10 2007/2008, n = 80 71 9 2006/2007, n = 78 68 10 2005/2006, n = 68 62 6 2004/2005, n = 78 68 10
Pre-hospital documentation is sometimes difficult to obtain. Every attempt is made to locate missing Patient Care Records (PCR) from the various ambulance services. 2. Glasgow Coma Scale (GCS) < 8 at scene with mechanical airway intervention.
Did the patient with a first recorded scene GCS < 8 receive mechanical airway intervention at the scene? Mechanical airway includes: oral intubation, nasal intubation, tracheostomy, and cricothyroidotomy. It does not include nasopharyngeal airway, laryngeal mask (LMA) or oropharyngeal airway. Exclusions: Inappropriate - patients with unknown GCS, patients without prehospital care, intubated patients prior to GCS calculation. Inclusions: n = all patients with first recorded GCS ≤ 8 at the scene.
27.0
52.973.0
47.146.244.420.0
55.6 53.880.0
2004/2005 2005/2006 2006/2007 2007/2008 2008/2009
%Yes %No
Indicator Yes No
2008/2009, n = 11 3 8 2007/2008, n = 17 8 9 2006/2007, n = 15 3 12 2005/2006, n = 13 6 7 2004/2005, n = 18 8 10
Pediatric experts advise that it is best practice to move the injured pediatric patient from the scene quickly to acute care for intubation, if required, rather than attempt intubation at the scene.
ACH Trauma Quality Indicators (ISS>12) 2008/2009
14
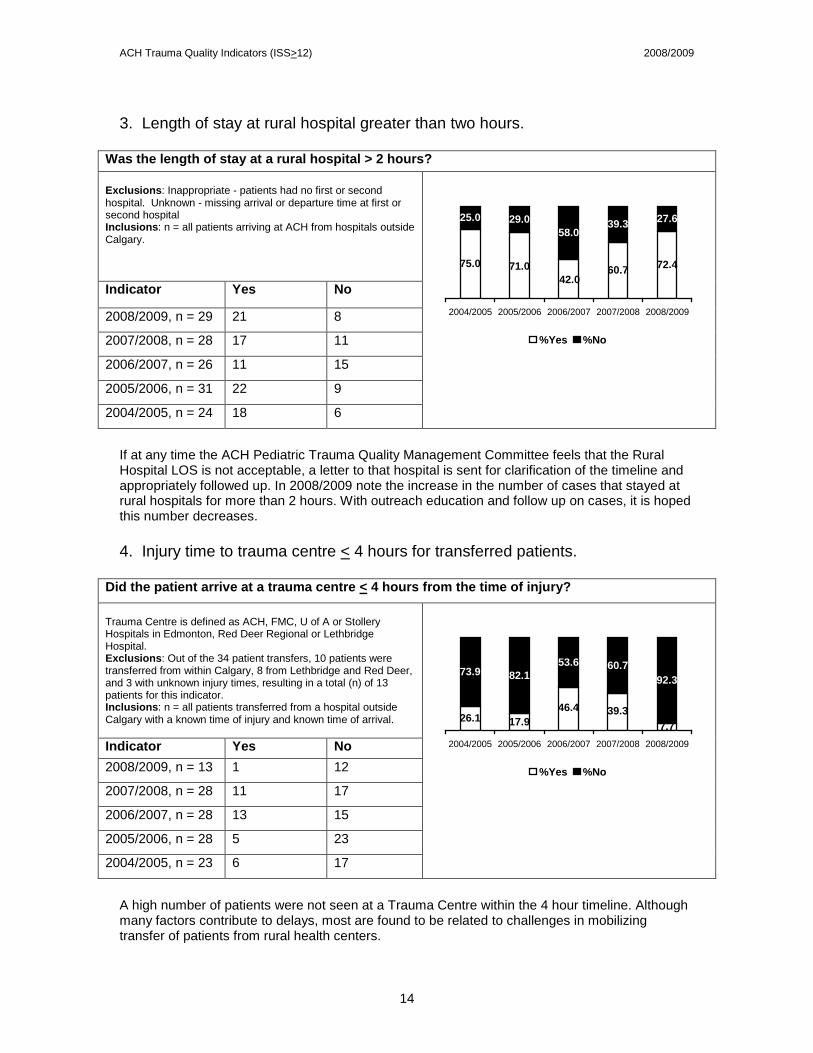
3. Length of stay at rural hospital greater than two hours.
Was the length of stay at a rural hospital > 2 hours? Exclusions: Inappropriate - patients had no first or second hospital. Unknown - missing arrival or departure time at first or second hospital Inclusions: n = all patients arriving at ACH from hospitals outside Calgary.
72.4
39.3 27.6
60.771.075.042.0
25.0 29.058.0
2004/2005 2005/2006 2006/2007 2007/2008 2008/2009
%Yes %No
Indicator Yes No
2008/2009, n = 29 21 8
2007/2008, n = 28 17 11
2006/2007, n = 26 11 15
2005/2006, n = 31 22 9
2004/2005, n = 24 18 6
If at any time the ACH Pediatric Trauma Quality Management Committee feels that the Rural Hospital LOS is not acceptable, a letter to that hospital is sent for clarification of the timeline and appropriately followed up. In 2008/2009 note the increase in the number of cases that stayed at rural hospitals for more than 2 hours. With outreach education and follow up on cases, it is hoped this number decreases. 4. Injury time to trauma centre < 4 hours for transferred patients.
Did the patient arrive at a trauma centre < 4 hours from the time of injury? Trauma Centre is defined as ACH, FMC, U of A or Stollery Hospitals in Edmonton, Red Deer Regional or Lethbridge Hospital. Exclusions: Out of the 34 patient transfers, 10 patients were transferred from within Calgary, 8 from Lethbridge and Red Deer, and 3 with unknown injury times, resulting in a total (n) of 13 patients for this indicator. Inclusions: n = all patients transferred from a hospital outside Calgary with a known time of injury and known time of arrival.
17.9 7.7
60.792.3
39.326.146.4
73.9 82.153.6
2004/2005 2005/2006 2006/2007 2007/2008 2008/2009
%Yes %No
Indicator Yes No 2008/2009, n = 13 1 12
2007/2008, n = 28 11 17
2006/2007, n = 28 13 15
2005/2006, n = 28 5 23
2004/2005, n = 23 6 17
A high number of patients were not seen at a Trauma Centre within the 4 hour timeline. Although many factors contribute to delays, most are found to be related to challenges in mobilizing transfer of patients from rural health centers.
ACH Trauma Quality Indicators (ISS>12) 2008/2009
15
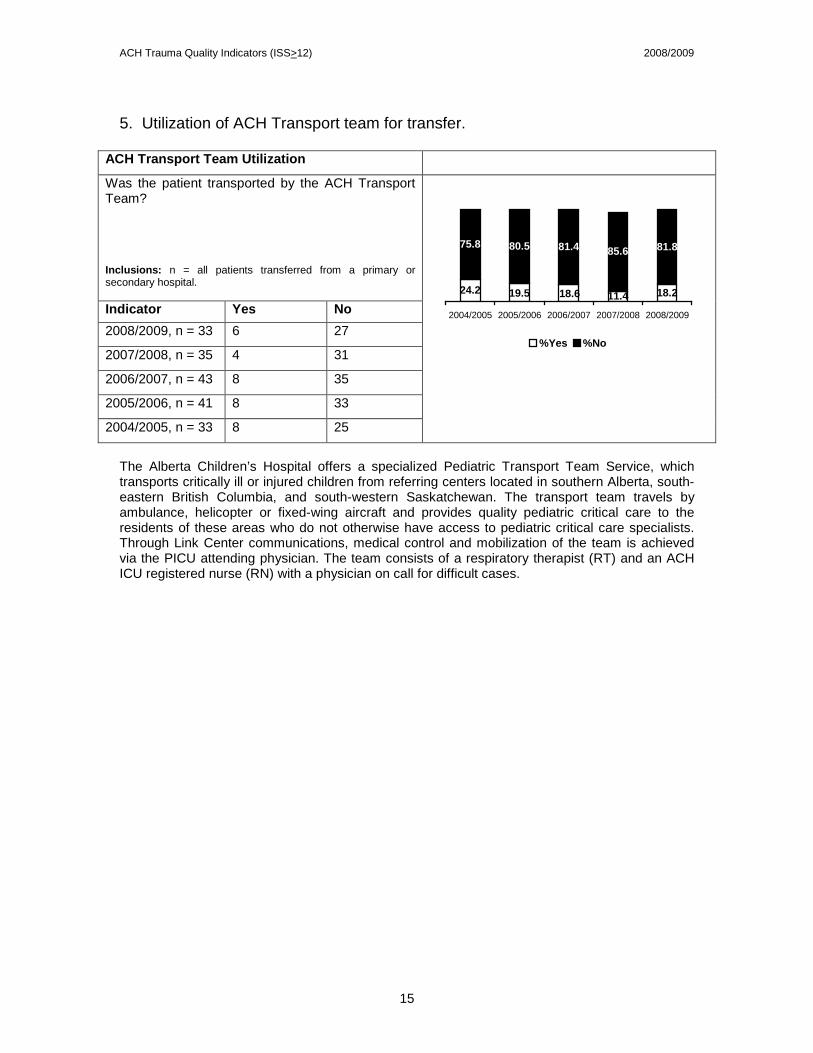
5. Utilization of ACH Transport team for transfer.
ACH Transport Team Utilization
Was the patient transported by the ACH Transport Team? Inclusions: n = all patients transferred from a primary or secondary hospital. 18.2
85.6 81.8
18.624.2 19.5 11.4
81.480.575.8
2004/2005 2005/2006 2006/2007 2007/2008 2008/2009
%Yes %No
Indicator Yes No 2008/2009, n = 33 6 27
2007/2008, n = 35 4 31
2006/2007, n = 43 8 35
2005/2006, n = 41 8 33
2004/2005, n = 33 8 25
The Alberta Children’s Hospital offers a specialized Pediatric Transport Team Service, which transports critically ill or injured children from referring centers located in southern Alberta, south-eastern British Columbia, and south-western Saskatchewan. The transport team travels by ambulance, helicopter or fixed-wing aircraft and provides quality pediatric critical care to the residents of these areas who do not otherwise have access to pediatric critical care specialists. Through Link Center communications, medical control and mobilization of the team is achieved via the PICU attending physician. The team consists of a respiratory therapist (RT) and an ACH ICU registered nurse (RN) with a physician on call for difficult cases.
ACH Trauma Quality Indicators (ISS>12) 2008/2009
16
Resuscitative care:
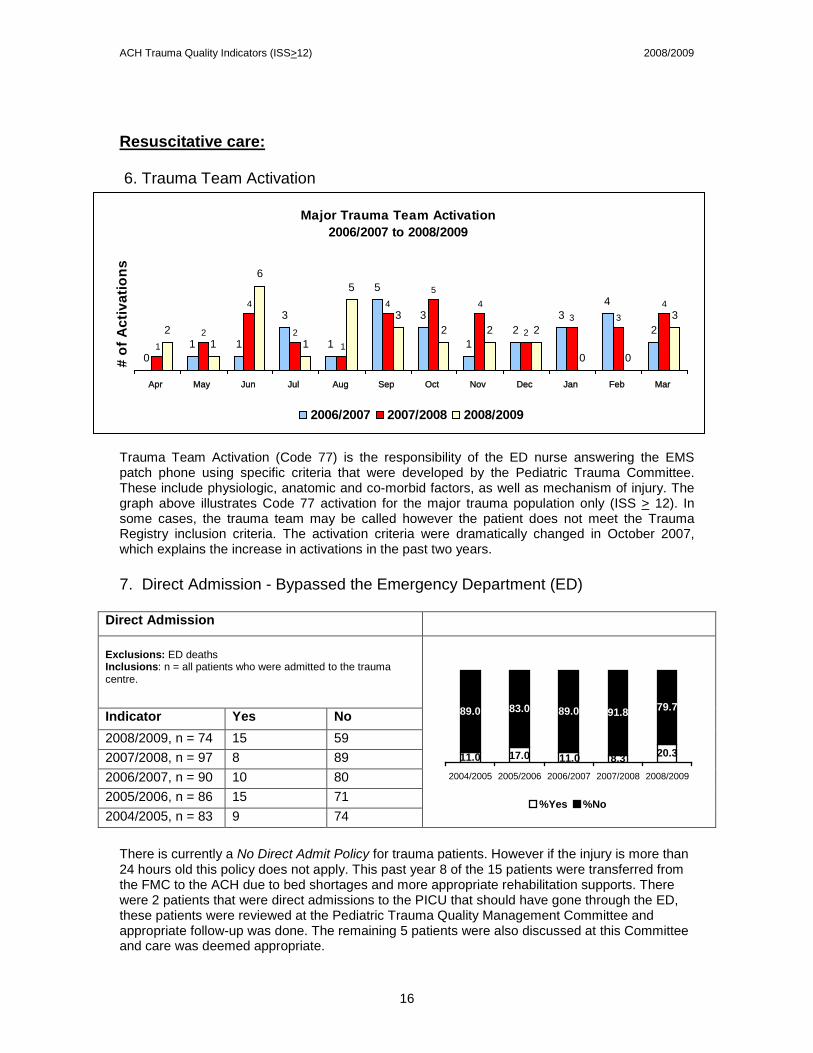
6. Trauma Team Activation
Trauma Team Activation (Code 77) is the responsibility of the ED nurse answering the EMS patch phone using specific criteria that were developed by the Pediatric Trauma Committee. These include physiologic, anatomic and co-morbid factors, as well as mechanism of injury. The graph above illustrates Code 77 activation for the major trauma population only (ISS > 12). In some cases, the trauma team may be called however the patient does not meet the Trauma Registry inclusion criteria. The activation criteria were dramatically changed in October 2007, which explains the increase in activations in the past two years. 7. Direct Admission - Bypassed the Emergency Department (ED)
Direct Admission Exclusions: ED deaths Inclusions: n = all patients who were admitted to the trauma centre.
20.3
91.8 79.7
8.317.011.0 11.0
89.0 83.0 89.0
2004/2005 2005/2006 2006/2007 2007/2008 2008/2009
%Yes %No
Indicator Yes No 2008/2009, n = 74 15 59 2007/2008, n = 97 8 89 2006/2007, n = 90 10 80 2005/2006, n = 86 15 71 2004/2005, n = 83 9 74
There is currently a No Direct Admit Policy for trauma patients. However if the injury is more than 24 hours old this policy does not apply. This past year 8 of the 15 patients were transferred from the FMC to the ACH due to bed shortages and more appropriate rehabilitation supports. There were 2 patients that were direct admissions to the PICU that should have gone through the ED, these patients were reviewed at the Pediatric Trauma Quality Management Committee and appropriate follow-up was done. The remaining 5 patients were also discussed at this Committee and care was deemed appropriate.
Major Trauma Team Activation 2006/2007 to 2008/2009
01 1
3
1
5
1
4
2
5
23
21
6
1
5
32 2 2
0 0
332
34
344
12
4
21
Apr May Jun Jul Aug Sep Oct Nov Dec Jan Feb Mar
# of
Act
ivat
ions
2006/2007 2007/2008 2008/2009
ACH Trauma Quality Indicators (ISS>12) 2008/2009
17
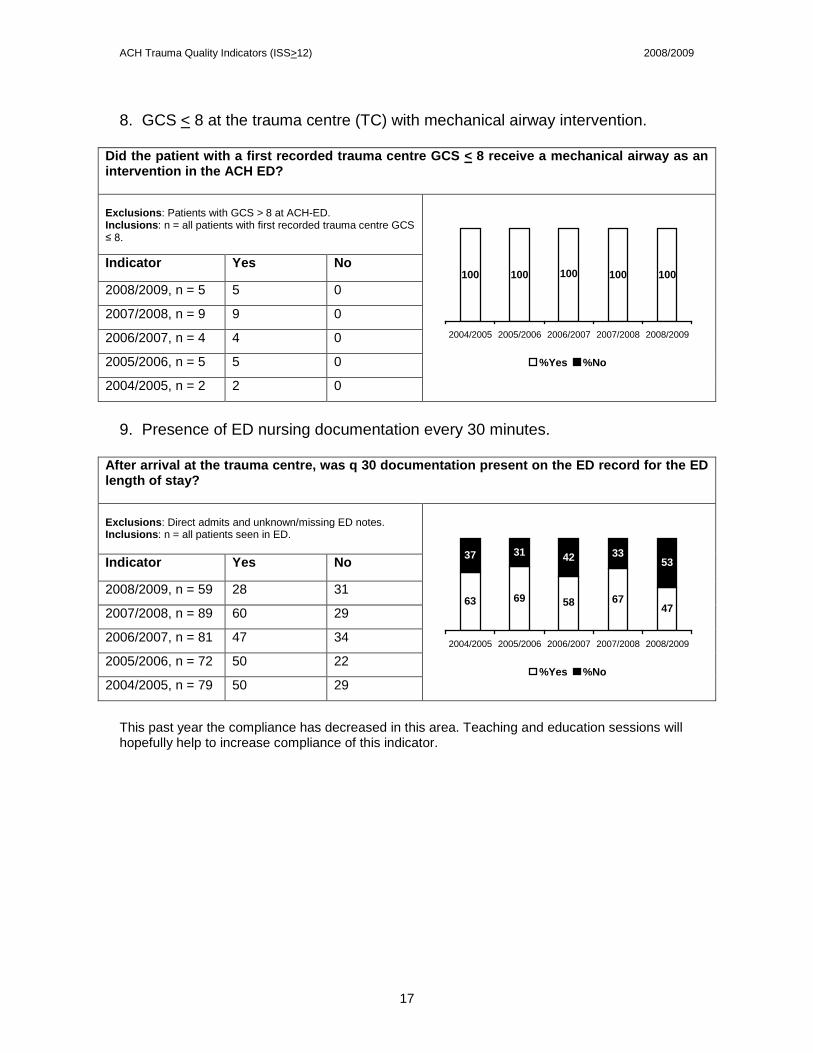
8. GCS < 8 at the trauma centre (TC) with mechanical airway intervention.
Did the patient with a first recorded trauma centre GCS < 8 receive a mechanical airway as an intervention in the ACH ED? Exclusions: Patients with GCS > 8 at ACH-ED. Inclusions: n = all patients with first recorded trauma centre GCS ≤ 8.
100 100 100100 100
2004/2005 2005/2006 2006/2007 2007/2008 2008/2009
%Yes %No
Indicator Yes No
2008/2009, n = 5 5 0
2007/2008, n = 9 9 0
2006/2007, n = 4 4 0
2005/2006, n = 5 5 0
2004/2005, n = 2 2 0
9. Presence of ED nursing documentation every 30 minutes.
After arrival at the trauma centre, was q 30 documentation present on the ED record for the ED length of stay? Exclusions: Direct admits and unknown/missing ED notes. Inclusions: n = all patients seen in ED.
69 6747
3353
63 58
37 31 42
2004/2005 2005/2006 2006/2007 2007/2008 2008/2009
%Yes %No
Indicator Yes No
2008/2009, n = 59 28 31
2007/2008, n = 89 60 29
2006/2007, n = 81 47 34
2005/2006, n = 72 50 22
2004/2005, n = 79 50 29
This past year the compliance has decreased in this area. Teaching and education sessions will hopefully help to increase compliance of this indicator.
ACH Trauma Quality Indicators (ISS>12) 2008/2009
18
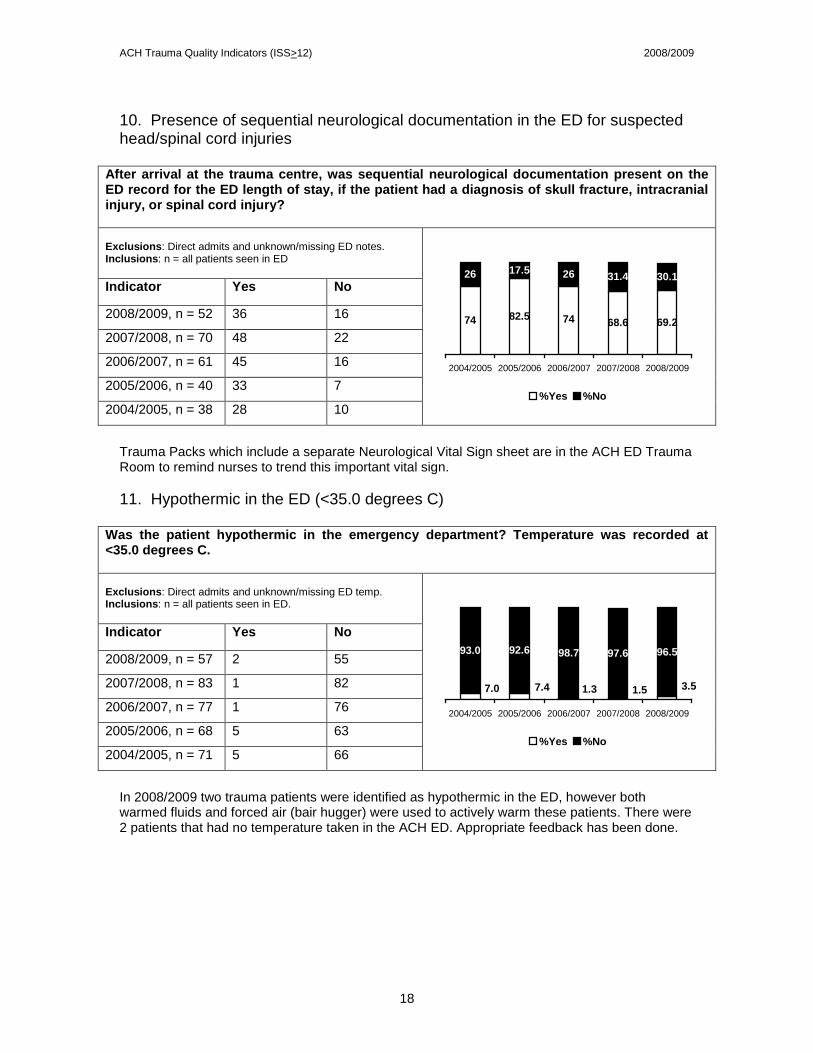
10. Presence of sequential neurological documentation in the ED for suspected head/spinal cord injuries
After arrival at the trauma centre, was sequential neurological documentation present on the ED record for the ED length of stay, if the patient had a diagnosis of skull fracture, intracranial injury, or spinal cord injury? Exclusions: Direct admits and unknown/missing ED notes. Inclusions: n = all patients seen in ED
82.5 68.6 69.2
31.4 30.1
74 74
26 17.5 26
2004/2005 2005/2006 2006/2007 2007/2008 2008/2009
%Yes %No
Indicator Yes No
2008/2009, n = 52 36 16
2007/2008, n = 70 48 22
2006/2007, n = 61 45 16
2005/2006, n = 40 33 7
2004/2005, n = 38 28 10
Trauma Packs which include a separate Neurological Vital Sign sheet are in the ACH ED Trauma Room to remind nurses to trend this important vital sign. 11. Hypothermic in the ED (<35.0 degrees C)
Was the patient hypothermic in the emergency department? Temperature was recorded at <35.0 degrees C. Exclusions: Direct admits and unknown/missing ED temp. Inclusions: n = all patients seen in ED.
97.6 96.5
3.51.57.47.0 1.3
93.0 92.6 98.7
2004/2005 2005/2006 2006/2007 2007/2008 2008/2009
%Yes %No
Indicator Yes No
2008/2009, n = 57 2 55
2007/2008, n = 83 1 82
2006/2007, n = 77 1 76
2005/2006, n = 68 5 63
2004/2005, n = 71 5 66
In 2008/2009 two trauma patients were identified as hypothermic in the ED, however both warmed fluids and forced air (bair hugger) were used to actively warm these patients. There were 2 patients that had no temperature taken in the ACH ED. Appropriate feedback has been done.
ACH Trauma Quality Indicators (ISS>12) 2008/2009
19
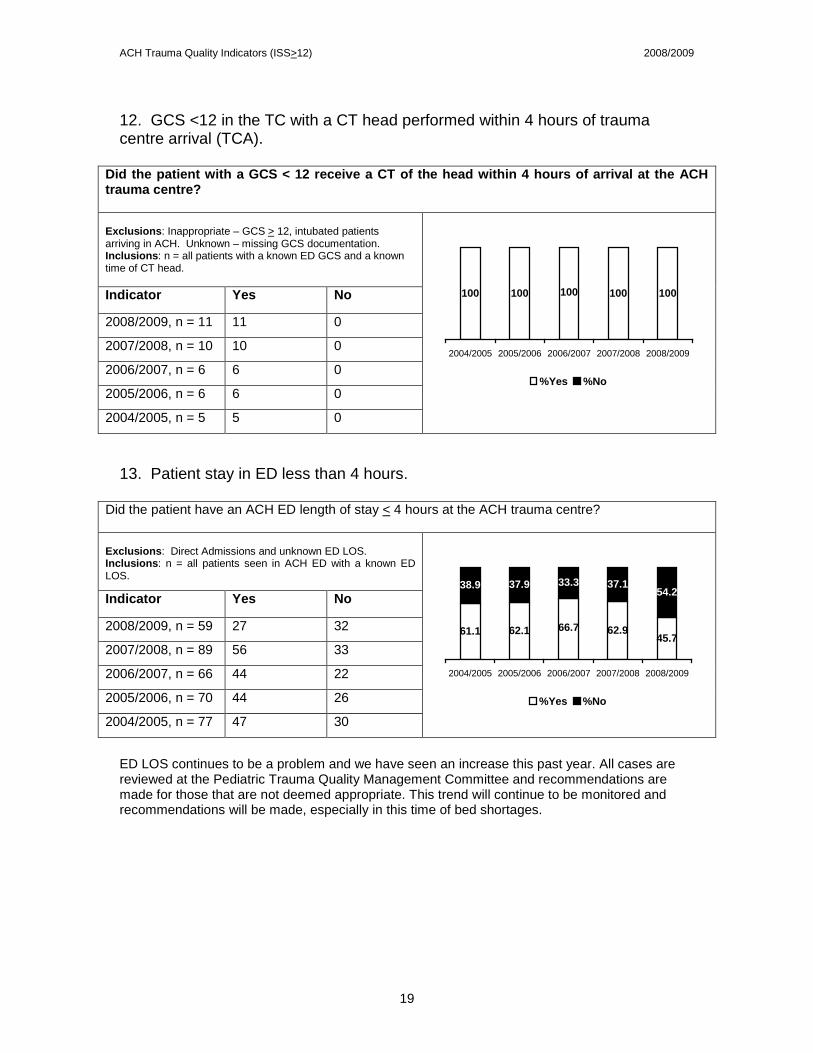
12. GCS <12 in the TC with a CT head performed within 4 hours of trauma centre arrival (TCA).
Did the patient with a GCS < 12 receive a CT of the head within 4 hours of arrival at the ACH trauma centre? Exclusions: Inappropriate – GCS > 12, intubated patients arriving in ACH. Unknown – missing GCS documentation. Inclusions: n = all patients with a known ED GCS and a known time of CT head.
100 100100100 100
2004/2005 2005/2006 2006/2007 2007/2008 2008/2009
%Yes %No
Indicator Yes No
2008/2009, n = 11 11 0
2007/2008, n = 10 10 0
2006/2007, n = 6 6 0
2005/2006, n = 6 6 0
2004/2005, n = 5 5 0
13. Patient stay in ED less than 4 hours.
Did the patient have an ACH ED length of stay < 4 hours at the ACH trauma centre? Exclusions: Direct Admissions and unknown ED LOS. Inclusions: n = all patients seen in ACH ED with a known ED LOS.
62.1 62.945.7
37.154.2
61.1 66.7
38.9 37.9 33.3
2004/2005 2005/2006 2006/2007 2007/2008 2008/2009
%Yes %No
Indicator Yes No
2008/2009, n = 59 27 32
2007/2008, n = 89 56 33
2006/2007, n = 66 44 22
2005/2006, n = 70 44 26
2004/2005, n = 77 47 30
ED LOS continues to be a problem and we have seen an increase this past year. All cases are reviewed at the Pediatric Trauma Quality Management Committee and recommendations are made for those that are not deemed appropriate. This trend will continue to be monitored and recommendations will be made, especially in this time of bed shortages.
ACH Trauma Quality Indicators (ISS>12) 2008/2009
20
Definitive care:
14. Admission to a surgeon or intensivist.
Was the patient admitted to a surgeon or an intensivist at the ACH trauma centre? Exclusions: ED deaths. Inclusions: n = all patients admitted to ACH Trauma Centre.
77.9 88.8 90.5
11.2 9.5
81.9 80.0
18.1 22.1 20.0
2004/2005 2005/2006 2006/2007 2007/2008 2008/2009
%Yes %No
Indicator Yes No
2008/2009, n = 74 67 7
2007/2008, n = 89 79 10
2006/2007, n = 90 72 18
2005/2006, n = 86 67 19
2004/2005, n = 83 68 15
Four of the seven patients that were admitted under the Pediatricians were cases of non-accidental trauma, which we feel is best managed by that team. One was a burn patient admitted under their care with plastics involvement. The sixth patient was initially admitted to the Pediatric service, but was transferred to the more appropriate service within 24 hours. The last patient was a direct admission for pediatric rehabilitation. 15. Craniotomy within 4 hours after TCA with unstable epidural/subdural hematoma.
If the patient had an epidural or subdural brain hematoma, was a craniotomy performed within 4 hours of arrival at ACH trauma centre? Exclusions: Inappropriate – all patients without epidural or subdural hematoma. Inclusions: n = all patients with epidural or subdural hematoma where operative management was the planned intervention.
75100 100 100 100
25
2004/2005 2005/2006 2006/2007 2007/2008 2008/2009
%Yes %No
Indicator Yes No
2008/2009, n = 3 3 0
2007/2008, n = 3 3 0
2006/2007, n = 4 4 0
2005/2006, n = 1 1 0
2004/2005, n = 8 6 2
ACH Trauma Quality Indicators (ISS>12) 2008/2009
21
16. Missed cervical spine injury after 48 hours from TCA without maintaining spinal precautions.
Did the patient have a missed c-spine injury with spinal precautions removed at the ACH trauma centre? Exclusions: ED deaths. Inclusions: n = all patients admitted to ACH Trauma Centre.
100 100100 100 100
2004/2005 2005/2006 2006/2007 2007/2008 2008/2009
%Yes %No
Indicator Yes No
2008/2009, n = 74 0 74
2007/2008, n = 94 0 94
2006/2007, n = 90 0 90
2005/2006, n = 86 0 86
2004/2005, n = 83 0 83
17. Any laparotomy procedure performed.
Did the patient require a laparotomy? Exclusions: None Inclusions: n = all major trauma patients.
95.5 95.9
4.14.51.14.62.3
97.7 95.4 98.9
2004/2005 2005/2006 2006/2007 2007/2008 2008/2009
%Yes %No
Indicator Yes No
2008/2009, n = 74 3 71
2007/2008, n = 97 4 93
2006/2007, n = 91 1 90
2005/2006, n = 87 4 83
2004/2005, n = 88 2 86
In 2008/2009, 3 patients required a laparotomy due to hemodynamic instability. This continues to reflect the current conservative and non-operative approach of pediatric patients with solid organ injuries.
ACH Trauma Quality Indicators (ISS>12) 2008/2009
22
18. Femur fracture to the OR within 24 hours of TCA.
Did the patient have operative management of the femur fracture within 24 hours of arrival at ACH trauma centre? Exclusions: No femur fracture or no surgical intervention planned. Inclusions: n = all patients requiring operative management of femur fracture.
50
100
50
6075 80
25 4020
2004/2005 2005/2006 2006/2007 2007/2008 2008/2009
%Yes %No
Indicator Yes No
2008/2009, n = 3 3 0
2007/2008, n= 4 2 2
2006/2007, n = 5 1 4
2005/2006, n = 5 3 2
2004/2005, n = 8 6 2
19. Open long bone fracture to the OR after 6-12 hours from TCA (depending on the severity of the fracture).
Did the patient with open long bone fracture have operative management performed within 6 hours (grade 3) or 12 hours (grade 1, 2) of arrival to ACH trauma centre? The long bones include the radius, ulna, humerus, tibia, femur and fibula. Exclusions: No open long bone fractures; patients with open long bone #s but too unstable for operative repair within the timeframe; patients with open long bone #s who died within the timeframe. Inclusions: n = all patients requiring operative management of open fracture where grade of fracture is known.
100100
00 0
2004/2005 2005/2006 2006/2007 2007/2008 2008/2009
%Yes %No
Indicator Yes No
2008/2009, n = 0 0 0
2007/2008, n = 1 1 0
2006/2007, n = 0 0 0
2005/2006, n = 0 0 0
2004/2005, n = 2 2 0
ACH Trauma Quality Indicators (ISS>12) 2008/2009
23
20. Unplanned return to the OR within 48 hours of initial procedure.
Did the patient have an unplanned return to the operating room at the ACH trauma centre? Exclusions: No operating room visit. Inclusions: n = all patients with at least one operating room visit.
96.3 100
4.305.9 3.7 0
95.710094.1
2004/2005 2005/2006 2006/2007 2007/2008 2008/2009
%Yes %No
Indicator Yes No
2008/2009, n = 26 0 26
2007/2008, n = 27 1 26
2006/2007, n = 23 1 22
2005/2006, n = 28 0 28
2004/2005, n = 34 2 32
In 2008/2009 there were no unplanned returns to the OR. 21. Missed injuries identified after 48 hours from TCA.
Did the patient have a delayed diagnosis or missed injury at the ACH trauma centre? Exclusions: ED deaths. Inclusions: n = all patients admitted to ACH Trauma Centre.
100 100
0013.6 0
96.4 99 100
2004/2005 2005/2006 2006/2007 2007/2008 2008/2009
%Yes %No
Indicator Yes No
2008/2009, n = 74 0 74
2007/2008, n = 94 0 94
2006/2007, n = 90 0 90
2005/2006, n = 86 1 85
2004/2005, n = 83 3 80
In 2008/2009 there were no patients who had a delayed diagnosis or missed injury. The In-patient Trauma Service performs a tertiary trauma assessment/survey on all major trauma patients within 24 hours of admission. This has ensured there are no missed injuries.
ACH Trauma Quality Indicators (ISS>12) 2008/2009
24
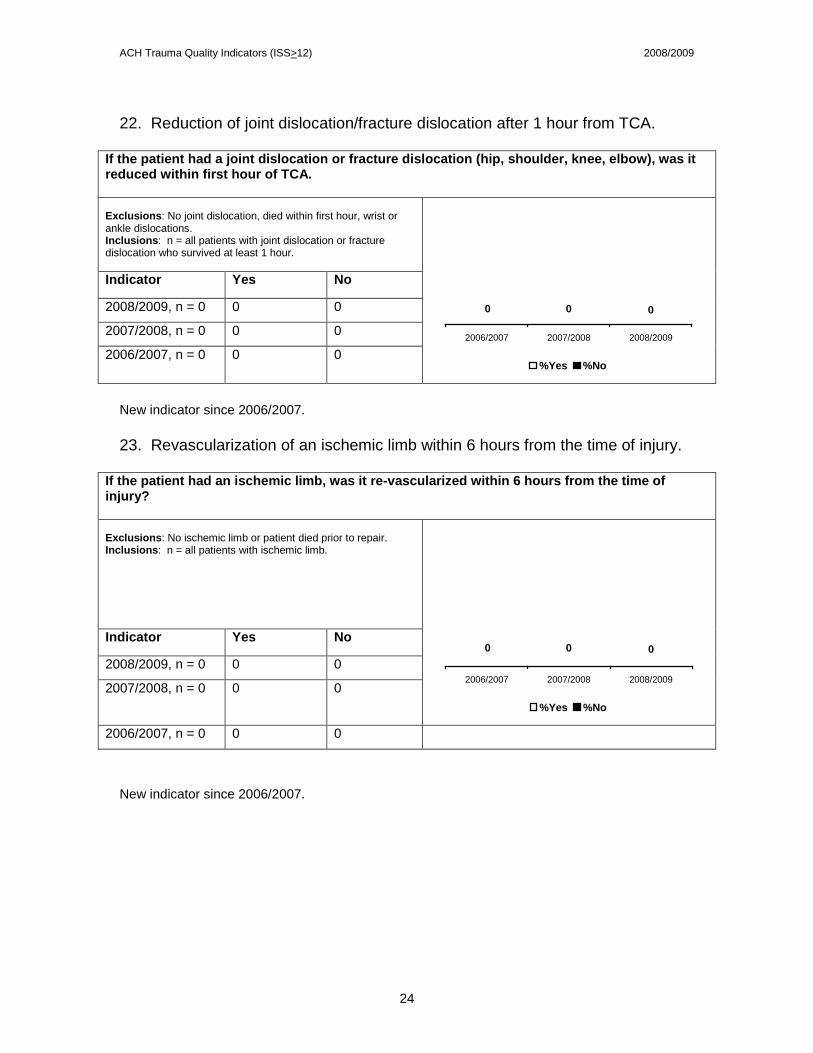
22. Reduction of joint dislocation/fracture dislocation after 1 hour from TCA.
If the patient had a joint dislocation or fracture dislocation (hip, shoulder, knee, elbow), was it reduced within first hour of TCA. Exclusions: No joint dislocation, died within first hour, wrist or ankle dislocations. Inclusions: n = all patients with joint dislocation or fracture dislocation who survived at least 1 hour.
000
2006/2007 2007/2008 2008/2009
%Yes %No
Indicator Yes No
2008/2009, n = 0 0 0
2007/2008, n = 0 0 0
2006/2007, n = 0 0 0
New indicator since 2006/2007. 23. Revascularization of an ischemic limb within 6 hours from the time of injury.
If the patient had an ischemic limb, was it re-vascularized within 6 hours from the time of injury? Exclusions: No ischemic limb or patient died prior to repair. Inclusions: n = all patients with ischemic limb.
000
2006/2007 2007/2008 2008/2009
%Yes %No
Indicator Yes No
2008/2009, n = 0 0 0
2007/2008, n = 0 0 0
2006/2007, n = 0 0 0 New indicator since 2006/2007.
ACH Trauma Quality Indicators (ISS>12) 2008/2009
25
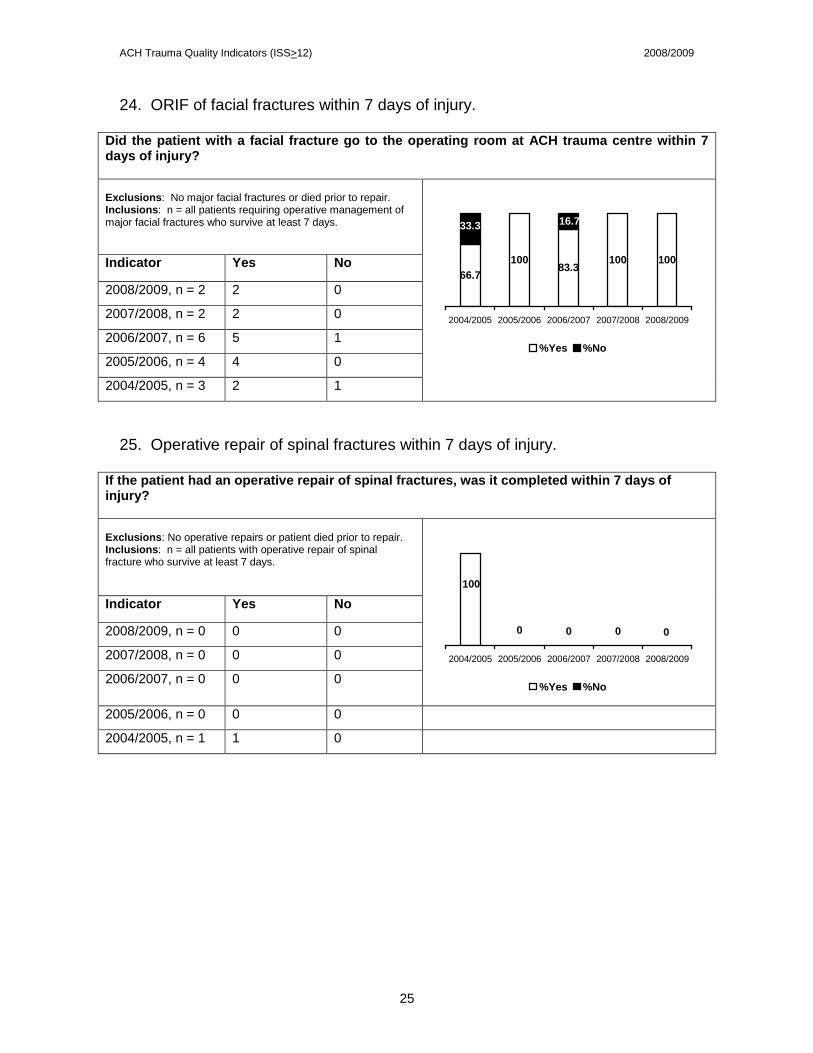
24. ORIF of facial fractures within 7 days of injury.
Did the patient with a facial fracture go to the operating room at ACH trauma centre within 7 days of injury? Exclusions: No major facial fractures or died prior to repair. Inclusions: n = all patients requiring operative management of major facial fractures who survive at least 7 days.
66.7100
83.3100 100
16.733.3
2004/2005 2005/2006 2006/2007 2007/2008 2008/2009
%Yes %No
Indicator Yes No
2008/2009, n = 2 2 0
2007/2008, n = 2 2 0
2006/2007, n = 6 5 1
2005/2006, n = 4 4 0
2004/2005, n = 3 2 1
25. Operative repair of spinal fractures within 7 days of injury.
If the patient had an operative repair of spinal fractures, was it completed within 7 days of injury? Exclusions: No operative repairs or patient died prior to repair. Inclusions: n = all patients with operative repair of spinal fracture who survive at least 7 days.
0000
100
2004/2005 2005/2006 2006/2007 2007/2008 2008/2009
%Yes %No
Indicator Yes No
2008/2009, n = 0 0 0
2007/2008, n = 0 0 0
2006/2007, n = 0 0 0
2005/2006, n = 0 0 0 2004/2005, n = 1 1 0
ACH Trauma Quality Indicators (ISS>12) 2008/2009
26
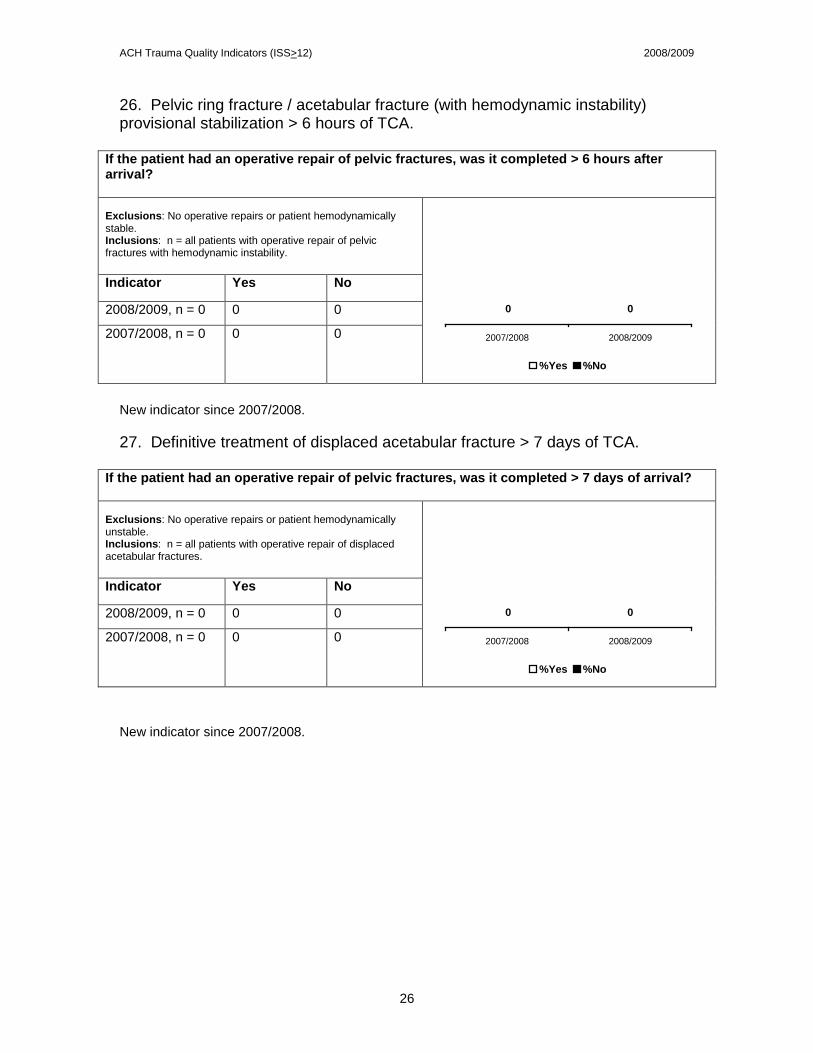
26. Pelvic ring fracture / acetabular fracture (with hemodynamic instability) provisional stabilization > 6 hours of TCA.
If the patient had an operative repair of pelvic fractures, was it completed > 6 hours after arrival? Exclusions: No operative repairs or patient hemodynamically stable. Inclusions: n = all patients with operative repair of pelvic fractures with hemodynamic instability.
00
2007/2008 2008/2009
%Yes %No
Indicator Yes No
2008/2009, n = 0 0 0
2007/2008, n = 0 0 0
New indicator since 2007/2008. 27. Definitive treatment of displaced acetabular fracture > 7 days of TCA.
If the patient had an operative repair of pelvic fractures, was it completed > 7 days of arrival? Exclusions: No operative repairs or patient hemodynamically unstable. Inclusions: n = all patients with operative repair of displaced acetabular fractures.
00
2007/2008 2008/2009
%Yes %No
Indicator Yes No
2008/2009, n = 0 0 0
2007/2008, n = 0 0 0
New indicator since 2007/2008.
ACH Trauma Quality Indicators (ISS>12) 2008/2009
27
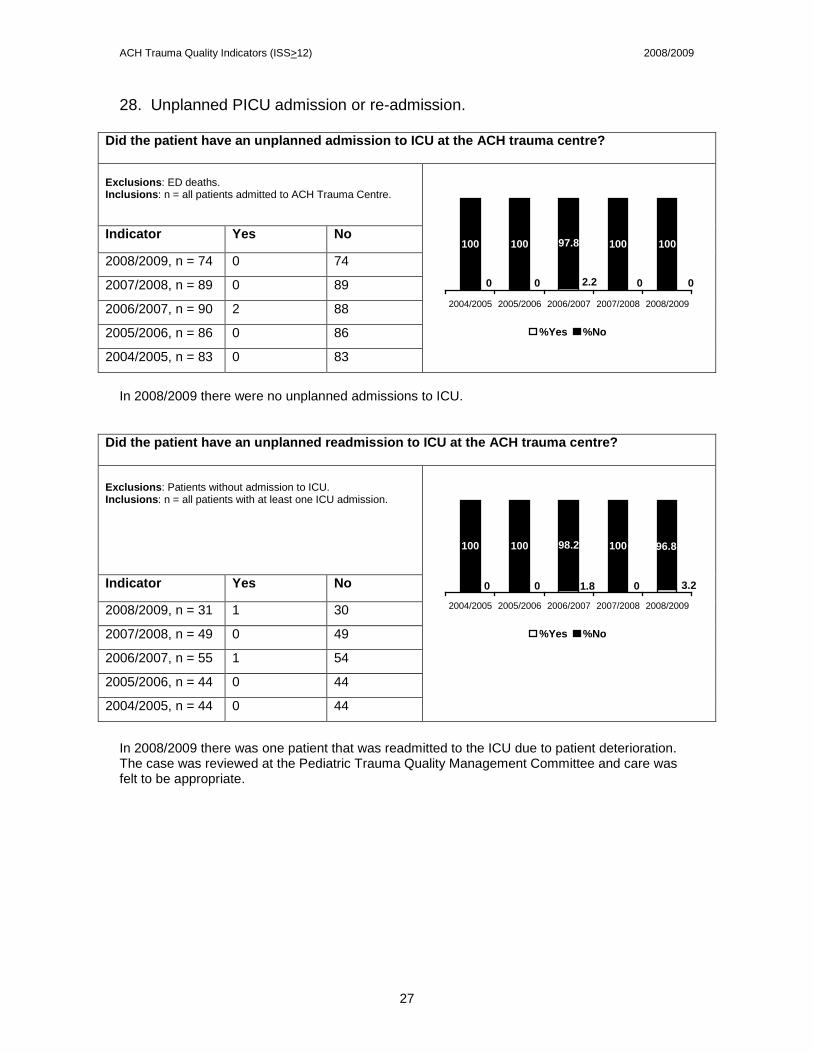
28. Unplanned PICU admission or re-admission.
Did the patient have an unplanned admission to ICU at the ACH trauma centre? Exclusions: ED deaths. Inclusions: n = all patients admitted to ACH Trauma Centre.
100 100
0 000 2.2
100 100 97.8
2004/2005 2005/2006 2006/2007 2007/2008 2008/2009
%Yes %No
Indicator Yes No
2008/2009, n = 74 0 74
2007/2008, n = 89 0 89
2006/2007, n = 90 2 88
2005/2006, n = 86 0 86
2004/2005, n = 83 0 83
In 2008/2009 there were no unplanned admissions to ICU.
Did the patient have an unplanned readmission to ICU at the ACH trauma centre? Exclusions: Patients without admission to ICU. Inclusions: n = all patients with at least one ICU admission.
100
01.800 3.2
96.8100 100 98.2
2004/2005 2005/2006 2006/2007 2007/2008 2008/2009
%Yes %No
Indicator Yes No
2008/2009, n = 31 1 30
2007/2008, n = 49 0 49
2006/2007, n = 55 1 54
2005/2006, n = 44 0 44
2004/2005, n = 44 0 44
In 2008/2009 there was one patient that was readmitted to the ICU due to patient deterioration. The case was reviewed at the Pediatric Trauma Quality Management Committee and care was felt to be appropriate.
ACH Trauma Quality Indicators (ISS>12) 2008/2009
28
Outcome:
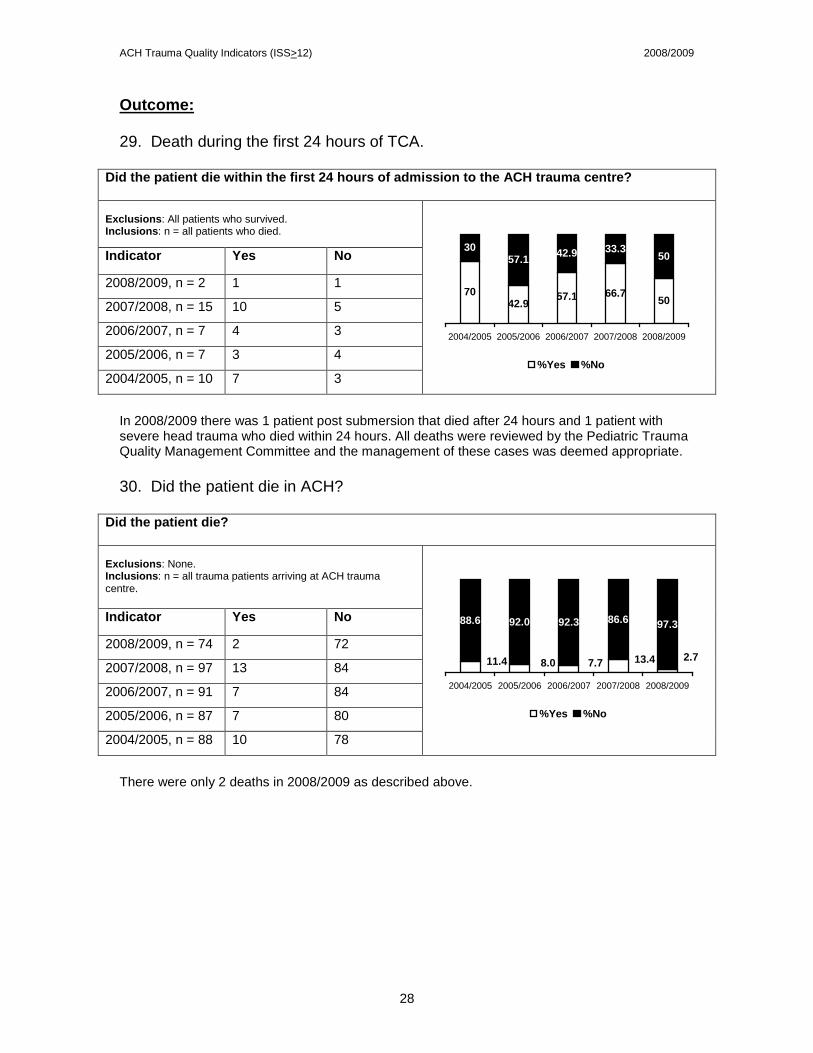
29. Death during the first 24 hours of TCA.
Did the patient die within the first 24 hours of admission to the ACH trauma centre? Exclusions: All patients who survived. Inclusions: n = all patients who died.
42.966.7 50
33.350
70 57.1
3057.1 42.9
2004/2005 2005/2006 2006/2007 2007/2008 2008/2009
%Yes %No
Indicator Yes No
2008/2009, n = 2 1 1
2007/2008, n = 15 10 5
2006/2007, n = 7 4 3
2005/2006, n = 7 3 4
2004/2005, n = 10 7 3
In 2008/2009 there was 1 patient post submersion that died after 24 hours and 1 patient with severe head trauma who died within 24 hours. All deaths were reviewed by the Pediatric Trauma Quality Management Committee and the management of these cases was deemed appropriate. 30. Did the patient die in ACH?
Did the patient die? Exclusions: None. Inclusions: n = all trauma patients arriving at ACH trauma centre.
86.6 97.3
2.713.48.011.4 7.7
88.6 92.0 92.3
2004/2005 2005/2006 2006/2007 2007/2008 2008/2009
%Yes %No
Indicator Yes No
2008/2009, n = 74 2 72
2007/2008, n = 97 13 84
2006/2007, n = 91 7 84
2005/2006, n = 87 7 80
2004/2005, n = 88 10 78
There were only 2 deaths in 2008/2009 as described above.
ACH Major Trauma Statistics (ISS>12) 2008/2009
29
APPENDIX B Major Trauma Statistics for 2008/2009
1. General Overview Age Gender
2. Etiology of Injuries Mechanism of Injury Type of Injury Place of Injury 3. Referrals Referrals from Health Regions Mode of Transportation to ACH Ground vs Air Transport ED Arrival By Month, Day and Time of Arrival Disposition from the Emergency Department
4. Patient Care Management Diagnostic Imaging Statistics Day of Week and Time of CT Non-Operative Procedures Performed in ED Surgical Procedures OR Data by Service Time to OR Length of Stay Admitting Physician Service Hospital Discharge Destination Outcomes by Age and ISS TRISS Pre-Charts
ACH Major Trauma Statistics (ISS>12) 2008/2009
30
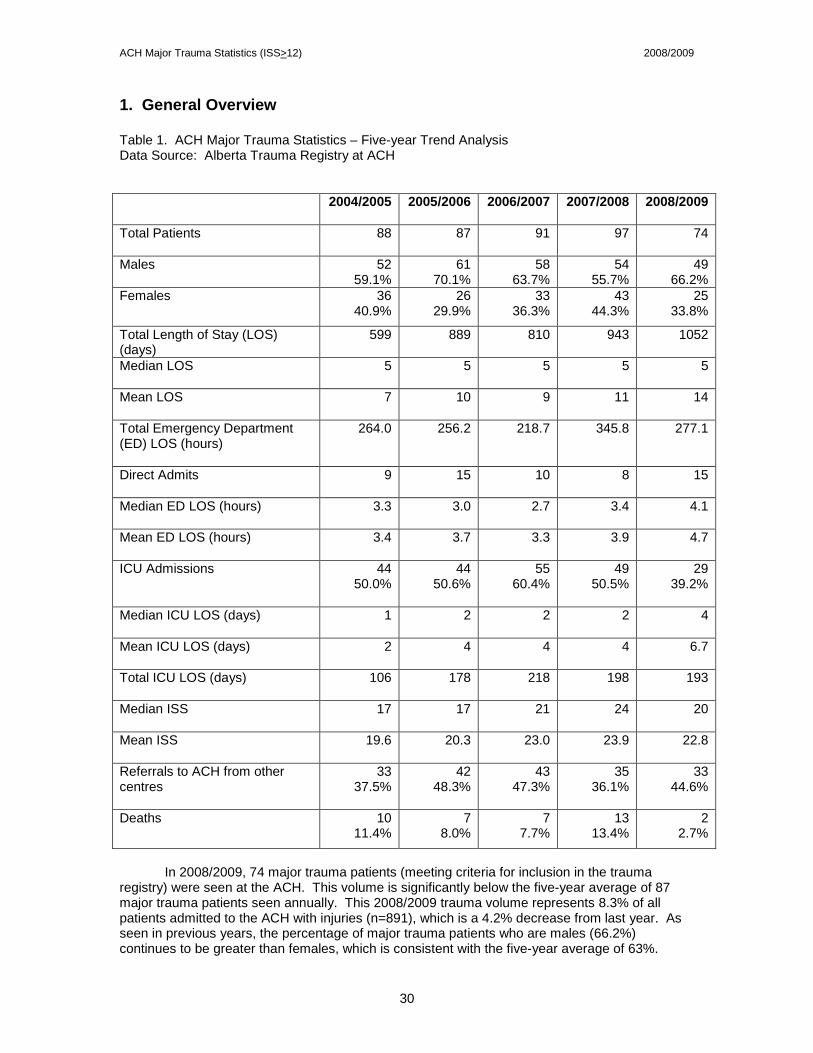
1. General Overview Table 1. ACH Major Trauma Statistics – Five-year Trend Analysis Data Source: Alberta Trauma Registry at ACH
2004/2005 2005/2006 2006/2007
2007/2008 2008/2009
Total Patients
88 87 91 97 74
Males
52 59.1%
61 70.1%
58 63.7%
54 55.7%
49 66.2%
Females
36 40.9%
26 29.9%
33 36.3%
43 44.3%
25 33.8%
Total Length of Stay (LOS) (days)
599 889 810 943 1052
Median LOS
5 5 5 5 5
Mean LOS
7 10 9 11 14
Total Emergency Department (ED) LOS (hours)
264.0 256.2 218.7 345.8 277.1
Direct Admits
9 15 10 8 15
Median ED LOS (hours)
3.3 3.0 2.7 3.4 4.1
Mean ED LOS (hours)
3.4 3.7 3.3 3.9 4.7
ICU Admissions
44 50.0%
44 50.6%
55 60.4%
49 50.5%
29 39.2%
Median ICU LOS (days)
1 2 2 2 4
Mean ICU LOS (days)
2 4 4 4 6.7
Total ICU LOS (days)
106 178 218 198 193
Median ISS
17 17 21 24 20
Mean ISS
19.6 20.3 23.0 23.9 22.8
Referrals to ACH from other centres
33 37.5%
42 48.3%
43 47.3%
35 36.1%
33 44.6%
Deaths 10 11.4%
7 8.0%
7 7.7%
13 13.4%
2 2.7%
In 2008/2009, 74 major trauma patients (meeting criteria for inclusion in the trauma
registry) were seen at the ACH. This volume is significantly below the five-year average of 87 major trauma patients seen annually. This 2008/2009 trauma volume represents 8.3% of all patients admitted to the ACH with injuries (n=891), which is a 4.2% decrease from last year. As seen in previous years, the percentage of major trauma patients who are males (66.2%) continues to be greater than females, which is consistent with the five-year average of 63%.
ACH Major Trauma Statistics (ISS>12) 2008/2009
31
Major trauma patients referred in from other centers represented 44.6% of the major trauma volume for 2008/2009. This is consistent with the five-year average of 43%.
Length of stay for major trauma patients ranged between 1 and 1052 days. Mean LOS of 14 days is greater than the five-year trend of 10.2. Median LOS of 5 days is consistent with the five-year trend. The total ED LOS was 277.1 hours, down 25% from last year, but higher than the five-year average of 272 hours. Both the mean and median LOS was higher than the five-year average.
There was an 11.3% drop in ICU admissions from 2007/08 to 2008/09. Overall, 39.2% of major trauma patients were admitted to the ICU, which is significantly lower than the five-year average of 50.2%. Total ICU LOS was 193 days, which is higher than the five-year average of 179. Median and mean ICU LOS were higher with the five-year average of 2.2 and 4.2 respectively.
Both the mean (20) and median (22.8) ISS for major trauma patient from 2008/2009 were higher than the five-year averages of 19.8 (mean) and 21.9 (median). This may explain why less patients overall were admitted to the ICU but had longer stays.
A total of 2 deaths were seen in major trauma patients in 2008/2009. This represents 2.7% of major trauma volume, and is lower than the five-year average of 8.6%.
ACH Major Trauma Statistics (ISS>12) 2008/2009
32
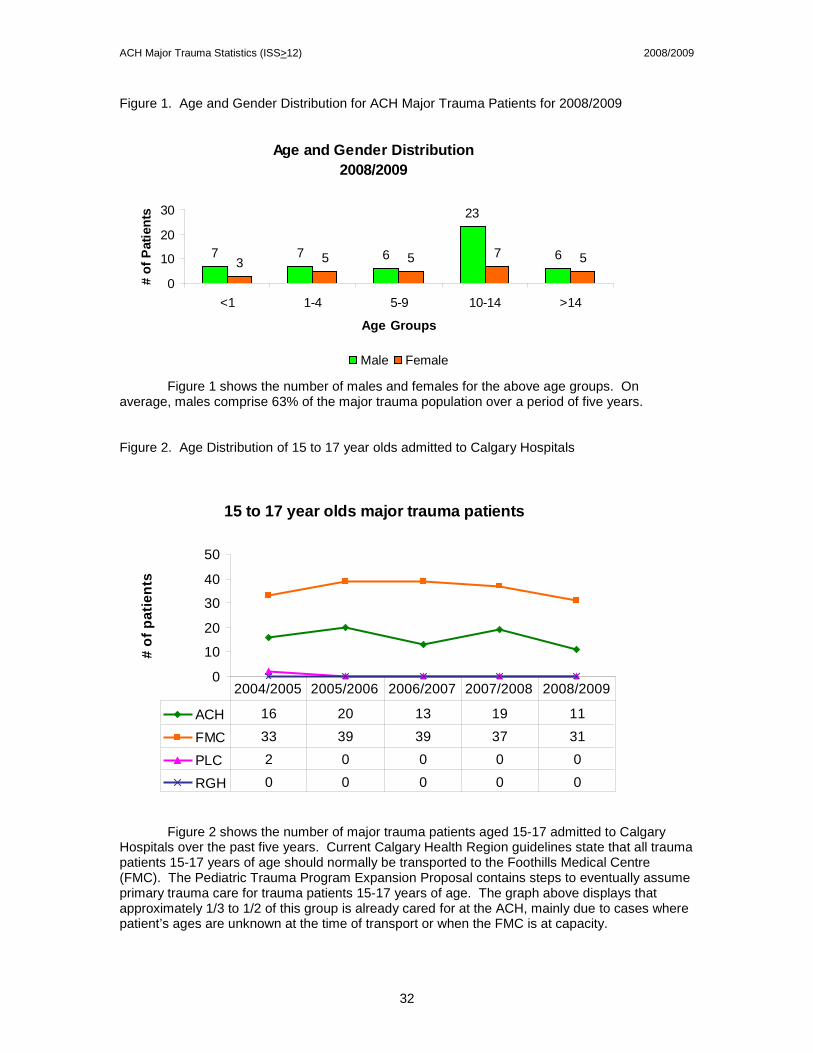
Figure 1. Age and Gender Distribution for ACH Major Trauma Patients for 2008/2009
Age and Gender Distribution2008/2009
7 7 6
23
63 5 5 7 5
0
10
20
30
<1 1-4 5-9 10-14 >14
Age Groups
# of
Pat
ient
s
Male Female
Figure 1 shows the number of males and females for the above age groups. On average, males comprise 63% of the major trauma population over a period of five years. Figure 2. Age Distribution of 15 to 17 year olds admitted to Calgary Hospitals
15 to 17 year olds major trauma patients
0
10
20
30
40
50
# of
pat
ient
s
ACH 16 20 13 19 11
FMC 33 39 39 37 31
PLC 2 0 0 0 0
RGH 0 0 0 0 0
2004/2005 2005/2006 2006/2007 2007/2008 2008/2009
Figure 2 shows the number of major trauma patients aged 15-17 admitted to Calgary Hospitals over the past five years. Current Calgary Health Region guidelines state that all trauma patients 15-17 years of age should normally be transported to the Foothills Medical Centre (FMC). The Pediatric Trauma Program Expansion Proposal contains steps to eventually assume primary trauma care for trauma patients 15-17 years of age. The graph above displays that approximately 1/3 to 1/2 of this group is already cared for at the ACH, mainly due to cases where patient’s ages are unknown at the time of transport or when the FMC is at capacity.
ACH Major Trauma Statistics (ISS>12) 2008/2009
33
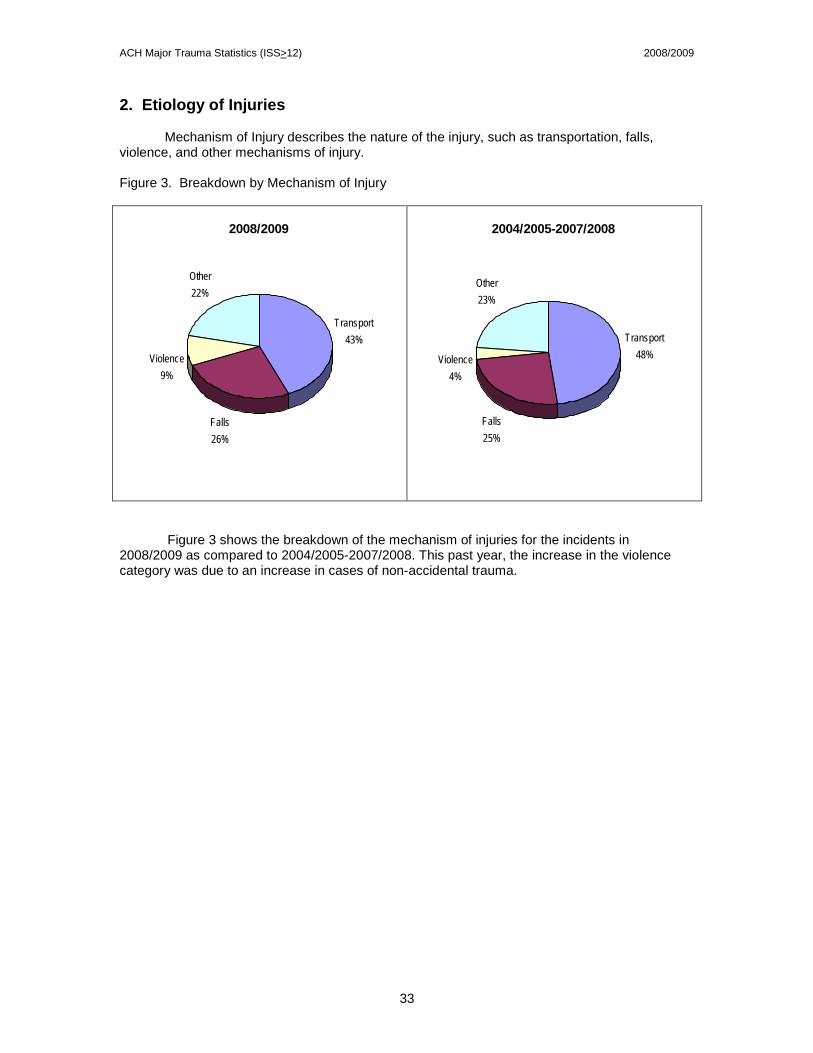
2. Etiology of Injuries
Mechanism of Injury describes the nature of the injury, such as transportation, falls, violence, and other mechanisms of injury. Figure 3. Breakdown by Mechanism of Injury
2008/2009
Falls26%
Violence9%
Other22%
Transport43%
2004/2005-2007/2008
Transport48%
Falls25%
Violence4%
Other23%
Figure 3 shows the breakdown of the mechanism of injuries for the incidents in 2008/2009 as compared to 2004/2005-2007/2008. This past year, the increase in the violence category was due to an increase in cases of non-accidental trauma.
ACH Major Trauma Statistics (ISS>12) 2008/2009
34
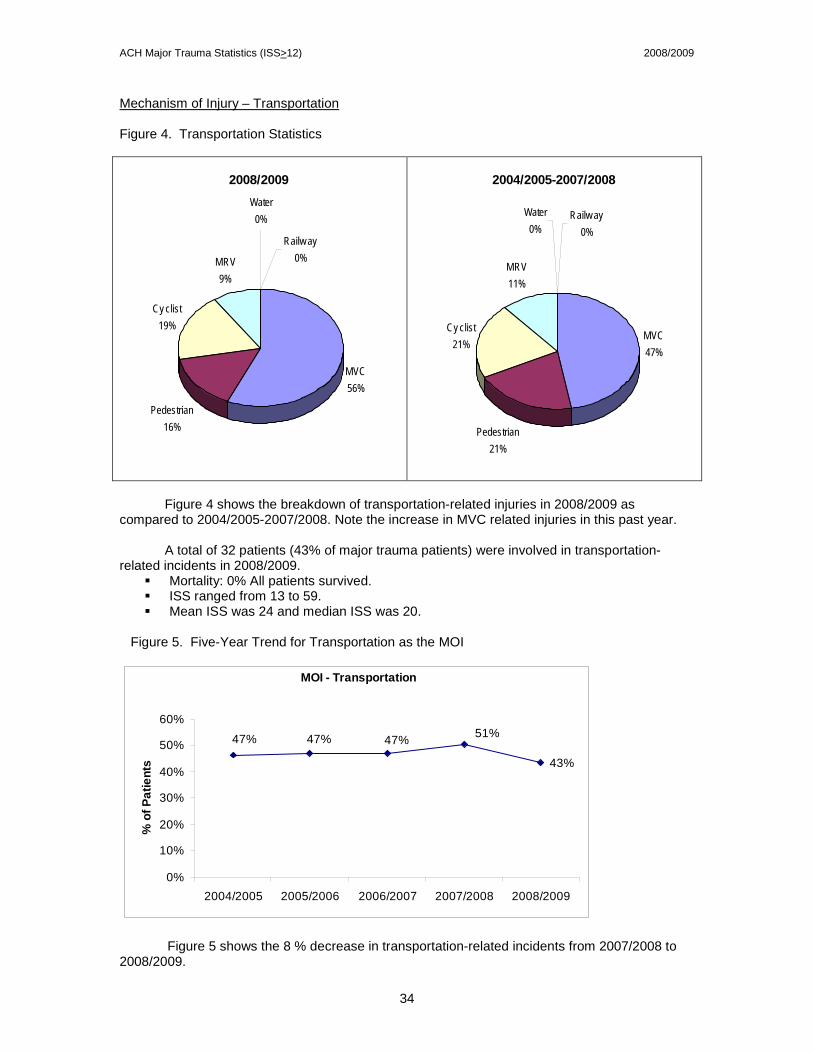
Mechanism of Injury – Transportation
Figure 4. Transportation Statistics
2008/2009
MVC56%
Cy clist19%
MRV9%
Pedestrian16%
Railw ay0%
Water0%
2004/2005-2007/2008
MVC47%
Cy clist21%
MRV11%
Pedestrian21%
Water0%
Railw ay0%
Figure 4 shows the breakdown of transportation-related injuries in 2008/2009 as compared to 2004/2005-2007/2008. Note the increase in MVC related injuries in this past year.
A total of 32 patients (43% of major trauma patients) were involved in transportation-related incidents in 2008/2009.
Mortality: 0% All patients survived. ISS ranged from 13 to 59. Mean ISS was 24 and median ISS was 20.
Figure 5. Five-Year Trend for Transportation as the MOI
MOI - Transportation
43%
51%47%47%47%
0%
10%
20%
30%
40%
50%
60%
2004/2005 2005/2006 2006/2007 2007/2008 2008/2009
% o
f Pat
ient
s
Figure 5 shows the 8 % decrease in transportation-related incidents from 2007/2008 to 2008/2009.
ACH Major Trauma Statistics (ISS>12) 2008/2009
35
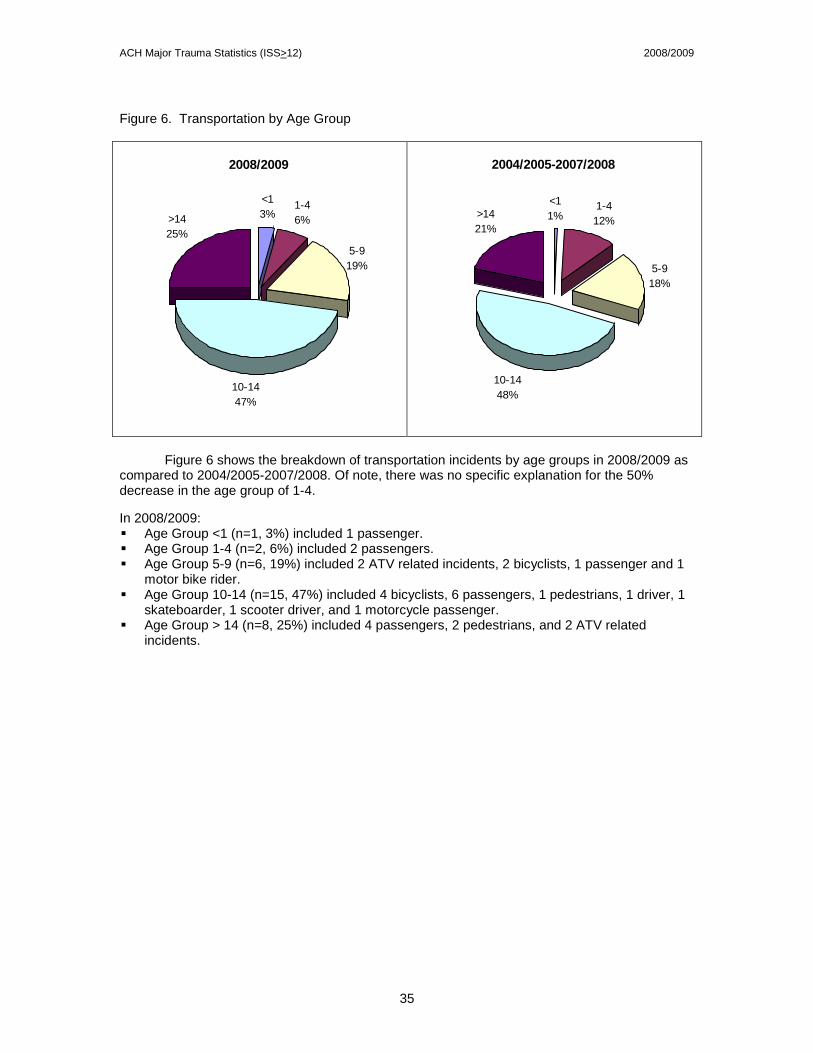
Figure 6. Transportation by Age Group
2008/2009
<13%
1-46%
5-919%
10-1447%
>1425%
2004/2005-2007/2008
<11%
1-412%
5-918%
10-1448%
>1421%
Figure 6 shows the breakdown of transportation incidents by age groups in 2008/2009 as compared to 2004/2005-2007/2008. Of note, there was no specific explanation for the 50% decrease in the age group of 1-4.
In 2008/2009: Age Group <1 (n=1, 3%) included 1 passenger. Age Group 1-4 (n=2, 6%) included 2 passengers. Age Group 5-9 (n=6, 19%) included 2 ATV related incidents, 2 bicyclists, 1 passenger and 1
motor bike rider. Age Group 10-14 (n=15, 47%) included 4 bicyclists, 6 passengers, 1 pedestrians, 1 driver, 1
skateboarder, 1 scooter driver, and 1 motorcycle passenger. Age Group > 14 (n=8, 25%) included 4 passengers, 2 pedestrians, and 2 ATV related
incidents.
ACH Major Trauma Statistics (ISS>12) 2008/2009
36
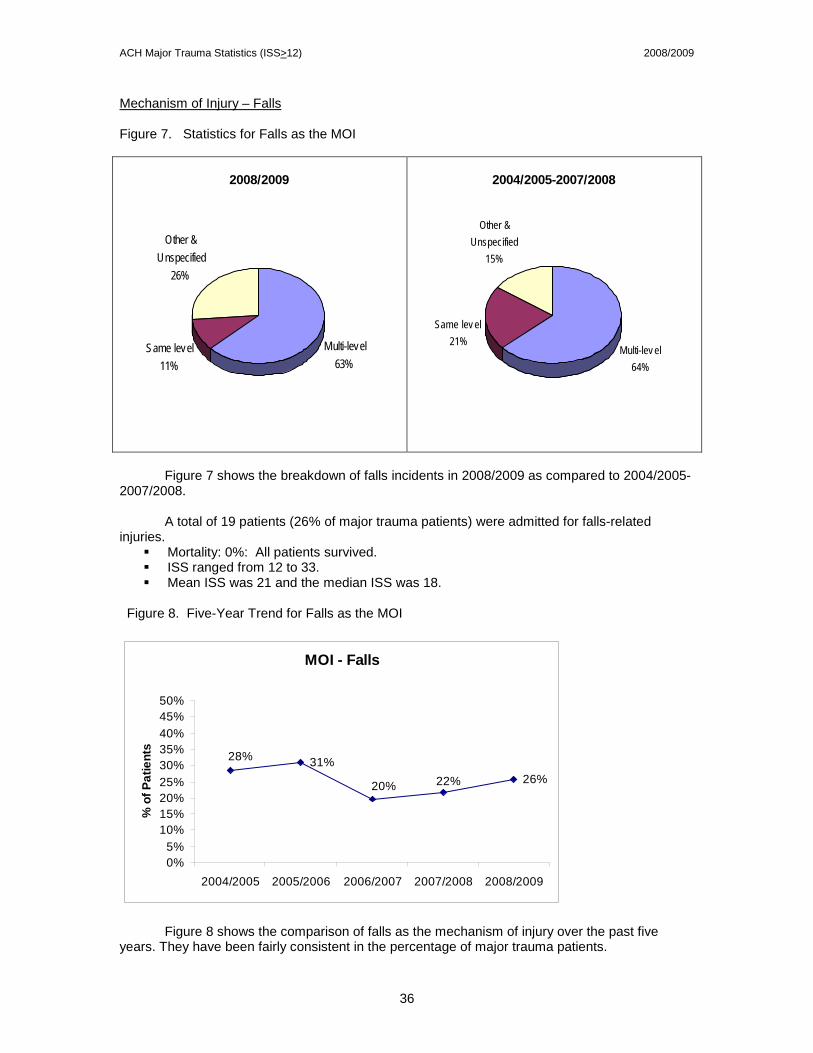
Mechanism of Injury – Falls
Figure 7. Statistics for Falls as the MOI
2008/2009
Multi-level63%
Same level11%
Other & Unspecified
26%
2004/2005-2007/2008
Multi-lev el 64%
Same lev el21%
Other & Unspecified
15%
Figure 7 shows the breakdown of falls incidents in 2008/2009 as compared to 2004/2005-2007/2008.
A total of 19 patients (26% of major trauma patients) were admitted for falls-related
injuries. Mortality: 0%: All patients survived. ISS ranged from 12 to 33. Mean ISS was 21 and the median ISS was 18.
Figure 8. Five-Year Trend for Falls as the MOI
MOI - Falls
31%26%22%20%
28%
0%5%
10%15%20%25%30%35%40%45%50%
2004/2005 2005/2006 2006/2007 2007/2008 2008/2009
% o
f Pat
ient
s
Figure 8 shows the comparison of falls as the mechanism of injury over the past five years. They have been fairly consistent in the percentage of major trauma patients.
ACH Major Trauma Statistics (ISS>12) 2008/2009
37
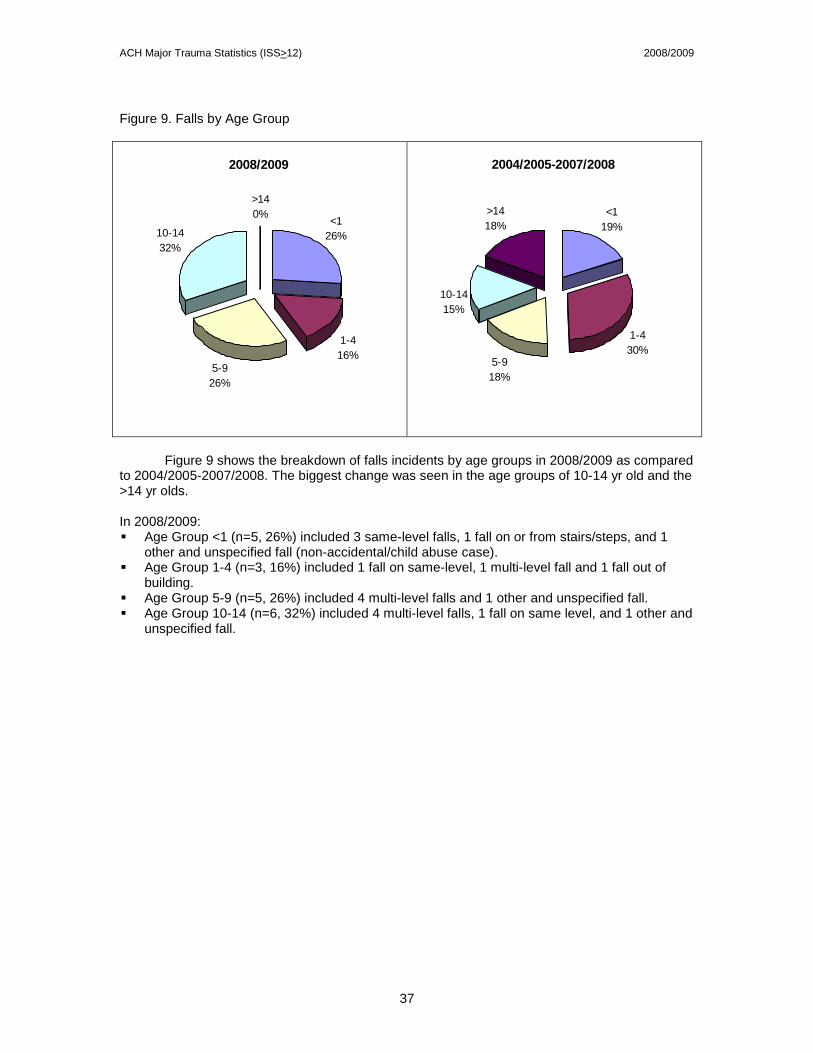
Figure 9. Falls by Age Group
2008/2009
<126%
1-416%
5-926%
10-1432%
>140%
2004/2005-2007/2008
<119%
1-430%
5-918%
10-1415%
>1418%
Figure 9 shows the breakdown of falls incidents by age groups in 2008/2009 as compared to 2004/2005-2007/2008. The biggest change was seen in the age groups of 10-14 yr old and the >14 yr olds.
In 2008/2009: Age Group <1 (n=5, 26%) included 3 same-level falls, 1 fall on or from stairs/steps, and 1
other and unspecified fall (non-accidental/child abuse case). Age Group 1-4 (n=3, 16%) included 1 fall on same-level, 1 multi-level fall and 1 fall out of
building. Age Group 5-9 (n=5, 26%) included 4 multi-level falls and 1 other and unspecified fall. Age Group 10-14 (n=6, 32%) included 4 multi-level falls, 1 fall on same level, and 1 other and
unspecified fall.
ACH Major Trauma Statistics (ISS>12) 2008/2009
38
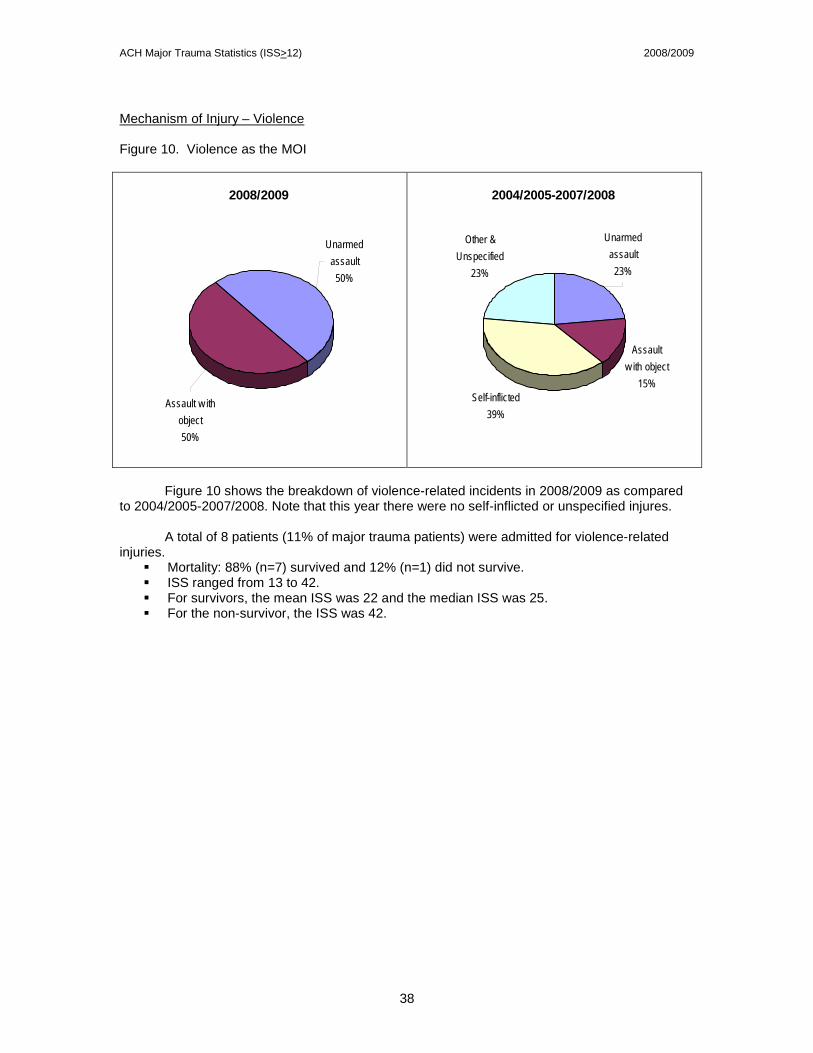
Mechanism of Injury – Violence
Figure 10. Violence as the MOI
2008/2009
Unarmed assault50%
Assault w ith object50%
2004/2005-2007/2008
Assault w ith object
15%Self-inflicted
39%
Other & Unspecified
23%
Unarmed assault23%
Figure 10 shows the breakdown of violence-related incidents in 2008/2009 as compared to 2004/2005-2007/2008. Note that this year there were no self-inflicted or unspecified injures.
A total of 8 patients (11% of major trauma patients) were admitted for violence-related
injuries. Mortality: 88% (n=7) survived and 12% (n=1) did not survive. ISS ranged from 13 to 42. For survivors, the mean ISS was 22 and the median ISS was 25. For the non-survivor, the ISS was 42.
ACH Major Trauma Statistics (ISS>12) 2008/2009
39
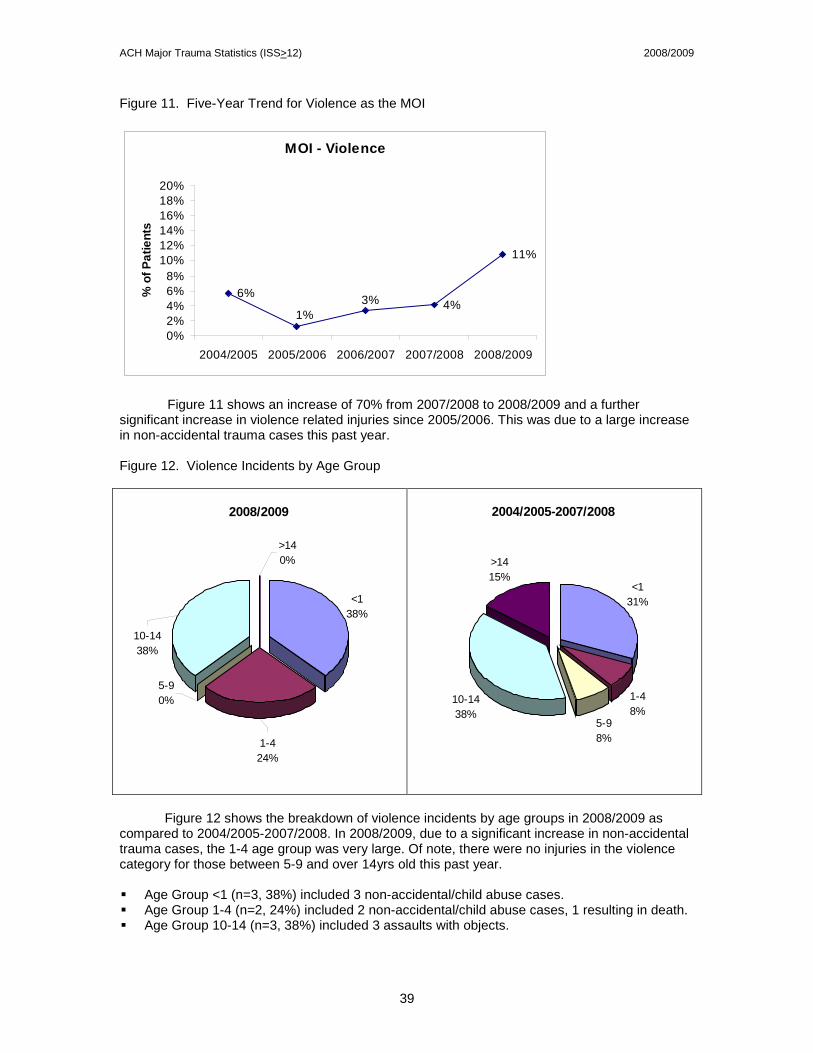
Figure 11. Five-Year Trend for Violence as the MOI
MOI - Violence
6%4%
11%
3%1%
0%2%4%6%8%
10%12%14%16%18%20%
2004/2005 2005/2006 2006/2007 2007/2008 2008/2009
% o
f Pat
ient
s
Figure 11 shows an increase of 70% from 2007/2008 to 2008/2009 and a further significant increase in violence related injuries since 2005/2006. This was due to a large increase in non-accidental trauma cases this past year. Figure 12. Violence Incidents by Age Group
2008/2009
10-1438%
>140%
<138%
1-424%
5-90%
2004/2005-2007/2008
<131%
1-48%
5-98%
10-1438%
>1415%
Figure 12 shows the breakdown of violence incidents by age groups in 2008/2009 as compared to 2004/2005-2007/2008. In 2008/2009, due to a significant increase in non-accidental trauma cases, the 1-4 age group was very large. Of note, there were no injuries in the violence category for those between 5-9 and over 14yrs old this past year.
Age Group <1 (n=3, 38%) included 3 non-accidental/child abuse cases. Age Group 1-4 (n=2, 24%) included 2 non-accidental/child abuse cases, 1 resulting in death. Age Group 10-14 (n=3, 38%) included 3 assaults with objects.
ACH Major Trauma Statistics (ISS>12) 2008/2009
40
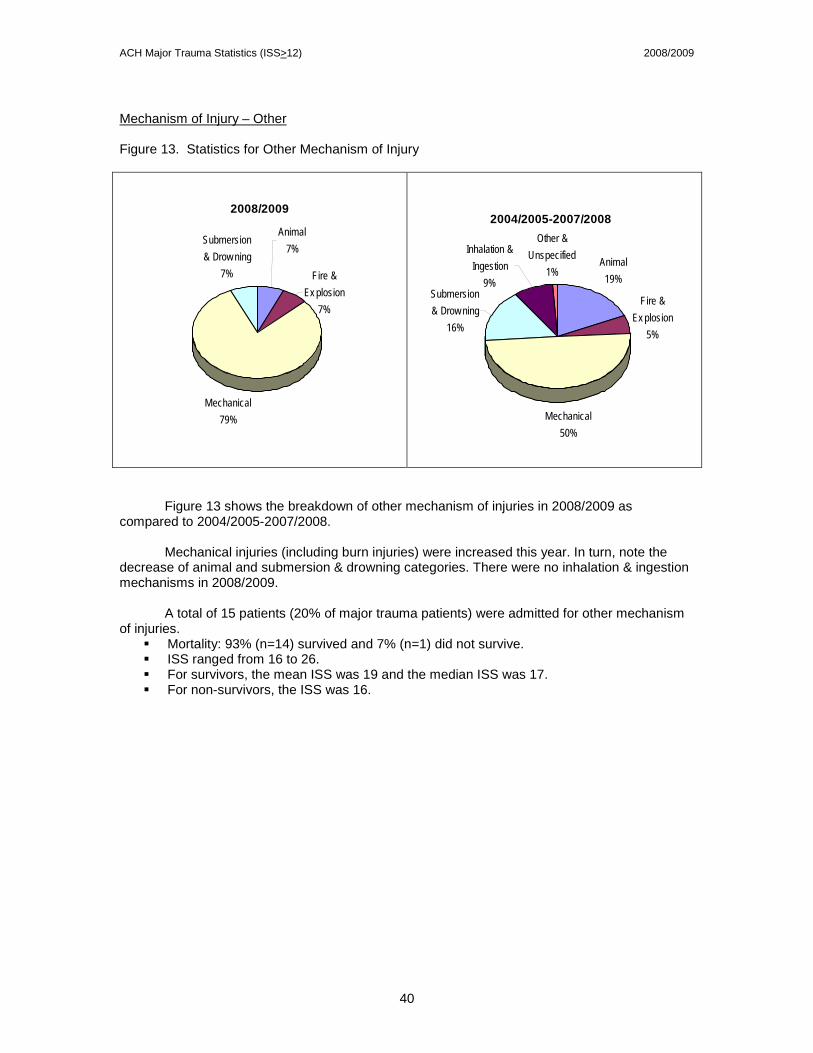
Mechanism of Injury – Other Figure 13. Statistics for Other Mechanism of Injury
2008/2009
Animal7%
Fire & Ex plosion
7%
Mechanical79%
Submersion & Drow ning
7%
2004/2005-2007/2008
Animal19%
Fire & Ex plosion
5%
Mechanical50%
Other & Unspecified
1%
Inhalation & Ingestion
9%Submersion & Drow ning
16%
Figure 13 shows the breakdown of other mechanism of injuries in 2008/2009 as compared to 2004/2005-2007/2008.
Mechanical injuries (including burn injuries) were increased this year. In turn, note the
decrease of animal and submersion & drowning categories. There were no inhalation & ingestion mechanisms in 2008/2009.
A total of 15 patients (20% of major trauma patients) were admitted for other mechanism
of injuries. Mortality: 93% (n=14) survived and 7% (n=1) did not survive. ISS ranged from 16 to 26. For survivors, the mean ISS was 19 and the median ISS was 17. For non-survivors, the ISS was 16.
ACH Major Trauma Statistics (ISS>12) 2008/2009
41
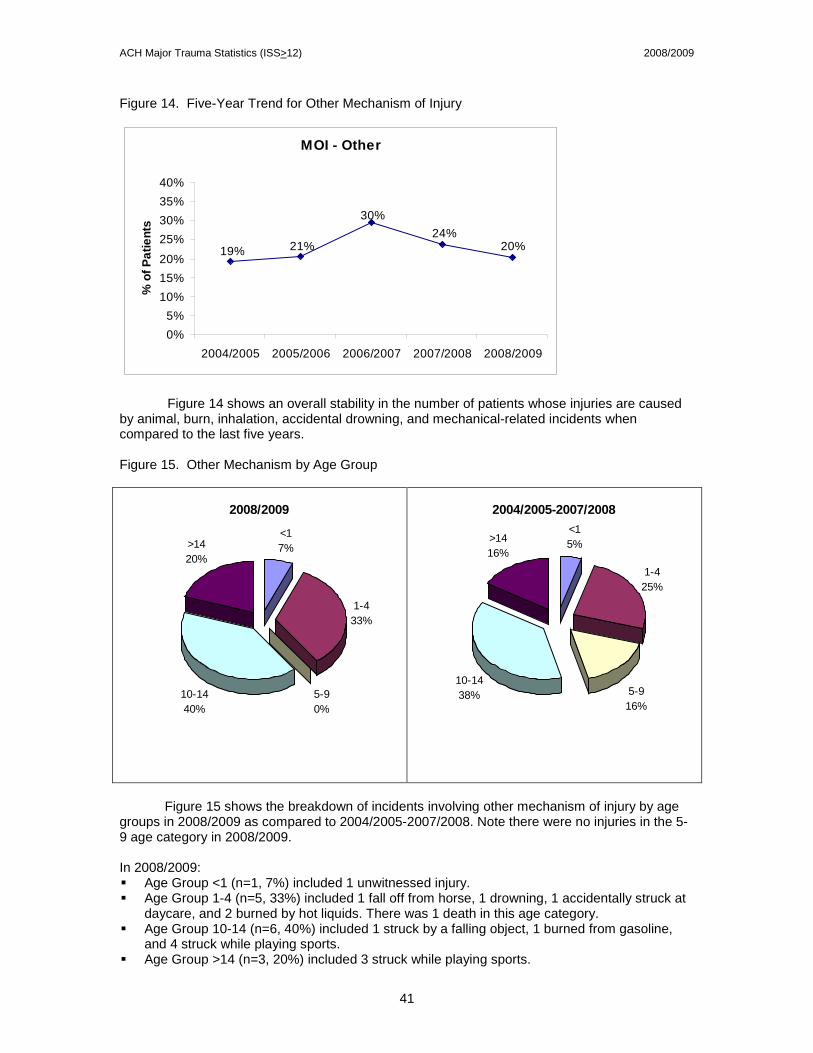
Figure 14. Five-Year Trend for Other Mechanism of Injury
MOI - Other
20%24%
30%
21%19%
0%5%
10%15%20%
25%30%35%40%
2004/2005 2005/2006 2006/2007 2007/2008 2008/2009
% o
f Pat
ient
s
Figure 14 shows an overall stability in the number of patients whose injuries are caused by animal, burn, inhalation, accidental drowning, and mechanical-related incidents when compared to the last five years. Figure 15. Other Mechanism by Age Group
2008/2009
<17%
1-433%
5-90%
10-1440%
>1420%
2004/2005-2007/2008<15%
1-425%
5-916%
10-1438%
>1416%
Figure 15 shows the breakdown of incidents involving other mechanism of injury by age
groups in 2008/2009 as compared to 2004/2005-2007/2008. Note there were no injuries in the 5-9 age category in 2008/2009. In 2008/2009: Age Group <1 (n=1, 7%) included 1 unwitnessed injury. Age Group 1-4 (n=5, 33%) included 1 fall off from horse, 1 drowning, 1 accidentally struck at
daycare, and 2 burned by hot liquids. There was 1 death in this age category. Age Group 10-14 (n=6, 40%) included 1 struck by a falling object, 1 burned from gasoline,
and 4 struck while playing sports. Age Group >14 (n=3, 20%) included 3 struck while playing sports.
ACH Major Trauma Statistics (ISS>12) 2008/2009
42
Type of Injury
Type of Injury indicates whether the most serious injury is blunt, penetrating, burn, or
other type of injury (strangulation, hanging and drowning). Figure 16. Type of Injury
Type of Injury - 2008/2009Total Pts = 74
69
1 4 00
20
40
60
80
Blunt Penetrating Burn Other
Figure 16 shows the different types of injuries sustained by the major trauma patients in 2008/2009. Blunt injuries comprised 93.2% of major trauma population. Penetrating injuries and burn comprised of 1.4% and 5.4% respectively, of the major trauma patients. Figure 17. Five-Year Trend for Type of Injury
Type of Injury - Five Year TrendTotal Pts = 437
81 76 85 8469
2 1 2 1 10 4 0 1 45 6 4 11 00
50
100
2004/2005 2005/2006 2006/2007 2007/2008 2008/2009
Fiscal Years
# of
Pat
ient
s
Blunt Penetrating Burn Other
Figure 17 compares the different types of injuries from 2004/2005 up to 2008/2009.
ACH Major Trauma Statistics (ISS>12) 2008/2009
43
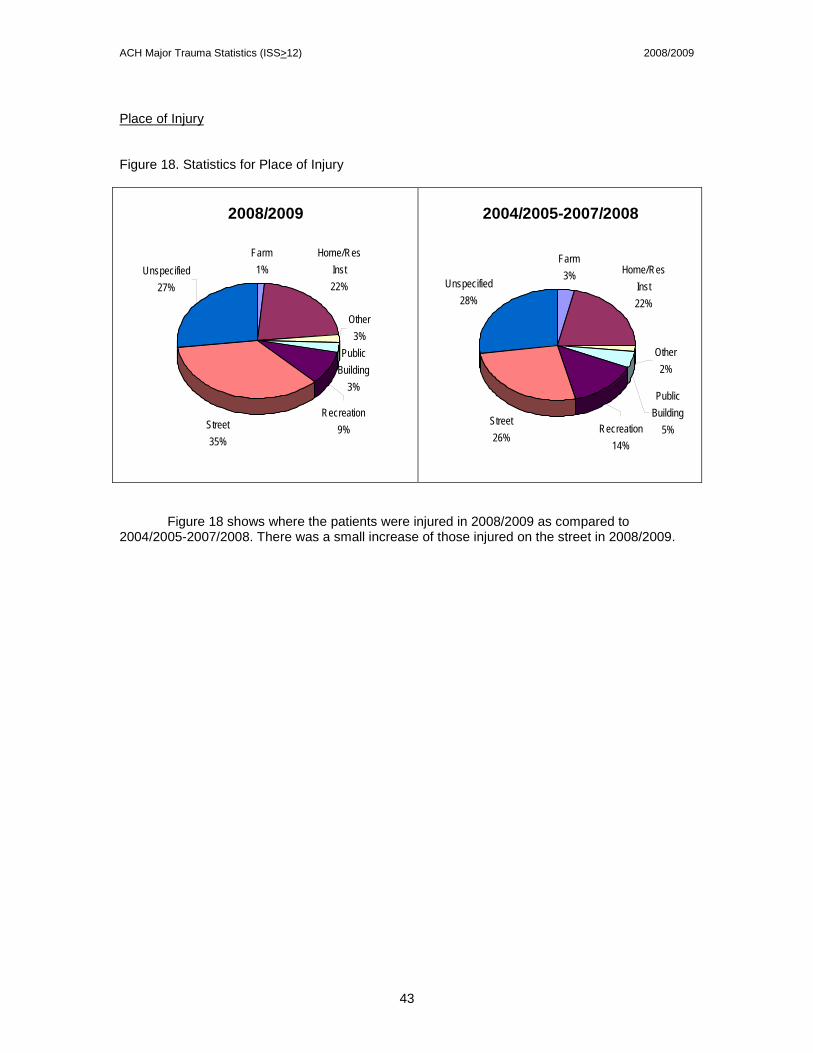
Place of Injury Figure 18. Statistics for Place of Injury
2008/2009
Farm1%
Home/Res Inst22%
Public Building
3%
Street35%
Other3%
Unspecified27%
Recreation9%
2004/2005-2007/2008
Farm3% Home/Res
Inst22%
Street26%
Unspecified28%
Other2%
Public Building
5%Recreation14%
Figure 18 shows where the patients were injured in 2008/2009 as compared to 2004/2005-2007/2008. There was a small increase of those injured on the street in 2008/2009.
ACH Major Trauma Statistics (ISS>12) 2008/2009
44
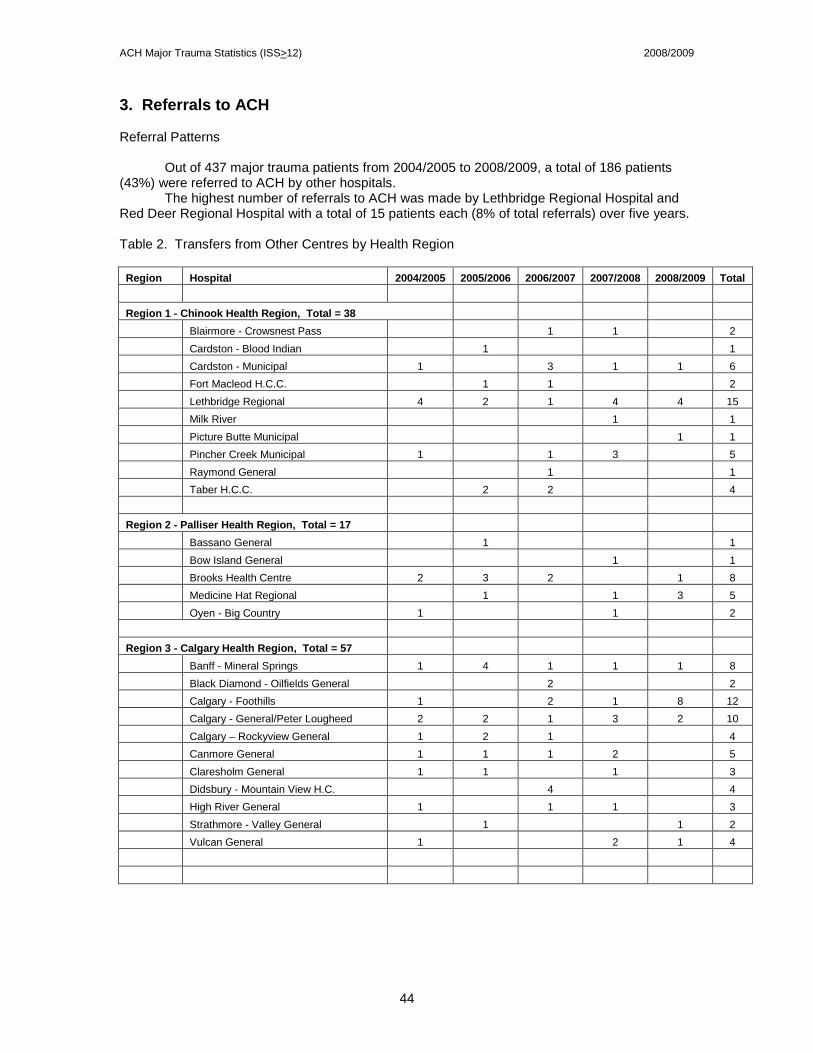
3. Referrals to ACH Referral Patterns
Out of 437 major trauma patients from 2004/2005 to 2008/2009, a total of 186 patients (43%) were referred to ACH by other hospitals.
The highest number of referrals to ACH was made by Lethbridge Regional Hospital and Red Deer Regional Hospital with a total of 15 patients each (8% of total referrals) over five years. Table 2. Transfers from Other Centres by Health Region
Region Hospital 2004/2005 2005/2006 2006/2007 2007/2008 2008/2009 Total Region 1 - Chinook Health Region, Total = 38 Blairmore - Crowsnest Pass 1 1 2 Cardston - Blood Indian 1 1 Cardston - Municipal 1 3 1 1 6 Fort Macleod H.C.C. 1 1 2 Lethbridge Regional 4 2 1 4 4 15 Milk River 1 1 Picture Butte Municipal 1 1 Pincher Creek Municipal 1 1 3 5 Raymond General 1 1 Taber H.C.C. 2 2 4 Region 2 - Palliser Health Region, Total = 17 Bassano General 1 1 Bow Island General 1 1 Brooks Health Centre 2 3 2 1 8 Medicine Hat Regional 1 1 3 5 Oyen - Big Country 1 1 2 Region 3 - Calgary Health Region, Total = 57 Banff - Mineral Springs 1 4 1 1 1 8 Black Diamond - Oilfields General 2 2 Calgary - Foothills 1 2 1 8 12 Calgary - General/Peter Lougheed 2 2 1 3 2 10 Calgary – Rockyview General 1 2 1 4 Canmore General 1 1 1 2 5 Claresholm General 1 1 1 3 Didsbury - Mountain View H.C. 4 4 High River General 1 1 1 3 Strathmore - Valley General 1 1 2 Vulcan General 1 2 1 4
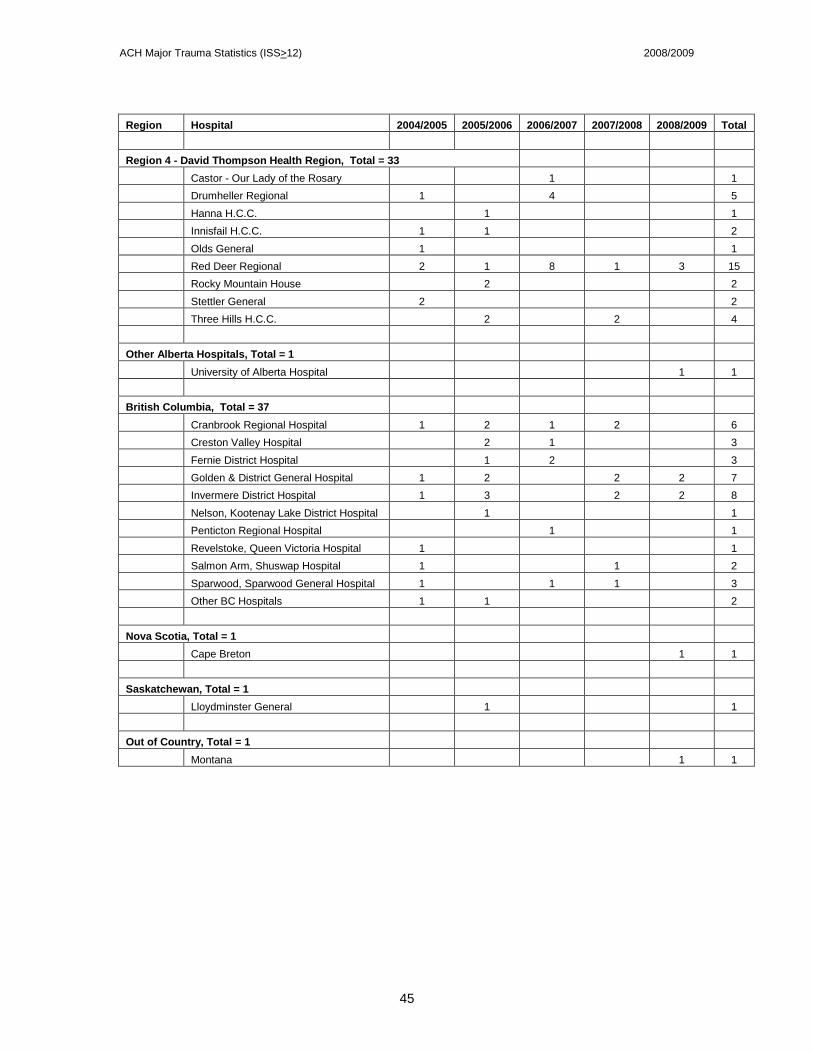
ACH Major Trauma Statistics (ISS>12) 2008/2009
45
Region Hospital 2004/2005 2005/2006 2006/2007 2007/2008 2008/2009 Total Region 4 - David Thompson Health Region, Total = 33 Castor - Our Lady of the Rosary 1 1 Drumheller Regional 1 4 5 Hanna H.C.C. 1 1 Innisfail H.C.C. 1 1 2 Olds General 1 1 Red Deer Regional 2 1 8 1 3 15 Rocky Mountain House 2 2 Stettler General 2 2 Three Hills H.C.C. 2 2 4 Other Alberta Hospitals, Total = 1 University of Alberta Hospital 1 1 British Columbia, Total = 37 Cranbrook Regional Hospital 1 2 1 2 6 Creston Valley Hospital 2 1 3 Fernie District Hospital 1 2 3 Golden & District General Hospital 1 2 2 2 7 Invermere District Hospital 1 3 2 2 8 Nelson, Kootenay Lake District Hospital 1 1 Penticton Regional Hospital 1 1 Revelstoke, Queen Victoria Hospital 1 1 Salmon Arm, Shuswap Hospital 1 1 2 Sparwood, Sparwood General Hospital 1 1 1 3 Other BC Hospitals 1 1 2 Nova Scotia, Total = 1 Cape Breton 1 1 Saskatchewan, Total = 1 Lloydminster General 1 1 Out of Country, Total = 1 Montana 1 1
ACH Major Trauma Statistics (ISS>12) 2008/2009
46
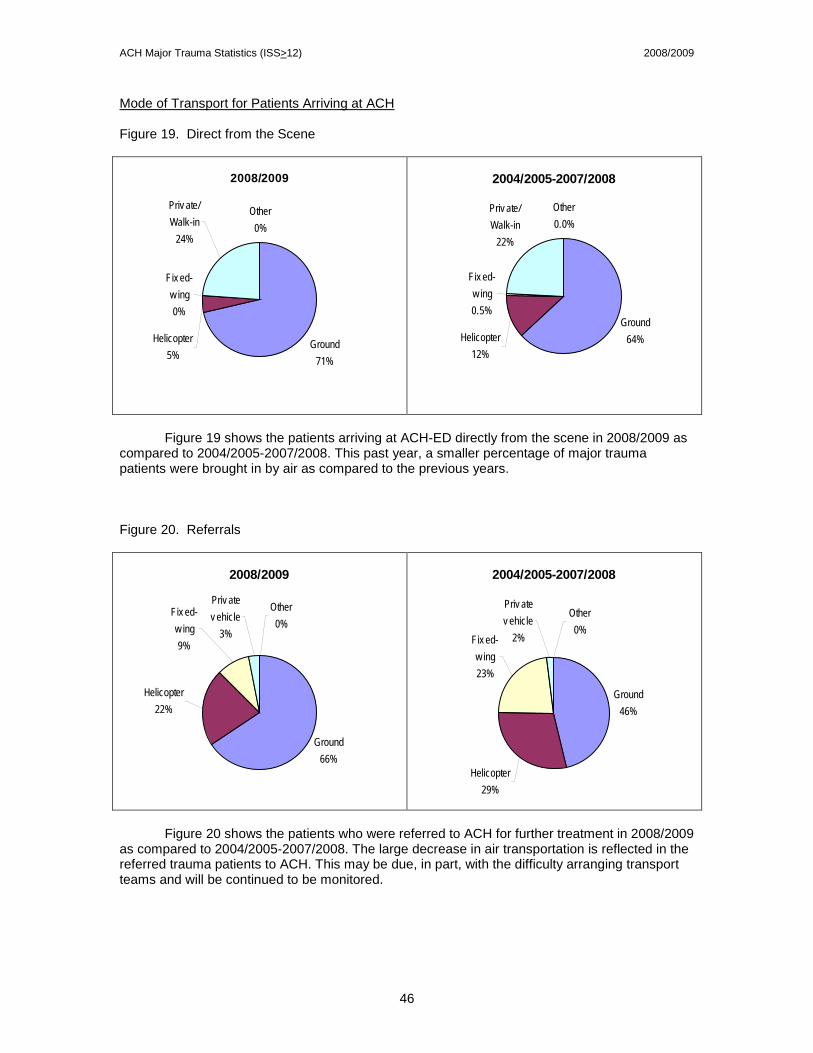
Mode of Transport for Patients Arriving at ACH Figure 19. Direct from the Scene
2008/2009
Fix ed-w ing0%
Other0%
Priv ate/Walk-in
24%
Helicopter5%
Ground 71%
2004/2005-2007/2008
Ground 64%Helicopter
12%
Priv ate/Walk-in
22%
Other0.0%
Fix ed-w ing0.5%
Figure 19 shows the patients arriving at ACH-ED directly from the scene in 2008/2009 as compared to 2004/2005-2007/2008. This past year, a smaller percentage of major trauma patients were brought in by air as compared to the previous years.
Figure 20. Referrals
2008/2009
Ground66%
Priv ate v ehicle
3%
Helicopter22%
Fix ed-w ing9%
Other0%
2004/2005-2007/2008
Ground46%
Helicopter29%
Fix ed-w ing23%
Priv ate v ehicle
2%
Other0%
Figure 20 shows the patients who were referred to ACH for further treatment in 2008/2009 as compared to 2004/2005-2007/2008. The large decrease in air transportation is reflected in the referred trauma patients to ACH. This may be due, in part, with the difficulty arranging transport teams and will be continued to be monitored.
ACH Major Trauma Statistics (ISS>12) 2008/2009
47
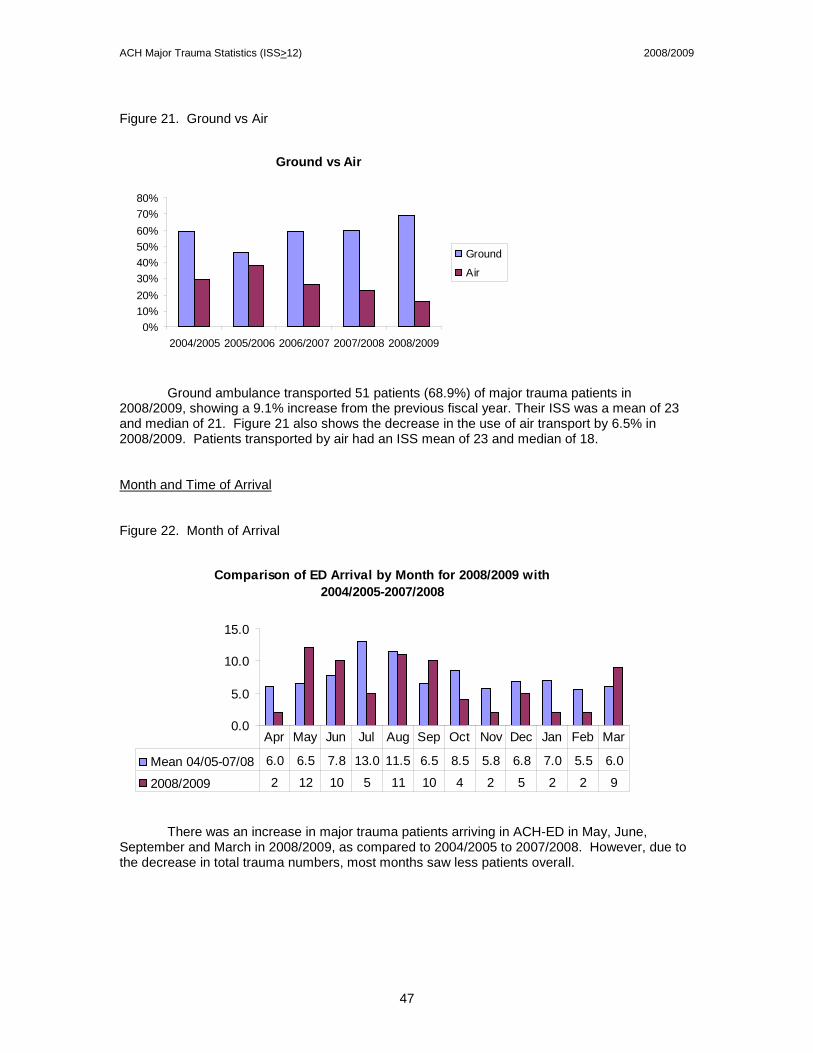
Figure 21. Ground vs Air
Ground vs Air
0%10%20%30%40%50%60%70%80%
2004/2005 2005/2006 2006/2007 2007/2008 2008/2009
Ground
Air
Ground ambulance transported 51 patients (68.9%) of major trauma patients in 2008/2009, showing a 9.1% increase from the previous fiscal year. Their ISS was a mean of 23 and median of 21. Figure 21 also shows the decrease in the use of air transport by 6.5% in 2008/2009. Patients transported by air had an ISS mean of 23 and median of 18. Month and Time of Arrival Figure 22. Month of Arrival
Comparison of ED Arrival by Month for 2008/2009 with 2004/2005-2007/2008
0.0
5.0
10.0
15.0
Mean 04/05-07/08 6.0 6.5 7.8 13.0 11.5 6.5 8.5 5.8 6.8 7.0 5.5 6.0
2008/2009 2 12 10 5 11 10 4 2 5 2 2 9
Apr May Jun Jul Aug Sep Oct Nov Dec Jan Feb Mar
There was an increase in major trauma patients arriving in ACH-ED in May, June, September and March in 2008/2009, as compared to 2004/2005 to 2007/2008. However, due to the decrease in total trauma numbers, most months saw less patients overall.
ACH Major Trauma Statistics (ISS>12) 2008/2009
48
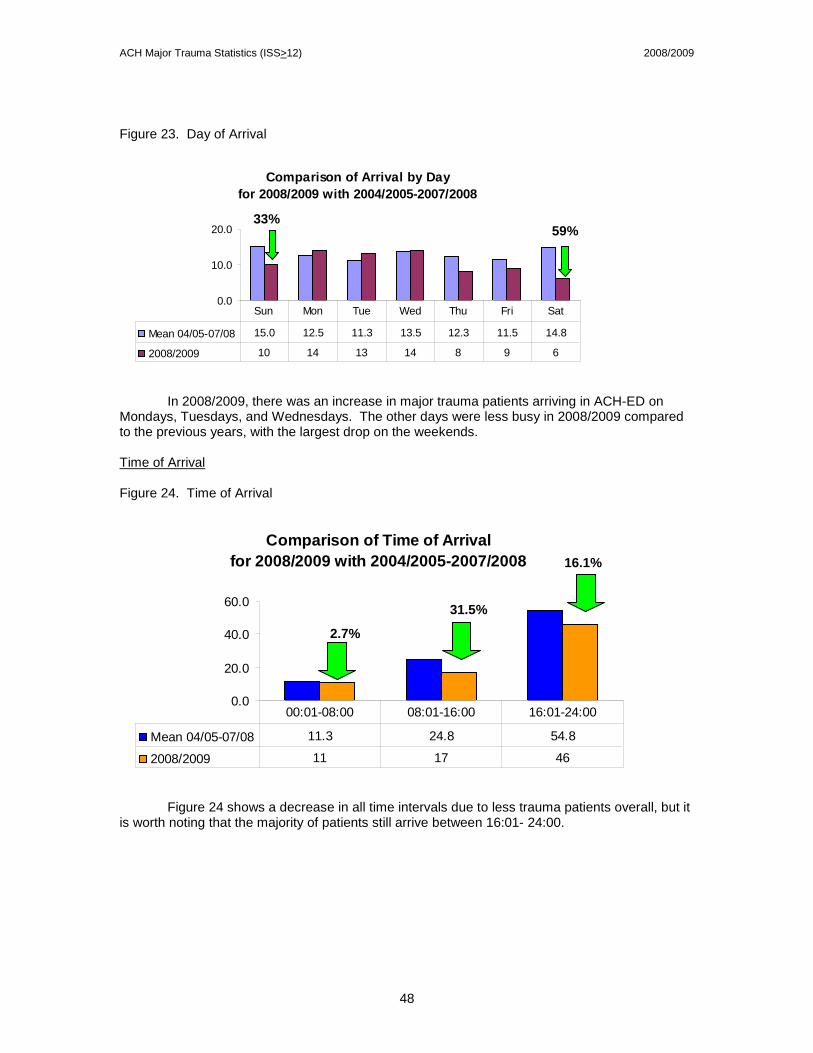
Figure 23. Day of Arrival
Comparison of Arrival by Day for 2008/2009 with 2004/2005-2007/2008
0.0
10.0
20.0
Mean 04/05-07/08 15.0 12.5 11.3 13.5 12.3 11.5 14.8
2008/2009 10 14 13 14 8 9 6
Sun Mon Tue Wed Thu Fri Sat
In 2008/2009, there was an increase in major trauma patients arriving in ACH-ED on Mondays, Tuesdays, and Wednesdays. The other days were less busy in 2008/2009 compared to the previous years, with the largest drop on the weekends. Time of Arrival Figure 24. Time of Arrival
Comparison of Time of Arrivalfor 2008/2009 with 2004/2005-2007/2008
0.0
20.0
40.0
60.0
Mean 04/05-07/08 11.3 24.8 54.8
2008/2009 11 17 46
00:01-08:00 08:01-16:00 16:01-24:00
Figure 24 shows a decrease in all time intervals due to less trauma patients overall, but it is worth noting that the majority of patients still arrive between 16:01- 24:00.
2.7%
31.5%
16.1%
33% 59%
ACH Major Trauma Statistics (ISS>12) 2008/2009
49
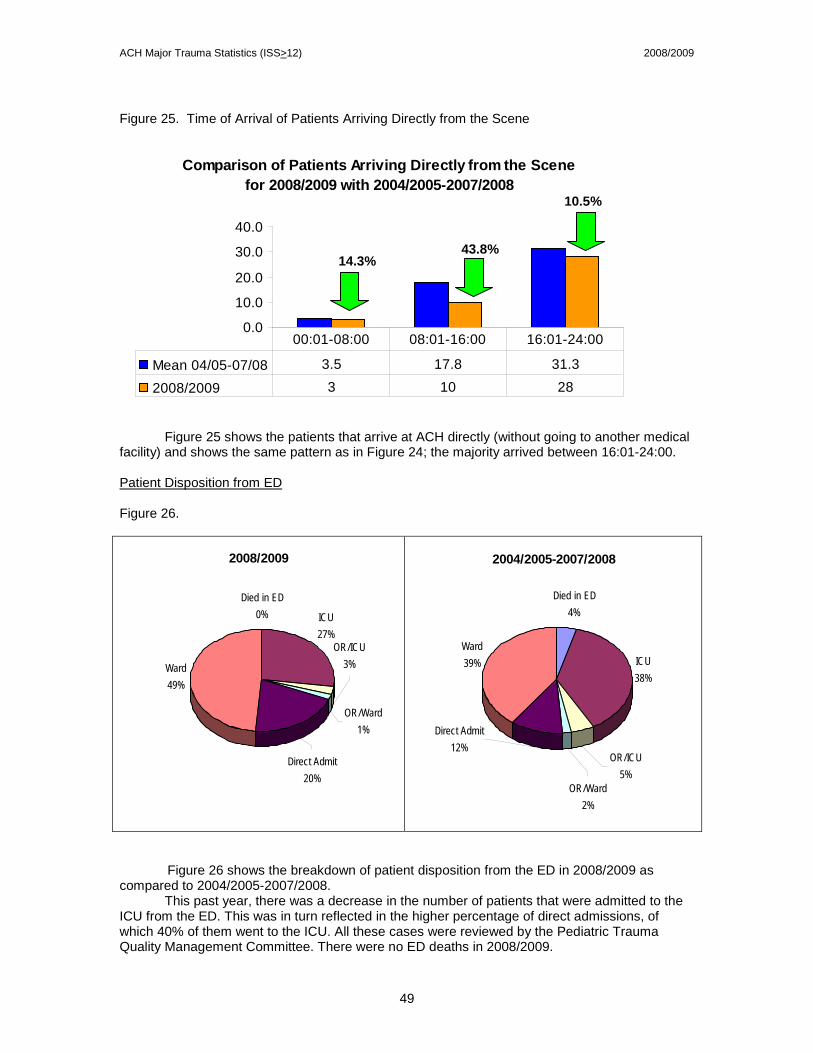
Figure 25. Time of Arrival of Patients Arriving Directly from the Scene
Comparison of Patients Arriving Directly from the Scene for 2008/2009 with 2004/2005-2007/2008
0.0
10.0
20.0
30.0
40.0
Mean 04/05-07/08 3.5 17.8 31.3
2008/2009 3 10 28
00:01-08:00 08:01-16:00 16:01-24:00
Figure 25 shows the patients that arrive at ACH directly (without going to another medical facility) and shows the same pattern as in Figure 24; the majority arrived between 16:01-24:00. Patient Disposition from ED Figure 26.
2008/2009
Died in ED0% ICU
27%
Ward49%
OR/ICU3%
Direct Admit20%
OR/Ward1%
2004/2005-2007/2008
Died in ED4%
ICU38%
Ward39%
OR/ICU5%
Direct Admit12%
OR/Ward2%
Figure 26 shows the breakdown of patient disposition from the ED in 2008/2009 as compared to 2004/2005-2007/2008.
This past year, there was a decrease in the number of patients that were admitted to the ICU from the ED. This was in turn reflected in the higher percentage of direct admissions, of which 40% of them went to the ICU. All these cases were reviewed by the Pediatric Trauma Quality Management Committee. There were no ED deaths in 2008/2009.
14.3%
10.5%
43.8%
ACH Major Trauma Statistics (ISS>12) 2008/2009
50
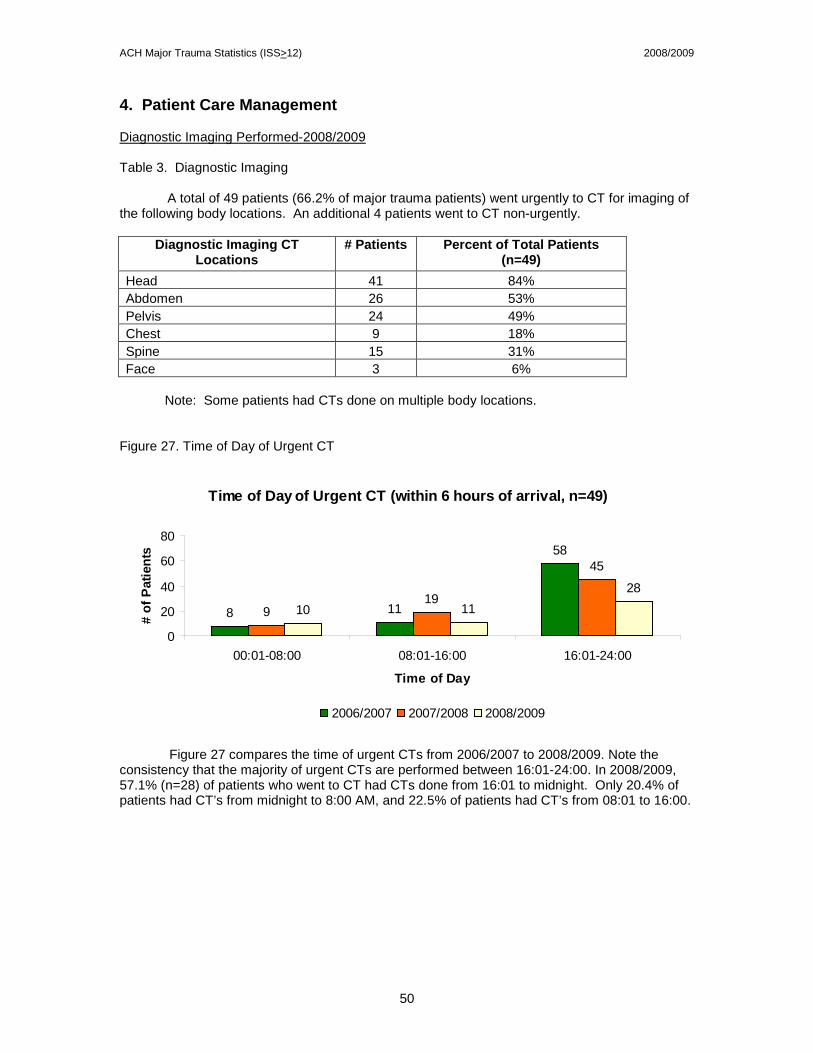
4. Patient Care Management Diagnostic Imaging Performed-2008/2009 Table 3. Diagnostic Imaging A total of 49 patients (66.2% of major trauma patients) went urgently to CT for imaging of the following body locations. An additional 4 patients went to CT non-urgently.
Diagnostic Imaging CT Locations
# Patients Percent of Total Patients (n=49)
Head 41 84% Abdomen 26 53% Pelvis 24 49% Chest 9 18% Spine 15 31% Face 3 6%
Note: Some patients had CTs done on multiple body locations.
Figure 27. Time of Day of Urgent CT
Time of Day of Urgent CT (within 6 hours of arrival, n=49)
8 11
58
919
45
10 1128
0
20
40
60
80
00:01-08:00 08:01-16:00 16:01-24:00
Time of Day
# of
Pat
ient
s
2006/2007 2007/2008 2008/2009
Figure 27 compares the time of urgent CTs from 2006/2007 to 2008/2009. Note the consistency that the majority of urgent CTs are performed between 16:01-24:00. In 2008/2009, 57.1% (n=28) of patients who went to CT had CTs done from 16:01 to midnight. Only 20.4% of patients had CT’s from midnight to 8:00 AM, and 22.5% of patients had CT’s from 08:01 to 16:00.
ACH Major Trauma Statistics (ISS>12) 2008/2009
51
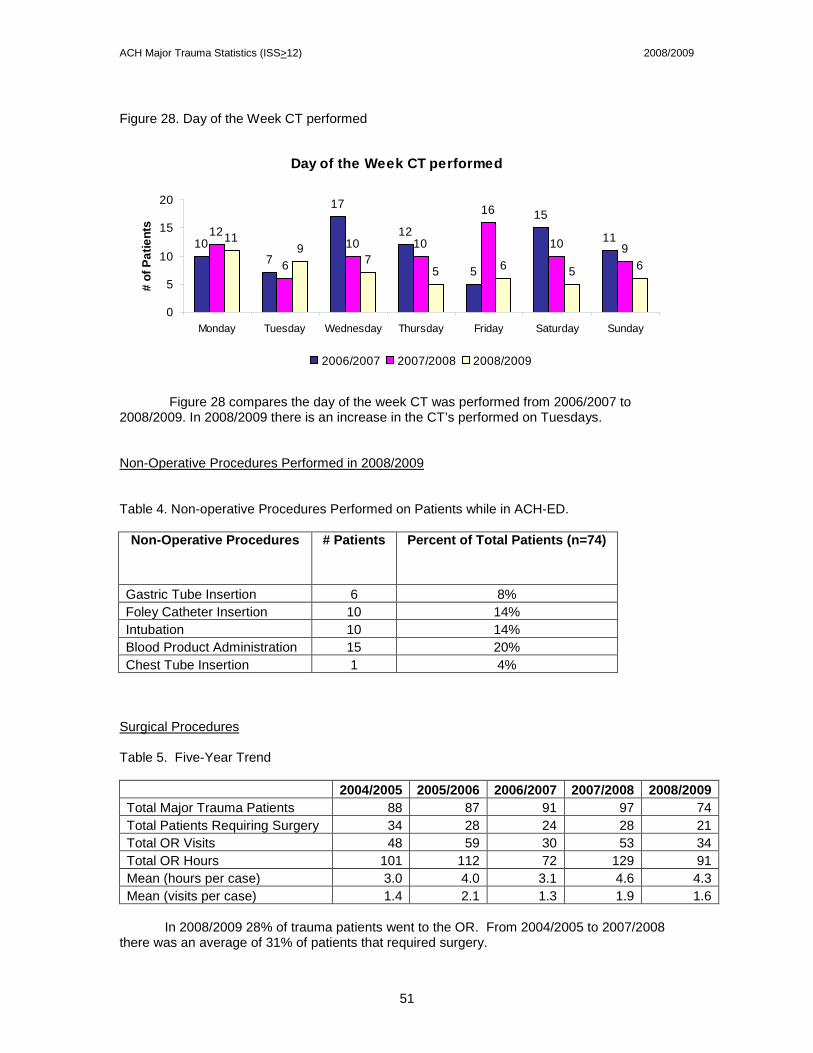
Figure 28. Day of the Week CT performed
Day of the Week CT performed
107
17
12
5
15
1112
6
10 10
16
10 911
97
5 6 5 6
0
5
10
15
20
Monday Tuesday Wednesday Thursday Friday Saturday Sunday
# of
Pat
ient
s
2006/2007 2007/2008 2008/2009
Figure 28 compares the day of the week CT was performed from 2006/2007 to 2008/2009. In 2008/2009 there is an increase in the CT’s performed on Tuesdays. Non-Operative Procedures Performed in 2008/2009 Table 4. Non-operative Procedures Performed on Patients while in ACH-ED.
Non-Operative Procedures # Patients Percent of Total Patients (n=74)
Gastric Tube Insertion 6 8% Foley Catheter Insertion 10 14% Intubation 10 14% Blood Product Administration 15 20% Chest Tube Insertion 1 4%
Surgical Procedures Table 5. Five-Year Trend 2004/2005 2005/2006 2006/2007 2007/2008 2008/2009 Total Major Trauma Patients 88 87 91 97 74 Total Patients Requiring Surgery 34 28 24 28 21 Total OR Visits 48 59 30 53 34 Total OR Hours 101 112 72 129 91 Mean (hours per case) 3.0 4.0 3.1 4.6 4.3 Mean (visits per case) 1.4 2.1 1.3 1.9 1.6
In 2008/2009 28% of trauma patients went to the OR. From 2004/2005 to 2007/2008
there was an average of 31% of patients that required surgery.
ACH Major Trauma Statistics (ISS>12) 2008/2009
52
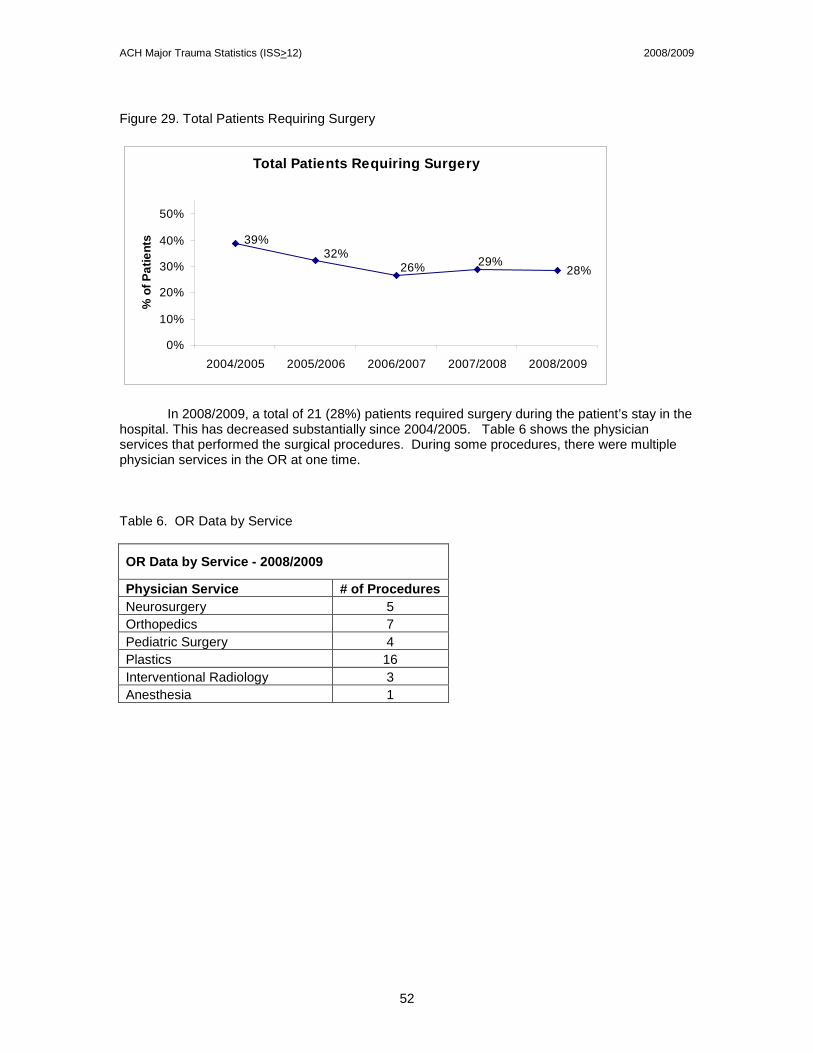
Figure 29. Total Patients Requiring Surgery
Total Patients Requiring Surgery
28%29%26%
32%39%
0%
10%
20%
30%
40%
50%
2004/2005 2005/2006 2006/2007 2007/2008 2008/2009
% o
f Pat
ient
s
In 2008/2009, a total of 21 (28%) patients required surgery during the patient’s stay in the hospital. This has decreased substantially since 2004/2005. Table 6 shows the physician services that performed the surgical procedures. During some procedures, there were multiple physician services in the OR at one time. Table 6. OR Data by Service
OR Data by Service - 2008/2009
Physician Service # of Procedures Neurosurgery 5 Orthopedics 7 Pediatric Surgery 4 Plastics 16 Interventional Radiology 3 Anesthesia 1
ACH Major Trauma Statistics (ISS>12) 2008/2009
53
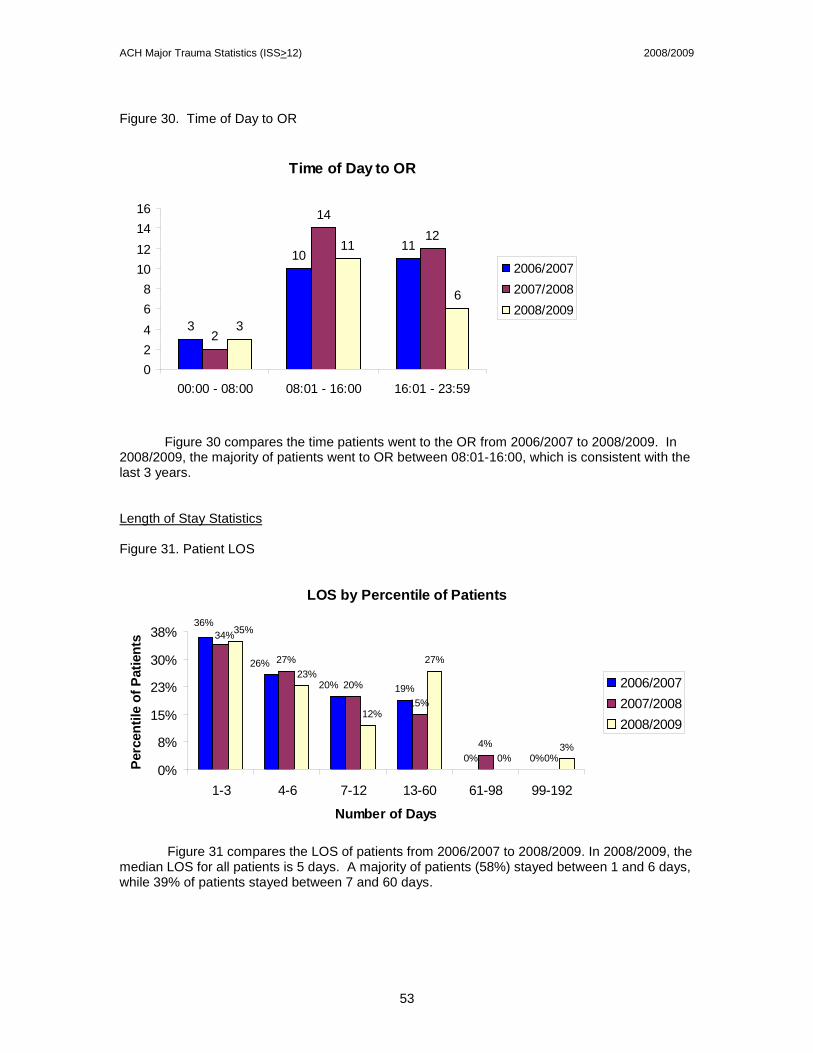
Figure 30. Time of Day to OR
Time of Day to OR
3
1011
2
1412
3
11
6
02468
10121416
00:00 - 08:00 08:01 - 16:00 16:01 - 23:59
2006/20072007/20082008/2009
Figure 30 compares the time patients went to the OR from 2006/2007 to 2008/2009. In 2008/2009, the majority of patients went to OR between 08:01-16:00, which is consistent with the last 3 years. Length of Stay Statistics Figure 31. Patient LOS
LOS by Percentile of Patients
19%
0% 0%
27%
20%
15%
4%0%
27%
3%
20%
26%
36%34%
0%
12%
23%
35%
0%
8%
15%
23%
30%
38%
1-3 4-6 7-12 13-60 61-98 99-192
Number of Days
Perc
entil
e of
Pat
ient
s
2006/20072007/20082008/2009
Figure 31 compares the LOS of patients from 2006/2007 to 2008/2009. In 2008/2009, the median LOS for all patients is 5 days. A majority of patients (58%) stayed between 1 and 6 days, while 39% of patients stayed between 7 and 60 days.
ACH Major Trauma Statistics (ISS>12) 2008/2009
54
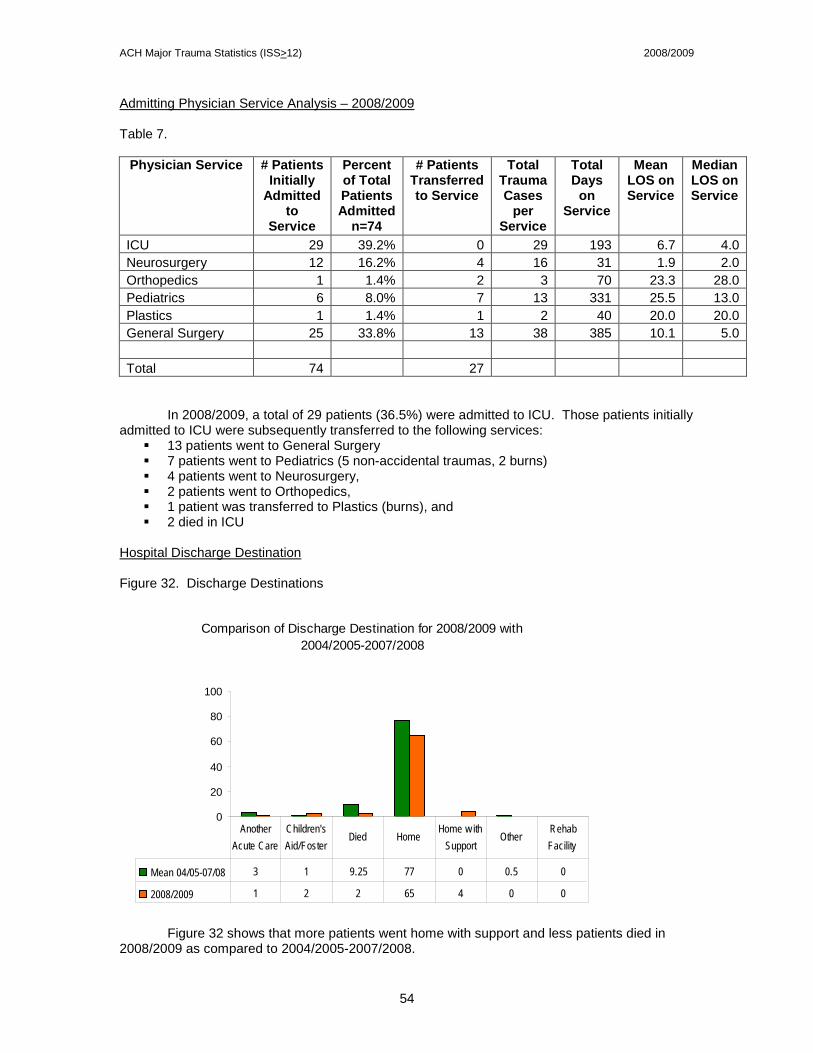
Admitting Physician Service Analysis – 2008/2009 Table 7.
Physician Service # Patients Initially
Admitted to
Service
Percent of Total Patients Admitted
n=74
# Patients Transferred to Service
Total Trauma Cases
per Service
Total Days
on Service
Mean LOS on Service
Median LOS on Service
ICU 29 39.2% 0 29 193 6.7 4.0 Neurosurgery 12 16.2% 4 16 31 1.9 2.0 Orthopedics 1 1.4% 2 3 70 23.3 28.0 Pediatrics 6 8.0% 7 13 331 25.5 13.0 Plastics 1 1.4% 1 2 40 20.0 20.0 General Surgery 25 33.8% 13 38 385 10.1 5.0 Total 74 27
In 2008/2009, a total of 29 patients (36.5%) were admitted to ICU. Those patients initially admitted to ICU were subsequently transferred to the following services:
13 patients went to General Surgery 7 patients went to Pediatrics (5 non-accidental traumas, 2 burns) 4 patients went to Neurosurgery, 2 patients went to Orthopedics, 1 patient was transferred to Plastics (burns), and 2 died in ICU
Hospital Discharge Destination Figure 32. Discharge Destinations
Comparison of Discharge Destination for 2008/2009 with 2004/2005-2007/2008
0
20
40
60
80
100
Mean 04/05-07/08 3 1 9.25 77 0 0.5 0
2008/2009 1 2 2 65 4 0 0
Another Acute Care
Children's Aid/Foster
Died HomeHome w ith
Support Other
Rehab Facility
Figure 32 shows that more patients went home with support and less patients died in 2008/2009 as compared to 2004/2005-2007/2008.
ACH Major Trauma Statistics (ISS>12) 2008/2009
55
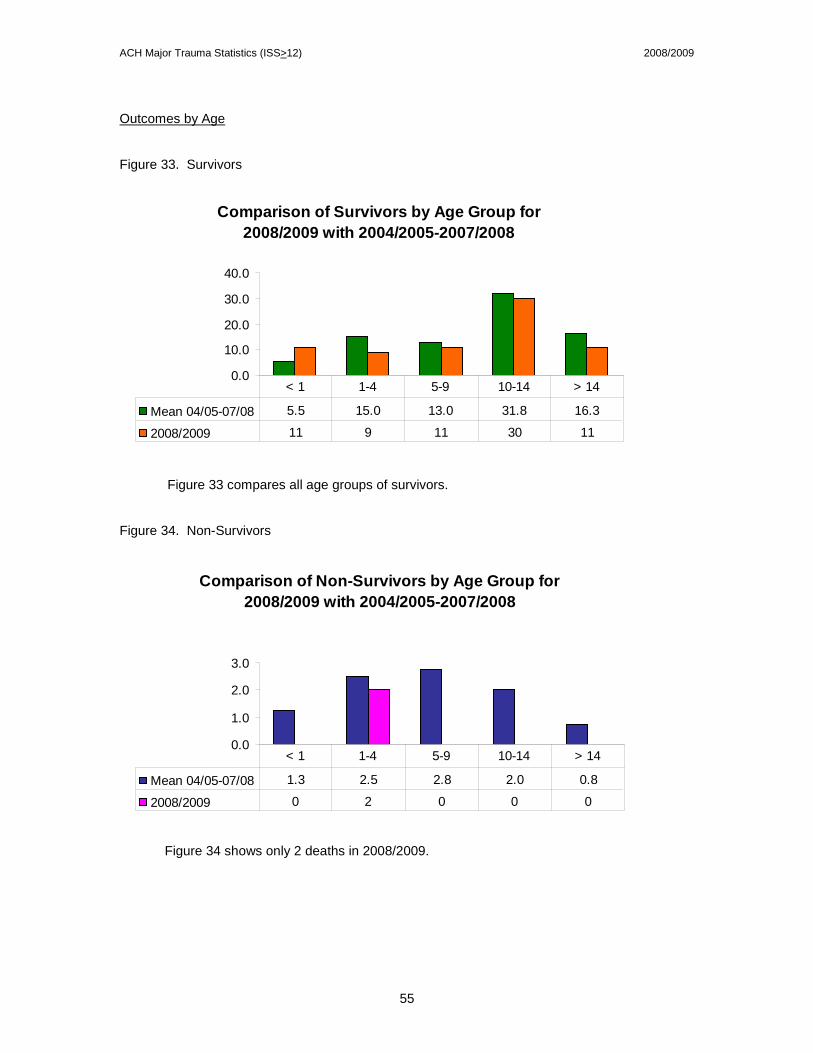
Outcomes by Age Figure 33. Survivors
Comparison of Survivors by Age Group for 2008/2009 with 2004/2005-2007/2008
0.0
10.0
20.0
30.0
40.0
Mean 04/05-07/08 5.5 15.0 13.0 31.8 16.3
2008/2009 11 9 11 30 11
< 1 1-4 5-9 10-14 > 14
Figure 33 compares all age groups of survivors. Figure 34. Non-Survivors
Comparison of Non-Survivors by Age Group for 2008/2009 with 2004/2005-2007/2008
0.0
1.0
2.0
3.0
Mean 04/05-07/08 1.3 2.5 2.8 2.0 0.8
2008/2009 0 2 0 0 0
< 1 1-4 5-9 10-14 > 14
Figure 34 shows only 2 deaths in 2008/2009.
ACH Major Trauma Statistics (ISS>12) 2008/2009
56
Outcomes by ISS – 2008/2009 Figure 35. Survivors vs Non-Survivors by ISS
2008/2009
5
46
17
2 0 20 1 0 1 0 00
10
20
30
40
50
12 - 15 16 - 25 26 - 35 36 - 45 46 - 55 56 - 65
ISS
# of
pat
ient
s
Survivors Non-Survivors
Most survivors (63.9%, n=46) had ISS from 16 to 25. Mortality rate was equally distributed in the ISS range 16-25 with 2.2% death rate, followed by ISS 36-45 with 50% mortality rate.
ACH Major Trauma Statistics (ISS>12) 2008/2009
57
TRISS Pre Charts for 2008/2009 The following charts identify patients according to their probability of survival (Ps). Each patient is characterized by the Revised Trauma Score (RTS) and the Injury Severity Score (ISS) and then plotted on a graph. The shaded area represents the combination of the RTS and the ISS which yield a probability of survival (Ps) of >.50. The area above the line represents a probability of survival of <.50. Patients who are above the shaded area and survive and those who die and are plotted in the shaded area are atypical cases and subject to medical review. The age groups are standard age groups used in the development of the TRISS analysis. Figure 36. Pediatric Pre Charts include blunt and penetrating mechanisms for patients < 15 years.
There was one unexpected death and two unexpected survivors for patients less than 15 years in 2008/2009 using the TRISS methodology. The unexpected death was reviewed at the Pediatric Trauma Quality Management Committee, as well as at Mortality and Morbidity rounds, and management was deemed appropriate.
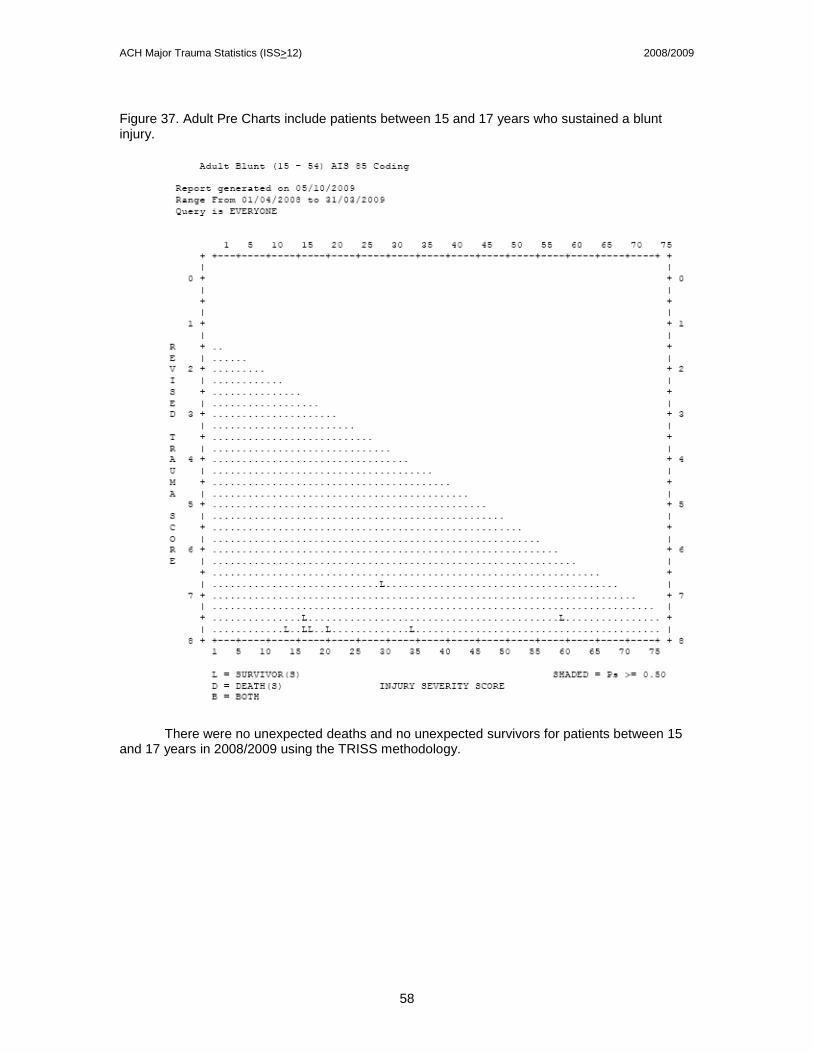
ACH Major Trauma Statistics (ISS>12) 2008/2009
58
Figure 37. Adult Pre Charts include patients between 15 and 17 years who sustained a blunt injury.
There were no unexpected deaths and no unexpected survivors for patients between 15 and 17 years in 2008/2009 using the TRISS methodology.
Related Documents