UNIVERSIDADE FEDERAL DE SANTA MARIA CENTRO DE TECNOLOGIA DEPARTAMENTO DE ENGENHARIA MECÂNICA CURSO DE GRADUAÇÃO EM ENGENHARIA AEROESPACIAL Alan Pitthan Couto PRELIMINARY DESIGN OF A LUDWIEG TUBE AS AN EXPERIMENTAL FACILITY FOR AN LABORATORY OF COMPRESSIBLE FLOWS AT UFSM Santa Maria, RS 2020

Welcome message from author
This document is posted to help you gain knowledge. Please leave a comment to let me know what you think about it! Share it to your friends and learn new things together.
Transcript

UNIVERSIDADE FEDERAL DE SANTA MARIACENTRO DE TECNOLOGIA
DEPARTAMENTO DE ENGENHARIA MECÂNICACURSO DE GRADUAÇÃO EM ENGENHARIA AEROESPACIAL
Alan Pitthan Couto
PRELIMINARY DESIGN OF A LUDWIEG TUBE AS AN EXPERIMENTALFACILITY FOR AN LABORATORY OF COMPRESSIBLE FLOWS AT
UFSM
Santa Maria, RS2020

Alan Pitthan Couto
PRELIMINARY DESIGN OF A LUDWIEG TUBE AS AN EXPERIMENTAL FACILITY FORAN LABORATORY OF COMPRESSIBLE FLOWS AT UFSM
Trabalho de Conclusão de Curso apresen-tado ao Curso de Graduação em Engen-haria Aeroespacial, da Universidade Federalde Santa Maria (UFSM, Santa Maria/RS),como requisito parcial para obtenção do graude Bacharel em Engenharia Aeroespacial.Defesa realizada por videoconferência.
ORIENTADOR: Prof. Dr. João Felipe de Araújo Martos
Santa Maria, RS2020
Alan Pitthan Couto
PRELIMINARY DESIGN OF A LUDWIEG TUBE AS AN EXPERIMENTAL FACILITY FORAN LABORATORY OF COMPRESSIBLE FLOWS AT UFSM
Trabalho de Conclusão de Curso apresen-tado ao Curso de Graduação em EngenhariaAeroespacial, da Universidade Federal deSanta Maria (UFSM, Santa Maria/RS), comorequisito parcial para obtenção do grau deBacharel em Engenharia Aeroespacial.
Aprovado em Outubro de 2020:
João Felipe de Araújo Martos, Dr. (UFSM)(Presidente/Orientador)
Giuliano Demarco, Dr. (UFSM)
Paulo Gilberto de Paula Toro, Dr. (UFRN)
Santa Maria, RS2020

AGRADECIMENTOS
Em primeiro lugar gostaria de agradecer à minha família, especialmente a minha
mãe, Valeska por todo o apoio, amor incondicional e força que sempre teve não só en-
quanto eu desenvolvia este trabalho, mas por todos os anos da minha existência. Tam-
bém, ao meu irmãozinho canídeo Zeca por afastar minha irritação e tristeza em alguns
momentos. São ambos o meu porto seguro.
Ao meu orientador, Prof. João Martos, pela orientação e amizade durante estes
últimos anos de graduação.
Aos meus colegas de curso, especialmente a Augusto, Fortunato, Jonas e Luiz com
os quais criei grandes laços de amizade ao longo destes 5 anos, onde passamos por
diversas situações tanto de alegria quanto de tristeza, sempre apoiando-nos mutuamente.
À Thalita e Carla pelo apoio e carinho singulares nos momentos difíceis ao longo
de minha trajetória.
A Universidade Federal de Santa Maria e todos os professores do curso, pelas
oportunidades e ensinamentos que moldaram minha trajetória acadêmica e impactaram
no meu crescimento profissional ao longo da graduação.

RESUMO
PROJETO PRELIMINAR DE UM TUBO DE LUDWIEG COMO UMAPARATO EXPERIMENTAL PARA UM LABORATÓRIO DE
ESCOAMENTOS COMPRESSÍVEIS NA UFSM
AUTOR: Alan Pitthan CoutoORIENTADOR: João Felipe de Araújo Martos
Túneis de vento pulsados são ferramentas utilizadas para reproduzir as condições necessá-
rias para efetuar pesquisa e desenvolvimento que dependam de escoamentos com alto
número de Mach. A replicação destas condições do escomento é crucial para o processo
de validação de novas tecnologias aeroespaciais e a compreeensão de fenômenos com-
plexos do escoamento. Um tubo de Ludwieg é um aparato experimental utilizado para
replicar o ambiente encontrado em voos supersônicos e hipersônicos capaz de gerar
uma ampla gama de escoamentos variando o número de Mach, número de Reynolds e
entalpia, tornando-o em um dos dispositivos laboratorias mais versáteis para aplicações
deste tipo. O objetivo deste trabalho é o projeto preliminar de um tubo Ludwieg planejado
para ser instalado na Universidade Federal de Santa Maria (UFSM) como uma ferramenta
de pesquisa e desenvolvimento para análise de escoamento compressível. Para tanto, é
necessária a compreensão de cada um dos componentes do tubo de Ludwieg e seus as-
pectos teóricos a respeito dos escoamentos de alta velocidade gerados durante o funciona-
mento. A teoria de base de escoamento isentrópico quase-unidimensional foi utilizada para
descrever o escoamento de alta velocidade gerado na seção de testes e para obtenção das
condições de operação que influenciam no dimensionamento mecânico. Uma abordagem
de engenharia de sistemas foi implementada na metodologia de projeto a fim de carac-
terizar os requisitos que orientam o desenvolvimento do sistema de interesse ao longo
dos estágios iniciais do ciclo de vida. O projeto mecânico da seção do driver -seção de
alta pressão e temperatura, foi conduzido de acordo com normas de projeto segundo a
ASME. O dimensionamento preliminar da seção do driver, seção de teste e reservatório
são apresentados. Instalações pulsadas operacionais em todo o mundo com característi-
cas semelhantes são usadas como referência para o desenvolvimento e comparação de
capacidades operacionais teóricas. Ao fim do trabalho foi concebido o projeto o preliminar
do tubo de Ludwieg da UFSM.
Palavras-chave: Tubo de Ludwieg. Hipersônica. Pesquisa Experimental. Projeto Con-
ceitual. Engenharia de Sistemas. Projeto Mecânico.

ABSTRACT
PRELIMINARY DESIGN OF A LUDWIEG TUBE AS AN EXPERIMENTALFACILITY FOR AN LABORATORY OF COMPRESSIBLE FLOWS AT
UFSM
AUTHOR: Alan Pitthan CoutoADVISOR: João Felipe de Araújo Martos
Pulsed wind tunnels are tools used to reproduce the necessary conditions to perform re-
search and development which depend of high Mach number flows. The replication of these
flow conditions is crucial for the validation process of new aerospace technologies and the
understanding of complex flow phenomena. A Ludwieg tube is an experimental apparatus
used to replicate supersonic and hypersonic flight conditions, capable of generating a wide
range of flows varying the Mach number, Reynolds number and enthalpy, making it one
of the most versatile testing facilities for applications of this nature. The main objective of
this work is the preliminary design of a Ludwieg tube planned to be installed at Universi-
dade Federal de Santa Maria (UFSM) as a research and development tool for compressible
flow analysis. Therefore, the understanding of each of the Ludwieg tube components and
its theoretical aspects regarding the high-speed flows generated during operation is nec-
essary. The basic theory of quasi-one-dimensional isentropic flow was used to describe
the high-speed flows generated in the test section and to obtain the operating conditions
which influence the mechanical project. A systems engineering approach was implemented
into the project methodology in order to characterize the requirements that guide the de-
velopment of the system of interest throughout the initial life-cycle stages. The mechanical
design of the driver section - high pressure and temperature section, was carried out follow-
ing ASME design standards. The preliminary design of the driver section, test section and
dump tank are presented. Operational pulsed installations around the world with similar
characteristics are used as a reference for the development and comparison of theoreti-
cal operational capabilities. In the end of the work, the preliminary project of the UFSM
Ludwieg tube was conceived.
Keywords: Ludwieg Tube. Hypersonics. Experimental Research. Conceptual Project.
Systems Engineering. Mechanical Project.

LIST OF FIGURES
Figure 1.1 – Concorde’s last-ever flight on November 26, 2003. . . . . . . . . . . . . . . . . . . . . . . 14Figure 1.2 – XB-1 prototype aircraft with fuselage and wings assembled. . . . . . . . . . . . . . 15Figure 1.3 – X-59 demonstrator. . . . . . . . . . . . . . . . . . . . . . . . . . . . . . . . . . . . . . . . . . . . . . . . . . . . . . 15Figure 1.4 – Brazilian 14-X waverider vehicle conceptual representation. . . . . . . . . . . . . . 16Figure 3.1 – Shock tunnel layout. . . . . . . . . . . . . . . . . . . . . . . . . . . . . . . . . . . . . . . . . . . . . . . . . . . . . 20Figure 3.2 – T3 hypersonic shock tunnel. . . . . . . . . . . . . . . . . . . . . . . . . . . . . . . . . . . . . . . . . . . . . 20Figure 3.3 – Expansion tube layout. . . . . . . . . . . . . . . . . . . . . . . . . . . . . . . . . . . . . . . . . . . . . . . . . . . 21Figure 3.4 – Continuous wind-tunnel facility from NASA Ames Research Center. . . . . . 22Figure 3.5 – Ludwieg Tube layout. . . . . . . . . . . . . . . . . . . . . . . . . . . . . . . . . . . . . . . . . . . . . . . . . . . . 26Figure 3.6 – Detailed HTFD driver sections. . . . . . . . . . . . . . . . . . . . . . . . . . . . . . . . . . . . . . . . . . . 27Figure 3.7 – Staged driver section with heating. . . . . . . . . . . . . . . . . . . . . . . . . . . . . . . . . . . . . . . 28Figure 3.8 – PHLIC configuration concept. . . . . . . . . . . . . . . . . . . . . . . . . . . . . . . . . . . . . . . . . . . . 28Figure 3.9 – Prepared grooved diaphragm (left) and burst diaphragm after test run
(right). . . . . . . . . . . . . . . . . . . . . . . . . . . . . . . . . . . . . . . . . . . . . . . . . . . . . . . . . . . . . . . . . . . 30Figure 3.10 – Fast action valve component representation in a longitudinal cut view. . . 31Figure 3.11 – Core flow region in a Mach number 6 contoured nozzle exit. . . . . . . . . . . . 32Figure 3.12 – T3 conical nozzle assembly (left) and modular nozzle throat section (right).
32Figure 3.13 – Shockwave formation inside the diffuser. . . . . . . . . . . . . . . . . . . . . . . . . . . . . . . . 34Figure 3.14 – Representation of the Ludwieg tube test run. . . . . . . . . . . . . . . . . . . . . . . . . . . 36Figure 4.1 – Generic life cycle project. . . . . . . . . . . . . . . . . . . . . . . . . . . . . . . . . . . . . . . . . . . . . . . . 41Figure 5.1 – Atmospheric air conditions change with altitude. . . . . . . . . . . . . . . . . . . . . . . . . 49Figure 5.2 – Unit Reynolds number and altitude plot for different flight Mach numbers. 50Figure 5.3 – Stagnation pressure requirements to replicate the exact real flight pressure
conditions. . . . . . . . . . . . . . . . . . . . . . . . . . . . . . . . . . . . . . . . . . . . . . . . . . . . . . . . . . . . . . 52Figure 5.4 – Stagnation temperature requirements to replicate the exact real flight tem-
perature conditions. . . . . . . . . . . . . . . . . . . . . . . . . . . . . . . . . . . . . . . . . . . . . . . . . . . . . 53Figure 5.5 – Design of d0 for different MDT requirements. . . . . . . . . . . . . . . . . . . . . . . . . . . . . 54Figure 5.6 – Analysis of flow quality for MDT = 0.025. . . . . . . . . . . . . . . . . . . . . . . . . . . . . . . . . 55Figure 5.7 – Analysis of flow quality for MDT = 0.04. . . . . . . . . . . . . . . . . . . . . . . . . . . . . . . . . . . 56Figure 5.8 – Analysis of stagnation conditions drop on test start. . . . . . . . . . . . . . . . . . . . . . 57Figure 5.9 – Allowable stress plots for aluminium (AL), carbon steel (CS) and stainless
steel grades (SS) according to temperature. . . . . . . . . . . . . . . . . . . . . . . . . . . . . 60Figure 5.10 – Allowable stress plot for steel grade SA312 TP304 according to temper-
ature. . . . . . . . . . . . . . . . . . . . . . . . . . . . . . . . . . . . . . . . . . . . . . . . . . . . . . . . . . . . . . . . . . . . 61Figure 5.11 – Flange connection assembly in exploded view. . . . . . . . . . . . . . . . . . . . . . . . . . 63Figure 5.12 – Sylvania 18kW electrical air heater. . . . . . . . . . . . . . . . . . . . . . . . . . . . . . . . . . . . . 63Figure 5.13 – Movable under-carriage supports, seen at the extremes of the driver
length and test section. . . . . . . . . . . . . . . . . . . . . . . . . . . . . . . . . . . . . . . . . . . . . . . . . . 64Figure 5.14 – Sleeve assembly for the double diaphragm section. . . . . . . . . . . . . . . . . . . . . 65Figure 5.15 – Test Section Concept 1. . . . . . . . . . . . . . . . . . . . . . . . . . . . . . . . . . . . . . . . . . . . . . . . 67Figure 5.16 – Dump Tank Concept 1. . . . . . . . . . . . . . . . . . . . . . . . . . . . . . . . . . . . . . . . . . . . . . . . . 68Figure 5.17 – Test Section Concept 2. . . . . . . . . . . . . . . . . . . . . . . . . . . . . . . . . . . . . . . . . . . . . . . . 68Figure 5.18 – Dump Tank Concept 2. . . . . . . . . . . . . . . . . . . . . . . . . . . . . . . . . . . . . . . . . . . . . . . . . 69Figure 5.19 – Test Section Concept 3. . . . . . . . . . . . . . . . . . . . . . . . . . . . . . . . . . . . . . . . . . . . . . . . 69

Figure 5.20 – Operational Reynolds Envelope for the proposed Ludwieg tube. . . . . . . . . 71
LIST OF TABLES
Table 3.1 – Examples of known Ludwieg tubes. . . . . . . . . . . . . . . . . . . . . . . . . . . . . . . . . . . . . . . 25Table 5.1 – Stakeholder needs. . . . . . . . . . . . . . . . . . . . . . . . . . . . . . . . . . . . . . . . . . . . . . . . . . . . . . . 43Table 5.2 – Stakeholder Requirements . . . . . . . . . . . . . . . . . . . . . . . . . . . . . . . . . . . . . . . . . . . . . . . 44Table 5.3 – Project Requirements . . . . . . . . . . . . . . . . . . . . . . . . . . . . . . . . . . . . . . . . . . . . . . . . . . . . 46Table 5.4 – Atmospheric air properties for specific altitude levels. . . . . . . . . . . . . . . . . . . . . . 49Table 5.5 – Temperature and pressure losses. . . . . . . . . . . . . . . . . . . . . . . . . . . . . . . . . . . . . . . . 58Table 5.6 – Proposed Ludwieg tube key parameters. . . . . . . . . . . . . . . . . . . . . . . . . . . . . . . . . . 59Table 5.7 – Driver section main mechanical specifications. . . . . . . . . . . . . . . . . . . . . . . . . . . . 62Table 5.8 – Static temperatures, dynamic viscosity’s and enthalpy levels for the attain-
able test section flows inside the Reynolds number Envelope. . . . . . . . . . . . . 71Table 5.9 – Unit Reynolds range comparison with another Ludwieg tubes. . . . . . . . . . . . . 72Table 5.10 – Unit Reynolds and dynamic viscosity for different altitude levels at Mach
5. . . . . . . . . . . . . . . . . . . . . . . . . . . . . . . . . . . . . . . . . . . . . . . . . . . . . . . . . . . . . . . . . . . . . . . . 72

LIST OF ABBREVIATIONS AND ACRONYMS
AFRL Air Force Research Laboratory
ASME The American Society of Mechanical Engineers
BL Boundary Layer
CFD Computational Fluid Dynamics
DC Direct-connect
ESA European Space Agency
FJ Free-jet
IEAv Institute for Advanced Studies
MOC Method of Characteristics
NASA National Aeronautics and Space Administration
REQ Requirement
SOI System of Interest
ST K Stakeholder
T 3 Hypersonic Shock Tunnel T3
T RL Technology Readiness Level
TU Technical University
UFSM Universidade Federal de Santa Maria
USAFA United States Air Force Academy
UT SA University of Texas San Antonio

LIST OF SYMBOLS
A Cross-section area
ADT Driver cross-section area
A∗ Nozzle throat cross-section area
bi Internal mechanical tolerance
C Sutherland constant
c Local sound speed
d0 Driver internal diameter
d2 Nozzle exit diameter
d3 Test section internal diameter
e Driver wall thickness
γ Specific heats ratio
H Altitude
h Enthalpy
h0 Stagnation enthalpy
LDT Driver section length
lmax Maximum test model width
M Mach number
MDT Driver section Mach number
µ Dynamic viscosity
µre f Reference dynamic viscosity
t test time
P Static pressure
P0 Stagnation pressure
Pi Pre-run pressure
R Gas constant
Re Reynolds Number
ρ Density

ρ0 Stagnation density
ρi Pre-run density
S.F. Safety factor
σallow Allowable stress
σmax Maximum stress
T Static temperature
T0 Stagnation temperature
TDT Driver post-expansion temperature
Ti Pre-run temperature
Tre f Reference temperature
u Flow speed
VDT Driver section hydraulic volume

CONTENTS
1 INTRODUCTION . . . . . . . . . . . . . . . . . . . . . . . . . . . . . . . . . . . . . . . . . . . . . . . . . . . . . . . . . . . . . 142 OBJECTIVES AND JUSTIFICATION . . . . . . . . . . . . . . . . . . . . . . . . . . . . . . . . . . . . . . . . . 183 BIBLIOGRAPHY REVIEW. . . . . . . . . . . . . . . . . . . . . . . . . . . . . . . . . . . . . . . . . . . . . . . . . . . . 193.1 PULSED WIND TUNNELS . . . . . . . . . . . . . . . . . . . . . . . . . . . . . . . . . . . . . . . . . . . . . . . . . . . . . . . . . 193.1.1 Shock Tubes and Shock Tunnels . . . . . . . . . . . . . . . . . . . . . . . . . . . . . . . . . . . . . . . . . . . . . . . . 193.1.2 Expansion Tubes . . . . . . . . . . . . . . . . . . . . . . . . . . . . . . . . . . . . . . . . . . . . . . . . . . . . . . . . . . . . . . . . . . . 213.2 CONTINUOUS SUPERSONIC WIND TUNNELS . . . . . . . . . . . . . . . . . . . . . . . . . . . . . . . . . 223.3 WIND-TUNNEL CONCEPT SELECTION. . . . . . . . . . . . . . . . . . . . . . . . . . . . . . . . . . . . . . . . . . 233.4 INTRODUCING THE LUDWIEG TUBE . . . . . . . . . . . . . . . . . . . . . . . . . . . . . . . . . . . . . . . . . . . . 233.4.1 Ludwieg Tube Main Features . . . . . . . . . . . . . . . . . . . . . . . . . . . . . . . . . . . . . . . . . . . . . . . . . . . . . 243.4.2 Ludwieg Tube facilities worldwide . . . . . . . . . . . . . . . . . . . . . . . . . . . . . . . . . . . . . . . . . . . . . . . 253.5 LUDWIEG TUBE . . . . . . . . . . . . . . . . . . . . . . . . . . . . . . . . . . . . . . . . . . . . . . . . . . . . . . . . . . . . . . . . . . . . 263.5.1 Driver . . . . . . . . . . . . . . . . . . . . . . . . . . . . . . . . . . . . . . . . . . . . . . . . . . . . . . . . . . . . . . . . . . . . . . . . . . . . . . . . 263.5.2 Diaphragm . . . . . . . . . . . . . . . . . . . . . . . . . . . . . . . . . . . . . . . . . . . . . . . . . . . . . . . . . . . . . . . . . . . . . . . . . . 293.5.3 Fast Action Valve . . . . . . . . . . . . . . . . . . . . . . . . . . . . . . . . . . . . . . . . . . . . . . . . . . . . . . . . . . . . . . . . . . . 303.5.4 Nozzle . . . . . . . . . . . . . . . . . . . . . . . . . . . . . . . . . . . . . . . . . . . . . . . . . . . . . . . . . . . . . . . . . . . . . . . . . . . . . . . 313.5.4.1 Nozzle Contour Design . . . . . . . . . . . . . . . . . . . . . . . . . . . . . . . . . . . . . . . . . . . . . . . . . . . . . . . . . . . . . 323.5.5 Test Section . . . . . . . . . . . . . . . . . . . . . . . . . . . . . . . . . . . . . . . . . . . . . . . . . . . . . . . . . . . . . . . . . . . . . . . . . 333.5.6 Diffuser . . . . . . . . . . . . . . . . . . . . . . . . . . . . . . . . . . . . . . . . . . . . . . . . . . . . . . . . . . . . . . . . . . . . . . . . . . . . . . 343.5.7 Dump Tank . . . . . . . . . . . . . . . . . . . . . . . . . . . . . . . . . . . . . . . . . . . . . . . . . . . . . . . . . . . . . . . . . . . . . . . . . . 353.6 LUDWIEG TUBE OPERATION . . . . . . . . . . . . . . . . . . . . . . . . . . . . . . . . . . . . . . . . . . . . . . . . . . . . . 353.6.1 Governing Equations . . . . . . . . . . . . . . . . . . . . . . . . . . . . . . . . . . . . . . . . . . . . . . . . . . . . . . . . . . . . . . 363.6.1.1 Quasi-Unidimensional Isentropic Compressible Flow . . . . . . . . . . . . . . . . . . . . . . . . . . . . . 363.6.1.2 Isentropic Flow with Area Change . . . . . . . . . . . . . . . . . . . . . . . . . . . . . . . . . . . . . . . . . . . . . . . . . . 373.6.1.3 Area-Mach Relation . . . . . . . . . . . . . . . . . . . . . . . . . . . . . . . . . . . . . . . . . . . . . . . . . . . . . . . . . . . . . . . . . 383.6.1.4 Energy Equation . . . . . . . . . . . . . . . . . . . . . . . . . . . . . . . . . . . . . . . . . . . . . . . . . . . . . . . . . . . . . . . . . . . . . 393.6.1.5 Initial Driver Tube Conditions . . . . . . . . . . . . . . . . . . . . . . . . . . . . . . . . . . . . . . . . . . . . . . . . . . . . . . . 394 METHODOLOGY. . . . . . . . . . . . . . . . . . . . . . . . . . . . . . . . . . . . . . . . . . . . . . . . . . . . . . . . . . . . . 414.1 CONCEPT STAGE . . . . . . . . . . . . . . . . . . . . . . . . . . . . . . . . . . . . . . . . . . . . . . . . . . . . . . . . . . . . . . . . . . 414.2 DEVELOPMENT STAGE . . . . . . . . . . . . . . . . . . . . . . . . . . . . . . . . . . . . . . . . . . . . . . . . . . . . . . . . . . . 425 RESULTS AND ANALYSIS . . . . . . . . . . . . . . . . . . . . . . . . . . . . . . . . . . . . . . . . . . . . . . . . . . . 435.1 CONCEPT STAGE . . . . . . . . . . . . . . . . . . . . . . . . . . . . . . . . . . . . . . . . . . . . . . . . . . . . . . . . . . . . . . . . . . 435.2 DEVELOPMENT STAGE . . . . . . . . . . . . . . . . . . . . . . . . . . . . . . . . . . . . . . . . . . . . . . . . . . . . . . . . . . . 465.2.1 Operation Requirements . . . . . . . . . . . . . . . . . . . . . . . . . . . . . . . . . . . . . . . . . . . . . . . . . . . . . . . . . . 485.2.1.1 High-Speed Flight Conditions . . . . . . . . . . . . . . . . . . . . . . . . . . . . . . . . . . . . . . . . . . . . . . . . . . . . . . . 485.2.1.2 Reynolds number Similarity . . . . . . . . . . . . . . . . . . . . . . . . . . . . . . . . . . . . . . . . . . . . . . . . . . . . . . . . . 495.2.1.3 Driver Tube Stagnation Conditions . . . . . . . . . . . . . . . . . . . . . . . . . . . . . . . . . . . . . . . . . . . . . . . . . 515.2.1.4 Driver Tube Mach number . . . . . . . . . . . . . . . . . . . . . . . . . . . . . . . . . . . . . . . . . . . . . . . . . . . . . . . . . . 535.2.2 Mechanical Project . . . . . . . . . . . . . . . . . . . . . . . . . . . . . . . . . . . . . . . . . . . . . . . . . . . . . . . . . . . . . . . . . 585.2.2.1 Key Parameters of the Facility . . . . . . . . . . . . . . . . . . . . . . . . . . . . . . . . . . . . . . . . . . . . . . . . . . . . . . 585.2.2.2 Material Selection . . . . . . . . . . . . . . . . . . . . . . . . . . . . . . . . . . . . . . . . . . . . . . . . . . . . . . . . . . . . . . . . . . . 605.2.2.3 Components Mechanical Project . . . . . . . . . . . . . . . . . . . . . . . . . . . . . . . . . . . . . . . . . . . . . . . . . . . 615.2.3 Reynolds number Envelope . . . . . . . . . . . . . . . . . . . . . . . . . . . . . . . . . . . . . . . . . . . . . . . . . . . . . . 706 CONCLUSION . . . . . . . . . . . . . . . . . . . . . . . . . . . . . . . . . . . . . . . . . . . . . . . . . . . . . . . . . . . . . . . 73
BIBLIOGRAPHY . . . . . . . . . . . . . . . . . . . . . . . . . . . . . . . . . . . . . . . . . . . . . . . . . . . . . . . . . . . . . 74

APPENIDX A – MUDGE DIAGRAM . . . . . . . . . . . . . . . . . . . . . . . . . . . . . . . . . . . . . . . . . . 78APPENIDX B – CONCEPTUAL VIEW OF THE PROPOSED FACILITY . . . . . . . 80
1 INTRODUCTION
According to Bertin and Cummings (2003) and Anderson (2003a), high-speed flows
greater than sound speed are named supersonic until a rule of thumb limit where speeds
exceed Mach number 5, then entering in the hypersonic regime. When trespassing this
"frontier" distinct phenomena takes place, such as severe viscous interactions and entropy
changes, high temperature heating of the fuselage caused by air friction and the change of
the gas flow properties due to the presence of dissociation and ionization effects.
The related research fields in both supersonic and hypersonic flights have renewed
interest in the current aerospace sector, especially in regard to the development of super-
sonic and hypersonic vehicles. There is a niche available for the use of these technologies
in various applications, such as commercial aviation, defense and access to space. The
interest can be seen through the initiative of several countries that have invested consid-
erable human and financial resources in the development of their own projects or through
international cooperation efforts and partnerships.
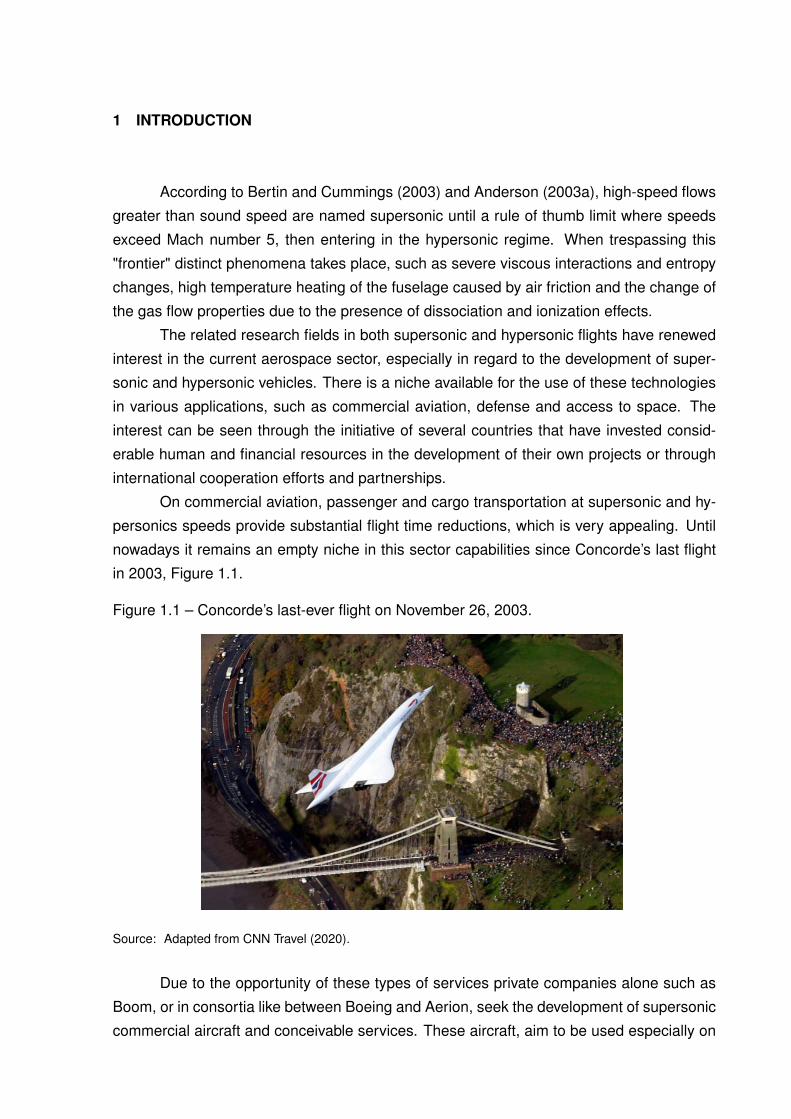
On commercial aviation, passenger and cargo transportation at supersonic and hy-
personics speeds provide substantial flight time reductions, which is very appealing. Until
nowadays it remains an empty niche in this sector capabilities since Concorde’s last flight
in 2003, Figure 1.1.
Figure 1.1 – Concorde’s last-ever flight on November 26, 2003.
Source: Adapted from CNN Travel (2020).
Due to the opportunity of these types of services private companies alone such as
Boom, or in consortia like between Boeing and Aerion, seek the development of supersonic
commercial aircraft and conceivable services. These aircraft, aim to be used especially on
15
transoceanic flight routes, drastically reducing long travel duration times.
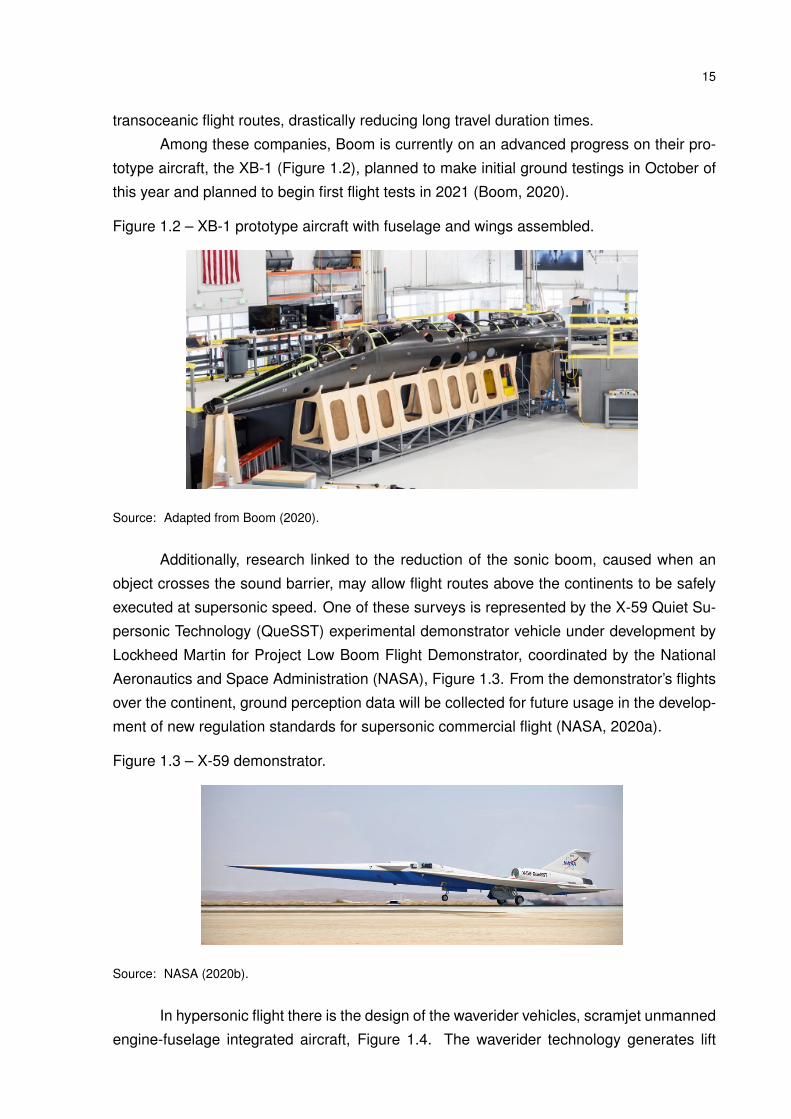
Among these companies, Boom is currently on an advanced progress on their pro-
totype aircraft, the XB-1 (Figure 1.2), planned to make initial ground testings in October of
this year and planned to begin first flight tests in 2021 (Boom, 2020).
Figure 1.2 – XB-1 prototype aircraft with fuselage and wings assembled.
Source: Adapted from Boom (2020).
Additionally, research linked to the reduction of the sonic boom, caused when an
object crosses the sound barrier, may allow flight routes above the continents to be safely
executed at supersonic speed. One of these surveys is represented by the X-59 Quiet Su-
personic Technology (QueSST) experimental demonstrator vehicle under development by
Lockheed Martin for Project Low Boom Flight Demonstrator, coordinated by the National
Aeronautics and Space Administration (NASA), Figure 1.3. From the demonstrator’s flights
over the continent, ground perception data will be collected for future usage in the develop-
ment of new regulation standards for supersonic commercial flight (NASA, 2020a).
Figure 1.3 – X-59 demonstrator.
Source: NASA (2020b).
In hypersonic flight there is the design of the waverider vehicles, scramjet unmanned
engine-fuselage integrated aircraft, Figure 1.4. The waverider technology generates lift

16
from the high pressure region at the bottom of the vehicle due to an attached shock wave
generated on high-speed atmospheric flight. The captured flow is further compressed by
the engine inlet and entering the combustion chamber with desired conditions. Airbreath-
ing scramjet propulsion systems provide better efficiency for atmospheric hypersonic flight
(ROMANELLI et al., 2011; TORO et al., 2012).
Figure 1.4 – Brazilian 14-X waverider vehicle conceptual representation.
Source: Toro et al. (2012).
Beginning in the 1960’s, many programs were created to verify scramjet systems.
Among these, the National Aero-Space Plane (NASP) was an ambitious application for the
scramjet propulsion in the development of a Single-Stage-to-Orbit (SSTO) platform for more
cost-efficient space access. An hypersonic plane with multi-cycle propulsion capable to
take-off in conventional runways, gain enough velocity to deliver payloads in orbit and return
for landing. Capabilities foreseen to provide more efficiency and cut costs comparatively to
traditional rocket launchers (BERTIN; CUMMINGS, 2003). However, despite the amount of
developed technology as heritage from this particular project, its objective is still very far
away from the necessary capabilities.
Still, even tough some programs did not succeed, the amount of research and re-
sources invested in high-speed technologies since that time paved the way of the modern
knowledge in this field, including the modern treatment of high-speed flows, aerothermody-
namics and airbreathing propulsion systems (BERTIN; CUMMINGS, 2003).
17
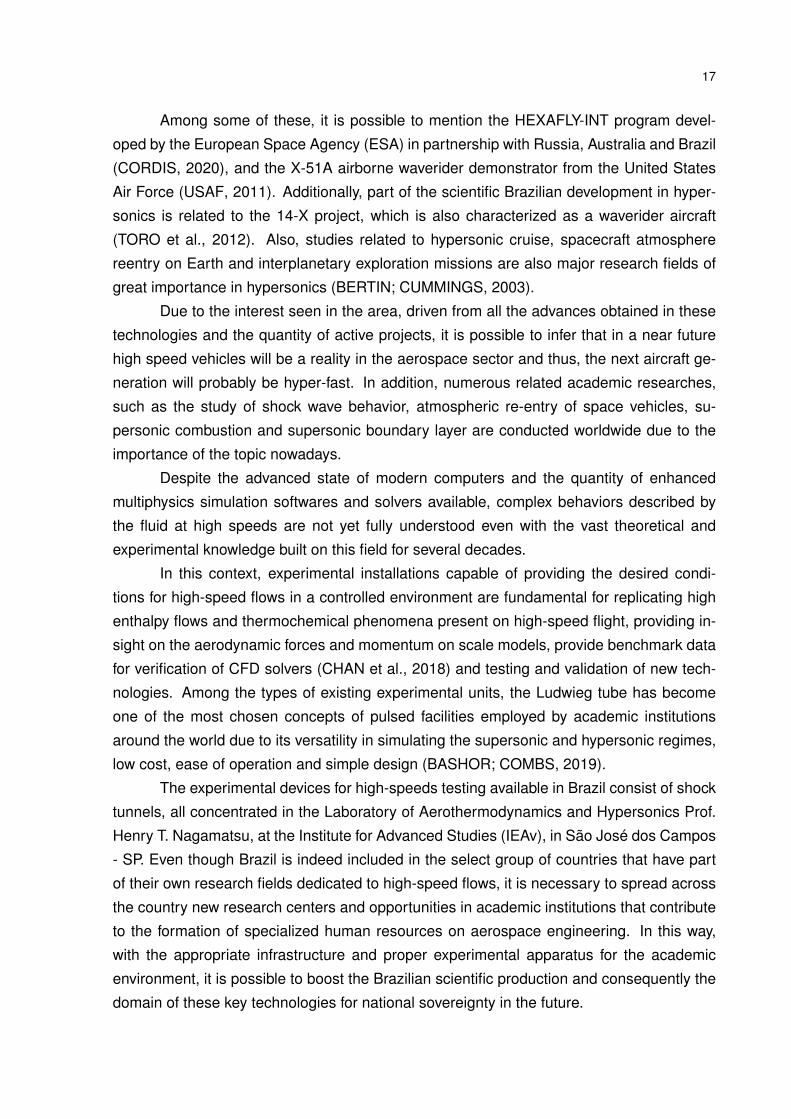
Among some of these, it is possible to mention the HEXAFLY-INT program devel-
oped by the European Space Agency (ESA) in partnership with Russia, Australia and Brazil
(CORDIS, 2020), and the X-51A airborne waverider demonstrator from the United States
Air Force (USAF, 2011). Additionally, part of the scientific Brazilian development in hyper-
sonics is related to the 14-X project, which is also characterized as a waverider aircraft
(TORO et al., 2012). Also, studies related to hypersonic cruise, spacecraft atmosphere
reentry on Earth and interplanetary exploration missions are also major research fields of
great importance in hypersonics (BERTIN; CUMMINGS, 2003).
Due to the interest seen in the area, driven from all the advances obtained in these
technologies and the quantity of active projects, it is possible to infer that in a near future
high speed vehicles will be a reality in the aerospace sector and thus, the next aircraft ge-
neration will probably be hyper-fast. In addition, numerous related academic researches,
such as the study of shock wave behavior, atmospheric re-entry of space vehicles, su-
personic combustion and supersonic boundary layer are conducted worldwide due to the
importance of the topic nowadays.
Despite the advanced state of modern computers and the quantity of enhanced
multiphysics simulation softwares and solvers available, complex behaviors described by
the fluid at high speeds are not yet fully understood even with the vast theoretical and
experimental knowledge built on this field for several decades.
In this context, experimental installations capable of providing the desired condi-
tions for high-speed flows in a controlled environment are fundamental for replicating high
enthalpy flows and thermochemical phenomena present on high-speed flight, providing in-
sight on the aerodynamic forces and momentum on scale models, provide benchmark data
for verification of CFD solvers (CHAN et al., 2018) and testing and validation of new tech-
nologies. Among the types of existing experimental units, the Ludwieg tube has become
one of the most chosen concepts of pulsed facilities employed by academic institutions
around the world due to its versatility in simulating the supersonic and hypersonic regimes,
low cost, ease of operation and simple design (BASHOR; COMBS, 2019).
The experimental devices for high-speeds testing available in Brazil consist of shock
tunnels, all concentrated in the Laboratory of Aerothermodynamics and Hypersonics Prof.
Henry T. Nagamatsu, at the Institute for Advanced Studies (IEAv), in São José dos Campos
- SP. Even though Brazil is indeed included in the select group of countries that have part
of their own research fields dedicated to high-speed flows, it is necessary to spread across
the country new research centers and opportunities in academic institutions that contribute
to the formation of specialized human resources on aerospace engineering. In this way,
with the appropriate infrastructure and proper experimental apparatus for the academic
environment, it is possible to boost the Brazilian scientific production and consequently the
domain of these key technologies for national sovereignty in the future.

2 OBJECTIVES AND JUSTIFICATION
The primary objective of this work is the development of a preliminary project of a
Ludwieg tube for academic research related to high-speed flows, which can be both used
for national experimental research production in this field and for didactic purposes. This
main objective is linked to secondary objectives of major relevance, described below.
First, identify needs and formulate requirements that the Ludwieg tube must accom-
plish concisely. With the entire process integrated to a system of interest (SOI) life-cycle
initial stages as in a systems engineering method. The goal is to provide a terse project
guidance, listing the variables taken into account and justification of the design choices un-
der requirements constraints. These requirements were used to select the Ludwieg tube
concept among the other types of pulsed wind-tunnels studied during the literature review.
The selection
Second, demonstrate the analyzes applied to the key facility parameters - such as
Mach number, driver Mach number, stagnation conditions, components dimensions, test-
run duration, and understand their interactions with the sets of requirements as well as their
impact into operational range, affordability and capabilities of the system.
Third, investigate similar current functional pulsed facilities aiming their design char-
acteristics and experimental qualities, with the respective objectives of identifying possible
trade-offs as well as insight of valid design choices. It is also done to evaluate the initial
operational aspects obtained by the Ludwieg tube designed compared to existent ones.
The motivation of this work is to contribute for the development of an experimen-
tal apparatus to equip a future high-speed compressible flow laboratory at Universidade
Federal de Santa Maria (UFSM), improving the infrastructure for experimental research
and employing it as teaching tool for aerospace engineering students as well as related
courses. Furthermore, this project is also carried out to provide insight about typical re-
quirements associated to these facilities as a mean to approach one step closer to a reality
where this, or other similar wind tunnels, can be conceived in other academic institutions
in Brazil. This way, generating scientific and technological contributions for the high-speed
flow field of knowledge along with the contributions to the aerospace sector in the country
as well as training and specialization of human resources.

3 BIBLIOGRAPHY REVIEW
According to Chung (2015), experimental apparatus for testing high-speed flows can
be divided into two groups: direct-connect (DC) and free-jet (FJ) facilities. DC units are used
to simulate the flow conditions in the combustion chamber and the analysis of the combus-
tion itself (fuel mixture, spark and flame). For such studies, the total pressure required to
operate the facility is not too high. Usually the DC units provide a longer test time, however
it is not possible to simulate the influence of the engine inlet on the experiment. FJ units,
on the other hand, simulate the flow over the body surface, and from these it is possible
to provide similarity of atmospheric flight conditions. However, it is necessary to store the
test gas under higher pressure, which implies more robust installations. Furthermore, re-
strictions on available facility space and operating costs are limiting factors for testing time.
Pulsed facilities can be used in both ways, depending in the adaptations made during the
design phase.
3.1 PULSED WIND TUNNELS
Generating high-speed flows in laboratory demands high energy and a gas supply to
generate the desired flow conditions. Those can be achieved, but due to most facilities con-
straints, the high-speed flows can be maintained just for a very small time period, between
microseconds and milliseconds. Because of the short experimental run times, those facili-
ties are known as pulsed wind tunnels. In the following subsections, some of the principal
types of facilities apart from the Ludwieg tube are presented.
3.1.1 Shock Tubes and Shock Tunnels
The shock tube consists of a duct subdivided between a high pressure gas reservoir
and another underlying low pressure section fulfilled with a test gas, named driver and
driven respectively. Both sections are separated by a diaphragm employed as a physical
barrier. When it suddenly breaks, the driver gas expands into the driven section, acting
similarly as a piston, and a normal shock wave is generated, propagating through the test
gas, which experiences strong accelerations and increase in its properties (pressure and
temperature). At the same time a series of wave expansions travels upstream towards the
driver end. Shock tubes are mainly used for thermodynamics and chemical equilibrium
research on reactive flows, such as studies including gas dissociation rate, over test times
in the scale of microseconds (IGRA; HOUAS, 2016; BRUN, 2011).
20
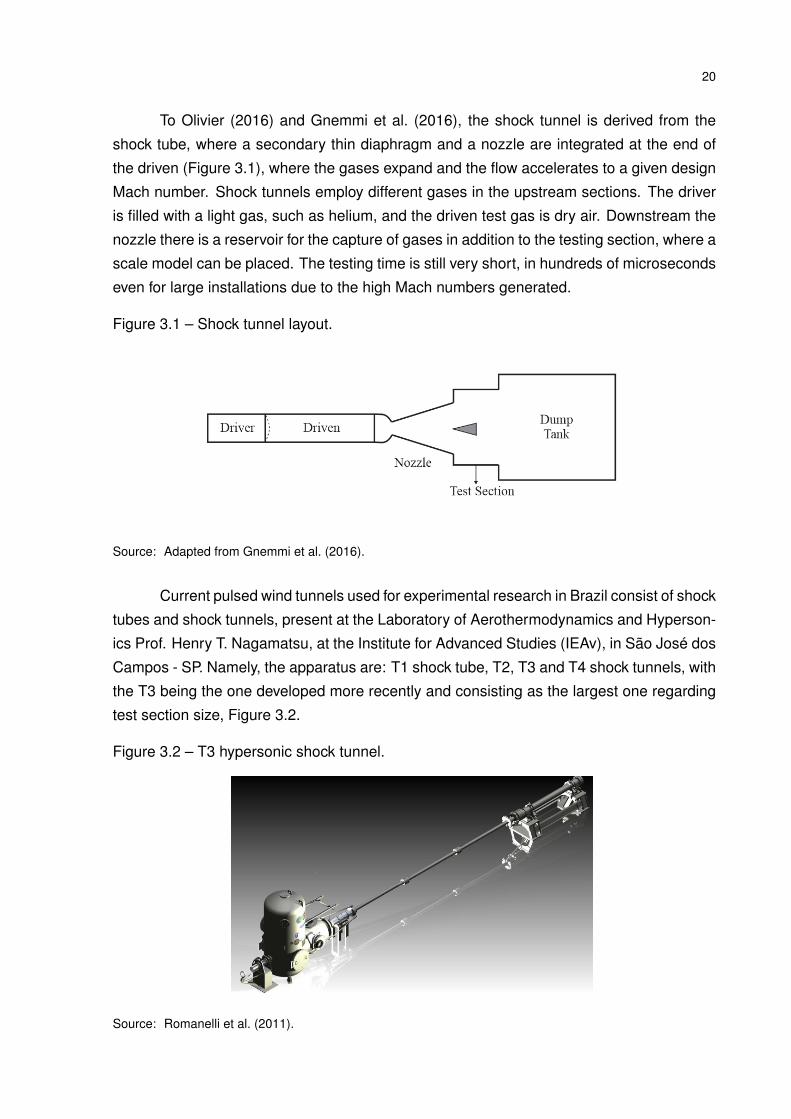
To Olivier (2016) and Gnemmi et al. (2016), the shock tunnel is derived from the
shock tube, where a secondary thin diaphragm and a nozzle are integrated at the end of
the driven (Figure 3.1), where the gases expand and the flow accelerates to a given design
Mach number. Shock tunnels employ different gases in the upstream sections. The driver
is filled with a light gas, such as helium, and the driven test gas is dry air. Downstream the
nozzle there is a reservoir for the capture of gases in addition to the testing section, where a
scale model can be placed. The testing time is still very short, in hundreds of microseconds
even for large installations due to the high Mach numbers generated.
Figure 3.1 – Shock tunnel layout.
Source: Adapted from Gnemmi et al. (2016).
Current pulsed wind tunnels used for experimental research in Brazil consist of shock
tubes and shock tunnels, present at the Laboratory of Aerothermodynamics and Hyperson-
ics Prof. Henry T. Nagamatsu, at the Institute for Advanced Studies (IEAv), in São José dos
Campos - SP. Namely, the apparatus are: T1 shock tube, T2, T3 and T4 shock tunnels, with
the T3 being the one developed more recently and consisting as the largest one regarding
test section size, Figure 3.2.
Figure 3.2 – T3 hypersonic shock tunnel.
Source: Romanelli et al. (2011).
21
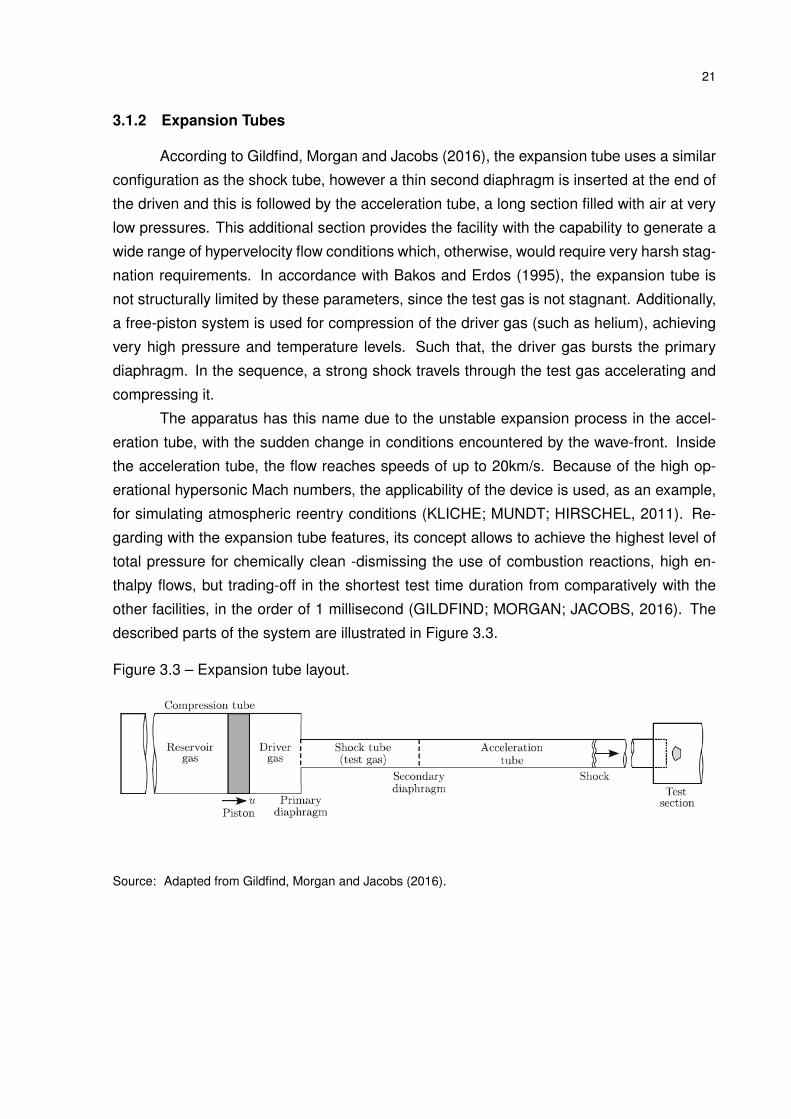
3.1.2 Expansion Tubes
According to Gildfind, Morgan and Jacobs (2016), the expansion tube uses a similar
configuration as the shock tube, however a thin second diaphragm is inserted at the end of
the driven and this is followed by the acceleration tube, a long section filled with air at very
low pressures. This additional section provides the facility with the capability to generate a
wide range of hypervelocity flow conditions which, otherwise, would require very harsh stag-
nation requirements. In accordance with Bakos and Erdos (1995), the expansion tube is
not structurally limited by these parameters, since the test gas is not stagnant. Additionally,
a free-piston system is used for compression of the driver gas (such as helium), achieving
very high pressure and temperature levels. Such that, the driver gas bursts the primary
diaphragm. In the sequence, a strong shock travels through the test gas accelerating and
compressing it.
The apparatus has this name due to the unstable expansion process in the accel-
eration tube, with the sudden change in conditions encountered by the wave-front. Inside
the acceleration tube, the flow reaches speeds of up to 20km/s. Because of the high op-
erational hypersonic Mach numbers, the applicability of the device is used, as an example,
for simulating atmospheric reentry conditions (KLICHE; MUNDT; HIRSCHEL, 2011). Re-
garding with the expansion tube features, its concept allows to achieve the highest level of
total pressure for chemically clean -dismissing the use of combustion reactions, high en-
thalpy flows, but trading-off in the shortest test time duration from comparatively with the
other facilities, in the order of 1 millisecond (GILDFIND; MORGAN; JACOBS, 2016). The
described parts of the system are illustrated in Figure 3.3.
Figure 3.3 – Expansion tube layout.
Source: Adapted from Gildfind, Morgan and Jacobs (2016).

22
3.2 CONTINUOUS SUPERSONIC WIND TUNNELS
Finally, there are also the continuous flow facilities used for tests with large-scale
models and capable to supply high-speed flows for the duration of minutes. However, a
complete infrastructure on a large, dedicated scale is required for this purpose. Due to
the cost involved in the implementation and operation of these facilities they are impractical
for construction in an academic environment. Only a few of them exists around the world.
Figure 3.4 illustrates the continuous wind-tunnel installation from NASA Ames Research
Center (ANDERSON, 2003a).
Figure 3.4 – Continuous wind-tunnel facility from NASA Ames Research Center.
(a) Installation plant.
(b) Test section with large scale model.
Source: Adapted from Anderson (2003a).

23
3.3 WIND-TUNNEL CONCEPT SELECTION
As it is already know by the title of this work, the Ludwieg tube was the selected wind-
tunnel concept for this project. It was chosen in accordance with needs that were formulated
for the facility or, in other words, expected characteristics and capabilities of the system
in order to extract the better possible use of it. A methodology analogous to a systems
engineering approach was implemented to this work, which in the first step establishes a
set of stakeholder needs that guide the main concept selection inside the initial life-cycle
stage of the system. This methodology, needs and justifications are better specified and
discussed in the Results Chapter. However, for the sake of clarity and logical order, this
subject is also brought here. Along the 5 needs formulated, one of them and a specified
design Mach number -that apply for the Ludwieg tube, were judged as fundamental and
sufficient to choose this concept:
• Low-cost of operation.
• Operational design at Mach 5.
Fortunately, this concept also present a series of features - presented in the next
section, that can be exploited to intensify the research potential of the facility and their
benefits among the academic environment.
Concluding, it is good to clarify that each type of high-speed wind-tunnel have their
own operational characteristics. First of all, the concept choice must agree with the desired
needs or demands that are foreseen for the facility, identified as stakeholder needs (i.e.
Mach number range, types of research and costs). The Ludwieg tube presents as a viable
choice for Mach number ranges between low supersonic until around Mach 10 - maximum
value seen for the facilities studied. The test section flow for a "standard" Ludwieg tube
configuration - without using free-piston compression, is cold, near or below 273 K, as a
result of the isentropic expansion of the test gas in the nozzle. The cold temperature is a
limitation for research regarding combustion and other chemical processes. However the
facility still manages to be useful for a wide set of fundamental high-speed aerodynamics
research. All this characteristics are further discussed along this work.
3.4 INTRODUCING THE LUDWIEG TUBE
As exposed in Radespiel et al. (2016), even with several decades of scientific con-
tributions in the study of hypersonic flows, the flow physics behaves in a complex way,
and only the theoretical and numerical models are insufficient to predict the fluid behavior.
Therefore, experimentation is crucial to fulfill the existent gaps and learn the processes.

24
However, it is still difficult to simulate the high speed and the high enthalpy levels that must
occur realistically in high-speed flows. The extreme thermal loads and kinetic energy rate
that follow the enthalpy levels achieved in hypersonic flight can only be fully generated in
a few installations worldwide. And, it comes with the penalty of high operating costs and
a short test times. Because of the challenges bounded to that, many experimental hyper-
sonics research tend to be done on pulsed facilities that at least the Mach number and
Reynolds number can be properly achieved, but with lower enthalpy levels.
In addition to that, according to Cummings and Mclaughlin (2012), hypersonic ground-
based facilities are traditionally expensive to operate and maintain. The operation cost fac-
tor is one of the main obstacles to extensive academic research in hypersonic, such as
the replacement of the test gases, usually light and inert gases are used for the FJ units
described - which are used to deliver a strong shockwave in the test gas in order to attain
the high-temperature requirements (GNEMMI et al., 2016), and the support infrastructure.
Resuming this scenery, the Ludwieg tube was introduced as an novel pulsated high-
speed facility configuration in agreement to some top-level requirements which illustrates
its potential, (RADESPIEL et al., 2016):
• Range of Mach numbers high enough to replicate typical hypersonic flow behaviours
for blunt and slender configurations.
• Provide Reynolds number in order of 15× 106 based on model scale to simulate of
both laminar and turbulent flows.
• Test times as high as 100 milliseconds to enable the usage of many flow measure-
ments techniques.
• Provide affordable operational costs.
3.4.1 Ludwieg Tube Main Features
Compared to the other pulsated facilities the Ludwieg tube presents the following
advantages (RADESPIEL et al., 2016; KIMMEL et al., 2016; CUMMINGS; MCLAUGHLIN,
2012):
• Simple design and minimal support infrastructure required.
• Generation of extremely clean and high quality flows.
• Generation of high-speed flow conditions using only dry air as test gas, dismissing
the use of inert gases such as helium.
• Longer test times in the order of 100 milliseconds.

25
• The higher test time enables the use of valve instead of consumable diaphragms
further reducing the operation costs and the time interval between shots.
3.4.2 Ludwieg Tube facilities worldwide
Due to the performance and the advantages inherent to the Ludwieg tube configura-
tion, many academic institutions and research centers around the world employ the device.
A list of some of the known facilities is showed below, with their specifications of affordable
Mach number (M) and test section diameter, Table 3.1:
Table 3.1 – Examples of known Ludwieg tubes.
Facility Name Location Specifications
RWG DNW Göttingen, GermanyM = 2.9 to 6.90.50m diameter test section
Ludwieg Tube Caltech, USAM = 2.30.2m x 0.2m test section
Boeing/AFOSRQuiet Tunnel
Purdue University, USAM = 60.24m diameter test section
TUSQUniversity of Southern Queensland,Australia
M = 60.22m diameter test section
HHKTU Braunschweig,Germany
M = 6 to 110.50m diameter test section
YT1 TubeCentral AerohydrodynamicInstitute, Russia
M = 5 to 100.50m diameter test section
USAFAUS Air Force Academy,USA
M = 60.50m diameter test section
AFRLAir Force Research Laboratory,USA
M = 61.2m diameter test section
Source: (KIMMEL et al., 2016; CUMMINGS; MCLAUGHLIN, 2012; KOPPENWALLNER, 2000; DAVID et al.,2006; WIDODO; BUTTSWORTH, 2010).
After the investigation on some Ludwieg tubes employed by preeminent academic
institutions it is clear that this unit consists of a popular experimental apparatus and has
several advantages in comparison to other FJ pulsed wind-tunnels units. In special, the
affordability of this type of facility and the available test time, compared to others are the
main attributes.
26
3.5 LUDWIEG TUBE
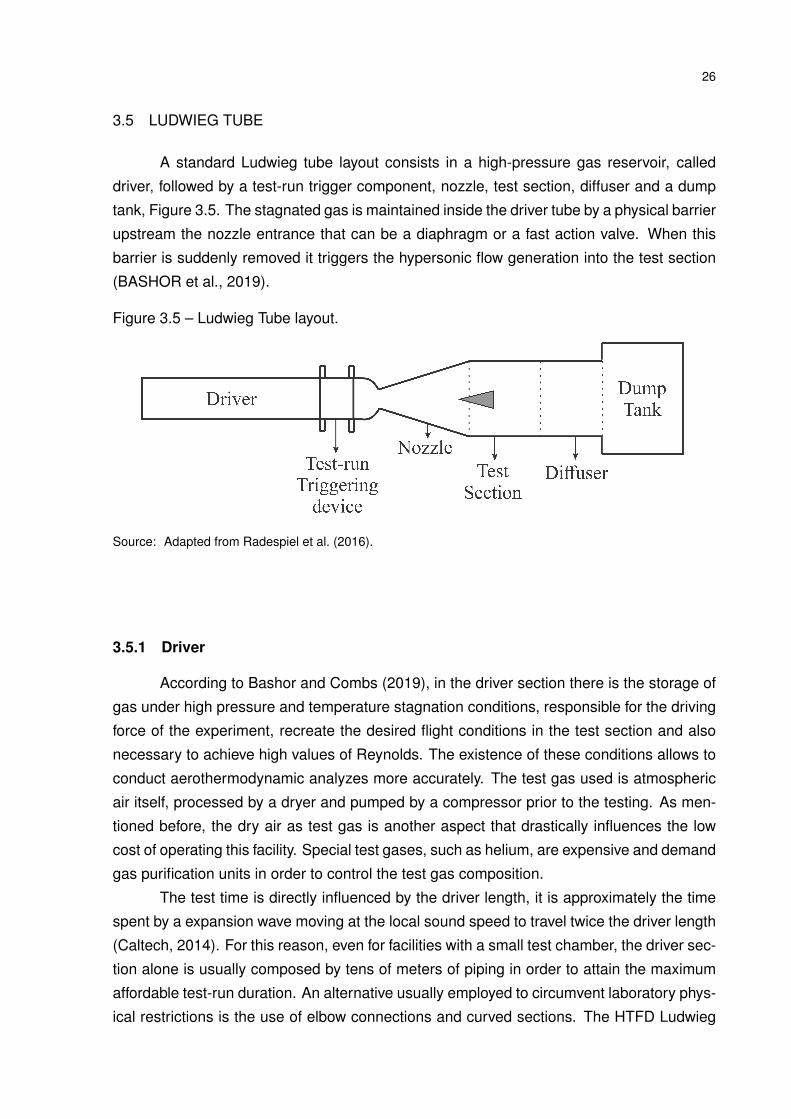
A standard Ludwieg tube layout consists in a high-pressure gas reservoir, called
driver, followed by a test-run trigger component, nozzle, test section, diffuser and a dump
tank, Figure 3.5. The stagnated gas is maintained inside the driver tube by a physical barrier
upstream the nozzle entrance that can be a diaphragm or a fast action valve. When this
barrier is suddenly removed it triggers the hypersonic flow generation into the test section
(BASHOR et al., 2019).
Figure 3.5 – Ludwieg Tube layout.
Source: Adapted from Radespiel et al. (2016).
3.5.1 Driver
According to Bashor and Combs (2019), in the driver section there is the storage of
gas under high pressure and temperature stagnation conditions, responsible for the driving
force of the experiment, recreate the desired flight conditions in the test section and also
necessary to achieve high values of Reynolds. The existence of these conditions allows to
conduct aerothermodynamic analyzes more accurately. The test gas used is atmospheric
air itself, processed by a dryer and pumped by a compressor prior to the testing. As men-
tioned before, the dry air as test gas is another aspect that drastically influences the low
cost of operating this facility. Special test gases, such as helium, are expensive and demand
gas purification units in order to control the test gas composition.
The test time is directly influenced by the driver length, it is approximately the time
spent by a expansion wave moving at the local sound speed to travel twice the driver length
(Caltech, 2014). For this reason, even for facilities with a small test chamber, the driver sec-
tion alone is usually composed by tens of meters of piping in order to attain the maximum
affordable test-run duration. An alternative usually employed to circumvent laboratory phys-
ical restrictions is the use of elbow connections and curved sections. The HTFD Ludwieg

27
tube at TU Delf presented by Schrijer and Bannink (2010) uses a 29 m long driver divided
into three individual sections, Figure 3.6, reducing the size of the facility.
Figure 3.6 – Detailed HTFD driver sections.
Source: Schrijer and Bannink (2010).
As pointed by Radespiel et al. (2016), the expansion process in the nozzle drastically
reduces the static temperature of the gas. When the high speed flow crosses the divergent
section of the nozzle, the gas expansion process occurs, where its internal energy in the
form of temperature and pressure is converted into kinetic energy. As a result the test
gas can fall below the saturation curve, or the condensation limit. This sudden drop in
temperature can lead to the formation of ice on the instruments and the freezing of the gas,
impairing the data collection and the realism of the experiment. To avoid this phenomenon
the gas should be heated previously in the driver. So, electrical devices are employed for
that, such as insulated heating tapes, heating cables or resistors are used around a portion
or in the whole driver length.
Fundamentally, the operation costs of the Ludwieg tube will be represented by the
energy consumed by the heating devices and auxiliary laboratory equipment. One way to
reduce heating costs is to fix the heating tapes only in the portion of the driver that contains
the mass of gas effectively consumed during the experiment - called hot slug. However, as
explained by Koppenwallner, Müller-Eigner and Friehmelt (1993) and Schrijer and Bannink
(2010), the heated section promotes an internal thermal gradient that must be compensated
by the variation of the driver diameter in the following section in order to avoid disturbances
in the flow with the expansion wave passage, i.e. the expansion wave reflection. The

28
phenomenon can be offset by the conservation of mass flow between both regions, as the
flow velocity changes following the duct diameter. The conservation of the mass flow in the
staged driver, Figure 3.7, is given by,
D1
D2=
(T2
T1
)0.25
(3.1)
which represents an increase in the upstream piping diameter.
Figure 3.7 – Staged driver section with heating.
Source: Author.
However, for higher Mach numbers the stagnation conditions for real flight simulation
cannot be fully achieved by electrical heating. In this way, some installations employ adi-
abatic gas compression carried out by the movement of a piston coupled in an additional
upstream section from the driver, called compression tube, Figure 3.8. The free piston
compression system as present on the T4 shock tunnel at Queensland University provides
the high pressure and temperature stagnation levels while also maintaining the flow clean
- without using chemical reactions or combustion processes to do so. The Pre-Heated
Ludwieg Tube with Isentropic Compression (PHLIC) configuration is described by Chung
(2015) and Chung, Houim and Laurence (2015).
Figure 3.8 – PHLIC configuration concept.
Source: Adapted from Chung, Houim and Laurence (2015).

29
3.5.2 Diaphragm
According to Hoffman and Combs (2019), the beginning of the experiment occurs
when the gas from the driver is accelerated through the nozzle. This occurs from the rupture
of a diaphragm or the opening of a valve, exposing the stagnated high pressure gas to the
low pressure region downstream. This pressure gradient then drives the flow.
The diaphragms are usually fixed at the end of the driver tube. Although some pul-
sated facilities can use the diaphragm downstream the test section such as in the GALCIT
Ludwieg tube. One advantage of this design is that a quieter flow can be produced, (Cal-
tech, 2014).
The burst pressure is defined according to the base material used for manufacture,
ranging from different grades of steel, aluminium or composites such as Mylar. Diaphragms
can be used in two ways: a single diaphragm with only a single rupture disc or double
diaphragm assembly, called buffer. The single diaphragm is coupled between flange con-
nections, and its rupture can occurs simply when the pressure of the test gas reaches the
burst pressure or by the actuation of a puncturing mechanism. As for the double diaphragm,
after the apparatus is integrated, the duct region between the discs is pressurized to a value
below the burst point. The pressure gradient between both inhibits the rupture of the set
while the driver stagnation conditions are still been set. Then, the test is started by depres-
surizing the region between the discs, triggering the rupture. Among both types, the double
diaphragm provides a better rupture control.
One of the critical requirements of this component is to prevent the loosening of
splinters during rupture, as the high speed fragments can damage the instrumentation or
other parts of the structure, as experienced by Martos (2014).
A procedure done into the components to both ensure flow quality after rupture
and prevent fragmentation is machining crossed grooves on one of the diaphragm faces.
The grooves will help guiding the diaphragm aperture in "petals" shape. The grooved face
shall be positioned facing the lower pressure side (MARTOS, 2014). Figure 3.9 presents
diaphragms before and after a test run.
For Kimmel et al. (2016), another way around the diaphragm fragmentation problem
is positioning the part after the test section, however there are other associated disadvan-
tages such as the need to charging the pressure from the driver until the test section.

30
Figure 3.9 – Prepared grooved diaphragm (left) and burst diaphragm after test run (right).
Source: Martos (2014).
3.5.3 Fast Action Valve
Many modern Ludwieg tubes feature a quick-acting valve replacing the diaphragm,
or are designed to use both. According to Radespiel et al. (2016) the use of a valve allows to
minimize the operations costs as does not consume diaphragms at every test. Diaphragms
are usually cheap, so the main advantages regarding its exchange for a fast action valve, is
to eliminate the risks associated to loosen fragments and an enhanced test-run control. The
fast action valve design presented by Koppenwallner, Müller-Eigner and Friehmelt (1993),
Figure 3.10, is adopted by several facilities.
According to Lindorfer et al. (2016), since the 1990’s a number of Hoscschal-Hyper-
schall-Kanal (HHK) Ludwieg tubes designed by Hyperschall Technologie Göttingen re-
search company employs fast-acting valves. The facilities currently operate at some uni-
versities in Europe such as University of Bremen, Technical University (TU) of Delft (the
DEFLT Ludwieg tube mentioned previously), TU Dresden and TU Braunschweig, as well as
the Mach 6 Ludwieg tube from USAFA at United States. This information is relevant since
the component was not found at market by the research done during this work.
The operation principle of the valve consists of a piston aligned to the flow direction,
whose pneumatic actuation is done by controlling the back pressure behind the piston,
inside the piston housing. In the closed configuration, the piston docks near the nozzle
throat blocking the flow passage (RADESPIEL et al., 2016).
For this, according to Cummings and Mclaughlin (2012), the piston is locked in place
by the driver pressure which is transmitted by a bypass valve and a control tube behind the
piston body. The piston is quickly opened by closing the bypass valve and opening an
exhaust valve via a computer command. This system allows the valve opening time as fast
as 10 milliseconds.

31
Figure 3.10 – Fast action valve component representation in a longitudinal cut view.
Source: Adapted from Radespiel et al. (2016).
3.5.4 Nozzle
The nozzle is designed to accelerate the flow from stagnation conditions to the de-
sired Mach number, controlled by the the area ratio relation between the throat and nozzle
exit cross sections (ANDERSON, 2003a). Some facilities are designed to cover a range
of Mach numbers, for that the nozzle section is designed in a modular way to be easily
replaced.
The nozzle configuration used in the Ludwieg tube is a convergent-divergent nozzle,
or De Laval nozzle. In the convergent section, the flow is accelerated almost from rest to
sonic regime and then in the divergent section accelerated to high-speeds. The efficient
operation of the nozzle depends of the existent pressure ratio in the system to drive the
gas. For this matter, the internal gas of the downstream sections after the driver is removed
by vacuum pumps in order to minimize the back-pressure. This helps to reduce the pre-run
driver requirements to achieve the desired test conditions (ANDERSON, 2003a).
In consequence of the low pressure at the nozzle exit, the flow will exit at the under-
expanded condition. For this matter, it is a good practice to adjust the nozzle exit diameter
to be less than the test section cross section so the remaining expansion process can de-
velop away from the model. Due to the expansion and viscous effects near the walls the
useful region where the desired test conditions are achieved are concentrated near the test
section centerline. This region is known as the core flow region. In the CFD Mach number
colormap results obtained from Radespiel et al. (2016) Mach number 6 nozzle is possible
to visualize the core flow region, Figure 3.11.

32
Figure 3.11 – Core flow region in a Mach number 6 contoured nozzle exit.
Source: Adapted from Radespiel et al. (2016).
3.5.4.1 Nozzle Contour Design
Conical nozzles present the same wall angle through the whole length, thus are
simple to manufacture. A 15◦ half angle is a standard choice for conical nozzle design
as the component does not become very long and the exit Mach number is attained. For
instance, the T3 shock-tunnel employs a 15◦ half-angle conical nozzle with interchangeable
throats for Mach numbers ranging from 6 to 25. The expansion section is segmented in four
different pieces fabricated with medium carbon steel and aluminium, Figure 3.12 (TORO et
al., 2006).
Figure 3.12 – T3 conical nozzle assembly (left) and modular nozzle throat section (right).
Source: Adapted from Toro et al. (2006).
The main issue of this design is related to nonparallel velocity components at the
exit area that causes performance losses. Bell shaped nozzles or De Laval nozzles were
developed to further increase performance giving more uniformity for the exit flow (SINGH,
2015).
These contoured nozzles are often obtained through the Method of Characteristics
(MOC). The generation of a smooth contour propitiates the expansion process through

33
small expansion waves and uniformity of the streamlines at the exit area. Low intensity
compression waves might propagate within the flow, however the idealised MOC is set to
cancel this energy dissipation and propitiates the expansion process occurs with minimum
losses (MURNAGHAN, 2019).
The ideal nozzle produces uniform parallel flow at exit and the expansion process
occurs isentropically. The maximum thrust is generated with the exit pressure is designed to
match the ambient pressure (SINGH, 2015). Those factors (flow uniformity and maximum
thrust) are translated into better flow quality for high-speed wind tunnels and performance
increase for aerospace vehicles. However ideal nozzles are typically very long due the
low angle variation induced to not disturb the flow. Because of that, these nozzles are not
much feasible for practical applications because of their high manufacture cost and weight.
Propulsion systems instead prefer to use truncated nozzles or even conical nozzles, but
they would typically produce poor flow quality.
The nozzle length problem was mitigated with the aid of optimization techniques, as
the method developed by Rao (1958), employing Lagrangian multipliers together with MOC
while keeping a fixed nozzle length as a design constraint. Components designed by this
method are referred to as thrust optimized contour (TOC) nozzles.
The coupling of MOC and optimization is a powerful tool for hypersonic facilities
nozzles as the flow quality requirement will impact experimental research. The MOC/BL
is another method developed to monitor the growth of the boundary layer along the nozzle
walls. The boundary layer becomes thicker at the exit area which tends to reduce the
effective area, choking the flow, and lowering the attainable Mach number. However this
particular method loses accuracy for higher Mach number regimes where the boundary
layer becomes continuously thicker.
A novel design method was introduced to enhance even more the nozzle design
for pulsed wind tunnels, by the coupling of CFD solver with optimization algorithms. The
Navier-Stokes equations propitiate to compute interactions between core flow and boundary
layer. This way the minimization flow angularity and Mach number deviation leading to
very high quality flow (CHAN et al., 2018). Also, geometric constraints such as throat
diameter and nozzle length can be added, which lead to more flexibility on design and
the development of compact nozzles. One of the challenging aspects of this methodology
however is the massive computational power and time required to perform the simulations.
3.5.5 Test Section
The test section is where the scale models and data gathering instrumentation are
positioned and exposed to the high-speed flow. For that, it shall have adequate room size.
Also, as pointed by Martos (2014) larger diameter test sections provide that the reflected

34
shock waves generated on the test section walls occur far from the model, providing a clear
flow visualization and reliability of the experimental results.
The section is designed with hatched windows on all sides and supports for po-
sitioning sensors and probes. A common window configuration consists on two lateral
opposite windows which can be used for schlieren imaging and a top window for infrared
non-intrusive measurements (RADESPIEL et al., 2016). According to Kimmel et al. (2016),
specifically for the tasks mentioned, fused silica transparency and calcium fluoride compo-
sitions can be used into the windows, respectively. Access ports for wiring and maintenance
are also factors taken in account.
3.5.6 Diffuser
According to Anderson (2003b), the diffuser has the function of slowing the flow after
the test section in order to have the lowest possible total pressure loss. Also, preventing
the flow from reflecting and the downstream end and returning to the test section. This
is done by compressing the flow via a sequence of oblique shock waves, terminated by a
normal low intensity shock wave. The deceleration of the supersonic flow in the diffuser is
done by its convergent geometry in the inlet which causes a sequence of oblique shock to
form at the straight section, terminated by normal shock wave at the end, on which the flow
becomes subsonic. The diffuser operation schematic can is shown in Figure 3.13. Some
pulsed facilities dont’t actually have a diffuser. In theses cases the flow is simply terminated
when entering the dump tank and expanding inside the sudden volume increase
Figure 3.13 – Shockwave formation inside the diffuser.
Source: Adapted from Anderson (2003b).
For Radespiel et al. (2016), another task of the diffuser is to increase the static
pressure downstream the test section to prevent an early flow break caused by increasing
pressure of the dump tank as it is fulfilled with the test gas.

35
3.5.7 Dump Tank
The dump tank is the final volume that stores the gas consumed during the whole
operation time. The volume is designed in order to maintain the final equilibrium pressure
after test-runs as close as possible to the atmospheric pressure. Vacuum pumps are es-
sential laboratory support equipment’s usually connected to the dump tank and are used to
purge the internal gases from the downstream section, lowering the back-pressure before
each experiment. The smaller the back-pressure obtained, the lower the pressure required
on the driver to generate the high-speed flow (ANDERSON, 2003b).
3.6 LUDWIEG TUBE OPERATION
After the diaphragm rupture or the fast valve opening, a shock wave is generated
that produces the desired flow conditions in the test section (LINDORFER et al., 2016).
According to Chung (2015) and Caltech (2014), simultaneously an expansion wave is also
generated, travelling upstream at the local speed of sound towards the driver end. The wave
undergoes a reflection upon reaching the end wall, reversing its motion. Another reflection
then occurs when the wave reaches the nozzle entrance and the process start again. This
dynamic is kept while the equilibrium is not reached. For each wave reflection in the nozzle
there is a reduction of the driver pressure.
The flow conditions in test section gradually change each time the expansion wave
reflects at the nozzle entrance, consisting in the time that the wave expend to travel twice of
the driver length, approximately. Because of these processes, is denoted that the test flow
conditions change in a stepped manner and over the total operating time there are multiple
test runs. Although just in the first one the set of test conditions is the aimed one. The high
speed flow in the test section is sustained while the driver pressure is high enough. The
operation processes are illustrated in Figure 3.14.

36
Figure 3.14 – Representation of the Ludwieg tube test run.
Source: Chung (2015).
The test time for a Ludwieg tube with continuous cross section area can be calculated by,
t =2LDT
c(3.2)
where LDT is the length of driver and c the local speed of sound (KIMMEL et al., 2016). Of
the total mass of gas stored, only a portion is properly consumed during the experiment,
which is called test-slug. According to Çengel and Cimbala (2017), the local sound speed
is simply calculated by
c =√
γRT (3.3)
where γ is the ratio of specific heats for air, R is the gas constant and T the local static
temperature. And, of course, the Mach number M is the adimensional that denotes how
much times the flow velocity u is greater than c in a given position, thus M = u/c.
3.6.1 Governing Equations
3.6.1.1 Quasi-Unidimensional Isentropic Compressible Flow
The high speed flow in the Ludwieg tube after expansion in the nozzle can be con-
sidered as almost one-dimensional since the gradients parallel to the flow have the greatest
magnitude compared to other directions. For Anderson (2003a), what differs the unidimen-
sional from the quasi-unidimensional flow is that for the first case, the area of the cross
37
section of the fluid path is considered strictly constant. While for the quasi-unidimensional
case, variations in the cross section are considered downstream the flow motion and the
changes in the flow properties are consequence of the area change only.
The flow can still be treated as isentropic since that the generation of entropy in the
real system occurs only in the boundary layer region close to the nozzle walls, correspond-
ing to the edges of the fluid domain.
Still, considering that no shock waves are generated in the nozzle and disregarding
friction, the behavior of the steady-state flow in the nozzle is in accordance with Euler’s
one-dimensional equations, from which the energy and continuity equations are obtained.
The expressions that describe the test flow in the Ludwieg tube are valid for isen-
tropic flow, where isentropic processes holds for the majority of the fluid domain. This is
defined in relation with two other thermodynamic concepts:
• Adiabatic Process: there is no heat exchange from the system to the external am-
bient.
• Reversible Process: dissipative effects don’t take place: the effects of viscosity,
thermal conductivity and mass diffusion are negligible.
• Isentropic Process: process that is both adiabatic and reversible.
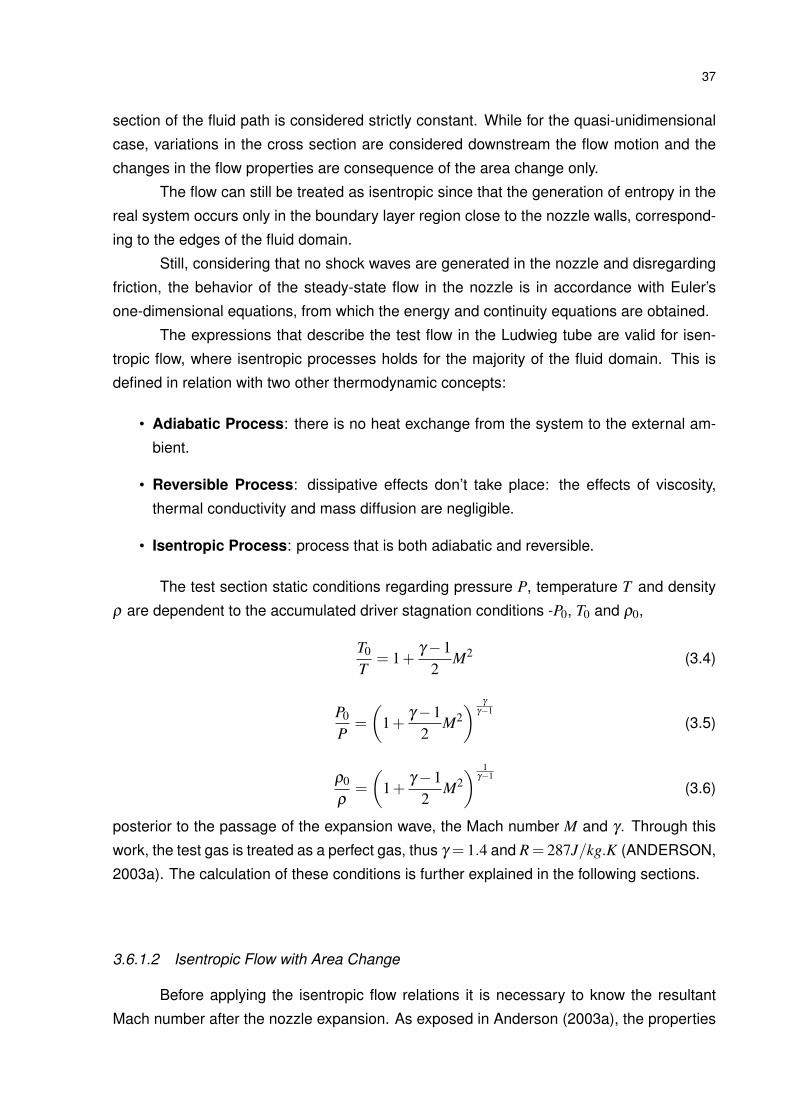
The test section static conditions regarding pressure P, temperature T and density
ρ are dependent to the accumulated driver stagnation conditions -P0, T0 and ρ0,
T0
T= 1+
γ −12
M2 (3.4)
P0
P=
(1+
γ −12
M2) γ
γ−1
(3.5)
ρ0
ρ=
(1+
γ −12
M2) 1
γ−1
(3.6)
posterior to the passage of the expansion wave, the Mach number M and γ . Through this
work, the test gas is treated as a perfect gas, thus γ = 1.4 and R= 287J/kg.K (ANDERSON,
2003a). The calculation of these conditions is further explained in the following sections.
3.6.1.2 Isentropic Flow with Area Change
Before applying the isentropic flow relations it is necessary to know the resultant
Mach number after the nozzle expansion. As exposed in Anderson (2003a), the properties

38
of a ducted isentropic compressible flow can be altered due to area changes, following:
duu
=1
(M2 −1)dAA
(3.7)
dPρu2 =
1(M2 −1)
dAA
(3.8)
dρρ
=−M2 duu
(3.9)
The set of equations denotes the asymmetrical behaviour in the flow properties
for subsonic and supersonic values of Mach number for narrowing and enlargement area
changes. Finding the density/velocity ratio by isolating M2 in 3.9 explains this change be-
haviour due to the conservation of the mass flow rate. For subsonic flows the density dilation
is going to be less than velocity dilatation, so the velocity changes will be dominant among
the compressibility effects. Then, the reduction of area causes the increase in velocity in
order to maintain the flow rate. While for supersonic flows the opposite happens, and an
area decrease causes the velocity to drop (ANDERSON, 2003b).M < 1
∣∣∣dρρ
∣∣∣< ∣∣duu
∣∣M > 1
∣∣∣dρρ
∣∣∣> ∣∣duu
∣∣ (3.10)
3.6.1.3 Area-Mach Relation
The previous analysis explain the utilization of a convergent-divergent nozzle, or
Laval nozzle, to accelerate the stagnated gas to the desired Mach at the nozzle exit. The
Area-Mach Relation as given by,
(AA∗
)2
=1
M2
[2
γ +1
(1+
γ −12
M2)](γ+1)/(γ−1)
(3.11)
relates M and γ at any location of the nozzle according to the ratio of the local area A and
nozzle throat area A∗, where the flow is sonic. There are two possible solutions for every
A/A∗ in relation with the subsonic and supersonic nozzle sections.

39
3.6.1.4 Energy Equation
The Energy Equation provides the measure of the total energy of the flow, which
for the facility operation is stored in the form of internal and kinetic energy (ÇENGEL; CIM-
BALA, 2017),
h0 = h+u2
2= constant (3.12)
where the internal energy of the gas is measured by the enthalpy term h. Since the isen-
tropic assumption holds for the majority of the domain, the total energy given by the stag-
nation enthalpy h0 is constant. Following the isentropic assumption, it can be related to 3.4
(Caltech, 2014) as
h0
h=
T0
T(3.13)
where h can be further rewritten as:
h =u2
2(
T0T −1
) (3.14)
Knowing the facility’s enthalpy is relevant since it provides additional information for
which types of experiments can be conducted. However, since h is mainly dependent on
temperature and M, the values obtained for the Ludwieg shall be less than other pulsed
facilities since the test flow is usually cold.
3.6.1.5 Initial Driver Tube Conditions
Due to the presence of the reflected shock wave inside the driver tube, the test gas
initial conditions are different to the pre-run driver conditions before the valve opening. For
this reason, it is useful to develop an analysis to predict the post-expansion gas conditions
in order verify the experimental data collected during the test time (KIMMEL et al., 2016).
The equations for predicting the driver tube conditions behind the shock wave are
followed if the continuity is satisfied by the driver Mach number, in other words, if the driver
diameter is well designed to avoid the expansion wave reflection in any point except at
the driver extremities. The post-expansion Mach number and γ determine the other flow
properties as most of the relations are acquired from the isentropic flow expressions. Here,
the subscript " DT " denotes the driver post-expansion conditions behind the shock wave, "
i " denotes the driver pre-run conditions and " 0 " the driver stagnation conditions which will
supply the test section flow conditions.
The Mach number is given by the area relation between the driver section and the
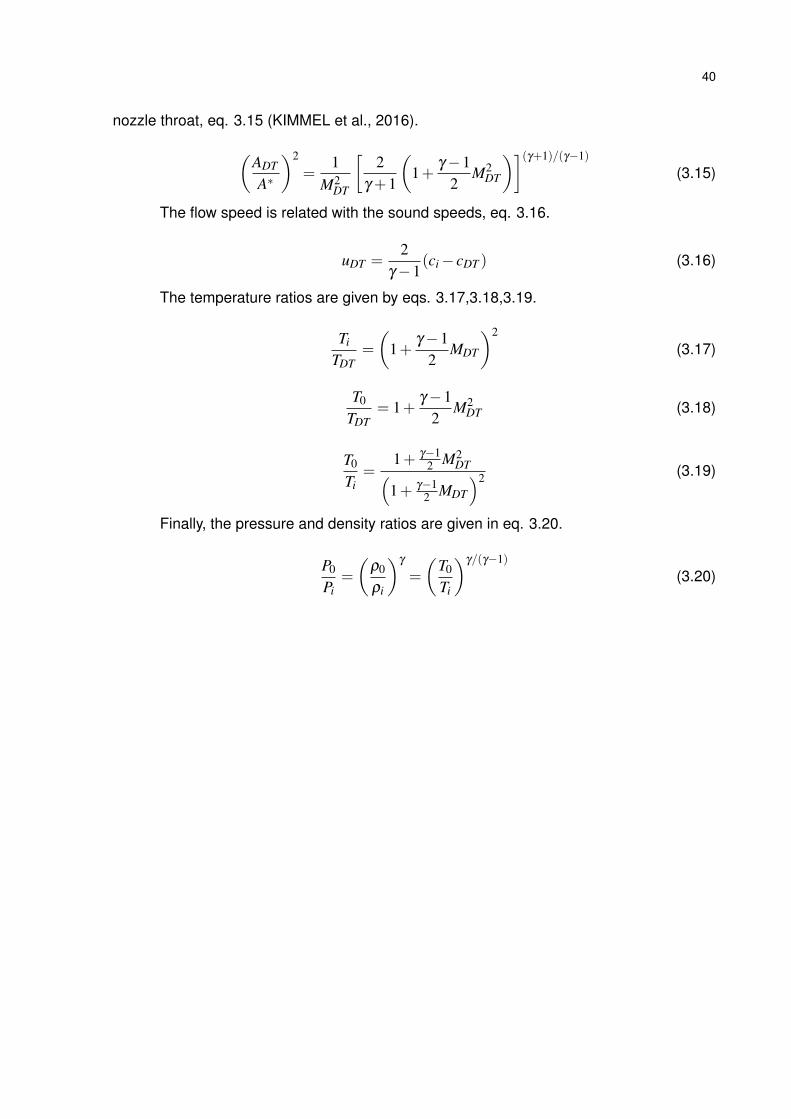
40
nozzle throat, eq. 3.15 (KIMMEL et al., 2016).
(ADT
A∗
)2
=1
M2DT
[2
γ +1
(1+
γ −12
M2DT
)](γ+1)/(γ−1)
(3.15)
The flow speed is related with the sound speeds, eq. 3.16.
uDT =2
γ −1(ci − cDT ) (3.16)
The temperature ratios are given by eqs. 3.17,3.18,3.19.
Ti
TDT=
(1+
γ −12
MDT
)2
(3.17)
T0
TDT= 1+
γ −12
M2DT (3.18)
T0
Ti=
1+ γ−12 M2
DT(1+ γ−1
2 MDT
)2 (3.19)
Finally, the pressure and density ratios are given in eq. 3.20.
P0
Pi=
(ρ0
ρi
)γ=
(T0
Ti
)γ/(γ−1)
(3.20)

4 METHODOLOGY
The methodology that this project followed was based on a systems engineering
approach. For that, a generic life cycle structure as described by INCOSE (2015), illustrated
in Figure 4.1, was used as a primary model. Additionally, contributions from Pahl et al.
(2005) and Romano (2003) will be used as a complement along the process. Referring
to INCOSE (2015), this work will comprehend the phases of conceptual stage and partial
development stage. The activities and objectives regarding each phase are explained in
the following sections.
Figure 4.1 – Generic life cycle project.
Source: INCOSE (2015).
4.1 CONCEPT STAGE
The kick-start of this initial stage is often driven by a demand: the identification of
new organizational capabilities, opportunities or stakeholder needs. Then, the conceptual
phase proceeds with an exploratory research to gather all relevant information and accu-
mulate knowledge about possible candidates for the system of interest (SOI), while also
studying new ideas and existent technologies. This research must be used to determine
the potential technologies - and their issues - and identify what is feasible and what is not.
Furthermore, the identification of technological risks and the technology readiness level
(TRL) for each concepts is critical. These analyses will provide the insight needed to guide
the selection of a SOI concept among the candidate systems analysed. Engineering mod-
els, mock-ups or other prototypes might be build and tested during this stage (INCOSE,
2015).
The research work executed during this stage is represented in this project as the the
bibliography review of hypersonic wind tunnels presented along chapter 3, with the Ludwieg
tube being the selected concept among the possible solutions.
Also during this stage the stakeholder needs are carefully reformulated to stake-
holder requirements. According to Pahl et al. (2005) those requirements can be subdivided

42
into 3 distinct categories:
• Basic Requirements: understood as implicit requirements, they are not spoken by
the stakeholder as are obvious functions that are expected that the SOI can perform.
• Technical Requirements: explicit requirements indicated by the stakeholder or con-
firmed upon feedback.
• Attractive Requirements: treated as implicit requirements, can lead to important
differentials to the SOI designed.
After that, the requirements are valuated and will pass through a ranking process
to sort the priority level of each. This is done to ensure that the SOI will indeed keep
his top-level features and also prevent that too much time or budget are spent with the
accomplishment of low priority requirements (ROMANO, 2003).
Finally, the main output from the conceptual stage are a SOI concept, better under-
standing of the stakeholder needs and formulation of the subsequent requirements, TRL
assessment and rough estimate of cost and schedule.
4.2 DEVELOPMENT STAGE
During this stage, the stakeholder requirements are transformed into project re-
quirements , which are described by engineering specifications. The activities are guided
towards the main development stage goal: the definition and realization of the SOI that
accomplish the stakeholder requirements and can be produced, utilized, supported and
retired (INCOSE, 2015).
The development stage of this work is related to the analysis of the operation re-
quirements for the Ludwieg tube and the mechanical project itself. This stage is partially
completed along this project as the focus for this project is the preliminary definition of the
main components of the facility.

5 RESULTS AND ANALYSIS
In this chapter are presented and discussed the main results obtained along each
design phase according to the methodology adopted.
5.1 CONCEPT STAGE
As exposed by INCOSE (2015) the stakeholder needs are one of the drivers for
the initial project research. Commonly the stakeholder, or clients, are external entities,
organizations or individuals which will require a system of interest (SOI) to accomplish
certain goals.
For the current work, however, the stakeholder needs are delivered by the author
as the desired attributes for the SOI in the form of an hypersonic wind tunnel experimental
facility. Those needs were formulated given the acknowledge of the author learned by
the bibliography review from other works regarding Ludwieg tube facilities as well as the
perception of the UFSM academic environment.
Among the existent pulsated facilities concepts, the Ludwieg tube concept was cho-
sen by the features of this design that were acknowledged by the literature review presented
in chapter 3.
The list of the stakeholder needs is presented on Table 5.1. The numeration does
not denotes importance order for the needs.
Table 5.1 – Stakeholder needs.
N◦ STK. NEED
1Generate aprox. high-speed
flight conditions
2 Safety
3 High research potential
4 Low-cost
5 Elevated durability
Source: Author.
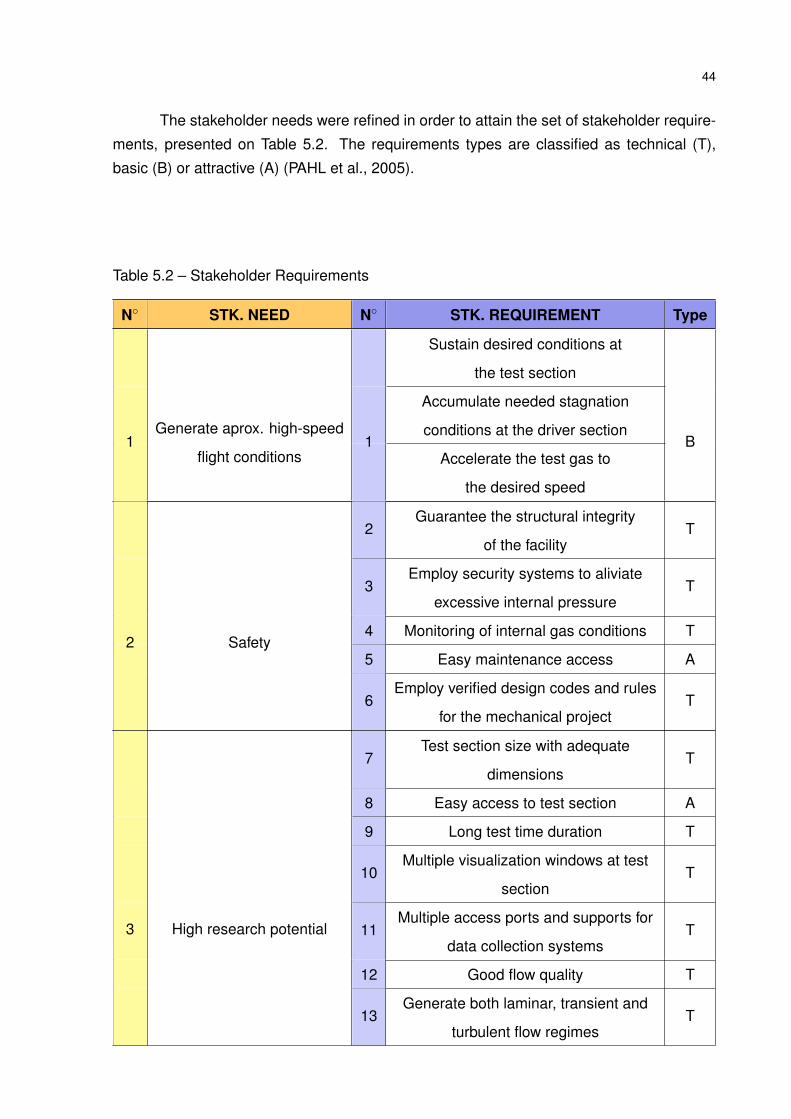
44
The stakeholder needs were refined in order to attain the set of stakeholder require-
ments, presented on Table 5.2. The requirements types are classified as technical (T),
basic (B) or attractive (A) (PAHL et al., 2005).
Table 5.2 – Stakeholder Requirements
N◦ STK. NEED N◦ STK. REQUIREMENT Type
Sustain desired conditions at
the test section
Accumulate needed stagnation
conditions at the driver section1
Generate aprox. high-speed
flight conditions1
Accelerate the test gas to
the desired speed
B
2Guarantee the structural integrity
of the facilityT
3Employ security systems to aliviate
excessive internal pressureT
4 Monitoring of internal gas conditions T
5 Easy maintenance access A2 Safety
6Employ verified design codes and rules
for the mechanical projectT
7Test section size with adequate
dimensionsT
8 Easy access to test section A
9 Long test time duration T
10Multiple visualization windows at test
sectionT
11Multiple access ports and supports for
data collection systemsT
12 Good flow quality T
3 High research potential
13Generate both laminar, transient and
turbulent flow regimesT

45
Table 5.2 continued from previous page
N◦ STK. NEED N◦ STK. REQUIREMENT Type
14 Employ commercial components T
15 Reduce consumables needs for testing A
16 Low-cost operation T
17 Simple design and fabrication A
4 Low-cost
18 Simple assembly and installation A
19 Corrosion resistance T
20 Long life-span B5 Elevated durabity
21 Fatigue and creep resistance T
Source: Author.
In the next step, the hierarchy of requirements is constructed by a valuation method
(ROMANO, 2003). As described by Csillag (1995), all requirements are listed and applied
into a Mudge Diagram. In this method, the requirements are compared in pairs for all
possible combinations, in each "confrontation" the user decides which one possess a major
importance and attribute the relative importance level by using weights associated to values
on an ascending numeric scale. The total sum achieved by each individual requirement
when compared to the remain defines the total importance level and will set the global rank
for each requirement. Also, the percentage of the sum value comparatively with the global
sum characterizes the relative importance level.
For this work, three levels of importance will be used. The weights and their associ-
ated values are set as follow: A = 5, B = 3 and C = 1. The Mudge Diagram built is presented
in Appendix A.
Initially, need 1 was divided on 3 separate requirements, however it was difficult
to set a importance order for the requirements since they directly dictate the generation
of desired test flow conditions. They are all equally needed to characterize the test flow,
as well as the test section conditions are a consequence from the stagnation and Mach
number parameters. This way, they were all grouped into the same requirement.
The valuation results in A shows a balance between requirements from needs 1,2
and 5 mostly - comprised on the top 6 requirements group, but also including the flow qual-
ity requirement from need 3. The conservative approach adopted, giving priority for safe
operation, is justified since the facility accumulates gas at high pressure and temperature
conditions that can lead to serious injuries in cause of leakage or failure. This approach
also originated a tie in the 4th and 6th priorities, between compromises of safety and flow
quality and durability issues, respectively. As a side note, because of the first tie the next

46
position was moved directly to the 6th place, jumping the 5th position. This is a result from
the native ranking function on Excel, however it does not interfere the ranking order neither
the analysis.
5.2 DEVELOPMENT STAGE
The stakeholder requirements are further translated into project requirements (project
metrics), capable to be quantitatively evaluated. The ranked list is shown on Table 5.3. All
the ties previously seen in the Mudge Diagram are solved using the "duel" result from both
requirements, prioritizing the winning one. The formulation of the operation requirements
and mechanical project characteristics in the following sections are conceived to satisfy the
stakeholder requirements according to their importance level and evaluated by the respec-
tive metrics.
Table 5.3 – Project Requirements
Rank STK. REQS. PROJECT REQS.
1◦Guarantee the structural integrity
of the facility
ASME Design
Rules
Safety
Factor (S.F.)
Sustain desired conditions at
the test sectionReynolds number P (kPa), T (K)
Accumulate needed stagnation
conditions at the driver sectionP0 (MPa) T0 (K)
2◦Accelerate the test gas to
the desired speedMach number
3◦ Facility and equipment long life-span Service life (years)
4◦Employ security systems to aliviate
excessive internal pressure
Number of components
(quantity)
5◦ Good flow quality MDT Nozzle contour
6◦ Corrosion resistance Materials properties
7◦ Fatigue and creep resistance ASME Design Rules
8◦Test section size with adequate
dimensionsGeometry (m)
9◦Generate both laminar, transient and
turbulent flow regimesReynolds number
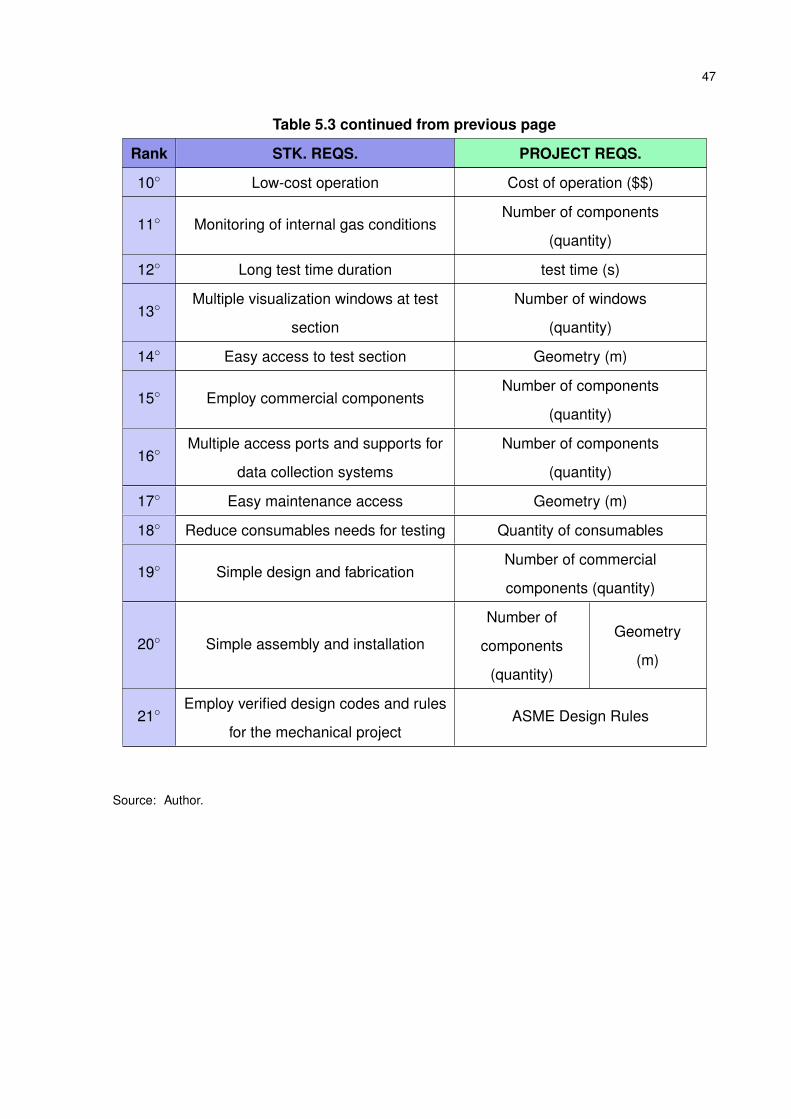
47
Table 5.3 continued from previous page
Rank STK. REQS. PROJECT REQS.
10◦ Low-cost operation Cost of operation ($$)
11◦ Monitoring of internal gas conditionsNumber of components
(quantity)
12◦ Long test time duration test time (s)
13◦Multiple visualization windows at test
section
Number of windows
(quantity)
14◦ Easy access to test section Geometry (m)
15◦ Employ commercial componentsNumber of components
(quantity)
16◦Multiple access ports and supports for
data collection systems
Number of components
(quantity)
17◦ Easy maintenance access Geometry (m)
18◦ Reduce consumables needs for testing Quantity of consumables
19◦ Simple design and fabricationNumber of commercial
components (quantity)
20◦ Simple assembly and installation
Number of
components
(quantity)
Geometry
(m)
21◦Employ verified design codes and rules
for the mechanical projectASME Design Rules
Source: Author.

48
5.2.1 Operation Requirements
This section explains the methodology adopted to quantify the operation require-
ments of the Ludwieg tube which will impact in the mechanical project of the facility. The
operational specifications are determined through the following analyzes:
• Generation of approximate high-speed flight conditions.
• Reynolds number and Mach number Similarity.
• Driver tube Mach number.
Through the studies, the isentropic relations were considered and the air was treated
as a perfect gas. However, before demonstrating each analysis in greater detail, first the
atmospheric flight conditions where high-speed flight takes place must be characterized.
5.2.1.1 High-Speed Flight Conditions
The surface heating of supersonic and hypersonic vehicles caused by air friction is
extreme and represents one of the most challenging aspects on the development of this
technology as higher it is the flight Mach number. To minimize this effect and avoid the
disintegration of the vehicle, the hypersonic flight takes place on high altitudes where pres-
sure and, especially, density of the atmospheric air is lower. Thus, the dynamic pressure
loads can be alleviated (HICKS, 1993). Specially the altitudes situated on the stratosphere
atmospheric layer corresponds to the region commonly used for experimental hypersonic
and supersonic vehicles testing.
As these prototypes are propelled by air-breathing engines such as ramjet or scram-
jet, they cannot generate static thrust by its own and must be delivered by other means,
typically by rocket propulsion, to be deployed with enough speed and in the desired altitude
(TORO et al., 2018).
An altitude range from 20 km to 50 km is considered in this analysis to measure
the atmospheric air conditions. Within this range, specially the 30 km altitude is a com-
mon altitude flight path for experimental high-speed vehicles. The variations on pressure,
temperature and density with altitude are given according to the 1976 U.S. Standard Atmo-
sphere (COESA) model (TEWARI, 2006), Figure 5.1. For some specific altitude levels the
respective atmosphere conditions are summarized in Table 5.4.

49
Figure 5.1 – Atmospheric air conditions change with altitude.
1 2 3 4 5
P (kPa)
20
25
30
35
40
45
50H
(km
)
220 240 260
T (K)
20
25
30
35
40
45
50
0.02 0.04 0.06 0.08
(kg/m3)
20
25
30
35
40
45
50
Source: Author.
Table 5.4 – Atmospheric air properties for specific altitude levels.
H (km) P (kPa) T (K) ρ (kg/m3) c (m/s)
20 5.4722 216.65 0.088 295.0425 2.5094 221.65 0.0394 298.427530 1.1710 226.65 0.018 301.774735 0.5584 237.05 0.0082 308.620640 0.2772 251.05 0.0038 317.603445 0.1430 265.05 0.0019 326.338950 0.0759 270.65 0.001 329.7684
Source: Author.
5.2.1.2 Reynolds number Similarity
To describe aerodynamic flow interactions, forces and moments acting upon the
scale model in an analogous relation to the real vehicle, the Reynolds number similarity
must be verified in both cases. The Mach number similarity is the second main parameter
to be achieved in order to replicate the compressible phenomena of the fluid, i.e. shock
waves behaviour.

50
This way, the facility operation requirements must be formulated to ensure a design
Mach number with minimum deviation and the attainable Reynolds number range in the
same magnitude order reached at atmospheric hypersonic flight. For that, the desired
Reynolds number parameter must be comprised inside the operational Reynolds number
envelope of the wind tunnel.
The Reynolds number is calculated by,
Re =ρuL
µ(5.1)
according to Çengel and Cimbala (2017), where L is a reference length. As a common
practice seen to generalize the analysis for wind tunnels, the reference length variable is
dismissed in the calculation, resulting in a unit Reynolds number (1/m).
The dynamic viscosity µ for air at given temperature T is obtained by the Sutherland
Correlation,
µ = µre f
(Tre f +CT +C
)(T
Tre f
)3/2
(5.2)
this expression is employed due to the low static temperature levels achieved post expan-
sion, which do not are usually shown on tables. The reference temperature used was Tre f
= 273.15 K, where the respective value of the dynamic viscosity is µre f = 1.729E-05 kg/m.s
(ÇENGEL; CIMBALA, 2017). The constant of Sutherland used is C = 103.0826 K.
For Mach number 3, 5, 7 and 9, and applying Equations 5.1 and 5.2 as well as the
data from Table 5.4, the resulting unit Reynolds number graph for the reference altitude H
range is given in Figure 5.2.
Figure 5.2 – Unit Reynolds number and altitude plot for different flight Mach numbers.
2 4 6 8 10 12 14 16
Re (1/m) 106
20
25
30
35
40
45
50
H(k
m)
Unit Reynolds x Altitude for a given flight Mach
M = 3
M = 5
M = 7
M = 9
Source: Author.

51
The results demonstrate high magnitude order achieved by the Unit Reynolds mostly
because the low viscosity and high flow velocity. However, as the density drop with the
height increase becomes the dominant factor in the equation, also causing Reynolds to
drop.
It is important to emphasize that the replication of the exact same flight conditions
over a reduced model does not guarantee the flow similarity over the real size body. How-
ever, for testing of small components or other types of aerothermodynamics research, the
capacity to generate approximate flight conditions, referring to pressure and temperature,
is also relevant. So, some of the project requirements are also formulated to accomplish
the operational capacity, which are discussed in more detail in the next section.
5.2.1.3 Driver Tube Stagnation Conditions
The driver tube initial conditions must be controlled mostly in order to attain the
Reynolds number similarity for a given model. However, an analysis was also conducted
to quantify the stagnation conditions requirements needed to generate exactly the set of
flight conditions from Table 5.4, but now stretched to the 20-35 km range - which is more
realistic for the current existent high-speed vehicles. This would give the capability to use
1:1 scale components, assuming that they could fit inside the test section. The isentropic
flow relations from Equations 3.5 and 3.4 were used to this mean.
The stagnation pressure plot in the logarithmic scale in the vertical axis is shown
below in Figure 5.3. For Mach number 5 and below the requirements on pressure dont’t
exceed 3 MPa for all the altitude ranges, which can be easily attainable on laboratory. For
higher Mach numbers however, the P0 condition increases exponentially. Usually, the Mach
number independence principle can be applied in some cases to mitigate the some of the
pre-run conditions (KLICHE; MUNDT; HIRSCHEL, 2011).
The stagnation temperature requirements are more extreme if compared with pres-
sure, as shown by Figure 5.4 - vertical axis in logarithmic scale. Still for supersonic flight
regime the T0 prerequisite is around 1000 K near Mach number 4. While a free-piston com-
pression system can provide the desired T0, the electric heating employed in the Ludwieg
tubes studied can generate a maximum attainable T0 around 900 K. Most of the Ludwieg
tubes with electrical heating operate with cold test flows. The heating is most used to avoid
air condensation and freezing. But still, according to Radespiel et al. (2016), these cold gas
facilities can be used for a wide range of fundamental research on hypersonics.

52
Figure 5.3 – Stagnation pressure requirements to replicate the exact real flight pressureconditions.
2 3 4 5 6 7 8 9 10
Mach number
10-2
100
102
P0 (
MP
a)
Stagnation Pressure for a given altitude and Mach of flight
H = 20km
H = 25km
H = 30km
H = 35km
(a) Global P0 requirements
2.5 3 3.5 4 4.5 5 5.5
Mach number
10-2
10-1
100
P0 (
MP
a)
Stagnation Pressure for a given altitude and Mach of flight
H = 20km
H = 25km
H = 30km
H = 35km
(b) Zoomed plot for supersonic and low hypersonic Mach number region.
Source: Author.

53
Figure 5.4 – Stagnation temperature requirements to replicate the exact real flight temper-ature conditions.
2 3 4 5 6 7 8 9 10
Mach number
103
T0 (
K)
Stagnation Temperature for a given altitude and Mach of flight
H = 20km
H = 25km
H = 30km
H = 35km
Source: Author.
5.2.1.4 Driver Tube Mach number
For each type of pulsed hypersonic facilities there are two primary requirements that
must be ensured by the designed driver tube:
• The driver tube Mach number should be low enough (MDT < 0.05) to ensure both
good flow quality and approximated stagnation conditions.
• The driver should have enough gas storage volume to supply the facility operation
timespan.
The insight on those parameters were given during e-mail exchange with the grad-
uate student Eugene Hoffman who was involved with the design and construction of the
UTSA Mach 7 Ludwieg tube along with Dr. Christopher Combs. Also, Radespiel et al.
(2016) provides accordance with the MDT restriction.
As given by Equation 3.15, MDT is correlated with the area relation between driver
and nozzle cross-sections. Also, as the nozzle is actually designed to be coupled into the
test section, the driver internal area is linked to the test section size, which is one of the
main input requirements for the mechanical project. In this regard, some analysis were
made in order to evaluate the driver tube internal diameter (d0) needed to satisfy different

54
requirements. For all analysis performed the test section was considered with a circular
shape of internal diameter d3 = 0.5m while the axisymmetric isentropic nozzle exit diameter
d2 is set as 0.6d3. The stagnation temperature used is 750K and considered uniform in the
driver tube.
The first analysis conducted was focused on quantify d0 necessary to lock on re-
quired values of MDT for a range of flight Mach numbers. The maximum value for MDT
considered is 0.084, which is the operational Mach value attained in the AFRL Ludwieg
Tube (KIMMEL et al., 2016). The results are shown in Figure 5.5.
Figure 5.5 – Design of d0 for different MDT requirements.
2.5 3 3.5 4 4.5 5 5.5 6
Mach number
0.1
0.2
0.3
0.4
0.5
0.6
0.7
0.8
0.9
d0 (
m)
Design of d0 for Flow Quality, d2 = 0.3m
MDT
= 0.025
MDT
= 0.04
MDT
= 0.05
MDT
= 0.084
Source: Author.
This study illustrates the increase required in d0 to lower MDT for the same flight
Mach number, as well as another considerable increase in d0 as the MDT plots approach
lower Mach number values. This behaviour provides an important insight: even when the
stagnation conditions requirements are less harsh for decreasing values of Mach, at the
same time the growth of d0 required to sustain a desired MDT , without changing the test
section dimensions, will difficult the feasibility of the mechanical project as well as increase
costs, as pointed by Hoffman and Combs (2019).
In short, a Ludwieg tube designed under given key parameters - test section size,
design operational Mach number, maximum stagnation conditions, the attainable experi-
ments for a range of Mach number values, the lower and higher M limits will be limited in
different ways. Considering nozzle replacements, the limitation for higher Mach numbers
will be associate with the capacity of the laboratory equipment’s to provide the stagnation
conditions requirements and the safety factor associated to the mechanical integrity of the
components when those conditions rise, especially at the driver section. While for lower
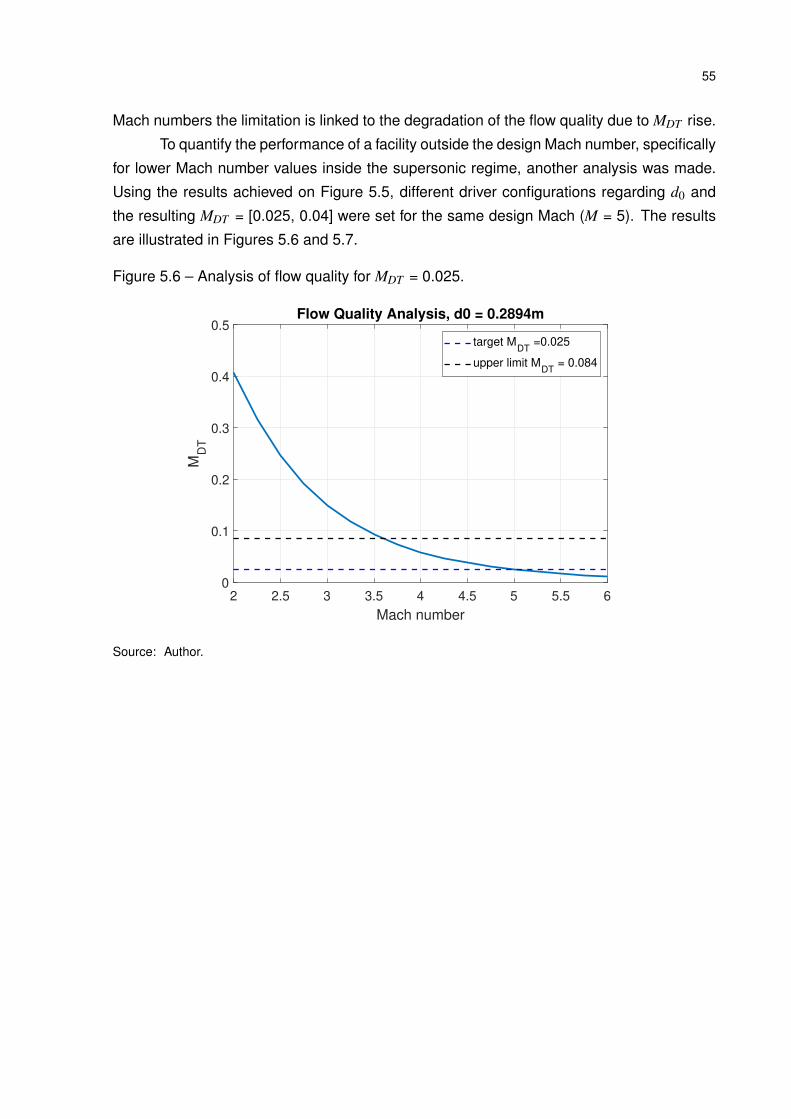
55
Mach numbers the limitation is linked to the degradation of the flow quality due to MDT rise.
To quantify the performance of a facility outside the design Mach number, specifically
for lower Mach number values inside the supersonic regime, another analysis was made.
Using the results achieved on Figure 5.5, different driver configurations regarding d0 and
the resulting MDT = [0.025, 0.04] were set for the same design Mach (M = 5). The results
are illustrated in Figures 5.6 and 5.7.
Figure 5.6 – Analysis of flow quality for MDT = 0.025.
2 2.5 3 3.5 4 4.5 5 5.5 6
Mach number
0
0.1
0.2
0.3
0.4
0.5
MD
T
Flow Quality Analysis, d0 = 0.2894m
target MDT
=0.025
upper limit MDT
= 0.084
Source: Author.
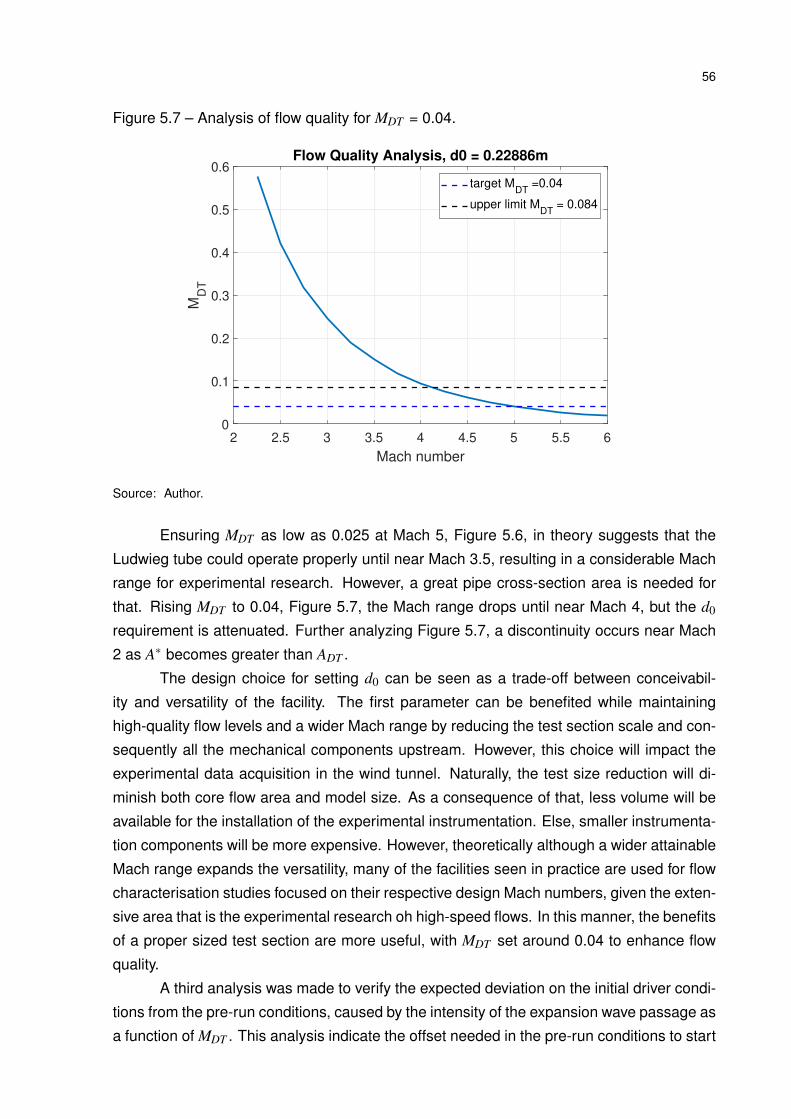
56
Figure 5.7 – Analysis of flow quality for MDT = 0.04.
2 2.5 3 3.5 4 4.5 5 5.5 6
Mach number
0
0.1
0.2
0.3
0.4
0.5
0.6
MD
T
Flow Quality Analysis, d0 = 0.22886m
target MDT
=0.04
upper limit MDT
= 0.084
Source: Author.
Ensuring MDT as low as 0.025 at Mach 5, Figure 5.6, in theory suggests that the
Ludwieg tube could operate properly until near Mach 3.5, resulting in a considerable Mach
range for experimental research. However, a great pipe cross-section area is needed for
that. Rising MDT to 0.04, Figure 5.7, the Mach range drops until near Mach 4, but the d0
requirement is attenuated. Further analyzing Figure 5.7, a discontinuity occurs near Mach
2 as A∗ becomes greater than ADT .
The design choice for setting d0 can be seen as a trade-off between conceivabil-
ity and versatility of the facility. The first parameter can be benefited while maintaining
high-quality flow levels and a wider Mach range by reducing the test section scale and con-
sequently all the mechanical components upstream. However, this choice will impact the
experimental data acquisition in the wind tunnel. Naturally, the test size reduction will di-
minish both core flow area and model size. As a consequence of that, less volume will be
available for the installation of the experimental instrumentation. Else, smaller instrumenta-
tion components will be more expensive. However, theoretically although a wider attainable
Mach range expands the versatility, many of the facilities seen in practice are used for flow
characterisation studies focused on their respective design Mach numbers, given the exten-
sive area that is the experimental research oh high-speed flows. In this manner, the benefits
of a proper sized test section are more useful, with MDT set around 0.04 to enhance flow
quality.
A third analysis was made to verify the expected deviation on the initial driver condi-
tions from the pre-run conditions, caused by the intensity of the expansion wave passage as
a function of MDT . This analysis indicate the offset needed in the pre-run conditions to start

57
the test run with the desired reservoir conditions. For that, equations 3.19 and 3.20 were
implemented for MDT values comprised between 0.025 and 0.125. Horizontal control lines
were added for MDT = 0.04 and MDT = 0.084, comprising a zone with affordable values.
The results are shown in Figure 5.8.
The calculated values of T0/Ti and P0/Pi along the interest region denotes small
variations between the calibrated pre-run conditions and the stagnation conditions that will
supply the hypersonic flow through the test run. As expected, the difference increases pro-
portionally with MDT as the gas converts more internal energy in form of speed. Pressure
losses are seen to be more affected. The calculated values along the region are presented
on Table 5.5.
Figure 5.8 – Analysis of stagnation conditions drop on test start.
0.96 0.965 0.97 0.975 0.98 0.985 0.99
T0/Ti
0.02
0.04
0.06
0.08
0.1
0.12
MD
T
0.86 0.88 0.9 0.92 0.94 0.96
P0/Pi
0.02
0.04
0.06
0.08
0.1
0.12
MD
T
target MDT
=0.04
upper limit MDT
= 0.084
Source: Author.
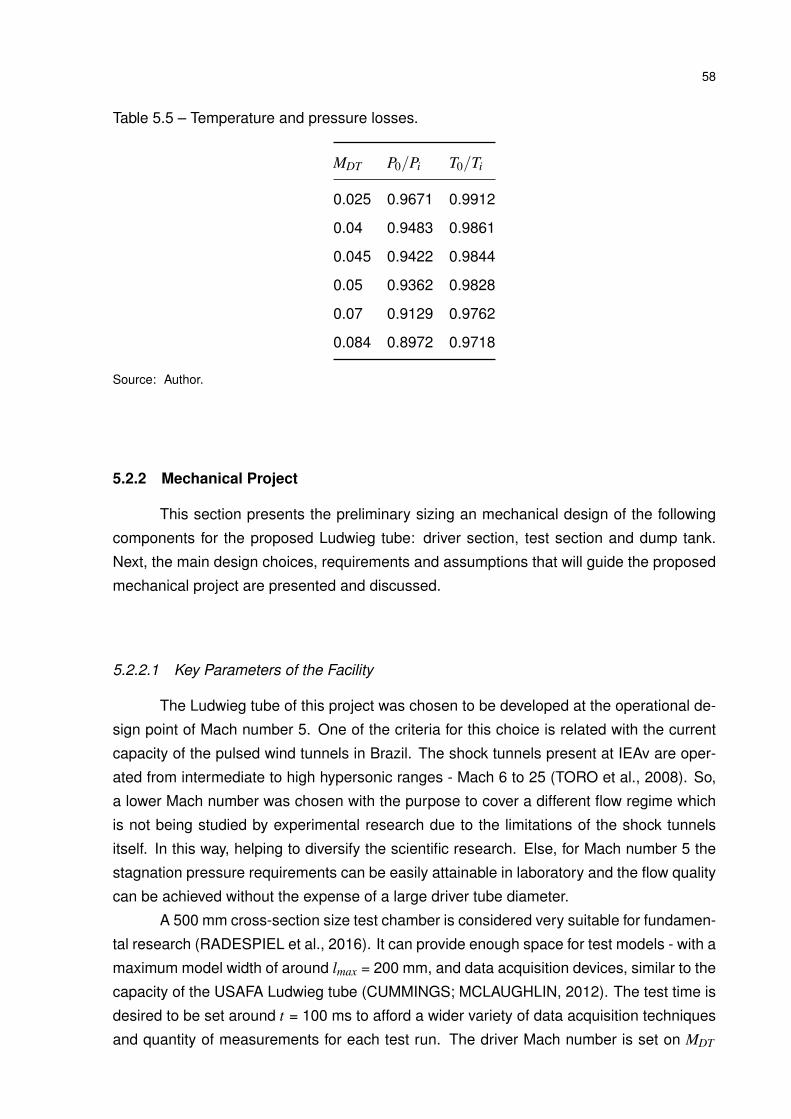
58
Table 5.5 – Temperature and pressure losses.
MDT P0/Pi T0/Ti
0.025 0.9671 0.9912
0.04 0.9483 0.9861
0.045 0.9422 0.9844
0.05 0.9362 0.9828
0.07 0.9129 0.9762
0.084 0.8972 0.9718
Source: Author.
5.2.2 Mechanical Project
This section presents the preliminary sizing an mechanical design of the following
components for the proposed Ludwieg tube: driver section, test section and dump tank.
Next, the main design choices, requirements and assumptions that will guide the proposed
mechanical project are presented and discussed.
5.2.2.1 Key Parameters of the Facility
The Ludwieg tube of this project was chosen to be developed at the operational de-
sign point of Mach number 5. One of the criteria for this choice is related with the current
capacity of the pulsed wind tunnels in Brazil. The shock tunnels present at IEAv are oper-
ated from intermediate to high hypersonic ranges - Mach 6 to 25 (TORO et al., 2008). So,
a lower Mach number was chosen with the purpose to cover a different flow regime which
is not being studied by experimental research due to the limitations of the shock tunnels
itself. In this way, helping to diversify the scientific research. Else, for Mach number 5 the
stagnation pressure requirements can be easily attainable in laboratory and the flow quality
can be achieved without the expense of a large driver tube diameter.
A 500 mm cross-section size test chamber is considered very suitable for fundamen-
tal research (RADESPIEL et al., 2016). It can provide enough space for test models - with a
maximum model width of around lmax = 200 mm, and data acquisition devices, similar to the
capacity of the USAFA Ludwieg tube (CUMMINGS; MCLAUGHLIN, 2012). The test time is
desired to be set around t = 100 ms to afford a wider variety of data acquisition techniques
and quantity of measurements for each test run. The driver Mach number is set on MDT

59
= 0.045 to assure good flow quality. The stagnation temperature is expected to be as high
as T0 = 750 K, by analyzing the heating capacity achieved existent Ludwieg tube facilities
by electric heating (KIMMEL et al., 2016; BASHOR; COMBS, 2019). For this initial phase
of the facility’s project the whole driver tube is considered to be heated, therefore having
an uniform internal diameter. Also, this design choice can simplify the project as dismisses
greater tubing parts for the non-heated section and also increment the research potential
as it could be hypothetically used for other operational Mach numbers. Although the UTSA
facility applies partial heating of an uniform driver without noticing any performance degra-
dation (BASHOR et al., 2019) - while also reducing operation costs. But due to the size
difference between this facility and the proposed one for this work, this effect might not be
the same. This is another design aspect that will be considered in a more mature stage of
this project, if necessary.
By the results obtained from the stagnation conditions requirements analysis (Fig-
ure 5.3), the maximum P0 needed to generate approximate real flight conditions is roughly 3
MPa. However a safety factor was introduced to extended the maximum allowable pressure
of the facility to 8 MPa, then an additional safety factor of S.F = 2.67. This limit was im-
posed to both guarantee safe operation and widen the attainable Unit Reynolds envelope,
estimated to range from Re = 5 x 10⁶ m−1 to 50 x 106 m−1 by analyzing the capacity of
existent facilities.
Finally, the complete set initial key parameters of the proposed facility are compiled
in Table 5.6.
Table 5.6 – Proposed Ludwieg tube key parameters
Key Parameters
M 5d3 500 mmlmax 200 mmt 100 msMDT 0.045P0max 8 MPaS.F. 2.67T0max 750 K
Source: Author.
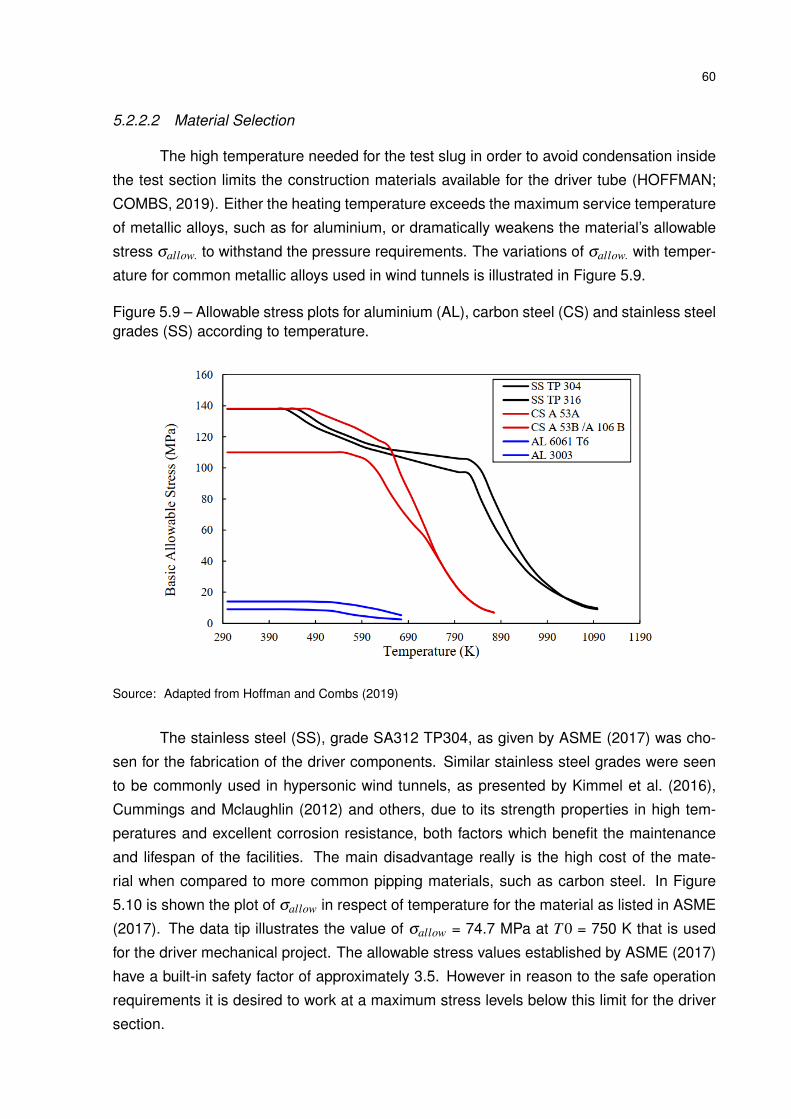
60
5.2.2.2 Material Selection
The high temperature needed for the test slug in order to avoid condensation inside
the test section limits the construction materials available for the driver tube (HOFFMAN;
COMBS, 2019). Either the heating temperature exceeds the maximum service temperature
of metallic alloys, such as for aluminium, or dramatically weakens the material’s allowable
stress σallow. to withstand the pressure requirements. The variations of σallow. with temper-
ature for common metallic alloys used in wind tunnels is illustrated in Figure 5.9.
Figure 5.9 – Allowable stress plots for aluminium (AL), carbon steel (CS) and stainless steelgrades (SS) according to temperature.
Source: Adapted from Hoffman and Combs (2019)
The stainless steel (SS), grade SA312 TP304, as given by ASME (2017) was cho-
sen for the fabrication of the driver components. Similar stainless steel grades were seen
to be commonly used in hypersonic wind tunnels, as presented by Kimmel et al. (2016),
Cummings and Mclaughlin (2012) and others, due to its strength properties in high tem-
peratures and excellent corrosion resistance, both factors which benefit the maintenance
and lifespan of the facilities. The main disadvantage really is the high cost of the mate-
rial when compared to more common pipping materials, such as carbon steel. In Figure
5.10 is shown the plot of σallow in respect of temperature for the material as listed in ASME
(2017). The data tip illustrates the value of σallow = 74.7 MPa at T 0 = 750 K that is used
for the driver mechanical project. The allowable stress values established by ASME (2017)
have a built-in safety factor of approximately 3.5. However in reason to the safe operation
requirements it is desired to work at a maximum stress levels below this limit for the driver
section.

61
Figure 5.10 – Allowable stress plot for steel grade SA312 TP304 according to temperature.
400 500 600 700 800 900 1000
T0 (K)
20
40
60
80
100
120
allo
w. (
MP
a)
allowed x T0 for SA312 TP304
T0: 750
Sigma: 74.7
Source: Author.
5.2.2.3 Components Mechanical Project
• Driver Tube
A driver tube section capable to provide MDT = 0.045 was chosen, corresponding
to an internal diameter of d0 = 215.8 mm (NPS 8). The tube components wall thickness
was evaluated as e = 12.25 mm by Eq. 5.3 for straight pipe under internal pressure as de-
scribed on ASME Code for Pressure Piping B31.3 (ASME, 2016). The internal mechanical
tolerance bi estimated is 0.5 mm and the remaining parameters of pressure and maximum
allowable stress, as described previously, are P0 = 8 MPa and σallow = 74.7 MPa at T0 = 750
K.
e =d0+2bi
2
[exp
(P0
σallow
)−1
](5.3)
To achieve a test time duration of 100 ms, the driver length required according to
3.2 is LDT = 27 m, similar to the facility from Cummings and Mclaughlin (2012). A resulting
hydraulic volume is evaluated in VDT = 0.98 m3. A folded driver approach is applied in order
to reduce the total length of the apparatus (KIMMEL et al., 2016; SCHRIJER; BANNINK,
2010). For that, a 180◦ long radius return - as given by ASME B16.9 (ASME, 2001)- is

62
placed on the mid point of the driver tube length.
All of the driver tube mechanical characteristics described are summarized in Table
5.7.
Table 5.7 – Driver section main mechanical specifications.
Driver Specifications
d0 215.8 mme 12.25 mmLDT 27 mVDT 0.98 m3
Material ASME A312 TP304
Source: Author.
The tube sections are interconnected by flange connections welded on the tubes
extremities. For that, both endings are beveled for the welding fillet deposition. It is also
expected to use stainless steel on the flange parts. For the given material, the flange class
900 is the most suitable for operating under the facility conditions according to ASME Code
B16.5 (ASME, 2013). For this class and environment, a set of 12 stud bolts A193 B16 and
24 heavy hex nuts A194 2H and washers are required to fasten adjacent flanges facings.
Additionally, the flange type weld-neck with ring-type joint facing is the preferred choice for
the facility.
The ring-type joint (RTJ) facing flanges don’t use regular flat gaskets for sealing,
instead uses a round metallic ring fitted in a groove cut into the flange face. The ring creates
a tight seal as the bolts tighten the assembly together with the internal gas pressure. Due
to the enhanced sealing capacity, the RTJ facing is considered the most efficient in process
piping systems (PARISHER; RHEA, 2012). According to ASME B16.20 (ASME, 2012), the
ring joint gasket shall be made of a softer material than the mating flanges as they shall
deform instead of the primary structures. In this case, a R49 soft iron or low carbon gasket
could be used while supporting high temperatures.
Weld neck flanges provides higher strength and structural resistance as a benefit
from the gradual thickness increase along the tapered hub. This design feature improves
the reliability over operation conditions under piping thermal dilatation. Due to this char-
acteristics, weld neck flanges are used in severe pressure and temperature service con-
ditions. Finally, the hub hole diameter is chosen to match the piping internal diameter.
Hence, the precise matching adjustment eliminates erosion and turbulence in the internal
flow (PARISHER; RHEA, 2012). The flange connection assembly with the specifications
mentioned is showed in Figure 5.11. All the parts can be found on market.
Plus, a blind flange class 900 is used for sealing the driver tube end. As described
by Cummings and Mclaughlin (2012), this part can be machined for the insertion of the
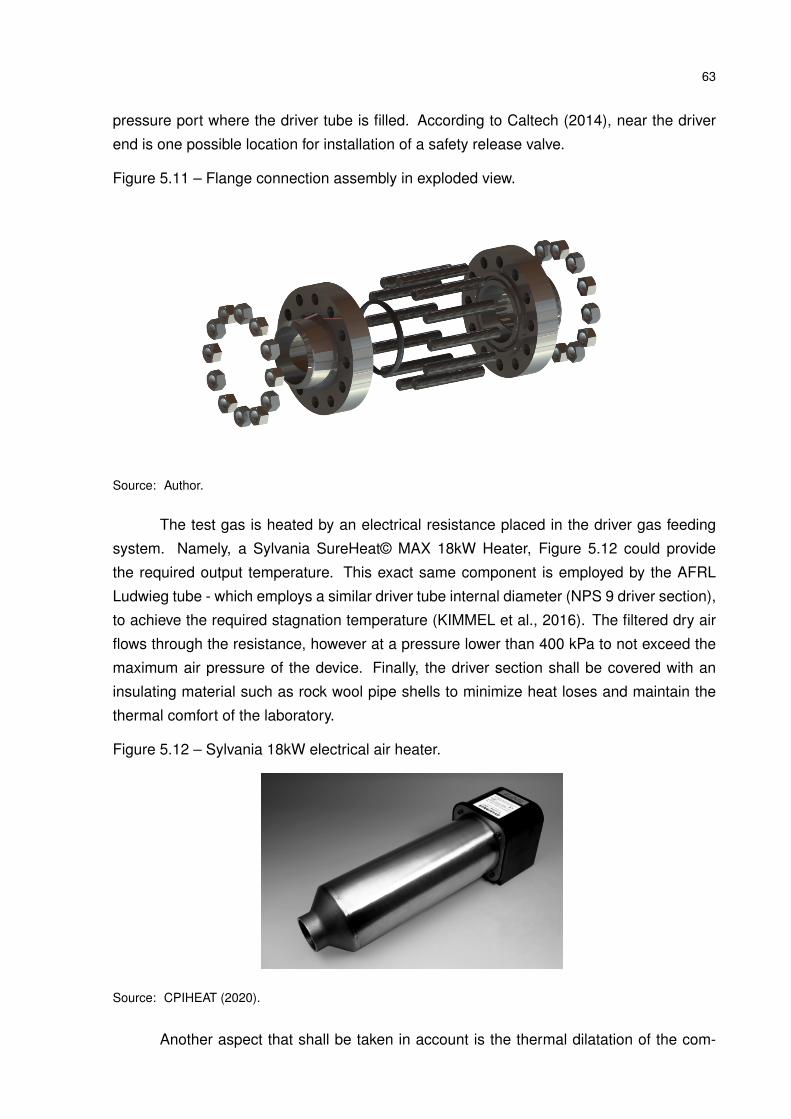
63
pressure port where the driver tube is filled. According to Caltech (2014), near the driver
end is one possible location for installation of a safety release valve.
Figure 5.11 – Flange connection assembly in exploded view.
Source: Author.
The test gas is heated by an electrical resistance placed in the driver gas feeding
system. Namely, a Sylvania SureHeat© MAX 18kW Heater, Figure 5.12 could provide
the required output temperature. This exact same component is employed by the AFRL
Ludwieg tube - which employs a similar driver tube internal diameter (NPS 9 driver section),
to achieve the required stagnation temperature (KIMMEL et al., 2016). The filtered dry air
flows through the resistance, however at a pressure lower than 400 kPa to not exceed the
maximum air pressure of the device. Finally, the driver section shall be covered with an
insulating material such as rock wool pipe shells to minimize heat loses and maintain the
thermal comfort of the laboratory.
Figure 5.12 – Sylvania 18kW electrical air heater.
Source: CPIHEAT (2020).
Another aspect that shall be taken in account is the thermal dilatation of the com-

64
ponents. Other pulsed facilities like shock-tunnels and expansion tunnels can achieve very
high temperatures, but for short amount of time. The period where the high temperatures
are keep in a heated Ludwieg tube corresponds to the pre-run time which could vary be-
tween a couple minutes or even some hours according to the bibliography. This time could
be sufficient for the volume pre-heated filled gas substantially increase the driver tubing
parts temperature. The condition is more extreme for external heating devices such as
as heating blankets and cables which directly transfer energy to the outside surface of the
tubing sections. Unfortunately, this phenomena is not yet fully understood during this work.
Upon contact with the personnel from the UTSA facility, it was related that the heat
generated by the heating tapes quickly dissipates, not trespassing much past the flanges
and not affecting the remaining downstream sections. However the driver diameter of this
facility is approximately 87 mm, with only partial heating. Again, this behaviour might not
appear in the same way for the proposed facility.
Considering the great length of this section it is expected that the thermal dilatation
can be expressive. One way to alleviate resulting structural stresses is providing space
for these dilatations occur without restriction. One possible solution is the use of wheeled
under-carriages, Figure 5.13, connected to the supports, as seen in the AFRL and USAFA
wind-tunnels, (KIMMEL et al., 2016; CUMMINGS; MCLAUGHLIN, 2012). This design also
allows better flexibility for moving the components, required for maintenance access or
modifications.
Figure 5.13 – Movable under-carriage supports, seen at the extremes of the driver lengthand test section.
Source: Author.
• Test-Run Triggering Component
As described previously, the test-run triggering component can be diaphragms or a

65
fast action valve. The fast action valve benefits lower operation costs, agility between test
runs, and most importantly: denies the use of consumables. The availability and acquisition
of experimental material is one of the main issues for public academic research in Brazil.
However, it was not found commercial models of this component. Consequently, it has to
be designed from scratch with fitting specifications for the facility. As another SOI, the com-
ponent will have their own life-cycle, development costs and a set of project requirements
which will be distributed in part to the design of electronic and pneumatic components re-
lated to the valve concept.
The difficulties seen for the fast action valve implementation are mitigated by the
use of diaphragms, which are cheap and can be easily integrated in the facility. The buffer
configuration is preferred as it promotes a better rupture control. Martos (2014) and Toro et
al. (2006) describe a double diaphragm section with a sleeve system used in the T3 shock-
tunnel, Figure 5.14. The design provides easy access for diaphragm replacement while
also avoiding moving the remaining sections for this task. Due to the trade-offs between
both options it is desirable that the facility could be compatible with both concepts. But the
proposed Ludwieg tube initially could operate with double diaphragms in a similar assembly
as described.
Figure 5.14 – Sleeve assembly for the double diaphragm section.
Source: Toro et al. (2006).
• Nozzle
The nozzle is the hearth of any pulsed wind tunnel, used to accelerate the flow to
high-speeds and guarantee the flow quality inside the test section. The most simple design
possible is a conical nozzle, however in general the flow presents an irregular distribution
on the velocity profile at the exit area due to the inclination of the streamlines. This results
in a poor flow quality that impacts the research potential of the facility.
It is imperative to generate good flow quality within the test section and the nozzle
contour is fundamental for that. A De Laval nozzle designed with a feasible length and
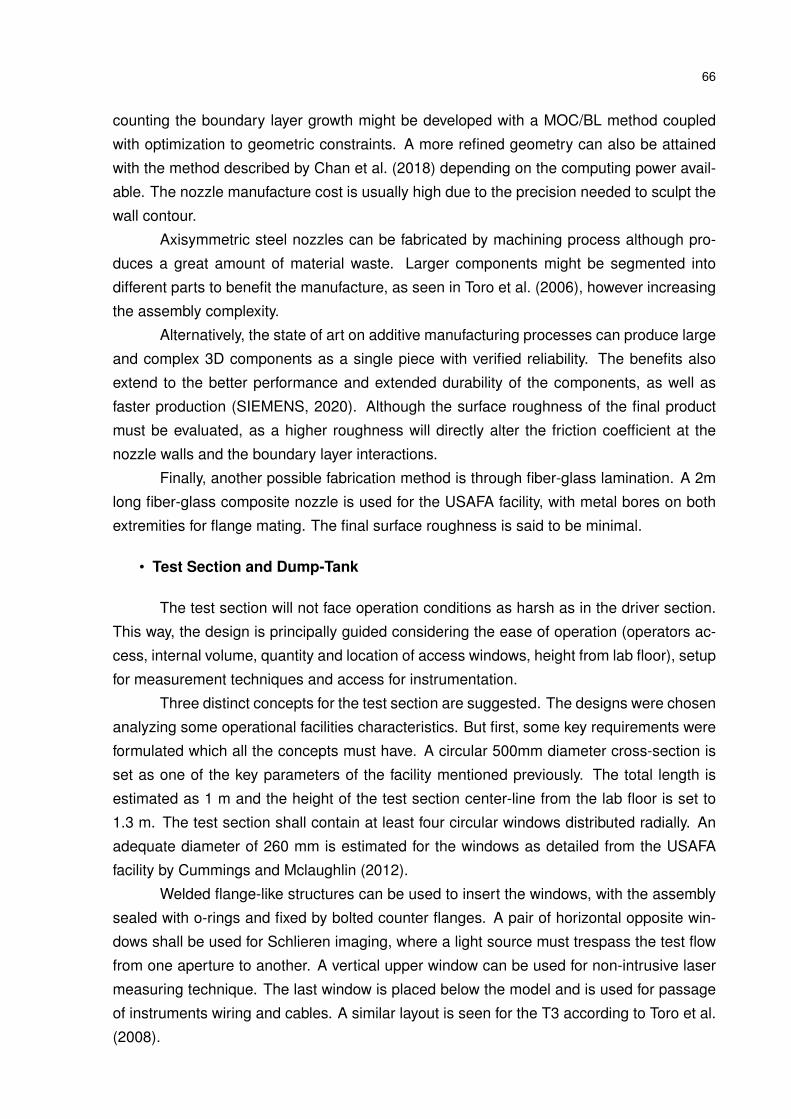
66
counting the boundary layer growth might be developed with a MOC/BL method coupled
with optimization to geometric constraints. A more refined geometry can also be attained
with the method described by Chan et al. (2018) depending on the computing power avail-
able. The nozzle manufacture cost is usually high due to the precision needed to sculpt the
wall contour.
Axisymmetric steel nozzles can be fabricated by machining process although pro-
duces a great amount of material waste. Larger components might be segmented into
different parts to benefit the manufacture, as seen in Toro et al. (2006), however increasing
the assembly complexity.
Alternatively, the state of art on additive manufacturing processes can produce large
and complex 3D components as a single piece with verified reliability. The benefits also
extend to the better performance and extended durability of the components, as well as
faster production (SIEMENS, 2020). Although the surface roughness of the final product
must be evaluated, as a higher roughness will directly alter the friction coefficient at the
nozzle walls and the boundary layer interactions.
Finally, another possible fabrication method is through fiber-glass lamination. A 2m
long fiber-glass composite nozzle is used for the USAFA facility, with metal bores on both
extremities for flange mating. The final surface roughness is said to be minimal.
• Test Section and Dump-Tank
The test section will not face operation conditions as harsh as in the driver section.
This way, the design is principally guided considering the ease of operation (operators ac-
cess, internal volume, quantity and location of access windows, height from lab floor), setup
for measurement techniques and access for instrumentation.
Three distinct concepts for the test section are suggested. The designs were chosen
analyzing some operational facilities characteristics. But first, some key requirements were
formulated which all the concepts must have. A circular 500mm diameter cross-section is
set as one of the key parameters of the facility mentioned previously. The total length is
estimated as 1 m and the height of the test section center-line from the lab floor is set to
1.3 m. The test section shall contain at least four circular windows distributed radially. An
adequate diameter of 260 mm is estimated for the windows as detailed from the USAFA
facility by Cummings and Mclaughlin (2012).
Welded flange-like structures can be used to insert the windows, with the assembly
sealed with o-rings and fixed by bolted counter flanges. A pair of horizontal opposite win-
dows shall be used for Schlieren imaging, where a light source must trespass the test flow
from one aperture to another. A vertical upper window can be used for non-intrusive laser
measuring technique. The last window is placed below the model and is used for passage
of instruments wiring and cables. A similar layout is seen for the T3 according to Toro et al.
(2008).

67
Meanwhile, the key parameter related to the dump tank is an estimated internal
volume of roughly 14 m3. Which was evaluated comparing VDT from the USAFA and the
one designed, 0.53 m3 and 0.97 m3 respectively.
The first concept is similar to the own T3 test section (TORO et al., 2006), but scaled
down to the dimensions mentioned, Figure 5.15. The operators access to the test section
can be through the windows or by entering inside the dump tank, which is directly mounted
downstream the test section. There is no diffuser in this concept. This facility features a
vertical dump of 4.5 m in height and 2 m in diameter. On Figure 5.16 the dump tank is
illustrated along with a 1.75 m operator dummy. For the T3 facility, the dump tank was also
designed to be trespassed by a long sting support used to sustain models into the test
section with minimal interference from the support itself.
The second concept is derived from the USAFA Ludwieg tube by Cummings and
Mclaughlin (2012). The test section is similar to the previous concept, but with a rectangular
access at the bottom used as a probe chamber, which can comport a linear motion unit and
a pitot rake, Figure 5.17. The main difference is that the internal access is done by sliding
the 1m long diffuser section inside the dump-tank, which is mounted horizontally, Figure
5.18. For that, a set of roller guides are mounted near the dump tank entrance. Additionally,
inflatable sealing rings in this region ensure the agreement to both sealing efficiency and
diffuser sliding mechanism, firmly sealing the tube when pressurized but also allowing the
diffuser movement when needed. It is believed that the access and work room is also
improved in this case, however the additional mechanisms involved can increase costs and
complexity. This design also introduces the installation of a model support between test
section and diffuser flange connections.
Figure 5.15 – Test Section Concept 1.
Source: Author.
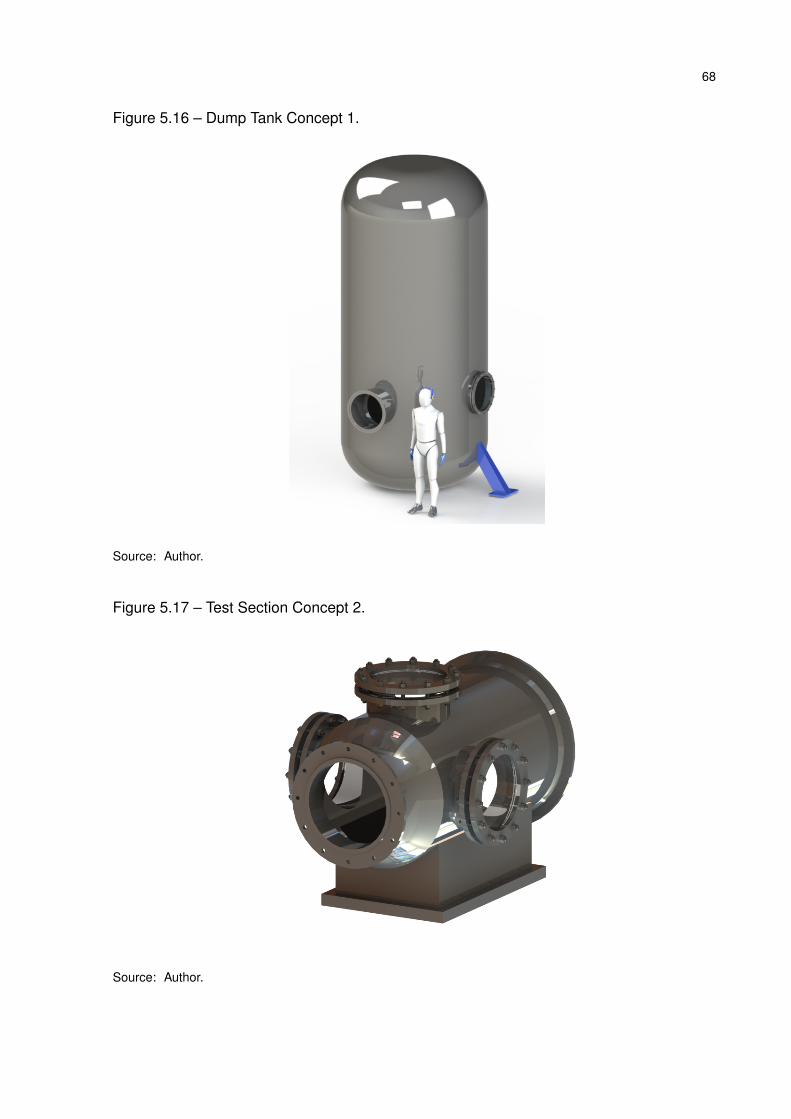
68
Figure 5.16 – Dump Tank Concept 1.
Source: Author.
Figure 5.17 – Test Section Concept 2.
Source: Author.

69
Figure 5.18 – Dump Tank Concept 2.
Source: Author.
Finally, the third test section concept is an adaptation of the square test section from
the UTSA Ludwieg tube. Here, a lateral hinged door is used for internal access (BASHOR
et al., 2019), Figure 5.19. This feature could provide a greater flexibility to access the
interior for minor adjustments in comparison with the other methods described. However,
the wall thickness would need to be greater in order to machine bolt holes for fixing the door
on test runs. The desired windows display were then added on this design to satisfy the
operational capabilities.
Figure 5.19 – Test Section Concept 3.
Source: Author.
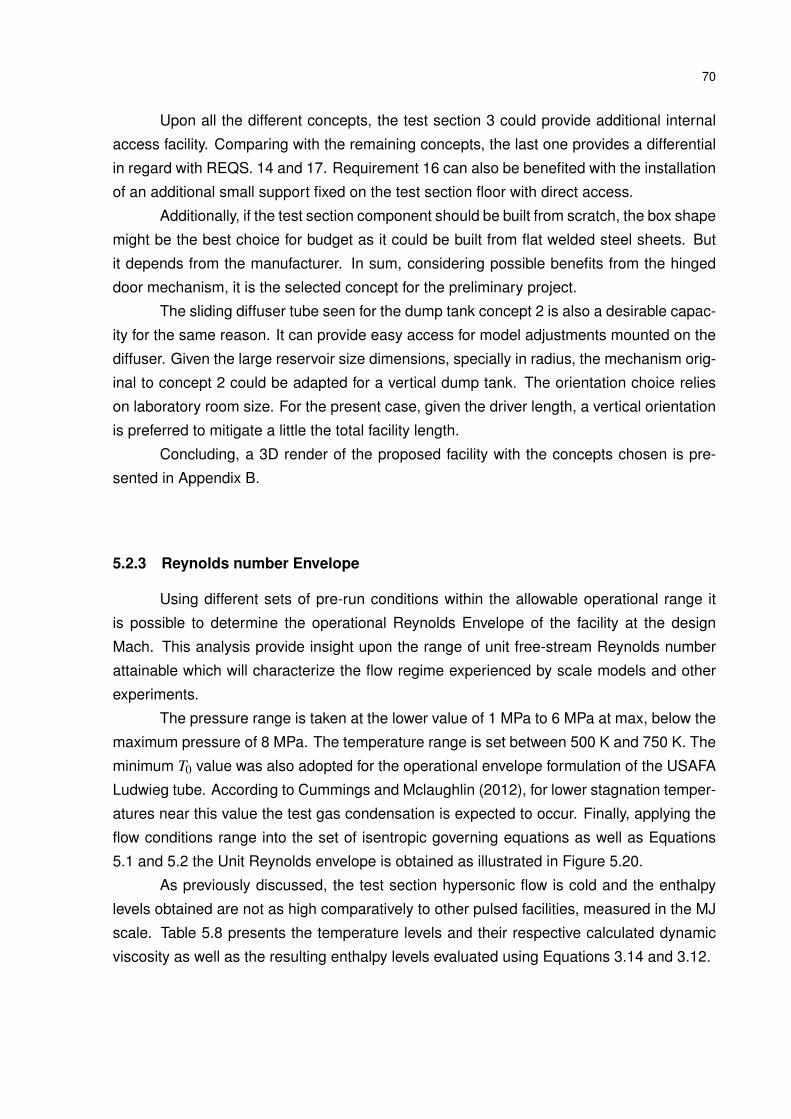
70
Upon all the different concepts, the test section 3 could provide additional internal
access facility. Comparing with the remaining concepts, the last one provides a differential
in regard with REQS. 14 and 17. Requirement 16 can also be benefited with the installation
of an additional small support fixed on the test section floor with direct access.
Additionally, if the test section component should be built from scratch, the box shape
might be the best choice for budget as it could be built from flat welded steel sheets. But
it depends from the manufacturer. In sum, considering possible benefits from the hinged
door mechanism, it is the selected concept for the preliminary project.
The sliding diffuser tube seen for the dump tank concept 2 is also a desirable capac-
ity for the same reason. It can provide easy access for model adjustments mounted on the
diffuser. Given the large reservoir size dimensions, specially in radius, the mechanism orig-
inal to concept 2 could be adapted for a vertical dump tank. The orientation choice relies
on laboratory room size. For the present case, given the driver length, a vertical orientation
is preferred to mitigate a little the total facility length.
Concluding, a 3D render of the proposed facility with the concepts chosen is pre-
sented in Appendix B.
5.2.3 Reynolds number Envelope
Using different sets of pre-run conditions within the allowable operational range it
is possible to determine the operational Reynolds Envelope of the facility at the design
Mach. This analysis provide insight upon the range of unit free-stream Reynolds number
attainable which will characterize the flow regime experienced by scale models and other
experiments.
The pressure range is taken at the lower value of 1 MPa to 6 MPa at max, below the
maximum pressure of 8 MPa. The temperature range is set between 500 K and 750 K. The
minimum T0 value was also adopted for the operational envelope formulation of the USAFA
Ludwieg tube. According to Cummings and Mclaughlin (2012), for lower stagnation temper-
atures near this value the test gas condensation is expected to occur. Finally, applying the
flow conditions range into the set of isentropic governing equations as well as Equations
5.1 and 5.2 the Unit Reynolds envelope is obtained as illustrated in Figure 5.20.
As previously discussed, the test section hypersonic flow is cold and the enthalpy
levels obtained are not as high comparatively to other pulsed facilities, measured in the MJ
scale. Table 5.8 presents the temperature levels and their respective calculated dynamic
viscosity as well as the resulting enthalpy levels evaluated using Equations 3.14 and 3.12.

71
Figure 5.20 – Operational Reynolds Envelope for the proposed Ludwieg tube.
Source: Author.
Table 5.8 – Static temperatures, dynamic viscosity’s and enthalpy levels for the attainabletest section flows inside the Reynolds number Envelope.
T0 (K) T (K) µ (kg/m.s) h (kJ) h0 (kJ)
750 125 8.8292E-6 125.56 753.38
600 100 7.0954E-6 100.45 602.7
500 83.33 5.8802E-6 83.71 502.25
Source: Author.
The UFSM proposed facility could provide unit Reynolds ranging from 6.68 x 10⁶ to
73.78 x 10⁶. This interval comprises other facilities unit Reynolds capabilities, Table 5.9.
But most important, the facility is, in theory, capable to provide unit Reynolds in a
higher magnitude order than those seen for real flight at Mach number 5, summarized from
Figure 5.2 on Table 5.10. The Reynolds number similarity should be achieved with the
proper adjustment of the test artifacts dimensions and the Ludwieg tube calibration.

72
Table 5.9 – Unit Reynolds range comparison with another Ludwieg tubes.
Name Mach number Re (m−1)
UTSI 4 48 x 106
AFRL 6 13 x 106 to 34 x 106
BAM6QT 6 11 x 106
USAFA 6 5 x 10⁶ to 32.5 x 10⁶
UTSA 7 47 x 106
UFSM 5 6.68 x 10⁶ to 73.78 x 10⁶
Source: (LINDORFER et al., 2016; BASHOR et al., 2019; CUMMINGS; MCLAUGHLIN, 2012; KIMMEL etal., 2016).
Table 5.10 – Unit Reynolds and dynamic viscosity for different altitude levels at Mach 5.
H (km) T (K) u (m/s) µ (kg/m.s) Re (1/m)
20 216.65 1.4752E3 0.1437E-4 9.0339E6
25 221.65 1.4921E3 0.1464E-4 4.0199E6
30 226.65 1.5089E3 0.1491E-4 1.8216E6
35 237.05 1.5431E3 0.1546E-4 0.8192E6
40 251.05 1.588E3 0.1619E-4 0.3775E6
45 265.05 1.6317E3 0.1689E-4 0.1816E6
50 270.65 1.6488E3 0.1717E-4 0.0938E6
Source: Author.

6 CONCLUSION
This work performed an initial approach on the development of a Mach number 5
Ludwieg tube. A set of 21 requirements were set, which after valuation guided the facility
design until the main goal: the preliminary design of an academic Ludwieg tube.
Fundamental analyses were conducted on the most expressive key parameters of
the facility. The driver Mach number, test section dimensions and test-run duration shall be
adequately chosen according to the requirements of importance. In this way, the analyses
conducted helped to quantify the stagnation conditions needed to generate approximate
flight conditions and the resulting Reynolds number Envelope. In the end, the key parame-
ters where set considering a balance between research potential, safety and feasibility.
The results from the previous analyses aided the guidance of the mechanical project,
where a detailed design of the driver section in agreement with ASME design codes was
performed. Additionally, the study of existent pulsed wind tunnels provided good insight
for formulation and comparison of test section and dump tank concepts. Where a final
combination of concepts, judged having more agreement with the proposed requirements,
was implemented. Else, the identification of mechanisms, auxiliary equipment and overall
engineering solutions applied in each case.
Some of the components still need their own dedicated projects, as it is in the case
for the nozzle and fast action valve, although considerations for both components were
presented in this work. The nozzle shall be designed with the appropriate numerical method
in order to compromise flow quality and exit Mach number in agreement with feasibility. The
fast action valve can lead to a more multidisciplinary project.
In conclusion, additionally to the goals accomplished within this project, this work
presented a general view of the Ludwieg Tube pulsed facility, trying to cover the most quan-
tity of details as possible. The features of this system as well as the quantity of recent
papers found, also related to the design and implementation of this facility on several in-
stitutions, strongly indicates that this system could substantially improve the experimental
high-speed research in Brazil and the national development of related aerospace technolo-
gies. However, paradoxically, not a single work from Brazilian authors about this type of
facility was found. That been said, it is believed that this is a pioneer work in the country for
this specific subject. This work conceived a preliminary design of the facility. So, there is
still many opportunities for future works.
In conclusion, the room for future contributions in this work or even start similar
projects from scratch - considering a national application, is vast. Considering the highlight
given for the development of novel aerospace high-speed systems in the world and the
space for growing projects in this field in Brazil, the motivations for working in this area -but
not only limited to pulsed wind tunnels, similarly appears in vast proportions.

BIBLIOGRAPHY
ANDERSON, J. D. Modern Compressible Flow with Historical Perspective. 3. ed. NewYork: McGraw-Hill, 2003. 760 p.
. Quasi-one-dimensional flow. In: MCGRAW-HILL (eds.). Modern CompressibleFlow with Historical Perspective. [S.l.]: McGraw-Hill Higher Education, 2003. cap. 5, p.192–237.
ASME. Factory-Made Wrought Buttwelding Fittings - ASME B16.9. New York: TheAmerican Society of Mechanical Engineers, 2001.
. Metallic Gaskets for Pipe Flanges - ASME B16.20. New York: The American Soci-ety of Mechanical Engineers, 2012.
. Pipe Flanges and Flanged Fittings - ASME B16.5. New York: The American Soci-ety of Mechanical Engineers, 2013.
. Process Piping - ASME B31.3. New York: The American Society of MechanicalEngineers, 2016.
. ASME Boiler and Pressure Vessel Code, Section II: Materials - Part D: Proper-ties (Metric). New York: The American Society of Mechanical Engineers, 2017.
BAKOS, R. J.; ERDOS, J. I. Options for enhancement of the performance of shock-expansion tubes and tunnels. AIAA 33rd Aerospace Sciences Meeting and Exhibit,1995.
BASHOR, I. P.; COMBS, C. S. RANS simulation of the UTSA Mach 7 Ludwieg tube. AIAARegion IV Student Conference, 2019.
BASHOR, I. P. et al. Design and preliminary calibration of the UTSA Mach 7 hypersonicLudwieg tube. AIAA Aviation Forum, 2019.
BERTIN, J. J.; CUMMINGS, R. M. Fifty years of hypersonics: where weve been, wherewere going. Progress in Aerospace Sciences, v. 39, n. 6-7, p. 511–536, 2003.
Boom. XB-1. 2020. Acessed in Sep. 05, 2020. Disponível em: <https://boomsupersonic.com/xb-1/build>.
BRUN, R. Shock tubes and shock tunnels: Design and experiments. STO EducationalNotes: RTO-EN-AVT-162, n. 12, p. 24, 2011.
Caltech. GALCIT Ludwieg Tube. Caltech Hypesonics Group, 2014. Acesso em 22 ago.2019. Disponível em: <http://shepherd.caltech.edu/T5/Ae104/Ae104b_handout2014.pdf>.
CHAN, W. Y. K. et al. Aerodynamic design of nozzles with uniform outflow for hypervelocityground-test facilities. Journal of Propulsion and Power, v. 34, n. 6, 2018.
CHUNG, J. Quasi-One-Dimensional Modeling of an Adiabatic-Compression Pre-heated Ludwieg Tube. 2015. 107 p. Dissertação (Master of Science) — University ofMaryland, 2015.

75
CHUNG, J. D.; HOUIM, R. W.; LAURENCE, S. J. Adiabatic-compression preheated Lud-wieg tube for the realistic simulation of hypersonic flows. 20th AIAA International SpacePlanes and Hypersonic Systems and Technologies Conference, 2015.
CNN Travel. Concorde’s last flight: Is this the greatest aviation photograph of alltime? 2020. Accessed in 05 Sep. 2020. Disponível em: <https://edition.cnn.com/travel/article/concorde-last-flight-photo/index.html>.
CORDIS. High-Speed Experimental Fly Vehicles - International. European Commis-sion, 2020. Accessed in 02 Oct. 2020. Disponível em: <https://cordis.europa.eu/project/id/620327>.
CPIHEAT. SureHeat MAX Air Heater Datasheet. 2020. Ac-cessed in 3 Aug. 2020. Disponível em: <https://www.cpiheat.com/Sylvania-074734-Sureheat-MAX-Hot-Air-Heater-p/074734.htm>.
CSILLAG, J. M. Análise do Valor: metodologia do valor. 4. ed. [S.l.]: Atlas, 1995. 303 p.
CUMMINGS, R. M.; MCLAUGHLIN, T. E. Hypersonic Ludwieg tube design and future usageat the US Air Force Academy. 50th AIAA Aerospace Sciences Meeting including theNew Horizons Forum and Aerospace Exposition., 2012.
DAVID, K. et al. Aeronautical wind tunnels: Europe and Asia. Library of Congress Re-search Report, 2006.
GILDFIND, D. E.; MORGAN, R. G.; JACOBS, P. A. Expansion tubes in australia. In: IGRA,O.; SEILER, F. (eds.). Experimental Methods of Shock Wave Research. Shock WaveScience and Technology. [S.l.]: Springer International Publishing, 2016. cap. 4, p. 399–433.
GNEMMI, P. et al. Shock tunnels at isl. In: IGRA, O.; SEILER, F. (eds.). Experimental Meth-ods of Shock Wave Research. Shock Wave Science and Technology. [S.l.]: SpringerInternational Publishing, 2016. cap. 2, p. 131–179.
HICKS, J. W. Flight Testing of Airbreathing Hypersonic Vehicles. Dryden Flight Re-search Facility: NASA Technical Memorandum 4524, 1993.
HOFFMAN, E.; COMBS, C. S. Design considerations and analysis of the UTSA hypersonicLudwieg tube facility. AIAA Region IV Student Conference, 2019.
IGRA, O.; HOUAS, L. Shock tubes. In: IGRA, O.; SEILER, F. (eds.). Experimental Meth-ods of Shock Wave Research. Shock Wave Science and Technology. [S.l.]: SpringerInternational Publishing, 2016. cap. 1, p. 3–53.
INCOSE. Systems Engineering Handbook - A Guide for System Life Cycle Processesand Activities. 4. ed. [S.l.]: Wiley, 2015. 291 p.
KIMMEL, R. L. et al. AFRL Ludwieg tube initial performance. 55th Aerospace SciencesMeeting, 2016.
KLICHE, D.; MUNDT, C.; HIRSCHEL, E. The hypersonic mach number independence prin-ciple in the case of viscous flow. Shock Waves, 2011.
KOPPENWALLNER, G. Hypersonic flow simulation in Ludwieg tube. Int. Symposium onRecent Advamces in Experimental Fluid Dynamics, IIT Kanpur India., 2000.

76
KOPPENWALLNER, G.; MüLLER-EIGNER, R.; FRIEHMELT, H. Hhk hochschulhyperschall-kanal: Ein "low cost" windkanal für forschung und ausbildung. DGLRJahrbuch, 1993.
LINDORFER, S. A. et al. An investigation of the role of an upstream burst diaphragm onflow quality within a Ludwieg tube using RANS. 46th AIAA Fluid Dynamics Conference,2016.
MARTOS, J. F. A. Investigação Experimental do Veículo Hipersônico Aeroespacial 14-X B. 2014. 132 p. Dissertação (Master’s Degree in Mechanical Engineering) — Universi-dade Federal do ABC, Santo André, SP, 2014.
MURNAGHAN, M. Study of minimum length, supersonic nozzle design using theMethod of Characteristics. 2019. 82 p. Dissertação (Master’s Degree in Space and Aero-nautical Engineering (MASE)) — Universitat Politècnica de Catalunya, 2019.
NASA. More Pieces of the X-59 are Coming Together. 2020. Acessedin Sep. 05, 2020. Disponível em: <https://www.nasa.gov/aeroresearch/more-pieces-of-the-x-59-are-coming-together>.
. NASAs X-59 Quiet Supersonic Research Aircraft Cleared for Final Assembly.2020. Acessed in Jan. 20, 2020. Disponível em: <https://www.nasa.gov/press-release/nasa-s-x-59-quiet-supersonic-research-aircraft-cleared-for-final-assembly>.
OLIVIER, H. The aachen shock tunnel th2 with dual driver mode operation. In: IGRA, O.;SEILER, F. (eds.). Experimental Methods of Shock Wave Research. Shock Wave Sci-ence and Technology. [S.l.]: Springer International Publishing, 2016. cap. 2, p. 111–131.
PAHL, G. et al. Projeto na Engenharia Mecânica - Fundamentos do DesenvolvimentoEficaz de Produtos. 4. ed. [S.l.]: Edgard Blücher, 2005. 407 p.
PARISHER, R. A.; RHEA, R. A. Pipe Drafting and Design. 3. ed. [S.l.]: Elsevier, 2012.470 p.
RADESPIEL, R. et al. Hypersonic Ludwieg tube. In: IGRA, O.; SEILER, F. (eds.). Exper-imental Methods of Shock Wave Research. Shock Wave Science and Technology.[S.l.]: Springer International Publishing, 2016. cap. 4, p. 433–455.
RAO, G. V. R. Exhaust nozzle contour for optimum thrust. Journal of Jet Propulsion, v. 28,n. 6, p. 377–382, 1958.
ROMANELLI, D. P. et al. Preliminary characterization of the hypersonic flow in the testsection of the IEAv T3 hypersonic shock tunnel. 21st Brazilian Congress of MechanicalEngineering, p. 10, 2011.
ROMANO, L. N. Modelo de Referência para o processo de desenvolvimento deMáquinas Agrícolas. 2003. 321 f. Tese (Doctor’s Degree in Mechanical Engineering) —Universidade Federal de Santa Catarina, Santa Catarina, 2003.
SCHRIJER, F. F. J.; BANNINK, W. J. Description and flow assesment of the delft hypersonicLudwieg tube. Journal of Spacecraft and Rockets, v. 47, n. 1, 2010.
SIEMENS. Additive manufacturing: Better turbines thanks to 3D-printing. 2020. Ac-cessed in 25 Aug. 2020. Disponível em: <https://new.siemens.com/global/en/company/stories/energy/better-turbines-thanks-to-3d-printing.html>.

77
SINGH, R. Optimal Design and Numerical Analisys of Axisymmetric Nozzles. 2015.142 f. Monografia (Graduation thesis) — Mechanical Engineering Course, School of Me-chanical and Manufacturing Engineering, Sydney, 2015.
TEWARI, A. Atmospheric and Space Flight Dynamics: Modelling and Simulation withMATLAB and Simulink. [S.l.]: Birkhäuser, 2006. 567 p.
TORO, P. G. P. et al. Development of a new hypersonic shock tunnel facility to investigateelectromagnetic energy addition for flow control and basic supersonic combustion. Ameri-can Institute of Physics Conference Proceedings, v. 860, n. 469, 2006.
. New hypersonic shock tunnel at the laboratory of aerothermodynamics and hyperson-ics prof. Henry T. Nagamatsu. American Institute of Physics Conference Proceedings,v. 997, n. 1, 2008.
. Brazilian 14-x hypersonic aerospace vehicle project. 18th AIAA/3AF InternationalSpace Planes and Hypersonic Systems and Technologies Conference, 2012.
. Projeto da seção de compressão do scramjet acadêmico da UFRN para voo at-mosférico acoplado ao foguete de treinamento. X Congresso Nacional de EngenhariaMecânica, p. 10, 2018.
USAF. x-51A Waverider. US Air Force, 2011. Accessed in 02 Oct. 2020. Disponível em:<https://www.af.mil/About-Us/Fact-Sheets/Display/Article/104467/x-51a-waverider/>.
WIDODO, A. S.; BUTTSWORTH, D. R. Stagnation temperature measurements in the usqhypersonic wind tunnel. 17th Australasian Fluid Mechanics Conference, 2010.
ÇENGEL, Y. A.; CIMBALA, J. M. Fluid Mechanics: Fundamentals and Applications. 3.ed. New York: McGraw-Hill College, 2017. 840 p.

APPENDIX A – MUDGE DIAGRAM

112
34
56
78
91
01
11
21
31
41
51
61
71
81
92
02
1V
ALU
E%
Ran
k
11
C1
B1
B1
B1
A1
C1
B1
A1
B1
B1
C1
B1
A1
A1
C1
B1
A1
C1
C1
C5
69
.41
2
22
C2
B2
B2
A2
B2
B2
A2
A2
B2
C2
B2
A2
A2
A2
A2
A2
C2
C2
C6
31
0.5
91
33
B3
C3
A3
C3
B3
A3
A3
A3
C3
A3
C3
A3
C3
A3
A3
C3
C3
C5
49
.08
4
44
C4
A4
C4
B4
A4
C4
C1
2B
4C
4C
4C
16
C4
C4
C1
9B
20
B2
1B
22
3.7
01
0
55
A7
B8
B5
B1
0C
11
C1
2A
13
A5
C1
5B
16
B5
C5
B1
9B
20
B2
1B
13
2.1
81
6
67
A8
A9
B1
0B
11
B1
2A
13
A1
4A
15
B1
6A
17
C1
8C
19
A2
0A
21
A0
0.0
02
1
77
B7
B7
C7
C1
2B
7C
7B
7B
7C
7B
7B
19
B2
0B
21
B3
05
.04
8
89
A1
0C
11
C1
2A
8C
8C
8B
16
B8
C8
C1
9B
20
B2
1B
15
2.5
21
4
91
0C
9B
12
A1
3B
14
B9
B1
6B
9B
9B
19
B2
0B
21
B2
03
.36
12
10
10
C1
2B
13
B1
0B
10
B1
0C
10
C1
0C
19
B2
0B
21
B1
62
.69
13
11
12
A1
1B
11
C1
1B
11
C1
7C
18
C1
9A
20
A2
1A
13
2.1
81
6
12
12
B1
2A
12
B1
2B
12
B1
2B
19
C2
0C
21
C5
49
.08
4
13
13
B1
3B
13
C1
3B
13
B1
9C
20
C2
1C
29
4.8
79
14
14
B1
4C
14
C1
4C
19
B2
0B
21
B1
42
.35
15
15
16
C1
7C
18
C1
9A
20
A2
1A
61
.01
18
16
16
B1
6B
19
A2
0A
21
A2
23
.70
10
17
17
C1
9A
20
A2
1A
40
.67
19
18
19
A2
0A
21
A3
0.5
02
0
19
20
C1
9C
53
8.9
16
20
20
C5
59
.24
3
21
53
8.9
16
TOTA
L5
95
10
0.0
0C
= 1 (little m
ore im
po
rtant)
MU
DG
E DIA
GR
AM
- STAK
EHO
LDER
REQ
UIR
EMEN
TS
23
45
We
ights
A = 5
(mu
ch m
ore im
po
rtant)
B = 3
(mo
re imp
ortan
t)
NEED
REQ
* Read
follo
win
g the R
equ
iremen
t nu
mb
er ro
w. It
is com
pared
with
ano
ther re
qu
ireme
nt
accord
ing to
the co
lum
n in
terse
ction
.
* The n
um
ber w
ritten at th
e inte
rsectio
ns is
the "w
inn
er" req
uirem
ent w
ith a relative
margin
of im
po
rtance se
t by th
e we
ights.
79

APPENDIX B – CONCEPTUAL VIEW OF THE PROPOSED FACILITY
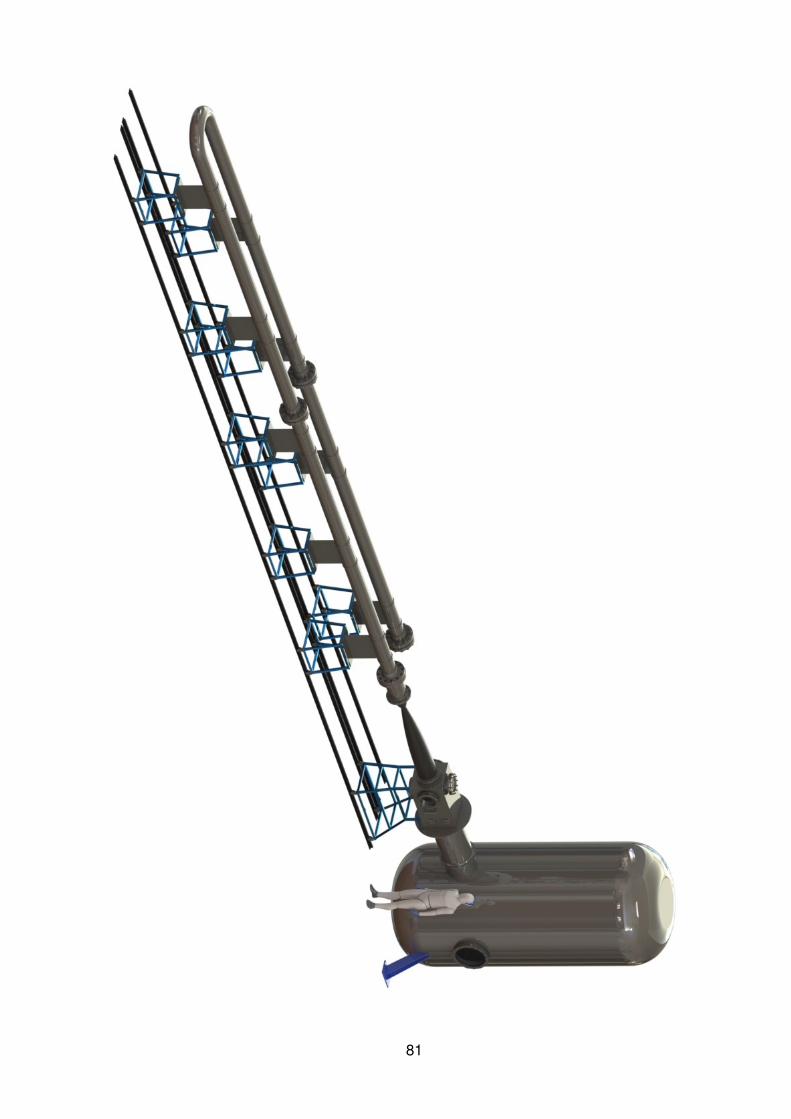
81
Related Documents


