Alabama Department of Public Health Nutrition and Physical Activity Division August 2012 Alabama Healthy Vending Machine Program

Welcome message from author
This document is posted to help you gain knowledge. Please leave a comment to let me know what you think about it! Share it to your friends and learn new things together.
Transcript

Alabama Department of Public HealthNutrition and Physical Activity Division
August 2012
Alabama Healthy Vending Machine Program
2
The original objectives of the project were: 1. By December 2010, educate and assist the
following four pilot state agencies to implement a
healthy vending machine policy in state level offices: ADPH, Governor’s Office and Capitol building, Alabama Department of Education, and Alabama Department of Agriculture and Industries.
The Alabama Healthy Vending Machine Program began in 2009 as a collaboration project between the Alabama Department of Public Health (ADPH) and the Alabama Department of Rehabilitation Services (ADRS) to provide healthier options in vending machines located in state agencies. The goal of the project was to create a policy that increased access to healthy foods and beverages and reduced or eliminated the availability of calorie dense, nutrient poor foods in public service venues. The Alabama Healthy Vending Machine Program (AHVMP) developed a policy with nutrition standards which was piloted in certain state agencies.
Although vending machines are convenient for employees to grab a snack during the work day, many are filled with low nutrient, high calorie foods and beverages. Positive environmental changes in the workplace can be made by replacing unhealthy options with more nutritious and healthful foods and beverages to support healthy behavior.
The overall goal of the AHVMP is to offer healthy choices while still allowing for free choice. The ADPH encourages healthy options in vending machines to assist state employees and visitors in leading a healthier lifestyle.
BACKGROUND
introduction
The ADPH and ADRS combined efforts to establish the AHVMP to offer healthier snacks and beverages to state employees working in state level offices. The lead programs responsible for the AHVMP were the Nutrition and Physical Activity Division (NPA) at ADPH and the Business Enterprise Program (BEP) at ADRS.
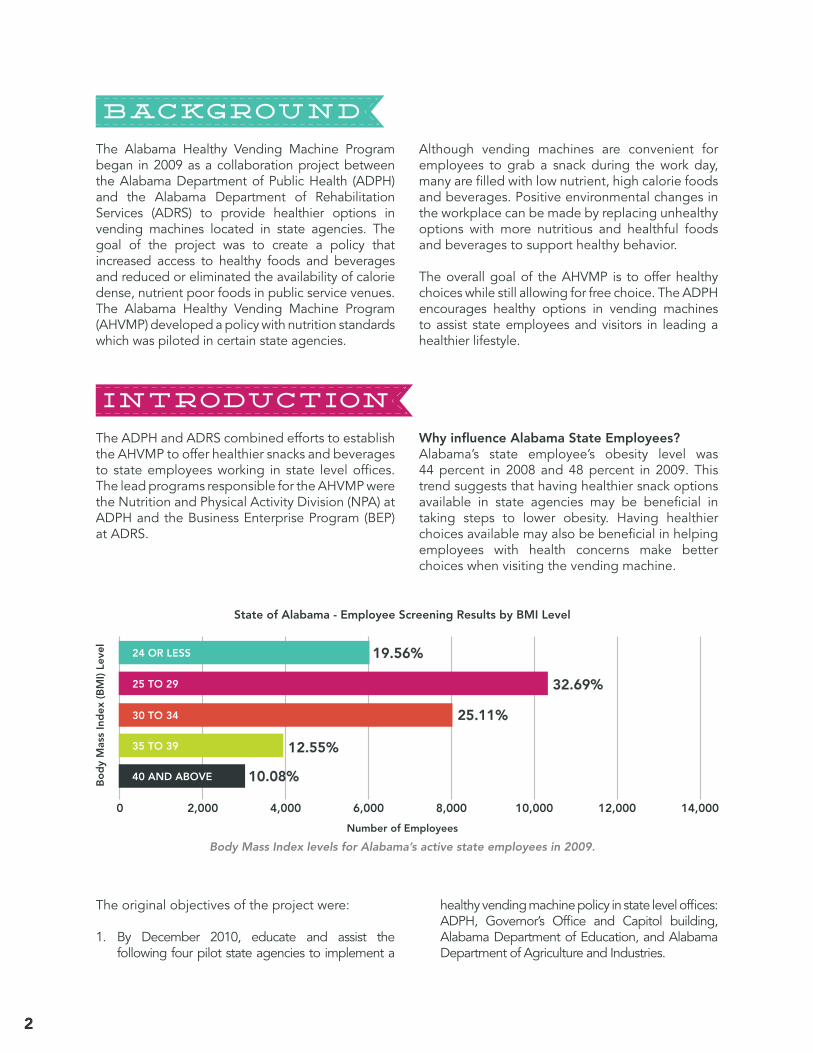
Why influence Alabama State Employees? Alabama’s state employee’s obesity level was 44 percent in 2008 and 48 percent in 2009. This trend suggests that having healthier snack options available in state agencies may be beneficial in taking steps to lower obesity. Having healthier choices available may also be beneficial in helping employees with health concerns make better choices when visiting the vending machine.
Body Mass Index levels for Alabama’s active state employees in 2009.
State of Alabama - Employee Screening Results by BMI Level
Bo
dy
Mas
s In
dex
(B
MI)
Leve
l
Number of Employees
0 2,000 4,000 6,000 8,000 10,000 12,000 14,000
24 OR LESS 19.56%
32.69%
25.11%
12.55%
10.08%
25 TO 29
30 TO 34
35 TO 39
40 AND ABOVE

3
2. By December 2011, educate and assist all state agencies to implement a healthy vending machine policy in state level offices.
3. By December 2011, the Governor of Alabama would sign an executive order to implement a healthy vending machine policy in all state offices at the state and local level.
Modifications to the objectives were made as the project moved forward. The following changes were made to Objective 1: The vendor at the Alabama Department of Education declined to participate in the pilot study; the state lab at ADPH and ADRS were added to the pilot study. The following change was made to Objective 3: An executive order was not requested from the current Governor; however, a recommendation from the ADPH State Health Officer was requested to implement the AHVMP in all ADPH offices statewide.
The pilot study started in October 2010 in the following state agencies: ADPH and the ADPH lab, Alabama Department of Agriculture and Industries, the Capitol, and ADRS. The pilot agencies were located in five buildings in Montgomery and managed by three vendors.
Step 1. Machine AuditsAfter being trained, the NPA staff and project evaluators assessed vending machines located in each agency. A standardized audit form was used to analyze the surrounding environment, snack and beverage content, nutrient content, and the percentage of snacks and beverages already meeting the nutrition standards before the introduction of the AHVMP (Appendix A).
Step 2. Employee SurveyEmployees from each pilot agency were surveyed electronically on attitudes about snacking and vending machine use at work before the introduction of the policy (Appendix B). A follow up survey was distributed to the same employees one year after the introduction of the policy.
Step 3. Policy ImplementationThe machines were stocked according to the policy; 50
methods
Vending machines in state buildings dressed with Good Choice materials.
The PolicyThe original policy stated 50 percent of the snacks and beverages in the vending machines would meet the 10-10-5 nutrition standards outlined below. • 10 percent or less of the Daily Value (DV) of
total fat (nuts are exceptions)• 10 percent or less of the Daily Value (DV) of
total carbohydrate (fruits are exceptions)• 5 percent or more of the Daily Value (DV) of
at least one of the following nutrients: fiber, vitamin A, vitamin C, calcium, or iron
• 360 mg or less of sodium
Preferred beverages included pure water, non- carbonated flavored and vitamin enhanced water (without artificial flavorings), 100 percent fruit and/or vegetable juice (without artificial sweeteners), and diet soda.

4
percent of the snacks and beverages were replaced with items meeting the nutrition standards. Each machine was dressed with promotion materials to identify the healthy snack or beverage and display educational messages. Posters and table tents were placed in the break rooms for message reinforcement. The price of snacks and beverages were comparable to the regular version of a similar item and not set higher.
Step 4. Education ComponentThe NPA staff hosted lunch and learn programs for employees in each pilot agency before the AHVMP was implemented. The audience learned about the AHVMP which included making healthy snack choices, reading labels, and participating in taste tests. All participants received educational handouts and incentives to take home or back to the office to share with other co-workers.
Step 5. Vending SalesMonthly sales data were tracked at the start date of the pilot and compared to the previous year’s monthly sales data. The vendors were reimbursed for any loss of sales experienced.
Step 6. Pilot ExpansionModifications were made to the policy to improve sales and vendor relations. New snacks were tested and put in the machines. Efforts to expand the pilot study began in the fall of 2011 in three additional agencies: Alabama Department of Senior Services, Farmers Market Authority, and the Montgomery County Health Department, a county level office of the ADPH.
Marketing CampaignThe Good Choice logo was created as a marketing tool for the AHVMP. The logo was designed by ADPH graphic artists to identify the healthier
snacks and beverages in the machines and provide positive messaging about taking steps towards healthy behaviors. The logo was used in education materials such as machine toppers, table tents, flyers, posters, incentives, and handouts. The Good Choice logo has become easily recognizable for its association with healthy snacking habits.
A healthy vending machine web page was created and is located on the ADPH web site. The web page contains information sheets, the snack list, nutrition standards, and guidelines for implementing the AHVMP. The healthy vending machine toolkit is also on the web page. It was designed so that any place of business can implement the AHVMP. Downloadable files of all the Good Choice materials are in the toolkit and free to be copied.
In the fall of 2011, a statewide media campaign was launched using the Good Choice logo and supporting messages that emphasize choosing healthier snacks. The campaign consisted of advertisements in six major Alabama magazines: Montgomery Parents, Mobile Parents, Eastern Shore Parents, River Region’s Journey and Boom, and Auburn-Opelika Parents. Gas pumptoppers (mini billboards) with Good Choice advertisements were placed in 45 gas stations along one of Alabama’s major interstates for five months.
A break room poster encouraging healthy snack and beverage choices using the Good Choice logo.
What will you pick?
Look for the Good Choice symbol when choosing a healthy snack.
For more information, go to www.adph.org/nutrition and click on vending machines.
Make a good choice.
State employees learn about selecting healthy snacks at work.

5
Machine AuditsVending machine audits were completed before and after the implementation of the AHVMP to assess the surrounding environment, snack and beverage content, nutrient content, and the percentage of snacks and beverages meeting the nutrition standards in the policy. All pilot agency machines were assessed except Site 1, who did not participate in the pilot study as planned. All NPA personnel were trained on how to complete the audit form.
Advertising on the Front of the Vending Machine. Initially, 18 of the 22 machines had some form of advertisement on the front of the machine. These ads included A D R S (n=1), cold drinks generic (n=3), cold drinks specific such as Coke, Pepsi, or Mountain Dew (n=5), and coffee (n=10). On follow-
up, all machines with advertisements contained Good Choice messages.
Nutrition Messages in the Vicinity of the Vending Machines. Prior to the intervention, health or nutrition messages were found in the breakroom or near the vending machines for 6 of the 22 machines. These messages included “Think your Drink,” (n=6), picture of orange juice (n=2), “Take the Stairs,” (n=4), ads for the Wellness Department (n=4), restaurant menus tacked to a nearby bulletin board (n=4), and “Control Diabetes.” At follow-up, the Good Choice messages were displayed in all vending areas.
Drink Machines. At baseline, 6 of the 22 machines contained cold drinks only and 11 contained both cold drinks and snacks. These combination
results
Environmental CriteriaBaseline Follow-up
N ( percent) N ( percent)
Site 2 11 11
Site 3 3 3
Site 4 4 4
Site 5 4 4
Access
Employees Only 22 (100) 20 (90.9)
Employees and Customers 0 2 (9.1)
Type of Machine
Combination 11 (50.0) 11 (50.0)
Drink 6 (28.2) 5 (22.7)
Snack 5 (22.7) 6 (28.2)
Advertising on Front of Machine 18 (81.8) 5 (22.7)
Advertised Foods Available 6 (33.3) 4 (18.2)
Nutrition Message Displayed Nearby 6 (28.6) 5 (22.7)
Foods Discussed in Nutrition Message Available in Vending Machine 0 (0.0) 4 (19.1)
Table 1: Descriptive Information about the Environment Surrounding the Vending Machines

6
machines also dispensed coffee and hot chocolate but these slots were not counted in the audit because they were either not in working order, not filled regularly, or coffee was available from a community coffee pot in the break room. Initially, 43.3 percent of slots were designated for a healthier drink option such as water, 100 percent fruit juice, or diet soda.
The goal was to have 50 percent of the slots in each drink machine contain healthy options of water, 100 percent fruit juice, or diet soda. At follow up, approximately 49.3 percent of items in the average cold drink vending machine were healthy. Empty slots on the day of the follow-up audit could explain why the goal was not met.
Snack Machines. There were 16 vending machines in the pilot test facilities and the goal was to stock 50 percent of the machines with snack items meeting the 10-10-5 nutrition standards. Eleven of these machines also sold cold and hot beverages. These machines were located in Site 2 only.
Compliance with the 10-10-5 Nutrition Standards. Contents of the Snack Machines. At baseline, 4.0 percent of the items sold in the average machine met the 10-10-5 standards. At follow-up, 25 percent of the items sold in a vending machine were in compliance with the 10-10-5 standards. Each component of the 10-10-5 standards improved from baseline to follow-up.
Compliance with the 10-10-5 Nutrition Standards with the Nut Exemption. The original policy suggested that 50 percent of items must meet these standards. At baseline, 16.7 percent of items met the 10-10-5 standards when items with nuts were exempt. At the follow-up audit, 48.5 percent of the items stocked in the average vending machine met the 10-10-5 standards when applying the nut/seeds exemption. These items were also located on the approved snack list. Each item was appropriately marked with the Good Choice logo. On the days of follow-up audits, approximately four to five slots were empty in the average vending machine. The lower than expected percentage of items meeting the target could be explained by empty slots.
Changes Made to the Types of Items Sold in Snack Machines. At baseline, approximately 20 percent of items sold in the average snack machine were regular chips while only 0.3 percent of items were lowfat, reduced fat, or baked chips. At follow-up, the greatest area of improvement was seen in the types
of chips sold. Only 12.5 percent of items were regular chips and 7.9 percent of items were baked or lower fat chips. Higher fat baked goods such as Danishes, doughnuts, and cookies were replaced with granola or cereal bars. The percentage of items that were considered chocolate items remained constant.
For the full evaluation report, including the Machine Audit Report, go to www.adph.org/nutrition and click on Vending Machines to read the “Evaluation of the Good Choice Program.”
Employee SurveyState government employees in participating agencies were electronically surveyed prior to and after the implementation of the AHVMP. The survey included questions about vending machine use at work, knowledge, snack patterns, confidence to make healthy choices, and barriers to making healthy snack choices.
The purpose of this survey was to determine whether selected interpersonal factors differed by vending use among employees prior to the intervention to improve availability of “healthier” vending options.
The percentage of employees who described themselves as overweight differed between baseline (63 percent) and follow-up (82 percent); however, the percentage of employees trying to lose weight remained the same. Changes in Vending Use by EmployeesVending use was categorized as LOW (less than one day per week), MODERATE (one to four days/week) or HIGH (five or more days/week). At baseline, the majority of employees who responded to the survey were LOW users of both beverage and snack vending machines (66 percent and 75 percent, respectively). Initially, approximately 80 percent of subjects brought snack foods from home to eat at work. When snacks were purchased at work from alternative sources, 24 percent and 19 percent of participants purchased snacks from snack shops within and outside of their buildings. Only 7 percent and 2 percent of survey participants were HIGH users of beverage and snack vending machines, respectively.
On follow-up, 80 percent (n=122) and 77 percent (n=118) of employees were LOW users of both beverage and snack vending machines, respectively. Approximately 84 percent of employees brought snacks from home to eat at work. Additionally, 26 percent and 13 percent of employees bought

7
Overall - Before Overall - After
n=193 n=153
n ( percent) n ( percent)
Gender
Male 44 (23) 29 (19)
Female 149 (77) 124 (81)
Race
White 139 (72) 109 (71)
Black/African American 49 (25) 39 (26)
Other* 5 (3) 5 (3)
Age Category
23-42 years 67 (35) 48 (31)
43-52 years 53 (27) 37 (24)
53 + years 73 (38) 68 (45)
Self-described weight status
Underweight/about right 71 (37) 27 (18)
Overweight 122 (63) 126 (82)
Efforts to change weight status
Lose weight 136 (70) 106 (69)
Gain weight/stay the same 57 (30) 47 (31)
Changed eating patterns to lose weight/health condition 161 (83) 121 (79)
Stage of change for beverages
Precontemplation 17 (9) 11 (7)
Contemplation 5 (3) 7 (5)
Preparation 12 (6) 5 (3)
Action 128 (66) 107 (70)
Maintenance 31 (16) 23 (15)
Stage of change for snacks
Precontemplation 7 (4) 9 (6)
Contemplation 12 (6) 5 (3)
Preparation 13 (7) 5 (3)
Action 111 (57) 99 (65)
Maintenance 50 (26) 35 (29)
Table 2: Characteristics of Government Employees Before and After a Vending Machine Intervention

8
snacks from snack shops within and outside of their buildings, respectively. Only 3 percent and 1 percent of employees were HIGH frequency users of beverage and snack vending machines, respectively. Identification of Good Choice SloganUpon follow-up, 95.5 percent (n=114) of employees could identify the Good Choice slogan.
Changes in KnowledgeInitially, 98 percent of employees could identify the low salt option from a list of three options. Upon follow-up 100 percent of employees could identify the correct answer. At baseline, 96 percent and 70 percent of employees could correctly identify the highest fiber and lowest calorie items, respectively. At follow-up, the percentage of employees that could correctly identify these items did not change.
Changes in Snack Patterns at WorkAfter the intervention, the percentage of moderate/high users of salty snacks, sweet pastry snacks, candies, and sugar sweetened beverages decreased while the percentage of moderate users of low fat snacks, fruits, vegetables, and dairy products increased.
Confidence in Making a Healthy ChoiceSelf-efficacy, or the confidence one has in his/her ability to make a good choice based on the situation, was measured using a five point Likert Scale.
Individuals with high scores are self-confident in making healthy snack decisions while individuals with low scores are not as confident. The average score for most of the self-efficacy questions fell within the middle of the scale indicating that the average employee lacks self-confidence to make a healthy snack choice when it is inconvenient to do so or when stressed and emotional.
Barriers to Healthy SnackingBarriers to healthy snacking were measured using a five point Likert Scale. Statements about barriers to healthy snacking were grouped based on taste, convenience, internal hunger/satiety cues, and knowledge. Again, higher scores represent greater barriers to healthy snacking. The barriers with the highest average scores were lack of availability and cost. Surprisingly, the average scores for taste were low, suggesting that taste was not a barrier and employees like the taste of healthy snacks.
For the full evaluation report, including the Employee Survey Report, go to www.adph.org/
nutrition and click on Vending Machines to read the “Evaluation of the Good Choice Program.”
Policy ImplementationThe policy was implemented as planned in four of the five pilot agencies. The Alabama Department of Education vendor did not agree to participate in the project. Several attempts were made to persuade the vendor to join the pilot without success. The vendor at the ADPH lab discontinued participation in the pilot study in its early phases.
With input from the BEP and the participating vendors, the policy was revised so that 25-100 percent of the snacks and beverages in the machines will meet the nutrition standards. Visit www.adph.org/nutrition and click on Vending Machines to view the current AHVMP standards.
Education ComponentLunch and learn sessions were held for employees at ADPH, the ADPH state lab, ADRS, the Capitol, and the Alabama Department of Agriculture and Industries. Sessions were completed twice in each of the agencies and a total of 126 state employees were in attendance.
At ADPH, follow-up emails were sent to all employees refreshing their memory on how to choose a healthy snack by reading labels.
The template for the lunch and learn presentation is available on ADPH’s Vending Machine web page and can be used by any organization to educate employees.
Vending SalesEach vendor was reimbursed for start up costs to implement the AHVMP. This included the cost of the healthy snacks, time spent training for the AHVMP, and stocking the machines with healthier snacks.
“The Good Choice Stickers (GCS) on the vending machine take out the counting and guess work, it has been done for you. Good Choices are easy when you have a guide. GCS are guides that can easily steer you in the right direction especially when you are on the run. Pick a GCS item and go - much like picking up a fresh fruit or vegetable - always a healthy choice!”
Alabama Department of Public Health Employee

9
SE
PT
EM
BE
R
OC
TO
BE
R
GRAPH 1 – Vending Sales – Gains/Losses over the duration of the pilot project starting in November 2010 through January 2012 compared to the previous year
$2,500
$1,500
$500
$0
$(500)
$(1,500)
$(2,500)
NO
VE
MB
ER
DE
CE
MB
ER
JAN
UA
RY
FE
BR
UA
RY
MA
RC
H
AP
RIL
MA
Y
JUN
E
JULY
AU
GU
ST
2009/10 vs 2010/11 2010/11 vs 2011/12
Monthly vending machine sales data were collected during the pilot study year and compared to the previous year’s (nonpilot study year 2009-2010) sales to determine losses. During the second year of the pilot, the monthly sales were compared to the first year of the pilot study in Graph 1 and to the nonpilot study year in Graph 2.
At the time of the pilot, there was no system in place to identify which snacks were selling so the total sales per machine were used in the calculations and not the sales of the healthy snacks only. The ADRS accounting office created a formula to accurately calculate the comparisons.
The graphs below use figures provided to ADPH in invoices and represent two of the four agencies participating in the pilot study which are serviced by one vendor. The sales data from these two agencies were used because a more precise method of record keeping was used by that particular vendor. The other two agencies were removed from this report due to a different style of record keeping which required percentages to be taken based on the number of machines serviced. The graphs represent the most accurate sales data available from this project.
In Graph 1, the blue bars represent the deviation in sales for Sites A and B (combined) during the pilot study year compared to the nonpilot study year 2009-2010. The red bars represent the deviation in sales for Sites A and B (combined) during November through January in the second year of the pilot study year compared to the previous pilot year during the
same months. A loss of sales is noted throughout the first year of the pilot study with the exception of August where a slight increase is reported. In the second year of the project, gains in sales are seen in comparison to the prior year.
In Graph 2, the red and blue bars represent the deviation in sales in Sites A and B (combined) during the pilot study compared to the nonpilot study year 2009-2010. Despite a loss of sales throughout the majority of the pilot study, substantial improvements are noted as it progressed.
Graph 3 illustrates the actual monthly sales during the nonpilot year (2009-2010) and the pilot year (2010-2011, 2012) for Site A. Initially, overall sales are lower in the pilot study year compared to the nonpilot year, but follow a very similar pattern. Slightly higher sales in the pilot study year are noted in August. Sales in November 2011 and January 2012 are higher than both the pilot year and the previous year demonstrating that sales were improving towards the end of the project.
Graph 4 illustrates the actual monthly sales during the nonpilot year (2009-2010) and the pilot year (2010-2011, 2012) for Site B. Initially, overall sales are lower in the pilot study year compared to the nonpilot year but follow a similar pattern in monthly sales. Higher sales are noted in August and October when compared to the nonpilot year. Higher sales are also noted in November 2011 and January 2012 when compared to both the pilot year and the nonpilot year demonstrating that sales were improving towards the end of the project.

10
GRAPH 3 – Site A – Total Vending Sales Per Month
2009-2010 Pre Study 2010-2011 During Study 2011-2012
$6000
$5500
$5000
$4500
$4000
$3500
$3000
$2500
$2000November December January February March April May June July August September October
GRAPH 4 – Site B – Total Vending Sales Per Month
2009-2010 Pre Study 2010-2011 During Study 2011-2012
$1700
$1500
$1300
$1100
$900
$700
$500
$300
$100November December January February March April May June July August September October
GRAPH 2 - Vending Sales – Gains/Losses over the duration of the pilot project starting in November 2010 through January 2012 compared to the nonpilot study year (2009-2010)
SE
PT
EM
BE
R
OC
TO
BE
R
$1000
$0
$(1,000)
$(2,000)
$(3,000)
$(4,000)
NO
VE
MB
ER
DE
CE
MB
ER
JAN
UA
RY
FE
BR
UA
RY
MA
RC
H
AP
RIL
MA
Y
JUN
E
JULY
AU
GU
ST
2009/10 vs 2010/11 2010/11 vs 2011/12

11
Pilot ExpansionThe pilot study expansion began in the fall of 2011 to the Alabama Department of Senior Services, Farmers Market Authority, and the Montgomery County Health Department, a county level office of the ADPH.
After discussions with partners at ADRS and input from the vendors, the policy was altered to allow more flexibility with the percentage of healthy snacks and beverages in each machine. It was revised so that 25 to 100 percent of the machine will contain snacks and beverages meeting the nutrition standards.
Lunch and learn programs were also completed in
the new pilot agencies to educate employees on the AHVMP.
These agencies are not serviced by the ADRS program. New partnerships have developed with private vending companies, and they will assist the NPA Division to expand the AHVMP in vending machines they service.
“I think the foods we sampled today are a good variety to go into the machines.” Montgomery County Health Department Employee
The results of the employee survey reveal that a lack of healthy vending options may be associated with increased reported barriers to healthy snacking among HIGH vending users. These findings support the need to improve workplace vending offerings and highlight a potential opportunity for nutrition education. Snack patterns improved and knowledge remained high.
The results of the vending machine audits demonstrate the need for healthier snacks and beverages of better nutritional quality. The post vending machine audits show improvements in the nutrition content based on a higher percentage of snacks and beverages meeting the 10-10-5 nutrition standards which can be attributed to the AHVMP. There were also improvements in the types of chips available with a much higher percentage of low fat, reduced fat, or baked chips after the AHVMP was implemented.
The sales data clearly shows lower sales during the first pilot study year but this could be due to a number of outside influences which are described in the next section of this report. As the project entered its second year, improvements in sales were noted. It should be noted that the participating vendors verbalized a decrease in sales even in buildings that were not participating in the pilot study during the same time period. This suggests that the healthier snacks alone may not have caused lower sales.
Barriers and ChallengesOutside influences - there were multiple outside influences that may have negatively impacted the AHVMP. • Economy-adecreaseinsalesmaybeduetoa
nationwide economic decline during 2011. • Layoffs-onepilotagencyexperiencedsignificant
employee layoffs (89 employees) which could have contributed to decreased sales.
• NewGovernorandAgricultureCommissioner-the project received prior approval and support from these state leaders; however, in 2010 a new administration was elected and established contacts were lost.
Accounting system - due to the unprecedented nature of this project in Alabama, the accounting system to pay invoices from the vendors was not in place and had to be created. This process took longer than expected and caused delays in payment, creating frustration among the vendors. A face-to-face meeting with accountants from ADPH and ADRS was held and an agreement was reached on accounting methods. The first invoices were processed promptly and there were no other problems in processing invoices. Elected Committee of Blind Vendors - the NPA staff was not aware of this committee and their role in policy development. This committee could have been a useful advisor in the early stages of the project. The NPA staff reached out to the Elected Committee of Blind Vendors to establish a relationship and gain support for the AHVMP. Materials were provided for distribution to the committee members. Agency selection - pilot agencies were selected based on their interest in providing healthy options for their employees and past involvement in
conclusions

12
worksite wellness programs. As a result, one vendor had the majority of the project responsibility causing a significant increase in his workload. Distributing the locations in the pilot study more evenly among participating vendors would have decreased the burden on one vendor. Negative perceptions and dissatisfaction - complaints were brought to the vendors and NPA staff initially, even after staff education sessions. New snacks meeting the nutrition standards of the AHVMP were placed in the machines and additional classes were offered to employees to decrease complaints. Successes Recognition - the AHVMP is recognized as an influential worksite wellness tool and is being identified as a step in creating healthy environments at work as well as other organizations. The logo is easily recognized by employees; the employee survey revealed that 95.5 percent knew the Good Choice symbol at the follow-up of the pilot study.
New, supportive partners - the AHVMP is embraced by organizations other than state agencies. Entities such as banks, private businesses, large manufacturers, and universities have shown interest in implementing the AHVMP. Hospitals are particularly interested in the AHVMP, and it is currently being implemented in eight Alabama hospitals.
Local level support - local health departments are receptive to the AHVMP and are requesting more information as well as presentations on the healthy vending project. Three county health departments have adopted the nutrition standards and more are expected to do the same.
Additional staffing - the ADPH Chronic Disease program received a grant and hired a nutritionist to assist with the sustainability of the AHVMP. The nutritionist is working closely with the NPA staff to continue expanding the policy to other worksites as well as state and local agencies.
Next steps 1. A Healthy Campus Toolkit is currently being
developed for ADPH at the request of the State Health Officer. This toolkit will incorporate the AHVMP along with other best practices for worksite wellness and will be adopted by the entire agency, including area and county level offices. Upon completion, the Healthy Campus Toolkit will be shared with other agencies as a model for a healthy work environment.
2. The NPA staff will continue strengthening existing partnerships and work to build new relationships. Working closely with private vendors, the AHVMP will continue to expand to hospitals, worksites, universities, and other venues such as manufacturers and large retail stores. Some private vendors are using the AHVMP as a marketing strategy to attract new customers and use the Good Choice materials on their machines in hospitals, state agencies, and city buildings.
3. The NPA staff will continue to have an open line of communication with the BEP in attempts to gain more support in the future from vendors participating in that program.
Alabama Healthy Vending Machine Program
The Alabama Healthy Vending Machine Program (AHVMP) is a comprehensive program to provide healthier choices in vending machines. The goal of the program is to increase access to healthy food and beverages and reduce or eliminate the availability of calorie dense, nutrient poor food in worksites.
The AHVMP consists of nutrition standards for snacks and beverages, guidelines for program implementation, education handouts, an approved snack list, and a vending machine toolkit that includes marketing materials to publicize the program.
Visit www.adph.org/nutrition and click on Vending Machines for more information.

13
appendices
Appendix A – Vending Machine Audit Form
Directions: Please complete one form for each vending machine you visit.
Your Name: _________________________________ Your position: __________________________ Today’s date ___/___/___
Step 1: Record the time you visited the machine ____:____ AM/PM
Step 2: Circle the day of the week: Monday Tuesday Wednesday Thursday Friday
Step 3: Select the location of machine. Be specific (give floor, room number, etc. if applicable - for example,“first floor lobby”)
____ (1) Alabama Department of Education ____________________________________________________________________
____ (2) Alabama Department of Public Health _________________________________________________________________
____ (3) Governor’s Office and Capital Building ________________________________________________________________
____ (4) Department of Agriculture and Industries ______________________________________________________________
____ (5) Other (describe): ____________________________________________________________________________________
Step 4: Who has access to the machine?
____ Accessible only to employees ____ Accessible to the public and employees
Step 5: What type of machine is this?
____ Drinks only ____ Snacks only ____ Sandwich only ____ Combination
Step 6: Count the number of slots available and record the number here _____.(Note: for beverage machines, you may need to count the number of “buttons.”)
Step 7: Count the number of empty slots and record the number here _____.
Step 8: Count the number of rows and place the number here _____. Step 9: Describe any advertising on the front of the machine. Please list if the ad is for a specific product.
___________________________________________________________________________________________________________
___________________________________________________________________________________________________________
Step 9b. Is the advertised product available in the vending machine now? YES NO(complete only if there is advertising on the machine)
Step 10: Describe any nutrition messages associated with the vending machines.
___________________________________________________________________________________________________________(messages on the items, machine, or surrounding area)
Step10b. Are the items identified in the nutrition messages available in the vending machine? YES NO(complete only if there is advertising on the machine)
Complete the back of this page and return to Teresa Fair, Alabama Department of Health.

14
Complete this portion of the form by describing each item fully.
Thanks for your help. Please return this form to Teresa Fair, RSA Tower Suite 710.
Brand name, flavor anddetailed description of food
# slots devoted to food
Row Size Cost
Nutrition Message
Associatedwith
Product
Ex. Diet Pepsi, Caffeine Free 2 1 12 ounces 1.00 Yes, Fitpick
Ex. Grandma’s Homestyle Chocolate Chip Cookies 8 4 72 g 1.25 No

15
Appendix B – Employee Survey
Work-Time Snack Habits and Vending Machine Use Survey
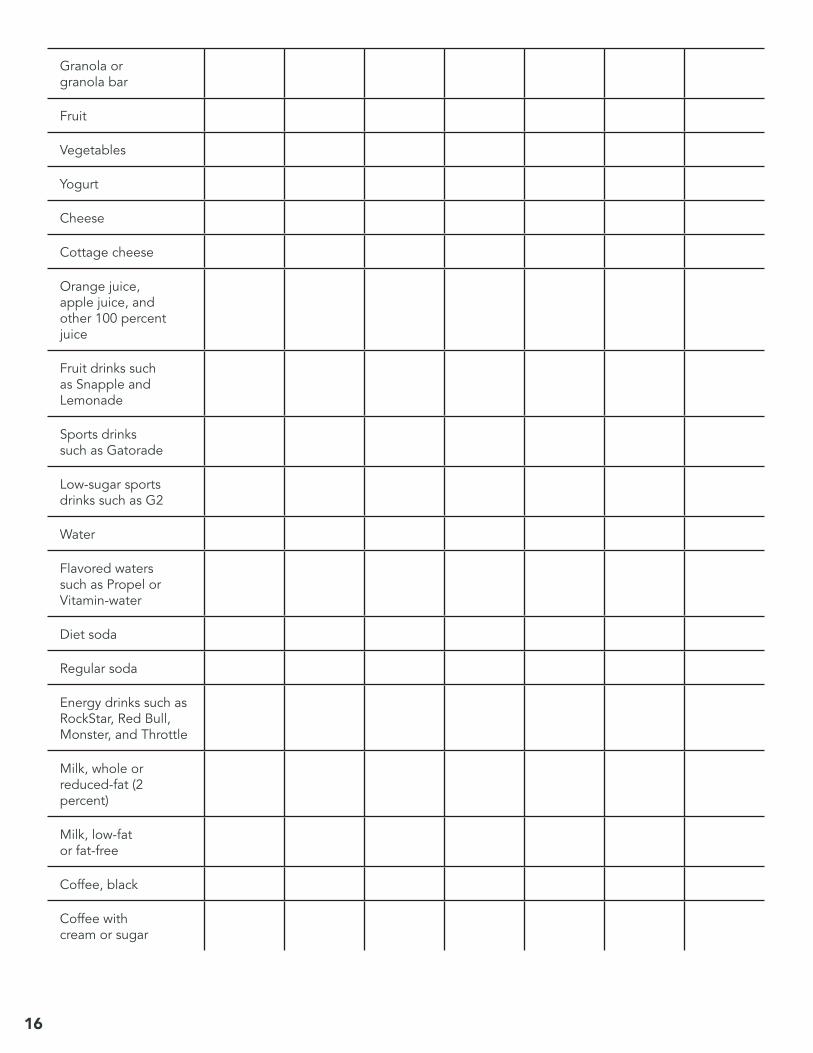
SNACK HABITSThis first section of the survey focuses on the types of snacks you eat or drink while at work. Please select how often you eat or drink each of the following food or drink items as snacks at work. These items include all flavors/varieties (for example, chocolate chip cookies and shortbread cookies would both fall into the “cookies, regular” category).
Never
Less than
once per week
1 or 2 days per
week
3-4 days per
week
Every workday
2 times per
workday
3 or more times per
workday
Popcorn
Regular potato chips, tortilla chips, puffs, or corn chips
Low-fat or non-fat potato chips, tortilla chips, puffs, or corn chips
Pretzels
Other salty snacks such as cheese nibs, Chex mix, or Gardetto’s
Peanut butter or cheese crackers, regular
Nuts or seeds
Chocolate candy and chocolate bars
Candy, like Jelly Bellies, gummies, and Life Savers
Doughnuts, Pop-Tarts, breakfast pastries
Cookies, brownies, pies, and cakes, regular
Low-fat or low-sugar cookies, brownies, pies, and cakes
16
Granola orgranola bar
Fruit
Vegetables
Yogurt
Cheese
Cottage cheese
Orange juice,apple juice, andother 100 percent juice
Fruit drinks such as Snapple and Lemonade
Sports drinkssuch as Gatorade
Low-sugar sports drinks such as G2
Water
Flavored waterssuch as Propel or Vitamin-water
Diet soda
Regular soda
Energy drinks such as RockStar, Red Bull, Monster, and Throttle
Milk, whole or reduced-fat (2 percent)
Milk, low-fator fat-free
Coffee, black
Coffee withcream or sugar

17
How often do you buy a beverage from a vending machine at work?❑ Never ❑ Less than once a week ❑ 1-2 days per week ❑ 3-4 days per week ❑ Every workday ❑ 2 times per workday ❑ 3 or more times per workday
How often do you buy a snack from a vending machine at work?❑ Never ❑ Less than once a week ❑ 1-2 days per week ❑ 3-4 days per week ❑ Every workday ❑ 2 times per workday ❑ 3 or more times per workday
If you eat snacks at work but don’t buy them from a vending machine at work, from where do you usually get your snack?❑ Home ❑ Snack shop at work ❑ Store outside of work
Nutrition Information This next section of the survey focuses on selecting healthy snacks. Please read each of the following phrases carefully. In general, if you were given a snack and told it had this quality, would you think it was healthy? Yes or no?
Please choose the snack item that is . . .
Lowest in salt❑ Potato chips ❑ Fresh fruit ❑ Pretzels
Highest in fiber❑ Pop-tarts ❑ Low-fat cheese ❑ Granola bar
Lowest in calories❑ Peanuts ❑ Baked chips ❑ Candy bar
Thoughts on Snacking A healthy snack is one that is low in fat, sugar, sodium, and calories, and high in fiber, vitamins, and minerals. Examples of healthy snacks include fresh fruit and vegetables, low-fat cheese and other low-fat dairy products, and whole-grain breads. A healthy beverage would also be one that is low in fat, sugar, and calories. Examples include: water, low-fat milk, and 100 percent fruit juice. When given a choice, do you currently usually choose healthful beverages instead of less healthful beverages?
❑ No, and I do not intend to change this within the next six months. ❑ No, but I intend to change this within the next six months. ❑ No, but I intend to change this within the next month. ❑ Yes, and I have started doing so in the last six months. ❑ Yes, and I have done so for more than six months.
When given a choice, do you currently usually choose healthful snack foods instead of less healthful snack foods?
❑ No, and I do not intend to change this within the next six months. ❑ No, but I intend to change this within the next six months. ❑ No, but I intend to change this within the next month. ❑ Yes, and I have started doing so in the last six months. ❑ Yes, and I have done so for more than six months.
Yes No
High fiber
High calorie
Low in vitamins and minerals
Low sugar
High sodium
18
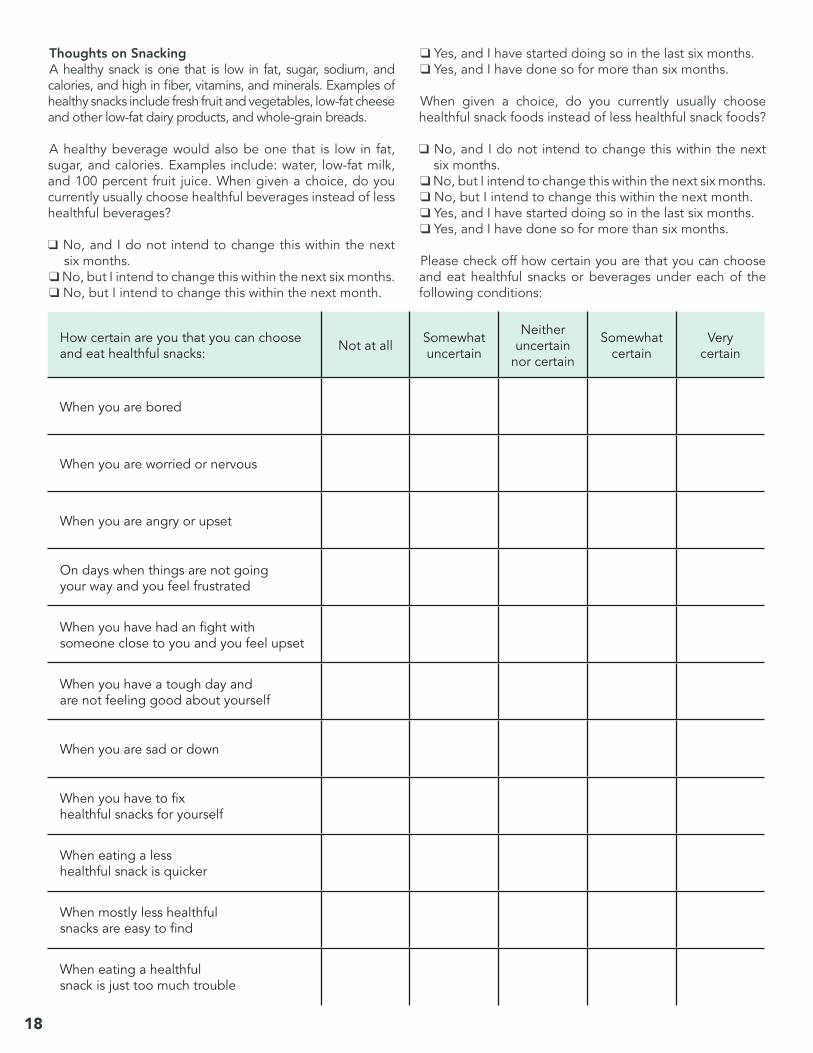
Thoughts on Snacking A healthy snack is one that is low in fat, sugar, sodium, and calories, and high in fiber, vitamins, and minerals. Examples of healthy snacks include fresh fruit and vegetables, low-fat cheese and other low-fat dairy products, and whole-grain breads. A healthy beverage would also be one that is low in fat, sugar, and calories. Examples include: water, low-fat milk, and 100 percent fruit juice. When given a choice, do you currently usually choose healthful beverages instead of less healthful beverages?
❑ No, and I do not intend to change this within the next six months.
❑ No, but I intend to change this within the next six months. ❑ No, but I intend to change this within the next month.
❑ Yes, and I have started doing so in the last six months. ❑ Yes, and I have done so for more than six months.
When given a choice, do you currently usually choose healthful snack foods instead of less healthful snack foods?
❑ No, and I do not intend to change this within the next six months.
❑ No, but I intend to change this within the next six months. ❑ No, but I intend to change this within the next month. ❑ Yes, and I have started doing so in the last six months. ❑ Yes, and I have done so for more than six months.
Please check off how certain you are that you can choose and eat healthful snacks or beverages under each of the following conditions:
How certain are you that you can choose and eat healthful snacks: Not at all Somewhat
uncertain
Neither uncertain
nor certain
Somewhat certain
Very certain
When you are bored
When you are worried or nervous
When you are angry or upset
On days when things are not goingyour way and you feel frustrated
When you have had an fight with someone close to you and you feel upset
When you have a tough day andare not feeling good about yourself
When you are sad or down
When you have to fixhealthful snacks for yourself
When eating a lesshealthful snack is quicker
When mostly less healthfulsnacks are easy to find
When eating a healthfulsnack is just too much trouble

19
Please indicate how strongly you agree or disagree with each of the following statements
Strongly Disagree Disagree
Neither Agree Nor Disagree
Agree Strongly Agree
I don’t enjoy the taste of healthful snacks or beverages.
Healthful snacks are not salty enough.
Healthful snacks and beverages are not sweet enough.
Healthful snacks and beverages are not readily available.
Healthful snacks and beverages take too long to prepare.
Healthful snacks and beverages are too expensive.
Healthful snacks and beverages don’t satisfy a craving.
Healthful snacks and beverages don’t give me the energy I need.
I don’t know how to choose healthful snacks and beverages.
I don’t know where to find healthful snacks and beverages.

20
Demographics This information is being used to describe the group of people who completed the survey. This information will not be used to determine who took the survey.
What is your gender?❑ Male ❑ Female
What is your age? ______
How would you describe your race/ethnicity (check all that apply)?❑ American Indian or Alaska Native ❑ Asian ❑ Black or African American❑ Hispanic or Latino ❑ Native Hawaiian or Other Pacific Islander ❑ White
In what government building do you work?❑ Department of Education ❑ Department of Public Health❑ Capitol ❑ Agriculture❑ Rehabilitation ❑ Other
How do you describe your weight?❑ Very underweight ❑ Slightly underweight❑ About the right weight ❑ Slightly overweight❑ Very overweight
What are you trying to do about your weight?❑ Lose weight ❑ Gain weight❑ Stay the same weight ❑ I am not trying to do anything about my weight
Are you watching what you eat either to lose weight or for some other health-related reason?❑ Yes ❑ No
Are you currently pregnant?❑ Yes ❑ No ❑ Don’t Know
Related Documents