ALABAMA BARRIER ISLAND RESTORATION ASSESSMENT INTERIM REPORT AUGUST 2017

Welcome message from author
This document is posted to help you gain knowledge. Please leave a comment to let me know what you think about it! Share it to your friends and learn new things together.
Transcript
ALABAMA BARRIER ISLAND RESTORATION ASSESSMENT INTERIM REPORT
AUGUST 2017
i
ADDENDUM Alabama Barrier Island Restoration Assessment Publications and Data Releases Bathymetric and Geologic Surveys
o DeWitt, N.T., Stalk, C.A., Flocks, J.G., Bernier, J.C., Kelso, K.W., Fredericks, J.J., and Tuten, T., 2017, Single-beam bathymetry data collected in 2015 nearshore Dauphin Island, Alabama: U.S. Geological Survey data release, https://doi.org/10.5066/F7BZ648W
o Flocks, J.G., DeWitt, N.T., and Stalk, C.A., 2017, Analysis of seafloor change at Dauphin Island, Alabama, U.S. Geological Survey Open-File Report 2017-1112, 32p.
Water Quality o All water quality data are publically available in the NWISweb online database:
http://nwis.waterdata.usgs.gov/al/nwis/qwdata. Gulf Facing Shoreline & Estuarine Shorelines/Environments
o Ellis, A.M., Marot, M.E., Smith, C.G., and Wheaton, C.J., 2017, The physical characteristics of the sediments on and surrounding Dauphin Island, Alabama: U.S. Geological Survey Data Series 1046, doi:10.3133/ds1046.
o Guy, K.K., 2015, Shorelines Extracted from Landsat Imagery—Dauphin Island,
Alabama: U.S. Geological Survey data release, doi:10.5066/F7028PMP. o Henderson, R.E, Nelson, P. R., Long, J.W., Smith, C., 2017, Vector Shorelines and
Associated Shoreline Change Rates Derived from Lidar and Aerial Imagery for Dauphin Island, Alabama—1940-2015: U.S. Geological Survey data release, doi:10.5066/F7T43RB5.
Habitat Mapping o Enwright, N.M., Borchert, S.M., Day, R.H., Feher, L.C., Osland, M.J., Wang, Lei,
and Wang, Hongqing, 2017, Barrier island habitat map and vegetation survey—Dauphin Island, Alabama, 2015: U.S. Geological Survey Open-File Report 2017–1083, 17 p., http://dx.doi.org/10.3133/ofr20171083.
o Enwright, N.M., Borchert, S.M., Day, R.H., Feher, L.C., Osland, M.J., Wang, Lei,
and Wang, Hongqing, 2017, Barrier island habitat map and vegetation survey, Dauphin Island, AL, 2015: U.S. Geological Survey data release, https://doi.org/10.5066/F7513WPC

ii
Hydrodynamic & Morphological Change Modeling o Thompson, D.M., Dalyander, P.S., Long, J.W., and Plant, N.G., 2017, Correction of
elevation offsets in multiple co-located lidar datasets: U.S. Geological Survey Open-File Report 2017–1031, 10 p., https://doi.org/10.3133/ofr20171031.

iii
Table of Contents 1. Executive Summary ................................................................................................................. 1 2. Background .............................................................................................................................. 1
2.1. Study Purpose, Goals, and Objectives ............................................................................. 3 2.2. Scope of Work .................................................................................................................. 4
3. Status Updates ......................................................................................................................... 5 3.1. Task 1 – Update Baseline Conditions and Trends ........................................................... 5
3.1.1. Task 1.1 – Data Compilation .................................................................................... 5 3.1.2. Task 1.2 – Database Development............................................................................ 7 3.1.3. Task 1.3 – Tool Development ................................................................................. 11
3.2. Task 2 – Field Data Collection ....................................................................................... 13 3.2.1. Task 2.1 – Bathymetric and Geologic Surveys ....................................................... 13 3.2.2. Task 2.2 – Tidal Current Measurements ................................................................. 16 3.2.3. Task 2.3 – Wave Measurements ............................................................................. 20 3.2.4. Task 2.4 – Sediment Distribution ........................................................................... 22 3.2.5. Task 2.5 – Water Quality ........................................................................................ 24
3.3. Task 3 – Data Analyses of Dauphin Island Shorelines and Habitats ............................. 28 3.3.1. Tasks 3.1 and 3.2 – Gulf Facing and Estuarine Shorelines and Environments ...... 28 3.3.2. Task 3.3 – Habitat Mapping.................................................................................... 32
3.4. Task 4 – Existing Volumetric Changes and Sediment Budget Analysis ....................... 35 3.5. Task 5 – Modeling.......................................................................................................... 37
3.5.1. Task 5.1 – Hydrodynamic & Morphological Change Modeling ............................ 38 3.5.2. Task 5.2 – Life-Cycle Structure Response Modeling ............................................. 43 3.5.3. Task 5.3 – Water Quality Modeling ....................................................................... 45 3.5.4. Task 5.4 – Habitat Modeling .................................................................................. 58
3.6. Task 6 – Alternative Evaluations ................................................................................... 61 3.6.1. Task 6.1 – Alternative Formulation and Evaluation ............................................... 61 3.6.2. Task 6.2 – Alternative Assessment Tool Development .......................................... 62 3.6.3. Task 6.3 – Cost Estimating ..................................................................................... 65
3.7. Task 7 – Monitoring and Adaptive Management........................................................... 65 4. Interim Project Evaluations ................................................................................................... 68
4.1. Group 1 Interim Projects ................................................................................................ 75 4.1.1. Mid-Island Land Acquisition and Management – Phase 1 (Project ID #3) ............ 75 4.1.2. Dauphin Island Audubon Bird Sanctuary Shoreline Restoration and Management
(Project ID #5 and #6)............................................................................................. 75 4.1.3. Stormwater Quality Rehabilitation Project (Project ID #11) .................................. 75 4.1.4. Aloe Bay/Mississippi Sound Water Quality Enhancement Project – Phase 1
(Project ID #12) ...................................................................................................... 76 4.1.5. Dauphin Island Wastewater Collection System Rehabilitation (Project ID #14) ... 77 4.1.6. Tupelo Gum Swamp Land Acquisition (Project ID #18) ....................................... 78 4.1.7. Gorgas Swamp Land Acquisition (Project ID #19) ................................................ 78 4.1.8. Steiner Property Acquisition (Project ID #20)........................................................ 79 4.1.9. Dauphin Island Management Support System (Project ID #23) ............................ 79
4.2. Group 2 Interim Projects ................................................................................................ 80 4.2.1. Dauphin Island Public Beach and Dune Restoration (Project ID #1) ..................... 80 4.2.2. West End Beach and Dune Restoration (Project ID #2) ......................................... 80

iv
4.2.3. Little Dauphin Island Nearshore Placement (Project ID #7) .................................. 81 4.2.4. Improved Bypassing of Beach Sands Dredged from the Mobile Ship Channel
(Project ID #8) ........................................................................................................ 81 4.2.5. Aloe Bay Beneficial Use Restoration (Project ID #9) ............................................ 82 4.2.6. Fill Borrow Pits Dug in 2010 to Protect Against Oil Spill Damage (Project ID #10) ................................................................................................................................. 82 4.2.7. Aloe Bay/Mississippi Sound Water Quality Enhancement Project – Phase 2
(Project ID #13) ...................................................................................................... 83 4.2.8. West End Land Acquisition (Project ID #17) ......................................................... 83 4.2.9. U.S. Coast Guard Property Disposal/Acquisition (Project ID #21)........................ 84 4.2.10. Dauphin Island 39 Parcel Property Acquisition – West End (Project ID #22a) . 84 4.2.11. Dauphin Island 39 Parcel Property Acquisition – Graveline Bay (Project ID #22b)
............................................................................................................................. 84 4.2.12. Dauphin Island 39 Parcel Property Acquisition – Aloe Bay (Project ID #22c) .. 85 4.2.13. Dauphin Island 39 Parcel Property Acquisition – Little Dauphin Island and Bay
(Project ID #22d) .................................................................................................. 85 4.2.14. Dauphin Island 39 Parcel Property Acquisition – East End (Project ID #22e)... 85
4.3. Group 3 Interim Projects ................................................................................................ 86 4.3.1. Mid-Island Land Acquisition and Management – Phase 2 (Project ID #4) ............ 86 4.3.2. Dauphin Island Water Supply Aquifer (Project ID #15) ........................................ 86 4.3.3. Dauphin Island Water Supply Elevated Storage Tank (Project ID #16) ................ 86
5. Conclusion ............................................................................................................................. 87 6. References ............................................................................................................................. 91 Appendix A – Descriptions of Potential Interim Projects ............................................................ 93
List of Figures
Figure 1: Alabama Barrier Island Restoration Assessment Online Software Suite (Project Team
file/data sharing Sandbox, Data Catalog, and Interactive Web Mapping Application) ... 5 Figure 2: Alabama Barrier Island Restoration Assessment Data Catalog Interface ....................... 6 Figure 3: Sample Alabama Barrier Island Restoration Assessment Data Catalog Record ............. 6 Figure 4: Alabama Barrier Island Restoration Assessment Web Mapping Application ................. 9 Figure 5: Web Mapping Application Water Quality Station ......................................................... 10 Figure 6: Web Mapping Application 2015 Water Quality Data Chart (parameter:
OrgCarbonUnfiltered_mg/l) .......................................................................................... 10 Figure 7: Web Mapping Application ADCP Data transects, observational points of one transect,
and corresponding dynamic plot of velocities at various depths for a single observation point ................................................................................................................................11
Figure 8: Alabama Barrier Island Restoration Assessment Sandbox Interface ............................ 12 Figure 9: Trackline map showing the final 2015 singlebeam and multibeam coverages around
Dauphin Island ............................................................................................................... 14 Figure 10: Draft Digital Elevation Model of the bathymetry around Dauphin Island based on the
integration of the single-beam and multibeam datasets ................................................. 14 Figure 11: Comparison of grid values (x) compared to point depth measurements collected
during Task 2.4 (y) show good correlation between the DEM and actual soundings. ... 15 Figure 12: ADCP Transect Locations (August & December 2015) .............................................. 16

v
Figure 13: Petit Bois Pass Ebb Tide Velocity Magnitude Plot (August 26, 2015 at 19:51:11) .... 17 Figure 14: Pass aux Herons Ebb Tide Velocity Magnitude Plot (August 26, 2015 at 19:00:17) .. 17 Figure 15: Mobile Pass Ebb Tide Velocity Magnitude Plots (August 26, 2015 at 19:16:11) ....... 18 Figure 16: Petit Bois Pass Flood Tide Velocity Magnitude Plots (December 9, 2015 at 21:15:47)
........................................................................................................................................ 18 Figure 17: Pass Aux Herons Flood Tide Velocity Magnitude Plots (December 9, 2015 at
21:01:17) ...................................................................................................................... 19 Figure 18: Mobile Pass Flood Tide Velocity Magnitude Plots (December 9, 2015 at 21:00:03) . 19 Figure 19: Wave Gage Locations .................................................................................................. 21 Figure 20: Aquadopp Significant Wave Height, Mean Period and Mean Direction. Deployed June
20, 2015 (Located south of Katrina Cut) ...................................................................... 21 Figure 21: AWAC Significant Wave Height, Mean Period and Mean Direction. Deployed
September 1, 2015 (Located near the Mobile Pass ebb tidal shoal) ............................. 22 Figure 22: Interpolated spatial distribution of median grain size (in micrometer or microns) for
the 300-plus samples collected on and around Dauphin Island, AL ............................ 23 Figure 23: Water Quality Sampling Locations ............................................................................. 25 Figure 24: NWIS data retrieval ..................................................................................................... 27 Figure 25: Landsat-derived shorelines (red lines) for the period 1984-2015. All 223 shorelines
(individual red lines) measured from the satellite images over the 30-year time period are shown. ...................................................................................................................... 29
Figure 26: LiDAR-derived shorelines for the period 1998-2013 ................................................. 30 Figure 27: Preliminary ocean-facing shoreline change rates using aerial imagery, Landsat, and
LiDAR shorelines ......................................................................................................... 31 Figure 28: Core locations from Little Dauphin Island and Graveline Bay marshes used to
evaluate recent (last 100 year) marsh accretion rates. The accretion rates (cm y-1) for the various cores are plotted as a function of time as determined by excess Pb-210. .. 32
Figure 29: Study site locations for habitat mapping field data collection. ................................... 33 Figure 30: Habitat mapping extent ............................................................................................... 33 Figure 31: Bathymetric data sets from contributing sources and dates ........................................ 36 Figure 32: Topographic/Bathymetric Change Map 2011 to 2015. ............................................... 37 Figure 33: Domains for the individual models coupled in the hydrodynamic/morphodynamic
simulation framework. Black points represent the outer northern Gulf of Mexico wave model domain, red points are the inner wave, circulation, and sediment transport model domain, and the depth colormap indicates the nested beach and dune storm response model. ............................................................................................................ 39
Figure 34: Observed (top left) and modeled (middle left) post-Ivan elevations using the Xbeach storm model. Specific comparisons of the simulated and observed elevation of the dune base (top-right) and crest (middle-right) are also shown. Detailed view of the simulated post-storm shoreline is overlaid on the observed post-Ivan center island section (bottom). Colormaps correspond to elevations where blue colors indicate water depth (darker correspond to deeper water) and yellow/orange colors represent island elevation (darker colors correspond to higher elevation). ............................................ 40
Figure 35: (top) Island segments used in the calculation of dune recovery rates following Hurricane Katrina. (bottom) Observed and modeled dune growth rates at a single cross-shore transect. ..................................................................................................... 41

vi
Figure 36: (top) Observed (black) and modeled (blue) water levels at the NOAA tide station (8735180) located on the eastern end of Dauphin Island (R2 = 0.68). Observed and modeled ebb (Trip 1) and flood (Trip 2) flow velocities across Mobile Bay inlet separated into cross-channel (bottom left; R2 = 0.92 and 0.47 for Trip 1 and Trip 2, respectively) and along-channel (bottom right; R2 = 0.91 and 0.43 for Trip 1 and Trip 2, respectively) velocity components. .......................................................................... 42
Figure 37: Model Grid and Transects .......................................................................................... 45 Figure 38: Northern Portion of the Model Domain ...................................................................... 46 Figure 39: Multi-Block Grid of the Upper Portion of the Model Domain ................................... 47 Figure 40: Comparison of Observed (red) and Simulated (blue) January Tide Elevations at
Dauphin Island ............................................................................................................. 48 Figure 41: Comparison of Observed (red) and Simulated (blue) March Tide Elevations at
Dauphin Island ............................................................................................................. 49 Figure 42: Comparison of Observed (red) and Simulated (blue) October Tide Elevations at
Dauphin Island ............................................................................................................. 49 Figure 43: Comparison of Observed (red) and Simulated (blue) March Tide Elevations at Weeks
Bay ................................................................................................................................ 50 Figure 44: Comparison of Observed (red) and Simulated (blue) October Tide Elevations at Coast
Guard Sector Mobile .................................................................................................... 50 Figure 45: Comparison of Observed (red) and Simulated (blue) March Tide Elevations at
Pascagoula .................................................................................................................... 51 Figure 46: Location of Salinity Measurement Stations ................................................................ 52 Figure 47: Comparison of Measured (red) and Simulated (blue) Salinities at Station DI on 28
May 2010 ...................................................................................................................... 52 Figure 48: Comparison of Measured (red) and Simulated (blue) Salinities at Station M1 on 28
May 2010 ...................................................................................................................... 53 Figure 49: Comparison of Measured (red) and Simulated (blue) Salinities at M2 on 28 May 2010
...................................................................................................................................... 53 Figure 50: Comparison of Measured (red) and Simulated (blue) Salinities at M3 on 28 May 2010
...................................................................................................................................... 54 Figure 51: Comparison of Measured (red) and Simulated (blue) Salinities at M4 on 28 May 2010
...................................................................................................................................... 54 Figure 52: Comparison of Measured (red) and Simulated (blue) Salinities at MB on 28 May 2010
...................................................................................................................................... 55 Figure 53: Comparison of Measured (red) and Simulated (blue) Salinities at Station DI on 14
November 2010 ............................................................................................................ 55 Figure 54: Comparison of Measured (red) and Simulated (blue) Salinities at Station M1 on 14
November 2010 ............................................................................................................ 56 Figure 55: Comparison of Measured (red) and Simulated (blue) Salinities at M2 on 14 November
2010 .............................................................................................................................. 56 Figure 56: Comparison of Measured (red) and Simulated (blue) Salinities at M3 on 14 November
2010 .............................................................................................................................. 57 Figure 57: Comparison of Measured (red) and Simulated (blue) Salinities at M4 on 14 November
2010 .............................................................................................................................. 57 Figure 58: Comparison of Measured (red) and Simulated (blue) Salinities at MB on 14
November 2010 ............................................................................................................ 58

vii
Figure 59: Conceptual Workflow for Habitat Modeling Effort .................................................... 60 Figure 60: Draft influence diagram illustrating the linkage among higher level objectives and
lower level attributes .................................................................................................... 64 Figure 61: Draft Conceptual Ecological Model for the Alabama Barrier Island Restoration
Assessment project at Dauphin Island .......................................................................... 67 Figure 62: Potential Interim Projects Considered by the USACE, State of Alabama, and
Evaluation Support Panel ............................................................................................... 70
List of Tables
Table 1: Alabama Barrier Island Restoration Assessment Data Catalog data type record counts .. 7 Table 2: Alabama Barrier Island Restoration Assessment web-enabled data sets. ......................... 8 Table 3: Sampling site identification numbers, names, and locations .......................................... 24 Table 4: Summary of Water Quality constituents measured by USGS in Mobile Bay................. 25 Table 5: List of habitats for mapping effort .................................................................................. 34 Table 6: List of focal species ........................................................................................................ 60 Table 7. Interim Project Evaluation Results ................................................................................. 74

1
Draft Alabama Barrier Island Restoration Assessment Interim Report
1. Executive Summary
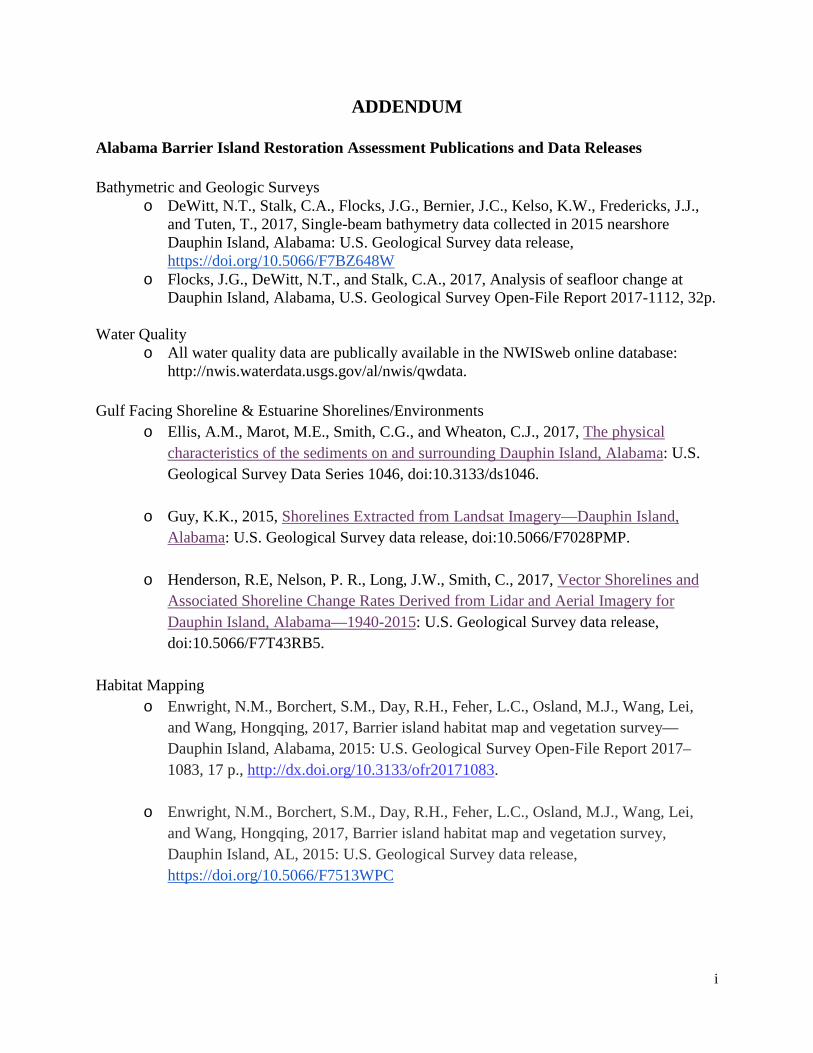
Hurricanes Ivan (2004), Katrina (2005), Isaac (2012) and the Deep Water Horizon (DWH) oil spill (2010) caused substantial ecological changes on Dauphin Island, Alabama over the past decade. Additionally, residential and commercial development on the barrier island and the surrounding area have resulted in the loss, degradation, and/or encroachment of natural habitats including wetlands, seagrasses, oyster reefs, beach/dune habitats, and maritime forest. Climatic events, including sea level rise and frequent storms, continue to erode, degrade, and threaten further loss of these habitats as well as threaten the ecological function of the Mississippi Sound and Heron Bay wetlands on the Alabama mainland. Given these influences on these valuable resources, there is a need to protect, restore, and enhance ecological resiliency and function of the island. This interim report provides a status of work completed to date by the U.S. Geological Survey (USGS) and the U.S. Army Corps of Engineers (USACE) under a grant from the National Fish and Wildlife Foundation (NFWF) Gulf Environmental Benefit Fund. In addition, this interim report presents 27 projects, previously proposed by various entities through a variety of sources, which were reviewed to determine whether they can be implemented in the short-term as “Interim Projects” to support the goal of enhancing the sustainability of the island as a critical natural coastal feature. This report focuses on 7 of the 9 tasks approved in the NFWF grant. For each Task, a discussion of the summary/purpose, efforts completed to date, ongoing work, preliminary results, and future direction are presented. Specifically, Tasks 1 – 5 are concerned with amassing scientific information necessary to make informed decisions including field data collection, analysis, and modeling. Task 6 continues with alternative formulation, analysis, and development of tools to assess the consequences of each restoration scenario relative to natural resource benefits, likelihood of project success, and the impact to coastal resiliency. Work under Task 7 will result in the development of a monitoring and adaptive management plan to determine if a project, if implemented, would meet the intended conservation and restoration objectives. Tasks 8 and 9 consist of report development (i.e. this interim report and a final report) and project management, so there is minimal discussion of those efforts in this document. A more comprehensive report outlining potential restoration scenarios based on the available scientific information will be finalized in March 2019. These scenarios, if subsequently selected for implementation, will aim to restore, preserve, and enhance Dauphin Island’s natural habitat for many decades. 2. Background
The USGS and USACE were asked by the State of Alabama to prepare a proposal for submittal to the NFWF Gulf Environmental Benefit Fund for a feasibility like study, investigating viable options for the restoration of Dauphin Island as a sustainable barrier island. The proposal, as approved by NFWF on 30 April 2015, includes 9 separate but inter-related tasks as discussed in
2
the Executive Summary above. A discussion of the progress to date and the path forward for Tasks 1 – 7 is provided in Section 3. Dauphin Island, Alabama, is a strategically significant barrier island along the northern Gulf of Mexico. It serves as the only barrier island providing protection to much of the state of Alabama’s coastal natural resources. With an average elevation of 7.2 feet, Dauphin Island is highly susceptible to rising sea levels. The size of the system spans over 3500 acres of barrier island habitat including beach, dune, overwash fans, intertidal flats, intertidal wetlands, maritime forest, and freshwater ponds. In addition, Dauphin Island provides protection to approximately one-third of the Mississippi Sound and estuarine habitats including oyster reefs, marshes and seagrasses. It serves as one of the most important bird sanctuaries in the Southeast and supports an important recreational and commercial fishing industry. Dauphin Island and the remainder of the barrier islands fronting the Mississippi Sound have been historically losing surface area, and their capacity to protect mainland natural resources and infrastructure is diminishing (Byrnes et al. 2010). Rising sea level, severe and frequent storms, and engineering activities all threaten the sustained subaerial presence (Twichell et al. 2013, Byrnes et al. 2012, Morton et al. 2008). Moreover, loss of barrier island area threatens the estuarine ecosystem of Mississippi Sound and its resources, and exposes the mainland coast and its associated wetlands and coastal habitats to increasing saltwater intrusion and damage from future storms and storm surges (USACE 2009). Dauphin Island has been severely impacted by repeated extreme events over the past several decades, most recently Hurricanes Ivan, Katrina, and Isaac, and by the Deepwater Horizon oil spill. Hurricanes Frederic, Ivan, and Katrina caused some of the most substantial morphological changes since major residential development on the island. Changes from these storms include island lowering, rollover, and breaching along the western portion of Dauphin Island as well as the merging of the Pelican/Sand Island complex to Dauphin Island. This pattern of island breaching and rollover as a function of hurricane passage, as well as the merging of the Pelican/Sand Island complex to Dauphin Island, has been documented several times in the historical survey record (Morton et al., 2008, Byrnes et al., 2010, Byrnes et al., 2012, Park et al., 2013). Breaches along the island prior to the most recent ones in 2004/2005 have been documented to close naturally in response to sediment supplied from the Mobile Pass ebb-tidal delta, with large breach closures occurring on order of decades. In addition, published reports (Morton et al., 2008, Byrnes et al., 2010) indicate that, historically, the western portion of the island has been able to generally maintain its form through time by migrating landward. Efforts to mitigate the impacts of these coastal hazards on the island date from 1904 when a rock revetment was put in place to protect Fort Gaines at the far eastern end of the island. Over time, other efforts include rock groins on the southeastern shore, a series of bulkheads along the north eastern side of the island, limited beneficial use on the southeastern shore, riprap protection at the fishing pier to the west, and construction of two emergency protective berms on the west end funded by the Federal Emergency Management Agency (FEMA) following Hurricane Georges, Tropical Storm Isadore, and Hurricanes Ivan and Katrina. Most recent mitigation efforts include reorientation of the groin field into a breakwater configuration and pocket beach construction on the east end and dune construction along the western portion of the developed island.
3
Furthermore, in response to the 2010 Deep Water Horizon oil spill, a major breach in the island, Katrina Cut, was closed with a temporary rubble mound structure to prevent oil migration into the Mississippi Sound. Response to climatic events including sea level rise and storms, as well as development on the island and surrounding shorelines, continues to degrade and threaten further loss of the island habitats and threaten the ecological functioning of the Mississippi Sound and the Heron Bay wetlands on the mainland. Restoration of Dauphin Island will help enhance, maintain, and protect significant coastal habitat and living resources damaged by the DWH oil spill. The goal of this work is to investigate viable options for the restoration of Dauphin Island as a sustainable barrier island to protect, enhance and restore resources on the island as well as the surrounding coastal resources the island helps to support. One of the main objectives to support the goal of this project is to evaluate potential restoration alternatives based on sound science, allowing the science to guide the development of sustainable restoration alternatives and being open to exploring a wide range of restoration possibilities. The likelihood of restoration success can be maximized by ensuring that restoration plans include an understanding of the island’s historical evolution, the physical topography and bathymetry, geologic, and oceanographic factors. These factors play an important role in understanding how the island has evolved in time to the existing island feature and will govern its future response.
2.1. Study Purpose, Goals, and Objectives
The intent of the Alabama Barrier Island Restoration Assessment Study Interim Report is to provide an update on studies conducted to date and evaluate previously recommended restoration projects that could be implemented in the short-term to begin the process of increasing the resilience of the natural habitats on Dauphin Island. The overall purpose of this study is to investigate sustainable options through a feasibility study based on science and technical expertise/evaluation that provides the ability to effectively evaluate the natural resource benefits and impacts of restoration activities and alternatives. The study includes modeling the island to evaluate: (1) beneficial use options and other sand placement activities; and (2) other resilient and sustainable island restoration activities in support of critical habitats and resources. The goal of this study is to investigate viable options for the restoration of Dauphin Island as a sustainable barrier island to protect and restore island resources as well as the surrounding coastal resources the island helps to support. Some of the questions this study is designed to help answer are:
• Is restoration of Dauphin Island feasible? For example, can the habitats and living resources that depend on it be increased and sustained over a longer period of time (50 years) with the appropriate amount of financial resources invested in island restoration?
• Is there a feasible option to support Beneficial Use of dredged material to aid in restoration of Dauphin Island?
4
• Would natural processes (such as wave action and sand transport) support or degrade island resources over time?
• How should island restoration be configured (i.e. width, height) for resilience to winter and tropical storms?
• Would Dauphin Island withstand future storms if restored? • Would restoration increase and/or conserve the habitats that support long-term living
resources damaged by the DWH spill? • Would successful restoration of the East End be different from the West End? • What are the most feasible and cost-effective restoration alternatives that support a
sustainable design? While this project is not within a current existing natural resource management or restoration plan, it does advance specific objectives of existing plans prepared by a number of stakeholders such as: the Dauphin Island Strategic Plan funded by the Town of Dauphin Island, the Mississippi-Alabama Sea Grant Consortium and the University of Southern Mississippi; and plans prepared by the Alabama Department of Conservation and Natural Resources; and the Dauphin Island Sea Lab and Mobile Bay National Estuary Program. Strategic recommendations this study could help to advance include: 1) Protecting all natural and cultural resources by determining their capacity in light of resource vulnerability; 2) Identifying protective measures to preserve wetland and water surface ecosystems; 3) Understanding the importance of, and relationships between, barrier island systems like the Dauphin Island complex of Sand Island Shoals, Pelican Island, and Little Dauphin Island; 4) Developing a better Island-wide understanding for the extent of what is called the “West end” of Dauphin Island and what it represents to the Island in terms of resources; and 5) Identifying best ways to seek beach stabilization.
2.2. Scope of Work
The scope of work for this study covers tasks necessary to evaluate feasibility level alternatives capable of increasing the resiliency and sustainability of Dauphin Island, Alabama. The study is divided into nine separate tasks. These tasks include:
1. Updating Baseline Conditions and Trends 2. Collecting Field Data which includes:
a. Bathymetric and Geophysical Surveys b. Tidal Current Measurements c. Wave Measurement d. Sediment Distribution e. Water Quality
3. Data Analysis of Dauphin Island Shorelines and Habitats 4. Updating the Sediment Budget Analysis and Calculating Volumetric Changes 5. Modeling of Coastal Processes which includes:
a. Hydrodynamic and Morphological Changes b. Life-Cycle Structure Response c. Water Quality d. Habitat
6. Alternative Formulation, Evaluation and Cost Estimating

5
7. Monitoring and Adaptive Management 8. Reporting (Interim and Final Reports) 9. Project Management
3. Status Updates
The status of Tasks 1-7 are summarized in the following section. This report serves as the status update for Task 8.
3.1. Task 1 – Update Baseline Conditions and Trends
● Task Summary The Alabama Barrier Island Restoration Assessment Data Management Team is working on data standardization and organization as well as developing the software tools to aid in the management and visualization of the data pertaining to the study. Some of the tasks below involve legacy or baseline data and others include recent data collected specific to this study. The team is developing a software suite of tools as shown in Figure 1, which will be made publicly available upon completion of the study.
Figure 1: Alabama Barrier Island Restoration Assessment Online Software Suite (Project Team file/data sharing Sandbox, Data Catalog, and Interactive Web Mapping Application)
3.1.1. Task 1.1 – Data Compilation ● Task Summary The Data Compilation portion of this study focuses on providing a centralized repository of past and present Dauphin Island-related data. Those baseline and legacy datasets discovered will be important when performing comparisons against more recent data collections of the island. ● Completed Efforts Working with the study team, as well as performing customized data searches, existing data related to Dauphin Island was compiled, attributed, and cataloged. This cataloged data was

6
transformed into a customized database-driven online searchable data catalog. Users will be able to search by data type, title, data steward, or data collection dates. For already existing publicly available data, the data catalog record links to that data. For data collected during the course of the study, the data catalog record links to the Dauphin Island Sandbox (see Task 1.3) where the data has been uploaded. The data catalog interface is shown in Figure 2 and a sample of a data catalog record is shown in Figure 3. The Data Catalog will be made publicly available upon completion of the study.
Figure 2: Alabama Barrier Island Restoration Assessment Data Catalog Interface
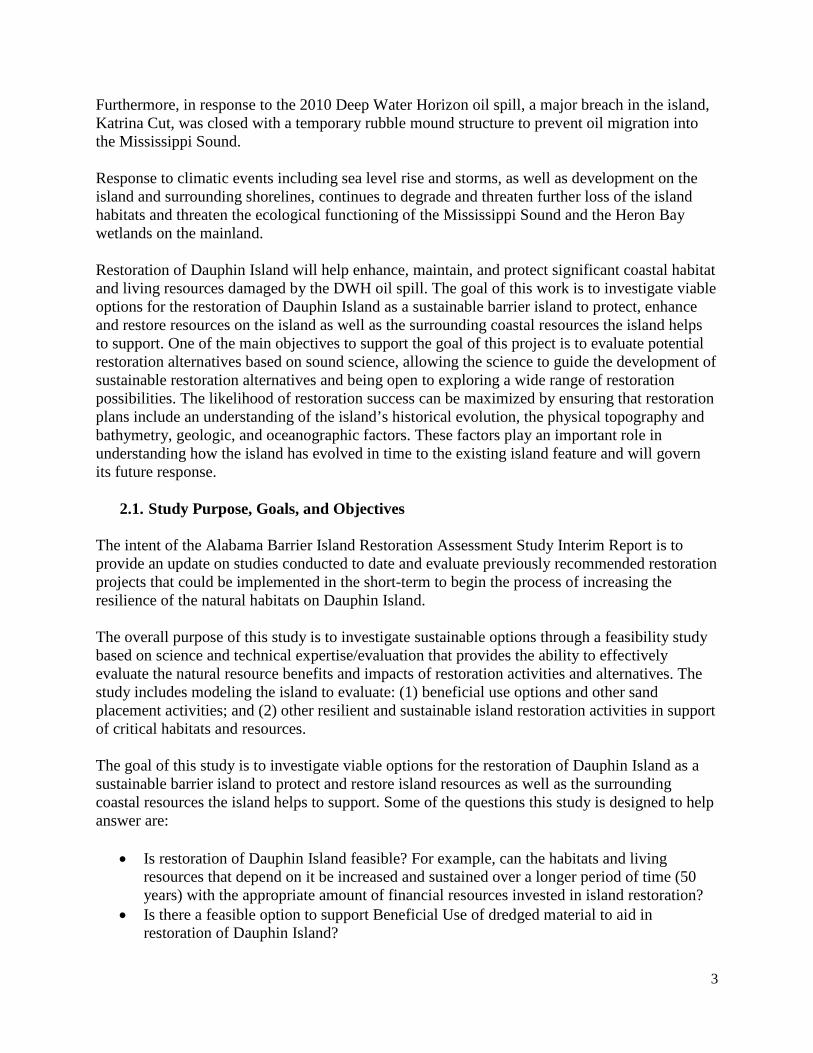
Figure 3: Sample Alabama Barrier Island Restoration Assessment Data Catalog Record ● Ongoing Work Records have been created, attributed, and inserted into the data catalog for all data discovered and delivered to date. As additional datasets are discovered and/or created, new entries will be inserted into the data catalog. The database behind the application is maintained and backed up regularly. The application is also regularly scanned for vulnerabilities and continues to be protected behind the USGS national web application firewall. ● Preliminary Results A total of 123 records of Dauphin Island-related data have been inserted into the Data Catalog to date. Table 1 gives a summary of records by data type.
7
Table 1: Alabama Barrier Island Restoration Assessment Data Catalog data type record counts
Data Type Number of Data Sets
Currents 2
Digital Elevation 3
Hydrographic 14
Imagery 62
Land Cover 8
LiDAR 14
Map 5
Meteorological (MET) 4
Multibeam Bathymetry 2
Publication 7
Shoreline 2
Side Scan Sonar 2
Tides 3
Topo 1
Waves 2
Winds 1 ● Future Direction As additional project data is delivered by the study team in the future, new records will be created, attributed, and inserted into the data catalog. Ultimately, the catalog will be released for full public access upon completion of the study.
3.1.2. Task 1.2 – Database Development ● Task Summary To ensure the use and sustainability of study data, data standards must be defined, documented, and adhered to. When available, previous data standards should be analyzed, adjusted, and leveraged accordingly. Various types of data will be collected during this study of the Dauphin

8
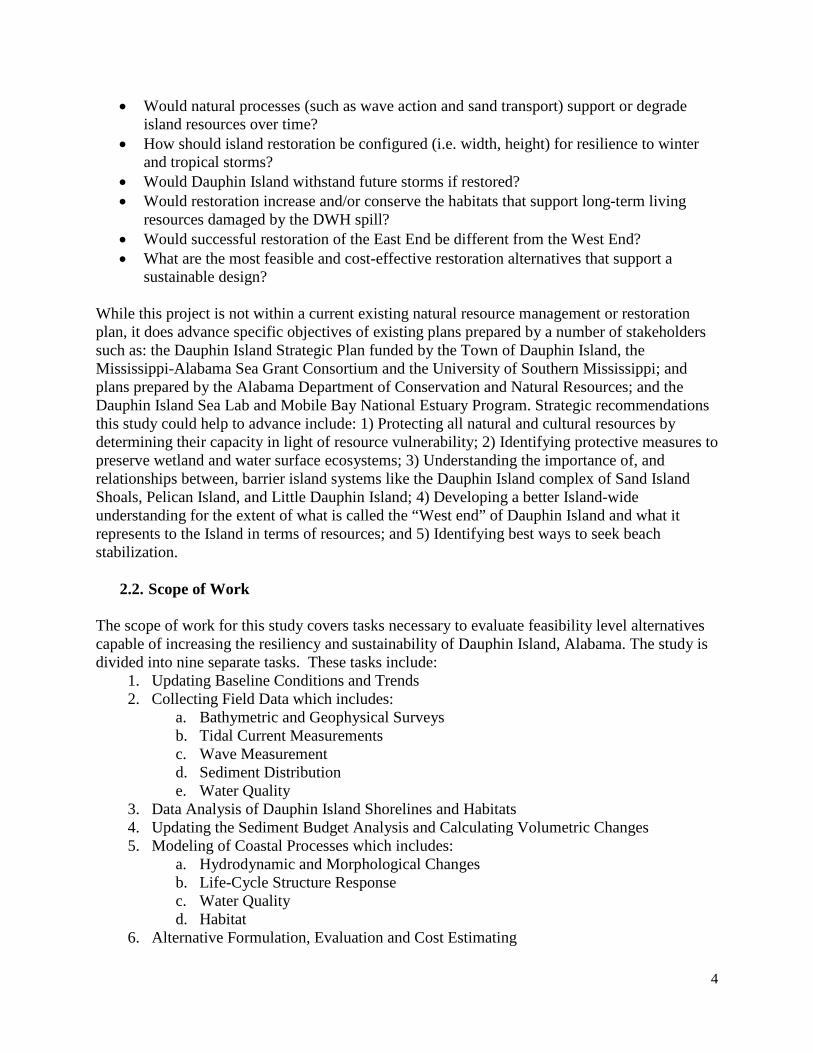
Island area. Both data tabular in nature and those possessing a spatial component will be stored in the appropriate database structures. Collaborating with study team members, the Data Management Team will document data format, delivery, and storage decisions in the Data Management Plan which will continue to be a living document throughout the study timeline. Those data collected as a result of this study will be prioritized by the Management Team to be further processed into web-enabled formats. This will allow them to be consumable by the custom interactive Alabama Barrier Island Restoration Assessment web mapping application (Figure 4) producing interactive visualizations of project data. ● Completed Efforts Working with the project leads for each data collection effort, data formats were discussed and standardized. As feasibility data was delivered by project teams, the tabular data was organized and stored in an Enterprise SQL Server database. If the data possessed a spatial component, it was also added as a web service to a spatial server database. This web-enabled the data which in turn allowed it to be consumed by the Alabama Barrier Island Restoration Assessment customized interactive web mapping application produced by the Data Management Team and also found in the above-mentioned software suite. The data that has been integrated in the database to date is shown in Figure 4 and consists of the following data listed in Table 2. The mapping application and included data will be publicly released upon completion of the study. Table 2: Alabama Barrier Island Restoration Assessment web-enabled data sets.
Data Type Location Count Observation Count
Water Quality 4 286 observations including measured parameters listed in Table 2.5.2
Wave Gage 2 processing
Acoustic Doppler Current Profiles (ADCP)
62 transects 741,034 point observations along transects
9
Figure 4: Alabama Barrier Island Restoration Assessment Web Mapping Application ● Ongoing Work A preliminary sediment sample dataset has been delivered and is being processed to be integrated into the database. The sediment sample locations will be added to the map with its associated data linked. The Data Management Team will address all other data as it is delivered.
● Preliminary Results The web mapping application is under development and currently contains point feature layers for the four water quality and two wave gage stations where data has been collected as part of this study. The tabular water quality data can also be dynamically charted for the 28 parameters found within the data files. In addition, the acoustic Doppler current profiler (ADCP) transect and observational point data has been integrated into the web mapping application. The transects give the footprint of the data collection path and a user may click on any displayed transect to view the individual observational point data (e.g. depth, velocity) in tabular or chart form. The web mapping application showing the water quality stations, wave gage sites, and ADCP transects is shown in Figure 4. Examples of water quality and ADCP data visualizations are shown in Figure 5 through Figure 7.

10
Figure 5: Web Mapping Application Water Quality Station
Figure 6: Web Mapping Application 2015 Water Quality Data Chart (parameter: OrgCarbonUnfiltered_mg/l)

11
Figure 7: Web Mapping Application ADCP Data transects, observational points of one transect, and corresponding dynamic plot of velocities at various depths for a single observation point
● Future Direction
The Data Management Team will continue to work with the data experts on format and delivery. As data is delivered, those selected to be included on the web map will be processed into a web-enabled format and consumed by the web mapping application. Data formats and structure have also been compiled into a Data Management Plan that will continually be updated as data is delivered, and the database will be released for full public access upon completion of the study.
3.1.3. Task 1.3 – Tool Development ● Task Summary Once data formats have been established and data has been standardized and organized, software tool development supporting data analysis, comparison, and visualization can be prioritized. Discussions will continue to occur between the Data Management Team and the data experts to create tools that will be the most beneficial to the project team. Tool options may include stand-alone software applications as well as dedicated software modules integrated into the web mapping application to focus or operate on a single data layer.
12
● Completed Efforts
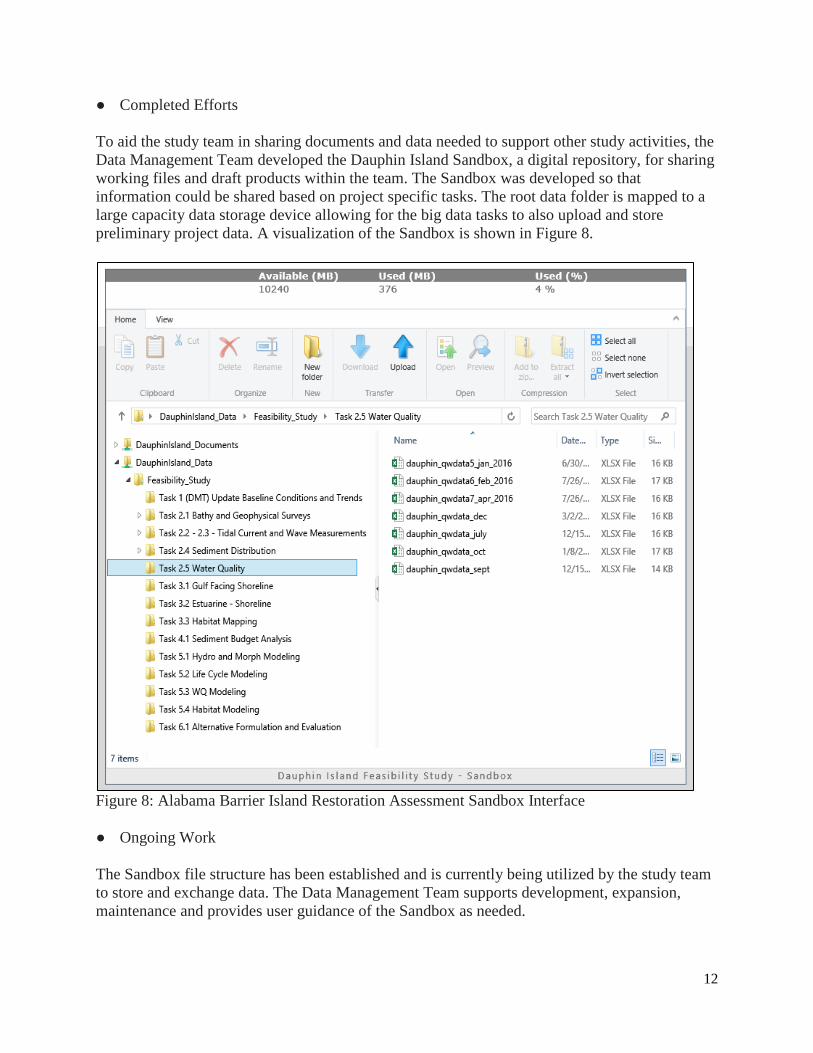
To aid the study team in sharing documents and data needed to support other study activities, the Data Management Team developed the Dauphin Island Sandbox, a digital repository, for sharing working files and draft products within the team. The Sandbox was developed so that information could be shared based on project specific tasks. The root data folder is mapped to a large capacity data storage device allowing for the big data tasks to also upload and store preliminary project data. A visualization of the Sandbox is shown in Figure 8.
Figure 8: Alabama Barrier Island Restoration Assessment Sandbox Interface ● Ongoing Work The Sandbox file structure has been established and is currently being utilized by the study team to store and exchange data. The Data Management Team supports development, expansion, maintenance and provides user guidance of the Sandbox as needed.
13
● Preliminary Results To date, the Sandbox houses both study-related documents and data as well as supplemental data of various types and formats for use by the study team. The Sandbox is organized by task-specific file folders and the study team members have permissions to add sub-files and upload data as necessary. As additional storage needs arise, the Sandbox framework was developed in a way to quickly increase back-end storage capacity.
● Future Direction
As data is delivered from other tasks, it will be uploaded into its corresponding data folder on the Sandbox. Also, as data is finalized and project data analysis discussions begin, additional tool development to aid in the analysis will be planned and prioritized by the project management team.
3.2. Task 2 – Field Data Collection Field data collected during this study includes bathymetric and geologic surveys; wave and current measurements; sediment distribution information; and water quality data. This information will be used to update baseline conditions and provide a primary source of data for model development and validation. Details of each of the data collection efforts are described in in sections 3.2.1 through 3.2.5
3.2.1. Task 2.1 – Bathymetric and Geologic Surveys ● Task Summary
The seafloor around Dauphin Island is highly dynamic, and updated bathymetric data is necessary to adequately characterize the morphology. This information is necessary for habitat characterization, to model oceanographic and sedimentologic processes, and provide accurate information for coastal management. The task seeks to provide a comprehensive, high-resolution bathymetric Digital Elevation Model (DEM) around the island using a suite of acoustic sensors: single-beam bathymetry in shallow waters (~1 - 10 feet), and multibeam in deeper waters (~9 - 50 feet). The DEM will be integrated with LiDAR elevation data of the island to provide a complete up-to-date bathymetric/topographic DEM. This data will be available for the needs of the other tasks and eventually to the public through USGS Data Series publications. ● Completed Efforts Bathymetric data was collected in 2015 from the Gulf and Sound sides of Dauphin Island in 3 legs. In July 2015, the USGS completed single-beam bathymetric surveys in the shallow waters (minimum 1 foot water depth) around the island. In August-September 2015, the USACE Engineering Research Development Center (ERDC) completed multibeam surveys in deeper waters (up to 20 feet in depth), and the USACE/USGS completed offshore surveys on the USACE survey vessel Irvington (up to 50 feet water depth). In 2016, ERDC processed the USACE multibeam data and delivered the product to the USGS. The USGS has completed processing the USGS single-beam products and has integrated the single beam and multibeam
14
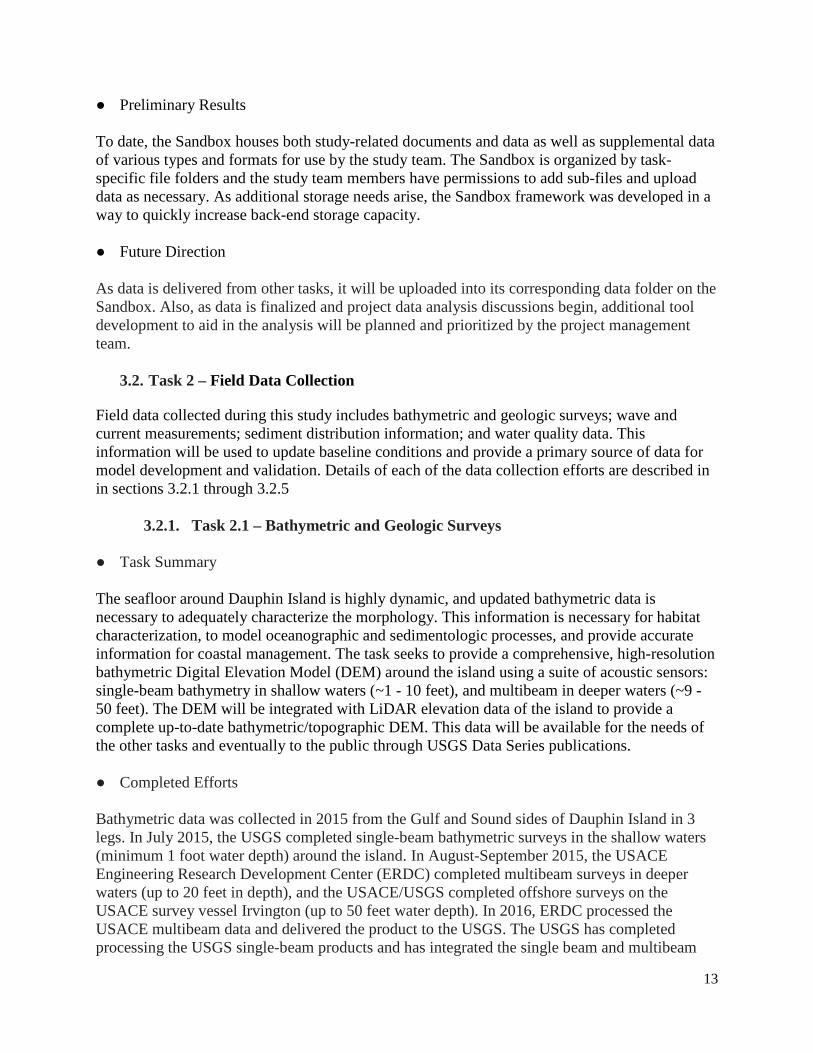
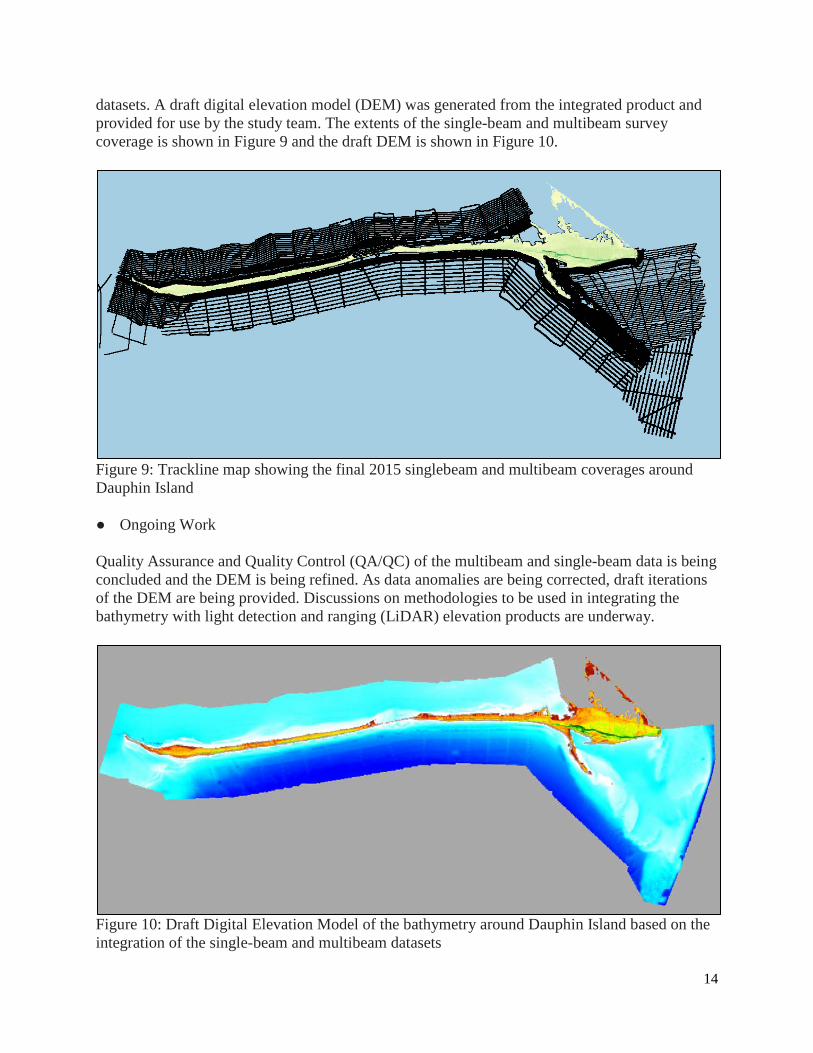
datasets. A draft digital elevation model (DEM) was generated from the integrated product and provided for use by the study team. The extents of the single-beam and multibeam survey coverage is shown in Figure 9 and the draft DEM is shown in Figure 10.
Figure 9: Trackline map showing the final 2015 singlebeam and multibeam coverages around Dauphin Island ● Ongoing Work Quality Assurance and Quality Control (QA/QC) of the multibeam and single-beam data is being concluded and the DEM is being refined. As data anomalies are being corrected, draft iterations of the DEM are being provided. Discussions on methodologies to be used in integrating the bathymetry with light detection and ranging (LiDAR) elevation products are underway.
Figure 10: Draft Digital Elevation Model of the bathymetry around Dauphin Island based on the integration of the single-beam and multibeam datasets
15
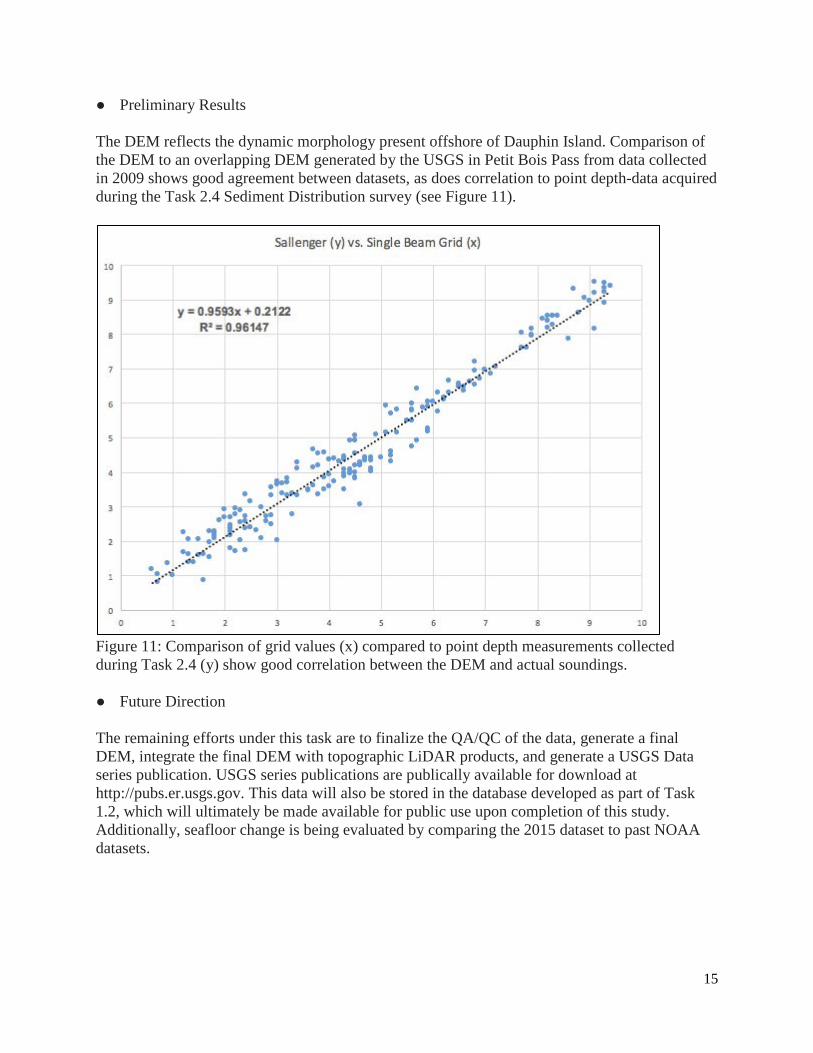
● Preliminary Results The DEM reflects the dynamic morphology present offshore of Dauphin Island. Comparison of the DEM to an overlapping DEM generated by the USGS in Petit Bois Pass from data collected in 2009 shows good agreement between datasets, as does correlation to point depth-data acquired during the Task 2.4 Sediment Distribution survey (see Figure 11).
Figure 11: Comparison of grid values (x) compared to point depth measurements collected during Task 2.4 (y) show good correlation between the DEM and actual soundings. ● Future Direction The remaining efforts under this task are to finalize the QA/QC of the data, generate a final DEM, integrate the final DEM with topographic LiDAR products, and generate a USGS Data series publication. USGS series publications are publically available for download at http://pubs.er.usgs.gov. This data will also be stored in the database developed as part of Task 1.2, which will ultimately be made available for public use upon completion of this study. Additionally, seafloor change is being evaluated by comparing the 2015 dataset to past NOAA datasets.
16
3.2.2. Task 2.2 – Tidal Current Measurements ● Task Summary
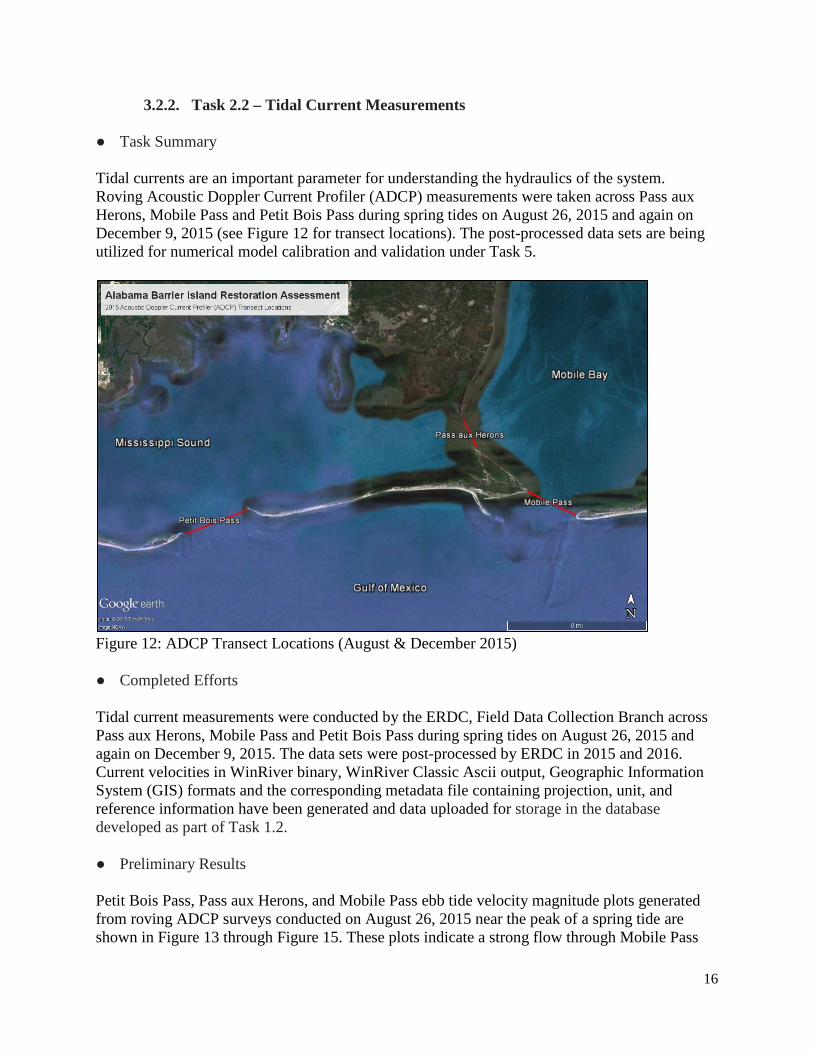
Tidal currents are an important parameter for understanding the hydraulics of the system. Roving Acoustic Doppler Current Profiler (ADCP) measurements were taken across Pass aux Herons, Mobile Pass and Petit Bois Pass during spring tides on August 26, 2015 and again on December 9, 2015 (see Figure 12 for transect locations). The post-processed data sets are being utilized for numerical model calibration and validation under Task 5.
Figure 12: ADCP Transect Locations (August & December 2015) ● Completed Efforts
Tidal current measurements were conducted by the ERDC, Field Data Collection Branch across Pass aux Herons, Mobile Pass and Petit Bois Pass during spring tides on August 26, 2015 and again on December 9, 2015. The data sets were post-processed by ERDC in 2015 and 2016. Current velocities in WinRiver binary, WinRiver Classic Ascii output, Geographic Information System (GIS) formats and the corresponding metadata file containing projection, unit, and reference information have been generated and data uploaded for storage in the database developed as part of Task 1.2.
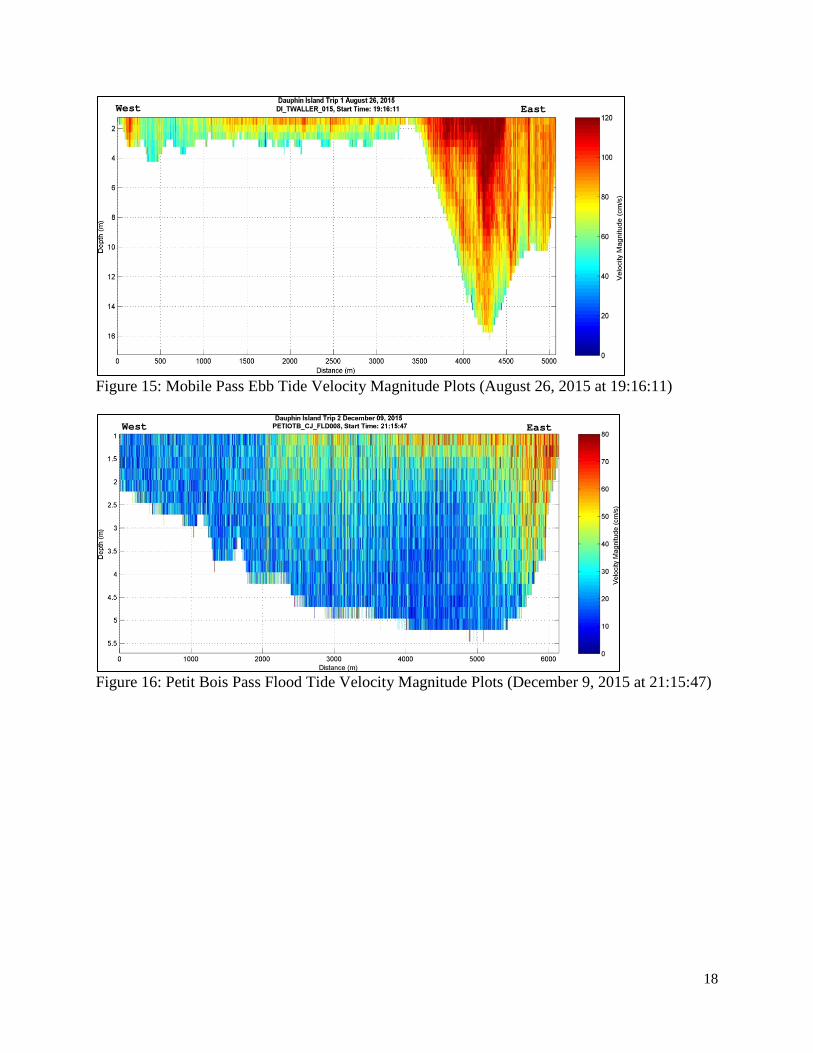
● Preliminary Results Petit Bois Pass, Pass aux Herons, and Mobile Pass ebb tide velocity magnitude plots generated from roving ADCP surveys conducted on August 26, 2015 near the peak of a spring tide are shown in Figure 13 through Figure 15. These plots indicate a strong flow through Mobile Pass

17
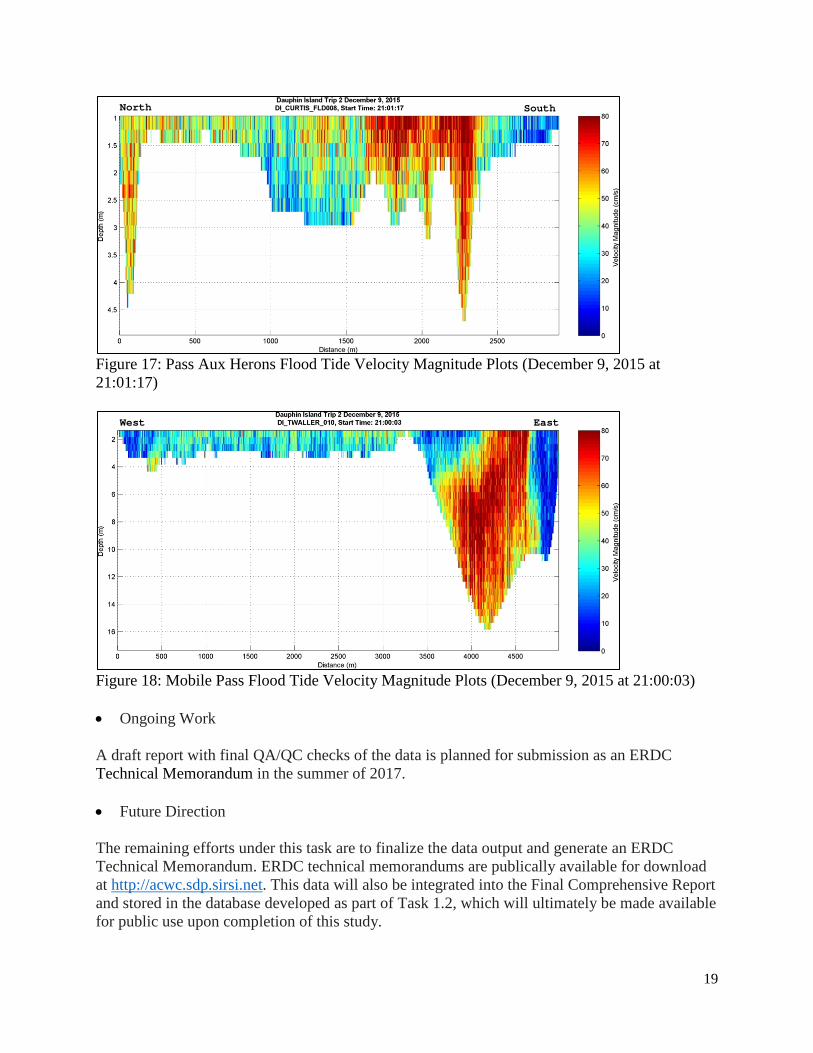
during ebb tide with notably smaller flows through Pass aux Herons and Petit Bois Pass. A similar pattern is observed in the velocity magnitude plots shown in Figure 16 through Figure 18 for Petit Bois Pass, Pass aux Herons, and Mobile Pass flood tide conditions collected on December 9, 2015 near the peak of a spring tide.
Figure 13: Petit Bois Pass Ebb Tide Velocity Magnitude Plot (August 26, 2015 at 19:51:11)
Figure 14: Pass aux Herons Ebb Tide Velocity Magnitude Plot (August 26, 2015 at 19:00:17)
East West
South North
18
Figure 15: Mobile Pass Ebb Tide Velocity Magnitude Plots (August 26, 2015 at 19:16:11)
Figure 16: Petit Bois Pass Flood Tide Velocity Magnitude Plots (December 9, 2015 at 21:15:47)
East West
East West
19
Figure 17: Pass Aux Herons Flood Tide Velocity Magnitude Plots (December 9, 2015 at 21:01:17)
Figure 18: Mobile Pass Flood Tide Velocity Magnitude Plots (December 9, 2015 at 21:00:03) • Ongoing Work
A draft report with final QA/QC checks of the data is planned for submission as an ERDC Technical Memorandum in the summer of 2017. • Future Direction The remaining efforts under this task are to finalize the data output and generate an ERDC Technical Memorandum. ERDC technical memorandums are publically available for download at http://acwc.sdp.sirsi.net. This data will also be integrated into the Final Comprehensive Report and stored in the database developed as part of Task 1.2, which will ultimately be made available for public use upon completion of this study.
East West
South North
20
3.2.3. Task 2.3 – Wave Measurements
● Task Summary
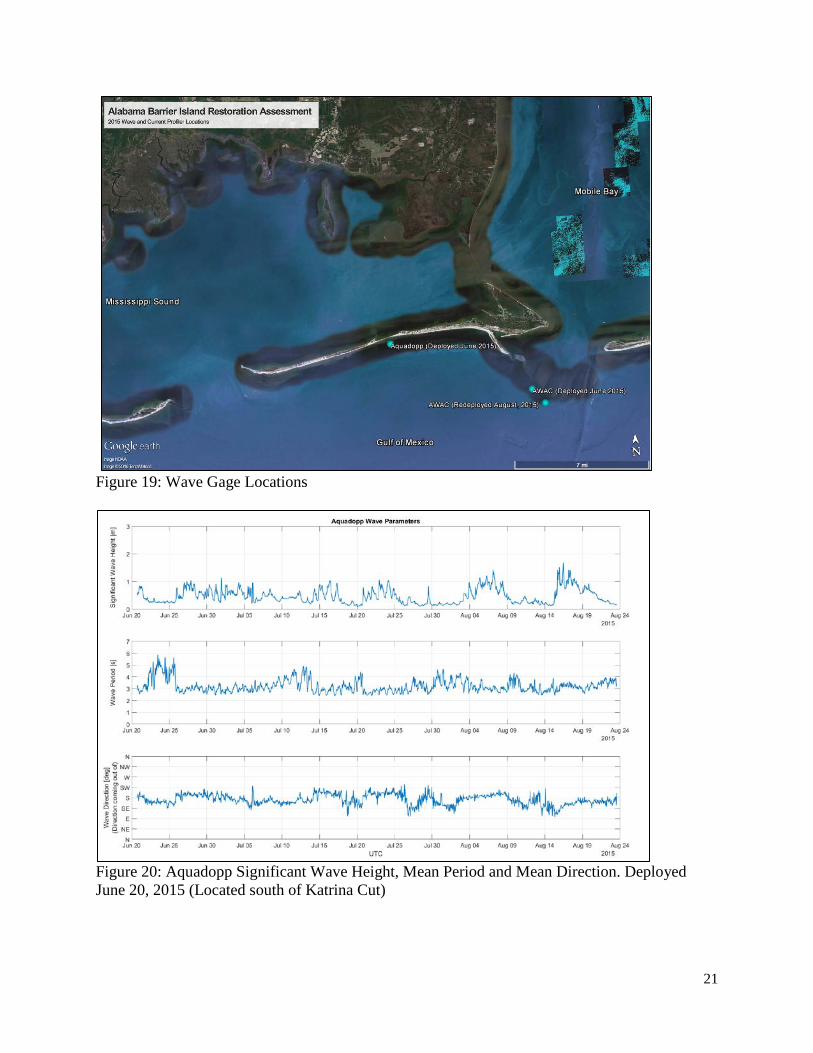
Waves are important coastal processes because they cause a shear at the seabed that can readily mobilize sediment and make it available for transport. In addition, breaking waves generate mean cross- and alongshore currents in the surf zone that also transport sediment. In order to accurately model currents driven by breaking waves, sediment transport, and shoreline morphology, wave measurements were collected during both ebb and flood conditions for the passes affecting the island. Two directional wave gage and current profilers were deployed in June 2015 to record measurements of waves, surface water elevations, and currents through August and November 2015 (see Figure 19 for gage locations). The post-processed data sets are being utilized for numerical model calibration and validation under Task 5. ● Completed Efforts
Wave and currents were measured in the vicinity of the Mobile Pass ebb tidal shoal and Katrina Cut (see Figure 19) using current profiler and directional wave systems. A bottom-mounted Nortek Aquadopp (specialized for shallow depths near Katrina Cut) and an Acoustic Wave and Current (AWAC) (near Mobile Pass ebb tidal shoal) were used. Both gages were initially deployed on June 20, 2015 with a second AWAC being redeployed on August 31, 2015 after the original gage was lost and not recovered. The Aquadopp recorded until August 23, 2015 at which time the gage became buried and could not be recovered.
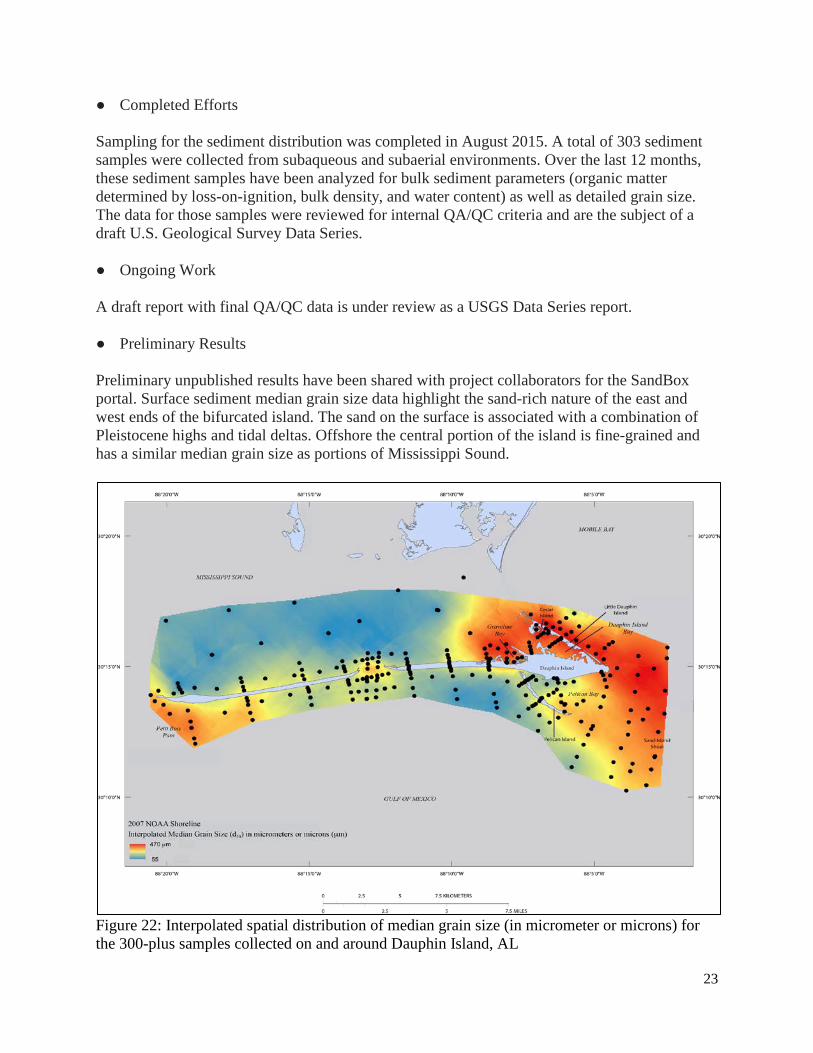
Processed full spectra directional wave data, wave height, wave period, wave direction, sea surface elevation, and current velocities data have been generated and data uploaded for storage in the database developed as part of Task 1.2. ● Preliminary Results Plots of significant wave height, period, and direction from the Aquadopp located just south of Katrina Cut during the time period of June 20, 2015 to August 23, 2015 and the AWAC located southwest of the Mobile Pass ebb tidal shoal during the time period of September 1, 2015 to November 1, 2015 are shown in Figure 20 and Figure 21. These plots indicate waves were primarily out of the south and southeast with significant wave heights rarely exceeding 1 meter and wave periods rarely greater than 4 seconds at the Aquadopp south of Katrina Cut (Figure 20). Wave conditions as recorded from the AWAC near the Mobile Pass ebb tidal shoal indicate more energetic conditions, with the strongest waves recorded out of the south and southeast with waves reaching heights of 1.5 to 2.5 meters with wave periods reaching 6 seconds (Figure 21).
21
Figure 19: Wave Gage Locations
Figure 20: Aquadopp Significant Wave Height, Mean Period and Mean Direction. Deployed June 20, 2015 (Located south of Katrina Cut)

22
Figure 21: AWAC Significant Wave Height, Mean Period and Mean Direction. Deployed September 1, 2015 (Located near the Mobile Pass ebb tidal shoal) ● Ongoing Work
A draft report with final QA/QC data is planned for submission as an ERDC Technical Memorandum by the summer of 2017.
• Future Direction
The remaining efforts under this task are to finalize the data output and generate an ERDC Technical Memorandum. ERDC technical memorandums are publically available for download at http://acwc.sdp.sirsi.net. This data will also be integrated into the Final Comprehensive Report and stored in the database developed as part of Task 1.2 which will be made available for public use upon completion of this study.
3.2.4. Task 2.4 – Sediment Distribution ● Task Summary Characterization of sediment texture, including detailed grain size metrics, within coastal-zone environments has been obtained in order to evaluate relationships among
○ sediment-transport patterns, ○ alongshore variability, and ○ geotechnical properties that influence the development of shoreline nourishment
and restoration approaches, and for inclusion in models to help anticipated coastal-system response to storm events.
23
● Completed Efforts
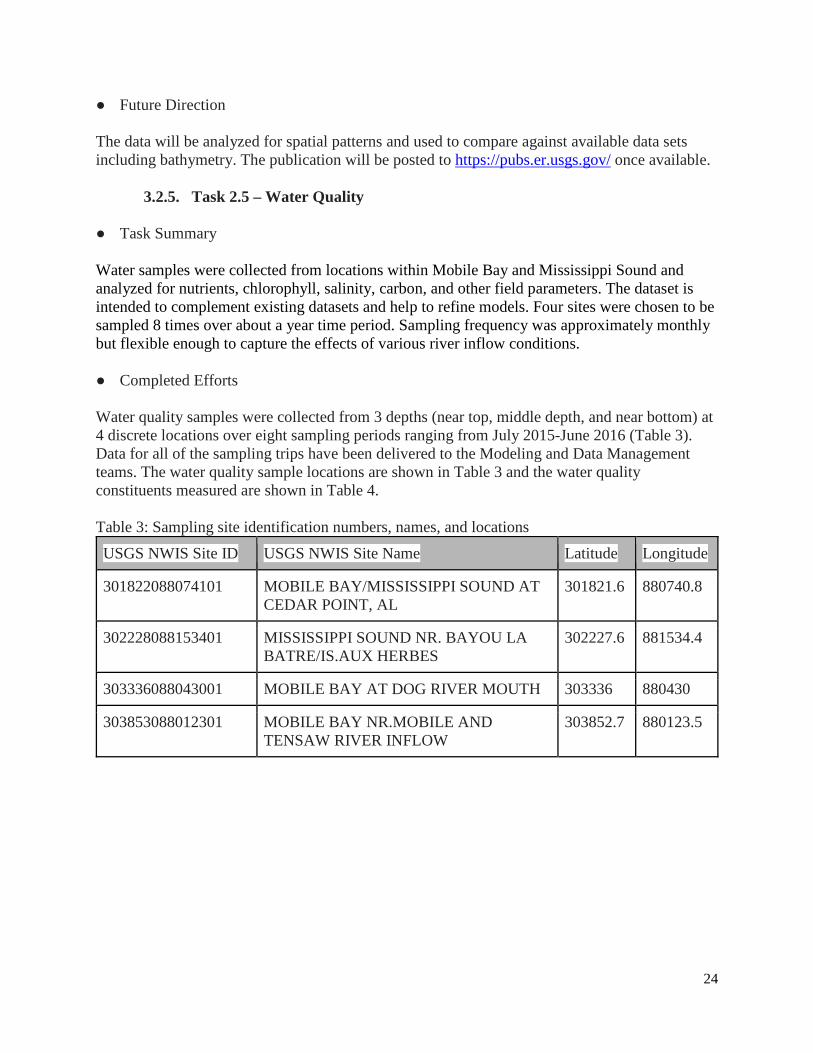
Sampling for the sediment distribution was completed in August 2015. A total of 303 sediment samples were collected from subaqueous and subaerial environments. Over the last 12 months, these sediment samples have been analyzed for bulk sediment parameters (organic matter determined by loss-on-ignition, bulk density, and water content) as well as detailed grain size. The data for those samples were reviewed for internal QA/QC criteria and are the subject of a draft U.S. Geological Survey Data Series. ● Ongoing Work A draft report with final QA/QC data is under review as a USGS Data Series report. ● Preliminary Results Preliminary unpublished results have been shared with project collaborators for the SandBox portal. Surface sediment median grain size data highlight the sand-rich nature of the east and west ends of the bifurcated island. The sand on the surface is associated with a combination of Pleistocene highs and tidal deltas. Offshore the central portion of the island is fine-grained and has a similar median grain size as portions of Mississippi Sound.
Figure 22: Interpolated spatial distribution of median grain size (in micrometer or microns) for the 300-plus samples collected on and around Dauphin Island, AL
24
● Future Direction The data will be analyzed for spatial patterns and used to compare against available data sets including bathymetry. The publication will be posted to https://pubs.er.usgs.gov/ once available.
3.2.5. Task 2.5 – Water Quality
● Task Summary
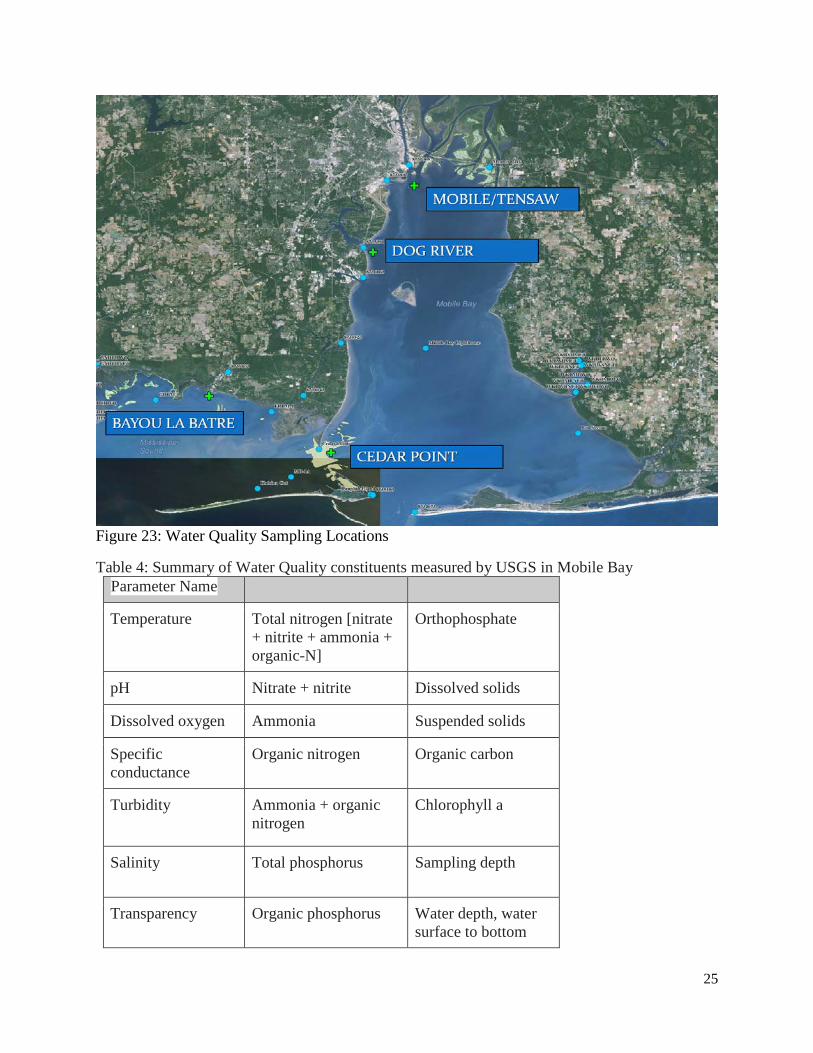
Water samples were collected from locations within Mobile Bay and Mississippi Sound and analyzed for nutrients, chlorophyll, salinity, carbon, and other field parameters. The dataset is intended to complement existing datasets and help to refine models. Four sites were chosen to be sampled 8 times over about a year time period. Sampling frequency was approximately monthly but flexible enough to capture the effects of various river inflow conditions. ● Completed Efforts Water quality samples were collected from 3 depths (near top, middle depth, and near bottom) at 4 discrete locations over eight sampling periods ranging from July 2015-June 2016 (Table 3). Data for all of the sampling trips have been delivered to the Modeling and Data Management teams. The water quality sample locations are shown in Table 3 and the water quality constituents measured are shown in Table 4. Table 3: Sampling site identification numbers, names, and locations
USGS NWIS Site ID USGS NWIS Site Name Latitude Longitude
301822088074101 MOBILE BAY/MISSISSIPPI SOUND AT CEDAR POINT, AL
301821.6 880740.8
302228088153401 MISSISSIPPI SOUND NR. BAYOU LA BATRE/IS.AUX HERBES
302227.6 881534.4
303336088043001 MOBILE BAY AT DOG RIVER MOUTH 303336 880430
303853088012301 MOBILE BAY NR.MOBILE AND TENSAW RIVER INFLOW
303852.7 880123.5
25
Figure 23: Water Quality Sampling Locations
Table 4: Summary of Water Quality constituents measured by USGS in Mobile Bay Parameter Name
Temperature Total nitrogen [nitrate + nitrite + ammonia + organic-N]
Orthophosphate
pH Nitrate + nitrite Dissolved solids
Dissolved oxygen Ammonia Suspended solids
Specific conductance
Organic nitrogen Organic carbon
Turbidity Ammonia + organic nitrogen
Chlorophyll a
Salinity Total phosphorus Sampling depth
Transparency Organic phosphorus Water depth, water surface to bottom

26
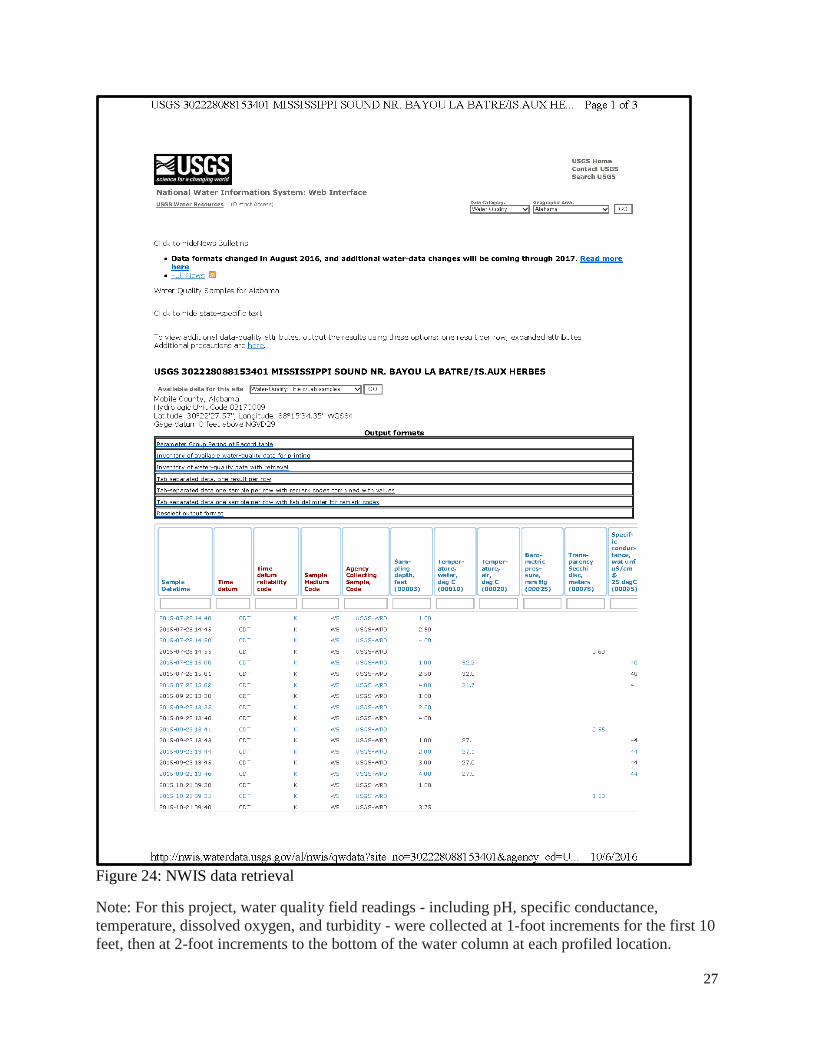
● Ongoing Work All work is complete for this task. The results of the final sampling event were delivered to the study team in September 2016. ● Preliminary Results The eight sampling trips included both “high flow” and “low flow” events during the year duration of this project giving the team a range of water quality conditions. No other interpretive work was proposed by the Water Quality Data Collection team. Further interpretation of the water quality data will be completed by the Modeling team and others associated with this project. All data are publically available in the NWISweb online database at the following link: http://nwis.waterdata.usgs.gov/al/nwis/qwdata. Figure 24 shows an example retrieval of data from NWISWeb.
27
Figure 24: NWIS data retrieval
Note: For this project, water quality field readings - including pH, specific conductance, temperature, dissolved oxygen, and turbidity - were collected at 1-foot increments for the first 10 feet, then at 2-foot increments to the bottom of the water column at each profiled location.

28
However, only three water quality samples were collected at each site during each sampling trip (at the top, mid, and bottom-depths of the water column). Each water quality sample was analyzed for chemical concentrations including nutrients, chlorophyll, solids, carbon, etc. Blanks in an NWIS retrieval indicate data that were not collected on a particular date, time, or depth. Since NWIS retrievals provide data for all times and depths at a particular location per sampling trip, blanks in the retrieval (as shown here) indicate chemical analyses that were not available because samples were not collected for all profiled depths where field readings were collected. ● Future Direction No other water quality sampling efforts will be completed during the study. As part of the Monitoring and Adaptive Management plan being developed under Task 7, we will propose water quality sampling in and around Alabama Barrier Island restoration areas to include pre-construction, during-construction, and post-construction phases similar to water quality data collection associated with other ongoing restoration activities in the region (e.g., the USACE Mississippi Coastal Improvement Program (MsCIP)). We will also propose to provide interpretation of water-quality data collected during that effort.
3.3. Task 3 – Data Analyses of Dauphin Island Shorelines and Habitats Data analysis of Dauphin Island shorelines and habitats will provide the basis for assessing short-term and long-term shoreline change, island width change, and increases or decreases in vegetated communities along the island. Subtasks include mapping historical shorelines and the historical extent of broad habitats as well as habitats important to identified species and ecosystem endpoints to help support evaluation of restoration alternatives. Further details of each of the subtasks are discussed below in sections 3.3.1 through 3.3.3.
3.3.1. Tasks 3.1 and 3.2 – Gulf Facing and Estuarine Shorelines and Environments ● Task Summary
The purpose of this task is to extract ocean-facing and estuarine shoreline positions from aerial imagery, satellite imagery, and LiDAR surveys to quantify short-term and long-term shoreline change and changes in island position and width. These data and analysis are intended to aid in establishing island-scale sediment budgets and validate numerical models of morphologic change. In addition to these observations of horizontal shoreline position, back-barrier marsh cores were collected to understand vertical accretion/erosion of marsh environments. The reporting of these two tasks has been combined to reflect that the ocean-facing and estuarine shorelines are interconnected (e.g., storm overwash) and the analysis of them as one system provides a more comprehensive understanding of island evolution and dynamics. ● Completed Efforts
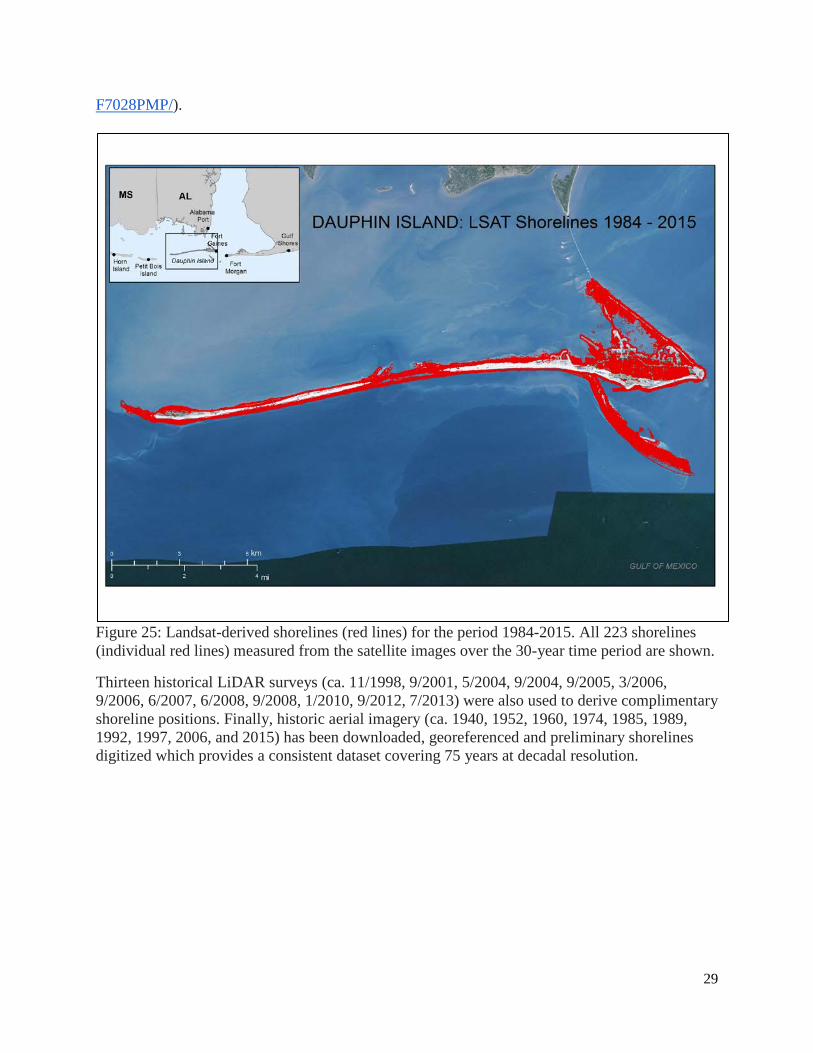
Landsat satellite imagery was used to extract shoreline positions from 1984-2015 (see Figure 25). This effort resulted in the digitization of over 200 shorelines for the 30-year time period which were published as a USGS data release (http://coastal.er.usgs.gov/data-release/doi-
29
F7028PMP/).
Figure 25: Landsat-derived shorelines (red lines) for the period 1984-2015. All 223 shorelines (individual red lines) measured from the satellite images over the 30-year time period are shown.
Thirteen historical LiDAR surveys (ca. 11/1998, 9/2001, 5/2004, 9/2004, 9/2005, 3/2006, 9/2006, 6/2007, 6/2008, 9/2008, 1/2010, 9/2012, 7/2013) were also used to derive complimentary shoreline positions. Finally, historic aerial imagery (ca. 1940, 1952, 1960, 1974, 1985, 1989, 1992, 1997, 2006, and 2015) has been downloaded, georeferenced and preliminary shorelines digitized which provides a consistent dataset covering 75 years at decadal resolution.

30
Figure 26: LiDAR-derived shorelines for the period 1998-2013
All of the back-barrier marsh cores collected have been analyzed for geochronometers, sediment texture, and organic matter content. The geochronometer and organic matter data have also been finalized. ● Ongoing Work Final QA/QC of the geospatial data is currently being performed to quantify uncertainties in the image-based shoreline positions which is needed to accurately determine shoreline change rates. The aerial image and LiDAR-derived shorelines will be disseminated in separate USGS data releases as soon as they are complete. Sediment texture data are also going through final QA/QC evaluation. ● Preliminary Results Initial shoreline change rates using the three data sources have been computed at 270 cross-shore transects spaced 100 meters apart covering the entire length of the island.
31
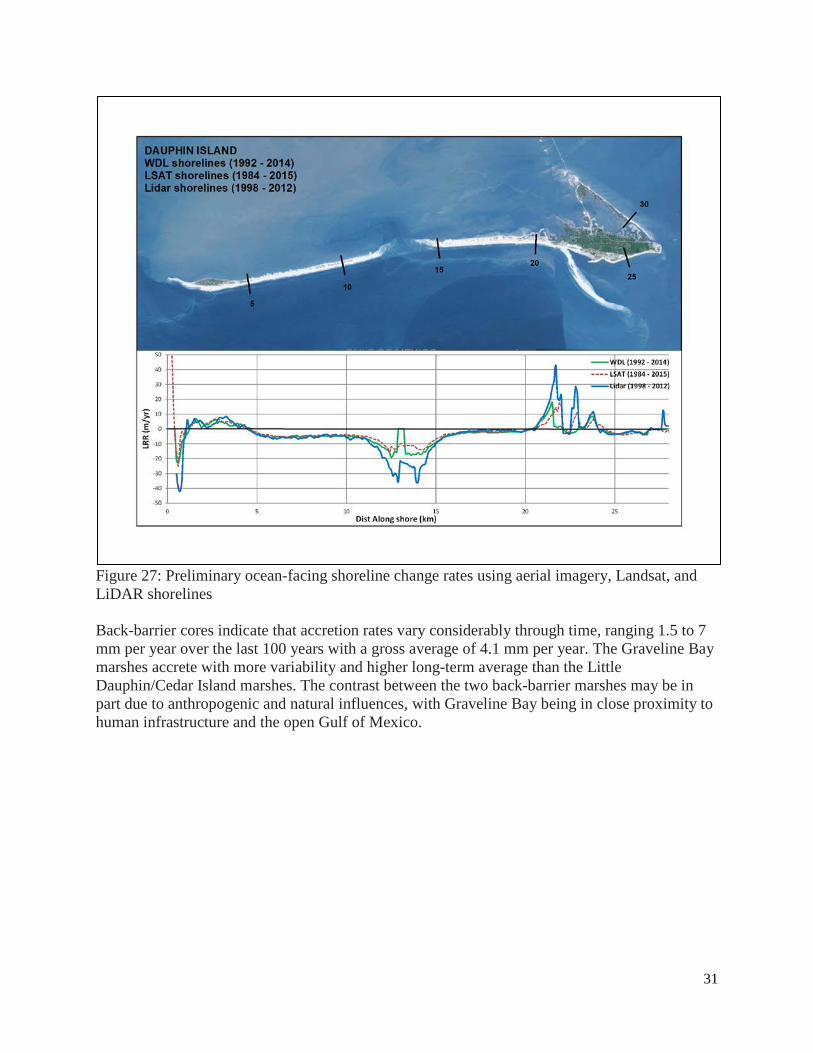
Figure 27: Preliminary ocean-facing shoreline change rates using aerial imagery, Landsat, and LiDAR shorelines Back-barrier cores indicate that accretion rates vary considerably through time, ranging 1.5 to 7 mm per year over the last 100 years with a gross average of 4.1 mm per year. The Graveline Bay marshes accrete with more variability and higher long-term average than the Little Dauphin/Cedar Island marshes. The contrast between the two back-barrier marshes may be in part due to anthropogenic and natural influences, with Graveline Bay being in close proximity to human infrastructure and the open Gulf of Mexico.
32
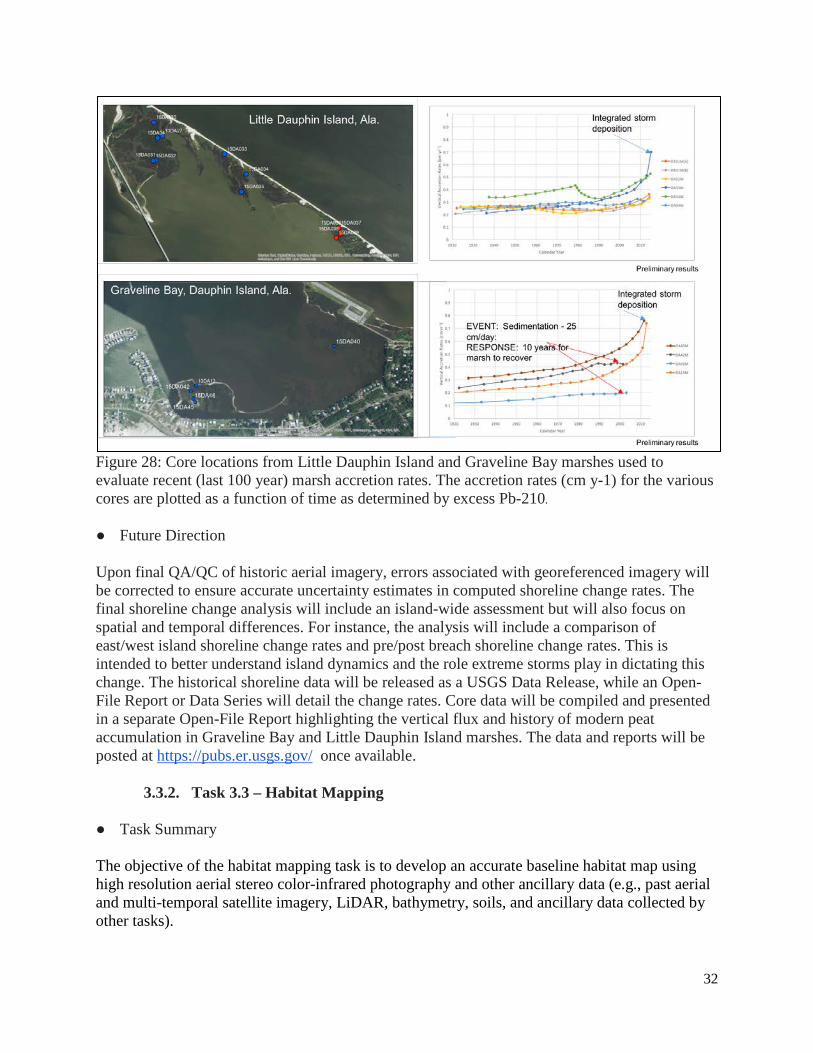
Figure 28: Core locations from Little Dauphin Island and Graveline Bay marshes used to evaluate recent (last 100 year) marsh accretion rates. The accretion rates (cm y-1) for the various cores are plotted as a function of time as determined by excess Pb-210.
● Future Direction Upon final QA/QC of historic aerial imagery, errors associated with georeferenced imagery will be corrected to ensure accurate uncertainty estimates in computed shoreline change rates. The final shoreline change analysis will include an island-wide assessment but will also focus on spatial and temporal differences. For instance, the analysis will include a comparison of east/west island shoreline change rates and pre/post breach shoreline change rates. This is intended to better understand island dynamics and the role extreme storms play in dictating this change. The historical shoreline data will be released as a USGS Data Release, while an Open-File Report or Data Series will detail the change rates. Core data will be compiled and presented in a separate Open-File Report highlighting the vertical flux and history of modern peat accumulation in Graveline Bay and Little Dauphin Island marshes. The data and reports will be posted at https://pubs.er.usgs.gov/ once available.
3.3.2. Task 3.3 – Habitat Mapping ● Task Summary
The objective of the habitat mapping task is to develop an accurate baseline habitat map using high resolution aerial stereo color-infrared photography and other ancillary data (e.g., past aerial and multi-temporal satellite imagery, LiDAR, bathymetry, soils, and ancillary data collected by other tasks).
33
● Completed Efforts
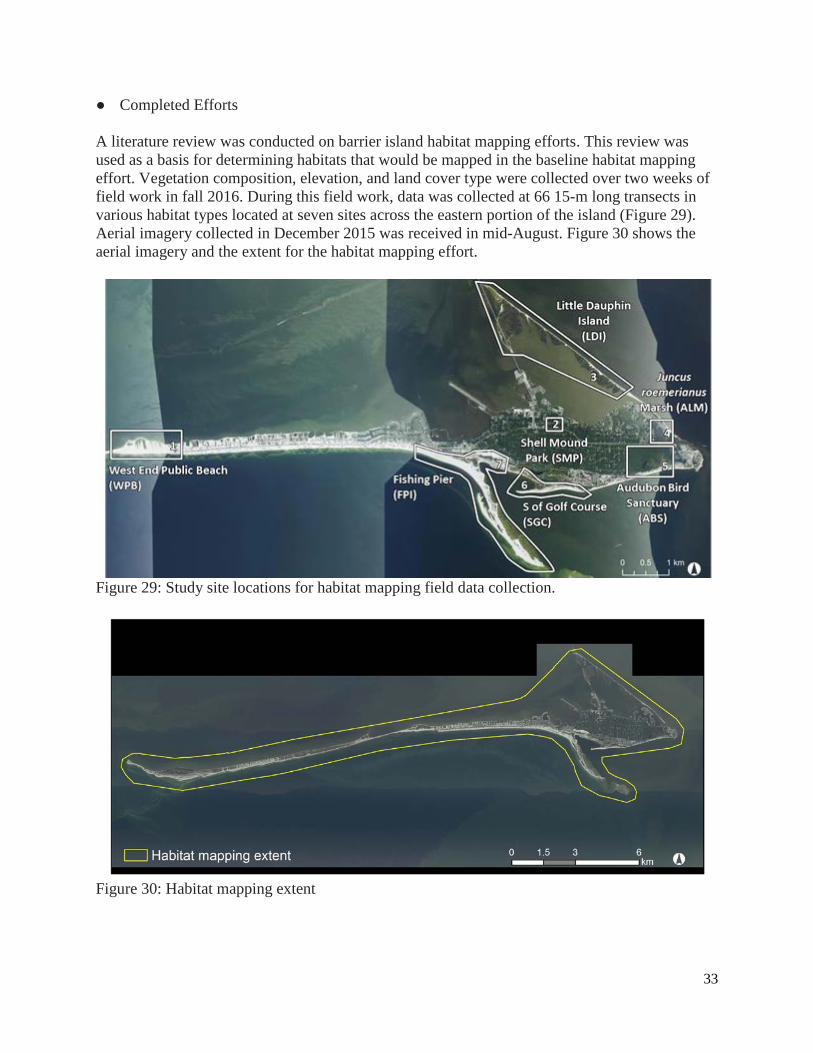
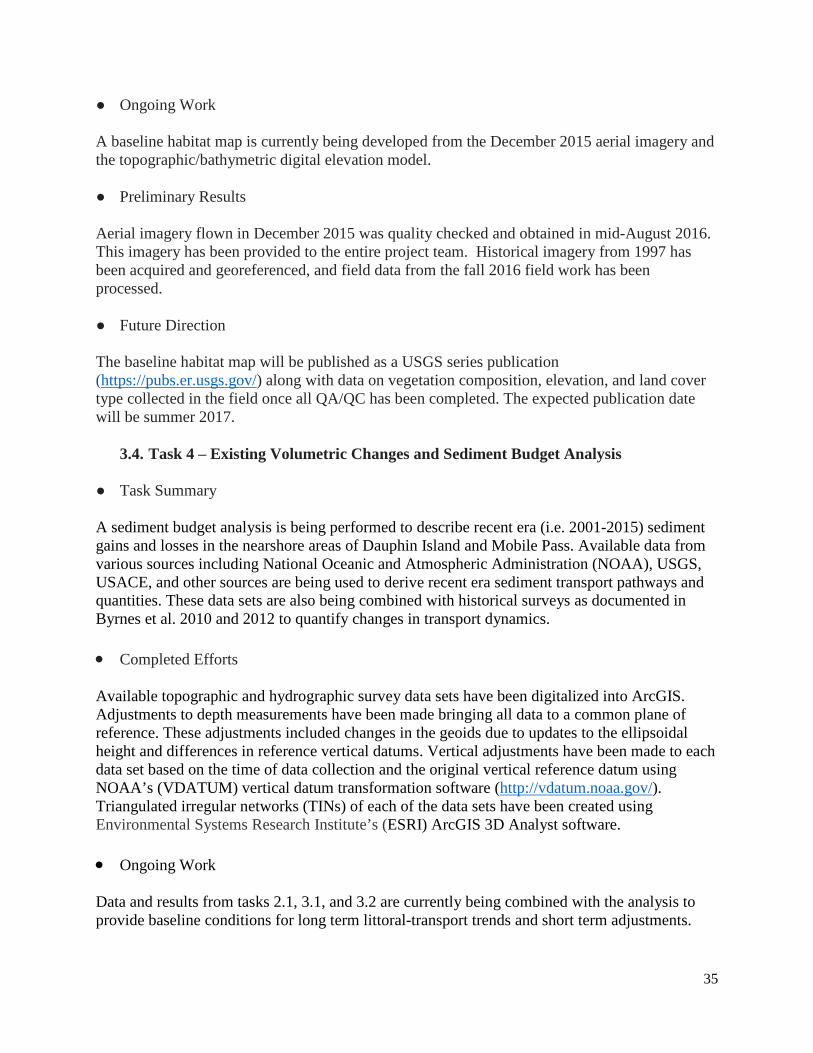
A literature review was conducted on barrier island habitat mapping efforts. This review was used as a basis for determining habitats that would be mapped in the baseline habitat mapping effort. Vegetation composition, elevation, and land cover type were collected over two weeks of field work in fall 2016. During this field work, data was collected at 66 15-m long transects in various habitat types located at seven sites across the eastern portion of the island (Figure 29). Aerial imagery collected in December 2015 was received in mid-August. Figure 30 shows the aerial imagery and the extent for the habitat mapping effort.
Figure 29: Study site locations for habitat mapping field data collection.
Figure 30: Habitat mapping extent

34
Table 5: List of habitats for mapping effort Class Subclass Description
Dune Dune
Dune includes both primary and secondary dunes. On Dauphin Island, primary dunes are low-elevation dunes (typically less than about 3 meters relative to mean sea level) found behind the beach berm. Secondary dunes are relatively immobile and support sparse vegetation coverage by shrubs. Secondary dunes are often found behind primary dunes and are typically higher than 3 meters (relative to mean sea level). These areas typically have a high absolute elevation (i.e., above extreme water levels from storms) and high relative elevation (i.e., upper slopes and ridges).
Barrier flat
Meadow Meadow includes grasslands located above extreme high water spring that commonly occupy areas on the backslope of a berm leading up to primary dunes, in between low dunes, and on flats behind dunes.
Sparsely vegetated barrier flat
Sparsely vegetated barrier flat includes flat or gently sloping areas with sparse vegetation above extreme high water spring that commonly occupy areas on the backslope of dunes (i.e., back-barrier-facing slopes).
Shrub/scrub Shrub/scrub Scrub/shrub includes upland areas where woody vegetation height is greater than about 0.5 meters but less than 6 meters.
Forested
Forested Forested includes upland areas where tree canopy is greater than 6 meters.
Forested wetland Forested wetland includes all non-tidal wetlands (i.e., wetlands with an average annual salinity due to ocean-derived salts that is equal to or less than 0.5 part per thousand (ppt)) dominated by woody vegetation with a height greater than or equal to 6 meters.
Beach
Intertidal beach
Intertidal beach includes bare or sparsely vegetated areas along the gulf-facing side of the island found between extreme low water spring and extreme high water spring that are adjacent to marine open water (i.e. water with an average annual salinity due to ocean-derived salts that is greater than or equal to 30 ppt).
Beach
Beach includes bare or sparsely vegetated area that is adjacent to intertidal beach and near marine open water (i.e. water with an average annual salinity due to ocean-derived salts that is greater than or equal to 30 ppt) and found above the extreme high water spring. Beach often transitions into sparsely vegetated barrier flat, primary dune, or meadow.
Oyster reef Oyster reef
Oyster reef includes subtidal, irregularly exposed, regularly flooded, and irregularly flooded by tides (i.e., all areas located below extreme high water spring) estuarine areas that are dominated by ridge-like or mound-like structures formed by the colonization and growth of extensive exoskeleton building sessile invertebrates. Note, all areas mapped as oyster reef will be extracted from historical oyster survey data collected by the State of Alabama.
Intertidal flat Intertidal flat
Intertidal flat includes all tidal wetlands (i.e., wetlands found above extreme low water spring and below extreme high water spring inundated from spring tides) adjacent to estuarine open water (i.e., water with an average annual salinity due to ocean-derived salts that is less than 30 ppt) with less than 30 percent areal cover of vegetation.
Intertidal marsh Intertidal marsh Intertidal marsh includes all tidal wetlands (i.e., wetlands found above extreme low water spring and below extreme high water spring inundated from spring tides) with 30 percent or greater areal cover by erect, rooted, herbaceous hydrophytes.
Seagrass Seagrass
Seagrass includes any combination of seagrasses, oligohaline grasses, attached macroalgae, and drift macroalgae covering 10-100 percent of the substrate. Note: areas mapped from the December 2015 imagery will be supplemented with a 2015 seagrass map produced by Barry Vittor and Associates, Inc.
Developed
Shoreline protection
Shoreline protection includes areas that have any material used to protect shorelines from erosion.
Developed Developed includes areas characterized by 30 percent or more constructed materials (e.g., asphalt, concrete, buildings, etc.).
Open water
Open water, fresh
Open water, fresh includes all areas of non-tidal open water (i.e., isolated low-lying areas that are not connected to areas above the extreme low water spring or extreme high water spring that receive regular inundation from tides). These open water areas generally have less than 25 percent cover of vegetation.
Open water, estuarine
Open water, estuarine includes all areas of tidal open water and estuarine water of the back-barrier side of the island (i.e., water bodies connected to areas above the extreme low water spring or extreme high water spring that receive regular inundation from tides). These areas have an average annual salinity due to ocean-derived salts of less than 30 ppt. These open water areas generally have less than 25 percent cover of vegetation.
Open water, marine
Open water, marine includes all areas of marine open water found offshore of the gulf-facing side of the island. These areas have an average annual salinity due to ocean-derived salts of greater than or equal to 30 ppt. These open water areas generally have less than 25 percent cover of vegetation.
35
● Ongoing Work
A baseline habitat map is currently being developed from the December 2015 aerial imagery and the topographic/bathymetric digital elevation model. ● Preliminary Results
Aerial imagery flown in December 2015 was quality checked and obtained in mid-August 2016. This imagery has been provided to the entire project team. Historical imagery from 1997 has been acquired and georeferenced, and field data from the fall 2016 field work has been processed. ● Future Direction
The baseline habitat map will be published as a USGS series publication (https://pubs.er.usgs.gov/) along with data on vegetation composition, elevation, and land cover type collected in the field once all QA/QC has been completed. The expected publication date will be summer 2017.
3.4. Task 4 – Existing Volumetric Changes and Sediment Budget Analysis ● Task Summary
A sediment budget analysis is being performed to describe recent era (i.e. 2001-2015) sediment gains and losses in the nearshore areas of Dauphin Island and Mobile Pass. Available data from various sources including National Oceanic and Atmospheric Administration (NOAA), USGS, USACE, and other sources are being used to derive recent era sediment transport pathways and quantities. These data sets are also being combined with historical surveys as documented in Byrnes et al. 2010 and 2012 to quantify changes in transport dynamics.
• Completed Efforts
Available topographic and hydrographic survey data sets have been digitalized into ArcGIS. Adjustments to depth measurements have been made bringing all data to a common plane of reference. These adjustments included changes in the geoids due to updates to the ellipsoidal height and differences in reference vertical datums. Vertical adjustments have been made to each data set based on the time of data collection and the original vertical reference datum using NOAA’s (VDATUM) vertical datum transformation software (http://vdatum.noaa.gov/). Triangulated irregular networks (TINs) of each of the data sets have been created using Environmental Systems Research Institute’s (ESRI) ArcGIS 3D Analyst software.
• Ongoing Work
Data and results from tasks 2.1, 3.1, and 3.2 are currently being combined with the analysis to provide baseline conditions for long term littoral-transport trends and short term adjustments.
36
Surface differencing of the processed data sets using the ArcGIS TIN Difference tool are being performed to determine volumetric changes between successive time periods. • Preliminary Results
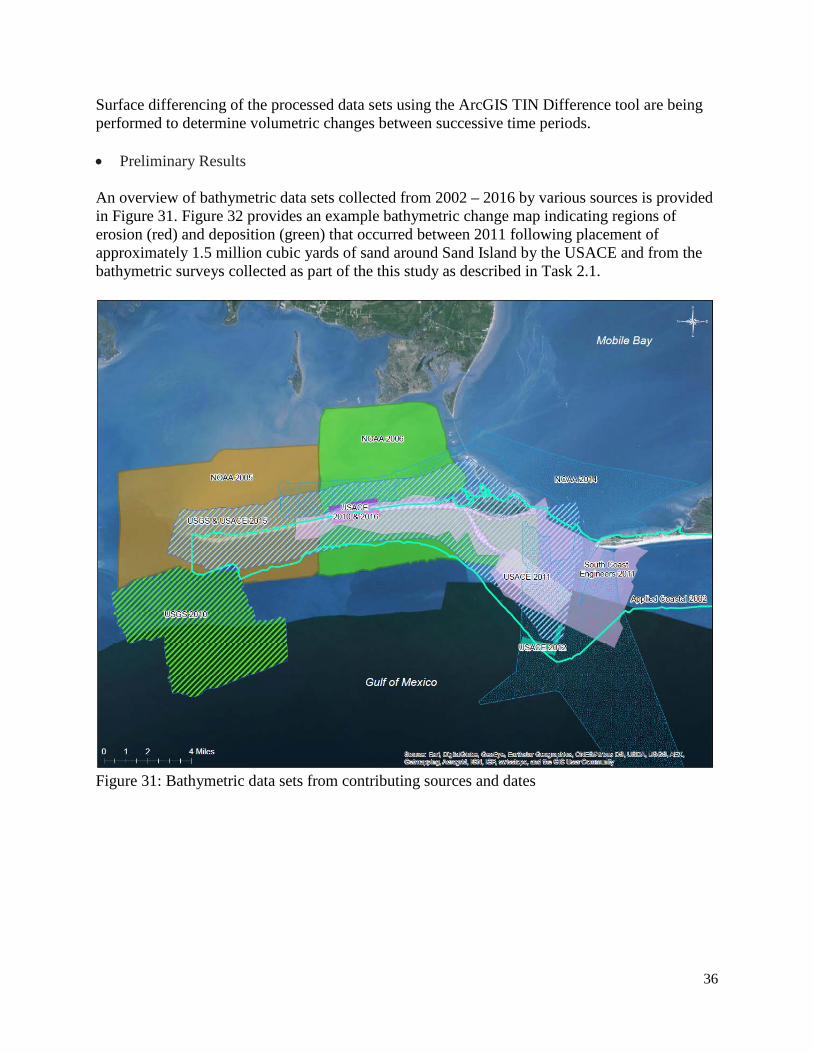
An overview of bathymetric data sets collected from 2002 – 2016 by various sources is provided in Figure 31. Figure 32 provides an example bathymetric change map indicating regions of erosion (red) and deposition (green) that occurred between 2011 following placement of approximately 1.5 million cubic yards of sand around Sand Island by the USACE and from the bathymetric surveys collected as part of the this study as described in Task 2.1.
Figure 31: Bathymetric data sets from contributing sources and dates

37
Figure 32: Topographic/Bathymetric Change Map 2011 to 2015.
• Future Direction
A sediment budget tallying the sediment gains and losses, or sources and sinks, within the study area over the given time frame(s) will be completed. Areas will be defined by geologic features or natural geomorphic boundaries, data resolution, coastal structures, and knowledge of the site. Topographic/bathymetric change maps indicating new regions of erosion/deposition as well as volumetric change and sediment pathways will be provided. This data and analysis will be integrated into the Final Comprehensive Report and stored in the database developed as part of Task 1.2 which will be made available for public use upon completion of this study.
3.5. Task 5 – Modeling
A suite of numerical models are being developed for Dauphin Island to provide a quantitative understanding of the processes governing the past and present Dauphin Island barrier system, including the nearshore region adjacent to the barrier island complex. The development of the numerical modeling suite of hydrodynamic, water quality, sediment transport, morphologic, and habitat change is intended to support evaluation of restoration alternatives. Details of each of the modeling components are discussed below in sections 3.5.1 through 3.5.4.

38
3.5.1. Task 5.1 – Hydrodynamic & Morphological Change Modeling ● Task Summary
In this task, a coupled hydrodynamic and morphologic model framework is being developed to hindcast and forecast the evolution of Dauphin Island over decadal time scales. The framework is comprised of multiple nested domains and individual models that, when coupled together, will simulate the dominant processes that dictate how the island evolves. This includes littoral sediment transport processes, the island response to large storms (e.g., dune erosion and overwash), and beach and dune recovery that occurs during non-storm conditions. The model framework will be calibrated/validated by hindcasting the island evolution between 1998 and 2013 and compared to the 15 LiDAR surveys collected during that time period. Restoration alternatives will then be incorporated into the present day island configuration and simulations will be performed to simulate the island response in the future over various time periods. Hydrodynamic and morphologic output from this model framework will be passed to the water quality, structural response, and habitat modeling efforts at varying time intervals. This output includes, in part, island footprint/elevations and wave and flow characteristics. ● Completed Efforts
Elevation grids for the wave, flow, and littoral sediment transport model (Delft3D) have been generated and tested for stability, resolution, computational efficiency, and accuracy. This currently consists of two nested grids with varying cross-shore and alongshore resolution and has been used to simulate the time periods when in situ wave and flow data was collected as part of this project (Tasks 2.2 and 2.3).

39
Figure 33: Domains for the individual models coupled in the hydrodynamic/morphodynamic simulation framework. Black points represent the outer northern Gulf of Mexico wave model domain, red points are the inner wave, circulation, and sediment transport model domain, and the depth colormap indicates the nested beach and dune storm response model.
Similarly, a grid to simulate storm-induced island evolution using the model XBeach (Roelyink et al, 2009) has been generated, tested, calibrated, and validated for Hurricanes Ivan and Katrina. The model setup provides high cross-shore resolution (~3 meters) of the beach and dune system and the impact of diverse land-use by incorporating spatially variable friction.
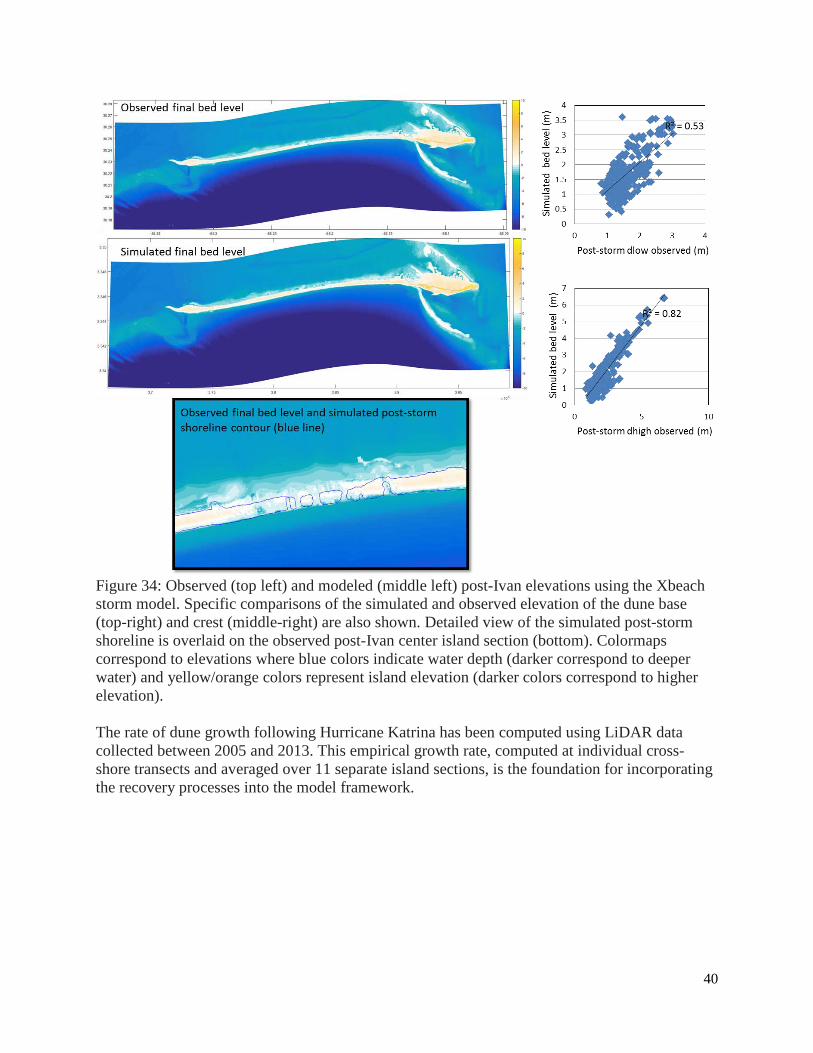
40
Figure 34: Observed (top left) and modeled (middle left) post-Ivan elevations using the Xbeach storm model. Specific comparisons of the simulated and observed elevation of the dune base (top-right) and crest (middle-right) are also shown. Detailed view of the simulated post-storm shoreline is overlaid on the observed post-Ivan center island section (bottom). Colormaps correspond to elevations where blue colors indicate water depth (darker correspond to deeper water) and yellow/orange colors represent island elevation (darker colors correspond to higher elevation). The rate of dune growth following Hurricane Katrina has been computed using LiDAR data collected between 2005 and 2013. This empirical growth rate, computed at individual cross-shore transects and averaged over 11 separate island sections, is the foundation for incorporating the recovery processes into the model framework.
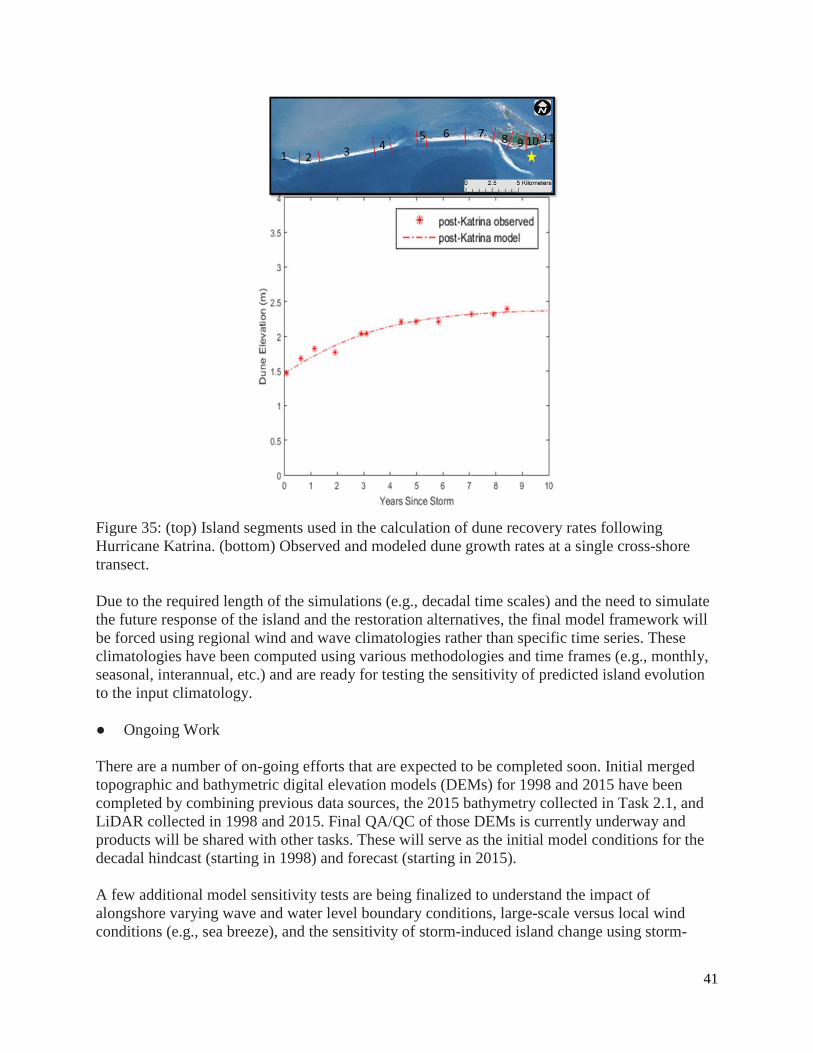
41
Figure 35: (top) Island segments used in the calculation of dune recovery rates following Hurricane Katrina. (bottom) Observed and modeled dune growth rates at a single cross-shore transect. Due to the required length of the simulations (e.g., decadal time scales) and the need to simulate the future response of the island and the restoration alternatives, the final model framework will be forced using regional wind and wave climatologies rather than specific time series. These climatologies have been computed using various methodologies and time frames (e.g., monthly, seasonal, interannual, etc.) and are ready for testing the sensitivity of predicted island evolution to the input climatology. ● Ongoing Work
There are a number of on-going efforts that are expected to be completed soon. Initial merged topographic and bathymetric digital elevation models (DEMs) for 1998 and 2015 have been completed by combining previous data sources, the 2015 bathymetry collected in Task 2.1, and LiDAR collected in 1998 and 2015. Final QA/QC of those DEMs is currently underway and products will be shared with other tasks. These will serve as the initial model conditions for the decadal hindcast (starting in 1998) and forecast (starting in 2015). A few additional model sensitivity tests are being finalized to understand the impact of alongshore varying wave and water level boundary conditions, large-scale versus local wind conditions (e.g., sea breeze), and the sensitivity of storm-induced island change using storm-

42
specific or scenario-based inputs. Initial model runs to determine the timing and frequency of model coupling are being performed and analyzed. ● Preliminary Results
Initial simulations of conditions during the in situ data collection show good agreement between observed and modeled water levels near the island and ebb/flood velocities through the passes adjacent to Dauphin Island. Because historical wave and water level data near the island are lacking, these data were essential toward validating the hydrodynamic model.
Figure 36: (top) Observed (black) and modeled (blue) water levels at the NOAA tide station (8735180) located on the eastern end of Dauphin Island (R2 = 0.68). Observed and modeled ebb (Trip 1) and flood (Trip 2) flow velocities across Mobile Bay inlet separated into cross-channel (bottom left; R2 = 0.92 and 0.47 for Trip 1 and Trip 2, respectively) and along-channel (bottom right; R2 = 0.91 and 0.43 for Trip 1 and Trip 2, respectively) velocity components. Wave characteristics including height, period, and direction were collected for three non-overlapping time periods in two shallow water locations (see details in Task 2.3). The Delft3D model (Lesser et al, 2004) was used to simulate this collective 6-month time period and assess model skill in both locations. The comparison at the eastern sensor closest to Pelican Island indicates good model-data agreement for bulk wave characteristics (September-November 2015). There appears to be a bias in the wave model when compared to the sensor deployed immediately in front of Katrina Cut. While the development of the coupled model framework
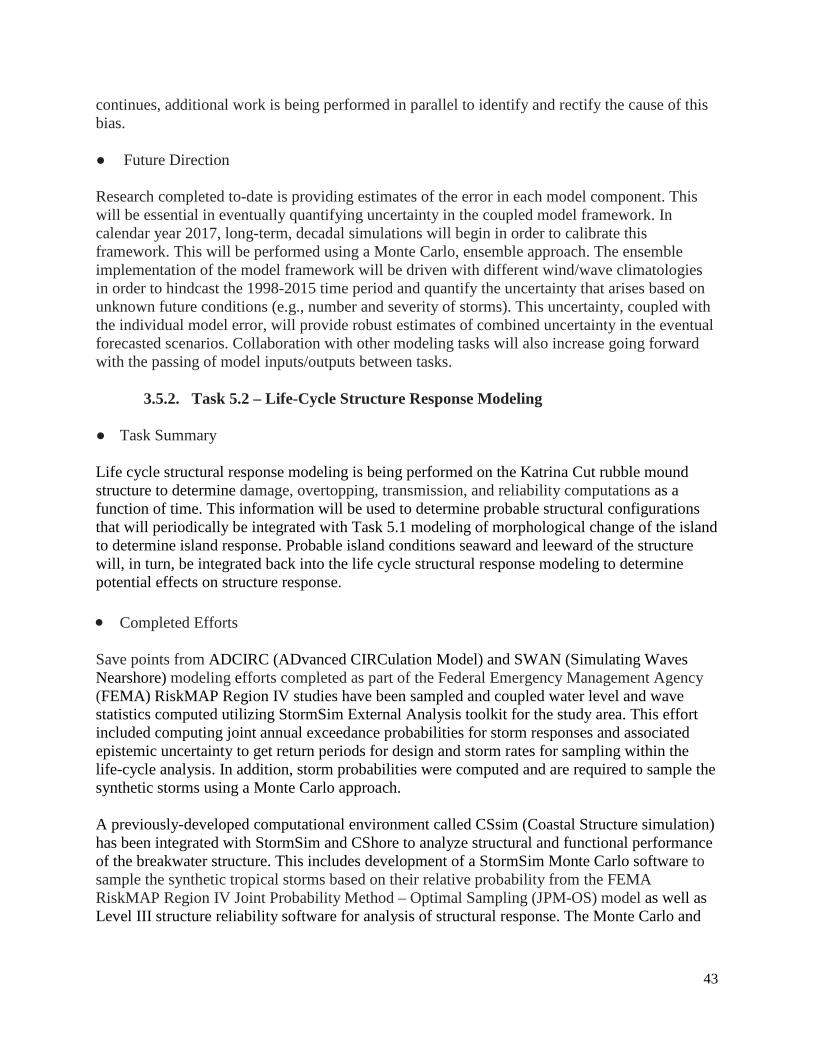
43
continues, additional work is being performed in parallel to identify and rectify the cause of this bias. ● Future Direction
Research completed to-date is providing estimates of the error in each model component. This will be essential in eventually quantifying uncertainty in the coupled model framework. In calendar year 2017, long-term, decadal simulations will begin in order to calibrate this framework. This will be performed using a Monte Carlo, ensemble approach. The ensemble implementation of the model framework will be driven with different wind/wave climatologies in order to hindcast the 1998-2015 time period and quantify the uncertainty that arises based on unknown future conditions (e.g., number and severity of storms). This uncertainty, coupled with the individual model error, will provide robust estimates of combined uncertainty in the eventual forecasted scenarios. Collaboration with other modeling tasks will also increase going forward with the passing of model inputs/outputs between tasks.
3.5.2. Task 5.2 – Life-Cycle Structure Response Modeling ● Task Summary
Life cycle structural response modeling is being performed on the Katrina Cut rubble mound structure to determine damage, overtopping, transmission, and reliability computations as a function of time. This information will be used to determine probable structural configurations that will periodically be integrated with Task 5.1 modeling of morphological change of the island to determine island response. Probable island conditions seaward and leeward of the structure will, in turn, be integrated back into the life cycle structural response modeling to determine potential effects on structure response. • Completed Efforts
Save points from ADCIRC (ADvanced CIRCulation Model) and SWAN (Simulating Waves Nearshore) modeling efforts completed as part of the Federal Emergency Management Agency (FEMA) RiskMAP Region IV studies have been sampled and coupled water level and wave statistics computed utilizing StormSim External Analysis toolkit for the study area. This effort included computing joint annual exceedance probabilities for storm responses and associated epistemic uncertainty to get return periods for design and storm rates for sampling within the life-cycle analysis. In addition, storm probabilities were computed and are required to sample the synthetic storms using a Monte Carlo approach. A previously-developed computational environment called CSsim (Coastal Structure simulation) has been integrated with StormSim and CShore to analyze structural and functional performance of the breakwater structure. This includes development of a StormSim Monte Carlo software to sample the synthetic tropical storms based on their relative probability from the FEMA RiskMAP Region IV Joint Probability Method – Optimal Sampling (JPM-OS) model as well as Level III structure reliability software for analysis of structural response. The Monte Carlo and

44
Reliability tools were shared with the beach morphology group working on Task 5.1. In addition, the FEMA storms and the computed relative probabilities of the storms were shared. In addition, the machine learning software was trained for the FEMA storm responses and validated with Hurricane Ivan fine-scale modeling. The validated model allows for rapid prediction of hurricane water levels for both incoming storms and for predefined storms, such as the FEMA storms or other scenarios. As an example, the software can be used to evaluate the structure resilience and functional performance resulting from Hurricane Ivan with and without sea level rise and on varying tracks and with varying intensity, speed and size. The Monte Carlo sampling and Reliability programs along with CSHORE were run for the Katrina Cut structure on preliminary profiles X1 – X3 as shown in Figure 37. The results from the program appear to be reasonable and the models are currently being validated. On September 7, 2016 a site visit and survey was conducted on and around the rubble mound structure at Dauphin Island in the area known as “Katrina Cut.” The purpose was to evaluate structure damage and verify existing Light Detection and Ranging (LiDAR) surveys and confirm existing conditions.
• Ongoing work
Finalization of the existing conditions grid based on the 2015 LiDAR and 2016 Real Time Kinematic (RTK) surveys. These data will be used to define the structure conditions and historical performance. The latter is critical for validation of the structure simulation tools developed to-date.
• Preliminary Results Existing conditions of the Katrina Cut rubble mound structure based on a merged dataset of USGS 2015 LiDAR and 2015 bathymetric surveys are shown in shown in Figure 37 along with two typical cross-sections.
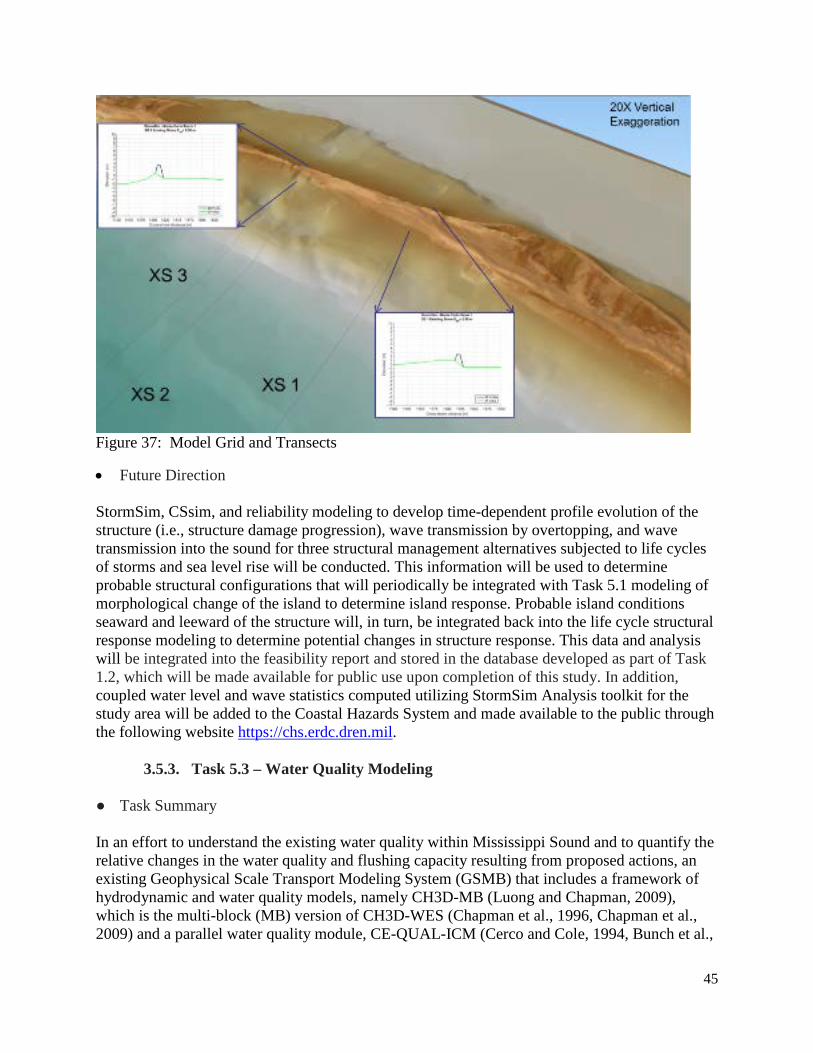
45
Figure 37: Model Grid and Transects
• Future Direction
StormSim, CSsim, and reliability modeling to develop time-dependent profile evolution of the structure (i.e., structure damage progression), wave transmission by overtopping, and wave transmission into the sound for three structural management alternatives subjected to life cycles of storms and sea level rise will be conducted. This information will be used to determine probable structural configurations that will periodically be integrated with Task 5.1 modeling of morphological change of the island to determine island response. Probable island conditions seaward and leeward of the structure will, in turn, be integrated back into the life cycle structural response modeling to determine potential changes in structure response. This data and analysis will be integrated into the feasibility report and stored in the database developed as part of Task 1.2, which will be made available for public use upon completion of this study. In addition, coupled water level and wave statistics computed utilizing StormSim Analysis toolkit for the study area will be added to the Coastal Hazards System and made available to the public through the following website https://chs.erdc.dren.mil.
3.5.3. Task 5.3 – Water Quality Modeling ● Task Summary
In an effort to understand the existing water quality within Mississippi Sound and to quantify the relative changes in the water quality and flushing capacity resulting from proposed actions, an existing Geophysical Scale Transport Modeling System (GSMB) that includes a framework of hydrodynamic and water quality models, namely CH3D-MB (Luong and Chapman, 2009), which is the multi-block (MB) version of CH3D-WES (Chapman et al., 1996, Chapman et al., 2009) and a parallel water quality module, CE-QUAL-ICM (Cerco and Cole, 1994, Bunch et al.,

46
2003) is being updated to expand simulation time, forcing conditions, and parameters. The tools will be used to investigate potential changes in water quality resulting from probable island conditions and potential management actions developed as part of Task 5.1 and Task 6. • Completed Efforts
Elevation grids for the wave, flow, and water quality models have been generated and tested for stability, resolution, computational efficiency, and accuracy. This currently consists of a 64 block grid with varying cross-shore, alongshore, and vertical resolution.
Figure 38: Northern Portion of the Model Domain
47
Figure 39: Multi-Block Grid of the Upper Portion of the Model Domain
Map files required for linkage of water quality model (CEQUAL-ICM) have been developed for all 64 blocks. These files enable the passing of hydrodynamic information (flows, cell properties) from the hydrodynamic model (CH3D-MB) to CEQUAL-ICM. Initial testing of model linkage between the hydrodynamic (CH3D-MB) and CE-QUAL-ICM for volume and mass conservation has been conducted to ensure proper model linkage. This is one of two tests conducted to ensure the two models are linked properly. • Ongoing work
Ongoing work consists of additional CE-QUAL-ICM linkage and testing and generation of boundary conditions for the CE-QUAL-ICM model. A second test involving setting the boundary conditions for salinity to be the same as those used in the hydrodynamic model is being conducted. This test will be used to ensure that transport agrees in both models and that CEQUAL-ICM is correctly capturing the flow patterns that the hydrodynamic model is generating.
• Preliminary Results
Comparison for 2010 hydrodynamic model runs at the Dauphin Island, Coast Guard Sector Mobile and other nearby tide stations show good agreement between the observed and simulated water surface elevations, as shown in Figure 40 through Figure 45. The blue line in the figures represents the simulated water surface elevation and the red line represents observed data from

48
the tide station. Specifically, the variation in neap and spring tide, storm response, and seasonal effect of the applied tidal constituent correction are well illustrated in these figures.
Figure 40: Comparison of Observed (red) and Simulated (blue) January Tide Elevations at Dauphin Island
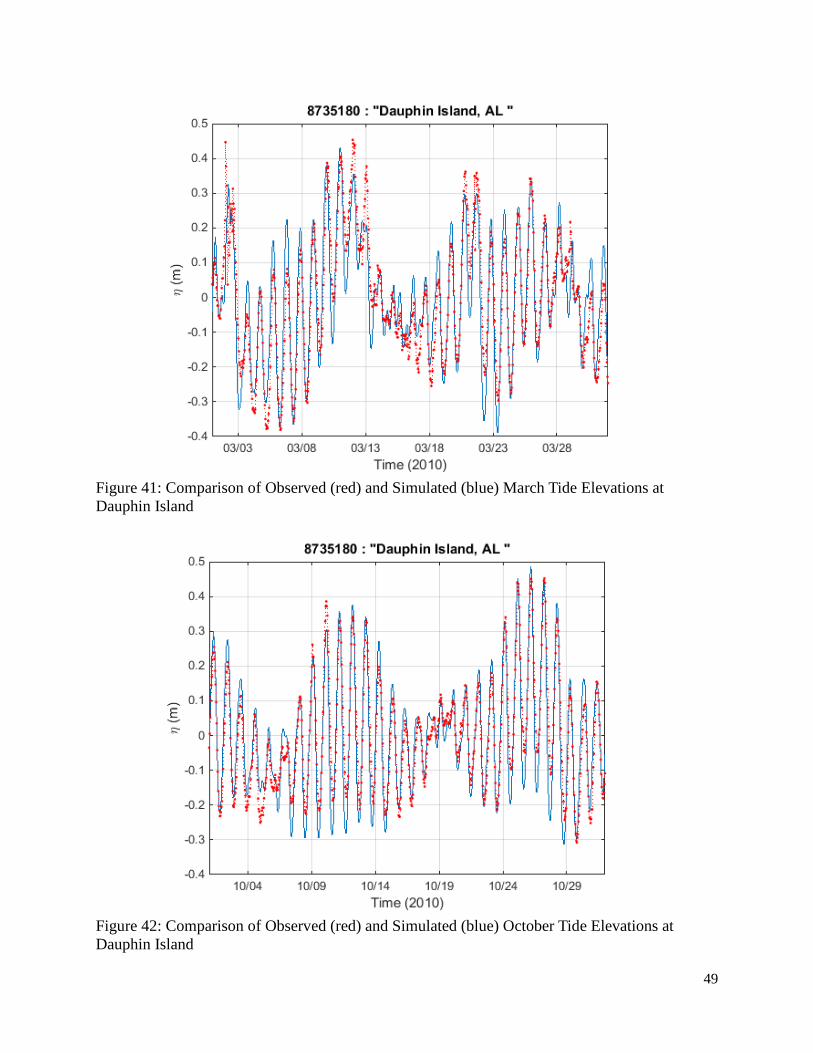
49
Figure 41: Comparison of Observed (red) and Simulated (blue) March Tide Elevations at Dauphin Island
Figure 42: Comparison of Observed (red) and Simulated (blue) October Tide Elevations at Dauphin Island

50
Figure 43: Comparison of Observed (red) and Simulated (blue) March Tide Elevations at Weeks Bay
Figure 44: Comparison of Observed (red) and Simulated (blue) October Tide Elevations at Coast Guard Sector Mobile
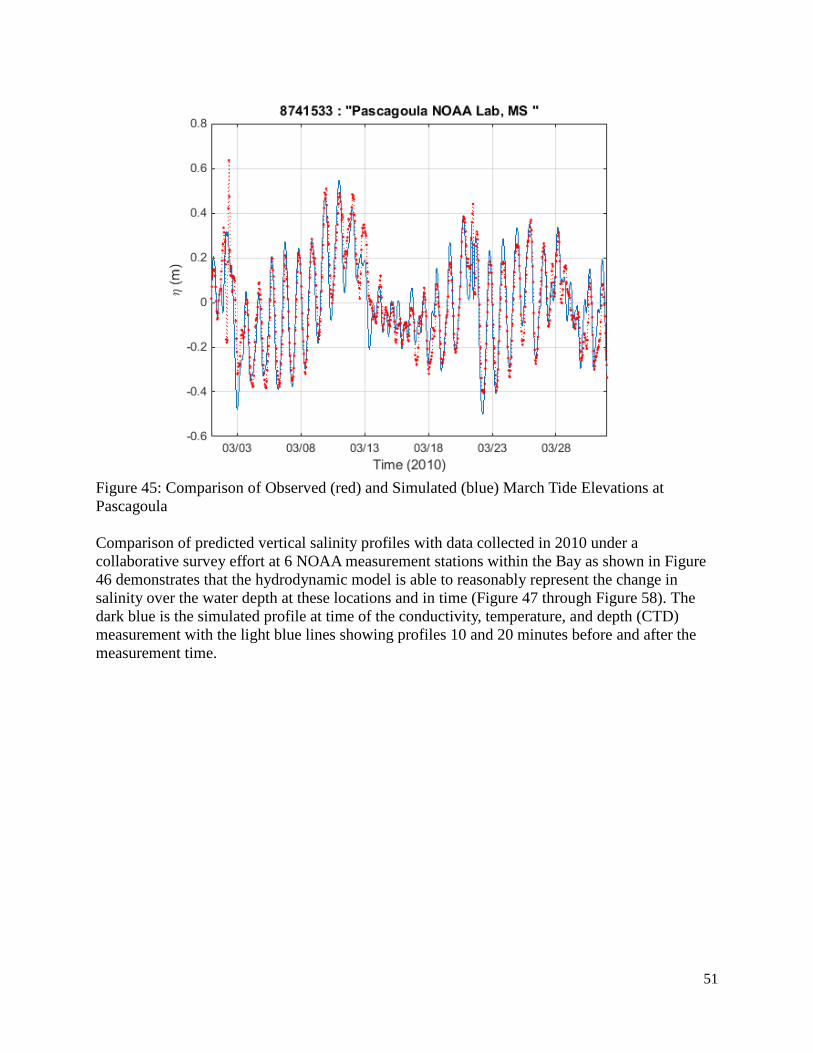
51
Figure 45: Comparison of Observed (red) and Simulated (blue) March Tide Elevations at Pascagoula Comparison of predicted vertical salinity profiles with data collected in 2010 under a collaborative survey effort at 6 NOAA measurement stations within the Bay as shown in Figure 46 demonstrates that the hydrodynamic model is able to reasonably represent the change in salinity over the water depth at these locations and in time (Figure 47 through Figure 58). The dark blue is the simulated profile at time of the conductivity, temperature, and depth (CTD) measurement with the light blue lines showing profiles 10 and 20 minutes before and after the measurement time.

52
Figure 46: Location of Salinity Measurement Stations
Figure 47: Comparison of Measured (red) and Simulated (blue) Salinities at Station DI on 28 May 2010
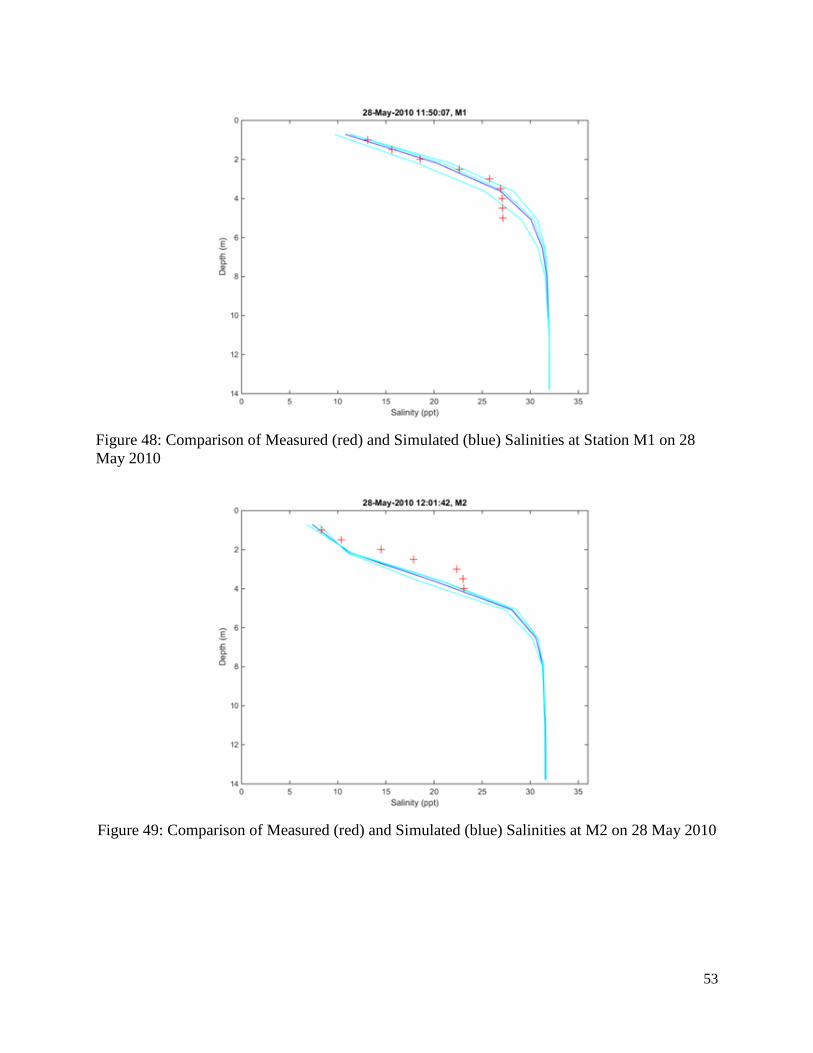
53
Figure 48: Comparison of Measured (red) and Simulated (blue) Salinities at Station M1 on 28 May 2010
Figure 49: Comparison of Measured (red) and Simulated (blue) Salinities at M2 on 28 May 2010
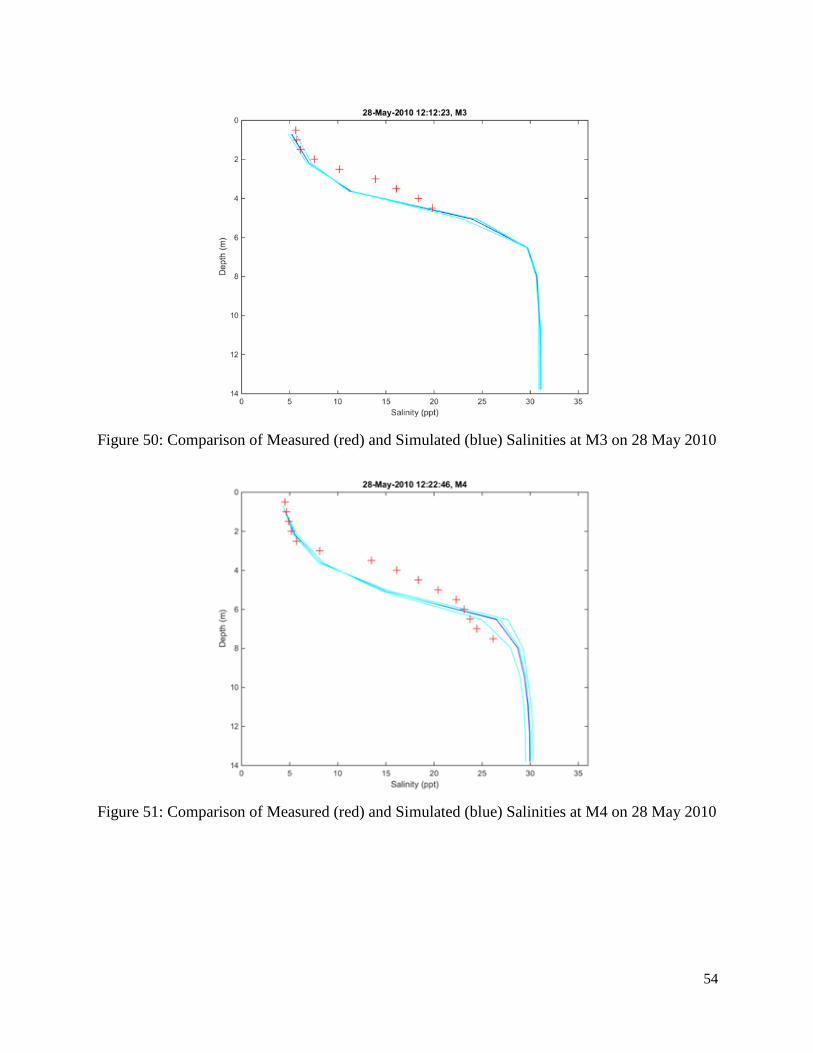
54
Figure 50: Comparison of Measured (red) and Simulated (blue) Salinities at M3 on 28 May 2010
Figure 51: Comparison of Measured (red) and Simulated (blue) Salinities at M4 on 28 May 2010
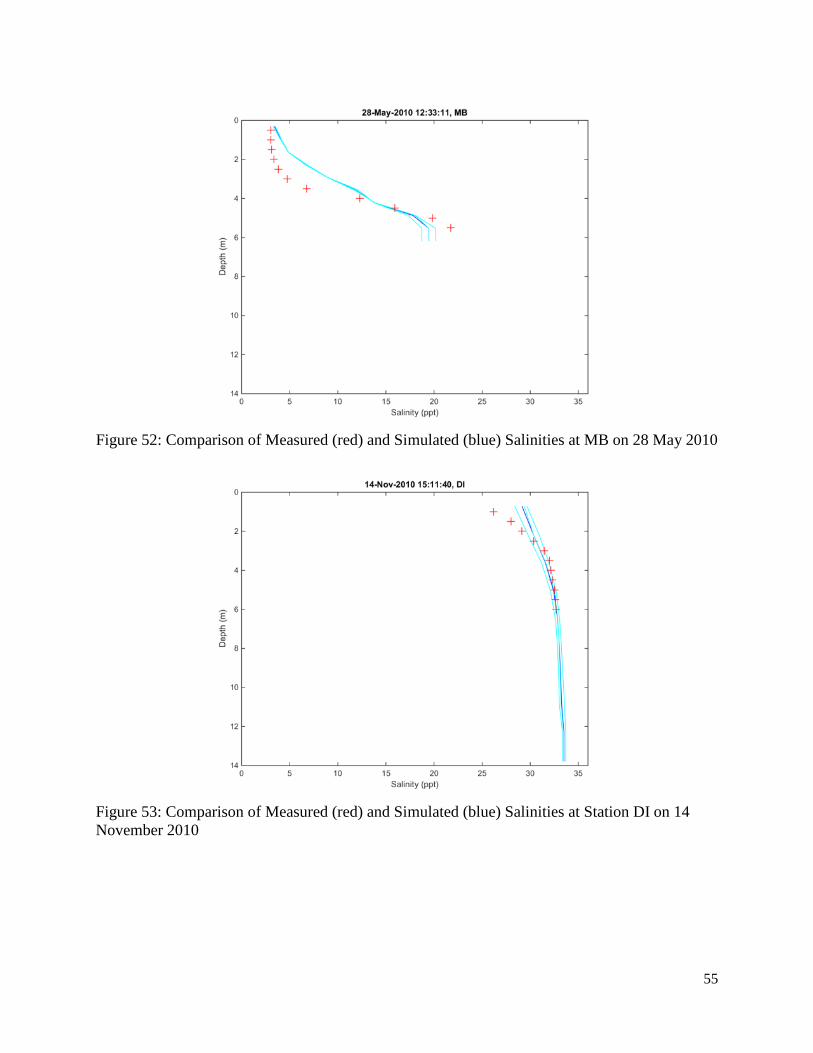
55
Figure 52: Comparison of Measured (red) and Simulated (blue) Salinities at MB on 28 May 2010
Figure 53: Comparison of Measured (red) and Simulated (blue) Salinities at Station DI on 14 November 2010

56
Figure 54: Comparison of Measured (red) and Simulated (blue) Salinities at Station M1 on 14 November 2010
Figure 55: Comparison of Measured (red) and Simulated (blue) Salinities at M2 on 14 November 2010
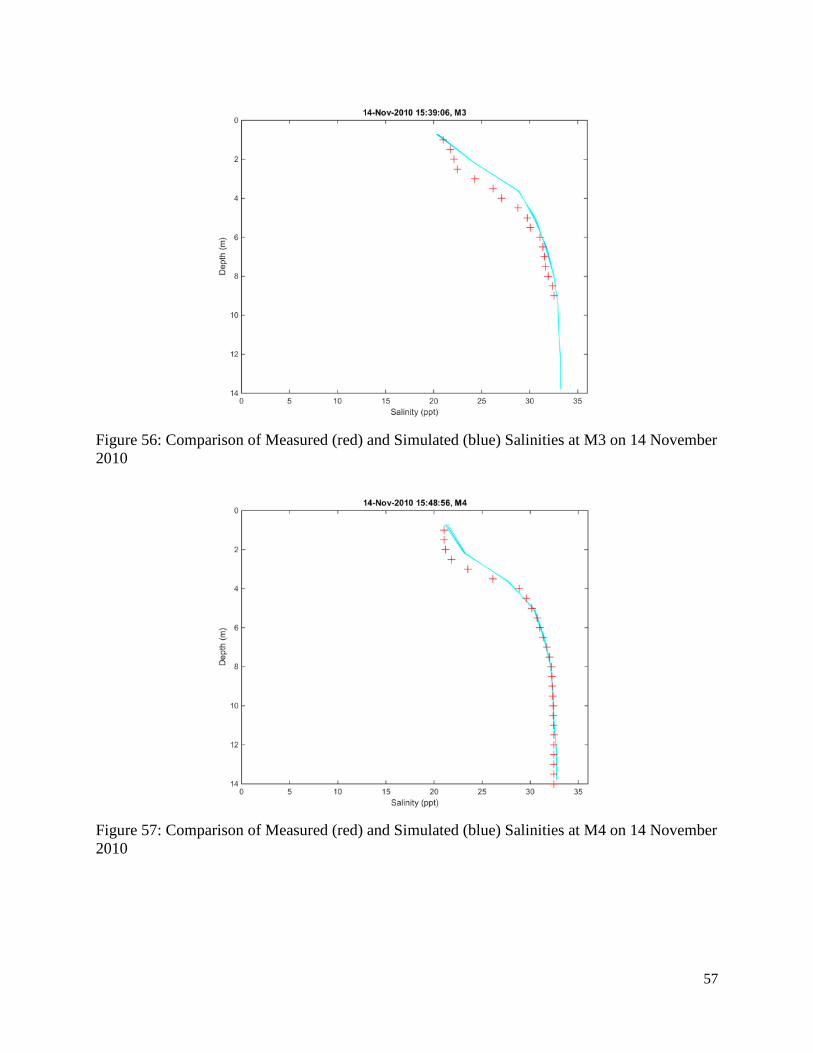
57
Figure 56: Comparison of Measured (red) and Simulated (blue) Salinities at M3 on 14 November 2010
Figure 57: Comparison of Measured (red) and Simulated (blue) Salinities at M4 on 14 November 2010

58
Figure 58: Comparison of Measured (red) and Simulated (blue) Salinities at MB on 14 November 2010 • Future Direction Calibration and validation of the models to time periods where there are observed data for the water quality constituents of concern will be conducted. Salinity and temperature variation will be compared to observed data to demonstrate self-consistency and reliability in both the hydrodynamic and water quality models. CE-QUAL-ICM results will be further compared and the agreement documented for relevant observed water quality parameter data from various state and federal agencies including those collected as part of Task 2.5. Adjustments will be made to model kinetic rates until an adequate calibration is obtained and sensitivity of the calibration to changes in key rates will be assessed to demonstrate calibration robustness. Once the models are validated, the tools will be used to investigate potential changes in water quality resulting from probable island conditions and potential management actions developed as part of Task 5.1 and Task 6. This data and analysis will be integrated into the feasibility report and stored in the database developed as part of Task 1.2, which will be made available for public use upon completion of this study.
3.5.4. Task 5.4 – Habitat Modeling
● Task Summary
The objective of the habitat modeling task is to create a habitat model that will be linked to the geomorphological model outputs (DEMs) and water quality model outputs (i.e., elevation data and inundation frequency data, etc.) to help quantify changes to habitats for proposed restoration alternatives. Additional objectives include the development of a list of important species found on Dauphin Island with an emphasis on species that were injured by the oil spill. Broad linkages

59
will be used to associate these species to the habitat types being modeled. The findings from Task 3.3 will support this habitat modeling task. ● Completed Efforts
Working with team members from Task 6.2, an initial draft focal species list was developed for the project through review of the Alabama State Wildlife Action Plan and internal project staff feedback (i.e., USACE and State of AL staff). Several webinars were held with faunal experts with the objective of soliciting feedback on the initial species list. The feedback was reviewed by team members from Task 6.2. A preliminary literature review on species linkages (e.g., shorebirds and sea turtles) was conducted. A preliminary literature review of existing habitat modeling efforts was also conducted in addition to a literature review focused on existing seagrass and oyster reef modeling efforts. Georeferenced historical imagery from 1997 was acquired to use as a hindcast for the modeling efforts. ● Ongoing Work
In coordination with staff from Task 6.2, the project draft focal species list was refined and additional work with experts to determine species linkages to modeled habitats was begun (Table 6). A historical habitat map will be developed using the historical imagery from 1997 and a topographic/bathymetric digital elevation model from 1998. ● Preliminary Results
Table 6 presents an initial draft project focal species list and compiled feedback from experts for refining the draft project species list. A workshop was held on September 19, 2016 with staff from Task 6.2 to begin the process of eliciting linkages to associate the draft project species list to habitats that are being modeled. ● Future Direction
Water quality outputs (e.g., salinity, suspended solid, dissolved inorganic nitrogen and phosphorus (DIN and DIP), chlorophyll-a, water depth, and variability of these water quality parameters) will be used in developing simple habitat suitability index (HSI) models for seagrass and oyster reef habitats. Figure 59 shows a workflow for the habitat modeling effort for modeled habitats (i.e., all habitats besides seagrass and oyster reef). The results from the Habitat Mapping task (Task 3.3) will be used to develop a model for predicting habitats based on simple relationships between landscape position (i.e., elevation, slope, distance from shoreline, wave energy). The habitat model will be used to hindcast habitats for 1998 using a DEM. This hindcast will allow for validation of the habitat model. The habitat model will then be used to predict habitats for future outputs from the hydrodynamic and morphological change outputs. Lastly, the habitat model outputs will be linked to species using information from expert elicitations.
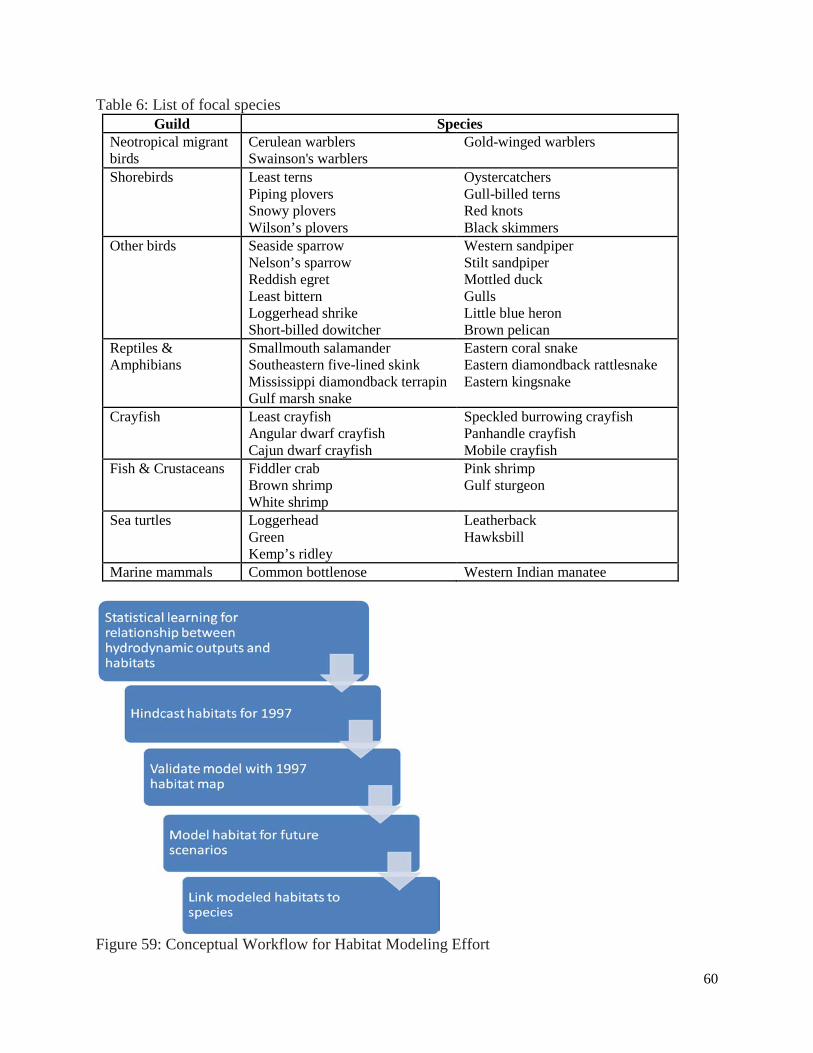
60
Table 6: List of focal species Guild Species
Neotropical migrant birds
Cerulean warblers Swainson's warblers
Gold-winged warblers
Shorebirds Least terns Piping plovers Snowy plovers Wilson’s plovers
Oystercatchers Gull-billed terns Red knots Black skimmers
Other birds Seaside sparrow Nelson’s sparrow Reddish egret Least bittern Loggerhead shrike Short-billed dowitcher
Western sandpiper Stilt sandpiper Mottled duck Gulls Little blue heron Brown pelican
Reptiles & Amphibians
Smallmouth salamander Southeastern five-lined skink Mississippi diamondback terrapin Gulf marsh snake
Eastern coral snake Eastern diamondback rattlesnake Eastern kingsnake
Crayfish Least crayfish Angular dwarf crayfish Cajun dwarf crayfish
Speckled burrowing crayfish Panhandle crayfish Mobile crayfish
Fish & Crustaceans Fiddler crab Brown shrimp White shrimp
Pink shrimp Gulf sturgeon
Sea turtles Loggerhead Green Kemp’s ridley
Leatherback Hawksbill
Marine mammals Common bottlenose Western Indian manatee
Figure 59: Conceptual Workflow for Habitat Modeling Effort
61
3.6. Task 6 – Alternative Evaluations
The goal of the Barrier Island Restoration Assessment study is to investigate viable options for the restoration of Dauphin Island as a sustainable barrier island to protect and restore island resources, including habitat and living coastal and marine resources, as well as protect the coastal resources of the Mississippi Sound/Mobile Bay and the southern portion of Mobile County including the expansive Heron Bay wetlands. Restoration alternatives to achieve this goal will be formulated based on science and technical expertise and evaluated using the suite of tools and products developed as part of this study (i.e. Tasks 1 – 5 and Task 6.2). Details on the alternative formulation and evaluation process and the assessment tool that will be utilized to determine how well each option meets restoration objectives are provided in the following sections.
3.6.1. Task 6.1 – Alternative Formulation and Evaluation ● Task Summary The Alternative Formulation and Evaluation task consists of two basic components. The first (Task 6.1a) is the identification of viable alternatives/projects that could be implemented in the short-term without needing detailed analysis to meet restoration objectives of NFWF and State of Alabama (these are called Interim Projects for the purposes of this report). This effort was led by the USACE through close coordination with the State and supported by the USGS and a panel of eight individuals (known as the Evaluation Support Panel) with firsthand knowledge of Dauphin Island and its resources. The second (Task 6.1b) is to identify longer-term, more comprehensive restoration alternatives that will be formulated using the results of this study and technical expertise and evaluated using study model results and the alternative assessment tool developed as part of Task 6.2. Potential types of alternatives that could be formulated and evaluated as part of this task include options to beneficially use dredged material for habitat restoration and/or preservation; island beach, platform, and dune restoration; acquisition of critical habitats; and the establishment of wetland and seagrass areas. Ultimately, the results of this task, using supporting information derived from Task 6.2, will identify how well each of the alternatives meet the fundamental objectives of the restoration, including a quantitative description of natural resource benefits, sustainability of the action over a 50-year planning horizon, costs to implement and maintain the action, and social acceptability. ● Completed Efforts Task 6.1a is complete and the evaluation process utilized to identify the Interim Projects is documented in Section 4 of this report. The potential Interim Projects were derived from publically available sources and information provided directly by project proponents. Detailed descriptions of the potential projects as evaluated are provided in Appendix A. Task 6.1b has not fully begun, but it will be critical in the ultimate identification and evaluation of viable alternatives that increase the long-term resiliency of the natural resources of Dauphin Island and the surrounding areas.

62
● Preliminary Results
A total of 27 potential Interim Projects were identified from a variety of publicly available sources and through coordination with state and federal resource agencies for evaluation by the USACE, State of Alabama, and an Evaluation Support Panel. The projects were evaluated using criteria developed by the USACE and State of Alabama and ultimately divided into three groups depending on how well they met the criteria. Group 1 projects are those that were determined to support the long term resiliency of the island and could be implemented in the short-term without needing additional environmental and/or engineering analyses to further quantify their benefits (i.e., their benefits were evident to the panel). Group 2 projects are those that appear to support the long term ecological resiliency of the island but need additional detailed engineering and/or environmental analyses to quantify, with more certainty, the benefits they would provide. Group 3 projects are those that, while they may be beneficial to the island from an economic or recreational standpoint, cannot be further informed by the tools being developed for this particular study as they are outside the environmental restoration scope of this effort. A detailed discussion of the projects, evaluation process, role of the Evaluation Support Panel, and outcome is provided in Section 4.
● Future Direction
The Group 1 Interim Projects, as documented in Section 4, were determined beneficial to the long-term resiliency of Dauphin Island and could likely be ready for implementation in less than one year should funding by an interested stakeholder (e.g., NFWF, NRDA, Federal RESTORE, Alabama RESTORE, or others) be available. Group 2 projects, along with other potential longer-term, more comprehensive restoration scenarios/alternatives evolving from this study or other efforts, will be further investigated as part of Task 6.1b. Group 3 projects will not be further investigated as part of this comprehensive study. The alternative formulation and evaluation process (i.e., Task 6.1b), including a comprehensive discussion of the benefits, impacts, and costs of each potential restoration action, will be documented in the Final Comprehensive Report and available for use by the State, NFWF, local governments, and other interested stakeholders in future decision-making.
3.6.2. Task 6.2 – Alternative Assessment Tool Development
● Task Summary
This task will quantify the consequences of each restoration scenario developed in Task 6.1 relative to natural resource benefits, the likelihood of project success, and the impact to coastal protection, as well as other objectives that will be elicited from subject-matter experts. A spatially explicit tool will be developed to evaluate trade-offs among developed alternatives as related to overall project goals (e.g., habitat for at-risk populations, probability of persistence of migratory birds, protection of wetlands). This tool will be used to inform decision-making and will also be useful to identify key uncertainties associated with alternative restoration actions. The formal analysis will identify the best set of alternatives that meet the fundamental objectives of the restoration. This task will also include convening a group of technical experts to help
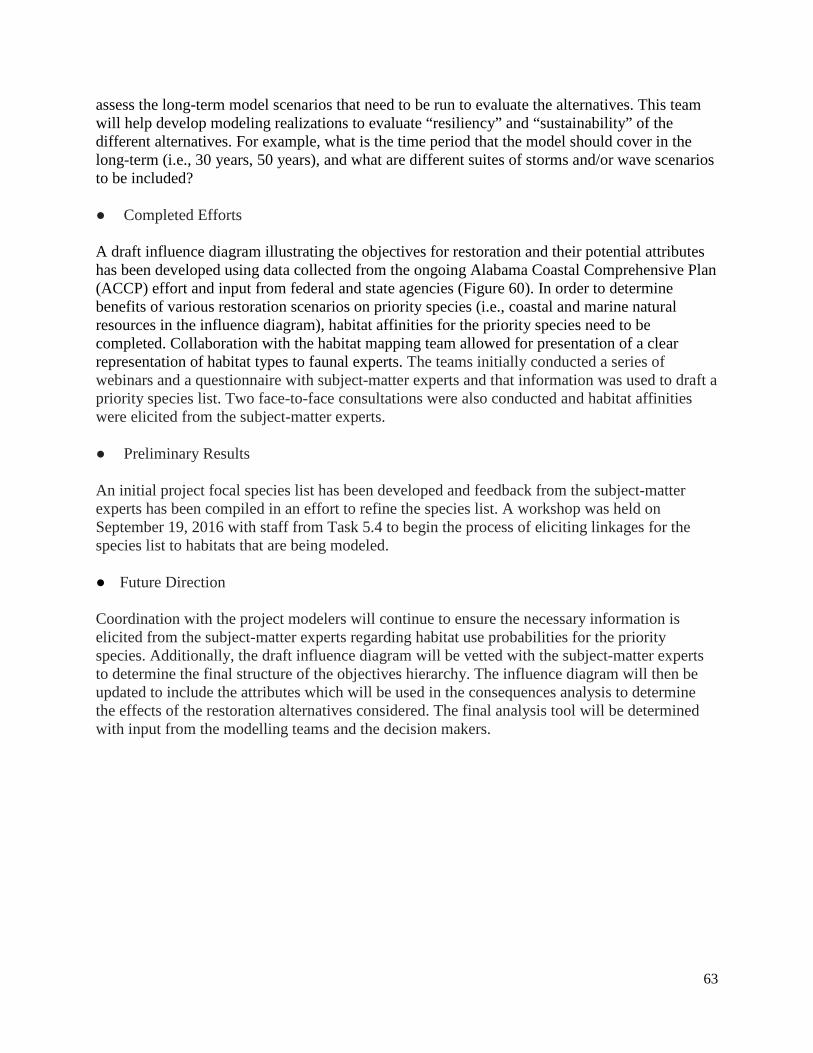
63
assess the long-term model scenarios that need to be run to evaluate the alternatives. This team will help develop modeling realizations to evaluate “resiliency” and “sustainability” of the different alternatives. For example, what is the time period that the model should cover in the long-term (i.e., 30 years, 50 years), and what are different suites of storms and/or wave scenarios to be included? ● Completed Efforts
A draft influence diagram illustrating the objectives for restoration and their potential attributes has been developed using data collected from the ongoing Alabama Coastal Comprehensive Plan (ACCP) effort and input from federal and state agencies (Figure 60). In order to determine benefits of various restoration scenarios on priority species (i.e., coastal and marine natural resources in the influence diagram), habitat affinities for the priority species need to be completed. Collaboration with the habitat mapping team allowed for presentation of a clear representation of habitat types to faunal experts. The teams initially conducted a series of webinars and a questionnaire with subject-matter experts and that information was used to draft a priority species list. Two face-to-face consultations were also conducted and habitat affinities were elicited from the subject-matter experts. ● Preliminary Results
An initial project focal species list has been developed and feedback from the subject-matter experts has been compiled in an effort to refine the species list. A workshop was held on September 19, 2016 with staff from Task 5.4 to begin the process of eliciting linkages for the species list to habitats that are being modeled. ● Future Direction Coordination with the project modelers will continue to ensure the necessary information is elicited from the subject-matter experts regarding habitat use probabilities for the priority species. Additionally, the draft influence diagram will be vetted with the subject-matter experts to determine the final structure of the objectives hierarchy. The influence diagram will then be updated to include the attributes which will be used in the consequences analysis to determine the effects of the restoration alternatives considered. The final analysis tool will be determined with input from the modelling teams and the decision makers.
64
Figure 60: Draft influence diagram illustrating the linkage among higher level objectives and lower level attributes
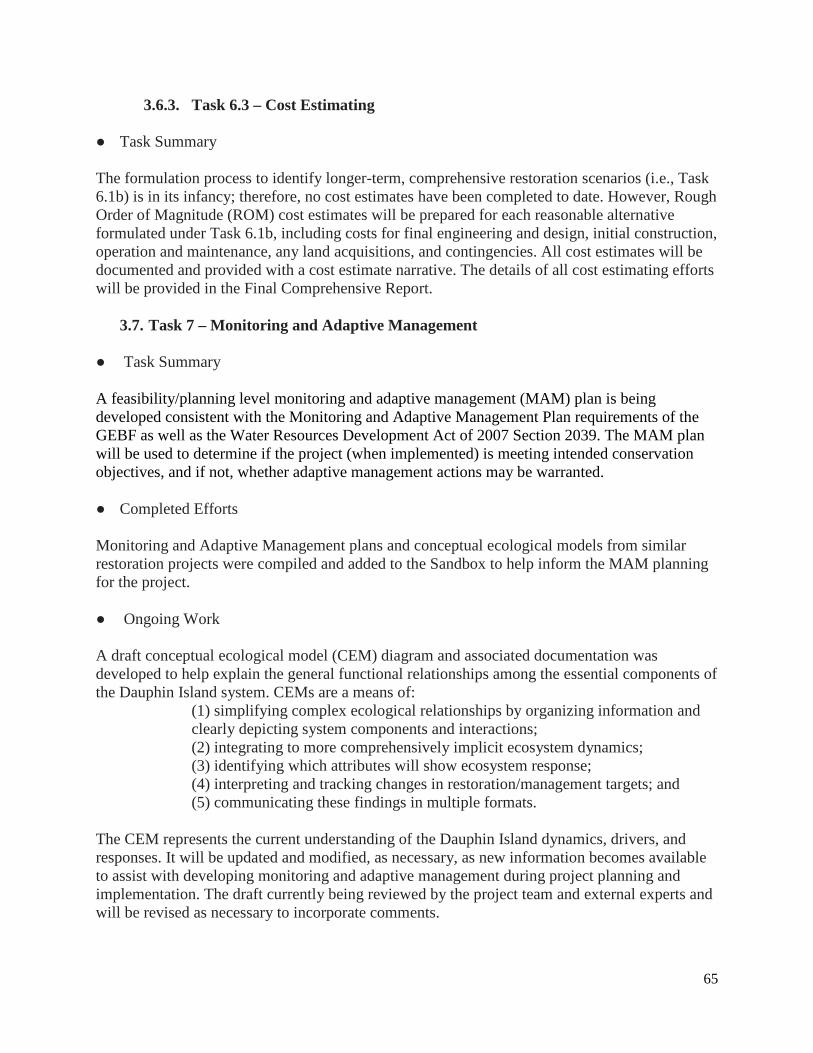
65
3.6.3. Task 6.3 – Cost Estimating ● Task Summary The formulation process to identify longer-term, comprehensive restoration scenarios (i.e., Task 6.1b) is in its infancy; therefore, no cost estimates have been completed to date. However, Rough Order of Magnitude (ROM) cost estimates will be prepared for each reasonable alternative formulated under Task 6.1b, including costs for final engineering and design, initial construction, operation and maintenance, any land acquisitions, and contingencies. All cost estimates will be documented and provided with a cost estimate narrative. The details of all cost estimating efforts will be provided in the Final Comprehensive Report.
3.7. Task 7 – Monitoring and Adaptive Management ● Task Summary A feasibility/planning level monitoring and adaptive management (MAM) plan is being developed consistent with the Monitoring and Adaptive Management Plan requirements of the GEBF as well as the Water Resources Development Act of 2007 Section 2039. The MAM plan will be used to determine if the project (when implemented) is meeting intended conservation objectives, and if not, whether adaptive management actions may be warranted. ● Completed Efforts
Monitoring and Adaptive Management plans and conceptual ecological models from similar restoration projects were compiled and added to the Sandbox to help inform the MAM planning for the project.
● Ongoing Work A draft conceptual ecological model (CEM) diagram and associated documentation was developed to help explain the general functional relationships among the essential components of the Dauphin Island system. CEMs are a means of:
(1) simplifying complex ecological relationships by organizing information and clearly depicting system components and interactions; (2) integrating to more comprehensively implicit ecosystem dynamics; (3) identifying which attributes will show ecosystem response; (4) interpreting and tracking changes in restoration/management targets; and (5) communicating these findings in multiple formats.
The CEM represents the current understanding of the Dauphin Island dynamics, drivers, and responses. It will be updated and modified, as necessary, as new information becomes available to assist with developing monitoring and adaptive management during project planning and implementation. The draft currently being reviewed by the project team and external experts and will be revised as necessary to incorporate comments.

66
● Preliminary Results The draft CEM diagram is shown in Figure 61.
67
Figure 61: Draft Conceptual Ecological Model for the Alabama Barrier Island Restoration Assessment project at Dauphin Island

68
● Future Direction Utilizing the information obtained from the CEM in conjunction with the data and modeling performed during the feasibility study, a Monitoring and Adaptive Management (MAM) Plan will be developed to outline monitoring data to be collected before, during, and after project construction to measure project performance and inform adaptive management. The MAM plan will be submitted as an appendix to the Final Comprehensive Report. The MAM Plan will describe:
• the specific and measurable indicators and parameters of performance measures that will be monitored
• appropriate, feasible, cost-effective, accurate, and reliable methods to collect the monitoring data
• the location (where), timeframe and frequency of monitoring data collection • identification of key uncertainties • a specific data management plan for data storage, processing and analysis • data QA/QC plan • a data synthesis, assessment, and adaptive management decision process
4. Interim Project Evaluations
One intention of this report is to identify potentially viable restoration alternatives that could be implemented in the short-term (known as Interim Projects), without the benefit of detailed environmental or engineering analyses and/or completion of all applicable Tasks of the Study. These projects would add to the value of the resources of Dauphin Island and adjacent waters while, at the same time, not preclude or adversely impact subsequent activities to be evaluated in the Final Comprehensive Report (i.e., as part of Task 6.1b). Ultimately, a total of 27 project proposals were identified from a variety of publicly available sources in coordination with state and federal resource agencies to potentially meet this intention. These project proposals were then evaluated by the USACE and a panel of individuals from state and local agencies (known as the Evaluation Support Panel) with firsthand knowledge of Dauphin Island and its resources. A listing of the sources of information for the potential Interim Projects is shown below along with the agencies represented on the Evaluation Support Panel (Panel). The locations, names, and a brief description of the 27 projects, including the project types, benefits, and costs (as estimated by project proponents) are shown in Figure 62. The specific project details, as provided to the group for evaluation, are included in Appendix A. Sources of Information for Potential Interim Projects:
• Alabama Coastal Restoration Portal (http://alabamacoastalrestoration.org/ProjectPrint.aspx)
• Public focus group meeting recommendations from the Alabama Coastal Comprehensive Plan (http://www.sam.usace.army.mil/Missions/Program-and-Project-Management/Alabama-Coastal-Comprehensive-Plan/ACCP-Interactive-Map/)
• Mobile Bay Regional Sediment Management Interagency Working Group (includes agencies such as the USACE, U.S. Fish & Wildlife Service, NOAA National Marine
69
Fisheries Service, Alabama Department of Conservation and Natural Resources, Environmental Protection Agency, and Alabama Department of Environmental Management).
• Dauphin Island Sea Lab • Alabama Department of Conservation and Natural Resources • Dauphin Island Water and Sewer Authority
Agencies Represented on the Evaluation Support Panel:
• Alabama Department of Conservation and Natural Resources, Marine Resources Division • Alabama Geological Survey • Dauphin Island Sea Lab • Dauphin Island Water and Sewer Authority • Mobile County Public Works Department • Mobile Bay National Estuary Program • Mississippi-Alabama Sea Grant • Town of Dauphin Island (Mayor’s Office)

70
Figure 62: Potential Interim Projects Considered by the USACE, State of Alabama, and Evaluation Support Panel
71
The criteria for evaluating the potential Interim Projects was developed collaboratively by the USACE and the State of Alabama. Six criteria were initially identified and are as follows:
• Criteria 1 – If funds are available, can the project be ready for implementation (i.e., designed and permitted) in less than one year?
• Criteria 2 – Are there potentially significant environmental impacts from the proposed action that require an Environmental Impact Statement (EIS)?
• Criteria 3 – Will implementation of the project require detailed engineering analysis to support the level of environmental effects and/or design?
• Criteria 4 – Is the project publicly supported? • Criteria 5 – Is the project beneficial to the long term resiliency of Dauphin Island with
respect to the NFWF priority natural resources of concern (http://www.nfwf.org/gulf/Pages/fundingpriorities.aspx) and values identified in the MBNEP's CCMP (http://www.mobilebaynep.com/the_values)?
• Criteria 6 – Would implementation of the project preclude future restoration efforts? Each project was evaluated by the Panel using the six criteria with simple yes, no, or unknown responses. The projects with the most positive outcome responses (e.g., “yes” indicates a positive outcome for Criteria 1, 4, and 5 while “no” indicates a positive outcome response for Criteria 2, 3, and 6) scored the highest, and the ones with the fewest scored the lowest. In theory, the ones with the highest positive outcome scores represent the projects most closely meeting the criteria of a potential Interim Project. All criteria were weighted equally for this exercise. The initial round of evaluations resulted in primarily land acquisition projects emerging as having most closely met all of the criteria. However, there were moderate levels of uncertainty in the responses for all criteria. Per feedback from the Panel, this uncertainty was due to factors such as insufficient detail/supporting information on the benefits and/or cost of a project and/or lack of knowledge by some panel members with respect to level of public support and level of permitting and/or engineering analysis that may be required. A major concern of the Panel was the use of public support as a criteria based on the limited information available in the proposals and a reluctance of the Panel members to fully predict the sentiments of the public prior to further work being completed as part of the Dauphin Island Watershed Management Planning process. For this reason, Criteria 4 was removed as an element of the evaluation exercise reflected in this Interim Report. As a result of these uncertainties and, as noted above, the emergence of the land acquisition project type, the USACE engaged the Panel for a second round of evaluations using some of the most relevant/applicable State of Alabama’s Forever Wild Land Trust – Nature Preserve Site Rating Criteria to gain a better understanding of the type and level of potential benefits, particularly for the land acquisition projects. The Forever Wild (FW) Criteria used in the second round of evaluations are shown below.
• FW Criteria A – To what extent does the project enhance, protect, or preserve significant natural communities?
• FW Criteria B – To what extent does the project enhance, protect, or preserve rare and/or threatened & endangered (T&E) species?

72
• FW Criteria C – To what extent is the project suspect to site disturbance from human activities and non-native plant and animal species?
• FW Criteria D – To what extent is the project susceptible to adjacent land use/encroachment influence?
• FW Criteria E – To what extent does the project increase the aquatic habitat value for those organisms found in it?
• FW Criteria F – To what extent are there available alternative projects and/or project sites on Dauphin Island that could be utilized to achieve the same ecological project benefits?
• FW Criteria G – What is the probability of development at the project site in the future that would preclude benefits?
Note: The “Forever Wild Criteria” are the same criteria that the state of Alabama established for the Forever Wild Land Trust program which utilizes separate criteria for the evaluation of a tract’s potential to meet program eligibility under one or more of four categories including Nature Preserves, Recreation Areas, Wildlife Management Areas, and State Parks. Similar to the first round of evaluations (i.e., for Criteria 1 – 6), all 27 projects were evaluated using high, medium, low, or unknown responses. The projects with the most positive outcome responses (e.g., “high” indicates a positive response for FW Criteria A, “low” indicates a positive response for FW Criteria C, etc.) scored the highest and the ones with the fewest scored the lowest. These responses were then assigned scores of 0 – 1 (“0” for the negative and unknown responses, “0.5” for the medium responses, and “1” for the positive responses), summarized, and averaged for each project. The results of this evaluation provided valuable insight into the confidence the Panel had in the potential cumulative benefits of the projects, given the level of information known about the various project proposals at that time. Upon completion of the two rounds of evaluation by the Panel, the projects were categorized into three groups. A suite of 10 projects with varying scopes (e.g., land acquisitions, dune restoration, controlled burns/invasive species management, stormwater drainage system improvements, wastewater collection system and treatment plant upgrades, and data collection efforts) were identified as “Group 1” projects, meaning they most strongly met the evaluation criteria and are considered possible “Interim Projects”. Six of these projects (primarily land acquisitions) scored above a 0.5 with respect to the FW Criteria, indicating a higher level of confidence/certainty (i.e., there were more positive than negative responses from the panel) in the ecosystem benefits they would provide, without having to conduct additional detailed analysis. Due to their project type, four of the projects (i.e., the wastewater collection system upgrades, wastewater treatment plant upgrades, stormwater drainage system improvements, and the data collection efforts) scored less than 0.5 because the benefits they would provide were not directly informed by the FW Criteria, particularly Criteria A – D. However, they were still deemed suitable for Group 1 because their benefits were evident to the Panel, USACE, and the State without needing additional detailed analysis to confirm. For example, projects to improve the quality of the wastewater treatment plant effluent, reduce leakage/loss in the wastewater collection system, improve the stormwater management and treatment system, and collect additional data for future scientific uses were viewed as “beneficial” without needing a detailed study for justification.

73
Of the 27 projects considered, 14 were determined to fit the classification of a Group 2 project. Based on feedback from the Panel, some of these projects appear to potentially be beneficial to the long term ecological resiliency of the island, but they need additional detailed engineering and/or environmental analyses to quantify, with more certainty, the benefits they would provide. Others in this group, specifically the acquisition projects, were thought by the Panel to either be too fragmented to substantially provide a benefit to the ecosystem, or they were thought potentially to already be currently serving in their highest ecological capacity. All of these projects are prime candidates for further evaluation as part of Task 6.1b of this study. Finally, the remaining three projects were determined to be within Group 3. These projects, while they may be beneficial to the island from an economic or recreational standpoint, cannot be further informed by the tools being developed for this particular study as they are outside the environmental restoration scope of this effort. The listing of the Group 1 – 3 projects are shown in Table 7.

74
Table 7. Interim Project Evaluation Results
Project ID Project Name Group 3 Mid-Island Land Acquisition and Management - Phase 1
1
5 Dauphin Island Audubon Bird Sanctuary Shoreline Restoration & Management
6 Dauphin Island Audubon Bird Sanctuary Shoreline Restoration & Management
11 Stormwater Quality Rehabilitation Project 12 Aloe Bay/Mississippi Sound Water Quality Enhancement Project -
Phase 1 14 Dauphin Island Wastewater Collection System Rehabilitation 18 Tupelo Gum Swamp Land Acquisition 19 Gorgas Swamp Land Acquisition 20 Steiner Property Acquisition 23 Dauphin Island Management Support System 1 Dauphin Island Public Beach and Dune Restoration
2
2 West End Beach and Dune Restoration 7 Little Dauphin Island Nearshore Placement 8 Improved Bypassing of Beach Sands Dredged from the Mobile Ship
Channel 9 Aloe Bay Beneficial Use Restoration 10 Fill Borrow Pits Dug in 2010 to Protect Against Oil Spill Damage 13 Aloe Bay/Mississippi Sound Water Quality Enhancement Project -
Phase 2 17 West End Land Acquisition 21 US Coast Guard Property Disposal / Acquisition 22a Dauphin Island 39 Parcel Property Acquisition – West End 22b Dauphin Island 39 Parcel Property Acquisition – Graveline Bay 22c Dauphin Island 39 Parcel Property Acquisition – Aloe Bay 22d Dauphin Island 39 Parcel Property Acquisition – Little Dauphin Island
and Bay 22e Dauphin Island 39 Parcel Property Acquisition – East End 4 Mid-Island Land Acquisition and Management - Phase 2
3 15 Dauphin Island Water Supply Aquifer Improvements 16 Dauphin Island Water Supply Elevated Storage Tank
Brief summaries of the project scopes, benefits, and costs for each of the Group 1 – 3 Interim Projects are shown in the following sections, including habitat type descriptions derived from the preliminarily results of the Habitat Mapping effort (Task 3.3) and real estate costs computed by USACE staff for the potential land acquisitions. Recent market sales, and appraisal data were used to estimate dollar amounts that could be anticipated when purchasing the land within each project. The dollar amounts shown are for the purpose of this study only and do not represent the actual values that would be derived by certified fair market appraisals. Costs for the other project types were taken directly from the publically available information on the project proposals, as submitted by the project proponents. Additional information, including the project
75
summaries/details used for the evaluation process and links to the sources of information for the proposals, is shown in Appendix A.
4.1. Group 1 Interim Projects
4.1.1. Mid-Island Land Acquisition and Management – Phase 1 (Project ID #3)
Implementation of this project would provide for the acquisition and conservation of 10 acres of undeveloped beach and dune habitat located west of the public fishing pier and the provision of enhanced controlled public access. This project will restore and conserve island beach and dune habitat located on the south side of the island consisting primarily of sparsely vegetated barrier flat, scrub/shrub and dune habitats. This property will benefit both resident and migratory avian species and serve as a critical wintering area. It is just due east of designated critical habitat for Piping Plover. Specifically, the Gulf front property is located south of Bienville Boulevard between the condos located on the east side of the property and Ponce De Leon Court on the west. This acreage is some of the last remaining beach habitat in this area of the island and is vulnerable to disturbance and/or development. The management goal for the Gulf front property is to preserve, protect, and increase the natural habitat and their ecosystem functions. The estimated Land Acquisition Cost, as determined by USACE real estate staff, is approximately $2.5 million.
4.1.2. Dauphin Island Audubon Bird Sanctuary Shoreline Restoration and Management (Project ID #5 and #6)
Implementation of this project would provide for habitat restoration, management, and increased controlled public access in the Audubon Bird Sanctuary, a 164-acre facility located on the south eastern end of the Island. This project would restore and enhance maritime forest, freshwater lake, marsh, and dune habitat for the benefit of numerous bird and animal species that utilize the area as well as improve public access and ecotourism value of the area. Management of the property will focus on sustainability projects like dune planting, shoreline monitoring, and educational signage (Project ID #5) and controlled burns, brush clearing, native vegetation monitoring, and invasive species removal (Project ID #6) to enhance the existing wildlife habitat and the public’s birding experience. The bird sanctuary is of vital importance because it is the largest segment of protected forest habitat on Dauphin Island and the first landfall for neo-tropical migrant birds after their long flight across the Gulf of Mexico from Central and South America each spring. The Sanctuary has been recognized by the American Bird Conservancy and the National Audubon Society as being "Globally Important" for bird migrations. The estimated Implementation Cost is $538,700 (ID #5 = $137,500; ID #6 = $401,200), Monitoring Cost is $770,300 (ID #5 = $308,150; ID #6 = $462,150), and Maintenance/Operational Cost is $216,000 (ID #5 = $0; ID #6 = $216,000). These costs were provided by the proponent of the original project proposal.
4.1.3. Stormwater Quality Rehabilitation Project (Project ID #11) Implementation of this project would improve the quality of the stormwater runoff that currently flows into the Mississippi Sound from the island. This will be accomplished by reducing the

76
level of pollutants flowing into the Sound from Dauphin Island, enhancing the quality of the stormwater outflow, reducing sediment and litter transport into the Sound, reducing overall stormwater discharge into the Sound, and improving the natural habitat on the north side of the Island. The overall majority of the stormwater runoff produced by the Town of Dauphin Island discharges directly into the Mississippi Sound carrying pollutants, sediment, litter, etc. damaging the overall water quality of the Sound and the surrounding coastal areas. The shallow coastal waters, coastline, saltwater marshes, and associated wetland habitats in and around the Mississippi Sound on the north side of Dauphin Island provide native and nursery habitat for numerous aquatic and avian species. The main goal of this project is to improve the native habitat along the north side of the island. Achieving this goal will be accomplished by making necessary repairs and improvements to the existing stormwater drainage facilities, including, but not limited to, grading and stabilization measures, updating and improving existing infrastructure, rerouting stormwater to centralized wetland treatment areas, and retention/detention areas. This project is expected to benefit the overall coastal ecosystem and greatly benefit habitat that will enhance the growth and repopulation of impacted species from the DWH Oil Spill such as shrimp, fish, crab, oysters, sea grasses, and a variety of wading and shorebirds. The project is divided into four phases: Phase 1 – Initial planning and development of the scope of work; Phase 2 – Develop the design and environmental permitting, establish costs, and prepare construction bid documents; Phase 3 – Construction of the project; and Phase 4 – Ongoing maintenance and monitoring of the constructed activities. The estimated cost for Phase 1, as provided by the proponent of the original proposal, is $500,000. Phase 2, 3 and 4 costs are unknown at this time.
4.1.4. Aloe Bay/Mississippi Sound Water Quality Enhancement Project – Phase 1 (Project ID #12)
Implementation of this project would improve the operation, capacity, and wastewater treatment process of the Dauphin Island sewage treatment plant. The project would also reduce the level of pollutants flowing into the Mississippi Sound and Aloe Bay, enhance the quality of the sewage treatment plant outflow, and improve the natural habitat within Aloe Bay and surrounding area. These improvements will reduce potential or actual impacts on receiving water quality, the general health of the Island's surrounding waters, shellfish harvesting, fishery management, tourism, commercial enterprises, recreational use, and local and regional economic values. The Dauphin Island Water and Sewer Authority (DIWSA) plans to upgrade treatment processes and techniques, including those practices that directly affect the quality of the wastewater plant discharge into Aloe Bay. Major components of this project include: 1) Secondary Filtration and Disinfection Upgrades - The project will improve the treatment plant's filtration and disinfection capabilities to provide higher levels of contaminant removal and virus and bacteria deactivation; 2) Improve Biological Nutrient Removal - The project will improve the treatment plant's ability to biologically remove nutrients thereby reducing nutrient loading to Aloe Bay; 3) Mechanical upgrades - The project would provide upgrades to mechanical equipment to increase the

77
reliability of the treatment process; 4) Computer monitoring system improvements - Improved facility monitoring and communication will include remote alarms to notify operators of mechanical failures and help to prevent overflow events; 5) Structural improvements - Existing tanks and adjacent structures are in need of rehabilitation or replacement to provide reliability and to increase service life; and 6) Improved Solids Handling - The project will upgrade the facilities solids handling system to support the enhanced nutrient removal upgrades. The estimated Implementation Cost is $10,000,000 and the Maintenance/Operational Cost is $50,000 per year. The updated costs for this project were provided by the proponent of the original proposal.
4.1.5. Dauphin Island Wastewater Collection System Rehabilitation (Project ID #14)
Implementation of this project would upgrade the Dauphin Island sewer system by: 1) rehabilitating sewer lines and manholes; 2) installing emergency generators at sewer pump systems; 3) rehabilitating main sewer pump stations; and 4) providing remote monitoring capabilities for key pump stations. This project would greatly improve and enhance the collection, transport, and treatment of the Island’s wastewater, improve water quality, reduce sewage pipe leakage, and prevent unplanned sewer discharges into the Island’s waterways and groundwater. This project proposes the following major improvements to the Dauphin Island sewer collection system:
• Rehabilitate approximately 10,000 feet of gravity sewer and 60 manholes • Provide for 9 emergency generators at key sewer pump stations • Rehabilitate 18 main sewer pump stations • Provide Supervisory Control & Data Acquisition (SCADA) monitoring at 8 key pump
stations
The DIWSA provides vital sewage service to the Town of Dauphin Island and consists of sewage collection, conveyance, and treatment. The system consists of over 22 miles of gravity sewer and 21 sewer lift stations. The original sewer collection system was constructed in the 1950s and is still in operation today. In 1984, a major construction program provided sewer service to the entire Island. The system is now over 30 years old and parts of the system are beyond 60 years old. The majority of the collection system consists of terracotta (clay) pipe; over time the clay pipe has a tendency to settle and crack, creating a path for infiltration and inflow (I/I) and locations for blockages in the pipe. Infiltration and inflow enters the wastewater collection system through pipe joints, cracked pipe, leaking manholes, storm drain cross connections, and abandoned service lines. I/I has many negative impacts on the collection and treatment system, and among these, increased energy requirements may be the largest impact to customers and the environment. The volume of I/I causes longer run times for pumps, decreases hydraulic capacity in the wastewater treatment plant, decreases pumping capacity in the collection system, and decreases gravity sewer pipe capacity. Due to shallow groundwater with high chloride content on Dauphin Island, I/I increases corrosion within the collection system and the wastewater treatment system, thereby increasing

78
wear, increasing energy requirements, and shortening equipment life span. In addition, cracking pipe can cause frequent blocks within the gravity sewer system. These blockages in the pipe cause sanitary sewer overflow (SSO). SSOs have a negative impact on the environment which the DIWSA is looking to completely eliminate. In addition, during storm events, power is routinely out on Dauphin Island, and DIWSA does not have emergency power for operating pumps during these outages. Short term power outages pose a risk for SSOs since water supply is not interrupted, but customer need continues. The estimated Implementation Cost is $3.1 million with a yearly Maintenance/Operational Cost of $45,000. The costs for this project were provided by the proponent of the original proposal.
4.1.6. Tupelo Gum Swamp Land Acquisition (Project ID #18) Implementation of this project would acquire and conserve up to 10 acres of gum swamp located within the center of the widest part of Dauphin Island. This project would conserve and maintain critical habitat for resident and migratory avian species while providing an ecotourism opportunity through the development of a birding trail along the existing right-of-way. Dauphin Island has been identified by The National Audubon Society as a Globally Important Birding area. At least 348 species have been reported on the island including residents and neo-tropical migrants. The location of the island on the Gulf Flyway and the first/last land mass encountered by migrating species to and from South America make the various habitats on the island critical features in maintaining the existence of a number of avian species. This “Tupelo Gum Swamp” is located between several dead-end roads branching off Iberville Drive and Hernando Street on the widest part of the island south of Bienville Boulevard. Twenty platted lots total approximately 10 acres containing substantial wetlands populated by tupelo gum trees, saw palmetto and pines interspersed with ponded freshwater wetlands. Since 2001, the Dauphin Island Bird Sanctuary has acquired four of the twenty lots. These remaining lots are vulnerable to developmental of residential structures. The estimated Land Acquisition Cost, as determined by USACE real estate staff, is approximately $700,000.
4.1.7. Gorgas Swamp Land Acquisition (Project ID #19) Implementation of this project would acquire and conserve approximately 10 acres identified as the “Gorgas Swamp”. This swath of wetlands east of the Tupelo Gum Swamp (Project ID #18) is centered on Gen. Gorgas Street between the main dunes and Gen. Gaines Place. The habitat consisting primarily of forested wetlands provides critical habitat for resident and migratory avian species. Acquisition would also provide an ecotourism opportunity through the development of confined birding trails. Dauphin Island has been identified by The National Audubon Society as a Globally Important Birding area. At least 348 species have been reported on the island including residents and neo-tropical migrants. The location of the island on the Gulf Flyway and the first/last land mass encountered by migrating species to and from South America make the various habitats on the island critical features in maintaining the existence of a number of avian species. Twenty platted lots totaling approximately 10 acres contain substantial wetlands populated predominately by tupelo gum trees. To date, three of the 20 lots have been purchased for conservation by the Dauphin Island Bird Sanctuary. Currently this area is being degraded by excessive all-terrain vehicle traffic, which compacts the soil, generating ruts and
79
gullies that serve to drain the water off the surface thus interrupting the hydrologic cycle that is critical to maintenance of this unique habitat. The estimated Land Acquisition Cost, as determined by USACE real estate staff, is approximately $700,000.
4.1.8. Steiner Property Acquisition (Project ID #20) The “Steiner Property” is a parcel left largely untouched during the initial development of the island in the 1950s. Implementation of this project would provide for the conservation and management of approximately 12 acres of critical habitat for neotropical migrants, wading birds, and waterfowl. In addition, the acquisition of the land could provide an ecotourism opportunity through the development of confined birding trails. The habitat coverages consist primarily of forested area, scrub/shrub, intertidal marsh and a small portion of meadow, intertidal flat, and open-water. Maritime forest, scrub/shrub, and intertidal marsh provides extensive habitat for migrant and resident birds including waterfowl. The meadow, intertidal marsh and intertidal flats provide additional habitat for birds, fish and shellfish/oysters. Dauphin Island has been identified by The National Audubon Society as a Globally Important Birding area. At least 348 species have been reported on the island including residents and neo-tropical migrants. The location of the island on the Gulf Flyway and the first/last land mass encountered by migrating species to and from South America make the various habitats on the island critical features in maintaining the existence of a number of avian species. The “Steiner Property” is a swath of wetlands on the north side of Bienville Boulevard between Grant and Fort Conde Streets and runs northward with the northern boundary being the main portion of Dauphin Island Bay. Only 2 lots on the entire property have been developed and 5 parcels have been purchased for conservation by the Dauphin Island Bird Sanctuary. The remaining acreage is at jeopardy for development especially the area adjacent to Dauphin Island Bay. The estimated Land Acquisition Cost, as determined by USACE real estate staff, is approximately $600,000.
4.1.9. Dauphin Island Management Support System (Project ID #23) The proposed project is designed to: 1) establish a system-wide scientific monitoring program to assist the public and scientific community to better understand the physical and environmental conditions of Dauphin Island, 2) improve the impact and effectiveness of proposed and future restoration efforts, 3) provide critical data that will facilitate adaptive management to improve on-going restoration efforts, and 4) allow for the assessment of any potential trends and/or changes/triggers resulting from implementation of current and future restoration efforts. Barrier islands are a fundamental component of Alabama’s coastal system that serve as protection from many offshore marine hazards (e.g. hurricanes, oil spills) as well as provide vital habitat for highly productive fisheries, native and migratory birds, and other ecologically important species. Proper management of these coastlines’ critical regions requires data to support informed policy-making. Currently, there is a concentrated effort by various state and federal agencies to develop viable, sustainable restoration options to protect and restore the natural resources of Dauphin Island, a major barrier island in Alabama’s coastal waters. In order to meet the needs of the current habitat management projects underway, as well as to understand the historical and future conditions around Dauphin Island, this proposal involves
80
maintenance and upgrade of four existing environmental monitoring stations to collect observation data. These stations collect water quality parameters, meteorological parameters, and off-shore water column water quality conditions and flow data. The first year will consistent of basic maintenance and replacement of the existing sensor packages at each site, so the existing data utilized to develop the current project models continues to be available. The second year will consist of upgrading the offshore site to be in real-time. Currently, those data are housed in a publicly accessible, online repository, but enhancements to real-time will integrate off-shore water column data into adaptive management practices. The third year will focus on adding surface water quality parameters and flow data to the inshore sites and developing new web-based applications for these data. The estimated costs for this project, as provided by the proponent of the original proposal, are as follows: Phase 1 (Year 1) – $447,000, Phase 2 (Year 2) – $398,000, and Phase 3 (Year 3) – $296,000.
4.2. Group 2 Interim Projects
4.2.1. Dauphin Island Public Beach and Dune Restoration (Project ID #1) The size of the proposed project area is approximately 35 acres. This project would widen the west end public beach, from the end of Bienville Blvd. to the vicinity of the Katrina Cut closure structure, to its natural elevation and install a dune system using an offshore sediment source to restore historic conditions. The restoration to this area will increase island longevity and reduce overwash and breaching potential by nourishing the beach and dune system. The beach fill would extend along approximately 4,500 feet of shoreline from the terminus of Bienville Blvd westward to the Katrina Cut area. The estimated quantity of sand to complete the project is approximately 600,000 cubic yards. To be compatible with the West End Beach and Dune Restoration (Project ID #2), the proposed dune height is +12 feet with a dune width of 25 feet. Sand would be hydraulically dredged from an offshore borrow area located in the Gulf of Mexico about a mile south-southwest of the Sand Island Lighthouse and pumped to the project area. Placement of the project in Group 2 is due to the need for engineering to determine the impact of adjacent properties that have been bulkheaded by the property owners, extensive coordination with Federal agencies concerning threatened or endangered species, possible cultural resource surveys of the proposed borrow site and the need to obtain permits covering the borrow and placement of sand. The estimated Implementation Cost including monitoring, as submitted by the proponent of the original proposal, is $10 million of which $9.5 million is construction and $500,000 would be used for monitoring.
4.2.2. West End Beach and Dune Restoration (Project ID #2) The proposed project would widen the beach to its natural elevation along the west end of Dauphin Island’s southern shoreline and install a dune system using an offshore sediment source to restore at or near historic conditions. The restoration to this area will increase island longevity and reduce overwash and breaching potential by nourishing the beach and dune system. The beach fill would extend due east from the public beach for approximately 4.25 miles or 22,440 feet along the southern shoreline of the island to the vicinity of the fishing pier over an area of approximately 130 acres. The estimated quantity of sand to fully restore the beach and dune system would be approximately 3.59 million cubic yards. The proposed dune height is +12 feet
81
with a dune width of 25 feet. As with the Public Beach and Dune Restoration (Project ID#1), beach fill will be hydraulically dredged from an offshore borrow area located in the Gulf of Mexico about a mile south-southwest of the Sand Island Lighthouse and pumped to the project area. Placement of this project in Group 2 is due, in part, to the longevity of the proposed restoration and to the need for environmental and engineering studies to support required permit applications. Three levels of project restoration were proposed in the original proposal. This project represents full restoration of the area to historic condition at an estimated $59 million. Monitoring costs are $2.9 million for the life of the project. All estimated costs were provided by the project proponent in the original proposal.
4.2.3. Little Dauphin Island Nearshore Placement (Project ID #7) The proposed project would place approximately 200,000 cubic yards of sandy dredged material on approximately 150 acres of shallow open water along the northeastern shoreline of Little Dauphin Island. This project would provide an offshore sediment source for natural renourishment and conservation of critical coastal upland habitats for the Little Dauphin Island segment of the Bon Secour National Wildlife Refuge. This location provides essential habitat for shorebirds including the Semipalmated Sandpiper and the Piping Plover. The habitat coverages adjacent to the open-water project site consists primarily of dune, sparsely vegetated barrier flat, intertidal reef and flat with smaller portions of meadow, scrub/shrub, and intertidal marsh. Restoration to this area will increase island longevity and reduce overwash and breaching potential by nourishing the beach and dune system. Sandy material would be obtained from the existing federal navigation channel or an offshore borrow area located in the Gulf of Mexico about a mile south-southwest of the Sand Island Lighthouse. Placement of this proposal within Group 2 is based on environmental and engineering needs to determine the best location for sand placement to achieve the goals of the project and to identify unintended consequences. In addition, other studies could be required to satisfy permitting requirements. The estimated Implementation Cost is $2.5 million. An additional $350,000 would be required for monitoring the success of the project. All estimated costs were provided by the project proponent in the original proposal.
4.2.4. Improved Bypassing of Beach Sands Dredged from the Mobile Ship Channel
(Project ID #8) Implementation of this project would involve the bypassing of sand dredged during the maintenance of the Mobile Harbor Entrance Channel onto the Sand Island shoals located around and to the west of the Sand Island Lighthouse. These funds would cover the incremental cost of placing the material in this area rather than the currently used Sand Island Beneficial Use Area which is north of the lighthouse. Sand would be placed in an approximate 130 acres of open-water to supplement the sediment supply to the southern shoreline. Sand placed in such a manner would naturally migrate to the shore enhancing the value of the shoreline in providing essential habitat for shorebirds including the Semipalmated Sandpiper and the Piping Plover and sea turtles. This restoration project would increase the resiliency of the island. Major reason for this project being placed in Group 2 is the concern relative to movement of material placed in this manner and the re-occurring cost of the effort to achieve success in increasing the resiliency of the island. The estimated Implementation Cost is $2.4 million, Monitoring Cost is $360,000, and
82
Maintenance/Operational Cost is $1.2 million. These costs were provided by the project proponent in the original proposal.
4.2.5. Aloe Bay Beneficial Use Restoration (Project ID #9)
This project would create approximately 12.5 acres of salt marsh habitat associated with 2,150 feet of segmented living shoreline structures in a cove just east of the Dauphin Island Airport runway. Material to be used in the marsh construction would come from reopening a silted in navigation channel used by local recreational and commercial fishing interests. This project would dredge Aloe Bay to its authorized depth and use the dredged material for beneficial use to create saltwater marsh habitat directly west of the bay. The saltwater marshes along the Gulf Coast of Alabama are significantly productive ecosystems, providing food, shelter, and breeding habitat for important fish species as well as bird habitat, drawing hundreds of birders to coastal Alabama each year. Eroding shorelines east of the Dauphin Island Airport have resulted in a loss of saltwater marsh habitat, negatively impacting fisheries and the value of the area for birding on the island. At the same time, Aloe Bay, on the north side of the Island, has historically been a thriving working waterfront, providing docking space and support services to the commercial fishing industry. Dredging the navigation channel, which is currently too shallow, will benefit water quality by reducing the potential of suspended sediment associated with vessel transits. This saltwater marsh will be planted with native marsh grasses. Placement in Group 2 is dictated by the need of environmental and engineering studies and other permit related efforts. The estimated Implementation Cost is $2.45 million, as provided by the project proponent in the original proposal.
4.2.6. Fill Borrow Pits Dug in 2010 to Protect Against Oil Spill Damage (Project ID
#10) To prevent an oil spill overwash on the western end of the island on May 2, 2010, the Town of Dauphin Island constructed emergency sand barriers along the Gulf facing beaches as the BP spill oil was approaching the island. Sand was mined from 20 privately and or City owned lots located on the north shore of the island within 40 feet of Mississippi Sound, creating "ponds" at those locations. Some of the ponds are now connected to the waters of the Sound while others are separated by thin sand berms. The island could breach at these excavated areas (specifically in the general vicinity of the 2400 block of Bienville Blvd) during the next major hurricane if these holes are not filled. A breach in these areas would sever the developed portion of the island destroying all of the infrastructure in the area and all the access to the houses west of this location. A quasi-permanent inlet could develop (like “Katrina Cut”) at these hole/pond locations. This proposal would backfill the holes with sand proposed to come from a submerged shoal roughly 5 miles south of the eastern end of the island. Alternative sand sources are possible including: upland pits, excess dredged sands from the Alabama Port Authority, and sand along the rivers managed by the USACE for beneficial uses. It is possible that this project could be done in conjunction with construction of a planned beach and barrier island restoration project on the island. While the benefits appear reasonable, the proposal is placed in Group 2 because of land rights issues and studies needed for appropriate permit applications. The estimated

83
Implementation Cost is $5.6 million, as provided by the project proponent in the original proposal.
4.2.7. Aloe Bay/Mississippi Sound Water Quality Enhancement Project – Phase 2
(Project ID #13)
This project would conduct the appropriate studies and relocate the existing sewage treatment plant wastewater discharge point further out from the island’s shoreline into deeper waters of the Mississippi Sound in an effort to improve the water quality. This project would improve water quality in the vicinity of the current discharge location by moving to an area with a greater ability to mix effluent with the ambient waters. In addition to improving water quality, the action would enhance recreational activities in Aloe Bay such as seafood harvesting and recreational fishing. The Dauphin Island wastewater treatment plant currently discharges directly into the waters of Aloe Bay and the Mississippi Sound. The wastewater discharge is located only 140 feet from the Dauphin Island shoreline just west of the Dauphin Island Bridge. The waters around the wastewater outfall are permanently closed to shellfish harvesting and recreational activities due to this discharge. Dauphin Island Water and Sewer recognizes the ongoing struggles of local fishermen and is aware of the commercial and recreational values these waters potentially hold. If the outfall remains in its current position, these waters will remain closed to seafood harvesting and recreational activities. This proposal was placed in Group 2 because of the environmental and engineering studies that would be required to relocate the outfall. The estimated Implementation Cost is $13 million with yearly Maintenance and Operational Costs of $50,000 based on information provided by the project proponent in the original proposal.
4.2.8. West End Land Acquisition (Project ID #17) The project would conserve and maintain approximately 720 acres west of Katrina Cut which provides critical habitat for resident and migratory avian species and endangered sea turtles. The primary habitat coverages consist of beach, dune, scrub/shrub, tidal flats and pools, salt meadows, and marsh. The undeveloped west end of Dauphin Island has been recognized by the American Bird Conservancy as a Globally Important Bird Area in the Southeast Coastal Plain Bird Conservation Region. The west end is used as a primary staging area during migration of numerous migratory birds and is designated Piping Plover critical habitat by the United States Fish and Wildlife Service. The beach and dunes are also prime habitat for nesting of various bird species including the Least Tern and Snowy, and Wilson’s Plover and wintering habitat for Piping Plover. The entire area provides critical habitat for migrants, wading birds, waterfowl, and small vertebrates. This project is placed in Group 2 because the west end is achieving significant environmental benefits in its current state and because of the unknown cost associated with conservation. In addition, development of this area is not imminent because of the status as an Undeveloped Coastal Barrier (Coastal Barrier Resources Act status) and the cost of possible development. The Estimated Land Acquisition Cost as submitted by Mobile Baykeeper in the Alabama Coastal Restoration Portal is $10 million with a maintenance cost of $5,000 per year over a 10 year period.

84
4.2.9. U.S. Coast Guard Property Disposal/Acquisition (Project ID #21) The U.S. Coast Guard (USGS) operated a recreational facility on the southeastern side of Dauphin Island until the housing facilities were destroyed by hurricanes in 2005-2007. The property is no longer needed by the USCG and is in the process of being disposed by the General Services Administration (GSA) Public Building Service. The approximately 7.5-acre parcel, which fronts the Gulf of Mexico, is bounded on the east by the Dauphin Island Sea Lab (DISL), on the west by the Dauphin Island Bird Sanctuary, and on the north by the Dauphin Island Park and Beach Board Campground. The DISL is interested in acquiring the site through a public benefit conveyance to use for education and wildlife conservation. Conservation of the scrub/shrub, dune, maritime forest, and beach habitats would provide significant benefit to resident avian species, neo-tropical migrants from South America, and small vertebrates. Significant educational benefits would also be gained through the use of the area as an open laboratory supporting the educational mission of the DISL which includes K-12 and higher education. This proposal is in Group 2 because of the uncertain timing of the GSA process for disposal of excess property. The estimated Land Acquisition Cost, as determined by USACE real estate staff, is $2.5 million.
4.2.10. Dauphin Island 39 Parcel Property Acquisition – West End (Project ID #22a)
This project would involve the acquisition of approximately 518 acres on the west end of Dauphin Island along the Mississippi Sound. The majority of this acreage is open water within the Mississippi Sound which is devoid of vegetative habitats. The remainder encompasses approximately 87 acres of the north side of the island beginning at St. Stephen Street and extending west to the end of Bienville Blvd. These areas are characterized as overwash sand abutting residential properties. Some of the areas are vegetated with low dune vegetation, others are ponds created to obtain sand during the Deepwater Horizon Oil Spill. This acquisition is part of a total of 39 parcels proposed for sale representing a broad diversity of significant bottomland, shoreline, wetland, dune and forested habitat strategically located on this barrier island. Many of these properties provide essential habitat for shorebirds including the Semi-palmated Sandpiper and the Piping Plover. In addition, many of the areas provide essential habitat for the production and survival of fish, shellfish, and crab. Their conservation for ecological and environmental preservation and use for seafood and tourism applications represents a unique and important opportunity to preserve, protect, and promote Dauphin Island's unique natural habitat, seafood, and tourism resources. This proposal is in Group 2 because of the uncertainty associated with the conservation benefits that would accrue above what is currently provided. The estimated Land Acquisition Cost, as developed by USACE real estate staff, is approximately $900,000.
4.2.11. Dauphin Island 39 Parcel Property Acquisition – Graveline Bay (Project ID
#22b)
The Graveline Bay acquisition area includes 6 parcels comprising 340 acres of wetland and open water habitat south and west of the southern edge of the Dauphin Island Airport runway to the vicinity of Pineda Street. No residential or commercial properties are included in this area. The eastern and southern property portions contain significant unimpacted intertidal wetlands and intertidal flats that are essential habitat for the production and survival of fish, shellfish, and
85
crabs. In addition, the wetlands provide habitat for wading birds and waterfowl. This acquisition is part of a total of 39 parcels proposed for sale representing a broad diversity of significant bottomland, shoreline, wetland, dune, and forested habitat strategically located on this barrier island. Their conservation for ecological and environmental preservation represents a unique and important opportunity to preserve, protect, and promote Dauphin Island's unique natural habitat and seafood and tourism resources. This proposal is in Group 2 because of the uncertainty associated with the conservation benefits that would accrue above what is currently provided. The estimated Land Acquisition Cost, as developed by USACE real estate staff, is approximately $400,000.
4.2.12. Dauphin Island 39 Parcel Property Acquisition – Aloe Bay (Project ID #22c) This project would result in the acquisition of approximately 76 acres of shallow open water habitat in the Aloe Bay area of Mississippi Sound adjacent and north east of the Dauphin Island Airport runway. This area serves as habitat for numerous aquatic species including fish, shellfish, and crab. This proposal is in Group 2 because of the uncertainty associated with the conservation benefits that would accrue above what is currently provided. The estimated Land Acquisition Cost, as developed by USACE real estate staff, is approximately $100,000.
4.2.13. Dauphin Island 39 Parcel Property Acquisition – Little Dauphin Island and Bay (Project ID #22d)
This project would result in the acquisition of approximately 150 acres of shallow open water habitat in Little Dauphin Bay and Mississippi Sound including a portion of the disposal area for maintenance of the federally authorized Government Cut Channel. This portion of the property is maintained against erosion through the routine placement of this material. This area serves as habitat for numerous aquatic species including fish, shellfish, and crab. This proposal is in Group 2 because of the uncertainty associated with the conservation benefits that would accrue above what is currently provided. The estimated Land Acquisition Cost, as developed by USACE real estate staff, is approximately $200,000.
4.2.14. Dauphin Island 39 Parcel Property Acquisition – East End (Project ID #22e)
This project would acquire 5 separate parcels of undeveloped land on the east end of the island comprising approximately 4 acres total. Four of the properties are located in the commercial area of the island north of Bienville Blvd. The fourth property is located on the north side of the main dune system in the vicinity of the golf course. This last parcel has the ability to provide habitat to resident and migratory avian species and small vertebrates. This proposal is in Group 2 because of concern as to the best use of the four parcels in the commercial area and the uncertainty associated with the conservation benefits that would accrue above what is currently provided. The estimated Land Acquisition Cost, as developed by USACE real estate staff, is approximately $620,000.
86
4.3. Group 3 Interim Projects
4.3.1. Mid-Island Land Acquisition and Management – Phase 2 (Project ID #4) This project would result in the acquisition of 3 parcels on the west end of the island for a total of approximately 2.09 acres of relatively undeveloped land bordering Pirates Cove to provide additional public recreational amenities. Some of the area would remain in the natural state. Habitat coverages consist primarily of dune, meadow, sparsely vegetated barrier flat, open water/shoreline and small portion of land that has been previously developed. Part of the shoreline parcel has a bulkhead. This Phase 2 acquisition consists of 3 parcels: approximately 0.94 acre of land bounded by Pirates Cove Street on the west, Cadillac Avenue on the north, and Bienville Blvd on the south; and approximately 1.15 acre abutting Graveline Bay on the east, Pineda Street on the west, and Cadillac Avenue on the south. The property to the north of Bienville Boulevard would be used to aid in accessing the waters of Graveline Bay, Mississippi Sound, and the Gulf of Mexico. This proposal has been included in Group 3 because use of the land does not fit into categories under which NFWF has indicated an ability to provide funds. The estimated Land Acquisition Cost, as developed by USACE real estate staff, is approximately $1 million.
4.3.2. Dauphin Island Water Supply Aquifer (Project ID #15) The project would involve finding and developing a secondary source of drinking water for Dauphin Island which would: 1) improve the drinking water supply for the residents and visitors of the island, 2) reduce the overuse of critical freshwater aquifers and prevent saltwater intrusion of the freshwater supply and 3) insure uninterrupted clean water supply to the island. In 2010 and for the duration of the BP oil spill cleanup efforts, Dauphin Island's primary source of drinking water originated from a shallow well aquifer. Continued use of this source, which is known to be susceptible to surface contaminants, required performance of extensive testing and protection efforts throughout the duration of the oil spill and subsequent cleanup. The integrity of this aquifer, which now serves as the primary backup to Dauphin Island's drinking water needs, remains ill-fated in the event of future disasters and saltwater intrusion. These risks to the integrity of Dauphin Island's water production and distribution system must be addressed to ensure the island continues to have safe drinking water. This proposal has been included in Group 3 because this type of project does not fit into categories under which NFWF has indicated an ability to provide funds. Other sources of funding would be more appropriate. The estimated Implementation Cost is $1.8 million with annual Maintenance and Operational Costs of $42,000, as provided by the project proponent in the original proposal.
4.3.3. Dauphin Island Water Supply Elevated Storage Tank (Project ID #16)
This project would provide Dauphin Island with additional drinking water storage and distribution capabilities. The project entails constructing an additional 100,000-gallon plus water tank and associated water distribution system. The original water system for Dauphin Island was constructed in the 1950s and was designed primarily for drinking water supply. A small 100,000-gallon elevated fresh water storage tank was constructed at that time which continues to provide
87
adequate storage capacity and limited fire protection to the residents of Dauphin Island. Over the years, the system has grown to meet increasing water supply demands by the addition of small diameter lines and water service that now covers the entire Island. Currently, the water storage and distribution system for Dauphin Island is more than adequate to provide drinking water and fire protection to its 1,800 year-round customers. However, during peak summer season, the system can become significantly strained due to the influx of tourists and visitors to the Island. Recent hydraulic analysis modeling has shown the strategic addition of larger diameter piping will significantly improve fire flow capacity to areas which currently have marginal capacity. The modeling has identified locations where installing loops on dead-end lines will greatly improve water flow and help reduce water age. Also, during high demand summer months, additional storage capacity is needed on the east end of the island. The addition of an elevated storage tank on the eastern portion of the island will meet peak water supply demands and fire flow reserves. These improvements will enable the Island to continue its growth and economic development by serving drinking water and providing fire protection to all its residents and visitors. This proposal has been included in group 3 because this type of project does not fit into categories under which NFWF has indicated an ability to provide funds. Other sources of funding would be more appropriate. The estimated Implementation Cost is $3.4 million with annual Maintenance and Operational Costs of $28,000, as provided by the project proponent in the original proposal.
5. Conclusion
The USACE and USGS have worked collaboratively with the State of Alabama since April 2015, under a grant from the NFWF Gulf Environmental Benefit Fund, to collect data and develop tools to ultimately identify potential restoration actions that could protect, enhance, and/or restore the natural resources of Dauphin Island and the surrounding areas of the Mississippi Sound and Mobile Bay. Specific tasks that have been completed or are currently ongoing include the following: Task 1 – development of a database and software tools to manage and visualize all of the data pertaining to this study; Task 2 – collection of necessary field data to characterize the existing and historical conditions of the study area; Task 3 – assessment of existing and historical data to better understand the evolution of the island’s shorelines and habitats; Task 4 – development of a sediment budget to describe recent era (i.e., 2001-2015) sediment gains and losses in the nearshore areas of Dauphin Island and Mobile Pass; Task 5 – development of models that will be used to characterize the existing physical features and habitats of the island and predict relative changes in the future as a result of potential restoration actions; Task 6 – formulation and evaluation of potential comprehensive restoration alternatives for Dauphin Island using technical expertise, model results, and an assessment tool being developed by the USGS, and identification of potential initial projects (i.e., Interim Projects) that could be recommended for implementation as part of this report prior to completion of the comprehensive effort; and Task 7 – Preparation of a monitoring and adaptive management plan to provide a roadmap for determining if restoration projects (when implemented) are meeting intended conservation objectives and, if not, whether adaptive management actions may be warranted. Tasks 8 and 9 are report development and project management. This interim report serves as the update for Task 8. No detailed discussion of Task 9 is provided, because it is the management support and financial/schedule oversight of Tasks 1 – 8. The status and summary of
88
Tasks 1 – 7 are discussed in the paragraphs below. Task 1 – Update Baseline Conditions and Trends: A total of 123 legacy and/or baseline datasets of varying data types (see Table 1) have been collected or compiled to date by the study team to aid in the understanding and characterization of the study area. These datasets are being stored in a centralized database (known as the “Sandbox”) developed and managed by the USGS. The USGS has also developed a web mapping application with data visualization tools to view the data containing spatial components (see examples in Figure 3 through Figure 8). The database and web mapping application, including all data visualization tools, will be continually updated and made available to the public upon completion of the study. Task 2 – Field Data Collection: Field data collected as part of this study includes bathymetric and geologic surveys (Task 2.1); wave and current measurements (Tasks 2.2 and 2.3); sediment distribution information (Task 2.4); and water quality data (Task 2.5). The bathymetric and geologic surveys were collected from July to September 2015 and provide a comprehensive, high-resolution Digital Elevation Model (DEM) around the island (see Figure 10) ranging from the shallow depth nearshore areas to the deeper water offshore areas (~1 - 50 feet). The DEM is being combined with topographic elevation data to provide an up-to-date bathymetric/topographic dataset for the entire island and surrounding area. To gain a better understanding of the hydraulic and wave climate of the study area, tidal current measurements were collected across Pass aux Herons, Mobile Pass, and Petit Bois Pass (see Figure 12) during spring tides in August and December 2015, and wave measurements were collected at two locations in the vicinity of the Mobile Pass ebb tidal shoal and Katrina Cut (see Figure 19) over a period from June – November 2015. In addition, a total of 303 sediment samples were taken at various locations around the island (see Figure 22) in August 2015 and analyzed for bulk sediment parameters (organic matter determined by loss-on-ignition, bulk density, and water content) as well as detailed grain size to evaluate relationships among sediment transport patterns, alongshore variability, and geotechnical properties that influence the development of shoreline nourishment and restoration approaches. Finally, water quality data was collected at 4 discrete locations (see Figure 23) over eight sampling periods from July 2015 – June 2016 at three water depths (near top, middle depth, and near bottom). The samples were analyzed for nutrients, chlorophyll, salinity, carbon, and other field parameters, and the data will be used to complement other existing water quality datasets from the area. All of the collected datasets will be used to update/characterize baseline conditions of the island and provide a primary source of data for model development and validation. Once they have undergone QA/QC review, they will be published as either USGS or USACE ERDC publications. The QA/QC process for all of the data collection efforts is ongoing with the exception being the water quality data, which is already publically available on the USGS NWIS web online database at the following location: http://nwis.waterdata.usgs.gov/al/nwis/qwdata. Task 3 – Data Analysis of Dauphin Island Shorelines and Habitats: The analysis of existing and historical data to better understand the evolution of the island’s shorelines (Tasks 3.1 and 3.2) and habitats (Task 3.3) is ongoing. A dataset was compiled for this study that contains over 200 shorelines extracted from Landsat satellite imagery for the time period of 1984 – 2015 (see Figure 25), thirteen historical LiDAR surveys between the years of 1998 – 2013 (see Figure 26),
89
and decadal historic aerial imagery ranging from 1940 – 2015. In addition, back-barrier marsh cores were collected at Little Dauphin Island and Graveline Bay, and a baseline habitat map is being created for the entire island utilizing aerial imagery collected in December 2015 and the topographic/bathymetric dataset created as part of Task 2.1. Initial shoreline change rates using the three data sources (i.e. Landsat imagery, LiDAR, and historical aerial imagery) have been computed at 270 cross-shore transects spaced 100 meters apart covering the entire length of the island, and the analysis of the marsh cores from Little Dauphin Island and Graveline Bay is complete. These datasets will be used to help validate the morphological model (Task 5.1) and to better understand the vertical accretion/erosion of marsh environments. Task 4 – Existing Volumetric Changes and Sediment Budget Analysis: A volumetric change and sediment budget analysis is being performed to describe recent era (i.e. 2001-2015) sediment gains and losses in the nearshore areas of Dauphin Island and Mobile Pass. Available data from various sources including National Oceanic and Atmospheric Administration (NOAA) (2014), USGS (2015), USACE (2001-2015), and the Town of Dauphin Island (2010) are being used to derive recent-era sediment transport pathways and quantities. These data sets are being combined with historical surveys as documented in Byrnes et al, 2010 and 2012 to quantify changes in transport dynamics. This effort is ongoing, but some of the preliminary results illustrating bathymetric changes between 2011 and 2015 are shown in Figure 32. Ultimately, a sediment budget tallying the sediment gains and losses, or sources and sinks, within the study area over the given time frame(s) will be completed and documented in the Final Comprehensive Report. The data will also be integrated into the study database developed as part of Task 1 and made available for public use upon completion of the study. Task 5 – Modeling: A suite of models are being developed to provide a quantitative understanding of the processes governing the past and present Dauphin Island barrier system and to predict future responses of the island and surrounding areas for potential restoration alternatives. A coupled Delft3D XBeach-Recovery coupled hydrodynamic and morphologic model is being used to hindcast and forecast the evolution of the island’s configuration (Task 5.1). Outputs from this model will be passed to the Katrina Cut structural response, water quality, and habitat modeling efforts for use at varying time intervals. The life cycle response of the Katrina Cut rubble mound structure is being modeled (Task 5.2) using a computational tool called CSsim (Coastal Structure simulation) and a Geophysical Scale Transport Modeling System (GSMB) that includes a framework of hydrodynamic and water quality models, namely CH3D-MB (Luong and Chapman, 2009), which is the multi-block (MB) version of CH3D-WES (Chapman et al., 1996, Chapman et al., 2009) and a parallel water quality module, CE-QUAL-ICM (Cerco and Cole, 1994, Bunch et al., 2003) is being developed to predict changes in water quality constituents (Task 5.3). The habitat model (Task 5.4) is being developed by the USGS and will quantify changes in habitats due to the morphological and water quality responses of the island and surrounding areas for various restoration alternatives. All of the models are under development and the teams are currently working on model calibration, validation, and characterization of the existing conditions. Additional details on each of these modeling tools and the status of those efforts are provided in Section 3.5. Task 6 – Alternative Evaluations: The goal of this study is to investigate and identify viable options for the restoration of Dauphin Island as a sustainable barrier island to protect and restore
90
island resources, including habitat and living coastal and marine resources, as well as protect the coastal resources of the Mississippi Sound/Mobile Bay and the southern portion of Mobile County including the expansive Heron Bay wetlands. To achieve this goal, restoration alternatives will be formulated and evaluated (Task 6.1b) using technical expertise, model results, and an assessment tool being developed by the USGS (Task 6.2) that will quantify the consequences of each restoration scenario relative to natural resource benefits, the likelihood of project success, and the impact to coastal protection, as well as other objectives that will be elicited from appropriate experts and decision-makers (e.g. NFWF, the State of Alabama, and others). The study team is currently working on characterizing the existing and historical conditions of the study area and developing the modeling and assessment tools that will be used to evaluate restoration alternatives (Tasks 1 – 5 and Task 6.2). Once those tools are fully developed and provide enhanced information, the formulation and evaluation of potential restoration options will begin. Potential types of alternatives that could be formulated and evaluated as part of this task include options to beneficially use dredged material for habitat restoration and/or preservation; island beach, platform, and dune restoration; acquisition of critical habitats; and the establishment of wetland and seagrass areas. Ultimately, the results of this task will identify how well each of the alternatives meet the fundamental objectives of the restoration, including a quantitative description of natural resource benefits, sustainability of the action over a 50-year planning horizon, and costs to implement and maintain the action (Task 6.3). In addition to the formulation and evaluation of comprehensive restoration alternatives described above, potential initial restoration projects (i.e. Interim Projects) were identified and evaluated to determine if any could be recommended for implementation, as part of this Interim Report, to support the long-term resiliency of the island prior to completion of the comprehensive study (Task 6.1a). This effort was led by the USACE through close coordination with the State and supported by the USGS and a panel of eight individuals (known as the Evaluation Support Panel) with firsthand knowledge of Dauphin Island and its resources. Ultimately, a total of 27 potential Interim Projects were identified from a variety of publicly available sources and through coordination with state and federal resource agencies for evaluation by the USACE, State of Alabama, and the Evaluation Support Panel. The projects were evaluated using criteria developed by the USACE and State of Alabama and divided into three groups depending on how well they met the criteria. Group 1 projects are those that were determined to support the long term resiliency of the island and could be implemented in the short-term without needing additional environmental and/or engineering analyses to further quantify their benefits (i.e., their benefits were evident to the panel). Group 2 projects are those that appear to support the long term ecological resiliency of the island but need additional detailed engineering and/or environmental analyses to quantify, with more certainty, the benefits they would provide. Group 3 projects are those that, while they may be beneficial to the island from an economic or recreational standpoint, cannot be further informed by the tools being developed for this particular study as they are outside the environmental restoration scope of this effort. A suite of 10 projects with varying scopes (e.g., land acquisitions, dune restoration, controlled burns/invasive species management, stormwater drainage system improvements, wastewater collection system and treatment plant upgrades, and data collection efforts) were identified as Group 1 projects, meaning they most strongly met the evaluation criteria and are considered

91
possible Interim Projects. In addition, a total of 14 projects were determined to fit the classification of Group 2 projects and are prime candidates for further evaluation as part of Task 6.1b. The remaining three projects were classified in Group 3 because they could not be further informed or investigated with the tools being developed for this study. A detailed discussion of the projects, evaluation process, and outcome is provided in Section 4. Task 7 – Monitoring and Adaptive Management: A feasibility/planning level monitoring and adaptive management (MAM) plan is being developed consistent with the Monitoring and Adaptive Management Plan requirements of the Gulf Environmental Benefit Fund as well as the Water Resources Development Act of 2007 Section 2039. The MAM plan will be used to determine if a particular project (when implemented) is meeting intended conservation objectives, and if not, whether adaptive management actions may be warranted. Monitoring and Adaptive Management plans and conceptual ecological models from similar restoration projects were compiled and added to the study database to help inform the MAM planning for the project, and a draft conceptual ecological model (CEM) diagram (see Figure 61) and associated documentation was developed to help explain the general functional relationships among the essential components of the Dauphin Island system. Utilizing the information obtained from the CEM in conjunction with the data and modeling performed during the feasibility study, a MAM Plan will be developed to outline monitoring data to be collected before, during, and after project construction to measure project performance and inform adaptive management. Further information on Tasks 1 – 7 are provided in Sections 1 – 4 of this Interim Report. The final outcomes and results of each task will be documented in the Final Comprehensive Report scheduled for completion by March 2019. All data collected and compiled for this study will be released to the public upon completion of the study. 6. References
Bunch, B. W., Channel, M., Corson, W. D., Ebersole, B. A., Lin, L., Mark, D. J., McKinney, J. P., Pranger, S. A., Schroeder, P. R., Smith, S. J., Tillman, D. H., Tracy, B. A., Tubman, M. W., and T. L. Welp. 2003. “Evaluation of Island and Nearshore Confined Disposal Facility Alternatives, Pascagoula River Harbor Dredged Material Management Plan,” Technical Report ERDC-03-3, U.S. Army Engineer Research and Development Center, Vicksburg, MS. Byrnes, M. R., S. F. Griffee, and M. S. Osler. 2010. Channel Dredging on Geomorphic Response at and Adjacent to Mobile Pass, Alabama, ERDC/CHL-TR-10-8, US Army Engineer Research and Development Center, Coastal and Hydraulics Laboratory, Vicksburg, Mississippi. 309 pp. Byrnes, M. R., J.D Rosati, and S. F. Griffee, 2012. Littoral Sediment Budget for the Mississippi Sound Barrier Islands, ERDC/CHL-TR-12-9, US Army Engineer Research and Development Center, Coastal and Hydraulics Laboratory, Vicksburg, Mississippi. Cerco, C., and T. Cole. 1994. “Three-Dimensional Eutrophication Model of Chesapeake Bay,” Technical Report EL-94-4, US Army Engineer Waterways Experiment Station, Vicksburg, MS. Chapman, R. S., and P. V. Luong. 2009. “Development of a multi-block CH3D with a wetting,

92
drying and CLEAR linkage capability.” Draft Report prepared for Louisiana Coastal Area (LCA) Ecosystem Restoration Plan S&T Office, Vicksburg, MS. Chapman, R. S., Johnson, B. H., and S. R. Vemulakonda. 1996. “Users Guide for the Sigma Stretched Version of CH3D-WES; A Three-Dimensional Numerical Hydrodynamic, Salinity and Temperature Model,” Technical Report HL-96-21, U.S. Army Engineer Waterways Experiment Station, Vicksburg, MS.Lesser, G. R., J. A. Roelvink, J. A. T. M. Van Kester, and G. S. Stelling. "Development and validation of a three-dimensional morphological model." Coastal engineering 51, no. 8 (2004): 883-915. Luong, P.V. and R. S. Chapman, 2009. Application of Multi-block Grid and Parallelization Techniques in Hydrodynamic Modeling, DOD High Performance Computing Modernization Program: User Group Conference (HPCMP-UGC), San Diego, CA. Morton, R. A. 2008., Historical Changes in the Mississippi-Alabama Barrier-Island Chain and the Roles of Extreme Storms, Sea Level, and Human Activities, J Coastal Res, 1587-1600. Park, K., Powers S. P., Bosarge, G. S. and S-H Jung. 2013. Plugging the leak: Barrier island restoration following Hurricane Katrina enhances larval retention and improves salinity regime for oysters in Mobile Bay, Alabama. Marine Environmental Research, 1-8. Roelvink, D., Reniers, A., Van Dongeren, A. P., de Vries, J. V. T., McCall, R., and Lescinski, J. (2009). Modelling storm impacts on beaches, dunes and barrier islands. Coastal engineering, 56(11), 1133-1152. Twichell, D., Flocks, F. Pendleton, E., and Baldwin, W. 2013. Geologic Controls on Regional and Local Erosion Rates of Three Northern Gulf of Mexico Barrier-Island Systems. Journal of Coastal Research, 63(sp1):32-45. U.S. Army Corps of Engineers (USACE). 2009. Mississippi Coastal Improvements Program (MsCIP), Hancock, Harrison, and Jackson Counties, Mississippi, Comprehensive Plan and Integrated Programmatic Environmental Impact Statement. Main report and appendices. June.

93
Appendix A – Descriptions of Potential Interim Projects
Related Documents