r d NATIONAL HURRICANE CENTER TROPICAL CYCLONE REPORT HURRICANE DELTA (AL262020) 4–10 October 2020 John P. Cangialosi and Robbie Berg National Hurricane Center 19 April 2021 1 NASA TERRA MODIS VISIBLE SATELLITE IMAGE OF HURRICANE DELTA AT 1920 UTC 8 OCTOBER 2020. Delta was a category 4 hurricane on the Saffir-Simpson Hurricane Wind Scale. It made two landfalls, both at category 2 intensity, on the Yucatan Peninsula and in southwestern Louisiana. Delta made landfall just east of where Hurricane Laura struck in Louisiana a little more than a month prior. 1 Original report date 30 March. This version includes a correction of Figure 1 and added rainfall data.

Welcome message from author
This document is posted to help you gain knowledge. Please leave a comment to let me know what you think about it! Share it to your friends and learn new things together.
Transcript

rd NATIONAL HURRICANE CENTER
TROPICAL CYCLONE REPORT
HURRICANE DELTA (AL262020) 4–10 October 2020
John P. Cangialosi and Robbie Berg National Hurricane Center
19 April 20211
NASA TERRA MODIS VISIBLE SATELLITE IMAGE OF HURRICANE DELTA AT 1920 UTC 8 OCTOBER 2020.
Delta was a category 4 hurricane on the Saffir-Simpson Hurricane Wind Scale. It
made two landfalls, both at category 2 intensity, on the Yucatan Peninsula and in southwestern Louisiana. Delta made landfall just east of where Hurricane Laura struck in Louisiana a little more than a month prior.
1 Original report date 30 March. This version includes a correction of Figure 1 and added rainfall data.

Hurricane Delta 2
Hurricane Delta 4–10 OCTOBER 2020
SYNOPTIC HISTORY The genesis of Delta was associated with a tropical wave that moved off the west coast of Africa on 26 September. The wave was not producing much deep convection when it departed the coast, and it remained relatively inactive during the next few days while it moved quickly westward across the tropical eastern Atlantic. Showers and thunderstorms began to increase in association with the wave as it approached 50°W longitude on 30 September, but there was no indication of a closed low-level circulation at that time. The wave moved across the Lesser Antilles on 1 October and then entered the eastern Caribbean Sea. Showers and thunderstorms waxed and waned near the wave axis as it moved across the Caribbean Sea due to moderate wind shear and intrusions of dry air, but satellite images and scatterometer data indicate that a well-defined center of circulation formed with sufficiently organized deep convection around 1800 UTC 4 October, marking the formation of a tropical depression about 90 n mi south of Kingston, Jamaica. The “best track” chart of the tropical cyclone’s path is given in Fig. 1, with the wind and pressure histories shown in Figs. 2 and 3, respectively. The best track positions and intensities are listed in Table 1.2
After the depression formed, thunderstorm activity continued to increase, but it remained confined to the southern portion of the circulation late on 4 October and early on 5 October due to northerly wind shear. During this time, the cyclone was moving slowly westward on the south side of an Atlantic subtropical ridge. As the shear lessened later on 5 October, convection became more symmetric around the center, and the system strengthened to a tropical storm by 1200 UTC that day when it was located about 130 n mi south-southwest of Montego Bay, Jamaica. With near ideal environmental conditions of warm ocean waters, low wind shear, and high levels of atmospheric moisture, Delta rapidly intensified during the next 24 to 30 h while it turned west-northwestward and accelerated over the western Caribbean Sea as the subtropical ridge strengthened to its north and northeast. Delta attained major hurricane intensity by 1200 UTC 6 October, and it reached its first peak intensity as a category 4 hurricane on the Saffir Simpson Hurricane Wind Scale with maximum winds of 120 kt by 1800 UTC that day when it was centered about 175 n mi south of the Isle of Youth, Cuba. This period of rapid intensification was quite impressive as it resulted in a 90-kt increase in winds over a 36-h period; only four other Atlantic tropical cyclones have accomplished that intensification rate or greater during the satellite era. At the time of its peak intensity, Delta had a pinhole eye that was surrounded by very intense deep convection (Fig. 4).
2 A digital record of the complete best track, including wind radii, can be found on line at ftp://ftp.nhc.noaa.gov/atcf. Data for the current year’s storms are located in the btk directory, while previous years’ data are located in the archive directory.

Hurricane Delta 3
Shortly after Delta reached its peak intensity, the eye of the major hurricane lost definition and although the convection remained quite intense, the cloud pattern became increasingly ragged. In addition, data and visual observations from the Air Force and NOAA Hurricane Hunters indicated that the eyewall had become diffuse, and Delta weakened quickly despite being over the warm waters of the northwestern Caribbean Sea. The reasons for the abrupt weakening appear to be a sudden increase in mid-level southeasterly wind shear and an intrusion of dry air as evident in aircraft dropsonde data and model analyses (not shown). As Delta continued to move relatively quickly toward the west-northwest, aircraft data indicated that it weakened to an intensity of about 90 kt by 0600 UTC 7 October when it was centered about 60 n mi east of Cozumel, Mexico. The hurricane maintained that intensity through its first landfall in the northeastern portion of the Yucatan Peninsula near Puerto Morelos, Mexico, around 1030 UTC that day.
As the core of Delta moved across the northern portion of the Yucatan Peninsula, the wind speed decreased due to the land interaction. Delta’s center moved back offshore over the extreme southern Gulf of Mexico by 1800 UTC 7 October with an estimated intensity of about 75 kt. Since the hurricane was still well organized after its passage across the Yucatan, and was located in generally favorable atmospheric and oceanic conditions, Delta again intensified. Now moving northwestward on the southwestern periphery of the ridge, Delta strengthened back to a major hurricane by 1800 UTC 8 October when it was centered about 300 n mi south of the Texas/Louisiana border. The major hurricane reached its second but lower peak intensity of 105 kt 6 h later, at which time it had a small eye and symmetrical convective pattern (cover image). Around that time, Delta reached the western edge of the ridge and turned northward toward southwestern Louisiana.
The major hurricane maintained its second peak intensity during the overnight hours on 9 October, but an increase in southwesterly shear and a decrease in the oceanic heat content over the northern Gulf of Mexico caused the cyclone to slowly weaken before it reached the U.S. coast. Delta made landfall near Creole, Louisiana, at 2300 UTC that day with maximum winds of about 85 kt. This landfall location was only about 10 n mi east of where Hurricane Laura’s eye struck the coast a little more than a month prior. At the time of landfall, Delta had an asymmetric appearance due to the increasing wind shear. After landfall, Delta rapidly weakened and fell below hurricane intensity by 0600 UTC 10 October while it was located over central Louisiana. The storm continued to weaken that day as it turned northeastward on the northern side of the ridge, and it became a weak extratropical cyclone by 1800 UTC over Mississippi. The extratropical cyclone continued to lose strength and the circulation broadened, and it opened into a trough of low pressure over the southeastern U.S. by 0000 UTC 12 October.
METEOROLOGICAL STATISTICS Observations in Hurricane Delta (Figs. 2 and 3) include subjective satellite-based Dvorak technique intensity estimates from the Tropical Analysis and Forecast Branch (TAFB) and the Satellite Analysis Branch (SAB), objective Advanced Dvorak Technique (ADT) estimates and Satellite Consensus (SATCON) estimates from the Cooperative Institute for Meteorological Satellite Studies/University of Wisconsin-Madison. Data and imagery from NOAA polar-orbiting

Hurricane Delta 4
satellites including the Advanced Microwave Sounding Unit (AMSU), the NASA Global Precipitation Mission (GPM), the European Space Agency’s Advanced Scatterometer (ASCAT), and Defense Meteorological Satellite Program (DMSP) satellites, among others, were also useful in constructing the best track of Delta. Aircraft observations include flight-level, stepped frequency microwave radiometer (SFMR), and dropwindsonde observations from nine flights (including 30 center fixes) of the 53rd Weather Reconnaissance Squadron of the U.S. Air Force Reserve Command and eight missions (including 21 center fixes) from the NOAA Hurricane Hunters of the NOAA Aircraft Operations Center (AOC). In addition, the NOAA AOC G-IV aircraft flew four synoptic surveillance flights around Delta, collecting valuable data on the surrounding steering currents and other environmental conditions.
Data from radars in Mexico and National Weather Service WSR-88D radars along the United States Gulf coast and across the Southeast were beneficial in tracking Delta. While Delta was near the U.S. Gulf coast, Doppler velocity data was useful in estimating the hurricane’s intensity along with the extent and strength of the outer wind field.
Ship reports of winds of tropical storm force associated with Delta are given in Table 2, and selected surface observations from land stations and data buoys are given in Table 3.
Winds and Pressure
Delta’s estimated peak intensity of 120 kt over the northwestern Caribbean Sea at 1800 UTC 6 October is based on data from a NOAA Hurricane Hunter aircraft. The aircraft measured a peak SFMR wind of 121 kt and peak 700-mb flight-level winds of 132 kt, which adjusts to an intensity of 118 kt at the surface. Both of these reports were around 1500 UTC 6 October. The minimum pressure of 953 mb at 1800 UTC 6 October is based on dropsonde data from the same aircraft mission. The peak intensity of Delta was very short lived as the next aircraft mission later that day showed notably less wind and a degraded structure. The second peak intensity of 105 kt from 0000 to 0600 UTC 9 October, when Delta was over the Gulf of Mexico, is based on data from both the NOAA and Air Force Hurricane Hunters. The peak 700-mb flight-level winds were 125 kt, which reduces to an intensity of 108 kt at the surface, and the peak SFMR winds were 99 kt. The minimum pressure also bottomed out at 953 mb during that time based on dropsonde reports from the NOAA aircraft.
In the Yucatan Peninsula, the highest surface wind report was from a WeatherFlow observation in Cancun, Mexico, where maximum sustained winds observed in the northern eyewall were 73 kt at 1018 UTC 7 October with a gust to 92 kt. The lowest pressure was measured just to the south of Cancun near Puerto Morelos, where a station recorded a minimum pressure of 972 mb with calm winds in the eye at 1018 UTC 7 October.
Along the far eastern Texas and western Louisiana coasts, there were two weather stations that reported sustained hurricane-force winds. At Calcasieu Pass, Louisiana, a National Ocean Service (NOS) site recorded maximum sustained winds of 64 kt with a wind gust of 78 kt just before 2300 UTC 9 October. A Texas Coastal Ocean Observing Network (TCOON) site near Texas Point recorded a maximum sustained wind of 70 kt with a gust to 87 kt also around 2300 UTC 9 October. Elsewhere, there were several observations of winds of tropical storm force with

Hurricane Delta 5
hurricane-force wind gusts. In Louisiana, Lake Charles airport (KLCH) recorded a sustained wind of 54 kt and a gust of 83 kt just before 0000 UTC 10 October. A couple of hours later, a sustained wind of 55 kt and gust of 65 kt were reported at the Lafayette Regional Airport (KLFT). In between Lake Charles and Lafayette, at the Jennings airport, a minimum pressure of 976 mb was recorded along with maximum sustained winds of 52 kt and a gust of 70 kt around 0000 UTC 10 October. Farther west in eastern Texas, the Beaumont-Port Arthur Regional Airport (KBPT) reported a maximum wind of 57 kt and a wind gust of 78 kt at 2315 UTC 9 October. Tropical-storm-force winds extended well inland from the coast. In particular, a station in Monroe, Louisiana (KMLU), reported maximum sustained winds of 37 kt and a gust of 55 kt at 0855 UTC 10 October.
Farther east in Mississippi, there were winds reports near and just below tropical storm force, and several locations across the western portion of the state recorded gusts in the 45–50 kt range.
In terms of the offshore buoys, sustained hurricane-force winds of 64 kt and 66 kt were recorded at NOAA buoys just east of the Yucatan Peninsula (42056) and over the western Gulf of Mexico (42002), respectively. In addition, NOAA buoy 42002 located over the west-central Gulf of Mexico reported a minimum pressure of 958 mb at 0350 UTC 9 October.
Storm Surge3 Delta produced storm surge inundation levels of 6 to 9 ft above ground level (AGL) to the
east of its landfall location along coastal portions of Vermilion, Iberia, and St. Mary Parishes in Louisiana, including near Vermilion Bay. Table 3 and Figures 5 and 6 provide observations from various tide stations, stream gauges, water level sensors, and surveyed high water marks along much of the northern and western U.S. Gulf coast. Although the NOS tide gauge at Freshwater Canal Locks had been destroyed during Hurricane Laura in late August, the NOS deployed a temporary station at the same site before Delta. This station measured 9.45 ft above normal tide levels, which resulted in a water level of 8.5 ft above Mean Higher High Water (MHHW). However, the physical limit of the gauge was reached at that level, and the actual peak water level may have been higher. A storm surge hindcast simulation produced by the NHC Storm Surge Unit (not shown) also suggests that peak inundation of 9 ft AGL occurred in and around the coastal wetlands of Vermilion and Iberia Parishes. Near the Freshwater Canal Locks NOS tide station, a Harris County Flood Control District (HCFCD)/NWS team surveyed a high water mark of 7.8 ft AGL, and a United States Geological Survey (USGS) water level sensor measured a peak water level of 6.8 ft MHHW. In nearby Pecan Island, the HCFCD/NWS team surveyed a high water mark of 6.7 ft AGL.
3 Several terms are used to describe water levels due to a storm. Storm surge is defined as the abnormal rise of water generated by a storm, over and above the predicted astronomical tide, and is expressed in terms of height above normal tide levels. Because storm surge represents the deviation from normal water levels, it is not referenced to a vertical datum. Storm tide is defined as the water level due to the combination of storm surge and the astronomical tide, and is expressed in terms of height above a vertical datum, i.e. the North American Vertical Datum of 1988 (NAVD88). Inundation is the total water level that occurs on normally dry ground as a result of the storm tide, and is expressed in terms of height above ground level. At the coast, normally dry land is roughly defined as areas higher than the normal high tide line, or Mean Higher High Water (MHHW).

Hurricane Delta 6
High water levels occurred along the shore of Vermilion Bay, particularly in the Cypremort Point area. A USGS water level sensor installed in the area measured a peak water level of 8.0 ft MHHW, and the HCFCD/NWS team surveyed a high water mark of 6.6 ft AGL. Numerous other high water marks and gauges suggest that inundation of 3 to 6 ft AGL occurred elsewhere along the shores of Vermilion Bay, Cote Blanche Bay, Atchafalaya Bay, and Caillou Bay.
Storm surge inundation of 3 to 6 ft AGL affected portions of Cameron Parish, flooding areas that had already been devastated by Hurricane Laura’s catastrophic storm surge. The NOS gauge at Calcasieu Pass measured a peak water level of 5.6 ft MHHW, and a USGS water level sensor in nearby Holly Beach recorded a peak level of 5.1 ft MHHW. Even with the considerable damage and debris in the area from Laura, the HCFCD/NWS team was able to locate fresh debris lines and stillwater marks left by Delta. The team surveyed a high water mark of 4.9 ft AGL in Cameron, and high water marks of 4.5 ft AGL were found in Creole and Grand Chenier, the two communities hit hardest by Laura’s storm surge.
Well to the east of Delta’s landfall, storm surge inundation near or slightly above 3 ft AGL occurred along the coasts of Mississippi and Alabama. In Mississippi, the NOS gauge at the Bay Waveland Yacht Club measured a peak water level of 3.5 ft MHHW, and a USGS water level sensor at Gulfport recorded a water level of 3.4 ft MHHW. In Alabama, the NOS gauge at Bayou La Batre Bridge registered 3.4 ft MHHW, and 3.3 ft MHHW was recorded in Mobile Bay at Coast Guard Sector Mobile.
Peak water levels along the coasts of Texas, southeastern Louisiana, and the Florida Panhandle were generally less than 3 ft MHHW. In Texas, the TCOON gauge at Texas Point-Sabine Pass measured a peak water level of 3.0 ft MHHW. The NOS gauge at the Bob Hall Pier in Corpus Christi recorded a water level of 3.2 ft MHHW, but the open-ocean exposure of this station likely makes it more susceptible to water rises due to wave setup. In southeastern Louisiana, the highest recorded water levels were 2.9 ft MHHW at several USGS stream gauges near Grand Isle and 2.8 ft MHHW at a US Army Corps of Engineers (USACE) gauge at Mandeville on the north shore of Lake Pontchartrain. The highest report along the Florida Panhandle was 2.3 ft MHHW by a USGS water level sensor at Navarre.
Rainfall and Flooding Delta produced a large area of 4–8 inches of rain across the northern portions of the
Yucatan Peninsula during its passage across that area. The heaviest rains fell in the vicinity of Cancun, where some areas experienced moderate flooding. Elsewhere across the Yucatan Peninsula, generally 2–4 inches of rain accumulated, except for slightly higher values in portions of the Mexican states of Campeche and Tabasco.
In the U.S., the heaviest rainfall produced by Delta fell primarily across southwestern and central Louisiana, where totals were in the 15–20-inch range between Lake Charles and Alexandria. In particular, LeBleu Settlement, Louisiana, observed 17.57 inches of rain from Delta, where significant flooding occurred. A larger area of 5–10 inches of rain occurred across much of Louisiana and far eastern Texas. Baton Rouge received nearly 10 inches of rain, which resulted in flooding in portions of the city. Heavy rains also occurred in southeastern Arkansas and western Mississippi, where a widespread area of 4–7 inches fell in association with Delta.

Hurricane Delta 7
Lesser amounts, generally 1–3 inches, occurred farther east across portions of extreme southeastern Louisiana, eastern Mississippi, Alabama, Georgia, and Tennessee associated with Delta and its extratropical remnants.
Tornadoes Delta’s outer rain bands and its extratropical remnants resulted in 13 tornadoes across portions of the northern Gulf Coast and the southeastern U.S. from 9–11 October (Fig 7). Of the 13 tornadoes, 1 occurred in Mississippi, 2 in Alabama, 7 in Georgia and 3 in South Carolina. There were 3 EF-1 tornadoes that occurred in portions of Georgia and South Carolina, while the others were rated EF-0. In particular, an EF-1 tornado caused tree and structural damage to homes near Newton, Georgia. Similar damage occurred with another EF-1 tornado near Dillon, South Carolina.
CASUALTY AND DAMAGE STATISTICS There were two direct deaths4 and two indirect fatalities reported in the U.S. from Hurricane Delta. The direct deaths were near Destin, Florida, where a 19-year old woman and a 49-year old man drowned in rip currents while the hurricane’s outer bands were nearby. The two indirect deaths in Louisiana were associated with electrocutions and fires during the preparation before the storm and clean-up after Delta’s passage. The NOAA National Centers for Environmental Information (NCEI) estimates that Delta caused around $2.9 billion (USD) in damage in the U.S. Damage was mostly confined to Louisiana, which was affected by category 4 Hurricane Laura a little over a month prior. In southwestern Louisiana, which was still in recovery from Laura, Delta caused additional damage to homes and businesses, and temporary roofs that were in place were blown away by Delta’s winds. Delta also blew around leftover debris piles from Laura, which caused roadways and drains to be blocked in some places. The most significant damage from Delta in Louisiana was due to widespread flooding, especially across the central portions of the state. In particular, there were several reports of flooded homes in Baton Rouge. Significant flash flooding occurred in Calcasieu, Louisiana, with several homes severely damaged. In Mississippi, tropical-storm-force wind gusts and flooding rains downed trees and knocked out power for nearly 100,000 homes and businesses. Elsewhere across the southeast U.S., damage was largely confined to the tornadoes associated with the storm (see section above). Images of some of the damage in Louisiana associated with Delta are shown in Figure 8.
In the Yucatan Peninsula of Mexico, there were no direct deaths, but there were two indirect fatalities caused by an electrocution and a fall during the clean-up after Delta moved through the area. About one-third of the population lost power during the storm due to widespread
4 Deaths occurring as a direct result of the forces of the tropical cyclone are referred to as “direct” deaths. These would include those persons who drowned in storm surge, rough seas, rip currents, and freshwater floods. Direct deaths also include casualties resulting from lightning and wind-related events (e.g., collapsing structures). Deaths occurring from such factors as heart attacks, house fires, electrocutions from downed power lines, vehicle accidents on wet roads, etc., are considered indirect” deaths.

Hurricane Delta 8
downed trees. There were reports of significant flooding in Cozumel and Playa del Carmen and many piers in the area were damaged. In Punta Cancun, mostly minor damage occurred to hotels and restaurants. The total damage from Delta in Mexico is estimated to be around $185 million (USD).
FORECAST AND WARNING CRITIQUE
Genesis
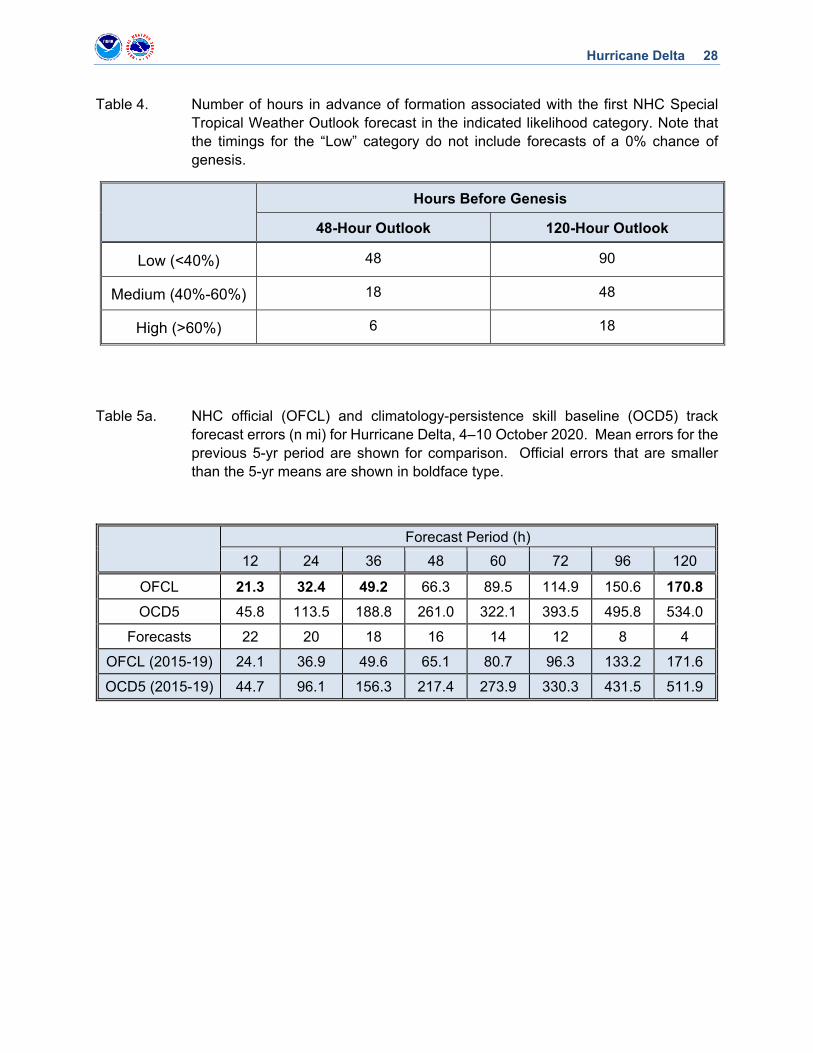
The genesis of Hurricane Delta was reasonably well forecast, but the tropical cyclone formed sooner than anticipated (Table 4). The tropical wave that became Delta was first included in the Tropical Weather Outlook 90 h before genesis occurred, giving the system a low (<40%) chance of tropical cyclone formation during the next five days. The probability of genesis reached the medium category (40–60%) 48 h before genesis occurred and the high category 18 h before the system developed. Regarding the 2-day genesis probabilities, a low chance of genesis was shown 48 h, a medium chance 18 h, and a high chance 6 h before Delta formed.
Track
A verification of NHC official track forecasts for Delta is given in Table 5a. Official forecast track errors were a little lower than the mean official errors for the previous 5-yr period from 12–36 h and at 120 h, but above the mean at the other forecast times. The official track forecasts during the early portions of Delta’s lifecycle had a significant right or northward bias (Fig. 9). The right bias during the early forecasts were likely the result of the convective asymmetry in Delta’s cloud pattern, which caused the center to unexpectedly reform to the south on 5 October. A homogeneous comparison of the official track errors with selected guidance models is given in Table 5b. GFSI and its ensemble mean AEMI were the best-performing models, and they largely beat the official forecasts. The track consensus models HCCA, TVCA, TVCX, TVDG, and GFEX were also strong performers. It should be noted, however, that nearly all of the models had a significant right bias around the time of Delta’s genesis due to the poorly forecast center reformation (Fig. 10), which illustrates the challenges in predicting these internal storm changes.
Intensity
A verification of NHC official intensity forecasts for Delta is given in Table 6a. Official forecast intensity errors were well above the mean official errors for the previous 5-yr period from 12 to 48 h and at 96 h, but below the long-term means at the other forecast times. NHC did not anticipate the first period of rapid intensification of Delta and the period of rapid weakening that quickly followed while the cyclone was over the northwestern Caribbean Sea. However, the official forecasts were much more accurate for the intensity of Delta when it was over the Gulf of Mexico (Fig. 11). A homogeneous comparison of the official intensity errors with selected guidance models is given in Table 6b. No model consistently beat the official forecasts, but overall the consensus aids HCCA, IVCN, and IVDR had the lowest errors.

Hurricane Delta 9
Storm Surge Forecasts and Watches and Warnings
Storm surge watches and warnings associated with Delta are given in Table 7 and indicated in Fig. 12. A Storm Surge Watch was first issued for the northern Gulf Coast from High Island, Texas, to the Alabama/Florida border, including all major intervening lakes and bays, at 1500 UTC 7 October. The portion of the watch area from Sabine Pass to Ocean Springs, Mississippi, was upgraded to a Storm Surge Warning at 0300 UTC 8 October, and the warning was extended westward to High Island at 1500 UTC 8 October. In effect, then, the final Storm Surge Warning area extended from High Island, Texas, to Ocean Springs, Mississippi, including all major intervening lakes and bays, and it extended well inland from the immediate coast in portions of Louisiana. Sustained tropical-storm-force winds first reached the coast around 1500 UTC 9 October, and the initial Storm Surge Watch and Warning were therefore issued approximately 48 h and 36 h, respectively, before that time.
Observations from numerous tide and stream gauges, water level sensor measurements, and surveyed high water marks indicate that storm surge inundation of 3 ft or greater above normally dry ground (which NHC uses as a first-cut threshold for the storm surge watch/warning) fell within the Storm Surge Warning area roughly between Sabine Pass and Caillou Bay in Terrebonne Parish, Louisiana (white markers within the magenta area, Fig. 12). Many of these observations were located within the Storm Surge Warning area well inland from the immediate coast, particularly north of Vermilion Bay. The portion of the Storm Surge Warning along the coast of Mississippi also verified, with several gauges recording water levels slightly above 3 ft MHHW.
Much of the Storm Surge Warning covering southeastern Louisiana did not verify, as all available gauge measurements from Terrebonne Bay eastward to the Pearl River, including around Lake Pontchartrain, were less than 3 ft MHHW (black markers within the magenta area, Fig. 12). However, some of these observations were very close 3 ft of inundation, and any eastward shift in Delta’s track would have increased inundation to warning criteria across southeastern Louisiana.
The initial Storm Surge Watch that covered the coast of Alabama (including Mobile Bay) and Jackson County, Mississippi, was not upgraded to a Storm Surge Warning; instead, it was discontinued late on 7 October and the morning of 8 October and replaced with Coastal Flood Advisories from the NWS Weather Forecast Offices (WFOs) in Mobile and New Orleans to communicate the expectation of minor coastal flooding of 1 to 3 ft AGL. Tide and stream gauges in this area recorded peak water levels as high as 3.4 ft MHHW, suggesting that the highest inundation along the coast was roughly 3 ft AGL.
As shown in Fig. 13, the initial peak storm surge inundation forecast issued at 1500 UTC 7 October was 7 to 11 ft above normally dry ground somewhere between Pecan Island and Port Fourchon, Louisiana, including Vermilion Bay. This inundation forecast range remained steady through Delta’s landfall, with the area shifting slightly and settling in from the Rockefeller Wildlife Refuge to Morgan City by 2100 UTC 8 October. Ultimately, the estimated peak inundation of 9 ft AGL verified right in the middle of the forecast range and occurred within the prescribed area.

Hurricane Delta 10
Wind Watches and Warnings
Coastal tropical storm and hurricane watches and warnings associated with Delta are listed in Table 8.
NHC provided support to the governments and meteorological services of Mexico, Cuba, and the Cayman Islands in coordination of forecast information and watches and warnings for those nations.
For the United States, hurricane and tropical storm watches were first issued for portions of the Mississippi, Louisiana, and Texas coasts at 1500 UTC 7 October. Since sustained tropical-storm force winds first reached the Louisiana and Texas coasts within the hurricane watch area around 1500 UTC 9 October, a lead time of 48 h was provided. A Hurricane Warning was issued from the central Louisiana coast to far the upper Texas coast at 0300 UTC 8 October and a Tropical Storm Warning was issued for the remainder of the Louisiana coast and a portion of upper Texas coast at the same time. These warnings provided a lead time of 36 h before the tropical-storm-force winds began.
NHC coordinates with the Weather Prediction Center (WPC) on hazard statements included in NHC public products related to inland flooding. The risk of life-threatening flash flooding along the central Gulf Coast was first mentioned in the NHC Key Messages in the Tropical Cyclone Discussion at 2100 UTC 4 October. The threat of flooding was expanded inland to include the Tennessee Valley by 0900 UTC 6 October.
Impact-Based Decision Support Services (IDSS) and Public Communication
NHC began communication with emergency managers on 5 October, shortly after Delta formed, and this continued through 10 October when the cyclone weakened over Mississippi. Briefings included federal video-teleconferences with FEMA Headquarters, FEMA Region 6, and FEMA Region 4. These decision support briefings were coordinated through the FEMA Hurricane Liaison Team, embedded at the NHC. In addition, the NHC director maintained direct communications with senior state emergency management officials to discuss the evolving threat to the Gulf coast. The NHC Director provided virtual briefings about the potential impacts from Hurricane Delta on 8 and 9 October to U.S. House of Representatives members and/or staffers from Texas, Louisiana, Mississippi, and Alabama. NHC’s Tropical Analysis and Forecast Branch provided seven briefings to officials at United States Coast Guard (USCG) District 8 and one briefing to USCG District 7.
Regarding collaboration with media partners, the NHC began a limited media pool on 7 October, followed by a full media pool on 8 and 9 October. A total of 88 interviews were conducted, which include a combination of generic broadcasts, network broadcasts, cable weather outlets, local affiliate outlets, and Skype. In addition, 25 audio podcasts were provided for Delta, which were used by national and local radio outlets. For social media, 12 Facebook Live broadcasts were conducted for Delta from 7–9 October and the NHC Atlantic Twitter account had 32 million impressions related to the hurricane.

Hurricane Delta 11
ACKNOWLEDGMENTS
Data in Table 3 were compiled from Post Tropical Cyclone Reports issued by the NWS WFOs in Houston, Lake Charles, New Orleans, Shreveport, and Jackson. Data from the Weather Prediction Center, National Data Buoy Center, NOS Center for Operational Oceanographic Products and Services, United States Geological Survey, Storm Prediction Center, and the Mexican Meteorological Service were also used in this report. Dennis Feltgen reported the media statistics used in this report and Tiffany O’Conner contributed to the IDSS section. NHC Hurricane Specialists Stacy Stewart and Philippe Papin provided valuable input that was helpful in analyzing Delta’s intensity.

Hurricane Delta 12
Table 1. Best track for Hurricane Delta, 4–10 October 2020.
Date/Time (UTC)
Latitude (°N)
Longitude (°W)
Pressure (mb)
Wind Speed (kt)
Stage
04 / 1800 16.4 76.2 1006 30 tropical depression
05 / 0000 16.4 77.0 1006 30 "
05 / 0600 16.4 77.7 1006 30 "
05 / 1200 16.4 78.4 1004 40 tropical storm
05 / 1800 16.4 79.1 985 55 "
06 / 0000 16.6 79.8 980 65 hurricane
06 / 0600 17.1 80.7 973 75 "
06 / 1200 17.8 82.0 959 100 "
06 / 1800 18.5 83.3 953 120 "
07 / 0000 19.3 84.6 962 100 "
07 / 0600 20.1 85.9 968 90 "
07 / 1030 20.8 86.9 971 90 "
07 / 1200 21.1 87.4 973 85 "
07 / 1800 21.7 88.8 978 75 "
08 / 0000 22.3 90.2 973 80 "
08 / 0600 23.0 91.4 973 85 "
08 / 1200 23.7 92.4 969 90 "
08 / 1800 24.5 93.1 960 100 "
09 / 0000 25.3 93.5 953 105 "
09 / 0600 26.3 93.7 953 105 "
09 / 1200 27.5 93.8 958 100 "
09 / 1800 28.7 93.6 966 90 "
09 / 2300 29.8 93.1 970 85 "
10 / 0000 30.1 92.9 971 75 "
10 / 0600 31.4 92.2 985 50 tropical storm
10 / 1200 32.5 91.4 993 35 "
10 / 1800 33.3 90.6 998 25 extratropical
11 / 0000 33.9 89.6 1002 25 "
11 / 0600 34.4 88.6 1004 25 "
11 / 1200 34.8 87.5 1005 20 "

Hurricane Delta 13
Date/Time (UTC)
Latitude (°N)
Longitude (°W)
Pressure (mb)
Wind Speed (kt)
Stage
11 / 1800 35.1 86.3 1007 20 "
12 / 0000 dissipated
06 / 1800 18.5 83.3 953 120 maximum wind and minimum pressure
07 / 1030 20.8 86.9 971 90 landfall near Puerto
Morelos, Mexico
09 / 2300 29.8 93.1 970 85 landfall near Creole,
Louisiana
Hurricane Delta 14
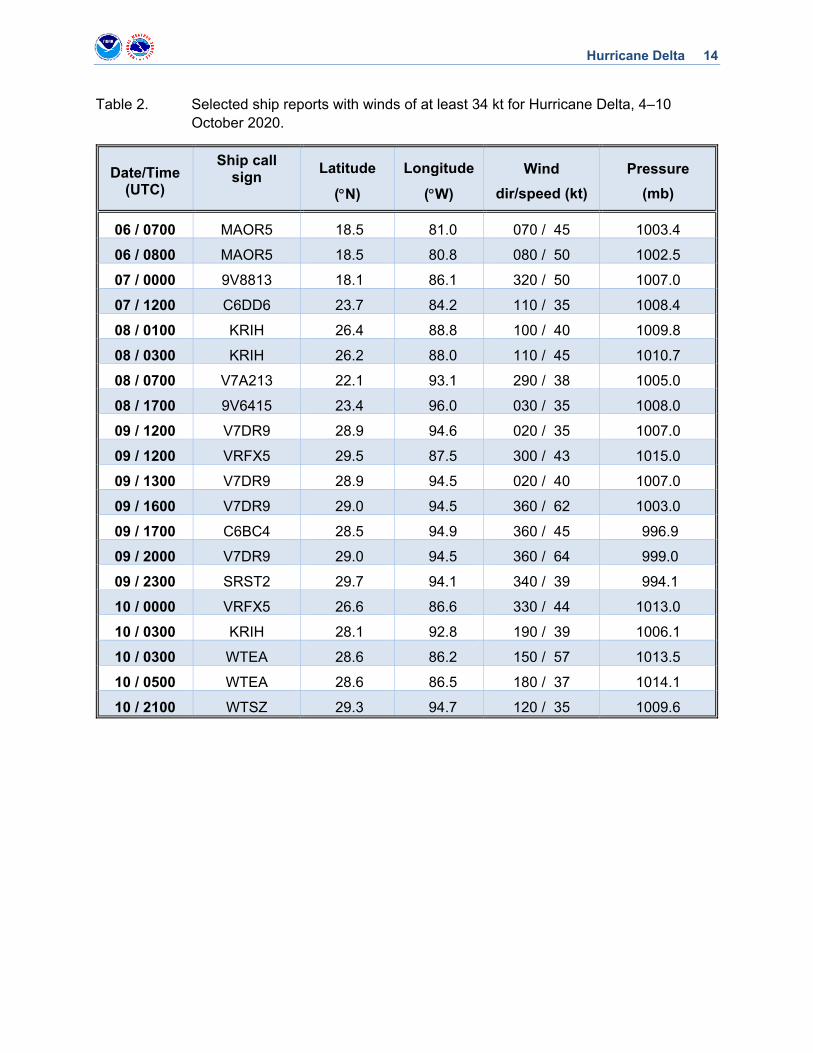
Table 2. Selected ship reports with winds of at least 34 kt for Hurricane Delta, 4–10 October 2020.
Date/Time (UTC)
Ship call sign
Latitude
(N)
Longitude
(W)
Wind
dir/speed (kt)
Pressure
(mb)
06 / 0700 MAOR5 18.5 81.0 070 / 45 1003.4
06 / 0800 MAOR5 18.5 80.8 080 / 50 1002.5
07 / 0000 9V8813 18.1 86.1 320 / 50 1007.0
07 / 1200 C6DD6 23.7 84.2 110 / 35 1008.4
08 / 0100 KRIH 26.4 88.8 100 / 40 1009.8
08 / 0300 KRIH 26.2 88.0 110 / 45 1010.7
08 / 0700 V7A213 22.1 93.1 290 / 38 1005.0
08 / 1700 9V6415 23.4 96.0 030 / 35 1008.0
09 / 1200 V7DR9 28.9 94.6 020 / 35 1007.0
09 / 1200 VRFX5 29.5 87.5 300 / 43 1015.0
09 / 1300 V7DR9 28.9 94.5 020 / 40 1007.0
09 / 1600 V7DR9 29.0 94.5 360 / 62 1003.0
09 / 1700 C6BC4 28.5 94.9 360 / 45 996.9
09 / 2000 V7DR9 29.0 94.5 360 / 64 999.0
09 / 2300 SRST2 29.7 94.1 340 / 39 994.1
10 / 0000 VRFX5 26.6 86.6 330 / 44 1013.0
10 / 0300 KRIH 28.1 92.8 190 / 39 1006.1
10 / 0300 WTEA 28.6 86.2 150 / 57 1013.5
10 / 0500 WTEA 28.6 86.5 180 / 37 1014.1
10 / 2100 WTSZ 29.3 94.7 120 / 35 1009.6
Hurricane Delta 15
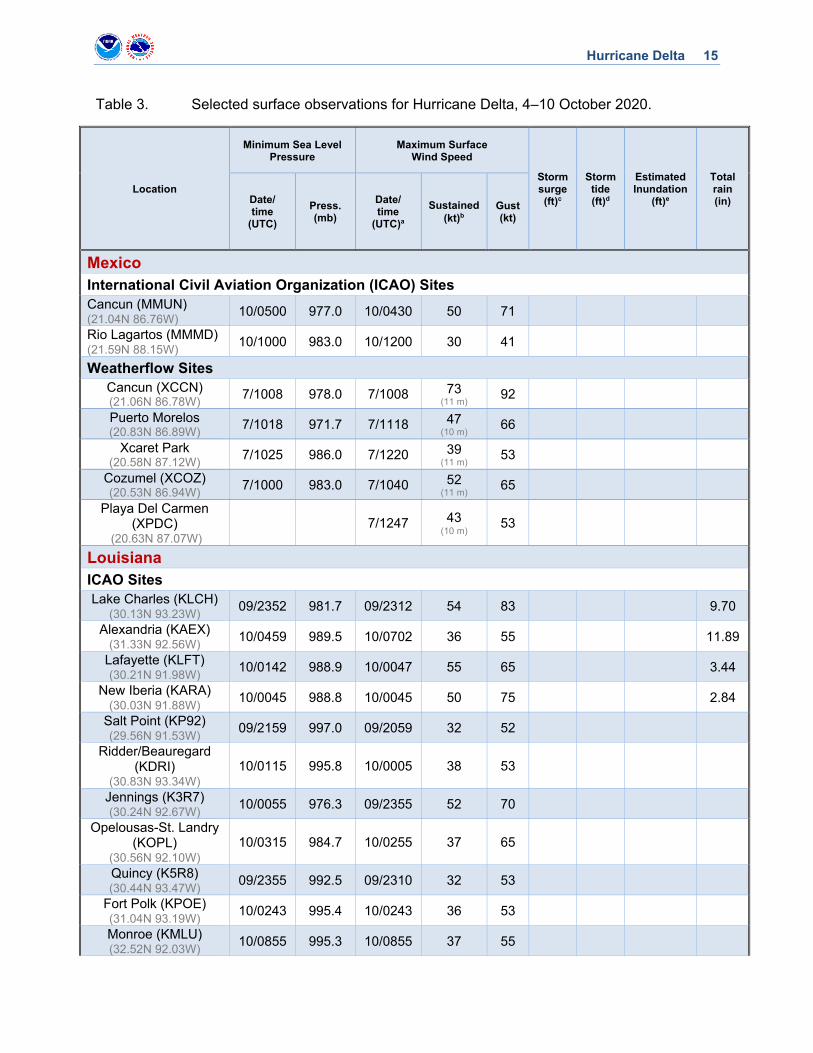
Table 3. Selected surface observations for Hurricane Delta, 4–10 October 2020.
Location
Minimum Sea Level Pressure
Maximum Surface Wind Speed
Storm surge (ft)c
Storm tide (ft)d
Estimated Inundation
(ft)e
Total rain (in) Date/
time (UTC)
Press. (mb)
Date/ time
(UTC)a
Sustained (kt)b
Gust (kt)
Mexico
International Civil Aviation Organization (ICAO) Sites
Cancun (MMUN) (21.04N 86.76W) 10/0500 977.0 10/0430 50 71
Rio Lagartos (MMMD) (21.59N 88.15W) 10/1000 983.0 10/1200 30 41
Weatherflow Sites
Cancun (XCCN) (21.06N 86.78W) 7/1008 978.0 7/1008 73
(11 m) 92
Puerto Morelos (20.83N 86.89W) 7/1018 971.7 7/1118 47
(10 m) 66
Xcaret Park (20.58N 87.12W) 7/1025 986.0 7/1220 39
(11 m) 53
Cozumel (XCOZ) (20.53N 86.94W) 7/1000 983.0 7/1040 52
(11 m) 65
Playa Del Carmen (XPDC)
(20.63N 87.07W) 7/1247 43
(10 m) 53
Louisiana
ICAO Sites
Lake Charles (KLCH) (30.13N 93.23W) 09/2352 981.7 09/2312 54 83 9.70
Alexandria (KAEX) (31.33N 92.56W) 10/0459 989.5 10/0702 36 55 11.89
Lafayette (KLFT) (30.21N 91.98W) 10/0142 988.9 10/0047 55 65 3.44
New Iberia (KARA) (30.03N 91.88W) 10/0045 988.8 10/0045 50 75 2.84
Salt Point (KP92) (29.56N 91.53W) 09/2159 997.0 09/2059 32 52
Ridder/Beauregard (KDRI)
(30.83N 93.34W) 10/0115 995.8 10/0005 38 53
Jennings (K3R7) (30.24N 92.67W) 10/0055 976.3 09/2355 52 70
Opelousas-St. Landry (KOPL)
(30.56N 92.10W) 10/0315 984.7 10/0255 37 65
Quincy (K5R8) (30.44N 93.47W) 09/2355 992.5 09/2310 32 53
Fort Polk (KPOE) (31.04N 93.19W) 10/0243 995.4 10/0243 36 53
Monroe (KMLU) (32.52N 92.03W) 10/0855 995.3 10/0855 37 55

Hurricane Delta 16
Location
Minimum Sea Level Pressure
Maximum Surface Wind Speed
Storm surge (ft)c
Storm tide (ft)d
Estimated Inundation
(ft)e
Total rain (in) Date/
time (UTC)
Press. (mb)
Date/ time
(UTC)a
Sustained (kt)b
Gust (kt)
Pearson Ridge (KAQV)
(31.40N 93.28W)
10/0121
10/0113 23 47
New Roads (KHZR) (30.72N 91.48W) 10/0555 33 52
Baton Rouge (KBTR) (30.54N 91.15W) 10/0330 995.9 10/0409 37 50 9.06
Gonzales (KREG) (30.17N 90.94W) 10/0315 33 48
New Orleans (KMSY) (29.98N 90.25W) 10/0256 1004.1 10/0052 33 43
Slidell (KASD) (30.35N 89.82W) 10/0553 1004.4 10/0448 27 39
Remote Automated Weather Stations (RAWS) Laccassine (LACL1)
(30.00N 92.89W) 09/2246 42 65
Vernon (LEVL1) (31.02N 93.19W) 10/0359 37 57
Weatherflow Sites
Mandeville (XMVL) (30.36N 90.09W) 10/0357 1002.2 10/0300 42 48
Bayou Bienvenue (XBYU)
(30.00N 89.90W) 10/0250 1001.6 10/0255 38 47
New Orleans (XLKF) (30.36N 90.02W) 10/0429 1002.8 10/0429 31 38
Dulac (XDUL) (29.35N 90.73W) 09/2209 1002.0 09/2217 37 45
Coastal Marine Automated Network (CMAN) Sites
Amerada Pass (AMRL1)
(29.45N 91.34W) 09/2312 998.6 09/2300 27 41
Eugene Island (EINL1) (29.37N 91.38W) 09/2154 998.2 09/2300 45 54
Berwick (TESL1) (29.67N 91.24W) 10/0112 33 45
Canal Locks (FRWL1) (29.55N 92.31W) 09/1848 35 51
Calacasieu Pass (CAPL1)
(29.77N 93.34W) 09/2224 973.5 09/2248 64
(13 m) 78
Shell Beach (SHBL1) (29.87N 89.67W) 10/0830 1006.2 10/0118 33 41
Pilottown (PILL1) (29.18N 89.26W) 10/0554 28 36
Hurricane Delta 17
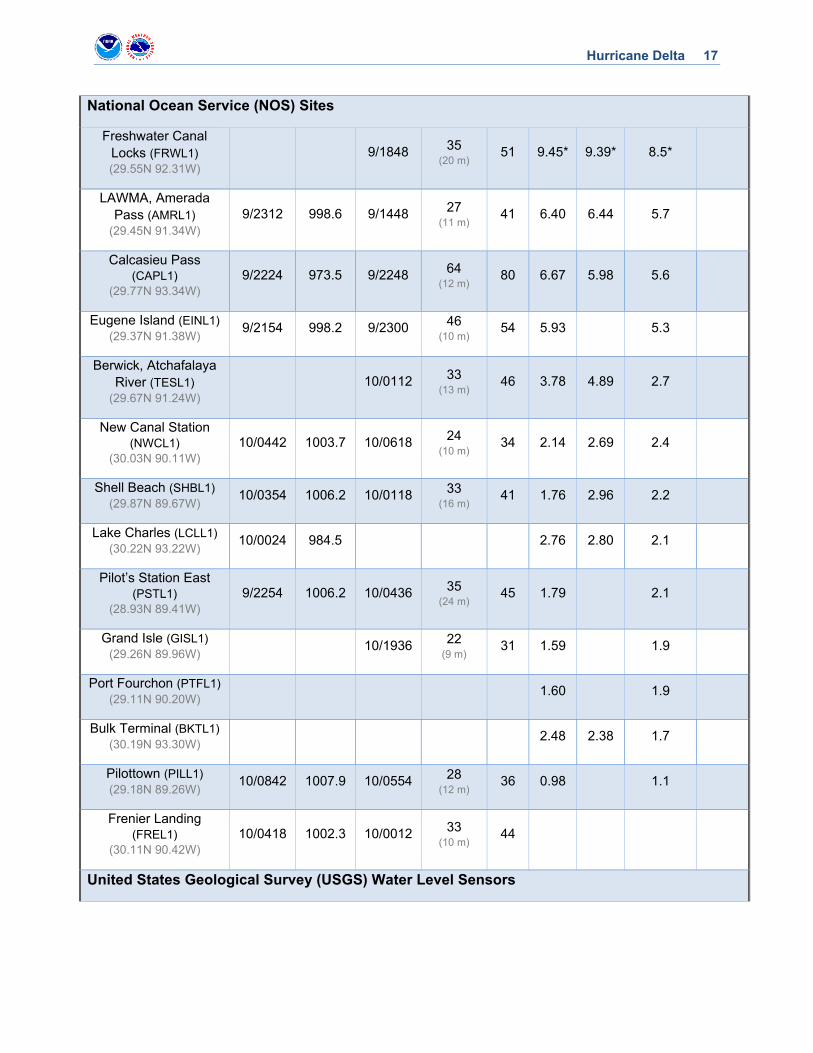
National Ocean Service (NOS) Sites
Freshwater Canal Locks (FRWL1) (29.55N 92.31W)
9/1848 35 (20 m)
51 9.45* 9.39* 8.5*
LAWMA, Amerada Pass (AMRL1)
(29.45N 91.34W) 9/2312 998.6 9/1448 27
(11 m) 41 6.40 6.44 5.7
Calcasieu Pass (CAPL1)
(29.77N 93.34W) 9/2224 973.5 9/2248 64
(12 m) 80 6.67 5.98 5.6
Eugene Island (EINL1) (29.37N 91.38W)
9/2154 998.2 9/2300 46 (10 m)
54 5.93 5.3
Berwick, Atchafalaya River (TESL1)
(29.67N 91.24W) 10/0112 33
(13 m) 46 3.78 4.89 2.7
New Canal Station (NWCL1)
(30.03N 90.11W) 10/0442 1003.7 10/0618 24
(10 m) 34 2.14 2.69 2.4
Shell Beach (SHBL1) (29.87N 89.67W)
10/0354 1006.2 10/0118 33 (16 m)
41 1.76 2.96 2.2
Lake Charles (LCLL1) (30.22N 93.22W)
10/0024 984.5 2.76 2.80 2.1
Pilot’s Station East (PSTL1)
(28.93N 89.41W) 9/2254 1006.2 10/0436 35
(24 m) 45 1.79 2.1
Grand Isle (GISL1) (29.26N 89.96W)
10/1936 22 (9 m)
31 1.59 1.9
Port Fourchon (PTFL1) (29.11N 90.20W)
1.60 1.9
Bulk Terminal (BKTL1) (30.19N 93.30W)
2.48 2.38 1.7
Pilottown (PILL1) (29.18N 89.26W)
10/0842 1007.9 10/0554 28 (12 m)
36 0.98 1.1
Frenier Landing (FREL1)
(30.11N 90.42W) 10/0418 1002.3 10/0012 33
(10 m) 44
United States Geological Survey (USGS) Water Level Sensors

Hurricane Delta 18
Cypremort Point (LASTM27175)
(29.73N 91.86W) 9.28 8.0
Vermilion Parish – Freshwater Canal
(LAVER27068) (29.54N 92.31W)
9.76 6.8
Holly Beach (LACAM27066)
(29.77N 93.46W) 6.50 5.1
Rockefeller Wildlife Refuge (LACAM27067)
(29.71N 92.77W) 5.18 4.2
Cameron Parish – Mae’s Beach (LACAM04361)
(29.75N 93.66W)
5.36 3.9
Dularge (LATER27180) (29.34N 90.84W)
3.77 2.8
Slidell (LASTT23298) (30.18N 89.73W)
3.17 1.2
USGS Stream Gauges
Vermilion Bay near Intracoastal City
(ICCL1) (29.67N 92.14W)
6.43 5.2
Caillou Lake SW of Dulac (DCLL1)
(29.25N 90.92W) 5.25 4.2
Lower Atchafalaya River at Morgan City
(MRGL1) (29.69N 91.21W)
5.93 4.0
Caillou Bay SW of Cocodrie (CCOL1)
(29.08N 90.87W) 4.49 3.6
Barataria Bay N of Grand Isle (NGIL1)
(29.42N 89.95W) 3.78 2.9

Hurricane Delta 19
Hackberry Bay NW of Grand Isle (HACL1)
(29.40N 90.04W) 3.70 2.9
Little Lake near Cutoff (CTFL1)
(29.52N 90.18W) 3.54 2.8
Calcasieu River at I-10 Lake Charles (LKHL1)
(30.24N 93.25W) 3.62 2.7
Mississippi Sound near Grand Pass
(GRPL1) (30.12N 89.25W)
3.68 2.5
Barataria Pass at Grand Isle (EGIL1)
(29.27N 89.95W) 3.25 2.4
Caminada Pass NW of Grand Isle (CPGL1)
(29.23N 90.05W) 3.21 2.4
Crooked Bayou near Delacroix (GRPL1)
(29.71N 89.72W) 3.65 2.3
Black Bay near Pointe-a-la-Hache
(PSIL1) (29.63N 89.56W)
2.47 1.1
US Army Corps of Engineers (USACE) Gauges
Lake Pontchartrain at Mandeville (LPML1) (30.37N 90.09W)
3.45 2.8
Lake Pontchartrain at Lakefront Airport
(LPML1) (30.04N 90.02W)
3.16 2.6
Pass Manchac Pontchatoula (LPML1)
(30.28N 90.40W) 3.43 2.4
Lake Pontchartrain – West End (WEGL1)
(30.02N 90.12W) 2.84 2.4

Hurricane Delta 20
Chef Manteur Pass near Lake Borgne
(CMPL1) (30.07N 89.80W)
3.20 2.1
Gulf Intracoastal Waterway near Paris Bridge Road (PRSL1)
(30.01N 89.94W)
2.93 1.7
Harris County Flood Control District / NWS High Water Marks
Vermilion Parish – SW of Freshwater Canal
Locks (29.54N 92.33W)
10.06 7.8
Pecan Island (29.64N 92.43W)
7.7 6.7
Cypremort Point (29.72N 91.88W)
8.9 6.6
Freshwater Canal Locks
(29.55N 92.31W) 8.54 6.0
Cypremort Point (29.71N 91.88W)
8.8 5.8
Pecan Island (29.66N 92.50W)
6.75 5.3
Pecan Island (29.64N 92.41W)
7.1 5.2
Intracoastal City (29.78N 92.16W)
8.0 5.0
Pecan Island (29.65N 92.47W)
7.6 5.0
Cameron (29.81N 93.34W)
6.6 4.9
Burns Point (29.57N 91.54W)
7.37 4.8
Grand Chenier (29.72N 92.76W)
6.62 4.5
Creole (29.78N 93.06W)
7.0 4.5

Hurricane Delta 21
Pecan Island (29.66N 92.53W)
6.7 4.4
Pecan Island (29.63N 92.39W)
6.8 4.3
Port of St. Mary (29.78N 91.75W)
8.46 4.2
Intracoastal City (29.78N 92.18W)
8.2 4.2
Grand Chenier (29.74N 92.84W)
6.24 4.2
Weeks Island (29.83N 91.79W)
6.5 4.0
Esther (29.84N 92.03W)
7.02 4.0
Delcambre (29.88N 92.00W)
6.13 3.9
Creole (29.79N 93.11W)
7.4 3.8
Pecan Island (29.65N 92.36W)
5.7 3.7
Pecan Island (29.63N 92.38W)
6.1 3.7
Pecan Island (29.64N 92.44W)
6.6 3.7
Superior Canal (29.75N 92.66W)
5.5 3.7
Grand Chenier (29.76N 93.02W)
7.0 3.6
North of Burns Point (29.60N 91.52W)
5.8 3.5
Alice B (29.77N 91.79W)
9.0 3.5
Esther (29.82N 92.14W)
6.09 3.5
Grand Chenier (29.73N 92.82W)
6.02 3.4
Duboin (29.94N 91.83W)
6.6 3.3

Hurricane Delta 22
New Iberia (29.95N 91.84W)
6.4 3.2
Grand Chenier (29.74N 92.87W)
7.2 2.8
Grand Chenier (29.72N 92.78W)
4.5 2.6
Grand Chenier (29.76N 92.95W)
7.9 2.5
Holly Beach (29.77N 93.46W)
4.8 2.5
Pecan Island (29.63N 92.37W)
5.5 2.4
Grand Chenier (29.75N 92.90W)
8.06 2.3
Cameron (29.78N 93.28W)
7.5 2.2
Esther (29.84N 92.17W)
3.42 2.0
Hydrometeorological Automated Data System (HADS) Sites 3 NW LeBleu Settlement
(CWOL1) (30.30N 93.12W)
15.01
3 SSW Gillis (MBLL1) (30.34N 93.22W) 12.30
1 WSW Moss Bluff (MBFL1)
(30.30N 93.22W) 12.15
2 N Alexandria (ALXL1) (31.32N 92.47W) 12.00
2 SW Oberlin (OBEL1) (30.60N 92.78W) 11.57
Zachary HWY 64 (WBGL1)
(30.64N 91.12W) 10.20
Pride (PRIL1) (30.67N 90.96W) 9.70
Milldale (MLDL1) (30.70N 91.05W) 8.61
Baton Rouge Sherwood (BRSL1)
(30.45N 91.05W) 7.20
Gloster (GLOM6) (31.17N 91.03) 6.96
Community Collaborative Rain, Hail and Snow Network (CoCoRaHS) Sites 3 SW Alexandria
(LA-RP-7) (31.17N 91.03)
13.07

Hurricane Delta 23
4.1 NNW Columbia (LA-CW-3)
(32.17N 92.11) 11.42
Brownsfield (LA-EB-9) (30.61N 91.05) 9.81
Greenwell Springs (LA-EB-64)
(30.55N 90.99) 9.39
Denham Springs (LA-LV-2)
(30.58N 90.97) 9.16
Public/Other 3 SSW Le Blue
Settlement (30.24N 93.07W)
17.57
Woodworth (31.15N 92.50W) 17.22
3 NE Calcasieu (31.13N 92.68W) 16.44
5 SSW Oakdale (30.75N 92.69W) 14.60
Mississippi ICAO Sites
McComb (KMCB) (31.18N 90.47W) 10/0731 998.3 10/0732 33 45
Gulfport (KGPT) (30.40N 89.07W) 10/1013 1006.1 10/0457 29 38
Biloxi (KBIX) (30.43N 88.92W) 10/0743 1006.3 10/0743 29 38
Pascagoula (KPQL) (30.46N 88.53W) 10/0844 1006.8 10/0745 24 35
Greenville (KGLH) (33.29N 90.05W) 10/0935 992.2 10/0846 31 47
Greenwood (KGWO) (33.29N 90.05W) 10/1146 992.6 10/0853 24 38
Jackson (KJAN) (32.19N 90.04W) 10/0938 996.6 10/1014 35 47
Hattiesburg (KHBG) 10/0714 998.6 10/0553 24 36
Vicksburg (KTVR) 10/1018 989.5 10/0853 23 39
NOS Sites
Bay Waveland Yacht Club (WYCM6)
(30.33N 89.33W) 10/0600 1005.3 10/0612 38 47 3.23 4.55 3.5
Pascagoula NOAA Lab (PNLM6)
(30.37N 88.56W) 2.87 4.14 3.3
Petit Bois Island, Port of Pascagoula
(PTBM6) (30.21N 88.51W)
10/0830 1006.8 10/0918 30 (5 m) 41
Weatherflow Sites
Ship Island (XSHI) (30.23N 88.98W) 10/0441 1006.2 10/0634 33
(12 m) 36

Hurricane Delta 24
HADS Sites
Eudora (EDAA4) (33.12N 91.26W) 7.87
Natchez (NATM6) (31.55N 91.39W) 6.94
Stoneville (STNM6) (33.42N 90.92W) 6.80
Port Gibson (PGBM6) (31.92N 90.97W) 5.79
Meadville (MDM6) (31.47N 90.89W) 5.15
CoCoRaHS Sites Liberty (MS-AM-1) (31.20N 90.70W) 4.43
Jayess (MS-PK-2) (31.30N 90.26W) 3.58
Texas
ICAO Sites
Beaumont (KBPT) (29.95N 94.02W) 09/2343 989.8 09/2315 57 78 4.93
Galveston (KGLS) (29.27N 94.87W) 09/1952 997.8 09/1952 38 50
Houston – Hobby Airport (KHOU) (29.65N 95.28W)
09/1953 1003.0 09/2219 25 37
Weatherflow Sites
Crab Lake (XCRB) (29.47N 94.62W) 09/1911 52
(20 m) 60
Levee (XLEV) (29.27N 94.89) 09/1941 42
(8 m) 50
Galveston Pier (XGRP)
(29.25N 94.85W) 09/1921 41
(12 m) 49
Surfside (XSRF) (28.93N 95.29W) 09/1821 35
(8 m) 46
Texas City (XTEX) (29.37N 94.95W) 09/1846 34
(20 m) 42
NOS Sites
Morgans Point (MGPT2)
(29.68N 94.99W) 09/1936 1000.5 09/1912 31 39
Eagle Point (EPTT2) (29.48N 94.92W) 09/1948 998.0 09/1936 33 44
Texas Coastal Ocean Observation Network (TCOON) Sites
High Island (HIST2) (29.60N 94.39W) 09/2154 993.0 09/2154 46 59 2.59 2.35 1.7
Rollover Pass (RLOt2) (29.52N 94.51W) 09/2042 996.0 09/1948 44 54 3.05 2.57 2.0
Galveston North Jetty (GNJT2)
(29.36N 94.72W) 09/2024 995.0 09/2030 45
(12 m) 54 3.10 3.35 2.2
San Luis Pass (LUIT2) (29.08N 95.12W) 09/1924 1001.6 09/1748 37 47 3.43 3.78 2.9

Hurricane Delta 25
Sargent (SGNT2) (28.77N 95.62W) 09/1800 1002.6 09/1648 28 35 2.37 3.33 2.3
Texas Point (TXPT2) (29.69N 93.84W) 09/2306 983.7 09/2300 70
(13 m) 87 4.39 3.82 3.0
Galveston Railroad Bridge (GRRT2) (29.30N 94.90W)
9/1954 998.1 9/1818 39 (11 m)
49 3.23 3.61 2.7
Aransas Pass (ANPT2) (27.84N 97.04W)
9/2100 1005.2 8/2200 21 (14 m)
24 2.45 3.41 2.6
Port Aransas (RTAT2) (27.84N 97.07W)
9/2118 1005.9 8/2218 18 (11 m)
23 2.75 3.34 2.4
Port O’Connor (PCNT2)
(28.45N 96.40W) 9/2030 1005.1 9/1300 24
(9 m) 28 2.57 3.51 2.4
Port Lavaca (VCAT2) (28.64N 96.61W)
9/2042 1005.5 9/1842 19 23 2.60 2.3
Matagorda City (EMAT2)
(28.71N 95.91W) 9/1830 1003.5 9/1924 26
(9 m) 36 2.58 3.33 2.3
Packery Channel (PACT2)
(27.63N 97.24W) 9/2036 1005.8 8/2242 21
(11 m) 26 1.58 3.04 2.3
USS Lexington – Corpus Christi (TAQT2)
(27.81N 97.39W) 9/2106 1005.4 2.25 3.24 2.2
Freeport SPIP (FPST2) (28.94N 95.29W)
9/1806 1000.5 9/0836 30 (15 m)
44 2.99 3.13 2.2
Aransas Wildlife Refuge (AWRT2) (28.23N 96.80W)
9/2048 1004.9 9/1836 19 26 2.19 3.35 2.1
Seadrift (SDRT2) (28.41N 96.71W)
9/2042 1005.6 9/1754 16 (10 m)
24 2.21 3.40 2.1
Manchester (NCHT2) (29.73N 95.27W)
9/2012 1002.2 9/2242 19 27 1.51 3.52 1.8
Port Arthur (PORT2) (29.87N 93.93W)
9/2324 988.6 9/2324 51 (11 m)
68 1.86 2.13 1.5
Rainbow Bridge (8770520)
(29.98N 93.88W) 1.16 1.85 1.3
HADS Sites Anahuac
(29.76N 94.68W) 4.07

Hurricane Delta 26
Crystal Beach (29.47N 94.61W) 3.55
Texas Tech University
101 (30.07N 92.86W) 972.9 43 52
102 (30.31N 92.74W) 976.3 51 68
104 (30.13N 93.02W) 974.5 46 59
108 (30.19N 92.81W) 974.8 46 57
111 (30.07N 93.18W) 979.5 53 67
215 (30.10N 92.70W) 974.0 54 66
326 (29.95N 92.36W) 978.1 60 72
334 (30.05N 92.48W) 981.0 56 69
Alabama
NOS Sites
Bayou La Batre Bridge (BLBA1)
(30.41N 88.25W) 3.26 4.37 3.4
Coast Guard Sector Mobile (MCGA1) (30.65N 88.06W)
10/1930 1007.1 10/1024 20 (9 m)
30 3.54 4.47 3.3
West Fowl River Bridge (WFRA1) (30.38N 88.16W)
2.98 4.10 3.2
Dog River Bridge (BYSA1)
(30.57N 88.09W) 2.71 3.1
Mobile State Docks (OBLA1)
(30.71N 88.04W) 10/1924 1006.8 2.79 4.16 3.0
Chickasaw Creek (CIKA1)
(30.78N 88.07W) 2.87 4.04 2.8
Weeks Bay, Mobile Bay (WBYA1)
(30.42N 87.83W) 2.53 2.7
East Fowl River Bridge (EFRA1)
(30.44N 88.11W) 2.27 3.44 2.6

Hurricane Delta 27
Dauphin Island (DILA1) (30.25N 88.08W)
1.90 2.88 2.2
Fort Morgan (FMOA1) (30.23N 88.03W)
10/1930 1007.5 10/0342 37 (38 m)
44
USGS Water Level Sensors
Fairhope (ALBAL00004) (30.53N 87.91W)
4.46 3.2
Florida
NOS Sites
Pensacola (PCLF1) (30.40N 87.21W)
10/2012 1007.8 10/1430 21 (10 m)
25 2.16 3.03 2.1
Panama City Beach (PCBF1)
(30.21N 85.88W) 10/2218 1009.2 10/2100 26
(17 m) 35 1.71 2.71 1.9
Panama City (PACF1) (30.15N 85.67W)
10/1606 21 (10 m)
29 1.56 2.54 1.8
USGS Water Level Sensors
Navarre (FLSAN23280) (30.38N 86.86W)
3.22 2.3
Shalimar (FLOKA03301)
(30.44N 86.58W) 2.43 1.8
St. Andrews State Park (FLBAY26247)
(30.13N 85.74W) 2.74 1.8
Offshore
Yucatan Basin (42056) (19.82.94N 84.95W)
7/0320 975.9 06/0950 64 (4 m, 1 min) 75
West Gulf (42002) (26.06N 93.65W)
9/0430 957.7 09/0350 66 (4 m, 1 min) 76
a Date/time is for sustained wind when both sustained and gust are listed. b Except as noted, sustained wind averaging periods for C-MAN and land-based reports are 2 min; buoy averaging
periods are 8 min. c Storm surge is water height above normal astronomical tide level. d For most locations, storm tide is water height above the North American Vertical Datum of 1988 (NAVD88). e Estimated inundation is the maximum height of water above ground. For NOS tide gauges, the height of the water
above Mean Higher High Water (MHHW) is used as a proxy for inundation. * This data is from a temporary station that was installed at Freshwater Canal Locks before Delta. This sensor reached
its physical limit, and the peak water level may have been higher than these measurements.
Hurricane Delta 28
Table 4. Number of hours in advance of formation associated with the first NHC Special Tropical Weather Outlook forecast in the indicated likelihood category. Note that the timings for the “Low” category do not include forecasts of a 0% chance of genesis.
Hours Before Genesis
48-Hour Outlook 120-Hour Outlook
Low (<40%) 48 90
Medium (40%-60%) 18 48
High (>60%) 6 18
Table 5a. NHC official (OFCL) and climatology-persistence skill baseline (OCD5) track forecast errors (n mi) for Hurricane Delta, 4–10 October 2020. Mean errors for the previous 5-yr period are shown for comparison. Official errors that are smaller than the 5-yr means are shown in boldface type.
Forecast Period (h)
12 24 36 48 60 72 96 120
OFCL 21.3 32.4 49.2 66.3 89.5 114.9 150.6 170.8
OCD5 45.8 113.5 188.8 261.0 322.1 393.5 495.8 534.0
Forecasts 22 20 18 16 14 12 8 4
OFCL (2015-19) 24.1 36.9 49.6 65.1 80.7 96.3 133.2 171.6
OCD5 (2015-19) 44.7 96.1 156.3 217.4 273.9 330.3 431.5 511.9

Hurricane Delta 29
Table 5b. Homogeneous comparison of selected track forecast guidance models (in n mi) for Hurricane Delta, 4–10 October 2020. Errors smaller than the NHC official forecast are shown in boldface type. The number of official forecasts shown here will generally be smaller than that shown in Table 5a due to the homogeneity requirement.
Model ID Forecast Period (h)
12 24 36 48 60 72 96 120
OFCL 21.0 30.6 46.1 60.4 82.8 109.2 148.5 169.8
OCD5 46.6 112.6 193.0 270.8 335.0 404.7 496.5 540.3
GFSI 18.5 29.9 43.0 50.7 76.7 105.2 144.7 156.1
HMNI 19.9 32.0 45.3 58.8 79.4 105.3 207.5 246.4
HWFI 22.0 38.5 52.8 67.3 78.2 104.5 181.1 261.0
EMXI 22.5 33.9 45.9 66.3 89.1 122.0 152.5 187.5
CMCI 33.9 57.8 75.7 86.6 105.9 141.6 197.6 219.8
NVGI 29.4 51.7 67.2 90.8 99.5 116.4 213.7 329.1
CTCI 22.9 38.2 53.1 75.2 103.4 144.0 221.4 300.7
AEMI 19.4 32.1 44.2 54.0 68.5 91.8 119.9 119.7
HCCA 17.5 27.7 41.6 58.5 76.1 91.9 121.9 175.8
TVCX 19.6 29.2 42.6 56.1 74.9 99.8 143.5 178.6
TVCA 19.8 30.0 43.3 55.9 74.9 101.8 142.2 176.4
TVDG 18.9 27.9 41.6 55.7 76.1 105.0 144.3 173.4
GFEX 20.3 29.5 39.4 52.3 71.7 95.3 141.2 172.4
TABS 59.0 121.5 169.0 176.3 162.6 168.7 135.0 151.4
TABM 34.0 57.4 74.9 90.5 112.6 141.5 208.4 214.6
TABD 26.7 52.6 84.8 126.7 180.8 245.8 363.3 562.3
Forecasts 18 17 16 14 12 10 6 3

Hurricane Delta 30
Table 6a. NHC official (OFCL) and climatology-persistence skill baseline (OCD5) intensity forecast errors (kt) for Hurricane Delta, 4–10 October 2020. Mean errors for the previous 5-yr period are shown for comparison. Official errors that are smaller than the 5-yr means are shown in boldface type.
Forecast Period (h)
12 24 36 48 60 72 96 120
OFCL 11.8 16.8 19.4 17.5 10.4 8.3 18.8 3.8
OCD5 14.7 21.8 28.3 29.7 26.6 29.4 36.4 20.8
Forecasts 22 20 18 16 14 12 8 4
OFCL (2015-19) 5.2 7.7 9.4 10.7 11.9 13.0 14.4 15.5
OCD5 (2015-19) 6.8 10.8 14.1 17.0 18.8 20.6 22.5 24.6
Table 6b. Homogeneous comparison of selected intensity forecast guidance models (in kt) for Hurricane Delta, 4–10 October 2020. Errors smaller than the NHC official forecast are shown in boldface type. The number of official forecasts shown here will generally be smaller than that shown in Table 6a due to the homogeneity requirement.
Model ID Forecast Period (h)
12 24 36 48 60 72 96 120
OFCL 12.5 15.9 18.4 14.3 9.6 8.5 16.7 3.3
OCD5 16.0 20.1 29.6 26.2 23.8 28.4 39.7 18.3
HMNI 11.3 16.3 16.5 11.3 8.5 10.6 21.2 16.7
HWFI 10.8 15.2 17.5 11.1 10.1 12.0 27.3 22.7
CTCI 11.5 18.2 19.4 15.6 20.3 18.0 17.5 52.7
DSHP 11.9 15.2 18.1 16.1 11.8 5.7 16.3 5.7
LGEM 12.2 18.5 24.2 20.5 12.6 5.9 24.5 13.0
GFSI 16.4 21.8 19.8 9.2 7.6 12.3 26.5 27.0
EMXI 16.6 23.0 22.6 14.8 12.5 22.8 41.8 32.0
HCCA 10.4 14.9 17.1 11.6 8.1 7.4 17.0 8.0
IVCN 10.4 15.8 17.4 12.1 7.1 5.0 16.7 7.3
IVDR 10.8 16.0 17.2 10.6 6.5 4.7 16.7 7.0
Forecasts 18 17 16 14 12 10 6 3

Hurricane Delta 31
Table 7. Storm surge watch and warning summary for Hurricane Delta, 4–10 October 2020.
Date/Time (UTC)
Action Location
7 / 1500 Storm Surge Watch issued High Island TX to the AL/FL border
7 / 1500 Storm Surge Watch issued Lake Pontchartrain, Lake Maurepas, Lake Borgne, Mobile Bay, Calcasieu Lake, and
Vermilion Bay
8 / 0300 Storm Surge Warning issued Sabine Pass to Ocean Springs MS
8 / 0300 Storm Surge Warning issued Lake Pontchartrain, Lake Maurepas, Lake
Borgne, Calcasieu Lake, and Vermilion Bay
8 / 0300 Storm Surge Watch discontinued MS/AL border to AL/FL border, including
Mobile Bay
8 / 1200 Storm Surge Watch discontinued Ocean Springs MS to MS/AL border
8 / 1500 Storm Surge Warning modified High Island TX to Ocean Springs MS
9 / 0900 Storm Surge Warning discontinued Mouth of the Pearl River to Ocean Springs MS, including Lake Pontchartrain and Lake
Maurepas
10 / 0000 Storm Surge Warning discontinued High Island TX to Sabine Pass
10 / 0300 Storm Surge Warning discontinued Sabine Pass to Cameron LA, including
Calcasieu Lake
10 / 0600 Storm Surge Warning discontinued Port Fourchon LA to mouth of the Pearl
River, including Lake Borgne
10 / 0900 Storm Surge Warning discontinued All

Hurricane Delta 32
Table 8. Hurricane and tropical storm watch and warning summary for Hurricane Delta, 4–10 October 2020.
Date/Time (UTC)
Action Location
4 / 2100 Tropical Storm Watch issued La Habana
4 / 2100 Tropical Storm Warning issued Cayman Islands
4 / 2100 Hurricane Watch issued Pinar del Rio to Artemisa
4 / 2100 Hurricane Watch issued Isle of Youth
5 / 1500 Hurricane Watch changed to Hurricane Warning
Pinar del Rio
5 / 1500 Tropical Storm Warning issued Isle of Youth
5 / 1500 Hurricane Watch issued Artemisa
5 / 2100 Hurricane Warning issued Tulum to Rio Lagartos
6 / 0300 Hurricane Watch changed to Tropical Storm Warning
Isle of Youth
6 / 0300 Hurricane Warning changed to Tropical Storm Warning
Pinar del Rio
6 / 0300 Tropical Storm Warning issued Punta Herrero to Tulum
6 / 0300 Tropical Storm Warning issued Rio Lagartos to Progreso
6 / 0300 Hurricane Watch discontinued All
6 / 0900 Tropical Storm Warning modified to Dzilam to Progreso
6 / 0900 Hurricane Warning modified to Tulum to Dzilam
6 / 1800 Tropical Storm Warning discontinued Cayman Islands
6 / 2100 Tropical Storm Watch discontinued All
7 / 0900 Tropical Storm Warning discontinued Isle of Youth
7 / 1500 Tropical Storm Watch issued San Luis Pass to High Island
7 / 1500 Tropical Storm Watch issued Grand Isle to Bay Saint Louis
7 / 1500 Tropical Storm Watch issued Lake Pontchartrain
7 / 1500 Tropical Storm Watch issued Lake Maurepas
7 / 1500 Tropical Storm Warning discontinued Pinar del Rio
7 / 1500 Hurricane Watch issued High Island to Grand Isle
7 / 1800 Tropical Storm Warning discontinued Punta Herrero to Tulum
8 / 0000 Tropical Storm Warning modified to Rio Lagartos to Dzilam
8 / 0000 Hurricane Warning discontinued All
8 / 0300 Tropical Storm Watch changed to Tropical Storm Warning
Lake Pontchartrain

Hurricane Delta 33
Date/Time (UTC)
Action Location
8 / 0300 Tropical Storm Watch changed to Tropical Storm Warning
Lake Maurepas
8 / 0300 Tropical Storm Watch discontinued San Luis Pass to High Island
8 / 0300 Tropical Storm Watch modified to Pearl River to Bay Saint Louis
8 / 0300 Tropical Storm Warning discontinued Rio Lagartos to Dzilam
8 / 0300 Tropical Storm Warning issued San Luis Pass to Sabine Pass
8 / 0300 Tropical Storm Warning issued Morgan City to Pearl River
8 / 0300 Hurricane Watch discontinued All
8 / 0300 Hurricane Warning issued Sabine Pass to Morgan City
8 / 1500 Tropical Storm Warning modified to San Luis Pass to High Island
8 / 1500 Hurricane Warning modified to High Island to Morgan City
8 / 2100 Tropical Storm Warning modified to Sargent to High Island
9 / 0900 Tropical Storm Watch discontinued All
10 / 0000 Tropical Storm Warning modified to San Luis Pass to High Island
10 / 0300 Tropical Storm Warning discontinued San Luis Pass to High Island
10 / 0600 Tropical Storm Warning discontinued Morgan City to Pearl River
10 / 0600 Hurricane Warning modified to High Island to Pearl River
10 / 0900 Hurricane and Tropical Storm Warnings discontinued
All

Hurricane Delta 34
Figure 1. Best track positions for Hurricane Delta, 4–10 October 2020.
Hurricane Delta 35
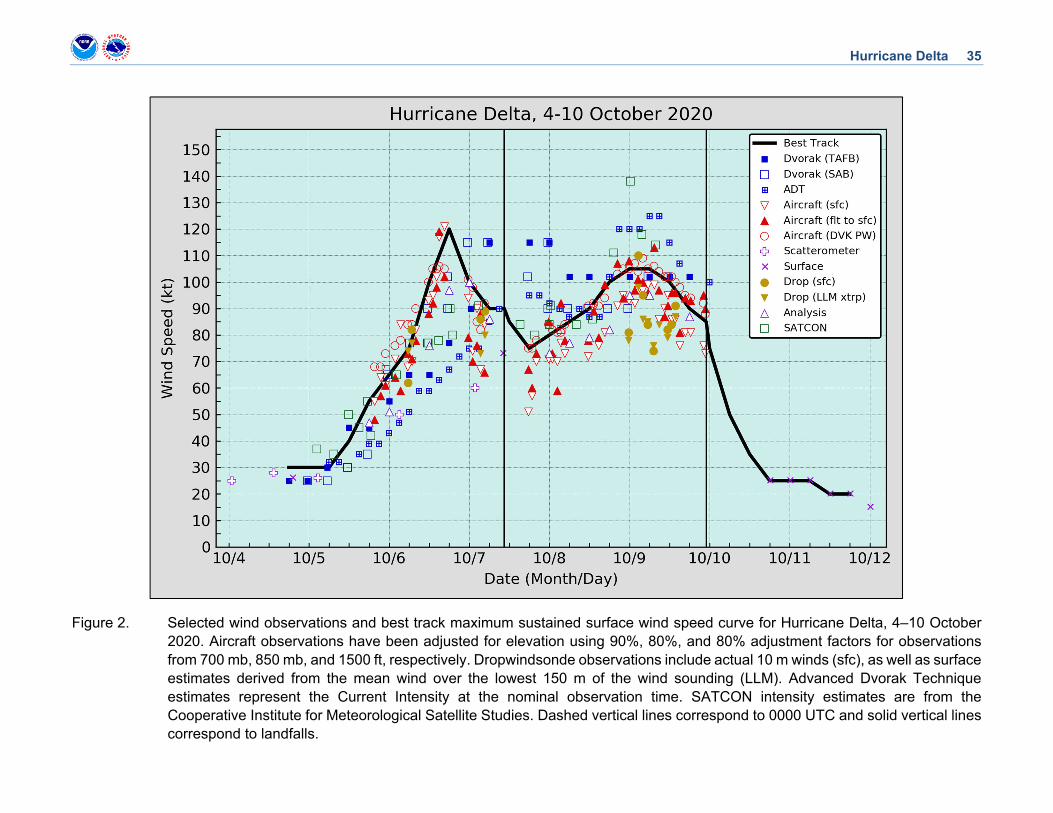
Figure 2. Selected wind observations and best track maximum sustained surface wind speed curve for Hurricane Delta, 4–10 October 2020. Aircraft observations have been adjusted for elevation using 90%, 80%, and 80% adjustment factors for observations from 700 mb, 850 mb, and 1500 ft, respectively. Dropwindsonde observations include actual 10 m winds (sfc), as well as surface estimates derived from the mean wind over the lowest 150 m of the wind sounding (LLM). Advanced Dvorak Technique estimates represent the Current Intensity at the nominal observation time. SATCON intensity estimates are from the Cooperative Institute for Meteorological Satellite Studies. Dashed vertical lines correspond to 0000 UTC and solid vertical lines correspond to landfalls.

Hurricane Delta 36
Figure 3. Selected pressure observations and best track minimum central pressure curve for Hurricane Delta, 4–10 October 2020. Advanced Dvorak Technique estimates represent the Current Intensity at the nominal observation time. SATCON intensity estimates are from the Cooperative Institute for Meteorological Satellite Studies. KZC P-W refers to pressure estimates derived using the Knaff-Zehr-Courtney pressure-wind relationship. Dashed vertical lines correspond to 0000 UTC and solid vertical lines correspond to landfalls.

Hurricane Delta 37
Figure 4. GOES-16 Geocolor visible satellite image of Hurricane Delta at 1330 UTC 6 October.

Hurricane Delta 38
Figure 5. Maximum water levels measured from NOS/TCOON tide gauges and USGS/USACE stream gauges (circles), USGS water level sensors (triangles), and surveyed high water marks (squares) from Hurricane Delta. Depending on the data type, water levels are referenced as feet above ground level (AGL), or Mean Higher High Water (MHHW), which is used as a proxy for inundation (above ground level) on normally dry ground along the immediate coastline.

Hurricane Delta 39
Figure 6. As in Figure 5, but zoomed in where the highest storm surge inundation from Hurricane Delta occurred over south-central Louisiana.

Hurricane Delta 40
Figure 7. Map of tornado reports (red circles) from Hurricane Delta from 9–11 October 2020.

Hurricane Delta 41
Figure 8. (a) Wind damage near Lake Charles, Louisiana from Hurricane Delta. Photo courtesy of the U.S. Coast Guard. (b) Flooded streets in Delcambre, Louisiana on 10 October. Photo courtesy of the Lafayette Daily Advertiser.
(a) (b)

Hurricane Delta 42
Figure 9. Official track forecasts (blue lines, with 0, 12, 24, 36, 48, 60, 72, 96, and 120 h positions indicated) for Hurricane Delta from 1800 UTC 4 October to 1800 UTC 9 October. The best track is given by the white line with positions shown at 6 h intervals.

Hurricane Delta 43
Figure 10. Selected track model guidance at 1800 UTC 4 October (colored lines, with 0, 12, 24, 36, 48, 60, 72, 96, and 120 h positions indicated) for Hurricane Delta from 1800 UTC 4 October to 1800 UTC 9 October. The best track is given by the white line with positions shown at 6 h intervals.

Hurricane Delta 44
Figure 11. NHC official intensity forecasts (kt, blue lines) from 1800 UTC 4 October to 1800 UTC 9 October 2020 for Hurricane Delta. The verifying intensity (kt) is shown in white.

Hurricane Delta 45
Figure 12. Maximum water levels measured during Hurricane Delta from tide and stream gauges (circles), USGS water level sensors (triangles) and surveyed high water marks (squares), as well as areas covered by storm surge watches (lavender) and warnings (magenta). Water levels are referenced as feet above ground level (AGL) or Mean Higher High Water (MHHW), which is used as a proxy for inundation (above ground level) on normally dry ground along the immediate coastline. Black markers denote water levels less than 3 ft above ground level, and white markers denote water levels 3 ft or higher above ground level.

Hurricane Delta 46
Figure 13. Timeline of NHC peak storm surge forecasts and communications for Hurricane Delta compared with verifying onset time of tropical-storm-force winds, landfall, and observed range of peak inundation.
Related Documents