A Project Report on “Optimization of Surface Roughness of Al-7075 T651 in CNC End Milling” Submitted in partial fulfillment of the requirement for the award of the degree of Bachelor of Engineering In Mechanical Engineering Under the Guidance of Professor Rizwan S. Shaikh By: Saif Hanif Pawaskar 13ME134 Bilal Ahmed Firfiray 13ME129 Abdul Raquib Imran Ali Khan 11ME029 Yusuf Hafiz 12ME015 SCHOOL OF ENGINEERING 2015-2016

Welcome message from author
This document is posted to help you gain knowledge. Please leave a comment to let me know what you think about it! Share it to your friends and learn new things together.
Transcript
A Project Report on
“Optimization of Surface Roughness of
Al-7075 T651 in CNC End Milling”
Submitted in partial fulfillment of the requirement for the award of the degree of
Bachelor of Engineering
In
Mechanical Engineering
Under the Guidance of
Professor Rizwan S. Shaikh
By:
Saif Hanif Pawaskar 13ME134
Bilal Ahmed Firfiray 13ME129
Abdul Raquib Imran Ali Khan 11ME029
Yusuf Hafiz 12ME015
SCHOOL OF ENGINEERING
2015-2016

A Project Report on
“Optimization of Surface Roughness of
Al-7075 T6 in CNC End Milling”
Submitted in partial fulfillment of the requirement for the award of the degree of
Bachelor of Engineering
In
Mechanical Engineering
Under the Guidance of
Professor Rizwan S. Shaikh
By:
Saif Hanif Pawaskar 13ME134 Bilal Ahmed Firfiray 13ME129
Abdul Raquib Imran Ali Khan 11ME029 Yusuf Hafiz 12ME015
SCHOOL OF ENGINEERING
2015-2016
ANJUMAN-I-ISLAM
KALSEKAR TECHNICAL CAMPUSNEW PANVEL
(Approvedby AICTE, recg. By Maharashtra Govt. DTE,
Affiliated to Mumbai University)
PLOT #2&3, SECTOR 16, NEAR THANA NAKA, KHANDAGAON, NEW PANVEL,NAVI MUMBAI-410206, Tel.: +91 22 27481247/48 * Website: www.aiktc.org
CERTIFICATE
This is to certify that the project entitled
“Optimization of Surface Roughness of Al-7075 T6 in CNC End Milling”
Submitted by
SAIF HANIF PAWASKAR1
BILAL AHMED FIRFIRAY2
ABDUL RAQUIB IMRAN ALI KHAN3
YUSUF HAFIZ4
To the Kalsekar Technical Campus, New Panvel is a record of bonafide work carried out
by him under our supervision and guidance, for partial fulfillment of the requirements for the
award of the Degree of Bachelor of Engineering in Mechanical Engineering as prescribed by
University of Mumbai, is approved.
Internal Examiner External Examiner
(Prof. Rizwan Shaikh) (Prof. ______________)
Headof Department Principal
(Prof. Zakir Ansari) (Dr______________)

ANJUMAN-I-ISLAM
KALSEKAR TECHNICAL CAMPUSNEW PANVEL
(Approved by AICTE, recg. By Maharashtra Govt. DTE,
Affiliated to Mumbai University)
PLOT #2&3, SECTOR 16, NEAR THANA NAKA, KHANDAGAON, NEW PANVEL,NAVI MUMBAI-410206, Tel.: +91 22 27481247/48 * Website: www.aiktc.org
APPROVAL OF DISSERTATION
This is to certify that the thesis entitled
“Optimization of Surface Roughness of Al-7075 T6 in CNC End Milling”
Submitted by
SAIF HANIF PAWASKAR1
BILAL AHMED FIRFIRAY2
ABDUL RAQUIB IMRAN ALI KHAN3
YUSUF HAFIZ4
In partial fulfillment of the requirements for the award of the Degree of Bachelor of Engineering
in Mechanical Engineering, as prescribed by University of Mumbai approved.
(Internal Examiner) (External Examiner)
_________________ _________________
Date: __________

ACKNOWLEDGMENT
After the completion of this work, we would like to give our sincere thanks to all those
who helped us to reach our goal. It is a great pleasure and moment of immense satisfaction for us
to express my profound gratitude to our guide Prof.Rizwan Shaikhwhose constant
encouragement enabled us to work enthusiastically. His perpetual motivation, patience and
excellent expertise in discussion during progress of the project work have benefited us to an
extent, which is beyond expression.
We would also like to give our sincere thanks toProf. Zakir Ansari Head Of
Department, Prof. Rizwan Shaikh Project coordinator from Department of Mechanical
Engineering, Kalsekar Technical Campus, New Panvel for their guidance, encouragement and
support during a project.
I am thankful toDr.Abdul Razzak Honnutagi, Kalsekar Technical Campus, New
Panvel, for providing an outstanding academic environment, also for providing the adequate
facilities.
I would also like to thankProf. Jamiluddin TalukdarHead of Department of Mechanical
Engineering and Prof. Sohail Kazi(Department of Mechanical Engineering) of Abdul Razzak
Kalsekar Polytechnic for providing and assisting us with the CNC machine in their premises.
Last but not the least I would also like to thank all the staffs of Kalsekar Technical
Campus (Mechanical Engineering Department) for their valuable guidance with their interest and
valuable suggestions brightened us.
Bilal Ahmed Firfiray (13ME129)
Saif Hanif Pawaskar (13ME134)
Abdul Raquib Khan (11ME029)
Yusuf Hafiz (12ME015)

ABSTRACT
The demand for high strength and low weight material in aerospace industries is found to be
increasing in fabrication of structures and equipment’s of aircraft and space satellites.
Aluminium alloys possesses the characteristics of lightweight and high strength. The
identification of the optimum values of input parameters to achieve better surface finish as
response parameters is the prime objective of the project. The Aluminium 7075 T651 is worked
on the End milling process on the HAAS CNC machine. Different parameters of Cutting Speed,
Feed, and Depth of Cut in the Orthogonal Array method using Taguchi method. The results are
to be worked on the DOE method on software MINITAB.
The material can further be worked upon different input parameters on various machines and for
different response parameters. For carrying out the above-mentioned process various papers were
referred for guidance and knowledge in the same field of previously carried experiments and
results. Various technical concepts and tools like The Taguchi, Orthogonal Array, DOE,
ANNOVA, Fuzzy Logic, and Response Parameters etc. were learned from the Published papers
and it helped extensively in gaining knowledge required for the experiments to be performed on
our project.
i
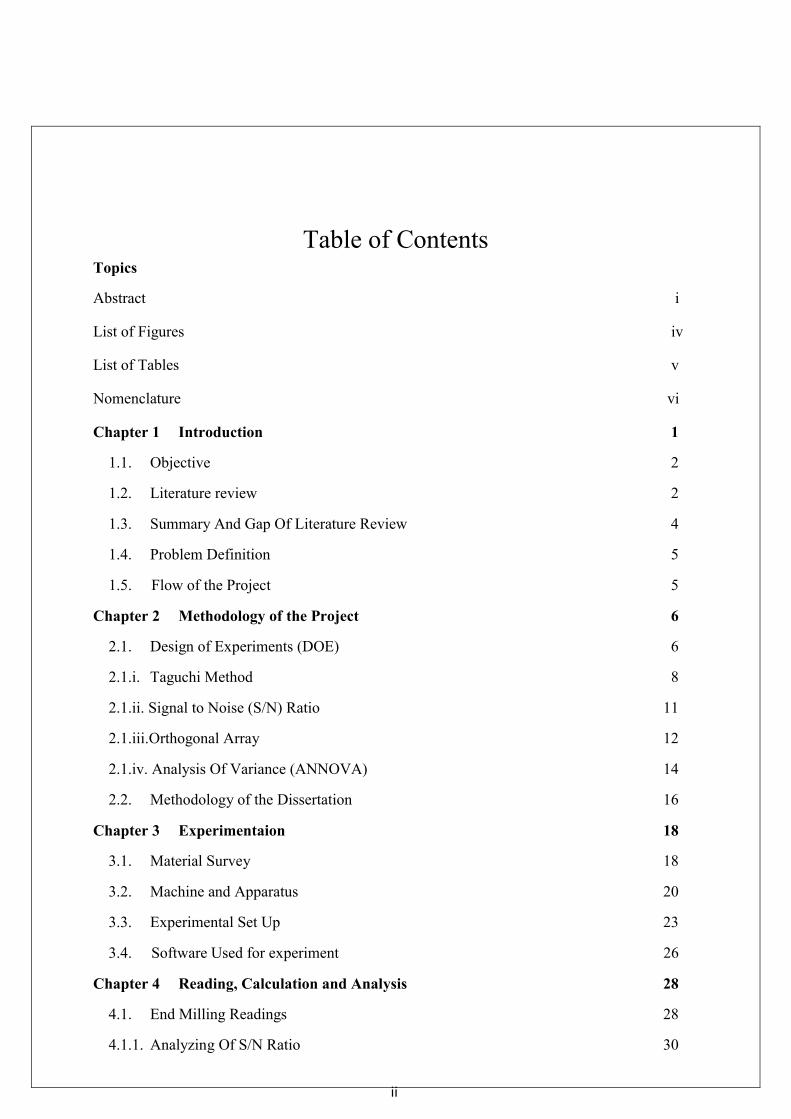
Table of Contents Topics
Abstract i
List of Figures iv
List of Tables v
Nomenclature vi
Chapter 1 Introduction 1
1.1. Objective 2
1.2. Literature review 2
1.3. Summary And Gap Of Literature Review 4
1.4. Problem Definition 5
1.5. Flow of the Project 5
Chapter 2 Methodology of the Project 6
2.1. Design of Experiments (DOE) 6
2.1.i. Taguchi Method 8
2.1.ii. Signal to Noise (S/N) Ratio 11
2.1.iii.Orthogonal Array 12
2.1.iv. Analysis Of Variance (ANNOVA) 14
2.2. Methodology of the Dissertation 16
Chapter 3 Experimentaion 18
3.1. Material Survey 18
3.2. Machine and Apparatus 20
3.3. Experimental Set Up 23
3.4. Software Used for experiment 26
Chapter 4 Reading, Calculation and Analysis 28
4.1. End Milling Readings 28
4.1.1. Analyzing Of S/N Ratio 30
ii

4.1.2. Analysis of Variance for S/N ratios 32
4.1.3. Analysis of Mean 33
4.1.4. Regression Analysis 35
Chapter 5 Conclusion and Future Scope 36
Chapter 6 References 38
iii

List of Figures
Figure 1.1 Flow Chart of the Project .......................................................................................... 5
Figure 2.1 Design of Experiment ................................................................................................ 7
Figure 2.2 Signal to Noise Ratio ................................................................................................. 9
Figure 2.3 Orthogonal Array..................................................................................................... 10
Figure 2.4 Orthogonal Array Experimentation ......................................................................... 11
Figure 2.5 Flow Chart of Methodology .................................................................................... 16
Figure 3.1 Aluminium 7075 T61 .............................................................................................. 19
Figure 3.2 HAAS Mini CNC Mill ............................................................................................ 20
Figure 3.3 MGW Surface Roughness Tester (SRT-1) .............................................................. 22
Figure 3.4 Setup of Experiment ................................................................................................ 23
Figure 3.5 Program Graph ........................................................................................................ 23
Figure 3.6 Operating of Machine .............................................................................................. 25
Figure 3.7 Completion of Machining........................................................................................ 26
Figure 3.8 Software work on Regression Analysis ................................................................... 27
Figure 3.9 Software work on S/N Ratio and Mean ................................................................... 27
Figure 4.1 Measurement of Ra Values on Surface Roughness tester ....................................... 28
Figure 4.2 Main effect plot for S/N ratio .................................................................................. 31
Figure 4.3. Main effect plot for Mean....................................................................................... 33
iv
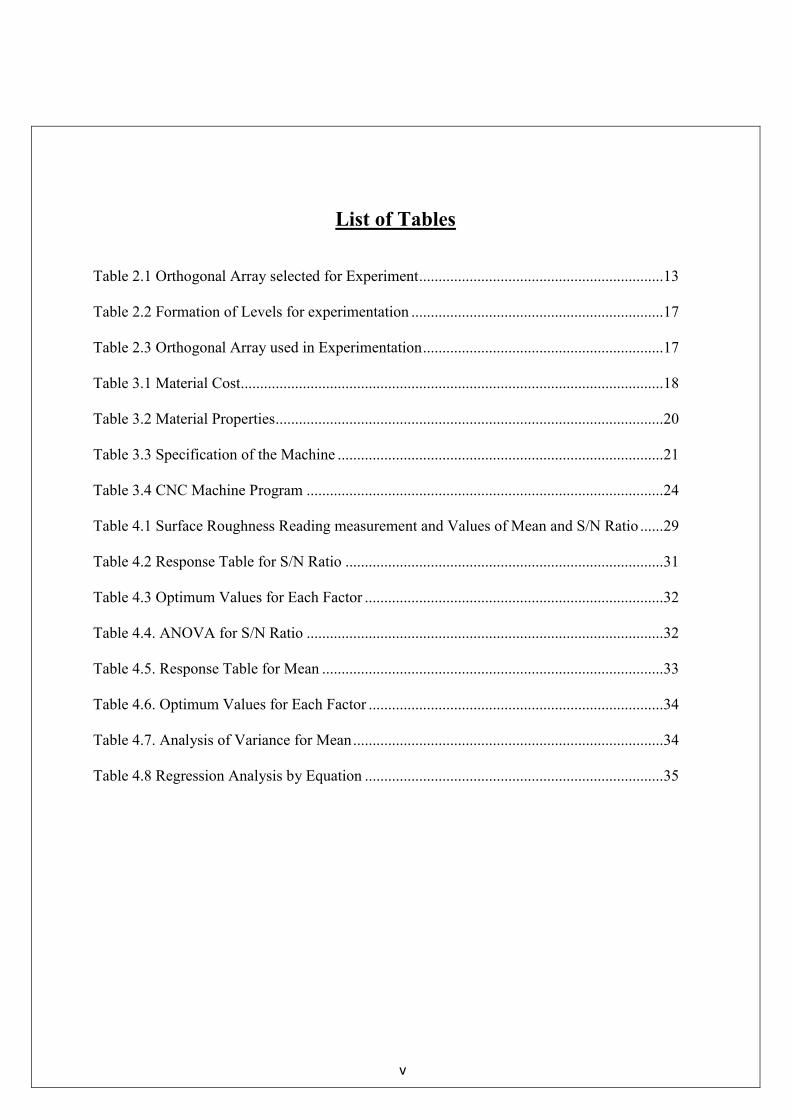
List of Tables
Table 2.1 Orthogonal Array selected for Experiment ............................................................... 13
Table 2.2 Formation of Levels for experimentation ................................................................. 17
Table 2.3 Orthogonal Array used in Experimentation .............................................................. 17
Table 3.1 Material Cost............................................................................................................. 18
Table 3.2 Material Properties .................................................................................................... 20
Table 3.3 Specification of the Machine .................................................................................... 21
Table 3.4 CNC Machine Program ............................................................................................ 24
Table 4.1 Surface Roughness Reading measurement and Values of Mean and S/N Ratio ...... 29
Table 4.2 Response Table for S/N Ratio .................................................................................. 31
Table 4.3 Optimum Values for Each Factor ............................................................................. 32
Table 4.4. ANOVA for S/N Ratio ............................................................................................ 32
Table 4.5. Response Table for Mean ........................................................................................ 33
Table 4.6. Optimum Values for Each Factor ............................................................................ 34
Table 4.7. Analysis of Variance for Mean ................................................................................ 34
Table 4.8 Regression Analysis by Equation ............................................................................. 35
v

NOMENCLATURE
Meaning
C.S. Cutting Speed
F.R. Feed
DOC Depth of Cut
Ra Surface Roughness
ANNOVA Analysis of Variance
Al Aluminium
S/N Signal to Noise Ratio
DOF Degree of Freedom
F Statistic Value.
Adj MS Adjusted Mean Square
Adj SS Adjusted Sum of Square
Seq SS Sequential Sum of Square
P Probability
vi

Chapter 1
Introduction
Surface roughness is an important measure of product quality, since it greatly
influences the performance of mechanical parts as well as production cost. Surface roughness
has an impact on the mechanical properties like fatigue behaviour, corrosion resistance, etc.
and functional attributes like friction, wear, light reflection, heat transmission and electrical
conductivity, etc. There have been many research developments in modelling surface
roughness and optimization of the controlling parameters to obtain a surface finish of desired
level, since only the proper selection of cutting parameters can produce a better surface finish.
In the manufacturing industries, various machining processes are adopted for removing the
material from the work piece for a better product.
Out of these, end milling process is one of the most vital and common metal cutting
operations used for machining parts because of its ability to remove materials faster with a
reasonably good surface quality. In recent times, Computer Numerically Controlled (CNC)
machine tools have been implemented to utilize full automation in milling, since they provide
greater improvements in productivity, increase the quality of the machined parts and require
less operator input.
End mill - A rotating cutting tool having a cylindrical shank with the teeth at the end,
used for machining sides of metal piece and other object.
Applications
Used to cut mazy profiles, slots, grooves etc in industrial.
Production of cavities in metal working dies

Optimization of Surface Roughness of Al-7075 T651 in CNC End Milling
2
1.1. Objective
The demand for high strength and low weight material in aerospace industry is found to be
increasing in fabrication of structure and equipment of aircraft.Aluminium alloy possesses
characteristics of lightweight and high strength. The 7000 Series Aluminium is the highest
strength series for aircraft applications.But the problem faced by this material is that is has
moderate corrosion and fatigue resistance. This problem can be solved largely by minimizing
the surface roughness.
1.2. Literature review
Various papers are studied and discussion on some papers are presented in this section.
Thakur Paramjit Mahesh, R.Rajesh [1] described the application of the fuzzy logic
integrated with Taguchi method for minimizing the surface roughness and maximizing the
material removal rate simultaneously. In CNC End Milling of Al 7075 T6 Aerospace alloy.
The Input parameters taken are SPEED, FEED, DOF and NOSE RADIUS. Al 7075 T6 is one
of the highest strength alloy in 7000 series family. In Taguchi method, L27 Orthogonal Array
with 4 factors and 3 Levels are chosen and S/N ratio is calculated. S/N Ratio of roughness and
MRR are fed as inputs to Fuzzy Logic system and output received is Multi response
performance index (MRPI) with application of ANOVA, Nose radius and DOC are identified
as most signified parameters contributing about 31% of Variance. There was a significant
improvement in MRPI of Optimal process parameters as compared to MRPI of initial process
parameters Optimization process parameters would solve problems of corrosion and fatigue
by material by minimizing roughness. same time it will increase productivity by maximizing
MRR.
Following parameters setting was been identified as to yield the best combination of
parameters - A3B1C3D2. Significant improvement in surface roughness and MRR. Most
important factor affecting response have been nose radius and depth of cut.

Optimization of Surface Roughness of Al-7075 T651 in CNC End Milling
3
J.S. Pang, M.N.M. Ansari, Omar S. Zaroog, Moaz H. Ali, S.M. Sapuan [2] used the
Taguchi design optimization of machining parameters on the CNC end milling process of
halloysite nanotube with aluminium reinforced epoxy matrix (HNT/Al/Ep) hybrid composite.
The Taguchi method was performed to select the optimal cutting parameters from varying
combinations of cutting parameters for end-milling operations on the HNT-Al/epoxy hybrid
composite material.A basic L27(33) orthogonal array was selected with 27 experimental runs
which included the three main factors each at three levels and this proved that the Taguchi
parameter design is an efficient way to determine the optimal combination of cutting
parameters for lowest surface finish and cutting force.
The Taguchi method was performed to select the optimal cutting parameters from varying
combinations of cutting parameters for end-milling operations on the HNT-Al/epoxy hybrid
composite material.
A. Arun Premnath, T. Alwarsamy, T. Abhinav, C. Adithya, Krishnakant [3] the
Response Surface Model (RSM) has been developed to predict the surface roughness during
face milling of Hybrid composites. Experiments carried out with tungsten carbide insert at
various cutting Speed, Feed, and Weight fraction of Alumina. Material used are Al 6061-
reinforced with Al2O3 of size 45 micron and Graphite of 60 microns, which are produced by
stir casting route, Central composite face centered second order response surface
methodology was employed to create a mathematical model and the adequacy of model was
verified using analysis of variance. And Concluded that – i) From RSM model, predicted and
measured values are quite close, which indicates that the developed model can be effectively
used to predict the surface roughness. Using this model, a noticeable saving in time and cost
has been obtained to select the level of milling. ii) Speed is major factor, which has more
influence on surface roughness, followed by feed rate and weight fraction of Al2O3 Among
the interaction, cutter speed and feed rate has a greater influence compared with other
interaction on surface roughness on milling of Al Hybrid MMC composites
Lohithaksha M Maiyara, Dr.R.Ramanujamb, K.Venkatesanc, Dr.J.Jeraldd [4]
investigated the parameter optimization of end milling operation for Inconel 718 super alloy
with multi-response criteria based on the taguchi orthogonal array with the grey relational
analysis. Nine experimental runs based on an L9 orthogonal array of Taguchi method were
performed. Cutting speed, feed rate and depth of cut are optimized with considerations of
multiple performance characteristics namely surface roughness and material removal rate. A
grey relational grade obtained from the grey relational analysis is used to solve the end
milling process with the multiple performance characteristics. Additionally, the analysis of
Optimization of Surface Roughness of Al-7075 T651 in CNC End Milling
4
variance (ANOVA) is also applied to identify the most significant factor. Finally,
confirmation tests were performed to make a comparison between the experimental results
and developed model. Experimental results have shown that machining performance in the
end milling process can be improved effectively through this approach.
Lakshmipathi Tammineni1 and Hari Prasada Reddy Yedula [5]deals with the effect of
three selective parameters viz. cutting speed, feed and depth of cut on the surface roughness
of Aluminium 1050 during milling operation. The main objective of this work is to investigate
the influence of the above-mentioned parameters on the surface roughness and flatness to
obtain the optimum surface texture using Response Surface Methodology and to recommend
the best parameters that contribute to obtain the optimum surface roughness value. The values
of said three parameters taken for the study are: cutting speed range - 500 to 1500 rpm, feed
range - 50 to 70 mm/rev and depth of cut range - 0.5 to 1.5mm, and given as input to the Mini
Tab software. As a result, 15 number of design of experiments with various combinations of
the three parameters under consideration have been generated. Experiments have been
conducted in the run order on CNC Milling Machine by using manual coding method, and the
surface roughness has been tested using TR-200 surface roughness tester, and the flatness has
been tested by using Coordinate Measuring Machine (CMM). The obtained surface roughness
and flatness values are analysed through graphs generated by using Response Surface
Methodology (RSM) of Minitab Software.
1.3. Summary And Gap Of Literature Review
Different tools like Taguchi, ANOVA, Fuzzy Logic, Regression, Orthogonal Array,
D.O.E. etc. were used to carry out experiments for Optimization of Surface Roughness.
i. Surface roughness increases rapidly with increase in feed rate
ii. Surface Roughness decrease with increase in cutting speed.
iii. An increase in either the feed rate or axial depth of cut increases the surface
roughness, while an increase in the spindle speed decreases the surface roughness
No research and analysis is carried out on Aluminium of Grade 7075 T651 for response
parameter of Surface Roughness

Optimization of Surface Roughness of Al-7075 T651 in CNC End Milling
5
1.4. Problem Definition
To optimize the level of the Surface Roughness of Aluminium Alloy 7075 T651 in the HAAS
CNC mill with End Milling Operation. Considering input parameters like SPEED, FEED,
DEPTH OF CUT, With SURFACE ROUGHNESS as Response Parameters. Using Three
Level Orthogonal Array (L9) with validation on MINITAB software.
1.5. Flowchart
Figure 1.1 Flow Chart of the Project
Result and Validation
Analysis of Material
Methodology and Experimentaion
Design of Experiments
Literature Survey
Introduction

Chapter 2
Methodology of the Project
2.1 Design of Experiments (DOE)
Design of experiments (DOE) is a systematic method to determine the relationship between
factors affecting a process and the output of that process. In other words, it is used to find
cause-and-effect relationships. This information is needed to manage process inputs in order
to optimize the output.
Design of Experiments (DOE) usingthe Taguchi Approach is astandardized form of
experimentaldesign technique (referred asclassical DOE) introduced by R. A.Fisher in
England in the early1920’s. As a researcher inJapanese Electronic ControlLaboratory, in the
late 1940’s, Dr.Genichi Taguchi devoted much ofhis quality improvement effort
onsimplifying and standardizing theapplication of the DOE technique.
Common areas of application of the technique are:
- Optimize Designs using analytical simulation studies
- Select better alternative in Development and Testing
- Optimize Manufacturing Process Designs
- Determine the best Assembly Method
- Solve manufacturing and production Problems

Optimization of Surface Roughness of Al-7075 T651 in CNC End Milling
7
Design techniques, you couldimprove the performances of yourproduct and process designs in
thefollowing ways:
- Improve consistency ofperformance and save cost
- Build insensitivity(Robustness) towards theuncontrollable factors
A designed experiment is a test or series of tests in which purposeful changes are made to the
input variables of a process or system so that we may observe and identify the reasons for
changes in the output response. For example, Figure 5.4.3 depicts a process or system under
study. The process parameters x1, x
2, x
3, …, x
p are controllable, whereas other variables z
1, z
2,
z3, …,z
qare uncontrollable. The term y refers to the output variable. The objectives of the
experiment are stated as:
• Determining which variables are most influential on the response, y.
• Determining where to set the influential x’s so that y is almost always near the desired
nominal value.
• Determining where to set the influential x’s so that variability in y is small.
• Determining where to set the influential x’s so that the effects of the uncontrollable z1, z
2
…zq are minimized.
Figure 2.1 Design of Experiment
Experimental design is used as an important tool in numerous applications. For instance, it is
used as a vital tool in improving the performance of a manufacturing process and in the
engineering design activities. The use of the experimental design in these areas results in
products those are easier to manufacture, products that have enhanced field performance and
reliability, lower product cost, and short product design and development time.
Optimization of Surface Roughness of Al-7075 T651 in CNC End Milling
8
Guidelines for designing experiments
• Recognition and statement of the problem.
• Choice of factors and levels.
• Selection of the response variable.
• Choice of experimental design.
• Performing the experiment.
• Data analysis.
• Conclusions and recommendations.
i. Taguchi Method
Taguchi designs are used for robust parameter design, in which the primary goal is to find
factor settings that minimize response variation, while adjusting (or keeping) the process on
target. Taguchi designs provide a powerful and efficient method for designing products that
operate consistently and optimally over a variety of conditions.
Taguchi method is based on performing evaluation or experiments to test the sensitivity of a
set of response variables to a set of control parameters (or independent variables) by
considering experiments in “orthogonal array” with an aim to attain the optimum setting of
the control parameters. Orthogonal arrays provide a best set of well balanced (minimum)
experiments. An array name indicates the number of rows and columns it has, and also the
number of levels in each of the columns. For example, array L4 (23) has four rows and three
“2 level” columns. Similarly, the array L18 (2137) has 18 rows; one “2 level” column; and
seven “3 level” columns. Thus, there are eight columns in the array L18. The number of rows
of an orthogonal array represents the requisite number of experiments. The number of rows
must be at least equal to the degrees of the freedom associated with the factors i.e. the control
variables. In general, the number of degrees of freedom associated with a factor (control
variable) is equal to the number of levels for that factor minus one. For example, a case study
has one factor (A) with “2 levels” (A), and five factors (B, C, D, E, F) each with “3 level”.
Table 5.4.2 depicts the degrees of freedom calculated for this case. The number of columns of
an array represents the maximum number of factors that can be studied using that array.
Taguchi's techniques have been used widely in engineering design (Ross 1996 & Phadke
1989). TheTaguchi method contains system design, parameter design, and tolerance design
procedures toachieve a robust process and result for the best product quality (Taguchi 1987 &
1993). The main trustof Taguchi's techniques is the use of parameter design (Ealey Lance
A.1994), which is an engineeringmethod for product or process design that focuses on

Optimization of Surface Roughness of Al-7075 T651 in CNC End Milling
9
determining the parameter (factor) settingsproducing the best levels of a quality characteristic
(performance measure) with minimum variation.Taguchi designs provide a powerful and
efficient method for designing processes that operateconsistently and optimally over a variety
of conditions. To determine the best design, it requires theuse of a strategically designed
experiment, which exposes the process to various levels of designparameters.
Experimental design methods were developed in the early years of 20th century and have
beenextensively studied by statisticians since then, but they were not easy to use by
practitioners (Phadke1989). Taguchi's approach to design of experiments is easy to be
adopted and applied for users withlimited knowledge of statistics; hence it has gained a wide
popularity in the engineering andscientific community. Taguchi specified three situations:
Larger the better (for example, agricultural yield);
Smaller the better (for example, carbon dioxide emissions); and
On-target, minimum-variation (for example, a mating part in an assembly).
Figure 2.2 Signal to Noise Ratio
Eight-Steps in Taguchi Methodology:
Step-1: Identify the main function, side effects, and failure mode
Step-2: Identify the noise factors, testing conditions, and quality characteristics
Step-3: Identify the objective function to be optimized
Step-4: Identify the control factors and their levels
Step-5: Select the orthogonal array matrix experiment
Step-6: Conduct the matrix experiment
Step-7: Analyse the data, predict the optimum levels and performance
Step-8: Perform the verification experiment and plan the future action

Optimization of Surface Roughness of Al-7075 T651 in CNC End Milling
10
Methodology Used: Taguchi Techniques
Dr. Taguchi's Signal-to-Noise ratios (S/N), which are log functions is based on
“ORTHOGONALARRAY” experiments which gives much reduced “variance” for the
experiment with “optimumsettings “of control parameters. Thus the marriage of Design of
Experiments with optimization ofcontrol parameters to obtain BEST results is achieved in the
Taguchi Method. "Orthogonal Arrays"(OA) provide a set of well balanced
(minimum)experiments & desired output, serve as objectivefunctions for optimization, help in
data analysis and prediction of optimum results.
Mathematical modelling:
“ORTHOGONAL ARRAYS “(OAs) experimentsUsing OAs significantly reduces the
number of experimental configurations to be studiedMontgomery, (1991). The effect of many
different parameters on the performance characteristic in aprocess can be examined by using
the orthogonal array experimental design proposed by Taguchi.Once the parameters affecting
a process that can be controlled have been determined, the levels atwhich these parameters
should be varied must be determined. Determining what levels of a variableto test requires an
in-depth understanding of the process, including the minimum, maximum, and current value
of the parameter. If the difference between the minimum and maximum value of aparameter
is large, the values being tested can be further apart or more values can be tested. If therange
of a parameter is small, then less value can be tested or the values tested can be closer
together.
Array Selector
Figure 2.3 Orthogonal Array
The Taguchi method is a powerful tool for designing high quality systems. To increase the
experimental efficiency, the L18 mixed orthogonal table in the Taguchi quality design. Ross
(1988) is used to determine the significant machining factors. In the experiments, we select
six influential machining parameters, such as cutting tools of different materials, depth of cut,
Optimization of Surface Roughness of Al-7075 T651 in CNC End Milling
11
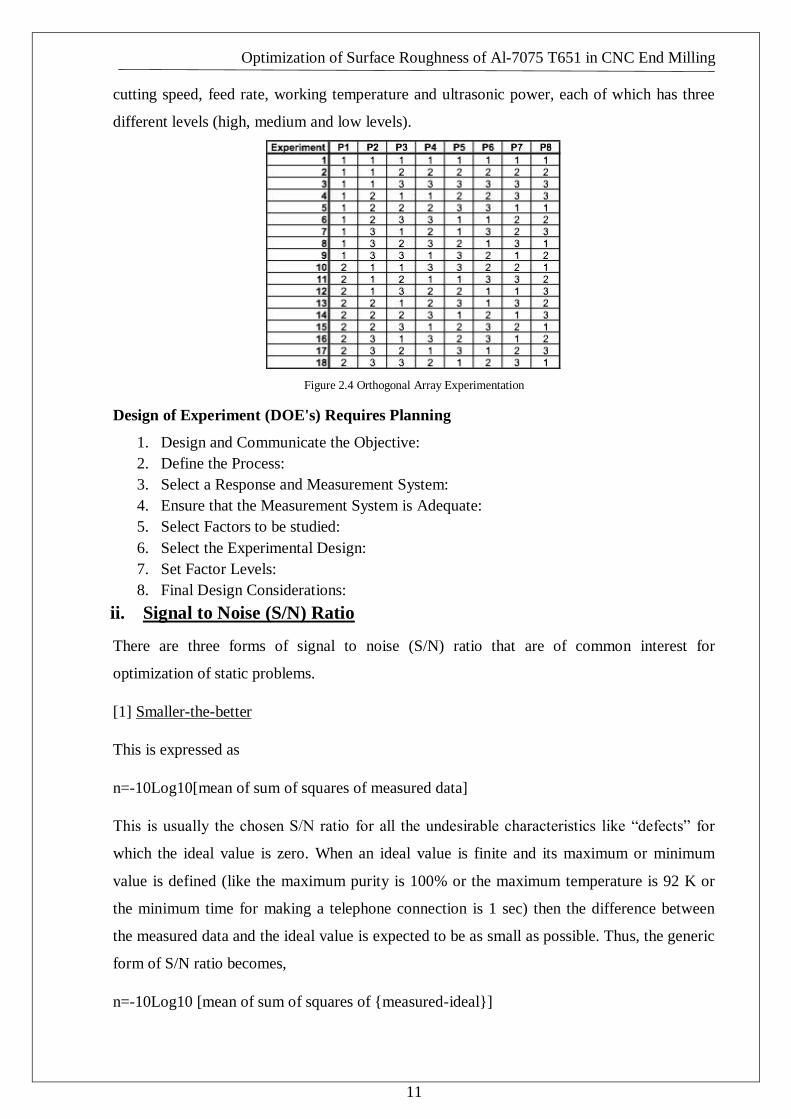
cutting speed, feed rate, working temperature and ultrasonic power, each of which has three
different levels (high, medium and low levels).
Figure 2.4 Orthogonal Array Experimentation
Design of Experiment (DOE's) Requires Planning
1. Design and Communicate the Objective:
2. Define the Process:
3. Select a Response and Measurement System:
4. Ensure that the Measurement System is Adequate:
5. Select Factors to be studied:
6. Select the Experimental Design:
7. Set Factor Levels:
8. Final Design Considerations:
ii. Signal to Noise (S/N) Ratio
There are three forms of signal to noise (S/N) ratio that are of common interest for
optimization of static problems.
[1] Smaller-the-better
This is expressed as
n=-10Log10[mean of sum of squares of measured data]
This is usually the chosen S/N ratio for all the undesirable characteristics like “defects” for
which the ideal value is zero. When an ideal value is finite and its maximum or minimum
value is defined (like the maximum purity is 100% or the maximum temperature is 92 K or
the minimum time for making a telephone connection is 1 sec) then the difference between
the measured data and the ideal value is expected to be as small as possible. Thus, the generic
form of S/N ratio becomes,
n=-10Log10 [mean of sum of squares of {measured-ideal}]

Optimization of Surface Roughness of Al-7075 T651 in CNC End Milling
12
[2] Larger-the-better
This is expressed as
n=-10Log10 [datameasuredofreciprocalofsquaresofsumofmean]
This is often converted to smaller-the-better by taking the reciprocal of the measured data and
next, taking the S/N ratio as in the smaller-the-better case.
[3] Nominal-the-best
This is expressed as
n=-10Log10 [square of mean/variance]
This case arises when a specified value is the most desired, meaning that neither a smaller nor
a larger value is desired.
iii. Orthogonal Array
Orthogonal Arrays (often referred to Taguchi Methods) are often employedin industrial
experiments to study the effect of several control factors.
Popularized by G. Taguchi. Other Taguchi contributions include:
• Model of the Engineering Design Process
• Robust Design Principle
• Efforts to push quality upstream into the engineering design process
An orthogonal array is a type of experiment where the columns for theindependent variables
are “orthogonal” to one another.
Benefits:
1. Conclusions valid over the entire region spanned by the control factorsand their settings
2. Large saving in the experimental effort
3. Analysis is easy
To define an orthogonal array, one must identify:
1. Number of factors to be studied
2. Levels for each factor
3. The specific 2-factor interactions to be estimated
4. The special difficulties that would be encountered in running theexperiment
We know that with two-level full factorial experiments, we can estimatevariable interactions.
When two-level fractional factorial designs are used,we begin to confound our interactions,
Optimization of Surface Roughness of Al-7075 T651 in CNC End Milling
13
and often lose the ability to obtainunconfused estimates of main and interaction effects. We
have also seenthat if the generators are chosen carefully then knowledge of lower
orderinteractions can be obtained under that assumption that higher orderinteractions are
negligible.
Orthogonal arrays are highly fractionated factorial designs. Theinformation they provide is a
function of two things
• The nature of confounding
•Assumptions about the physical system.
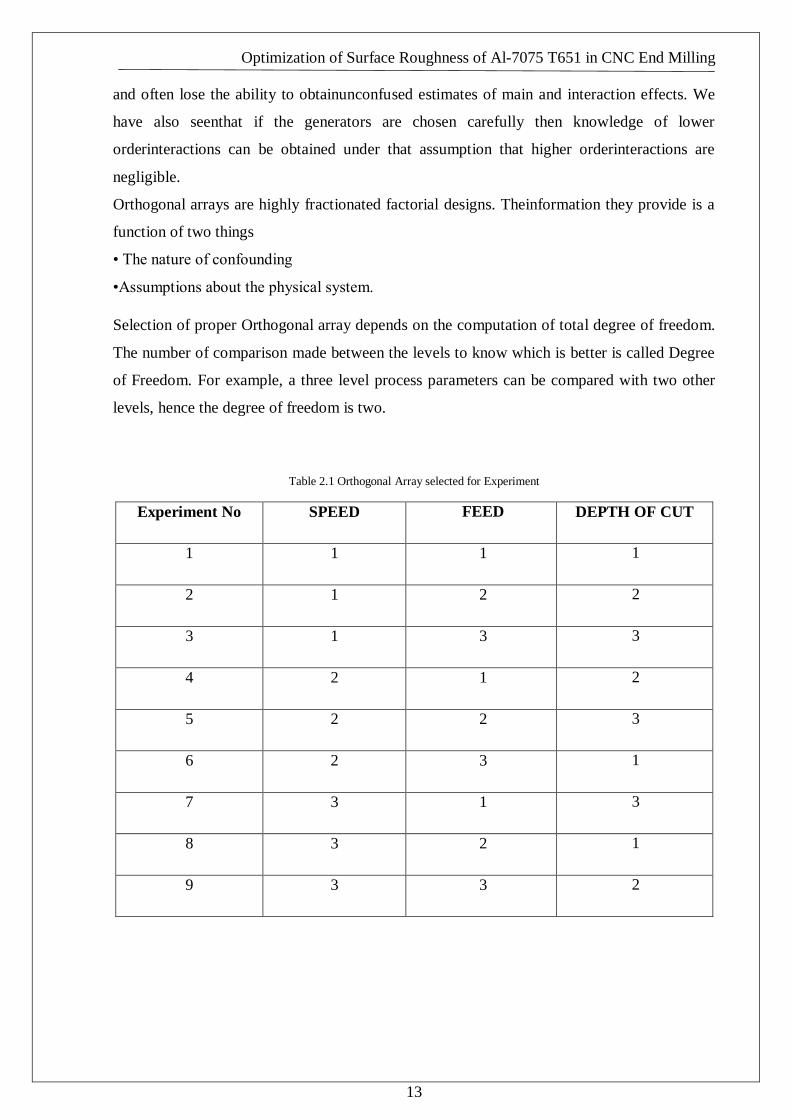
Selection of proper Orthogonal array depends on the computation of total degree of freedom.
The number of comparison made between the levels to know which is better is called Degree
of Freedom. For example, a three level process parameters can be compared with two other
levels, hence the degree of freedom is two.
Table 2.1 Orthogonal Array selected for Experiment
Experiment No SPEED FEED DEPTH OF CUT
1 1 1 1
2 1 2 2
3 1 3 3
4 2 1 2
5 2 2 3
6 2 3 1
7 3 1 3
8 3 2 1
9 3 3 2

Optimization of Surface Roughness of Al-7075 T651 in CNC End Milling
14
iv. Analysis of Variance (ANNOVA)
ANOVA (Analysis of Variance)
ANOVA is a statistical method that stands for analysis of variance. ANOVA was developed
by Ronald Fisher in 1918 and is the extension of the t and the z test. Before the use of
ANOVA, the t-test and z-test were commonly used. But the problem with the T-test is that it
cannot be applied for more than two groups. In 1918, Ronald Fisher developed a test called
the analysis of variance. This test is also called the Fisher analysis of variance, which is used
to do the analysis of variance between and within the groups whenever the groups are more
than two. If you set the Type one error to be .05, and you had several groups, each time you
tested a mean against another there would be a .05 probability of having a type one error rate.
This would mean that with six T-tests you would have a 0.30 (.05×6) probability of having a
type one-error rate. This is much higher than the desired .05.
ANOVA creates a way to test several null hypotheses at the same time.
The logic behind this procedure has to do with how much variance there is in the population.
It is likely he researcher will not know the actual variance in the population but they can
estimate this by sampling and calculating the variance in the sample. You compare the
differences in the samples to see if they are the same or statistically different while still
accounting for sampling error.
General Purpose of ANOVA:
These days, researchers are using ANOVA in many ways. The use of ANOVA depends on
the research design. Commonly, researchers are using ANOVA in three ways: one-way
ANOVA, two-way ANOVA, and N-way Multivariate ANOVA.
One-Way: When we compare more than two groups, based on one factor (independent
variable), this is called one-way ANOVA. For example, it is used if a manufacturing
company wants to compare the productivity of three or more employees based on working
hours. This is called one-way ANOVA.
Two-Way:When a company wants to compare the employee productivity based on two
factors (2 independent variables), then it said to be two way (Factorial) ANOVA. For
example, based on the working hours and working conditions, if a company wants to compare
employee productivity, it can do that through two-way ANOVA. Two-way ANOVA’s can be
used to see the effect of one of the factors after controlling for the other, or it can be used to
Optimization of Surface Roughness of Al-7075 T651 in CNC End Milling
15
see the INTERACTION between the two factors. This is a great way to control for
extraneous variables, as you are able to add them to the design of the study.
Factorial ANOVA can be balanced or unbalanced. This is to say, you can have the same
number of subjects in each group (balanced) or not (unbalanced). This can come about,
depending on the study, as just a reflection of the population, or an unwanted event such as
participants not returning to the study. Not having equal sizes groups can make it appear that
there is an effect when this may not be the case. There are several procedures a researcher
can do in order to solve this problem:
Discard cases (undesirable): Conduct a special kind of ANOVA, which can deal with the
unbalanced design
There are three types of ANOVA’s that can candle an unbalanced design. These are the
Classical Experimental design (Type 2 analysis), the Hierarchical Approach (Type 1
analysis), and the Full regression approach (Type 3 analysis). Which approach to use depends
on whether the unbalanced data occurred on purpose.
-If the data is unbalanced because this is a reflection of the population and it was intended,
use the Full Regression approach (Type 3).
-If the data was not intended to be unbalanced but you can argue some type of hierarchy
between the factors, use the Hierarchical approach (Type 1).
-If the data was not intended to be unbalanced and you cannot find any hierarchy, use the
classical experimental approach (Type 2).
N-Way:When the factor comparison is taken, then it said to be n-way ANOVA. For example,
in productivity measurement if a company takes all the factors for productivity measurement,
then it is said to be n-way ANOVA.
ANOVA is used very commonly in business, medicine or in psychology research. In
business, ANOVA can be used to compare the sales of different designs based on different
factors. A psychology researcher can use ANOVA to compare the different attitude or
behaviour in people and whether or not they are the same depending on certain factors. In
medical research, ANOVA is used to test the effectiveness of a drug.
Optimization of Surface Roughness of Al-7075 T651 in CNC End Milling
16
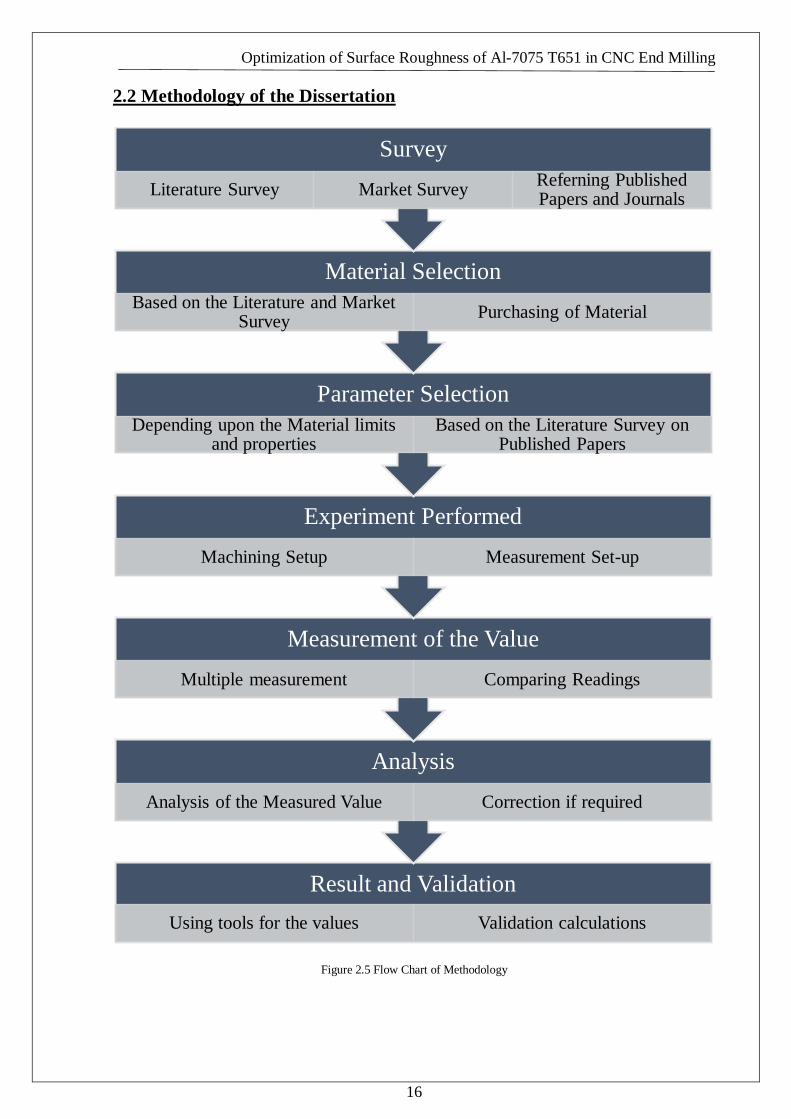
2.2 Methodology of the Dissertation
Figure 2.5 Flow Chart of Methodology
Result and Validation
Using tools for the values Validation calculations
Analysis
Analysis of the Measured Value Correction if required
Measurement of the Value
Multiple measurement Comparing Readings
Experiment Performed
Machining Setup Measurement Set-up
Parameter Selection
Depending upon the Material limits and properties
Based on the Literature Survey on Published Papers
Material Selection
Based on the Literature and Market Survey
Purchasing of Material
Survey
Literature Survey Market Survey Referning Published Papers and Journals

Optimization of Surface Roughness of Al-7075 T651 in CNC End Milling
17
Formation of Levels
Table 2.2Formation of Levels for experimentation
Parameters Level 1 Level 2 Level 3
Cutting Speed (rpm) 2000 4000 6000
Feed Rate (mm/min) 160 640 1440
Depth of Cut (mm) 0.2 0.4 0.6
Orthogonal Array formed
Selection of Orthogonal Array: To select an appropriate orthogonal array for experiments, the
total degrees of freedom need to be computed. In thisstudy each three level parameter has 2
degree of freedom(DOF = Number of level–1), the total DOF required forthree parameters
each at three levels is 8. Once thedegrees of freedom required are known, the next step is
toselect an appropriate orthogonal array to fit the specifictask. The degrees of freedom for the
orthogonalarray should be greater than or at least equal to those forthe process parameters. In
this study, an L9 Orthogonalarray (a standard 3-level OA) having 8 degree of freedomwas
selected from the Taguchi’s special set of predefinedarrays.
Table 2.3 Orthogonal Array used in Experimentation
SR. No. Cutting Speed Feed Rate Depth of cut
1 2000 160 0.2
2 2000 640 0.4
3 2000 1440 0.6
4 4000 160 0.4
5 4000 640 0.6
6 4000 1440 0.2
7 6000 160 0.6
8 6000 640 0.2
9 6000 1440 0.4

Chapter 3
Experimentation
3.1. Material Survey
Commonly available materials in the market are:
1. Normal Aluminium
2. Commercial Aluminium
Table 3.1 Material Cost
Grade Applications Price per kg
Aluminium 2024 Air Craft, Hydraulic piston etc. Rs.725
Aluminium 5083 Ship Building Rs.2500
Aluminium 7075 T651 Air Craft, Hydraulic piston etc. Rs.2500

Optimization of Surface Roughness of Al-7075 T651 in CNC End Milling
19
i. MATERIAL SELECTED
Figure 3.1 Aluminium 7075 T651
Aluminium: 7075-T651
Subcategory: 7000 Series Aluminium Alloy; Aluminium Alloy; Metal; Nonferrous Metal
Material Notes: General 7075 characteristics and uses (from Alcoa): Very high strength
material used for highly stressed structural parts. The T7351 temper offers improved stress-
corrosion cracking resistance.
Applications: Aircraft fittings, gears and shafts, fuse parts, meter shafts and gears, missile
parts, regulating valve parts, worm gears, keys, aircraft, aerospace and defence applications;
bike frames, all-terrain vehicle (ATV) sprockets.
Composition Notes: A Zr + Ti limit of 0.25 percent maximum may be used with this alloy
designation for extruded and forged products only, but only when the supplier or producer
and the purchaser have mutually so agreed. Agreement may be indicated, for example, by
reference to a standard, by letter, by order note, or other means, which allow the Zr + Ti limit.

Optimization of Surface Roughness of Al-7075 T651 in CNC End Milling
20
Table 3.2 Material Properties
3.2. Machine and Apparatus
Figure 3.2HAAS Mini CNC Mill
Optimization of Surface Roughness of Al-7075 T651 in CNC End Milling
21
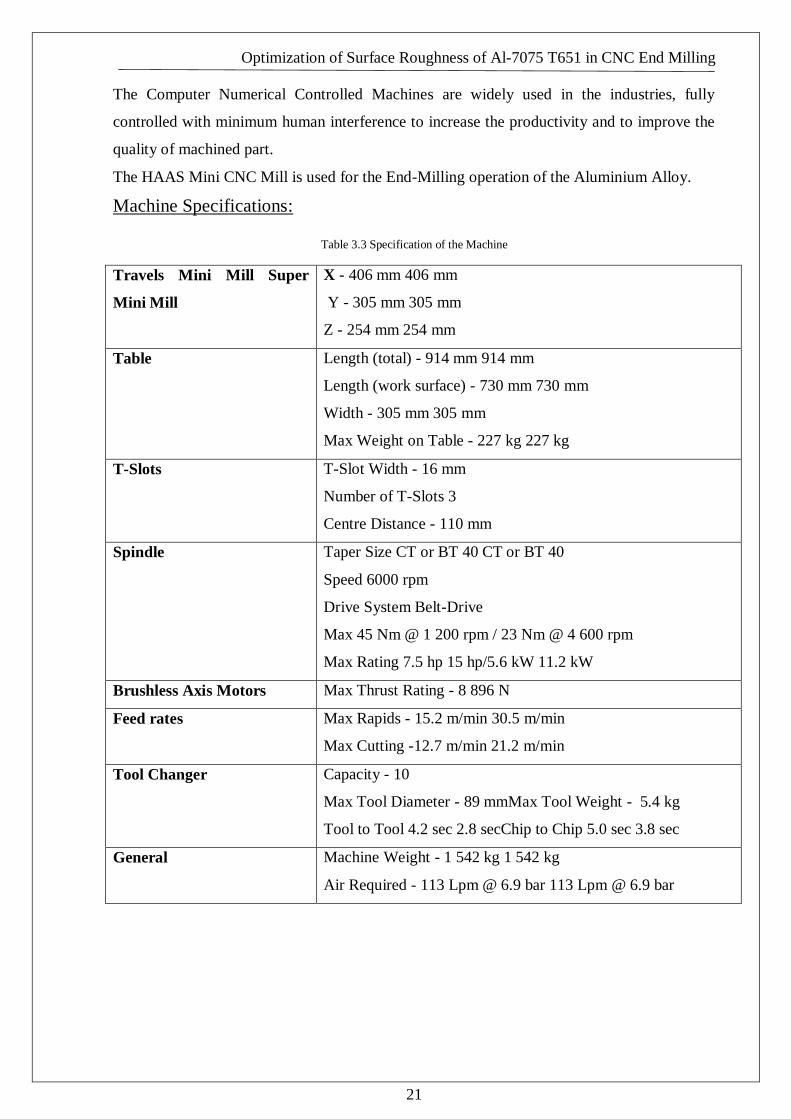
The Computer Numerical Controlled Machines are widely used in the industries, fully
controlled with minimum human interference to increase the productivity and to improve the
quality of machined part.
The HAAS Mini CNC Mill is used for the End-Milling operation of the Aluminium Alloy.
Machine Specifications:
Table 3.3 Specification of the Machine
Travels Mini Mill Super
Mini Mill
X - 406 mm 406 mm
Y - 305 mm 305 mm
Z - 254 mm 254 mm
Table Length (total) - 914 mm 914 mm
Length (work surface) - 730 mm 730 mm
Width - 305 mm 305 mm
Max Weight on Table - 227 kg 227 kg
T-Slots T-Slot Width - 16 mm
Number of T-Slots 3
Centre Distance - 110 mm
Spindle Taper Size CT or BT 40 CT or BT 40
Speed 6000 rpm
Drive System Belt-Drive
Max 45 Nm @ 1 200 rpm / 23 Nm @ 4 600 rpm
Max Rating 7.5 hp 15 hp/5.6 kW 11.2 kW
Brushless Axis Motors Max Thrust Rating - 8 896 N
Feed rates Max Rapids - 15.2 m/min 30.5 m/min
Max Cutting -12.7 m/min 21.2 m/min
Tool Changer Capacity - 10
Max Tool Diameter - 89 mmMax Tool Weight - 5.4 kg
Tool to Tool 4.2 sec 2.8 secChip to Chip 5.0 sec 3.8 sec
General
Machine Weight - 1 542 kg 1 542 kg
Air Required - 113 Lpm @ 6.9 bar 113 Lpm @ 6.9 bar

Optimization of Surface Roughness of Al-7075 T651 in CNC End Milling
22
Measuring Device:
Figure 3.3MGW Surface Roughness Tester (SRT-1)
Measurement - MGW Surface Roughness Tester (SRT-1)
MGW PRECISION TOOLS SURFACE ROUGHNESS TESTER SRT-1
Use DSP chip control and data processing, high speed, low power consumption LCD
digital display with backlight function (Do not need to buy another battery)
Can be measured in several parts of the surface roughness: Planar, curved surface, small
hole, slot of the irregular surface.
Design of electromechanical integration, small volume, lightweight, convenient with
measuring value storage function and data storage query
Can communicate with PC computer for statistics and printing by the optional cable and
the software for RS232C interface.
Optional surface sensor, deep groove sensor, measuring platform, connected with a long
rod and other accessories.
Multi parameter measurement: Ra, Rz, Rq, Rt.

Optimization of Surface Roughness of Al-7075 T651 in CNC End Milling
23
3.3. Experimental Set Up:
Figure 3.4 Setup of Experiment
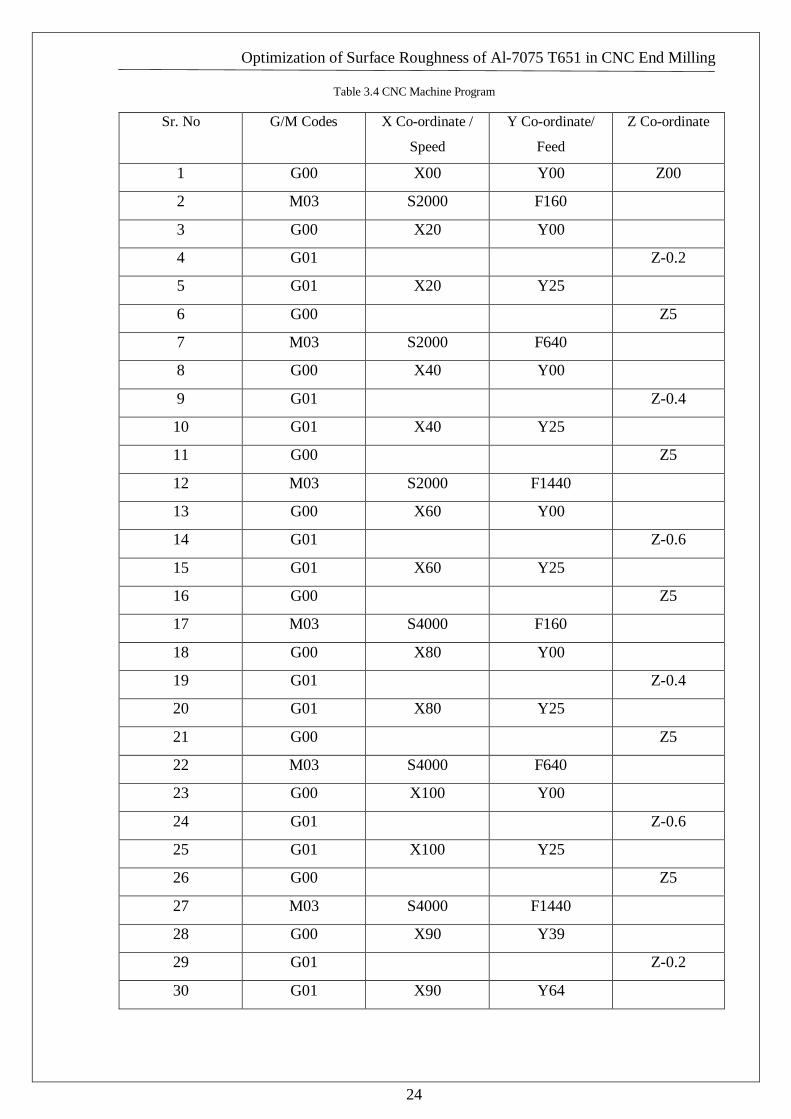
Program for Machining:
Figure 3.5 Program Graph
Optimization of Surface Roughness of Al-7075 T651 in CNC End Milling
24
Table 3.4 CNC Machine Program
Sr. No G/M Codes X Co-ordinate /
Speed
Y Co-ordinate/
Feed
Z Co-ordinate
1 G00 X00 Y00 Z00
2 M03 S2000 F160
3 G00 X20 Y00
4 G01 Z-0.2
5 G01 X20 Y25
6 G00 Z5
7 M03 S2000 F640
8 G00 X40 Y00
9 G01 Z-0.4
10 G01 X40 Y25
11 G00 Z5
12 M03 S2000 F1440
13 G00 X60 Y00
14 G01 Z-0.6
15 G01 X60 Y25
16 G00 Z5
17 M03 S4000 F160
18 G00 X80 Y00
19 G01 Z-0.4
20 G01 X80 Y25
21 G00 Z5
22 M03 S4000 F640
23 G00 X100 Y00
24 G01 Z-0.6
25 G01 X100 Y25
26 G00 Z5
27 M03 S4000 F1440
28 G00 X90 Y39
29 G01 Z-0.2
30 G01 X90 Y64

Optimization of Surface Roughness of Al-7075 T651 in CNC End Milling
25
31 G00 Z5
32 M03 S6000 F160
33 G00 X70 Y39
34 G01 Z-0.6
35 G01 X70 Y64
36 G00 Z5
37 M03 S6000 F640
38 G00 X50 Y39
39 G01 Z-0.2
40 G01 X50 Y64
41 G00 Z5
42 M03 S6000 F1440
43 G00 X30 Y39
44 G01 Z-0.4
45 G01 X30 Y64
46 G00 Z5
47 G28
48 M05
49 M30
Figure 3.6 Operating of Machine

Optimization of Surface Roughness of Al-7075 T651 in CNC End Milling
26
Figure 3.7 Completion of Machining
3.4. Software Used for experiment
Minitab Inc. is one of the world’s leading developers of statistical and process improvement
software. Minitab Statistical Software has been used in virtually every major Six Sigma
initiative around the world, and is used to teach statistics in over 4,000 colleges and
universities. Quality Companion is used worldwide to plan and execute Six Sigma projects.
Minitab products are backed by outstanding services, including training, e-learning
opportunities, and free technical support.

Optimization of Surface Roughness of Al-7075 T651 in CNC End Milling
27
Figure 3.8 Software work on Regression Analysis
Figure 3.9 Software work on S/N Ratio and Mean
Chapter 4
Reading, Calculation and Analysis
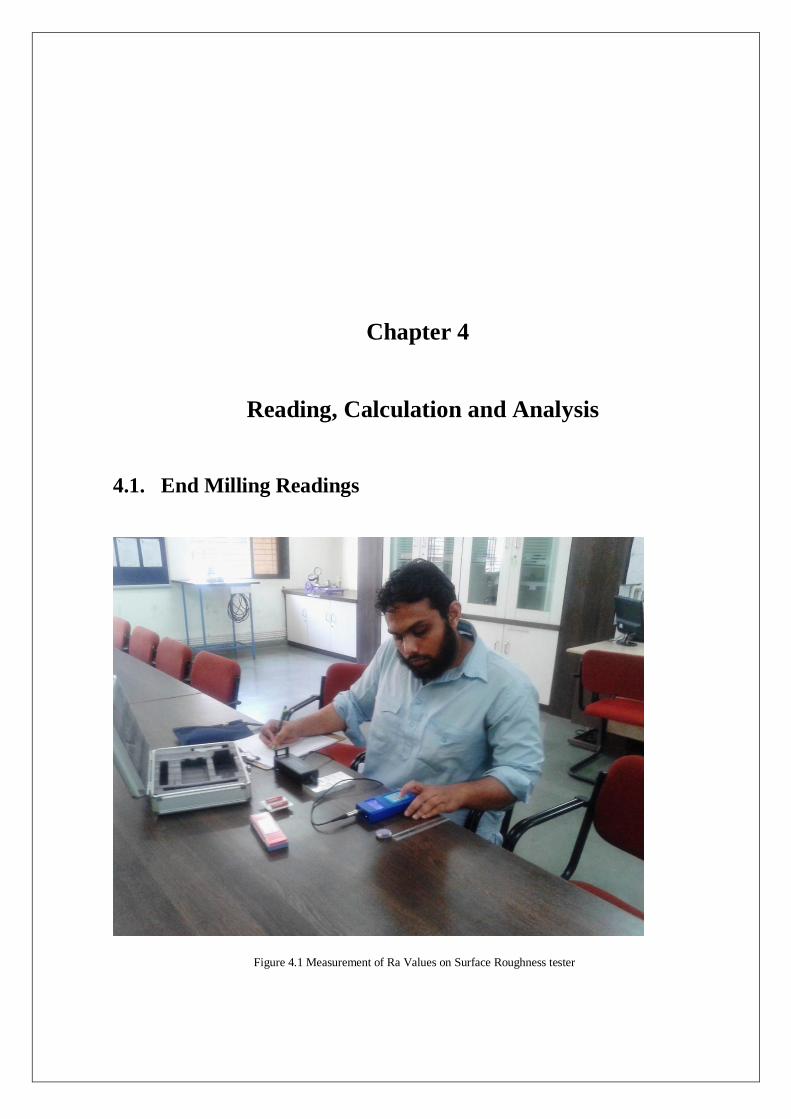
4.1. End Milling Readings
Figure 4.1 Measurement of Ra Values on Surface Roughness tester

Readings and Calculations:
Table 4.1 Surface Roughness Reading measurement and Values of Mean and S/N Ratio
SR.NO.
Cutting
Speed
‘r.p.m’
Feed
Rate
‘mm/min
Depth
of cut
‘mm’
Surface Roughness
(Ra)
‘µm’
S/N
Ratio
S/N
Ratio
By
formula
Mean
1 2000 160 0.2 0.211 0.209 0.210 13.5556 13.55 0.210
2 2000 640 0.4 0.426 0.427 0.425 7.4118 7.41 0.426
3 2000 1440 0.6 0.660 0.661 0.659 3.6091 3.61 0.660
4 4000 160 0.4 0.196 0.197 0.195 14.1549 14.15 0.196
5 4000 640 0.6 0.304 0.302 0.303 10.3711 10.37 0.303
6 4000 1440 0.2 0.498 0.503 0.499 6.0206 6.02 0.500
7 6000 160 0.6 0.285 0.288 0.286 10.8727 10.87 0.286
8 6000 640 0.2 0.343 0.340 0.345 9.2941 9.29 0.343
9 6000 1440 0.4 0.567 0.568 0.570 4.9130 4.91 0.568
Calculation Of S/N Ratio (Smaller Is Better) By Formula
Formula for Smaller is better
S/N Ratio = -10*log(∑y2/n)
1. S/N Ratio = -10*log(0.2102/1)=13.55
2. S/N Ratio = -10*log(0.4262/1)=7.41
3. S/N Ratio = -10*log(0.6602/1)=3.61
4. S/N Ratio = -10*log(0.1962/1)=14.15
5.S/N Ratio = -10*log(0.3032/1)=10.37
6. S/N Ratio = -10*log(0.5002/1)=6.02
7. S/N Ratio = -10*log(0.2862/1)=10.87
8. S/N Ratio = -10*log(0.3432/1)=9.29
9. S/N Ratio = -10*log(0.5682/1)=4.91
29

Optimization of Surface Roughness of Al-7075 T651 in CNC End Milling
30
Calculation for Mean
Formula for Mean
Ra=(Ra1+Ra2+Ra3)/3
1. Ra=(0.211+0.209+0.210)/3 =0.210
2. Ra=(0.426+0.427+0.425)/3 = 0.426
3. Ra=(0.660+0.661+0.659)/3 = 0.660
4. Ra=(0.196+0.197+0.195)/3 = 0.196
5. Ra=(0.304+0.302+0.303)/3= 0.303
6. Ra=(0.498+0.503+0.499)/3 =0.500
7. Ra=(0.285+0.288+0.286)/3 =0.286
8. Ra=(0.343+0.340+0.345)/3 =0.343
9. Ra=( 0.567+0.568+0.570)/3 =0.568
4.1.1. Analysingof S/N Ratio
What is S/N ratio?
In Taguchi designs, a measure of robustness used to identify control factors that reduce
variability in a product or process by minimizing the effects of uncontrollable factors (noise
factors). Control factors are those design and process parameters that can be controlled. Noise
factors cannot be controlled during production or product use, but can be controlled during
experimentation. In a Taguchi designed experiment, you manipulate noise factors to force
variability to occur and from the results, identify optimal control factor settings that make the
process or product robust, or resistant to variation from the noise factors. Higher values of the
signal-to-noise ratio (S/N) indicate control factor settings that minimize the effects of the
noise factors.
The signal-to-noise (S/N) ratio measures how the response varies relative to the nominal or
target value under different noise conditions. For optimization the selected S/N ratios is:
Signal-to-noise ratio Use when the goal is to: And your data are
Smaller is better
Minimize the response
Non-negative with a target
value of zero

Optimization of Surface Roughness of Al-7075 T651 in CNC End Milling
31
Response Table for Signal to Noise Ratios
Smaller is better
Table 4.2Response Table for S/N Ratio
Level Cutting speed Feed rate Depth of cut
1 8.192 12.861 9.623
2 10.182 9.026 8.827
3 8.360 4.848 8284
Delta 1.990 8.013 1.339
Rank 2 1 3
The response table shows the average of each response characteristic (S/N ratios, means) for
each level of each factor. Above Table include ranks based on Delta statistics, which compare
the relative magnitude of effects. The Delta statistic is the highest minus the lowest average
for each factor. Minitab assigns ranks based on Delta values; rank 1 to the highest Delta
value, rank 2 to the second highest, and so on. Feed rate has more important significance on
surface roughness followed by cutting speed and depth of cut has minimum significance on
surface roughness.
Main Effect Plot for S/N Ratios:
Figure 4.2Main effect plot for S/N ratio

Optimization of Surface Roughness of Al-7075 T651 in CNC End Milling
32
From Fig.4.2, it can be seen that the surface roughness first increases with the cutting speed
up to the optimum level i.e. 4000 rpm and after that it decreases whereas in case of feed rate
surface roughness is maximum up to the optimum level i.e.160mm/min decreases with
increases in its value. But in case of depth of cut, surface roughness increases up to the
optimum level i.e. 0.2 mm and after that it decreases gradually.
Optimum Values for Each Factor
Table 4.3 Optimum Values for Each Factor
Cutting Speed Level 2 4000 rpm 10.182
Feed Rate Level 1 160 mm/min 12.861
Depth of cut Level 1 0.2 mm 9.623
4.1.2. Analysis of Variance for S/N ratios
Table 4.4. ANOVA for S/N Ratio
Source Degree
of
Freedom
Sequential
Sum of
Square
Adjusted
Sum of
Square
Adjusted
Mean of
Square
F-
statistic
P-value
C.S. 2 7.309 7.309 3.655 2.10 0.323
F. R. 2 96.382 96.382 48.191 27.70 0.035
D.O.C 2 2.722 2.722 1.361 0.78 0.561
Residual Error 2 3.480 3.480 1.740 - -
Total 8 109.893 - - - -
The analysis of variance was carried out at 95%confidence level. The purpose of ANOVA is
to investigate which cutting parameters significantly affect the surface roughness. This is
accomplished by separating the total variability of the S/N Ratios, which is measured by the
sum of squared deviations from the total mean of the S/N ratio, into contributions by each
cutting process parameter and the error (Table 4.4). In the experimentation work, for S/N
ratios, feed rate (p = 0.035) has the significant effect on surface finish at an α-level of 0.05,
other parameters cutting speed (p = 0.323) and depth of cut (p = 0.561) are non-significant.

Optimization of Surface Roughness of Al-7075 T651 in CNC End Milling
33
4.1.3. Analysis of Mean
What Is Mean?
It is the average value of the roughness measured in each Experiment.
Response Table for Means
Table 4.5. Response Table for Mean
Level C.S F. R. D.O.C
1 0.4320 0.2307 0.3510
2 0.3330 0.3573 0.3967
3 0.3990 0.5760 0.4163
Delta 0.0990 0.3453 0.0653
Rank 2 1 3
From the above response table 4.5. shows the average of each response characteristic (S/N
ratios, means) for each level of each factor. Above table also include ranks based on Delta
statistics, which compare the relative magnitude of effects. The Delta statistic is the highest
minus the lowest average for each factor. Minitab assigns ranks based on Delta values; rank 1
to the highest Delta value, rank 2 to the second highest, and so on. Feed rate has more
important significance on surface roughness followed by cutting speed and depth of cut has
minimum significance on surface roughness.
Main Effect Plot for Mean
Figure 4.3. Main effect plot for Mean

Optimization of Surface Roughness of Al-7075 T651 in CNC End Milling
34
From Fig.4.3, it can be seen that the surface roughness decreases with increases in cutting
speed up to the optimum level i.e. 4000 rpm whereas in case of feed rate surface roughness is
low to the optimum level i.e.160mm/min and increases with increases in its value. But in case
of depth of cut, surface roughness increases up to the optimum level i.e. 0.2 mm and after that
it increases gradually.
Optimum Values for Each Factor
Table 4.6. Optimum Values for Each Factor
Cutting Speed Level 2 4000 rpm 0.3330
Feed Rate Level 1 160 mm/min 0.2307
Depth of cut Level 1 0.2 mm 0.3510
Analysis of Variance for Mean
Table 4.7. Analysis of Variance for Mean
Source Degree of
Freedom
Sequential
Sum of
Square
Adjusted
Sum of
Square
Adjusted
Mean of
Square
F- statistic P-value
C.S 2 0.015246 0.015246 0.007623 4.39 0.186
F.R 2 0.183115 0.183115 0.091557 52.73 0.019
D.O.C 2 0.006741 0.006741 0.003370 1.94 0.340
Residual
Error
2 0.003473 0.003473 0.001736 - -
Total 8 0.208574 - - - -
The analysis of variance was carried out at 95%confidence level. The purpose of ANOVA is
to investigate which cutting parameters significantly affect the surface roughness. This is
accomplished by separating the total variability of the S/N Ratios, which is measured by the
sum of squared deviations from the total mean of the S/N ratio, into contributions by each
cutting process parameter and the error (Table 4.7). In the experimentation work, for S/N
ratios, feed rate (p = 0.019) has the significant effect on surface finish at an α-level of 0.05,
other parameters cutting speed (p = 0.186) and depth of cut (p = 0.340) are non-significant.

Optimization of Surface Roughness of Al-7075 T651 in CNC End Milling
35
4.1.4. Regression Analysis
Regression results indicate the direction, size, and statistical significance of the relationship
between a predictor and response.
Sign of each coefficient indicates the direction of the relationship.
Coefficients represent the mean change in the response for one unit of change in the
predictor while holding other predictors in the model constant.
P-value for each coefficient tests the null hypothesis that the coefficient is equal to
zero (no effect). Therefore, low p-values suggest the predictor is a meaningful addition
to your model.
The equation predicts new observations given specified predictor values.
By use of Minitab 17 regression analysis equation for the work was found shown as below:
Ra = 0.0103 - 0.0165 C. S + 0.1727 F. R + 0.0327 D.O.C
Table 4.8 Regression Analysis by Equation
Cutting Speed Feed rate Depth of cut Ra
L2 L1 L1 0.0561
L3 L2 L3 0.0783
L1 L3 L2 0.1162
Chapter 5
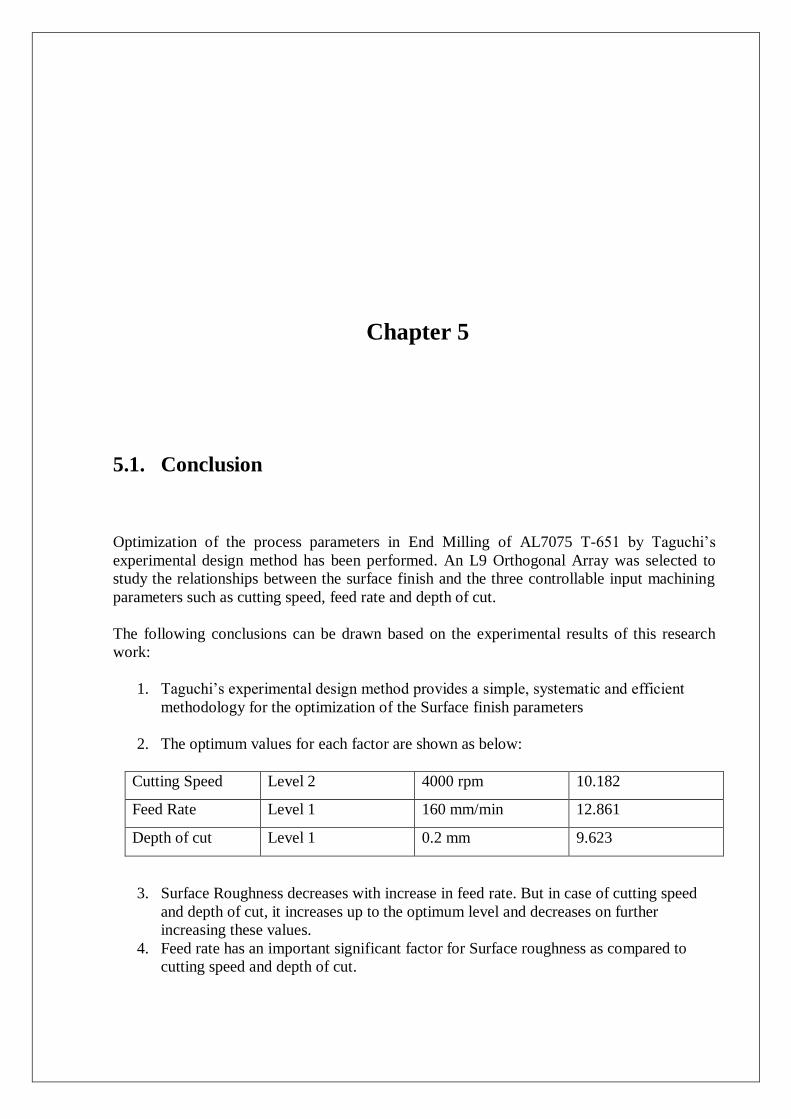
5.1. Conclusion
Optimization of the process parameters in End Milling of AL7075 T-651 by Taguchi’s
experimental design method has been performed. An L9 Orthogonal Array was selected to
study the relationships between the surface finish and the three controllable input machining
parameters such as cutting speed, feed rate and depth of cut.
The following conclusions can be drawn based on the experimental results of this research
work:
1. Taguchi’s experimental design method provides a simple, systematic and efficient
methodology for the optimization of the Surface finish parameters
2. The optimum values for each factor are shown as below:
Cutting Speed Level 2 4000 rpm 10.182
Feed Rate Level 1 160 mm/min 12.861
Depth of cut Level 1 0.2 mm 9.623
3. Surface Roughness decreases with increase in feed rate. But in case of cutting speed
and depth of cut, it increases up to the optimum level and decreases on further
increasing these values.
4. Feed rate has an important significant factor for Surface roughness as compared to
cutting speed and depth of cut.

Optimization of Surface Roughness of Al-7075 T651 in CNC End Milling
38
5.2. Future Scope
Different material or different categories of Aluminium Alloy can be used as the
experimental material.
Changed Parameters such as Nose Radius, cutting angles etc. as the input parameters
and many other Response parameters like MRR, Chip formation etc.
Dissimilar Machine instead of CNC can be used with or without Coolant in the
experimental Setup.
Multi Response parameter can be opted as methodology for the experimentation.
Various other Cutting tools can be used for the End Milling and identifying the
Surface Roughness effect of each of them.
Alternative to DOE approach can be employed for analysis and validation of the
project.

Chapter 6
References
Reference Journal Paper:
[1] Thakur Paramjit Mahesh, R.Rajesh, “OPTIMAL SELECTION OF PROCESS
PARAMETERS IN CNC END MILLING OF AL7075 T6.” International Conference
on Advances in Manufacturing and Material Engineering, AMME 2014.
[2] J.S. Pang, M.N.M. Ansari, Omar S. Zaroog, Moaz H. Ali, S.M. Sapuan, “Design
Optimization Of Parameters On The CNC End Milling Process Of Halloysite Nanotube
(HNT/Al/Ep) Hybrid Composite”, Housing and Building National Research Center,
HBRC Journal, 2014.
[3] A. Arun Premnath, T. Alwarsamy, T. Abhinav, C. Adithya, Krishnakant, “Surface
Roughness Prediction By Response Surface Methodology In Milling Of Hybrid
Aluminium Composites.”, International Conference on Modelling Optimisation and
Computing, 2012.
[4] Lohithaksha M Maiyara, Dr.R.Ramanujamb, K.Venkatesanc, Dr.J.Jeraldd,
“Optimization of Machining Parameters for End Milling of 718 Super Alloy Using
Taguchi Grey Analysis”, International Conference on DESIGN AND
MANUFACTURING, IConDM 2013.
[5] Lakshmipathi Tammineni1 and Hari Prasada Reddy Yedula, “Investigation Of Influence
Of Milling Parameters On Surface Roughness And Flatness”, International Journal of
Advances in Engineering & Technology, Jan. 2014. ©IJAET
[6] Deepak Kumar and Sandeep Jindal, "Optimization of Process Parameters of Gas Metal
ARC Welding by Taguchi’s Experimental Design Method", International Journal of
Surface Engineering and Material Technology, Vol.1 No.1, July-Dec-14, ISSN:2249-
7250.

Optimization of Surface Roughness of Al-7075 T651 in CNC End Milling
39
[7] Mohammed T. Hayajneh, Montasser S. Tahat b, Joachim Bluhm, "A Study of the
Effects of Machining Parameters on the Surface Roughness in the End-Milling
Process", Jordan Journal of Mechanical and Industrial Engineering,Volume 1, Number
1, Sep. 2007 ISSN 1995-6665 Pages 1 – 5.
[8] D.Sudhakaraa,G.Prasanthi,"Application of Taguchi Method for Determining Optimum
Surface Roughness in Wire Electric Discharge Machining of P/M Cold Worked Tool
Steel (Vanadis-4E)"Procedia Engineering 97 ( 2014 ) 1565 – 1576.
[9] Chi-Hsiang Chen,Yung-Cheng Wang, Bean-Yin Lee, “The Effect of Surface
Roughness of End-Mills on Optimal Cutting Performance for High-Speed Machining",
Strojniški vestnik - Journal of Mechanical Engineering 59(2013)2, 124-134.
[10] Mohammad Khoran, Pouyan Ghabezi And Eisa Khoran, "The Effects Of Milling
Parameters On Surface Roughness Of Stainless Steel X22 Cr Mo V 12 1", indian
j.sci.res.1(2) : 445-452, 2014.
[11] R.Ramanathan, S.Syed Abuthahir, Dr.P.Ranjithkumar,"ANALYSIS OF CNC
MILLING PARAMETERS FOR ALUMINUM AA6063 BY USING TAGUCHI
DESIGN", International Journal of Advanced Research in Biology, Ecology, Science
and Technology (IJARBEST) Vol. 1, Issue 8, November 2015.
[12] Avinash A. Thakre, "Optimization of Milling Parameters for Minimizing Surface
Roughness Using Taguchi‘s Approach", International Journal of Emerging Technology
and Advanced Engineering, ISSN 2250-2459, ISO 9001:2008 Certified Journal,
Volume 3, Issue 6, June 2013.
Books:
[13] Machinery's Handbook 27th Edition, Industrial Press, Inc., New York, NY.2004.
[14] "DOE-I Basic Design of Experiments" Presented By Nutek, Inc. 3829 Quarton Road
Bloomfield Hills, Michigan 48302, USA.
[15] "Technical Guide – Machining Formulas" - Paragon MAchine Technology, Chappell
Hill, TX.
[16] An Overview on Taguchi Method - Shyam Kumar Karna, Dr. Rajeshwar
Sahai.International Journal of Engineering and Mathematical Sciences IJEMS Jan.-
June 2012, Volume 1, pp.11-18
40
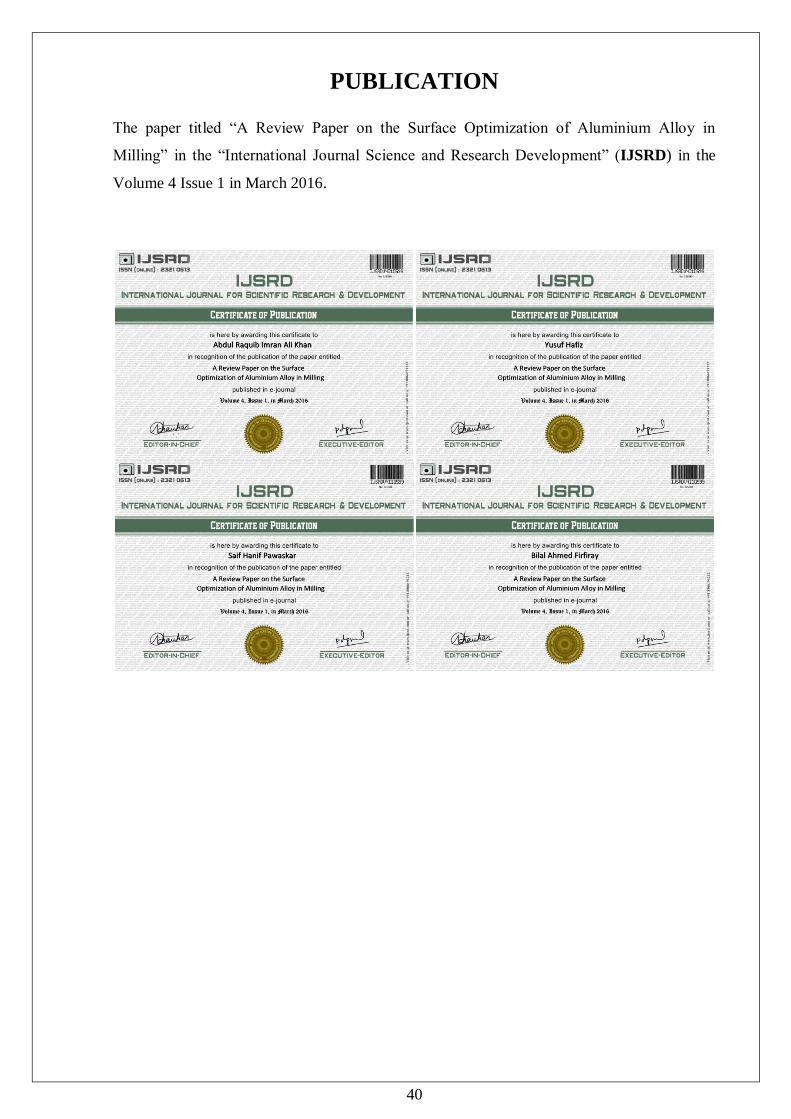
PUBLICATION
The paper titled “A Review Paper on the Surface Optimization of Aluminium Alloy in
Milling” in the “International Journal Science and Research Development” (IJSRD) in the
Volume 4 Issue 1 in March 2016.

Optimization of Surface Roughness of Al-7075 T651 in CNC End Milling
41

Optimization of Surface Roughness of Al-7075 T651 in CNC End Milling
42
Related Documents