1 PowerPoint PowerPoint Presentation by Presentation by Gail B. Wright Gail B. Wright Professor Emeritus of Professor Emeritus of Accounting Accounting Bryant University Bryant University © Copyright 2007 Thomson South-Western, a part of The Thomson Corporation. Thomson, the Star Logo, and South-Western are trademarks used herein under license. MANAGEMENT ACCOUNTING 8 th EDITION BY HANSEN & MOWEN 15 QUALITY COSTS AND PRODUCTIVITY STUDENT EDITION

Akuntansi Manajemen Edisi 8 oleh Hansen & Mowen Bab 15
May 29, 2015
Akuntansi Manajemen Edisi 8 oleh Hansen & Mowen Bab 15 Quality Costs And Productivity
Welcome message from author
This document is posted to help you gain knowledge. Please leave a comment to let me know what you think about it! Share it to your friends and learn new things together.
Transcript

1
PowerPointPowerPoint Presentation by Presentation by
Gail B. WrightGail B. WrightProfessor Emeritus of AccountingProfessor Emeritus of AccountingBryant UniversityBryant University
© Copyright 2007 Thomson South-Western, a part of The Thomson Corporation. Thomson, the Star Logo, and
South-Western are trademarks used herein under license.
MANAGEMENT ACCOUNTING
8th EDITION
BY
HANSEN & MOWEN
15 QUALITY COSTS AND PRODUCTIVITY
STUDENT EDITION
2
1. Identify & describe the 4 types of quality costs.
2. Prepare a quality cost report; differentiate between acceptable quality level & total quality control.
3. Tell why quality cost information is needed & show how it is used.
4. Explain what productivity is; calculate the impact of productivity changes on profits.
LEARNING OBJECTIVESLEARNING OBJECTIVES

3
WEIGHING COSTS & BENEFITS
Managers need to know what quality costs are & how they change over timeCosts of quality
Studies suggest that cost of quality production might be as much as 20% – 30% of sales
Benefits of qualityCompetitive dimension
LO 1
4
DIMENSIONS OF QUALITY: 1
Performance: how consistently a product functions
Aesthetics : appearance of tangible products, facilities, communication materials
Serviceability: ease of maintaining, repairing product
Features of quality design: characteristics that differentiate between similar products
LO 1
Continued
Aesthetics
5
DIMENSIONS OF QUALITY: 2
Reliability: probability that product, service will perform intended function for specified length of time
Durability: length of time a product functionsQuality of conformance : measure of how a
product meets its specificationsFitness for use: suitability of product for
advertised functions
LO 1
Quality of conformance

6
DEFECTIVE PRODUCT: Definition
DEFECTIVE PRODUCT: Definition
Is one that does not conform to specifications. Zero defects is
the goal.
LO 1
7
What are costs of quality?
Costs of quality exist because poor quality does or may exist:
• Control activities to prevent, detect poor quality.
• Failure activities are responses to poor quality.
LO 1
Failure activities

8
CATEGORIES OF QUALITY COSTS
1. Prevention costs: incurred to prevent poor quality
2. Appraisal costs : incurred to determine whether products, services conform to requirements, customer needs
3. Internal failure costs: incurred when non-conformance is discovered & product, service re-worked, scrapped, etc.
4. External failure costs: incurred when products fail to conform after delivery and recalled
LO 1
Appraisal costs
9
CLASSIFYING QUALITY COSTS
ObservableCosts available in accounting records
HiddenSignificantNot directly available in accounting recordsEstimated
Multiplier methodMarket researchTaguchi quality loss function
LO 1
10
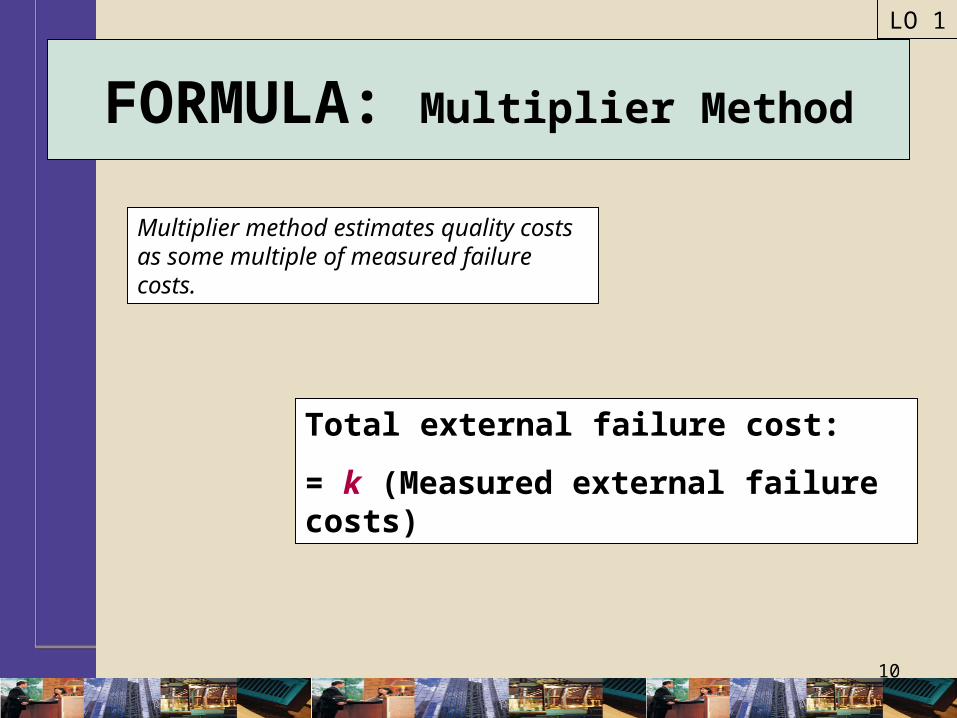
FORMULA: Multiplier Method
Multiplier method estimates quality costs as some multiple of measured failure costs.
LO 1
Total external failure cost:
= k (Measured external failure costs)

11
How does market research estimate hidden quality
costs?
Market research uses customer surveys & interviews of sales staff to project future profit
losses.
LO 1

12
What assumption does the Taguchi quality loss
function make?
Taguchi quality loss function assumes that variations from
target value of quality characteristic causes hidden quality costs regardless of
specification limits.
LO 1
13
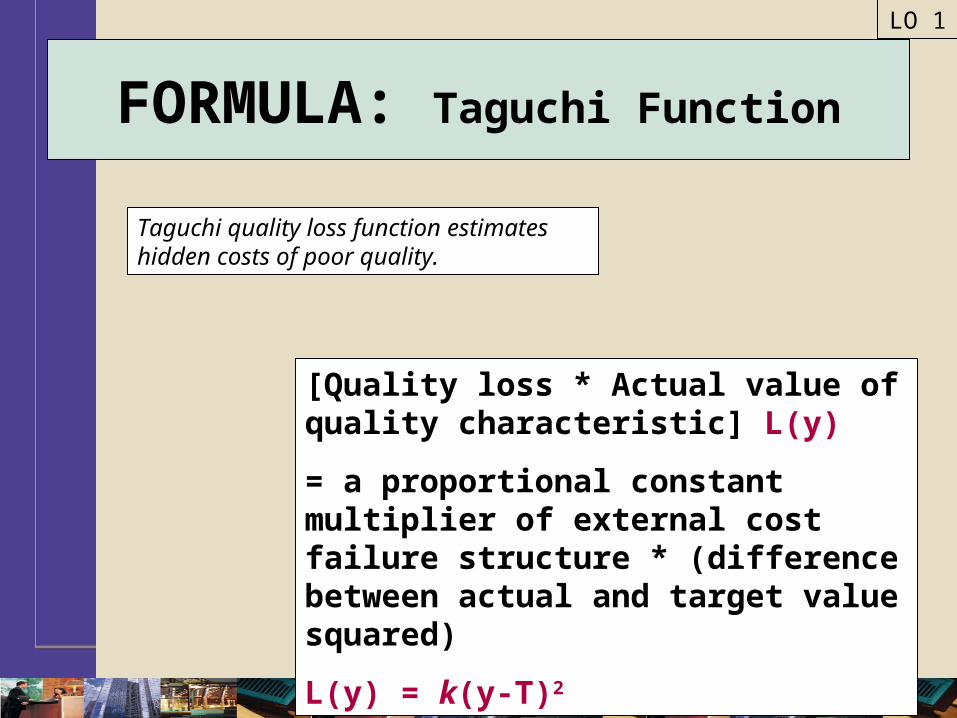
FORMULA: Taguchi Function
Taguchi quality loss function estimates hidden costs of poor quality.
LO 1
[Quality loss * Actual value of quality characteristic] L(y)
= a proportional constant multiplier of external cost failure structure * (difference between actual and target value squared)
L(y) = k(y-T)2

14
ACCEPTABLE QUALITY LEVEL (AQL): Definition
ACCEPTABLE QUALITY LEVEL (AQL): Definition
Is the optimal balance between control costs &
failure costs.
LO 2
15
Is there a problem with the ACL (traditional) view of
quality?
AQL encouraged lower quality levels by accepting production of a given number of defective
units.
LO 2
16
ZERO DEFECTS MODEL: Definition
ZERO DEFECTS MODEL: Definition
Claims that it is cost beneficial to reduce non-conforming units to zero.
LO 2
17
Is there a problem with the zero defects model?
Zero defects model understates quality costs & the potential for savings from efforts to improve
quality.
LO 2
understates

18
REDUCING QUALITY COSTS
Take direct attack on failure costs to drive them to zero
Invest in “right” prevention activities to bring about improvement
Reduce appraisal costs according to results achieved
Continuously evaluate, redirect prevention efforts to gain further improvement
LO 2
19
What is the strategy for reducing costs based on?
The strategy is based on the premise that a) there is a root cause for each failure, b) causes are preventable,
and c) prevention is always cheaper.
LO 2
20
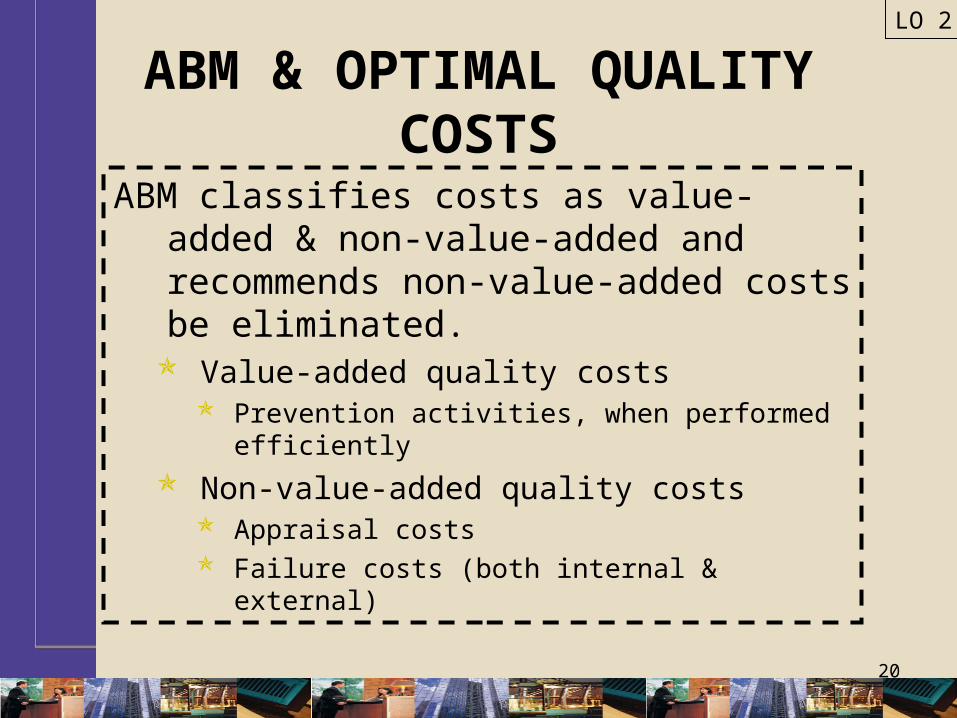
ABM & OPTIMAL QUALITY COSTS
ABM classifies costs as value-added & non-value-added and recommends non-value-added costs be eliminated.
Value-added quality costs Prevention activities, when performed
efficiently
Non-value-added quality costs Appraisal costs Failure costs (both internal & external)
LO 2

21
TQC COMPONENT GRAPH
LO 2
EXHIBITEXHIBIT 15-815-8
Over time, quality costs shift from non-value-added to value-added (prevention) costs.
22
What are principal objectives of reporting
quality costs?
Principal objectives are to improve & facilitate a)
managerial planning, b) control, and c) decision making.
LO 3

23
TOTAL PRODUCTIVE EFFICIENCY
When concerned with productive efficiency, 2 conditions must be satisfied:
Technical efficiency: For any mix of inputs that will produce a given output, no more of any 1 input is used than necessary to produce the output
Input trade-off efficiency: Given the mixes that satisfy the first condition, the least costly mix is chosen.
LO 4
24
PARTIAL MEASURES: AnalysisPARTIAL MEASURES: Analysis
LO 4
Conclusions that can be drawn about partial measures:
Existence of trade-offs mandates total measure of productivity for assessing merits of productivity decisions
Because of possibility of trade-offs, financial productivity must be measured
Conclusions that can be drawn about partial measures:
Existence of trade-offs mandates total measure of productivity for assessing merits of productivity decisions
Because of possibility of trade-offs, financial productivity must be measured

25
TOTAL PRODUCTIVITY MEASUREMENT: Definition
TOTAL PRODUCTIVITY MEASUREMENT: Definition
Is measuring productivity for all inputs simultaneously.
LO 4
26
PROFIT-LINKED PRODUCTIVITY MEASUREMENT: Definition
PROFIT-LINKED PRODUCTIVITY MEASUREMENT: Definition
Is measuring the amount of profit change attributable to
productivity change.
LO 4
27
PROFIT-LINKAGE RULE: Definition
PROFIT-LINKAGE RULE: Definition
States that productivity change is the difference between
[Cost of inputs without
productivity change – cost of inputs actually used].
LO 4
28
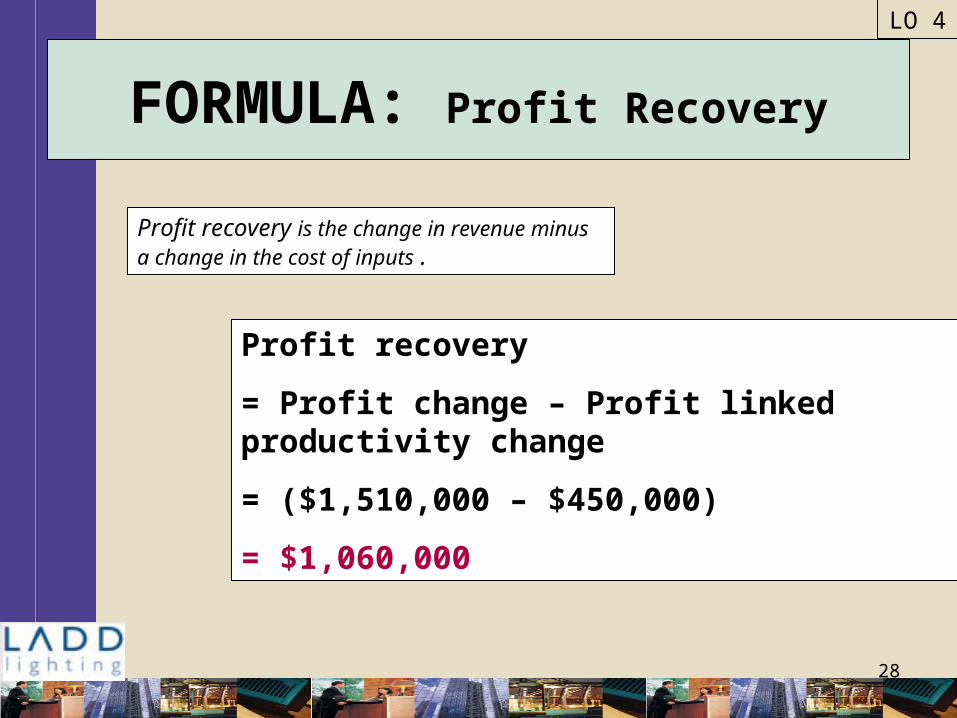
FORMULA: Profit Recovery
Profit recovery is the change in revenue minus a change in the cost of inputs .
LO 4
Profit recovery
= Profit change – Profit linked productivity change
= ($1,510,000 – $450,000)
= $1,060,000

29
THE ENDTHE END
CHAPTER 15
Related Documents