i EFFECTS OF PROPRIETARY VITAMIN-MINERAL PREMIXES AND HOUSING SYSTEMS ON LAYING CHICKENS EGG PRODUCTION AND QUALITY INDICES Akinola Yinka Paul OJELADE Matriculation Number: 42346 `

Welcome message from author
This document is posted to help you gain knowledge. Please leave a comment to let me know what you think about it! Share it to your friends and learn new things together.
Transcript
i
EFFECTS OF PROPRIETARY VITAMIN-MINERAL
PREMIXES AND HOUSING SYSTEMS ON LAYING
CHICKENS EGG PRODUCTION AND QUALITY
INDICES
Akinola Yinka Paul OJELADE
Matriculation Number: 42346
`
ii
EFFECTS OF PROPRIETARY VITAMIN-MINERAL
PREMIXES AND HOUSING SYSTEMS ON LAYING
CHICKENS EGG PRODUCTION AND QUALITY
INDICES
By
Akinola Yinka Paul OJELADE
B.Sc. (Hons.) Agriculture (Animal Science)
M.Sc. Agricultural Biochemistry and Nutrition (Ibadan)
PGDE Curriculum Studies (Lagos)
Matriculation Number: 42346
Submitted to the Department of Animal Science,
Faculty of Agriculture and Forestry,
University of Ibadan, Ibadan
In partial fulfillment of the award of
Doctor of Philosophy
in
Agricultural Biochemistry and Nutrition
November, 2016
iii
CERTIFICATION
We certify that this project was carried out by OJELADE Akinola Yinka Paul with
Matriculation Number 42346 in the Department of Animal Science, University of Ibadan,
Ibadan, Nigeria, under our supervision
……………………………………
Supervisor
Professor A. O. Akinsoyinu
B.Sc. (Hons.), Ph.D. (Ibadan), RAS, FNSAP
Agricultural Biochemistry and Nutrition Unit
Department of Animal Science
University of Ibadan, Ibadan, Nigeria
…...........................................
Date
…………………………………
Supervisor
Dr. O. A. Ogunwole
B.Sc. (Hons.), M. Sc., Ph.D., RAS, FCASN
Senior Lecturer,
Vitamin-Mineral & Amino Acid Metabolism
Agricultural Biochemistry and Nutrition Unit
Department of Animal Science
University of Ibadan, Ibadan, Nigeria
…........................................................
Date

iv
DEDICATION
This thesis is dedicated to the Glory of God, The Father, The Son and The Holy Spirit
v
ACKNOWLEDGEMENT
To God be the glory for great things He has done. All thanks and adoration is to Almighty God
for His grace and mercies that saw me through this PhD Programme. I praise God for the
wisdom, knowledge and protection in the course of the programme. I am most grateful to A.
O. Akinsoyinu; an erudite Professor of Agricultural Biochemistry and Nutrition, former Head
of Department of Animal Science and Dean, Faculty of Agriculture and Forestry, University of
Ibadan and currently, Dean, School of Agriculture and Industrial Technology, Babcock
University, Ilishan-Remo, Ogun State, Nigeria. Also, my sincere appreciation goes to Dr. O. A.
Ogunwole for his roles at the onset, execution and eventual completion of this research. I will
forever remain appreciative to him for of his enthusiastic support and encouragement. The
unalloyed and consistent support of my supervisors in the course of this research impacted
greatly on the results obtained. I say thank you for your support and mentorship.
I am grateful to Professor O. J. Babayemi, the Head of Department of Animal Science, Dr. E.
O. Ewuola, the Sub-Dean (Postgraduate), Faculty of Agriculture and Forestry and Dr.
Olufuunmilayo Adeleye, the Postgraduate Coordinator, Department of Animal Science for their
understnding academic contributions to this thesis. I sincerely thank Professors O. O. Tewe,
Oyebiodun Longe, A. D. Ologhobo and E. A. Iyayi for the various. I thank Drs. O. A. Abu,
Adebisi Agboola, O. Odu and R. Omidiwura for their roles during the different semeniar
presentations. My warm appreciation goes to Professor S. S. Abiola of the Federal University
of Agriculture, Abeokuta, Ogun State, Nigeria, who was on sabbatical leave in the Department
for his encouragement in the course of this research. I thank Professors A. B. Omojola, A. E.
Salako, and M. K. Adewunmi, and Drs. Olubunmi Olusola, T. O. Osasanya, O. A. Adebiyi,
Mabel Akinyemi, O. A. Olorunsomo, H. Osaiyuwu as well as Mr. O. Alaba for their various
contributions towards successful completion of this study. I appreciate Professor A. O. K.
Adesehinwa of the Institute of Agricultural Research and Training, Moor Plantation, Ibadan,
Nigeria for his encouragement during the period of my study. I thank Mrs. T. T. Lawal and
Messrs. S. Adelani, A. A. Fabowale and O. M. Omotoso for laboratory assistance. I shall
forever remain grateful to Professor O. O. Oluwatosin of the Federal University of Agriculture,
vi
Abeokuta, Ogun State, Nigeria, for supplying me with several published journals relating to the
study. I say thank you sir.
My special thanks go to the Provost, Dr. S. O. Olusanya, Deputy Provost, Dr. K. Olojede and
other members of the management of Federal College of Education (Technical), Akoka Lagos
for granting me three years study leave to embark on this Ph.D programme. I thank the Federal
Government of Nigeria for providing financial support through Tertiary Education Trust Fund
(TETFUND). I appreciate Dr. W. A. Lamidi, Dean School of Vocational Education, Drs. E. O.
Filani, A. W. Azeez, A.W. Olowa, Omowunmi Olowa, Olabisi Busari and Ruth Chigbu;
Messrs. E. O. Ibiyemi, A. S. Ajibade, A. A. Falade and E. K. Ayeyemi; Mrs. Oluwatoyin
Oyegunwa, Mrs. L. V. Ezechi of the Federal College of Education (Technical), Akoka Lagos. I
specially thank Mr. J. A. Adedokun, for his financial and moral support during the course of
the programme.
I am very grateful to the CEO of OOA Farms, Idi Osan, Balogun Village, Ibadan, Oyo State,
Nigeria for providing me suitable poultry research farm site to carry out this work. I appreciate
the Farm Manager and other workers for their assistance and support in the course of the
research. Permit me also to appreciate the useful support and assistance of Mr. Lawrence Sule
and family and Pastor Bejamin Ayodele. It is important to place on record the cooperation of
the following undergraduate and post-graduate students whose involvements and participation
enriched the quality of this research. First in this category are Miss Adedayo Bodunrin, Mr. I.
K. Aikore, Miss Essien, Emem Aquaowo, Mr. Oyewo Muttiu, Miss Asuquo Christiana, Miss
Lovette Dibia (Now Late RIP), Miss Kemi Akinleye, Miss Yemisi Oluremi, Mr.Dele Adedeji,
Miss Ireti Oludoyi, Mr. Sabur Oladimeji, Mr. Ibrahim Akinfemi, Mr. Ahmed Lawal, Mrs.
Folashade Jemiseye, Mrs. Aderonke Mosuro, Mrs. Titi Abokede, Miss Oluwagbemisola
Mapayi and Mr. Peter Asiruwa. Also, I thank Mr. Afis and Mr. Lawrence Abegunde, both
worked as research assistants in the course of the research. I appreciate the Director and entire
staff of Lawrem Feed Mill where all feeds for the birds was milled
I thank Dr. S. O. Adeniyi, formerly in the Department of Educational Psychology, Federal
College of Education (Technical), Akoka Lagos, and now in the Department of Educational
Foundation, University of Lagos and Mr. Olabode of the Department of General Studies,
Federal College of Education (Technical), Akoka Lagos for reading and making useful
corrections on the first draft of this thesis.

vii
I appreciate the moral support and encouragement of the following colleagues; Dr. I. O. Miller,
Dr. S. A. Adebayo, Mr. K. T. Ijadunola, Mrs. Tolulope Aluko, Mrs. Ruth Lawal, Mr. D. Faleye
and Dr. J. Owolabi of the Federal College of Education (Technical), Akoka Lagos. I
acknowledge the wonderful and innumerable spiritual, financial and material support of Mr.
and Mrs. Ogunmuditi and their children; Eniola and Lolade as well as Miss Rifkatu Anthony.
May Almighty God continually bless your family and protect you always, Amen. Also, I
appreciate the spiritual and financial assistance of Mr. and Mrs. Dotun Ologbon towards the
successful completion of this study.
I am grateful to Pastor and Pastor (Mrs.) E. A. Adeboye, the General Overseer of The
Redeemed Christian Church, all the Elders, Regional, Provincial, Zonal, Area and Parish
Pastors as well as the entire body of Christ for their prayers for me. My thanks go to Olusegun
Alawode, the Area Pastor of Sanctuary Dwellers and the entire congregation for their prayers
for me. I thank the entire members of my extended family particularly, Mr. Adeshina
Emmanuel Ojelade, who sponsored me right from secondary up to Master’s Degree level in the
university. I prayed that the Almighty God bless you, your children and grand-children. Let me
express my appreciation to my niece, Miss Toyin Ojelade in Minnesota, USA for her financial
support in the course of this study.
The home supports of my wife, Mrs. Temitope Yetunde Ojelade and my children: Oluwasegun
Elijah Olusoji-Ojelade, Anuoluwapo Esther Olusoji-Ojelade, Oreoluwa Ruth Olusoji-Ojelade
and Oluwadolapo Enoch Olusoji-Ojelade, are quite appr4eciated. I thank all for their prayers
and endurance in periods I was far away from home at the University of Ibadan. May the good
Lord bless all of you, amen.
AkinolaYinka Paul Ojelade
November, 2016
viii
ABSTRACT
Housing Systems (HS), dietary vitamins and mineral supplements are obligatory components
of poultry production. The composition of Proprietary Vitamin-mineral Premixes (PVmP)
varies in forms and source which alongside HS could alter production and quality of eggs.
There is dearth of information on effects of HS and different PVmP on production and quality
indices of eggs. Therefore, effects of five PVmP and two HS on egg production and quality
indices were investigated in Ibadan.
A basal diet was formulated without any PVmP (control diet, D1), while others were
supplemented with 0.25% premixes K, L, M, N and P each to obtain diets D2, D3, D4, D5 and
D6, respectively. In a completely randomised design, Bovan Nera pullets (n=576) aged 13
weeks were randomly allocated to two HS [Battery Cage (BC) and Deep Litter (DL)] and six
treatments in a 2x6 factorial arrangement, and reared for ten months. Ambient temperature and
Relative Humidity (RH) in HS were recorded. Hen Day Egg Production (HDEP) was assessed
at peak and late-lay phases by standard procedure. Eggs collected at week 36 were stored for 28
days and assayed for Crude Protein (CP), Low Density Lipoprotein-cholesterol (LDLc), Lipid
Oxidation (LO), Eggshell Weight (EW), Eggshell Thickness (ET) and Haugh Unit (HU) at 0, 7,
14, 21, 28 Days of Storage (DoS) under ambient conditions. Data were analysed using
descriptive statistics, polynomial regression and ANOVA at α0.05.
Ambient temperature (oC) and RH (%) ranged from 26.5±0.1 to 31.9±1.1and 40.6±1.0 to
90.5±8.7, respectively and were above thermoneutrality for chickens. Hens attained peak-lay at
different periods during production irrespective of HS and PVmP type. The HDEP (%) in BC
(64.1±26.4) and DL (82.0±13.8) at peak-lay reduced to 52.1±11.4 and 57.8±14.1, respectively
in late-lay. The HDEP on D1 at peak-lay declined from 56.1±9.6 to zero at week 34. At week
34, HDEP in K (76.65) and M (76.60) were higher than 68.45, 68.59 and 67.72 obtained for
birds on L, N and P respectively. At week 36, CP (%) of eggs from hens on D2 (11.6±0.17), D3
(11.55±0.23), D5 (11.55±0.23) and D6 (11.6±0.23) were higher than those on D4 (11.4±0.17).
The LDLc (mg/dL) and LO (μmol/g) of egg from hens on DL (2.13±1.63 and 0.04±0.01,
respectively) were higher than BC (0.74±0.15 and 0.028±0.01μmol/g, respectively). At zero
DoS, LO (μmol/g) of egg from hens on D2 (0.028±0.009), D3 (0.031±0.008), D4
(0.033±0.008), D5 (0.032±0.008) and D6 (0.027±0.010) were significantly different and
increased linearly with DoS. The EW and ET of eggs from BC (5.89±0.60 and 0.35±0.03) were
significantly higher than in DL (5.58±0.48 and 0.34±0.03, respectively). Eggs from BC
(48.7±24.6) had higher HU than DL (44.8±25.2). The HU of egg from hens on D5 (48.6±25.2)
and D6 (48.0±25.0) were significantly higher than D2 (46.1±26.8), D3 (46.1±23.8) and D4
(44.8±25.1), and HU decreased significantly with DoS (R² = 0.98).
Birds raised on deep litter produced more eggs than battery cage system. Proprietary vitamin-
mineral premix P reduced egg lipid oxidation, while interaction of proprietary vitamin-mineral
premixes L and N with both housing systems enhanced bird laying capability.
Keywords: Deep litter, Battery cage, Laying chickens, Egg storage quality, Hen day egg
production
Word count: 500
ix
TABLE OF CONTENT
TITLE PAGE ii
CERTIFICATION iii
DEDICATION iv
ACKNOWLEDGEMENT v
ABSTRACT viii
TABLE OF CONTENT ix
LIST OF TABLES xix
LIST OF FIGURES xxii
CHAPTER ONE
1.0: INTRODUCTION 1
1.1: Justification 5
1.2: Objectives of study 7
CHAPTER TWO
2.0: LITERATURE REVIEW
2.1: Housing systems in poultry production 8
2.2: Management of laying chickens 10
2.3: Energy requirement of laying chickens 12
2.4: Protein requirement of laying chickens 13
2.5: Vitamin and mineral nutrition in poultry production 16
2.6: Vitamin and mineral requirement of laying birds 21
2.7: Vitamin and mineral metabolism and immune systems 22
2.8: The use of vitamin-mineral premixes in poultry nutrition 24
2.9: Housing systems and performance of laying chickens 27
2.10: Composition, formation and structure of a chicken egg 29
2.11: Egg quality characteristics 32
2.12: External egg quality characteristics 33
2.12.1: Egg shape index (SI) 34
x
2.12.2: Egg weight (Ew) 36
2.12.3: Eggshell weight (EW) 37
2.12.4: Eggshell thickness (ET) 38
2.13: Internal egg quality characteristics 39
2.13.1: Albumen quality 40
2.13.2: Yolk quality 41
2.14: Relationship among quality characteristics 42
2.15: Effect of housing system on egg quality characteristics 44
2.16 Effect of housing system on egg lipid profile 47
2.17: Effect of nutrition on egg quality characteristics 48
2.18: Dietary influence on blood and egg-yolk cholesterol in poultry 53
2.19: Methods of chicken eggs storage 54
2.20: Changes in egg quality characteristics during storage 56
2.21: Lipid oxidation and biological implications in animals and products 61
2.22: Effect of dietary vitamins and minerals on lipid oxidation 63
CHAPTER THREE
3.0: MATERIALS AND METHODS
Study One
Effects of two housing systems on performance characteristics of pullets from 13 to 16 week of
age
3.1.1: Experimental Site 66
3.1.2: Housing systems 66
3.1.3: Animals and Management 67
3.1.4: Gross composition of experimental diet 67
3.1.5: Data collection 69
3.1.7: Statistical analysis 69
xi
Study Two
Effects of five different proprietary vitamin-mineral premixes and two housing systems on
performance and egg production characteristics of pullets from 17 to 21 week of age
3.2.1: Experimental site 70
3.2.2: Housing systems 70
3.2.3: Experimental design and model 70
3.2.4: Animals and Management 70
3.2.5: Test proprietary vitamin-mineral premixes 70
3.2.6: Dietary layouts 72
3.2.7: Experimental diets 72
3.2.8: Data collection 74
3.2.9: Statistical analysis 74
Study Three
Effects of five different proprietary vitamin-mineral premixes and two housing systems on
performance and hen egg production of laying chickens (22-70 weeks of age)
3.3.1: Experimental site 75
3.3.2: Housing systems 75
3.3.3: Experimental design and model 75
3.3.4: Animals and Management 75
3.3.5: Test proprietary vitamin-mineral premixes 75
3.3.6: Dietary layouts 77
3.3.7: Experimental diets 77
3.3.8: Data collection 79
3.3.9: Statistical analysis 79
Study Four
Effects of five different proprietary vitamin-mineral premixes, housing systems and duration of
storage on external and internal quality indices of eggs
3.4.1: Experimental site 80
3.4.2: Housing systems 80
3.4.3: Experimental design and model 80
xii
3.4.4: Animals and Management 80
3.4.5: Test proprietary vitamin-mineral premixes 80
3.4.6: Dietary layouts 80
3.4.7: Experimental diets 81
3.4.8: Data collection 81
3.4.9: Statistical analysis 82
Study Five
Effects of supplementing laying chickens feed with five different proprietary vitamin-mineral
premixes, two housing systems and duration of storage on chemical compositions of eggs
3.5.1: Experimental site 83
3.5.2: Housing systems 83
3.5.3: Experimental design and model 83
3.5.4: Animals and Management 83
3.5.5: Test proprietary vitamin-mineral premixes 83
3.5.6: Dietary layouts 83
3.5.7: Experimental diets 83
3.5.8: Data collection 83
3.5.8.1: Determination of Moisture and Dry Matter content 84
3.5.8.2: Determination of Ash Content 84
3.5.8.3: Determination of Crude Protein 84
3.5.8.4: Determination of Ether Extract 85
3.5.8.5: Determination of Gross Energy 85
3.5.8.6: Determination of Calcium 86
3.5.8.7: Determination of Phosphorous 86
3.5.8.8: Determination of Nitrogen Free Extract (NFE) 86
3.5.9: Statistical analysis 86
Study Six
Effects of five different proprietary vitamin-mineral premixes and two housing systems on
cholesterol profile of eggs
3.6.1: Experimental site 87
xiii
3.6.2: Housing systems 87
3.6.3: Experimental design and model 87
3.6.4: Animals and Management 87
3.6.5: Test proprietary vitamin-mineral premixes 87
3.6.6: Dietary layouts 87
3.6.7: Experimental diets 87
3.6.8: Data collection 87
3.6.9: Statistical analysis 88
Study Seven
Effects of supplementing five different dietary proprietary vitamin-mineral premixes, two
housing systems and duration of storage on lipid oxidation of eggs
3.7.1: Experimental site 89
3.7.2: Housing systems 89
3.7.3: Experimental design and model 89
3.7.4: Animals and Management 89
3.7.5: Test proprietary vitamin-mineral premixes 89
3.7.6: Dietary layouts 89
3.7.7: Experimental diets 89
3.7.8: Data collection 89
3.7.9: Statistical analysis 90
CHAPTER FOUR
4.0: RESULTS
Study One
4.1: Performance characteristics of growing pullets from 13 to 16 week of age 91
Study Two
4.2.1: Performance characteristics of pullets fed diets supplemented with five different
proprietary vitamin-mineral premixes in two housing systems from 17 to 21 week of
age 93
4.2.2: Hen day egg production of pullets fed diets supplemented with five different proprietary
vitamin-mineral premixes in two systems from 17 to 21 week of age 98
xiv
Study Three
4.3.1: Ambient temperature (oC) and relative humidity (%) in the two housing systems 101
4.3.2: Performance characteristics of layers fed diets supplemented with five different
proprietary vitamin-mineral premixes in two housing systems from 22 to 35 week of age
103
4.3.3: Egg production characteristics of layers fed diets supplemented with five different
proprietary vitamin-mineral premixes in two housing systems from 22 to 35 week of age
107
4.3.4: Hen day egg production of layers fed diets supplemented with five different proprietary
vitamin-mineral premixes in two housing systems 16 to 70 week of age 111
Study Four
4.4.1: External quality indices of eggs from layers fed diets supplemented with five different
proprietary vitamin-mineral premixes in two housing systems from 22 to 35 week of
age 114
4.4.2: Internal quality indices of eggs from layers fed diets supplemented with five different
proprietary vitamin-mineral premixes in two housing systems from 22 to 35 week of
age 118
4.4.3: External quality indices of eggs as affected by five different proprietary vitamin-
mineral premixes and duration of storage under two housing systems from 36 to 52
week of age 122
4.4.4: Effect of duration of storage on internal quality indices of eggs from layers fed diets
supplemented with five different proprietary vitamin-mineral premixes in two housing
systems from 36 to 52 week of age 124
4.4.5: Effect of duration of storage on external quality indices of eggs from layers fed diets
supplemented with five different proprietary vitamin-mineral premixes in two housing
systems from 53 to 70 week of age 126
xv
4.4.6: Internal quality indices of eggs from layers as affected by duration of storage, proprietary
vitamin-mineral premixes and two housing systems in days of storage from 53 to 70
week of age 128
4.4.7: Relationship among external quality indices of eggs as affected by duration of storage
130
4.4.8: Relationship among internal quality indices of eggs as affected by duration of storage
134
Study Five
4.5.1: Chemical compositions of eggs from layers fed diets supplemented with five different
proprietary vitamin-mineral premixes in two housing systems at week 22 to 35 weeks of
age 138
4.5.2: Chemical compositions of eggs as affected by five different proprietary vitamin-mineral
premixes, two housing systems and duration of storage from 36 to 52 week of age 143
4.5.3: Chemical compositions of eggs as affected by five different proprietary vitamin-mineral
premixes, two housing systems and duration of storage from week 53 to 70 weeks of age
142
4.5.3: Relationship among parameters of chemical composition of eggs as affected by duration
of storage from 53 to 70 weeks of age 148
Study Six
4.6.1: Cholesterol profile of whole-egg from layers fed diets supplemented with five different
proprietary vitamin-mineral premixes in two housing systems from 36 to 52 week of age
151
4.6.2: Cholesterol profile of egg-yolk from layers fed diets supplemented with five different
proprietary vitamin-mineral premixes in two housing systems from 36 to 52 week of age
149
xvi
Study Seven
4.7.1: Lipid oxidation of egg-yolk of layers fed diets supplemented with five different
proprietary vitamin-mineral premixes under two housing systems in days of storage from
36 to 52 week of age 159
4.7.2: Lipid oxidation of egg albumen and whole-egg of chickens fed diets supplemented with
five different proprietary vitamin-mineral premixes as affected by two housing systems
and duration of storage from 52 to 70 week of age 161
4.7.3: Regression of lipid oxidation of egg albumen, yolk and whole-egg with duration of
storage at late laying phase (52 to 70 week of age) 163
CHAPTER FIVE
5.0: DISCUSSION
Study One
Effects of two housing systems on performance characteristics of growing pullets from 13 to 16
weeks of age 165
Study Two
Effects of five different proprietary vitamin-mineral premixes and two housing systems on
performance and egg production characteristics of pullets from 17 to 21 weeks of age 167
Study Three
Effects of five different proprietary vitamin-mineral premixes and two housing systems on the
performance and hen egg production of laying chickens (22 to 70 weeks of age) 171
Study Four
Effects of five different proprietary vitamin-mineral premixes, two housing systems and
duration of storage on external and internal quality indices of eggs 175
Study Five
Effects of supplementing laying chicken feed with five different proprietary vitamin-mineral
premixes, two housing systems and duration of storage on chemical compositions of eggs 179
xvii
Study Six
Effects of five different proprietary vitamin-mineral premixes and two housing systems on
cholesterol profile of laying chicken eggs 180
Study Seven
Effects of five different dietary proprietary vitamin-mineral premixes, two housing systems and
duration of storage on lipid oxidation of eggs 182
CHAPTER SIX
5.0: SUMMARY, CONCLUSION AND RECOMMENDATIONS
5.1: Summary 183
5.2: Conclusion 182
5.3: Recommendations 185
REFERENCES 186
xviii
LIST OF TABLES
Table 1: Gross composition of experimental diet 68
Table 2: Gross compositions/2.5kg of test proprietary growers’ vitamin-mineral premixes 71
Table 3: Gross composition (%) of experimental diets fed from 17 to 21 weeks of age 73
Table 4: Gross composition/2.5kg of test proprietary layers vitamin-mineral premixes 76
Table 5: Gross composition (%) of layers diets 78
Table 6: Performance characteristics of pullets in two housing systems from 13 to 16 weeks of
age 92
Table 7: Performance characteristics of pullets fed five diets supplemented with five different
proprietary vitamin-mineral premixes in two housing systems from 17 to 21 weeks of
age 95
Table 8: Interaction effects of proprietary vitamin-mineral premixes and two housing systems
on performance characteristics of pullets from 17 to 21 weeks of age 97
Table 9: Ambient temperature (oC) and relative humidity (%) of two housing systems 102
Table 10: Performance characteristics of layers fed five diets supplemented with five
proprietary vitamin-mineral premixes in two housing systems from 22 to 35 weeks of
age 104
Table 11: Interaction effects of proprietary vitamin-mineral premixes and housing systems on
performance characteristics of layers from 22 to 35 weeks of age 106
Table 12: Egg production characteristics of layers fed diets supplemented five different
proprietary vitamin-mineral premixes in two housing systems from 22 to 35 weeks of
age 108
Table 13: Interaction effects of proprietary vitamin-mineral premixes and two housing systems
on egg production characteristics of layers from 22 to 35 weeks of age 110
Table 14: External quality indices of eggs from layers fed diets supplemented with five
different proprietary vitamin-mineral premixes in two housing systems from 22 to 35
weeks of age 115
xix
Table 15: Interaction effects of proprietary vitamin-mineral premixes and two housing systems
on external quality indices of eggs from layers from 22 to 35 weeks of age 117
Table 16: Internal quality indices of eggs from layers fed diets supplemented with five different
proprietary vitamin-mineral premixes in two housing in early-laying phase (22 to 35
weeks of age 119
Table 17: Interaction effects of proprietary vitamin-mineral premixes and two housing systems
oninternal egg quality indices of eggs from layers at week 22 to 35 week of age 121
Table 18: Effect of duration of storage on external quality indices of eggs from layers fed diets
supplemented with five different proprietary vitamin-mineral premixes in two housing
systems from 36 to 52 weeks of age 123
Table 19: Effect of duration of storage on internal quality indices of eggs from layers fed diets
supplemented with five different proprietary vitamin-mineral premixes in two housing
systems from 36 to 52 weeks of age 125
Table 20: Effect of duration of storage on external quality indices of eggs from layers fed diets
supplemented with five different proprietary vitamin-mineral premixes in two housing
systems from 53 to 70 weeks of age 127
Table 21: Internal quality indices of egg as affected by duration of storage, proprietary vitamin-
mineral premixes and two housing systems from 53 to 70 weeks of age 129
Table 22: Chemical compositions of eggs of layers fed diets supplemented with five different
proprietary vitamin-mineral premixes in two housing systems from 22 to 35 weeks of
age 140
Table 23: Interaction effects of proprietary vitamin-mineral premixes and two housing systems
on chemical compositions of eggs from 22 to 35 weeks of age 142
Table 24: Chemical composition of eggs as affected by five different proprietary vitamin-
mineral premixes, two housing systems and duration of storage from 36 to 52 weeks
of age 145
xx
Table 25: Chemical compositions of eggs as affected by five different proprietary vitamin-
mineral premixes, two housing and duration of storage from 53 to 70 weeks of age
144
Table 26: Cholesterol profiles of whole-egg from layers fed diets supplemented with five
different proprietary vitamin-mineral premixes in two housing systems from 36 to
52 weeks of age 152
Table 27: Interaction effects of proprietary vitamin-mineral premixes and housing systems on
cholesterol profile of whole-eggs of layers from 36 to 52 weeks of age 154
Table 28: Cholesterol profile of egg-yolk from layers fed diets supplemented with five different
proprietary vitamin-mineral premixes in two housing systems from 36 to 52 weeks
of age 156
Table 29: Interaction effects of proprietary vitamin-mineral premixes and housing systems on
cholesterol profile of egg-yolk of layers from 36 to 52 weeks of age 152
Table 30: Lipid oxidation of egg-yolk of layers fed diets supplemented with five different
proprietary vitamin-minerals premixes as affected by two housing systems and
duration of storage from 36 to 52 weeks of age 160
Table 31: Lipid oxidation of egg albumen and whole-egg of layers fed diets supplemented with
five different proprietary vitamin-minerals premixes as affected by two housing
systems and duration of storage from 53 to 70 weeks of age 156
xxi
LIST OF FIGURES
Figure 1: Hen Day Egg Production of pullets in two housing systems from weeks 16 to 21
99
Figure 2: Hen Day Egg Production of pullets of pullets fed diets supplemented with five
different proprietary vitamin-mineral premixes from weeks 16 to 21. 100
Figure 3: Hen Day Egg Production of laying hens in battery cage and deep litter systems. 112
Figure 4: Hen Day Egg Production of laying chickens fed different PVmP 113
Figure 5: Relationship of eggshell weight on DoS from 36 to 52 and 53 to 70 weeks of age
131
Figure 6: Relationships between eggshell thickness and days of storage from 36 to 52 and 53 to
70 weeks of age 132
Figure 7: Relationships between egg weight loss and days of storage from 36 to 52 and 53 to 70
weeks of age 133
Figure 8: Regression of albumen quality (Haugh Unit) on days of storage of eggs from 36 to 52
and 53 to 70 weeks of age 135
Figure 9: Regression of egg-yolk quality on days of storage of eggs from 36 to 52 and 53 to 70
weeks of age 136
Figure 10: Regression of albumen and yolk quality on days of storage of eggs 137
Figure 11: Regression of eggs crude protein on days of storage at the early- and late-laying
phases 149
Figure 12: Regression of egg fat on days of storage at the early- and late-laying phases 150
Figure 13: Regression of lipid oxidation on albumen, yolk and whole-egg in days of storage
164
1
CHAPTER ONE
1.0: INTRODUCTION
Poultry supply over 60% of the world‟s food (Brillard, 2004) which represents 25%
animal protein production (FAO, 2000). Poultry industry has witnessed rapid expansion
due to phenomenal improvement in animals‟ productivity through researches in
breeding and genetics, nutrition and husbandry management (Hetland et al., 2004;
Ogunwole, 2009) to meet the ever-increasing demand for animal protein consumption.
Research into production of quality and health friendly eggs for human consumption is
critical in commercial poultry industry. Production of quality eggs remains one of the
determinants of economic sustainability in commercial egg industry (Ahmadi and
Rahimi, 2011). The two main housing systems use in commercial egg production are
battery cage and deep litter systems (Anderson and Adams, 1994a). Variations in
housing systems relate to operating conditions, feeding and management practices
which affect egg production and quality indices (Mahmoud et al., 1996; Ayo et al.,
2007; Zemková et al., 2007; Lichovníková and Zeman, 2008; Obidi et al., 2008; Singh
et al., 2009; Djukicstojcic et al., 2009). Poultry farmers in developing countries are
known to house more birds in deep litter than battery cage system (Njoya and Picard,
1994; Badubi and Ravindran, 2004). However, conventional battery cage system
accommodates approximately 90% world population of laying chickens in commercial
poultry industry (Awoniyi, 2003; Peterman, 2003). In temperate countries, housing
laying chickens in conventional battery cage has comparative advantage over deep litter
system (Abrahamsson et al., 1996; Pistikova et al., 2006; Vosláŕova et al., 2006; Banga-
Mboko et al., 2010).
The emerging Animal Welfare Policy however tends to favour commercial egg
production in deep litter system (Scientific Panel on Animal Health and Welfares,
2005). This is because birds generally retain natural behaviour of their wild counterparts
(Price, 1984; Fraser and Bloom, 1990). Birds, therefore, prefer more space than is
provided in conventional battery cage where feed trough and water line are provided in
a restricted environment (Hughes, 1975; Dawkin, 1983). The natural behaviours such as
nesting, perching, roosting, scratching, dust-bathing, wing flapping, preening and
exercising are strongly motivated by internal factors such as hormones (Nicol, 1986).
2
These natural behaviours are important for well-being of birds but prevented when
housed in conventional battery cage system. The wire floor in conventional battery cage
deprives bird opportunity to express scratching behaviour. The domestic chickens spend
more than 50% of their active time foraging and scratching as means of exploring the
environment in search of food (Savory, et al., 1978; Dawkin, 1989). Although, birds in
battery cage system are always provided with balanced dietsad libitum but still possess
strong natural urge to scratch. Birds in deep litter system choose to scratch on littered
floor rather than eating identical feed provided in feeder (Duncan and Hughes, 1972).
Thus, birds in deep litter system are able to satisfy vitamins and minerals requirement
by foraging on litter materials, faeces and other natural feed materials (Skinner, et al.
1992; Asadumzzaman et al., 2005). Lack of appropriate scratching substrate could
result in abnormal behaviour like feather pecking (Blokhuis, 1989).
Nutrition is important for growth and production quality of eggs. All species of poultry
require nutrients in balanced proportion for efficient growth, maintenance of healthy
physiologic condition, reproduction and production. Birds respond differently to dietary
nutrients (Morris, 2004). Vitamins and minerals are required for growth and egg
production. Vitamins are complex organic nutrients present in small amounts in natural
foodstuffs (McDowell, 2000) and participate in cellular metabolism (Marks, 1979).
Feed ingredients do not normally contain all vitamins at the right amounts and
proportion needed by Chickens. Vitamins; A, D, B12 and riboflavin are usually low in
poultry feeds particularly in maize-soyabean diets where vitamins D and B12 are usually
absent. Vitamin K is generally added to poultry feed because birds have short intestines
and ingested feed pass through the intestine fast with less intestinal vitamin synthesis.
Poultry species are more susceptible to vitamins deficiencies because microbial
population in the intestinal tract synthesizes very little amount of vitamins and compete
vigorously with the host dietary supply (Asaduzzman et al., 2005).
Mineral nutrients are inorganic elements required for efficient production. Calcium,
phosphorus, copper, iodine, iron, manganese, sodium and zinc are essential for growth
and efficient quality egg production (Ogunwole, 2009). Calcium and phosphorous are
required for normal bone development, blood-clotting, muscle contraction, strong

3
eggshell and metabolic and energy functions. Chlorine in hydrochloric acid is required
for digestion and maintenance of water and acid/base balance. Sodium and potassium
are components of body electrolytes for metabolic, muscle and nerve functions as well
as water and acid/base balance. Magnesium functions in metabolism and muscular
contraction. Trace minerals are involved in metabolic functions. Iodine is needed for
production of thyroid hormone for regulation of rate of energy metabolism. Zinc is
involved in many enzymatic processes in body while iron serves as a component of
blood haemoglobin and myoglobin necessary for oxygen transportation.
Effects of single vitamin and/or mineral premixes in poultry nutrition are well
documented (Ogunmodede, 1974; 1975; 19977; 1978; 1981a and b; 1991; 1992). The
metabolic responses of single vitamin and/or mineral premix are different compared
with vitamin-mineral premixes which contain a condiment of vitamins and minerals.
Also, there are interactions, interrelationship and interdependence among vitamins
and/or minerals and other feed nutrients. Thus, single vitamin and/or mineral premixes
are not solely responsible for metabolic process and productive performance in poultry.
The effect of vitamins and minerals are largely interdependent in combination rather
than individual vitamin and/or mineral. The variability and inconsistent supply of
vitamins and minerals from feed ingredients as well as unreliability of commercial
single vitamins and/or minerals premix necessitates the use of proprietary vitamin-
mineral premixes. Hence, the discovery and use of vitamin-mineral premixes in poultry
nutrition was a major breakthrough in poultry nutrition (Oduguwa and Ogunmodede,
1995; Oduguwa et al., 1996; Oduguwa et al., 2000).
Proprietary vitamin-mineral premixes are marketed under different trade names and
account for about 10% total feed cost (Singh and Panda, 1988). These are commercial
micro-feed inputs that contain vitamins and/or trace minerals and antioxidants in
different carrier media. The use of quality premixes is essential and indispensable for
successful and sustainable commercial egg production and quality indices (Raven and
Walker, 1980). Therefore, proprietary vitamin-mineral premixes are added in small
amounts to feed to improve safety and reliability of productive performance as well as
protect against deficiency diseases (Raven and Walker, 1980). Thus, any compromise or
4
neglect to include proprietary vitamin-mineral premixes in poultry feed as an attempt to
minimize cost of feeding could make chickens to shut down all necessary metabolic
processes, reduced or cease egg production, produce poor egg quality imdices, high
mortality and farm economic losses (Suttle and Jones, 1989; Wuryastuti, et al., 1993).
Also, sub-standard or adultrated vitamin-mineral premixes by proprietors could affect
production and quality indices of eggs (Ogunwole et al., 2012; Ogunwole et al. 2015 a
and b) as optimum dietary vitamin and mineral requirements only allow for full
expression of genetic potentials of birds (OVN, 2010).
Table-eggs produced by chickens are rich sources of high quality digestible proteins,
carbohydrates, fats, minerals and vitamins. Egg quality is determined by standard
procedure based on external and internal characteristics (Koelkebeck, 2003). The
external quality indices of eggs influence consumers‟ acceptance or rejection and
marketing (Natalie, 2009). The albumen and yolk quality indices as well as chemical
compositions provide information on internal egg quality (Song et al., 2002). High
internal egg quality is indicated by firm and thick albumen and yolks (Ihsan, 2012). Egg
quality deteriorate depending on days of storage (Adeogun and Amole, 2004; Kul and
Seeker, 2004). The physical changes that determine egg quality include thinning of
albumen and flattening of yolk (Stadelman and Cotterill, 1995) which is cause by
weakening of vitelline membrane (Fromm and Matrone, 1962). The changes in albumin
quality are measured in Haugh Units (HU) and calculated from albumen height and
weight (Haugh, 1937). Chemical oxidation in poultry products affects lipids,
carbohydrates, proteins deoxyribonuclic acid (DNA) and vitamins (Kanner, 1994).
In animal muscle and eggs, chemical oxidation continues post-mortem and affects shelf-
life quality of products. Chemical oxidation is inherent to metabolism since excessive
formation of reactive species cause damage to some biological component (Halliwell et
al., 1995). The oxidative damage in biological materials is due to imbalance between
productions of free radicals and defense mechanism in response to oxidative stress. The
rate of chemical oxidation increases with high intake of lipid or oxidation of
polyunsaturated fatty acids (PUFA) or pro-oxidants and low intake of nutrients involved
in antioxidant defense system. Lipid oxidation is one example of chemical oxidation
5
and responsible for deterioration of meat and egg quality indices during storage.
Oxidative stability ofpoultry products may be maximised by dietary supplementation of
vitamins and mineral especially vitamin A and E and selenium which possess
antioxidants proprotey. Storage methods, length of storage days and temperature affect
oxidative stability of poultry products (Coutts and Wilson, 1990; Jacob et al., 2000).
The length of storage days and temperature affect albumin and yolk quality (Samli et
al., 2005) becuase internal temperature of eggs above 7oC degenerate albumen and
vitelline membrane (Jones, 2006) making water move from albumen into the yolk and
increase severity of mottling when eggs are stored (Jacob et al., 2000). There is
therefore a dearth of information on the effect vitamin-mineral premixes by different
proprietors on laying chickens egg production and quality indices. The present study
was carried out to investigate effects of five different proprietary vitamin-mineral
premixes and two housing systems on laying chickens egg production and quality
indices.
1.1: Justification
Housing systems and vitamin-mineral nutrition greatly affect production and quality
indices of eggs (Zemková et al., 2007; Lichovníková and Zeman, 2008; Singh et al.,
2009; Djukic-Stojcic et al., 2009). To satisfy continuous demand for desirable quality
eggs, there is need to investigate effects of different proprietary vitamin-mineral
premixes and housing systems. Commercial egg industry in Nigeria is dominated by
exotic strains of chicken that have been evaluated in the temperate region under optimal
nutrition and housing systems. The productive performance of these strains is sub-
optimal in developing countries due to sub-optimal housing systems and nutrition
(Dingle and Henuk, 1999; Henuk and Dingle, 2000). Also, there are variations in
performances among commercial strains of laying chickens under homogenous housing
systems in controlled and natural environments (Duduyemi, 2005; Mmereole and
Omeje.2005; Yakubu et al., 2007). Extensive studies (Oduguwa et al., 2000; Ogunwole
et al., 2012) on effects of proprietary vitamin-mineral premixes on broiler chickens have
been documented. However, fewer emhapsises have been on laying chickens egg
production and quality indices (Asaduzzaman et al., 2005). Thus, there is dearth of
information on effects of different propritarty vitamin-mineral premixes and housing
sytems on laying chicken egg production and quality indices.
6
Generally, chickens reared in deep litter system are believed to satisfy their vitamins
and minerals requirement by scratching litter materials and faeces (Skinner, et al. 1992).
Also, speculations abounds that some proprietary vitamin-mineral premixes are of poor
or sub-standard in quality. Low production and poor quality indices of table chicken
eggs in developing countries like Nigeria could be attributed to the use of adulterated or
sub-standard vitamin-mineral premixes. The use of poor or sub-standard quality
propeitary vitamin-mineral premixes could reduce egg production and quality indices.
Study (Anisuzzaman, 1993) indicated reduced production and low quality of eggs
despite supplementation with well formulated balanced layer diets with proprietary
vitamin-mineral premix.
Farmers, animal nutritionists and feed millers are therefore at cross road at determining
the brand of propeitary vitamin-mineral premix to use in feed formulation. In addition,
inadequacy of laboratory equipment for analyses and provision of needed information
on vitamin and mineral profile remained a challenge. Thus, a slower but rational
investigative approach of using live animals in feeding trials is explored to investigate
effects of different proprietary vitamin-mineral premixes (Ogunwole et al., 2012). There
is therefore the need for regular assessment of vitamin and mineral profile in different
proprietary vitamin-mineral premixes by using live animals in feeding trials. This is
important for quality control and regulation of products standard to ensure safety of
poultry industry. Also, farmers, animal nutritionists and feed millers need to be well
informed about the vitamin-mineral profile in different proprietary vitamin-mineral
premixes so as to formulate and compound poultry feed that will have optimal
productive performance and high profit returns on investment.
There is a general public misconception on eggs consumption as causative factor of
heart disease (atherosclerosis) in human. Animal fat contains high content of poly-
saturated fatty acids which encourages incidence of atherosclerosis. Also, dietary
quantity of fat whichserves an indicator of egg-yolk cholesterol influences blood
cholesterol (Olomu, 2011; Vasudevan et al., 2011). However, dietary supplementation
with vitamins and minerals could elevate or reduced blood and egg-yolk cholesterol.
Nicotinic acid, biotin, vitamin D, E, calcium, iron, vanadium, selenium and zinc affect
blood and egg-yolk cholesterol. It is therefore hoped that results from the study will
7
provide baseline information on effects of different proprietary vitamin-mineral
premixes and housing systems on laying chickens egg production and quality indices
useful for quality control and monitoring by regulatory agenicies in Nigeria. By this,
commercial poultry industries will be protected against proliferation of adulterated or
sub-standard proprietary products. The information provided on egg-yolk cholesterol
profile will possibly dispel public misconception and encourage consumption of table
chicken eggs. This will reduce egg-glut and increase farm revenue through increase
marketing and sales of table-eggs.
1.2: Objectives of study
The objectives of this study were to:
investigate effects of two housing systems on performance of pullets from 13 to 16
weeks of age
assess effects of five different proprietary vitamin-mineral premixes and two
housing sytems on performance and egg production characteristics of pullets from
17 to 21 weeks of age
assess effects of different proprietary vitamin-mineral premixes and housing
systems on performance and hen day egg production of laying chickens;
evaluate effects of different proprietary vitamin-mineral premixes, housing systems
and duration of storage on externaland internal quality indices of eggs;
assess effects of different proprietary vitamin-mineral premixes, housing systems
and duration of storage on chemical composition of eggs;
evaluate effects ofdifferent proprietary vitamin-mineral premixes and housing
systems on cholesterol profile of eggs; and
determineeffect of different proprietary vitamin-mineral premixes, housing systems
and duration of storage on lipid oxidation of eggs
8
CHAPTER TWO
2.0: LITERATURE REVIEW
2.1: Housing systems in poultry production
The rapidly growing rate of human population is not commensurate with the increasing
rate of demand for animal protein and its consequence attendance of food security
challenges (Nworgu, 2006). Poultry production is one of the fastest ways of mitigating
protein deficiency in human diet due to the relatively short maturity period and high
feed conversion efficiency of birds (Ziggers, 2011). There are different housing systems
for raising poultry which generally fall under intensive, semi-intensive or extensive
housing depending on the purpose production. Housing systems significantly influence
the performance characteristics of birds and the chemical composition of eggs
(Zemková et al., 2007). Studies (Lichovníková and Zeman, 2008; Singh et al., 2009;
Djukic-Stojcic et al., 2009) showed that housing systems affect egg quality in
commercial flocks. Worldwide, housing systems for managing laying birds and
producing eggs of good shell and internal quality is critical to the economic viability of
commercial egg industry (Ahmadi and Rahimi, 2011). There are different housing
systems used for management and production of commercial laying chickens (Anderson
and Adams, 1994).
Housing systems vary in terms of facilities, husbandry operations, feeds and feeding
management, therefore, the choice of housing system depends on available space,
facility, man-power, technology and economy of production. Majority of laying
chickens are reared in conventional battery cage system, although European Union
Council Directive 1999/74 EC banned its use in EU States since January 2012. Animal
welfare scientists are critical on the use of conventional battery cages for managing
laying chickens because cages do not provide sufficient space for birds to stand, walk,
flap wings, perch and make a nest. It is therefore widely considered that laying chickens
suffer boredom and frustration (DEFRA, 2011) leading to a wide range of abnormal
behaviours that are injurious. Conventional battery cage comprises small cages, usually
made of metal in modern systems to accommodate 3 to 8 layers. The walls are made of
either solid metal mesh with sloped wire mesh floor to allow the excreta to drop through
9
or eggs to roll onto an egg-collecting compartment or conveyor belt. Water is provided
by overhead nipple systems and feed trough in front of cages at regular intervals
manually or by automation.
The cages are arranged back-to-back in rows as multiple tiers hence the term battery
cage. There may be several floors containing battery cages within a single shed meaning
that a single shed may contain many tens of thousands of birds. The three-tier type of
conventional battery cage is raised on a platform sheds with capacity up to 25,000 birds
in 40ft wide of laying houses. Large laying houses of dimension 50ft wide with 5 blocks
can accommodate 50,000 birds. The size of a cage is 12 inches deep and 15 inches
fronts to accommodate three birds. The cage size of 15 inches front and 18 inches depth
could accommodate four laying chickens, while cages with larger sizes accommodate
more birds. The feeding is done by moving feed hopper and water by nipple drinkers
(http://en.wilkipediaorg/w/ poultry_production). In the temperate countries, foggers are
provided above cages during summer months. Automatic egg collection systems are
installed in some specifications. Automatic feeding saves feed wastage and reduces the
labour cost. Conventional battery cages and their installation are been improved to
provide better ventilation, and avoid production of soiled eggs.
Light intensity is often kept low (e.g.10 lux) to reduce feather pecking and vent pecking.
Floor space for laying chickens ranges upwards from 300 cm2 per hen while EU
standards stipulated at least 550 cm2 per hen (United Egg Producer, 2003). In the U.S.,
the current recommendation is 67 to 86 square inches (430 to 560 cm2) per bird (United
Egg Producer, 2009).Some of the benefits of conventional battery cage system are easy
management of the birds; reduced labour cost collection; clean eggs; capture at the end
of lay is expedited; less feed requirement to produce eggs; broodiness is eliminated;
high stocking capacity; easy treatment of internal parasites; and reduced labour
requirement. In farms where cages are used for egg production, more chickens per unit
area allow for greater productivity and lower feed costs (Appleby, 2001).
Deep litter system is not commonly used for egg production. It is most useful in
production of meat-type chickens like broilers, cockerels and breeder stock. Chickens
10
are raised in large open structures known as brooding, rearing and breeding or breeder
pens. These pens are equipped with manual or mechanical systems to deliver feed and
water to birds. They have ventilation systems and heaters that function as the need
arises. The floor of pen is covered with bedding material consisting of wood chips, rice
hulls, or peanut shells. Dry bedding helps maintain flock health and such pens are
provided with enclosed water systems (“nipple drinkers”) to reduce water spillage (U.S
Poultry and Egg Association, 2012). Deep litter house protects birds against predators
such as hawks and foxes. Some deep litter houses are equipped with curtain walls,
which can be rolled up in good weather to admit natural light and fresh air
(http://en.wilkipediaorg/w/ poultry_production).
Traditionally, deep litter houses or pens may measure 400 feet long and 40 feet wide
and provides about eight-tenths of a square foot per bird. The Council for Agricultural
Science and Technology (CAST) provided minimum floor space requirement of one-
half square foot per bird. Modern deep litter houses are often larger and contain more
chickens with floor space allotment to meets the requirement per bird (U.S. Poultry and
Egg Association, 2012). Recently, deep litters are equipped with “tunnel ventilation,” in
which a bank of fans draws fresh air into the house (U.S. Poultry and Egg Association,
2012). High stocking density in deep litter generates high concentration of ammonia gas
from poultry dropping causing air pollution. This often results in ill-health damaging
birds‟ eyes, respiratory systems and causing painful burns on the legs known as hock
burns.
2.2: Management of laying chickens
The theoretical objectives of commercial egg production include attainment of standard
and uniform body weights (1350-1375 g/bird) at 20 weeks and onset of egg lay at 18
weeks; 5% egg production at week 19, 50% egg production at the end of week 21 and
90% egg production at the end of weeks 25; attain an average egg weight (45gms) at
weeks 20; and that mortality rate should not exceed 0.7%
(htt://ag.ansc.purdue.edu/poultry). The period between 18th
and 25th
week of age can be
referred to as early-laying period. A uniformly well grown flock starts to lay egg in
time, and egg production increases steadily every day without records of mortality and
11
culling. The egg-lay initiation, daily rate of egg production, peak production, mortality
rate, egg quality, and feed intake depend on the quality of birds, season and quality of
nutrition (htt://ag.ansc.purdue.edu/poultry).
All operations like vaccinations are always completed and pullets in laying house before
18 weeks. Birds at onset of lay are expected to attain 1300 gm average body weight
(htt://ag.ansc.purdue.edu/poultry). Birds usually have uniform size with well-built body
without compromise for fat. The frame size can be judged by the shank length. The
shank length of the pullets at 19 weeks is about 104 mm and remains same throughout
the life. Smallest birds in among flock are usually not be below 1150 gm, while the
heaviest should not be more than 1450 gm body weight
(htt://ag.ansc.purdue.edu/poultry) with signs of maturity of feather shedding and re-
growth of new feathers. The birds are usually docile having bright red combs and
yellow shanks and beaks. Birds are normally fed standard layer diets from 18-22 weeks.
The diet is changed from low protein-low calcium (1% calcium) to higher protein-
higher calcium (4% calcium) at the onset of egg production
(htt://ag.ansc.purdue.edu/poultry).
The change in diet may result in reduced feed intake for few days because the onset of
egg production possesses stress on birds, hence the need for increase dietary calcium in
order to reduce stress and help individual bird adjust to physical property of new diet.
The extra quantity of calcium included is stored in the reserves pool for egg formation.
The crude protein may be kept higher at 18% crude protein for flock below the standard
weight. The quantity of feed consumed depends on the level of metabolisable energy in
diet. Different levels of crude protein have been used for feeding birds before onset of
lay. Birds are fed higher protein diets (20% CP) during the first six weeks but
continuously decrease approximately 16 to 16.5% during egg production
(htt://ag.ansc.purdue.edu/poultry). The amino acid composition of in diet decides the
egg size. Higher levels of methionine up to 0.4% was recommended
(htt://ag.ansc.purdue.edu/poultry) at the beginning of egg lay, while it quantity was
reduced when eggs became over-sized.
12
2.3: Energy requirement of laying chickens
The energy requirement of laying chickens needs to be determined and managed in
relation to other nutrients. Although chickens tend to adjust feed consumption to meet
the energy need, this is not precisely enough to insure optimum performance. Additional
energy in feed often results in better body weight gain, egg production and increase egg
size particularly when nutrients such as protein and amino acids are proportionately
balanced. A high energy ration reduces the daily feed consumption while low energy
rations results in higher feed consumption with lesser protein intake. The range of
recommended energy: protein ratio, calculated as C.P:M.E, is 1:150 to 1:160
(htt://ag.ansc.purdue.edu/poultry). Study (Hill and Dansky, 1954) obsereved 623 caloric
per pound of diet as minimum productive energy required for maximum growth rate
because feed intake increase as dietary energy concentration decrease. Fraps (1964)
reported 800-850 caloric per pound of diet as minimum productive energy level
required for maximum early growth rate. Total energy intake increases as dietary energy
decrease progressively. Poultry and ruminant animals respond in opposite direction to
variation in dietary energy concentration of diets. In ruminant animals, voluntary feed
intake response to increase in dietary energy content, while voluntary feed intake
reduces when poultry species are provided with more digestible diets (Morris, 2004).
Poultry species therefore reduce voluntary feed intake as dietary energy concentration
increases. Voluntary feed intake in ruminant animals is limited by digestive capacity
(Morris, 2004). Feed that are more digestible, pass through rumen more quickly to allow
for more feed intake. In the case of poultry species, digestive capacity is often not
limited so that feed that are rich in digestible energy are taken in smaller quantity.
However, chickens reduce voluntary feed intake when diets contain high proportion of
indigestible fibre. Conversely, ruminant animals tend to reduce feed intake when diet
become enriched with digestible starch or fat. Poultry and ruminant animals have
limitation for nutrient digestibility and utilization when fibre content increases in diets.
Study with White Leghorn, (Hill, 1962) showed that chickens normally adjust their
voluntary feed intake when fed different nutrient density. This adjustment was far being
perfect in heavy breeds of laying chickens. A measurable relationship exists among
poultry breed, appetite and there is a tendency to over-feed when supplus diets highly
13
rich in digestible energy are offered (Morris, 1968; Fisher and Wilson, 1974). Practical
implication is that there is no definite dietary energy requirement for laying or broiler
chickens without voluntary feed intake consideration.
It is therefore important to specify dietary energy requirement with voluntary feed
intake at lowest feed cost (Morris, 1968; Fisher and Wilson, 1974). Jackson et al. (1969)
reported an insignificant change in rates of egg lay and small increase in egg size with
increased dietary metabolic energy (ME). Feeding high dietary energy concentration
fattens pullets and provides extra income per bird at the end of production. This
comparative advantage is often offset by high mortality rates cause by fat deposition,
prolapse and haemorrhagic fatty liver syndrome (Manitoba Agriculture, Food and Rural
Initiatives, 1945). For profitable egg production, laying birds are fed diets that minimize
cost of dietary energy concentration per bird. The optimal dietary metabolic energy
(ME) level is calculated by taking into account the changes in voluntary feed intake,
feed cost, and live weight gain and egg production. Indigestible fibres have negative
effect on the effective energy derive from diets fed to birds (Emman, 1994).
2.4: Protein requirement of laying chickens
Protein requirement in laying chickens follow egg production phases. It reduces with
age and production phases. In a study (Reid et al., 1951) laying chickens fed 18% crude
protein and high energy diets were superior in body weight to either to those fed 15% or
13% crude protein, while lesser body weight was obtained for 12% crude protein (Bray
and Morrissey, 1962). In a similar study (Heywang et al., 1955) 15% crude protein diets
at high energy level were required for maximum egg production in both hot and
moderate weather and Haugh Unit score of eggs increased when dietary protein
decreased (Deaton and Quisenberry, 1965). The eggshell thickness and specific gravity
were not affected by dietary protein level (Aitken et al., 1977). Dietary protein
requirement was affected by amino acids composition. Layer diets are usually
formulated at least-cost by amino acid specification per minimum dietary protein levels.
Minimum level of dietary protein intake for supply of non-essential amino nitrogen is
allowed in poultry diets. Such level has not been defined because most diets formulated
compose of natural feeding ingredients which supply more than enough of the non-
14
essential amino nitrogen. Hence, amino acids requirements are quoted at fixed
proportion of feed intake for specific age, type of birds and energy content.
This is based on the requirement for reappraisal of changes in performance standards
and environmental factors on voluntary feed intake. The requirement of dietary protein
changes as a variation to voluntary feed intake occur. These changes define requirement
of amino acids on daily basis. Feed intake is stated in per unit output or production and
does not need revision because genetic selection does not change among species but
improves level of performance. Fisher et al. (1973) proposed amino acids requirement
model for laying chickens as follow.
R = a E + w b where, R = amino acid requirement (mg/bird/day)
E = egg output (g/bird day)
W= body weight (kg)
a = mg amino acid required per egg output
b = mg amino acid required per day to maintain 1 kg live weight
This model was used to formulate diets for laying birds at or near peak-lay phase and
omits requirement for live weight gain. Empirical estimates of protein and amino acids
requirements have been reported (Welhli and Morris, 1978; Huygheb et al., 1991).
Laying chickens do not gain much weight so that coefficient of weight gain account for
rate of protein deposition and not weight gain. Laying chickens deposit fat and not
protein except for feather growth towards the end egg production phase. Thus, the
coefficient of weight gain in adult chickens is probably zero. The presumption that
laying chickens still grow during the early lay-phase by assessment of body weight is a
misconception (Morris, 2004).
Pullets during first 7 weeks of lay fed uniformly well-balanced diet normally attain 50%
egg production by laying one egg per day. Skeletal growth stops abruptly just before
onset of lay and growth attained few weeks before onset of lay is due to increase in
ovary, oviducts and combs, and storage of yolk precursors in liver and calcium
phosphate in medullary bones. Pullets at onset of lay need higher supply of high protein
diet in order to meet protein requirement and safely cover individual requirement for
building organs and storage of materials for egg formation (Morris, 2004). At point of
15
lay, sufficient and quality feeds should be provided for egg production. Amino acid
requirement do not increase as rate of egg increase or decrease as egg production
decline during post-laying phase. This is because laying flock consists of individuals
with diverse rates of egg production. When rate of egg production of most productive
flock decline, egg size increases because feed intake increase to compensate for increase
output (Banga-Mboko et al., 2010).
The body weight and egg output are normally distributed about their mean values. The
expected response curve of essential amino acid is estimated from egg composition and
potential egg output. Broiler breeders and aging laying flock do not exhibit normal
distribution rates of egg production. The efficiency of amino acids utilization decline
with age and does not indicate genuine ageing because moulting fully recovers
efficiency of utilization. Diets containing surplus protein could lead to impaired
utilization of first limiting essential amino acids (Hassan et al., 2013) Excessive dietary
protein in laying chickens is catabolized and excreted via kidney in form of urea in
excreta. This implies higher water intake. An increase in 1 per cent in protein level
increases water consumption by 3 per cent (Larbier and Leclercq, 1997). Marks and
Pesti (1984) reported that when diet of bird changed to increase protein content by
increasing soyabean at the expense of maize, there was increase in water consumption
and higher water: feed ratio.
Study (Alleman and Leclercq, 1997) that combined effect of temperature and dietary
protein on water consumption of two diets (16% and 20% crude protein) at two
temperatures (22oC and 32
oC) from 23 to 44 day showed that water intake of birds at
22oC increase linearly with age but remain constant at 32
oC. The increase in protein
level increased water consumption at both temperatures. Water: feed ratio at 22oC was
1.69 (16% crude protein) and 1.93 (20%) at 32oC were 2.84 and 3.07 respectively.
Soyabean meal-based diet was found to cause greater amount of water intake than an
equal quantity of any animal protein-based diet (Wheeler and James, 1950). Soyabean
contains some constituents such as fibre, fermentable sugar and potassium that are
responsible for increase of water consumption in birds.
16
2.5: Vitamin and mineral nutrition in poultry production
Feed nutrients are found in cells and tissues of animals and important for various
biological processes. Underwood (1981) reported that twenty-two (22) elements are
found in animal feed which compose of seven elements (calcium, phosphorus,
potassium, sodium, choline, magnesium and sulphur) and fifteen others (iron, iodine,
zinc, copper, manganese, cobalt, molybdenum, chromium, tin, fluorine, nickel, and
argon). Seven of these elements, usually referred to as macro-minerals and their
requirement express as 100 part per million (ppm), and twenty-seven (27) micro- or
trace minerals below 100ppm and requirement express in part per billion (ppb) are
found in the body of animals (McDowell, 2005). Chickens require forty-three (43)
nutrients for optimum productivity (Ogunwole, 2009) which include13 vitamins (A, B1,
B2, B3, B6, B12, Folic acid, E, K, Choline, D, Pantothenic and Biotin); and 13 minerals
(Ca, P, Mg, Na. K, Fe, Cu, Cl, Mn, S, I, Mo and Zn). Mineral nutrients are inorganic
compounds divided into two groups; macro-minerals and micro-minerals.
Macro-minerals are needed in relatively large amount. The macro-minerals include
calcium, phosphorus, chlorine, magnesium, potassium and sodium. It has been reported
(Chernick et al., 1948) that reduced availability of trace minerals and interference with
enzymatic synthesis is among several growth-inhibitory factors in animals. Calcium is
important for normal bone development, blood-clot formation, and muscle contraction
and in maintaining good egg shell quality. Phosphorus also is important for normal bone
development. It is a component of cellular membrane and a requirement for many
metabolic functions. Chlorine is used in digestion as a component of hydrochloric acid
found in the stomach. It is involved in water and acid/base balance in the body. Sodium
and potassium are electrolytes that are important for metabolism, muscle and nerve
functions. They are involved with water and acid/base balance. Magnesium assists with
metabolism and muscle functions. The micro-or trace minerals are involved in
metabolic functions and include copper, iron, iodine, manganese, selenium and zinc.
Iodine is used to produce thyroid hormone that regulates the rate of energy metabolism.
Zinc is involved with many enzymatic processes in the body. Iron aids in oxygen
transportation but may be toxic at high level.

17
Ground limestone and oyster shell are the primary sources of calcium. Phosphorus and
other calcium sources include mono-calcium phosphate, di-calcium phosphate, and de-
fluorinated phosphate (Kershavarz and Nakajima, 1993). Common salt is the primary
source of sodium and chlorine. The levels of magnesium, potassium and other minerals
are supplied by dietary feed ingredients such as corn, soyabean meal and meat and bone
meals. Nutritionists use traces minerals (micro-minerals) premixes when formulating
ration to supply required amounts needed for production and maintenance (Larbier and
Leclercq, 1997). Vitamins are a group of organic compounds found in feed in small
amount. They constitute an essential parts of a good nutrition programme. Adequate
intake levels of vitamin are necessary for normal body functions, growth and
reproduction. Vitamin deficiencies can lead to a number of diseases, disorders or
syndromes (Leeson, 2007). Vitamins can be divided into two classes base on their
solubility in water and fat; fat-soluble and water-soluble. The fat-soluble vitamins
include Vitamins A, D, E and K. Vitamin A is required for normal growth and
development of epithelial tissues and reproduction in poultry (Leeson and Caston,
2003). Vitamin D is required for normal growth and development of bones and for egg
shell formation (Leeson and Summers, 2001). Vitamin K is an essential part of blood-
clot formation. Vitamin E is a powerful antioxidant (Mori et al., 2003).
The water-soluble vitamins include the B-complex (Vitamins B12, biotin, choline, folic
acid, niacin, pantothenic acid, pyridoxine, riboflavin and thiamine) and Vitamin C. The
B-complex vitamins are involved in many metabolic functions including energy
metabolism (McDowell, 2005). Birds can synthesize vitamin C and usually has no
established requirement (Olomu, 2011; Majekodunmi, 2014). It may be beneficial in
some circumstance, such as when birds are subjected to heat stress. Nutritionists usually
add vitamin premixes to poultry diets to compensate for fluctuating levels found in
natural animal feeds. This ensures that birds have required amounts necessary for
normal productive efficiency (Majekodunmi, 2014). Vitamins are indispensable micro-
nutrients that actively improve efficiency of Kreb or Citric cycle (Marks, 1979) and
participate in body metabolism (Alahyari-Shahrab et al., 2011). Modern egg laying
chickens often suffer from osteoporosis, a nutritional disorder of weakened skeletal
system. During egg production, large amounts of calcium are transferred from bones for
18
formation of eggshell (Neijat et al., 2011). Although dietary calcium levels are
adequate, absorption of dietary calcium is not always sufficient to fully replenish bone
calcium given intensity of egg production. This can lead to increases in bone breakages,
particularly when laying chickens are removed from cages at the end of lay.
Chickens are more susceptible to vitamins and mineral deficiency than any other species
of poultry (Miles, 2001; McDowell, 2005).The gastro-intestinal tract in chickens is
relatively short and permit faster rate of food passage. Also, microbial population in the
gut of chickens provides very little synthesis of vitamins but competes with host for
dietary supply (Leeson and Summers, 2001). Intensively managed laying chickens at
high stocking density are quickly prone to vitamin deficiency. Vitamins A and D,
riboflavin and B12 are usually found in low quantity in most poultry feed. Vitamins D
and B12 are almost completely absent in maize-soyabean based-diets. Vitamin K is
generally included in diets of chickens because their gastro-intestinal tract lacks
synthetic ability for most vitamins (Rose et al., 1997). Tocopherol is a natural
antioxidant, responsible for good keeping quality of animal products and improves
utilization of vitamin A (Cerny et al., 1971). Vitamin E improves ovulation and reduces
production stress. The concept of optimal input is used when formulating diets for
vitamin and mineral requirements. The optimum input is an amount more requirements
and satisfies all individual chicken in a laying flock (Optimum Vitamin Nutrition,
2010).
Minerals are essential for growth and egg production in laying chickens. Calcium and
phosphorus are two important macro-minerals needed for egg production and good egg
quality. Miller and Bearse (1934) found that approximately 0.8% phosphorous was
required for optimum egg production when fixed calcium content of diet is 2.23 or
3.0%. Norris et al. (1934) found that 0.5% phosphorous was not sufficient for egg
production but 0.75% was adequate. Schaible (1941) in a review concluded that 0.4%
phosphorous was required but to allow for safety margin, 0.5% was recommended. The
study by Evans and Carver (1942) reported that phosphorous requirement in diets is
always considered alongside calcium requirements. When 1.5% calcium wass present,
0.6% phosphorous was adequate but if 2.5% calcium was added in diet, 0.8%
19
phosphorous was required. When 3.0% calcium was included in diet, 0.8% phosphorous
was not satisfactory except 1.0%. Calcium requirement during egg production is an
important mineral nutrient that determines eggshell quality.
Calbindin is a calcium-binding protein that improves eggshell quality (Heryanto et al.,
1997). The mechanism for calcium transport to egg eggshell is related to vitamin D-
dependent calcium absorption and a multifactor-dependent transfer of calcium to shell
(Yosefi et al., 2003). These two steps are mediated by calbindin found in intestine and
eggshell gland (Berry and Brake, 1991; Bar and Striem, 1999). Oestrogen is a
reproductive hormone. This hormone is responsible for regulating calcium metabolism
during eggshell formation (Etches, 1987). Calbindin concentration increase with onset
of lay and decreases as egg production decline (Nys et al., 1989). There is a positive
correlation between eggshell and shell gland calbindin (Nys et al., 1986). Park et al.
(2004) found that feeding laying chickens with low-calcium diet less than 0.2 to 0.3%
reduced rate of egg production to less than 5% within 10 to 14 days, and in some cases,
a complete cessation of egg production within 21 days. Similarly, low-energy, low
density and low-calcium diet was observed to paused egg production (Rolon et al.,
1993). Structural bone losses due to poor calcium nutrition resulted in fragility and
susceptibility to fracture during laying period (Whitehesd and Fleming, 2000). Gregory
and Wilkins (1989) found that approximately 30% of laying chickens housed in
batteries suffered at least one broken bone during their life time. Also, approximately
one-third of broken bones occur in cages while remaining occurs during depopulation,
transporting and processing.
The acid-base status of birds is determined primarily by amount of sodium, potassium
chloridein diet under practical conditions. Excess dietary intake of sodium and/or
potassium in relation to chloride leads to alkalosis, while excess intake of chloride
results in acidosis. Sodium, chloride, and potassium are essential for maintenance of
osmotic pressure, acid-base balance and fluid balance (Henry, 1995). Morgin (1981)
reported an optimal growth performance in chicks fed purified diet using an electrolyte
balance (Na+ K+- Cl
-) of 250mEq/kg with a relation (K+Cl)/Na >1. Effect of dietary
sodium level on water intake and droppings remained a controversial debate. There is a
20
controversy that excess dietary sodium in chicken increase excretion of moisture.
Murakami et al. (1997) and Oviedon-Rondon et al. (2001) reported increased excretion
of moisture which was linearly dependent on quantity of dietary sodium. Excess intake
of sodium and potassium promote increase moisture in litter. However, increased water
intake due to high dietary chloride seems unrelated to the wetness of poultry droppings
(Oviedon-Rondon et al., 2001).
The dietary sodium requirement to achieve maximum growth in chickens was put at
0.20-0.28% (NRC, 1994; Murakami et al., 1997; Oviedon-Rondon et al., 2001). Smith
et al. (2006) increased dietary sodium from 0.16 to 2.11% in layer diet and recorded a
linear increase of 0.9% moisture excretion for 0.1% increase in dietary sodium. An
increase of dietary sodium from 0.15 to 1.5% also resulted in linear moisture excretion
with 10% moisture excretion and 0.52% dirty egg collected increase. Rolon et al. (1993)
found that low-sodium diet less than 40ppm reduced rate of egg production to less than
5% within 14-21 days, and in some cases resulted in complete cessation of egg
production within 4 hours. Damron et al. (1986) and Murakami et al. (1997) did not
record any impairment in chickens fed sodium below 0.24 - 0.25% but observed a linear
increase in water intake with increased dietary sodium supplementation. The water
consumption of laying chickens increased by 2.9 folds and water: feed ratio by 6.7 folds
increase when sodium supplementation increased from 0.16 to 2.11% (Smith et al.,
2006). In broiler chickens and turkey, sodium bicarbonate is used as source of sodium to
maintain body electrolyte, improve heat stress tolerance and keep litter dry. The same
salt is used in laying chickens to mitigate heat stress and improve eggshell quality
particularly in older layers.
Potassium is rapidly absorb from upper intestine and excreted from the body through
urine. The mineral element is required for osmotic pressure regulation, maintenance of
water and acid-base balance, nerve impulse conduction, muscle contraction and
enzymatic reactions (Miller, 1995). An increase in dietary potassium causes
corresponding increase in water consumption and moisture excretion. Study (Smith et
al., 2008) showed that for every 0.1% increase in dietary potassium intake, there was
increased excretion of moisture by 1.2% in laying chickens fed 0.23 to 2.0% potassium.
21
Addition of vitamin-mineral premixes to diets of poultry is a good insurance against
nutritional deficiency and disorders.
2.6: Vitamin and mineral requirements of laying birds
Vitamins are organic substances needed in trace quantities for physiological and
biochemical functions (Bolu, 2013). Balanced poultry feed requires feed additives for
most vitamins. The effects of different dosage of feed additive were not only related to
egg production, but also to their contents in liver and egg yolk as well as biochemical
parameters (Whitehead, 1998). Laying hens requires vitamins A, D3, E3, K3, B1, B2, B6,
B12, Niacin, pantothenic acid, folic acid, biotin, and choline at levels of 2930, 295, 5,
0.5, 0.7, 2.5, 2.5, 0.004, 10, 2, 0.25, 0.1 and 1050IE/kg of feed, respectively (NRC,
1994). Leeson (2007) observed that NRC (1994) recommendations were not adequate
for today‟s highly efficient layers. Pan (2005) and Leeson and Summers (2005)
recommended a higher range of vitamin A level of 8000-11000 and 7000 – 12000IE/kg
of feed, respectively compared to NRC (1994) recommendation. Other fat-soluble
vitamins, vitamins D3, E2 and K3were recommended for inclusion in feed at higher rate
than recommendations by NRC (1994) for laying birds. Vitamins recommendations by
Whitehead (1998) took into consideration B vitamins the contents in feed ingredients.
The mineral elements require by laying birds vary with body weight, rate of egg
production, size of egg and breed and feed intake. Laying birds require calcium, non-
phytine-P, available phosphorus, magnesium, sodium, chlorine. Magnesium, zinc,
selenium, manganese, copper, iron and iodine are the most important trace element in
for layers diet.The NRC (1994) recommendation for light strain layer weighing 1.8kg at
90% rate of egg production of egg were 32.5mg of calcium, 2.45mg of non-phytate
phosphorus, 0.5mg of magnesium, 1.5mg of sodium and 1.3mg of chlorine per 100g
feed intake per hen. Pan (2005) reported requirement of 35.0mg of calcium, 3.7mg of
available phosphorus, 0.5mg of magnesium, 1.5mg of sodium and 1.6mg of chlorine for
brown strain hen at above 85% egg production rate.
The addition of trace elements in feed supplements is carried out following specific
recommendations. However, in designing feed supplements, trace elements in feed
22
ingredients are often ignored. This may lead to over-consumption and excessive levels
in excreta. It has been demonstrated that some organic compounds of trace elements,
especially selenium, had higher bio-availability than inorganic compounds in poultry
(Bolu, 2013). Based on NRC (1994) nutrient requirement, laying birds require 446mg of
iron, 34–44mg of zinc 20mg of manganese, 0.034-0.1mg of iodine and 0.06mg of
selenium per kg of feed. Pan (2005) recommended a much higher level of these
elements per kg of feed than NRC (1994) recommendation except for lower value of
iron and absent of copper. Therefore selenium, cobalt, manganese, iron, zinc and copper
are encouraged to be supplemented at varied levels of inclusion in diets of laying birds
(Bolu, 2013).
2.7: Vitamin and mineral metabolism and immune systems
Nutrient metabolism provides information critical to performance and productivity of
laying birds. The interactions between nutrition and immunity are important to growth
and egg production. Nutrition modulates immune system of laying birds. The impacts of
nutrients metabolism on immune-competence of birds are well documented (Cook,
1991; Koutsos and Klasing, 2001; Humphrey and Klasing, 2004). Immune responses to
foreign bodies particularly pathogens influence nutrient requirement and metabolism in
laying birds. Immune system is activated in order to play a major role in nutrient
metabolism and production. Roura et al. (1992) reported that animals reared in germ-
free conditions have higher growth and feed efficiency than those in a less sanitary
environment. Therefore, exposing birds to high level of infection may result in slower
growth and decreased accretion of many tissues (adipose tissues, liver, spleen and
skeletal muscles) (Benson et al., 1993). Immune system produces regulatory factor
which has systemic effects to alter nutrient partitioning or deter metabolic process
associated with growth and egg production. The growth inhibiting effect of innate
immunity on nutrient metabolism have been reported (Leshchinsky and Klasing, 2001;
Humphrey and Klasing, 2004).
Earlier reports by Siegel et al. (1982), Martin et al. (1990), Qureshi and Havenstein
(1994) and Parmentier et al. (1996) indicated that growth rate is inversely related to the
level of adaptive immunity at genetic level. Klasing et al. (1987) observed that most
23
significant impact of infectious challenge on growth is the declines in feed intake which
account for 70 per cent of decline in growth rate, and remaining 30 per cent due to
inefficient nutritional metabolism induce by the immune system. Immune responses
alter deposition of energy in form of lipid into adipose storage and fatty acid level in
blood plasma. Lipoprotein lipases catalyze removal of fatty acids from plasma very-low
density lipoprotein (VLDL) for tissues‟ usage. Study (Griffin and Butterwith, 1988)
confirmed that lipopolysaccharides decrease lipoprotein lipase activity in chicken heart,
adipose tissues, and skeletal muscles. The same effect was obtained on adipocytes by a
chicken TNF-like cytokine (Butterwith and Griffin, 1989). Thus, there is increase in
body fat level due to either innate or adaptive immune responses (Benson et al., 1993;
Parmentier et al., 1996).
Vitamins and minerals are readily involved in body immune systems. Vitamin E is
widely accepted for its effectiveness in inhibiting lipid peroxidation in biological
systems (Kang et al., 1998; Lanari et al., 2004). Vitamin E increases humeral immunity
in monogastric animals (Langweiler et al., 1983; Wuryastuti et al., 1993). Galobat et al.
(2001) compared antioxidant activity from Rosemary extract (500 -1000 mg/kg) and
vitamin E (200 mg/kg) and reported no significant difference in antioxidant activity on
Thiobarbituric acid values. Vitamin E was highly transported to egg yolk in laying
chickens (Grobass et al., 2002; Hayat et al., 2010). The metabolism of minerals is
altered by immune systems. Selenium, copper, zinc and iron altered various components
of immune system (Suttle and Jones, 1989). The interaction of mineral metabolism and
immune system in animals is more profound with micro-mineral like copper, iron and
zinc. Many alterations reflect hepatic production of their transport and storage protein
during acute phase response. Plasma copper concentration increases during immune
response along with copper containing protein, ceruloplasmin (Klasing et al., 1987; Tuff
et al., 1988; Koh et al., 1996). Ceruloplasmin in positive acute phase is induced by IL-
1β (Barber and Cousins, 1998).
Changes in ceruloplasmin are therefore related to dietary level of copper (Koh et al.,
1996) so that higher dietary levels are required during innate immune response. Plasma
concentrations of iron and zinc are known to decrease during immune response
24
(Klasing, 1984; Lauorin and Klasing, 1987; Tuff et al., 1988; Takahashi et al., 1997) by
partitioning into the liver and other tissues for increase production of their protein
storage forms, ferritin and metallothionein respectively (Klasing, 1984; Lauorin and
Klasing, 1987). Iron is the first limiting mineral for bacterial growth and increases in
susceptibility to disease (Knight et al., 1983). The severity of alteration in iron and zinc
metabolism depends on the activity of antigens and the type of immune system. The
activities of antigen that elicit innate immune response trigger the greatest decline in
plasma iron and zinc concentration. Hence, repeated exposure of chickens to antigens
promotes adaptive immune responses which cause reduction in plasma iron and zinc
concentration too (Klasing, 1984). Thus, microbial immunogens produce larger changes
in iron, zinc and copper metabolism than protein antigen which elicit innate responses
(Klasing, 1984; Klasing et al., 1987).
2.8: The use of vitamin-mineral premixes in poultry nutrition
The use of vitamin-mineral premixes in poultry is well documented (Oduguwa and
Ogunmodede, 1995; Oduguwa et al., 1996; Al-Nassar et al., 1998; Dingle and Henuk,
1999; Oduguwa et al., 2000; Asadumzzaman et al., 2005; Ogunwole, 2009; Ogunwole
et al., 2012). Premix is a concentrated mixture of vitamins, trace minerals and diluents.
It may contain other feed additives such as amino acids or medicaments. Vitamin-
mineral premix is nutritional condiment that amongst others increase cost efficiency and
laying ability of commercial chicken from an average of 150 eggs to about 330 eggs per
lay cycle (Ogunwole. 2009). Vitamin-mineral premixes contain specific vitamins and
minerals in amount and proportion recommended by the manufacturer for addition in
poultry feed. Vitamin-mineral premix is required by animals due to the dynamics of
unavailability from natural feed ingredients (Bolu, 2013). They come in different sizes,
contents and composition as propounded by the proprietors and commercially sold in
different locality.
Vitamin-mineral premix is a critical dietary input for improved safety, reliability and
performance as well as successful poultry production (Raven and Walker, 1980).
Although minerals and vitamins contribute only 10 per cent of the total cost of feed
(Singh and Panda, 1988), the effects of using substandard or less potent vitamins on
25
production could easily be felt in poultry production. When formulating poultry diets,
care and professional attention should be taken in the choice of vitamin-mineral
premixes used (Ogunwole et al., 2013). Several proprietary vitamin-mineral premixes
are sold in Nigeria with each manufacturer ascribing similar effectiveness and potency.
The labeled composition on each proprietay vitamin-mineral premix claims high
potency and efficacy claim without any cognate experimental evidence (Ogunwole et
al., 2013). This situation is further compounded by the dearth or lack of suitable
equipment and laboratory to undertake analyses of vitamin and mineral contents. The
slower but rational approach is the use of live animals to assess the premixes. There
have been studies on single use of vitamin-mineral premix in poultry nutrition
(Oduguwa and Ogunmodede, 1995; Oduguwa et al., 1996) and several others on mix of
vitamin-mineral premixes and their effects on specific parameters in poultry nutrition
(Oduguwa et al., 2000; Asaduzzman et al., 2005; Ogunwole et al., 2013). Inclusion of
vitamin-mineral premix in formulated diet has become indispensable practice because
feed ingredients do not contain all essential vitamins and minerals at the right amounts
needed for chicken (Asaduzzaman et al., 2005). Diets formulated without vitamin-
mineral premix may be nutrient deficient (McDonald, 1996).
Chickens managed under intensive systems of production are usually susceptible to
vitamin-mineral deficiencies. Therefore, it is a general practice to include all
supplemental vitamins-minerals premix at levels that provide margins of adequate
safety under various stress conditions (Scott et al., 1982). For laying chickens, provision
of adequate dietary minerals and vitamins is essential for good eggshell quality (Yoruk
et al., 2004), while non-inclusion restrict performance of birds with heavy ecomomic
losses. Birds in cages require more attention for supply of vitamin-mineral premix than
those of floor housing because of more limited opportunity for natural behviours
(Asaduzzaman et al., 2005). Vitamins are essential for growth, health, and survival.
They are involved all cellular metabolism critical to efficiency of Krebs/Citric Acid
cycle (Marks, 1979). For laying chickens,Optimum Vitamin Nutrient-diets (Optimun
Vitamin Nutrition, 2010) increased egg weights, number of large eggs, lower percentage
of broken eggs, higher percentage of lay and improved feed efficiency (McDowel,
1996).
26
The dietary water soluble vitamins affect vitamin egg white concentration (House,
2002). Riboflavin, folic acids, niacin, thiamine, pyridoxine, panthotenic acid, biotin,
vitamin B12 are well transferred into egg white, and their concentrations depend on
dietary consumption (Leeson and Caston, 2003). Ascorbic acid supplementation has
beneficial effect on growth rate, egg production, egg shell strength, and thickness in
stressed-poultry (Thornton, 1962; McDowell, 1989). Vitamin D, calcium, phosphorous,
manganese, copper and zinc play a major role in maintaining eggshell integrity and
quality, while excess or reduced concentration of phosphorous, chlorine, influence
availability of calcium and vitamin D (Neospark, 2012). The inclusion of different
vitamin D metabolites in diet enhances effect of vitamin D due to availability, sparing
chain reactions required for synthesis of active metabolite (Nascimento et al., 2014).
Critical vitamins like choline, folic acid, pantothenic acid, pyridoxine, riboflavin, Vit-A,
Vit-D and Vit-E) and minerals e.g. calcium, phosphorus, copper, iodine, iron,
manganese, sodium and zinc,are compulsorily added to diet (Asaduzzaman et al., 2005).
Vitamin K plays an important role in blood clotting. Vitamin K deficiency can result in
an increased occurrence of blood spots (Bains, 1999).
Trace mineral nutrition is a complex area of animal nutrition. A wide range of
interactions and antagonisms occur in poorly absorbed or utilized essential minerals,
particularly during shell formation (Burley and Vadehra, 1989). Trace elements affect
eggshell quality. They serve as key enzymes involved in formation of membrane and
eggshell or by direct interaction with calcite crystals during shell formation (Zamani et
al., 2005). Mabel et al. (2003) reported that trace elements such as Mn, Zn, and Cu
influence mechanical properties of eggshell. However, earlier studies (Mas and Arola,
1985; Miles, 2001) revealed that provision of adequate amounts of zinc, copper, iron
and manganesein diets of laying chickens is key components of shell matrix and play an
essential role as co-enzymes in shell and its associated membranes. Trace elements are
transferred into egg white. Scatolini (2007) evaluatedquality of eggs produced by laying
chickens fed supplemental inorganic and organic Mn, Zn, Se, Fe and Cu and stored for
14 days at environmental temperature. The results of this study indicated that organic
trace minerals allowed maintenance of egg weight during the experimental period.
27
Eggs from layers fed a combination of organic Mn and Zn lost less weight than eggs of
layers fed organic Zn and Se, while treatment with organic Mn presented the lowest
Haugh Unit. These results were different from treatment containing combination of
organic Mn and Se and there was no influence of treatments on yolk index. Correia et
al. (2000) fed layers with feeds supplemented with or without organic selenium
observed no effect on external or internal egg quality of eggs stored at environmental
temperature for up to 21 days. However, Zamani et al. (2005) reported that addition of
organic Mn and Zn influenced internal egg quality when eggs were stored up to 20 days
independently of storage temperature. This suggested that combined supplementation of
organic Se and Zn improved internal egg quality and extend egg shelf-life. Zamani et al.
(2005) indicated that Zinc is commonly supplemented in diets of laying chickens and
other livestock because most feed ingredients are marginally Zn-deficient. Organic
complexes of zinc are readily available sources of zinc for laying chickens. They are
metabolized differently than inorganic forms (Aliarabi et al., 2007). Tabidi (2011)
reported that diets of brown parent stock layers should include 180 mg zinc /kg for
optimal performance and hatchability traits.
2.9: Housing systems and performance of laying chickens
The effects of different housing systems on egg production indices of poultry abound in
literature (Al-Rawi and Abu-Ashour, 1983; Anderson and Adams, 1994a; Abrahamsson
et al., 1996; Pistikova et al., 2006; Vosláŕova et al., 2006; Banga-Mboko et al., 2010).
The evidences from these studies show comparative advantage for birds in conventional
battery cage to include; increase spatial density of birds, easier control of microclimate,
simplified waste disposal, reduced labour costs and easier supervision of individual
birds for production level and health status. The egg production of laying birds in
battery cage was significantly higher than in deep litter. The eggshell thicknesses of
birds in cages were also greater than those in the deep litter. Earlier reports by Al-Rawi
and Abu-Ashour (1983) showed that laying birds in deep litter had higher laying rate
and consumed more feed than those in cages. In a study, Voslářová et al. (2006)
compared performance of laying Isa Brown hybrid kept in cages and deep litter and fed
diets that contained meat and bone meal replaced by vegetable feeds (lupin) in hot
climates. The number of eggs laid, egg weight, shell quality, clinical state of birds and
28
mortality daily over a period of nine months were recorded. The authors reported that
birds in cages had higher number of eggs; lower mean egg weight (p<0.01); higher
number of eggs per bird per day (p<0.01); and higher egg mass weight per bird per day
(p<0.01). The number of cracked eggs (p<0.01) was reported higher (p<0.05), while
number of membranous eggs laid was not different (p>0.05). The mortality was lower
(p<0.05) in in deep litter system. These authors concluded that differences in the egg
production indices of laying birds in deep litter and battery cage system and deep litter
met animal welfare requirements despite lower egg production.
The responses of laying birds in battery cage and deep litter under tropical climate in
Congo Brazzaville using a sample of 3,620 laying birds in two groups of 1,660 each
were evaluated by Bannga-Mboko et al. (2010). Each group of birds was replicated four
times (415 hens x 4) and separately transferred into battery cages (first group). The
second group of birds was raised in deep litter. Feed and water were supplied ad
libitum. The two groups were compared on data collected during 70 days on egg
production indices, egg and shell quality and food efficiency. This study showed that
birds in battery cage improved significantly (p<0.05) in egg number (+55%), egg-laying
rate (+ 25.3%), mass egg (+59.6%) and egg weight (+2.3%). Also, the feed
consumption (199.2 versus 155.7g/hen/day) and feed efficiency (2.7 versus 3.42) were
better (p<0.05) in caged birds than those raised in deep litter. However, the caged birds
were observed to produce more broken eggs (+1.08%) and there was no difference in
egg shell quality. Battery cage system was better preferred because birds recorded
higher egg production and better feed efficiency as these indices are major determinants
of revenue in commercial egg production. The authors suggested the need to evaluate
and validate economic profitability in each housing system because of the high
percentage of broken eggs in cages, and high cost of battery cage.
The diet of laying birds consists primarily of corn and soybean meal with addition of
essential vitamins and minerals. Laying birds are not fed on too high protein diets which
may results in high growth rate and fat accumulation in the body. This could make
laying birds suffer high leg deformities because of development of large breast muscles
which could cause distortions in developing legs and pelvis. Laying birds, in particular
29
those in cagescannot support increase in body weight since additional weight puts strain
on the hearts and lungs to cause Ascites. In deep litter, birds are kept indoors with more
floor space requirement which allow for feeding, exercise, perching, mating and nesting
boxes. Birds in deep litter are expose to richer natural environment in terms of provision
of natural nutrients that encourages foraging on litter and excreta materials to meet
some nutrient requirements (http://en.wilkipediaorg/w/ poultry_production;
Asaduzzaman et al., 2005). Birds in deep litter therefore tend to grow more slowly and
live longer than those in cages.
2.10: Composition, formation and structure of a chicken egg
Eggs are important part of human food since ancient times (McGee, 2004) and one of
nature‟s nearly perfect supplies of protein foods. They contain readily digested nutrients
required daily for growth and maintenance of body tissues and utilized in many ways in
food industry. Chicken eggs are more importance than eggs of other poultry species like
geese, ducks, plovers, and seagull‟s and quail (McGee, 2004). Chicken eggs provide
valuable nutrients such as proteins of outstanding biological value, phospholipids,
minerals and vitamins (De Ketelaere et al., 2004). The average composition of 60 grams
chicken egg by USDA (2000) is given as 29% yolk, 61.5% albumen and 9.5% shell.
The chemical composition of a 58g chicken egg was recently quoted as; water (∼74%),
protein; (∼12%), and lipids; (∼11%); 56-61% egg white; and 27-32% egg yolk
(www.egghealth.com, 2014). In a related studies, Li-Chin et al. (1995) and Kiosseoglou
(2004) reported that egg white constitute 67-89% water and 9-11% of protein, whereas
egg-yolk contain 50% water, 32-35% lipid and 16% protein.
The eggshell contains 95-97% calcium carbonate crystals, 0.3% phosphorous and
magnesium and traces of sodium, potassium, zinc, manganese, iron and copper and
organic matter (Arias et al., 2001; Nys et al., 2004; Neospark, 2012) which makes it a
rich source of calcium. An egg is formed gradually over a period of about 26 hours in
birds‟ reproductive system. Many organs help to convert raw materials from the feed
eaten by the hen into the various substances that become part of the egg. The hen, unlike
most animals, has only one functional ovary situated in the body cavity near the
backbone. At maturity, a female chick has up to 4000 tiny ova (reproductive cells) from
30
which full-sized yolks developed to form eggs. Each yolk (ovum) is enclosed in a thin-
walled sac, or follicle attached to the ovary. This sac is richly supplied with blood. The
mature yolk is released when the sac ruptures and received by the funnel at the left
oviduct (the right oviduct is not functional).
The left oviduct is a coiled or folded tube about 80 cm in length. It is divided into five
distinct sections, each with a specific function. An egg is surrounded by 0.2–0.4 mm
thick calcareous and porous shell. The structure and composition of the eggshell are
designed to naturally protect eggs against damage and microbial contamination, loss of
moisture, regulate exchange of gases for the growing embryo, and provide calcium for
embryogenesis (Hunton, 2005).The eggshell consists of calcite crystals embedded in an
organic matrix or framework of interwoven protein fibers and spherical masses. The
shell structure is divided into four parts: the cuticle or bloom, spongy layer, mammillary
layer and pores (Belitz et al., 2009). Eggshells in chicken are white-yellow to brown,
greenish to white in ducks and characteristically spotted in most wild birds. The inner
structure of shell is lined with two (inner and outer) closely adhering membranes
(McGee, 2004). The two membranes are separate at the large end of egg to form an air
space called air cell. The inside of eggshell has two membranes; the outer membrane is
attached to the shell while the inner membrane is attached to the albumen or egg white.
These two membranes provide a protective barrier against bacterial penetration. An air
space or air cell is a pocket of air usually found at the interior large end of eggs between
the outer and inner membranes. Air cell is created by contraction of inner contents it
cools and evaporates moisture after laid. Air cell increases with days of storage (Belitz
et al., 2009). Air cell is approximately 5mm in diameter in fresh eggs. The air cell can
be used to determine age of eggs. Egg albumen is an aqueous, faintly straw-tinted, gel-
like liquid, consisting of three fractions that differ in viscosity (www.egghealth.com,
2014).The thin and thick albumen is build-up from four layers that surround yolk. The
first layer is the thick albumen close to yolk and adjacent to vitelline membrane, while
the second layer is composed of thin albumen, followed by another layer of thick
albumen and finally a layer of thin albumen closest to shell membranes (Stadelman and
Cotterill, 1995). There is another type of albumen formed as long twisted fibres called
31
chalazae, a structure that keep yolk in central position in eggs. The chalazae resemble
two twisted rope-like cords, twisted clockwise at the large end of the egg and counter
clockwise at the small end. They serve as anchors to keep the yolk in the centre of eggs.
Chalazae is positioned at each side of the yolk, attached with one end to the surface of
vitelline membrane and other interlaced with fibres in thick albumen layer closest to
yolk (Rose et al., 1997). The proteins albumen includes ovalbumin, conalbumin
(ovotransferin), ovomucoid, lysozyme and ovomucin (Parkinson, 1966). The pH of
albumen ranged from 8.2 to 9.0 (Toney and Bergquist, 1983). Egg albumen is water
storage depot containing approximately 88% water (Farooq et al., 2001). Moreover,
albumen supplies some nutrients approximately 11% protein, 1% carbohydrates and
minimal amount of fat (Rose, et al., 1997). Egg-yolk is surrounded by a thin but very
firm layer of albumen (chalaziferous layer) which branches on opposite sides into two
chalazae and extends into thick albumen (McGee, 2004). In an opened egg, the chalazae
remain with the yolk. The germinal disc (blastoderm) is located at the top of a club-
shaped latebra on one side of the yolk. Egg yolk is almost spherical and surrounded by a
colourless membrane. It is a mixture of particles and plasma of low density globules
rich in fat (Parkinson, 1966). It contains high capacity for pigmentation of yellow yolk
globules. The yolk colour is determined by amount of xanthophyll, a yellow colouring
pigment present in maize which does not affect nutritional quality of eggs. The yolk
consists of alternate layers of dark- and light-coloured material arranged concentrically
(www.egghealth.com/2014).
2.11: Egg quality characteristics
Eggs are vehicle for reproduction and a staple food in human diets because of their
balanced nutrient composition. They are fragile poultry products which can be subjected
to quality loss with age. Eggs quality characteristics have natural variability and often
fail to meet the requirement for consistency and consumers‟ demand. Egg quality
characteristics are influenced by a variety of factors including genetics, hen age, body
weight, feed quality, length of holding period and environment (Silversides, 1994;
Monria et al., 2003; Silversides and Budgell, 2004; Van den Brand et al., 2004). The
age of laying chicken is most important factor that determines egg quality because
32
young pullets produce smaller eggs with strong egg shell and albumen that stand high.
As laying flock aged, eggshell thins and albumen begins to weaken and run. The flock
can be moulted to induce egg cycle which improve egg quality or by replacement with
young pullets. In the humid tropics, natural environment are characterized by daily and
seasonal fluctuations in temperature and relative humidity.
Temperature and relative humidity are two main indices of stress. Arima et al. (1976)
reported that egg qualities of older birds were more severely affected by increased
temperature than younger ones. A planned nutrition and good quality control procedure
could help to reduce variation in egg quality. Egg quality encompasses a number of
aspects that relate to shell, the albumen and the yolk and usually classify as external and
internal egg quality, respectively. External quality of eggs is the index that appeal to
consumers‟ patronage and influenced by degree of defects. Stadelman (1977) stated that
egg quality is composed of characteristics that affect consumers‟ acceptability. Egg
shell is therefore assessed on the basis of shape, texture and soundness. The internal
quality is based on air cell size, albumen quality, yolk quality and presences of blood or
meat spots. Albumen quality is a major indicator of overall interior egg quality.
Thinning of albumen is a sign of quality loss. When a fresh egg is carefully broken on a
smooth flat surface, egg-yolk remains in central position surrounded by thick albumen.
When a stale egg is broken, egg-yolk become flattened and displaced to one side with
thick albumen becoming thinner resulting in large area of albumen which collapse and
flatten to produce a wide arc of liquid.
This principle is used in measuring Haugh Unit, an indicator of albumen quality
(Haugh, 1937). Egg-yolk quality is related to its appearance, texture, firmness and
smell. Egg quality evaluation information is fundamental for successful handling and
transporting during marketing of eggs (Altuntas and Sekkeroglu, 2007). Egg quality
measurements have application in eggs grading for enhancement of safety and quality
assurance as well as need for farmers and feed millers to monitor outcome of feed and
feeding, animal health status and ambient condition in housing system. Many egg
quality characteristics can be quantified to determine physical (internal and external)
33
and chemical qualities. Egg value is determined by standards based on interior and
exterior characteristics
2.12: External egg quality characteristics
Shell quality appeal to consumers‟ patronage. It is a major factor for consideration
during handling, packaging, storage, transporting and hatchery operation (Rogue and
Soares, 1994; Kemps et al., 2006; King‟ori, 2011). Hamilton, (1982) stated some of the
external eggs quality traits as egg shell colour, shell thickness, shell weight, egg weight,
egg shape index which are highly affected by breed and age of chicken, molting, level
of nutrition, prevalence of disease and type production system. Egg colour is one of the
external characteristics that influence grading, price, consumer preference and
hatchability (King‟ori, 2011). Egg colour is considered as external quality characteristic
that protects egg from harmful solar radiation (Lahti, 2008), reinforce eggshell structure
(Gosler et al., 2005) and protect developing embryos from thermal deterioration
(Bakken et al., 1978). Although shell colour have genetic component, there are several
other factors that influence intensity of eggshell colour. Obadaşi et al. (2007) reported
that size of egg affected colour of eggshell with assumption that older laying birds lay
lighter coloured eggs due to increase in egg size associated with proportionate change in
quantity of pigment deposited over shell surface.
Butcher and Miles (1995) studied relationship between stress and eggshell colour in
laying birds. The authors reported that loss of shell pigment may provide a basis for a
non-invasive method of assessing stress in laying birds. The strength, texture, porosity,
shape, cleanliness, soundness, and colour are used in determining shell quality (Natalie,
2009). Large sized eggs break more easily than small ones as laying birds are
genetically could be prone to depositing finite amount of calcium in shell (Neospark,
2012). Poor eggshell quality has been of major economic concern in commercial egg
industry (Washburn, 1982). Reduction in shell quality lowers egg shelf-life, hatchability
and increases breakage. Shell thickness and porosity regulate exchange of carbon
dioxide and oxygen between developing embryo and extental environment during
incubation (Rogue and Soares, 1994). Thin shelled eggs loose more moisture than do
thick shelled eggs; possess serious difficulty of hatching (Rogue et al., 1994) and
34
deteriorates in quality (Bennett, 1992). The shell of table-eggs must be strong enough to
prevent failure during packing and/ transportation (Pavlovski et al., 2012), while shells
of hatching eggs must be initially thick and strong to preserve embryo but become thin
and weak later during incubation in order to allow gaseous exchange and easy chick
hatching (Roland, 2000).
Some category of eggshell defects that make eggs loss integrity include gross cracks,
hairline cracks, star cracks and thin shelled or shell-less eggs. Cracked eggs attract
lower patronage and lower monetary value (Natalie, 2009). Cracking of eggs could be
due to mechanical damage by birds and poor management practices such as infrequent
collection of eggs, rough handling and poor design and/ or maintenance of cage floor
(Natalie, 2009). The strength of eggshell affects soundness of shell, with weaker
shelled-eggs more prone to breakages and microbial contamination (King‟ori, 2011).
Eggshell strength is affected by age of birds, egg size and stress (Coutts and Wilson,
1990; Butcher and Miles, 2003). Butcher and Miles (2003) reported that birds lay bigger
eggs as they grow older with an implication on shell strength (Butcher and Miles, 2003).
Coutts and Wilson (1990) reported that young birds have immature shell glands that
produce shell-less eggs or eggs with very thin shells but when onset of sexual maturity
was delayed by one to two weeks, incidence of shell-less eggs or eggs with very thin
shells was insignificant. The authors observed that smaller eggs have stronger shells
than larger ones because birds have finite capacity to deposit calcium in shell so that
same amount of calcium are spread over a larger area of shell. Stress de-synchronise
process of egg formation e.g. oviposition prior to completion of shell deposition which
results in soft or thin-shelled eggs (Coutts and Wilson, 1990).
2.12.1: Egg shape index (SI)
The determination of egg shape index is a matter of natural convenience rather than
aesthetic consideration. The overall shape of an egg should be smooth in order to assist
laying birds (Abanikannda et al., 2007). Panda (1996) defined egg shape index as ratio
of short border relative to long border. Egg length, which is also referred to as height, is
the longest portion observed on external egg surface. Egg width is shortest portion of
the egg and referred to as breadth or short border where the dense mass of yolk is
35
situated (Gunlu et al., 2003). Abanikannda et al. (2007) also reported relationship
between egg weight, egg length and egg width. The shell shape and weight are
dependent on heredity, age of bird, season of the year and diet (Izat et al., 1985). Burtov
et al. (1990) reported that eggs of normal shape hatch more successfully than those with
shaped abnormally. Shape index is a measurement of overall shape of an egg. There are
three classification of egg shape: sharp (SI of<72), normal (SI of 72-76) and round
(SI>76), most prevalent in commercial egg production. Eggs outside normal range do
not fit into pre-made packaging while sharp eggs are not as resistant to handling and
transporting processes (Altuntas and Sekkeroglu, 2007).
To calculate shape index, the egg diameter or width (ED) and egg length (EL) are
measured in mm using callipers. The egg diameter (EW) is then divided by egg length
(EL) and multiplied by 100 (Van den Brand et al., 2004). These authors evaluated egg
shape index of 776 eggs from layers aged 25 to 59 weeks at 4-week interval (25, 29, 33,
37, 41, 45, 49, 55 and 59 weeks) within 3 hours of egg lay and observed that shape
index decreased steadily from 77.02 to 72.85±0.29 (p<0.05) and were classified as
normal shaped eggs. Anderson et al. (2004) using 6 hens per cage in a tri-deck system at
18 week collected and measured egg shape index starting at 28 week and continuing
through second production cycle with a moult occurring at 62 week reported an overall
long-term shape index with a base population from 1950; SI of 71.54 classified as sharp
and for strain derivatives from 1959 SI of 72.48; 1970 SI of 73.59; 1993 SI of 74.76
(p<0.05), indicating possible selection for larger normal round eggs.
Popva-Ralcheva et al. (2009) examined effect of age and genotype on egg quality
characteristics using eggs from hens at 32 and 50 weeks and observed that shape index
increase with age of hens. The shape index ranged from 75.88±0.7 to 78.45±0.7 in eggs
from the hens at 32 week and 73.46±0.84 to 76.29±0.52 in eggs from hens at 50 week.
There was a numerical decrease in shape index from 32 to 50 week suggesting that as
laying flock aged, egg shape become more normal. Shape index is an important
consideration during processing and marketing procedure particularly for pre-made
packaging. Normal shaped eggs are ideal for fitting into pre-made package containers
and provide more strength to eggshell compared to sharp eggs, making them more
36
resistant to breakage during handling and transportation (Altuntas and Sekkeroglu,
2007). Additionally, uniformity in egg shape is important as market for further
processing continues to grow. The efficiency of market is based on use of automatic
breakers and conformity in egg shape to machine specification.
2.12.2: Egg weight (Ew)
Egg weight is an important egg trait which influences quality as well as grading (Farooq
et al., 2001). It is one of egg quality parameters determined without breaking the eggs
(Wilson, 1991). Egg weight has direct relation with weight of albumen, yolk and shell
(Pandey et al., 1986). It varies significantly with strains (Brake et al., 1997). Tixier-
Boichard et al. (2006) recorded weight of 42.8g for Fayoumi eggs and 58.8g Isa Brown
eggs. The hens‟ age affects proportion of yolk, albumen and shell and egg weight
increases with hens‟ age, reaching a plateau at the end of lay cycle (Scott and Silverside,
2000). Hocking et al., (2003) reported that higher weight of egg from commercial
strains is not a surprise since such strains submitted to important breeding pressure for
egg weight improvement. Egg weight is measured simply by placing an unbroken egg
on sensitive weighing scale. It is greatly influenced by genetic, nutrition and other
environmental factors (Silversides, 1994; Monria et al., 2003; Silversides and Budgell,
2004; Van den Brand et al., 2004). Laying flock with heavier body weight produce
smaller eggs relative to their body size while those with lighter body weight produce
larger eggs.
There are six different egg weight categories; jumbo (68.6g), extra-large (61.5g), large
(54.4g), medium (47.3g), small (40.3g) and peewee (no minimum requirement). Egg
weight, unlike all other quality characteristics does not decrease with age of laying flock
(Silversides, 1994; Tharrington et al., 1999; Ledur et al., 2002; Van den Brand et al.,
2004; Altuntas and Sekkeroglu, 2007). Silversides (1994) in a study of sex-linked gene
for imperfect albinism on egg production collected eggs at 30, 45, 60 and 75 weeks of
age and stored overnight at 4oC. The authors reported steady increase in egg weight
with age of laying chickens. The overall egg weight at 30 week was 52.56±0.25g which
increased (p<0.05) over four measurements to 60.13±0.25g at 75 week. The results
clearly indicate that egg weight numerically increased across four measurements,
37
though the increase was not significantly different between last two measurements to
signal a leveling off. Tharrington et al. (1999) assessed the quality and composition of
eggs as influenced by genetic selection using the same strains used by Anderson et al.
(2004) with initial measurement at 28 week and taken over a period of 60 weeks. Eggs
were collected within 24 hours of lay tested for Specific Density (SG), dried and stored
overnight at 5oC; on the next day, 10 egg samples from each strain were weighed and
broken for further analysis. The observed values were not reported but egg weight
increased progressively with strains (p<0.05) and moulting at 63 week caused increase
in egg weight to level off. Van den Brand et al. (2004) in a study found that an average
egg weight from laying flock at 25 week was 49.21±0.43g which steadily increased to
61.01±0.43g (p<0.05) at 59 week indicating that egg weight increased with age. In all
the studies x-ray, egg weight increased at decreasing rate with age of laying flock. The
increase in egg weight in recently developed strains shows that larger egg weight is
desirable and could be selected genetically.
2.12.3: Eggshell Weight (EW)
Eggshell weight is the weight of shell portion of egg alone, although procedure varies.
Eggs are rinsed and set upside down to drain. The membrane inside of eggshell may be
removed during rinsing or included prior to weighing. The eggshell is dried either by
air, fume hood (Anderson et al., 2004) or oven at 100oC (Silversides, 1994). Eggshell
weight increased with age of laying flock (Silversides, 1994; Silversides and Budgell,
2004; Popova-Ralcheva et al., 2009). In a study of comparison of albino and non-albino
strains of layers with commercial layers at 30 week, Silversides (1994) reported
average eggshell weight of 5.44g with an increase (p<0.05) of 15g at 45 week (p<0.05)
and decreases (p<0.05) with average values of 5.50g and 5.35g at weeks 60 and 75,
respectively. Commercial strains of layer had significantly (p<0.05) heavier eggshells
than selected strains with eggshell weight measuring 5.88±0.04 and 6.13±0.04g,
respectively. The increase weight of eggshells in commercial strains was consistent with
increase in egg weight. Anderson et al. (2004) in a study of four strains of White
Leghorn measured eggshell weight and found heavier eggshell in recently developed
strains, while older strains had average eggshell weight of 5.28g.
38
The second strains recorded an average value slightly higher though insignificantly
different from the oldest strains.The younger strains recorded significantly (p<0.05)
increase average eggshell weight 0.35 and 0.52g when compared to the oldest strains.
These increases were due in part to the selection for birds of heavier egg weight.
Popva-Ralcheva et al. (2009) in agreement with the findings of Silversides (1994)
reported that eggshell weight varied in eggs produced from week 32 to week 50. These
authors in agreement with Silversides (1994) submitted that eggshell weight
numerically increased with age of laying flock from 0.32 to 1.18±0.02g. However, two
groups of birds were observed to decrease in eggshell weight (0.04 and 0.23±0.18 g)
with age of layers. The values of eggshell weight were inconsistent because newly
developed strains of laying flock produced eggs which were heavier in shells than older
strains. Silversides (1994) reported that eggshell varied with age of laying flock. The
eggshell weight was observed to increase at first with age but later decreased after 60
week. Popva-Ralcheva et al. (2009) reported that there was no specific pattern of
variation but commercial strains produced eggs that were heavier than those selected for
or against albinism. The variations were reported to be due to differences in egg weight,
strains and age of laying flock (Silversides, 1994).
2.12.4: Eggshell Thickness (ET)
Eggshell thickness measurement is taken along mid-line of an egg using micrometer. It
is done after egg has been broken. Eggshell strength is highly dependent on egg
thickness (Zeidler, 2002). The values of egg thickness vary slightly across similar
breeds of chicken (Potts et al., 1974; Anderson et al., 2004) and can either decrease
(Anderson et al., 2004) or remain constant as laying flock increases in age (Van de
Brand et al., 2004). Eggshell thickness is affected by temperatures above 32oC, age of
laying chickens and dietary calcium below 3% (Zeidler, 2002). An eggshell thickness
of at least 0.33 mm has been estimated to be necessary for at least 50% chance of
withstanding normal handling conditions without breakage (Stadelman, 1995). Van de
Brand et al. (2004) reported that eggshell thickness did not vary with age of laying flock
(p>0.05) but differences (p<0.05) was observed among strains with eggshell thickest of
39
0.344±0.003mm and thinnest eggshell of 0.295±0.003mm. This distribution
corresponds with values obtained for eggshell percentage.
Eggshell percentage is weight of eggshell as a percentage of total egg weight. The
authors reported 12.87-12.36±0.11% (p<0.05) as ranged value obtained for thicker eggs.
Anderson et al. (2004) in a study to determine significance of eggshell selection in
breeding programme, dried eggshells under fume hood to constant weight and measured
eggshell thickness at two different locations near mid-line. There were no significant
differences in eggshell thickness. Potts et al. (1974) evaluated breaking strength
eggshell thickness and specific gravity among brown and white eggs. They reported that
the thickness brown shelled eggs were not significantly (p>0.05) different and ranged
from 0.322 mm to 0.330 mm. The thickness of white shelled-eggs ranged from 0.330
mm to 0.353 mm. This finding showed little variation in eggshell thickness differences
between white and brown eggs of similar breeds of chickens. The little variation could
be attributed to factors that affect eggshell thickness including temperatures over 320 C
and low dietary calcium levels.
2.13: Internal egg quality characteristics
The interior egg quality is based on albumen quality, yolk quality and the presence of
blood or meat spots (Jacob et al., 2000). Sinha and Giri (1989) described internal egg
quality as a measured of factors like yolk colour, albumen height, yolk height, Haugh
unit, yolk width and nutritive values. High quality egg contents are indicated by firm
and thick albumen and yolks which contains no blood or meat spots (Ihsan, 2012).
Study conducted by Jones (2006) showed that internal egg quality traits are functions of
albumen height and weight and yolk index. However, Jacob et al. (2000) reported that
interior egg quality could also be based on air cell size, albumen quality and yolk
quality. Kul and Seeker (2004) reported internal egg quality traits based on the albumen
weight, height, ratio and Haugh Unit, and yolk diameter, height, weight, index and ratio.
The best indicators of internal egg quality traits were yolk index and Haugh Unit
(Isikwenu et al., 1999). The higher the yolk index and Haugh Unit, the more desirable is
egg internal quality (Jones, 2006).
40
2.13.1: Albumen quality
The albumen quality is influenced by factors like genetic, environmental (such as
temperature, relative humidity and the presence of CO2), bird‟s age, nutrition status, egg
storage condition and storage time (Jones, 2006). A good quality egg is free from
internal blemishes such as blood spots, pigment spots and meat spots (Robert, 2004).
High foam-forming quality in eggs correlates with high albumen viscosity which is
measured in terms of albumen height and thick of egg on flat surface (Silversides and
Budgell, 2004). Albumen refers to as egg „white‟ and consists of thick and thin portion.
The thick albumen is portion immediately surrounding egg yolk, where thin albumen
comprises the rest of white portion. Albumen quality is measured in terms of Haugh
Units (HU) and calculated from albumen height and egg weight (Haugh, 1937; Coutts
and Wilson, 1990). This is calculated as logarithm of thick albumen with an adjustment
for differences in egg weight (Haugh, 1937, Silversides, 1994). The albumen height
indicates egg freshness and is measured using tripod micrometer. Once an egg is broken
onto a flat surface, tripod micrometer is placed over thick albumen. The center pin is
lowered until it „‟kisses‟‟ albumen which measured albumen height in cm or mm. The
thicker the albumen; the better the egg quality Eggs with albumen height ranging from 8
to 10mm are considered to have superior interior quality (Zeidler, 2002). It is also
possible to theoretically calculate albumen height from Haugh Unit (Haugh, 1937;
William, 1992) using the formula below.
Hu = 100 log10 (AH - 1.7 EW0.37
+ 7.57)
where AH is the albumen height in mm and EW is the egg weight in g.
The higher is value of Haugh Unit; the better is quality of eggs (Chukwuka et al., 2011).
Haugh Unit of eggs is classified by United States Department of Agriculture (USDA,
2000) as AA (100-72), A (71-60), B (59-30) and C (below 29). Most eggs have 75-80
HU with a minimum value of 60 (Chukwuka et al., 2011). Haugh Unit and albumen
height decreases with storage time (Scott and Silversides, 2000). Albumen height is
greatly influenced by age of laying flock and length of time laying flock is in
continuous lay without moulting. Albumen quality decreases with age of laying flock
(Doyon et al., 1986; William, 1992; Silversides, 1994; Ledur et al., 2002; van de Brand
et al., 2004) and storage period (Silversides, 1994; Silversides and Budgell, 2004).
41
On the other hand, Silversides (1994) measured albumen height of eggs laid at 30, 45,
60 and 75 weeks of age and found that the average albumen height steadily decreased
(p<0.05) (average range values at 30 and 75 weeks were 6.70±0.06 mm and 5.50±0.06
mm, respectively) as laying chickens increased in age. Monria et al. (2003) examined
internal and external quality of Barred Plymouth Rock, White Leghorn, Rhode Island
Red and White Rock chickens from day 220 to 260 in storage time 1, 7, 14 21 days and
ambient temperature 27.40±1.25oC and relative humidity 80.50±1.90%. The authors
found that average albumen height of breeds decreased as egg holding period increased
(p<0.05), indicating reduction in egg freshness. Van de Brand et al. (2004) reported
average value of albumen height as 7.27±0.18mm for young laying flock which
decreased (p<0.05) in value to 1.78±0.18mm for old laying flock.
Silversides and Budgell (2004) in a study to determine significance of genetics, age and
storage time using ISA Brown and Babcock B300 commercial strain of laying chickens,
collected eggs at 32, 50 and 68 weeks of age to represent early, middle and late phases
of production and measured albumen height within 24 hours of lay and 5 and 10 days of
storage time at 21oC.The authors reported albumen height values of 6.47±0.06mm at 32
week which decreased (p<0.05) to 0.71±0.06 at 50week and 1.71±0.06mm at 68week.
The average albumen height of eggs laid within 2 hours was 8.45±0.06mm. A decrease
of 3.49 and 4.35±0.06mm (p<0.05) was reported for eggs stored for 5 and 10 days
respectively. The decrease in albumen height with increase storage time indicated
freshness or staleness in eggs.These studies suggested that albumen height of eggs
decreases with age of birds and length days of egg storage.
2.13.2: Yolk quality
Egg-yolk is enclosed in tender and elastic membrane called vitelline membrane.
Vitelline membrane keeps yolk together and separates from albumen content (Rose,
1997). Yolk quality is determined by colour, texture, firmness and odour (Jacob et al.,
2000). Yolk colour is a key factor in determining egg quality (Jacob et al., 2000;
Okeudo et al., 2003). Consumers‟ preference for egg-yolk colour is highly subjective
and varies widely. The colour of egg-yolk is affected by carotenoid pigments
(xanthophylls) present in feedstuffs like maize, lucerne, grasses, tomatoes, carrots, algae
42
among others (Hasin et al., 2006). Yellow maize, in addition as energy source, supplies
xanthophyll pigment to animals. It contains 20-25 mg xanthophyll/kg. Egg producers
make efforts to produce eggs whose yolk would have rich yellow colour using yellow
maize. There are approved synthetic pigments used to replace natural pigments as
components of feed additives. Mottled yolks occur when contents of albumen and yolk
mix as a result of degeneration and increase permeability of vitelline membrane (Jacob
et al., 2000).
Yolk colour is variable and subject to easy change ranging from light to medium colour
of yellow (Galobart et al., 2004). It is subjectively determined using Roche Colour Fan
Score (Vulleumier, 1968; Stadelman, 1995). Food processing and other industries often
prefer darker yolk colour that impart yellow colouration of products (Zeidler, 2002).
The diets of laying chickens greatly affect egg yolk colour (Galobart et al., 2004). The
yolk colour can be manipulated by inclusion of synthetic additive or natural feeding
ingredients for example xanthophyll in diets (Zeidler, 2002; Galobart et al., 2004).
Galobart et al. (2004) investigated effect of saponification of paprika products, marigold
products and both on xanthophyll levels in yolk colour at days 19, 20, 21, 26, 27 and 28
using a Roche Yolk Fan Score. The authors reported that yolk colour darkened as levels
of red xanthophyll increased in diets. The concentration of products in diets varied
significantly (p<0.05) with dark yolk colour. Popova-Ralcheva et al., (2009) determined
egg yolk colour from laying chickens at 32 and 50 week of age using Roche Colour Fan
Score and found that younger layers had yolk colour score ranging from 8.20±0.43 to
8.87±0.26, while older laying chickens recorded 8.21±0.12 to 8.60±0.28. When laying
chickens were fed the same diets, there were no differences in yolk colour because diet
predominantly influence egg yolk colour.
2.14 Relationship among egg quality characteristics
Some egg quality characteristics are either moderately or strongly related. The different
correlational studies enable egg quality characteristics to be evaluated when resources
are limited in supply. Egg quality encompasses entire egg mass and characterized by
eggshell thickness, weight and specific gravity. Thus, correlation among specific egg
specific gravity, eggshell thickness and eggshell weight help to determine shell quality.
43
Specific gravity of eggs is determined from egg shell thickness and weight without
breakage. There is strong positive correlation between eggshell and specific gravity of
eggs. This relationship is plausible since specific gravity gives a method of measuring
eggshell quality. Stadelman (1995) reported correlation value of 0.78 between eggshell
thickness and specific gravity. As eggshell thickness increase, specific gravity of egg
increases. Zhang et al., (2005) reported moderately strong and positive genetic
correlation between eggshell thickness and weight in dwarf brown-egg layers developed
from pure line.
In a post-moult study using using white and brown layers at 57 week for 40 weeks fed
four different diets, Aygun and Yatisir (2010) reported a strong positive correlation
between eggshell thickness and specific gravity. The relationship between eggshell
thickness and specific gravity (0.06) was lower than 0.78 obtained by Stadelman (1995).
However, stronger correlation was obtained by Aygun and Yatisir (2010) in barley-
based diets (0.78±0.03) and oat-based diets (0.53±0.03). The two diets had lower
correlations values of 0.06±0.04 and 0.03±0.04 in wheat- and bran-based diets,
respectively. The diets contained 1% calcium but wheat- and bran-based diet had lower
level of di-calcium phosphate which may affect overall shell quality. The reduced level
of di-calcium phosphate may have affected either eggshell thickness or specific gravity
of eggs more than the other to cause reduction in correlation values between the two
characteristics.
Relationship among egg equality extends beyond eggshell characteristics. Zhang et al.
(2005) examined a number of egg quality characteristics and reported that genetic
correlation exist between internal and external quality of eggs. The positive correlation
values between albumen and egg weight and shell index and eggshell weight were 0.32,
0.33 and 0.36, respectively. These correlation values though weaker than values
recorded for eggshell, these values remain significant for determining egg quality since
high quality eggs are expected to have high multiple egg quality characteristics. Aygun
and Yatisir (2010) investigated phenotypic correlation across several egg quality
characteristics. The overall strongest relationship between albumen height and Haugh
Unit reported was 0.95±0.01 because Haugh Unit is related with directly albumen
44
height. The correlation values of egg weight and egg width, egg length and specific
gravity were 0.70±0.01, 0.60±0.02 and -0.32±0.02, respectively. Shell percentage was
correlated with specific gravity and eggshell thickness to obtain 0.39 and 0.37±0.02,
respectively
2.15: Effect of housing system on egg quality characteristics
Many studies have shown that housing systems affect quality of eggs in commercial
flocks (Zemková et al., 2007; Lichovníková and Zeman, 2008; Djukicstojcic et al.,
2009) but fewer reports (Casagrande et al., 2001; Minelli et al., 2007; Rossi, 2007) and
review (Pavlovski et al., 2012) did not establish comparative advantages or
disadvantages of housing systems on egg quality. Egg quality is influenced by housing
system (Vits et al., 2005). Birds in non-cage systems spend more energy on movement
which may result in production of either smaller eggs or reduced egg-yolk content (Van
Niekerk, 2014). In a study to compared egg quality of laying birds in cage, cage-free,
organic and free-range systems, Hidalgo et al. (2008) reported that eggs from organic
management system had greatest whipping capacity, foam consistency and lowest
Haugh Unit scores which indicated poorer egg quality. In a similar study, Abrahamsson
and Tauson (1995) reported that there were no clear trends in interior egg quality
characteristics produced by birds in conventional cage and aviary production.
The reports by Pavlovski et al. (1981) and Shawkat (2002) showed better albumen
height and Haugh Unit for eggs collected from free-range than caged birds. This
observation was corroborated by the study carried out by Djukic-Stojcic et al. (2009),
that eggs from free-range system were significantly greater in albumen height and
Haugh Unit than eggs from cages. Van den Brand et al. (2004) compared egg quality of
birds individually in cages with those that co-habited with male counterparts on free-
range. These authors reported inconsistency in external and internal egg quality
characteristics but observed darker egg-yolk colour in eggs obtained free-range system.
Minelli et al. (2007) reported higher values of egg-yolk colour in eggs from
conventional systems. In another study, Simčič et al. (2009) reported that egg-yolk
weight of native breed of chicken kept under free-range system was higher than caged
birds. Silversides and Scott (2001) and Pavlovski et al. (2012) reported that albumen
45
percentage and yolk-albumen ratio decreased with age for birds in cages with no
variable differences in albumen height. The frequency of blood and meat spots was less
than 1% in eggs produced from commercial lines (Smith et al., 2008).
The incidence of blood and meat spots increased with age of bird (Silverside and Scott,
2001). Other environmental factors that are likely to affect egg quality include noises,
temperature changes, infections and incidence of blood and meat spots (Campo, et al.,
1998). A greater incidence of meat spots has been found in aviary versus conventional
cage eggs (Abrahamsson et al., 1996). The study conducted by Hidalgo et al. (2008),
which did not include aviary production, showed lowest incidence of meat spots in free-
range eggs when compared with conventional cages, cage-free, and organic production.
The effect of housing systems on egg quality was investigated (Williams, 1992). A
number of studies also showed that housing systems affect egg quality characteristics of
chickens. Wang et al. (2009) and Silversides and Scott (2001) observed higher internal
egg quality traits in deep litter than in battery cage. Jin and Craig (1994) reported that
housing conditions affected growth, egg production and qualities in laying hens.
Ojedapo (2013) reported that egg quality trait e.g. egg weight, length, breadth, shell
weight and thickness (external egg quality traits) and yolk weight and colour, albumen
weight and height (internal egg quality traits) were better in eggs from deep litter system
than cages.
Egg production, weight and shell quality parameters like specific gravity, weight,
thickness and percentage shell were not significantly affected by different housing
systems (Neijat et al., 2011). However, Usturoi et al. (2010) reported that laying birds
in deep litter produced lower proportion of eggs with shell faults when compared to
those managed in other housing systems. Mohan et al. (1991) observed that egg weight
and shell thickness of laying birds in cages were higher than in deep litter. The
production practices and physiological stress have direct impact on egg size (Morris,
1985; Keshavarz and Nakajima, 1995). Eggs from free-range production systems
weighed more than those from battery and conventional cages (Hughes et al., 1985;
Hidalgo et al., 2008). There was however no difference in egg weight from furnished
cages compared with those from conventional cages (Guesdon and Faure, 2004).
46
Tanaka and Hurnik (1992) compared egg size of laying birds in conventional cages and
aviary production between 27 and 63 weeks of age and found no differences in egg size
between the two housing systems. Abrahamsson et al. (1996) reported that eggs from
conventional cages had significantly greater weight compared with those from aviary
systems.
Hughes et al. (1985) observed that variation in egg weight could be due to differences in
environmental temperature in free-range and cage systems of egg production. In a
similar study, Anderson and Adams (1994) reported that laying birds in cages always
produce heavier eggs and birds were less fearful at end of production cycle than in deep
litter. High environmental temperatures are known to affect voluntary feed intake of
birds which may result in decreased availability of calcium for shell deposition (Okoli et
al., 2006). High atmospheric temperature therefore adversely effects oviposition and
oviposition interval leading to drop in egg production and weak eggshell (Oguntunji and
Alabi, 2010). Although, laying birds mitigate heat stress by panting (Koelkebeck, 1999),
heat stress causes a decrease in amount of carbon dioxide (CO2) in blood leading to
condition known as respiratory alkalosis (Koelkebeck, 1999; Nys et la., 1999). Since
egg shells are made up of 95% calcium carbonate (CaCO3), a decrease in blood CO2
level combined with increased blood pH and subsequently decrease in Ca2+
ions for
shell formation could lead to increase production of thin or soft shelled eggs
(Koelkebeck, 1999; Okoli et al., 2006).
Laying birds under stress often retain eggs in oviduct for longer period of time leading
to deposition of amorphous calcium carbonate and eggs laid are described as „whiter
eggs‟ (Walker and Hughes, 1998). Egg quality traits such as egg cracking and dirtiness
are affected by design of housing systems (Abrahamsson and Tauson, 1995). The
effects of design of housing systems on egg cracking and dirtiness is pronounced in
deep litter system than battery cage because of higher frequency of nesting and perching
behaviour (Elston, 2000). Guesdon and Faure (2004) reported no differences in shell
breaking strength of eggs from furnished and conventional cages. Eggs collected from
free-range system were observed to have greater shell thickness and stronger shells than
those from conventional cages (Hughes et al., 1985). However, when eggs collected
47
from aviaries, conventional cages and floor pens were compared, Tauson et al. (1999)
reported greater percentages of cracked eggs for eggs from aviaries and conventional
cages than those from floor pens. Victor et al. (2013) opined that laying birds in free
range systems generate higher occurrence of dirty and shell cracked eggs as well as
decrease shell quality parameters such as eggshell density, thickness and mass,
especially toward the end of laying period.
On the contrary, Mertens et al. (2006) reported highest percentage of cracked eggs at
point of lay in conventional and furnished cages, while lower percentage was observed
in aviary and free-range production. Short (2001) explained that competition among
laying birds for dust bathing might produce increased stress which in turn reduces
eggshell density. In a study by Hidalgo et al. (2008), eggshell thickness was lowest for
eggs from cages but varied for those from litter-floor and free-range systems. Pavlovski
et al. (2001) however reported thicker eggshell for eggs from deep litter than those from
free-range system.
2.16: Effect of housing systems on egg lipid profile
The effect of housing systems on egg quality and its chemical composition have been
investigated (Williams, 1992). Several studies (Lopez-Bote et al., 1998; Silversides
and Scott, 2001; Cherian et al., 2002; Rizzi et al., 2006; Rossi, 2007; Zemková et al.,
2007; Minelli et al., 2007; Stefano et al., 2008; Krawczyk and Gornowicz, 2009;
Wang et al., 2009; Józefa et al., 2011; Kamil et al., 2012) have shown that housing
systems affect egg qualities of hens in cages and deep litter. Wang et al. (2009) and
Silversides and Scott (2001) observed higher internal egg quality traits in deep litter
floor than in battery cage. Zemková et al. (2007) reported lower cholesterol level in
yolks of eggs from caged compared with litter-kept hens. Also, Józefa et al. (2011)
recorded lower yolk cholesterol in eggs laid by hen reared under free range system
than those in litter floor. Simčič et al. (2009) found that the yolks of eggs raised with
outdoor access contained more fat and cholesterol than yolks of eggs from hens
raised indoors.
48
Krawczyk and Gornowicz, (2009) observed less fat in egg-yolk from free range
compare to litter floor and no effect of housing system on yolk cholesterol. Minelli et
al.(2007) reported lower cholesterol from egg yolk of hen from conventional system.
The study by Kamil et al. (2012) showed that housing systems (battery cage and deep
litter) had no influence on yolk cholesterol. Reported studies (Lopez-Bote et al.,
1998; Cherian et al., 2002; Rizzi et al., 2006; Rossi, 2007; Stefano et al., 2008;
Józefa et al., 2011; Kamil et al., 2012) have shown that eggs from free range contain
two thirds the amount of cholesterol compared to conventional cage. These authors
compared composition of fatty acids of eggs from conventional battery cage system
and found no clear effect of housing system on yolk lipid composition.Józefa et al.
(2011) reported a lower level of saturated fatty acids, higher levels of
monounsaturated fatty acids, lower level of polyunsaturated fatty acids, higher level
of n-3 fatty acid and a lower level of n-6: n-3 fatty acid ratio in the yolk of egg from
eggs from hens reared under free range system.
Cherian et al. (2002) and Rizzi et al. (2006) declared that fatty acid compositions of
eggs from organic system were not significantly different from conventional
system. Rossi (2007) also found no difference in fatty acid composition of eggs from
organic and conventional systems except total saturated fatty acids. Kamil et al.
(2012) observed a lower level of omega 3 fatty acid in egg yolk from litter floor
compared with conventional cage. Lopez-Bote et al. (1998) reported that eggs from
free range system had higher omega-3 and lower omega-6 contents compared with
those from conventional system while Stefano et al. (2008) reported no influence of
total lipid in yolk but significant changes in yolk fatty acid profile of eggs from hens
reared on different housing systems.
2.17: Effect of nutrition on egg quality characteristics
Nutrition has direct effect on egg quality. When laying birds are nutritionally
compromised, their body shut down necessary biochemical processes (Jones, 2006). A
lack of appropriate level of required nutrients in diets of laying birds will not only
impair efficiency of production but also inferior with egg quality (Jones, 2006). Egg
mass is important for maintenance of good shell quality (Pavlovski et al., 2012).
49
Smaller eggs have stronger shells than larger ones because laying birds have finite
capacity to deposit calcium in shell since the same amount of calcium is spread over a
larger shell area (Butcher and Miles, 2003). Pavlovski et al. (2012) reported that egg
mass can be reduced by lowering the total amount of dietary protein or methionine
levels in diet. These authors observed adverse effect on egg production and reported that
0.25-0.5% supplementation of amino ethyl-sulfonic acid in powder form in layer diet
will not decreases egg mass nor has effect on production traits. Also, Grobas et al.
(1999) reported that addition of 4% fat affected egg mass at early laying phase and
should be avoided in order to prevent decrease in egg production.
It has however been observed that addition of more saturated fatty acids (palm oil) and
linoleic acid in quantities that meet physiological function of laying birds are
alternatives to control increase in weight with age especially when egg mass reduction
does not reflect changes in mass of eggshell (Harms et al., 2000). Thus, any delay in
introducing required calcium in diet of laying birds has serious negative effect on
eggshell quality during early laying phase and subsequent eggs produced (Roland,
2000). The optimal eggshell quality was determined in eggs from laying birds fed diets
containing more than 3.5% calcium brown shell eggs (Vitorović et al., 1995; Safaa et
al., 2008) and 4 to 4.5g per day. Evidence from these studies and others (NRC, 1994;
Vitorović et al., 1995; Safaa et al., 2008) showed that feeding laying birds high levels of
calcium may interfere with availability of other minerals causing negative impact on
ability of birds to utilize calcium, particularly when calcium levels in diets is sub-
optimal in quantity. Coetzee (2002) reported in South Africa that laying birds supplied
200mg of calcium per litre in drinking water laid eggs with higher mean shell strength
compared to those fed un-supplemented water. However, Kershavarz and Nakajima
(1993) reported that feeding laying birds with calcium levels above requirement did not
improve shell quality.
Similarly, feeding high levels of dietary phosphorous has been shown to have negative
effect on eggshell quality (Taylor, 1965; Boorman, et al., 1989; Kershavarz and Austic,
1990). Miles et al. (1983) reported negative correlation between phosphorus content in
diets and eggshell as high dietary phosphorus increases blood phosphorus content which
50
in turns inhibits bone calcium mobilization and cause poor eggshell quality. Pavlovski
et al., (2012) observed that laying birds often require increase phosphorus during warm
period and where quantity fall below 0.25% in order prevent mortality, eggshell
breakage increases. Low level of phosphorus in feed reduces the need for calcium but
lead to bone problems and poor quality of eggshell. This condition can be improved
partially by adding large particles of marble (Nys 1995). Mas and Arola (1985) and
Miles (2001) showed that provision of adequate amounts of zinc, copper, iron and
manganese, key components of eggshell matrix and shell integrity, play essential role as
co-enzymes in shell formation and its associated membranes. The deficiency of these
microelements in diet reduce shell mass (Zamani et al., 2005).
Magnesium deficiency affects number of egg laid and shell quality. The diets of laying
birds often contain four times more than its requirement (Vogt et al., 1984). There is no
definite magnesium requirement since plant feedstuffs such as bran, sunflower,
rapeseed, contain sufficient quantity of magnesium. However, excess amount of
magnesium in diets increases water consumption leading to increase in number of dirty
eggs (Pavolvski et al., 2012). Laying birds fed manganese deficit diet produced thinner
shell partly due to deterioration of see-through spots arising from worsening of ultra-
shell structure and reduction of concentration of polysaccharides which are precursors
of protein matrix (Pavlovski et al., 2012). Faria et al. (1999) reported that 70-
100mgMn/kg diet is needed for good quality eggshell strength and thickness.
Chowdhury (1990) reported that inadequate supply of copper in diets of laying birds
affects biochemical and mechanical properties of eggshell membrane negatively to
caused egg shape deformation. Meluzzi et al. (2000) also observed that metals such as
nickel, chromium and lead reduce eggshell mass.
The report of study on selenium supplementation in diets of laying birds up to 0.8
mg/kg by Pavlovski et al. (2012) indicated no negative effect on eggshell quality.
Vitamin D3 up to 400 IU increased number of egg laid and improves shell quality
(Whitehead, 1996). Seven (2008) reported that addition of vitamin C to layer diets in
order to mitigate heat stress conditions had positive effects on mass and eggshell
thickness. This observation contradicts report by Supić et al. (1997). However, Çiftçi et
51
al. (2005) reported that egg production and egg weight, egg specific gravity and shell
thickness were significantly increased when laying birds were fed vitamin C and E after
exposure to heat stress. Mori et al. (2003) also reported that specific gravity, shell index,
and shell thickness of eggs from laying birds fed diets supplemented with vitamins A
and E were not different from those fed basal diet. Sodium and chloride deficit diets
adversely affect egg production and shell quality. Excess chloride has detrimental effect
on eggshell quality (Gezen et al., 2005). The study by Belnave et al. (2000) revealed
that shell quality decreases as concentration of NaCl in drinking water increases.
A significant linear relationship exited between shell quality and NaCl concentration in
drinking water. The concentration of 600 mgNaCl/L in water increased incidence of
damaged shell and reduced shell breaking strength, thickness, weight, weight/egg ratio,
weight and shell weight/unit surface in domestic fowl by three-folds (Balnave and
Yoselewitz, 1987). Keshavarz and Austic (1990) examined interaction of phosphorus
and chloride on egg shell integrity and reported that elevated dietary levels of chloride
resulted in decreased eggshell quality and blood acid-base indicators. In contrast, Hess
and Britton (1989) fed diets lower in chloride to laying birds and found virtually no
effect on shell quality. Water quality affects eggshell quality. Water containing high
levels of electrolytes has long-term negative effects on eggshell quality (Balnave and
Yoselewitz, 1987). Water temperature is important, especially during hot weather when
birds reduce water intake or even cease to drink if water gets too hot. Provision of cool
drinking water improves eggshell quality in heat stressed hens (Glatz, 1993). A number
factor has been reported (Robert, 2004) to affect albumen quality although Williams
(1992) concluded that albumen quality is not greatly influenced by nutrition.
Nevertheless, albumen quality decrease with increasing dietary protein and amino acid
content (Hammershoj and Kjaer, 1999); increases with higher amount of dietary lysine
(Belnave et al., 2000); decreases with dietary addition of neem kernel meal (Verma et
al., 1998); increases with ascorbic acid supplementation (Franchini et al., 2002); and
increases with vitamin E supplementation, especially at high ambient temperatures
(Kirunda et al., 2001; Puthpongsiriporn et al., 2001). At temperatures above or below
thermo-neutral zone, corticosteroid secretion increases in response to stress (Brown and
52
Nestor, 1973). By decreasing synthesis and secretion of corticosteroids, vitamin C
alleviates negative effects of stress such as cold stress-related depression in poultry
performance (McDowell, 1989; Kutlu and Forbes, 1993). Ajakaiye et al. (2011)
examined impact of supplementing L-ascorbic acid and DL-tocopherol acetate in diets
of laying birds under heat stress and observed that egg-yolk was higher in group fed
combination of vitamin C and E compared to those fed vitamin E and vitamin C treated
groups and control respectively. They also reported that Haugh Unit was higher in
group fed combination of vitamin C and E compared with those fed vitamin C and E
treated groups and control.
Mori et al., (2003) reported that albumen quality of eggs from hens fed diets with
supplemental vitamins A and E did not differ from those fed basal diet. This observation
is in agreement with findings of Qi and Sim (1998) who supplied laying birds with 800
mg vitamin E/kg of diet without changes in internal egg quality. The primary
determinant of yolk colour is xanthophyll (plant pigment) content in diets (Silversides et
al., 2006).The omission of xanthophyll in diets led to pale egg-yolk (Esonu, 2006). It is
therefore possible to manipulate the colour of egg yolk by the addition of natural or
synthetic xanthophyll in poultry diets. However, the ease with which yolk colour can be
manipulated can lead to unwanted colour changes. The inclusion of more than 5%
cottonseed meal in layer diets resulted in olive or salmon coloured yolks (Beyer, 2005;
Esonu, 2006), while inclusion of certain weeds or weed seeds produced green yolks
(Beyer, 2005; Coutts and Wilson, 1990). The alteration in yolk colour can result due to
any factor which alters or prevents absorption of pigments from diet or deposition of
pigments in yolk. Such factors include worm infections (Coutts and Wilson, 1990);
mycotoxicosis caused by aflatoxin B1 (Zaghini et al., 2005); coccidiosis; and any other
factor that inhibits liver function and lipids metabolism.
Study (Coutts and Wilson, 1990) on diphenyl-para-phenylenediamine (DPPD), an
antioxidant, was found to cause excessive deposition of pigments in egg-yolk. Mottled
yolks in egg occur when albumen and yolk mix as a result of degeneration and increase
permeability of the vitelline membrane (Jacob et al., 2000). Other factors that may
cause mottled egg-yolks include presence of nicarbazin (an anticoccidal agent) in feed
53
(Cunningham and Sanford, 1974; Jones et al., 1990), deworming drugs such as
phenothiazine (Coutts and Wilson, 1990), dibutyltin dialaurate (Coutts and Wilson,
1990;Jacob et al., 2000) or Piperazine (Jacob et al., 2000; Coutts and Wilson, 1990);
gossypol from cotton seed meal (Jacob et al., 2000) and presence of tannin and tannic
acid (Coutts and Wilson, 1990; Esonu, 2006) in feed. Miles (2001) reviewed effects of
vanadium on poultry performance and noted poorer albumin quality from laying hens
that consumed as little as 6ppm. This finding agreed with earlier reports by Sell et al.
(1982), that there was decrease in interior egg quality from two strains of laying birds
fed 3 or 6 ppm vanadium. The report of study by Duyck et al. (1990) of feeding laying
birds 10ppm of vanadium for 30 days recorded 71 and 64HU after first and seventh day
of storage at 16.6oC temperature and 60% relative humidity after seven days of storage
respectively.
Miles (2001) reported that negative effects of vanadium may be overcome by feeding
cotton seed meal, ascorbic acid, vitamin E or carotene. Karmel et al. (2010) reported
higher albumen height and improvement in Haugh Unit but lower albumen and yolk pH
in eggs from birds fed garlic juice when compared to those on control diet. Senkoylu et
al., (2005) examined effect of inclusions of poultry by-products in layer diets and found
significant effect on egg breaking strength, shell weight, albumen weight, and yolk
weight. They observed significant reduction in egg weight when birds were fed 4%
feather meal and 4% poultry by-product and decrease in Haugh Unit was more
pronounced when compared with those on control diet. Dietary treatments indicated
differences in the amino acid contents in poultry by-products (Senkoylu et al., 2005).
2.18: Dietary influence on blood serum egg yolk cholesterol in poultry
Animal fats encouraged incidence of atherosclerosis because they contain larger
proportion of poly-saturated fatty acids. There is positive correlation between animal
fats and cholesterol content in egg-yolk but maintained inverse relationship with plant
fats. Thus, animal fats enhance synthesis of cholesterol while plant fats reduce its level
(Maynard et al., 1979). Dietary factors elevate blood cholesterol which is indicated by
egg-yolk cholesterol. Reports of studies (Kokantnur et al., 1958) stated that dietary
components have little or no alteration on egg-yolk cholesterol content. The type and
54
quantity of dietary fat appear to have no effect on total lipid content (Edwards et al.,
1962), however, dietary cholesterol largely and uniformly increases the egg-yolk
cholesterol which strongly suggests that hens have ability to control serum cholesterol
and prevent hypercholesterolemia by excretion through the egg-yolk (Harris and
Wilcox, 1963). Blood serum or plasma cholesterol level of hen were not significantly
affected by different dietary fats (Edward et al., 1962), though a reduction in blood
cholesterol level was recorded in a study where laying hens were fed melted animal fats.
The total blood cholesterol level increase when hens were fed soyabean oil (Daghir et
al., 1960) while corn oil caused decrease the total liver lipid and total cholesterol
(Marion and Edward, 1962). The egg-yolk cholesterol did not respond to soyabean oil
as serum cholesterol and yolk cholesterol remains relatively independent of serum
cholesterol in in-vitro experiment with membrane surrounding growing ovum in
chickens (theca interna and granulosa) which are equally active as liver slice in
cholesterol biosynthesis. Dietary protein has some part to play on serum and egg-yolk
cholesterol content. There were significantly higher cholesterol values in hens fed lower
dietary protein irrespective of amount or type of fat (Mone et al., 1959). Serum
cholesterol level was not affected by increasing dietary fat from 4-10%, but reduction in
dietary protein with sucrose gave higher blood cholesterol and more aortic and coronary
atherogenesis which were prevented when protein uptake was restored by supplement of
soyabean protein (Stamler et al., 1958). The excess fat and cholesterol combined with
inadequate protein may be of primary importance in production of high blood
cholesterol and atherosclerosis.
2.19: Methods of egg storage
Egg production is on the increase in Nigeria but poor storage conditions may result in
quality deterioration and consequently causing loss in farm revenue (Raji et al., 2009).
Most egg quality characteristics aside shape index and shell thickness are affected by
type and storage time (Dudusola, 2009). Egg loss could be due to accumulation of
carbon dioxide, ammonia, nitrogen, hydrogen sulphide gas and water in eggs when
poorly stored or stored for long period of time (Dudusola, 2009; Alsobayel and Albadry,
2011). In Nigeria, eggs in most cases are stored under ambient condition due to irregular
55
electric power supply (Okeudo, 2005; Raji et al, 2009). Retailers usually display eggs
for sales on open paper or plastic egg trays while housewives store eggs in kitchens. The
most profound factor that causes deterioration in egg quality is storage temperature
(Stadelman and Coterill, 1995). The deterioration of interior egg quality can be delayed
significantly by maintaining storage temperature near freezing point (Zeidler 2002).
Several studies (Dudusola, 2009; Scott and Silverside, 2000) have shown that
refrigeration method of egg storage effectively reduce egg weight loss by half and
maintained quality grade for at least 4 weeks compared to storage under room
temperature (Biladeau and Keener, 2009). Storage of eggs at temperatures of 7–13oC
and humidity of 50-60% reduced rate of degeneration of thick albumen proteins and
consequently maintained albumen quality for longer period (Jones, 2006). This report
agreed with the finding of Silversides and Scott (2001) that Haugh units were not
significantly decreased by storing for 3-14 days at 4ºC, while albumen pH of
refrigerated eggs (5°C) decreased and these qualities increased at 21°C or 29°C (Samli
et al., 2005). The decrease in albumen pH during storage may be due to continuing
breakdown of major constituents in egg white and/or changes in bicarbonate buffer
system (Obanu and Mpieri, 1984; Biladeau and Keener 2009). Samli et al. (2005)
reported that yolk indices of eggs from old laying hens decreased with increase storage
time but decrease at slower rate at 5°C than at 21°C or 29°C.
In some developing counties where refrigeration method of storage is seldom practiced,
egg-coating method is effectively used to preserve the egg quality from microbial
deterioration. The different food-grade coating materials have been proven to be
efficient in reducing quality deterioration. These materials include chitosan, whey
protein, waxes, mineral and vegetable oils (Obanu and Mpieri 1984; Wong et al., 1996).
Oil-coating eggs reduce CO2 losses and help maintain egg quality (Coutts and Wilson,
1990; Koelkebeck, 1999; Beyer, 2005) but cannot be a substitute for refrigeration
method (Jacob et al., 2000). Williams (1992) and ACIAR (1998) observed that oil-
coating of eggs within 24 hours of lay effectively retarded albumen deterioration but
does not replace the need for refrigeration method.
56
Mineral oil used for coating egg must be odourless and colourless, and free of
fluorescent materials (Stadelman and Coterill, 1995). Waimaleongora-Ek et al. (2009)
in a study using mineral oil with different viscosities as egg-coating materials reported
that mineral oils with highest viscosity were more effective in preventing weight loss
and preserving albumen quality deterioration. The authors observed that coating with
mineral oils reduced egg weight loss by more than 10 times and extended keeping
quality by at least 3 weeks compared with non-coated eggs during 4 weeks of storage at
25°C. However, shell colour and visual appearance of eggs were altered after storage
(Stadelman and Coterill, 1995). According to FAO (2003), weight loss of 2-3% was
common among commercial eggs which are hardly noticeable by consumers. This
indicates that non-coated eggs may not be suitable for market after approximately 3
weeks (if stored at 25 °C) and 5 weeks (if stored at 4°C) of storage (Bhale et al., 2003).
2.20: Changes in egg quality characteristics during storage
Storage condition like temperature, relative humidity and storage time affect egg quality
characteristics. As egg storage condition of changes, egg weight, shell weight and
eggshell percentage are affected (Jin et al., 2011). The changes in egg quality
characteristics vary among species of poultry (Tebesi et al., 2012; Tilki and Inal, 2004).
The effects of storage time and temperature on albumen quality have been documented
(Stadelman and Cotterill, 1995, Scott and Silverside, 2000). Egg weight decrease with
storage time as a result of loss of moisture through eggshell pores (Brake et al., 1997).
The decrease in egg weight with storage time was also reported by Samli et al. (2005).
The authors observed decrease in egg weight within 10days of storage at 29oC.
However, eggs stored in refrigerator and by oil-coating had lower egg weight loss due
to less moisture loss (ACIAR, 1998). Alade et al. (2009) reported that egg qualities are
affected by storage time except shell weight, shape index, egg length and egg width and
shell thickness. This report was in line with observations of Hamilton (1982) and Tilki
and Inal (2004) that shell thickness did not change with days of storage in geese eggs
although, specific gravity and compression fracture strength of eggs were altered by
storage time.
57
The report of Tebesi et al. (2012) on guinea fowl eggs showed that storage time
significantly affected shell thickness while egg weight, egg dimensions (width and
length), egg shape index, shell weight and shell percentage were not affected by storage
time. Egg weights decreases due to increase in weight losses with increase in days of
storage. The losses were accounted for by losses in carbon dioxide, ammonia, nitrogen,
hydrogen sulphide gas and water from eggs (Dudusola, 2009; Alsobayel and Albadry,
2011). Weight losses were not the same for all storage methods. Eggs refrigerated did
not lose as much solvent as those under room temperature. Thus, reduction in egg
quality characteristics was not as higher in refrigerated eggs compared with those stored
at room temperature. Albumen height and Haugh Units decreased with storage time.
The decrease in albumen height occurred more quickly at higher storage temperatures
(Li-Chan and Nakai 1989; Dudusola, 2009). The rapid cooling of with carbon dioxide
was found to improve Haugh Units of stored eggs (Keener et al., 2000). During storage
of eggs, pH of albumen increases which accounts for deterioration. After three days of
storage, pH of albumen rose to 9.3 or more thereby rendering eggs less susceptible to
bacterial infection (Scott an Sliverside, 1987).
The changes in albumen quality during egg storage are related to changes in ovomucin,
particularly thick albumen (Kato et al., 1994; Toussant and Latshaw, 1999). As egg
ages and carbon dioxide (CO2) is lost through shell pores, the contents in eggs become
more alkaline making albumin more transparent and increasingly watery (Okeudo et al.,
2003). At higher temperatures, loss of carbon dioxide (CO2) become faster and albumin
quality deteriorates faster, while eggs stored at ambient temperatures and humidity
lower than 70% lost 10–15 HU in few days from point of lay and at 35 days eggs lost up
to 30HU (Natalie 2009). Ihsan (2012) in his study reported that storage time
significantly affected albumin index. This report agree with findings of Scott and
Silversides (2000), who observed significant decrease from 9.16-4.75mm in albumin
height for stored eggs at 10 days. Storage time and temperature affect degree of egg
yolk mottling (Coutts and Wilson, 1990; Jacob et al., 2000). Jones (2006) stated that
when internal temperature of eggs increases above 7oC, protein structures of thick
albumen and vitelline membrane breakdown fast.
58
As vitelline membrane degenerates, water from albumen moves into yolk resulting in
enlarged and decreased viscosity and consequently gives yolk a flattened shape when
broken (Fromm and Matrone, 1962; Okoli and Udedibe, 2003; Jones, 2006,). The report
by Obanu and Mpieri (1984) and Stadelman and Coterill (1995) showed that yolk index,
an indicator of spherical nature of egg yolk, decreases as a result of progressive
weakening of vitelline membranes, reduction in total solid and liquefaction of yolk due
to osmotic diffusion of water from albumen during storage. Brake et al. (1997) reported
that yolk index of non-coated eggs decreased from an initial value of 0.45 to 0.25 and
0.16 after 2 and 4weeks of storage at 25 °C, respectively. In addition, Hidalgo et al.
(1996) observed decreased yolk index, increased water content, pH, furosine,
pyroglutamic acid and urdine as well as progressive transition of egg yolk rheological
properties from pseudo-plastic to Newtonian behaviour and decrease in apparent
viscosity of egg yolk during storage. However, storage of eggs at temperatures of 7–
13oC and humidity of 5 -60% reduced rate of degeneration of thick albumen proteins
and consequently maintained egg albumin quality for longer period (Jones, 2006). This
finding agreed with reports by Silversides and Scott (2001); Gavril and Usturoi (2012),
who observed that Haugh Units were not significantly affected when eggs were stored
for 3-14 days at 4ºC.
Oiling method of egg storage reduced CO2 losses and maintained internal egg quality
(Coutts and Wilson, 1990; Koelkebeck, 1999; Beyer, 2005) but was not a substitute for
cold storage (Jacob et al., 2000). Pasquoal et al. (2012) reported that increased storage
time, regardless of the temperature, caused loss in albumen quality. Refrigeration
method of egg storage did not significantly alter proximate composition in eggs (Ihisan,
2012). This finding was in consonance with the report by Dudusola (2009) on Japanese
quail eggs that control and refrigeration methods did not alter the proximate
composition significantly except for egg protein content. Some researchers
(Simopoulos, 2000; Kovács et al., 2000; Meluzzi et al., 2000; Gonzales-Esquerra and
Leeson, 2000; Kralik et al., 2006; Škrtić et al., 2007) have shown that fatty acid in eggs
can be modified through the use of plant and animal oil. Kovács et al. (2000) reported
that dietary supplementation with oil from linseed resulted increased α-linolenic acid
(LNA, C18:3n-3), while Meluzzi et al. (2000) reported increase in Eicosapentaenoic
59
(EPA, C20:5n-3) and Docosahexaenoic (DHA, C22:6n-3) acids with fish oil. These
were omega n-3 fatty acids and their content in egg reflected higher concentration of
low density lipoprotein (LDL).
Simopoulos (2000) reported that EPA and DHA were of higher biological value than
LNA in egg-yolk. Kralik et al. (2006) reported that replacement of one part of
sunflower oil in hens‟ diets with a combination of fish and rapeseed oil significantly
altered lipid profile in egg-yolk. In a study, Škrtićet al. (2007) observed that laying hens
fed mixture of rapeseed and fish oil supplemented diets produced egg-yolk that were
significantly higher in favorable fatty acids (linolenic, C18:3n-3; Eicosapentaenoic,
C20:5n-3 and Docosahexaenoic, C22:6n-3) compared with those fed sunflower oil
alone. The study showed higher content of yolk PUFA, n-3 PUFA and favorable ratio of
n-3 PUFA and n-6 PUFA. Meluzzi et al. (2000) stated that addition of 3% of fish oil in
hens‟ diets positively affected the content of EPA and DHA of egg-yolk Gonzales-
Esquerra and Leeson (2000) observed an increase in n-3 PUFA in the egg-yolk of hens
fed diet enriched with 6% fish oil. Galobart et al. (2002) reported a more favorable ratio
of SFA, MUFA and EPA plus DHA in egg-yolk of hens fed diets supplemented with
linseed oil compared with diets supplemented with sunflower oil.
Cherian (2007) reported 5.4% increase of total lipids in egg-yolk with addition of
yellow grease (3.0%) in diet compared with rations that contained 2.5%yellow grease
plus 0.25% conjugated linoleic acid and0.25% fish oil. Cashew nut meal impacted
significant influence on total lipid in egg-yolk (Vidal et al., 2013). Reduction in
Palmitic acid, PUFA and increase in the level of oleic acid (MUFA) were observed in
egg-yolk of hen fed cashew nut meal (Vidal et al., 2013). High level of MUFA is a
reflection of relatively lower level of LDL and higher level of high density lipoprotein
(HDL) (Lima, 2000). Filardi (2005) reported lower palmitic acid in egg-yolk of hens fed
diets containing canola oil compared with those fed diets containing cotton seed oil and
lard. These differences were attributed to the low palmitic acid in canola oil. Palmitic
acid increases serum total cholesterol and low density lipoproteins (Ponnampalam et al.,
2011). Milinsk (2003) fed five different diets to laying hens (four diets containing either
canola, linseed, soybean or sunflower meals and oils and a control diet containing
60
maize, soybean meal, and soybean oil) and observed decrease in palmitic and stearic
acid contents in e eggs compared with control diet.
Nam (1997) reported high MUFA/SFA ratio in yolks of hens fed linseed diet containing
animal fat. Grobas (2001) also observed increase in the level of fatty acids in yolks of
hens fed diets containing olive oil. Yolk cholesterol content was reduced when cashew
nut meal was added to layer‟s feed (Vidal et al., 2013). The reduction in cholesterol
content of egg-yolk was due to increase in oleic acid found in the diets and MUFA
cause reduction in cholesterol levels during lipid metabolism in birds. Freitas (2000)
also reported reduction in cholesterol content of abdominal fat of broiler chickens fed
diets containing cashew nut meal. Dietary supplementation of fish oil rich in n-3 PUFA
reduced triacylglycerol and cholesterol level in egg and meat products of chickens
(Ruxton et al., 2007). The addition of PUFA-rich oils in diet reduced blood and egg
cholesterol (Holland et al., 1980) however, other studies (Santos, 1998; Brandão, 2005)
showed that yolk cholesterol cannot be changed because it is independent of dietary
factors. Studies on dietary manipulation to influence egg cholesterol content have
reported conflicting results since some authors claimed reduction in blood and yolk
cholesterol with diet enriched with polyunsaturated fatty acids (Mori et al., 1999) and
others did not observe any effect (Grobas et al., 1997; Santos, 1998).
Grobas et al. (1997) did not observe any differences in egg cholesterol compared with
wheat and soybean-based diet without fat supplementation (control) and 7.5%
supplemental tallow, olive oil, soybean oil, rapeseed oil or fish oil. Santos (1998) also
found no effect on egg-yolk cholesterol when diet containing soybean (2 and 4%),
canola (2 and 4%), or polyunsaturated marine (0.1 and 0.2%) were fed to commercial
layers. The amount of cholesterol ingested did not automatically increase blood and egg
cholesterol (Brandão, 2005). Chickens are capable of producing 10 times more
cholesterol per kg of liver than humans. Therefore, manipulating layer diets to reduce
egg cholesterol levels may not be effective because chickens maintain egg cholesterol
levels essential for egg composition and embryo development (Shafey and Cham,
1994). However, hens change egg-yolk polyunsaturated fatty acid content in response to
61
dietary lipid source through absorption of dietary fat in portal system as portomicrons
into blood and transport them into liver for lipogenesis (Van-Elswyk et al., 1994).
2.21: Lipid oxidation and biological implications in animals and products
Lipids are diverse group of naturally occurring organic compounds classified based on
solubility in non-polar organic solvents such as ether, chloroform, acetone, benzene, and
are general insolubility in water. Lipid include fats, waxes, sterols, fat soluble vitamins
(such as vitamins A, D, E, and K), mono-glycerides, di-glycerides, triglycerides,
phospholipids among others. The main biological functions of lipids include storing
energy, signalling, and acting as structural components of cell membranes (Fahy et al.,
2009). Lipids have applications in cosmetic and food industries as well as nano-
technology (Mashaghiet al., 2013). The different lipid include: fatty acids,
glycerolipids, glycerophosphholipids, sphingolipids, saccharolipid, polyketides (derived
from condensation of ketoacyl subunits), sterol lipids and prenol lipids (derived from
condensation of isoprene subunits) (Fahy et al., 2009. Lipid oxidation is considered as a
main molecular mechanism involved in oxidative damage to cell structures and toxicity
process leading to cell death. It is oxidative degradation of lipids. Free radicals and
variety of metabolites like alcohols, ketones, alkanes, aldehydes and ethers are formed
in cells to destroy membrane lipids (Dianzani and Barrera, 2008).
This process is preceded by free radical chain reaction mechanism. It affects
polyunsaturated fatty acids because they contain multiple double bonds in between
which lie methylene bridges (-CH2-) that possess especially reactive hydrogen. The
reaction consists of three major steps: initiation, propagation, and termination. During
initiation, fatty acid radical is produced and involves hydrogen abstraction or addition of
oxygen radical resulting in oxidative damage of polyunsaturated fatty acids (PUFA).
The most notable initiators in living cells are reactive oxygen species (ROS) such as OH
and HO2, which combines with hydrogen atom to produce water and fatty acid radical
(www.lipis.com/2014). The fatty acid radical is not a stable molecule, so it reacts
readily with molecular oxygen, thereby creating a peroxyl-fatty acid radical.The
formation of peroxyl radicals leads to production of organic hydroperoxides, which in
turn subtract hydrogen from another PUFA. This reaction is termed propagation which
62
implies that one initiating reaction result in conversion of numerous PUFA to lipid
(www.lipids.com/2014). The radical reaction stops when two radicals react produce
non-radical species.
This happens only when concentration of radical species is high enough for high
probability of collision of two radicals. Living organisms have different molecules that
speed up termination by catching free radicals and therefore, protecting cell membrane.
An important antioxidant is Vitamin E. Other anti-oxidants within the body include
superoxide dismutase, catalase and peroxide. As a result of lipid peroxidation, great
varieties of aldehydes like hexanal, malondialdehyde (MDA) and 4- hydroxyl-nonenal
are produced (Catala, 2006). Production of reactive oxygen species primarily
superoxide anion (O2-) and hydrogen peroxide (H2O2) are capable of damaging
molecules of biochemical classes including nucleic acids and amino acids as well as cell
membrane. The exposure of reactive oxygen to proteins produces denaturation, loss of
function, cross-linking, aggregation and fragmentation of connective tissues as collagen
(Chance et al., 1979). Toxicity from lipid peroxidation affects liver lipid metabolism
where cytochrome P-450 is an efficient catalyst in oxidative transformation of lipid
derived aldehydes to carboxylic acids.
The toxicity of lipid peroxidation products in mammals generally involves
neurotoxicity, hepatotoxicity and nephrotoxicity (Boveris and Navarro, 2008).Lipid
peroxidation has a role in pathogenesis of several pathologies as neurodegenerative
(Dominguez et al., 2008); inflammatory (Farooqui and Farooqui, 2011); infectious
gastric and nutritional diseases (Repetto et al., 2010). Oxidised lipids have a signalling
function in pathological situations which are pro-inflammatory agonists and contribute
to neuronal death under conditions in which membrane lipid peroxidation occurs. The
end-products of lipid peroxidation may becomen mutagenic and carcinogenic (Marnett,
1999). The degree of lipid oxidation is measured by several products of the damage
such as Malondialdehyde/Thiobarbituric Acid Reactive Substances (TBARS) (Pryo,
1991). Malondialdehyde is one of several low-molecular-weight end products formed
via decomposition of certain primary and secondary lipid oxidation products but not a
substance generated exclusively through lipid oxidation. The more utilized
63
determination of lipid oxidation product is MDA which is determined with great
efficiency by simple and useful assay of Thiobarbituric Acid Reactive Substances
(TBARS). The degree of oxidation is indicated by level of end product ofof lipid
oxidation. As these products increases the level of damage also increases
(www.TBARS.com/2014).
2.22: Effect of dietary vitamins and minerals on lipid oxidation
Poultry diets are supplemented with vegetable oils to increase energy density and
concentrations of polyunsaturated fatty acids particularly n-3 PUFAs in final product
(Grashorn, 2005; Bou et al., 2006). Numerous experiments have shown that increased
PUFA concentrations in eggs enhance lipid oxidation (Grashorn, 2005; Mohiti-Asli et
al. 2008). Therefore, PUFA-rich poultry diets should contain increased levels of
antioxidants. Vitamins and mineral serve as antioxidants when oils are added to poultry
diet. Vitamin C and E are primary antioxidants in biological systems and break chain of
lipid oxidation in cells. Kucuk et al. (2003) reported that vitamin E and C improved
overall egg quality traits, reduced serum cholesterol and triglyceride, increased serum
calcium and phosphorus and reduced serum malondialdehyde (MDA) concentrations in
laying hens. The antioxidant effect of these vitamins increased when in combined sup-
plementation (Kucuk et al., 2003). Morrissey et al. (1997) reported that dietary
supplementation of α-tocopherol in chicken diets increased tissues α-tocopherol
concentrations, while it markedly decreased MDA concentration.
Vitamin E, natural antioxidant in biological systems, functions as free radical scavenger
and inhibits lipid oxidation within membranes (McDowell, 1989; Halliwell and
Gutteridge, 1989). Vitamin C and E act synergistically such that vitamin E functions
mainly as chain-breaking antioxidant in lipid phases at cellular membrane, while
vitamin C serve as terminal reductant by oxidizing free radical chain reactions in
aqueous compartments (Tappel, 1968; Gey, 1998). Dietary α-tocopheryl acetate
supplementation has been shown to protect fatty acids (Botsoglou et al., 2005; Bou et
al., 2006) and cholesterol (Grau et al., 2001; Galobart et al., 2002) from oxidation in
eggs. Hens fed dietary supplements of α-tocopherol recorded reduced primary and
secondary oxidation compounds in fresh and spray-dried eggs (Galobart et al., 2001).
64
Also, raw and cooked dark meat from chickens fed longer periods of supplementation of
α-tocopherol showed decreased lipid hydro peroxides and lower TBARS values (Bou et
al., 2006). Research reoports by Zduńczyk et al. (2011) showed that eg-yolk laid by
hens fed diets with increased levels of selenium had higher n-3 PUFA content, a lower
n-6 PUFA content and a lower n-6/n-3 fatty acid ratio, while vitamin E had no
influence.
Meluzzi et al. (2000) found that different doses of dietary vitamin E (0, 50, 100 and 200
mg/kg) slightly affected fatty acid composition of yolk whereas Cherian et al. (1996)
reported a significant increase in egg-yolk content of C20:5n-3 and C22:6n-3 in with
dietary tocopherols. This was attributed to beneficial effect of tocopherols on n-3 fatty
acid synthesis via denaturation of n-6 PUFA. Carrillo-Domínguezet al. (2012) recorded
higher contents of Eicosapentaenoic (C20:5 EPA n-3) and Docosapentaenoic (C22:5
DPA n-3) with 100 mg/kg vitamin E and lower content of palmitic acid (C16:0),
palmitoleic (C16:1), n-6 fatty acid (C18:2 and C20:4) and n-3 fatty acid (C18:3, C20:5,
C22:5, C22:6) with 200mg/kg of vitamin E in egg of hens fed diets supplemented with
sardine oil. The report by Cherian et al. (1996) indicated that diets containing 3.5% Fish
oil and 367 to 423 μg/g vitamin E did not affect fatty acid composition in eggs. Qi and
Sim (1998) discovered no effect on fatty acid content of eggs when high concentrations
of vitamin E (200, 400, and 800 mg/kg) were supplemented with 15% linseed oil +
0.5% Fish oil. There was no effect on fatty acid composition of eggs when 50 or 100
mg/kg of Vitamin E was supplemented with 3% fish oil (Meluzzi et al., 2000).
Cortinas et al. (2004) and Zduńczyk et al. (2011) found no influence of vitamin E on
fatty acid profile of broiler meat. There are empirical evidences (Gutteridge, 1995;
Meluzzi et al., 2000; Leeson and Summers, 2001; Surai, 2003, Mabe et al., 2003;
Franco and Sakamoto, 2005; Fernandez et al,. 2011) to confirm that vitamins and
minerals function primarily as antioxidants in stabilizing lipid component by reducing
lipid oxidation and increase shelf-life rather than altering lipid profile in biological
systems. Vargas and Naber (1984) correlated yolk cholesterol content with dietary
energy balance and reported that excessive energy intake beyond maintenance and
production requirements increased body weight and cholesterol synthesis. Therefore,
65
excessive cholesterol in blood would be transferred into egg-yolk. Hassan et al.(2013)
reported insignificant decreased in saturated fatty acid and increase of unsaturated fatty
acid in eg-yolk with increasing levels of ME (2750 kcal/kg) and decreasing level of CP
(17%). Thus, as dietary energy levels increase to 2800 kcal/kg ME while protein
dropped to 16%, egg-yolk UFA/SFA and n-6/n-3 ratio linearly increase and no effect
found on yolk PUFA and MUFA.
Quirino et al., (2009) reported that energy had no effect on yolk cholesterol and fatty
acid profile. Mohammed et al. (2013) reported reduction in plasma and yolk cholesterol
and triglyceride when 3% and 6% of brown marine algae (Sargasum dentifebium)
supplemented diet was fed to layers. The reduction was attributed to effect of high fibre
content in algae. Furthermore, algae supplementation in human and animal diets
significantly improved lipid profile. Since nutrition, vaccination, hygiene and other
management practices affect lipid profile in eggs, management system could be
manipulated for production of good egg quality and enhancement of eggs shelf-life.
66
CHAPTER THREE
3.0: MATERIALS AND METHODS
Study One
Effects of two housng systems on performance characteristics of growing pullets
from 13 to 16 weeks of age
3.1.1: Experimental Site
The experiment was carried out at the Rearing Unit of OOA Farms, Idi Osan, Balogun
Village, Ibadan, in the tropical rainforest of Nigeria on latitude 7o 39" N and longitude
3o 89"W at altitude above 255 m above sea levels with mean minimum and maximum
temperature of 24oC and 35
oC, respectively and average relative humidity of 53%
(2012-2017-www.latlog.net)
3.1.2: Housing systems
A conventional 3-tier battery cage (BC) was used for the study. The BC was placed
inside a standard laying housing unit built with 3 to 4 cemented blocks from the
foundation. Perimeter of the BC housing unit was covered with steel wire mesh and
supported by steel and wood poles to allow cross ventilation. The floor was cemented
with a deep bathe below the BC for collection of faecal deoppings and asbestors roofing
sheet. The housing unit was not provided with light at night during the period of the
study. The BC was partitioned into individual cage that measured 50 x 45 x 40 cm3 with
a floor space of 450cm2/ bird. Each cage accommodated four pullets. A standard open-
sided deep litter (DL) system was used for the study. The DL housing unit was
constructed with 3 or 4 cemented blocks from foundation. Perimeter of the DL housing
unit was covered with steel wire mesh and supported by steel and wood poles to allow
cross ventilation were the two housing types. The DL was partitioned into 36 smaller
cubicles using steel wire mesh and wooden poles with a door and floor space of 450
cm2/ bird. Each cubicle accommodated eight pullets.
67
3.1.3: Animals and Management
Bovan Nera pullets (n=576) at week 13 (point-of-cage) weighing 1.06±0.01-
1.08±0.03kg/bird purchased from a reputable poultry farm with proven track records of
vaccination and medication schedules in Ibadan were used for the study. They were
randomly allocated into two equal parts of 288 pullets and housed in BC and DL
systems. Each housing type had six tretments and a treatment was replicated six times.
Each replicate comprised 8 pullets both in the BC and DL systems. Birds in BC and DL
were provided feed manually three times daily in the morning (7.00-8.00 hrs), noon
(12.00-13.00 hrs) and evening (16.00-17.00 hrs). In the BC, birds were provided fresh
drinking water through automatic water pipe with nipples while in the DL, water bowls
with iron gaurds were used. Feed were provided in the feed through in front of the cage
while steel hyanging feeders were used in the DL housing unit. Pullets in BC and DL
systems were offered experimental diet and fresh clean water ad libitum throughout the
course of study which lasted 21 days.
3.1.4: Gross composition of experimental diet
The gross composition of experimental diet fed from weeks 13 to 16 is shown in Table
1.
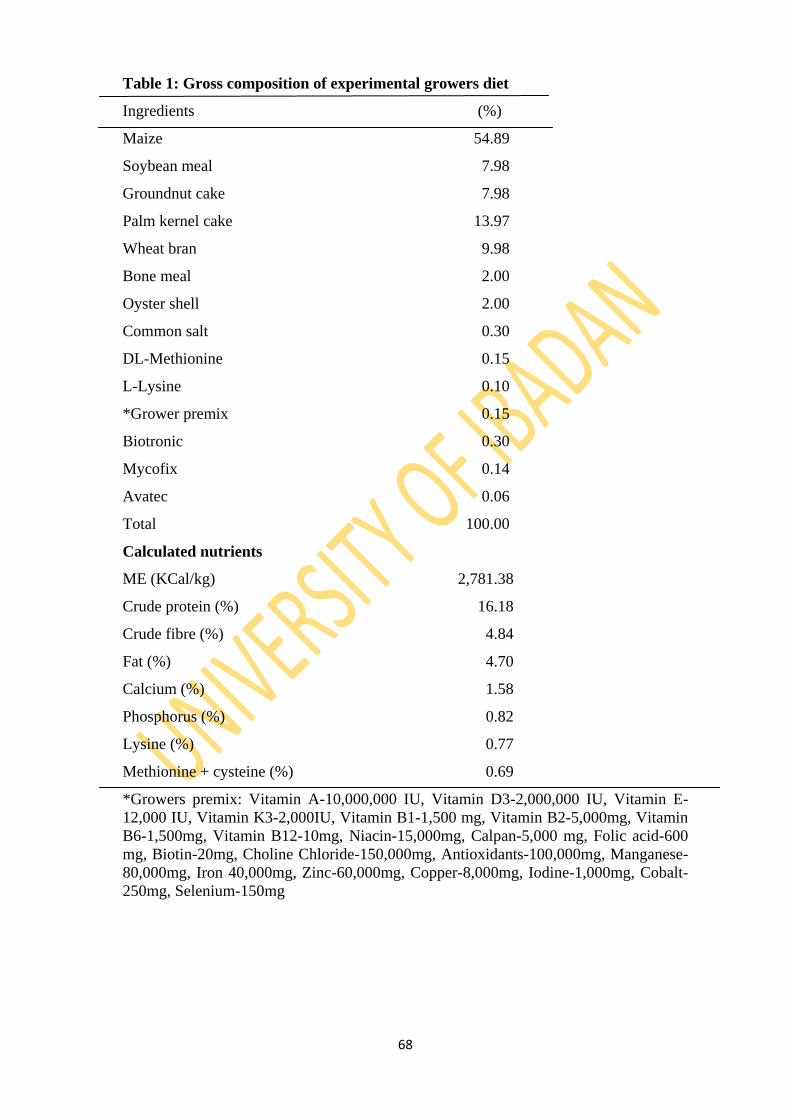
68
Table 1: Gross composition of experimental growers diet
Ingredients (%)
Maize 54.89
Soybean meal 7.98
Groundnut cake 7.98
Palm kernel cake 13.97
Wheat bran 9.98
Bone meal 2.00
Oyster shell 2.00
Common salt 0.30
DL-Methionine 0.15
L-Lysine 0.10
*Grower premix 0.15
Biotronic 0.30
Mycofix 0.14
Avatec 0.06
Total 100.00
Calculated nutrients
ME (KCal/kg) 2,781.38
Crude protein (%) 16.18
Crude fibre (%) 4.84
Fat (%) 4.70
Calcium (%) 1.58
Phosphorus (%) 0.82
Lysine (%) 0.77
Methionine + cysteine (%) 0.69
*Growers premix: Vitamin A-10,000,000 IU, Vitamin D3-2,000,000 IU, Vitamin E-
12,000 IU, Vitamin K3-2,000IU, Vitamin B1-1,500 mg, Vitamin B2-5,000mg, Vitamin
B6-1,500mg, Vitamin B12-10mg, Niacin-15,000mg, Calpan-5,000 mg, Folic acid-600
mg, Biotin-20mg, Choline Chloride-150,000mg, Antioxidants-100,000mg, Manganese-
80,000mg, Iron 40,000mg, Zinc-60,000mg, Copper-8,000mg, Iodine-1,000mg, Cobalt-
250mg, Selenium-150mg
69
3.1.5: Data collection
Feed consumption per replicate was obtained by subtracting the leftover from the
quantity of feed offered to the birds on weekly basis. Total feed intake per bird was
determined by dividing the total feed intake per replicate by number of birds while the
daily feed intake per bird was obtained by dividing by seven. Pullets in each replicate
were weighed individually and the mean live weights of pullets in each replicate were
used to determine live weight changes. Live weight changes were determined by
subtracting initial from the final live weight. Feed conversion ratio was obtained by
dividing feed intake (kg) by the live weight gain (kg). Feed cost per gain was obtained
by dividing the amount of feed consumed by live weight gain. The number of deadbirds
was expressed as percentage mortality.
3.1.6: Statistical analysis
Data were subjected to descriptive statistics and t-test at α0.05 and means separated by
LSD procedure of SAS (2012)
70
Study Two
Effects of five different proprietary vitamin-mineral premixes and two housing
systems on performance and egg production characteristics of pullets from 17 to
21 weeks of age
3.2.1: Experimental site
As described in 3.1.1.
3.2.2: Housing systems
As described in 3.1.2
3.2.3: Experimental design and model
The experimental birds were randomly allocated to two HS (BC and DL systems) and
six treatments in acompletely randomised design of 2 x 6 factorial arrangements.The
experimental model is given below.
Xijk = μ + "i + $j + "$ij + eijk
Where: Xijk = the observed values of each of the response variables
μ = the overall population mean
"i = Observed effect of the ith
dietary treatment
$j = Effect of the jth
week of performance characteristics
"$ij = Effect of the interaction between dietary treatments and time in weeks
eijk = Random residual error due to the experimentation
3.2.4: Animals and nanagement
Bovan Nera pullets (n=576) at point-of-lay (16 weeks of age) from study one in BC and
DL systems were used for this study. Management was as described in 3.1.3 above and
study lasted 35 days.
3.2.5: Test proprietary vitamin-mineral premixes
Five commonly used brands of proprietary growers vitamin-mineral premixes in poultry
tolls feed milling in Ibadan were sampled for investigation. The test proprietary
vitamin-mineral premixes (PVmP) were Nutripoult, Hi-Nutrient, Agrited, Daram vita-
mix and Micro-mix which were designated as premix K, L, M, N and P, respectively.
The gross compositions of the test vitamin-mineral premixes as shown on their
respective labels are shown in Table 2
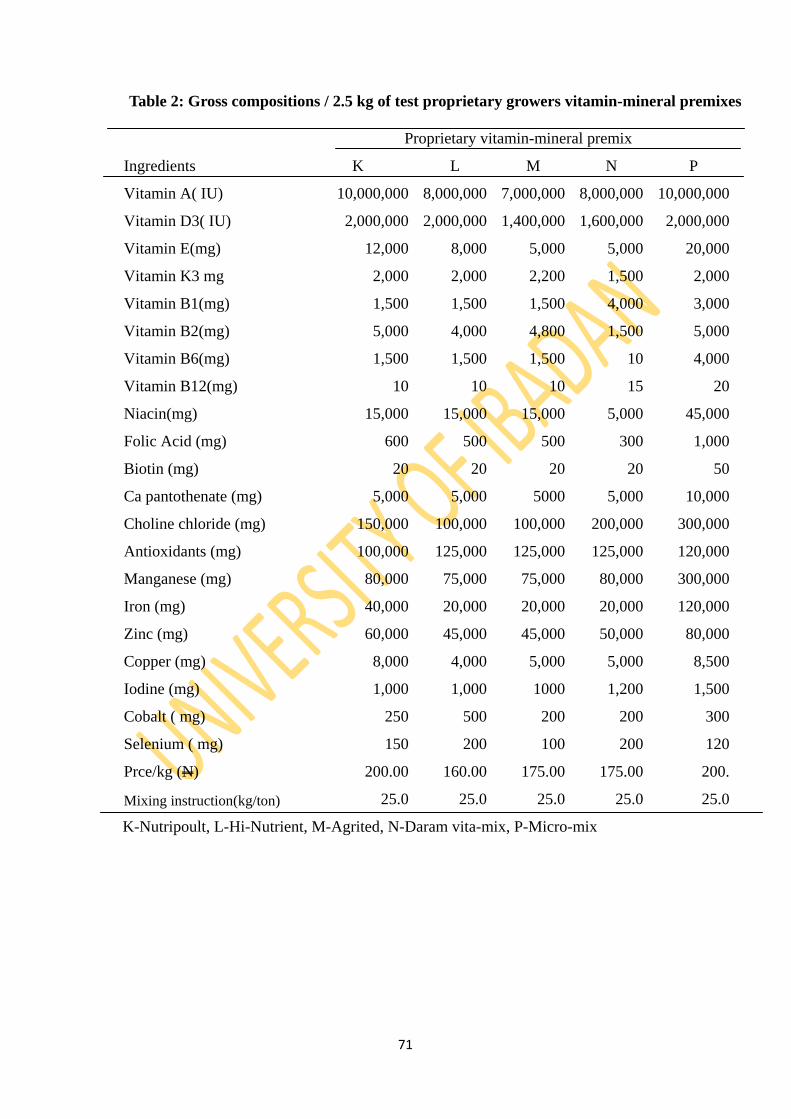
71
Proprietary vitamin-mineral premix
Ingredients K L M N P
Vitamin A( IU) 10,000,000 8,000,000 7,000,000 8,000,000 10,000,000
Vitamin D3( IU) 2,000,000 2,000,000 1,400,000 1,600,000 2,000,000
Vitamin E(mg) 12,000 8,000 5,000 5,000 20,000
Vitamin K3 mg 2,000 2,000 2,200 1,500 2,000
Vitamin B1(mg) 1,500 1,500 1,500 4,000 3,000
Vitamin B2(mg) 5,000 4,000 4,800 1,500 5,000
Vitamin B6(mg) 1,500 1,500 1,500 10 4,000
Vitamin B12(mg) 10 10 10 15 20
Niacin(mg) 15,000 15,000 15,000 5,000 45,000
Folic Acid (mg) 600 500 500 300 1,000
Biotin (mg) 20 20 20 20 50
Ca pantothenate (mg) 5,000 5,000 5000 5,000 10,000
Choline chloride (mg) 150,000 100,000 100,000 200,000 300,000
Antioxidants (mg) 100,000 125,000 125,000 125,000 120,000
Manganese (mg) 80,000 75,000 75,000 80,000 300,000
Iron (mg) 40,000 20,000 20,000 20,000 120,000
Zinc (mg) 60,000 45,000 45,000 50,000 80,000
Copper (mg) 8,000 4,000 5,000 5,000 8,500
Iodine (mg) 1,000 1,000 1000 1,200 1,500
Cobalt ( mg) 250 500 200 200 300
Selenium ( mg) 150 200 100 200 120
Prce/kg (N) 200.00 160.00 175.00 175.00 200.
Mixing instruction(kg/ton) 25.0 25.0 25.0 25.0 25.0
K-Nutripoult, L-Hi-Nutrient, M-Agrited, N-Daram vita-mix, P-Micro-mix
Table 2: Gross compositions / 2.5 kg of test proprietary growers vitamin-mineral premixes
72
3.2.6: Dietary layout
The dietary layout is schematically shown as follows;
D1 - Diet without premix
D2 - Diet with 0.25% Premix K
D3 - Diet with 0.25% Premix L
D4 - Diet with 0.25% Premix M
D5 - Diet with 0.25% Premix N
D6 - Diet with 0.25% Premix P
3.2.7: Experimental diets
A basal diet was formulated without any PVmPwhich served control diet (D1). Five
other diets were each supplemented with 0.25% of premixesK, L, M, N and P to
obtaindiets D2, D3, D4, D5 and D6, respectively. The experimental diets were fed from
weeks 17 to 21. The gross compositions of experimental diets are shown in Table 3.
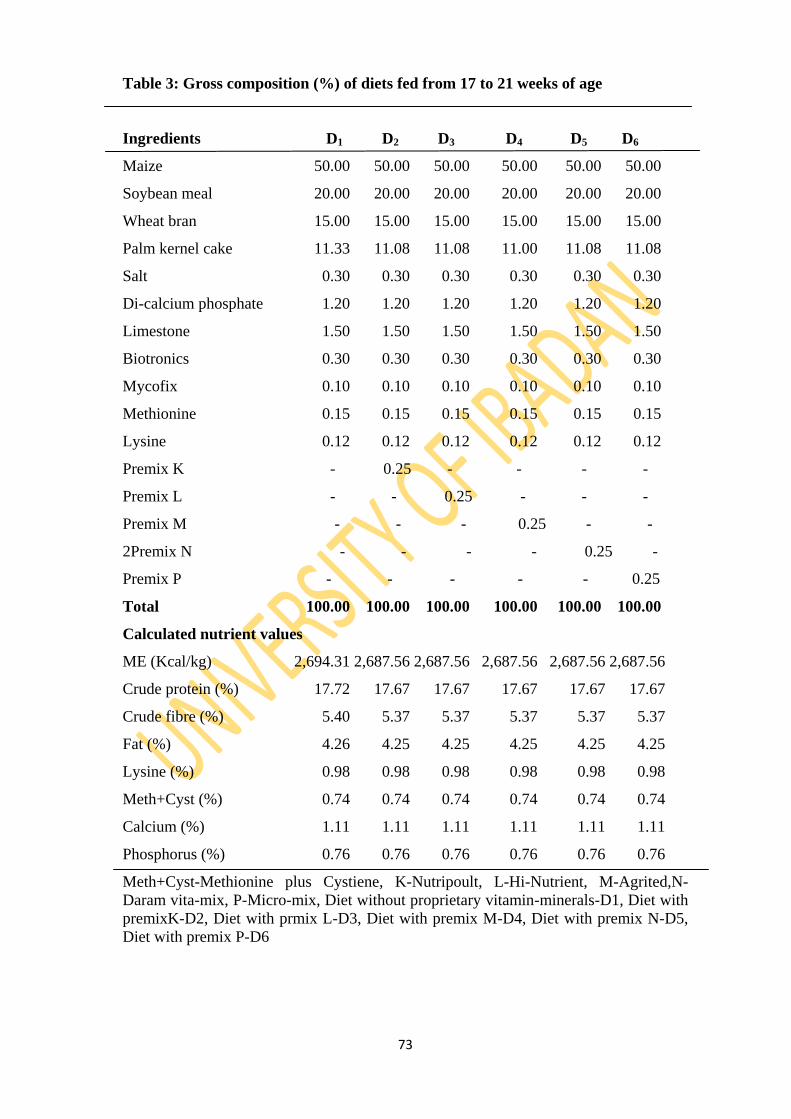
73
Table 3: Gross composition (%) of diets fed from 17 to 21 weeks of age
Ingredients D1 D2 D3 D4 D5 D6
Maize 50.00 50.00 50.00 50.00 50.00 50.00
Soybean meal 20.00 20.00 20.00 20.00 20.00 20.00
Wheat bran 15.00 15.00 15.00 15.00 15.00 15.00
Palm kernel cake 11.33 11.08 11.08 11.00 11.08 11.08
Salt 0.30 0.30 0.30 0.30 0.30 0.30
Di-calcium phosphate 1.20 1.20 1.20 1.20 1.20 1.20
Limestone 1.50 1.50 1.50 1.50 1.50 1.50
Biotronics 0.30 0.30 0.30 0.30 0.30 0.30
Mycofix 0.10 0.10 0.10 0.10 0.10 0.10
Methionine 0.15 0.15 0.15 0.15 0.15 0.15
Lysine 0.12 0.12 0.12 0.12 0.12 0.12
Premix K - 0.25 - - - -
Premix L - - 0.25 - - -
Premix M - - - 0.25 - -
2Premix N - - - - 0.25 -
Premix P - - - - - 0.25
Total 100.00 100.00 100.00 100.00 100.00 100.00
Calculated nutrient values
ME (Kcal/kg) 2,694.31 2,687.56 2,687.56 2,687.56 2,687.56 2,687.56
Crude protein (%) 17.72 17.67 17.67 17.67 17.67 17.67
Crude fibre (%) 5.40 5.37 5.37 5.37 5.37 5.37
Fat (%) 4.26 4.25 4.25 4.25 4.25 4.25
Lysine (%) 0.98 0.98 0.98 0.98 0.98 0.98
Meth+Cyst (%) 0.74 0.74 0.74 0.74 0.74 0.74
Calcium (%) 1.11 1.11 1.11 1.11 1.11 1.11
Phosphorus (%) 0.76 0.76 0.76 0.76 0.76 0.76
Meth+Cyst-Methionine plus Cystiene, K-Nutripoult, L-Hi-Nutrient, M-Agrited,N-
Daram vita-mix, P-Micro-mix, Diet without proprietary vitamin-minerals-D1, Diet with
premixK-D2, Diet with prmix L-D3, Diet with premix M-D4, Diet with premix N-D5,
Diet with premix P-D6
74
3.2.8: Data collection
Feed consumptions per replicates were obtained by subtracting leftover from the
quantities of feed offered to birds on weekly basis. Total feed intake per bird was
determined by dividing total feed intake per replicate by number of birds while daily
feed intake per bird was obtained by dividing by seven. Pullets in each replicate were
weighed individually and mean live weights of pullets in each replicate were used to
determine live weight changes. Live weight changes were determined by subtracting
initial from final live weight. Feed conversion ratio was obtained by dividing feed
intake (kg) by the weight gain (kg). Feed cost per gain was obtained by dividing the
amount of feed consumed by body weight gain. The number of birds dead was
expressed to percentage. The number and weight of eggs produced per replicate,
treatment and housing system were recorded on daily basis. The Hen Day Egg
Production (HDEP) was determined as follows:
Hen Day Egg Production (HDEP) = Total number of eggs produced per week
Total number of hen-day per week
Eggs were weighed using an electronic top loading scale (JS-B LCD® Display
Scale).Egg mass was calculated by first determining the average weight of
representative samples of eggs produced and then using mathematical relation as
shown;
Average egg mass (g/hen/day) = Per cent HDEP X Average egg weight in grams
Feed conversion ratio per egg mass (FCR/EM) was determined by taking into
consideration feed intake, egg weight and egg production and calculated as a ratio
between the feed consumed and the egg mass thus;
FCR/EM = Feed consumed
HDEP x Average egg weight
3.2.9: Statistical analysis
Data were analysed using descriptive statistics and GLM procedure of analysis of
variance (ANOVA) at α 0.05 (SAS, 2012). Means were separated using LSD option of
the same software.
75
Study Three
Effects of five different proprietary vitamin-mineral premixes and two housing
systems on performance and hen day egg production of laying chickens (22 to 70
weeks of age)
3.3.1: Experimental site
As described in 3.1.1.
3.3.2: Housing systems
As described in 3.1.2.
3.3.3: Experimental design and model
As described in 3.2.4 above.
3.3.4: Animals and management
Bovan Nera pullets (n=571) at early-lay (22 weeks of age) from study two in BC and
DL systems were used for this study. Management was as described in 3.1.3 above and
the study lasted 43 days.
3.3.5: Test proprietary vitamin-mineral premixes
Fivecommonly used brands of proprietary layers vitamin-mineral premixes inpoultry
tolls feed milling in Ibadan were sampled for investigation. The test PVmP
wereNutripoult, Hi-Nutrient, Agrited, Daram vita-mix and Micro-mix which were
designated as premix K, L, M, N and P, respectively. The gross compositions of the test
PVmP as shown on their respective labels are in Table 4.
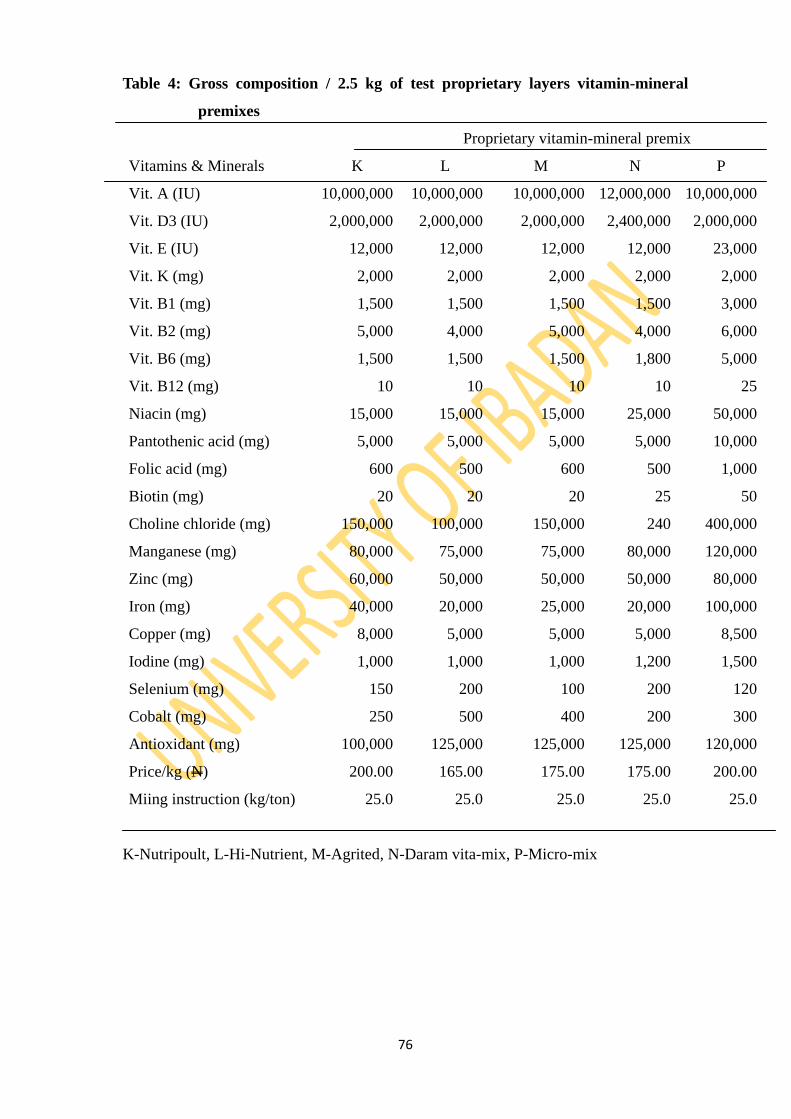
76
Table 4: Gross composition / 2.5 kg of test proprietary layers vitamin-mineral
premixes
Proprietary vitamin-mineral premix
Vitamins & Minerals K L M N P
Vit. A (IU) 10,000,000 10,000,000 10,000,000 12,000,000 10,000,000
Vit. D3 (IU) 2,000,000 2,000,000 2,000,000 2,400,000 2,000,000
Vit. E (IU) 12,000 12,000 12,000 12,000 23,000
Vit. K (mg) 2,000 2,000 2,000 2,000 2,000
Vit. B1 (mg) 1,500 1,500 1,500 1,500 3,000
Vit. B2 (mg) 5,000 4,000 5,000 4,000 6,000
Vit. B6 (mg) 1,500 1,500 1,500 1,800 5,000
Vit. B12 (mg) 10 10 10 10 25
Niacin (mg) 15,000 15,000 15,000 25,000 50,000
Pantothenic acid (mg) 5,000 5,000 5,000 5,000 10,000
Folic acid (mg) 600 500 600 500 1,000
Biotin (mg) 20 20 20 25 50
Choline chloride (mg) 150,000 100,000 150,000 240 400,000
Manganese (mg) 80,000 75,000 75,000 80,000 120,000
Zinc (mg) 60,000 50,000 50,000 50,000 80,000
Iron (mg) 40,000 20,000 25,000 20,000 100,000
Copper (mg) 8,000 5,000 5,000 5,000 8,500
Iodine (mg) 1,000 1,000 1,000 1,200 1,500
Selenium (mg) 150 200 100 200 120
Cobalt (mg) 250 500 400 200 300
Antioxidant (mg) 100,000 125,000 125,000 125,000 120,000
Price/kg (N) 200.00 165.00 175.00 175.00 200.00
Miing instruction (kg/ton) 25.0 25.0 25.0 25.0 25.0
K-Nutripoult, L-Hi-Nutrient, M-Agrited, N-Daram vita-mix, P-Micro-mix
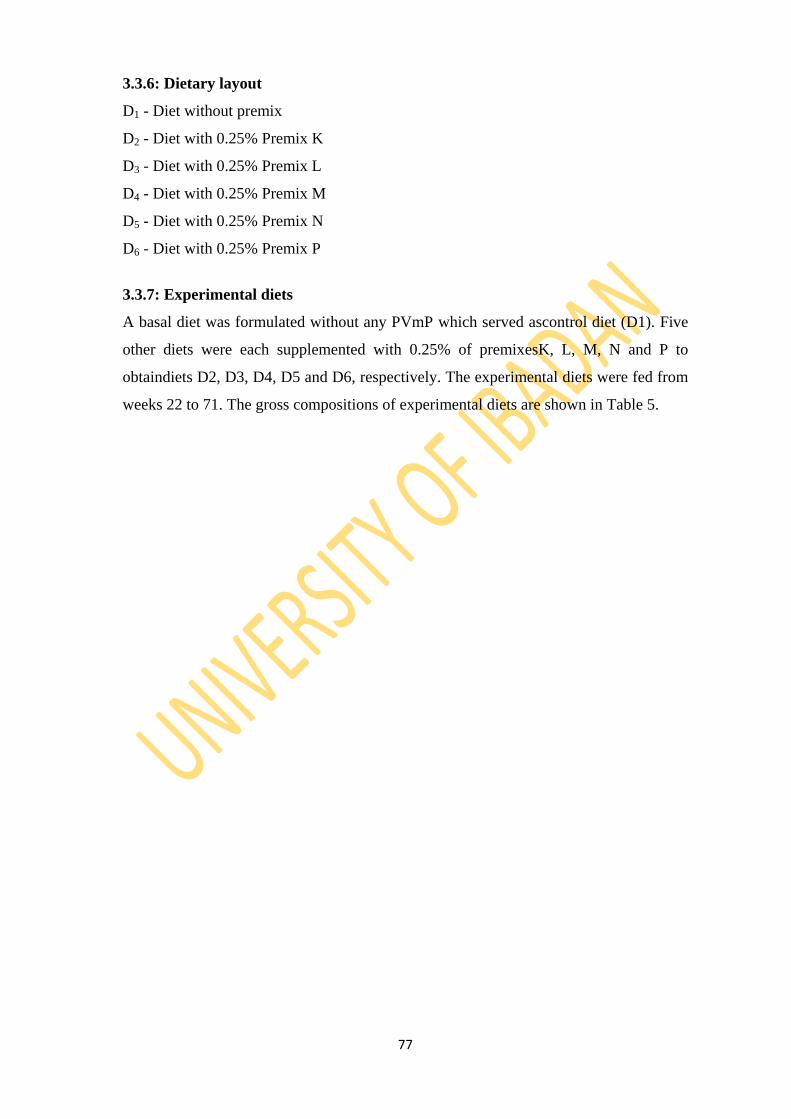
77
3.3.6: Dietary layout
D1 - Diet without premix
D2 - Diet with 0.25% Premix K
D3 - Diet with 0.25% Premix L
D4 - Diet with 0.25% Premix M
D5 - Diet with 0.25% Premix N
D6 - Diet with 0.25% Premix P
3.3.7: Experimental diets
A basal diet was formulated without any PVmP which served ascontrol diet (D1). Five
other diets were each supplemented with 0.25% of premixesK, L, M, N and P to
obtaindiets D2, D3, D4, D5 and D6, respectively. The experimental diets were fed from
weeks 22 to 71. The gross compositions of experimental diets are shown in Table 5.
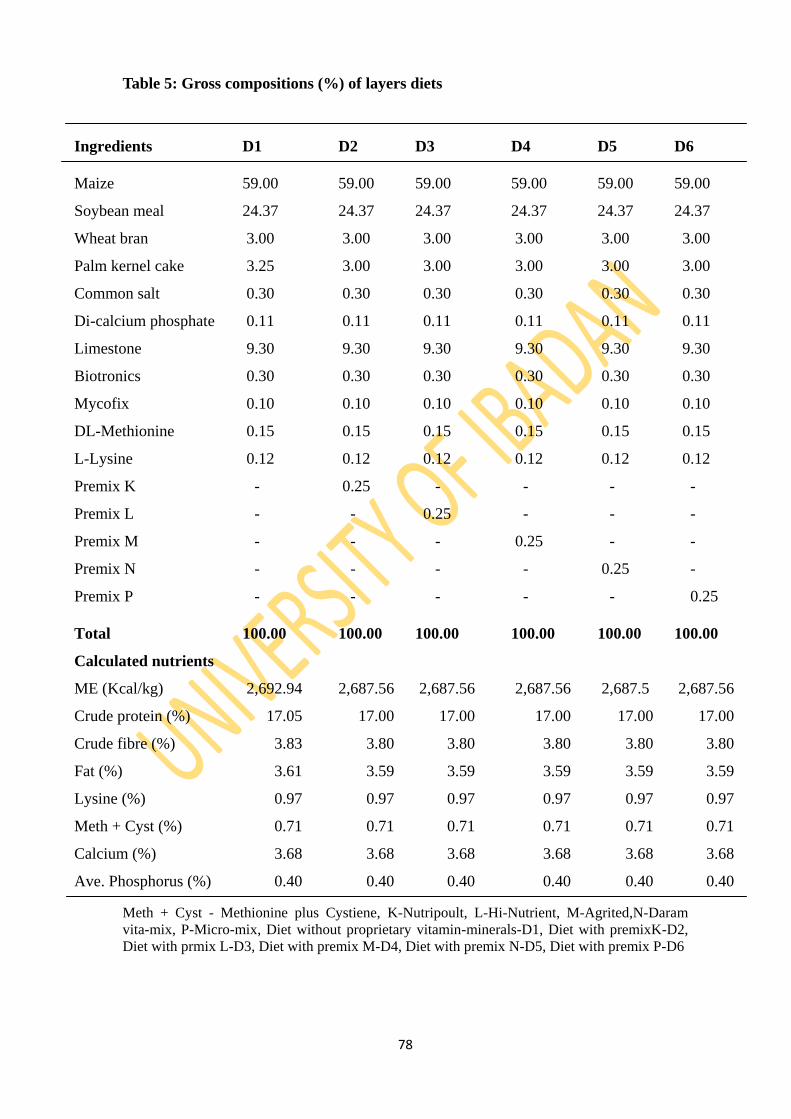
78
Table 5: Gross compositions (%) of layers diets
Meth + Cyst - Methionine plus Cystiene, K-Nutripoult, L-Hi-Nutrient, M-Agrited,N-Daram
vita-mix, P-Micro-mix, Diet without proprietary vitamin-minerals-D1, Diet with premixK-D2,
Diet with prmix L-D3, Diet with premix M-D4, Diet with premix N-D5, Diet with premix P-D6
Ingredients
D1
D2
D3
D4
D5
D6
Maize
Soybean meal
Wheat bran
Palm kernel cake
Common salt
Di-calcium phosphate
Limestone
Biotronics
Mycofix
DL-Methionine
L-Lysine
Premix K
Premix L
Premix M
Premix N
Premix P
59.00
24.37
3.00
3.25
0.30
0.11
9.30
0.30
0.10
0.15
0.12
-
-
-
-
-
59.00
24.37
3.00
3.00
0.30
0.11
9.30
0.30
0.10
0.15
0.12
0.25
-
-
-
-
59.00
24.37
3.00
3.00
0.30
0.11
9.30
0.30
0.10
0.15
0.12
-
0.25
-
-
-
59.00
24.37
3.00
3.00
0.30
0.11
9.30
0.30
0.10
0.15
0.12
-
-
0.25
-
-
59.00
24.37
3.00
3.00
0.30
0.11
9.30
0.30
0.10
0.15
0.12
-
-
-
0.25
-
59.00
24.37
3.00
3.00
0.30
0.11
9.30
0.30
0.10
0.15
0.12
-
-
-
-
0.25
Total
Calculated nutrients
ME (Kcal/kg)
Crude protein (%)
Crude fibre (%)
Fat (%)
Lysine (%)
Meth + Cyst (%)
Calcium (%)
Ave. Phosphorus (%)
100.00
2,692.94
17.05
3.83
3.61
0.97
0.71
3.68
0.40
100.00
2,687.56
17.00
3.80
3.59
0.97
0.71
3.68
0.40
100.00
2,687.56
17.00
3.80
3.59
0.97
0.71
3.68
0.40
100.00
2,687.56
17.00
3.80
3.59
0.97
0.71
3.68
0.40
100.00
2,687.5
17.00
3.80
3.59
0.97
0.71
3.68
0.40
100.00
2,687.56
17.00
3.80
3.59
0.97
0.71
3.68
0.40
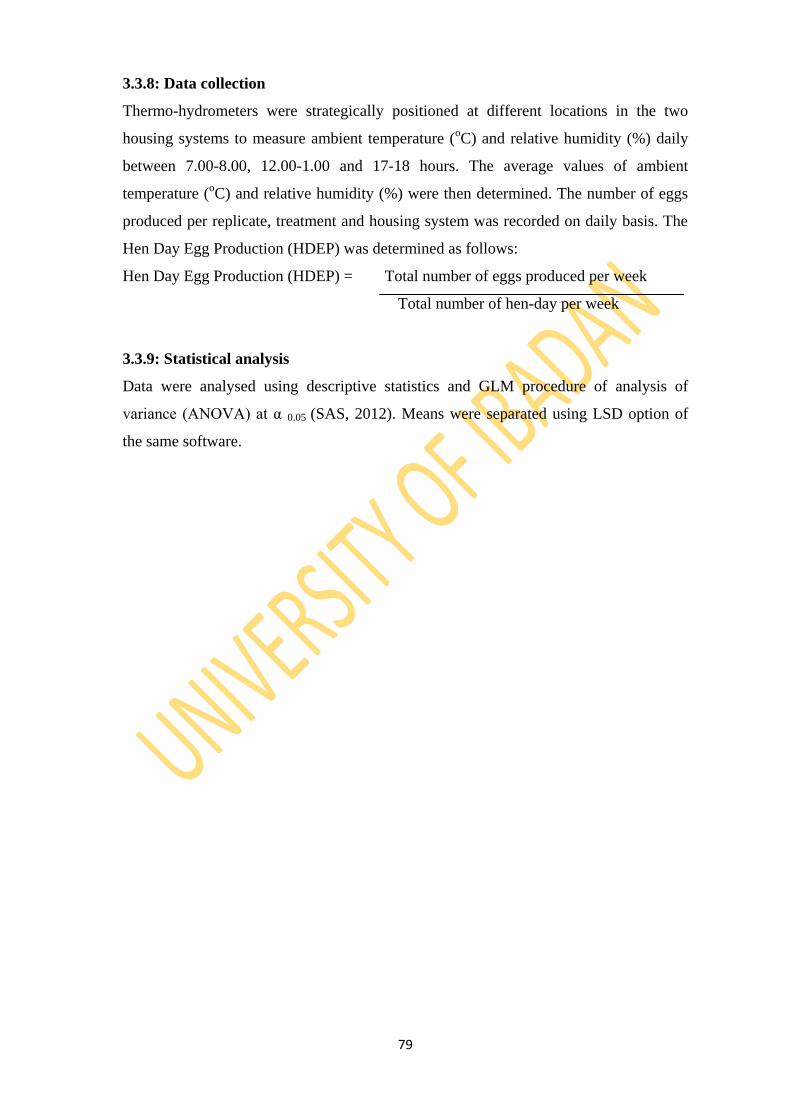
79
3.3.8: Data collection
Thermo-hydrometers were strategically positioned at different locations in the two
housing systems to measure ambient temperature (oC) and relative humidity (%) daily
between 7.00-8.00, 12.00-1.00 and 17-18 hours. The average values of ambient
temperature (oC) and relative humidity (%) were then determined. The number of eggs
produced per replicate, treatment and housing system was recorded on daily basis. The
Hen Day Egg Production (HDEP) was determined as follows:
Hen Day Egg Production (HDEP) = Total number of eggs produced per week
Total number of hen-day per week
3.3.9: Statistical analysis
Data were analysed using descriptive statistics and GLM procedure of analysis of
variance (ANOVA) at α 0.05 (SAS, 2012). Means were separated using LSD option of
the same software.
80
Study Four
Effects of five different proprietary vitamin-mineral premixes, two housing
systems and duration of storage on external and internal quality indices of eggs
3.4.1: Experimental site
As described in 3.1.1.
3.4.2: Housing systems
As described in 3.1.2 above
3.4.3: Experimental design and model
The experimental birds were randomly allocated to two HS (BC and DL systems) and
six treatments in acompletely randomised design of 2x6 factorial arrangements. Eggs
were stored for 0, 7, 14, 21 and 28 days. The experimental model is given below.
Xijk= u+Si+Sj+Sk+ Sij+Sjk+Sijk+eijkl, where:
u = overall population mean
Si = effect of housing system (deep litter and battery cage)
Sj = effect of proprietary vitamin-mineral premixes (k-n)
Sk= effect of days of egg storage (0, 7, 14, 21, 28)
Sij = interaction between housing systems and proprietary vitamin-mineral premixes
Sjk = interaction between housing systems and days of egg storage
Sijk = interaction between housing systems, proprietary vitamin-mineral premixes and
days of egg storage
eijkl= random residual error
3.4.4: Animals and management
Bovan Nera pullets (n=563) at early-lay (22 weeks of age) from study two in BC and
DL systems were used for this study. Management was as described in 3.1.3 above. The
experimental diets were fed from 22 to 70 weeks.
3.4.5: Test proprietary layers vitamin-mineral premixes
As described in 3.3.5 above.
3.4.6: Dietary layout
As described in 3.3.6 above.
81
3.4.7: Experimental diets
As described in 3.3.7
3.4.8: Data collection
At week 36, 180 fresh eggs representing fifteen eggs per treatment and90 eggs per
housing system were randomly sampled. Fifteen fresh eggs, three eggs per treatment,
were immediately evaluated for external and internal quality indices, while the
remaining eggs were stored in trays with the broad ends containing air cells upward on
the shelf at avaerage ambient temperature of 26 oC for 7, 14, 21 and 28 days,
respectively. The ambient temperature of egg storage was determined using Thermo-
hygrometers. Stored eggs were then evaluated for external and internal quality indices at
different days of storage using standard procedures. Egg and shell weights were
measured using electronic top loading scale (JS-B LCD® Display Scale). Egg length
and diameter were measured using electronic venier caliper, while shell thickness was
measured using micrometer screw gauge after drying at room temperature (Scott and
Silverside, 2000). Egg diameter and shell thickness were measured in three places (at
the narrow, middle and broad ends) and the average taken (Tyler, 1961). Egg weight
loss was determined as difference between successive weights at different days of
storage (Bhale et al., 2003).
Each egg was broken on a flat plate to measure internal egg quality indices. Albumen
pH was measured using pH meter. Albumen height was measured using tripod
micrometer. Yolk was carefully separated from albumen to measure yolk height and
diameter using electronic venier caliper. Yolk weight was measured using electronic top
loading scale (JS-B LCD® Display Scale). The weight and diameter of the petri dish
bottom used for holding egg-yolk was noted. Yolk weight and height were determined
by difference. Albumen weight was determined by difference of egg weight, yolk
weight and shell weight. Yolk index was estimated as ratio of yolk height to width. The
DSM Roche Yolk Colour Fan (RYCF) was used to determine the yolk colour. Haugh
Units were determined from albumen height and egg weight as described by Haugh
(1937) from the equation;
82
HU = 100 log10 (h - 1.7W0.37
+ 7.6); where
HU=Haugh Unit; h=observed height of the albumen in millimeters and W= egg weight
in grams
3.4.9: Statistical analysis
Data were analysed using descriptive statistics and GLM procedure of analysis of
variance (ANOVA) at α0.05 (SAS, 2012). Means were separated using LSD option of the
same software.
83
Study Five
Effect of supplementing laying chicken feed with five different proprietary
vitamin-mineral premixes, two housing systems and duration of storage on
chemical compositions of eggs
3.5.1: Experimental site
As described in 3.1.1 above
3.5.2: Housing systems
As described in 3.1.2 above.
3.5.3: Experimental design and model
As described in 3.4.3 above.
3.4.4: Animals and management
Bovan Nera pullets (n=558) at early-lay (22 weeks of age) from study two in BC and
DL systems were used for this study. Management was as described in 3.1.3 above. The
experimental diets were fed from 22 to 71 weeks.
3.4.5: Test proprietary layers vitamin-mineral premixes
As described in 3.3.5 above.
3.4.6: Dietary layout
As described in 3.3.6 above.
3.5.7: Experimental diets
As described in 3.3.7
3.5.8: Data collection
At week 36,180 fresh eggs representing 15 eggs per treatment and 90 eggs per housing
system were randomly sampled. Fifteen fresh eggs representing 3 eggs per treatment
were immediately evaluated chemically, while the remaining eggs were stored as
described in 3.4.7 Egg were broken and homogenized for determination of chemical
composition at different days of storage using standard procedures (AOAC, 2000).
84
3.5.8.1: Determination of moisture and dry matter (AOAC Offical Method 934.01)
Moisture and dry matter determinations in eggs were carried out using air-oven dry
method. Crucibles were washed and dried in an oven. They were allowed to cool in
desiccators and the weight noted. Ten grams of homogenized eggs were then transferred
into the crucibles and dried at a temperature between 103-105oC. The dried samples
were cooled in desiccators and weighed. They were later returned to the oven and the
process continued until constant dry weights were obtained.
Moisture content (%) = (weight loss ÷ initial weight) x 100
Dry Matter content (%) = (Dry weight ÷ initial weight) x 100
3.5.8.2: Determination of ash (AOAC Offical Method 942.05)
Five grams homogenized samples of eggs dried at 55oC were weighed into clean and
previously dried weighed crucibles. The samples were ignited over a low flame to char
organic matter. The crucibles were then placed in muffle furnace at 600oC for 6 h until
it ash completely. They were then transferred directly to desiccators, cooled and
weighed immediately.
Ash (%) = {(Initial weight – ash weight)/initial weight} x 100.
3.5.8.3: Determination of crude protein (AOAC Offical Method 2001.11)
The crude protein content was determined using micro Kjeldahl method. Two grams of
homogenized eggs was weighed into a long necked Kjeldahl flask. One tablet of
Kjeldahl catalyst was added to the sample in flask with 25cm3 of conc. H2SO4. The
flask was swirled, gently clamped in an inclined position and heated electrically in a
fume cupboard. The heating continue until a clear solution was obtained. The clear
solution was cooled, poured into 100cm3 volumetric flasks and made up to mark with
distilled water. Ten milliliter of the resulting mixture was measured into distillation set
through a funnel.
Five cubic centimeters of boric acid was pipetted into a 100 cm3 conical flask and
placed at the receiving end of the distillatory. The conical flask was placed such that the
delivery tube dipped completely into the boric acid inside the flask. 40% NaOH was
used to liberate ammonia from the digest under alkaline condition during distillation.
Two drops of methyl orange was added to the round bottom flask containing the
digested sample before 40% NaOH added. As soon as the contents became alkaline, the
85
red colour changed to yellow showing excess NaOH. Steam was then generated into the
distillation set using a steam chest. The liberated ammonia was trapped in the boric acid
solution and about 50 cm3
of the solution collected into a conical flask. The solution in
the flask was titrated against 0.1M HC1 until the first permanent colour change
observed. A blank sample was allowed to go through the same procedure to obtain
blank titre value. The titre value for the blank was used to correct for the titre values of
samples.
N (%) = Molarity of HC1 X (Sample titre – Blank titre) X 0.014 X DF X 100
Weight of sample used.
N (%) was converted to the percentage crude protein by multiplying by 6.25.
3.5.8.4: Determination of ether extracts (EE) (AOAC Offical Method 960.09)
Soxhlets extraction method was used to extract ether. A known weight of homogenized
eggs (dried at 55oC) was weighed into a weighted filter paper and folded neatly and
placed inside pre-weighed thimble. The thimble was inserted into the Soxhlets apparatus
and extraction under reflux was carried out with petroleum ether (40–60oC boiling
range) for 6 hrs. At the end of extraction, the thimble was dried in the oven for about 30
minutes at 100oC to evaporate solvent and thimble cooled in desiccator and later
weighed. The ether extracted from a given quantity of sample was then calculated:
Ether Extract (%) = Loss in weight of sample X 100
Original weight of sample
3.5.8.5: Determination of gross energy (AOAC, 1995)
Gross energy (GE) is the amount of heat produced from sample when it is completely
burnt down to its ultimate oxidation products; carbon dioxide (CO2) and water (H2O).
Samples of freeze-dried eggs were burnt in Bomb calorimeter and heat produced
measured to determine Gross Energy according to the procedure of AOAC (1995) using
the formula;
Gross heat of combustion (cal/g) = T x W x [C1 + C2 + C3)
M
where T =Rise in temperature,W = Water equivalent, C1 and C2 = Heat of combustion
(cal) of H2SO4 and HNO3, C3 = Heat of combustion (cal) of used wire, paper and thread,
M = Weight of freeze-dried eggs
86
3.5.8.6: Determination of calcium (AOAC Offical Method 927.02)
The ash sample obtained was digested by adding 5 mL of 2M HCL to the ash in the
crucible and heat to dryness on a heating mantle, 5 mL of 2M HCL was added again,
heat to boil and filtered through a Whatman No.1 filter paper into a 100 mL volumetric
flask. The filtrate was made up to mark with distilled water stopper and made ready for
reading of concentration of calcium on the Jenway Digital Flame Photometer (PFP7
Model) using the filter corresponding to each mineral element. The concentration of
each of the element was calculated using the formula:
Calcium (%) = Meter reading (MR) X Slope X Dilution factor/1000
NB: MR x Slope x dilution factor gave the concentration in part per million (ppm or
mg/kg) and when divided by 10000 concentration in % was derived.
3.5.8.7: Determination of phosphorous (AOAC Offical Method 964.06)
Phosphorus was determined routinely by the Vanado-molybdate colorimeter or
spectrophotometric method. The ash sample obtained was treated with 2M HCL
solution as described for calcium determination above, 10 mL of the filtrate solution
was pipetted into 50 mL standard flask and 10 mL of vanadate yellow solution was
added and the flask was made up to mark with distilled water, stoppered and left for 10
minutes for full yellow development. The concentration of the phosphorus was obtained
by taking the optical density (OD) or absorbence of the solution on a spectronic-20 at
470 nm wavelengths. The percentage phosphorus was calculated using the formula:
Phosphorus (%) = Absorbance x Slope x Dilution factor/10000
3.5.8.8: Determination of nitrogen free extracts (NFE) (AOAC Offical Method
978.1)
The nitrogen free extract (NFE) was calculated by the difference of crude protein, ash,
fat and moisture content from 100.
NFE (%) = 100-(crude protein + fat + ash+ moisture)
3.5.9: Statistical analysis
Data were analysed using descriptive statistics and GLM procedure of analysis of
variance (ANOVA) at α 0.05 (SAS, 2012). Means were separated using LSD option of
the same software.
87
Study Six
Effects of five different proprietary vitamin-mineral premixes and two housing
systems on cholesterol profile of chicken eggs
3.6.1: Experimental site
As described in 3.1.1 above
3.6.2: Housing systems
As described in 3.1.2 above.
3.6.3: Experimental design and model
As described in 3.4.3 above.
3.6.4: Animals and management
Bovan Nera pullets (n=558) at early-lay (22 weeks of age) from study two in BC and
DL systems were used for this study. Management was as described in 3.1.3 above. The
experimental diets were fed from 22 to 71 weeks.
3.6.5: Test proprietary layers vitamin-mineral premixes
As described in 3.3.5 above.
3.6.6: Dietary layout
As described in 3.3.6 above.
3.6.7: Experimental diets
As described in 3.3.7
3.6.8: Data collection
At week 36, 72 fresh eggs representing one per replicate, 6 per treatment and 36 per
housing system were randomly sampled and labeled appropriately and analysed for
cholesterolprofile in egg-yolk. Fresh eggs were broken and the yolks separatedfrom
albumen using egg-yolk separator. The yolks were beaten and mixed together to obtain
a clear and homogenous mixture. Five milliliter of homogenized samples were put in
K3EDTA bottles with anticoagulant EDTA for cholesterol profile analyses. The samples
88
were centrifuged at 1800 r/m and then analyzed using Hitachi 902: Auto Analyzer for
total cholesterol, triglycerides, high density lipoprotein-cholesterol (HDLc) and low
density lipoprotein-cholesterol (LDLc) as described (Friedwald et al., 1972; Bauer,
1982). The value of very low density lipoprotein (VLDL) was calculated by division of
triglycerides values by 5.
3.6.9: Statistical analysis
Data were analysed using descriptive statistics and GLM procedure of analysis of
variance (ANOVA) at α 0.05 (SAS, 2012). Means were separated using LSD option of
the same software.
89
Study Seven
Effect of supplementing five different proprietary vitamin-mineral premixes, two
housing systems and duration of storage on lipid oxidation of eggs
3.7.1: Experimental site
As described in 3.1.1 above
3.7.2: Housing systems
As described in 3.1.2 above.
3.7.3: Experimental design and model
As described in 3.4.3 above.
3.7.4: Animals and Management
Bovan Nera pullets (n=558) at early-lay (22 weeks of age) from study two in BC and
DL systems were used for this study. Management was as described in 3.1.3 above. The
experimental diets were fed from 22 to 71 weeks.
3.7.5: Test proprietary layers vitamin-mineral premixes
As described in 3.3.5 above.
3.7.6: Dietary layout
As described in 3.3.6 above.
3.7.7: Experimental diets
As described in 3.3.7
3.7.8: Data collection
At week 36, 180 fresh eggs representing 15 eggs per treatment and 90 eggs per housing
system were randomly sampled. Fifteen fresh whole eggs, 3 eggs per treatment, were
immediately evaluated for lipid oxidationmeasured as secondary product, while the
remaining eggs were stored on the shelf at ambient temperature of 26 oC for 7, 14, 21
and 28 days. The ambient temperature of egg storage was determined using Thermo-
90
hygrometers. Stored eggs were then evaluated for Thiobarbituric Acid Reactive
Substance (TBARS, μm/g) at different days of storage (Kang et al., 2001)
MDA (TBARS mg /100g) = K x A; where: K = -9.242; A = Absorbance
3.7.9: Statistical analysis
Data were analysed using descriptive statistics and GLM procedure of analysis of
variance (ANOVA) at α 0.05(SAS, 2012). Means were separated using LSD option of the
same software.
91
CHAPTER FOUR
4.0: RESULTS
Study One
4.1.1: Performance characteristics of growing pullets from 13- 16 weeks of age
Performance characteristics of growing pullets in the two housing systems (HS)
[Battery cage (BC) and Deep litter (DL)] from 13 to 16 weeks of age are presented in
Table 6. The daily feed intake (g/bird/day) of pullets in BC (100.00±0.06) was higher
(p<0.05) than 80.00±0.08 in DL. The initial live weight (kg/bird) of pullets at week 13
in BC (1.08±0.08) and DL (1.06±0.07) were not different (p>0.05). Pullets in BC
(1.32±0.10) and DL (1.33±0.11) increased in live weight to gain 0.28±0.02 and
0.24±0.03 respectively. There were no differences (p>0.05) in the live weight and live
weight gain. However, regression of live weight and age in weeks of pullets in the two
HS were strong and positive as shown by equations 1 and 2 below:
BC: y = 0.097x + 0.95……… (R2 = 0.96)……………………………………………... 1
DL: y = 0.08x + 0.985……… (R2 = 0.97) …………………………………………….. 2
Feed conversion ratio of pullets in BC (9.86±0.02) was similar to 9.71±0.03 in DL.
Feed cost per gain of pullets in BC (N701.71) was higher (p<0.05) than N691.13 in DL.
There was no mortality of pullets in the two housing systems during the period of study.
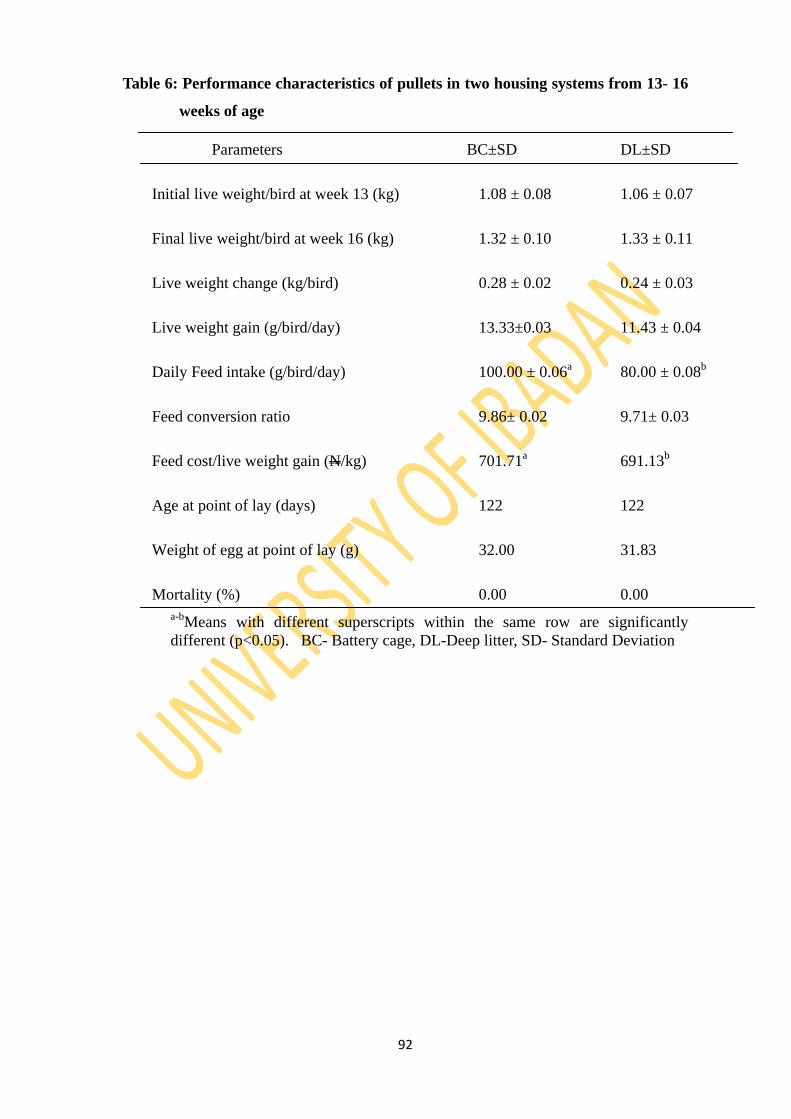
92
Table 6: Performance characteristics of pullets in two housing systems from 13- 16
weeks of age
Parameters BC±SD DL±SD
Initial live weight/bird at week 13 (kg) 1.08 ± 0.08 1.06 ± 0.07
Final live weight/bird at week 16 (kg) 1.32 ± 0.10 1.33 ± 0.11
Live weight change (kg/bird) 0.28 ± 0.02 0.24 ± 0.03
Live weight gain (g/bird/day) 13.33±0.03 11.43 ± 0.04
Daily Feed intake (g/bird/day) 100.00 ± 0.06a 80.00 ± 0.08
b
Feed conversion ratio 9.86± 0.02 9.71± 0.03
Feed cost/live weight gain (N/kg) 701.71a 691.13
b
Age at point of lay (days) 122 122
Weight of egg at point of lay (g) 32.00 31.83
Mortality (%) 0.00 0.00
a-bMeans with different superscripts within the same row are significantly
different (p<0.05). BC- Battery cage, DL-Deep litter, SD- Standard Deviation
93
Study Two
4.2.1: Performance charcteristics of pullets fed diets supplemented with five
different proprietary vitamin-mineral premixes in two housing systems
from 17 to 21 weeks of age
Performance characteristics of pullets fed diets supplemented with five different PVmP
in two HS from point of lay at week 17 to 22 weeks is presented in Table 7. The main
effect of HS on final live weight (FLW) and daily feed intake (DFI) were different
(p<0.05). Pullets in DL had higher (p<0.05) daily feed intake (DFI) (88.00g/bird/day)
and final live weight (FLW) (1.73kg/bird) compared with 86.86 and 1.68, respectively
in BC. The regression of feed intake and age of pullets in BC were positive and strong
than in DLas shown by equations 3 and 4 below:
BC: y = 6.09x + 68.6 …………… (R2=0.82)………………………………. …………3
DL: y = 5.124x + 72.498 ……… (R2=0.57) ………………………………………… 4
Housing systems did not affect (p<0.05) total feed intake (TFI), live weight changes
(LWC), feed conversion ratio (FCR) and mortality (M). Pullets in DL recorded
3.08kg/bird (TFI) to gain 11.43g/bird/day (LWC) at feed effeiciencey of 7.70 (FCR)
compared with 3.04; 10.29 and 8.44 respectively for those in BC.
The regression of live weight and age in weeks of pullets in the two HS are represented
in equations 5 and 6 below. The regression values obtained for growing pullets in both
HS were positive, strong and similar.
BC: y = 0.0746x + 1.2189 ……… (R2
= 0.98)…………………………………………5
DL: y = 0.0758x + 1.2469……… (R2
= 0.98) ……………………………… ………. 6
Effects of PVmP on FLW differed (p>0.05). Pullets fed diets supplemented with
Nutripoult had 1.74 kg/bird FLW similar 1.73 kg/bird for fed diets without PVmP but
higher (p<0.05) compared with 1.69, 1,69, 1.69 and 1.69 kg/bird for pullets on diets
with Hi-Nutrient, Agrited, Daram vita and Micro-mix respectively. The main effect of
PVmP supplementation on TFI, DFI, BWC, FCR and mortality were not different
(p>0.05).
94
Pullets fed diets supplemetened with Agrited (D4) had highest TFI (4.93 kg/bird), DFI
(87.98 g/bird/day) and LWC (11.14 g/bird/day). Pullets on diets supplemented with
Nutripoult at week 16 grew from 1.36kg/bird to attain the highest body weight
(1.74kg/bird) at week 21. Pullets fed diet supplemented with Hi-Nutrient, Agrited,
Daram vita-mix and Micro-mix recorded lower live weights compared to those on diets
without PVmP (D1). There were positive and strong regreesion values of live weight
and age of pullets fed different PVmP as shown in equations 7, 8, 9, 10, 11 and 12
below:
D1: y =0.074x + 1.2427 …………… (R2 = 0.96)……………………… …………….. 7
D2: y = 0.0737x + 1.262…………… (R2 = 0.95) ………………………… …………. 8
D3: y =0.0789x + 1.214 …………… (R2 = 0.98) …………………………………….. 9
D4: y = 0.0777x + 1.2047………… (R2 = 0.99) …………………………………….10
D5: y = 0.0749x + 1.2247………… (R2 = 0.99) …………………………… ………11
D6: y = 0.0714x + 1.2533………… (R2 = 0.99) …………………………………… 12
There was no mortality (%) among pullet on diets supplemented with Hi-Nutrient (D3),
while those fed diets without PVmP (D1) recorded 2.08, and those supplemented with
Nutripoult (D2), Agrited (4), Daram vita-mix (5) and Micro-mix (6) 2.08, 1.04, 1.04 and
1.04 respectively.
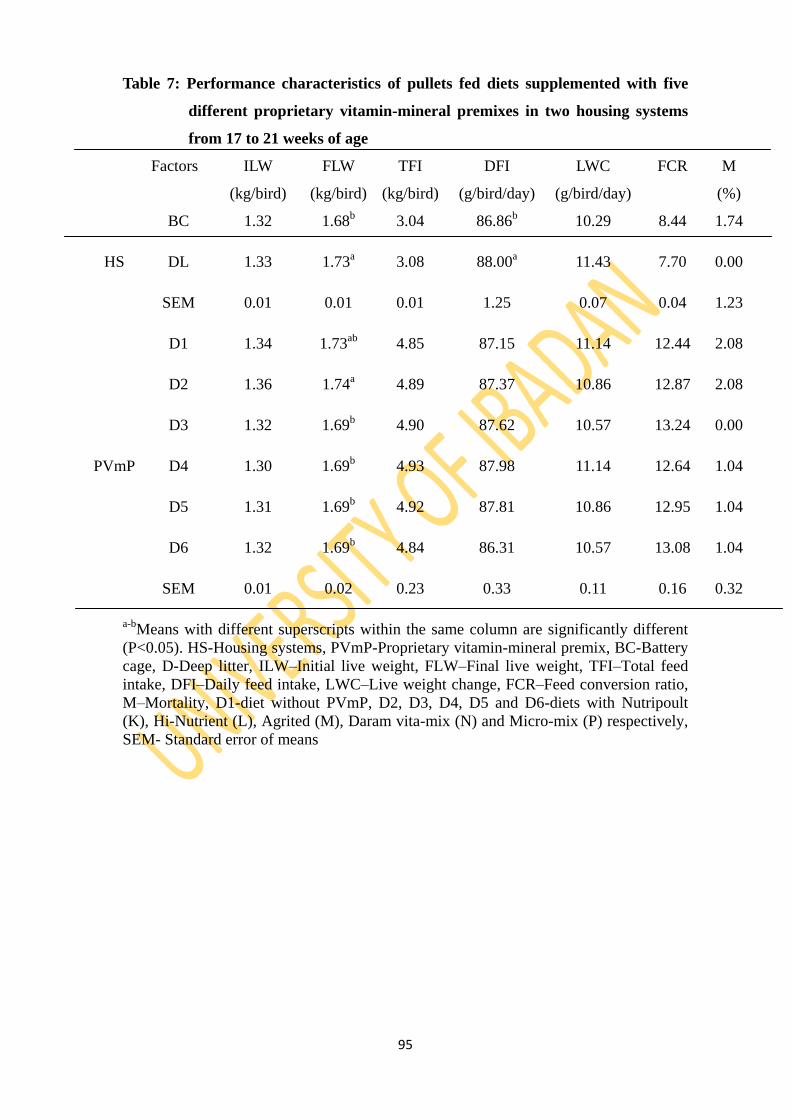
95
Table 7: Performance characteristics of pullets fed diets supplemented with five
different proprietary vitamin-mineral premixes in two housing systems
from 17 to 21 weeks of age
Factors ILW FLW TFI DFI LWC FCR M
(kg/bird) (kg/bird) (kg/bird) (g/bird/day) (g/bird/day)
(%)
BC 1.32 1.68b 3.04 86.86
b 10.29 8.44 1.74
HS DL 1.33 1.73a 3.08 88.00
a 11.43 7.70 0.00
SEM 0.01 0.01 0.01 1.25 0.07 0.04 1.23
D1 1.34 1.73ab
4.85 87.15 11.14 12.44 2.08
D2 1.36 1.74a 4.89 87.37 10.86 12.87 2.08
D3 1.32 1.69b 4.90 87.62 10.57 13.24 0.00
PVmP D4 1.30 1.69b 4.93 87.98 11.14 12.64 1.04
D5 1.31 1.69b 4.92 87.81 10.86 12.95 1.04
D6 1.32 1.69b 4.84 86.31 10.57 13.08 1.04
SEM 0.01 0.02 0.23 0.33 0.11 0.16 0.32
a-bMeans with different superscripts within the same column are significantly different
(P<0.05). HS-Housing systems, PVmP-Proprietary vitamin-mineral premix, BC-Battery
cage, D-Deep litter, ILW–Initial live weight, FLW–Final live weight, TFI–Total feed
intake, DFI–Daily feed intake, LWC–Live weight change, FCR–Feed conversion ratio,
M–Mortality, D1-diet without PVmP, D2, D3, D4, D5 and D6-diets with Nutripoult
(K), Hi-Nutrient (L), Agrited (M), Daram vita-mix (N) and Micro-mix (P) respectively,
SEM- Standard error of means
96
The interaction effects of PVmP x HS on performance characteristics of pullets fed diets
supplemented with five different PVmP from week 17 to 22 is shown in Table 8. There
were significant (p<0.05) interaction effects of PVmP x HS on FLW. However,
interaction effects of Nutripoult x DL (D2 x DL) on FBW (kg/bird) (1.53) was the
highest and similar to Nutripoult x BC (D2 x BC) (1.51); D1 and DL (D1 x DL) (151);
Hi-Nutrient x DL (D3 x DL) (1.51); Agritedx DL (D4 x DL) (1.50); Daram vita-mix x
DL (D5 x DL) (1.51); and Micro-mixx DL (D6 x DL) (1.51) but higher (p<0.05)
compared with D1 x BC (1.49), Hi-Nutrient x BC (1.47), Agrited x BC (1,45), Daram
vita-mix x BC (1.46) and Micro-mix x BC (1.50). The interaction effect of PVmP x
HS on TFI and DFI were not different (P>0.05).

97
Table 8: Interaction effects of proprietary vitamin-mineral premixes and housing
systems on performance characteristics of pullets from 17 to 21 weeks of
age
Factors
FLW
(kg/bird)
TFI
(kg/bird)
DFI
(g/bird/day)
D1 x BC 1.49bc
4.88 87.2
D2 x BC 1.51ab
4.85 86.61
PVmP x BC D3 x BC 1.47cd
4.92 87.80
D4 x BC 1.45d
4.87 86.96
D5 x BC 1.46d
4.86 86.79
D6 x BC 1.50bc
4.81 85.86
D1 x DL 1.51ab
4.86 86.85
D2 x DL 1.53a
4.94 88.13
PVmP x DL D3 x DL 1.51ab
4.90 87.44
D4 x DL 1.50ab
4.98 88.99
D5 x DL 1.51ab
4.97 88.81
D6 x DL 1.51ab
4.87 87.02
SEM 0.01 0.12 2.18
a-dMeans with different superscripts within the same column are significantly different
(P<0.05). PVmP-Proprietary vitamin-mineral premix, BC-Battery cage, DL-Deep litter,
FLW–Final live weight, TFI–Total feed intake, DFI–Daily feed intake, D1-diet without
PVmP, D2, D3, D4, D5,and D6-diets with Nutripoult, Hi-Nutrient, Agrited, Daram vita-
mix and Micro-mix respectively, x-Interaction, SEM-Standard error of means
98
4.2.2: Hen day egg production of pullets fed diets supplemented with five different
proprietary vitamin-mineral premixes in two housing systems from 17 to 21
weeks of age
Hen Day Egg production (HDEP) of pullets fed diets supplemented with five different
PVmP in two HS from 17 to 21 weeks of age is shown in Figure 1. The HS affected
(p<0.05) number of eggs produced (EP) and HDEP of pullets from 17 to 21 weeks of
age. Pullets in the two HS started egg laying at about week 18 with birds in BC
commencing earlier and produced more eggs than those in DL. At week 21, pullets in
BC had 33.19% HDEP higher (p<0.05) than 16.62% in DL. In Figure 2, PVmP caused
variations (p<0.05) in HDEP of pullets from 17 to 21 weeks of age. Pullets on diets
supplemented with Micro-mix (D6) maintained highest level of egg production from 17
to 19 week. At week 19, pullets on Hi-Nutrient (D2) increased in HDEP over others fed
diets with and without PvmP. The HDEP of pullets fed diets supplemented with Darami
vita-mix (D5) increased rapidly more than those on Nutripult (D2) at week 21.
However, the HDEP of pullets on diets without PVmP supplementation was abysmal
lower compared with those on diets containing PVmP.
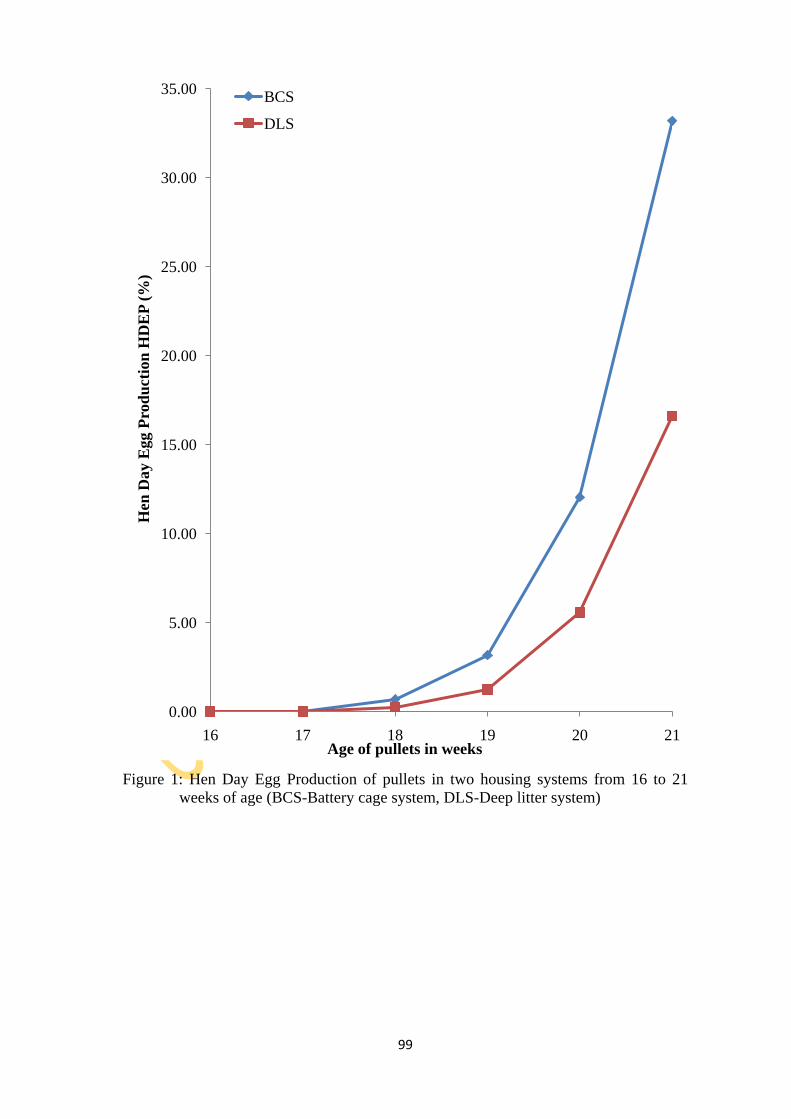
99
Figure 1: Hen Day Egg Production of pullets in two housing systems from 16 to 21
weeks of age (BCS-Battery cage system, DLS-Deep litter system)
0.00
5.00
10.00
15.00
20.00
25.00
30.00
35.00
16 17 18 19 20 21
Hen
Day E
gg
Pro
du
ctio
n H
DE
P (
%)
Age of pullets in weeks
BCS
DLS
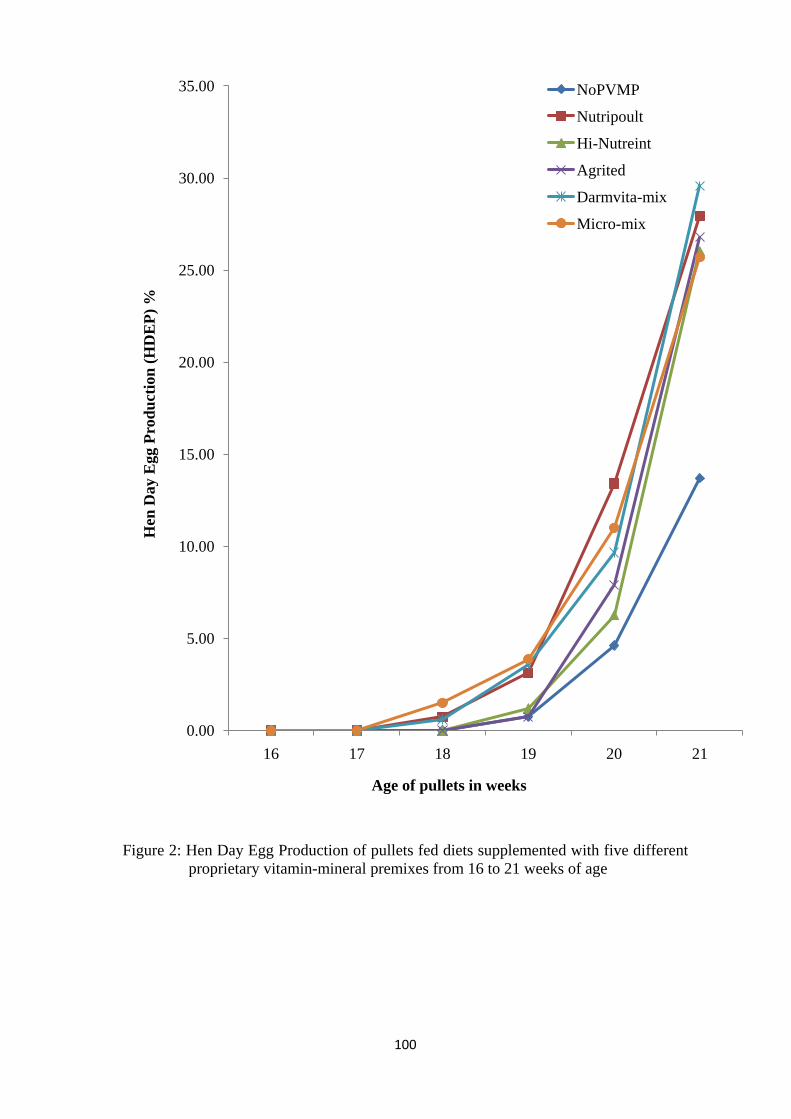
100
Figure 2: Hen Day Egg Production of pullets fed diets supplemented with five different
proprietary vitamin-mineral premixes from 16 to 21 weeks of age
0.00
5.00
10.00
15.00
20.00
25.00
30.00
35.00
16 17 18 19 20 21
Hen
Day E
gg P
rod
uct
ion
(H
DE
P)
%
Age of pullets in weeks
NoPVMP
Nutripoult
Hi-Nutreint
Agrited
Darmvita-mix
Micro-mix
101
Study Three
4.3.1: Ambient temperature (oC) and relative humidity in the two housing systems
Ambient temperature and relative humidity in the two housing systems in the period of
production are presented in Table 9. The ambient temperatures (oC) and relative
humidity (%) range recorded in BC and DL were 25.7-32.1 and 22.6-82.2; 25.3-31.3
and 27.8- 87.8 with the corresponding mean values of 28.5±1.6 and 68.2±13.7; 28.3±1.7
and 73.6±13.5 respectively.
.
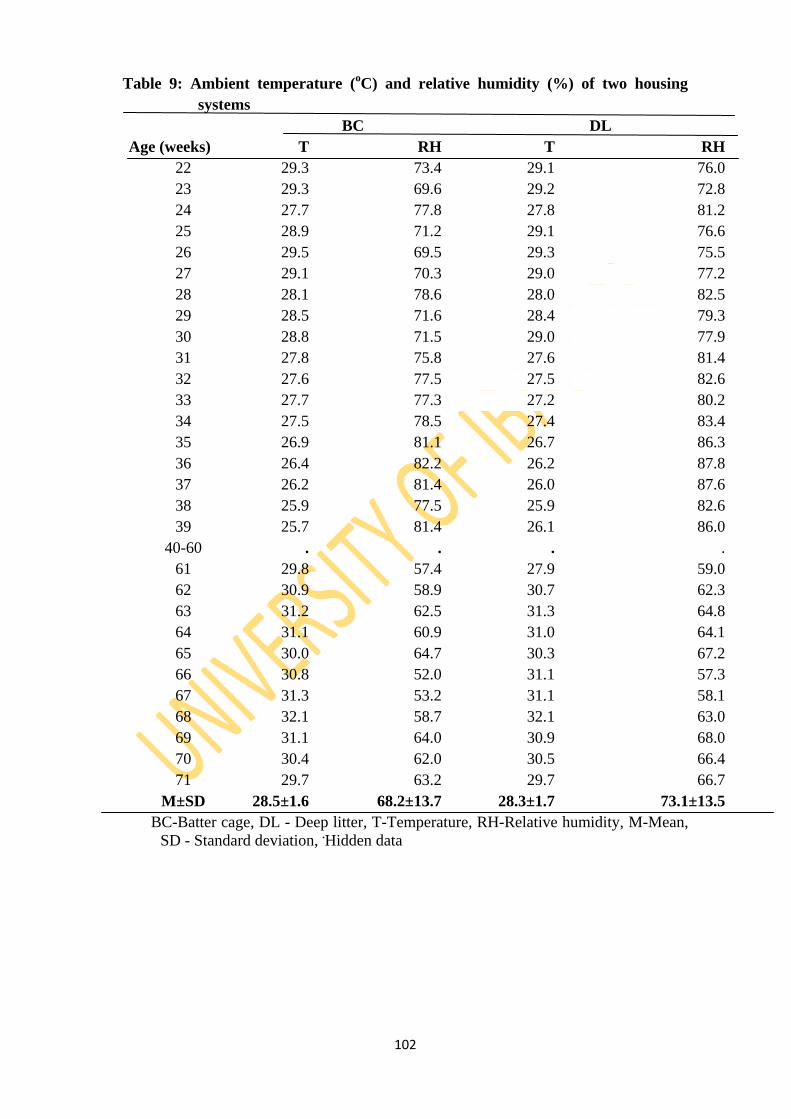
102
Table 9: Ambient temperature (oC) and relative humidity (%) of two housing
systems
BC DL
Age (weeks) T RH T RH
22 29.3 73.4 29.1 76.0
23 29.3 69.6 29.2 72.8
24 27.7 77.8 27.8 81.2
25 28.9 71.2 29.1 76.6
26 29.5 69.5 29.3 75.5
27 29.1 70.3 29.0 77.2
28 28.1 78.6 28.0 82.5
29 28.5 71.6 28.4 79.3
30 28.8 71.5 29.0 77.9
31 27.8 75.8 27.6 81.4
32 27.6 77.5 27.5 82.6
33 27.7 77.3 27.2 80.2
34 27.5 78.5 27.4 83.4
35 26.9 81.1 26.7 86.3
36 26.4 82.2 26.2 87.8
37 26.2 81.4 26.0 87.6
38 25.9 77.5 25.9 82.6
39 25.7 81.4 26.1 86.0
40-60 . . . .
61 29.8 57.4 27.9 59.0
62 30.9 58.9 30.7 62.3
63 31.2 62.5 31.3 64.8
64 31.1 60.9 31.0 64.1
65 30.0 64.7 30.3 67.2
66 30.8 52.0 31.1 57.3
67 31.3 53.2 31.1 58.1
68 32.1 58.7 32.1 63.0
69 31.1 64.0 30.9 68.0
70 30.4 62.0 30.5 66.4
71 29.7 63.2 29.7 66.7
M±SD 28.5±1.6 68.2±13.7 28.3±1.7 73.1±13.5
BC-Batter cage, DL - Deep litter, T-Temperature, RH-Relative humidity, M-Mean,
SD - Standard deviation, .Hidden data
103
4.3.2: Performance characteristics of layers fed diets supplemented with five
different proprietary vitamin-mineral premixes in two housing systems from
22 to 35 weeks of age
The performance characteristics of layers fed diets supplemented with five different
PVmP in two HS in from 22 to 35 weeks of age is presented in Table 10. Main effects
of HS significantly (p<0.05) affected liveweight (LW) and daily feed intake (DFI) of
layers. The LW (1.73kg/bird) and DFI (98.54g/bird/day) of layers in DL were higher
(p<0.05) than 1.54 and 90.09 respectively in BC. There were variations (p<0.05) across
dietary PVmP supplementation on LW and DFI. The DFI (g/bird/day) of layers fed diets
without PVmP (98.16) was higher (p<0.05) compared with 86.21, 94.35 and 94.68 for
layers diets supplemented with Micro-mix, Daram-vita and Agrited respectively. Layers
fed diets without PVmP recorded the highest feed intake (98.16 g/bird/day), while those
on diets supplemented with Micro-mix (86.21 g/bird/day) the least. Layers fed diets
supplemented with Nutripoult (D2) had the highest LW (1.66 kg/bird) similar to those
on Hi-Nutrient (1.65 kg/bird) but higher (p<0.05) compared with 1.60, 1.62, 1.64 and
1.64 for those on Daram-vita, Agrited, Micro-mix and without PVmP respectively.
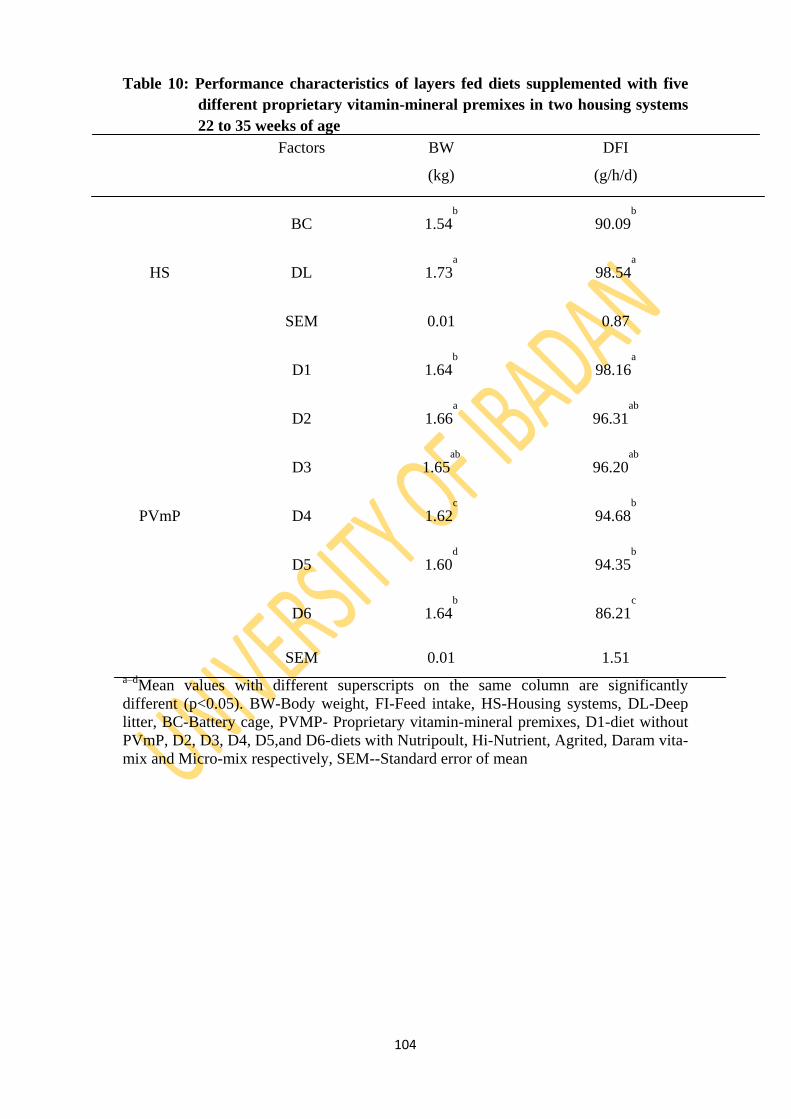
104
Table 10: Performance characteristics of layers fed diets supplemented with five
different proprietary vitamin-mineral premixes in two housing systems
22 to 35 weeks of age
Factors
BW
(kg)
DFI
(g/h/d)
BC 1.54b
90.09b
HS DL 1.73a
98.54a
SEM 0.01 0.87
D1 1.64b
98.16a
D2 1.66a
96.31ab
D3 1.65ab
96.20ab
PVmP D4 1.62c
94.68b
D5 1.60d
94.35b
D6 1.64b
86.21c
SEM 0.01 1.51
a–dMean values with different superscripts on the same column are significantly
different (p<0.05). BW-Body weight, FI-Feed intake, HS-Housing systems, DL-Deep
litter, BC-Battery cage, PVMP- Proprietary vitamin-mineral premixes, D1-diet without
PVmP, D2, D3, D4, D5,and D6-diets with Nutripoult, Hi-Nutrient, Agrited, Daram vita-
mix and Micro-mix respectively, SEM--Standard error of mean
105
The interaction effects of PVmP x HS on LW and DFI of layers fed diets supplemented
with five different PVmP in two HS in from 22 to 35 weeks of age is shown in Table
11. The PVmP x HS interaction effect on DFI and LW were significant (p<0.05).
Micro-mix x DL interaction effect on DFI (101.11 g/day/bird) was similar to Nutripoult
x BC (93.38), Hi-Nutrient x DL (99.45), Agrited x DL (99.44) and Daram-vit x DL
(99.30) but higher (p<0.05) compared with diet without PVmP x BC (79.40), diet
without PVmP x DL (93.06), Micro-mix x BC (87.59), Daram-vita x BC (90.06),
Agrited x BC (92.96) and Hi-Nutrient x BC (93.17).
Nutripoult x DL interaction effect on LW (1.75 kg/bird) was similar to Hi-Nutrient x
DL (1.73), Daram vita-mix x DL (1.73) and Micro-mix x DL (1.74) but higher
(p<0.05) compared with diets without PVmP x BC (1.57), Nutripoult x BC (1.57), Hi-
Nutrient x BC (1.57), Agrited x BC (1.53), Daram vita-mix x BC (1.47), Micro-mix x
BC (1.53), diet without PVmP x DL (1.72) and Agrited x DL (1.70).
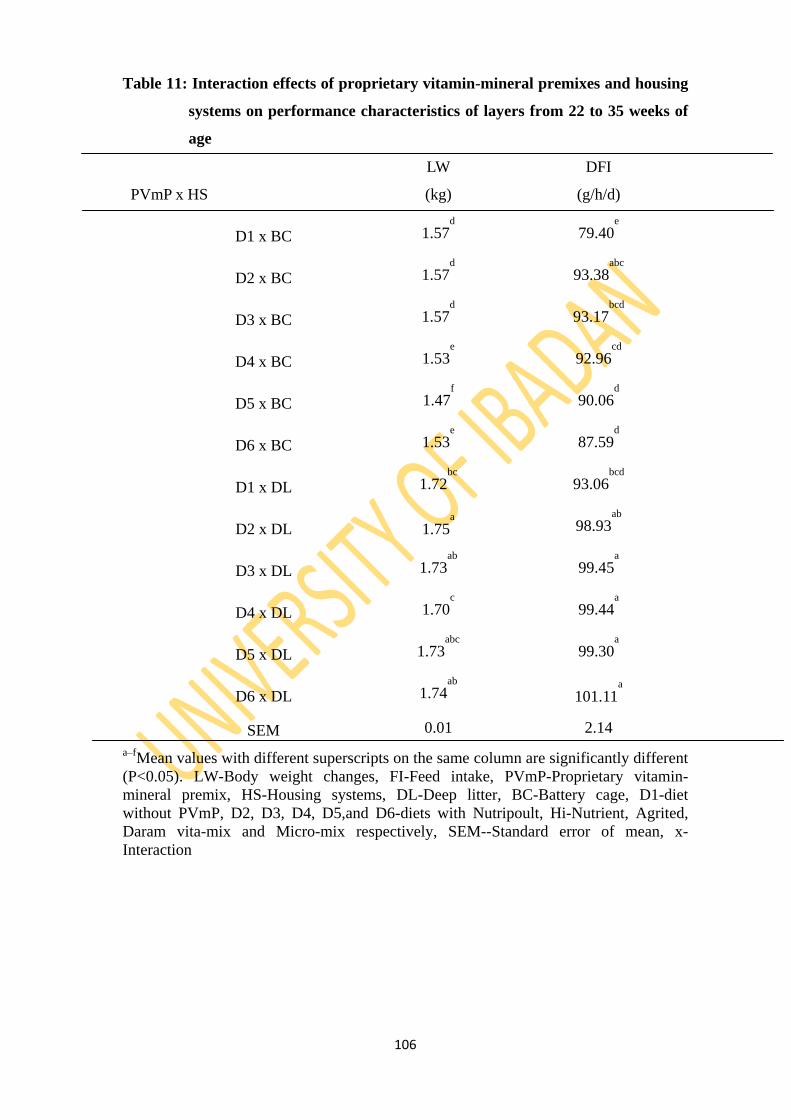
106
Table 11: Interaction effects of proprietary vitamin-mineral premixes and housing
systems on performance characteristics of layers from 22 to 35 weeks of
age
PVmP x HS
LW
(kg)
DFI
(g/h/d)
D1 x BC 1.57d
79.40e
D2 x BC 1.57d
93.38abc
D3 x BC 1.57d
93.17bcd
D4 x BC 1.53e
92.96cd
D5 x BC 1.47f
90.06d
D6 x BC 1.53e
87.59d
D1 x DL 1.72bc
93.06bcd
D2 x DL 1.75a
98.93ab
D3 x DL 1.73ab
99.45a
D4 x DL 1.70c
99.44a
D5 x DL 1.73abc
99.30a
D6 x DL 1.74ab
101.11a
SEM 0.01 2.14
a–fMean values with different superscripts on the same column are significantly different
(P<0.05). LW-Body weight changes, FI-Feed intake, PVmP-Proprietary vitamin-
mineral premix, HS-Housing systems, DL-Deep litter, BC-Battery cage, D1-diet
without PVmP, D2, D3, D4, D5,and D6-diets with Nutripoult, Hi-Nutrient, Agrited,
Daram vita-mix and Micro-mix respectively, SEM--Standard error of mean, x-
Interaction
107
4.3.3: Egg production characteristics of layers fed diets supplemented with five
different proprietary vitamin-mineral premixes in two housing systems from
22 to 35 weeks of age
Egg production characteristics of layers fed diets supplemented with five different
PVmP in two HS from 22 to 35 weeks of age is presented in Table 12. The HS
significantly (p<0.05) influenced number of eggs laid (EP), HDEP, egg mass (EM) and
feed conversion ratio per egg mass (FCR/EM). The egg weight was not significantly
(p>0.05) affected by HS. Layers in DL had higher (p<0.05) FCR/EM (2.47), egg laying
capacity (HDEP; 71.22%) and egg mass (7.33 g/bird/day) compared with 2.19, 62.58
and 6.48 respectively in BC. Egg production characteristics increased significantly
(p<0.05) with dietary PVmPs. The FCR/EM of layers fed diets supplemented with
Nutripoult (2.46) was similar to 2.42 and 2.37 for those on Hi-Nutrient and Agrited
respectively. Layers fed diets supplemental Nutripoult (D2) had higher HDEP (76.65)
similar to those on supplemeted with Agrited (76.60) but higher (p<0.05) compared
with those on diets without PVmP (43.40), Hi-Nutrient (68.45), Daram vita-mix (68.59)
and Micro-mix (67.72). The mass of eggs produced by layers fed diets supplemented
with Nutripoult (7.79) and Agrited (8.06) were similar and higher (p<0.05) compared
with those fed diets without PVmP (4.39), Hi-Nutrient (6.95), Daram-vita (7.05) and
Micro-mix (7.17)
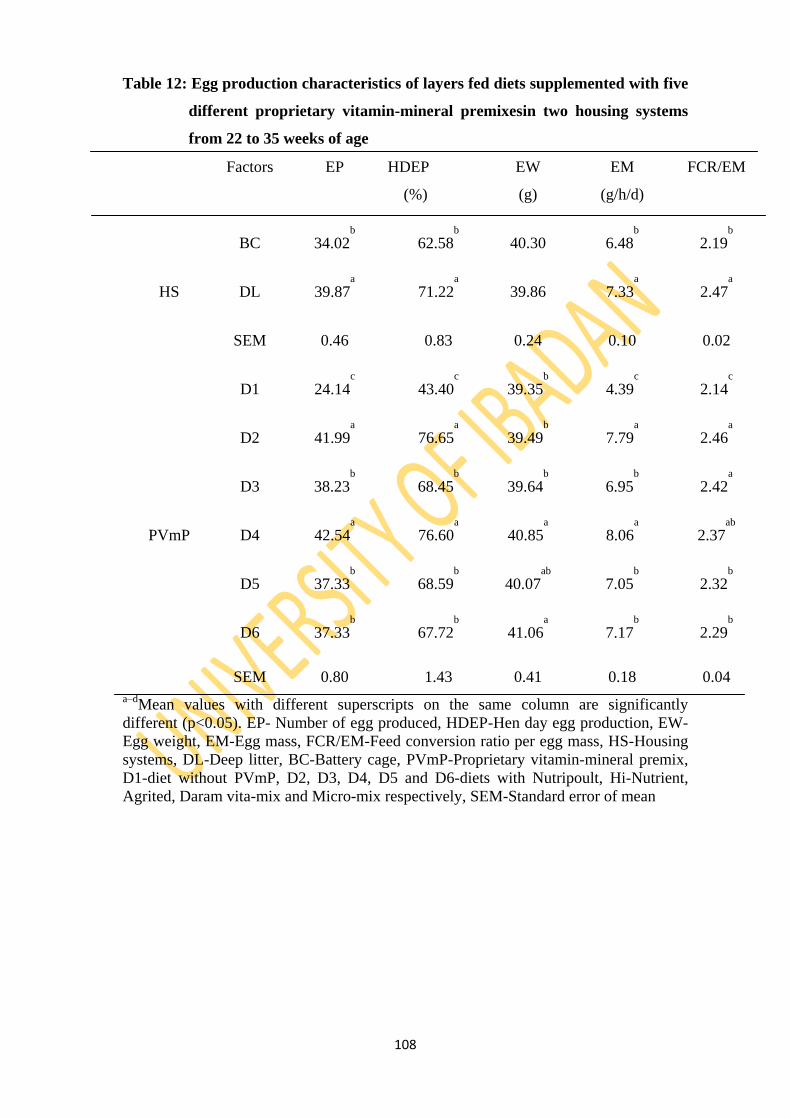
108
Table 12: Egg production characteristics of layers fed diets supplemented with five
different proprietary vitamin-mineral premixesin two housing systems
from 22 to 35 weeks of age
Factors
EP
HDEP
(%)
EW
(g)
EM
(g/h/d)
FCR/EM
BC 34.02b
62.58b
40.30 6.48b
2.19b
HS DL 39.87a
71.22a
39.86 7.33a
2.47a
SEM 0.46 0.83 0.24 0.10 0.02
D1 24.14c
43.40c
39.35b
4.39c
2.14c
D2 41.99a
76.65a
39.49b
7.79a
2.46a
D3 38.23b
68.45b
39.64b
6.95b
2.42a
PVmP D4 42.54a
76.60a
40.85a
8.06a
2.37ab
D5 37.33b
68.59b
40.07ab
7.05b
2.32b
D6 37.33b
67.72b
41.06a
7.17b
2.29b
SEM 0.80 1.43 0.41 0.18 0.04
a–dMean values with different superscripts on the same column are significantly
different (p<0.05). EP- Number of egg produced, HDEP-Hen day egg production, EW-
Egg weight, EM-Egg mass, FCR/EM-Feed conversion ratio per egg mass, HS-Housing
systems, DL-Deep litter, BC-Battery cage, PVmP-Proprietary vitamin-mineral premix,
D1-diet without PVmP, D2, D3, D4, D5 and D6-diets with Nutripoult, Hi-Nutrient,
Agrited, Daram vita-mix and Micro-mix respectively, SEM-Standard error of mean
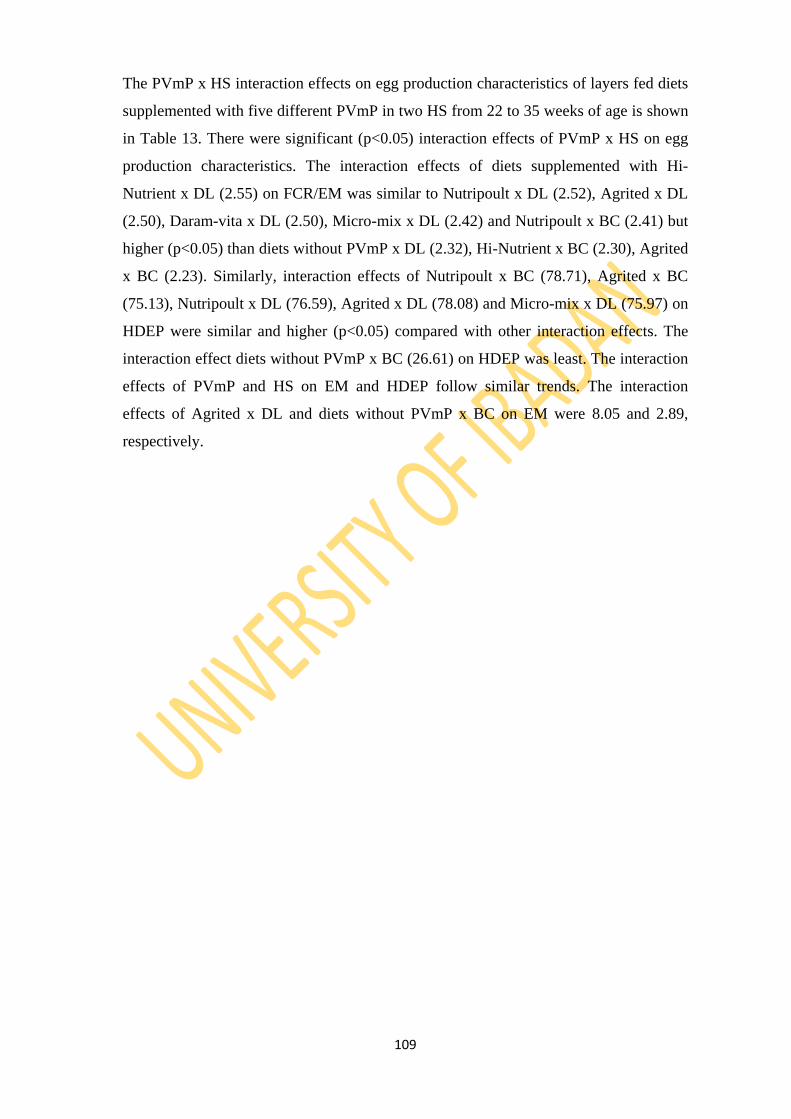
109
The PVmP x HS interaction effects on egg production characteristics of layers fed diets
supplemented with five different PVmP in two HS from 22 to 35 weeks of age is shown
in Table 13. There were significant (p<0.05) interaction effects of PVmP x HS on egg
production characteristics. The interaction effects of diets supplemented with Hi-
Nutrient x DL (2.55) on FCR/EM was similar to Nutripoult x DL (2.52), Agrited x DL
(2.50), Daram-vita x DL (2.50), Micro-mix x DL (2.42) and Nutripoult x BC (2.41) but
higher (p<0.05) than diets without PVmP x DL (2.32), Hi-Nutrient x BC (2.30), Agrited
x BC (2.23). Similarly, interaction effects of Nutripoult x BC (78.71), Agrited x BC
(75.13), Nutripoult x DL (76.59), Agrited x DL (78.08) and Micro-mix x DL (75.97) on
HDEP were similar and higher (p<0.05) compared with other interaction effects. The
interaction effect diets without PVmP x BC (26.61) on HDEP was least. The interaction
effects of PVmP and HS on EM and HDEP follow similar trends. The interaction
effects of Agrited x DL and diets without PVmP x BC on EM were 8.05 and 2.89,
respectively.
110
Table 13: Interaction effects of proprietary vitamin-mineral premixes and housing
systems on egg production characteristics of layers from 22 to 35 weeks
of age
HS x PVmP
EP
HDEP
(%)
EW
(g)
EM
(g/h/d)
FCR/EM
D1 x BC 16.25f
29.61f
39.01d
2.89f
1.95f
D2 x BC 41.10ab
76.71a
39.46cd
7.79a
2.41ab
D3 x BC 37.35cd
67.05c
40.10bcd
6.87cd
2.30bcd
D4 x BC 41.35ab
75.13ab
41.81a
8.07a
2.23cde
D5 x BC 32.36e
61.21de
40.81abc
6.39de
2.13e
D6 x BC 35.71d
65.77cd
40.61abcd
6.86cd
2.15de
D1 x DL 32.03e
57.19e
39.69cd
5.89e
2.32bc
D2 x DL 42.89a
76.59a
39.53cd
7.80a
2.52a
D3 x DL 39.11bc
69.84bc
39.18cd
7.04bcd
2.55a
D4 x DL 42.72a
78.08a
39.90bcd
8.05a
2.50a
D5 x DL 42.54a
75.97a
39.33cd
7.70ab
2.50a
D6 x DL 38.94bc
69.68bc
41.50ab
7.48abc
2.42ab
SEM 1.13 2.03 0.59 0.25 0.05
a–fMean values with different superscripts on the same column are significantly different
(p<0.05).EP-Egg production, HDEP-Hen day egg production, HHEP-Hen house egg
production, EWEgg weight, EM–Egg mass, FCR/EM-Feed conversion ratio per egg
mass, FCR/DE-Feed conversion ratio per dozen egg, HS-Housing systems, PVmP-
Proprietary vitamin-mineral premix, DL-Deep litter, BC-Battery cage, D1-diet without
PVmP, D2, D3, D4, D5,and D6-diets with Nutripoult, Hi-Nutrient, Agrited, Daram vita-
mix and Micro-mix respectively, SEM-Standard error of mean, x-Interaction
111
4.3.4: Hen Day Egg Production of layers fed diets supplemented with five
different proprietary vitamin-mineral premixes in two housing systems from
16 to 70 weeks of age
The Hen Day Egg Production (HDEP, %) of layers in two HS from 16 to 70 weeks of
age is presented in Figure 3. The HDEP of layers in BC was higher and maintained
steady increase over and above those in DL. Layers in BC attained peak-lay (HDEP;
65.18) at week 23, while those in DL increased steadily to peak (HDEP: 88.99) at week
30, and thereafter declined. Layers in DL remained at higher HDEP than those in BC
for the rest of the production period. The HDEP of layers in BC and DL fluctuated and
reduced to 52.14 and 57.78 in BC and DL respectively in late-laying phase. The HDEP
of layers fed diets supplemented with five different PVmP from 16 to 70 weeks of age is
presented in Figure 4. The HDEP values varied (p<0.05) with different PVmP
supplementations. The HDEP of layers fed Nutripoult (D2), Hi-Nutrient (D3), Agrited
(D4), Daram vita-mix (D5) and Micro-mix (D6) were higher compared with those diets
without PVmP (D1).
The HDEP of layers increased at comparative rates from point-of-lay (week 18) so that
those fed diet without PVmP (D1) attained peak-lay (HDEP: 59.95) earlier at week 23
and then nose-dived sharply to zero HDEP at week 34. Birds fed Nutripoult (D2) and
Daram vita-mix (D4) recorded comparatively higher HDEP; 88.71 and 87.67 at weeks
31 and 29 respectively. Layers fed diets supplemented with Micro-mix (D6), Hi-
Nutrient (D3) and Daram vita-mix (D4) attained peak HDEP; 83.38, 78.72 and 77.62 at
weeks 30, 29 and 29 respectively.
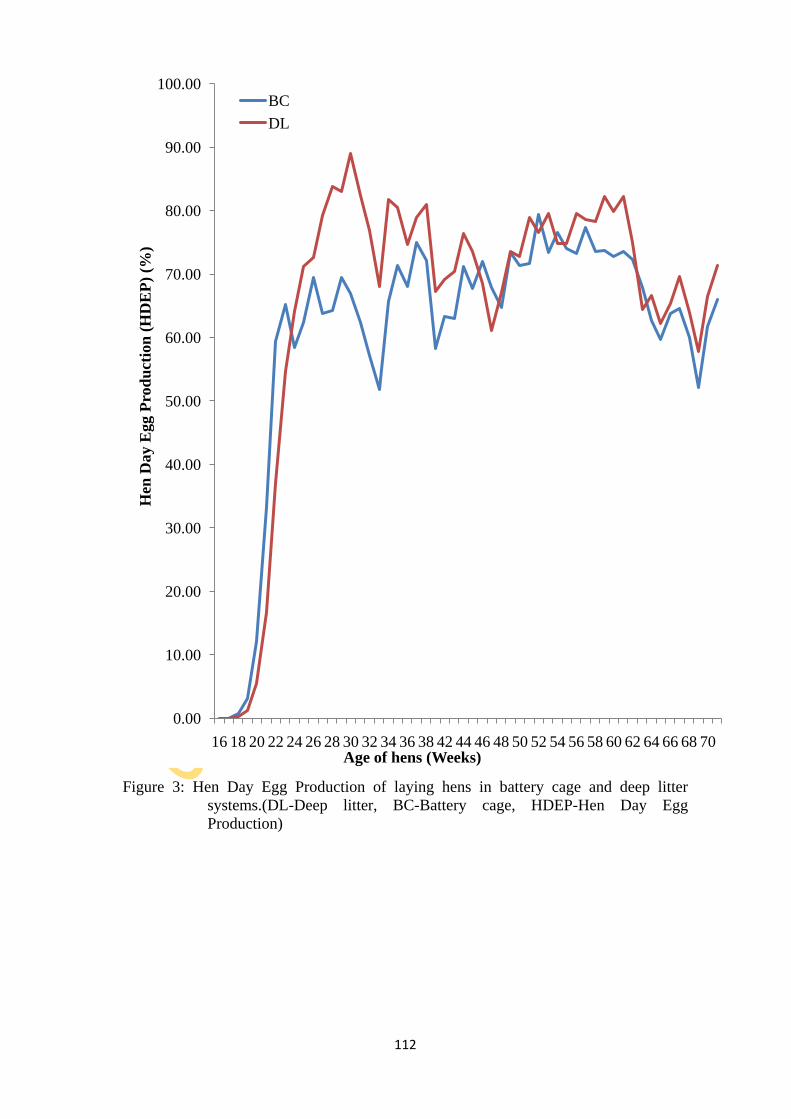
112
Figure 3: Hen Day Egg Production of laying hens in battery cage and deep litter
systems.(DL-Deep litter, BC-Battery cage, HDEP-Hen Day Egg
Production)
0.00
10.00
20.00
30.00
40.00
50.00
60.00
70.00
80.00
90.00
100.00
16 18 20 22 24 26 28 30 32 34 36 38 42 44 46 48 50 52 54 56 58 60 62 64 66 68 70
Hen
Day E
gg P
rod
uct
ion
(H
DE
P)
(%)
Age of hens (Weeks)
BC
DL
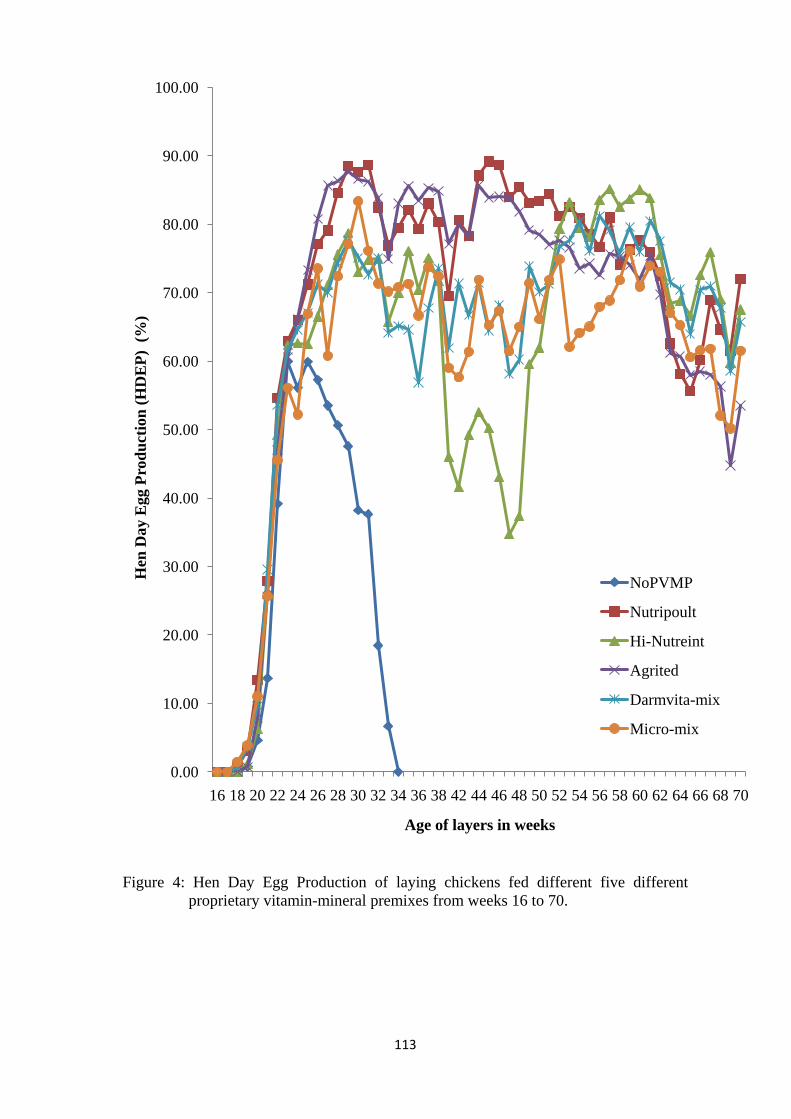
113
Figure 4: Hen Day Egg Production of laying chickens fed different five different
proprietary vitamin-mineral premixes from weeks 16 to 70.
0.00
10.00
20.00
30.00
40.00
50.00
60.00
70.00
80.00
90.00
100.00
16 18 20 22 24 26 28 30 32 34 36 38 42 44 46 48 50 52 54 56 58 60 62 64 66 68 70
Hen
Day E
gg P
rod
uct
ion
(H
DE
P)
(%
)
Age of layers in weeks
NoPVMP
Nutripoult
Hi-Nutreint
Agrited
Darmvita-mix
Micro-mix
114
Study Four
4.4.1: External quality indices of eggs from layers fed diets supplemented with five
different proprietary vitamin-mineral premixes in two housing systems from
22 to 35 weeks of age
External quality indices of of eggs from layers fed diets supplemeted with five different
PVmP in two housing systems from 22 to 35 weeks of age is presented in Table 14. The
egg weights (Ew), diameter (ED), shell index (EI) and shell weight (EW) from layers
were not affected (P>0.05) by HS. However, Egg length (EL) (37.79) and Eggshell
thickness (ET) varied (p<0.05) with HS. The EL from layers in DL (37.79 mm) were
higher (p<0.05) than those in BC (37.52). The ET (0.32) from layers in BC was higher
(p<0.05) compared with 0.31 in DL. Dietary PVmP significatly (p<0.05) increased Ew,
ED, ET and EW. Eggs produced by layers fed diets supplemented with Micro-mix
(41.06 g) had highest Ew which was similar to eggs produced by those on Agrited
(40.85) and Daram vita-mix (40.07) but higher (p<0.05) than values obtained for eggs
produced by those on diets without PVmP(38.35), Nutripoult (39.49) and Hi-Nutrient
(39.64).
Eggs from layers fed diets supplemented with Hi-Nutrient (26.03) had highest value of
ED which was similar to obtained values for eggs produced by those on Nutripoult
(25.94) and Micro-mix (25.89) but higher (p<0.05) than values obtained for eggs
produced by those fed diets without PVmP (25.56), Agrited(25.66) and Daram vita-mix
(25.65). The highest EI was obtained for eggs produced by layers fed diets without
PVmP (1.47), Daram vita-mix (1.47) and Agrited (1.47) which were similar to eggs laid
by thos on Nutripoult (1.45) and Micro-mix (1.46) but higher (p<0.05) than 1.44 for
those on HDEP.
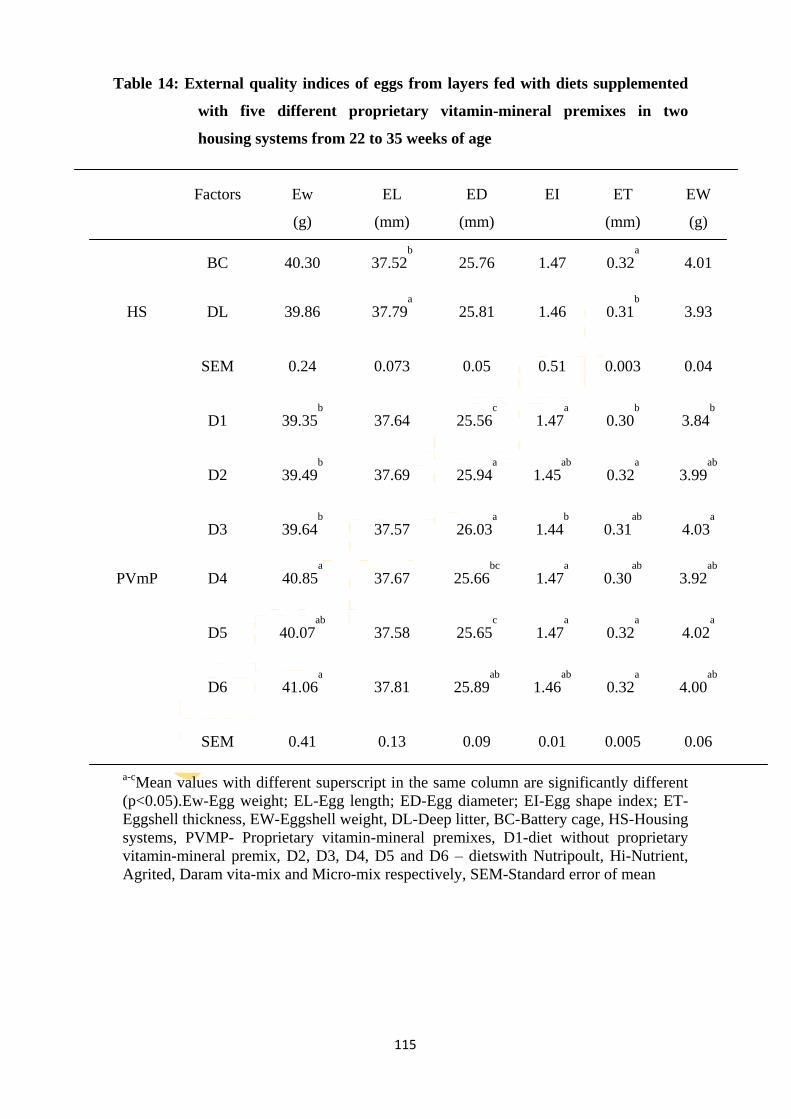
115
Table 14: External quality indices of eggs from layers fed with diets supplemented
with five different proprietary vitamin-mineral premixes in two
housing systems from 22 to 35 weeks of age
Factors
Ew
(g)
EL
(mm)
ED
(mm)
EI
ET
(mm)
EW
(g)
BC 40.30 37.52b
25.76 1.47 0.32a
4.01
HS DL 39.86 37.79a
25.81 1.46 0.31b
3.93
SEM 0.24 0.073 0.05 0.51 0.003 0.04
D1 39.35b
37.64 25.56c
1.47a
0.30b
3.84b
D2 39.49b
37.69 25.94a
1.45ab
0.32a
3.99ab
D3 39.64b
37.57 26.03a
1.44b
0.31ab
4.03a
PVmP D4 40.85a
37.67 25.66bc
1.47a
0.30ab
3.92ab
D5 40.07ab
37.58 25.65c
1.47a
0.32a
4.02a
D6 41.06a
37.81 25.89ab
1.46ab
0.32a
4.00ab
SEM 0.41 0.13 0.09 0.01 0.005 0.06
a-cMean values with different superscript in the same column are significantly different
(p<0.05).Ew-Egg weight; EL-Egg length; ED-Egg diameter; EI-Egg shape index; ET-
Eggshell thickness, EW-Eggshell weight, DL-Deep litter, BC-Battery cage, HS-Housing
systems, PVMP- Proprietary vitamin-mineral premixes, D1-diet without proprietary
vitamin-mineral premix, D2, D3, D4, D5 and D6 – dietswith Nutripoult, Hi-Nutrient,
Agrited, Daram vita-mix and Micro-mix respectively, SEM-Standard error of mean
116
The ET of eggs produced by layers fed diets supplemented with Nutripoult (0.32 mm),
Daram vita-mix (0.32) and Micro-mix (0.32) were similar to eggs produced by those on
Hi-Nutrient (0.31) and higher (p<0.05) than those on diets without PVmP (0.30).
Supplemetntation of Hi-Nutrient (4.03) in diets of layers induced the highest EW which
was similar to eggs produced by those on Nutripoult (3.99), Agrited (3.92), Daram vita-
mix (4.02) and Micro-mix (4.00) but higher (p<0.05) than eggs laid by layers fed diets
without PVmP (3.84). The interaction effects of dietary PVmP x HS on external quality
characteristics of eggs from layers from 22 to 35 weeks of age is presented in Table 15.
The combined effect of dietary PVmP supplementations and HS on external quality
characteristics of eggs from layers fed diets supplemented with five different proprietary
vitamin-mineral premixes in two housing systems were significant (p<0.05). The
interaction effects of D4 x BC (41.81) on Ew had the highest and similar to D6 x DL
(41.50), D5 x BC (40.81) and D6 x BC (40.61). The interaction effect of D1 x BC
(39.01) on Ew was the least. Interaction effect of D1 x DL (38.10) on EL recorded the
highest value which was similar to D2 x BC (37.80), D3 x BC (37.61), D4 x BC
(37.67), D6 x BC (37.67), D4 x DL (37.68), D5 x DL (37.94) and D6 x DL (37.94). The
interaction effect of D1 x BC (37.19) on EL was the least.
The interaction effects of D3 x BC on ED was highest (26.03) and similar to D2 x BC
(25.93), D4 x BC (25.87), D6 x BC (25.82), D1 x DL (25.81), D2 x DL (25.94), D3 x
DL (26.02), D5 x DL (25.70) and D6 x DL (25.96). The interaction effect of D1 x BC
(25.31) was the least. Intraction effects of D1 x DL, D4 x DL and D5 x DL on EI were
the same in value (1.48) but similar to D1 x BC (1.47) and D6 x DL (1.46) and higher
(p<0.05) than D3 x BC (1.45), D5 x BC (1.45), D2 x DL (1.45) and D3 x DL (1.44).
Interaction effects of D6 x BC on ET had the highest value (0.33) which was similar to
D1 x BC (0.31), D2 x BC (0.32), D3 x BC (0.31), D4 x BC (0.32), D5 x BC (0.32), D3
x DL (0.32), D5 x DL (0.32) and D6 x DL (0.32). The least value of interaction effect
(0.29) on ET was obtained for D1 x DL and D4 x DL. The highest interaction effects of
D3 x DL (4.18) on EW was similar to D5 x BC (4.17), D6 x BC (4.15), D2 x BC (4.08)
and D4 x BC (3.97) and higher (p<0.05) than D1 x BC (3.78), D3 x BC (3.88), D1 x DL
(3.90), D2 x DL (3.90), D4 x DL (3.88), D5 x DL (3.86) and D6 x DL (3.85).
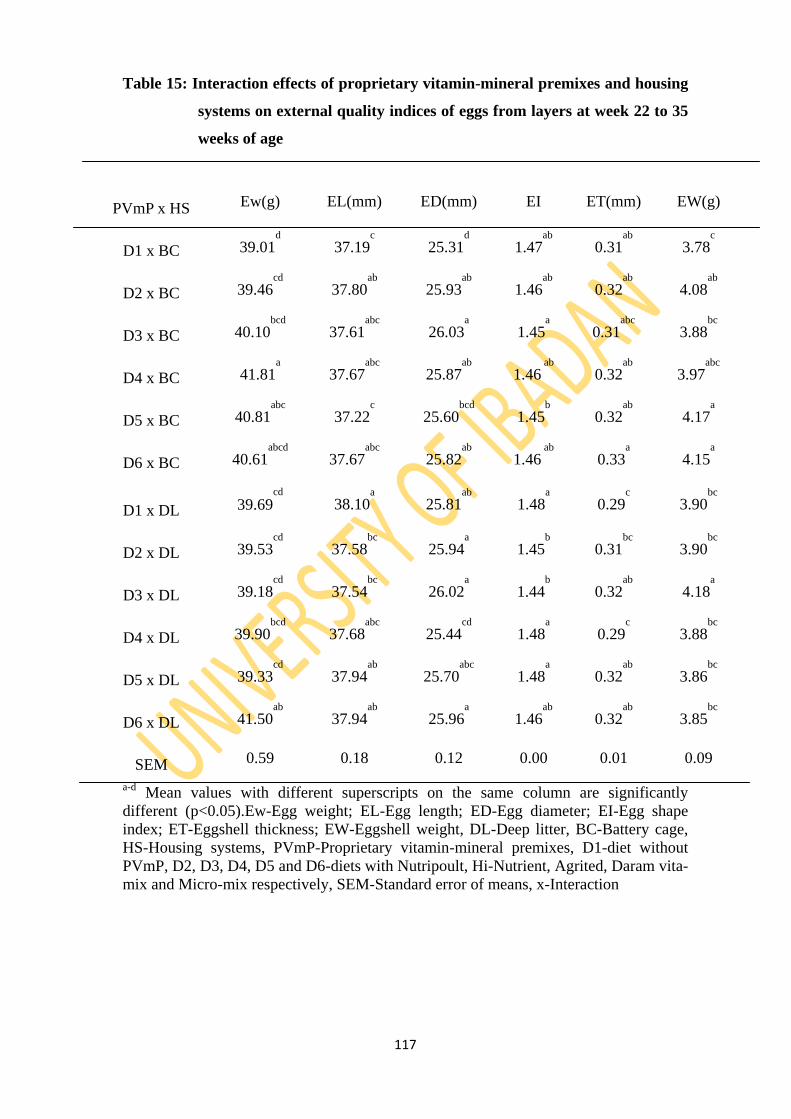
117
Table 15: Interaction effects of proprietary vitamin-mineral premixes and housing
systems on external quality indices of eggs from layers at week 22 to 35
weeks of age
PVmP x HS Ew(g) EL(mm) ED(mm) EI ET(mm) EW(g)
D1 x BC 39.01d
37.19c
25.31d
1.47ab
0.31ab
3.78c
D2 x BC 39.46cd
37.80ab
25.93ab
1.46ab
0.32ab
4.08ab
D3 x BC 40.10bcd
37.61abc
26.03a
1.45a
0.31abc
3.88bc
D4 x BC 41.81a
37.67abc
25.87ab
1.46 ab
0.32ab
3.97abc
D5 x BC 40.81abc
37.22c
25.60bcd
1.45b
0.32ab
4.17a
D6 x BC 40.61abcd
37.67abc
25.82ab
1.46 ab
0.33a
4.15a
D1 x DL 39.69cd
38.10a
25.81ab
1.48a
0.29c
3.90bc
D2 x DL 39.53cd
37.58bc
25.94a
1.45b
0.31bc
3.90bc
D3 x DL 39.18cd
37.54bc
26.02a
1.44b
0.32ab
4.18a
D4 x DL 39.90bcd
37.68abc
25.44cd
1.48a
0.29c
3.88bc
D5 x DL 39.33cd
37.94ab
25.70abc
1.48a
0.32ab
3.86bc
D6 x DL 41.50ab
37.94ab
25.96a
1.46ab
0.32ab
3.85bc
SEM 0.59 0.18 0.12 0.00 0.01 0.09
a-d Mean values with different superscripts on the same column are significantly
different (p<0.05).Ew-Egg weight; EL-Egg length; ED-Egg diameter; EI-Egg shape
index; ET-Eggshell thickness; EW-Eggshell weight, DL-Deep litter, BC-Battery cage,
HS-Housing systems, PVmP-Proprietary vitamin-mineral premixes, D1-diet without
PVmP, D2, D3, D4, D5 and D6-diets with Nutripoult, Hi-Nutrient, Agrited, Daram vita-
mix and Micro-mix respectively, SEM-Standard error of means, x-Interaction
118
4.4.2: Internal quality indices of eggs from layers fed diets supplemented with five
different proprietary vitamin-mineral premixes in two housing systems
from 22 to 35 weeks of age
Table 16 shows internal quality indices of eggs from layers fed diets supplemented with
five different PVmPin two HS from 22 to 35 weeks of age. Albumen height (AH) and
Haugh Unit (HU) of eggs were not affected (p>0.05) by HS. Egg albumen weight
(AW), yolk weight (YW), height (YH), diameter (YD) and index (YI) varied (p<0.05)
with HS. Layers in BC produced eggs with higher (p<0.05) AW (25.49 g), YH (17.54
mm) and YI (0.65) compared with 24.74, 17.31 and 0.63 respectively for eggs from
those in DL. Thus, DL induced higher (p<0.05) YW (12.42 g) and YD (29.65 mm) in
eggs than in BC. Albumen quality of eggs reduced significantly (p<0.05) with dietary
PVmP supplementtions. Layers fed diets without PVmP (D1) produced eggs with
higher (p<0.05) AW (25.60 g), AH (5.99 mm) and HU (83.08) compared with eggs fed
diets supplemented with PVmPs. The AW of eggs from layers on diets supplemented
with Nutripoult (25.48 g), Hi-Nutrient (25.38 g) and Micro-mix (25.11 g) were similar
to those fed diets without PVmP (25.60 g) but higher (p<0.05) compared with eggs
from those on diets supplemented with Daram vita-mix (24.44). The YW, YD and Yolk
Colour (YC) increased (p<0.05) with dietary PVmPs, while YH and YI decreased
(p<0.05).
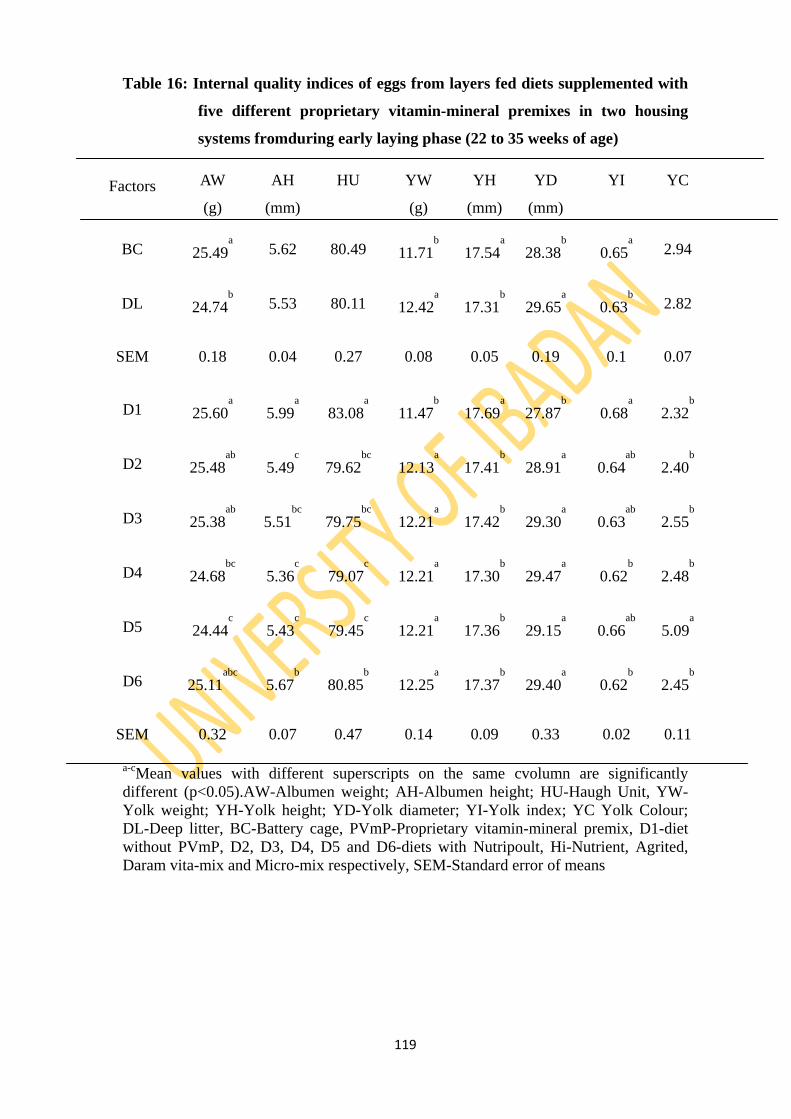
119
Table 16: Internal quality indices of eggs from layers fed diets supplemented with
five different proprietary vitamin-mineral premixes in two housing
systems fromduring early laying phase (22 to 35 weeks of age)
Factors AW
(g)
AH
(mm)
HU
YW
(g)
YH
(mm)
YD
(mm)
YI
YC
BC 25.49a
5.62 80.49 11.71b
17.54a
28.38b
0.65a
2.94
DL 24.74b
5.53 80.11 12.42a
17.31b
29.65a
0.63b
2.82
SEM 0.18 0.04 0.27 0.08 0.05 0.19 0.1 0.07
D1 25.60a
5.99a
83.08a
11.47b
17.69a
27.87b
0.68a
2.32b
D2 25.48ab
5.49c
79.62bc
12.13a
17.41b
28.91a
0.64ab
2.40b
D3 25.38ab
5.51bc
79.75bc
12.21a
17.42b
29.30a
0.63ab
2.55b
D4 24.68bc
5.36c
79.07c
12.21a
17.30b
29.47a
0.62b
2.48b
D5 24.44c
5.43c
79.45c
12.21a
17.36b
29.15a
0.66ab
5.09a
D6 25.11abc
5.67b
80.85b
12.25a
17.37b
29.40a
0.62b
2.45b
SEM 0.32 0.07 0.47 0.14 0.09 0.33 0.02 0.11
a-cMean values with different superscripts on the same cvolumn are significantly
different (p<0.05).AW-Albumen weight; AH-Albumen height; HU-Haugh Unit, YW-
Yolk weight; YH-Yolk height; YD-Yolk diameter; YI-Yolk index; YC Yolk Colour;
DL-Deep litter, BC-Battery cage, PVmP-Proprietary vitamin-mineral premix, D1-diet
without PVmP, D2, D3, D4, D5 and D6-diets with Nutripoult, Hi-Nutrient, Agrited,
Daram vita-mix and Micro-mix respectively, SEM-Standard error of means
120
The YW of eggs from layers fed diet supplemented with Micro-mix (12.25 g) was
similar to eggs from those on diets with Nutripoult (12.13 g), Hi-Nutrient (12.21 g),
Agrited (12.21 g) and Daram vita-mix (12.21 g) but higher (p<0.05) compared with
eggs laid by those fed diets without PVmP (11.47). The YH of eggs from layers fed
diets without PVmP (17.69 mm) was higher (p<0.05) than those fed PVmP
supplementations.
The YD of eggs from layers fed diets supplemented with Agrited (29.47 mm) was
similar to those on diets supplemeted with Nutripoult (28.91 mm), Hi-Nutrient (29.20
mm), Daram vita-mix (29.15) and Micro-mix (29.40 mm) but higher (p<0.05) than eggs
produced by those on diets without PVmP (27.87 mm). The YI of eggs from layers fed
diets without PVmP (0.68) and supplemented with Nutripoult(0.64), Hi-Nutrient (0.63)
and Daram vita-mix (0.66) were simlar bu higher (p<0.05) compared with eggs laid by
those on Agrited (0.62) and Micro-mix (0.62). The YC of eggs produced by layers on
diets that contained Daram vita-mix (5.09) was higher (p<0.05) compared with eggs
laid by those fed diets without PVmP (2.32), Nutripoult (2.40), Hi-Nutrient (2.55),
Agrited (2.48) and Micro-mix (2.45). Table 17 indicates significant interaction effects
(p<0.05) of dietary PVmP and HS on all parameters of internal quality of eggs from
layers fed diets supplemented with five different PVmP in two HS from 22 to 35 weeks
of age.
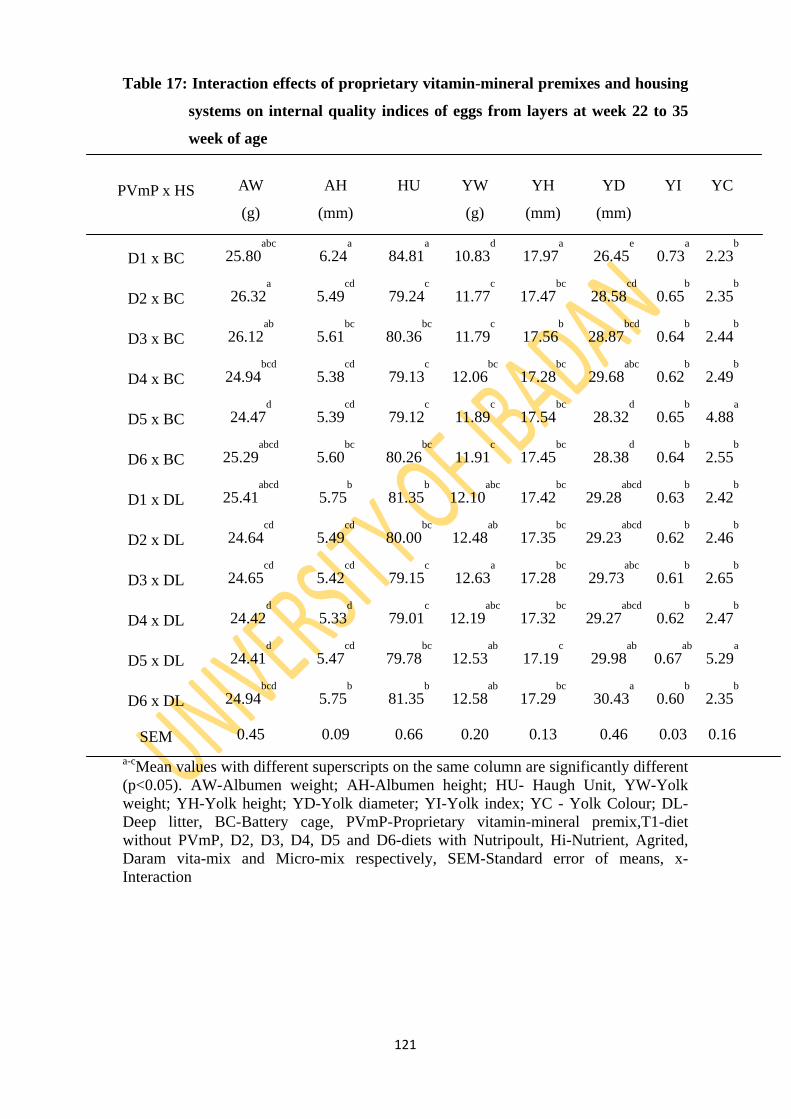
121
Table 17: Interaction effects of proprietary vitamin-mineral premixes and housing
systems on internal quality indices of eggs from layers at week 22 to 35
week of age
PVmP x HS
AW
(g)
AH
(mm)
HU
YW
(g)
YH
(mm)
YD
(mm)
YI
YC
D1 x BC 25.80abc
6.24a
84.81a
10.83d
17.97a
26.45e
0.73a
2.23b
D2 x BC 26.32a
5.49cd
79.24c
11.77c
17.47bc
28.58cd
0.65b
2.35b
D3 x BC 26.12ab
5.61bc
80.36bc
11.79c
17.56b
28.87bcd
0.64b
2.44b
D4 x BC 24.94bcd
5.38cd
79.13c
12.06bc
17.28bc
29.68abc
0.62b
2.49b
D5 x BC 24.47d
5.39cd
79.12c
11.89c
17.54bc
28.32d
0.65b
4.88a
D6 x BC 25.29abcd
5.60bc
80.26bc
11.91c
17.45bc
28.38d
0.64b
2.55b
D1 x DL 25.41abcd
5.75b
81.35b
12.10abc
17.42bc
29.28abcd
0.63b
2.42b
D2 x DL 24.64cd
5.49cd
80.00bc
12.48ab
17.35bc
29.23abcd
0.62b
2.46b
D3 x DL 24.65cd
5.42cd
79.15c
12.63a
17.28bc
29.73abc
0.61b
2.65b
D4 x DL 24.42d
5.33d
79.01c
12.19abc
17.32bc
29.27abcd
0.62b
2.47b
D5 x DL 24.41d
5.47cd
79.78bc
12.53ab
17.19c
29.98ab
0.67ab
5.29a
D6 x DL 24.94bcd
5.75b
81.35b
12.58ab
17.29bc
30.43a
0.60b
2.35b
SEM 0.45 0.09 0.66 0.20 0.13 0.46 0.03 0.16
a-cMean values with different superscripts on the same column are significantly different
(p<0.05). AW-Albumen weight; AH-Albumen height; HU- Haugh Unit, YW-Yolk
weight; YH-Yolk height; YD-Yolk diameter; YI-Yolk index; YC - Yolk Colour; DL-
Deep litter, BC-Battery cage, PVmP-Proprietary vitamin-mineral premix,T1-diet
without PVmP, D2, D3, D4, D5 and D6-diets with Nutripoult, Hi-Nutrient, Agrited,
Daram vita-mix and Micro-mix respectively, SEM-Standard error of means, x-
Interaction
122
4.4.3: Effect of duration of storage on external quality indices of eggs from layers
fed diets supplemented with five different proprietary vitamin-mineral
premixes in two housing systems from 36 to 52 weeks of age
Effect of duration of storage on external quality indices of eggs from layers fed diets
supplemented with five different PVmP in two housing systems from 36 to 52 weeks of
age are presented in Table 18. The EW, ET and Egg weight Loss (EwL) varied
significantly (p<0.05) with HS, while Ew and EI were not affected. The EW (5.89 g)
and ET (0.35 mm) of eggs of layers in BC were higher (p<0.05) compared with 5.58
and 0.33 respectively for eggs produced in DL. The EwL of layers in DL (1.70 %) was
higher (p<0.05) compared with 1.60% for eggs produced in BC. The different dietary
PVmP did not affect (p>0.05) Ew, ET and EI but varied (p<0.05) with EW and EwL.
The EW of eggs produced by layers fed Nutripoult (5.89 g) was similar to those fed fed
diets supplemented with Daram vita-mix (5.73) and Micro-mix (5.84) but were higher
(p<0.05) than those fed diets supplemented with Hi-Nutrient (5.59) and Agrited (5.61).
The highest EwL value was recorded for eggs laid by layers fed Hi-Nutrient (1.80%)
which was similar to those fed diets supplemented with Nutripoult (1.70) and Agrited
(1.70) but higher (p<0.05) than those on Daram vita-mix (1.50) and Micro-mix (1.50).
The EW, ET and EwL varied (p<0.05) with days of egg storage. The Ew and EI were
not affected (p>0.05) by days of egg storage. The EW and EwL increased (p<0.05) with
days of storage, while ET decreased (p<0.05). The interaction effectd of PVmP and HS
(PVmP x HS), HS and DoS (HS x DoS), PVmP and DoS (PVmP x DoS) and PVmP,
HS and DoS (PVMP x HS x DES) on external quality indices eggs layers fed diets
supplemented with five different PVmP in two HS from 36 to 52 weeks of age were not
significant (p>0.05). Also, interaction effects of PVmP and DoS (PVmP x DoS) and
PVmP, HS and DoS (PVmP x HS x DoS) on ET were significant (p<0.01).
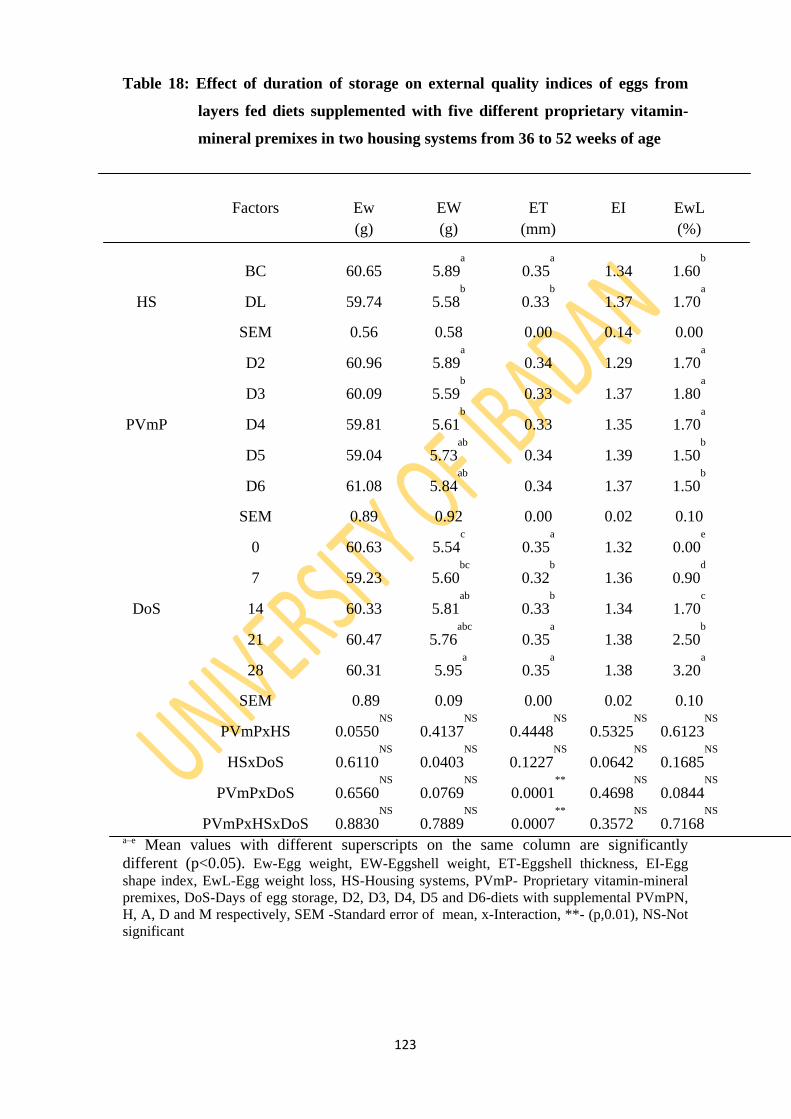
123
Table 18: Effect of duration of storage on external quality indices of eggs from
layers fed diets supplemented with five different proprietary vitamin-
mineral premixes in two housing systems from 36 to 52 weeks of age
Factors
Ew
(g)
EW
(g)
ET
(mm)
EI
EwL
(%)
BC 60.65 5.89a
0.35a
1.34 1.60b
HS DL 59.74 5.58b
0.33b
1.37 1.70a
SEM 0.56 0.58 0.00 0.14 0.00
D2 60.96 5.89a
0.34 1.29 1.70a
D3 60.09 5.59b
0.33 1.37 1.80a
PVmP D4 59.81 5.61b
0.33 1.35 1.70a
D5 59.04 5.73ab
0.34 1.39 1.50b
D6 61.08 5.84ab
0.34 1.37 1.50b
SEM 0.89 0.92 0.00 0.02 0.10
0 60.63 5.54c
0.35a
1.32 0.00e
7 59.23 5.60bc
0.32b
1.36 0.90d
DoS 14 60.33 5.81ab
0.33b
1.34 1.70c
21 60.47 5.76abc
0.35a
1.38 2.50b
28 60.31 5.95a
0.35a
1.38 3.20a
SEM 0.89 0.09 0.00 0.02 0.10
PVmPxHS 0.0550NS
0.4137NS
0.4448NS
0.5325NS
0.6123NS
HSxDoS 0.6110NS
0.0403NS
0.1227NS
0.0642NS
0.1685NS
PVmPxDoS 0.6560NS
0.0769NS
0.0001**
0.4698NS
0.0844NS
PVmPxHSxDoS 0.8830NS
0.7889NS
0.0007**
0.3572NS
0.7168NS
a–e Mean values with different superscripts on the same column are significantly
different (p<0.05). Ew-Egg weight, EW-Eggshell weight, ET-Eggshell thickness, EI-Egg
shape index, EwL-Egg weight loss, HS-Housing systems, PVmP- Proprietary vitamin-mineral
premixes, DoS-Days of egg storage, D2, D3, D4, D5 and D6-diets with supplemental PVmPN,
H, A, D and M respectively, SEM -Standard error of mean, x-Interaction, **- (p,0.01), NS-Not
significant
124
4.4.4: Effect of duration of storage on internal quality indices of eggs from layers
fed diets supplemented with five different proprietary vitamin-mineral
premixes in two housing systems from 36 to 52 weeks of age
Effect of duration of storage on internal quality indices of eggs from layers fed diets
supplemented with five different dietary PVmP in two housing systems from 36 to 52
weeks of age are presented in Table 19. Albumen pH (ApH) and AW of eggs were not
affected (p>0.05) by HS, while AH and HU varied (p<0.05). Eggs produced by layers in
BC had higher (p<0.05) AH (3.69 mm) and HU (48.68) than 3.50 and 44.78,
respectively in DL. Yolk quality indices of eggs were not affected (p>0.05) by HS.
Albumen and yolk quality indices of eggs did not vary (p>0.05) with dietary PVmP
supplementation aside AH and HU. The highest AH value was obtained from eggs
produced by layers fed diet supplemented with Micro-mix (3.72 mm) and simllar to
eggs from those fed diets with Nutripoult (3.69), Hi-Nutrient (3.57) and Daram vita-mix
(3.67) but higher (p<0.05) than those supplemented with Agrited (3.33).
The HU of eggs produced by layers fed diets supplemented with Daram vita-mix
(48.64) was similar to those fed Nutripoult (46.13) and Micro-mix (48.03) and higher
(p<0.05) than those on Hi-Nutrient (46.08) and Agrited (44.75). The ApH, AH, HU, YH
and YI varied (p<0.05) with DoS. However, AW, YW, YR and YAR were not affected
(p>0.05) in DoS. As ApH of eggs increased (p<0.05), AH, HU, YH and YI decreased
(p<0.05) in DoS. The interaction effects of PVmP and HS (PVmP x HS); HS and DoS
(HS x DoS); PVmP and DoS (PVmP x DoS); and PVmP, HS and DoS (PVmP x HS x
DoS) on internal quality indices of eggs from layers fed diets supplemented with five
different PVmP in two HS were not different (p>0.05). The interaction effect of PVmP
and DoS (PVmP x DoS) affected (p<0.05) AH and HU
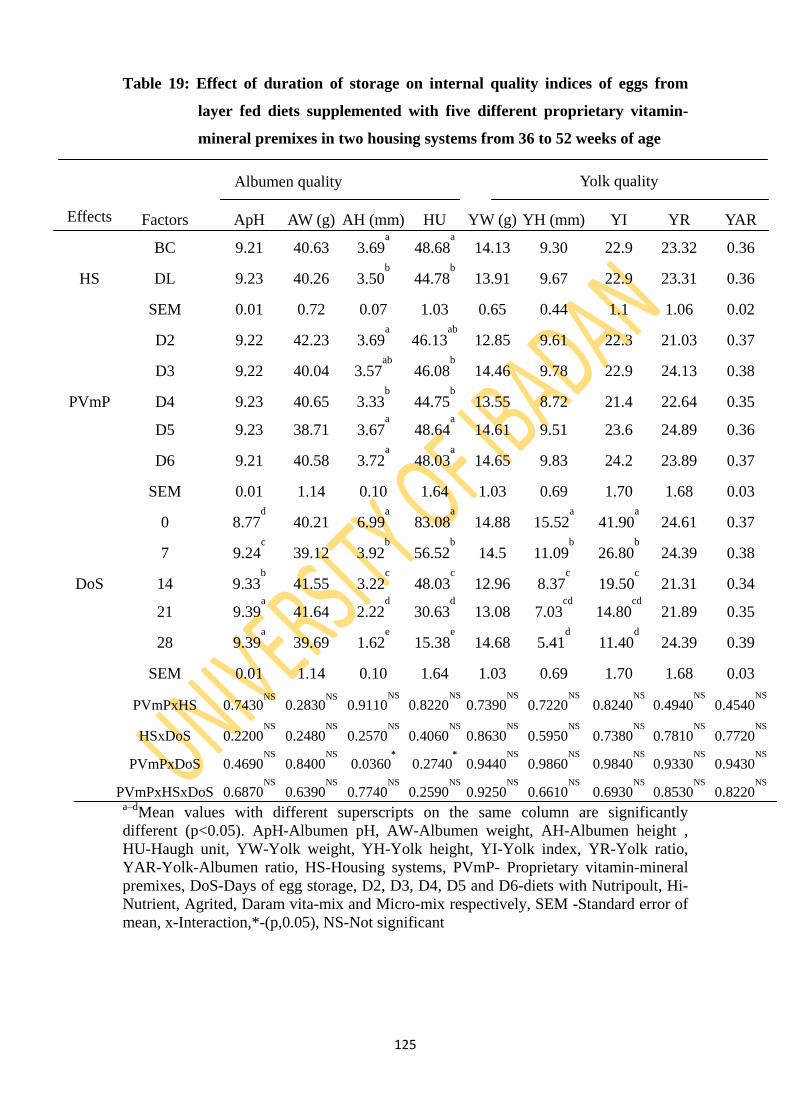
125
Table 19: Effect of duration of storage on internal quality indices of eggs from
layer fed diets supplemented with five different proprietary vitamin-
mineral premixes in two housing systems from 36 to 52 weeks of age
Albumen quality Yolk quality
Effects Factors ApH AW (g) AH (mm) HU YW (g) YH (mm) YI YR YAR
BC 9.21 40.63 3.69a
48.68a
14.13 9.30 22.9 23.32 0.36
HS DL 9.23 40.26 3.50b
44.78b
13.91 9.67 22.9 23.31 0.36
SEM 0.01 0.72 0.07 1.03 0.65 0.44 1.1 1.06 0.02
D2 9.22 42.23 3.69a
46.13ab
12.85 9.61 22.3 21.03 0.37
D3 9.22 40.04 3.57ab
46.08b
14.46 9.78 22.9 24.13 0.38
PVmP D4 9.23 40.65 3.33b
44.75b
13.55 8.72 21.4 22.64 0.35
D5 9.23 38.71 3.67a
48.64a
14.61 9.51 23.6 24.89 0.36
D6 9.21 40.58 3.72a
48.03a
14.65 9.83 24.2 23.89 0.37
SEM 0.01 1.14 0.10 1.64 1.03 0.69 1.70 1.68 0.03
0 8.77d
40.21 6.99a
83.08a
14.88 15.52a
41.90a
24.61 0.37
7 9.24c
39.12 3.92b
56.52b
14.5 11.09b
26.80b
24.39 0.38
DoS 14 9.33b
41.55 3.22c
48.03c
12.96 8.37c
19.50c
21.31 0.34
21 9.39a
41.64 2.22d
30.63d
13.08 7.03cd
14.80cd
21.89 0.35
28 9.39a
39.69 1.62e
15.38e
14.68 5.41d
11.40d
24.39 0.39
SEM 0.01 1.14 0.10 1.64 1.03 0.69 1.70 1.68 0.03
PVmPxHS 0.7430NS
0.2830NS
0.9110NS
0.8220NS
0.7390NS
0.7220NS
0.8240NS
0.4940NS
0.4540NS
HSxDoS 0.2200NS
0.2480NS
0.2570NS
0.4060NS
0.8630NS
0.5950NS
0.7380NS
0.7810NS
0.7720NS
PVmPxDoS 0.4690NS
0.8400NS
0.0360*
0.2740*
0.9440NS
0.9860NS
0.9840NS
0.9330NS
0.9430NS
PVmPxHSxDoS 0.6870NS
0.6390NS
0.7740NS
0.2590NS
0.9250NS
0.6610NS
0.6930NS
0.8530NS
0.8220NS
a–d
Mean values with different superscripts on the same column are significantly
different (p<0.05). ApH-Albumen pH, AW-Albumen weight, AH-Albumen height ,
HU-Haugh unit, YW-Yolk weight, YH-Yolk height, YI-Yolk index, YR-Yolk ratio,
YAR-Yolk-Albumen ratio, HS-Housing systems, PVmP- Proprietary vitamin-mineral
premixes, DoS-Days of egg storage, D2, D3, D4, D5 and D6-diets with Nutripoult, Hi-
Nutrient, Agrited, Daram vita-mix and Micro-mix respectively, SEM -Standard error of
mean, x-Interaction,*-(p,0.05), NS-Not significant
126
4.4.5: Effect of duration of storage on external quality indices of eggs from layers
fed diets supplemented with five different proprietary vitamin-mineral
premixes in two housing systems from 53 to 70 weeks of age
Effect of duration of storage on external quality characteristics of eggs from layers fed
diets supplemented with five different PVmP in two HS from 53 to 70 weeks of age is
presented in Table 20. All indices of external quality characteristics of eggs were not
influenced (p>0.05) by HS aside egg diameter (ED). Eggs produced by layers in BC
were wider (p<0.05) than eggs from DL. However, the dietary PVmP did not affect
(p>0.05) all indices of external quality of eggs. Egg length (EL), diameter (ED) and
shell index (EI) were not affected (p>0.05) by DoS, while egg weight (Ew), shell weight
(EW), shell thickness (ET) and weight loss (EwL) varied (p<0.05). The ET and EwL
increased (p<0.05) with DoS, while EW and EW decreased (p<0.05).
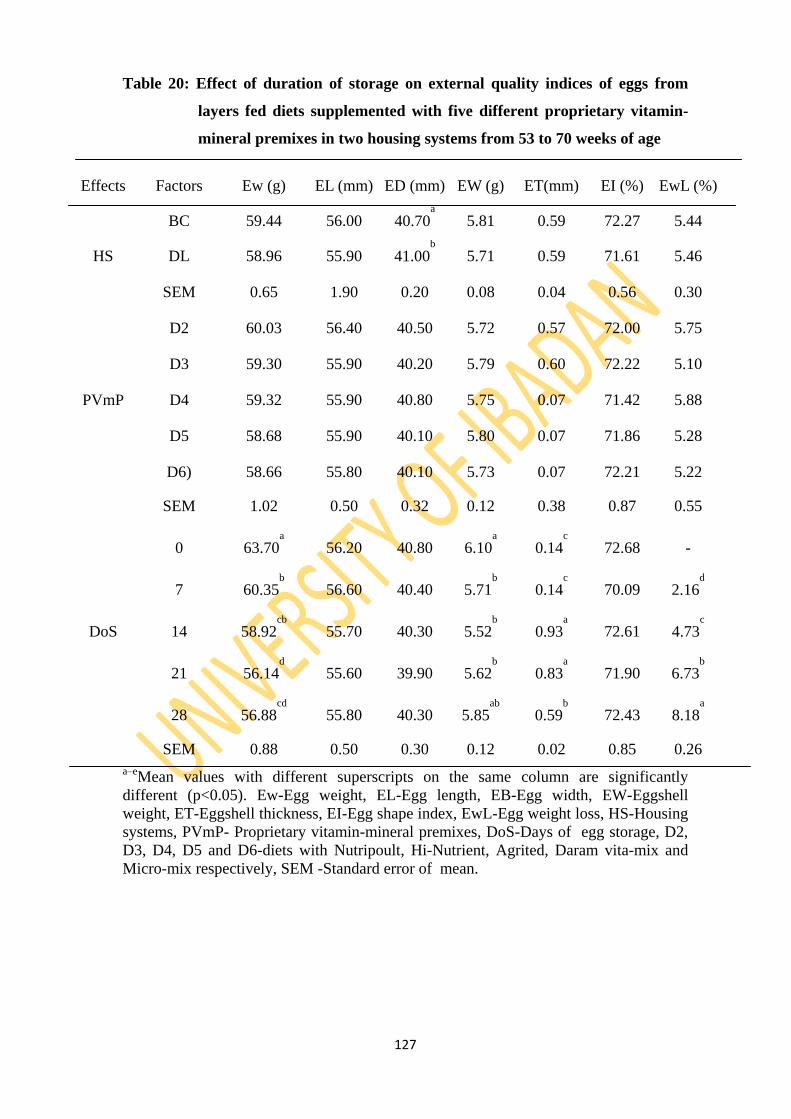
127
Table 20: Effect of duration of storage on external quality indices of eggs from
layers fed diets supplemented with five different proprietary vitamin-
mineral premixes in two housing systems from 53 to 70 weeks of age
Effects Factors Ew (g) EL (mm) ED (mm) EW (g) ET(mm) EI (%) EwL (%)
BC 59.44 56.00 40.70a
5.81 0.59 72.27 5.44
HS DL 58.96 55.90 41.00b
5.71 0.59 71.61 5.46
SEM 0.65 1.90 0.20 0.08 0.04 0.56 0.30
D2 60.03 56.40 40.50 5.72 0.57 72.00 5.75
D3 59.30 55.90 40.20 5.79 0.60 72.22 5.10
PVmP D4 59.32 55.90 40.80 5.75 0.07 71.42 5.88
D5 58.68 55.90 40.10 5.80 0.07 71.86 5.28
D6) 58.66 55.80 40.10 5.73 0.07 72.21 5.22
SEM 1.02 0.50 0.32 0.12 0.38 0.87 0.55
0 63.70a
56.20 40.80 6.10a
0.14c
72.68 -
7 60.35b
56.60 40.40 5.71b
0.14c
70.09 2.16d
DoS 14 58.92cb
55.70 40.30 5.52b
0.93a
72.61 4.73c
21 56.14d
55.60 39.90 5.62b
0.83a
71.90 6.73b
28 56.88cd
55.80 40.30 5.85ab
0.59b
72.43 8.18a
SEM 0.88 0.50 0.30 0.12 0.02 0.85 0.26
a–eMean values with different superscripts on the same column are significantly
different (p<0.05). Ew-Egg weight, EL-Egg length, EB-Egg width, EW-Eggshell
weight, ET-Eggshell thickness, EI-Egg shape index, EwL-Egg weight loss, HS-Housing
systems, PVmP- Proprietary vitamin-mineral premixes, DoS-Days of egg storage, D2,
D3, D4, D5 and D6-diets with Nutripoult, Hi-Nutrient, Agrited, Daram vita-mix and
Micro-mix respectively, SEM -Standard error of mean.
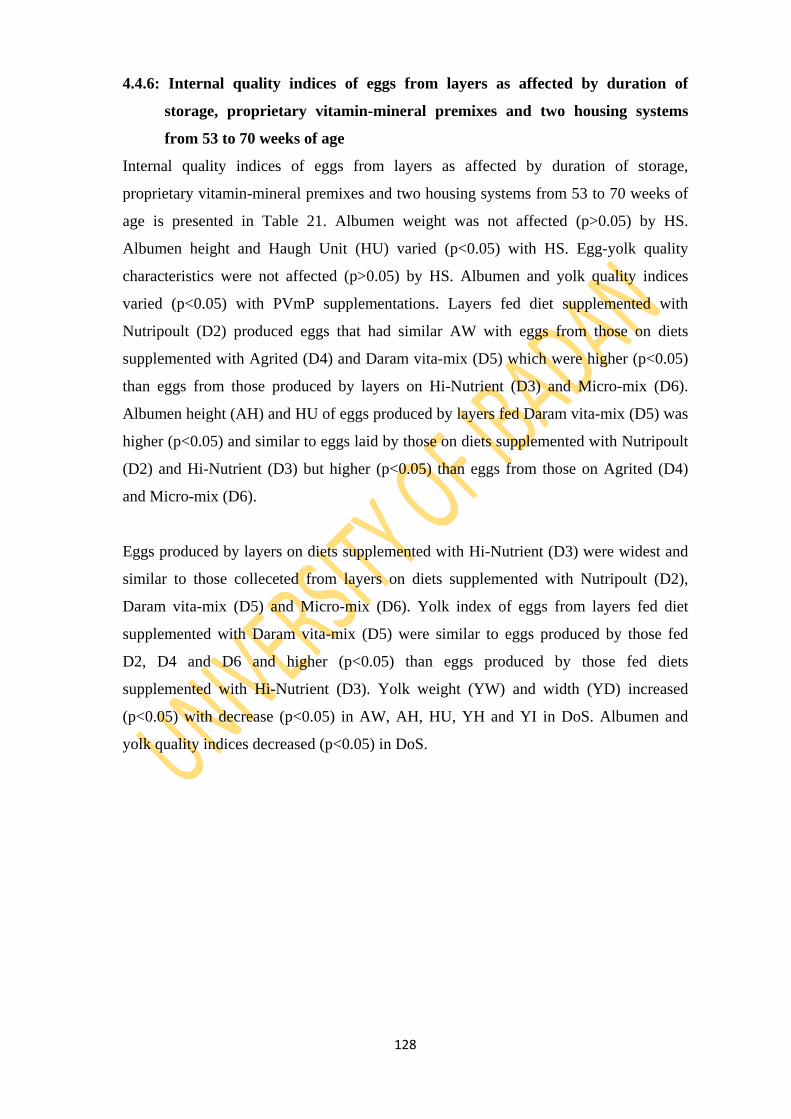
128
4.4.6: Internal quality indices of eggs from layers as affected by duration of
storage, proprietary vitamin-mineral premixes and two housing systems
from 53 to 70 weeks of age
Internal quality indices of eggs from layers as affected by duration of storage,
proprietary vitamin-mineral premixes and two housing systems from 53 to 70 weeks of
age is presented in Table 21. Albumen weight was not affected (p>0.05) by HS.
Albumen height and Haugh Unit (HU) varied (p<0.05) with HS. Egg-yolk quality
characteristics were not affected (p>0.05) by HS. Albumen and yolk quality indices
varied (p<0.05) with PVmP supplementations. Layers fed diet supplemented with
Nutripoult (D2) produced eggs that had similar AW with eggs from those on diets
supplemented with Agrited (D4) and Daram vita-mix (D5) which were higher (p<0.05)
than eggs from those produced by layers on Hi-Nutrient (D3) and Micro-mix (D6).
Albumen height (AH) and HU of eggs produced by layers fed Daram vita-mix (D5) was
higher (p<0.05) and similar to eggs laid by those on diets supplemented with Nutripoult
(D2) and Hi-Nutrient (D3) but higher (p<0.05) than eggs from those on Agrited (D4)
and Micro-mix (D6).
Eggs produced by layers on diets supplemented with Hi-Nutrient (D3) were widest and
similar to those colleceted from layers on diets supplemented with Nutripoult (D2),
Daram vita-mix (D5) and Micro-mix (D6). Yolk index of eggs from layers fed diet
supplemented with Daram vita-mix (D5) were similar to eggs produced by those fed
D2, D4 and D6 and higher (p<0.05) than eggs produced by those fed diets
supplemented with Hi-Nutrient (D3). Yolk weight (YW) and width (YD) increased
(p<0.05) with decrease (p<0.05) in AW, AH, HU, YH and YI in DoS. Albumen and
yolk quality indices decreased (p<0.05) in DoS.
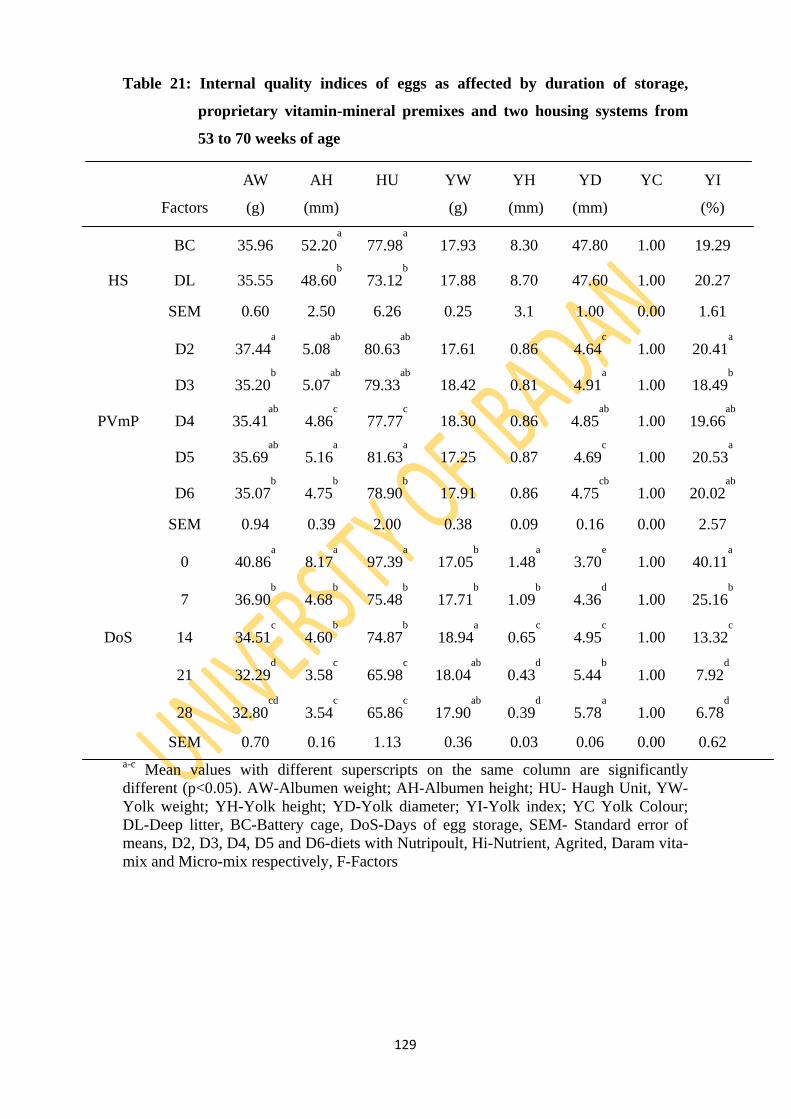
129
Table 21: Internal quality indices of eggs as affected by duration of storage,
proprietary vitamin-mineral premixes and two housing systems from
53 to 70 weeks of age
Factors
AW
(g)
AH
(mm)
HU
YW
(g)
YH
(mm)
YD
(mm)
YC
YI
(%)
BC 35.96 52.20a
77.98a
17.93 8.30 47.80 1.00 19.29
HS DL 35.55 48.60b
73.12b
17.88 8.70 47.60 1.00 20.27
SEM 0.60 2.50 6.26 0.25 3.1 1.00 0.00 1.61
D2 37.44a
5.08ab
80.63ab
17.61 0.86 4.64c
1.00 20.41a
D3 35.20b
5.07ab
79.33ab
18.42 0.81 4.91a
1.00 18.49b
PVmP D4 35.41ab
4.86c
77.77c
18.30 0.86 4.85ab
1.00 19.66ab
D5 35.69ab
5.16a
81.63a
17.25 0.87 4.69c
1.00 20.53a
D6 35.07b
4.75b
78.90b
17.91 0.86 4.75cb
1.00 20.02ab
SEM 0.94 0.39 2.00 0.38 0.09 0.16 0.00 2.57
0 40.86a
8.17a
97.39a
17.05b
1.48a
3.70e
1.00 40.11a
7 36.90b
4.68b
75.48b
17.71b
1.09b
4.36d
1.00 25.16b
DoS 14 34.51c
4.60b
74.87b
18.94a
0.65c
4.95c
1.00 13.32c
21 32.29d
3.58c
65.98c
18.04ab
0.43d
5.44b
1.00 7.92d
28 32.80cd
3.54c
65.86c
17.90ab
0.39d
5.78a
1.00 6.78d
SEM 0.70 0.16 1.13 0.36 0.03 0.06 0.00 0.62
a-c Mean values with different superscripts on the same column are significantly
different (p<0.05). AW-Albumen weight; AH-Albumen height; HU- Haugh Unit, YW-
Yolk weight; YH-Yolk height; YD-Yolk diameter; YI-Yolk index; YC Yolk Colour;
DL-Deep litter, BC-Battery cage, DoS-Days of egg storage, SEM- Standard error of
means, D2, D3, D4, D5 and D6-diets with Nutripoult, Hi-Nutrient, Agrited, Daram vita-
mix and Micro-mix respectively, F-Factors
130
4.4.7: Relationship among external quality indices of eggs as affected by duration
of storage
Variations in external and internal quality indices of eggs with days of storage were
observed. These variations were shown by regression of EW on DoS from 36 to 52 and
53 to 70 weeks of age in equations 13 and 14 respectively below:
Mid-laying phase; y = -0.0173x2 + 0.3297x + 5.026 (R² = 0.85) ……………………13
Late-laying phase; y = 0.0022x2 - 0.0709x + 6.0966 (R² = 0.99) ……………..............14
Shell weight (EW) of stored eggs in mid-laying phase increased up to day 7 of storage
and then nose dived. However, at late-laying (53 to 70 weeks of age), the EW remained
fairly constant as shown in Figure 5 below:
Equations 15 and 16 are regreesions of ET on DoS from 36 to 52 and 53 to 70 weeks of
age as shown below:
Mid-laying phase; y = 0.0001x2 - 0.0024x + 0.344 (R² = 0.55) ……………………. ..15
Late-laying phase; y = -0.002x2 + 0.0786x + 0.0123 (R² = 0.69) ……………………. 16
The ET remained fairly constant in mid-laying phase (36 to 52 weeks of age) and later
increased rapidly but decreased after day 21of storage as shown in Figure 6.
The regressions of EwL on DoS from 36 to 52 and 53 to 70 weeks of age are
represented by equations 17 and 18 respectively below:
Mid-laying phase; y = -0.0006x2 + 0.1306x + 0.0029 (R² = 0.99) ………………….. 17
Late-laying phase; y = -0.0029x2 + 0.3802x - 0.1103 (R² = 0.99) …………………. ..18
Egg weight loss increased linearly in with DoS but more rapid in eggs collected for
storage between 53 to 70 comapred with eggs colleceted for storage between 36 to 52
weeks of age.
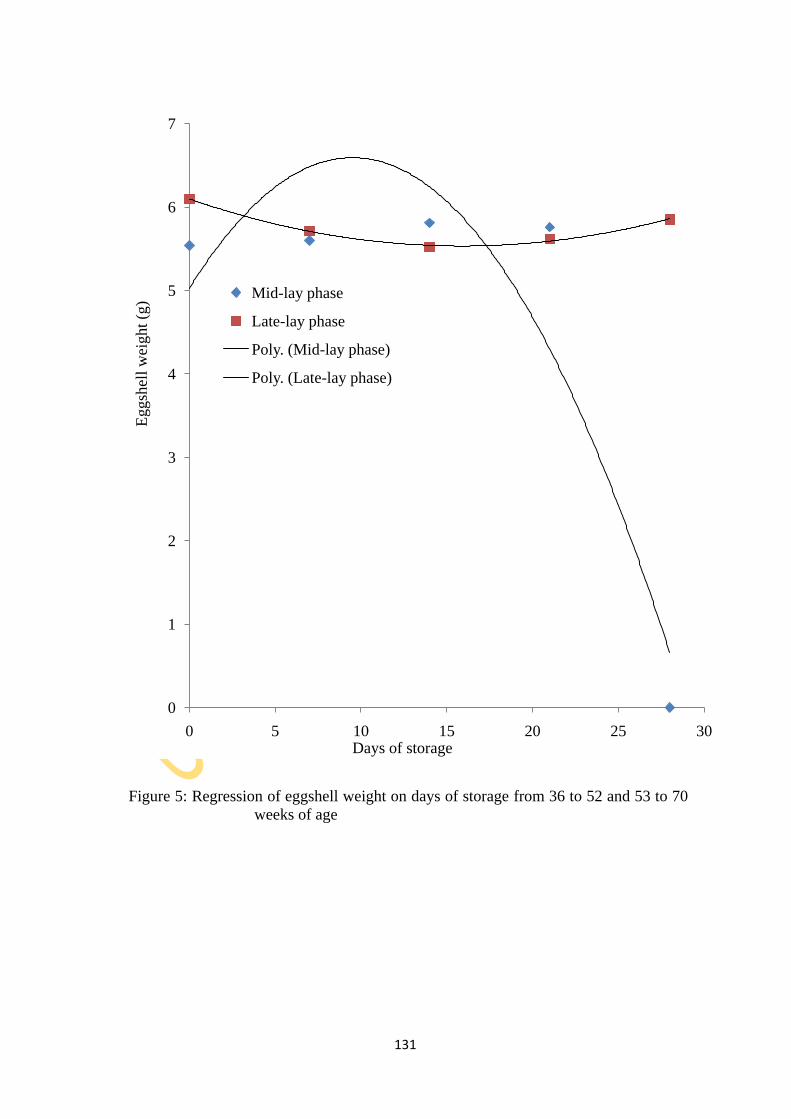
131
Figure 5: Regression of eggshell weight on days of storage from 36 to 52 and 53 to 70
weeks of age
0
1
2
3
4
5
6
7
0 5 10 15 20 25 30
Eggsh
ell
wei
ght
(g)
Days of storage
Mid-lay phase
Late-lay phase
Poly. (Mid-lay phase)
Poly. (Late-lay phase)
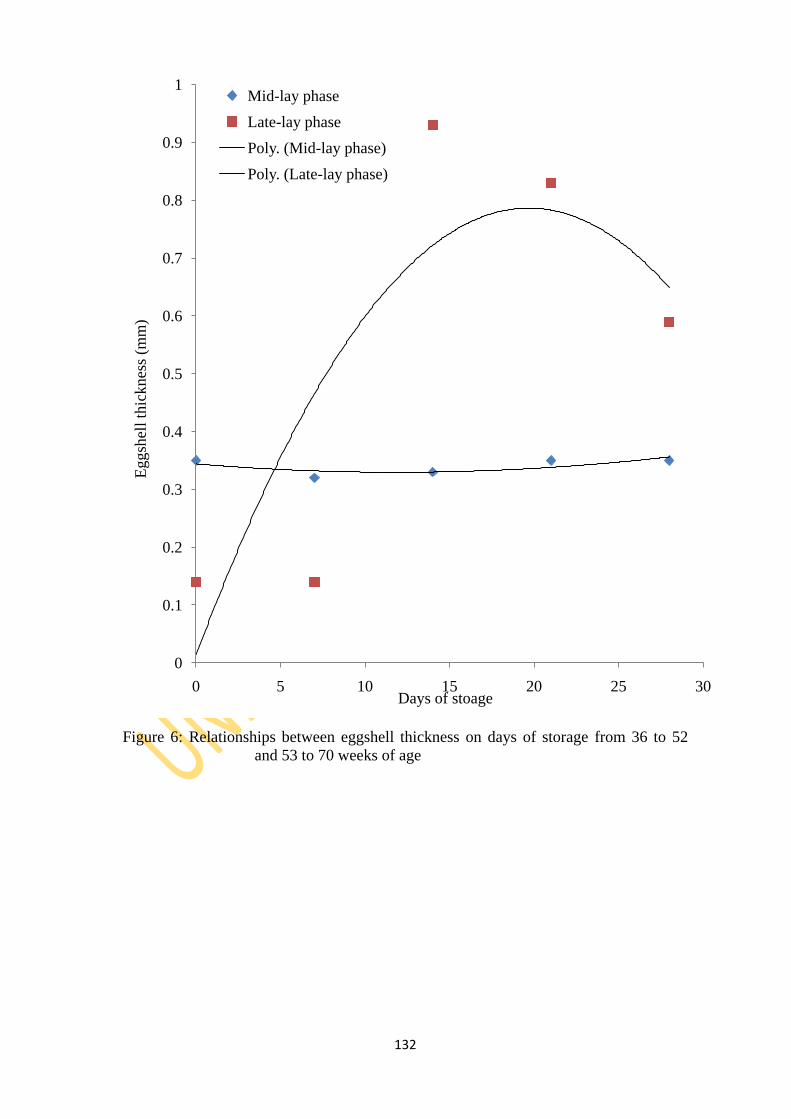
132
Figure 6: Relationships between eggshell thickness on days of storage from 36 to 52
and 53 to 70 weeks of age
0
0.1
0.2
0.3
0.4
0.5
0.6
0.7
0.8
0.9
1
0 5 10 15 20 25 30
Egg
shel
l th
ick
nes
s (m
m)
Days of stoage
Mid-lay phase
Late-lay phase
Poly. (Mid-lay phase)
Poly. (Late-lay phase)
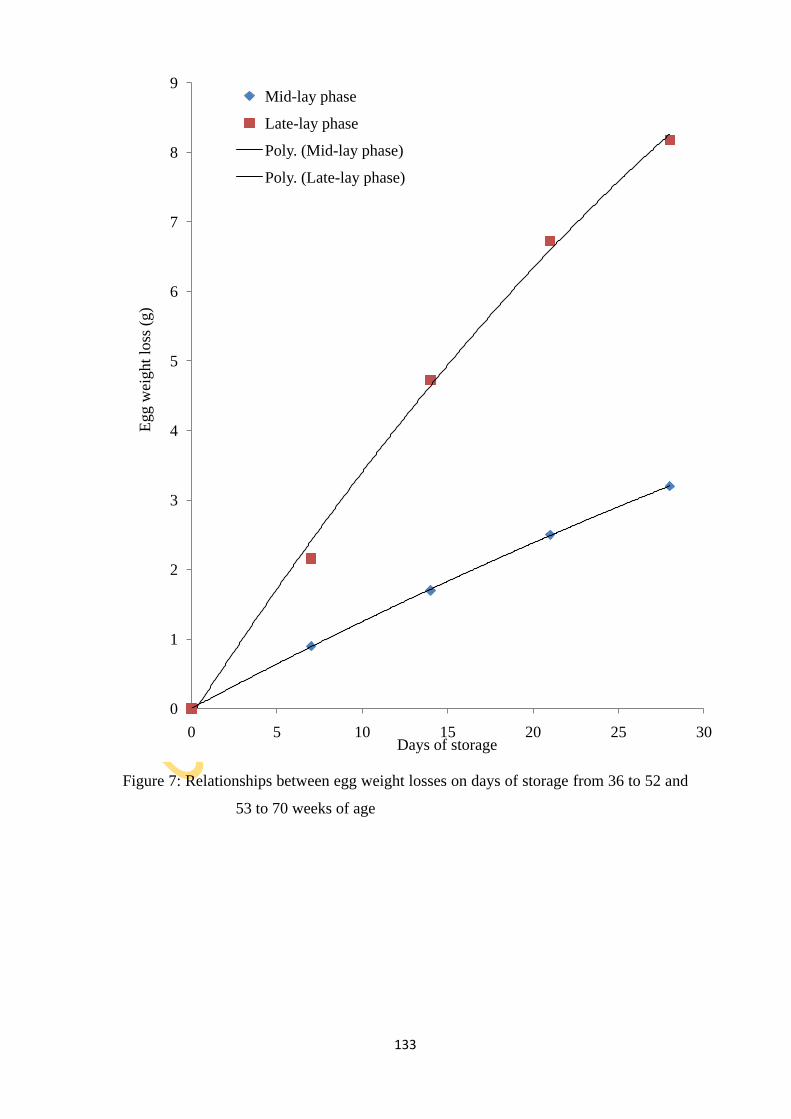
133
Figure 7: Relationships between egg weight losses on days of storage from 36 to 52 and
53 to 70 weeks of age
0
1
2
3
4
5
6
7
8
9
0 5 10 15 20 25 30
Egg w
eight
loss
(g)
Days of storage
Mid-lay phase
Late-lay phase
Poly. (Mid-lay phase)
Poly. (Late-lay phase)
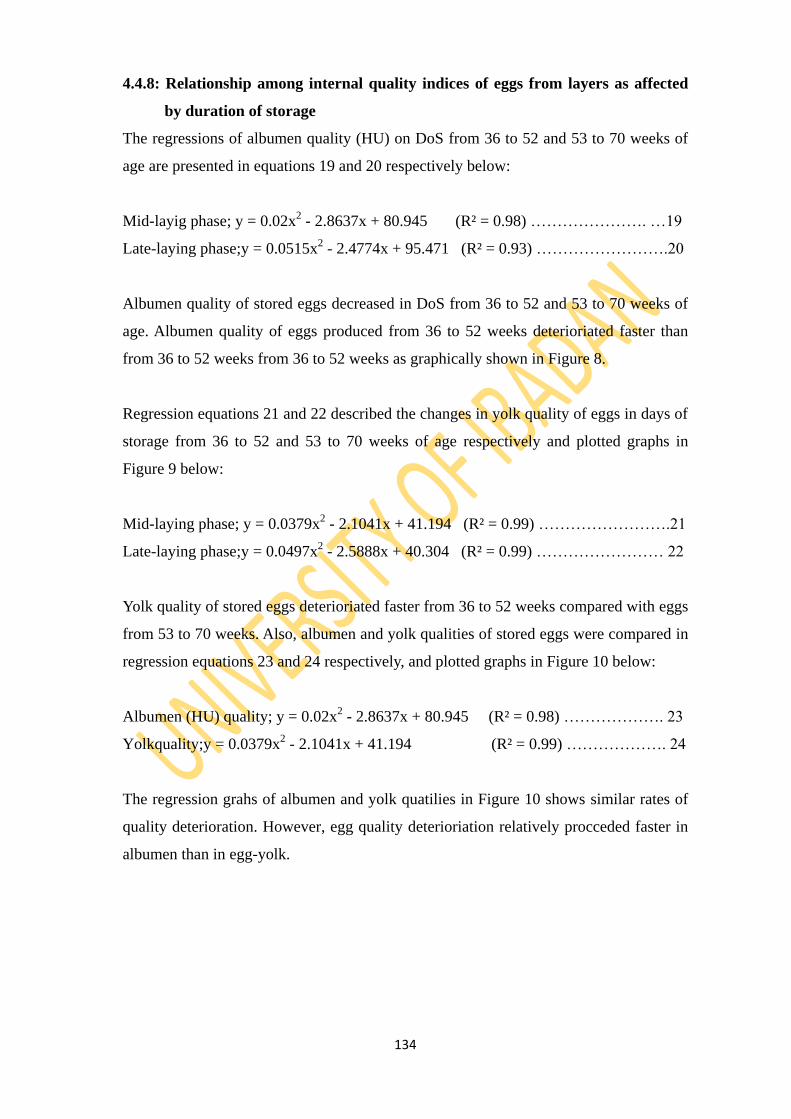
134
4.4.8: Relationship among internal quality indices of eggs from layers as affected
by duration of storage
The regressions of albumen quality (HU) on DoS from 36 to 52 and 53 to 70 weeks of
age are presented in equations 19 and 20 respectively below:
Mid-layig phase; y = 0.02x2 - 2.8637x + 80.945 (R² = 0.98) …………………. …19
Late-laying phase;y = 0.0515x2 - 2.4774x + 95.471 (R² = 0.93) …………………….20
Albumen quality of stored eggs decreased in DoS from 36 to 52 and 53 to 70 weeks of
age. Albumen quality of eggs produced from 36 to 52 weeks deterioriated faster than
from 36 to 52 weeks from 36 to 52 weeks as graphically shown in Figure 8.
Regression equations 21 and 22 described the changes in yolk quality of eggs in days of
storage from 36 to 52 and 53 to 70 weeks of age respectively and plotted graphs in
Figure 9 below:
Mid-laying phase; y = 0.0379x2 - 2.1041x + 41.194 (R² = 0.99) …………………….21
Late-laying phase;y = 0.0497x2 - 2.5888x + 40.304 (R² = 0.99) …………………… 22
Yolk quality of stored eggs deterioriated faster from 36 to 52 weeks compared with eggs
from 53 to 70 weeks. Also, albumen and yolk qualities of stored eggs were compared in
regression equations 23 and 24 respectively, and plotted graphs in Figure 10 below:
Albumen (HU) quality; y = 0.02x2 - 2.8637x + 80.945 (R² = 0.98) ………………. 23
Yolkquality;y = 0.0379x2 - 2.1041x + 41.194 (R² = 0.99) ………………. 24
The regression grahs of albumen and yolk quatilies in Figure 10 shows similar rates of
quality deterioration. However, egg quality deterioriation relatively procceded faster in
albumen than in egg-yolk.
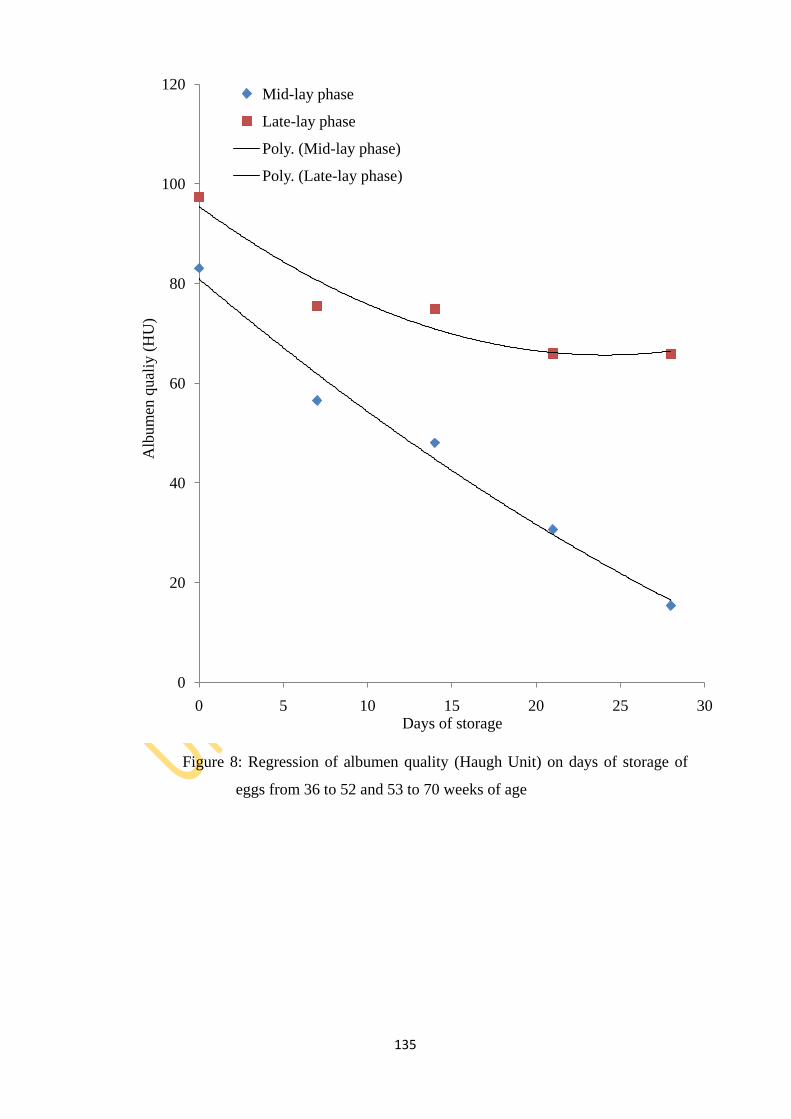
135
Figure 8: Regression of albumen quality (Haugh Unit) on days of storage of
eggs from 36 to 52 and 53 to 70 weeks of age
0
20
40
60
80
100
120
0 5 10 15 20 25 30
Alb
um
en q
ual
iy (
HU
)
Days of storage
Mid-lay phase
Late-lay phase
Poly. (Mid-lay phase)
Poly. (Late-lay phase)
136
Figure 9: Regression of egg-yolk quality on days of storage of eggs at the
mid- and late-laying phases
0
5
10
15
20
25
30
35
40
45
0 5 10 15 20 25 30
Yolk
qual
ity
Days of storage
Mid-lay phase
Late-lay phase
Poly. (Mid-lay phase)
Poly. (Late-lay phase)
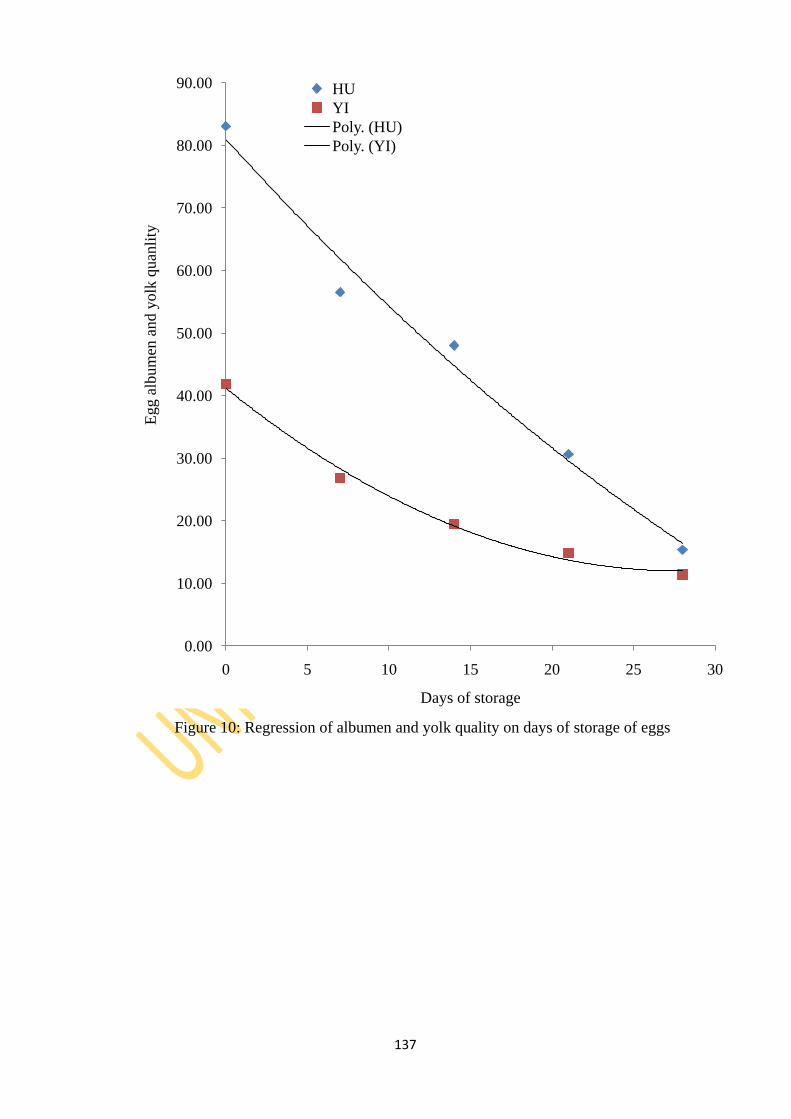
137
Figure 10: Regression of albumen and yolk quality on days of storage of eggs
0.00
10.00
20.00
30.00
40.00
50.00
60.00
70.00
80.00
90.00
0 5 10 15 20 25 30
Egg a
lbum
en a
nd y
olk
quan
lity
Days of storage
HU
YI
Poly. (HU)
Poly. (YI)
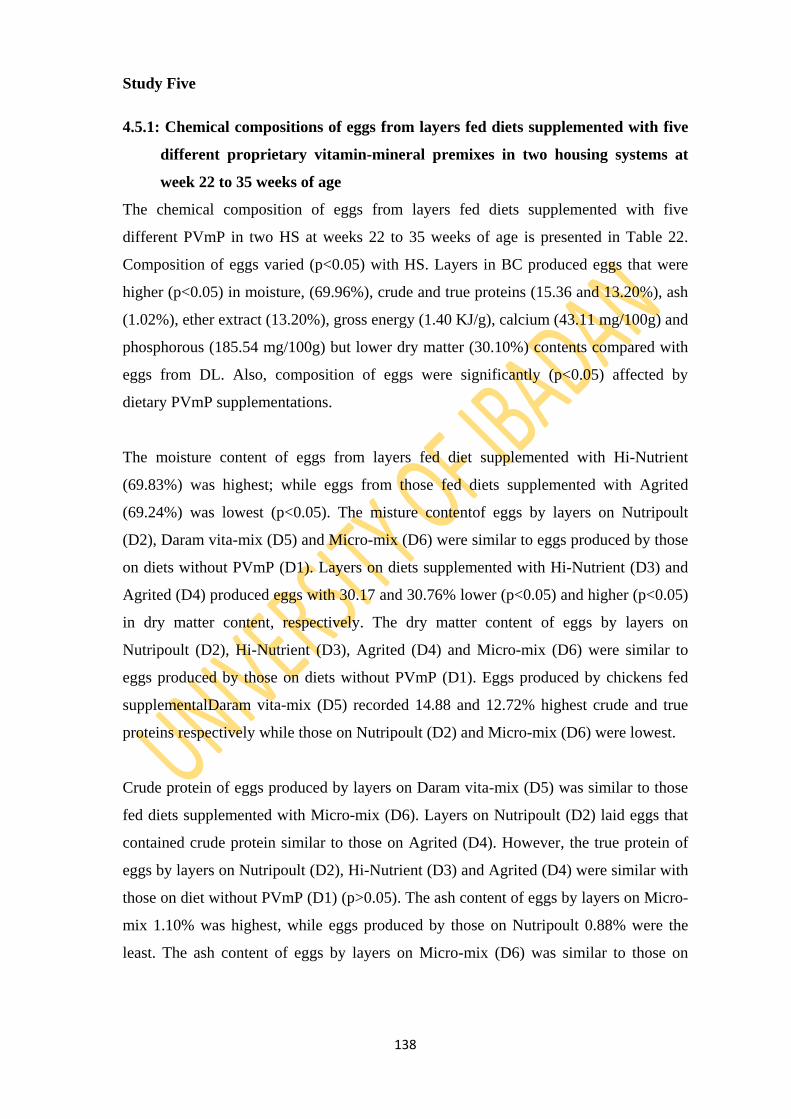
138
Study Five
4.5.1: Chemical compositions of eggs from layers fed diets supplemented with five
different proprietary vitamin-mineral premixes in two housing systems at
week 22 to 35 weeks of age
The chemical composition of eggs from layers fed diets supplemented with five
different PVmP in two HS at weeks 22 to 35 weeks of age is presented in Table 22.
Composition of eggs varied (p<0.05) with HS. Layers in BC produced eggs that were
higher (p<0.05) in moisture, (69.96%), crude and true proteins (15.36 and 13.20%), ash
(1.02%), ether extract (13.20%), gross energy (1.40 KJ/g), calcium (43.11 mg/100g) and
phosphorous (185.54 mg/100g) but lower dry matter (30.10%) contents compared with
eggs from DL. Also, composition of eggs were significantly (p<0.05) affected by
dietary PVmP supplementations.
The moisture content of eggs from layers fed diet supplemented with Hi-Nutrient
(69.83%) was highest; while eggs from those fed diets supplemented with Agrited
(69.24%) was lowest (p<0.05). The misture contentof eggs by layers on Nutripoult
(D2), Daram vita-mix (D5) and Micro-mix (D6) were similar to eggs produced by those
on diets without PVmP (D1). Layers on diets supplemented with Hi-Nutrient (D3) and
Agrited (D4) produced eggs with 30.17 and 30.76% lower (p<0.05) and higher (p<0.05)
in dry matter content, respectively. The dry matter content of eggs by layers on
Nutripoult (D2), Hi-Nutrient (D3), Agrited (D4) and Micro-mix (D6) were similar to
eggs produced by those on diets without PVmP (D1). Eggs produced by chickens fed
supplementalDaram vita-mix (D5) recorded 14.88 and 12.72% highest crude and true
proteins respectively while those on Nutripoult (D2) and Micro-mix (D6) were lowest.
Crude protein of eggs produced by layers on Daram vita-mix (D5) was similar to those
fed diets supplemented with Micro-mix (D6). Layers on Nutripoult (D2) laid eggs that
contained crude protein similar to those on Agrited (D4). However, the true protein of
eggs by layers on Nutripoult (D2), Hi-Nutrient (D3) and Agrited (D4) were similar with
those on diet without PVmP (D1) (p>0.05). The ash content of eggs by layers on Micro-
mix 1.10% was highest, while eggs produced by those on Nutripoult 0.88% were the
least. The ash content of eggs by layers on Micro-mix (D6) was similar to those on
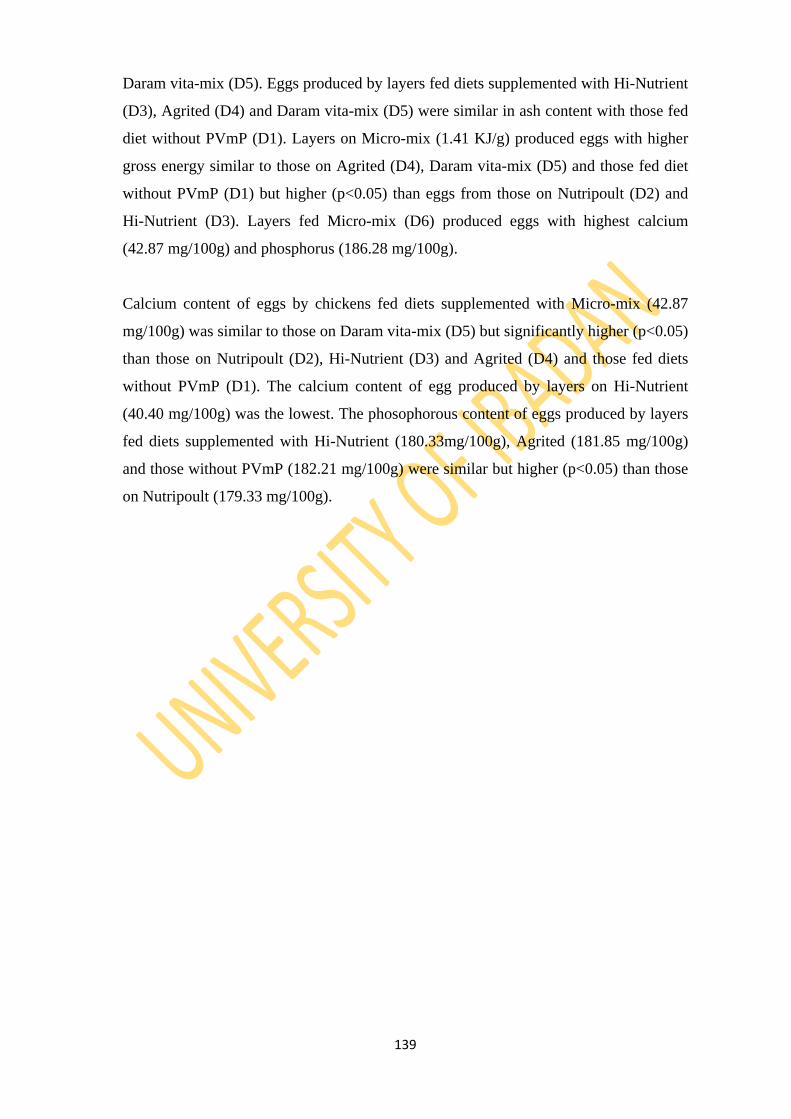
139
Daram vita-mix (D5). Eggs produced by layers fed diets supplemented with Hi-Nutrient
(D3), Agrited (D4) and Daram vita-mix (D5) were similar in ash content with those fed
diet without PVmP (D1). Layers on Micro-mix (1.41 KJ/g) produced eggs with higher
gross energy similar to those on Agrited (D4), Daram vita-mix (D5) and those fed diet
without PVmP (D1) but higher (p<0.05) than eggs from those on Nutripoult (D2) and
Hi-Nutrient (D3). Layers fed Micro-mix (D6) produced eggs with highest calcium
(42.87 mg/100g) and phosphorus (186.28 mg/100g).
Calcium content of eggs by chickens fed diets supplemented with Micro-mix (42.87
mg/100g) was similar to those on Daram vita-mix (D5) but significantly higher (p<0.05)
than those on Nutripoult (D2), Hi-Nutrient (D3) and Agrited (D4) and those fed diets
without PVmP (D1). The calcium content of egg produced by layers on Hi-Nutrient
(40.40 mg/100g) was the lowest. The phosophorous content of eggs produced by layers
fed diets supplemented with Hi-Nutrient (180.33mg/100g), Agrited (181.85 mg/100g)
and those without PVmP (182.21 mg/100g) were similar but higher (p<0.05) than those
on Nutripoult (179.33 mg/100g).
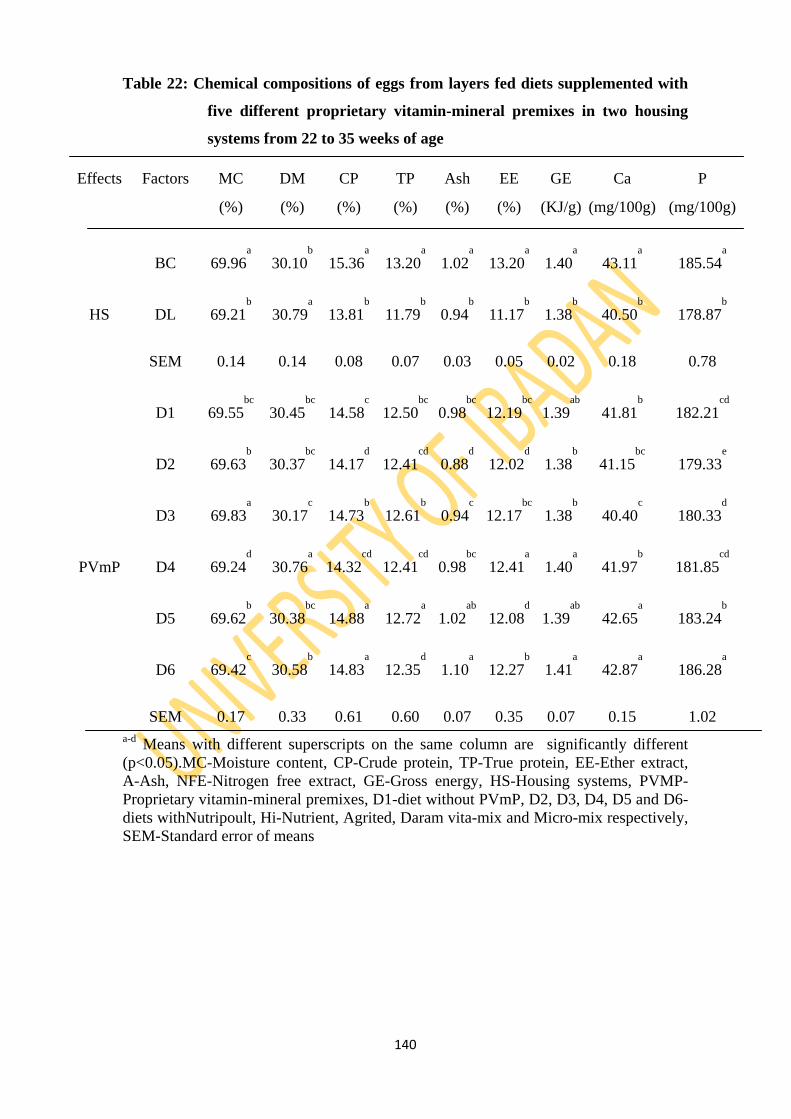
140
Table 22: Chemical compositions of eggs from layers fed diets supplemented with
five different proprietary vitamin-mineral premixes in two housing
systems from 22 to 35 weeks of age
Effects Factors MC DM CP TP Ash EE GE Ca P
(%) (%) (%) (%) (%) (%) (KJ/g) (mg/100g) (mg/100g)
BC 69.96a
30.10b
15.36a
13.20a
1.02a
13.20a
1.40a
43.11a
185.54a
HS DL 69.21b
30.79a
13.81b
11.79b
0.94b
11.17b
1.38b
40.50b
178.87b
SEM 0.14 0.14 0.08 0.07 0.03 0.05 0.02 0.18 0.78
D1 69.55bc
30.45bc
14.58c
12.50bc
0.98bc
12.19bc
1.39ab
41.81b
182.21cd
D2 69.63b
30.37bc
14.17d
12.41cd
0.88d
12.02d
1.38b
41.15bc
179.33e
D3 69.83a
30.17c
14.73b
12.61b
0.94c
12.17bc
1.38b
40.40c
180.33d
PVmP D4 69.24d
30.76a
14.32cd
12.41cd
0.98bc
12.41a
1.40a
41.97b
181.85cd
D5 69.62b
30.38bc
14.88a
12.72a
1.02ab
12.08d
1.39ab
42.65a
183.24b
D6 69.42c
30.58b
14.83a
12.35d
1.10a
12.27b
1.41a
42.87a
186.28a
SEM 0.17 0.33 0.61 0.60 0.07 0.35 0.07 0.15 1.02
a-d Means with different superscripts on the same column are significantly different
(p<0.05).MC-Moisture content, CP-Crude protein, TP-True protein, EE-Ether extract,
A-Ash, NFE-Nitrogen free extract, GE-Gross energy, HS-Housing systems, PVMP-
Proprietary vitamin-mineral premixes, D1-diet without PVmP, D2, D3, D4, D5 and D6-
diets withNutripoult, Hi-Nutrient, Agrited, Daram vita-mix and Micro-mix respectively,
SEM-Standard error of means
141
The interaction effects of PVmP and HS on chemical composition of eggs from
chickens fed diets supplemented with five different PVmP in two HS from 22 to 35
weeks of age is presented in Table 23. There were significant interactions (p<0.05) of
PVmP and HS on chemical compositions of eggs in the early-laying phase.
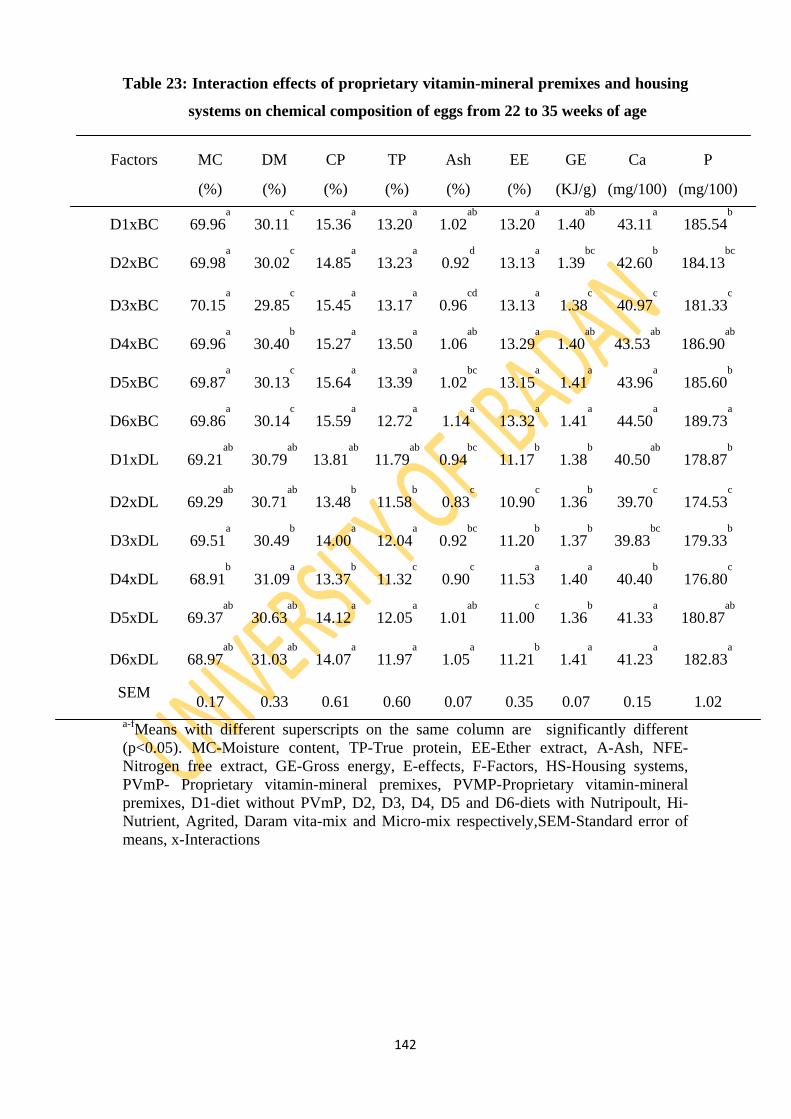
142
Table 23: Interaction effects of proprietary vitamin-mineral premixes and housing
systems on chemical composition of eggs from 22 to 35 weeks of age
Factors MC DM CP TP Ash EE GE Ca P
(%) (%) (%) (%) (%) (%) (KJ/g) (mg/100) (mg/100)
D1xBC 69.96a
30.11c
15.36a
13.20a
1.02ab
13.20a
1.40ab
43.11a
185.54b
D2xBC 69.98a
30.02c
14.85a
13.23a
0.92d
13.13a
1.39bc
42.60b
184.13bc
D3xBC 70.15a
29.85c
15.45a
13.17a
0.96cd
13.13a
1.38c
40.97c
181.33c
D4xBC 69.96a
30.40b
15.27a
13.50a
1.06ab
13.29a
1.40ab
43.53ab
186.90ab
D5xBC 69.87a
30.13c
15.64a
13.39a
1.02bc
13.15a
1.41a
43.96a
185.60b
D6xBC 69.86a
30.14c
15.59a
12.72a
1.14a
13.32a
1.41a
44.50a
189.73a
D1xDL 69.21ab
30.79ab
13.81ab
11.79ab
0.94bc
11.17b
1.38b
40.50ab
178.87b
D2xDL 69.29ab
30.71ab
13.48b
11.58b
0.83c
10.90c
1.36b
39.70c
174.53c
D3xDL 69.51a
30.49b
14.00a
12.04a
0.92bc
11.20b
1.37b
39.83bc
179.33b
D4xDL 68.91b
31.09a
13.37b
11.32c
0.90c
11.53a
1.40a
40.40b
176.80c
D5xDL 69.37ab
30.63ab
14.12a
12.05a
1.01ab
11.00c
1.36b
41.33a
180.87ab
D6xDL 68.97ab
31.03ab
14.07a
11.97a
1.05a
11.21b
1.41a
41.23a
182.83a
SEM 0.17 0.33 0.61 0.60 0.07 0.35 0.07 0.15 1.02
a-fMeans with different superscripts on the same column are significantly different
(p<0.05). MC-Moisture content, TP-True protein, EE-Ether extract, A-Ash, NFE-
Nitrogen free extract, GE-Gross energy, E-effects, F-Factors, HS-Housing systems,
PVmP- Proprietary vitamin-mineral premixes, PVMP-Proprietary vitamin-mineral
premixes, D1-diet without PVmP, D2, D3, D4, D5 and D6-diets with Nutripoult, Hi-
Nutrient, Agrited, Daram vita-mix and Micro-mix respectively,SEM-Standard error of
means, x-Interactions
143
4.5.2: Chemical compositions of eggs as affected by five different proprietary
vitamin-mineral premixes, two housing systems and duration of storage from
36 to 52 weeks of age
The chemical compositions of eggs as affected by five different proprietary vitamin-
mineral premixes, two housing systems and duration of storage as well as interaction
effects of PVmP and HS in DoS from 36 to 52 weeks of age are presented in Table 24.
Ether extracts, ash and nitrogen free extract differed significantly (p<0.05) with HS,
while moisture, dry matter and crude protein were not significantly (p>0.05) affected.
Significantly (p<0.05) higher ether extract and ash values were obtained from eggs
produced by layers in DL (7.64 and 1.30%, respectively) than eggs from BC (7.59 and
1.28%). On the other hand, layers in BC (1.15%) produced eggs that were significantly
higher (p<0.05) in nitrogen free extract than eggs from DL (1.08%).
The moisture, dry matter, crude protein and ether extract contents of eggs significantly
(p<0.05) varied with different dietary PVmP, while ash and nitrogen free extract content
were not significantly affected (p>0.05). The moisture content of eggs from layers on
diets supplemented with Agrited (D4) was higher (p<0.05) and similar to those on
Micro-mix-diets (D5) but significantly (p<0.05) higher compared with eggs from layers
on Nutripoult (D2), Hi-Nutrient (D3) and Micro-mix (D6). Eggs produced by layers fed
diets supplemented with Nutripoult (D2) had the highest dry matter content. Layers fed
diets supplemented with Agrited (D4) recorded the least dry matter content was similar
to eggs produced by those on Daram vita-mix (D5). The dry matter content of eggs
produced by layers on diet supplemented with Hi-Nutrient, (D3) and Daram vita-mix
(D5) were similar and lower (p<0.05) than eggs from those on Micro-mix (D6).
Eggs laid bychickens fed diets supplemented with Nutripoult recorded highest level
(11.63%) of crude protein. Diet supplemented with Agrited (11.44%) induced the least
level crude protein in eggs. The crude protein of eggs from layers fed diets
supplemented with Hi-Nutrient (D3), Daram vita-mix (D5) and Micro-mix (D6) were
similar but lower (p<0.05) compared with eggs from those on Nutripoult (D2). Eggs
from layers on diets supplemented with Nutripoult (D2) was the highest in ether extract
and similar to eggs produced by those on Agrited (D4) and higher (p<0.05) than eggs
144
from those on Hi-Nutrient (D3), Daram vita-mix (D5) and Micro-mix (D6). Eggs
produced by layers fed diets supplemented with Micro-mix (D6) were lowest in ether
extract. Moisture content and ether extract content of eggs signifcantly decreased
(p<0.05) with DoS, while dry matter, crude protein and ash increased (p<0.05). The
interaction effects of HS x PVmP were highly significant (p<0.01) for all indices of
chemical compositions, while PVmP x DoS interaction was significant (p<0.05) on
ether extract and nitrogen free extract. There were no significant (p>0.05) interaction
effects of HS x DoS and PVmP x HS x DoS on chemical composition parameters.
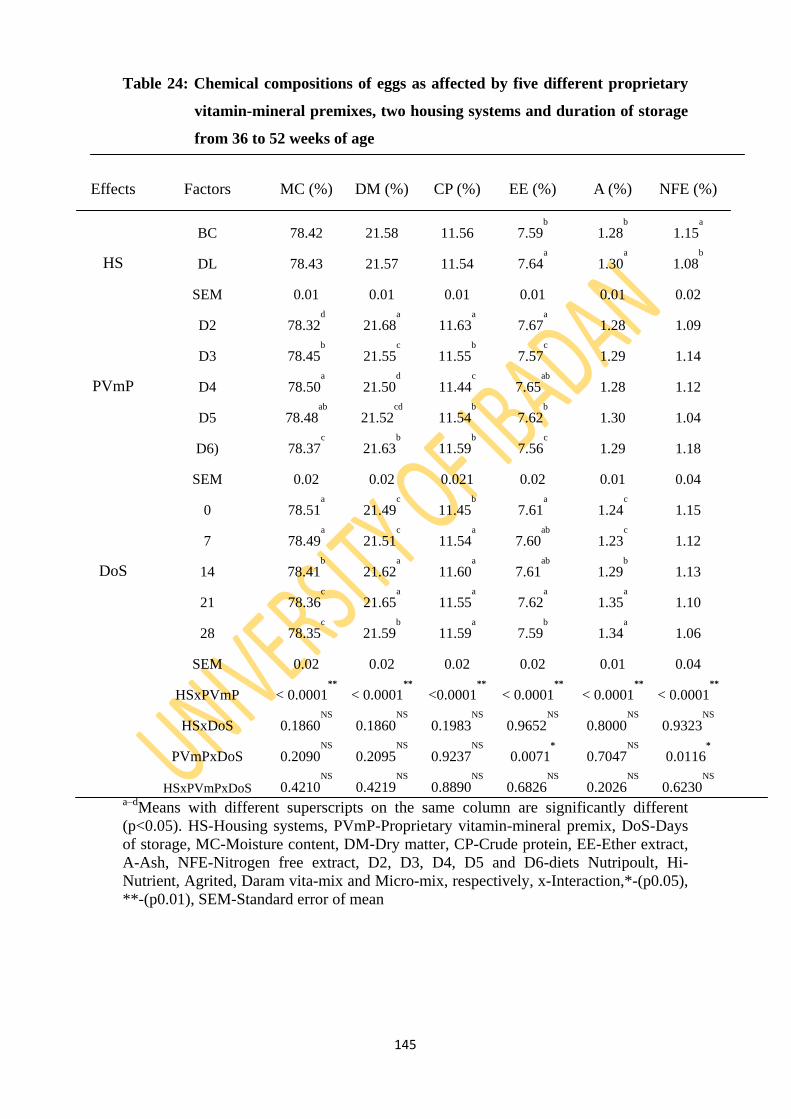
145
Table 24: Chemical compositions of eggs as affected by five different proprietary
vitamin-mineral premixes, two housing systems and duration of storage
from 36 to 52 weeks of age
Effects Factors MC (%) DM (%) CP (%) EE (%) A (%) NFE (%)
BC 78.42 21.58 11.56 7.59b
1.28b
1.15a
HS DL 78.43 21.57 11.54 7.64a
1.30a
1.08b
SEM 0.01 0.01 0.01 0.01 0.01 0.02
D2 78.32d
21.68a
11.63a
7.67a
1.28 1.09
D3 78.45b
21.55c
11.55b
7.57c
1.29 1.14
PVmP D4 78.50a
21.50d
11.44c
7.65ab
1.28 1.12
D5 78.48ab
21.52cd
11.54b
7.62b
1.30 1.04
D6) 78.37c
21.63b
11.59b
7.56c
1.29 1.18
SEM 0.02 0.02 0.021 0.02 0.01 0.04
0 78.51a
21.49c
11.45b
7.61a
1.24c
1.15
7 78.49a
21.51c
11.54a
7.60ab
1.23c
1.12
DoS 14 78.41b
21.62a
11.60a
7.61ab
1.29b
1.13
21 78.36c
21.65a
11.55a
7.62a
1.35a
1.10
28 78.35c
21.59b
11.59a
7.59b
1.34a
1.06
SEM 0.02 0.02 0.02 0.02 0.01 0.04
HSxPVmP < 0.0001**
< 0.0001**
<0.0001**
< 0.0001**
< 0.0001**
< 0.0001**
HSxDoS 0.1860NS
0.1860NS
0.1983NS
0.9652NS
0.8000NS
0.9323NS
PVmPxDoS 0.2090NS
0.2095NS
0.9237NS
0.0071*
0.7047NS
0.0116*
HSxPVmPxDoS 0.4210NS
0.4219NS
0.8890NS
0.6826NS
0.2026NS
0.6230NS
a–d
Means with different superscripts on the same column are significantly different
(p<0.05). HS-Housing systems, PVmP-Proprietary vitamin-mineral premix, DoS-Days
of storage, MC-Moisture content, DM-Dry matter, CP-Crude protein, EE-Ether extract,
A-Ash, NFE-Nitrogen free extract, D2, D3, D4, D5 and D6-diets Nutripoult, Hi-
Nutrient, Agrited, Daram vita-mix and Micro-mix, respectively, x-Interaction,*-(p0.05),
**-(p0.01), SEM-Standard error of mean
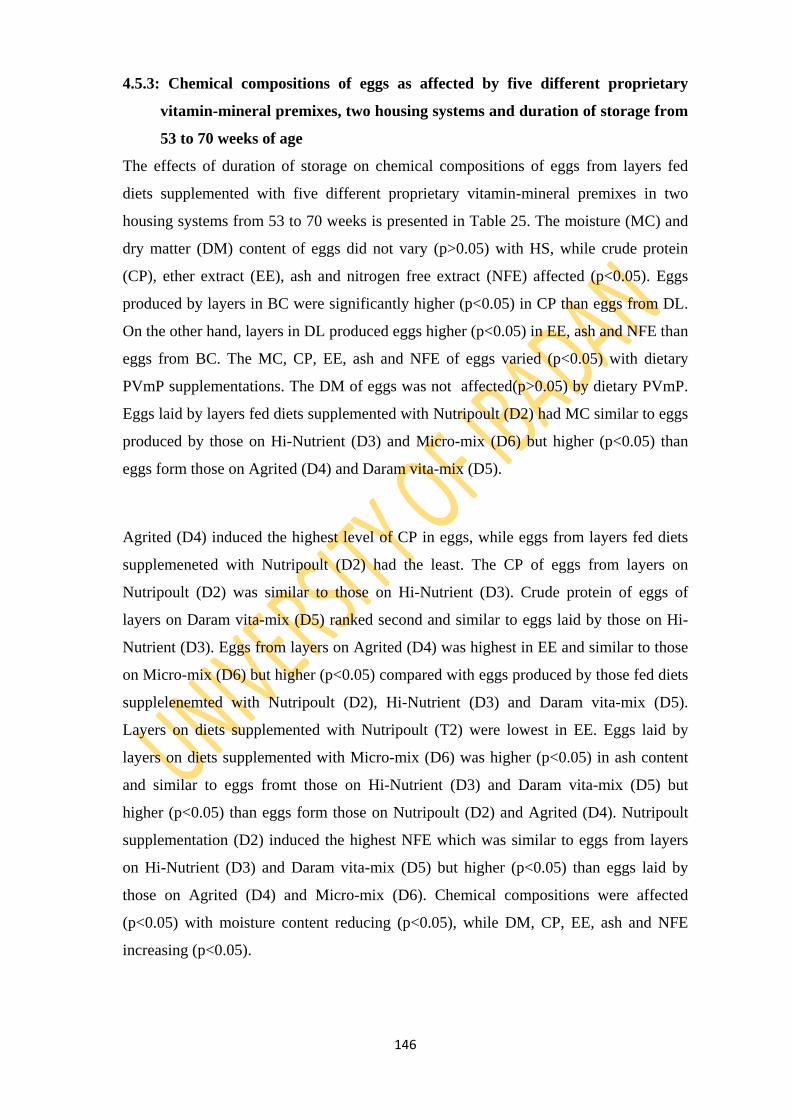
146
4.5.3: Chemical compositions of eggs as affected by five different proprietary
vitamin-mineral premixes, two housing systems and duration of storage from
53 to 70 weeks of age
The effects of duration of storage on chemical compositions of eggs from layers fed
diets supplemented with five different proprietary vitamin-mineral premixes in two
housing systems from 53 to 70 weeks is presented in Table 25. The moisture (MC) and
dry matter (DM) content of eggs did not vary (p>0.05) with HS, while crude protein
(CP), ether extract (EE), ash and nitrogen free extract (NFE) affected (p<0.05). Eggs
produced by layers in BC were significantly higher (p<0.05) in CP than eggs from DL.
On the other hand, layers in DL produced eggs higher (p<0.05) in EE, ash and NFE than
eggs from BC. The MC, CP, EE, ash and NFE of eggs varied (p<0.05) with dietary
PVmP supplementations. The DM of eggs was not affected(p>0.05) by dietary PVmP.
Eggs laid by layers fed diets supplemented with Nutripoult (D2) had MC similar to eggs
produced by those on Hi-Nutrient (D3) and Micro-mix (D6) but higher (p<0.05) than
eggs form those on Agrited (D4) and Daram vita-mix (D5).
Agrited (D4) induced the highest level of CP in eggs, while eggs from layers fed diets
supplemeneted with Nutripoult (D2) had the least. The CP of eggs from layers on
Nutripoult (D2) was similar to those on Hi-Nutrient (D3). Crude protein of eggs of
layers on Daram vita-mix (D5) ranked second and similar to eggs laid by those on Hi-
Nutrient (D3). Eggs from layers on Agrited (D4) was highest in EE and similar to those
on Micro-mix (D6) but higher (p<0.05) compared with eggs produced by those fed diets
supplelenemted with Nutripoult (D2), Hi-Nutrient (D3) and Daram vita-mix (D5).
Layers on diets supplemented with Nutripoult (T2) were lowest in EE. Eggs laid by
layers on diets supplemented with Micro-mix (D6) was higher (p<0.05) in ash content
and similar to eggs fromt those on Hi-Nutrient (D3) and Daram vita-mix (D5) but
higher (p<0.05) than eggs form those on Nutripoult (D2) and Agrited (D4). Nutripoult
supplementation (D2) induced the highest NFE which was similar to eggs from layers
on Hi-Nutrient (D3) and Daram vita-mix (D5) but higher (p<0.05) than eggs laid by
those on Agrited (D4) and Micro-mix (D6). Chemical compositions were affected
(p<0.05) with moisture content reducing (p<0.05), while DM, CP, EE, ash and NFE
increasing (p<0.05).
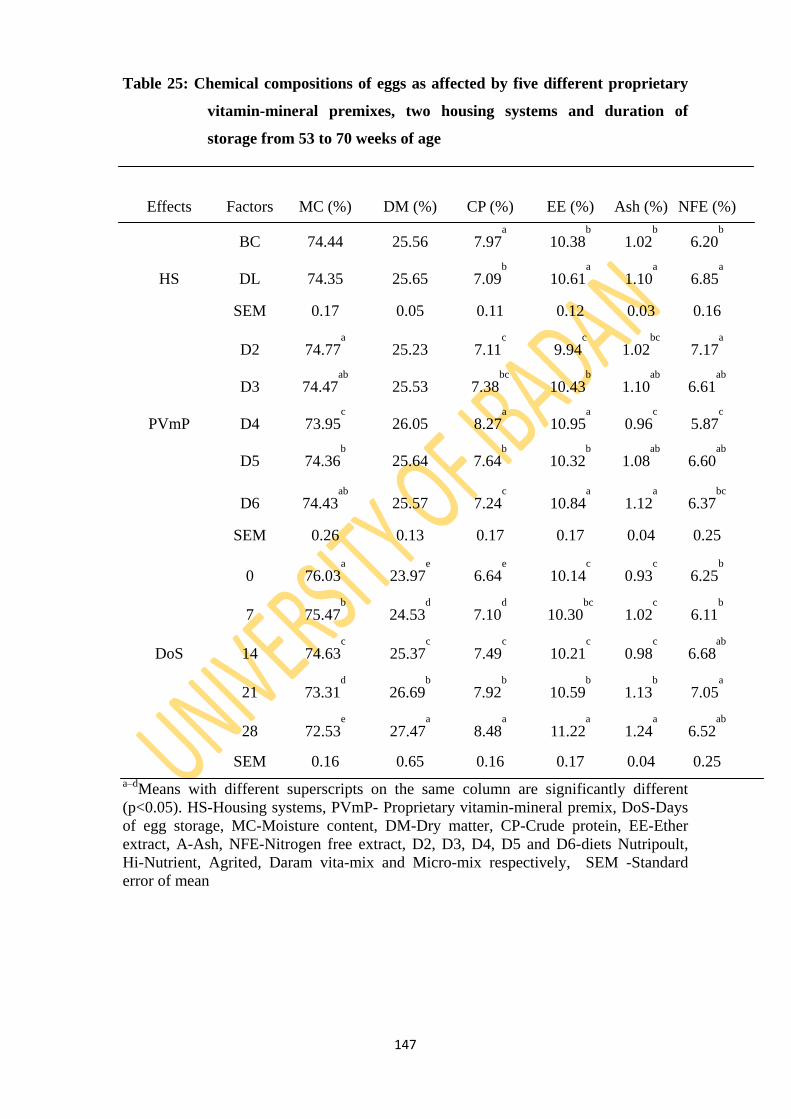
147
Table 25: Chemical compositions of eggs as affected by five different proprietary
vitamin-mineral premixes, two housing systems and duration of
storage from 53 to 70 weeks of age
Effects Factors MC (%) DM (%) CP (%) EE (%) Ash (%) NFE (%)
BC 74.44 25.56 7.97a
10.38b
1.02b
6.20b
HS DL 74.35 25.65 7.09b
10.61a
1.10a
6.85a
SEM 0.17 0.05 0.11 0.12 0.03 0.16
D2 74.77a
25.23 7.11c
9.94c
1.02bc
7.17a
D3 74.47ab
25.53 7.38bc
10.43b
1.10ab
6.61ab
PVmP D4 73.95c
26.05 8.27a
10.95a
0.96c
5.87c
D5 74.36b
25.64 7.64b
10.32b
1.08ab
6.60ab
D6 74.43ab
25.57 7.24c
10.84a
1.12a
6.37bc
SEM 0.26 0.13 0.17 0.17 0.04 0.25
0 76.03a
23.97e
6.64e
10.14c
0.93c
6.25b
7 75.47b
24.53d
7.10d
10.30bc
1.02c
6.11b
DoS 14 74.63c
25.37c
7.49c
10.21c
0.98c
6.68ab
21 73.31d
26.69b
7.92b
10.59b
1.13b
7.05a
28 72.53e
27.47a
8.48a
11.22a
1.24a
6.52ab
SEM 0.16 0.65 0.16 0.17 0.04 0.25
a–dMeans with different superscripts on the same column are significantly different
(p<0.05). HS-Housing systems, PVmP- Proprietary vitamin-mineral premix, DoS-Days
of egg storage, MC-Moisture content, DM-Dry matter, CP-Crude protein, EE-Ether
extract, A-Ash, NFE-Nitrogen free extract, D2, D3, D4, D5 and D6-diets Nutripoult,
Hi-Nutrient, Agrited, Daram vita-mix and Micro-mix respectively, SEM -Standard
error of mean
148
4.5.3: Relationship parameters or chemical compositions of eggs as affected by
duration of storage from 53 to 70 weeks of age
The regression of crude protein on days of storage of eggs at the early- and late-laying
phases are shown in equations 25 and 26, respectively and plotted graphs in Figure 11
below:
Early-laying phase; y = -0.0003x2 + 0.0127x + 11.458 … (R² = 0.82) ……………. 25
Late-laying phase;y = 0.0003x2 + 0.0545x + 6.6603… ......(R² = 0.99) ……………. 26
Crude protein of eggs produced and stored at the early-laying phase was higher than
those at late-laying phase. The crude protein of eggs in days of storage at the early-
laying remain fairly contant (R2
= 0.82) but increased at the late-laying phase (R² =
0.99) as shown in Figure 11.
Equations 27 and 28 shows regression of egg fat on days of storage at the early- and
late-laying phases, respectively.
Late-laying phase; y = 0.0021x2 - 0.0226x + 10.203 (R² = 0.95) …………………27
Early-laying phase; y = -6E-05x2 + 0.0013x + 7.6043 (R² = 0.30) ……………….. 28
Fat in stored eggs at the late-laying phase was higher than in early-laying phase. At
eraly-laying phase, fat content of eggs (R2 =0.30) remained fairly contant but increased
(R2 =0.95) at the late-laying phase as shown in Figure 12 below:
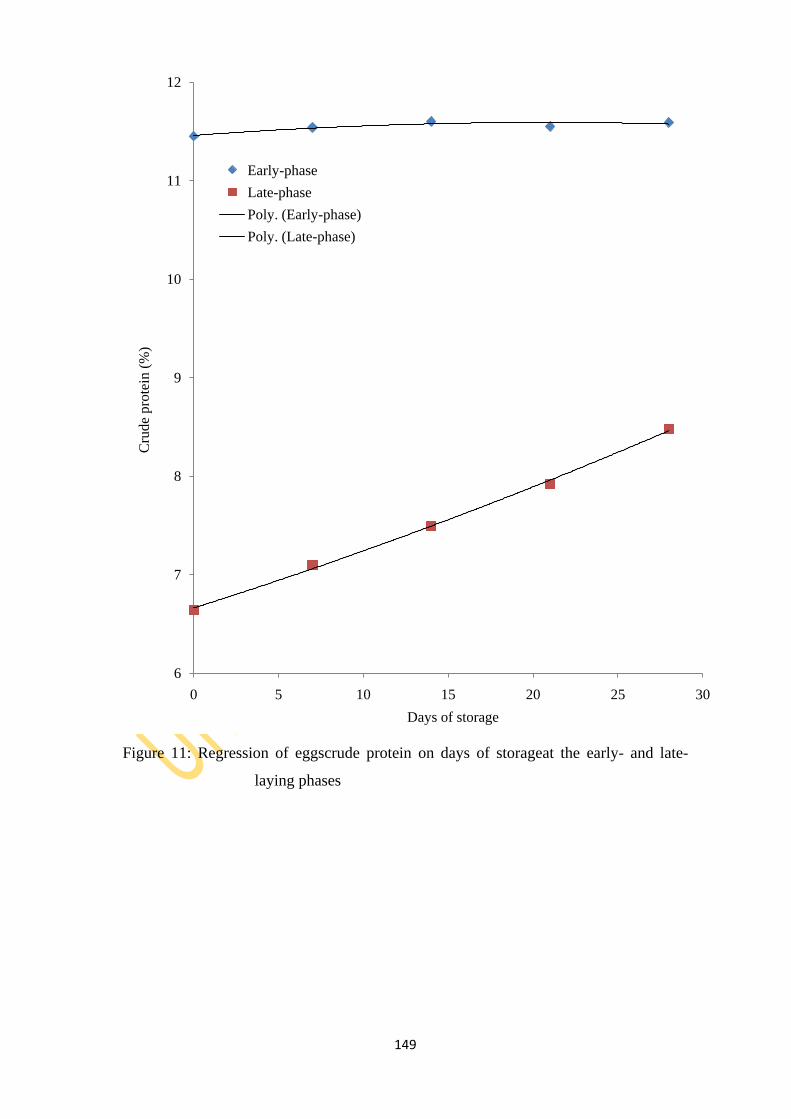
149
Figure 11: Regression of eggscrude protein on days of storageat the early- and late-
laying phases
6
7
8
9
10
11
12
0 5 10 15 20 25 30
Cru
de
pro
tein
(%
)
Days of storage
Early-phase
Late-phase
Poly. (Early-phase)
Poly. (Late-phase)
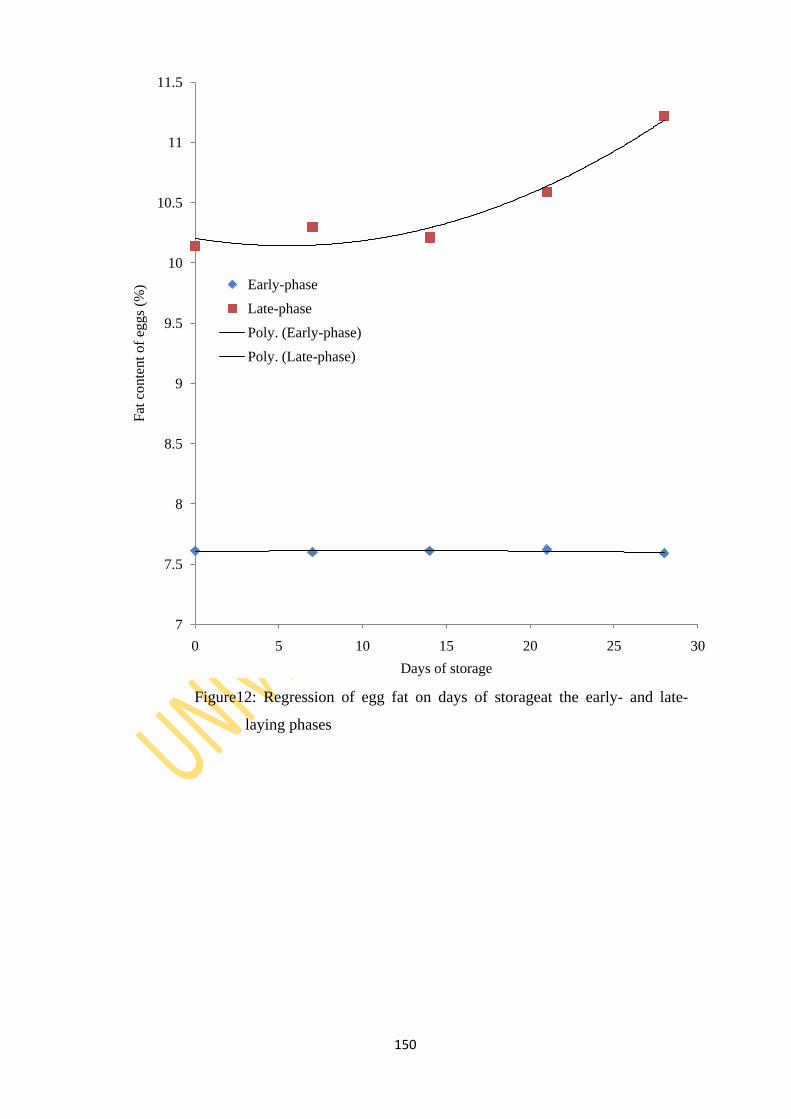
150
Figure12: Regression of egg fat on days of storageat the early- and late-
laying phases
7
7.5
8
8.5
9
9.5
10
10.5
11
11.5
0 5 10 15 20 25 30
Fat
con
tent
of
egg
s (%
)
Days of storage
Early-phase
Late-phase
Poly. (Early-phase)
Poly. (Late-phase)
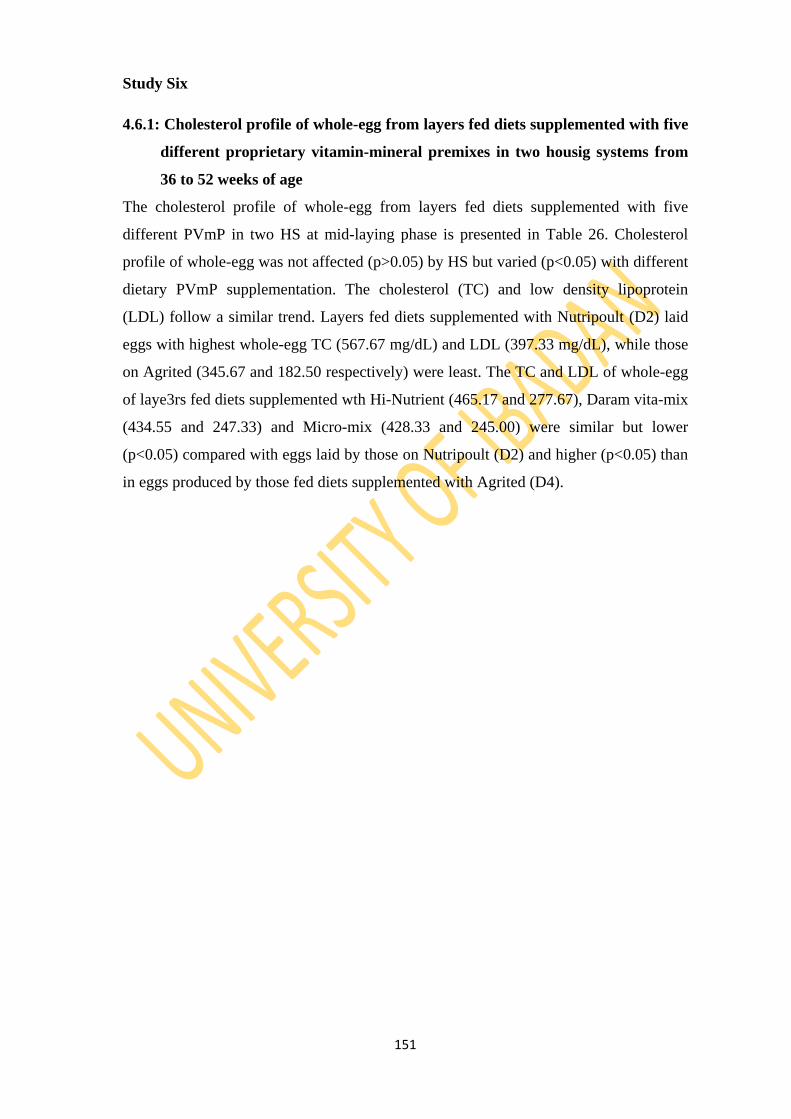
151
Study Six
4.6.1: Cholesterol profile of whole-egg from layers fed diets supplemented with five
different proprietary vitamin-mineral premixes in two housig systems from
36 to 52 weeks of age
The cholesterol profile of whole-egg from layers fed diets supplemented with five
different PVmP in two HS at mid-laying phase is presented in Table 26. Cholesterol
profile of whole-egg was not affected (p>0.05) by HS but varied (p<0.05) with different
dietary PVmP supplementation. The cholesterol (TC) and low density lipoprotein
(LDL) follow a similar trend. Layers fed diets supplemented with Nutripoult (D2) laid
eggs with highest whole-egg TC (567.67 mg/dL) and LDL (397.33 mg/dL), while those
on Agrited (345.67 and 182.50 respectively) were least. The TC and LDL of whole-egg
of laye3rs fed diets supplemented wth Hi-Nutrient (465.17 and 277.67), Daram vita-mix
(434.55 and 247.33) and Micro-mix (428.33 and 245.00) were similar but lower
(p<0.05) compared with eggs laid by those on Nutripoult (D2) and higher (p<0.05) than
in eggs produced by those fed diets supplemented with Agrited (D4).
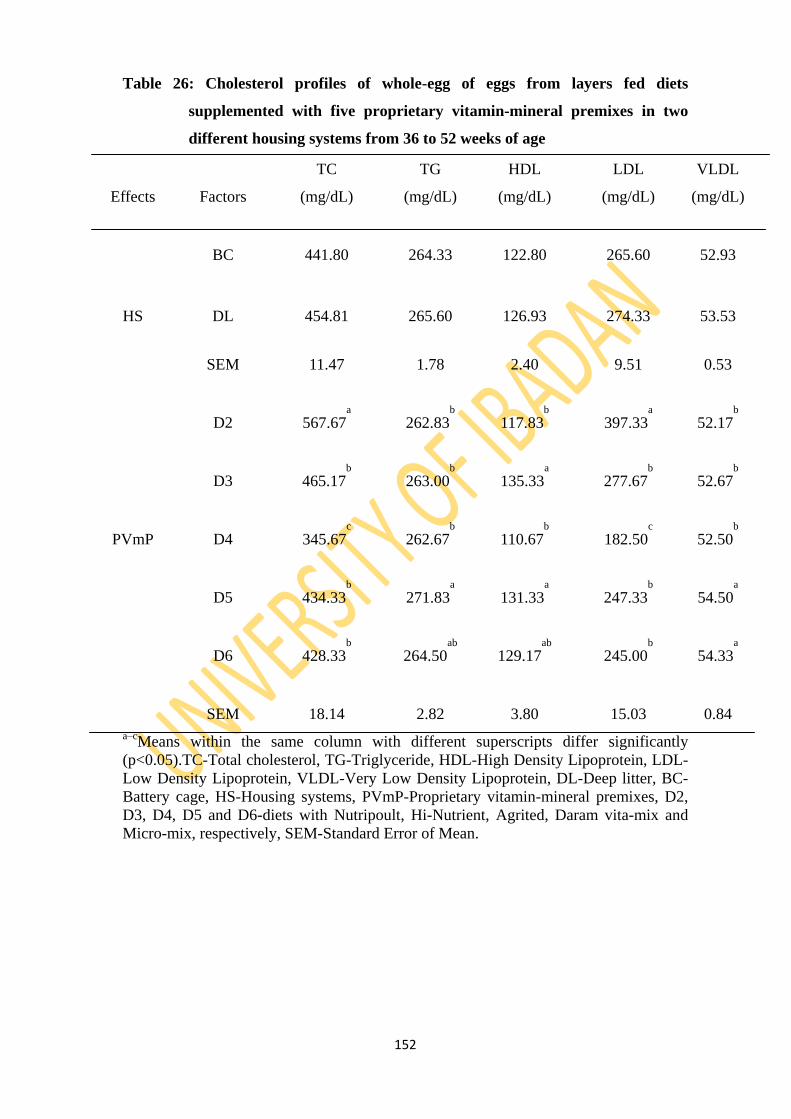
152
Table 26: Cholesterol profiles of whole-egg of eggs from layers fed diets
supplemented with five proprietary vitamin-mineral premixes in two
different housing systems from 36 to 52 weeks of age
Effects Factors
TC
(mg/dL)
TG
(mg/dL)
HDL
(mg/dL)
LDL
(mg/dL)
VLDL
(mg/dL)
BC 441.80 264.33 122.80 265.60 52.93
HS DL 454.81 265.60 126.93 274.33 53.53
SEM 11.47 1.78 2.40 9.51 0.53
D2 567.67a
262.83b
117.83b
397.33a
52.17b
D3 465.17b
263.00b
135.33a
277.67b
52.67b
PVmP D4 345.67c
262.67b
110.67b
182.50c
52.50b
D5 434.33b
271.83a
131.33a
247.33b
54.50a
D6 428.33b
264.50ab
129.17ab
245.00b
54.33a
SEM 18.14 2.82 3.80 15.03 0.84
a–cMeans within the same column with different superscripts differ significantly
(p<0.05).TC-Total cholesterol, TG-Triglyceride, HDL-High Density Lipoprotein, LDL-
Low Density Lipoprotein, VLDL-Very Low Density Lipoprotein, DL-Deep litter, BC-
Battery cage, HS-Housing systems, PVmP-Proprietary vitamin-mineral premixes, D2,
D3, D4, D5 and D6-diets with Nutripoult, Hi-Nutrient, Agrited, Daram vita-mix and
Micro-mix, respectively, SEM-Standard Error of Mean.
153
The triglycerides (TG) and very low density lipoprotein (VLDL) in whole-eggs of
layers fed diets supplemented with Daram vita-mix (D5) were similar to those from on
Micro-mix (D6) but higher (p<0.05) compared with those on Nutripoult(D2), Hi-
Nutrient (D3) and Daram vita-mix (D4). Layers on Nutripoult (D2) and Hi-Nutrient
(D3) laid eggs that contained lower (p<0.05) VLDL and TG. Whole-eggs of layers on
Hi-Nutrient (D3) was higher (p<0.05) in high density lipoprotein (HDL) though similar
to eggs from those on Daram vita-mix (D5) and Micro-mix (D6) but higher (p<0.05)
than eggs from those on Nutripoult (D2) and Agrited (D4). The whole-egg HDL of
layers on Nutripoult (D2), Agrited (D4) and Micro-mix (D6) were similar too. The
interaction effects of PVmP and HS on cholesterol profile of whole-egg of layers from
36 to 52 weeks of age is shown in Table 27. The interaction effect of PVmP and HS on
cholesterol profile of whole-egg was significant (p<0.05).
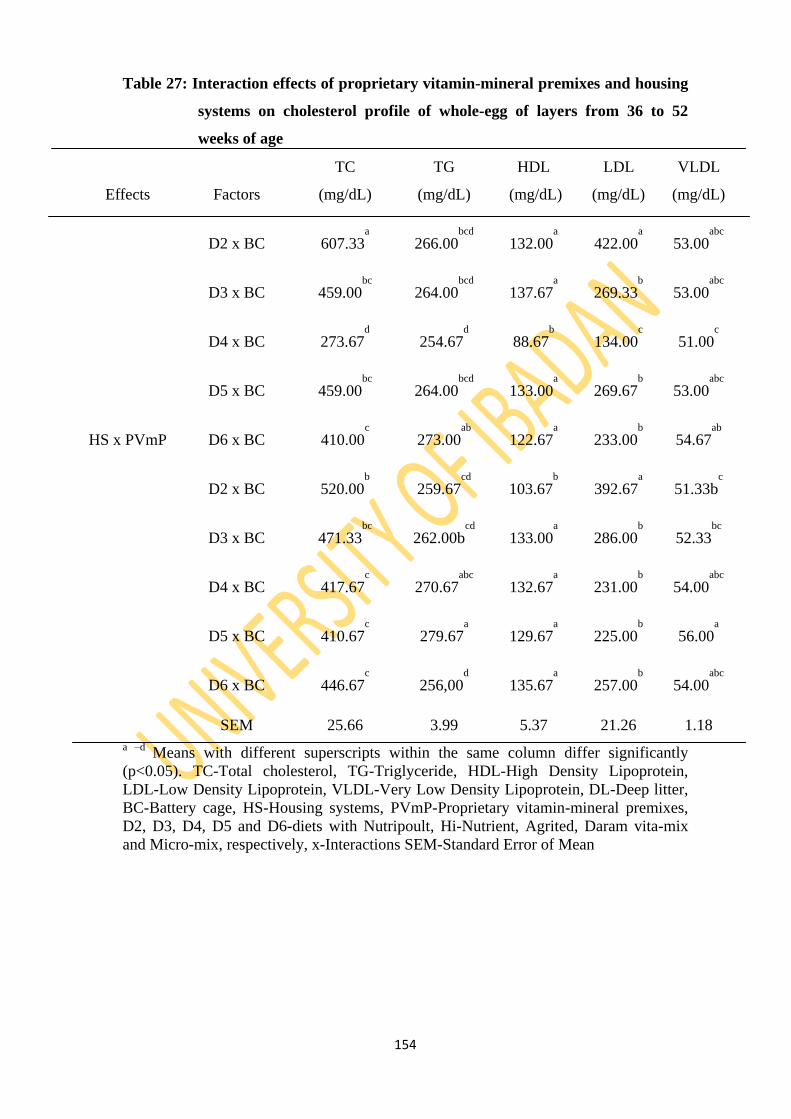
154
Table 27: Interaction effects of proprietary vitamin-mineral premixes and housing
systems on cholesterol profile of whole-egg of layers from 36 to 52
weeks of age
Effects Factors
TC
(mg/dL)
TG
(mg/dL)
HDL
(mg/dL)
LDL
(mg/dL)
VLDL
(mg/dL)
D2 x BC 607.33a
266.00bcd
132.00a
422.00a
53.00abc
D3 x BC 459.00bc
264.00bcd
137.67a
269.33b
53.00abc
D4 x BC 273.67d
254.67d
88.67b
134.00c
51.00c
D5 x BC 459.00bc
264.00bcd
133.00a
269.67b
53.00abc
HS x PVmP D6 x BC 410.00c
273.00ab
122.67a
233.00b
54.67ab
D2 x BC 520.00b
259.67cd
103.67b
392.67a
51.33bc
D3 x BC 471.33bc
262.00bcd
133.00a
286.00b
52.33bc
D4 x BC 417.67c
270.67abc
132.67a
231.00b
54.00abc
D5 x BC 410.67c
279.67a
129.67a
225.00b
56.00a
D6 x BC 446.67c
256,00d
135.67a
257.00b
54.00abc
SEM 25.66 3.99 5.37 21.26 1.18
a –d Means with different superscripts within the same column differ significantly
(p<0.05). TC-Total cholesterol, TG-Triglyceride, HDL-High Density Lipoprotein,
LDL-Low Density Lipoprotein, VLDL-Very Low Density Lipoprotein, DL-Deep litter,
BC-Battery cage, HS-Housing systems, PVmP-Proprietary vitamin-mineral premixes,
D2, D3, D4, D5 and D6-diets with Nutripoult, Hi-Nutrient, Agrited, Daram vita-mix
and Micro-mix, respectively, x-Interactions SEM-Standard Error of Mean
155
4.6.2: Cholesterol profile of egg-yolk from layers fed diets supplemented with five
different proprietary vitamin-mineral premixes in two housing systems
from 36 to 52 weeks of age
The of cholesterol profile of egg-yolk from layers fed diets supplemented with five
different PVmP in two HS from 36 to 52 weeks of age is shown in Table 28. The HS
did not affect (p>0.05) total cholesterol (TC) and high density lipoprotein (HDL) of
egg-yolk, while trigylecrides (TG), low density lipoprotein (LDL) and very low density
lipoprotein (VLDL) varied (p<0.05). Eggs from layers in BC were higher (p<0.05) in
yolk TG and VLDL but lower in LDL compared with those from DL. The cholesterol
profile of egg-yolk were affected (p<0.05) by dietary PVmP. Eggs produced by layers
fed diets supplemented with Micro-mix (D6) was higher in yolk TC, TG and VLDL and
similar to eggs laid by those on Nutripoult (D2), Hi-Nutrient (D3) and Agrited (D4) but
higher (p<0.05) than eggs from those on Daram vita-mix (D5).
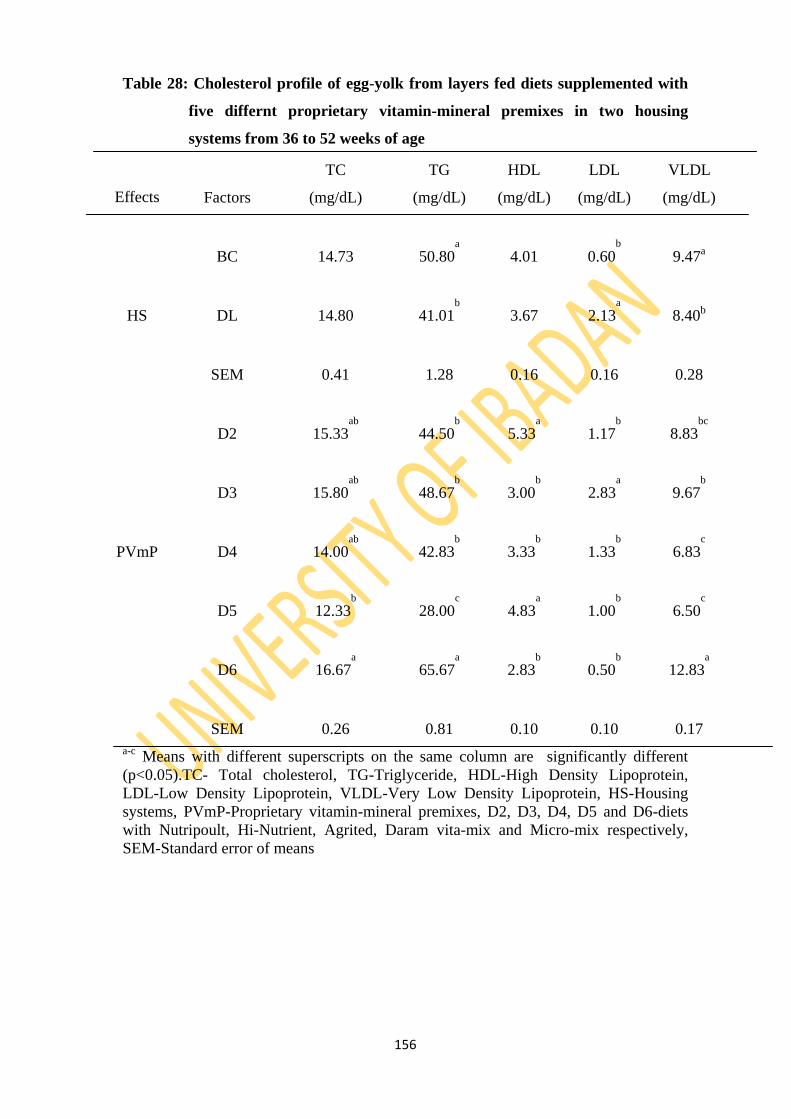
156
Table 28: Cholesterol profile of egg-yolk from layers fed diets supplemented with
five differnt proprietary vitamin-mineral premixes in two housing
systems from 36 to 52 weeks of age
Effects Factors
TC
(mg/dL)
TG
(mg/dL)
HDL
(mg/dL)
LDL
(mg/dL)
VLDL
(mg/dL)
BC 14.73 50.80a
4.01 0.60b
9.47a
HS DL 14.80 41.01b
3.67 2.13a
8.40b
SEM 0.41 1.28 0.16 0.16 0.28
D2 15.33ab
44.50b
5.33a
1.17b
8.83bc
D3 15.80ab
48.67b
3.00b
2.83a
9.67b
PVmP D4 14.00ab
42.83b
3.33b
1.33b
6.83c
D5 12.33b
28.00c
4.83a
1.00b
6.50c
D6 16.67a
65.67a
2.83b
0.50b
12.83a
SEM 0.26 0.81 0.10 0.10 0.17
a-c Means with different superscripts on the same column are significantly different
(p<0.05).TC- Total cholesterol, TG-Triglyceride, HDL-High Density Lipoprotein,
LDL-Low Density Lipoprotein, VLDL-Very Low Density Lipoprotein, HS-Housing
systems, PVmP-Proprietary vitamin-mineral premixes, D2, D3, D4, D5 and D6-diets
with Nutripoult, Hi-Nutrient, Agrited, Daram vita-mix and Micro-mix respectively,
SEM-Standard error of means
157
The egg-yolk of layers fed diets supplemented with Daram vita-mix (D5) was lower in
TC, TG and VLDL. The HDL of egg-yolk produced by layers on Nutripoult (D2) was
similar to those on Daram vita-mix (D5) and higher (p<0.05) than eggs from those on
Hi-Nutrient (D3), Agrited (D4) and Micro-mix (D6). Egg-yolk of layers fed diets
supplemented with Micro-mix (D6) was the lowest in HDL. The egg-yolk of layers on
Hi-Nutrient (D3) and Micro-mix (D6) had highest and lowest LDL respectively. The
LDL of egg-yolk oflayers feed diets supplemented with Nutripoult (D2), Agrited (D4),
Daram vita-mix (D5) and Micro-mix (D6) were similar. The interaction effects of
dietary PVmP and HS on cholesterol profile of egg-yolk of layers from 36 to 52 weeks
of age are presented in Table 29. There were interaction effects (p<0.05) of PVmP and
HS on parameters of cholesterol profile of egg-yolk of layers.
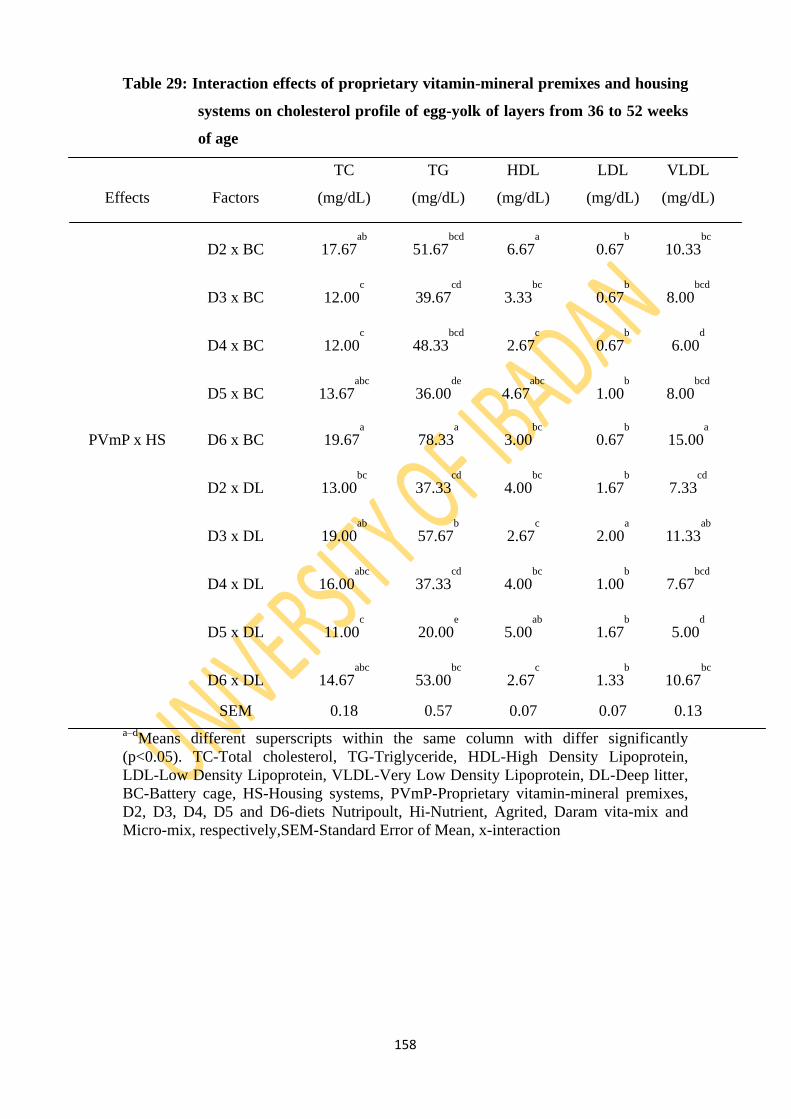
158
Table 29: Interaction effects of proprietary vitamin-mineral premixes and housing
systems on cholesterol profile of egg-yolk of layers from 36 to 52 weeks
of age
Effects Factors
TC
(mg/dL)
TG
(mg/dL)
HDL
(mg/dL)
LDL
(mg/dL)
VLDL
(mg/dL)
D2 x BC 17.67ab
51.67bcd
6.67a
0.67b
10.33bc
D3 x BC 12.00c
39.67cd
3.33bc
0.67b
8.00bcd
D4 x BC 12.00c
48.33bcd
2.67c
0.67b
6.00d
D5 x BC 13.67abc
36.00de
4.67abc
1.00b
8.00bcd
PVmP x HS D6 x BC 19.67a
78.33a
3.00bc
0.67b
15.00a
D2 x DL 13.00bc
37.33cd
4.00bc
1.67b
7.33cd
D3 x DL 19.00ab
57.67b
2.67c
2.00a
11.33ab
D4 x DL 16.00abc
37.33cd
4.00bc
1.00b
7.67bcd
D5 x DL 11.00c
20.00e
5.00ab
1.67b
5.00d
D6 x DL 14.67abc
53.00bc
2.67c
1.33b
10.67bc
SEM 0.18 0.57 0.07 0.07 0.13
a–dMeans different superscripts within the same column with differ significantly
(p<0.05). TC-Total cholesterol, TG-Triglyceride, HDL-High Density Lipoprotein,
LDL-Low Density Lipoprotein, VLDL-Very Low Density Lipoprotein, DL-Deep litter,
BC-Battery cage, HS-Housing systems, PVmP-Proprietary vitamin-mineral premixes,
D2, D3, D4, D5 and D6-diets Nutripoult, Hi-Nutrient, Agrited, Daram vita-mix and
Micro-mix, respectively,SEM-Standard Error of Mean, x-interaction
159
Study Seven
4.7.1: Lipid oxidation in egg-yolk of layers fed diets supplemented with five
different proprietary vitamin-mineral premixes under two different housing
systems in days of storage from 36 to 52 weeks of age
Lipid oxidation in egg-yolk of layers fed diets supplemented with five different PVmP
under two different HS in DoS from 36 to 52 weeks of age is presented in Table 30. The
HS caused variations (p<0.05) in lipid oxidation of egg-yolk. Lipid oxidation (mg/kg) in
egg-yolk of layers in DL (0.034) was higher (p<0.05) compared with 0.028 in BC.
Dietary PVmP influenced (p<0.05) lipid oxidation in egg-yolk of layers at the mid-
laying phase. Lipid oxidation of egg-yolk of layers fed diet supplemented with Agrited
(D4) (0.033) had the highest value; while those on Micro-mix (D6) was least (0.027).
Egg-yolk lipid oxidation increased (p<0.05) in DoS from 0.021 in freshly laid eggs to
0.036 at day 28 of storage
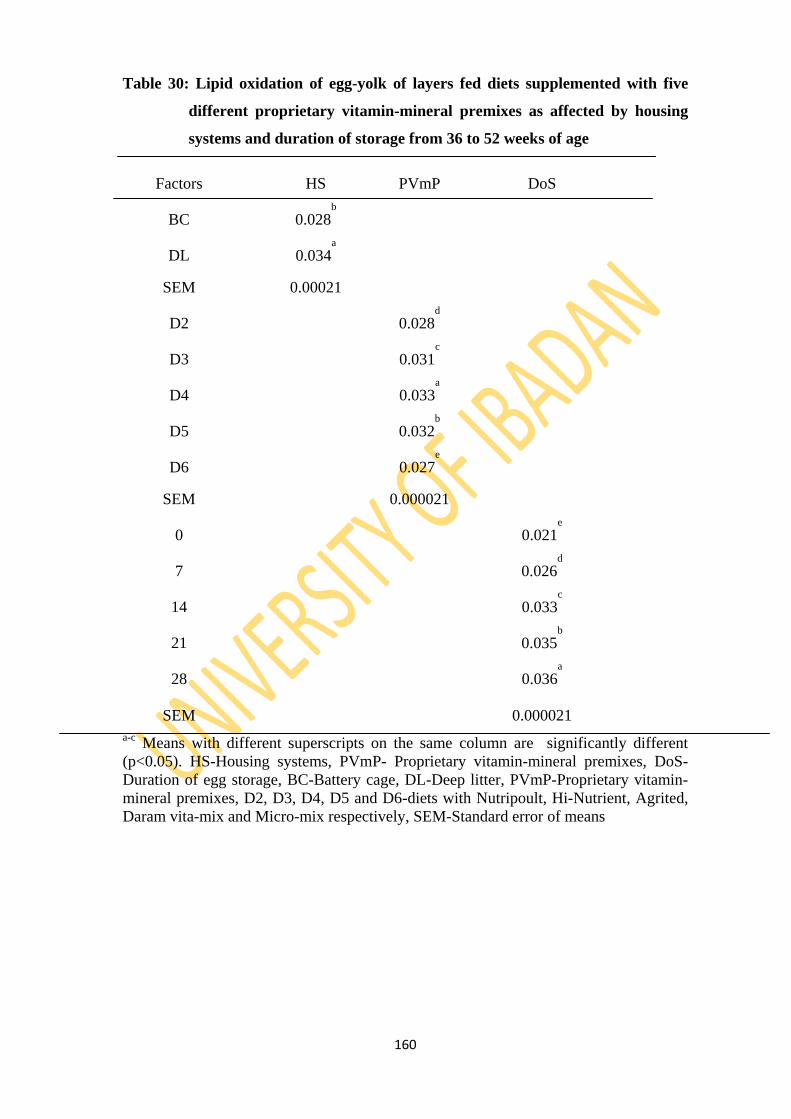
160
Table 30: Lipid oxidation of egg-yolk of layers fed diets supplemented with five
different proprietary vitamin-mineral premixes as affected by housing
systems and duration of storage from 36 to 52 weeks of age
Factors HS PVmP DoS
BC 0.028b
DL 0.034
a
SEM 0.00021
D2
0.028d
D3
0.031c
D4
0.033a
D5
0.032b
D6
0.027e
SEM
0.000021
0
0.021e
7
0.026d
14
0.033c
21
0.035b
28
0.036a
SEM
0.000021
a-c Means with different superscripts on the same column are significantly different
(p<0.05). HS-Housing systems, PVmP- Proprietary vitamin-mineral premixes, DoS-
Duration of egg storage, BC-Battery cage, DL-Deep litter, PVmP-Proprietary vitamin-
mineral premixes, D2, D3, D4, D5 and D6-diets with Nutripoult, Hi-Nutrient, Agrited,
Daram vita-mix and Micro-mix respectively, SEM-Standard error of means
161
4.7.2: Lipid oxidation of egg albumen and whole-egg of chickens fed diets
supplemented with five proprietary vitamin-minerals premixes as affected
by two housing systems and duration of storage from 53 to 70 weeks of age
The Lipid Oxidation (LO) of egg albumen and whole-egg of chickens fed diets
supplemented with five different PVmP as affected by two housing systems and
duration of storage from 53 to 70 weeks of age is presented in Table 31. The LO in
albumen and whole-egg varied (p<0.05) with HS. Eggs produced by layers in DL had
higher (p<0.05) 0.06 LO in albumen and 0.16 in whole-egg compared with 0.04 and
0.15 respectively in BC. Dietary PVmP supplementations impacted (p<0.05) on LO of
albumen and whole-egg. Albumen of eggs from layers on diets supplemented with
Micro-mix (D6) had the highest value of LO (0.056), while albumen of eggs from those
fed diet supplemented with Nutripoult (D2) had the least (0.048). The highest LO in
whole-egg was recorded in eggs from layers on diets with Hi-Nutrient (D3) (0.156) and
Agrited (D4) (0.156), while LO of whole-egg produced by those on diets with Micro-
mix (D6) was least (0.151). The LO of whole-egg produced by layers on diets with
Nutripoult (D2) and Daram vita-mix (D5) were similar. The LO in albumen and whole-
eggs increased (p<0.05) in DoS.
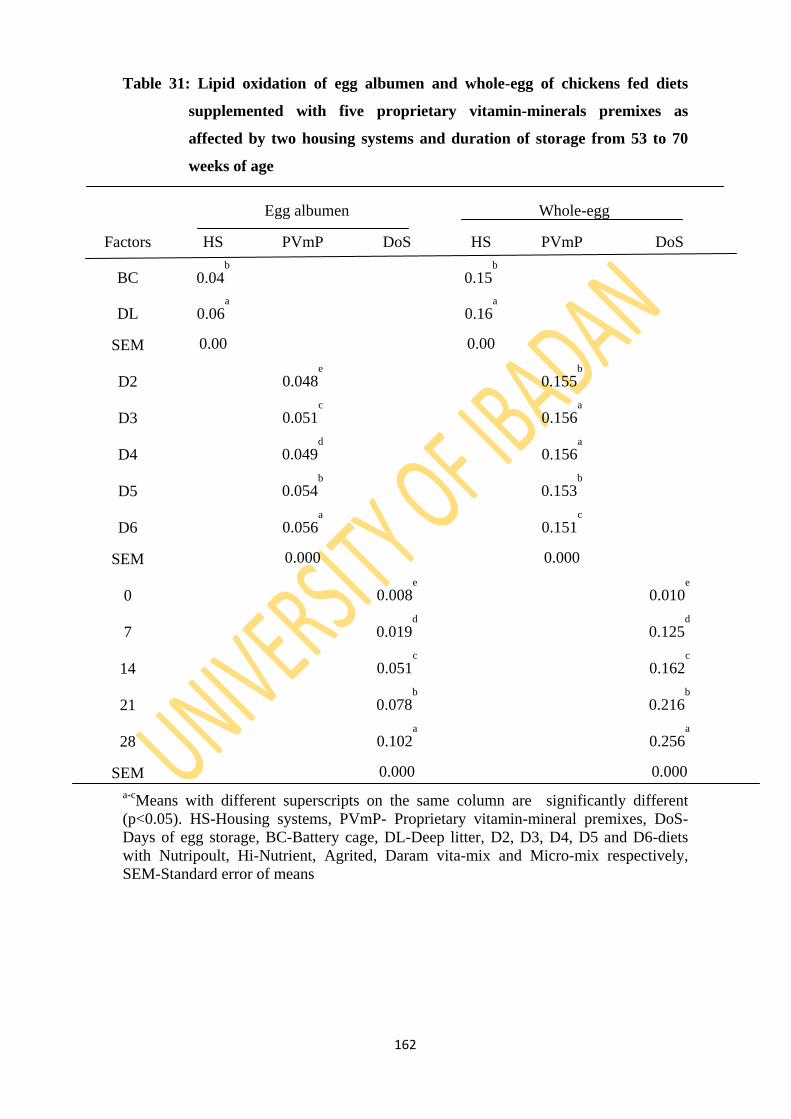
162
Table 31: Lipid oxidation of egg albumen and whole-egg of chickens fed diets
supplemented with five proprietary vitamin-minerals premixes as
affected by two housing systems and duration of storage from 53 to 70
weeks of age
Egg albumen
Whole-egg
Factors HS PVmP DoS
HS PVmP DoS
BC 0.04b
0.15b
DL 0.06
a
0.16a
SEM 0.00
0.00
D2
0.048e
0.155b
D3
0.051c
0.156a
D4
0.049d
0.156a
D5
0.054b
0.153b
D6
0.056a
0.151c
SEM
0.000
0.000
0
0.008e
0.010e
7
0.019d
0.125d
14
0.051c
0.162c
21
0.078b
0.216b
28
0.102a
0.256a
SEM
0.000
0.000
a-cMeans with different superscripts on the same column are significantly different
(p<0.05). HS-Housing systems, PVmP- Proprietary vitamin-mineral premixes, DoS-
Days of egg storage, BC-Battery cage, DL-Deep litter, D2, D3, D4, D5 and D6-diets
with Nutripoult, Hi-Nutrient, Agrited, Daram vita-mix and Micro-mix respectively,
SEM-Standard error of means
163
4.7.3: Regression of lipid oxidation of egg albumen, yolk and whole-egg with
duration of storage at the late-laying phase
The regression of lipid oxidation on egg albumen, yolk and whole-egg of chickens fed
diets supplemented with five different PVmP in HS in DoS at the late-laying phase are
shown in equations 29, 30 and 31 and plotted graphs in Figure 13 below:
Albumen; y = 3E-05x2 + 0.0027x + 0.0052 ……… (R² = 0.99) …………………......29
Yolk; y = -2E-05x2 + 0.0011x + 0.0205 …………… (R² = 0.98) ………………… ..30
Whole-egg; y = -0.0002x2 + 0.0138x + 0.0182……..(R² = 0.98) ……………………..31
Lipid oxidation was highest in whole-egg and least in yolkbut increased more rapidly in
whole-egg and albumen than in egg-yolk as shown in Figure 13 below:
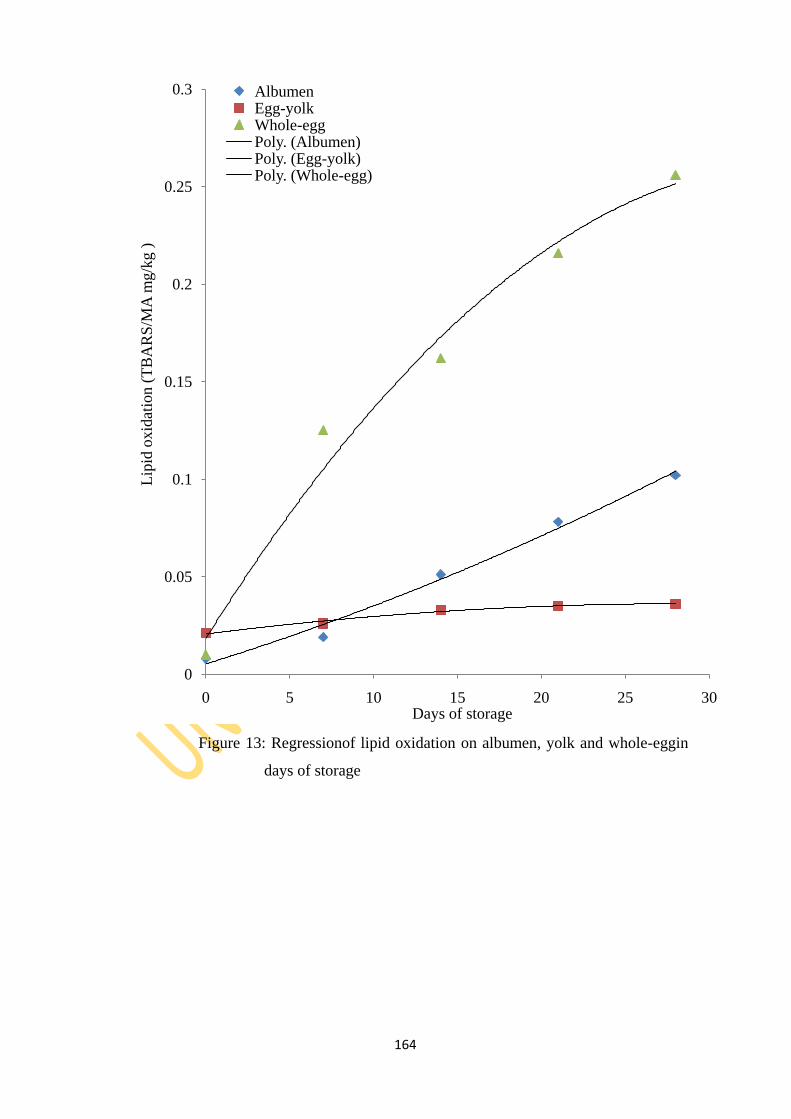
164
Figure 13: Regressionof lipid oxidation on albumen, yolk and whole-eggin
days of storage
0
0.05
0.1
0.15
0.2
0.25
0.3
0 5 10 15 20 25 30
Lip
id o
xid
atio
n (
TB
AR
S/M
A m
g/k
g)
Days of storage
AlbumenEgg-yolkWhole-eggPoly. (Albumen)Poly. (Egg-yolk)Poly. (Whole-egg)
165
CHAPTER FIVE
5.0 DISCUSSION
Study One
Effects of two housing systems on performance characteristics of growing pullets
from 13 to 16 weeks of age
Performance characteristics of growing pullets were indicated that daily feed intake
(g/bird) and feed cost per live weight gain varied (p<0.05) with HS. Feed consumed
(g/bird/day) in this period were 100.00±0.06 and 80.00±0.08 for pullets in BC and DL,
respectively. Growing pullets in BC consumed feed more (p<0.05) than those in DL.
Although, earlier study (Al-Rawi and Abu-Ashour, 1983) claimed that birds in DL
consumed more (p<0.05) feed than those in BC, the finding in this study agrees with
recent report (Bannga-Mboko et al., 2010) that feed consumption in BC (199.2
g/bird/day) was higher (p<0.05) than 155.7 in DL.
Natural habits of feeding on litter and feacal materials provided marginal nutrients to
pullets in DL (Asaduzzaman et al., 2005; DEFRA, 2011). Pullets in BC were not deined
such environment. Thus, feeding on litter and feacal materials and feed wasting by
pullets in DL could possibly compensate for reduced feed intake despite similar feed
efficiency in both HS. The comparative advantages of limited space per birds, higher
(p<0.05) feed intake and feed cost per live weight and reduced feed wastage of birds in
BC than in DL as reported (Pistikova et al., 2006; Vosláŕova et al., 2006; Bannga-
Mboko et al., 2010) could be responsible for thse differences. The increase in feed
intake by pullets in both HS was necessary because individual pullet adjust to
physiological development and readiness for egg production. This was evident as pullets
in both HS commenced egg production at approximately 122 days with those in BC
staring earlier than those in DL. It was possible that the higher (p<0.05) feed intake of
pullets in BC was utilised for egg production, hence production of heavier of first egg
(32.00g) than 31.83g in DL.
166
There was no significant difference in feed conversion ratio of pullets in the two HS.
This was contrary to the finding by Bannga-Mboko et al. (2010) that feed efficiency in
BC (2.7) was better (p<0.05) than in DL (3.42). The live weight and weight gain of
pullets were not influenced by HS. However, pullets in the two HS increased in weight
in the course of study. This was evident by strong and positive relationship between live
weight and age of pullets as indicated by regression values BC (R2 = 0.96) and DL (R
2
= 0.97).
Relationships between liveweight and age of pullets in both HS were linear which
explains positive growth in age. Pullets in DL increased in weight slightly more than
those in BC contrary to earlier findings by Pistikova et al. (2006), Vosláŕova et al.
(2006) and Banga-Mboko et al. (2010) that birds in BC achieve better feed efficiency
and growth rate than in DL. There was difference (p<.0.05) in feed cost per live weight
gain of pullet. The higher (p<0.05) feed cost per live weight in BC than DL recorded in
this study disagrees with the report (Appleby, 2001) that birds in BC lower feed cost.
There were no records of mortality in BC and DL which possibly implied that the two
HS were safe for managing growing pullets. However, Vosláŕova et al. (2006) reported
lower mortality and better performance in BC (p<0.05) than DL and recommended that
DL meet animal welfare policy requirement.
167
Study Two
Effects of five different proprietary vitamin-mineral premixes and two housing
systems on performance and egg production characteristics of pullets from 16 to
21 weeks of age
Feed consumption and utilisation are important factors that contribute to final live
weight. The HS did not affect total feed consumption but influenced (p<0.05) daily feed
intake of pullets. The relationship between DFI and age of pullets in BC and DL were
positive and significant (p<0.05). Pullets in BC consumed more feed than those in DL.
At early stage of egg producton, feed consumption was observed to increase with
increase rate of egg production. The results were contrary to earlier findings (Hargreave,
1982; Al-Rawi and Abu-Ashour, 1983) but confirmed by other reports (Pistikova et al.,
2006; Vosláŕova et al., 2006; Bannga-Mboko et al., 2010) that birds in BC utilised the
advantages of spatial density to reduced feed wastage and grow better (p<0.05) than
those in DL. The daily feed consumption of pullets in BC and DL increased (p<0.05)
linearly (R2=0.82 and R
2=0.57 respectively) with age which could be due to higher
nutrients demand for maintenance requirement, metabolisable energy, body weight,
growth, on-set of egg production; due to increase in size of ovary, oviducts, combs and
nutrient storage for egg-yolk precursors in liver, particularly calcium phosphate in
medullary bones, increase in size and number of eggs, chickens‟ activity and ambient
temperature of the housing system (Singh and Panda, 1988).
Pullets utilised feed in BC and DL to meet requirements for maintenance, growth,
development of eggs forming organs and early egg production. Thus, the increased daily
feed intake of pullets in DL could mean demand for more nutrients to meet requtrement
for maintenance, growth and exercise activity arising from higher floor space allowance
per pullet. However, pullets fed on litter and faecal materials to obtain exogenous
nutrients such as vitamins and minerals to partly meet these requirements. The
efficiency of feed utilization indicated that pullets were not meat-type and effect of HS
on feed convsersion ratio was not significant (p>0.05). Thus, variations in vitamin and
trace minerals content of dietary PVmP supplemented did not cause significant
difference (p>0.05) in total daily feed consumptions and feed conversion ratio. It could
therefore be deduced that the amount and quality of vitamins and trace minerals in test
168
ingredients (supplemental PVmP) were adequate to met requirement for growth and
initiation of egg production. In addition, some vitamins such as thiamine (B1), riboflavin
B2), pyridoxine (B6) and niacin which stimulate appetite were probably synthesized by
gut microbes in adequate amount to meet requirement for growth and preparation for
egg production despite competition with dietary source or sparing effect and nutrients
synergetic relationship. The findings in this study agree with explanation provided by
Oduguwa (1991) that chickens are better stabilised when riboflavin (B2), pyridoxine
(B6) and niacin in combination with thiamine are adequately supplied in diets. The
differences in vitamins and trace minerals in PVmP did not cause adverse effect on feed
consumption and utilisation by pullets. The interaction of supplemental PVmP and HS
did not affect (p>0.05) total and daily feed consumptions of pullets.
At week 21, HS affected (p<0.05) final live weight of pullets. The final live weight of
pullets in DL was higher (p<0.05) compared with those in BC. Pullets in the two HS
grew in the period of study. Pullets in DL increased in daily live weight more than those
in BC. This was indicated by similar and strong positive linear relationship (R2= 0.98)
between live weight and age of pullets in both HS. The higher (p<0.05) final live weight
of pullets in DL could be due to higher (p<0.05) feed consumption among other factors.
This shows that feed was properly utilised for growth and in preparation for egg
production. Pullets in DL had access to richer environment that provided extra nutrients
through feeding on litter and feacal materials as well as more floor space requirement.
The possibility of pullets in DL obtaining extra natural feed materials rich in protein,
amino acids, vitamins and minerals could not be ruled out. This probably explains the
reason for higher (p<0.05) final live weight attained by pullets in DL compared with
those in BC. Supplementation of diets with PVmP did not affect daily live weight while
final live weight of pullets varied (p<0.05).
The main effect of PVmP on final live weight was significant (p<0.05). Pullets fed diets
supplemented with PVmP grew differently in the period of study. Higher (p<0.05) feed
intake of pullets on diets supplemented with Nutripoult could be due to balanced
vitamin and trace mineral profile. The reduction in final live weight of pullets fed diets
supplemented with Hi-Nutrient, Agrited, Daram-vita and Micro-mix could be due to
relatively imbalanced, lower and/or excess of some vitamins and minerals. Low or
169
excess of thiamine, biotin, cyanocobalamin (B12), folic acid and zinc have been reported
by Ogunmodede (1974; 1978; 1982; 1991) to impair utilisation of carbohydrate, fat and
proteins. The final live weight of pullets fed diets supplemented with Hi-Nutrient,
Agrited, Daram vita-mix and Micro-mix were similar to those on diets without PVmP.
Imbalanced dietary vitamins and minerals are often implicated in complicity arising
from nutrient toxicity and/or antagonism. The combine effect of PVmP and HS affected
(p<0.05) live weight of pullets.
The HS influenced (p<0.05) number of eggs produced (EP) and hen day egg production
(HDEP) of pullets. Pullets in BC consumed lower feed but produced more eggs
compared with those in DL. At week 16 to 21 weeks of egg-lay, pullets in BC increased
rapidly in egg production more than in DL. This shows that feed consumption of pullets
in BC and DL was more properly channelled to egg production than maintenance and
growth. These results were in agreement with reports by Al-Rawi and Abu-Ashour
(1983), Anderson and Adams (1994), Abrahamsson et al. (1996), Pistikova et al.
(2006), Vosláŕova et al. (2006) and Bannga-Mboko et al. (2010) indicated that layers in
BC had comparative advantages of spatial density; controlled micro-climate; less
contact with feacal materials as a source of disease infection, better health condition and
reduced feed wastage to produced more egg than in DL. The findings in this study
corroborates reports by Vosláŕova et al. (2006) and Bannga-Mboko et al. (2010) that
layers in BC produced higher number of eggs and improved number of egg (+55%),
laying capacity (+25.5%) and feed efficiency (2.7 versus 3.42) than in DL.
The HDEP of pullets was affected (p<0.05) by PVmP supplementation. The difference
in composition of vitamin and trace minerals in diets supplemented with PVmP possibly
explains the variation in HDEP. Pullets fed diets supplemented with different PVmP
had higher HDEP. At about week 17, pullets fed diets with and without PVmP
supplementation were in lay irrespective of the differences in vitamin and trace minerals
in the diets. Pullets fed diets supplemented with PVmP had higher (p<0.05) HDEP than
those on diet without PVmP. The difference in HDEP was due to supply of additional
vitamins and trace minerals suuplied by the tested PVmP in the diets. Also, higher
HDEP of pullets fed Daram vita mix could be due to relatively more balanced vitamins

170
and trace minerals profile compared with lower HDEP values of those on diets
supplemented with Nutripoult, Hi-Nutrient, Agrited, and Micro-mix. Thus, diets
supplemented with PVmP and interaction effects with HS improved (p<0.05) HDEP.
171
Study Three
Effects of five different proprietary vitamin-mineral premixes and two housing
systems on performance and hen day egg production of laying chickens (22 to 70
weeks of age)
The ambient temperatures (oC) and relative humidity (%) in BC (28.5±1.6and
68.2±13.7) and DL (28.3±1.7 and 73.1±13.5) were higer than thermoneutral zones (18-
22 oC) documented for poultry (Charles, 2002; USDC-ESSA, 1970 as modified by Tao
and Xin, 2003). Higher ambient temperature and relative humidity have implication on
nutrients requirement for growth and egg production. Nutrient requirement for
maintenance and productive functions varies with changes in ambient conditions. The
daily variations in ambient temperature and relative humidity had noticeable effect on
rates of daily feed consumption and egg production. The rates of daily feed
consumption were affected (p<0.05) by HS. Earlier reports (Ajakaiye et al., 2011)
indicated that reduction in feed and dry matter intake of chickens under high ambient
conditions caused decline of egg production.
The high ambient tempartures and relative humidity probably affected production to
cause reduction in hen day egg production. Reports of earlier study (Hughes et al.,
1985) showed that high ambient temperature imposed heat stress on layers and cause
reduction hen day egg production and quality. This observation agree with reports by
Sahin and Kucuk (2001), Balmvave (2004), Robert (2004), Ciftci et al. (2005) Karaman
et al. (2007), Daghir (2009) and Ajakaiye et al. (2011) that layers managed in housing
system maintained at ambient temperature outside thermoneutral zones (18-22 oC)
declined in egg production drastically because of the presence of feather covering and
lack of sweat gland which made heat dissipation very difficult. Also, high ambient
temperature higher than thermoneutral zones (18-22 oC) create heat stress on ovarian
activities thereby causing differential ovarian blood flow pattern to leading to reduction
in production of eggs. Hence, reported study of Oguntunji and Alabi (2010) indicated
that fluctuation in egg production pattern was due to combined effect of high alternating
day and night ambient temperatures and humidity which stimulate higher level of
corticosteroids from hypothalamus. Therefore, the high level concentration
172
corticosteroids could be responsible for the negative influence onoviposition and cause
decline in egg production.
At early- (22 to 35 weeks), mid- (36 to 52) and late- (53 to 70) laying phases, layers in
DL had higher (p<0.05) daily feed intake than those in BC but there were differences
(p<0.05) in daily feed consumption among layers fed diets supplemented with PVmP.
The interaction of PVmP and HS affected (p<0.05) rate of daily feed consumption and
efficiency of feed utilisation. This observation was contrary to reports of Bannga-
Mboko et al. (2010) that feed consumption and feed efficiency of birds in BC was
higher (p<0.05) than those in DL. The feed consumption per egg mass of layers in BC
was lower (p<0.05) compared with those in DL which implied better feed efficiency for
egg production rather than growth. Layers in DL consumed feed on daily basis to meet
nutrients requirement for more active movement and exercise because of allowed higher
floor space. The higher daily feed consumption by layers in DL could probably be due
to feed wastage. This finding coborrates authors reports of Pistikova et al. (2006),
Vosláŕova et al. (2006) and Bannga-Mboko et al. (2010) that birds in BC utilised
advantages of spatial density to reduced feed wastage and perform better than those in
DL.
The label compositions of five different PVmPs contained varying amount of vitamins
and trace minerals. Micro-mix had relatively higher levels vitamins and minerals
profiles compared with other PVmPs. Adequate dietary levels of vitamins and minerals
enhance appetite but when in excess could cause toxicity or nutrient antagonism. Daily
feed consumption of chickens fed diets supplemented with Nutripoult, Hi-Nutrient,
Agrited and Daram vita-mix were higher due to enhanced appetite by vitamins and
minerals compared with those on diets without PVmP. This finding perhaps indicates
importance of PVmP supplementation in enhancing and stimulation of birds‟ appetite to
increase feed consumption and egg production. However, layers on diets supplemented
with Micro mix recorded lower daily feed intake probably due to reduced appetite as a
result of imbalance vitamins and mineral profile.
173
The live weight (LW) of layers varied (p<0.05) with HS, dietary PVmP
supplementation and its interactions with HS. Layers in DL was higher (p<0.05) in live
weight than those in BC. Efficiency of feed utilisation was determined in term of feed
conversion ratio per egg mass. Feed conversion ratio per egg mass of layers fed diets
without PVmP was better than those fed dietary PVmP supplementation. The
implication of thses findings is that HS and PVmP supplememtation in the diets caused
differences weight, efficiency of feed utilization for unit mass of egg produced. Layers
fed diets with PVmP supplementation possibly utilized vitamins such as thiamine (B1),
riboflavin B2), pyridoxine (B6) and niacin which stimulate appetite leading to higher
feed intake, egg weigt and mass and feed conversion ratio per egg mass. Variations in
daily feed consumption and efficiency of utilisation of egg production could be due to
differences of the different HS and PVmP compositions.
The importance of PVmP supplementation in diets of layers was underscored by the
results obtained in this study. Number of eggs produced, egg weight, egg mass and hen
day egg production varied (p<0.05) with HS, PVmP supplementation and PVmP
interactions with HS. Layers in DL was higher (p<0.05) in number of egg produced, egg
mass and hen day egg production than in BC. This finding is contrary to reports of
Bannga-Mboko et al. (2010) that BC improved (p<0.05) number of egg, hen day egg
production, egg mass and egg weight than DL. Layers in DL probably obtained extra
nutreints by feeding on litter and faecal materials for maintenance, growth and egg
production than those in BC.
Hen day egg production of layers varied (p<0.05) with HS. The hen day egg production
of layers in DL was higher (p<0.05) than in BC. Variations in egg production in the two
HS could be due to higher (p<0.05) feed intake and richer nutrient environment birds
feed on litter and faecal materials as well as the comfort of egg-laying on soft litter
materials in nesting boxes in DL. At late-laying phase (53 to 70 weeks), egg production
declined as birds approach the end of first laying cycle. The rate of decline of egg
production in BC was quite higher (p<0.05) than in DL. This observation was in
agreement with earlier reports of Anderson and Adams (1994) that layers in BC always
produce lesser number of eggs and heavier eggs at end of egg production cycle than in
174
DL. The hen day egg production of layers in BC was relatively higher than in DL at
week 22 and increased steadily in DL from week 22 more than those in BC at week 23.
The hen day egg production of layers in DL remained higher until week 33. The
different PVmP compositions influenced (p<0.05) hen day egg production. Higher
(p<0.05) live weight, number of egg produced and hen day egg production of layers on
diets supplemented with Nutripoult (D2) probably indicates adequacy of vitamin and
trace minerals supply in diets. The layers on diets without supplemental PVmP (D1)
probably utilised feed for growth than egg production compared with those on diets
with PVmP supplementation. Layers on diets without PVmP (D1) decresed in hen day
egg production from week 23, and later dive-nosed to zero value at week 34, while
those on diets supplemnetd with PVmP increased steadily in egg production. This
finding is consistent with earlier reports of Singh and Panada (1988) that any marked
deficiency of one or more of vitamins and trace minerals caused reduction or cessation
of growth and/or egg production in layers.
Research reports of Sahin and Kucuk (2001) and Ciftci et al. (2005) indicated that
differences in dietary vitamins and minerals and the degree in which micro-nutrients
mitigate heat stress were responsible for variations in egg production. Thus, in
agreement with the findings of Mori et al. (2003), Çiftçi et al, (2005) and Seven (2008),
vitamin and mineral profile of PVmPs probably maintained synergetic relationship in
thermoregulatory control of physiological processes in layers under heat stress to
impacted differences in hen day egg production. The differences in antioxidants profile
of PVmPs could participate in supply of egg precursors in plasmato reduce ACTH
concentration and decrease blood carbon dioxide (CO2) to cause variations in hen day
egg production (Kevin, 1982; Koelkebeck, 1999; Ny et al., 1999)
175
Study Four
Effects of five different proprietary vitamin-mineral premixes, two housing
systems and duration of storage on external and internal quality indices of eggs
The egg length (EL) of eggs from layers in DL was higher than those from BC which
supported earlier reports of Silversides and Scott, (2001), Wang et al. (2009) and
Ojedapo (2013) that egg weight (Ew), EL, diameter (EB), shell weight (EW) and shell
thickness (ET), yolk weight (YW) and colour (YC), albumen weight (AW) and heght
(AH) were better in eggs produced in DL than in BC. Eggshell was thicker for eggs
from BC than in DL. This finding is contrary to the report of Ojedapo (2013). External
[EW, EB and eggshell index (EI)] and internal (albumen and yolk) quality indices of
eggs varied (p<0.05) with different dietary PVmP. The YW, YB and YC increased
(p<0.05) with PVmP, while AW, HU and YH and YI decreased (p<0.05) in accordance
with reported studies of Silversides (1994), Monria et al. (2003) and Silversides and
Budgell (2004).
Egg quality indices of layers were affected by quality and composition of feed
according to reported studies (Van den Brand et al., 2004; Jones, 2006; Pavlovski et al.,
2012). Layers on diets without PVmP (D1) probably shut down all biochemical
processes necessary for egg formation and other body metabolism at week 34 due to
insufficient supply or lack of vitamin and minerals. The compositions of vitamin and
trace mineral profile in PVmP were different which explained the variations in egg
quality indices. Whitehead (1996) reported variations in number of egg produced and
egg quality of layers when given varied vitamin D3. This could be due to synergistic
relationships of vitamin D3 with other nurients. Also, the difference in vitamin E and its
synergetic relationship with other nutrients could probably increase (p<0.05) EP, EW
and ET when layers were under heat stress (Çiftçi et al., 2005). The EI and ET of eggs
were not different from the values obtained for eggs produced by those on diets without
PVmP as reported also by Qi and Sim (1998).
The variation in amount of microminerals in PVmP possibly accounted for the
differences in quality indices of eggs since vitamins and trace minerals serves as co-
enzymes in shell formation and associated membranes as reported by Mas and Arola
176
(1985) and Miles (2001). Trace minerals, particularly zinc, copper, iron, selenium and
manganese in PVmP are key components of shell matrix and shell integrity. Reported
study by Zamani et al. (2005) indicated that poor quality indices of eggs were due to
variation in dietary supply of micronutrients. The deficiency of dietary copper affect
biochemical and mechanical properties of eggshell membrane resulting in deformation
of egg shape, while dietary selenium supplementation up to 0.8mg/kg caused no
negative impact on eggshell quality indices as reported by reported Chowdury (1990).
Housing conditions in the two HS affected egg production and quality indices. The EW,
ET and AH of eggs of layers in BC were higher (p<0.05) than those from DL which
was contrary to reported studies by Silversides and Scott (2001), Wang et al. (2009) and
Ojedapo (2013). Variations in productive performance of layers on diets supplemented
with PVmPs could be due to difference in micronutrient profile of different PVmPs. The
findings of Roland (2000) and Zamani et al. (2005) indicated that deficiency or excess
of micronutrients in diets of layers impair efficiency of egg production leading to
production of poor egg quality. However, earlier reported study by Kershavarz and
Nakajima (1993) showed that excess dietary micronutrients such as calcium,
phosphorous, zinc and managanese above their requirements did not improve shell
quality. In similar reported studies by Taylor (1965), Boorman et al. (1989), Kershavarz
and Austic (1990), Nys (1995), and Pavlovski et al. (2012) imbalanced dietary
micronutrients such as phosphorous was reported to cause heat stress which inhibited
calcium mobilization with attendant poor bones development and eggshell breakage.
Also, the reports of Mas and Arola (1985) and Miles (2001) showed that dietary zinc,
copper, iron and manganese play crucial role as co-enzymes in metabolic reactions,
shell matrix and membranes formation and eggshell integrity.
There were no effects of HS on EW and ET contrary to reported studies of Jin and Craig
(1994), Pavlovski et al. (2001) and Hidalgo et al. (2008). However, present study
indicates difference (p<0.05) in egg diameter of layers in the two HS. This was
consistent with reports of studies by Mohan et al. (1991), Anderson and Adams (1994)
and Abrahamsson et al. (1996). In this study, external quality indices of eggs from
layers in BC were better contrary to the findings of Hughes et al. (1985), Pavlovski et
177
al. (2001), Hidalgo et al. (2008) and Ojedapo (2013). Reported studies by Morris (1985)
and Keshavarz and Nakajima (1995) indicated that differences in external quality
indices of eggs from layers in HS were due to production practices and physiological
stress. The high ambient temperature and relative humidity and competition among
layers for dust bathing was reported by Hughes et al. (1985) and Short (2001) to
increase stress in DL. Also, reported studies by Okoli et al. (2006) and Oguntunji and
Alabi (2010) showed that higher ambient temperatures outside thermonuetral zone
reduced voluntary feed intake and availability of micronutrients for shell deposition and
adversely affect oviposition and oviposition interval leading to reduction in egg
production and weak eggshell.
The findings in late-laying (53 to 70 weeks) was contrary to reports of Silversides and
Scott (2001) and Wang et al. (2009) that internal quality indices of eggs from layers in
DL were better than eggs from BC. Thus, variations and utilisation of micronutrients in
PVmPs critically affected internal quality indices of eggs. Reported studies by Williams
(1992), Franchini et al. (2002), Kirunda et al. (2001), Puthpongsiriporn et al. (2001) and
Ajakaiye et al. (2011) showed that albumen quality (Haugh Unit) was not greatly
influenced by variation in dietary nutrients. The duration of egg storage (DoS) affected
(p<0.05) external and internal quality characteristics of eggs. The Ew, EW, ET and egg
weight loss (EwL) change with DoS in agreement with findings of Jin et al. (2011). The
Ew decreased with DoS due of loss of egg moisture through shell pores in agreement
with the reports by Brake et al. (1997). The decrease in Ew with DoS agreed with
reported studies by ACIAR (1998) and Samli et al. (2005) that eggs reduced drasticaly
in weight within 10 days of storage at 29oC.
The EI, EL, EB and ET were not affected by DoS in agreement with reported studies of
Hamilton (1982), Tilki and Inal (2004) and Alade et al. (2009). In the reported studies
of Dudusola (2009) and Alsobayel and Albadry (2011), decrease in Ew with DoS was
due to metabolic process leading to loss of moisture, carbon dioxide, ammonia, nitrogen
and hydrogen sulphide gases. The decrease in AH and HU with DoS occurred more
quickly at higher ambient temperaturein as reported by Li-Chan and Nakai (1989) and
Dudusola (2009). At ambient temperatures and relative humidity lower than 70%,
178
Natalie (2009) indicated that stored eggs reduced in HU by 10–15 after few days of
storage but increased to 30 HU at 35 days of storage, while AH of eggs stored for 10
days decreased from 9.16-4.75 mm (Scott and Silversides, 2000; Ihsan, 2012). Albumin
index of eggs were influenced (p<0.05) by DoS. The increase in albumen pH during egg
storage could be due to changes in ovomucin (thick albumen) (Kato et al., 1994;
Toussant and Latshaw, 1999). Reported study of Okeudo et al. (2003) indicated that
loss of carbon dioxide (CO2) through shell pores made albumen more alkaline,
transparent and increasingly watery. At higher temperatures of egg storage, loss of
carbon dioxide (CO2) could be faster with increased deterioration of albumin quality
(Natalie, 2009). The changes in YW, YD and YH with DoS agreed with reported
studies by Fromm and Matrone (1962), Okoli and Udedibe (2003) and Jones (2006) that
protein structures of thick albumen and vitelline membrane degenerates faster while
water from albumen moves into yolk resulting in enlarged and decreased yolk viscosity
so that yolk become flattened and breakdown with increase in internal temperature of
eggs.
These changes could account for reduction in YH and YI and increased YW and YB.
The YI indicates spherical nature of egg-yolk which decreases progressively when
vitelline membranes become weakened and cause liquefaction of egg-yolk due to
osmotic diffusion of water from albumen. The YI decreased with increased moisture
content in agreement with reported study by Hidalgo et al. (1996). There were observed
variations in external and internal quality indices of eggs with days of storage. These
variations are explained by the regression of EW on DoS at the mid- (R² = 0.85) and
late- (R² = 0.99) laying phases. The rates of quality deterioration of albumen and egg
yolk were similar but proceeded relatively faster in egg yolk than albumen.
179
Study Five
Effect of supplementing laying chicken feed with five different proprietary
vitamin-mineral premixes, two housing systems and duration of storage on
chemical compositions of eggs
Eggs produced by layers in BC contained more energy, proteins, fat, ash, calcium and
total phosphorous than eggs from DL.These results corroborates reported study of Matt
et al. (2009) that eggs produced by birds in BC were richer in nutrients than eggs from
DL. However, reports of Menill et al. (2007) and Matt et al. (2009) indicated that
organic eggs contained more proteins and carbohydrate than eggs produced in BC. Also,
reported study of Menill et al. (2007) showed that orgnic eggs were higher in dry matter
compared with from those BC. The reason for lower chemical components of eggs
produced by layers in DL at early- (22 to 35), mid- (36 to 52) and late- (53 to 70 weeks)
laying phases could be due to nutrients partitioning between maitainenace for active
movement and exercise.
The chemical composition of eggs was affected by PVmP, which could be due to the
varying efficacy of the PVmP. Vitamins and trace minerals are required for different
biological process, particularly as co-enzymes in metabolism of carbohydrate, fat and
protein, production of eggs shell, albumen and yolk-forming materials in liver and
ovaries (Etches, 1996). Crude protein in eggs produced by layers at early laying phase
and stored was higher (p<0.05) than at late laying phase. The crude protein of eggs
during storage at early laying phase remained fairly conatant (R2 = 0.82) but increased
more at late laying phase (R2 = 0.99). Fat in stored eggs at late laying phase was higher
(p<0.05) compared with early laying phase. At early laying phase, fat content in stored
eggs was lower (R2 = 0.30) than at the late laying phase (R
2 = 0.95).
180
Study Six
Effects of five different proprietary vitamin-mineral premixes and two housing
systems on cholesterol profile of chicken eggs
The cholesterol profile of whole-egg and egg yolk of eggs produced by layers fed
different PVmP revealed that HS did not affect triglyceride (TG), total cholesterol
(TC), High Density Lipoprotein (HDL), Low Density Lipoprotein (LDL) and Very
Low Density Lipoprotein (VLDL) of whole-egg. However, TG and LDL of egg-yolk
varied (p<0.05) with HS. Eggs produced by layers in BC were higher (p<0.05) in TG
but lower in LDL than eggs from DL. The TG, TC, HDL, LDL and VLDL of both
whole-eggs and egg-yolk varied (p<0.05) with different dietary PVmP
supplementations. The interaction effects of PVmP supplementation and HS
influenced (p<0.05) TG and cholesterol profile of whole-egg and egg-yolk. These
findings agreed with reported studies of Lopez-Bote et al. (1998), Rizzi et al. (2006),
Rossi (2007), Stefano et al. (2008), Józefa et al. (2011) and Kamil et al. (2012). Eggs
produced by layers in DL contained two-thirds amount of cholesterol of those in BC.
Also, the finding in this study agreed with report of Zemkovia et al. (2007) that HS
influenced yolk cholesterol but contrary to the findings by Rizzi et al. (2006), Rossi
(2007) and Kamil et al. (2012).
Lower egg-yolk LDL was observed in eggs produced by layers from BC compared
with those in DL. This finding agrees with the reports by Zemkovia et al. (2007) and
Minelli et al. (2007). The TG of egg yolk of layers in BC was higher than those from
DL. This finding was contrary to the reports of Cherian et al. (2009) that there was no
clear effect of HS on lipid composition of egg-yolk. The difference (p<0.05) in TG,
TC and cholesterol profile of whole-egg and egg-yolk was a reflection of differences
in amount of vitamins and trace mineral content of dietary PVmP supplementation.
Vitamins and minerals serves primarily as an antioxidant in stabilizing lipid
component in poultry by reducing lipid peroxidation leadfing to increase in egg
production and quality (Gutteridge, 1995; Vicenzi, 1996; Meluzzi et al., 2000;
Leeson and Summers, 2001; Surai, 2003, Mabe et al., 2003; Franco and Sakamoto,
2005; Fernandez et al,. 2011).
181
Vitamins like thiamine, riboflavin pyridoxine, folic acid and niacin stimulate appetite
and increase consumption of feed. The higher feed consumption of layers in DL and
those fed PVmP supplementation possibly explains the differences in cholesterol
profile of eggs. This finding agrees with reports by Vargas and Naber (1984) that
egg-yolk cholesterol correlates positively with dietary energy balance because excess
dietary energy consumption beyond maintenance and production requirements
increased body weight and cholesterol synthesis such that excess cholesterol is
transferred and stored in egg-yolk. Conversly, Quirino et al, (2009) explained that
dietary energy had no effect on egg-yolk cholesterol and fatty acid profile. On the
other hand, Hassan et al. (2013) indicated that saturated fatty acid decreased with
increase in unsaturated fatty acid of egg-yolk with increase dietary metabolisable
energy and decreased crude protein. The differential feed consumption implied
variation in dietary energy with consequential correlation on egg-yolk cholesterol
content.
182
Study Seven
Effect of five different proprietary vitamin-mineral premixes, two housing systems
and duration of storage on lipid oxidation of eggs
At mid-laying phase, egg-yolk TBARS varied (p<0.05) with HS and PVmP and DoS
interaction effects. The egg-yolk TBARS of layers in BC was higher (p<0.05) than
those from DL. The egg-yolk TBARS increased (p<0.05) linearly (R² = 0.98) with DoS.
Also, at late- (53 to 70 weeks) laying phase, TBARS in albumen and whole-eggs varied
(p<0.05) with HS and PVmP supplementation. The TBARS increased (p<0.05) linearily
with DoS in both the albumen (R² = 0.99) and in whole-eggs (R² = 0.98) at the late-
laying phase. The TBARS increased (p<0.05) linearily with DoS at the late-laying
phase. The differences in TBARS in egg-yolk, albumen and whole-eggs could be due to
different HS and levels of potency of the vitamin and trace mineralin the different
supplemental PVmP.
Higher TBARS in whole-egg implied greater degree of lipid oxidation content in egg-
yolk. This finding agree with reported studies by Hamilton (1982), Tilki and Inal
(2004), Alade et al. (2009) and Tebesi et al. (2012) that egg quality was affected by
storage time. Also, Bou et al. (2006) observed that longer periods of supplementation of
α-tocopherol decreased lipid hydro-peroxides and lowered TBARS in stored eggs. In
this study, dietary supplementation of PVmP caused variations (p<0.05) in egg-yolk
TBARS. ThUS, higher TBARS in whole-egg implied greater degree of lipid oxidation
in egg-yolk. Reported studies of McDowell (1989), Halliwell and Gutteridge (1989),
Morrissey et al. (1997), Botsoglou et al. (2005), Grau et al. (2001), Galobart et al.
(2002) and Bou et al. (2006) revealed that dietary vitamin E in syerngistic relation with
vitamins C and selenium function as chain-breaking antioxidants in lipid oxidation
phases of cellular membrane or low density lipoproteins to reduce (p<0.05) TBARS.
Lipid oxidation was higher in whole-egg than egg yolk but increased rapidly in whole-
egg and albumen than egg yolk.
183
CHAPTER SIX
6.0: SUMMARY, CONCLUSION AND RECOMMENDATIONS
6.1: Summary
Seven studies were carried out to investigate effects of five proprietary vitamin-minreal
premixes (PVmP) and two housing systems (HS) on performance, egg production and
egg quality indices of laying chickens. Bovan Nera (n=576) pullets at week 13 were
divided equally into 288 per HS and used for the study. The two HS were conventional
3-tier Battery Cage (BC) and Deep Litter (DL) systems. The five different PVmPs
(growers and layers premixes): Nutripoult, Hi-Nutrient, Agrited, Daram vita-mix and
Micro-mix and designated K, L, M, N and P respectively were common brands of
premixes used for formulating poultry diets in different tolls of feed milling in Ibadan.
The compositions of vitamins and trace minerals in five different PVmP as indicated on
respective the labels and two HS were not the same and constituted souces of variation.
The findings of the study revealed that;
Ambient temperature (oC) and relative (%) ranged from 26.5 ± 0.1 to 31.9 ±1.1 and
40.6 ±1.0 to 90.5±8.7 respectively and were above thermoneutrality for laying
chickens.
Layers attained peak-lay at different periods during production irrespective of HS
and PVmP type.
The hen day egg production (HDEP) (%) in BC (64.1 ± 26.4) and DL (82.0 ± 13.8) at
peak-lay reduced to 52.1 ± 11.4 and 57.8 ± 14.1 respectively in late-lay (52 to 70
weeks).
The HDEP of layers fed diets without PVmP at peak-lay declined from 56.1±9.6 to
zero at week 34.
At week 34, HDEP of layers fed diets supplemented with Nutripoult (76.65) and
Agrited (76.60) were higher (p<0.05) than 68.45, 68.59 and 67.72 on diet with Hi-
Nutrient, Daram vita-mix and Micro-mix respectively.
At week 36, crude protein (%) of eggs from layers on diets supplemented with
Nutripoult (11.6 ± 0.17), Hi-Nutrient (11.55 ± 0.23), Daram vita-mix (11.55 ± 0.23)
and Micro-mix (11.6 ± 0.23) were higher than those on diets with Agrited
(11.4±0.17).
184
Low density lipoprotein (mg/dL) and Lipid oxidation (μmol/g) in eggs from layers on
DL (2.13 ± 1.63 and 0.04 ± 0.01 respectively) were higher (p<0.05) than 0.74 ± 0.15
and 0.028 ± 0.01 respectively in BC.
At zero duration of storage, Lipid oxidation (μmol/g) of egg from layers on
Nutripoult (0.028 ± 0.009), Hi-Nutrient (0.031 ± 0.008), Agrited (0.033 ± 0.008),
Daram vita-mix (0.032 ± 0.008) and Micro-mix (0.027 ± 0.010) were different and
increased (p<0.05) linearly with duration of egg storage.
The eggshell weight and thickness of eggs from BC (5.89 ± 0.60 and 0.35 ± 0.03)
were higher (p<0.05) than 5.58 ± 0.48 and 0.34 ± 0.03 respectively in DL.
Eggs from BC (48.7 ± 24.6) had higher haugh unit than DL (44.8 ± 25.2).
The haugh unit of egg from layers on Daram vita-mix (48.6 ± 25.2) and Micro-mix
(48.0 ± 25.0) were higher (p<0.05) than Nutripoult (46.1 ± 26.8), Hi-Nutrient (46.1 ±
23.8) and Agrited (44.8 ± 25.1), and haugh unit decreased (p<0.05) with duration of
egg storage (R² = 0.98).
6.2: Conclusion
Empirical findings from this study revealed that laying chickens managed on deep litter
produced more eggs than battery cage system from weeks 22 to 70. Diet without PVmP
supplementation made laying chickens to attain early peak of egg production at week 25
which subsequently declined to zero at week 34. Diets with PVmP supplementations
sustained increased egg production to peak at different weeks. Housing systems and the
type of dietary PVmP both affected composition and egg quality characteristics in
duration of egg storage. Nutripoult and Micro-mix Micro-mix would be preferred in
both HS as they both tend to ensure good albumen height, Haugh unit, yolk height, yolk
index, higher shell thickness and lowered weight loss. Quality of eggs was observed to
decrease when stored at room temperature. The lipid indices and duration of storage of
eggs from both HS were affected by the different dietary PVmP. Also, the interactions
of the dietary PVmP and HS as well as duration of egg storage profoundly affected the
lipid composition of eggs. Eggs qualities deteriorated below desirable grade before day
7 of storage at room temperature. Micro-mix reduced egg lipid oxidation, while
interaction effects of Hi-Nutrient and Daram vita-mix with both housing systems
enhanced bird laying capability.
185
6.3: Recommendations
Further studies on quality and potentcy of chemical profile of proprietary vitamin-
mineral premixes must be undertaken regularly to ensure standards
Strict compliance of industry standards by different proprietors of vitamin-mineral
premixes should be enforced by regulatory agencies and professional bodies such as
National Agency for Food and Drug Administration and Control (NAFDAC),
Standard Organisation of Nigeria (SON), Nigeria Institute of Animal Science
(NIAS) and Poultry Assocaiation of Nigeria (PAN), Animal Science Association of
Nigeria (ASAN), Nigerian Society for Animal Production (NSAP).
Public education and awearness programme should be mounted to provide
information on nutritional benefits of egg.
Alternative methods should be considered for storing excess eggs produced to
enhance retention of freshness.
186
REFERENCES
Abanikannda, O. T. F., Olutogun, O., Leigh, A. O. and Ajayi, L. A. (2007). Statistical
modeling of egg weight and egg dimensions in commercial layers. .International
Journal of Poultry Science, 6 (1):59-63
Abrahamsson, P. and Tauson, R. (1995).Aviary systems and conventional cages for
laying hens. Acta Agricultural Scandenviana Animal Science, 45:191–203
Abrahamsson, P., Tauson, R. and Elwinger, K. (1996). Effects on production, health
and egg quality of varying prop ortions of wheat and barley in diets for two
hybrids of laying hens kept in different housing systems. Acta Agricultural
Scandenviana Animal Science, 46:173–182
Adeogun, I. O. and Amole, F. O. (2004). Some Quality Parameters of Exotic Chicken
eggs Under Different Storage Conditions. Bulletin for Animal Health and
Production in Africa (Kenya), 52 (1):43 – 47
Ahmadi, F. and Rahimi, F. (2011). Factors affecting quality and quantity of egg
production in laying hens: A Review.World Applied Science, 12(3): 72-384
Ajakaiye, J. J., Perez-Bello, A. and Mollineda-Trujillo, A. (2011). Impact of heat stress
on egg quality in layer hens supplemented with l-ascorbic acid and dl-heat stress
on egg quality in layer hens supplemented with l-ascorbic acid and dl-tocopherol
acetate tocopherol acetate. Veterinary Arhive, 81, 119-132
Alade, F. A., Uzeh, R. E. and Bankole, M. (2009).Quality of eggs under varying storage
periods, condition and seasons in semi-arid regions of Nigeria.International
Journal of Basic Applied and Innovative Research, 8(2):21-24
Alahyari-Shahrab, M., Moravej, H., Shivzad, M. and Gerami, A. (2011). Study of
possible reduction or withdrawal of vitamin premix during finisher period in
floor and battery cage broiler raising system. .African Journal of Biotechnology,
33:6337
Aliarabi, H., Ahmadi, A., Ashori, N. and Hosseini, S. A. (2007). Effect of different
storage condition and hens age on egg quality parameters. 19th
Australia Poultry
Science Symposium, Sydney, New South Wales, 12-14th
February: 106-109
Alleman, F. and Leclercq, B. (1997). Effect of dietary protein and environmental
temperature on growth performance and waste composition of male broiler
chickens. British Poultry Science, 38: 607- 610
Al-Nasser, A., Holleman, K., Al-Khailefa, H., Al-Saffar, A., Behbehani, S., Al-Haddad,
A. and Al-Matrouq, F. (1998). Effect of vitamin and trace mineral premixes hen
187
substituted for concentrates in broiler and layer diets in Kuwait. Poultry Science,
77 (Suppl. 1): 86 (Abstr,)
Al-Rawi, B. A. and Abu-Ashour, A. M. (1983).Performance of laying hens under
different housing and environmental condition. World’s Review of Animal
Production, 19:54-60
Alsobayel, A.A. and Albadry, M. A. (2011). Effect of storage period and strain of layers
on internal and external quality characteristics of eggs marketed in Riyadh area.
Journal Saudi Agricultural Science, 10:41-45
Altunta, E. and Sekeroglu, A (2007). Effect of egg shape index on mechanical
properties of chicken eggs. Journal Food Engeering, 85: 606-612.
Anderson, K. E. and Adams, A. W. (1994). Effect of cage versus floor rearing
environments and cage floor mesh sizeon bone strength, fearfulness, and
production of singlecomb white leghorn hens. Poultry Science, 73, 1233–1240.
Anderson, K. E., Tharrington, J. B., Curtis, P. A. and Jones, F. T. (2004).
Characteristics of egg shape from historic strains of single conb White Leghorn
chickens and the relationship of egg shape to shell strength. International
Journal of Poultry Science, 3:17-19
Anisuzzaman, M. (1993). Influence of different types of litter on the performance of
broiler chicks, M. Sc. Thesis, Dept. of Poultry Science, BAU
AOAC (2000). Official Methods of Analysis, 15th
edition, Association of Official
Analytical Chemists, Washington, DC
Appleby, M. C. (2001). Chickens: Layer Housing, Encyclopaedia of Animal Science.
Doi: 10 1081/E-EAS-120019534.
Arima, Y., Mather, F. B. and Ahmad, M. M. (1976). Response of egg production and
shell quality, to increases in environmental temperature in. two age groups of
hens. Poultry Science Journal, 55:818-820
Asaduzzaman, M., M. S. Jahan, M. R. Mondol, M. A. Islam, and A. K. Sarkar (2005).
Efficacy of different commercial vitamin-mineral premixes on productive
performance of caged laying pullets. International Journal of Poultry Science,
4(8):589-595
Australian Centre for International Agricultural Research (ACIAR) (1998).
Measurement and maintenance of duck and hen egg quality in Vietnam.
Research Note: Research RN23 12/99
188
Awoniyi, T. A. M. (2003). The effect of housing on layer-chicken productivity in the 3-
tier cage. International Journal of Poultry Science, 2:438-441
Aygun, A. and Yetisir, R. (2010). The relationship among egg quality characteristic of
different hybrid layers to forced moulting programme with and without feed
withdrawal. Journal of Animal Vetenitary Advance, 9:710-715
Ayo, J. O. O., Owoyele, O. O and Dzenda, T. (2007). Effects of ascorbic acid on diurnal
variation on rectal temperature of Bovan Nera pullets during the harmattan
season. International Journal of Poultry Science, 6: 612-616.
Bains, B. S. (1999). A Guide to the Application of Vitamins in Commercial Poultry
Feed. Rath Design Communications, Australia
Bakken, G. S., Vanderbilt, V. C. Buttemer, W. A.and Dawson. W. R. (1978). Avian
eggs: thermoregulatory value of very high near infra-red reflectance. Poultry
Science, 200:321-323
Banga-Mboko, H., Mabas, J. S. and Adzona, P. P. (2010). Effect of Housing System
(Battery Cages Versus Floor Pen) on Performance of Laying Hens under
Tropical Conditions in Congo Brazzaville. Journal of Poultry Science, 3(1): 1-4
Bar, A., Vax, E. and Striem, S. (1999). Relationship among age, eggshell thickness and
vitamin D metabolism and its expression in laying hens. Comparative
Biochemistry and Physiology, 123: 147-154
Barber, E. F. and Cousin, R. J. (1998). Internaleukin-1-stimulated induction of
cerulopiasmin synthesis in normal and copper deficient rats. Journal of
Nutrition, 118:375-381.
Belnave, D., R. J., Gill, X. Li and Bryden,W. L. (2000). Response of Isa brown laying
hens to pre-layer diet containing additional calcium and to dietary protein and
lysine concentration during inorganic phosphorous in laying hens. British
Poultry Science, 51:779-784
Bennett, C. D. (1992). The influence of shell thickness on hatchability in commercial
broiler breeder flocks. Journal of Applied Poultry Research, 1:61-65
Benson, B. N., Calvert, C. C., Roura, E. and Klasing, K. C. (1993). Dietary energy
sources and density modulate of immunologic stress in chicks. Journal of
Nutrition, 123:1714-1723.
Berry, W. D. and Brake, J. (1991). Research note: Induced moult eggshell quality and
calbindin-D28K content of eggshell gland duodenum of egg hens. Poultry
Science, 70:655-657.
189
Beyer, R. S. (2005). Factors affecting egg quality Kansas State University.
http://www.oznet.ksu.edu/library/lvstk2/ep127.pdf
Bhale S., No H., Prinyawiwaiku, K. and Far, W. (2003). Chitosan coating improves
shelf life of eggs. Journal of Food Science, 68:2378-2383
Biladeau, A. M. and Keener, K. M. (2009). The effects of edible coatings on chicken
egg quality under refrigerated storage. Poultry Science, 88:1266-1274.
Blokhuis, H. J. (1989). The effect of a sudden change in floor type on pecking
behaviour in chicks. Applied Animal Behaviour Science, 22 (1): 65-73
Bolu, S. A. (2013). Vitamins in Poultry Nutrition. T-Babs Printers ISBN: 978-8113-02-
8
Boorman K. N., Volynchook, J. G. and Belyavin, C. G. (1989). Egg Shell Formation
and Quality, In: Recent Developments in Poultry Nutrition. Eds: Cole, D. J. A.
and Haresign, W., Butterworths, Kent, England
Botsoglou, N. A., Florou-Paneri, P., Nikolakakis, I., Giannenas, I., Dotas, V.,
Botsoglou, E. N., Bou, R., Codony, R., Baucells, M. D. and Guardiola, F.
(2005). Effect of heated sunflower oil and dietary supplements on the
composition, oxidative stability, and sensory quality of dark chicken meat.
Journal of Agricuture and Food Chemistry, 53:7792–7801
Bou, R., Grimpa, S., Baucells, M. D., Codony, R. and Guardiola, F. (2006). Dose and
duration of dark chicken meat through frozen storage: Influence of dietary fat
and alpha-tocopherol and ascorbic acid supplementation. Poultry Science
Journal, 80:1630–1642
Brake, J., Walsh, T. J., Benton, C. E., Petitte, J. N. Jr., Meijerhof, R. and G. Penalva.
(1997). Egg handling and storage. Poultry Science, 76:144-151.
Brandão, P. A. (2005). Ácidos graxos e colesterol na alimentação humana.
Agropecuária Técnica, (26)1:5-14.
Brillard, J. P. (2004). Natural mating in broiler breeders: present and future concerns.
World’s Poultry Science Journal, 60 (4): 439-445
Brown K. I. and Nestor K. E. (1973). Some physiological response of turkey selected
for high and low adrenal response to cold stress. Poultry Science, 52:1948
Burley, R. W. and Vadehra, D. V. (1989). The Avian Egg Chemistry and Biology, John
Wiley and Sons, New York, NY
190
Burtov, Yu, Z., Goldin, Yu. S. and Krrivopishin, I. P. (1990). Incubation of eggs:
Handbook, Agropromizdat, Moscow, Russia
Butcher, G. D. and Miles, R. D. (2003). Concepts of Eggshell Quality, University of
Florida http://edis.ifas.ufl.edu/pdffiles/VM/VM01300.pdf
Butcher, G. D., and Miles, R. D. (1995). Factors causing poor pigmentation of brown-
shelled eggs, Cooperative Extension Service Fact Sheet VM94 Institute of Food
and Agricultural Science, Univrsity of Florida, Gainesville, FL.
Butterwith, S. C. and Griffin, H. D. (1989). The effect of macrophage-derived cytokines
on lipid metabolism in chickens (Gallus domesticus) hepatocytes and
adipocytes. Comparative Biochemistry Physiology, 97B:722-724
Campo J. L, Garcia, H. and Gil M. (1998). Internal inclusions in brown eggs:
relationships with fearfulness and stress. Poultry Science, 77:1743-1747
Carrillo-Domínguez, S., Avila, G. E., Vásquez, P. C., Fuente, B., Calvo, C., C. and
Carranco, J. M. (2012). Eggs–No Yolking Matter. Nutrition Action Health
Letter.
Casagrande Proietti, P., Passamonti, F., and Asdrubali, G. (2001). La gallina ovaiola
allevata a terra e in gabbia. Riv. Avicolt, 3(5-6):12-15
Catala, A. (2006). An overview of lipid peroxidation with emphasis in outer segments
of carbonyl in eggs. The Lipid Chronicles 4(1):35-37.
Cerny, K., Kordylas, P., Pospisil, F., Vanbens, O. S. and Zajic, B. (1971). Nutritive
value of the winged bean (Psophocarpus tetragonolobus Desv). British Journal
of Nutrition, 26: 293-299.
Chance, B., Sies, H. and Boveris, A. (1979). Hydroperoxide metabolism in mammalian
organs. British Poult Journal 5(1):12-15
Charles, D. R. (2002). Responses to the thermal environment. In: poultry environment
problems, A guide to solutions (Charles, D.A. and Walker, A.W. Eds.),
Nottingham University Press, Nottingham, United Kingdom. 1-16
Cherian, G. (2007). Conjugated linoleic acid and fish oil in laying hen diets: effects on
egg fatty acids, thiobarbituric acid reactive substances, and tocopherols during
storage. Poultry Science, 86(5):953-958
191
Cherian, G. Campbell, A. and Parker, T. (2009). Egg quality and lipid composition of
eggs from hens fed Camelina saliva. Journal of Applied Poultry Research, 18:
143-150
Cherian, G., Holsonbake, M., and Goeger, P. (2002). Fatty acid composition and egg
components of speciality eggs. Poultry Science Journal, 81:30-33.
Cherian, G., Wolfe, F. and Sim, J. (1996). Dietary oils with added tocopherols: Effects
on egg or tissue tocopherols, fatty acids, and oxidative stability. Poultry Science
Journal, 75: 423-431.
Chernick, S. S., Lepkovsky, S. and Chaikoff, I. L. (1948). A dietary factor regulating
the enzyme content of the pancreas; changes induced in size and proteolytic
activity of the chicks‟ pancreas by the ingestion of raw soyabean meal.
American Journal of Physiology, 155:33-41
Chowdhury, S. R., Chowdhury, S. D. and Smith, T. K. (1990). Effects of dietary garlic
on cholesterol metabolism in laying hens. Poultry Science, 81:1856-1862.
Chukwuka, O. K., Okoli, I. C., Okeudo, N. J., Udedibie, A. B. I., Ogbuewu, I. P., Aladi,
N. O., Iheshiulor, O. O. M. and Omded, A. A. (2011). Egg Quality Defects in
Poultry Management and Food Safety. .Asian Journal of Agriciltural Research,
5, 1-16.
Ciftci, M., Nihat, O. and Ertas, T. Guler (2005). Effects of vitamins E and C dietary
supplementation on egg production and egg quality of laying hens exposed to a
chronic heat stress. Revue Médical Véterinary, 156 (Suppl. II), 107-111
Coetzee, C. (2002). The effect of elevated Calcium Levels in drinking water on shell
integrity. Spesfeed News, Summer 2002.
http://www.spesfeed.co.za/Summer2002.htm
Cook, M. E. (1991). Nutrition and immune response of the domestic fowl. Critical
Reviewof Poultry Biology, 3:167-189
Correia G. M. G, Takata F. N., Medeiro J. P. (2000). Effect of organic selenium and
zinc on the performance and egg quality of Japanese quails. Revista brasileira
de ciencia avicola, 29 (5):1440-1445
Cortinas, L., Villaverde, C. Galobart, J., Baucells, M. D., Codony, R. and Barroeta, A.
C. (2004). Fatty acid content in chicken thigh and breast as affected by dietary
polyunsaturation level. Poultry Science Journal, 83(11):55-64.
Coutts, J. A. and Wilson, G. C. (1990). Egg quality handbook, Queensland department
of primary industries, Australia
192
Cunningham, F. E. and Sanford, P. E. (1974). A review of facts influencing egg yolk
mottling. World's Poultry Science Journal, 30: 103-114
Daghir, N. J. (2009). Nutritional strategies to reduce heat stress in broiler and broder
breeders. Lohman Information, 44 (1)6-15
Daghir, N. J., Marrion, W. W. and Balloun, S. L. (1960). Influence of dietary fat and
choline on serum and egg yolk cholesterol in the laying chicken. Poultry
Science, 39: 1459-1466
Damron, B. L., Johnson, W. L. and Kelly, L. S. (1986). Utilization of sodium
bicarbonate by broiler chickens. Poultry Science, 65:782-785
Dawkin, M. (1983). Cage size and flooring preferences in litter-reared and cage-reared
hens. British Poultry Science, 24(2): 177-182
Dawkin, M. (1989). Time budgets in Red Jungle fowl as a baseline for the assessement
of welfare in domestic fowls. .Applied Animal Behaviour Science, 24:77-80
De Ketelaere, B., Bamelis, F., Kemps, B., Decuypere, B. and De Baerdemaeker, J.
(2004). Non-destructive measurement of egg quality. World’s Poultry Science
Journal, 60 (3): 289-302
Deaton, J. W. and Quisenberry, D. (1965). Effect of amino acid supplemented of low
protein corn and grain sorghum diets on the performance of egg production
stock. Poultry Science, 43:1214-1219
DEFRA (2011). DEFRA code for the welfare of laying hens/Access date 5 December
2011
Dingle, N. M. and Henuk, Y. L. (1999). Formulating diets for laying hens without a
vitamin and mineral premix gives less nutrient excesses. In: Austrailian. Poultry
Scienec Symposum 11:185. University of Sydney, Sydney, NSW
Djukic-Stojcic, M., Peric, L., Bjedov, S. and Milosevic, N. (2009). The quality of table
eggs produced in different housing systems. Biotechnology in Animal
Husbandry, 25 (5-6):1103-1108
Domínguez, R.O., Marschoff, E. R., Guareschi, E. M., Repetto, M. G., Famulari, A. L.
and Pagano, A. (2008). Biosynthesis and function of polyacetylenes and allied
natural products. Progress in Lipid Research, 47 (4): 233–306.
Doyon, G., Bernier-Cardoyon, Bernier-Cardou, M., Hamilton, R. M. G., Castaigne, F.
and Randall, C. J. (1986). Egg quality: 2. Albumen quality of eggs from five
193
commercial strains of White Leghorn hens during one year of lay. Poultry
Sci.ence, 65:63-66.
Dudusola I. O. (2009). Effect of Storage Methods and Length of Storage on some
Quality Parameters of Japanese quail eggs. Tropicultura, 27 (1): 45-48.
Duduyemi, O. A. (2005). Evaluation of egg-lating performance of low strain of bovan
chickens (Bovan Brown and Bovan Nera) in the tropics. Proc. 1st Nigerian
International Poultry Summit, Feb 20-25, 2005, Ota Ogun State Nigeria 33-35
Duncan, I. J. H. and Hughe, B. O. (1972). Free and operant) Free and operant feeding in
domestic fowls. Animal Behaviour, 20:775-777
Duyck, S. K., Miles, R. D., Rossi, A. F. and Henry, P. R. (1990). Effect of time and
storage conditions on interior egg quality from hens fed vanadium. Poultry
Science, 69 (Supplement 10):164
Edward Jr., H. M., Marion, J. E. and Driggers, J. C (1962). Serum and cholesterol levels
in mature hens as influenced by dietary protein and fat changes. Poultry Science,
41:713-717
Elston, J. J. (2000). Laying hen behaviour: Effect of cage type and startle stimuli
Poultry Science Savoy, 79(4):471-476
Emman, G. C. (1994). Effective energy: a concept of energy utilization applied across
species. British Journal of Nutrition, 71: 801-802
Esonu B. O. (2006). Animal Nutrition and Feeding: A functional Approach. 2nd
Edn
Rukzeal and Ruksons Associates Memmory Press, Owerri, Nigeria
Etches, R. J. (1987). Calcium logistic in the laying hens. Journal of Nutrition, 117:619-
628
Etches, R. J. (1996). Reproduction-Poultry. Wallingford: CAB Intectual: 378
Fahy, E., Subramaniam, S., Murphy, R., Nishijima, M., Raetz, C., Shimizu, T., Spener,
F., Meer, G., Wakelam, M ., and Dennis, E. A. (2009). Update of the lipid maps
comprehensive classification system for lipids. Journal of Lipid Research, 50(1):
9–14
FAO (2003). Egg marketing a guide for the production and sale of eggs. Food and
Agriculture Organization of the United Nations Rome
194
FAO, (2000). World Watch List for Domestic Animal Diversity, Food and Agriculture
Organization of the United Nations, 3rd
Edition, Ed. Beate D. Scherf, Roma
2000: 364.
Faria, D. E., Junqueirao. M., Sakomura, N. K. and Santana A. E. (1999). Effect of
different levels of manganese and phosphorus on the performance and eggshell
quality of laying hens. Revista Sociedade Brasileria Zo otecnia, 28:105–112
Farooq, M., Mian, M., Ali, M., Durrani, F. Asghar, and Muqarrab, A. (2001). Egg traits
of Fayoumi birds under subtropical conditions. Sarhad Journal of Agriculture,
17, 141-145
Farooqui, T. and Farooqui, A. (2011). Lipid-mediated oxidative stress and inflammation
fromfats and cholesterol. The Nutrition Source Harvard School of Public Health
Fernandez, I. B., Cruz, V. C. and Polycarpo, G. V. (2011). Effect of dietary organic
selenium and zinc on the internal egg quality of quail eggs for different periods
and under different temperatures. Rev. Brasilain Cienc Avic, 13(1):234-255.
Filardi, R. S. (2005). Influence of different fat sources on the performance, egg quality,
and lipid profile of egg yolks of commercial layers in the second laying cycle.
The Journal of Applied Poultry Research, 14(2):258-264
Fisher, C. and Wilson, B. M. (1974). Responses to dietary energy concentration by
growing chickens, In: Energy Requirement of Poultry (Morris, T. R and
Freeman, B. M. Eds). Edinburgh. Constable 151-184
Fisher, L. J., Erfle, J. D., Lodge, G. A. and Sauer, F. D. (1973). Effects of propylene
glycol or glycerol supplementation of the diet of dairy cows on feed intake,
milk yield and composition, and incidence of ketosis. Canadian Journal of
Animal Science, 53:289-296.
Franchinni, A., Sirri, F., Tallarico, N., Minelli, G., Iaffaldano, N. and Meluzzi, A.
(2002). Oxidative stability and sensory and functional properties of eggs from
laying hens fed supranutritional doses of vitamins E and C. Poultry Science, 81:
1744-1750
Franco, J. G. and Sakamoto, M. I. (2005).Qualidade de ovos: uma visão geral dos
fatores que a influenciam. Campinas Brasilian Cienc Avic, 10(3)
Fraps, G. S. (1946). Composition and productive energy of poultry feeds and rations.
Texas Agricultural Experimental Station Bulletin, 678-876
Fraser, A. F. and Bloom, D. M. (1990). Farm Animal Behaviour and Welfare, 3rd
Edition, London, England: Bailliere Tindall p. vii
195
Freitas, E. R. (2000). Colesterol e ácidos graxos da gordura de frangos de corte
alimentados com dietas contendo farelo da amêndoa da castanha de caju
suplementado com enzimas In: Reunião Anual Da Sociedade Brasileira De-
Zootecnia. Viçosa. Anais Viçosa Journ., 37(4):261-278
Fromm, D. and Matrone, G. (1962). A rapid method for evaluating the strength of the
vitelline membrane of the hen‟s egg yolk. Poultry Science, 41: 1516-1521
Galobart, J., Barroeta, A. C., Baucells, M. D., Cortinas, L. and Guardiola, F. (2001).α-
Tocopherol transfer efficiency and lipid oxidation in fresh and spray-dried eggs
enriched with n-3 polyunsaturated fatty acids. Poultry Science, 80:1496–1505
Galobart, J., Barroeta, A. C., Cortinas, L., Baucells, M. D. and Codony, R. (2002).
Accumulation of α-tocopherol in eggs enriched with ω-3 and ω-6
polyunsaturated fatty acids. Poultry Science Journal, 45(11):567-588
Galobart, J., Sala, R., Rincon-Carruyo, X., Manzannilla, E. G., Vila, B. and Gasa, J.
(2004). Egg yolk colour as affected by saponification of different natural
pigmentation sources. Journal of Applied Poultry Research, 13:328-338
Gavril, R. and Usturoi, M. G. (2012).Effect of storage time and temperature on hen egg
quality. Seria Zootehnie, 57:221-229
Gey, K. F. (1998). Vitamins E plus C and interacting co nutrients required for optimal
health in adults. Lancet Journal, 6 (1): 8–11
Gezen, S.S., Eren, M. and Deniz, G. (2005). The effect of different dietary electrolyte
balances on eggshell quality in laying hens. Revue Medecine Veterinarie, 156,
(10):491-497
Glatz, P. C. (1993). Poultry Production in Hot Climates. Proceedings of the 9th
Australian Poultry and Feed Convention, Gold Coast, Australia, 202-205
Gonzalez-Esquerra, R., and Leeson, S. (2000). Effect of feeding hens regular or
deodorized menhaden oil on production parameters, yolk fatty acid profile, and
sensory quality of eggs. Poultry Science Journal, 79:1597-1602
Gosler, A. G., Higham, J. P. and Reynolds, S. J. (2005). Why are birds' eggs speckled?
Ecology Letter, 8:1105-1113
Grashorn, M. A. (2005). Enrichment of egg and poultry meat with biologically active
substances by feed modifications and effects on the final quality of the product.
Poultry Journal of food Nutrition Science, 14(55):15-20
196
Grau, A., Guardiola, F., Grimpa, S., Barroeta, A. C. and Codony, R. (2001). Oxidative
stability of special eggs. Poultry Science Journal, 81:30-33
Gregory, N. G. and Wilkins, L. J. (1989). Broken bones in domestic fowls: Handling
and processing damage in end-of-lay battery hens. British Poultry Science,
30:555-562.
Griffin, H. D. and Butterwith, S. C. (1988). Effect of eschericia coli endotoxin on tissue
lipoprotein lipase activities in chickens. British Poultry Science, 29(2): 371-
378
Grobas, S, Mendes J, Medel P, Lazaro R, Mateos, G. G. (1997). Influence of energy,
linoleic acid and fat content of the diet on performance and weight ofegg
components of brown layers. Poultry Science Journal, 76:256-258.
Grobas, S. (2001). Influence of source and percentage of fat added to diet on
performance and fatty acid composition of egg yolk of two strains of laying
hens. Poultry Science Journal, 80:1171-1179
Grobas, S., J., Mendez, C., Lopez Bote, C. De Blas and Mateos, G. G. (1999). Effect of
vitamin E and A supplementation on egg yolk α-tocopherol concentration.
Poultry Science, 81:376-381
Guesdon V. and Faure, J. M. (2004). Laying performance and egg quality in hens kept
in standard or furnished cages. Journal of Animal Research, 53:45–57
Gunlu, A., Kirikci, K., Cetin, O. and Garip, M. (2003). Some external and internal
quality characteristics of partridge (A. graeca) egg. Food Agriculture and
Environment, 1: 197-199.
Gutteridge, J. M. (1995). Lipid peroxidation and antioxidants as biomarkers of tissue
damage. Clinical Chemistry, 41:1819–1828
Halliwell, B. and Gutteridge, J. M. (1989).Free Radicals in Biology and Medicine 2nd
ed.
Halliwell, B., Murcia, M. A., Chirico, S. and Aruoma, O. I. (1995). Free-radicals and
antioxidants in food and in-vivo–what they do and how they work. Critical
Review of Food Science and Nutrition Journal, 35:7–20.
Hamilton, R. M. G. (1982). Methods and factors that affect the measurement of egg
shell quality. Poultry Science, 61: 2002-2039.
197
Hammershoj M. and Kjaer, L. (1999). Phase feeding for laying hens: Effect of protein
and essential amino acids on egg quality and product. Acta Agriculturae
Scandinavica section. A-Animal Science, 49-41
Hargreave, C. T. (1982). Layers nutrition in hot climates. Poultry International, 21:36-
40
Harms, R. H., Russell G. B., Sloan D. R., (2000). Performance of four strains of
commercial layers with major changes in dietary energy. Journal of Applied
Poultry Research, 9:535–541
Hasin B. M., Ferdaus, A. J. M., Islam, M. A., Uddin, M. J. and Islam, M. S. (2006).
Marigold and Orange Skin as Egg Yolk Color Promoting Agents. International
Journal of Poultry Science, 5 (10): 979-987
Hassan, M. D., Rakibul, H. S., Choe, A., Yong, D., Jeong, I., Jong, H., Kyeong, S. and
Ryu, D. (2013). Effect of dietary energy and protein on the performance, egg
quality, bone mineral density, blood properties and yolk fatty acid composition
of organic laying hens. Italian Journal of Animal Science, 12(10):234-239.
Haugh, R. R. (1937). The Haugh unit for measuring egg quality: US Egg Poulty
Magazine. 43:552-555 and 572-573
Hayat, Z., Cherian, G., Pasha, T. N., Khattak, F. M. and Jabber, M. A. (2010). Oxidative
stability and lipid components of eggs from flax-fed hens: Effect of dietary
antioxidants and storage. Poultry Science, 89:1285-1292
Henry, P. R. (1995). Sodium and chloride bioavailability In: Ammernan, C. B., Baker,
D. H. and Lewis, A. J. Eds.) Bioavailability of Nutrients for Animals, Academic
Press, San Diego, California USA, 337-348
Hess, J. B. and Britton, W. M. (1989). The effect of dietary chloride or protein changes
on eggshell pimpling and shell quality in late production leghorn hens. Nutrition
Reports International, 40, 1107 -1115
Hetland, H., Choct, M. and Svihus, B. (2004). Role of insoluble non-starch
polysaccharides in poultry nutrition. World’s Poultry Science Journal, 60 (4):
415-422
Hidalgo, A., Rossi, M., Clerici, F. and Ratti, S. (2008). A market study on the quality
characteristics of eggs from different housing systems. Journal of Food
Chemistry, 106: 1031-1038
198
Hill, F. W. (1962). Some aspects of the physiology of food intake and digestion in
chickens. In: Nutrition of Pigs and Poultry (Morgan, J. T. and Lewis, D. Eds.),
London, Butterworth, 3-17
Hocking, P. M., Bain, M., Channing, C. E., Fleming, R. and Wilson, S., (2003). Genetic
variation for egg production, egg quality and bone strength in selected and
traditional breeds of laying fowl. British Poultry Science, 44: 365-373
Holland, K. G., Grunder, A. A. and Williams, C. L. (1980). Response to five
generations of selection for blood cholesterol levels in White Leghorns. Poultry
Science Joural, 59:1316-1326
House, J. D., Braun, K., Balance, D. M., O'Connor, C. P. and Guenter, W. (2002). The
enrichment of eggs with folic acid through supplementation of the laying hen
diet. Poultry Science, 2002: 81(9):1332-7
Hughes B. O., Dum, P. and McCorquodale, C. C. (1985). Shell strength of eggs from
medium bodied hybrid hens housed in cages or on range outside pen. British
Poultry Science, 26: 129-136
Hughes, B. O. (1975).Spatial preference in the domestic hens. British Veterinary
Journal, 131 (5) 560-564
Humphrey, B. D. and Klasing, K. C. (2004). Modulation of nutrient metabolism and
homeostasis by the immune system. World’s Poultry Science Journal, 60 (1):
99-100
Hunton, P. (2005). Research on eggshell structure and quality: An historical overview.
Revista Brasileria de Ciencia Avicola, 7 (2)
Huygheb, G., De Groote, G., Butter, E. A. and Morris, T. R. (1991). Optimum
isoleucine requirement of laying hens and the effect of age. British Poultry
Science, 32: 471-481
Ihsan, T. Tayeb (2012). Effect of storage temperature and length on egg quality
parameters of laying hen. Journal of Animal Science, 1(2): 32-36.
Isikwenu, J.O., Okaplefe, C.S., Mmereole, F.U.C. (1999). Storability of chicken eggs
under different storage conditions. Proceedings of the 26th
Annual Nigeria
Society for Animal Production Conference, 21-25: March, University of Ilorin,
Ilorin, Nigeria.
Izat, A., Garder, A. and Mellor, D. (1985). The effect of age of bird and season of the
year on egg quality. Poultry Science, 65:726-728
199
Jackson, N., Kirkpatrick, H. R. and Fulton, R. B. (1969). An experimental study of the
utilization by the laying hen of dietary energy partially supplied as animal fat.
British Poultry Science, 10: 115-126
Jacob, J. P., Miles, R. D. and Mather, F. B. (2000). Egg quality. University of Florida
http//:edis.ifas.ufl.edu/pdffiles/PS/PS02000.PDF
Jin Y. H, Lee, K. T., Lee, W. I. and Han, Y. K. (2011). Effects of Storage Temperature
and Time on the Quality of Eggs from Laying Hens at Peak Production. Asian
Australian Journal of Animal Science, 24 (2): 279-284
Jin, L, and Craig, J. V. (1994). Some effects of cage and floor rearing on commercial
white leghorn: Perspective on lipid index of eggs. Nutrition bulletin, 31(1): 21-
27
Jones, D. R. (2006). Conserving and Monitoring Shell Egg Quality. Proceedings of the
18th
Annual Australian Poultry Science Symposium, 157-165
Jones, D. R., Tharrington, J. B., Curtis, P. A., Anderson, K. E., Keener, K. M. and
Jones, F. T. (1990). Physical quality and composition of retail shell eggs.
Poultry Science, 81:727–733
Józefa, K., Zofia, S. and Beata, S. (2011). Effect of housing system on cholesterol,
vitamin and fatty acid content of yolk and physical characteristics of eggs from
Polish native hens. Archiva geflügelk, 75(3):151- 157.
Kamil, K., Mehmet, B., Emine, N., Mustafa, Ç., Abdullah, U., Erol, B. and Fethiye, Ç.
(2012). Effects of rearing systems on performance, egg characteristics and
immune response in two layer hen genotype. Asian-Australian Journal of
Animal Science, 25(4):559–568
Kang, K. R., Cherian, G. and Sim, J. S. (1998). Tocopherols, retinol and carotenes in
chicken egg and tissues as influenced by dietary palm oil. Journal of Food
Science, 63: 592–596
Kang, K. R., Cherian, G. and Sim, J. S. (2001). Dietary palm oil alters the lipid stability
of polyunsaturated acid-modified poultry product. Poultry Science, 80: 228-234.
Kato, A., Ibrahim H.R., Nakamura, S. and Kobayashi, K. (1994). New methods for
improving the functionality of egg white proteins: In: Sim, J. S., Nakai, S. (eds):
Egg Uses and Processing Technologies New Developments, CAB International
Wallingford 250–267
Keener, K. M., LaCrosse, J. D., Curtis, P. A., Anderson, K. E. and Farkas, B. E. (2000).
The influence of rapid air cooling and carbon dioxide cooling and subsequent
200
storage in air and carbon dioxide on shell egg quality. Poultry Science, 79:1067–
1071
Kemps, B. J., Bamelis, F. R., De Katelaere, B., Mertens, K., Tona, K., Decuypere, E.M.
and De Baerdemaeker, J. G. (2006). Visible transmission spectroscopy for the
assessment of egg freshness. Journal of the Science of Food and Agriculture, 86:
1399-1406
Kershavarz, K. and Nakajima, S. (1993). Re-evaluation of calcium and phosphorous
requirements of laying hens for optimum performance and egg shell quality.
Poultry Science, 72: 144 - 153
Keshavarz, K. and Austic R. E.(1990). The effect of minerals on acid-base balance and
eggshell quality. Journal of Nutrition, 120: 1360-1369.
Keshavarz, K. and Nakajima, S. (1995). The effect of dietary manipulations of energy,
protein, and fat during the growing and laying periods on early egg weight and
egg components. Poultry Science, 74:50–61
King‟ori, A. M. (2011). Review of factors that influence egg fertility and hatchability in
poultry. International Journal of Poultry Science, 10:483-492
Kirunda D. F. K. and McKee, S. R. (2001). Relating quality characteristics of age egg
and fresh eggs to vitelline membrane strength as determined by a texture
analyzer. Poultry Science, 79: 1189-1193
Klasing, K. C. (1984). Effect of inflammatory agents and interleukin-1 on iron and zinc
metabolism. American Journal of Physiology, 247:R901-904.
Klasing, K. C., Laurin, D. E., Peng, R. K. and Fry, M. (1987). Immunologically
mediated growth depression in chicks: Influence of feed intake, Corticosterone
and Interleukin-1. Journal of Nutrition, 117:1629-1637
Knight, C. D., Klasing, K. C. and Forsyth, D. M. (1983). E. coli derxtraan-supplement
pigs. Journal of Animal Science, 57: 387-395.
Koelkebeck, K. W (2003). What is egg quality and conserving it? University of Illinois
Extension Publications, August
Koelkebeck, K. W. (1999). What is egg quality and conserving it? University of
Illinois.http//www.traill.uiuc.edu/poultrynet/paperDisplay.cfm?ContentID=522
Koh, T. S., Peng, R. K. and Klasing, K. C. (1996). Dietary copper level affects copper
metabolism during lipopolysaccharide-induced immunological stress in chicks.
Poultry Science, 75:867-872
201
Kokantnur, M., Rand, R. T., Kummerow, F. A. and Scott, H. M (1958). Effects of
dietary protein and fat on changes of serum cholesterol in mature birds. Journal
of Nutrition, 64:177-184
Koutsos, E. A. and Klasing, K. C. (2001). Interaction between the immune system,
nutrition and productivity of animals: In: Recent Advance in Animal Nutrition.
2001. P. C.Gansworthy and J. Wiseman eds. Nottingham University Press,
Nottingham, 173-190
Kovács, G., Schmidt, J., Dublecz, K., Wágner, L. and Farkas-Zele, E. (2000). Effect of
feed composition on cholesterol content of the table egg. Animal Science
Journal, 29: 25-41
Kralik, G., Ivanković, S., Bogut, I., Csapo, J. (2006). Effect of dietary supplementation
with PUFA n-3 on the lipids composition of chicken meat. Animal Science
Journal, 33: 129-139
Krawczyk, J. and Gornowicz, S. (2009). Effect of layer age and egg production level on
changes in quality traits of eggs from hens of conservation breeds and
commercial hybrids. Annals of Animal Science Journal, 9(2): 185-193
Kucuk, O. Sahin, N., Sahin, K., Gursu, M. F., Gulu, F., Ozcelik, M. and Issi, M. (2003).
Egg production, egg quality, and lipid peroxidation status in laying hens
maintained at a low ambient temperature (6°C) and fed a vitamin C and vitamin
E-supplemented diet. Czeche Vetetrinary Medicine, 48 (1–2): 33–40
Kul, S. and Seker, I. (2004). Phenotypic correlation between some external and internal
egg quality traits of Japanese quail (Coturnix coturnix Japonica). Iinternational
Journal of Poultry Science, 3: 400-405
Kutlu, H. R. and Forbes, J. M. (1993). Changes in growth and blood parameters in heat-
stressed broiler chicks in response to dietary ascorbic acid. Livestock Production
Science, 36: 335-350
Lahti, D. C. (2008). Population differentiation and rapid evolution of egg color in
accordance with solar radiation. Aukland, 125:796-802
Lanari, M.C., Hewavitharan, A.K., Becu, C. and de Jong, S. (2004). Effect of dietary
tocopherols and tocotrienols on the antioxidant status and lipid stability of
chicken. Meat Science, 68: 155–162
Langweiler, M. B., Sheffy, E. and Schultz, R. D. (1983). Effect of antioxidants on the
proliferative response of canine lymphocytes in serum from dogs with vitamin E
deficiency. Animal Journal of Vetetinary Research, 44:5
202
Larbier, M. and Leclercq, M. (1997).Nutrition and Feeding of Poultry. Nottingham
University Press, Loughborough GB, 305
Lauorin, D. E and Klasing, K. C. (1987). Effect of repetitive immunogen injections and
fasting versus feeding on iron, zinc and copper metabolism in chicks. Biology of
Trace Element Research, 14:153-165
Ledur, M. C., Liljedahl, L. E., McMillan, I., Asselstine, L. and Fairfull, R. W. (2002).
Genetic effects of aging on egg quality traits in the first laying cycle of White
Leghorn strains and strain crosses. Poultry Science, 81:1439-1447
Leeson, S. (2007). Vitamin requirement: is there basis for re-evaluating dietary
specifications. World`s Poultry Science Journal, 63:255-266.
Leeson, S. and Caston, L. J. (2003). Vitamin Enrichment of Eggs. The Journal of
Applied Poultry Research, 12:24-26
Leeson, S. and Summers, J. D. (2001). Scott`s Nutrition of the Chicken. 4th
ed.
University Books, Guelph, Ontario, Canada, 591
Leeson, S. and Summers, J. D. (2005). Commercial Poultry Nutrition 3rd
ed. Nottingham
University Press, UK, 398
Leshchinsky, T. V. and Klasing, K. C. (2001). Divergence of inflammatory response in
two types of chickens. Developmental and Comparative Immunology, 25:629-
638
Li-Chan, E. and Nakai, S. (1989). Biochemical basis for the properties of egg white.
Critical Review of Poultry Biology, 2:21-59
Li-Chan, E. C., Powrie, W. and Nakai, S. (1995). The chemistry of egg and egg
products: In: Egg Science and Technology, 4th
ed., W. J. Staelman and J. O.
Cotterill, Food Product Press, New York, 105-175
Lichovnikova, M. and Zeman, L. (2008). Effect of housing system on the calcium
requirements of laying hens and eggshell quality. Czech Journal of Animal
Science, 53:162–168
Lopez-bote, C. J., Arias, R. S., Rey, A. I., Castano, A., Isabel, B. and Thos, J. (1998).
Effect of free range feeding on omega-3 fatty acid and alpha- tocopherol content
and oxidative stability of eggs. Animal Feed Science and Technology, 72:33-40
Mabe I., Rapp C., Bain Mm. and Nys Y. (2003). Supplementation of a corn-soybean
meal diet with manganese, copper, and zinc from organic or inorganic sources
improves eggshell quality in aged laying hens. Poultry Science, 82:1903-1913
203
Majekodunmi, B. C. (2014). Mitigation of heat stress in broiler chickens using ascorbic
acid and electrolytes. Ph.D Thesis, Department of Animal Science Ibadan,
Ibadan, Nigeria: 185
Marion, J. E. and Edward Jr., H. M. (1962). The influence of various oils in diet on lipid
metabolism of fat deficient laying hens. Poultry Science, 41:1662
Marks, H. l. and Pesti, G. M. (1984). The role of protein level and diet forms in water
consumption and abdominal fat depot deposition of broilers. Poultry Science,
63:1617-1625
Marks, J. (1979). A guide to the vitamins: Their Roles in Health and Diseases. MTF,
Medical and Tech. Publishing and Limited, England
Marnett, L. J. (1999). Lipid peroxidation-DNA damage by malondialdehyde, Mutation
Research, 8424(1-2):83–95
Martins, A., Dunnington, E. A., Gross, W. B., Briles, W. E., Briles, R. W. and Siegel, P.
B. (1990). Production traits and alloantigen systems in line of chickens selected
for high or low antibody responses to sheep erythrocytes. Poultry Science,
69:871-878
Mas, A. and Arola, L. (1985). Cadmium and lead toxicity effects on zinc, copper, nickel
and iron distribution in the developing chick embryo. Comparative Biochemistry
and Physiology, 80C: 185-188
Mashaghi, S., Jadidi, T., Koenderink, G. and Mashaghi, A. (2013). Lipid
Nanotechnology. International Journal of Molecular Science, 13 (14): 4242–
4282
Maynard, L. A., Loosli, J. K., Hintz, H. F. and Warner, R. G. (1979).Animal lipid in
human nutrition. Tata McGraw-Hill Publishing Co. Ltd., 132.
McDonald, S. (1996). The complete blood count. URL http://www.oldworld
avaries.com
McDowell L. R. (2000). Vitamins in animal and human nutrition Second Edition. Iowa
State University Press, ISBN 0-8138-2630-6, 395
McDowell, L. R. (1989). Vitamin B 12. In:McDowell LR Vitamins in animal nutrition.
San Diego, Academic Press, 323-346
McDowell, L. R. (2005). Vitamins in animal nutrition In: McDowell, L.R. (Ed.)
Comparative aspects to human nutrition, Introduction and historical
considerations.London. Academic Press, 3-12
204
McGee, H. (2004) .McGee on Food and Cooking: Eggs, Hodder and Stoughton,
20, ISBN 0-340-83149-9
Meluzzi, A., Tallarico, N., Manfreda, G., Sirri, F. and Franchini, A. (2000). Effect of
dietary vitamin E on the quality of table eggs enriched With N-3 Long Chain
Fatty Acids. Journal of Poultry Science, 79:539-545
Mertens, K., Bamelis, F., Kemps, B., Kamers, B., Verhoelst, E., De Ketelaere, B., Bain,
M., Decuypere, E. and De Baerdemaeker, J. (2006). Monitoring of eggshell
breakage and eggshell strength in different production of chains of consumption
eggs. Poultry Science, 85: 1670-1677
Miles, R. D. (2001). Trace minerals and avian embryo development. Ciência Animal
Brasileira, 2:1-10
Milinsk, M. C. (2003). Fatty acid profile of egg yolk lipids from hens fed diets rich in n-
3 fatty acids. Food Chemistry, 83(2):287-292
Miller, E. R. (1995). Potassium bioavailability In:C. B. Ammernan, D. H. Baker, and A.
J. Lewis (eds.). Bioavailability of Nutrients for Animals, Academic Press San
Diego California US, 295-301
Minelli, G., Sirri, F., Folegatti, E., Meluzzi, A. and Franchini, A. (2007). Egg quality
traits of laying hens reared in organic and conventional systems. Italian Journal
of Animal Science, 6(1):728–730
Mmereole, F. U. C and Omeje, S. I. (2005). Genotypexseasion interaction effect on the
laying mortality rates of the Nigerian local chicken, the Barred Plymouth Rock
and the crosess. Proc. 1st Nigerian International Poultry Summit, Feb 20-25,
2005, Ota Ogun State Nigeria 28-31
Mohammed, A., Al-Harthi, S., Ahmed, A. and El-Deek, W. (2013). Effect of different
dietary concentrations of brown marine algae (Sargasum dentifebium) prepared
by different methods on plasma and yolk lipid profiles, yolk total carotene and
lutein plus zeaxanthin of laying hens. Italian Journal of Animal Science,
11(4):234-239
Mohan, B., Kadirvel,R., Bhaskaran, M. and Notarajan, A. (1991). Effect of probiotic
supplementation on serum/yolk cholesterol and on egg shell thickness in layers.
British Poultry Science, 36: 799-803
Mohiti-Asli, M., Shariatmadari, F., Lotfollahian, H. and Mazuji, M. T. (2008). Effect of
supplementing layer hen diets with selenium and vitamin E on egg quality, lipid
205
oxidation and fatty acid composition during storage. Candian Journal of Animal
Science, 88(44):475-483
Mone, P. E., Warner, W. D., Poling C. E. and Rice, E. E. (1959). Influence of dietary fat
and protein on serum cholesterol of cholesterol fed chicks. Journal of American
Oil Chemistry Society, 36:141-142
Monria, K. N., Salahuddin, M. and Miah, G. (2003). Effect of breed and holding period
on egg quality characteristics of chicken. International Journal of Poultry
Science, 2:261-263
Morgin, P. (1981). Recent advances in dietary anion-cation balance: Application in
poultry. Proceedings Nutrition Society, 40:285-294
Mori, A. V., Mendonca Junior., C. X. and Almeida, C. R. M. (2003). Supplementing
hen diets with Vitamins A and E affects egg yolk retinol and á-tocopherol levels.
Journal of Applied Poultry Research, 12:106-114
Morris, T. R. (1968). The effect of dietary energy level on the voluntary caloric intake
of laying birds. British Poultry Science, 9: 285-295
Morris, T. R. (1985). The manipulation of egg size and egg quality. African Journal of
Animal Science, 15:120–122
Morris, T. R. (2004). Nutrition of chicks and layers. World’s Poultry Science Journal,
60(1): 5-18
Morrissey P.A., Brandon, S., Buckley, D., Sheehy, P. and Frigg, M. (1997). Tissue
content of α-tocopherol and oxidative stability of broilers receiving dietary α-
tocopherol acetate supplement for various periods post-slaughter. British Poultry
Science, 38: 84–88
Murakami, A. E., Saleh, E. A., England, J. A., Dickey, D. A., Watkins, S. E. and
Waldroup, P. N. (1997). Effect of level and source of sodium on performance of
male broiler to 56 days. Journal of Applied Poultry Research, 6:123-136
Nam, K. (1997). Influence of dietary supplementation with linseed and vitamin E on
fatty acids, a-tocopherol and lipid peroxidation in muscles of broiler chicks.
Animal Feed Science and Technology, 66(114): 149-158
Nascimento, V. P., Cranstoun, S. and Solomon, S. E. (2014). Relationship between shell
structure and movement of Salmonella enteritidis across the eggshell wall.
British Poultry Science, 33: 37-48
206
Natalie, G. (2009). Factors affecting egg quality in the commercial laying hen: A review
of Egg Producers Federation of New Zealand (Inc)/Poultry Industry Association
of New Zealand 96 D Carlton Gore Road, Newmarket, 1023, Auckland
National Research Council (NRC) (1994). Nutrient requirements of poultry, 9th
revised
ed., National Academie Press, Washington, DC 155
Neijat M., House, J. D., Guenter, W. and Kebreab, E. (2011). Calcium and phosphorus
dynamics in commercial laying hens housed in conventional or enriched cage
systems. Poultry Science, 90 (10):2383-2396
Neospark, J. (2012).Eggshell deffects and dietary essentials. Downloaded from the
internet on 1/07/2012
Nicol, C. J. (1986). Non-exclusive spatial preference in the laying hens. Applied Animal
Behaviour Science, 15 (3):33-50
Njoya, J. and Picard, M. (1994). Climatic adaptation of laying hens. Tropical Animal
Health Production, 26: 180-186
Nworgu, F. C. (2006). Prospects and Pitfalls of Agricultural Production in Nigerian.
Blessed Publication, Ibadan, Nigeria, 79-96
Nys, Y. (1995). Influence of nutritional factors on eggshell quality at high
environmental temperature. Proceedings VI European Symposium on the
Quality of Eggs and Egg Products, Zaragoza, Spain, 209-220
Nys, Y., Gautron, J., Garcia-Ruiz, J. M. and Hincke, M. T. (2004). Avian eggshell
mineralization: biochemical and functional characterization of matrix
proteins.Comptes Rendus Palevol, 3: 549–62
Nys, Y., Hincke, M., Arias, J. L., Garcia-Ruiz, J. M. and Solomon, S. E. (1999).Avian
eggshell mineralization. Poultry Avian Biology Review, 10: 142-166
Nys, Y., Mayel-Afashar, S., Bouillon, R., Van-Baelen, H. and Lawson, D. E. M. (1989).
Increases in calbindin D28K mRNA in the uterus of the domestic fowls induced
by sexual maturity and shell formation. General Comparative Endocrinology,
76: 322-329
Nys, Y., Parkers, C. O. and Thomasset, M. (1986). Effect of suppression and
resumption of shell formation and parathyroid hormone on uterine calcium
binding protein, carbonic anhydrase activity and intestinal calcium absorption in
hens. General Comparative Endocrinology, 64: 293-299
207
Obadasi, A. Z., Miles, R. D., Balaban, M. O. and Portier, K. M. (2007). Changes in
Brown Eggshell Color as the Hen Ages. Poultry Science, 86: 356-363
Obanu, Z. A. and Mpieri, A. A. (1984). Efficiency of dietary vegetable oils in
preserving the quality of shell eggs under ambient tropical conditions. Journal
Science Food and Agriculture, 35:1311–7
Obidi, J. A., Onyeanusi, B. I., Relwot, P. L., Ayo, J. O. and Dzenda, T. (2008). Seasonal
variation in seminal characteristics of Shikabrown breeder cocks. International
Journal of Poultry Science, 7(2):1219-1223
Oduguwa, O. O. (1991). Protein utilization by broiler hickens fed on three commerciaql
premixes at the starter aqnd finisher phase. Ph.D. Thesis in the Department of
Animal Scoence, University of Ibadan, Ibadan Nigeria
Oduguwa, O. O. and Ogunmodede, B. K. (1995). Growth and protein utilization by
broiler chicks fed three commercial micronutrients mixture. International
Journal of Animal Science, 10: 170-175
Oduguwa, O. O., Oduguwa, B. O. Fanimo, A. O. and Dipeolu, M. A. (2000). Potency of
two proprietary micronutrients premixes for broiler chicken at marginally
deficient protein content. Archiva Zootechnical, 49: 433- 444
Oduguwa, O. O., Ogunmodede, B. K. and Fanimo, A. O. (1996). Comparative efficacy
of three commercial micronutrients premixes for rearing broilers at two
physiological phases. Pertankan Journal of Tropical Agriculture, 19:81-86
Ogunmodede, B. K. (1974). Dietary zinc and protein utilization by growing chickens.
Nigerian Journal of Animal Producvtion, 1:198-203
Ogunmodede, B. K. (1975). Comparative effects of copper and Terramycin on
performance of broiler chicks and growers. Nigerian Journal of Animal
Production, 2(2):199-203
Ogunmodede, B. K. (1977). Riboflavimn requirements of starting chickens in a tropical
environment. Poultry Science, 56:231-234
Ogunmodede, B. K. (1978). Biotin requirement of broiler chicks fed maize-groundnut
cake or guinea corn-groundnut cake ration. African Journal of Agricultural
Science, v:47-53
Ogunmodede, B. K. (1981a).Vitamin A requirement of broiler chicks in Nigeria. Poult.
Sci., 60:116-121
208
Ogunmodede, B. K. (1982). Folic acid requirement of broiler chicks in a humid tropical
environment. Nigerian Journal of Nutritional Science, 3 (1):31-39
Ogunmodede, B. K. (1991). Vitamin nutrition by poultry in warm climates. Paper
presented at a conference organized by Roche Nigeria Limited, 6th
March
Ogunmodede, B. K.(1981b). The supplementation of groundnut based broiler chick
rations with ptridoxine. British Poultry Science, 32(3):153-164
Oguntunji, A. O. and 0Alabi, O. M. (2010). Influence of high environmental
temperature on egg production and shell quality – A review. World’s Poultry
Science Journal, 66:739-750
Ogunwole A. O., Kolade, E. O. and Taiwo, B. A. (2012). Performance and Carcass
Characteristics of Broilers Fed Five Different Commercial Vitamin-Mineral
Premixes in Ibadan.Nigeria International Journal of Poultry Science, 11 (2):
120-124, 2012ISSN: 1682-8356
Ogunwole, O. A. (2009). Implications of nutritional additives in the diets of commercial
growing and laying chickens.Science and Technology In: Panoy Link 3rd
Ed., A
publication of the Poultry Association of Nigeria (PAN), Oyo State chapter
Ogunwole, O. A., Ojelade, A. Y. P., Oyewo, M. O. and Essien, E.A. (2015a). Proximate
composition and physical characteristics of eggs from laying chickens fed
different proprietary vitamin-mineral premix under two rearing systems during
storage. International Journal of Food Science and Nutrition Engineering, 5 (1):
59-67. DOI: 10.5923/j. food. 20150501.08.
Ogunwole, O. A., Oso, Y. A. A., Omotoso, R. R., Majekdunmi, B. C., Ayinde, B. O.
and Oikei, I. (2013). Performance, carcass characteristics and meat physic-
chemical properties of broiler chickens fed graded levels of supplemented
ascorbic acid. Agriculture and Biology Journal of North America, 4 (4): 485-49
Ogunwole, O.A., Ojelade A.Y.P., Essien, E.A., Oyewo, M.O. (2015b). Lipid profile of
eggs from laying chickens fed five proprietary vitamin-mineral premixes under
two rearing systems as influenced by duration of storage. Food and Public
Health, 5(1):10-16. doi: 10.5923/j.fph.20150501.02.
Ojedapo, L.O. (2013). Effect of two housing systems (Cages vs Deep Litters) on
external and internal egg characteristics of commercial laying birds reared in
derived savanna zone of Nigeria. Transnational Journal of Science and
Technology, 3(7):25-34
209
Okeudo, N., Onwuchekwa, C. and Okoli, I. (2003). Effect of oil ttreatment and length of
storage on the internal quality, organoleptic attributes and microbial profile of
chicken eggs. Tropical Animal and Production, 6:63-70
Okeudo, Ndukwe James., Ezetoha Uchechi., Akomas Chinenye and Akanno, Everistus
Chima (2005). Egg quality of Gallus domesticus under domestic storage in
Nigeria. Animal Research International, 2(2):319 – 321
Okoli C. G, Okorondu, U. V. and Opera, M. N. (2006). Environmental and public health
issues of animal food product delivery system in Imo state Nigeria.
Online/Journal of Health Allied Science, 5(2):1-11
Okoli I. C. and Abi Udedibe (2003). Effect of oil treatment and storage on egg quality.
Journal of Agricultural Rural Develop, 1:55-56
Olomu, J. M. (2011). Monogastric Animal Nutrition: Principles and Practices (2nd
Ed.,).
St. Jackson Publishing, Benin City, Nigeria
Optimun Vitamin Nutrition (O.V.N.) (2010). Improving the nutritive value of eggs by
feeding laying hens.An Optimum Vitamin Nutrition (OVN™)
Oviedo-Rondón, E. O., Murakami, A. E., Furlan, A. C., Moreira, I. and Macari, M.
(2001). Sodium and chloride requirement of young broiler chickens fed corn-
soyabean diets (one to twenty-one day of age). Poultry Science, 80:592-598
Pan, S. (2005). Processing of gluten based bioplastics. Biochemistry and Engineering
Journal, 26
Panda, P. C. (1996). Shape and Texture: In a Textbook on egg and poultry technology,
57
Pandey, N. K., Mahapatra, C. M., Verma, S. S. and Johari, D. C. (1986). Effect of strain
on physical egg quality characteristics in White Leghorn chickens. International
Journal of Poultry Science, 21:304–307.
Park, S. Y., Kim, W. K., Birkhold, S. G., Kubena, L.E., Nisbet, D. J. and Ricke, S. C.
(2004). Induced moulting issues and alternative dietary strategies for egg
industry in the United State. World’s Poultry Science Journal, 60 (2):196-209
Parkinson T. L (1966). Solid contents of eggs. Poultry Science, 45:221-226.
Parmentier, H. K., Neuwland, M. G., Rijke, E., De Vries Reilingh, G. and Scrama, J. W.
(1996). Divergent antibody responses to vaccine and divergent body weight of
chicken lines selected for high and low humoral responsiveness to sheep red
blood cells. Avian Disease, 40:634-644.
210
Pasquoal Carrazzoni de Menezes1, Evilda Rodrigues de Lima1, Juliana Pinto de
Medeiros, Wanessa Noadya Ketruy de Oliveira1, Joaquim Evêncio-Neto (2012).
Egg quality of laying hens in different conditions of storage, ages and housing
densities. Revista Brasileira de Zootecnia, 41(9): 2064-2069
Pavlovski, Z., Hopic, S. and Lukic, M. (2001). Housing systems for layers and egg
quality. Biotechnology in Animal Husbandry, 17:197-201
Pavlovski, Z., Masic, B. and Apostolov, N. (1981). Quality of eggs laid by hens kept on
free range and in cages. In: proceedings of first European Symposium by World
Poultry Science Association, 231-235
Pavlovski, Z., Škrbić, M., Lukić1, D., Vitorović, S. and Lilić, V. P. (2012). Shell
quality–everlasting problem in Today Poultry Science. Biotechnology in Animal
Husbandry, 28 (3):393-404
Pistikova, V., Hovorka, M., Vecerel, V., Strakova, E. and Suchy, P. (2006). The quality
comparison of eggs laid by laying hens kept in battery cage and in a deep litter
system. Czech. Journal of Animal Science, 51:318-325
Ponnampalam, E. N. (2011). Differential effects of natural palm oil, chemically–and
enzymatically–modified palm oil on weight gain, blood lipid metabolites and fat
deposition in a pediatric pig model. Nutrition Journal, 10(1):1-7
Popova-Ralcheva, S., Snedkova, V., Valchev, G. and Bozakova, N. (2009). The effect
of the age and genotypte on morphological egg quality of parent stock hens.
Archiva Zootechinoa, 12:24-30
Potts, P. L., Wasburn, K. W. and Hale, K. K. (1974). Shell evaluation of white and
brown egg strains by deformation, breaking strength, shell thinckness and
specific gravity 2 Stepwise regression analyses of egg characteristics on methods
of assessing shell strength. Poultry Science, 53:2167- 2174
Price, E. O. (1984). Behavioural aspects of animal domestication. The Quaterly Review
of Biology, 59 (1): 1-32
Pryor, W. (1991). The antioxidant nutrients and disease prevention. American Journal
of Clinical Nutrition, 53: 391–393
Puthpongsiriporn, U., Scheideler, S. E., Sell, J. L. and Beck, M. M. (2001). Effect of
vitamin E and C supplementation on performance in vitro lymphocytes
proliferation and antioxant statu of laying hens during heat stress. Poultry
Science, 80:1190-1200
211
Qi, G. and Sim, J. (1998). Natural tocopherol enrichment and its effect in n-3 fatty acid
modified chicken eggs. Journal of Agriculture and Food Chemistry, 46:1920-
1926
Quirino, B. J., de Sousa, F. G., Perazzo, C. R., Queiroga, R. E., Walter, E. and Luveia
de Souza (2009). Effect of different metabolizable energy and soybean oil levels
in the diet of laying hens on the egg chemical composition and lipid profile.
Research Brasil Zootechology, 38(4):685-689
Qureshi, M. A. and Havenstein, G. B. (1994). A comparison of the immune
performance of a 1991 commercial broiler with a 1957 randombred strain when
fed „„typical‟‟ 1957 and 1991 broiler diets. Poultry Science, 73:1805-1812
Raji, A. O., Aliyu, J., Igwebuike, J. U. and Chiroma, S. (2009). Effect of storage
methods and time on egg quality traits of laying hens in a hot dry climate. ARPN
Journal of Agricultural Biology Science, 4 (4):1-7
Raven, P. and Walker, G. (1980). Food and Agricultural Organization of United Nation.
Reitman, S. and S Frankel. American Journal of Clinical Pathology, 1957:28-56
Reid, J., Watson, R. D., Cochran, J. B. and Sprows, D. H. (1951). Sodium ƴ-Resorcylate
in Rheumatic fever. British Medical Journal, 321-326 (PMCID: PMC2069708)
Repetto, M., Ossani, G., Monserrat, A. and Boveris, A. (2010). Oxidative damage: The
Review of Biochemistry, 72(13):774-778
Rizzi, L., Simioli, G., Martelli, G., Paganelli, R. and Sardi, L. (2006). Effects of organic
farming on egg quality and welfare of laying hens. Proceeding of European
Poultry Conference, Verona, Italy
Roberts, Juliet R. (2004). Factors affecting egg internal quality and egg shell quality in
laying hens. Journal of Poultry Science, 41:161-177
Roland, D. A. (2000). Nutrition and feeding for optimum egg shell quality. XXI
World‟s Poultry Congress, Montreal, Canada (CD Proceedings)
Rolon, A., Burhr, R. J. and Cunningham, D. L. (1993). Twenty-four-hour feed
withdrawal and limited feeding as alternative methods for induction of moult in
laying hens. Poultry Science, 72: 776-785
Roque, L. and Soares, M. C. (1994). Effects of eggshell quality and broiler breeder age
on hatchability. Poultry Science, 73:1838-1845
212
Rose, Christmas, Ross, A. Harms, R. H. and Sloan, D. R. (1997). The absence of
vitamins and trace minerals and broiler performance. Journal of Applied Poultry
Research, 4: 407-410
Rossi, M. (2007). Influence of the laying hen housing systems on table egg
characteristics. Proc. XVIII European Symp on the Quality of Poultry Meat and
XII Eur. Prague, Czech Republic, 49-51
Roura, E., Homedes, J. and Klasing, K. C. (1992). Prevention of immunologic stress
contributes to the growth-permitting ability of dietary antibiotics in chicks.
Journal of Nutrition, 122:2383-2390
Ruxton, C., Reed, S., Simpson, M. and Millington, K. J. (2007). The health benefits of
omega-3 polyunsaturated fatty acids: A review of the evidence. Journal of
Human Nutrition Diet, 20:275–285
Safaa H. M., Serrano M. P., Valencia D. G., Frikha M., Jiménez-Moreno, E., Mateos
G.G. (2008). Productive Performance and Egg Quality of Brown Egg-Laying
Hens in the Late Phase of Production as Influenced by Level and Source of
Calcium in the Diet. Poultry Science, 87:2043-2051
Sahin, K. and Küçük, O. (2001). Effects of vitamin C and vitamin E on performance,
digestion of nutrients, and carcass characteristics of Japanese quails reared under
chronic heat stress (34°C). Journal of Animal Physiology and Animal Nutrition,
85, 335–342
Samli, H. E., Agma, A. and Senkoylu, N. (2005). Effect of storage time and temperature
on egg quality in old laying hens. Journal of Applied Poultry Research, 14: 548-
553
Santos, C. O. (1998). Efeito da adicao de oleos poliinsaturados a racao nos niveis de
lipidios plasmaticos e de colesterol no ovo de galinhas poedeiras [dissertacao],
Sao Paulo (SP): Universidade de Sao Paulo
SAS Institute Inc. (2012). SAS STAT User‟s Guide Release 6.08, SAS Institute Inc.,
Cary, NC
Savory, C. J., Wood-Gush, D. G. M. and Duncan, I. J. H. (1978). Feeding behaviour in
apopulation of domestic fowls in the wild. Apllied Animal Ethology, 4:13-27
Scatolini A. M. (2007). Mn, Zn e Se associados a moléculas orgânicas na alimentação
de galinhas poedeiras no segundo ciclo de produção [dissertation]. Jaboticabal
(SP): Universidade Estadual Paulista
213
Scientific Panel on Animal Health and Welfares (2005). Opinion of the Scientific Panel
on Animal Health and Welfares as a request from Commission related to the
welfare aspect of various system of keeping laying hens. The EFSA Journal
197:1.23. www.efsa.europa.eu/EFSA/Scientific_Opinion/lh_opinion1.pdf
Scott, M. L., Nesheim, M. C. and Young, R. J. (1982). Nutrition of the chicken 3rd
Ed.
M.L Scott and Associates, Ithaca, NY, USA, 119
Scott, T. A. and F. G. Silversides (2000). The effect of storage and strain of hen on egg
quality. Poultry Science, 79:1725-1729.
SDC-ESSA (1970). Ecology and Animal Health. (Leif Norrgen and Jeffy M.
Levengood Eds.), Baltic University Press, Amazon
Sell, J. L., Arthur, J. A. and Williams, I. L., (1982). Adverse effects of dietary vanadium
contributed by dicalcium phosphate on egg albumin quality. Poultry Science, 61:
1541
Senkoylu N., Samli, H. E., Akyurek, H., Agma, A. and Yasar, S. (2005). Performance
and Egg Characteristics of Laying Hens Fed Diets Incorporated with Poultry By-
Product and Feather Meals. Journal of Applied Poultry Research, 14:542–547
Seven P. T. (2008). The Effects of Dietary Turkish Propolis and Vitamin C on
Performance, Digestibility, Egg Production and Egg Quality in Laying Hens
under Different Environmental Temperatures. Asian-Australian Journal of
Animal Science, 21:1164-1170
Shafey, T.M. and Cham, B. E. (1994). Altering fatty acid and cholesterol contents of
eggs for human comsuption. Washington: CAB International, 374-385
Shawkat, Md Ali (2002). Study on the effect of feed supplementation to laying hen
under the rural condition of Bangladesh (M.Sc Thesis), The Royal Veterinary
and Agricultural University, Dyrlægevej, 1870 Frederiksberg C., Denmark.
Short, F. J. (2001). Egg shell density in furnished cages: Effect of dustbath and perch
provision. British Poultry Science, 41 (suppl.1):77-78
Siegel, H. S., Henken, A. M., Verstegen, M. W. A. and Van Der Hel, W. (1982).Heat
production during the induction of an immune response to sheep red blood cells
in growing pullets.Poultry Science 61:2296-2300
Silversides, E. G. (1994). The Haugh unit correction for egg weight is not adequate for
comparing eggs from chickens of different lines and ages. Journal of Applied
Poultry Research, 3:120-126
214
Silversides, F. G. and Budgell, K. (2004). The relationship among measures of egg
albumen height, pH and whipping volume. Poultry Science, 83:1619-1623
Silversides, F. G. and Scott, T. A. (2001). Effect of storage and layer age on quality of
eggs from two lines of hens. Poultry Science, 80:1240-1245
Silversides, F. G., Korver, D. R. and Budgell, K. L. (2006). Effect of Strain of Layer
and Age at Photostimulation on Egg Production, Egg Quality, and Bone
Strength. Poultry Science, 85:1136-1144
Simčič, M., Stibilj, V. and Holcman, A. (2009). The cholesterol content of eggs
produced by the Slovenian autochthonous Styrian hen. Food Chemistry, 114, 1-
4.
Simopoulos, A. P. (2000). Human requirement for n-3 polyunsaturated fatty acids.
Journal of Poultry Science, 79:961-970
Singh, K. S. and Panda, B. (1988).Nutrition and quality of poultry products. Poultry
Nutrition, 159-161
Singh, R., Cheng, K. M. and Silversides, F. G. (2009). Production performance and egg
quality of four strains of laying hens kept in conventional cages and floor pens.
Poultry Science, 88:2 56–264
Sinha, P. and Giri, A. K. (1989). Consumption of Livestock Products-Analysis and
Comparison of Data of NSS 32nd and 38th
Round Livestock Economy of India.
Oxford and IBH Publishing Co. Pvt. Ltd., New Delhi
Skinner, J. T., Waldroup, A. L. and Waldroup, P. W. (1992). Effect of removal of
vitamin and mineral supplements from grower and finisher diets on live
performance and carcass composition of broilers. Journal of Appled Poultry
Research, 1:280-286
Škrtić, G., Kralik, Z., Gajčević, I., Bogut, D. and Hanžek, Z. (2007). The Increase of the
N-3 Pufa Content in Eggs. Danish Journal, 22(4):23–34
Smith, D. M. Jr., Milelke, H. W. and Heneghan, J. B. (2008). Sub-clinical lead feeding
studing in male rats, Archiva Environment al Contamination and Toxicology
55(3):518-528
Smith, J. A., Ackerman, A. S., Jensen, E. J. and Toon, O. B. (2006). Role of deep
convection in establishing the isotopic composition of water vapor in the
tropical transition layer. Geophys. Research Letter, 33, L06812,
doi:10.1029/2005GL024078.
215
Song K. T., Choil, S. C. and Oh, H. R. (2002). A comparison of egg quality of pheasant,
chukar, quail and guinea fowl. Asian-Australian Journal of Animal Science,
13(7): 986-990
Stadelman, W. J. (1977). Quality identification of shell eggs: In Egg Science and
Technology. 2nd
ed., W. J. Stadelman and D. J. Cotterill, eds. AVI Publishing
Company Inc., Westport, CT
Stadelman, W. J. (1995). Quality identification of shell eggs In: Egg Science and
Technology, 4th
rev. W. J. Stadelman and O. J. Cotterill eds. Food Products
Press, Binghamton New York, 39-66
Stadelman, W. J. and Coterill, O. J. (1995). Egg Science and Technology, 4th
rev. W. J.
Stadelman and O. J. Cotterill eds. Food Products Press, Binghamton New York,
39-66
Stamler, J., Pick, R. and Katz, L. N. (1958). Effect of dietary protein and carbohydrate
levels on cholesterolemia and athrogenesis in cockerels on a high-fat, high-
cholesterol mash. Circulation Research, 6: 447-451
Supić, B., Cmiljanić, R., Savić, S., Milošević, N., Kočiš, I. and Jakobčić, Z. (1997).
Uticaj vitamina C na proizvodnju i kvalitet ljuske jaja za konzum, I
Jugoslovenski medjunarodni kongres o stočarstvu. Biotehnologija u stočarstvu,
3(4):177-186
Surai, P. (2003). Natural antioxidants in avian nutrition and reproduction. Nottingham
University Press, England
Suttle N. F. and Jones, D. G. (1989). Recent developments in trace element metabolism
and function. Trace elements, disease resistance and immune responsiveness in
ruminant. Journal of Nutrition, 119:1055-1061
Tabidi M. H. (2011). Impact of storage period and quality on composition of Table egg.
Advance Environmental Biology, 5(5):856-861
Takahashi, K., Ohta, N. and Akiba, Y. (1997). Influence of dietary methionine and
cysteine on metabolic responses to immunological stress by Escherichia coli
lipopolysaccharide injection, and mitogenic response in broiler chickens. British
Journal of Nutrition, 78:815-821
Tanaka, T. and Hurnik, J. F. (1992). Comparison of behavior and performance of laying
hens housed in battery cages and an aviary. Poultry Science, 71:235–243
Tao, X. and Xin, H. (2003). Temperataure-humidity-velocity-indexfor market size
broiler. Proc. of the ASAE 46:491-497
216
Tappel, A. L. (1968). Will antioxidant nutrients slow aging processes? Geriatrics, 23
Tauson, R., Wahlström, A. and Abrahamsson, P. (1999). Effect of two floor housing
systems and cages on health, production, and fear response in layers. Journal of
Applied Poultry Research, 8, 152–159
Taylor, T. G. (1965). Dietary phosphorus and egg shell thick-ness in the domestic fowl.
British Poultry Science, 6:79-87
Tebesi T., Madibela, O. R and Moreki, J. C. (2012). Effect of storage time on internal
and external characteristics of Guinea fowl (Numida meleagris) eggs. Journal
Animal Science Advance, 2(6):534-542
Tharrington, J. B., Curtis, P. A., Jones, F. T. and Anderson, K. E. (1999). Comparison
of physical quality and composition of eggs from historic strains comb White
Leghorn chickens. Poultry Science, 78: 591-594
Thornton, P. A. (1962). The effect of environmemtal temperature and oxygen uptake by
the chicken. Poultry Science, 41:1053-1062
Tilki, M. and Inal, S. (2004). Quality traits of goose eggs, 1 Effect of goose age and
storage time of eggs. Archiva Gefl ügelk., 68:182-186
Toney, J. and Bergquist, D. H. (1983). Functional egg products for the cereal foods
industries. Cereal Foods World, 28, 445–447.
Toussant, M. J. and Latshaw, J. D. (1999). Ovomucin content and composition in
chicken eggs with different interior. Journal of Food Science and Agriculture,
(79):1666-1670
Tufft, L.S., Nockels, C. F. and Fettman, M. J. (1988). Effect of Escherichia coli
Escherichia coli on iron, copper, and zinc metabolism in chicks. Avian Disease,
32:779-786
Tyler, C. (1961). Shell strength: Its measurement and its relationship to other factors.
British Poultry Science, 2, 3-19.
U.S. Poultry and Egg Association (2012). Poultry Industry frequently asked questions.
Retrieved June 21 htt://www.uspoultry.org/economic_data
United States Department of Agriculture (USDA) (2000). United States standards,
grades, and weight classes for shell eggs. Agricultural Research Note, RN 23
12/99
217
Untied Egg Producer (2003). European Union Standards: Housing, space, feed and
water. 2003-09-03
Untied Egg Producer (2009). European Union Standards: Housing, space, feed and
water. Washington Post, 2003-09-03 Retrieved 2009-07-30
Usturoi M. G., Boişteanu, P. C., RaduRusu, R. M., Pop, I. M., Doliş, M. G. and Al.
Usturoi (2010). Influence of husbandry technologies with horizontal disposing
on the performances achieved by the Lohmann Brown hybrid. International
Conference on Animal Science and Veterinary Medicine, Tokyo-Japonia,
Academic Science Research, Cemal Ardil Editor-in-Chief, 88
Van den Bran, D., Parmentier, H. and Kemp, B. (2004). Effects of housing system
(outdoor vs cages) and age of laying hens on egg characteristics. British Poultry
Science, 45 (6):745-752
Van Niekerk (2014). Egg quality: Low Input Breeds Technical Note. Download at
www.lowinputbreeds.org
Van-Elswky, M. E., Hargis, B. M., Willians, J. D. and Hargis, P. S. (1994). Dietary
menhaden oil contributes to hepatic lipidosis in laying hens. Poultry Science,
73(5):653-662
Vansudevan, D. M., Sreekumari, S. and Kanna, Vaidyanathan (2011). Textbook of
Biochemistry for Medical Students (6th
ed.,) Jaypee Brothers Medical
Vargas, R. and Naber, E. (1984). Relationship between dietary fiber and nutrient density
and its effect on energy balance, egg yolk cholesterol and hen performance.
Journal of Nutrition, 114:645–652
Verma, S. V. S., Gowda, S. K. and Elangovan, A. V. (1998). Animal Feed Science and
Technology, 76(1-2):169-175
Vicenzi, E. (1996). Fadiga de gaiola e qualidade da casca do ovo. Aspectos nutricionais.
Anais do 6º Simpósio Técnico de Produção de Ovos, São Paulo, SP. Brasil, 77-
91
Victor G Stanley, Dacian Nelson and Milton B Daley (2013). Evaluation of Two Laying
Systems (Floor vs. Cage) on Egg Production. Quality, and Safety,
Agrotechnology, 2:1http://dx.doi.org/10.4172/2168-9881.1000109
Vidal, F. T., Ana, L., Virgínia, K. G., Abreu, E., Freitas, M. A., Sousa Neto, S. and
Jorge, F. (2013). Egg quality and yolk lipid composition of laying hens fed diets
containing cashew nut meal. Journal of Food Science and Technology
Campinas, 33(1): 172-179
218
Vitorović D., Pavlovski Z., Nikolovski J., Djurdjević Z., Todorović M. (1995). Kvalitet
ljuske i dalje aktuelan problem avremenog živinarstva. IV Medjunarodni
simpozijum "Novi pravci razvoja stočarstva", Beograd, Biotehnologija u
stočarstvu, 3(6):301-306
Vits, A., Weizenburger, D., Hamann, H. and Distl, O. (2005). Influence of different
small group systems on production traits, egg quality and bone breaking strength
of laying hens. First communication: Production traits and egg quality.
Zuchtungskunde, 77:303–323
Vogt, X., Dewar, W. A., Sauveur, B. and Simons, P.C.M. (1984). Mineral requirements
and recommendations for adult birds. World's Poultry Science Journal, 40:183
Vosláŕová, E., Hánzálek, Z., Većerek, V., Stráknsá, E. and Scchý, P. (2006).
Comparison between laying hens performance in the cage system and the deep
litter system on adiet free from animal protein. Acta Veterinaria Brno., 76:219-
225
Vulleumier, J. P. (1968). The Roche Yolk Colour Fan-An instrument for measuring
Yolk Colour. Poultry Science, 48:767-783
Waimaleongora-Ek, P., Garcia, K. M., No, H. K., Prinyawiwatkul, W. and Ingram, D.
R. (2009). Selected quality and shelf-life of eggs coated with mineral oil with
different viscosities. Journal of Food Science, 74:423–S429
Walker, A. W. and Hughes, B. O. (1998). Egg shell colour is affected by laying cage
design. British Poultry Science, 39(5):696-699
Wang, X. L., Zheng, J. X., Ning, Z. H., Qu, L. J., Xu, G. and Yang, N. (2009). Laying
performance and egg quality of blue-shelled layers as affected by different
housing systems. Journal of Food Science and Technology, 4 (2): 45-48.
Washbourn K. (1982). Incidence, cause and prevention of egg shell breakage in
commercial production. Poulttry Science, 61:2005-2012
Wheeler, R. S. and James Jr., E. C. (1950). The problem of wet poultry house litter: The
influence of total chicken. Poultry Science, 29:496-500
Whitehead C. C. (1996). Nutrition and bone disorders in poultry, Proceedings of XX
World‟s Poultry Congress. New Delhi II, 161-171
Whitehead, C. C. (1998). Vitamin interactions and requirements in poultry: In 7th
International Symposium on Animal Nutrition, Kaposvar, Hungary 3-31
219
Whitehead, C. C. and Fleming, R. H. (2000). Osteoporosis in cage layers. Poultry
Science, 79:1033-1041
William, K. C. (1992). Some factors affecting albumen quality with particular reference
to Haugh unit score. World’s Poultry Science Journal, 48:5-16
Wilson, H. R. (1991). Interrelationships of egg size, chick size, post hatching growth
and hatchability. World’s Poultry Science Journal, 47:5–20
Wong, Y. C., Herald, T. J. and Hachmeister, K. A. (1996). Evaluation of mechanical
and barrier properties of protein coatings on shell eggs. Poultry Science, 75:417–
22
Wuryastuti, H., Stowe, H. D., Bull, R. W. and Miller, E. R. (1993). Effect of vitamin E
and selenium on immune response peripheral blood, colostrum and milk
leukocytes of sows. Journal of Animal Science, 71: 2464
Yoruk M. A., Gul, M. and Hayirli, A. (2004). Laying performance and egg quality of
hens supplemented with sodium bicarbonate during late laying period.
International Journal of Poultry Science, 3:272-278
Yosefi, S., Braw-Tal, R. and Bar, A. (2003). Intestinal and eggshell calbindin and bone
ash of laying hens as influenced by age and moulting. Comparative
Biochemistry and Physiology, 136: 672-683
Zaghini A., Martelli G., Roncada P., Simioli M., Rizzi L., (2005).
Mannanoligosaccharides and aflatoxin B1 in feed for laying hens: effects on egg
quality, aflatoxin B1 and M1 residues in eggs, and aflatoxin B1 levels in liver.
Poultry Science, 84:825-32
Zamani, A., Bahmani, H. and Pourreza, J. (2005). Effect of different levels of
manganese and zinc supplement on the performance traits and egg quality of
laying hens. Pakistan. Journal of Biological Science, 8:1035-1040
Zdunczyk, Z., Gruzauskas, R., Semaskaite, A., Juskiewicz, J., Raceviciute-Stupeliene,
A. and Wroblewska, M. (2011). Fatty acid profile of breast muscle of broiler
chickens fed diets with different levels of selenium and vitamin E. Archiva
Geflügelk, 75:264-267
Zeidler, G. (2002). Shell Egg Quality and Preservation. In: Bell DD, Weaver WD,
editors. Commercial chicken meat and egg production 5th
ed., Norwell, Mass.:
Kluwer Academic Publishers, 1190–1217
220
Zemková, Ĺ., Simenová, J., Lichovníkoá, M. and Somerlíková, K. (2007). The effects
of housing systems and age of hens on the weight and cholesterol concentration
of the egg. Czech Journal of Animal Science, 52(4): 110-115
Zhang, M. H., Lin, W. Y., Klein, S. A., Bacmeister, J. T., Bony, S., Cederwall, R. T.,
Del Genio, A. D., Hack, J. J., Loeb, N. G., Lohmann, U., Minnis, P., Musat,
I., Pincus, R., Stier, P., Suarez, M. J., Webb, M. J., Wu, J. B., Xie, S. C., Yao,
M. S. and Zhang, J. H. (2005). Comparing clouds and their seasonal
variations in 10 atmospheric general circulation models with satellite
measurements. Journal of Geophysics Research, 110, D15S02,
doi:10.1029/2004JD005021.
Ziggers, G. W., Driessen, P. H. and Bloemer, J. M. (2011). Dynamics and Innovation in
Food Networks. Proceedings of the 5th
International European Forum,
Innsbruck-Igls, AustriaGriffin, H. D. and Butterwith, S. C. (1988). Effect of
eschericia coli endotoxin on tissue lipoprotein lipase activities in chickens.
British Poultry Science, 29:2, pages ...
2012-2017 www.latlong.net//place/ibadan-nigeria-178.html
Related Documents