1.1 INTRODUCTION Business decisions may be based upon “intuition” or upon an intelligent analysis of factual data. There is no formula for analysis. Much depends on the purpose of analysis, the nature of analysis and exclusiveness of significant conclusions. There are three basic steps in the analysis of business problem; 1. Breakdown the figure into classification so that one can compare the past of the whole to each other and 2. Compare with significant outside factors and thus determine their relationship 3. This permits one to determine the reason for relat5ionship thus making possible understanding of essential nature of the situation and findings of solution to the problems involved in the situation. From the above view point the researcher of this project makes an attempt in analyzing the capital structure planning by breaking down the figures into classifications to compare the parts of the whole to each other. This project taken up to strengthen the academic of the project Cost of Capital Analysis The impact of changes in the capital structure on the cost of capital analysis and the profitability is analyzed as capital structure decisions are not taken in isolation. They are largely influenced by their twin factors of minimizing the cost of capital and maximizing the returns. Thus the cost of capital is 1

Welcome message from author
This document is posted to help you gain knowledge. Please leave a comment to let me know what you think about it! Share it to your friends and learn new things together.
Transcript

1.1 INTRODUCTION
Business decisions may be based upon “intuition” or upon an intelligent analysis of
factual data. There is no formula for analysis. Much depends on the purpose of analysis, the
nature of analysis and exclusiveness of significant conclusions.
There are three basic steps in the analysis of business problem;
1. Breakdown the figure into classification so that one can compare the past of the whole to
each other and
2. Compare with significant outside factors and thus determine their relationship
3. This permits one to determine the reason for relat5ionship thus making possible
understanding of essential nature of the situation and findings of solution to the problems
involved in the situation.
From the above view point the researcher of this project makes an attempt in analyzing
the capital structure planning by breaking down the figures into classifications to compare the
parts of the whole to each other. This project taken up to strengthen the academic of the project
Cost of Capital Analysis
The impact of changes in the capital structure on the cost of capital analysis and the
profitability is analyzed as capital structure decisions are not taken in isolation. They are largely
influenced by their twin factors of minimizing the cost of capital and maximizing the returns.
Thus the cost of capital is the combination of various specific costs which are discussed below.
Cost of Equity
Equity capital like other sources of funds does not certainly involve a cost of the firm. It
may be recalled that the objectives of the financial management is to maximize the shareholders
wealth and maximization of market price of shares in the operational substitute for wealth
maximization. When equity shareholders invest their funds, they also except returns in the form
of dividends.
The market value of shares is a function of the returns that the shareholders except and
get. Thus in order to evaluate the capital structure of the firm it is necessary to know the cost of
capital of the company.
1

Cost of Debt
Cost of debt describes about the cost of raising finance from long term funds or
outsider’s fund. Thus an optimum amount of dent in the capital structure of the firm may reduce
its costs. However over utilization of debt may increase the interest payments of the company.
Debt of a firm is predominated figure in the capital structure and so there lays the
essentiality to calculate the cost of debt to derive at optimum capital structure.
Weighted Average Cost of Capital
Weighted average cost of capital is the composition of specific cost of capital lays cost
of equity and cost of debt. The overall cost of capital helps the company to analyze the overall
efficiency of the company. It describes the overall cost of capital of the company. Thus it is a
technique to measure the capital structure of the company.
Capital Structure
Given the objectives of the firm to maximize the value of its equity shares, the firm
should select the best mix of the equity and debt capital structure refers to the composition of
long term sources of funds such as debentures, long term debt, preference share capital and
equity including reserves and surplus. Optimum or balanced capital structure means an ideal
combination of borrowed and owned capital that may attain the marginal goal (i.e.) maximizing
the value of shareholders.
The choice of amount of debt and equity is made after comparison of certain
characteristics of each kind of security of internal factors related to the firms operations and
external factors that affect the firm. Thus the capital structure of the company may be a
combination of debt and equity leads to the maximum value of the firm.
Objective of Capital Structure
In context of the optimum capital structure, the firm may be faced with the problem of
mixing the equity securities and debt securities.
1. Payment of high interest.
2. Higher control of equity shareholders.
Thus optimum capital structure is decided on the basis of two danger points.
2

Tools and Techniques of Capital Structure
Companies do not plan their capital structure may prospect in short run but ultimately
they will face series problem in f\raising funds to meet their additional financial requirements in
future.
Whenever the financial manager considers the question of capital structure, it is always
the question of capital structure (i.e.) to decide the proportion of ownership funds and borrowed
funds. So the study was made to analyze the capital structure of the company using various
tools.
Ratio Analysis
One approach to analyze the capital structure of the firm is to make the comparison of
the ratios of the firm. Comparison is helpful as it is acts as a red signal to the management that
there may be something wrong with the capital structure of the company.
Ratio shows the significant relationship between figures shown in the Balance Sheet, in
Profit and Loss account or in any other part of accounting organization. Ratios are the best guide
for execution of basic managerial function like planning, forecasting and controlling.
3

1.2 INDUSTRY PROFILE
Milk is considered as a complete and ideal food and it contains most of the proximate
principles of a well balanced diet. India is the world’s largest milk producer and in set to
become the world’s largest food factory. Indian dairy industry embarked on recent innovation
technology by having a wide ranging impact on the growth of the industry.
This revolution is contributing to the productive utilization of growing milk surplus. It’s
important for healthy, active people to eat right. A glass of Milma milk three times a day gives
you more vitamin sand minerals than any other popular health drink and ensures that you get
sufficient proteins to help in providing the building blocks that constructs and repairs muscle.
Milma milk also helps to meet your calcium requirement. Dairy products are the richest source
of important nutrients like vitamin D which helps to use calcium effectively.
Calcium Counts for Young and Old
Calcium is one of the most important nutrients in Milma’s pasteurized milk. Calcium,
one of the most abundant minerals in the human body, is frequently found lacking in the daily
diet. Calcium is important not only for building and maintain strong bones but also for
regulating the heart beat and proper functioning of the nerves. With calcium playing such a
clerical role in maintain your health, you cannot afford a deficiency. Milma’s low far or fat free
milk give the same amount of calcium and other nutrients, minus fat. Pregnant women need
calcium for the growth of the baby.
The Fresh and Glowing Fresher
A well-nourished boy is more component to meet the mental and physical demands of
college life. Skipped meals and unhealthy eating habits can short change essential nutrients of
our body. Healthy eating not only made us look and feel good, but also make our body and for
the future.
Increasing our daily milk consumption will not help us on the calcium front, but also
help balance our diet and keep it nutrients rich. Consumption of three glass of Milma milk
everyday for the strong bones, good looks and a sharp mind.
4

The Power Drink for Teenagers
Milk is a vital drink throughout life and more so when it needs the teenagers in growing.
The 15% of the human grows during the teenage period. So that calcium is very much needed in
teenage for the growth. The essential growth nutrients like protein, potassium and calcium is
essential for all humans for their growth. Milma milk is the power drink for active young boys
and girls.
Kerala Co-Operative Milk Marketing Federation (KCMMF), popularly called Milma
was established in April, 1980 with its head office at Thiruvananthapuram for the successful
implementation of Operation Flood (a dairy programme launched in 1970 under the aegis of
National Dairy Development Board (NDDB).
TRCMPU
TRCMPU is carrying out various input activities in its milk shed and a details of the activities
carried out by the Regional Union in the Financial year 2011-2012 are given below.
Union has distributed Rs. 4.00 crores as price incentive to the societies and Rs. 3.5 crores as
summer incentive to the farmers.
In the financial year total numbers of 465 first aid centers are functioning in four districts and
29336 numbers of cases were attended.
Total number of de-centralized vetenary units are 30 and 29681 cases had been attended.
Total number of production enhancement camp (Gosamvardhini) conducted is 244 and total
number of cases attended is 12013.
50% subsidy on cattle insurance premium.
Total; A.I centers functioning under union is 26 and the total number of A.I performed is
9211.
Under100P scheme, 65 hectors of land was cultivated under fodder development programme
in Pathanamthitta District.
Under 100P-CMP Programme, various projects are implemented with the financial assistance
to the tune of Rs. 10.06 crores from the Govt. of Indi. 52 bulk coolers were installed with a total
capacity of 19600 liters.
5

Schemes for Milk Production Enhancement
Rs, 137.68 lakhs were spending for calf adoption scheme.
Insurance subsidy for new mini Dairy units was given for an amount of Rs. 3.15lakhs.
Cattle feed subsidy for a new mini dairy units was given for Rs. 37.39 lakhs.
Rs. 3.22 lakhs was spending for fodder cultivation schemes.
Rs.2.57 lakhs was spending for de-warming.
Under Benevolent fund scheme financial assistance to depend of deceased farmers and
scholarship for higher education are given Rs.25.64 lakhs spend during 2011-2012.
De-centralized vetenary units for providing vetenary service at doorstep of farmers and free
medicine Rs.51.14 lakhs during 2011-2012.
Future Plan
Maximization of women participation in Dairy sector.
10% growth rate in income through Dairying for the farmers.
Reaping on corporative identity through mnemonic symbol.
Enhance processing capacity.
Plan to launch new products.
Introducing of new brands.
Export of products.
Plans to custom pack products such as cheese, tera fino and fruit drinks.
Building of brand equity.
Restructuring of district system.
Benchmarking performance to international Quality Standards.
Introducing of bulk milk coolers at society for improvement of bacterial quality.
Quality awareness training.
1.3 COMPANY PROFILE
6

Brief Introduction of Milma
Kerala Co-Operative Milk Marketing Federation (KCMMF) popularly called Milma was
established in April 1980 with its head office Thiruvananthapuram for the successful
implementation of Operation Flood (a dairy development programme launched in 1970 under
the aegis of National Dairy Development Board (NDDB)).
The name Milma represents;
2100 primary milk co-operative societies.
5.24 lakhs farmer member.
Three Regional Cooperative milk producers union.
Eleven diaries.
Fourteen milk chilling centers.
Two cattle fed plant 10 MT per day capacity of 500 MT per day.
One milk powder plant 10MT per day capacity.
A well established training centre.
More than 4000 retail outlets.
Over 18000 people working either directly or indirectly for the functioning of Milma.
Apart from these, Milma servers millions of consumer’s day in and day out.
Mission
To channelize marketable surplus milk from rural areas to urban deficit areas to maximize the
returns to the producer and provide quality milk products to consumers.
To carryout activities for promoting production procurement processing and marketing of
milk and milk products for economic development of farming community.
To build a viable dairy in the state.
To provide a constant market and stable price to the farmers for the products.
The motto of co-operation “of the people, by the people and for the people” in the
foundation of the three tier system followed by the organization. At the village level Milma have
village milk co-operative societies- the local milk producers as its members. These village co-
operative units at the regional level and from co-operative milk producers unions. These unions
are federated at the level a form- State federation namely Kerala Co-operative Milk Marketing
Federation.
7

Milma- the Farmer’s Organization
Milma is an organization for the farmers. Farmers are the producer of the raw materials
that the milk. The shareholders in the organization and the chairman and the Board of Directors
are elected among them.
The farmers are the members of the Anand pattern co-operative societies (APCOS). The
President of the APCOS forms the general body of the Regional milk unions which federated to
form KCMMF
Milma’s Associates
Chief associates are;
National Dairy Development Board (NDDB)
NDDB under Dr. Varghese Kurian’s guidance set up KCMMF at 1980. Ever since then
there has been a close co-operation between NDDB and Federation.
Amul
The dairy co-operative of Gujarat has been the inspiration for the development of the
vast network of co-operative in Kerala.
Government of Kerala
The phenomenal success of the Dairy co-operative in Kerala could not have been
achieved without foundation of animal husbandry activities, led by the Animal Husbandry
Department, Kerala.
MILMA have 3 Regional Co-operative Unions;
1. Thiruvananthapuram Regional Co-operative Milk Producers Union Ltd.
2. Ernakulam Regional Co-operative Milk Producers Union Ltd.
3. Malabar Regional Co-operative Milk Producers Union Ltd.
Thiruvanthapuram Regional Co-operative Milk Producers Union Ltd (TRCMPU) is one
of the Regional Co-operative Milk Producers Union in Kerala state, and is the oldest one among
the three. The TRMPU includes the four southern district of Kerala.
a) Thiruvanthapuram
8

b) Kollam
c) Alleppy
d) Pathanamthitta
2678 primary milk co-operative societies now functioning as on31.03.2013.
8.31 lakhs farmer members.
Three regional co-operative milk producers union.
Thirteen diaries capable of handling 12 lakhs liters of milk per day.
Ten milk chilling centers.
Two cattle feed plants with cumulative capacity of 600 MT per day.
One milk powder plant of 10 MT per day capacity.
A well established training centre.
5200 retail outlets.
Over 32000 people working either directly or indirectly for the functioning of Milma.
Apart from these the company serves millions of consumers day-in and day- out.
1.4 PRODUCT PROFILE
Product and service details
9

Milma pasteurized having two kinds;
o Toned milk
o Double Toned milk
Toned Milk
Toned milk is considered common milk in which the colour of the package is blue which
contains 3.5% fat and 8.5% of SNF. This milk mainly focused on domestic consumer and is
available in 500 ml packet. Milma gives 4% of commission of sale of each packet of milk. The
price of the toned milk is Rs. 17.50.
Double Toned Milk
This milk contains high fat content of about 4.5% fat and 9% SNF. The price of the
double toned milk is Rs. 16. Both the above milk can be stored for 2 days under cool condition
below 7 degree Celsius.
Sambharam
Sambharam (Butter milk) is a favorite beverage in Kerala. Milma sambharam is only
product of its kind in the market and it is very popular throughout the state is comes in 200ml
packet. It is seasonal product mainly for summer season and is very demand in summer. In
future Milma is planning to launch 500ml packet of sambharam price is at Rs. 20.
Curd
It is a fermented product prepared from pasteurized skim milk using curd culture from
National Dairy Regional Institute (NDRI) is delicious tasty, free cholesterol and is available in
500ml packet. The market price of curd is Rs.20.
Ghee
Milma ghee is available in 500ml, 100ml 50ml and 1 liter. Ghee is the only exporting
product of Milma. The market price of the Milma ghee is as follows;
500ml – Rs.210
100ml – Rs.44
200ml – Rs.86
10

50ml – Rs.23
1 Liter- Rs.400
Peda
An indigenous product manufactured by evaporating water content from whiles some
cow’s milk and sweetened with cane sugar. It is nutritious and delicious sweet bite for children
and in 10 piece box which costs Rs.60. milma peda is produced in Pathanamthitta Dairy.
Milma Sip Up
It is made from pasteurized skim milk sweetened and flavored which is available in 25ml
polythene tube, which flavored by vanilla, strawberry, pineapple served in chilled condition. It
is good for health and is nutritious substance to all other sip ups. The market price of the sip up
is Rs.3.
Ice Cream
Milma ice cream is available in average of lip smacking flavours. Vanilla, chocolate,
pineapple, strawberry and pista. The only ice cream and Kerala manufactured in a dairy is
Milma ice cream and hence this is fresher than any other ice cream produced in the
Thiruvananthapuram dairy. The market price of ice cream is Rs.105, for standard flavour like
chocolate and butterscotch are Rs. 125, 135.
Cattle Feed
Balanced cattle feed is the major input to the dairy farmers of the state federation. There
is a high level of acceptance for this product in the market. The cattle feed is distributed to the
farmers at a reasonable price through different agencies.
Milma Instant Dairy Whitener
Milma has a plant in Allapuzha for the milk powder production from milk. The market
price of 500gm of milk powder is Rs. 175 and for 200gmis Rs.65.
Palada Mix
Palada mix is a product of Kozhikod dairy. The market price of Palada mix of 250gm is
RS.60.
11

Mango Drink
Thiruvananthapuram dairy is producing the mango drink. The market price of the mango
drink is Rs.50 per liter.
Milma Butter
Milma butter is produced in Thiruvanthapuram dairy. The market price of milma butter
is Rs.35 for 100gm. The product can be stored up to 6 months from the manufacturing date
under regeneration condition.
Low Fat Panner
Thiruvanthapuram dairy is producing the low fat panner. The market price of low fat
panner is Rs.28 for 100gm.
Milma Chocolick
Milma chocolik is a chocolate produced in the Ernakulam Dairy. The market price is
Rs.14 for Chocó bar and Rs.12 for mango bar.
Milma Plus
Milma plus is satirized from skimmed flavoured milk which is good energy drink
producer in the Allapuzha and Kollam Dairy. Milma plus is the flavours like chocolate,
strawberry pineapple, mango and pista. The market price of milma plus is Rs.20 for 200ml.
1.5 DEPARTMENT PROFILE
Human Resource Department
12

In Pathanamtitta Dairy the human resource management is headed by the assistant
manager, the dairy had a total strength of 120 workers out of which 80 are permanent and 35 are
temporary. Temporary employees are appointed for a period of 6 months usually they include
stenographers, typist etc...
Marketing Department
Marketing department of any organization has a key role to play the profile and
development. The marketing department in Pathanamthitta dairy is headed by an assistant
manager. Under he comes marketing officer, senior assistant officers etc...
Production Department
Production department is concerned with the process which combines and transfers
various resources into value added product or service. It is the core department of the company.
An organization’s wealth is to successfully utilize the resource available in the organization that
is men, material, money and machine. The importance of production department is the
processing of the milk and its other by-products. The production department is headed by the
assistant manager.
Finance and Accounting Department
Finance is considered as the life blood of business organization. Finance management
is one of the important areas of the management as the effectiveness of the business enterprise is
based on finance. The Pathanamthitta dairy the finance department is headed by the assistant
manager. The structure of the department is shown below;
Assistant Manager
Junior Superintendent
13

Senior Assistant
Junior Assistant
Quality Control Department
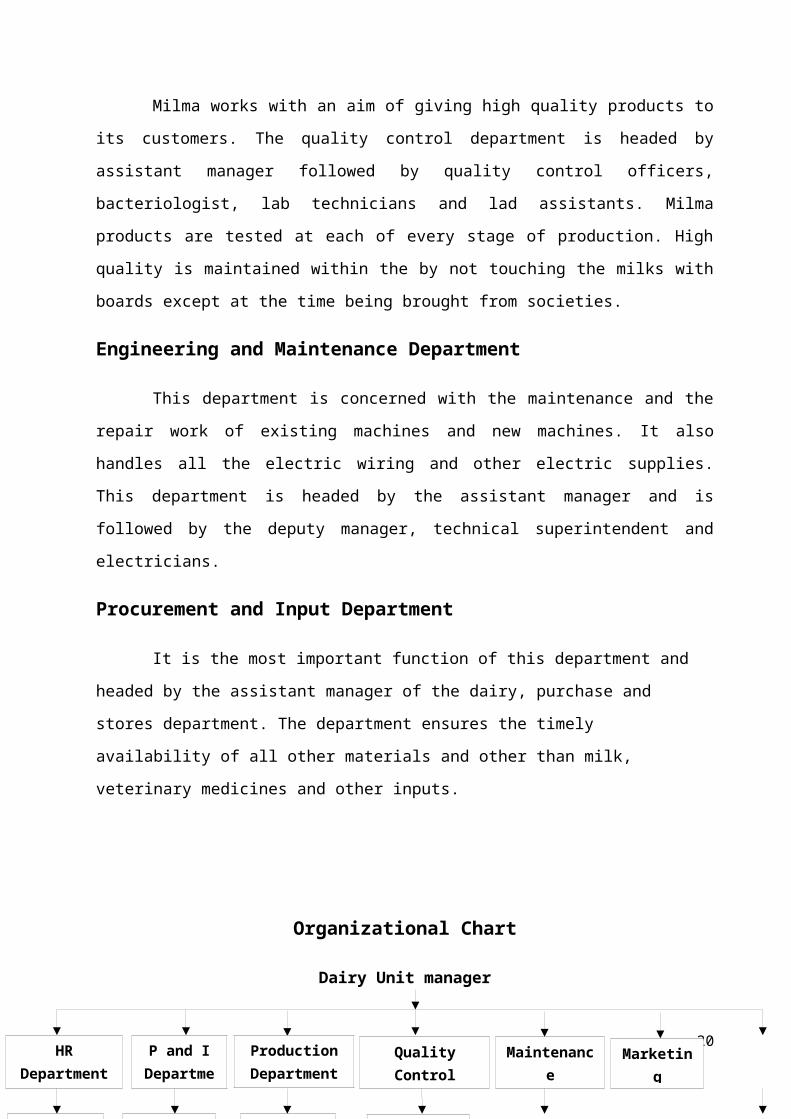
Milma works with an aim of giving high quality products to its customers. The quality
control department is headed by assistant manager followed by quality control officers,
bacteriologist, lab technicians and lad assistants. Milma products are tested at each of every
stage of production. High quality is maintained within the by not touching the milks with boards
except at the time being brought from societies.
Engineering and Maintenance Department
This department is concerned with the maintenance and the repair work of existing
machines and new machines. It also handles all the electric wiring and other electric supplies.
This department is headed by the assistant manager and is followed by the deputy manager,
technical superintendent and electricians.
Procurement and Input Department
It is the most important function of this department and headed by the assistant
manager of the dairy, purchase and stores department. The department ensures the timely
availability of all other materials and other than milk, veterinary medicines and other inputs.
Organizational Chart
Dairy Unit manager
14
HR Department
P and I Department
Production Department
Quality Control Department
Maintenance Department
Marketing Departmen
t
Finance Manager
Assistant Manager
Assistant Manager
Assistant Manager
Assistant Manager

1.6 NEED OF THE STUDY
This study helps to find out the Cost of Capital of Milma Dairy, Pathanamthitta.
Covers comparison and analysis of the performance of the concern and to point out the threat.
15
Assistant manager
Assistant Manager
Assistant Manager
Deputy Manager
Technical Supervisor
Marketing Officer
Assistant Marketing
Officer
Field Officer
Junior Superinte
ndent
Senior Assistant
Junior Assistant

1.7 OBJECTIVES OF THE STUDY
To examine the capital structure of the company.
To evaluate the cost of capital analysis in the Milma dairy.
To measure the profitability of the firm.
To study the leverage analysis in the reference of annual report.
16

To give suggestion on the basis of the above analysis, for an effective financial decisions
making.
SCOPE AND LIMITATIONS OF THE STUDY
1.8 Scope of the Study
The study helps to find out the strength and weakness of the concern in its management of
Cost of Capital and also the reason for the variation in profitability.
17

It gives the management an overall idea about its past performance and this is in turn will
help them to take corrective measures if they are not satisfied with their past performance.
1.9 Limitations of the Study
The availability of information and data limited by the time factor.
The study is based on the data obtained from the annual reports of the company.
The analysis of various ratios is done only for a period of 5 years.
Hence conclusion made may not be complete.
2. REVIEW OF LITERATURE
Brander and Lewis (1986)1
1 Brander and Lewis (1986) , Financial Management by M.Y Khan & P.K Jain, Tata McGraw
Hill Publishing Co. Ltd, 1997
18

Provide the theoretical framework that links capital structure and market structure.
Contrary to the project maximization objective postulated in industrial organization literature,
these theories like the corporate finance theory, assumes that the firm’s objective is to maximize
the wealth of the shareholders and show that the market structure affects the capital structure by
influencing the competitive behaviour and strategies of the firm. Firms in the oligopolistic
market will follow the strategy of maximizing their output for improving profitability in
favourable economic condition. In unfavorable economic conditions, they would take a cut in
production and reduce their profitability.
Jensen and Mocking2
Argue that the shareholder’s lender’s conflict results into risk shifting and wealth
appropriation in favour of shareholders as they take on risky investment projects (assets
substitution). Hence, shareholders and managers as their agents are prompted on to take on more
borrowing to finance. Risky project venders would receive interest and principal if project
succeed and shareholders would appropriate the residual income finance corporate theory that
justifies the use of high debt is the tax-shield theory.
Modigliani and Miller (1963)3
Profitability firms borrow more to save taxes since interest cost are tax deductible. The
output maximization by oligopoly firms is supposed to increase their profitability. Hence, both
the Agency Cost theory and tax-shield theory would predict a positive relationship between
capital structure and market structure. Capital structure increases the chances of financial
distress and bankruptcy. Firms face cost of financial distress when they are unable to service
debt. They will have high debt ratios if these costs are zero or trivial.
Scott(1976) Kim(1990)4
2 Jensen and Mocking (1986) , Principles of Management Accounting by Dr. S.N Maheswari,
Sultan Chand & Sons, 1995.
3 Modigliani and Miller (1963) , Financial Management by I.M Pandey, Vikas Publishing House Pvt Ltd, 19954 Scott(1976) Kim(1990) , Financial Management by M.Y Khan & P.K Jain, Tata McGraw Hill
Publishing Co. Ltd, 1997
19
Since cost of financial distress are trivial and high levered firm can actually go
bankrupt, firms with high probability of bankrupt will have low debt ratio. The chances of
bankruptcy for firms with large reserve funds will be relatively less but, unleveled firms with
high profitability and large reserve funds would have great competitive advantage. These firms
with deep purse may not survive but they would also gain by driving their rival firms into
bankrupt.
Bolton and Scharfstein (1990)5
These firms follow a policy of aggressive production and predatory price cuts to
eliminate their rivals by forcing them into financial distress. Their strategy pays them off
particularly when external funding is not available to the firms of the target predatory price
behaviour. The implication of this model is that the unleveled firm with deep purses (high
profitability and reserve funds) would have incentive to increase output to drive the competitors
into bankruptcy. Empirically, we can predict a negative relationship between capital structure
and market structure.
Myres (1977)6
Provide a model under which debt causes under-investment (asset substitution). Firms
reject those profitable, low risk investment projects that have the possibility of passing on
benefits from shareholders to lenders. Further, internal financing is cheaper than external
financing due to asymmetric information. Higher debt makes higher output costly for a levered
firm. There are a few empirical studies that have investigated the issues of capital structure and
market structure using the data of the U.S firms.
Chevalien (1993)7
5 Bolton and Scharfstein , Financial Management by Prasanna Chandra, Tata McGraw Hill
Publishing Co. Ltd, 1995.
6 Myres (1977) , Cost and Management Accounting by S.N Maheswari, Sultan Chand & Sons, 19967 Chevalien (1993) , Cost Accounting by Jain & Narang, Kalyani Publishing, New Delhi, 1997.
20

Provide evidence in support of a negative relationship between capital structure and
market structure. This result is consistent with the bankruptcy cost or the asymmetric
information / pecking order hypothesis.
3. RESEARCH METHODOLOGY
Research
Research is common pestilence refers to search for knowledge. Once can also define
research as a scientific and systematic search for a pertinent information on a specific topic. In
fact, research is an art of scientific investigation. Redman and Mary define research as a
“systematic effort to gain new knowledge”.
21

Research is an academic activity and as such the term should be used in a technical
sense. According to Clifford Woody, “research comprises defining redefining problems,
formulation of hypothesis, collecting, organizing and evaluating data, making deductions and
research conclusion and at last carefully testing the conclusion to determine whether they fit the
formulating hypothesis”.
Research Design
A research design is the arrangement of condition for collection and analysis of data in
a means that aims relevance to the research purpose with economy in procedure. In this study
the analytical research is followed.
Sources of Data Collection
In this study secondary data is the main source.
Primary Data
The primary data are those data which are collected for the first time by the researcher.
Secondary Data
The secondary data are those data which have already been collected someone else and
which have already been passed through the statistical process. In this study secondary data is
the main source. Thus the data was collected through;
Annual Reports
Books
Website of Milma Dairy
Internet
Tools used for Analysis
1) Ratios
2) Leverage Analysis
3) Capital Structure and Cost of Capital
4) Trend Analysis
Area of study
22

Milma dairy , Pathanamthitta , kerala
Period of study
The period of study is from 2009 to 2013.
4. DATA ANALYSIS AND INTERPRETATION
4.1 Ratio
4.1.1 Debt Equity Ratio
This financing of the total assets of the business concern is done by owner’s
equity (also known as internal equity) as well as outsider’s debt (also known as outsider’s
equity). How much fund has been provided by the owner’s and how much by the outsiders in
the acquisition of the total assets is a very significant factor affecting the long term solvency
position of the concern.
23

Table Showing Debt Equity Ratio
Year Long Term Debt Shareholder’s Fund Ratio
2008-2009 3314097.2 3567417.08 .929
2009-2010 2614008.3 4752742.35 .55
2010-2011 41829512.05 5980284.19 6.99
2011-2012 41859512.05 5980284.19 6.99
2012-2013 1885645 6280250 .300
Interpretation
The debt equity ratio was 3.29 in the year 2008-2009. It indicates long term debt is high
compare than shareholder fund but it was decreased during the next year. The lower proportion
of debt provides a higher margin of safety for them.
Graph 1
24

2008-2009 2009-2010 2010-2011 2011-2012 2012-20130
1
2
3
4
5
6
7
8
Ratio
Ratio
4.1.2 Interest Coverage Ratio
Apart from EBIT-EPS analysis, the ability of the firm to use debt from the profitability point
of view can also be judged in terms of coverage ratio namely;
Interest Coverage = Earnings before I and T / Fixed Interest Charges
25

Table Showing Interest Coverage Ratio
Year EBIT Interest Ratio
2008-2009 5435117.60 323242 16.81
2009-2010 6060665.58 699996.00 8.66
2010-2011 10710115.35 699996.00 15.30
2011-2012 3775818.47 699996.00 6.39
2012-2013 14891082 700000 21.27
Interpretation
The above table indicates that interest covered by earning was 7.81 times on an average.
Even though there has been a small fall in the ratio during the year 2010 and 2011 when
compared 2012. The ratio went up 10.04 times in the year 2012-2013. This was due to high
increase in the earning before interest and taxes.
Graph 2
26

2008-2009 2009-2010 2010-2011 2011-2012 2012-20130
5
10
15
20
25
Ratio
Ratio
4.1.3 Debtors Turnover Ratio
Debtor’s turnover ratio measures the number of times the receivables are rotated in terms of
sales. This ratio also indicates the efficiency of credit collection and efficiency of credit policy.
The ratio is helpful in determining the operational efficiency of a business concern and the
27

efficiency of credit policy. It is important to maintain reasonable quantitative relationship
between receivables and sales.
Debtor’s Turnover Ratio = Sales / Debtors
Table Showing Debtors Turnover Ratio
Year Sales Debtors Times
2008-2009 115570571.80 2889264.30 40
2009-2010 139266692.88 3027536.80 46
2010-2011 168393118.14 2629747.795 64.03
2011-2012 139266692.88 2629747.795 52.96
2012-2013 252541100.5 4194870.23 66.20
Interpretation
It is shown in the table that there is an increasing ratio of debtor’s turnover ratio from the
year 2009-2011, but the small variation in the year 2012 was due to the change in organization
strategy.
Graph 3
28

2008-2009 2009-2010 2010-2011 2011-2012 2012-20130
10
20
30
40
50
60
70
Times
Times
4.1.4 Debtors Collection Period
Debtor’s collection period indicates the financial strength of the organization because
it facilitates a comfortable working capital. The higher the turnover ratio and shorter the
collection period, better the trade credit management. Debtor’s collection period measures the
29

quality of debtors. Since it measures the rapidity or lowness with which money is collected from
them.
Debtors Collection Period = 365 Days / Debtor’s Turnover
Table Showing Debtors Collection Period
Year Days of Year Debtor’s Turnover Days
2008-2009 365 40 9
2009-2010 365 46 8
2010-2011 365 64.03 6
2011-2012 365 52.96 7
2012-2013 365 66.20 5
Interpretation
In the year 2008-2009, the debtor’s collection period is 9 days. It indicates too liberal and
insufficient credit collection performance. In the subsequent years company has taken measures
and decreased collection period. It shows good sign for the company.
Graph 4
30

2008-2009 2009-2010 2010-2011 2011-2012 2012-20130
1
2
3
4
5
6
7
8
9
10
Days
Days
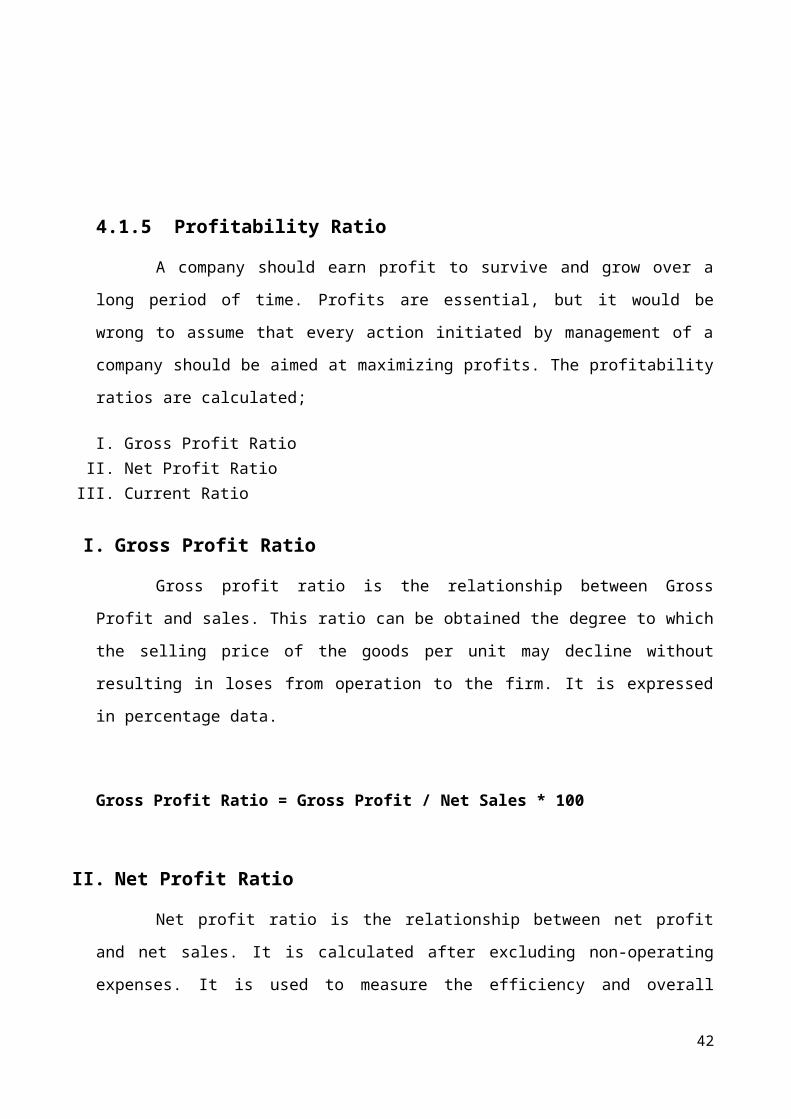
4.1.5 Profitability Ratio
A company should earn profit to survive and grow over a long period of time. Profits
are essential, but it would be wrong to assume that every action initiated by management of a
company should be aimed at maximizing profits. The profitability ratios are calculated;
31

I. Gross Profit RatioII. Net Profit Ratio
III. Current Ratio
I. Gross Profit Ratio
Gross profit ratio is the relationship between Gross Profit and sales. This ratio can be
obtained the degree to which the selling price of the goods per unit may decline without
resulting in loses from operation to the firm. It is expressed in percentage data.
Gross Profit Ratio = Gross Profit / Net Sales * 100
II. Net Profit Ratio
Net profit ratio is the relationship between net profit and net sales. It is calculated after
excluding non-operating expenses. It is used to measure the efficiency and overall profitability
of the organization. This ratio helps in determining the efficiency with which affairs of the
business are being managed.
Net Profit Ratio = Net Profit / Sales* 100
III. Current Ratio
Current Ratio = Current Assets / Current Liabilities
Table Showing Gross Profit Ratio
32

Year Gross Profit Sales Ratio
2008-2009 3526118.86 344446633.69 1.024
2009-2010 8291413.38 412094161.81 2.012
2010-2011 4730881.83 493670662.22 .958
2011-2012 18286413.36 422094161.81 4.332
2012-2013 164961078 21423516.62 7.70
Interpretation
In 2008-2009 Gross Profit Ratio is average. This shows that opening stock is over valued.
But from 2009-2010 the ratio increases when compared to the previous years, this proved that
the selling price of the goods sold has gone up without corresponding increases in the costs.
Graph 5
33

2008-2009 2009-2010 2010-2011 2011-2012 2012-20130
1
2
3
4
5
6
7
8
9
Ratio
Ratio
Table Showing Net Profit Ratio
34

Year Profit after Sales Sales Ratio
2008-2009 -3435117.60 344446633.69 -1.578
2009-2010 -6060665.58 412094161.81 -1.470
2010-2011 -10710115.37 493670662.22 -2.169
2011-2012 3775818.47 422094161.81 0895
2012-2013 33849156.26 21423516.62 1.58
Interpretation
In 2008-2009 Net profit ratio is low. It indicates lack of improvement in the operational
efficiency of the business. From the year 2012-2013 the ratio is increased which shows that the
good profitability condition of the business.
Graph 6
35

2008-2009 2009-2010 2010-2011 2011-2012 2012-2013
-200
0
200
400
600
800
1000
Ratio
Ratio
Table Showing Current Ratio
36

Year Current Assets Current Liabilities Current Ratio
2008-2009 102458078.38 108869852.32 .941
2009-2010 218954815.6 238225938.85 .919
2010-2011 10156426.31 401442464.05 .253
2011-2012 25570689.92 401424664.05 .637
2012-2013 24147041 45101080.5 .535
Interpretation
The Current Ratio indicates that there is a fluctuation in each year, which represents there is
adequate for the day to day transaction.
Graph 7
37

2008-2009 2009-2010 2010-2011 2011-2012 2012-20130
0.1
0.2
0.3
0.4
0.5
0.6
0.7
0.8
0.9
1
Current Ratio
Current Ratio
4.2 Leverage Analysis
38

4.2.1 Degree of Financial Leverage
Financial leverage affects the earning per share. When the economic conditions are good and
the firm’s EBIT is increasing, its EPS increases faster with more debt in the capital structure.
DFL = % Change in EPS / % Change in EBIT
Table Showing Degree of Financial Leverage
Interpretation
The above table shows that the EBIT of the company has increased in the year 2011-2012.
The decline in the year 2012-2013 was due to increase in the interest payments. On an average
the financial leverage was 1.21% times which implies that one percent change in EBIT will lead
to 1.07% change in EPS.
Graph 8
39
Year EBIT EPS Ratio
2008-2009 13672 11188 1.22
2009-2010 17608 15566 1.13
2010-2011 22244 20230 1.09
2011-2012 25999 23056 1.12
2012-2013 34674 32132 1.07

2008-2009 2009-2010 2010-2011 2011-2012 2012-20130.95
1
1.05
1.1
1.15
1.2
1.25
Ratio
Ratio
4.2.2 Operating Leverage
Operating Leverage can be defined more precisely in terms of the way given
change in volume or value of sales, affects portfolio degree of Operating Leverage.
40

Degree of Operating Leverage (DOL) is defined as the percentage change n the Operating
Profit that results from a percentage change in units sold.
Operating Leverage can also be calculated by the formula.
DOL = Contribution / EBIT
Table Showing Operating Leverage
Year Contribution EBIT Ratio
2008-2009 42042 13672 3.07
2009-2010 51548 17608 2.92
2010-2011 55807 22244 2.50
2011-2012 59304 25999 2.28
2012-2013 62433 34674 1.80
Interpretation
The above table indicates the Operating Leverages for 5 years that is from 2009-2013. The
leverage was 2.04% times on an average. The leverage was increased in the year 2008-2009 and
lowest in the year 2012-2013.
Graph 9
41
2008-2009 2009-2010 2010-2011 2011-2012 2012-20130
0.5
1
1.5
2
2.5
3
3.5
Ratio
Ratio
4.2.3 Combined Leverage
The Degree of Financial Leverage and Operating Leverage can be combined to see the
effect of total leverage of EPS associate with a given change in sales. The degree of Combined
Leverage (DOL) is given by the formula.
42

Degree of Combined Leverage = Operating Leverage * Financial Leverage
Degree of Financial leverage constitutes a double edged sword. They have tremendous
acceleration effect on EPS and EBIT.
Table Showing Combined Leverage
Year Financial Leverage Operating Leverage Combined Leverage
2008-2009 1.22 3.07 3.74
2009-2010 1.13 2.92 3.29
2010-2011 1.09 2.50 2.72
2011-2012 1.12 2.28 2.46
2012-2013 1.07 1.80 1.92
Interpretation
The table shows Combined Leverage for five years (2009-2013) Combined Leverage was
higher in the year 2008-2009 amounts to 3.74 percent which explain that 2 percent change in
sales would lead to 2 percentage changes in Earnings per Share. The Combined Leverage was
3.74% on an average. This leverage was due to the existence of Financial Leverage of the
company.
Graph 10
43

2008-2009 2009-2010 2010-2011 2011-2012 2012-20130
0.5
1
1.5
2
2.5
3
3.5
4
Combined Leverage
Combined Leverage
Table showing sources of funds during the year 2008-2009
Particulars Amount (in lakhs) Percentage
44

Share Capital 4439 7%
Reserves and Surplus 28306 48%
Secured Loans 17267 29%
Unsecured Loans 7434 13%
Deferred Tax Liability 1744 3%
Total 59189 100%
Interpretation
From the above table of the total funds employed of Rs.59189 lakhs. Funds 7% raise through
share capital 48% of the raise using reserves and surplus, 29% of the source from secured loans
and 13% funds from unsecured loans and 3% of the funds are raised by deferred tax liability
further it is inferred that majority of the funds has been used in the form of reserves and surplus.
Graph 11
45

Share Capital Reserves and Surplus Secured Loans Unsecured Loans Deferred Tax Liability0%
10%
20%
30%
40%
50%
60%
Percentage
Percentage
Table showing sources of funds during the year 2009-2010
Particulars Amount (in lakhs) Percentage
46

Share Capital 4439 6%
Reserves and Surplus 39178 55%
Secured Loans 18811 26%
Unsecured Loans 6978 10%
Deferred Tax Liability 2471 3%
Total 71877 100%
Interpretation
From the above table of the total funds employed of Rs. 71877 lakhs funds 6% raise
through share capital 55% of the funds are raise through Reserves and Surplus, 26% of the
source from Secured loans and 3% of the fund are raised by Deferred Tax Liability further it is
inferred that majority of the funds has been used in the form of Reserves and Surplus.
Graph 12
47

Share Capital Reserves and Surplus
Secured Loans Unsecured Loans
Deferred Tax Liability
0%
10%
20%
30%
40%
50%
60%
Percentage
Percentage
Table Showing Sources of Funds during the year 2010-2011
Particulars Amount (in lakhs) Percentage
48

Share Capital 4439 6%
Reserves and Surplus 50685 68%
Secured Loans 11676 16%
Unsecured Loans 5865 8%
Deferred Tax Liability 1818 2%
Total 74483 100%
Interpretation
From the above table of the total funds employed of Rs.74483 lakhs. Funds 6%
of funds are raised through Share Capital 68% of the raise using Reserves and Surplus, 16% of
the sources from Secured Loans and 8% funds from Unsecured and 2% of the funds are raised
by Deferred Tax Liability further it is inferred that majority of the funds has been used in the
form of Reserves and Surplus.
Graph 13
49

Share Capital Reserves and Surplus Secured Loans Unsecured Loans Deferred Tax Liability0%
10%
20%
30%
40%
50%
60%
70%
80%
Percentage
Percentage
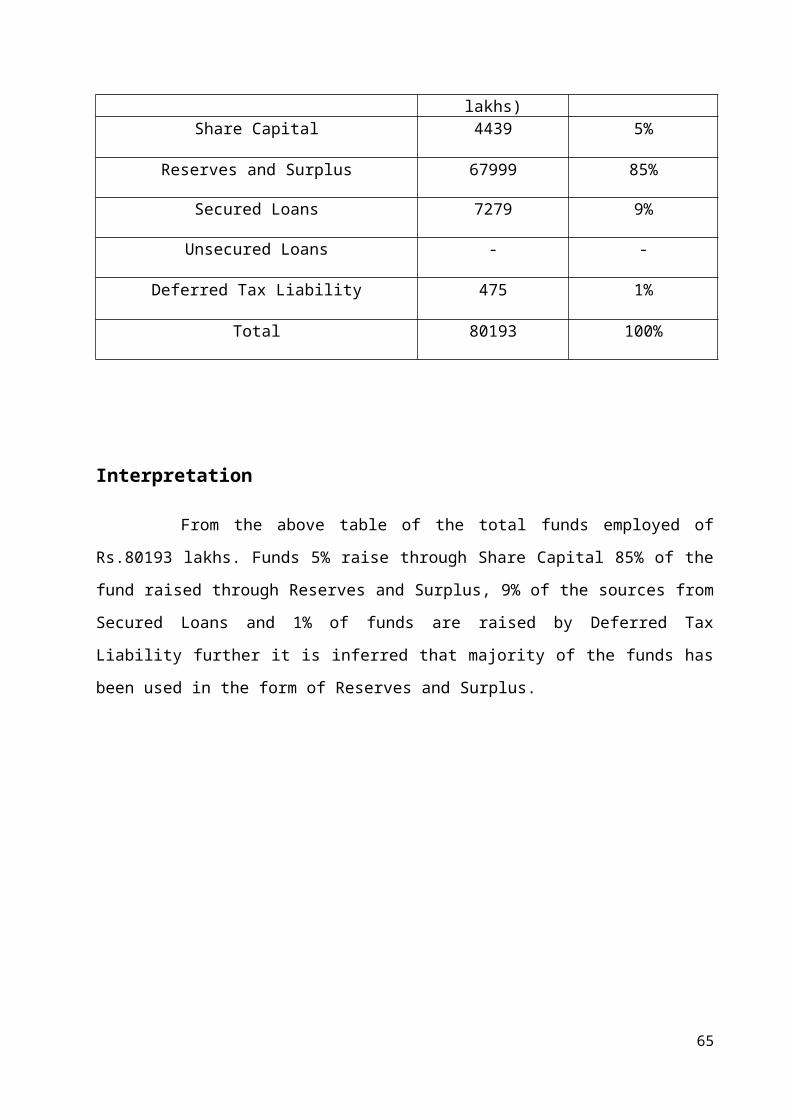
Table Showing Sources of Funds during the year 2011-2012
50

Particulars Amount (in lakhs) Percentage
Share Capital 4439 5%
Reserves and Surplus 67999 85%
Secured Loans 7279 9%
Unsecured Loans - -
Deferred Tax Liability 475 1%
Total 80193 100%
Interpretation
From the above table of the total funds employed of Rs.80193 lakhs. Funds 5%
raise through Share Capital 85% of the fund raised through Reserves and Surplus, 9% of the
sources from Secured Loans and 1% of funds are raised by Deferred Tax Liability further it is
inferred that majority of the funds has been used in the form of Reserves and Surplus.
Graph 14
51

Table Showing Sources of Funds during the year 2012-2013
52
Share Capital Reserves and Surplus Secured Loans Unsecured Loans Deferred Tax Liability0%
10%
20%
30%
40%
50%
60%
70%
80%
90%
Percentage
Percentage

Particulars Amount (in lakhs) Percentage
Share Capital 4439 6%
Reserves and Surplus 47142 62.5%
Secured Loans 16054 21%
Unsecured Loans 2637 3.5%
Deferred Tax Liability 5255 7%
Total 75527 100%
Interpretation
From the above table of the total funds employed of Rs.75527 lakhs. Funds 6%
raise through Share Capital 62.5% of the fund raised through Reserves and Surplus, 21% of the
sources from Secured Loans,3.5% of funds was raised through from Unsecured Loans and 7%
of funds are raised by Deferred Tax Liability further it is inferred that majority of the funds has
been used in the form of Reserves and Surplus.
Graph 15
53

Share Capital Reserves and Surplus Secured Loans Unsecured Loans Deferred Tax Liability0%
10%
20%
30%
40%
50%
60%
70%
Percentage
Percentage
4.4 Cost of Capital
In order to run and manage a company funds are needed, right from the promotional stage
up to end, finance play a vital role in a company’s life, if the funds are adequate the business
suffers and if the funds are not properly managed, it is therefore, necessary that correct estimates
54

of the current and further need of capital be made to have an optimum Capital Structure, which
shall help the organization to run the work smoothly and without any stress.
Overall Cost of Capital
KO= EBIT / V
EBIT – Earning before Interest and Tax
V = S + B
Value of the Firm = Value of Equity + Value of Debt
Table Showing Net Income Approach during the year 2008-2009
Particulars Amount (RS. In Lakhs)
Value Share (S) 23257
Market Value of the bond(B) 29168
Value of the Firm (V=S+B) 52425
Earnings before interest and Tax 13672
Overall Cost of Capital 0.26%
Interpretation
From the above table, Value of the Firm is Rs.52425; the overall Cost of Capital is 0.26%.
Graph 16
55

Value Sh
are (S)
Market V
alue o
f the b
ond(B)
Value o
f the Fi
rm (V=S+B)
Earnings b
efore i
nterest a
nd Tax
Overall C
ost of Capital
0100002000030000400005000060000
Amount (RS. In Lakhs)
Amount (RS. In Lakhs)
Table Showing Net Income Approach during the year 2009-2010
56

Particulars Amount (RS. In Lakhs)
Value Share (S) 32744
Market Value of the bond(B) 26445
Value of the Firm (V=S+B) 59189
Earnings before interest and Tax 17608
Overall Cost of Capital 0.29%
Interpretation
From the above table, Value of the Firm is Rs.59189; the overall Cost of Capital is 0.29%.
Graph 17
57

Value Sh
are (S)
Market V
alue o
f the b
ond(B)
Value o
f the Fi
rm (V=S+B)
Earnings b
efore i
nterest a
nd Tax
Overall C
ost of Capital
0
10000
20000
30000
40000
50000
60000
70000
3274426445
59189
17608
0.0029
Amount (RS. In Lakhs)
Table Showing Net Income Approach during the year 2010-2011
58

Particulars Amount (RS. In Lakhs)
Value Share (S) 43617
Market Value of the bond(B) 28260
Value of the Firm (V=S+B) 71877
Earnings before interest and Tax 22244
Overall Cost of Capital 0.30%
Interpretation
From the above table, Value of the Firm is Rs.71877; the overall Cost of Capital is 0.30%.
Graph 18
59

Value S
hare (S)
Market V
alue o
f the b
ond(B)
Value o
f the F
irm (V=S+
B)
Earnings b
efore i
nterest
and Ta
x
Overall
Cost of Capital
01000020000300004000050000600007000080000
43617
28260
71877
22244
0.00300000000000001
Amount (RS. In Lakhs)
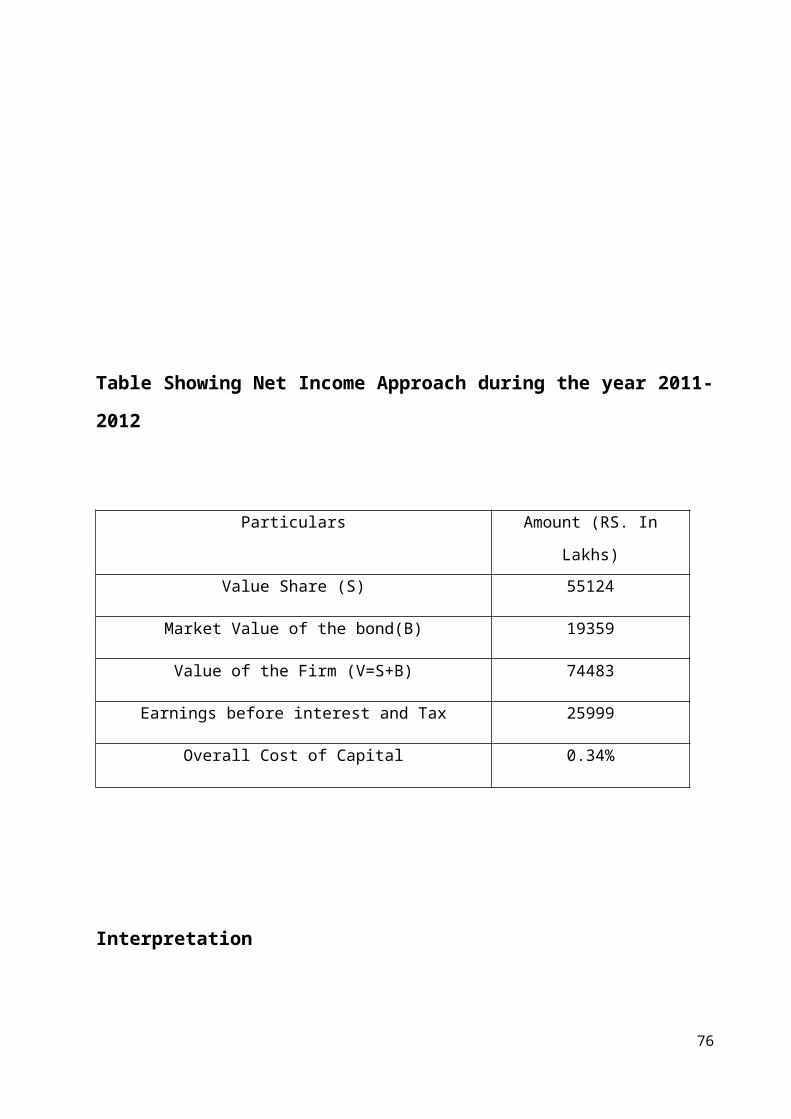
Table Showing Net Income Approach during the year 2011-2012
60

Particulars Amount (RS. In Lakhs)
Value Share (S) 55124
Market Value of the bond(B) 19359
Value of the Firm (V=S+B) 74483
Earnings before interest and Tax 25999
Overall Cost of Capital 0.34%
Interpretation
From the above table, Value of the Firm is Rs.74483; the overall Cost of Capital is 0.34%.
Graph 19
61

Value S
hare (S
)
Market
Value o
f the b
ond(B)
Value o
f the F
irm (V
=S+B)
Earnings
before
interest
and Ta
x
Overall
Cost of C
apita
l0
1000020000300004000050000600007000080000
55124
19359
74483
25999
0.00340000000000002
Amount (RS. In Lakhs)
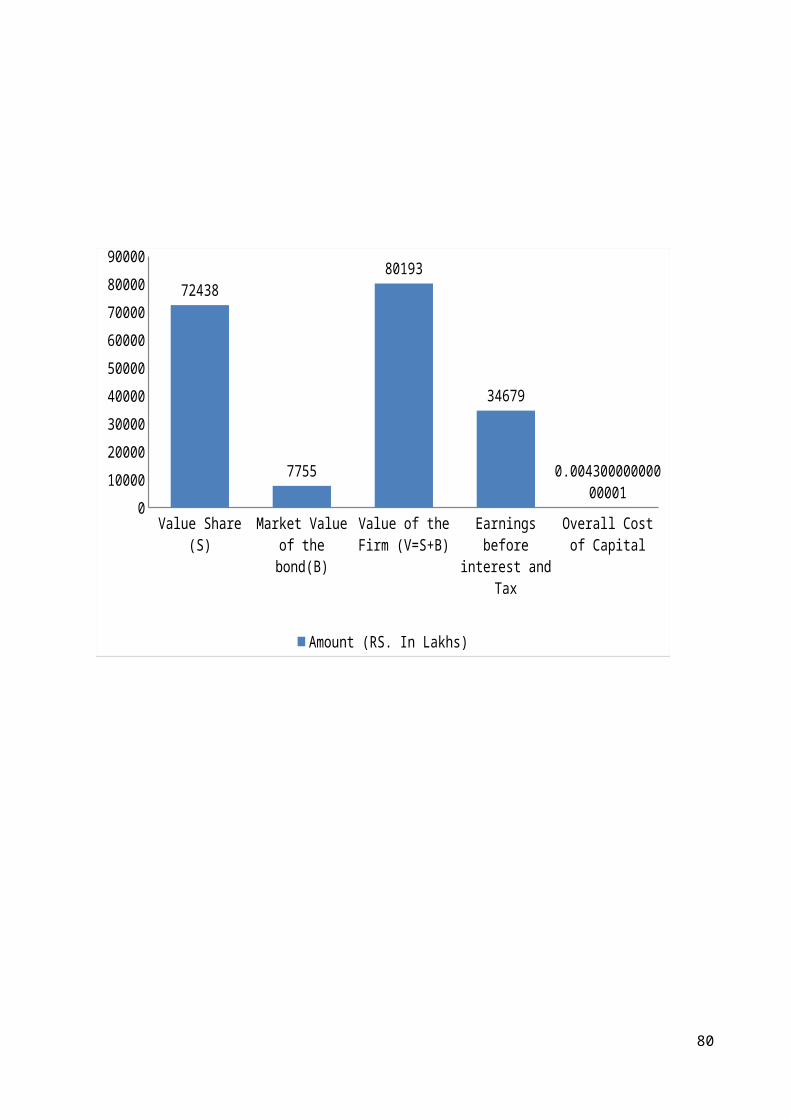
Table Showing Net Income Approach during the year 2012-2013
62

Particulars Amount (RS. In Lakhs)
Value Share (S) 72438
Market Value of the bond(B) 7755
Value of the Firm (V=S+B) 80193
Earnings before interest and Tax 34679
Overall Cost of Capital 0.43%
Interpretation
From the above table, Value of the Firm is Rs.80193; the overall Cost of Capital is 0.43%.
Graph 20
63

Value S
hare (S)
Market V
alue o
f the b
ond(B)
Value o
f the F
irm (V=S+
B)
Earnings b
efore i
nterest
and Ta
x
Overall
Cost of Capital
0100002000030000400005000060000700008000090000
72438
7755
80193
34679
0.00430000000000001
Amount (RS. In Lakhs)
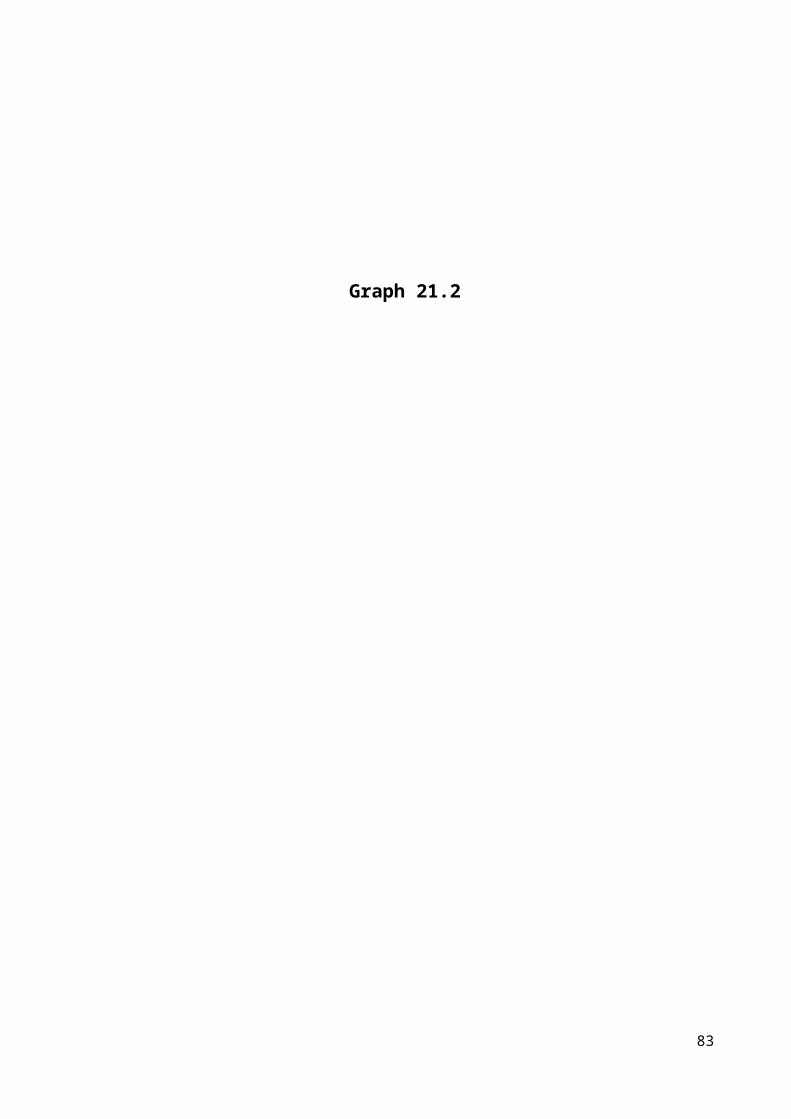
Table Showing Net Operating Income Approach during the year 2009-2013
64
Year Cost of Capital Value of the Firm
2009 0.26% 52425
2010 0.29% 59189
2011 0.30% 71877
2012 0.34% 74483
2013 0.43% 80193
Interpretation
From the above table showing that the overall Cost of Capital is very low 0.26% in the year
2009 and value of the firm were Rs. 52425. But it started growing and reached 0.43% and
Rs.80193.
Graph 21.1
65

2009 2010 2011 2012 20130.00%
0.05%
0.10%
0.15%
0.20%
0.25%
0.30%
0.35%
0.40%
0.45%
0.50%
Cost of Capital
Cost of Capital
Graph 21.2
66

2009 2010 2011 2012 2013
5242559189
71877 7448380193
Value of the FirmValue of the Firm
4.4 Trend Analysis
67

Trend Analysis of sales = Sales of the Year / Total Sales * 100
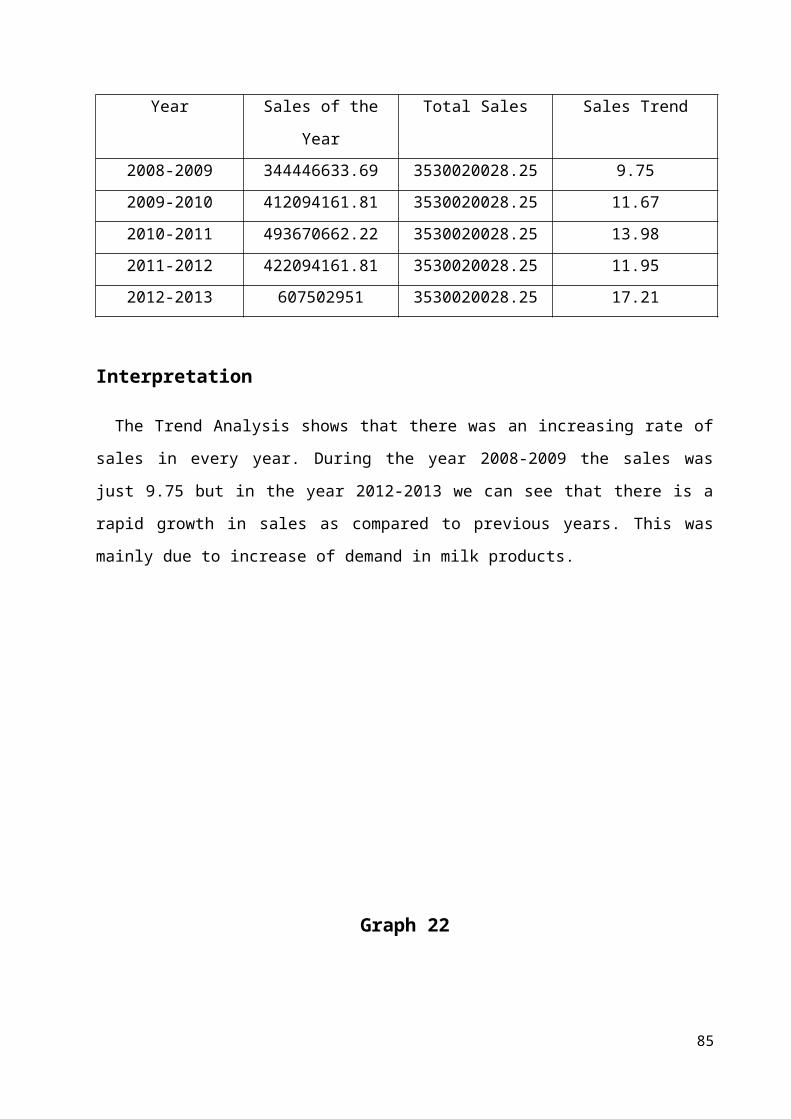
Table showing Trend Analysis in Sales
Year Sales of the Year Total Sales Sales Trend
2008-2009 344446633.69 3530020028.25 9.75
2009-2010 412094161.81 3530020028.25 11.67
2010-2011 493670662.22 3530020028.25 13.98
2011-2012 422094161.81 3530020028.25 11.95
2012-2013 607502951 3530020028.25 17.21
Interpretation
The Trend Analysis shows that there was an increasing rate of sales in every year. During the
year 2008-2009 the sales was just 9.75 but in the year 2012-2013 we can see that there is a rapid
growth in sales as compared to previous years. This was mainly due to increase of demand in
milk products.
Graph 22
68

2008-2009 2009-2010 2010-2011 2011-2012 2012-20130
2
4
6
8
10
12
14
16
18
20
Sales Trend
Sales Trend
5. FINDINGS, SUGGESTIONS AND CONCLUSION
69

5.1 Findings
Debt Equity Ratio indicates the average position of the firm. It shows .929% in the year 2009
and in the year 2013 it shows .30% low level.
Interest Coverage Ratio in the year 2009 was 16.81% and 2012 shows the low level of 6.39%
and it shows high level in 2013 of 21.27%.
Debtor’s Turnover Ratio indicates the increasing year to year. It shows 66.20% in the year
2013 which shows the good position of the firm.
The Gross Profit Ratio is increasing year to year. The highest ratio is 7.70% during the year
2013. The lowest ratio is .958% during the year 2011.
The Net Profit Ratio is high in the year 2013 at 1.58%. In 2011 Net Profit declined at -
2.169% and in the year 2009, 2012 the ratio is very low at -1.578% and -1.470% respectively.
The Degrees of Financial Leverage in the year 2009 were increased to 1.22%. In the 2013 it
shows decreasing of 1.07%.
The Operating Leverage indicates increase in the year 2009 with 3.07% and in the year 2013
it shows decreasing of 1.80% which indicates low position of the firm.
The Combined Leverage shows the highest in the year 2009 at 3.74%. But in the year 2013 it
decreased to 1.92%.
The sources of funds are increasing year by year. The highest source of funds during the year
2012 was 80193 and lowest in the year 2009 of 59189.
Net Income Approach shows the low rate of .26% during the year 2009. But in the year 2013
it shows 0.43% which indicates the good position of the firm.
5.2 Suggestions
In order to overcome the problems of Long term Solvency, Profitability and Leverage
position, Cost of Capital is suggested to follow.
70

The company’s current financial position is not so good, so they have to take much care
about decision regarding capital.
Motivating the employees in the organization is beneficial to the company.
The financial leverage is low, so it must be increased in future.
The sources of funds increasable it must be increasing in future.
Through reducing the Cost of Capital, the company can gain a lot.
5.3 Conclusion
Capital Structure is the key indicator to determine the position of an organization. It
can reduce the loss of wastage through effectively controlling Cost of Capital. In this study of
71

Milma Dairy it found that they are concentrating on the Cost of Capital analysis and maintaining
it.
The employees can be rewarded and they motivated and they may work truthfully for
the organization. So the Capital Structure may be normally increased by their effective work.
Profits are essential, but it would be wrong to assume that every action initiated by the
management of the company should be aimed at maximization of profits. It enhances the
goodwill of the company; stakeholders evaluate the performance of the company on the basis of
the profits. So that the Capital Structure and Cost of Capital analysis is necessary.
The thing is that, the company is giving more importance to the welfare of employees,
the company is basically a service oriented industry, and in such a way they are providing
quality goods and services rather than making profits.
APPENDIX
TRCMPU
72

Final Audit 2008-2009
Manufacturing and Trading Account for the year ended 31-2-2009
Sl.
No
Particulars Amount Sl.
No
Particulars amount
1. Purchase &
Consumption
106945938.29 1. Sales – Milk &
Products
228626306.29
2. Consumption of other
materials
210374.67 2. Sales by Transfer 15570571.80
3. Stock transfer in 207272568.17 3. Other Sales 249755.60
4. Freight / Carriage
Taxes & insurance
5076085.38
5. Wages & Allowance 4510831.38
6. Manufacturing
expenses
10341557.61
7. Procurement & Input
Charges
687048.12
8 Selling Expenses 5876111.19
Total 340920514.83 Total 344446633.69
Gross Profit 3526118.86
Grand Total 344446633.69 Grand Total 344446633.69
TRCMPU LTD
Final Audit 2009-2010
Manufacturing and Trading Account for the year ended 31-3-2010
73

Sl.
No
Particulars Amount Sl.
No
Particulars Amount
1. Raw Material
Consumed
119973693.59 1. Sales – Milk &
Products
272449735.91
2. Consumption of other
materials
346136.29 2. Sales by Transfer 139266692.88
3. Stock transfer in 251299833.27 3. Other Sales 377733.02
4. Freight / Carriage
Taxes & insurance
6250179.82
5. Wages & Allowance 6290760.88
6. Manufacturing
expenses
10816213.61
7. Procurement & Input
Charges
1838389.74
8 Selling Expenses 6914674.25
9. Taxes & Insurance 72867.00
Total 403802748.45 Total 412094161.81
Gross Profit 8291413.38
Grand Total 412094161.81 Grand Total 412094161.81
TRCMPU LTD
Final Audit 2010-2011
Manufacturing & Trading Account for the year ended 31-3-2011
74

Sl.
No
Particulars Amount Sl.
No
Particulars Amount
1. Raw Material
Consumed
151139165.10 1. Sales – Milk &
Products
324973460.97
2. Consumption of other
materials
229560.39 2. Sales by Transfer 168393118.14
3. Stock transfer in 295497727.96 3. Other Sales 1015730.63
4. Freight / Carriage
Taxes & insurance
7375030.39
5. Wages & Allowance 5536543.65
6. Manufacturing
expenses
11326195.57
7. Procurement & Input
Charges
9748261.62
8 Selling Expenses 9056296.93
9. Taxes & Insurance 46729.00
Total 489955511.02 Total 494686392.85
Gross Profit 4730881.83
Grand Total 494686392.85 Grand Total 494686392.85
TRCMPU LTD
Final Audit 2011-2012
Manufacturing and Trading Account for the year ended 31-3-2012
75
Sl.
No
Particulars Amount Sl.
No
Particulars Amount
1. Raw Material
Consumed
119976193.59 1. Sales – Milk &
Products
282449735.91
2. Consumption of other
materials
348636.29 2. Sales by Transfer 139266692.88
3. Stock transfer in 251299833.27 3. Other Sales 377733.02
4. Freight / Carriage
Taxes & insurance
6250179.82
5. Wages & Allowance 6290760.88
6. Manufacturing
expenses
10816213.61
7. Procurement & Input
Charges
1838389.74
8 Selling Expenses 6914674.25
9. Taxes & Insurance 72867.00
Total 403807748.45 Total 422094161
Gross Profit 18286413.36
Grand Total 422094161.81 Grand Total 422094161
TRCMPU LTD
Final Audit 2012-2013
Manufacturing and Trading Account for the year ended 31-3-2013
76

Sl.
No
Particulars Amount Sl.
No
Particulars Amount
1. Raw Material
Consumed
125368473.5 1. Sales – Milk &
Products
354561850.5
2. Consumption of other
materials
385544.5 2. Sales by Transfer 252541100.5
3. Stock transfer in 282545584.75 3. Other Sales 4000000.00
4. Freight / Carriage
Taxes & insurance
6250179.25
5. Wages & Allowance 6980000.00
6. Manufacturing
expenses
11500000.80
7. Procurement & Input
Charges
2512415.50
8 Selling Expenses 6914674.70
9. Taxes & Insurance 85000.00
Total 442541873.00 Total 607502951.00
Gross Profit 164961078.00
Grand Total 607502951.00 Grand Total 607502951.00
TRCMPU LTD
Final Audit 2008-2009
Profit & Loss Account for the year ended 31-3-2009
77

Sl.
No.
Particulars Amount Sl.
No.
Particulars Amount
1. Salaries and other
benefits
3854412.16 1. Gross Profit b/d 3526118.86
2. Administrative
Expenses
564541.18 Miscellaneous Income 169130.25
3. Miscellaneous
Expenses
3918442.40
4. Depreciation & other
services
469722.97
5. Interest on
Borrowings
323242.00
Total 9130366 Total 3698249.11
Net Loss 5435117.60
Grand Total 9130366.71 Grand Total 9130366.71
TRCMPU LTD
Final Audit 2009-2010
Profit & Loss Account for the year ended 31-3-2010
78

Sl.
No
.
Particulars Amount Sl.
No
.
Particulars Amount
1. Salaries and other
benefits
7376868 1. Gross Profit b/d 8449929.31
2. Administrative
Expenses
619513.88 Miscellaneous Income 196699.39
3. Miscellaneous
Expenses
4825591.06
4. Depreciation & other
services
1185325.27
5. Interest on
Borrowings
-
Total 14707294.28 Total 8646628.70
Net Loss 6060665.58
Grand Total 14707294.28 Grand Total 14707294.28
TRCMPU LTD
Final Audit 2010-2011
Profit & Loss Account for the year ended 31-3-2011
79
Sl.
No.
Particulars Amount Sl.
No.
Particulars Amount
1. Salaries and other
benefits
6891506.23 1. Gross Profit b/d 4730881.33
2. Administrative
Expenses
972056.37 Miscellaneous Income 171694.46
3. Miscellaneous
Expenses
5821591.22
4. Depreciation & other
services
1227541.84
5. Interest on Borrowings 699996.00
Total 15612691.66 Total 492576.29
Net Loss 10710115.37
Grand Total 15612691.66 Grand Total 15612691.66
TRCMPU LTD
Final Audit 2011-2012
Profit & Loss Account for the year ended 31-3-2012
80

Sl.
No.
Particulars Amount Sl.
No.
Particulars Amount
1. Salaries and other
benefits
7376868 1. Gross Profit b/d 18286413.36
2. Administrative
Expenses
619513.88 Miscellaneous Income 196699.39
3. Miscellaneous
Expenses
4825591.06
4. Depreciation & other
services
1185325.27
5. Interest on
Borrowings
699996.00
Total 14707294.28 Total 18483112.75
Net Profit 3775818.47
Grand Total 18483112.75 Grand Total 18483112.75
TRCMPU LTD
Final Audit 2012-2013
Profit & Loss Account for the year ended 31-3-2013
81

Sl.
No.
Particulars Amount Sl.
No.
Particulars Amount
1. Salaries and other
benefits
8850250.00 1. Gross Profit b/d 164961078.00
2. Administrative
Expenses
700000.50 2. Miscellaneous Income 300000.00
3. Miscellaneous
Expenses
5200000.00
4. Depreciation & other
services
200000.50
5. Interest on Borrowings 700000.00
Total 15650251.0 Total 165261078.00
Net Profit 149610827.00
Grand Total 165261078.00 Grand Total 165261078.00
TRCMPU LTD
Final Audit 2008-2009
Balance Sheet as on 31-3-2009
82
At the
begin
ning
of the
year
Particulars At the end of
the year 31-3-
2009
At the
begin
ning
of the
year
Particulars At the end of
the year 31-3-
2009
0 Borrowings 3314097.00 0 Cash in Hand 56414.59
0 Adjusting heads due
by
1106042.36 0 Cash at Bank 218779.65
0 Inter unit accounts
due by
107763809.96 0 Adjusting Head due
to
285291.86
0 Funds, Reserves &
Provisions
3567417.08 0 Inter unit Accounts
due to
100185695.48
0 Closing Stock 1711896.80
Fixed Assets 7858170.42
Net Loss 5435117.60
115751366.40 115751366.40
TRCMPU LTD
Final Audit 2009-2010
Balance Sheet as on 31-3-2010
83

Previous
year 31-3-
2008
Particulars At the end
of the year
31-3-2010
Previous
year 31-3-
2008
Particulars At the end
of the year
31-3-2010
3314097.00 Borrowings 2631944 56414.59 Cash in Hand 54702.22
1106042.36 Adjusting heads
due by
5585998.93 218779.65 Cash at Bank 942364.15
107763809.
96
Inter unit
accounts due by
232639939.
92
285291.86 Adjusting Head
due to
1357410.28
3567417.08 Funds, Reserves
& Provisions
4752742.35 100185695.
48
Inter unit
Accounts due to
1357410.28
1711896.80 Closing Stock 214375813.
62
5435117.60 Fixed Assets 2224525.33
Net Loss 6060665.58
Loss of the year 5435117.60
245610625.
20
245610625.
20
TRCMPU LTD
Final Audit 2010-2011
Balance Sheet as on 31-3-2011
84
Previous
year 31-3-
2009
Particulars At the end
of the year
31-3-2011
Previous
year 31-3-
2009
Particulars At the end
of the year
31-3-2011
2631944 Borrowings 1687048.00 54702.22 Cash in Hand 23368.71
5585998.93 Adjusting heads
due by
3325480.33 942364.15 Cash at Bank 3237268.65
232639939.
92
Inter unit
accounts due by
5980284.19 1357410.28 Adjusting Head
due to
3877485.31
4752742.35 Funds, Reserves
& Provisions
36816983.7
2
1357410.28 Inter unit
Accounts due to
483796.06
214375813.
62
Closing Stock 2534507.58
2224525.33 Fixed Assets 15304809.4
2
6060665.58 Net Loss 10710115.3
7
5435117.60 Loss of the year 11638445.1
4
47809796.2
4
47809796.2
4
TRCMPU LTD
Final Audit 2011-2012
Balance Sheet as on 31-3-2012
85

Previous
year 31-3-
2011
Particulars At the end
of the year
31-3-2012
Previous
year 31-3-
2011
Particulars At the end
of the year
31-3-2012
1687048.00 Borrowings 1687048.00 54702.22 Cash in Hand 23368.71
3325480.33 Adjusting heads
due by
3325480.33 942364.15 Cash at Bank 18651532.2
6
5980284.19 Inter unit
accounts due by
36816983.7
2
1357410.28 Adjusting Head
due to
3877485.31
36816983.7
2
Funds, Reserves
& Provisions
5980284.19 1357410.28 Inter unit
Accounts due to
483796.06
Net Profit 3775818.47 214375813.
62
Closing Stock 2534507.58
2224525.33 Fixed Assets 15304809.4
2
5435117.60 Loss of the year 10710115.3
7
51585614.7
1
51585614.7
1
TRCMPU LTD
Final Audit 2012-2013
Balance Sheet as on 31-3-2013
86

Previous
year 31-3-
2012
Particulars At the end
of the year
31-3-2013
Previous
year 31-3-
2012
Particulars At the end
of the year
31-3-2013
1687048.00 Borrowings 1885645 23368.71 Cash in Hand 25000
3325480.33 Adjusting heads
due by
3520465.5 18651532.2
6
Cash at Bank 19025550
36816983.7
2
Inter unit
accounts due by
41580615 3877485.31 Adjusting Head
due to
4512255.15
5980284.19 Funds, Reserves
& Provisions
6280250 483796.06 Inter unit
Accounts due to
584235.85
3775818.47 Net Profit 149610827 2534507.58 Closing Stock 2815350.5
15304809.4
2
Fixed Assets 175915411
202877802.
5
202877802.
5
6.BIBLIOGRAPHY
Financial Management by M.Y Khan & P.K Jain, Tata McGraw Hill Publishing Co. Ltd,
1997.
Principles of Management Accounting by Dr. S.N Maheswari, Sultan Chand & Sons, 1995.
87

Financial Management by I.M Pandey, Vikas Publishing House Pvt Ltd, 1995.
Financial Management by Prasanna Chandra, Tata McGraw Hill Publishing Co. Ltd, 1995.
Cost and Management Accounting by S.N Maheswari, Sultan Chand & Sons, 1996.
Cost Accounting by Jain & Narang, Kalyani Publishing, New Delhi, 1997.
Websites
http//www.google.com
http//www.wikipedia.com
88