Airport security measures and their influence on enplanement intentions: Responses from leisure travelers attending a Canadian University Doug Alards-Tomalin a , Tamara L. Ansons b , Tara C. Reich c , Yumiko Sakamoto d , Rita Davie e , Jason P. Leboe-McGowan a, * , Launa C. Leboe-McGowan a a Department of Psychology, University of Manitoba, Canada b Department of Marketing, Warwick Business School, United Kingdom c Department of Management, London School of Economics, United Kingdom d Department of Psychology, York University, Canada e Faculty of Law, University of British Columbia, Canada article info Article history: Available online 22 March 2014 Keywords: Airport security Humiliation Perceived safety abstract Airport security measures can be grouped into two types; standardized screening techniques, which all passengers must undergo (e.g., baggage X-rays, metal detecting scans); and elevated-risk screening (including pat-downs and strip searches) for which only a sub-set of passengers are selected. In the current study, an undergraduate sample (n ¼ 636) was surveyed regarding the professionalism of se- curity screening staff, as well as perceived safety, threat to dignity, and enplanement intentions, following standard and elevated-risk screening measures. Consistent with our hypotheses, perceived professionalism and safety were positively correlated with enplanement intentions, and dignity threat was negatively associated with perceived safety. As the perceived safety from the use of a security measure decreased, enplanement intentions also decreased. Notably, when a screening measure is perceived as having negative consequences (e.g., threatening one’s sense of dignity) the safety of the measure is personally invalidated. Ó 2014 The Authors. Published by Elsevier Ltd. This is an open access article under the CC BY-NC-ND license (http://creativecommons.org/licenses/by-nc-nd/3.0/). 1. Introduction Airport security screening has undergone numerous improve- ments in the past decade. After the events of September 11, 2001, the Transportation Security Administration (TSA) and the Canadian Air Transport Security Authority (CATSA) were developed to improve the screening standards in place in North American air- ports. Targets were set for North American airports to screen all checked luggage for explosives, and to subject passengers to more intensive security screening procedures, which have continued to evolve. While previous standardized security measures are still routinely administered uniformly across all passengers (e.g., baggage X-rays and metal detector scans); elevated risk screening has become more common-place (which include, but is not limited to, bodily pat-downs, bag searches and explosive trace detection scans) (O’Malley, 2006). Selection for elevated risk screening may be determined based on one’s predetermined “risk level” obtained through Computer Assisted Passenger Pre-screening Systems (CAPPS II), or through random selection (Persico and Todd, 2005). While an increase in the use of elevated risk screening has greatly benefited the overall safety of commercial air passengers world- wide ewhich most United States residents recognize (71% of Americans support the continued use of profiling in airport secu- rity 1 ) e the application of more intensive screening measures has also led to increased passenger inconvenience (Gkritza et al., 2006), and has brought to light the issue of restricted civil liberties, and privacy concerns. In a recent study by Hasisi and Weisburd (2011), Arab Israeli and Jewish Israeli passengers who had just passed through a security screening checkpoint in an Israeli airport were provided a * Corresponding author. Department of Psychology, University of Manitoba, Winnipeg, Manitoba, Canada R3T 2N2. Tel.: þ1 204 272 1558. E-mail address: [email protected] (J.P. Leboe-McGowan). 1 http://www.gallup.com/poll/125078/Americans-back-profiling-air-travelers- combat-terrorism.aspx. The survey consisted of. telephone interviews that included 1023 adults (January 8e10, 2010). Contents lists available at ScienceDirect Journal of Air Transport Management journal homepage: www.elsevier.com/locate/jairtraman http://dx.doi.org/10.1016/j.jairtraman.2014.02.004 0969-6997/Ó 2014 The Authors. Published by Elsevier Ltd. This is an open access article under the CC BY-NC-ND license (http://creativecommons.org/licenses/by-nc-nd/3.0/). Journal of Air Transport Management 37 (2014) 60e68

Welcome message from author
This document is posted to help you gain knowledge. Please leave a comment to let me know what you think about it! Share it to your friends and learn new things together.
Transcript
lable at ScienceDirect
Journal of Air Transport Management 37 (2014) 60e68
Contents lists avai
Journal of Air Transport Management
journal homepage: www.elsevier .com/locate / ja i r t raman
Airport security measures and their influence on enplanementintentions: Responses from leisure travelers attending a CanadianUniversity
Doug Alards-Tomalin a, Tamara L. Ansons b, Tara C. Reich c, Yumiko Sakamoto d,Rita Davie e, Jason P. Leboe-McGowan a,*, Launa C. Leboe-McGowan a
aDepartment of Psychology, University of Manitoba, CanadabDepartment of Marketing, Warwick Business School, United KingdomcDepartment of Management, London School of Economics, United KingdomdDepartment of Psychology, York University, Canadae Faculty of Law, University of British Columbia, Canada
a r t i c l e i n f o
Article history:Available online 22 March 2014
Keywords:Airport securityHumiliationPerceived safety
* Corresponding author. Department of PsycholoWinnipeg, Manitoba, Canada R3T 2N2. Tel.: þ1 204 2
E-mail address: Jason.Leboe-McGowan@umanitob
http://dx.doi.org/10.1016/j.jairtraman.2014.02.0040969-6997/� 2014 The Authors. Published by Elsevier
a b s t r a c t
Airport security measures can be grouped into two types; standardized screening techniques, which allpassengers must undergo (e.g., baggage X-rays, metal detecting scans); and elevated-risk screening(including pat-downs and strip searches) for which only a sub-set of passengers are selected. In thecurrent study, an undergraduate sample (n ¼ 636) was surveyed regarding the professionalism of se-curity screening staff, as well as perceived safety, threat to dignity, and enplanement intentions,following standard and elevated-risk screening measures. Consistent with our hypotheses, perceivedprofessionalism and safety were positively correlated with enplanement intentions, and dignity threatwas negatively associated with perceived safety. As the perceived safety from the use of a securitymeasure decreased, enplanement intentions also decreased. Notably, when a screening measure isperceived as having negative consequences (e.g., threatening one’s sense of dignity) the safety of themeasure is personally invalidated.� 2014 The Authors. Published by Elsevier Ltd. This is an open access article under the CC BY-NC-ND
license (http://creativecommons.org/licenses/by-nc-nd/3.0/).
1. Introduction
Airport security screening has undergone numerous improve-ments in the past decade. After the events of September 11, 2001,the Transportation Security Administration (TSA) and the CanadianAir Transport Security Authority (CATSA) were developed toimprove the screening standards in place in North American air-ports. Targets were set for North American airports to screen allchecked luggage for explosives, and to subject passengers to moreintensive security screening procedures, which have continued toevolve. While previous standardized security measures are stillroutinely administered uniformly across all passengers (e.g.,baggage X-rays and metal detector scans); elevated risk screeninghas become more common-place (which include, but is not limitedto, bodily pat-downs, bag searches and explosive trace detection
gy, University of Manitoba,72 1558.a.ca (J.P. Leboe-McGowan).
Ltd. This is an open access article u
scans) (O’Malley, 2006). Selection for elevated risk screening maybe determined based on one’s predetermined “risk level” obtainedthrough Computer Assisted Passenger Pre-screening Systems(CAPPS II), or through random selection (Persico and Todd, 2005).While an increase in the use of elevated risk screening has greatlybenefited the overall safety of commercial air passengers world-wide ewhich most United States residents recognize (71% ofAmericans support the continued use of profiling in airport secu-rity1) e the application of more intensive screening measures hasalso led to increased passenger inconvenience (Gkritza et al., 2006),and has brought to light the issue of restricted civil liberties, andprivacy concerns.
In a recent study by Hasisi andWeisburd (2011), Arab Israeli andJewish Israeli passengers who had just passed through a securityscreening checkpoint in an Israeli airport were provided a
1 http://www.gallup.com/poll/125078/Americans-back-profiling-air-travelers-combat-terrorism.aspx. The survey consisted of. telephone interviews that included1023 adults (January 8e10, 2010).
nder the CC BY-NC-ND license (http://creativecommons.org/licenses/by-nc-nd/3.0/).
2 http://www.ustravel.org/news/press-kit/travel-facts-and-statistics.
D. Alards-Tomalin et al. / Journal of Air Transport Management 37 (2014) 60e68 61
questionnaire. It was found that Arab Israelis reported higher ratesof being selected for elevated-risk security screening, higher ratesof perceived humiliation and intimidation, and demonstrated anincreased negative appraisal of their treatment by security staff.The researchers also found that perceived humiliation had an in-fluence on the perceived legitimacy of the airport security regula-tions, and overall safety. While the mean level of trust in the airportsecurity screening staff was high (75%), Jewish Israeli passengersexhibited higher levels of trust (85.4%) than Israeli-Arab passengers(64.7%). Despite safety ratings (the degree to which security checkscontributed to overall safety) being rated fairly high overall (83.7%),IsraelieJewish passengers rated their perceived safety significantlyhigher (87.6%) than Israeli Arabs (79.6%). This finding suggests thathumiliations incurred during security screening by Israeli Arabsmay have had negative consequences on their level of trust in thescreening personnel, which subsequently had a negative impact onoverall safety assessments.
In the current study it was predicted that perceived threat toone’s dignity resulting from humiliation experienced during secu-rity screening, would lead to forming a negative impression of thatmeasure in enhancing safety, as well as negatively impact in-tentions to use commercial air carriers in the future (referred tothroughout as enplanement intentions). Additionally, we predictedthat higher levels of professionalism by security staff would bepositively related to perceived safety; which in turn would also bepositively related to enplanement intentions.
2. Security personnel professionalism
In the current study, the professionalism of security personnel inCanadian airports was measured using three survey questions inwhich the respondent rated; 1) how appropriate the behaviors ofCanadian security personnel behavior are; 2) How well trainedCanadian security personnel are; and 3) How confident re-spondents are that Canadian security personnel make correct de-cisions. In a previous study, Sindhav et al. (2006) found thatpassengers going through airport security demonstrated a strongcorrelation between their level of perceived justice (that the de-cisions of airport security personnel are judged as fair and unbi-ased) and their overall satisfaction. In this study, several types ofjustice were examined, including distributive justice (i.e., the fairdistribution of tangible and intangible resources), procedural jus-tice (i.e., outcomes are the result of a fair and unbiased process);and interactional and/or interpersonal justice (i.e., the degree towhich the conduct of those enacting the procedures is respectful).They found that while all forms of justice were positively correlatedwith satisfaction, procedural justice exhibited the strongest rela-tionship. Based on this finding, we hypothesized (H1A) thatperceived security personnel professionalism (e.g., how appro-priate and in-keepingwith regulations the behaviors of the securityscreening personnel were) would positively correlate withenplanement intentions; and (H1B) that the effect of securitypersonnel professionalism would be mediated through perceivedsafety onto enplanement intentions. In essence, if respondents feltsecurity staff professionalism to be high (i.e., a high level of pro-cedural justice), they would also view the security measures beingenforced as highly contributing to their overall safety.
3. Perceived safety and dignity
In addition to the perceived professionalism of the security staff,there were a number of other factors relating to security screeningthat we predicted would impact on enplanement intentions. In thecurrent model, we considered the degree to which the securitymeasures (whether standard or elevated) enhanced passenger’s
feelings of overall safety, and contributed to their enplanementintentions. Personal safety is reported as one of the most importantfactors considered when selecting an air carrier (Gilbert andWong,2003). Additionally, overall satisfaction tends to decrease as theperceived risk of an activity increases (Johnson et al., 2006). Whileother studies have failed to find a correlation between perceivedsafety and enplanement (Squalli and Saad, 2006). Ringle et al.(2011) found a significant positive correlation between perceivedsafety levels and customer satisfaction for leisure travelers usingcommercial aviation. Therefore, we predicted in the current model(H2) e which was specified using primarily leisure travelers thathigher levels of perceived safety arising from the use of a securityscreening measure (whether standard or elevated) would bepositively correlated with enplanement intentions. In essence, re-spondents that feel that security measures are purposeful andeffective, will also be more likely to intend to use commercial aircarriers in the future.
The debate over privacy issues inherent in security measuresthat involve pat-downs and body scans continues. For example,American civil liberties organizations have stated that while thebody scanners implemented in North America (millimetre wavebody-scanning technology) are less invasive than X-ray scanners orpat-downs, intimate details may still be viewed by the operator(Boussadia, 2009). Alternatively, body-scanning technology ap-pears to be gaining favor as an alternative to enhanced pat-downs.For instance, passengers at a United Kingdom airport were found toprefer body scans to pat-downs, which were seen as more intrusive(Mitchener-Nissen et al., 2012). Based on Hasisi and Weisburd’s(2011) findings, in which higher levels of humiliation experiencedduring airport security screening led to lower levels of overallperceived safety, we predicted (H3A) that the perceived dignitythreat of a security screening measure would be negatively corre-lated with enplanement intentions. Secondly, we predicted (H3B),that the effect of perceived dignity threat of a security screeningmeasure (whether standard or elevated) would be mediated ontoenplanement intentions via a significant negative correlation withperceived safety. Lastly, (H4) we predicted that age would bepositively correlated with future flying intentions, as older agedparticipants may be more actively engaged in air travel thanyounger participants. To summarize, H1A, H2, H3A and H4 testeddirect effects in the proposed theoretical model, while H1B and H2Btested indirect effects. Wherever means are provided, standarderrors are given in brackets.
4. Method
4.1. Participants
4.1.1. Descriptive statisticsThe participants were undergraduate students recruited from
an Introduction to Psychology course at the University of Manitobawho participated in exchange for partial course credit. Under-graduate students were selected for this study for several reasons:1) we hypothesized that undergraduate students, despite being onaverage younger (M ¼ 20.72 [4.76]) than the average air traveler inNorth America (47.5 years2), will have had sufficient experiencewith airport security measures to have formed valid opinionsregarding them. For instance, the participants reported a meannumber of 6.62 flights (SE ¼ .282) over a period of 3 years, anaverage of slightly more than 2 flights per year. This is highlyconsistent with the national average for the United States ofAmerica. According to data collected by the Travel Industry
D. Alards-Tomalin et al. / Journal of Air Transport Management 37 (2014) 60e6862
Association of America (TIA/BTS Air Travel Survey ResultsNovember 15, 2002), which represented approximately 76 millioncommercial flight users, 81% of commercial air travelers took be-tween 1 and 4 flights per year (Mean ¼ 2.0 flights), with 12% takingbetween 5 and 9, and 7% taking 10þ. This suggests that while theirreasons for flying may not be the same as the general public; thesample used in the study, according to self-report, were as familiarwith airport security measures as the average traveler. Secondly,the undergraduate participant-pool constituted a large, accessiblesample on which the proposed models could be validated.
Seven hundred and twelve participants completed the AirportSecurity Survey online. In the measurement model 68 participantswere excluded using the list-wise deletion procedure for failing tocomplete the questionnaire (81% of the removed participants weremissing only a single item). The list-wise deletion procedure as-sumes that omitted items are missing completely at random, andhave no significant impact on the final model (Brown, 1983; Carter,2006). As the number of participants that were missing data wasrelatively small, and the omitted items were distributed evenlyacross the questionnaire items (the mean number of omissions peritem ¼ 4.8 [2.5], range ¼ 2e11) this assumption was safely met(Rubin, 1976). Only two items tended to be omitted morefrequently: v9 regarding feelings of safety for the use of metaldetecting wands (11 omissions) and v10 regarding feelings of safetyfor the use of enhanced pat-downs (10 omissions), and v9 would beremoved from the final measurement model. Another 8 partici-pants were eliminated for failing to either specify their gender(n ¼ 1), or their racial ancestry (n ¼ 7). The final measurementmodel and theoretical models were specified with an n ¼ 636.
The final sample was composed of 387 (60.8%) females, and249 (39.2%) males. The mean age of the participants included inthe final analysis was 20.7 (4.8) and varied in reported age rangefrom 16 to 50 years old; however the majority of the respondentswere between the ages of 18e22 (82.7%). The majority of therespondents indicated that they were Caucasian (62.3%). Re-spondents of Asian ancestry (including South-West, South-East,North-East and South-Central Asia) comprised the second largestsub-grouping (18.8%), while First-Nations/Metis respondentswere the third largest sub-group (8.2%). When collapsed intoCaucasian and Other ancestry groupings, 396 had indicated thatthey were Caucasian, and 240 (60.6%) had indicated an ancestryother than Caucasian. These two groups were large enough, andof similar size, to allow for multi-group comparisons to beperformed.
4.1.2. Flight experience informationSix questionnaire items examined the frequency of air travel in
the past three years for business or leisure. These items looked atflights within, and outside of Canada, as well as internationalflights (across borders). It was found that the average number ofbusiness flights were significantly lower [M ¼ 1.24 (.19)] than theaverage number of leisure flights [M ¼ 6.81 (.45)], F(1,571) ¼ 233.629, p < .001. This result was anticipated, as the samplewas composed of undergraduate university students. In comparingthe average number of leisure flights within Canada [M ¼ 3.079(.142)], against flights outside of Canada [M ¼ 1.679 (.187)] andInternational flights originating or terminating in Canada[M ¼ 2.238 (.193)] significant differences between these groupswere demonstrated F(2, 1210) ¼ 33.300, p < .001. The majority ofthe sample reported flights inside of Canada, followed by Inter-national flights (originating or terminating in Canada), with theleast number of flights occurring outside of Canada (originatingand terminating in another country). This indicates that oursample was primarily familiar with security measures employed inCanadian airports.
4.2. Procedure
The data were collected using an online survey that includedmultiple questionnaire items (20 of which were included in thefinal measurement model). In the current study, respondents pro-vided ratings for standard (including X-ray and metal detectorscans) and elevated risk (enhanced body pat-downs, full-bodyscans and strip-searches) security measures on several differentscales. For each of these measures, respondents rated how effectiveeach screening measure was at increasing their feeling of personalsafety when traveling, as well as the extent to which these mea-sures constituted a threat to human dignity. Additionally, theyprovided an assessment of their future enplanement intentionsgiven the continued use of each measure.
4.3. Data analysis
The data were analyzed using a structural equation modeling(SEM) approach with AMOS version 20 software. The models testedin this analysis were covariance models which used multiple in-dicator variables to represent each latent factor. The analysis fol-lowed the two-step procedure suggested by Anderson and Gerbing(1988) and Hatcher (1994). The first step in this procedure involvesthe development of a measurement model using confirmatoryfactor analysis (CFA) to assess convergent and discriminant validity.In the second step, this model was modified into two full structuralequation models to investigate the relations among the notedexogenous and endogenous constructs. These models were thentested for goodness of fit (GOF).
Generally, GOF is indicated using the chi-square test, whichexamines the comparability of the proposed (theoretical) modeland the independence model (which assumes no relationshipsbetween any of the constructs) (Bollen, 1989). It should be notedthat the chi-square statistic must be non-significant for the modelto be considered to exhibit GOF. However, the chi-square testassumes multivariate normality, and is highly sensitive to samplesize, often demonstrating significance for larger samples regard-less of good model fit. Therefore, to avoid model rejection whenthe fit is acceptable; the chi-square test is often presented withother GOF indices that are unbiased by sample size (Hox andBechger, 1998). The primary index often reported is the relativechi-square, which is the ratio of chi-square to its degrees offreedom (c2/c2df). In general, a value equal to or less than 3 in-dicates acceptable model fit (Marsh et al., 2004), however, largercriterions (e.g., 5 or less) have also been suggested (Marsh andHocevar, 1985).
In the current study, we reported three incremental fit indicesfor each of the models. These indices compare the hypothesizedmodel against a baseline uncorrelated factors model, and examinethe proportionate improvement in fit when transitioned to thetheoretical model. These indices included, the CFI (comparative fitindex), the NFI (normed fit index), and TLI (TuckereLewis index).The CFI was selected because it is unaffected by sample size, andis routinely reported (Gerbing and Anderson, 1993). The TLI wasalso included because it includes a correction for modelcomplexity. It is recommended that CFI, NFI and TLI all havevalues exceeding .90 for fit to be considered acceptable (Bentler,1990). Also included, were two absolute fit indices; whichassess how well the hypothesized model reproduces the sampledata; the SRMR (standardized root mean square residual) and theRMSEA (root mean square error of approximation). Unlike theincremental fit indices, lower values are indicative of better modelfit, with 0 indicating perfect fit (Hu and Bentler, 1999). It is sug-gested that the SRMR and RMSEA be less than .08 for model fit tobe considered adequate.
D. Alards-Tomalin et al. / Journal of Air Transport Management 37 (2014) 60e68 63
4.4. Measured and latent variables
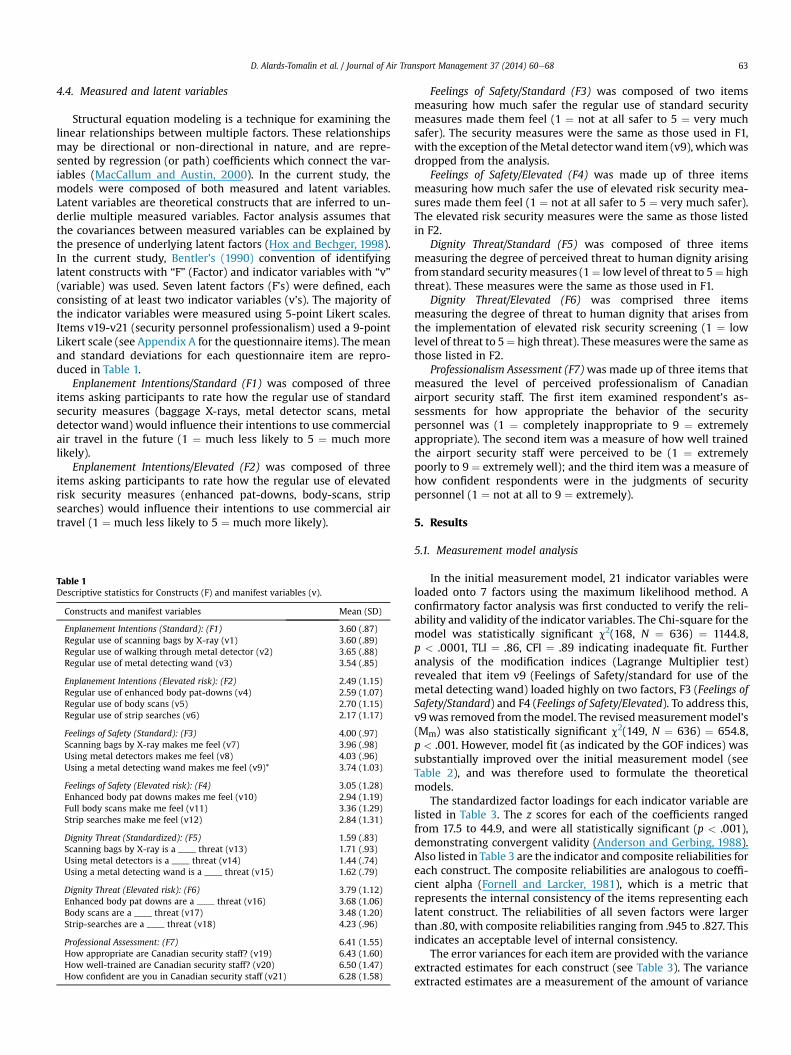
Structural equation modeling is a technique for examining thelinear relationships between multiple factors. These relationshipsmay be directional or non-directional in nature, and are repre-sented by regression (or path) coefficients which connect the var-iables (MacCallum and Austin, 2000). In the current study, themodels were composed of both measured and latent variables.Latent variables are theoretical constructs that are inferred to un-derlie multiple measured variables. Factor analysis assumes thatthe covariances between measured variables can be explained bythe presence of underlying latent factors (Hox and Bechger, 1998).In the current study, Bentler’s (1990) convention of identifyinglatent constructs with “F” (Factor) and indicator variables with “v”(variable) was used. Seven latent factors (F’s) were defined, eachconsisting of at least two indicator variables (v’s). The majority ofthe indicator variables were measured using 5-point Likert scales.Items v19-v21 (security personnel professionalism) used a 9-pointLikert scale (see Appendix A for the questionnaire items). The meanand standard deviations for each questionnaire item are repro-duced in Table 1.
Enplanement Intentions/Standard (F1) was composed of threeitems asking participants to rate how the regular use of standardsecurity measures (baggage X-rays, metal detector scans, metaldetector wand) would influence their intentions to use commercialair travel in the future (1 ¼ much less likely to 5 ¼ much morelikely).
Enplanement Intentions/Elevated (F2) was composed of threeitems asking participants to rate how the regular use of elevatedrisk security measures (enhanced pat-downs, body-scans, stripsearches) would influence their intentions to use commercial airtravel (1 ¼ much less likely to 5 ¼ much more likely).
Table 1Descriptive statistics for Constructs (F) and manifest variables (v).
Constructs and manifest variables Mean (SD)
Enplanement Intentions (Standard): (F1) 3.60 (.87)Regular use of scanning bags by X-ray (v1) 3.60 (.89)Regular use of walking through metal detector (v2) 3.65 (.88)Regular use of metal detecting wand (v3) 3.54 (.85)
Enplanement Intentions (Elevated risk): (F2) 2.49 (1.15)Regular use of enhanced body pat-downs (v4) 2.59 (1.07)Regular use of body scans (v5) 2.70 (1.15)Regular use of strip searches (v6) 2.17 (1.17)
Feelings of Safety (Standard): (F3) 4.00 (.97)Scanning bags by X-ray makes me feel (v7) 3.96 (.98)Using metal detectors makes me feel (v8) 4.03 (.96)Using a metal detecting wand makes me feel (v9)* 3.74 (1.03)
Feelings of Safety (Elevated risk): (F4) 3.05 (1.28)Enhanced body pat downs makes me feel (v10) 2.94 (1.19)Full body scans make me feel (v11) 3.36 (1.29)Strip searches make me feel (v12) 2.84 (1.31)
Dignity Threat (Standardized): (F5) 1.59 (.83)Scanning bags by X-ray is a ____ threat (v13) 1.71 (.93)Using metal detectors is a ____ threat (v14) 1.44 (.74)Using a metal detecting wand is a ____ threat (v15) 1.62 (.79)
Dignity Threat (Elevated risk): (F6) 3.79 (1.12)Enhanced body pat downs are a ____ threat (v16) 3.68 (1.06)Body scans are a ____ threat (v17) 3.48 (1.20)Strip-searches are a ____ threat (v18) 4.23 (.96)
Professional Assessment: (F7) 6.41 (1.55)How appropriate are Canadian security staff? (v19) 6.43 (1.60)How well-trained are Canadian security staff? (v20) 6.50 (1.47)How confident are you in Canadian security staff (v21) 6.28 (1.58)
Feelings of Safety/Standard (F3) was composed of two itemsmeasuring how much safer the regular use of standard securitymeasures made them feel (1 ¼ not at all safer to 5 ¼ very muchsafer). The security measures were the same as those used in F1,with the exception of theMetal detectorwand item (v9), whichwasdropped from the analysis.
Feelings of Safety/Elevated (F4) was made up of three itemsmeasuring how much safer the use of elevated risk security mea-sures made them feel (1 ¼ not at all safer to 5 ¼ very much safer).The elevated risk security measures were the same as those listedin F2.
Dignity Threat/Standard (F5) was composed of three itemsmeasuring the degree of perceived threat to human dignity arisingfrom standard securitymeasures (1¼ low level of threat to 5¼ highthreat). These measures were the same as those used in F1.
Dignity Threat/Elevated (F6) was comprised three itemsmeasuring the degree of threat to human dignity that arises fromthe implementation of elevated risk security screening (1 ¼ lowlevel of threat to 5¼ high threat). Thesemeasures were the same asthose listed in F2.
Professionalism Assessment (F7)was made up of three items thatmeasured the level of perceived professionalism of Canadianairport security staff. The first item examined respondent’s as-sessments for how appropriate the behavior of the securitypersonnel was (1 ¼ completely inappropriate to 9 ¼ extremelyappropriate). The second item was a measure of how well trainedthe airport security staff were perceived to be (1 ¼ extremelypoorly to 9 ¼ extremely well); and the third itemwas a measure ofhow confident respondents were in the judgments of securitypersonnel (1 ¼ not at all to 9 ¼ extremely).
5. Results
5.1. Measurement model analysis
In the initial measurement model, 21 indicator variables wereloaded onto 7 factors using the maximum likelihood method. Aconfirmatory factor analysis was first conducted to verify the reli-ability and validity of the indicator variables. The Chi-square for themodel was statistically significant c2(168, N ¼ 636) ¼ 1144.8,p < .0001, TLI ¼ .86, CFI ¼ .89 indicating inadequate fit. Furtheranalysis of the modification indices (Lagrange Multiplier test)revealed that item v9 (Feelings of Safety/standard for use of themetal detecting wand) loaded highly on two factors, F3 (Feelings ofSafety/Standard) and F4 (Feelings of Safety/Elevated). To address this,v9was removed from themodel. The revisedmeasurementmodel’s(Mm) was also statistically significant c2(149, N ¼ 636) ¼ 654.8,p < .001. However, model fit (as indicated by the GOF indices) wassubstantially improved over the initial measurement model (seeTable 2), and was therefore used to formulate the theoreticalmodels.
The standardized factor loadings for each indicator variable arelisted in Table 3. The z scores for each of the coefficients rangedfrom 17.5 to 44.9, and were all statistically significant (p < .001),demonstrating convergent validity (Anderson and Gerbing, 1988).Also listed in Table 3 are the indicator and composite reliabilities foreach construct. The composite reliabilities are analogous to coeffi-cient alpha (Fornell and Larcker, 1981), which is a metric thatrepresents the internal consistency of the items representing eachlatent construct. The reliabilities of all seven factors were largerthan .80, with composite reliabilities ranging from .945 to .827. Thisindicates an acceptable level of internal consistency.
The error variances for each item are provided with the varianceextracted estimates for each construct (see Table 3). The varianceextracted estimates are a measurement of the amount of variance
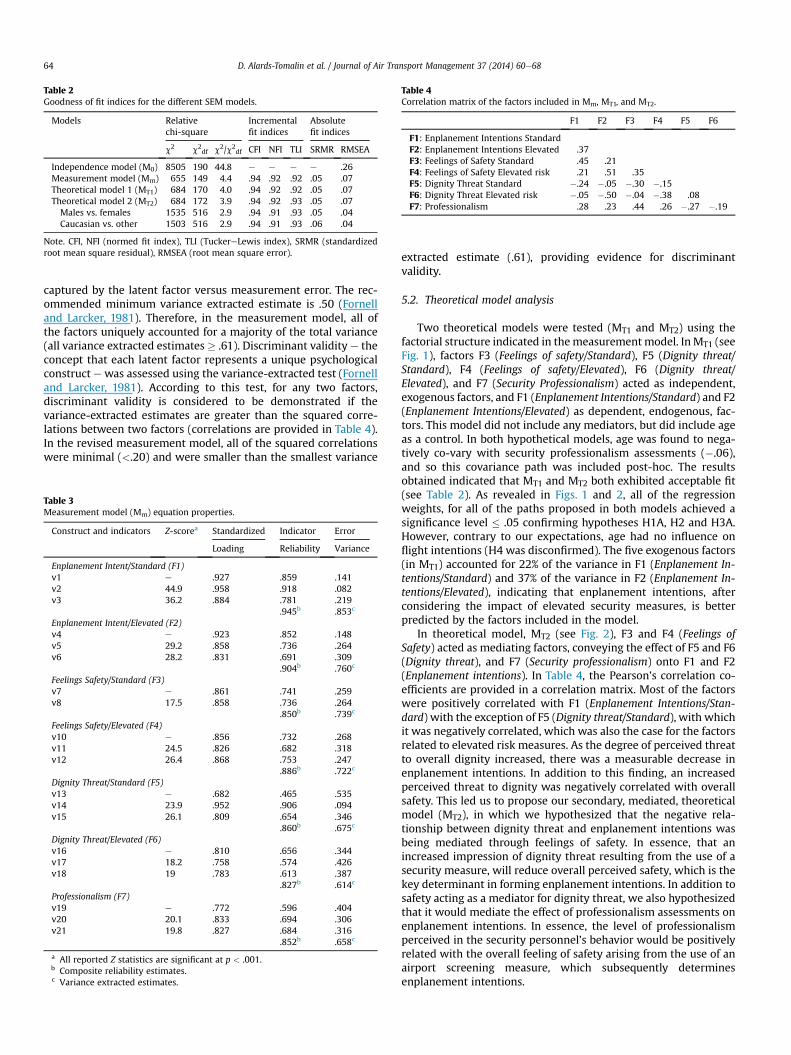
Table 4Correlation matrix of the factors included in Mm, MT1, and MT2.
F1 F2 F3 F4 F5 F6
F1: Enplanement Intentions StandardF2: Enplanement Intentions Elevated .37F3: Feelings of Safety Standard .45 .21F4: Feelings of Safety Elevated risk .21 .51 .35F5: Dignity Threat Standard �.24 �.05 �.30 �.15F6: Dignity Threat Elevated risk �.05 �.50 �.04 �.38 .08F7: Professionalism .28 .23 .44 .26 �.27 �.19
Table 2Goodness of fit indices for the different SEM models.
Models Relativechi-square
Incrementalfit indices
Absolutefit indices
c2 c2df c2/c2df CFI NFI TLI SRMR RMSEA
Independence model (M0) 8505 190 44.8 e e e e .26Measurement model (Mm) 655 149 4.4 .94 .92 .92 .05 .07Theoretical model 1 (MT1) 684 170 4.0 .94 .92 .92 .05 .07Theoretical model 2 (MT2) 684 172 3.9 .94 .92 .93 .05 .07Males vs. females 1535 516 2.9 .94 .91 .93 .05 .04Caucasian vs. other 1503 516 2.9 .94 .91 .93 .06 .04
Note. CFI, NFI (normed fit index), TLI (TuckereLewis index), SRMR (standardizedroot mean square residual), RMSEA (root mean square error).
D. Alards-Tomalin et al. / Journal of Air Transport Management 37 (2014) 60e6864
captured by the latent factor versus measurement error. The rec-ommended minimum variance extracted estimate is .50 (Fornelland Larcker, 1981). Therefore, in the measurement model, all ofthe factors uniquely accounted for a majority of the total variance(all variance extracted estimates � .61). Discriminant validity e theconcept that each latent factor represents a unique psychologicalconstruct ewas assessed using the variance-extracted test (Fornelland Larcker, 1981). According to this test, for any two factors,discriminant validity is considered to be demonstrated if thevariance-extracted estimates are greater than the squared corre-lations between two factors (correlations are provided in Table 4).In the revised measurement model, all of the squared correlationswere minimal (<.20) and were smaller than the smallest variance
Table 3Measurement model (Mm) equation properties.
Construct and indicators Z-scorea Standardized Indicator Error
Loading Reliability Variance
Enplanement Intent/Standard (F1)v1 e .927 .859 .141v2 44.9 .958 .918 .082v3 36.2 .884 .781 .219
.945b .853c
Enplanement Intent/Elevated (F2)v4 e .923 .852 .148v5 29.2 .858 .736 .264v6 28.2 .831 .691 .309
.904b .760c
Feelings Safety/Standard (F3)v7 e .861 .741 .259v8 17.5 .858 .736 .264
.850b .739c
Feelings Safety/Elevated (F4)v10 e .856 .732 .268v11 24.5 .826 .682 .318v12 26.4 .868 .753 .247
.886b .722c
Dignity Threat/Standard (F5)v13 e .682 .465 .535v14 23.9 .952 .906 .094v15 26.1 .809 .654 .346
.860b .675c
Dignity Threat/Elevated (F6)v16 e .810 .656 .344v17 18.2 .758 .574 .426v18 19 .783 .613 .387
.827b .614c
Professionalism (F7)v19 e .772 .596 .404v20 20.1 .833 .694 .306v21 19.8 .827 .684 .316
.852b .658c
a All reported Z statistics are significant at p < .001.b Composite reliability estimates.c Variance extracted estimates.
extracted estimate (.61), providing evidence for discriminantvalidity.
5.2. Theoretical model analysis
Two theoretical models were tested (MT1 and MT2) using thefactorial structure indicated in themeasurementmodel. In MT1 (seeFig. 1), factors F3 (Feelings of safety/Standard), F5 (Dignity threat/Standard), F4 (Feelings of safety/Elevated), F6 (Dignity threat/Elevated), and F7 (Security Professionalism) acted as independent,exogenous factors, and F1 (Enplanement Intentions/Standard) and F2(Enplanement Intentions/Elevated) as dependent, endogenous, fac-tors. This model did not include any mediators, but did include ageas a control. In both hypothetical models, age was found to nega-tively co-vary with security professionalism assessments (�.06),and so this covariance path was included post-hoc. The resultsobtained indicated that MT1 and MT2 both exhibited acceptable fit(see Table 2). As revealed in Figs. 1 and 2, all of the regressionweights, for all of the paths proposed in both models achieved asignificance level � .05 confirming hypotheses H1A, H2 and H3A.However, contrary to our expectations, age had no influence onflight intentions (H4 was disconfirmed). The five exogenous factors(in MT1) accounted for 22% of the variance in F1 (Enplanement In-tentions/Standard) and 37% of the variance in F2 (Enplanement In-tentions/Elevated), indicating that enplanement intentions, afterconsidering the impact of elevated security measures, is betterpredicted by the factors included in the model.
In theoretical model, MT2 (see Fig. 2), F3 and F4 (Feelings ofSafety) acted as mediating factors, conveying the effect of F5 and F6(Dignity threat), and F7 (Security professionalism) onto F1 and F2(Enplanement intentions). In Table 4, the Pearson’s correlation co-efficients are provided in a correlation matrix. Most of the factorswere positively correlated with F1 (Enplanement Intentions/Stan-dard) with the exception of F5 (Dignity threat/Standard), with whichit was negatively correlated, which was also the case for the factorsrelated to elevated risk measures. As the degree of perceived threatto overall dignity increased, there was a measurable decrease inenplanement intentions. In addition to this finding, an increasedperceived threat to dignity was negatively correlated with overallsafety. This led us to propose our secondary, mediated, theoreticalmodel (MT2), in which we hypothesized that the negative rela-tionship between dignity threat and enplanement intentions wasbeing mediated through feelings of safety. In essence, that anincreased impression of dignity threat resulting from the use of asecurity measure, will reduce overall perceived safety, which is thekey determinant in forming enplanement intentions. In addition tosafety acting as a mediator for dignity threat, we also hypothesizedthat it would mediate the effect of professionalism assessments onenplanement intentions. In essence, the level of professionalismperceived in the security personnel’s behavior would be positivelyrelated with the overall feeling of safety arising from the use of anairport screening measure, which subsequently determinesenplanement intentions.
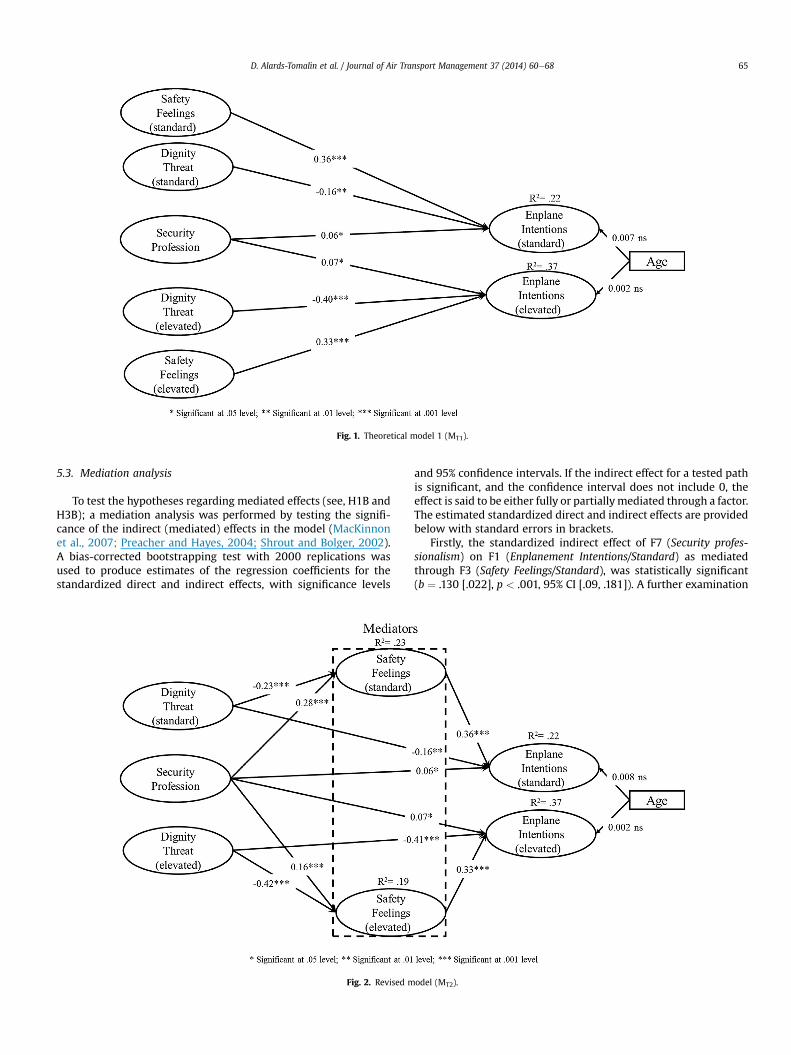
Fig. 1. Theoretical model 1 (MT1).
D. Alards-Tomalin et al. / Journal of Air Transport Management 37 (2014) 60e68 65
5.3. Mediation analysis
To test the hypotheses regarding mediated effects (see, H1B andH3B); a mediation analysis was performed by testing the signifi-cance of the indirect (mediated) effects in the model (MacKinnonet al., 2007; Preacher and Hayes, 2004; Shrout and Bolger, 2002).A bias-corrected bootstrapping test with 2000 replications wasused to produce estimates of the regression coefficients for thestandardized direct and indirect effects, with significance levels
Fig. 2. Revised m
and 95% confidence intervals. If the indirect effect for a tested pathis significant, and the confidence interval does not include 0, theeffect is said to be either fully or partiallymediated through a factor.The estimated standardized direct and indirect effects are providedbelow with standard errors in brackets.
Firstly, the standardized indirect effect of F7 (Security profes-sionalism) on F1 (Enplanement Intentions/Standard) as mediatedthrough F3 (Safety Feelings/Standard), was statistically significant(b ¼ .130 [.022], p < .001, 95% CI [.09, .181]). A further examination
odel (MT2).
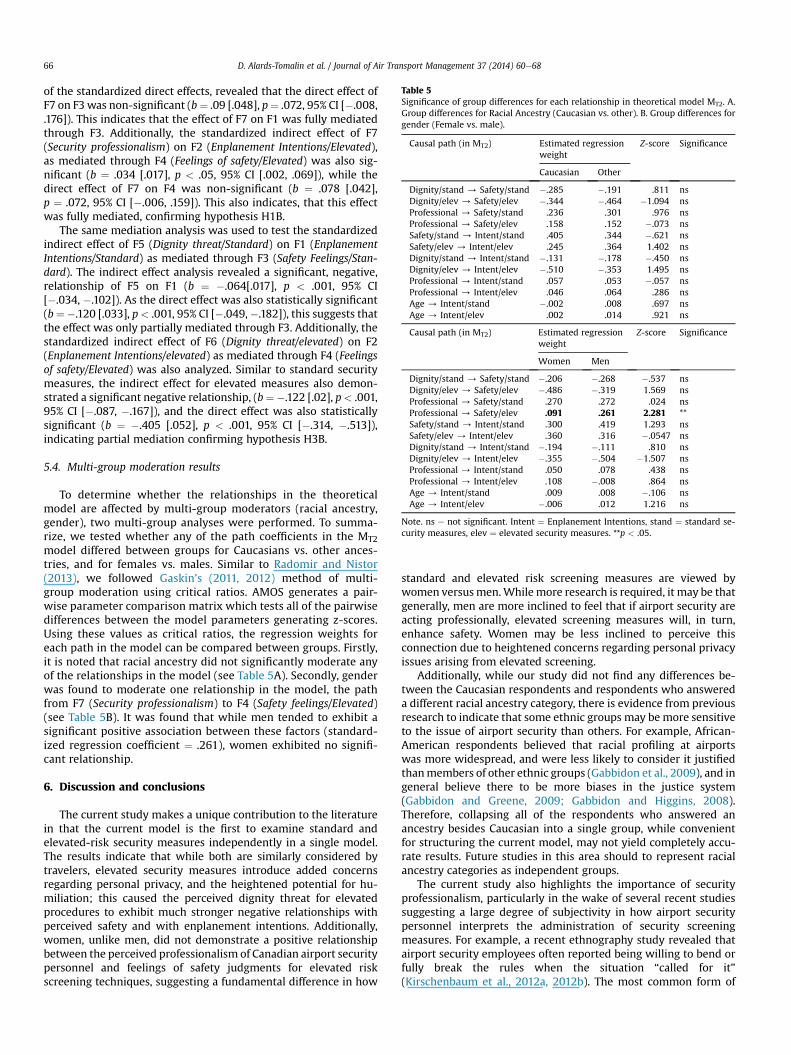
Table 5Significance of group differences for each relationship in theoretical model MT2. A.Group differences for Racial Ancestry (Caucasian vs. other). B. Group differences forgender (Female vs. male).
Causal path (in MT2) Estimated regressionweight
Z-score Significance
Caucasian Other
Dignity/stand / Safety/stand �.285 �.191 .811 nsDignity/elev / Safety/elev �.344 �.464 �1.094 nsProfessional / Safety/stand .236 .301 .976 nsProfessional / Safety/elev .158 .152 �.073 nsSafety/stand / Intent/stand .405 .344 �.621 nsSafety/elev / Intent/elev .245 .364 1.402 nsDignity/stand / Intent/stand �.131 �.178 �.450 nsDignity/elev / Intent/elev �.510 �.353 1.495 nsProfessional / Intent/stand .057 .053 �.057 nsProfessional / Intent/elev .046 .064 .286 nsAge / Intent/stand �.002 .008 .697 nsAge / Intent/elev .002 .014 .921 ns
Causal path (in MT2) Estimated regressionweight
Z-score Significance
Women Men
Dignity/stand / Safety/stand �.206 �.268 �.537 nsDignity/elev / Safety/elev �.486 �.319 1.569 nsProfessional / Safety/stand .270 .272 .024 nsProfessional / Safety/elev .091 .261 2.281 **Safety/stand / Intent/stand .300 .419 1.293 nsSafety/elev / Intent/elev .360 .316 �.0547 nsDignity/stand / Intent/stand �.194 �.111 .810 nsDignity/elev / Intent/elev �.355 �.504 �1.507 nsProfessional / Intent/stand .050 .078 .438 nsProfessional / Intent/elev .108 �.008 .864 nsAge / Intent/stand .009 .008 �.106 nsAge / Intent/elev �.006 .012 1.216 ns
Note. ns e not significant. Intent ¼ Enplanement Intentions, stand ¼ standard se-curity measures, elev ¼ elevated security measures. **p < .05.
D. Alards-Tomalin et al. / Journal of Air Transport Management 37 (2014) 60e6866
of the standardized direct effects, revealed that the direct effect ofF7 on F3was non-significant (b¼ .09 [.048], p¼ .072, 95% CI [�.008,.176]). This indicates that the effect of F7 on F1 was fully mediatedthrough F3. Additionally, the standardized indirect effect of F7(Security professionalism) on F2 (Enplanement Intentions/Elevated),as mediated through F4 (Feelings of safety/Elevated) was also sig-nificant (b ¼ .034 [.017], p < .05, 95% CI [.002, .069]), while thedirect effect of F7 on F4 was non-significant (b ¼ .078 [.042],p ¼ .072, 95% CI [�.006, .159]). This also indicates, that this effectwas fully mediated, confirming hypothesis H1B.
The same mediation analysis was used to test the standardizedindirect effect of F5 (Dignity threat/Standard) on F1 (EnplanementIntentions/Standard) as mediated through F3 (Safety Feelings/Stan-dard). The indirect effect analysis revealed a significant, negative,relationship of F5 on F1 (b ¼ �.064[.017], p < .001, 95% CI[�.034, �.102]). As the direct effect was also statistically significant(b¼�.120 [.033], p< .001, 95% CI [�.049,�.182]), this suggests thatthe effect was only partially mediated through F3. Additionally, thestandardized indirect effect of F6 (Dignity threat/elevated) on F2(Enplanement Intentions/elevated) as mediated through F4 (Feelingsof safety/Elevated) was also analyzed. Similar to standard securitymeasures, the indirect effect for elevated measures also demon-strated a significant negative relationship, (b¼�.122 [.02], p< .001,95% CI [�.087, �.167]), and the direct effect was also statisticallysignificant (b ¼ �.405 [.052], p < .001, 95% CI [�.314, �.513]),indicating partial mediation confirming hypothesis H3B.
5.4. Multi-group moderation results
To determine whether the relationships in the theoreticalmodel are affected by multi-group moderators (racial ancestry,gender), two multi-group analyses were performed. To summa-rize, we tested whether any of the path coefficients in the MT2model differed between groups for Caucasians vs. other ances-tries, and for females vs. males. Similar to Radomir and Nistor(2013), we followed Gaskin’s (2011, 2012) method of multi-group moderation using critical ratios. AMOS generates a pair-wise parameter comparison matrix which tests all of the pairwisedifferences between the model parameters generating z-scores.Using these values as critical ratios, the regression weights foreach path in the model can be compared between groups. Firstly,it is noted that racial ancestry did not significantly moderate anyof the relationships in the model (see Table 5A). Secondly, genderwas found to moderate one relationship in the model, the pathfrom F7 (Security professionalism) to F4 (Safety feelings/Elevated)(see Table 5B). It was found that while men tended to exhibit asignificant positive association between these factors (standard-ized regression coefficient ¼ .261), women exhibited no signifi-cant relationship.
6. Discussion and conclusions
The current study makes a unique contribution to the literaturein that the current model is the first to examine standard andelevated-risk security measures independently in a single model.The results indicate that while both are similarly considered bytravelers, elevated security measures introduce added concernsregarding personal privacy, and the heightened potential for hu-miliation; this caused the perceived dignity threat for elevatedprocedures to exhibit much stronger negative relationships withperceived safety and with enplanement intentions. Additionally,women, unlike men, did not demonstrate a positive relationshipbetween the perceived professionalism of Canadian airport securitypersonnel and feelings of safety judgments for elevated riskscreening techniques, suggesting a fundamental difference in how
standard and elevated risk screening measures are viewed bywomen versusmen.While more research is required, it may be thatgenerally, men are more inclined to feel that if airport security areacting professionally, elevated screening measures will, in turn,enhance safety. Women may be less inclined to perceive thisconnection due to heightened concerns regarding personal privacyissues arising from elevated screening.
Additionally, while our study did not find any differences be-tween the Caucasian respondents and respondents who answereda different racial ancestry category, there is evidence from previousresearch to indicate that some ethnic groups may be more sensitiveto the issue of airport security than others. For example, African-American respondents believed that racial profiling at airportswas more widespread, and were less likely to consider it justifiedthanmembers of other ethnic groups (Gabbidon et al., 2009), and ingeneral believe there to be more biases in the justice system(Gabbidon and Greene, 2009; Gabbidon and Higgins, 2008).Therefore, collapsing all of the respondents who answered anancestry besides Caucasian into a single group, while convenientfor structuring the current model, may not yield completely accu-rate results. Future studies in this area should to represent racialancestry categories as independent groups.
The current study also highlights the importance of securityprofessionalism, particularly in the wake of several recent studiessuggesting a large degree of subjectivity in how airport securitypersonnel interprets the administration of security screeningmeasures. For example, a recent ethnography study revealed thatairport security employees often reported being willing to bend orfully break the rules when the situation “called for it”(Kirschenbaum et al., 2012a, 2012b). The most common form of
D. Alards-Tomalin et al. / Journal of Air Transport Management 37 (2014) 60e68 67
reported injustice experienced when dealing with people in a po-sition of administrative powere in general e involves disrespectfultreatment (Lupfer et al., 2000; Mikula, 1986). However, when oneaspect of justice is retained, people tend to perceive their treatmentas having been fair. For example, an unfavorable proceduraloutcome e such as being randomly selected for elevated securityscreening e can still result in satisfaction as long as interpersonaltreatment (i.e., procedural justice) is perceived as satisfactory(Skarlicki and Folger, 1997). As Hasisi and Weisburd (2011), and theresults of the current study demonstrated, perceived safety e afactor that is highly important in determining satisfaction, and inturn enplanement intentions (Gilbert and Wong, 2003) e isdirectly, negatively impacted by increased feelings of humiliation,or dignity threat, an important consideration for airport securitypersonnel training.
Additionally, there is good reason to believe that intentions arein fact predictive of behavior (Manski, 1990), for example, votingintentions have been used to successfully predict the outcomes ofelections (Turner and Martin, 1984), while it has long been knownthat surveys on buying intentions can successfully predict futurepurchasing behavior (Juster, 1966). Similarly, attitudes and socialnorms, in addition to behavioral intentions have been used tosuccessfully predict overt behavior using basic path models(Fishbein and Ajzen, 1975; Ajzen and Fishbein, 1980). As a result,enplanement intentions may be a good indicator of airplane ticketpurchasing behaviors, however, this will need to be furtheraddressed.
This study exhibited a number of major limitations. Firstly, asmentioned above, the questionnaire was administered to a sampleof undergraduate university students causing the sample to berelatively homogeneous in both age and education-level. Secondly,the current study did not distinguish between different passengersub-groups, for instance frequent versus infrequent flyers; orbusiness from leisure flyers. Since themodel was developed using astudent sample, where the majority of the flights were intended forleisure purposes, it is therefore possible that this model may not bevalid for business travelers. As previous studies have shown, busi-ness travelers appear to place less emphasis on overall safety thanleisure travelers (Ringle et al., 2011), these travelers should beinvestigated as separate groups.
Thirdly, it should be noted that the questionnaire was generallyworded, and did not directly tap into the respondent’s first-handexperiences with airport security measures. It may be the casethat these assessments are also being influenced by second-handsources of information (e.g., stories heard from friends/family,news reports), and that their reactions, based on these second-hand sources, is more extreme than would have occurred fromfirsthand experience. A study by Gilovich (1987) found, forinstance, that participants subjected to second-hand informationabout a target person tended to have more extreme ratings of thatperson’s attributes than participants receiving information first-hand. Additionally, listeners in general do not tend to weigh situ-ational information very heavily when forming second-hand im-pressions (Inman et al., 1993). Therefore, it is possible that negativesecond-hand information heard about airport security measuresmay cause assessments towards these measures to be moreextreme than firsthand knowledge. One method around this issuewould be for future studies validating this, or similar models, to usesamples that have just passed through security screening.
Lastly, there were a number of other variables that were notfactored into the current model that may also be impactingenplanement intentions. Financial losses incurred from decreasedairline ticket sales were substantial in the past decade e a loss of$49.1 billion dollars in revenue (International Air Transport, 2009)e and are likely the result of numerous complex, interacting factors,
including economic downturns paired with the rising price ofairline tickets and the increased use of communication technology(e.g., teleconferencing, social media websites). Future research inthis area should consider that these, in addition to dignity andsafety concerns, will also significantly impact enplanementintentions.
Authors’ note
We are grateful to Alexandra Smith for assisting with data entry.Funding for her assistance was provided by the University ofManitoba’s Psychology Undergraduate Research Experience (PURE)award. We would also like to thank Cam Huynh and Clove Havivafor their helpful feedback on earlier versions of this manuscript.
Appendix A
Enplanement intentions
Rate the degree to which regular use of each of the followingmeasures would influence your decision to participate in future airtravel (1 ¼ much less likely to 5 ¼ much more likely):
Feelings of safety
Rate the degree to which each of the following measures makesyou feel safe (1 ¼ not at all safer to 5 ¼ very much safer).
Dignity threat
¼Rate the degree to which each of the following measuresconstitutes a threat to human dignity (1low threat to 5 ¼ highthreat)
(1) Passenger bags are scanned by X-ray.(2) Passengers walk through a metal detector.(3) A metal detecting wand is used on passengers.(4) Enhanced hand-to-body pat-downs are used on passengers.(5) Full body scans.(6) Strip searches are used on passengers.
Professionalism
(1) Overall, I think behaviors of security personnel at Canadianairports are _____ (1 ¼ completely inappropriate to9 ¼ extremely appropriate)
(2) Overall, I think security personnel at Canadian airportsare ______ trained (1 ¼ extremely poorly to 9 ¼ extremelywell)
(3) Overall, I think I am _____ confident about the judgmentsmade by security personnel at Canadian airports (1 ¼ not atall to 9 ¼ extremely)
References
Ajzen, I., Fishbein, M., 1980. Understanding Attitudes and Predicting Social Behavior.Prentice-Hall, Englewood Cliffs, NJ.
Anderson, J.C., Gerbing, D.W., 1988. Structural equation modeling in practice: areview and recommended two-step approach. Psychol. Bull. 103, 411e423.
Bentler, P.M., 1990. Comparative fit indexes in structural models. Psychol. Bull. 107,238e246.
Bollen, K.A., 1989. Structural Equations with Latent Variables. Wiley, New York.Boussadia, K., 2009. The evolution of airport screening technology. Biom. Technol.
Today 17, 7e8.Brown, C.H., 1983. Asymptotic comparison of missing data procedures for esti-
mating factor loadings. Psychometrika 48, 269e292.
D. Alards-Tomalin et al. / Journal of Air Transport Management 37 (2014) 60e6868
Carter, R.L., 2006. Solutions for missing data in structural equation modeling. Res.Pract. Assess. 1, 1e6.
Fishbein, M., Ajzen, I., 1975. Belief, Attitude, Intention, and Behavior: an Introduc-tion to Theory and Research. Addison-Wesley, Reading MA.
Fornell, C., Larcker, D.F., 1981. Evaluating structural equation models with unob-servable variables and measurement error. J. Mark. Res. 18, 39e50.
Gabbidon, S.L., Greene, H.T., 2009. Race and Crime, second ed. Sage, Thousand Oaks,CA.
Gabbidon, S.L., Higgins, G.E., 2008. Profiling white Americans: a research note on“shopping while white. In: Lynch, M.J., Patterson, E.B., Childs, K. (Eds.), RacialDivide: Race, Ethnicity and Criminal Justice. Criminal Justice Press, Monsey, NY.
Gabbidon, S.L., Penn, E.B., Jordan, K.L., Higgins, G.E., 2009. The influence of race/ethnicity on the perceived prevalence and support for racial profiling at air-ports. Crim. Justice Policy Rev. 20, 344e358.
Gaskin, J., 2011. Multigroup Moderation in Amos e Made Easy. Retrieved fromGaskination’s statistics: http://youtube.com/Gaskination (accessed 20.01.14.).
Gaskin, J., 2012. Group Differences. Retrieved from Stats Tools Package: http://statwiki.kolobkreations.com (accessed 20.01.14.).
Gerbing, D.W., Anderson, J.C., 1993. Monte Carlo Evaluations of Goodness-of-fitIndices for Structural Equation Models, vol. 154. SAGE Focus Editions, p. 40.
Gilbert, D., Wong, R.K.C., 2003. Passenger expectations and airline services: a HongKong based study. Tour. Manag. 24, 519e532.
Gilovich, T., 1987. Secondhand information and social judgment. J. Exp. Soc. Psychol.23, 59e74.
Gkritza, K., Niemeier, D., Mannering, F., 2006. Airport security screening andchanging passenger satisfaction: an exploratory assessment. J. Air Transp.Manag. 12, 213e219.
Hasisi, B., Weisburd, D., 2011. Going beyond ascribed identities: the importance ofprocedural justice in airport security screening in Israel. Law Soc. Rev. 45, 867e892.
Hatcher, L., 1994. A Step-by-step Approach to Using SAS for Factor Analysis andStructural Equation Modeling. SAS Institute Inc, Cary.
Hox, J.J., Bechger, T.M., 1998. An introduction to structural equation modeling. Fam.Sci. Rev. 11, 354e373.
Hu, L., Bentler, P.M., 1999. Cutoff criteria for fit indexes in covariance structureanalysis: conventional criteria versus new alternatives. Struct. Equ. Model. 6, 1e55.
Inman, M.L., Reichl, A.J., Baron, R.S., 1993. Do we tell less than we know or hear lessthan we are told? Exploring the teller-listener extremity effect. J. Exp. Soc.Psychol. 29, 528e550.
International Air Transport Association, 2009. US $5.6 Billion Loss in 2010 e LowYields and Rising Costs Keep Industry in the Red, Press Release no.55, Montreal,December 15. Available online at: www.iata.org/pressroom/pr/2009-12-15-01.htm.
Johnson, M.S., Garbino, E., Sivadas, E., 2006. Influences of customer differences ofloyalty, perceived risk and category experience on customer satisfaction ratings.Int. J. Mark. Res. 48, 601e622.
Juster, T., 1966. Consumer buying intentions and purchase probability: an experi-ment in survey design. J. Am. Stat. Assoc. 61, 658e696.
Kirschenbaum, A., Mariani, M., Gulijk, C.V., Lubasz, S., Rapaport, C., Andriessen, H.,2012a. Airport security: an ethnographic study. J. Air Transp. Manag. 18, 68e73.
Kirschenbaum, A., Rapaport, C., Lubasz, S., Mariani, M., Gulijk, C.V., Andriessen, H.,2012b. Security profiling of airport employees: complying with the rules.Airport Manag. 6, 373e380.
Lupfer, M.B., Weeks, K.P., Doan, K.A., Houston, D.A., 2000. Folk conceptions of fair-ness and unfairness. Eur. J. Soc. Psychol. 30, 299e346.
MacCallum, R.C., Austin, J.T., 2000. Applications of structural equation modeling inpsychological research. Annu. Rev. Psychol. 51, 201e226.
MacKinnon, D.P., Fairchild, A.J., Fitz, M.S., 2007. Mediation analysis. Annu. Rev.Psychol. 58, 593.
Manski, C.F., 1990. The use of intentions data to predict behavior: a best-caseanalysis. J. Am. Stat. Assoc. 85, 934e940.
Marsh, H.W., Hocevar, D., 1985. Application of confirmatory factor analysis to thestudy of self-concept: first and higher order factor models and their invarianceacross groups. Psychol. Bull. 97, 562.
Marsh, H.W., Hau, K.T., Wen, Z., 2004. In search of golden rules: comment on hy-pothesis testing approaches to setting cutoff values for fit indexes and dangersin over-generalizing Hu & Bentler’s (1999) findings. Struct. Equ. Model. 11, 320e341.
Mikula, G., 1986. The experience of injustice: toward a better understanding of itsphenomenology. In: Bierhoff, H.W., Cohen, R.L., Greenberg, J. (Eds.), Justice inSocial Relations. Plenum, New York, pp. 103e124.
Mitchener-Nissen, T., Bowers, K., Chetty, K., 2012. Public attitudes to airport secu-rity: the case of whole body scanners. Secur. J. 25, 229e243.
O’Malley, P., 2006. Risks, ethics, and airport security. Can. J. Criminol. Crim. Justice48, 413e421.
Persico, N., Todd, P.E., 2005. Passenger profiling, imperfect screening and airportsecurity. Am. Econ. Rev. 95, 127e131.
Preacher, K.J., Hayes, A.F., 2004. SPSS and SAS procedures for estimating indirecteffects in simple mediation models. Behav. Res. Methods, Instrum. Comput. 36,717e731.
Radomir, L., Nistor, V.C., 2013. An application of technology acceptance model tointernet banking services. In: International Conference “Marketing e from In-formation to Decision”, vol. 6, pp. 251e266.
Ringle, C.M., Sarstedt, M., Zimmermann, L., 2011. Customer satisfaction with com-mercial airlines: the role of perceived safety and purpose of travel. J. Mark.Theory Pract. 19, 459e472.
Rubin, D.B., 1976. Inference and missing data. Biometrika 61, 581e592.Sindhav, B., Holland, J., Rodie, A.R., Adidam, P.T., Pol, L.G., 2006. The impact of
perceived fairness on satisfaction: are airport security measures fair? Does itmatter? J. Mark. Theory Pract. 14, 323e335.
Shrout, P.E., Bolger, N., 2002. Mediation in experimental and nonexperimentalstudies: new procedures and recommendations. Psychol. Methods 7, 422.
Skarlicki, D.P., Folger, R., 1997. Retaliation in the workplace: the roles of distributive,procedural, and interactional justice. J. Appl. Psychol. 82, 434e443.
Squalli, J., Saad, M., 2006. Accidents, airline safety perceptions and consumer de-mand. J. Econ. Financ. 30, 297e305.
Travel Industry Association of America Research Department, United States Bureauof Transportation Statistics, November 15, 2002. TIA/BTS Air Travel Survey Re-sults. Travel Industry Association of America.
Turner, C., Martin, E., 1984. Surveying Subjective Phenomena, vol. 1. Russell SageFoundation, New York.
Related Documents