AIRNow and AIRNow-Tech Dianne S. Miller and Natalie M. LaGuardia Sonoma Technology, Inc. Petaluma, California Presented to: Annual Region 9 EPA/Tribal Conference Pala, California October, 2011 910216-4140

Welcome message from author
This document is posted to help you gain knowledge. Please leave a comment to let me know what you think about it! Share it to your friends and learn new things together.
Transcript

AIRNow and AIRNow-Tech
Dianne S. Miller and Natalie M. LaGuardiaSonoma Technology, Inc.
Petaluma, California
Presented to:Annual Region 9 EPA/Tribal Conference
Pala, CaliforniaOctober, 2011
910216-4140

2
Outline• Overview of AIRNow• AIRNow-Tech
– About– Features– Case study analysis: Use of AIRNow-Tech during 2008
California wildfires• Related topics
– Air Quality Index (AQI)– Getting data into AIRNow– AIRNow mapping
• AIRNow-Tech Demonstration

33
Overview of AIRNow
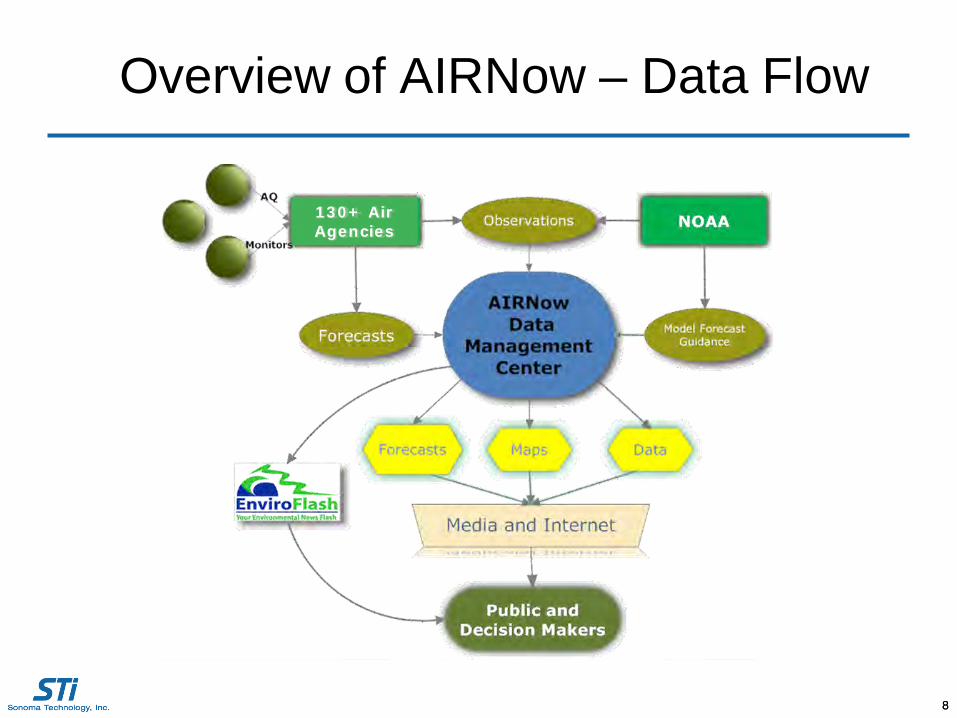
AIRNow provides a common framework for acquiring and distributing air quality information that• Fosters community effort among
tribal, federal, state, and local air quality agencies (130+)
• Collects, quality assures, and transfers real-time and forecasted air quality information to the public
• Communicates air quality via the AQI• Issues weather/air quality news stories• Enables partnerships with national
media• Provides air quality education and
outreach
44
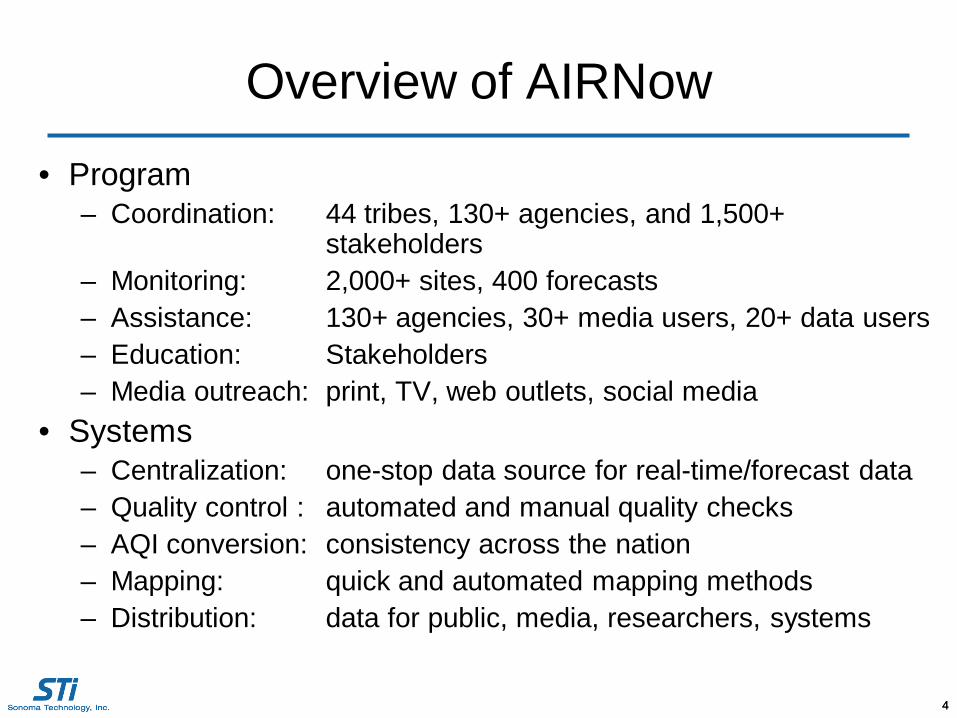
• Program– Coordination: 44 tribes, 130+ agencies, and 1,500+
stakeholders – Monitoring: 2,000+ sites, 400 forecasts– Assistance: 130+ agencies, 30+ media users, 20+ data users– Education: Stakeholders– Media outreach: print, TV, web outlets, social media
• Systems– Centralization: one-stop data source for real-time/forecast data– Quality control : automated and manual quality checks– AQI conversion: consistency across the nation– Mapping: quick and automated mapping methods– Distribution: data for public, media, researchers, systems
Overview of AIRNow
5
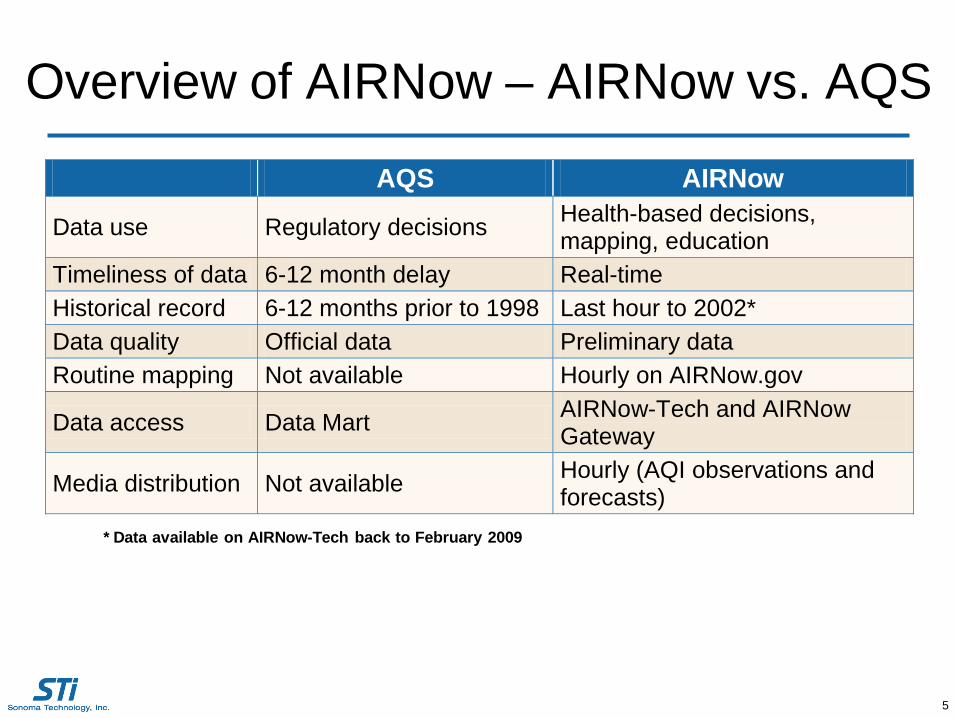
Overview of AIRNow – AIRNow vs. AQS
* Data available on AIRNow-Tech back to February 2009
AQS AIRNow
Data use Regulatory decisions Health-based decisions, mapping, education
Timeliness of data 6-12 month delay Real-time Historical record 6-12 months prior to 1998 Last hour to 2002* Data quality Official data Preliminary data Routine mapping Not available Hourly on AIRNow.gov
Data access Data Mart AIRNow-Tech and AIRNow Gateway
Media distribution Not available Hourly (AQI observations and forecasts)
666
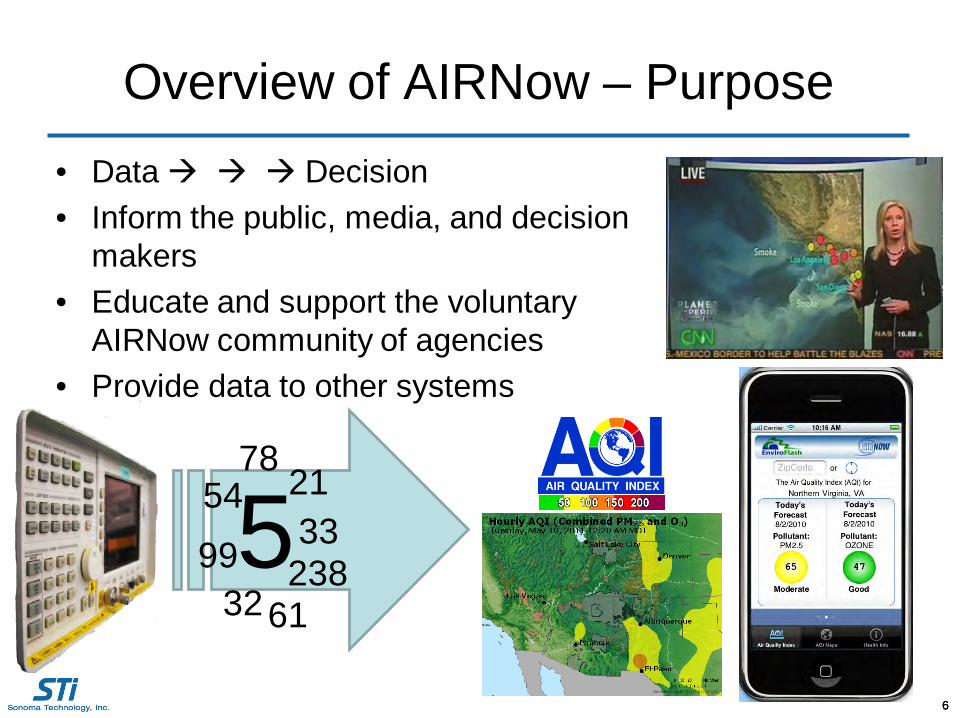
Overview of AIRNow – Purpose• Data Decision• Inform the public, media, and decision
makers• Educate and support the voluntary
AIRNow community of agencies• Provide data to other systems
55478
32
2133
2389961
77
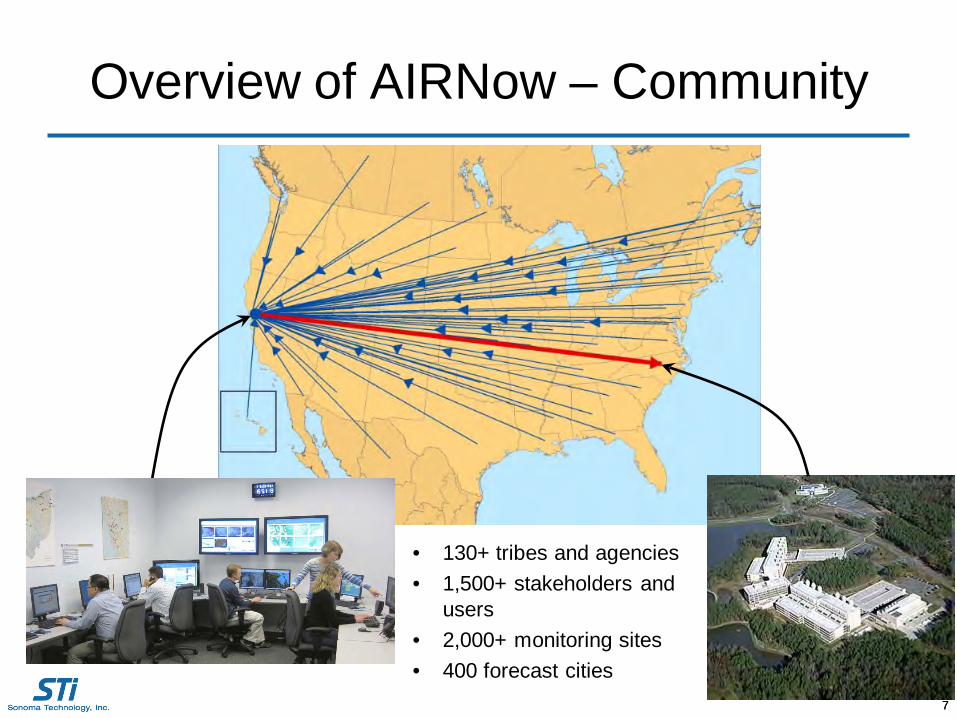
Overview of AIRNow – Community
• 130+ tribes and agencies• 1,500+ stakeholders and
users• 2,000+ monitoring sites• 400 forecast cities
88
Overview of AIRNow – Data Flow
130+ Air Agencies
9
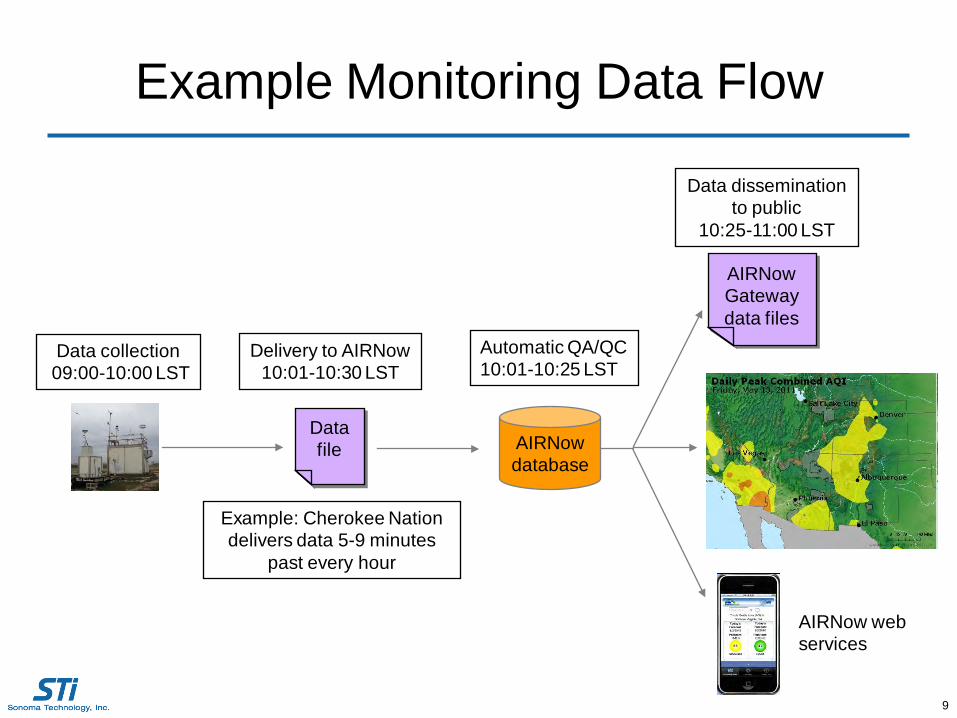
Example Monitoring Data Flow
Delivery to AIRNow10:01-10:30 LST
AIRNow database
Automatic QA/QC10:01-10:25 LST
Data collection09:00-10:00 LST
Data file
AIRNowGatewaydata files
AIRNow web services
Data dissemination to public
10:25-11:00 LST
Example: Cherokee Nation delivers data 5-9 minutes
past every hour
10
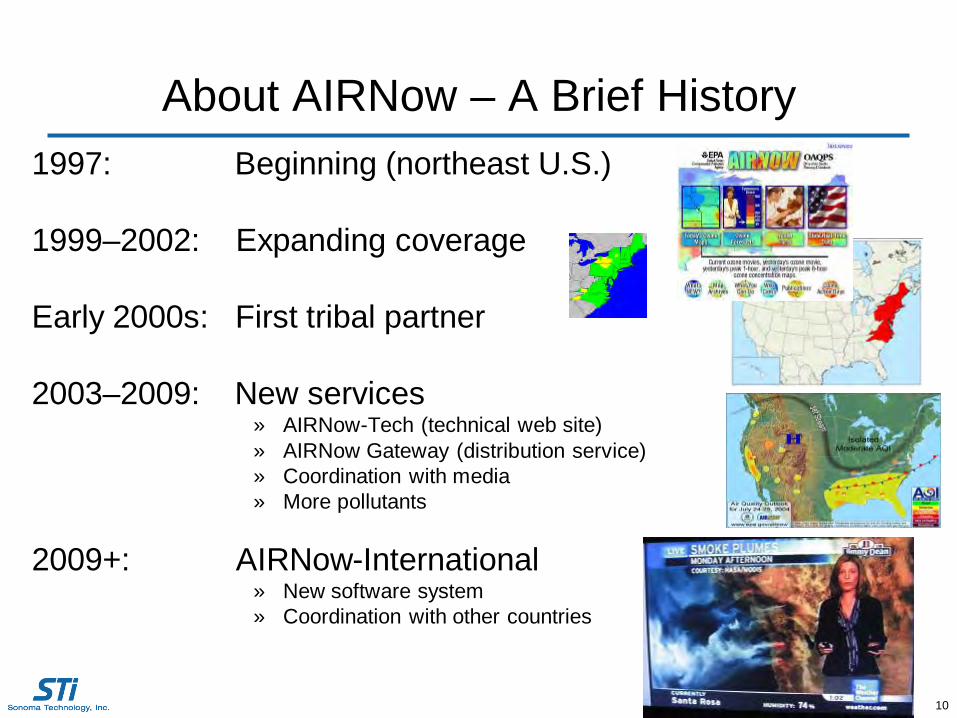
About AIRNow – A Brief History1997: Beginning (northeast U.S.)
1999–2002: Expanding coverage
Early 2000s: First tribal partner
2003–2009: New services» AIRNow-Tech (technical web site)» AIRNow Gateway (distribution service)» Coordination with media» More pollutants
2009+: AIRNow-International » New software system» Coordination with other countries
1111
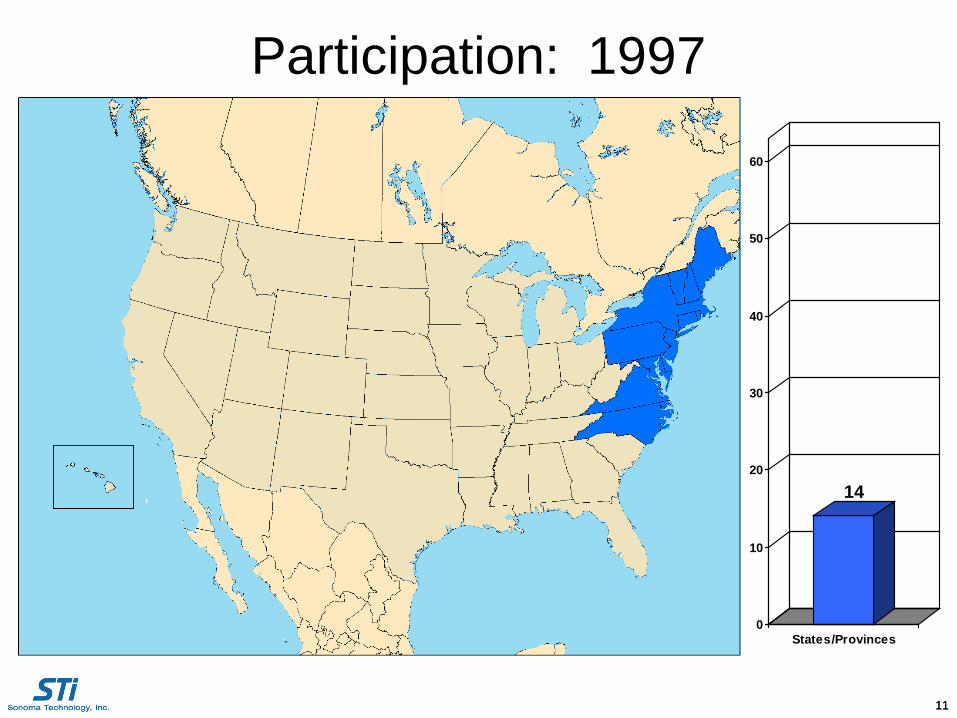
Participation: 1997
14
0
10
20
30
40
50
60
States/Provinces

1212
Participation: 1999
28
0
10
20
30
40
50
60
States/Provinces

1313
Participation: 2003
52
0
10
20
30
40
50
60
States/Provinces

1414
Participation: 200760
0
10
20
30
40
50
60
States/Provinces

1515
63
0
10
20
30
40
50
60
States/Provinces
Participation: 2010
Shanghai
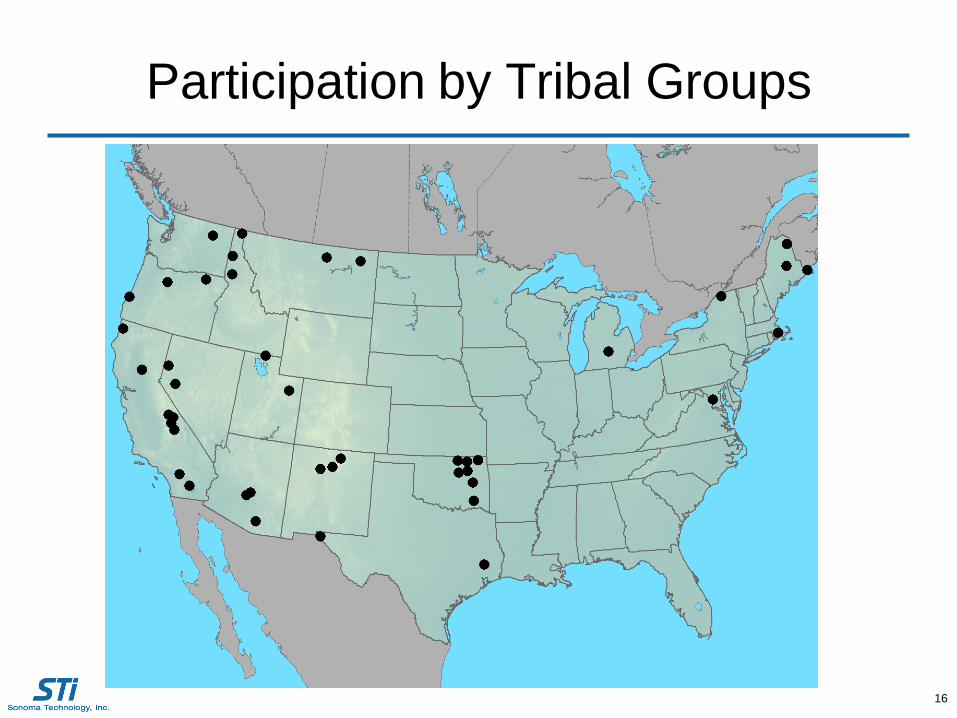
Participation by Tribal Groups
16

17
About AIRNow-Tech
AIRNowTech.org• Decision Support System –
management and analysis tool for the AIRNow Program
• GIS functions – HYSPLIT trajectory tool, satellite, and smoke products
• Data queries, personalized tools, preferences, and services
• Ability to view meteorological and air quality data
• Password-protected user accounts
Hazard Mapping System smoke plumes with forward HYSPLIT trajectories
18
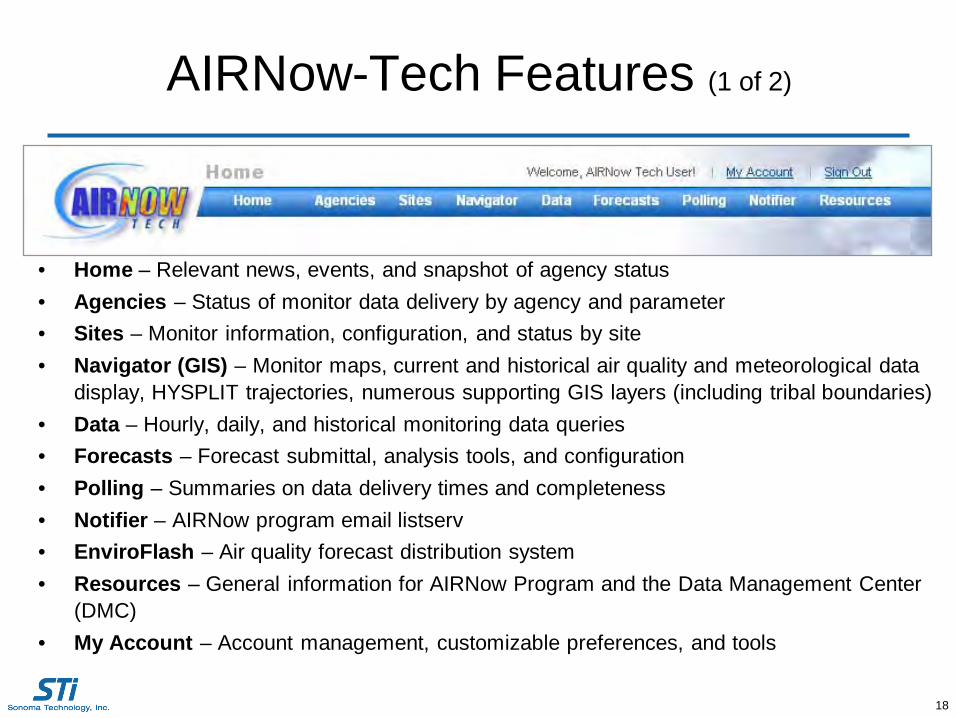
AIRNow-Tech Features (1 of 2)
• Home – Relevant news, events, and snapshot of agency status• Agencies – Status of monitor data delivery by agency and parameter• Sites – Monitor information, configuration, and status by site• Navigator (GIS) – Monitor maps, current and historical air quality and meteorological data
display, HYSPLIT trajectories, numerous supporting GIS layers (including tribal boundaries)• Data – Hourly, daily, and historical monitoring data queries• Forecasts – Forecast submittal, analysis tools, and configuration • Polling – Summaries on data delivery times and completeness• Notifier – AIRNow program email listserv• EnviroFlash – Air quality forecast distribution system• Resources – General information for AIRNow Program and the Data Management Center
(DMC)• My Account – Account management, customizable preferences, and tools
19
AIRNow-Tech Features (2 of 2)
• Query and export spreadsheets– Real-time and past hourly air quality data (PM2.5, PM10, O3, and
other pollutants) – Data summaries (e.g., days with AQI over 100)
• Create time-series plots of current and past hourly or daily air quality data
• Access real-time and past meteorological observations• Create and save GIS maps of
– Current or past observed AQ and meteorological conditions – HYSPLIT backward and forward trajectories at different heights– Hazard Mapping System smoke and fire locations and other layers
AIRNow-Tech tools for current or past event analysis
20
Case Study Analysis with AIRNow-Tech
• AIRNow-Tech was a key tool during the summer wildfires of 2008 in California
• Data flowed into AIRNow from mobile monitors that were deployed near fire locations
• Emergency response personnel used AIRNow-Tech to track air quality– Data queries– Navigator GIS
• HYSPLIT• Satellite-detected fire locations

21
AIRNow-Tech Navigator (1 of 3)
= Mobile Monitors
July 9, 2008, at 11 a.m. PST Hourly PM2.5 concentrations in µg/m³
22
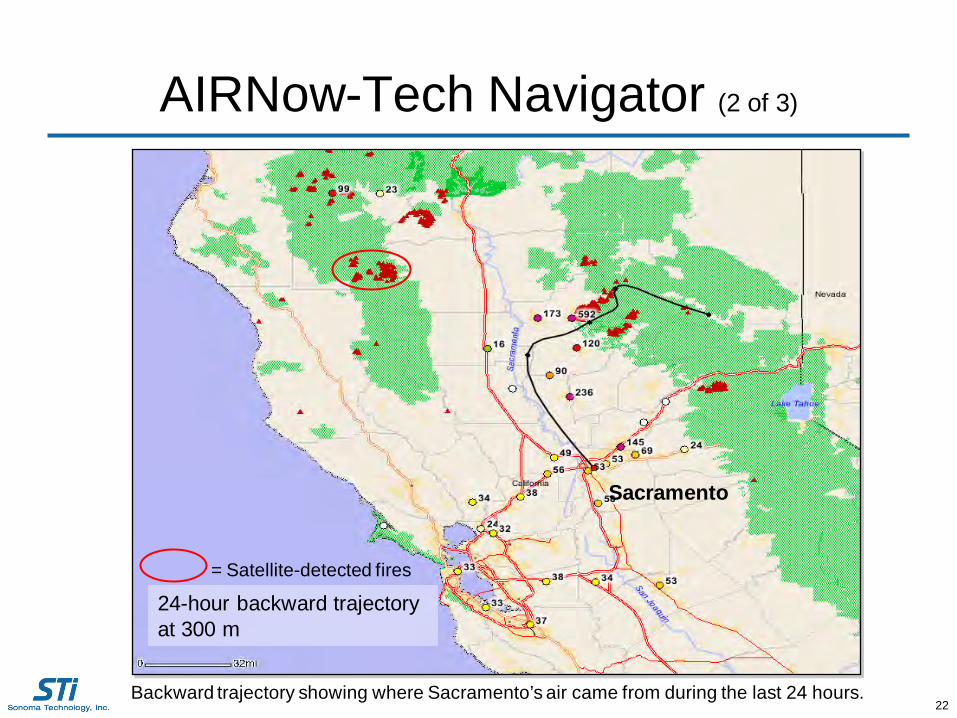
AIRNow-Tech Navigator (2 of 3)
24-hour backward trajectory at 300 m
Sacramento
= Satellite-detected fires
Backward trajectory showing where Sacramento’s air came from during the last 24 hours.
23
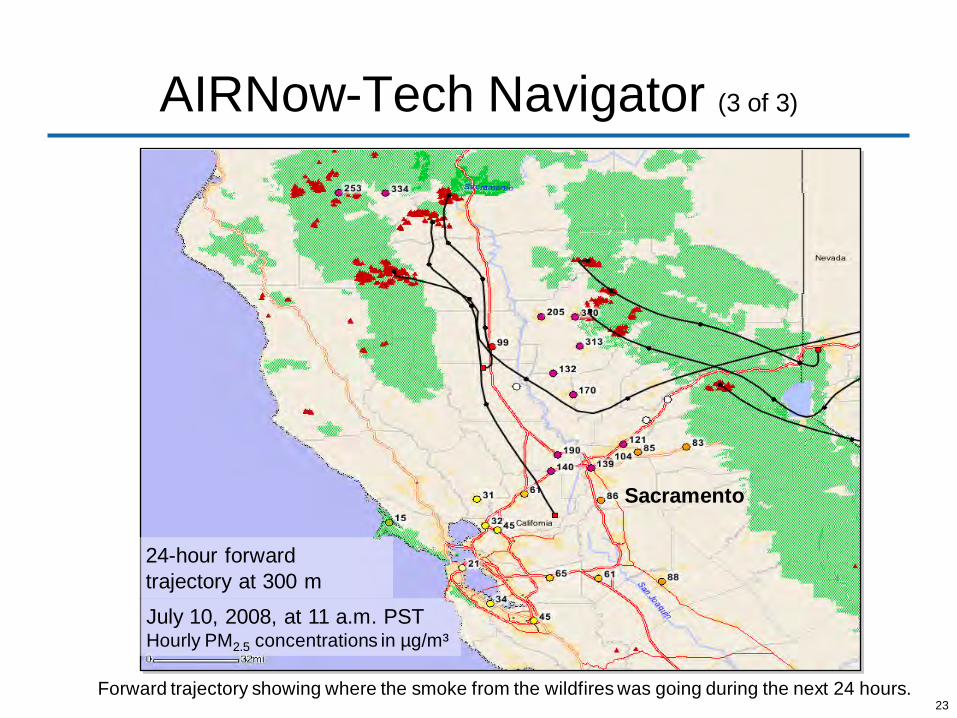
AIRNow-Tech Navigator (3 of 3)
Sacramento
July 10, 2008, at 11 a.m. PST Hourly PM2.5 concentrations in µg/m³
24-hour forward trajectory at 300 m
Forward trajectory showing where the smoke from the wildfires was going during the next 24 hours.
24
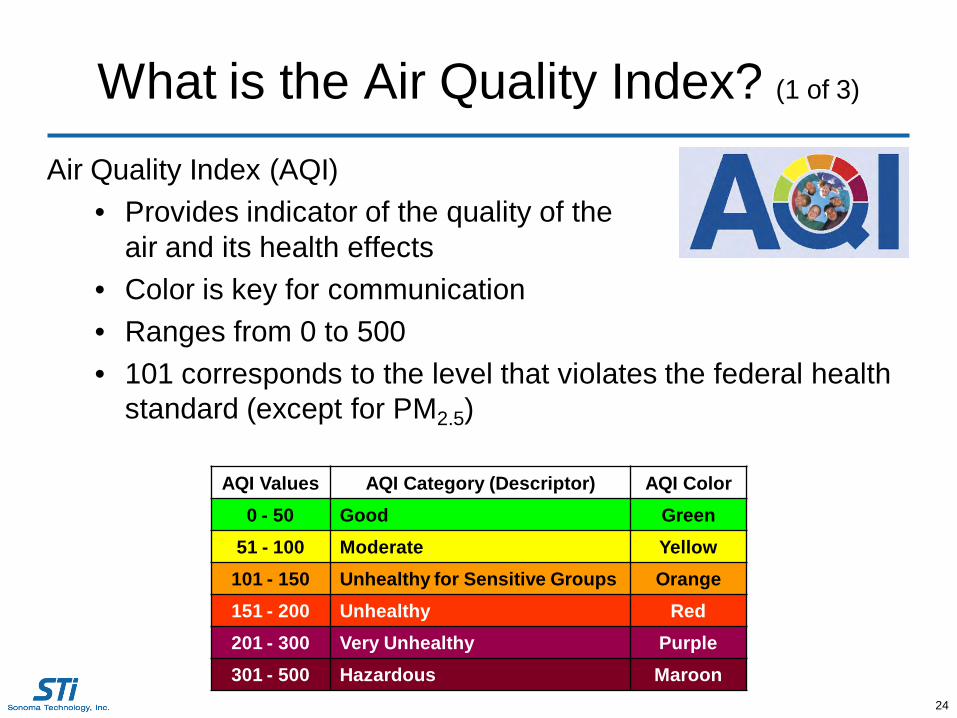
What is the Air Quality Index? (1 of 3)
Air Quality Index (AQI)• Provides indicator of the quality of the
air and its health effects• Color is key for communication• Ranges from 0 to 500• 101 corresponds to the level that violates the federal health
standard (except for PM2.5)
AQI Values AQI Category (Descriptor) AQI Color0 - 50 Good Green
51 - 100 Moderate Yellow101 - 150 Unhealthy for Sensitive Groups Orange151 - 200 Unhealthy Red201 - 300 Very Unhealthy Purple301 - 500 Hazardous Maroon

25
What is the Air Quality Index? (2 of 3)
Descriptors Cautionary StatementsGood 0 – 50
No message
Moderate 51 – 100
Moderate health concerns for unusually sensitive individuals
Unhealthy for Sensitive Groups101 – 150
Identifiable groups at risk – different groups for different pollutants
Unhealthy151 – 200
General public at risk; sensitive groups at greater risk
Very Unhealthy201 – 300
General public at greater risk; sensitive groups at greatest risk
Hazardous301 – 500
Health warnings of emergency conditions
NAAQS*
*National Ambient Air Quality Standard

26
AQI Values 8-hr Avg O3(ppm)
24-hr Avg PM10 (µg/m3)
24-hr Avg PM2.5(µg/m3)
0 - 50 0 – 0.059 0 – 54 0 – 15.4
51 - 100 0.06 – 0.075 55 – 154 15.5 – 35.4
101 - 150 0.076 – 0.095 155 – 254 35.5 – 65.4
151 - 200 0.096 – 0.115 255 – 354 65.5 – 150.4
201 - 300 0.116 – 0.374 355 – 424 150.5 – 250.4
301 - 500 Not defined 425 – 604 250.5 – 500.4
What is the Air Quality Index?AQI Breakpoints (3 of 3)
27
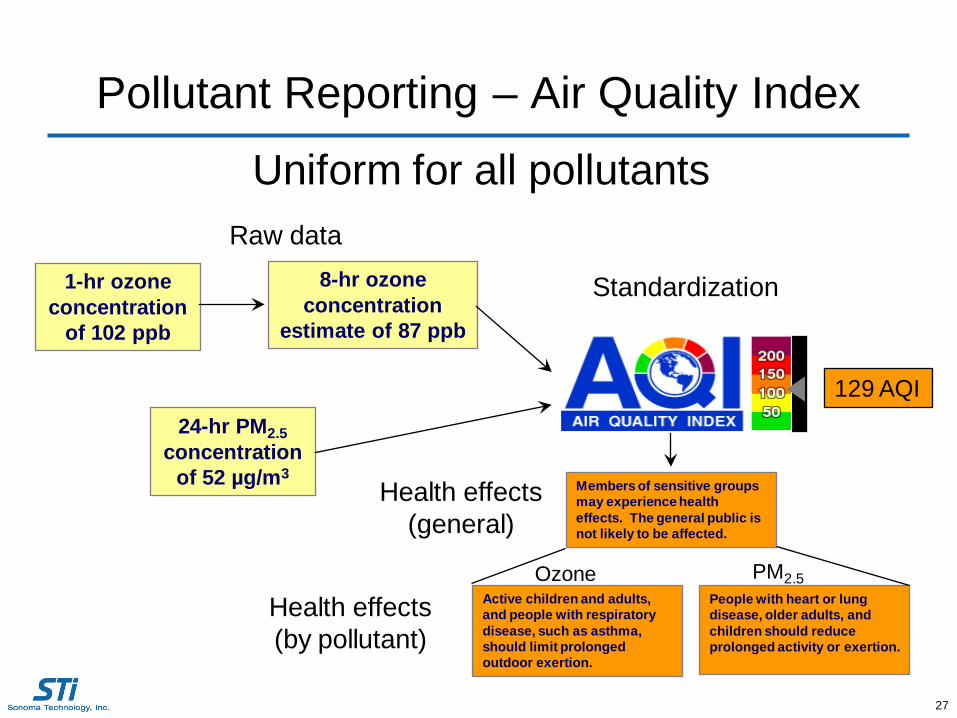
Pollutant Reporting – Air Quality Index
Uniform for all pollutants
1-hr ozone concentration
of 102 ppb
Active children and adults, and people with respiratory disease, such as asthma, should limit prolonged outdoor exertion.
Raw data8-hr ozone
concentration estimate of 87 ppb
Standardization
Health effects(general)
24-hr PM2.5concentration
of 52 µg/m3
129 AQI
People with heart or lung disease, older adults, and children should reduce prolonged activity or exertion.
Members of sensitive groups may experience health effects. The general public is not likely to be affected.
Ozone PM2.5
Health effects(by pollutant)

28
Getting Data into AIRNow
• Three ways to submit data to AIRNow– OBS file (phasing out)– XML file via Data Exchange Node– AQCSV file
• Details on each file format are available on the AIRNow-Tech Resources page
• Many data logger manufacturers have modules available to automatically create one or more of these formats

29
OBS Format
• Legacy format for data ingest into AIRNow• Why are we phasing it out?
– Difficult to program– No native support for
• Mobile monitors• Three-dimensional data
– Limited list of accepted parameters– No sub-hourly data– Applied only to North America– Difficult to use in mobile applications
30
AQCSV Format (1 of 2)
• Supports– AQS standards (parameter codes, POC)– Any AQS parameters– Speciated/lab data– Mobile monitors data (changing location)
• Allows for – Ingest of AQS data into AIRNow– Backfill of AQS certified data into AIRNow
when available– Bulk data updates– Support of international data exchange– Easy encoding and parsing of data
(Excel)

31
AQCSV Format (2 of 2)
• ISO Standards– Country codes (840 = USA)– Date and time
• AQS-Based– Parameter codes– Units codes
• Support for– AQS qualifier codes – Location information
• Latitude and longitude• Elevation and GIS datum
– Method codes– Measurement performance
characteristics (value and uncertainty)
32
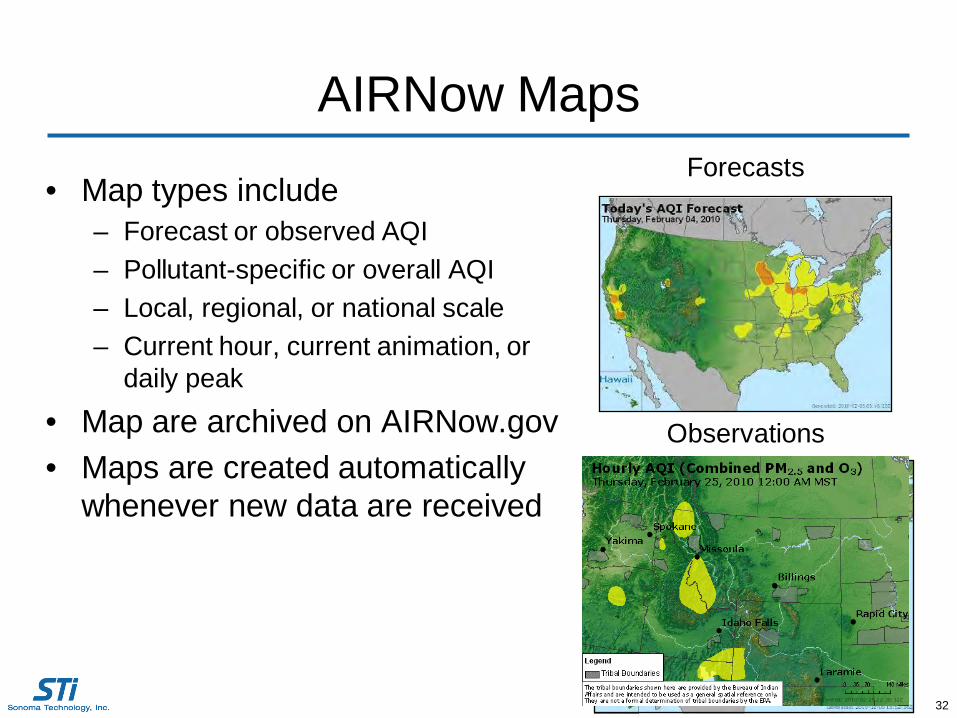
AIRNow Maps
• Map types include– Forecast or observed AQI– Pollutant-specific or overall AQI– Local, regional, or national scale– Current hour, current animation, or
daily peak
• Map are archived on AIRNow.gov• Maps are created automatically
whenever new data are received
Observations
Forecasts

33
AIRNow.gov – Current Air Quality Maps
Forecast mapsCurrent AQI mapsAQI AnimationCurrent OzoneCurrent PM2.5
Archive maps

34
AIRNow.gov – Archived Maps
Search archives by– Map type– Region– Month/year
35
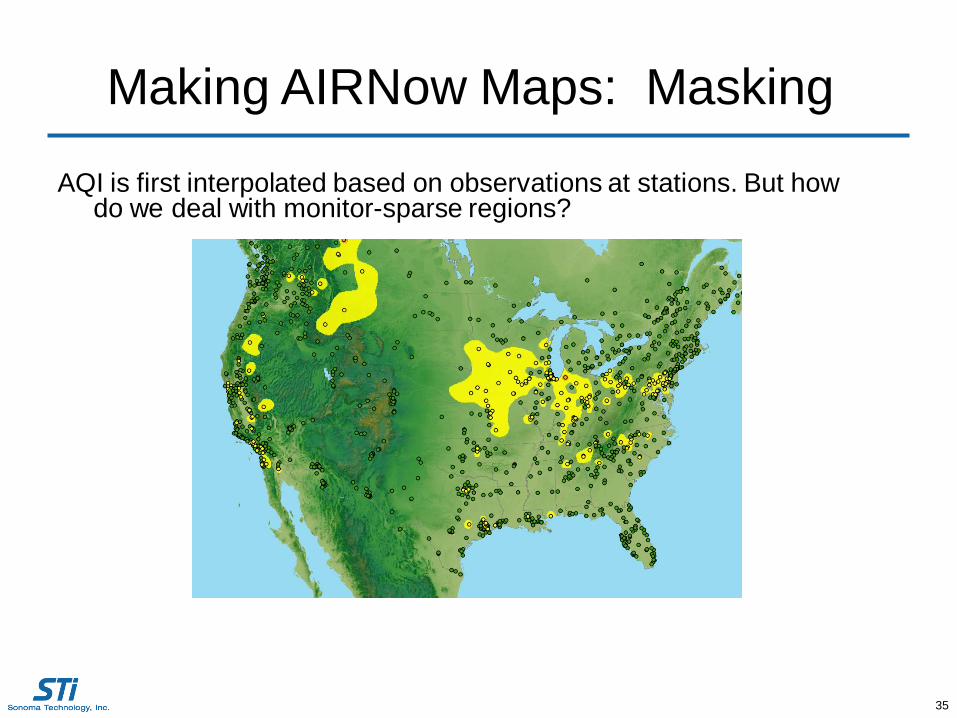
Making AIRNow Maps: Masking
AQI is first interpolated based on observations at stations. But how do we deal with monitor-sparse regions?

36
A mask is created to block out areas without sufficient monitoring.
Blue shading indicates masked areas
AIRNow Maps: Masking
37
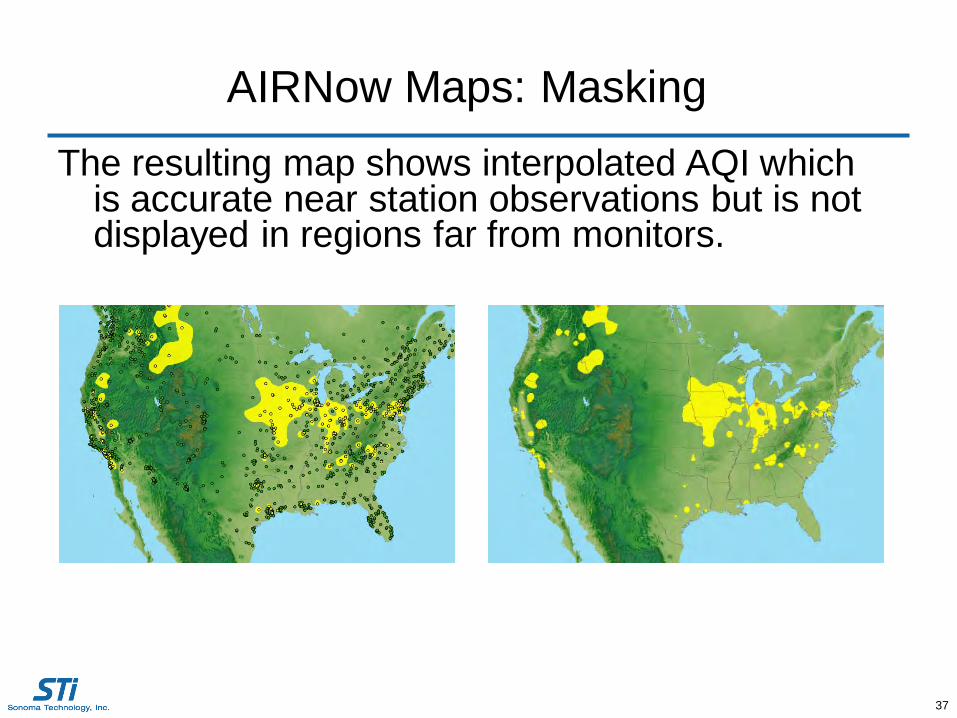
AIRNow Maps: MaskingThe resulting map shows interpolated AQI which
is accurate near station observations but is not displayed in regions far from monitors.
38
AIRNow-Tech Demonstration
• Site and monitor management• Performing data queries• Navigator GIS• Customizable preferences and tools in My Account
3939
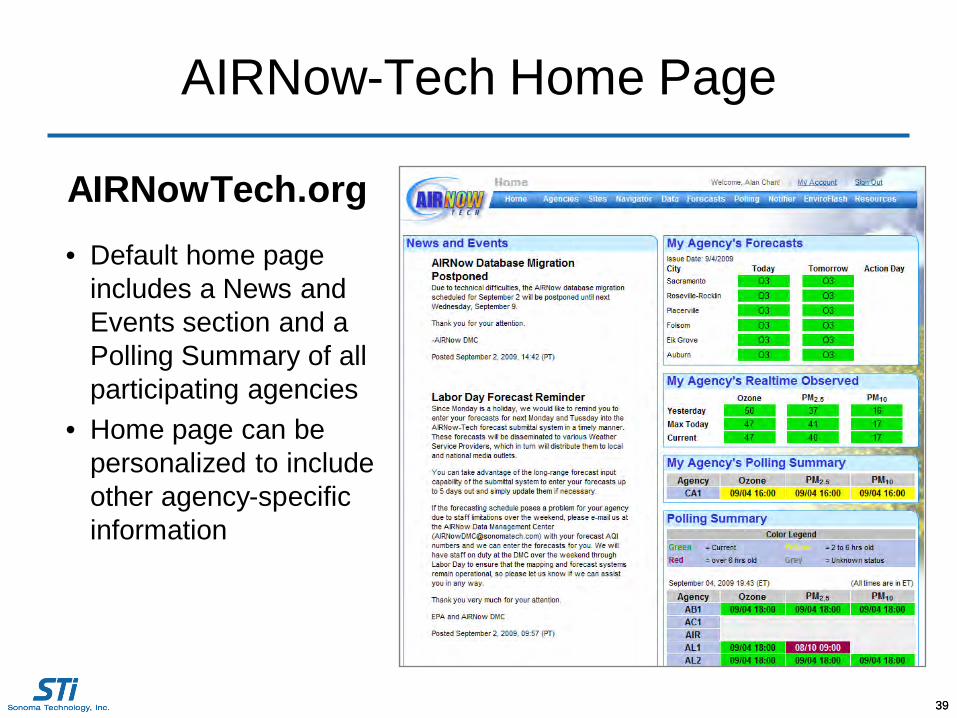
AIRNow-Tech Home Page
AIRNowTech.org• Default home page
includes a News and Events section and a Polling Summary of all participating agencies
• Home page can be personalized to include other agency-specific information
40
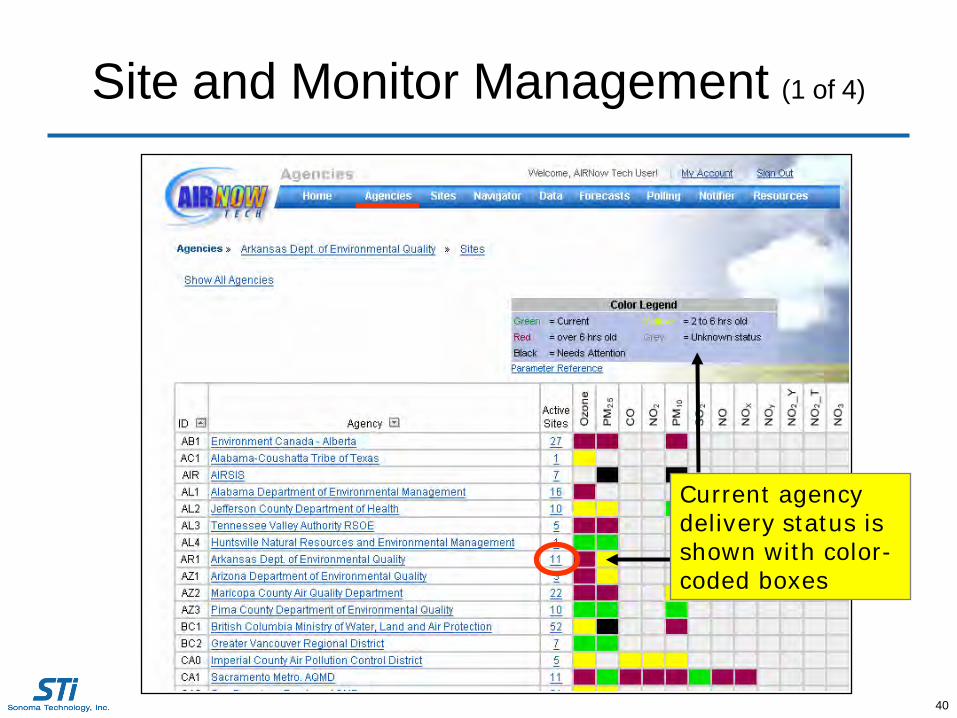
Site and Monitor Management (1 of 4)
Current agency delivery status is shown with color-coded boxes
41
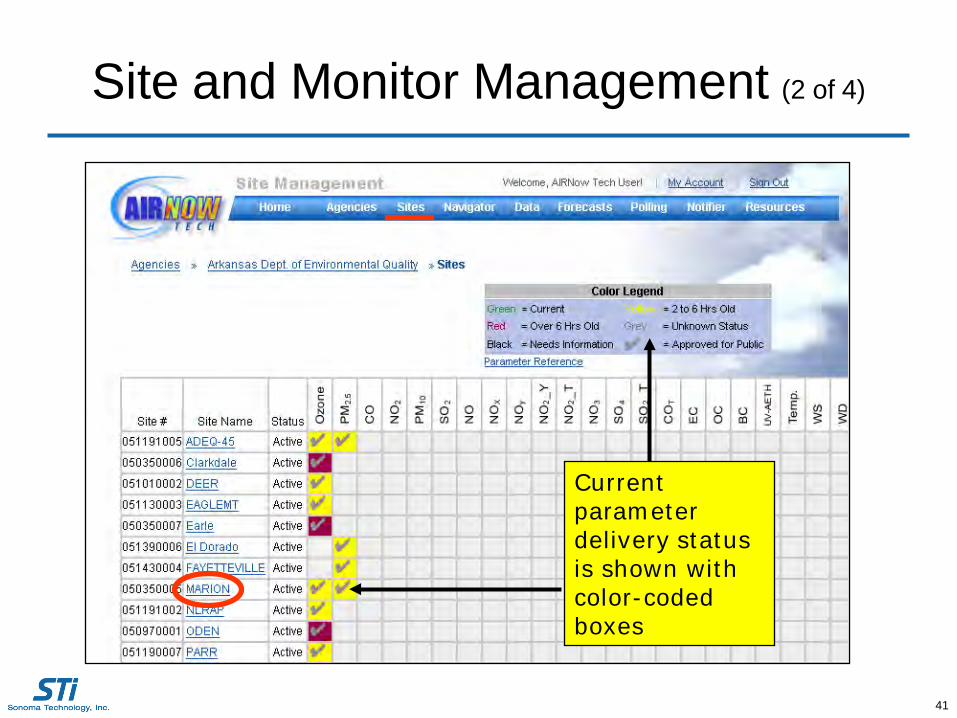
Site and Monitor Management (2 of 4)
Current parameter delivery status is shown with color-coded boxes

42
Site and Monitor Management (3 of 4)
Site status can be set to either Active or Inactive. Data from both Active and Inactive sites undergo QC and can be queried using AIRNow-Tech. However, only data from Active sites are used to produce maps and other AQI reporting products.
Easily toggle through your agency’s sites by using the drop-downmenu.
Edit site information by clicking on “Enable Editing.”
Edit parameter information by clicking on a name
43
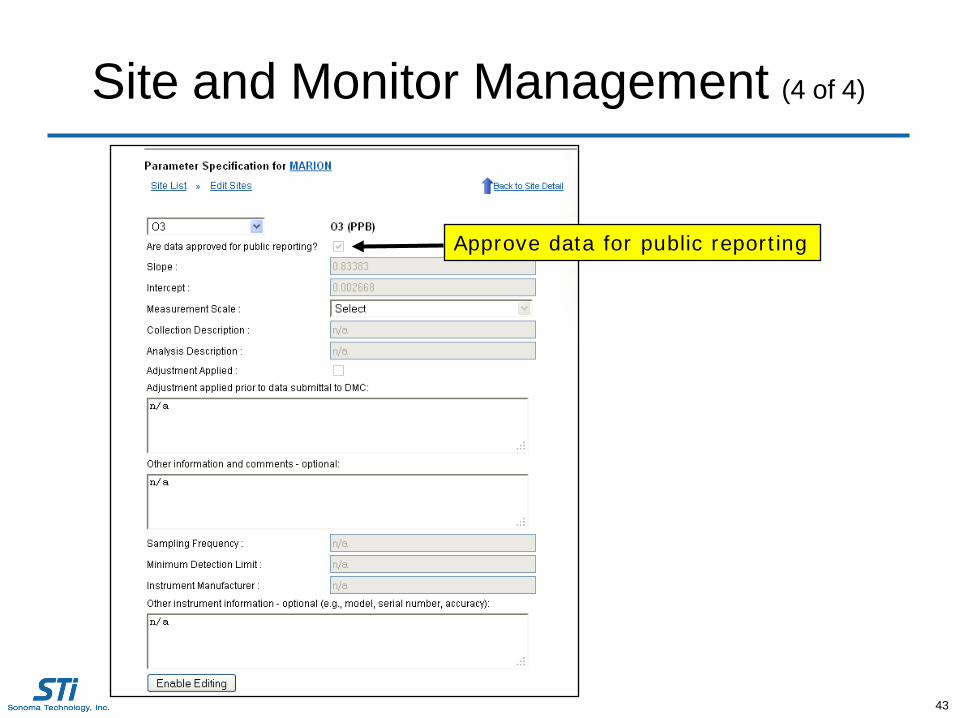
Site and Monitor Management (4 of 4)
Approve data for public reporting
44
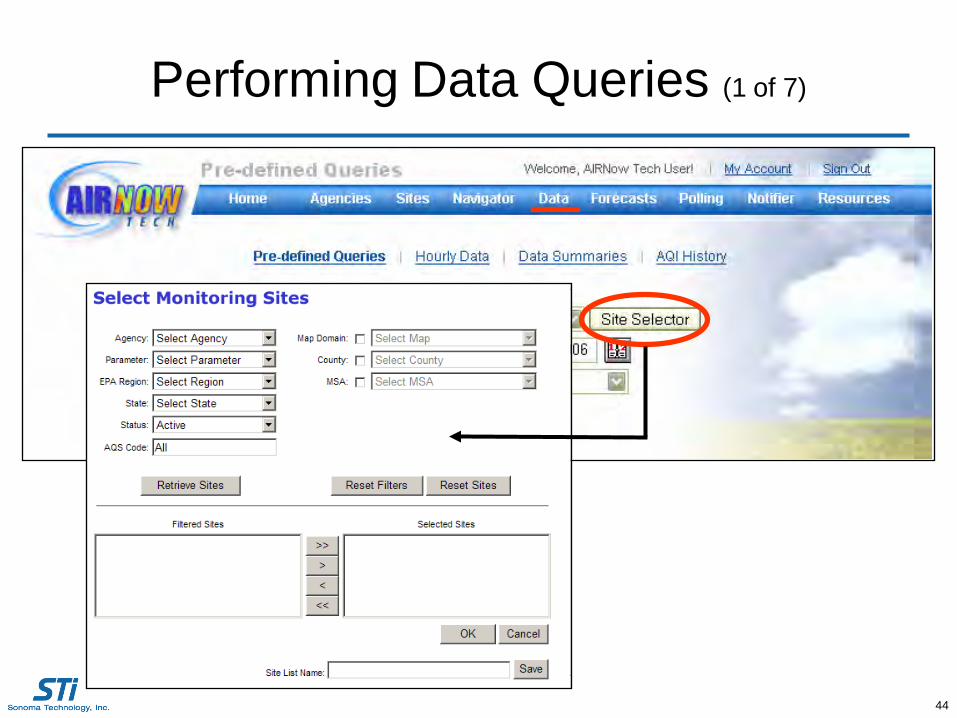
Performing Data Queries (1 of 7)

45
Performing Data Queries (2 of 7)
46
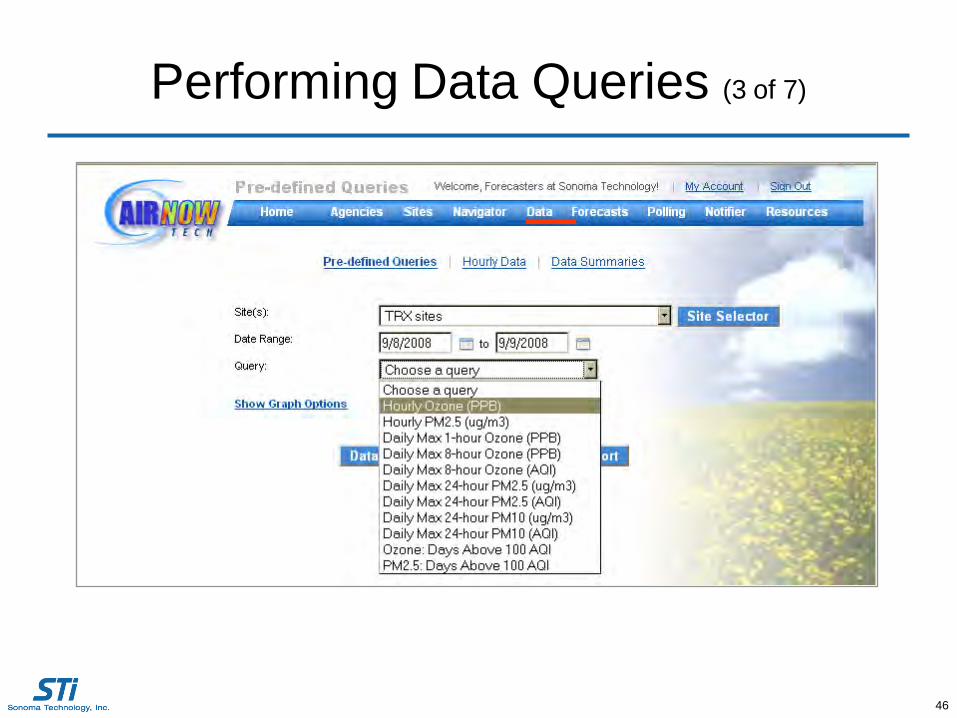
Performing Data Queries (3 of 7)

47
Performing Data Queries (4 of 7)
48
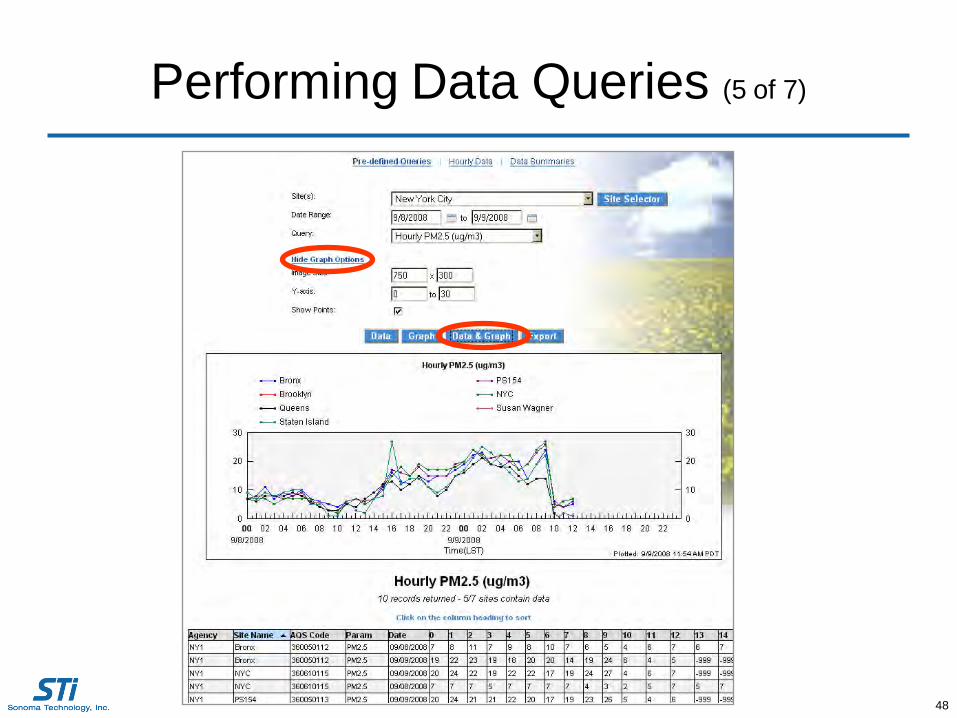
Performing Data Queries (5 of 7)

49
Performing Data Queries (6 of 7)
Access to all parameters
Useful for analyzing diurnal trends and daily averages
Sorting and row/column summaries available
50
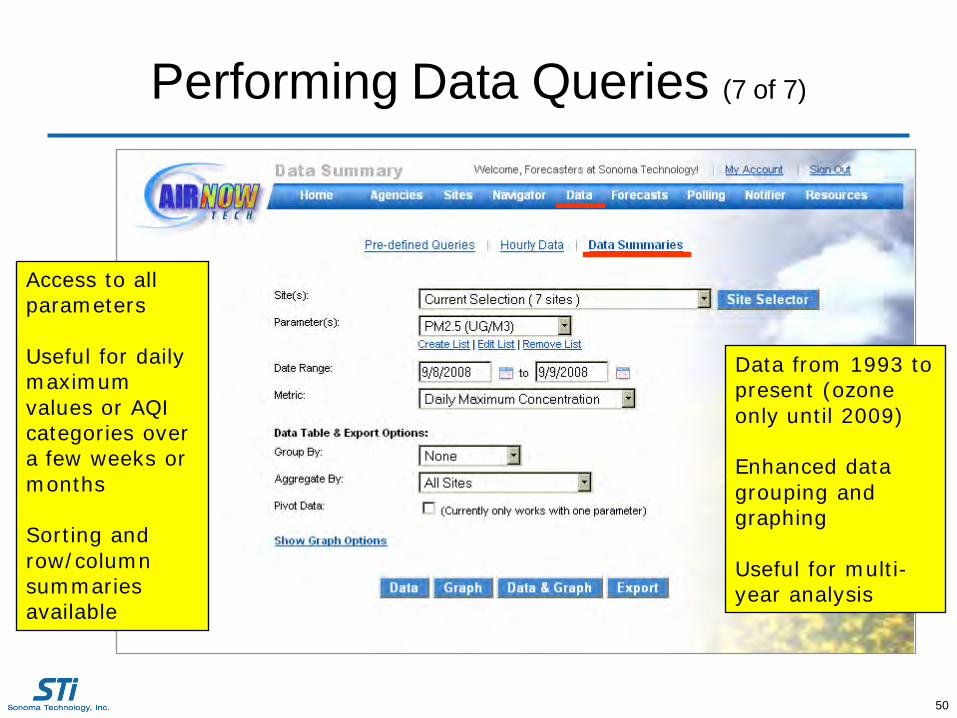
Performing Data Queries (7 of 7)
Access to all parameters
Useful for daily maximum values or AQI categories over a few weeks or months
Sorting and row/column summaries available
Data from 1993 to present (ozone only until 2009)
Enhanced data grouping and graphing
Useful for multi-year analysis

51
Navigator GIS (1 of 11)

52
Navigator GIS (2 of 11)
Site locations with optional site label
Air quality monitoring site
NWS site

53
Monitor data with labels
Selected PM2.5 hourly data
Navigator GIS (3 of 11)
54
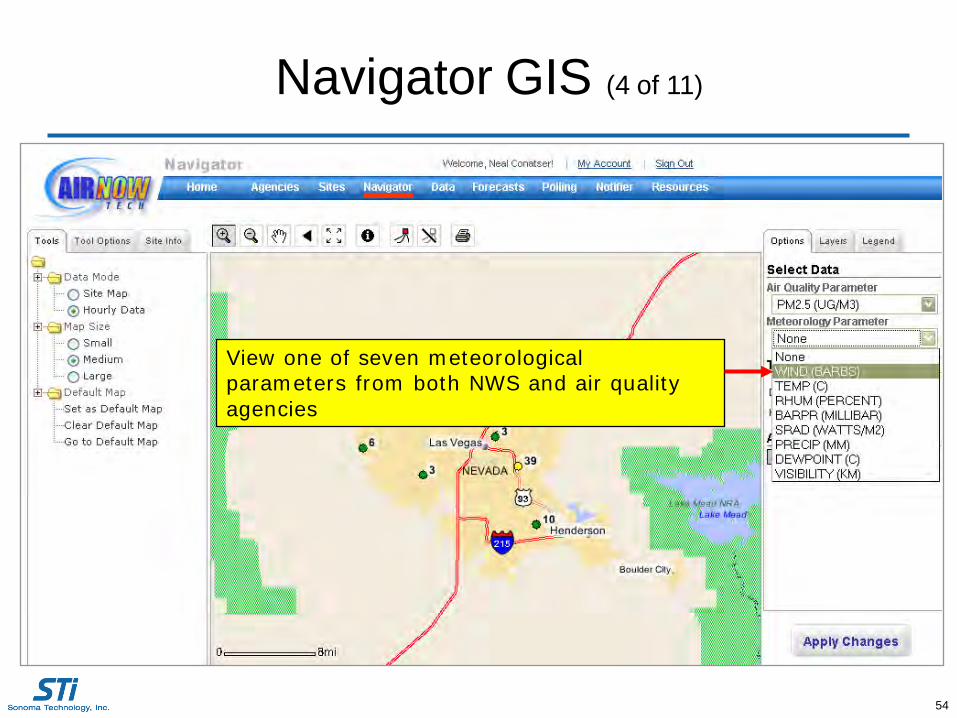
View one of seven meteorological parameters from both NWS and air quality agencies
Navigator GIS (4 of 11)

55
Wind barbs
Navigator GIS (5 of 11)

56
Run backward and forward HYSPLIT trajectories
Input trajectory parameters
Navigator GIS (6 of 11)

57
Backward trajectory with optional labels
Navigator GIS (7 of 11)

58
Go to a previous hour or day
Navigator GIS (8 of 11)
The location of the trajectory parcel moves every hour
59
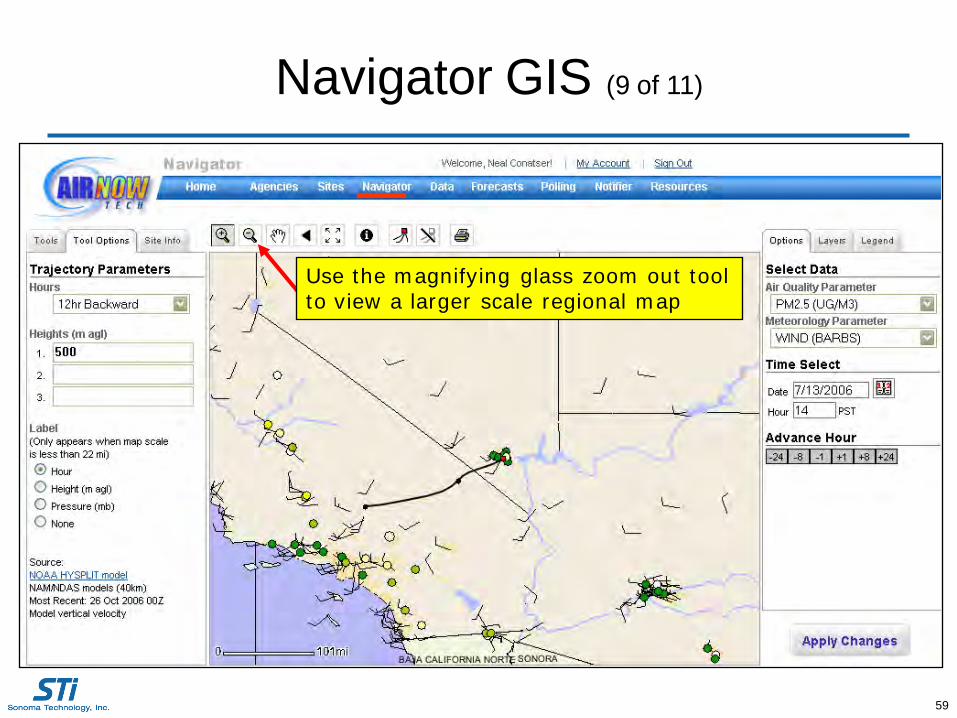
Navigator GIS (9 of 11)
Use the magnifying glass zoom out tool to view a larger scale regional map
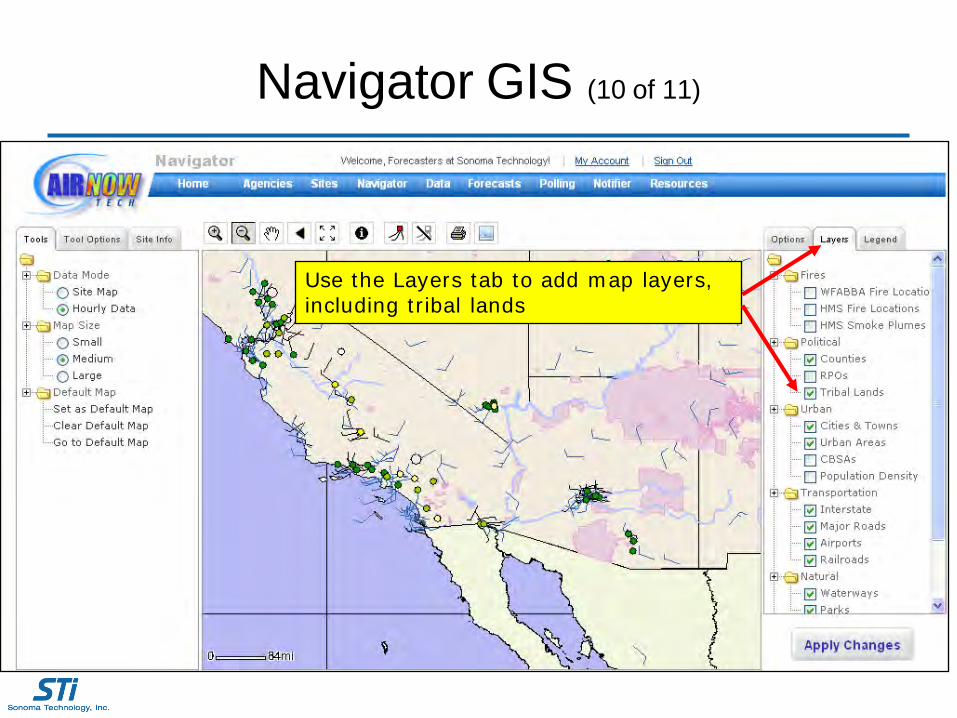
Navigator GIS (10 of 11)
Use the Layers tab to add map layers, including tribal lands

61
Hazard Mapping System (HMS) smoke plumes with forward HYSPLIT trajectories
Navigator GIS (10 of 11)
62
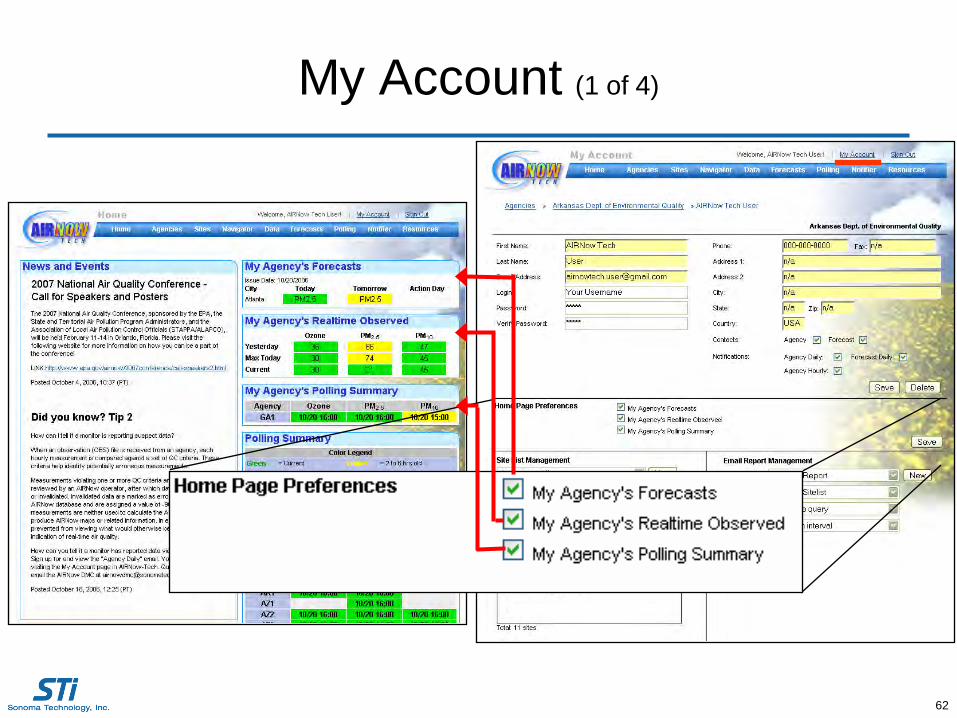
My Account (1 of 4)
63
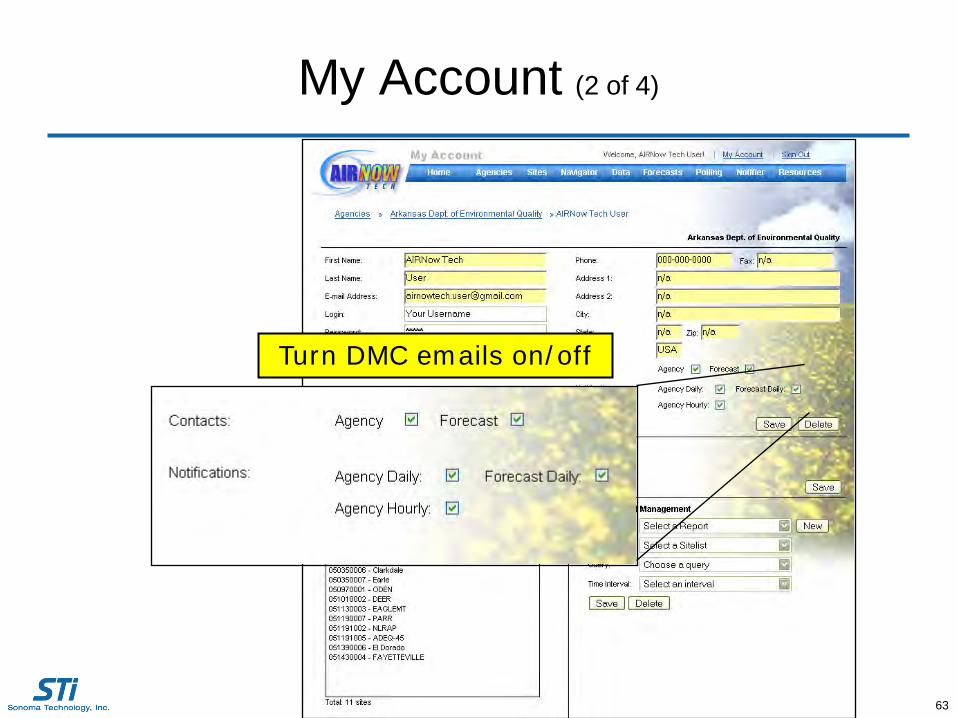
My Account (2 of 4)
Turn DMC emails on/off

64
My Account (3 of 4)
Site List Management

65
My Account (4 of 4)
Email Report Management
Weekly Ozone Exceedances

66
Resources
The AIRNow-Tech Resources page has
• Tutorial videos• Manuals and
Instructions• Data formats and
processing details• Links and other
useful information
67
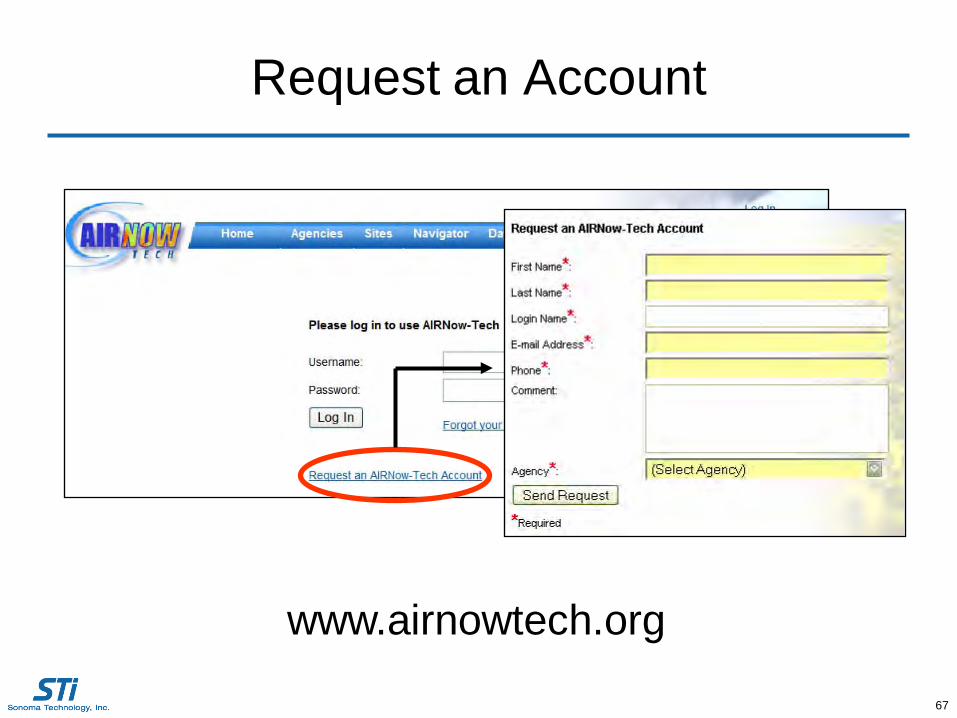
Request an Account
www.airnowtech.org

68
Contacts
Alan Chan707-665-9900
Dianne Miller 707-665-9900
Related Documents