Aircraft Operation Anomaly Detection Using FDR Data Lishuai Li, Maxime Gariel, R. John Hansman IAB/Airline Industry Consortium Nov 4, 2010 1

Welcome message from author
This document is posted to help you gain knowledge. Please leave a comment to let me know what you think about it! Share it to your friends and learn new things together.
Transcript

Aircraft Operation Anomaly Detection Using FDR Data
Lishuai Li, Maxime Gariel, R. John Hansman
IAB/Airline Industry Consortium
Nov 4, 2010
1

Motivation
Commercial aircraft accident rate has dropped significantly.
Fatal Accidents – Worldwide Commercial Jet ( 1959~2008)
Further improvement requires proactive safety management.
Id tif i k i d t d• Identify risks in day-to-day operations
Large amount of routine flight g gdata “available” • Flight Operations Quality Assurance (FOQA) in US • Flight Data Monitoring (FDM) in Europe
Boeing, 2008 Statistical Summary
g g ( ) p
Information in flight data:• Rich about flight operations and risks
Underutilized by current practices
2
• Underutilized by current practices
Objective
ObjectiveIdentify emerging risks from routine flight data
Issues: complexity of routine flight dataL b f i bl• Large number of variables
• Mix of relationships among variables• Variability among flights
Aircraft type Aircraft type ProceduresWeather Pilots…
3
FDR Data
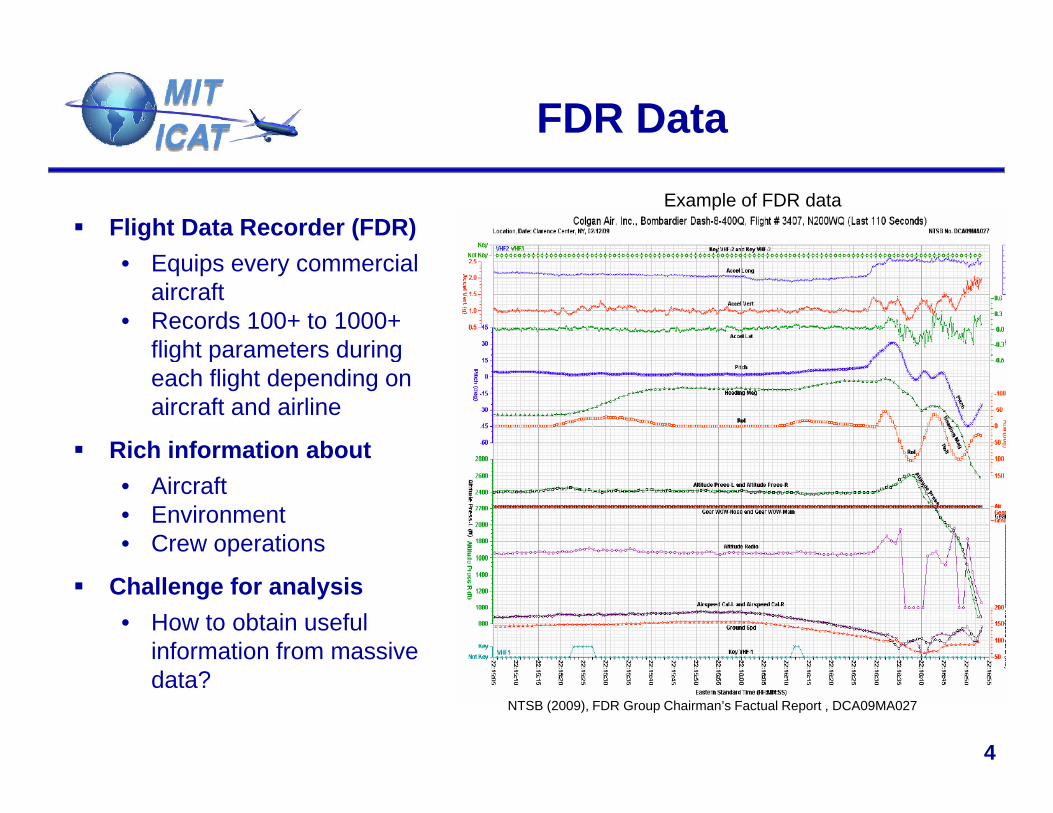
Flight Data Recorder (FDR)Example of FDR data
• Equips every commercial aircraft
• Records 100+ to 1000+ flight parameters duringflight parameters during each flight depending on aircraft and airline
Rich information aboutc o at o about• Aircraft• Environment• Crew operations
Challenge for analysis• How to obtain useful
information from massive
4
data?NTSB (2009), FDR Group Chairman’s Factual Report , DCA09MA027
Current Data Analysis
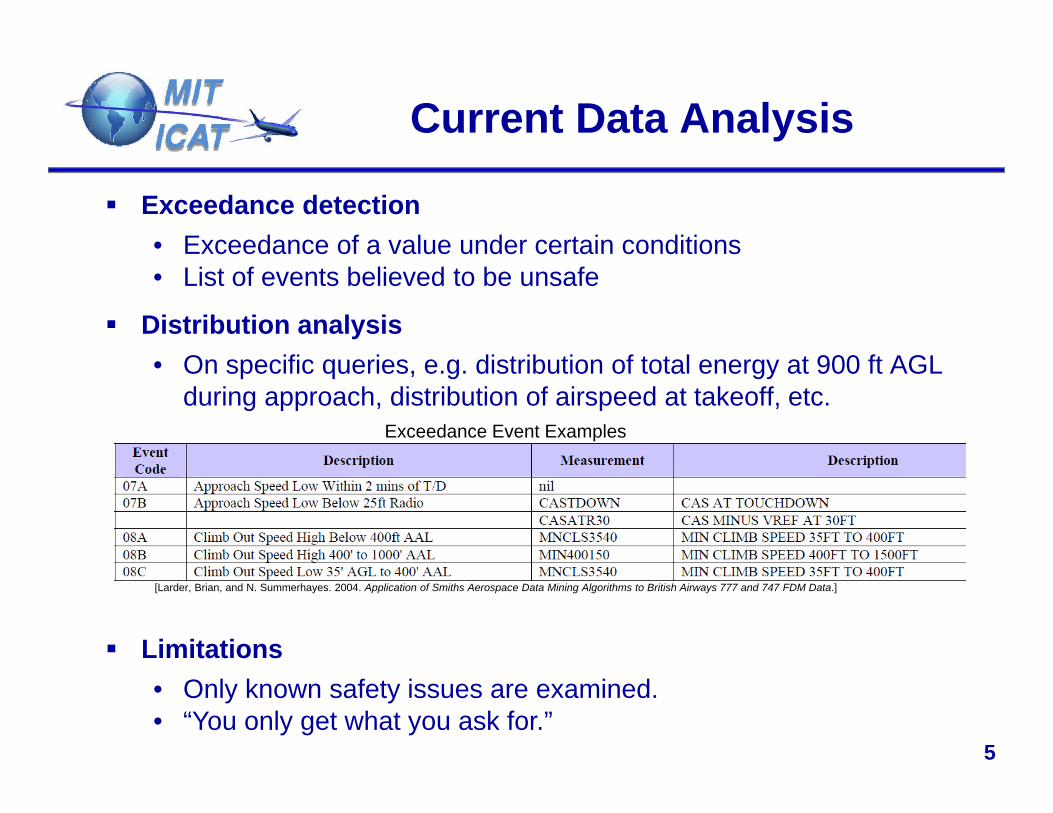
Exceedance detection• Exceedance of a value under certain conditionsExceedance of a value under certain conditions• List of events believed to be unsafe
Distribution analysisO ifi i di t ib ti f t t l t 900 ft AGL• On specific queries, e.g. distribution of total energy at 900 ft AGL during approach, distribution of airspeed at takeoff, etc.
Exceedance Event Examples
Limitations
[Larder, Brian, and N. Summerhayes. 2004. Application of Smiths Aerospace Data Mining Algorithms to British Airways 777 and 747 FDM Data.]
5
• Only known safety issues are examined.• “You only get what you ask for.”
Proposed Approach
Assumption• Majority of flights is safeMajority of flights is safe
ApproachD l th d t t k d t il d i fli ht d d d tDevelop a method to track detailed in-flight recorded data
• Establish a norm of safe operations
• Identify anomalies, or abnormal operationswhich indicate increased risks: Vehicle impairmentp External hazards Inappropriate crew operations…
6
Data Analysis Method
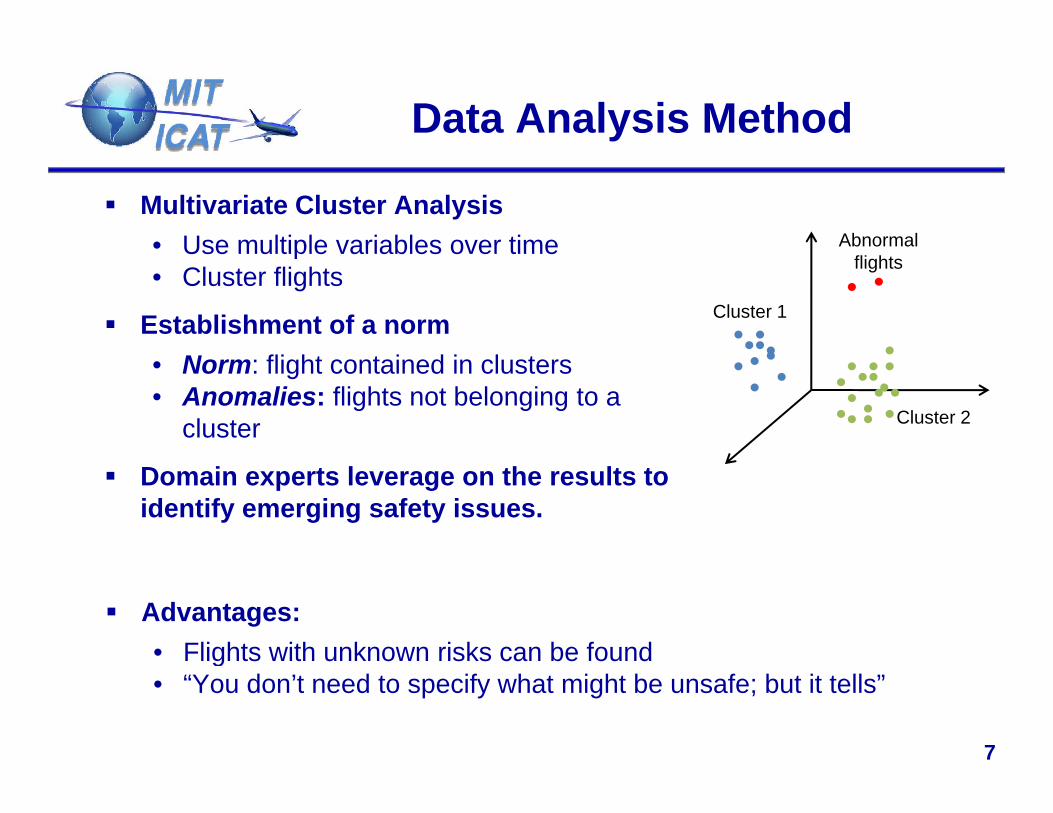
Multivariate Cluster Analysis• Use multiple variables over time Abnormal Use multiple variables over time• Cluster flights
Establishment of a normN fli ht t i d i l t
Cluster 1
flights
• Norm: flight contained in clusters• Anomalies: flights not belonging to a
cluster Cluster 2
Domain experts leverage on the results to identify emerging safety issues.
Advantages:• Flights with unknown risks can be found
7
g• “You don’t need to specify what might be unsafe; but it tells”
Preliminary Study
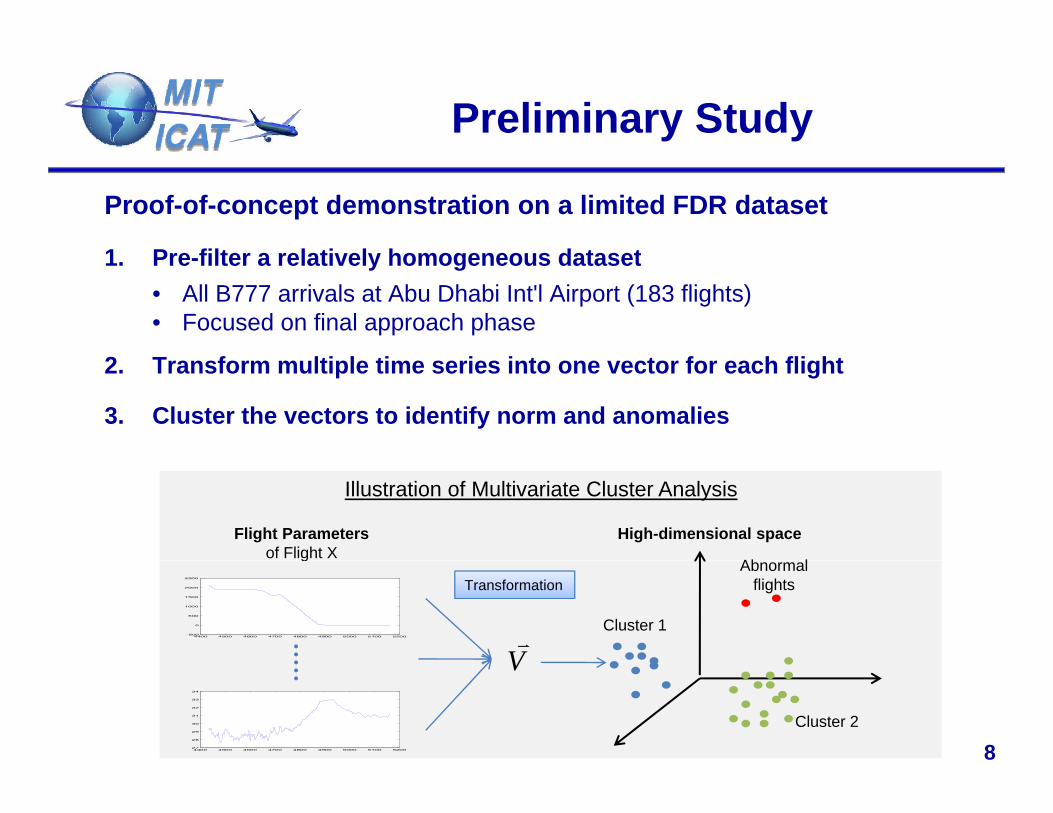
Proof-of-concept demonstration on a limited FDR dataset
1 P filt l ti l h d t t1. Pre-filter a relatively homogeneous dataset• All B777 arrivals at Abu Dhabi Int'l Airport (183 flights)• Focused on final approach phase
2. Transform multiple time series into one vector for each flight
3. Cluster the vectors to identify norm and anomalies
Ab l
High-dimensional spaceFlight Parametersof Flight X
Illustration of Multivariate Cluster Analysis
Cluster 1
Abnormal flights
4400 4500 4600 4700 4800 4900 5000 5100 5200-500
0
500
1000
1500
2000
2500
g
V
Transformation
8Cluster 2
4400 4500 4600 4700 4800 4900 5000 5100 520027
28
29
30
31
32
33
34
V
Subsets of flight parametersfor Clusteringfor Clustering
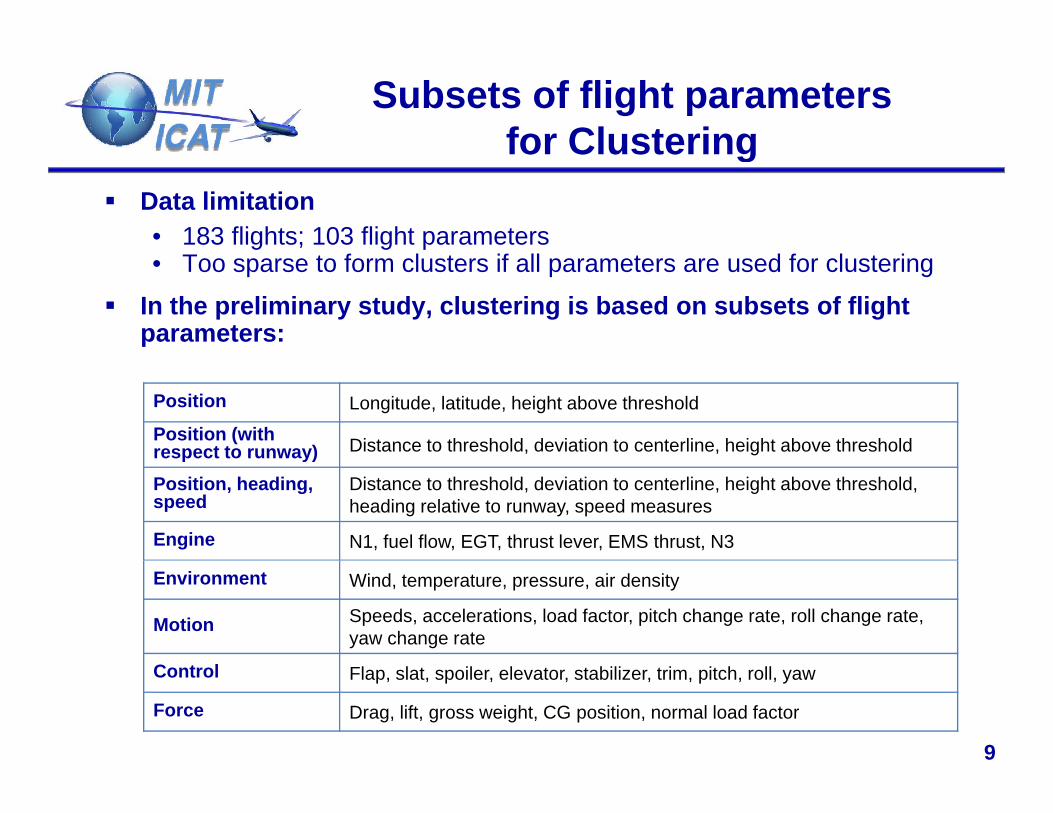
Data limitation• 183 flights; 103 flight parameters• Too sparse to form clusters if all parameters are used for clustering
In the preliminary study, clustering is based on subsets of flight parameters:
Position Longitude, latitude, height above threshold
Position (with respect to runway) Distance to threshold, deviation to centerline, height above thresholdrespect to runway)Position, heading, speed
Distance to threshold, deviation to centerline, height above threshold, heading relative to runway, speed measures
Engine N1, fuel flow, EGT, thrust lever, EMS thrust, N3
Environment Wind, temperature, pressure, air density
Motion Speeds, accelerations, load factor, pitch change rate, roll change rate, yaw change rate
9
Control Flap, slat, spoiler, elevator, stabilizer, trim, pitch, roll, yaw
Force Drag, lift, gross weight, CG position, normal load factor
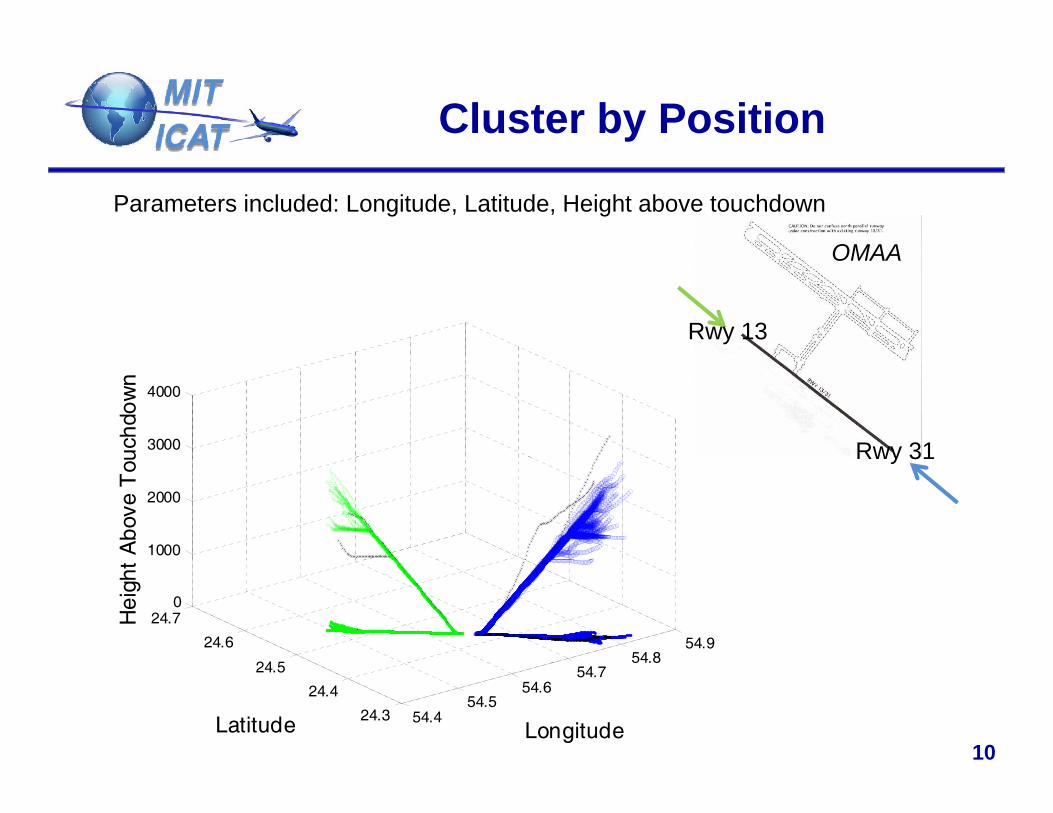
Cluster by Position
Parameters included: Longitude, Latitude, Height above touchdown
OMAA
Rwy 13
OMAA
Rwy 313000
4000
uchd
own
Rwy 31
1000
2000
Abo
ve T
ou
54.854.9
24 5
24.6
24.70
Hei
ght
10
54.454.5
54.654.7
24.3
24.4
24.5
LongitudeLatitude
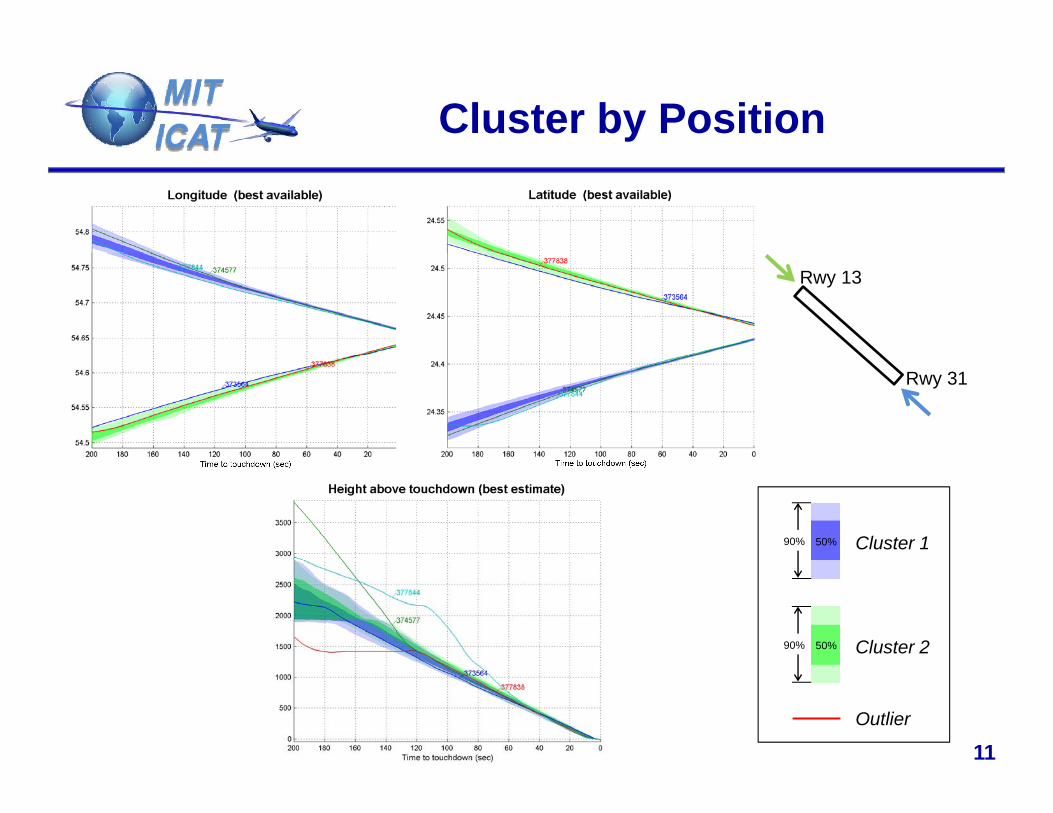
Cluster by Position
Rwy 13
Rwy 31
Cluster 150%90%
Cluster 250%90%
11Outlier
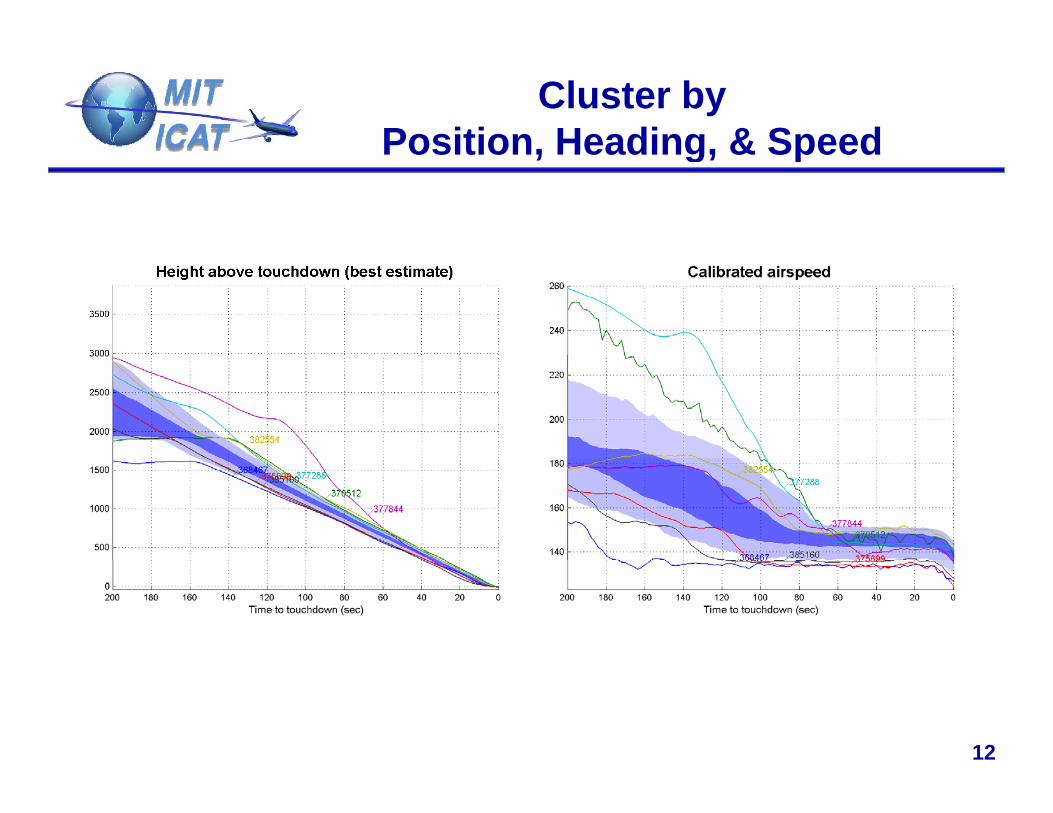
Cluster by Position, Heading, & SpeedPosition, Heading, & Speed
12
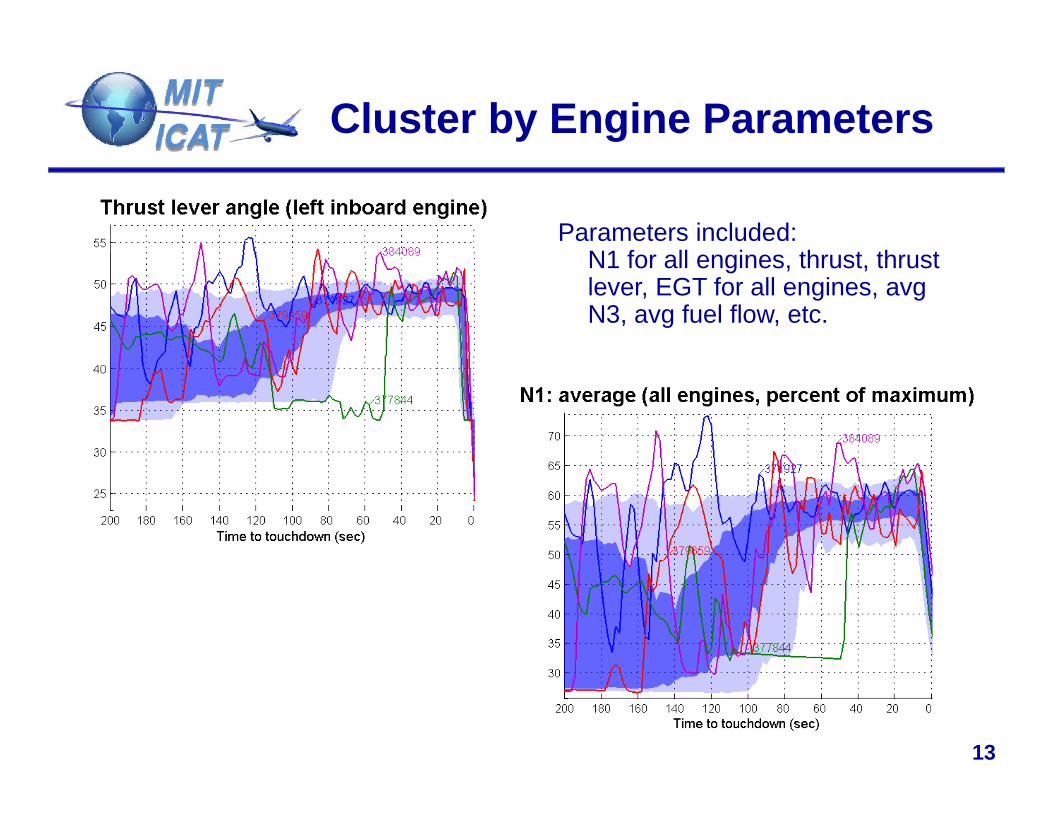
Cluster by Engine Parameters
Parameters included: N1 f ll i th t th tN1 for all engines, thrust, thrust lever, EGT for all engines, avgN3, avg fuel flow, etc.
13

Summary of outliers identified by subsetby subset
Position (Absolute)
Position (Relative)
Position, Heading,
Speed Engine Weather Motion Control Force
p373564 1 0 0 0 0 0 0 0374577 1 1 0 0 0 0 1 1377838 1 0 0 0 0 0 0 0377844 1 1 1 1 1 0 0 0368467 0 1 1 1 0 0 0 0382554 0 1 1 0 1 0 0 0382554 0 1 1 0 1 0 0 0369204 0 0 0 0 1 0 0 0370512 0 0 1 0 1 1 0 0375699 0 0 1 0 0 0 0 0377288 0 0 1 0 0 0 1 1385160 0 0 1 0 0 0 0 0371927 0 0 0 1 0 0 0 0379659 0 0 0 1 0 0 0 0384089 0 0 0 1 0 0 0 0382520 0 0 0 0 1 0 0 0384512 0 0 0 0 1 0 0 0370713 0 0 0 0 0 1 0 0370713 0 0 0 0 0 1 0 0371044 0 0 0 0 0 1 1 1371929 0 0 0 0 0 1 0 0377860 0 0 0 0 0 1 1 1379684 0 0 0 0 0 1 0 0369202 0 0 0 0 0 0 1 1
14
383279 0 0 0 0 0 0 0 1
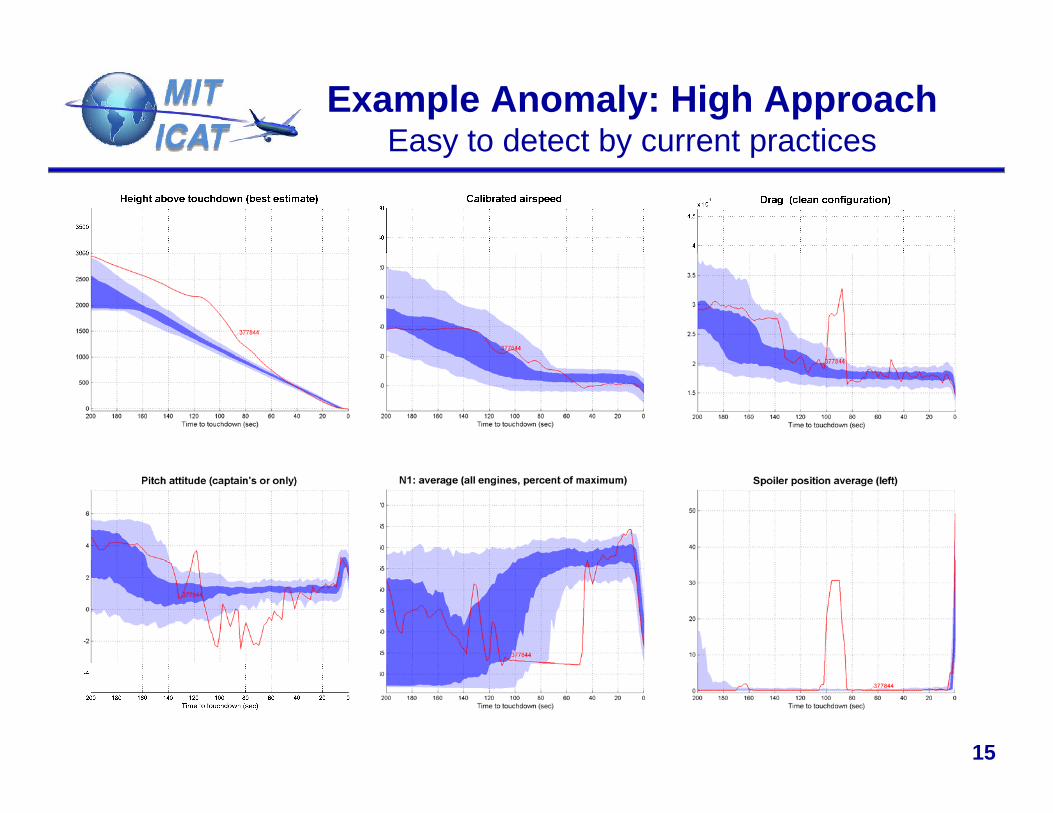
Example Anomaly: High ApproachEasy to detect by current practicesEasy to detect by current practices
15
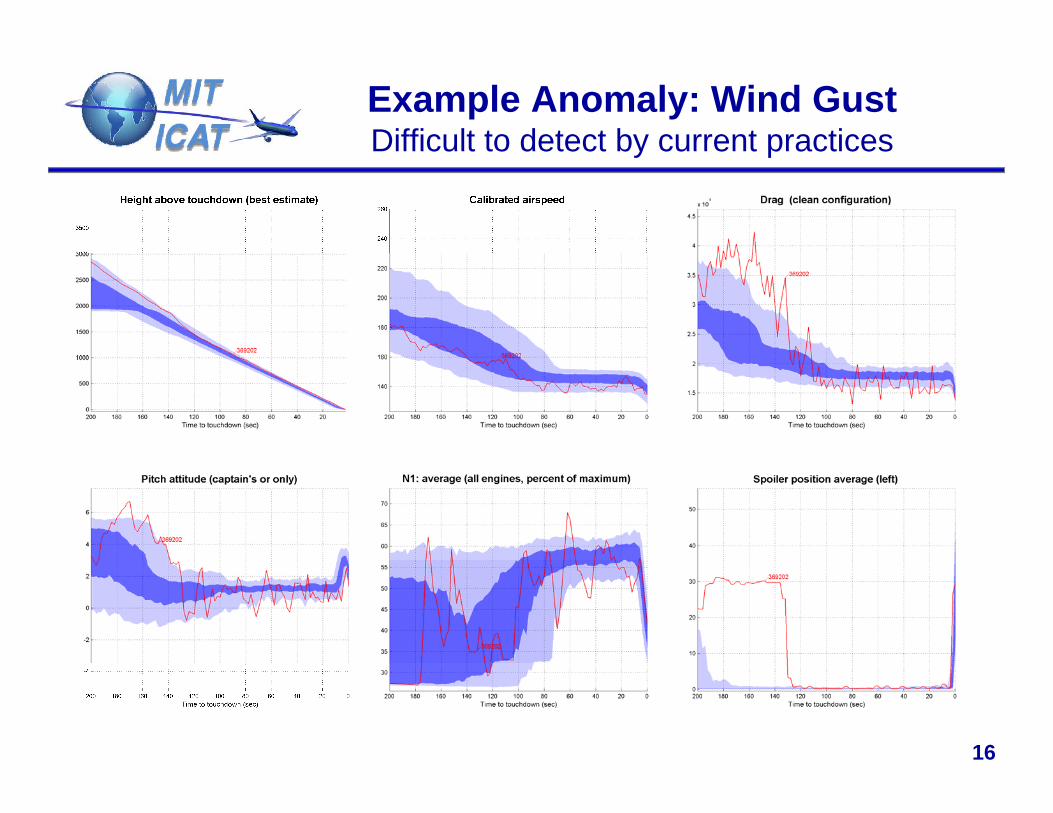
Example Anomaly: Wind GustDifficult to detect by current practicesDifficult to detect by current practices
16
Summary & Future Work
Summary• Proposed an approach to identify emerging risks from routineProposed an approach to identify emerging risks from routine
flight data• Developed a method to track detailed flight data and define norm
and anomalies for flight operations• Performed preliminary analysis on a limited FDR dataset
Next Steps • Extend the analysis to other phase of flight• Investigate parameters with no observable patterns over timeg p p• Apply method to full FDR dataset (Data Wanted)
17

Thank you!
Comments and questions?
18
Related Documents


