HAL Id: hal-02177161 https://hal.archives-ouvertes.fr/hal-02177161 Submitted on 8 Jul 2019 HAL is a multi-disciplinary open access archive for the deposit and dissemination of sci- entific research documents, whether they are pub- lished or not. The documents may come from teaching and research institutions in France or abroad, or from public or private research centers. L’archive ouverte pluridisciplinaire HAL, est destinée au dépôt et à la diffusion de documents scientifiques de niveau recherche, publiés ou non, émanant des établissements d’enseignement et de recherche français ou étrangers, des laboratoires publics ou privés. Airfoil Tip Leakage Aeroacoustics Predictions using a Lattice Boltzmann Based Method Adrian Mann, Min-Suk Kim, Jingshu Wu, Franck Pérot, Julien Grilliat, Marc C. Jacob, Miles Colman To cite this version: Adrian Mann, Min-Suk Kim, Jingshu Wu, Franck Pérot, Julien Grilliat, et al.. Airfoil Tip Leakage Aeroacoustics Predictions using a Lattice Boltzmann Based Method. 22nd AIAA/CEAS Aeroacoustics Conference, May 2016, Lyon, France. pp.1-17. hal-02177161

Welcome message from author
This document is posted to help you gain knowledge. Please leave a comment to let me know what you think about it! Share it to your friends and learn new things together.
Transcript
HAL Id: hal-02177161https://hal.archives-ouvertes.fr/hal-02177161
Submitted on 8 Jul 2019
HAL is a multi-disciplinary open accessarchive for the deposit and dissemination of sci-entific research documents, whether they are pub-lished or not. The documents may come fromteaching and research institutions in France orabroad, or from public or private research centers.
L’archive ouverte pluridisciplinaire HAL, estdestinée au dépôt et à la diffusion de documentsscientifiques de niveau recherche, publiés ou non,émanant des établissements d’enseignement et derecherche français ou étrangers, des laboratoirespublics ou privés.
Airfoil Tip Leakage Aeroacoustics Predictions using aLattice Boltzmann Based Method
Adrian Mann, Min-Suk Kim, Jingshu Wu, Franck Pérot, Julien Grilliat, MarcC. Jacob, Miles Colman
To cite this version:Adrian Mann, Min-Suk Kim, Jingshu Wu, Franck Pérot, Julien Grilliat, et al.. Airfoil Tip LeakageAeroacoustics Predictions using a Lattice Boltzmann Based Method. 22nd AIAA/CEAS AeroacousticsConference, May 2016, Lyon, France. pp.1-17. �hal-02177161�

�
�������������������������� �������������������������������������������������������
�������������������������������������
���������������������������������������������
������ �� ��� ���� ����� ��������� ����� �������� ���� ��� � ��� ���� ��������
���������������� �������������������������������������������������
�������������������������������������������������
����������������� ��
�
�
�
�
������������ ���
an author's https://oatao.univ-toulouse.fr/24061
https://doi.org/10.2514/6.2016-2825
Mann, Adrian and Kim, Min-Suk and Wu, Jingshu and Pérot, Franck and Grilliat, Julien and Jacob, Marc C. and
Colman, Miles Airfoil Tip Leakage Aeroacoustics Predictions using a Lattice Boltzmann Based Method. (2016) In:
22nd AIAA/CEAS Aeroacoustics Conference, 30 May 2016 - 1 June 2016 (Lyon, France).
Airfoil Tip Leakage Aeroacoustics Predictions using a
Lattice Boltzmann Based Method
Adrien Mann1, Min-Suk Kim2, Jingshu Wu3, and Franck Pérot4
Exa Corporation
150 North Hill Drive, Brisbane, CA 94005, USA
Julien Grilliat5
ebm-papst St. Georgen GmbH & Co. KG
Hermann-Papst-Straße 1, 78112 St. Georgen, Germany
Marc C. Jacob6
Laboratoire de Mécanique des Fluides et d’Acoustique UMR CNRS 5509,
Ecole Centrale de Lyon/ Université de Lyon, Ecully, France
also at ISAE-SupAéro, Toulouse, France
Miles Colman7
Kitty Hawk Corp.
2639 Terminal Blvd., Mountain View, CA 94043, USA
The noise produced by rotating systems such as fans and turbo machines is of growing
importance in the academic and engineering communities. The prediction and understanding
of the physical mechanisms associated with noise generation are required in order to develop
innovative solutions able to efficiently reduce radiated acoustics levels. The flow-induced noise
generation mechanisms related to rotating devices are various and complex, and one of them
is related to the blade tip flow. The tip flow noise, or tip leakage noise, is particularly important
for free-tip configurations, for which the tip flow induced by the pressure gradient between
the suction and pressure sides can be particularly intense. The experimental investigation of
this mechanism is practically challenging. Consequently, a simplified non-rotating
representative configuration has been proposed, and has been previously investigated
experimentally. In this paper, transient, compressible, and time-explicit Computational Fluid
Dynamics/Computational Aero-Acoustics (CFD/CAA) simulations of an airfoil tip leakage
flow for this simplified geometry are performed using a Lattice Boltzmann Method (LBM)
based approach. The studied configuration is a NACA 5510 airfoil profile at high Reynolds
number flow conditions, for which a variable size gap is introduced between the airfoil and
one of the end plates, modeling the tip gap encountered in free-tip fans. First, the simulation
results are compared with experimental results to validate the numerical approach. Further
investigation of the numerical results underlines the connection between the tip vortex
structures and noise radiation, including a parametric study on the Angle of Attack (AoA) and
the tip gap width.
1Principal Application Engineer, Aeroacoustics Applications, [email protected] 2Principal Application Engineer, Aeroacoustics Applications, [email protected] 3Principal Application Engineer, HVNA Group, [email protected] 4Senior Director, Aeroacoustics Applications, [email protected] 5Head of Aerodynamics, Acoustics and Vibrations Labs, [email protected] 6 Professor, Laboratoire de Mécanique des Fluides et d’Acoustique, Université de Lyon, Département
d’Aérodynamique, Energétique et Propulsion (ISAE), AIAA Member, [email protected] 7Mechanical Engineer, [email protected]
I. Introduction
he noise generated by fans and turbo machinery has long been of interest to the community. Rising consumer
expectations and recent regulations have made fan noise analysis and mitigation a more important part of fan
integration for vehicles, aircrafts, HVAC systems and heavy industry equipment. Fan noise can be measured in
experimental tests, but experiments require physical prototypes and have turn-around times which do not satisfy
production constraints. In addition, the scale of some of the flow structures responsible for noise generation requires
advanced experimental equipment to detect them, which are costly and often difficult to set up properly. Validated
simulation capabilities for fan noise, able to simultaneously evaluate both airflow and acoustic performance, represent
an attractive alternative enabling rapid evaluation, design optimization work and insight into and visualization of the
sources of noise.
To isolate the main source of unsteady flow structures and noise in fan blades, a simpler experimental case that
has been well-studied and possesses qualitatively similar dimensions to a fan blade is examined. The simulation results
reported in the present work are based on the experimental study of an airfoil with tip gap flow in a quasi-2D jet with
a free stream velocity U01-4. At the exit of the wind tunnel, the airfoil is mounted between two end plates. A variable
gap between the tunnel wall and the airfoil is introduced. The highly loaded airfoil with tip gap generates a tip vortex
via the same mechanism as a rotating fan blade operating near a stationary wall, although no moving parts are involved
in this particular setup.
In this study, the Computational Fluid Dynamics/Computational AeroAcoustics (CFD/CAA) solver PowerFLOW
based on the Lattice-Boltzmann Method is used to predict the transient flow field and corresponding flow-induced
noise radiation5-12. The solver has been successfully applied in numerous industrial analyses, academic validations and
investigations such as wind-noise, HVAC, fans, blower and wind-turbine problems13-24. Wall Pressure Fluctuations
(WPF) near the tip gap are the focus of this paper, as the noise-generating mechanisms of interest for fans are expected
to correlate to the measurement locations on the blade.
The paper is organized in the following sections. The experimental and numerical setups are presented in section II,
including a wind-tunnel flow quality study. Section III presents a study of the accuracy of the numerical method via
the correlation of the simulated mean/transient flow field results with the tests1-4, as well as an in-depth analysis of the
flow topology and its correlation to noise generation. In order to gain deeper insights in the noise-generating
mechanisms occurring in the vicinity of the blade tip, two parametric studies, based on the Angle of Attack (AoA) and
the tip gap width, are provided with the corresponding analysis in the final section IV.
II. Experimental and numerical setups
II.A. Experimental setup
The tested geometry is shown in Figure 1 and corresponds to a NACA 5510 airfoil (10% thickness, 5% camber)
with a 200 mm chord and a 200 mm span. The angle of attack of the airfoil can be varied from 0 o to 20o by rotating
the wooden plates, and the tip gap width Δz between the wall and the airfoil can be adjusted from Δz=0 mm to Δz=200
mm, corresponding to the distance between the end plates.
The baseline configuration has the following properties: AoA=15o, Δz=10 mm, U0=70 m/s. The corresponding
Reynolds number based on the chord is Rec= 9.6∙105. This set of parameters has been chosen because such a setup
best represents a typical configuration for axial cooling fans and rotating machinery.
The available measurements in Grilliat1 are:
Hot Wire Anemometry (HWA): turbulent boundary layer and velocity profiles at various locations
Time-average pressure coefficient CP at the surface of the airfoil and endplates
Power Spectrum Density (PSD) of Wall Pressure Fluctuations (WPF) on the airfoil and end plates
Laser Particle Image Velocimetry (PIV) measurements in various planes around the airfoil parallel to the
end plates
T
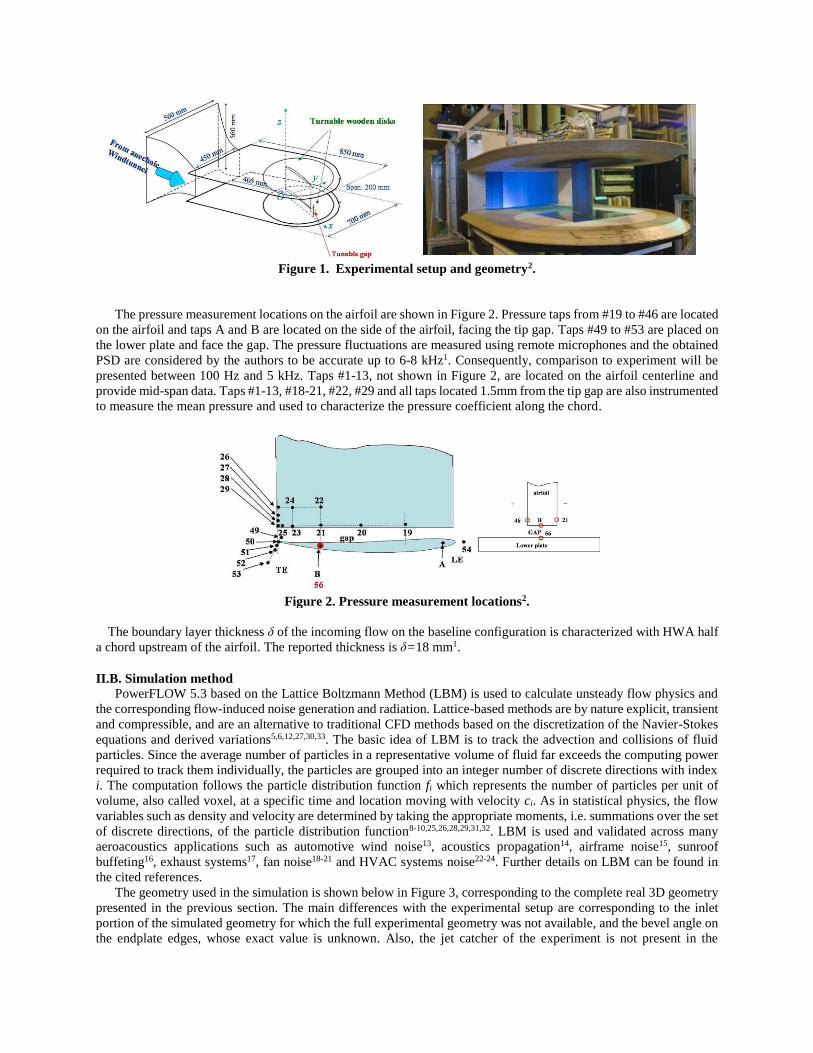
Figure 1. Experimental setup and geometry2.
The pressure measurement locations on the airfoil are shown in Figure 2. Pressure taps from #19 to #46 are located
on the airfoil and taps A and B are located on the side of the airfoil, facing the tip gap. Taps #49 to #53 are placed on
the lower plate and face the gap. The pressure fluctuations are measured using remote microphones and the obtained
PSD are considered by the authors to be accurate up to 6-8 kHz1. Consequently, comparison to experiment will be
presented between 100 Hz and 5 kHz. Taps #1-13, not shown in Figure 2, are located on the airfoil centerline and
provide mid-span data. Taps #1-13, #18-21, #22, #29 and all taps located 1.5mm from the tip gap are also instrumented
to measure the mean pressure and used to characterize the pressure coefficient along the chord.
Figure 2. Pressure measurement locations2.
The boundary layer thickness δ of the incoming flow on the baseline configuration is characterized with HWA half
a chord upstream of the airfoil. The reported thickness is δ=18 mm1.
II.B. Simulation method
PowerFLOW 5.3 based on the Lattice Boltzmann Method (LBM) is used to calculate unsteady flow physics and
the corresponding flow-induced noise generation and radiation. Lattice-based methods are by nature explicit, transient
and compressible, and are an alternative to traditional CFD methods based on the discretization of the Navier-Stokes
equations and derived variations5,6,12,27,30,33. The basic idea of LBM is to track the advection and collisions of fluid
particles. Since the average number of particles in a representative volume of fluid far exceeds the computing power
required to track them individually, the particles are grouped into an integer number of discrete directions with index
i. The computation follows the particle distribution function fi which represents the number of particles per unit of
volume, also called voxel, at a specific time and location moving with velocity ci. As in statistical physics, the flow
variables such as density and velocity are determined by taking the appropriate moments, i.e. summations over the set
of discrete directions, of the particle distribution function8-10,25,26,28,29,31,32. LBM is used and validated across many
aeroacoustics applications such as automotive wind noise13, acoustics propagation14, airframe noise15, sunroof
buffeting16, exhaust systems17, fan noise18-21 and HVAC systems noise22-24. Further details on LBM can be found in
the cited references.
The geometry used in the simulation is shown below in Figure 3, corresponding to the complete real 3D geometry
presented in the previous section. The main differences with the experimental setup are corresponding to the inlet
portion of the simulated geometry for which the full experimental geometry was not available, and the bevel angle on
the endplate edges, whose exact value is unknown. Also, the jet catcher of the experiment is not present in the
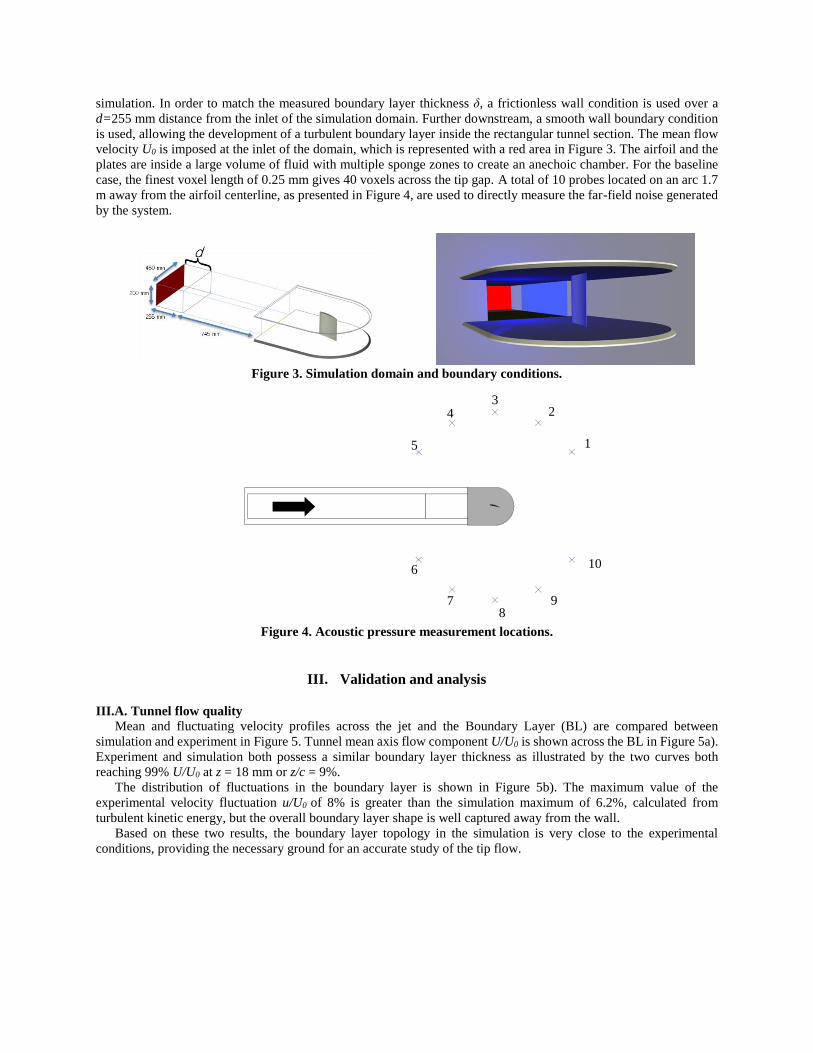
simulation. In order to match the measured boundary layer thickness δ, a frictionless wall condition is used over a
d=255 mm distance from the inlet of the simulation domain. Further downstream, a smooth wall boundary condition
is used, allowing the development of a turbulent boundary layer inside the rectangular tunnel section. The mean flow
velocity U0 is imposed at the inlet of the domain, which is represented with a red area in Figure 3. The airfoil and the
plates are inside a large volume of fluid with multiple sponge zones to create an anechoic chamber. For the baseline
case, the finest voxel length of 0.25 mm gives 40 voxels across the tip gap. A total of 10 probes located on an arc 1.7
m away from the airfoil centerline, as presented in Figure 4, are used to directly measure the far-field noise generated
by the system.
Figure 3. Simulation domain and boundary conditions.
Figure 4. Acoustic pressure measurement locations.
III. Validation and analysis
III.A. Tunnel flow quality
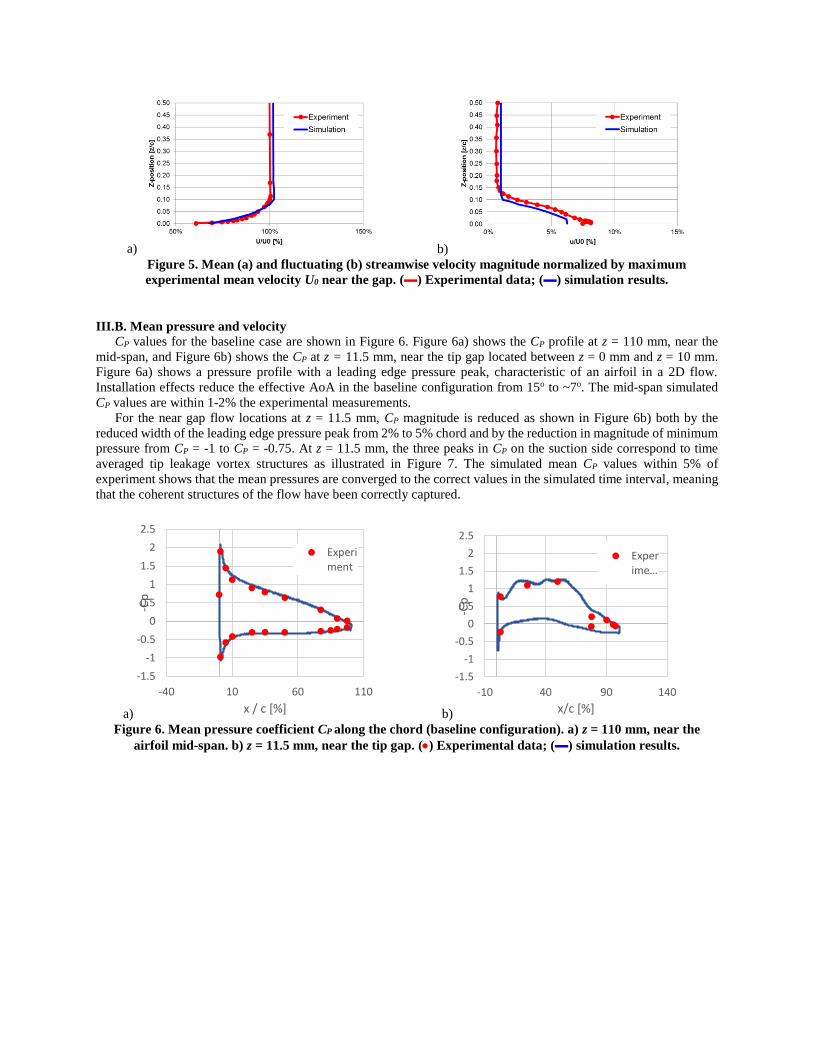
Mean and fluctuating velocity profiles across the jet and the Boundary Layer (BL) are compared between
simulation and experiment in Figure 5. Tunnel mean axis flow component U/U0 is shown across the BL in Figure 5a).
Experiment and simulation both possess a similar boundary layer thickness as illustrated by the two curves both
reaching 99% U/U0 at z = 18 mm or z/c = 9%.
The distribution of fluctuations in the boundary layer is shown in Figure 5b). The maximum value of the
experimental velocity fluctuation u/U0 of 8% is greater than the simulation maximum of 6.2%, calculated from
turbulent kinetic energy, but the overall boundary layer shape is well captured away from the wall.
Based on these two results, the boundary layer topology in the simulation is very close to the experimental
conditions, providing the necessary ground for an accurate study of the tip flow.
1
2 3
4
5
6
7 8
9
10
a) b)
Figure 5. Mean (a) and fluctuating (b) streamwise velocity magnitude normalized by maximum
experimental mean velocity U0 near the gap. (▬) Experimental data; (▬) simulation results.
III.B. Mean pressure and velocity
CP values for the baseline case are shown in Figure 6. Figure 6a) shows the CP profile at z = 110 mm, near the
mid-span, and Figure 6b) shows the CP at z = 11.5 mm, near the tip gap located between z = 0 mm and z = 10 mm.
Figure 6a) shows a pressure profile with a leading edge pressure peak, characteristic of an airfoil in a 2D flow.
Installation effects reduce the effective AoA in the baseline configuration from 15o to ~7o. The mid-span simulated
CP values are within 1-2% the experimental measurements.
For the near gap flow locations at z = 11.5 mm, CP magnitude is reduced as shown in Figure 6b) both by the
reduced width of the leading edge pressure peak from 2% to 5% chord and by the reduction in magnitude of minimum
pressure from CP = -1 to CP = -0.75. At z = 11.5 mm, the three peaks in CP on the suction side correspond to time
averaged tip leakage vortex structures as illustrated in Figure 7. The simulated mean CP values within 5% of
experiment shows that the mean pressures are converged to the correct values in the simulated time interval, meaning
that the coherent structures of the flow have been correctly captured.
a) b)
Figure 6. Mean pressure coefficient CP along the chord (baseline configuration). a) z = 110 mm, near the
airfoil mid-span. b) z = 11.5 mm, near the tip gap. () Experimental data; (▬) simulation results.
-1.5
-1
-0.5
0
0.5
1
1.5
2
2.5
-40 10 60 110
-Cp
x / c [%]
Experiment
-1.5
-1
-0.5
0
0.5
1
1.5
2
2.5
-10 40 90 140
-Cp
x/c [%]
Experime…
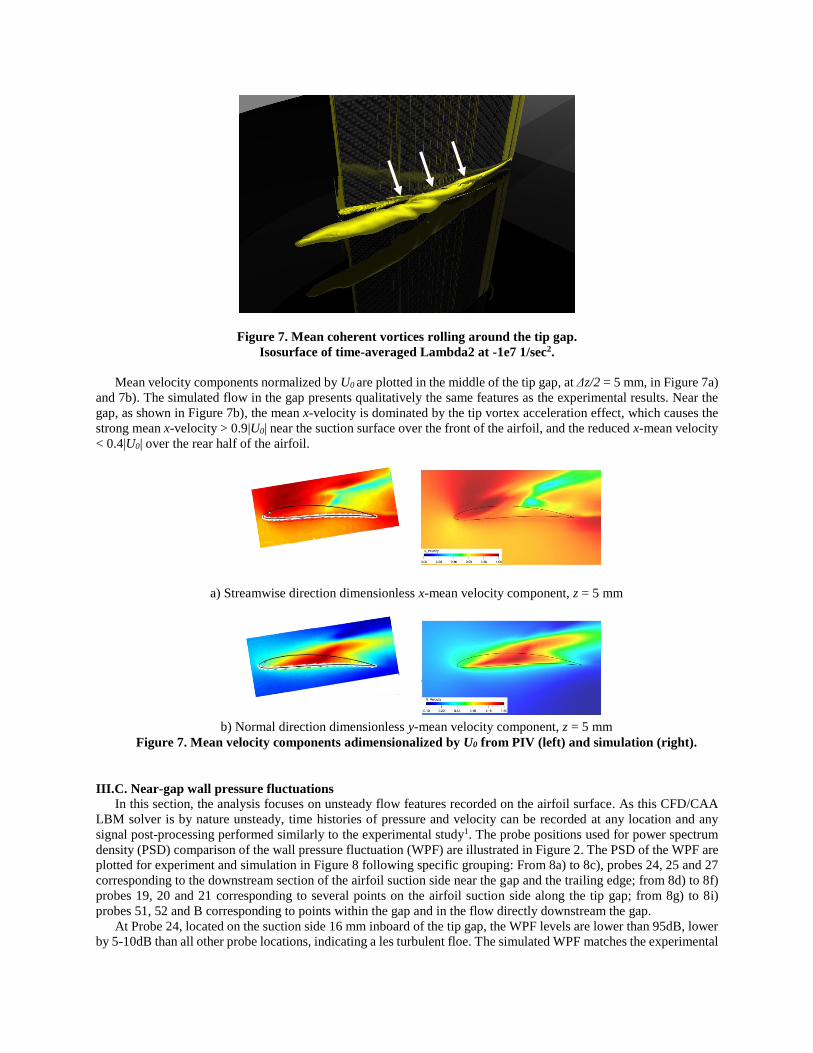
Figure 7. Mean coherent vortices rolling around the tip gap.
Isosurface of time-averaged Lambda2 at -1e7 1/sec2.
Mean velocity components normalized by U0 are plotted in the middle of the tip gap, at Δz/2 = 5 mm, in Figure 7a)
and 7b). The simulated flow in the gap presents qualitatively the same features as the experimental results. Near the
gap, as shown in Figure 7b), the mean x-velocity is dominated by the tip vortex acceleration effect, which causes the
strong mean x-velocity > 0.9|U0| near the suction surface over the front of the airfoil, and the reduced x-mean velocity
< 0.4|U0| over the rear half of the airfoil.
a) Streamwise direction dimensionless x-mean velocity component, z = 5 mm
b) Normal direction dimensionless y-mean velocity component, z = 5 mm
Figure 7. Mean velocity components adimensionalized by U0 from PIV (left) and simulation (right).
III.C. Near-gap wall pressure fluctuations
In this section, the analysis focuses on unsteady flow features recorded on the airfoil surface. As this CFD/CAA
LBM solver is by nature unsteady, time histories of pressure and velocity can be recorded at any location and any
signal post-processing performed similarly to the experimental study1. The probe positions used for power spectrum
density (PSD) comparison of the wall pressure fluctuation (WPF) are illustrated in Figure 2. The PSD of the WPF are
plotted for experiment and simulation in Figure 8 following specific grouping: From 8a) to 8c), probes 24, 25 and 27
corresponding to the downstream section of the airfoil suction side near the gap and the trailing edge; from 8d) to 8f)
probes 19, 20 and 21 corresponding to several points on the airfoil suction side along the tip gap; from 8g) to 8i)
probes 51, 52 and B corresponding to points within the gap and in the flow directly downstream the gap.
At Probe 24, located on the suction side 16 mm inboard of the tip gap, the WPF levels are lower than 95dB, lower
by 5-10dB than all other probe locations, indicating a les turbulent floe. The simulated WPF matches the experimental
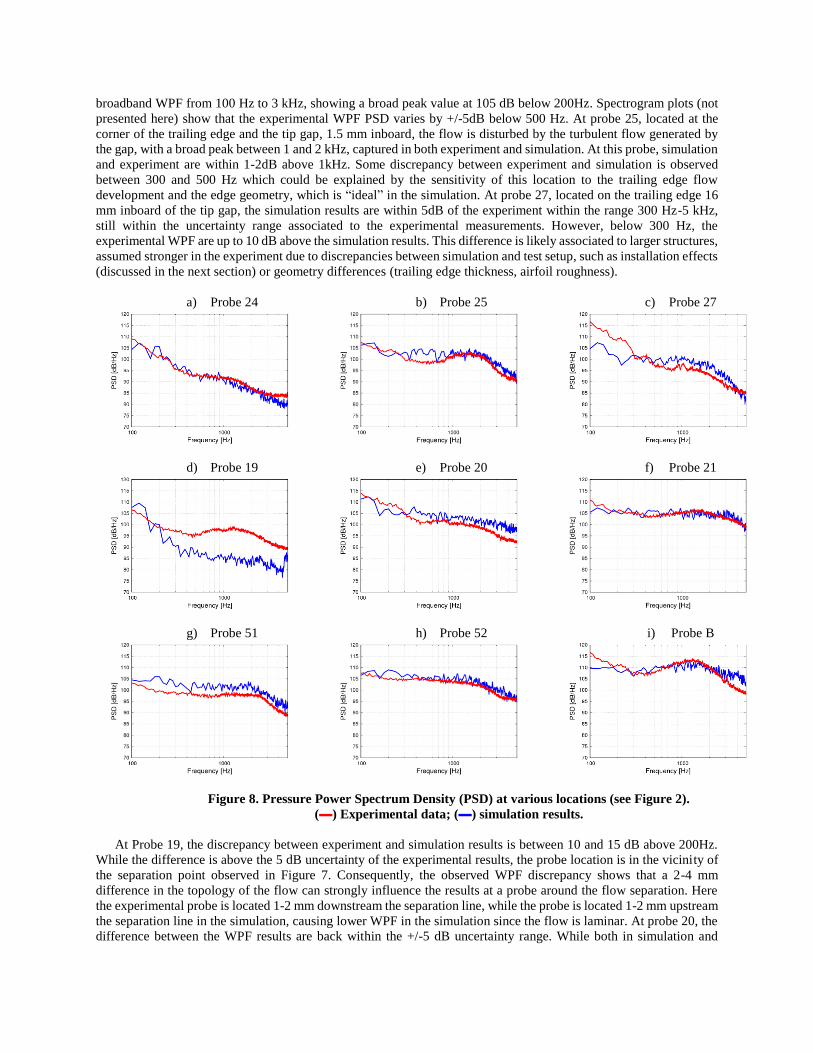
broadband WPF from 100 Hz to 3 kHz, showing a broad peak value at 105 dB below 200Hz. Spectrogram plots (not
presented here) show that the experimental WPF PSD varies by +/-5dB below 500 Hz. At probe 25, located at the
corner of the trailing edge and the tip gap, 1.5 mm inboard, the flow is disturbed by the turbulent flow generated by
the gap, with a broad peak between 1 and 2 kHz, captured in both experiment and simulation. At this probe, simulation
and experiment are within 1-2dB above 1kHz. Some discrepancy between experiment and simulation is observed
between 300 and 500 Hz which could be explained by the sensitivity of this location to the trailing edge flow
development and the edge geometry, which is “ideal” in the simulation. At probe 27, located on the trailing edge 16
mm inboard of the tip gap, the simulation results are within 5dB of the experiment within the range 300 Hz-5 kHz,
still within the uncertainty range associated to the experimental measurements. However, below 300 Hz, the
experimental WPF are up to 10 dB above the simulation results. This difference is likely associated to larger structures,
assumed stronger in the experiment due to discrepancies between simulation and test setup, such as installation effects
(discussed in the next section) or geometry differences (trailing edge thickness, airfoil roughness).
a) Probe 24 b) Probe 25 c) Probe 27
d) Probe 19 e) Probe 20 f) Probe 21
g) Probe 51 h) Probe 52 i) Probe B
Figure 8. Pressure Power Spectrum Density (PSD) at various locations (see Figure 2).
(▬) Experimental data; (▬) simulation results.
At Probe 19, the discrepancy between experiment and simulation results is between 10 and 15 dB above 200Hz.
While the difference is above the 5 dB uncertainty of the experimental results, the probe location is in the vicinity of
the separation point observed in Figure 7. Consequently, the observed WPF discrepancy shows that a 2-4 mm
difference in the topology of the flow can strongly influence the results at a probe around the flow separation. Here
the experimental probe is located 1-2 mm downstream the separation line, while the probe is located 1-2 mm upstream
the separation line in the simulation, causing lower WPF in the simulation since the flow is laminar. At probe 20, the
difference between the WPF results are back within the +/-5 dB uncertainty range. While both in simulation and
experiment the probe is located in the separation region, the observed discrepancy is likely related to the difference in
the upstream flow with a higher coherence of the flow structures in the experiment. Finally, at Probe 21, further
downstream the separation line, the experiment and simulation are within 2 dB for the frequency range 100Hz-5kHz.
At this location, the flow is fully separated in both experiment and simulation, the coherent vortices start breaking up
and the upstream separation topology does not influence as much the flow at the probe location.
A Probes 51 and 52, the WPF levels are within 4 dB over the whole frequency range, and the WPF curve shape
matches the experimental results. These two probes illustrate again the importance of the flow topology on the WPF.
While the distance between the two probes is less than 5 mm, the flow separation happening on the airfoil suction side
is different between simulation and experiment by less than 5 mm, explaining the difference in WPF between test and
simulation at Probe 51 of about 4-5 dB. At Probe 52, the probe is in the turbulent wake of the airfoil in both experiment
and simulation, and then the WPF are within 2-3dB.
Finally, simulation and experiment are within 3dB at Probe B, between 200 Hz and 3 kHz. Experiment WPF fall
down quicker than simulation above 3 kHz while the WPF level are up to 5dB higher than simulation below 200Hz.
Since the trends are inversed at low and high frequency, the experimental flow is likely more coherent, with larger
structures and delayed turbulent eddy break up compared to simulated flow in the gap, causing the rise of WPF levels
at low frequency and decrease at high frequency. However, the differences are within the uncertainty range and thus
increase the confidence in the numerical method for solving these complex flow mechanisms and associated noise
generation.
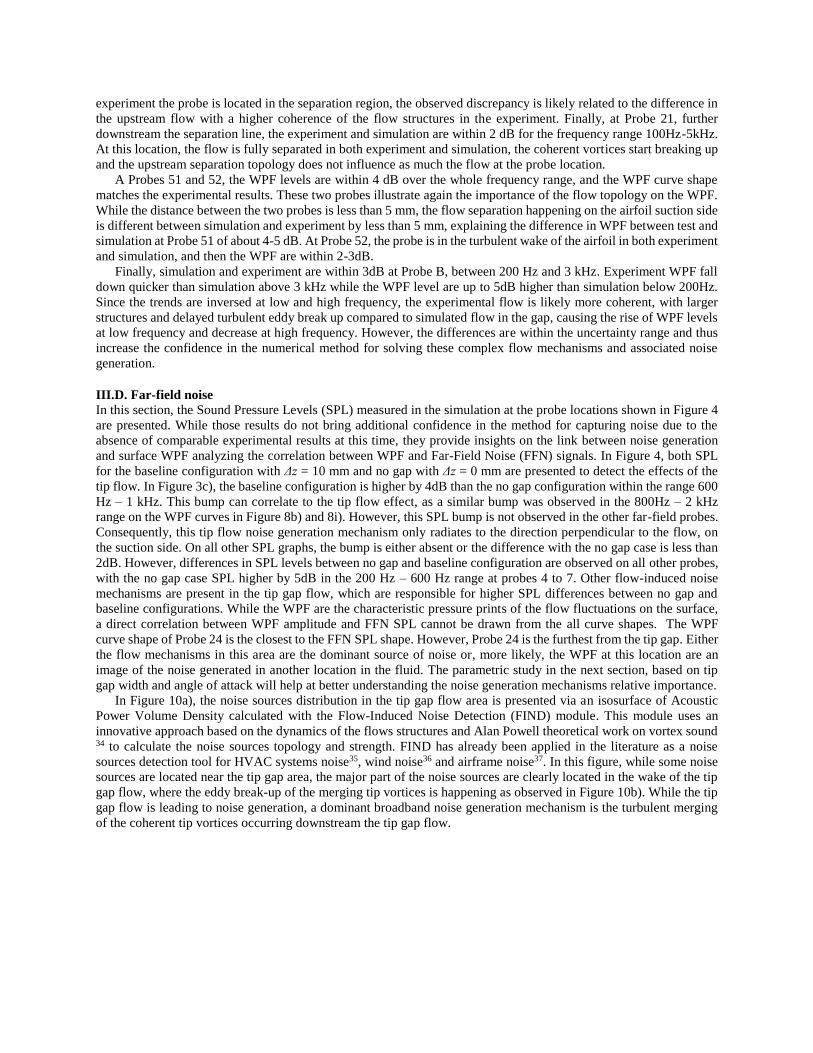
III.D. Far-field noise
In this section, the Sound Pressure Levels (SPL) measured in the simulation at the probe locations shown in Figure 4
are presented. While those results do not bring additional confidence in the method for capturing noise due to the
absence of comparable experimental results at this time, they provide insights on the link between noise generation
and surface WPF analyzing the correlation between WPF and Far-Field Noise (FFN) signals. In Figure 4, both SPL
for the baseline configuration with Δz = 10 mm and no gap with Δz = 0 mm are presented to detect the effects of the
tip flow. In Figure 3c), the baseline configuration is higher by 4dB than the no gap configuration within the range 600
Hz – 1 kHz. This bump can correlate to the tip flow effect, as a similar bump was observed in the 800Hz – 2 kHz
range on the WPF curves in Figure 8b) and 8i). However, this SPL bump is not observed in the other far-field probes.
Consequently, this tip flow noise generation mechanism only radiates to the direction perpendicular to the flow, on
the suction side. On all other SPL graphs, the bump is either absent or the difference with the no gap case is less than
2dB. However, differences in SPL levels between no gap and baseline configuration are observed on all other probes,
with the no gap case SPL higher by 5dB in the 200 Hz – 600 Hz range at probes 4 to 7. Other flow-induced noise
mechanisms are present in the tip gap flow, which are responsible for higher SPL differences between no gap and
baseline configurations. While the WPF are the characteristic pressure prints of the flow fluctuations on the surface,
a direct correlation between WPF amplitude and FFN SPL cannot be drawn from the all curve shapes. The WPF
curve shape of Probe 24 is the closest to the FFN SPL shape. However, Probe 24 is the furthest from the tip gap. Either
the flow mechanisms in this area are the dominant source of noise or, more likely, the WPF at this location are an
image of the noise generated in another location in the fluid. The parametric study in the next section, based on tip
gap width and angle of attack will help at better understanding the noise generation mechanisms relative importance.
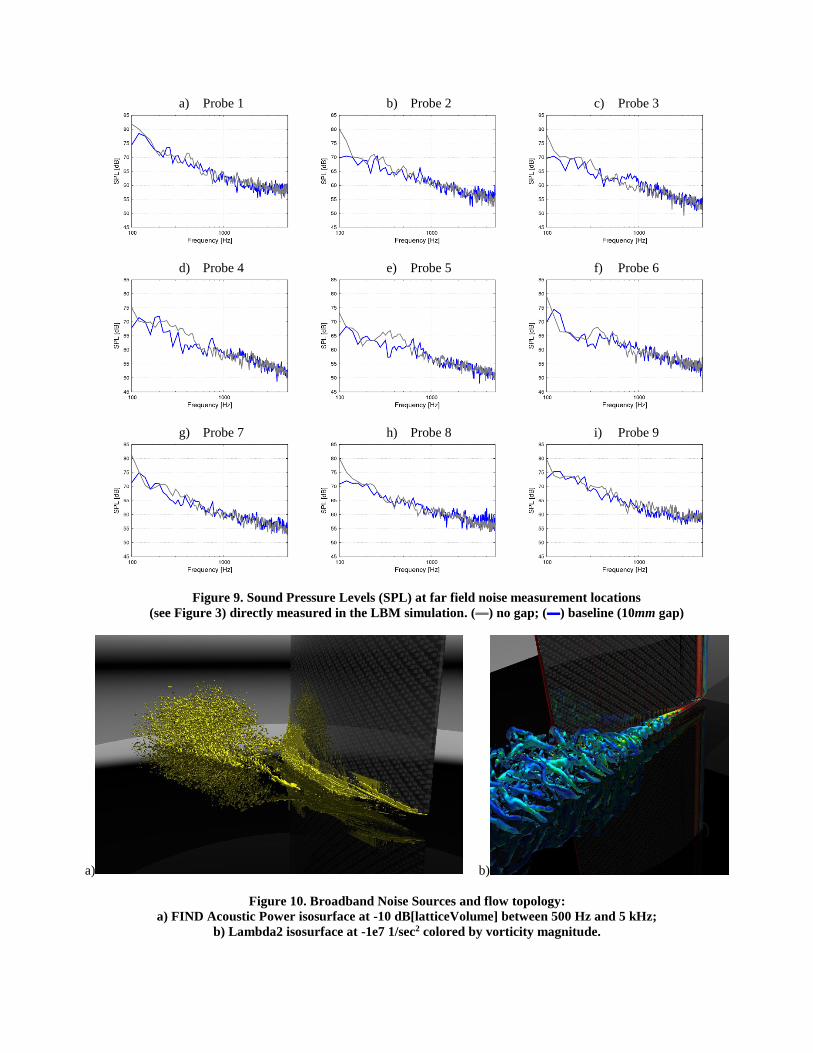
In Figure 10a), the noise sources distribution in the tip gap flow area is presented via an isosurface of Acoustic
Power Volume Density calculated with the Flow-Induced Noise Detection (FIND) module. This module uses an
innovative approach based on the dynamics of the flows structures and Alan Powell theoretical work on vortex sound 34 to calculate the noise sources topology and strength. FIND has already been applied in the literature as a noise
sources detection tool for HVAC systems noise35, wind noise36 and airframe noise37. In this figure, while some noise
sources are located near the tip gap area, the major part of the noise sources are clearly located in the wake of the tip
gap flow, where the eddy break-up of the merging tip vortices is happening as observed in Figure 10b). While the tip
gap flow is leading to noise generation, a dominant broadband noise generation mechanism is the turbulent merging
of the coherent tip vortices occurring downstream the tip gap flow.
a) Probe 1 b) Probe 2 c) Probe 3
d) Probe 4 e) Probe 5 f) Probe 6
g) Probe 7 h) Probe 8 i) Probe 9
Figure 9. Sound Pressure Levels (SPL) at far field noise measurement locations
(see Figure 3) directly measured in the LBM simulation. (▬) no gap; (▬) baseline (10mm gap)
a)
b)
Figure 10. Broadband Noise Sources and flow topology:
a) FIND Acoustic Power isosurface at -10 dB[latticeVolume] between 500 Hz and 5 kHz;
b) Lambda2 isosurface at -1e7 1/sec2 colored by vorticity magnitude.
III.E. Installation effects analysis
In this section, the analysis of the flow is focused on the installation effects related to the shear layer flow at the exit
of the wind tunnel. While the WPF results at the surface of the airfoil were validated, the general surrounding flow
must also be investigated. In addition to providing confidence in the simulation method, it brings additional insight
on some of the discrepancies observed in the previous section.
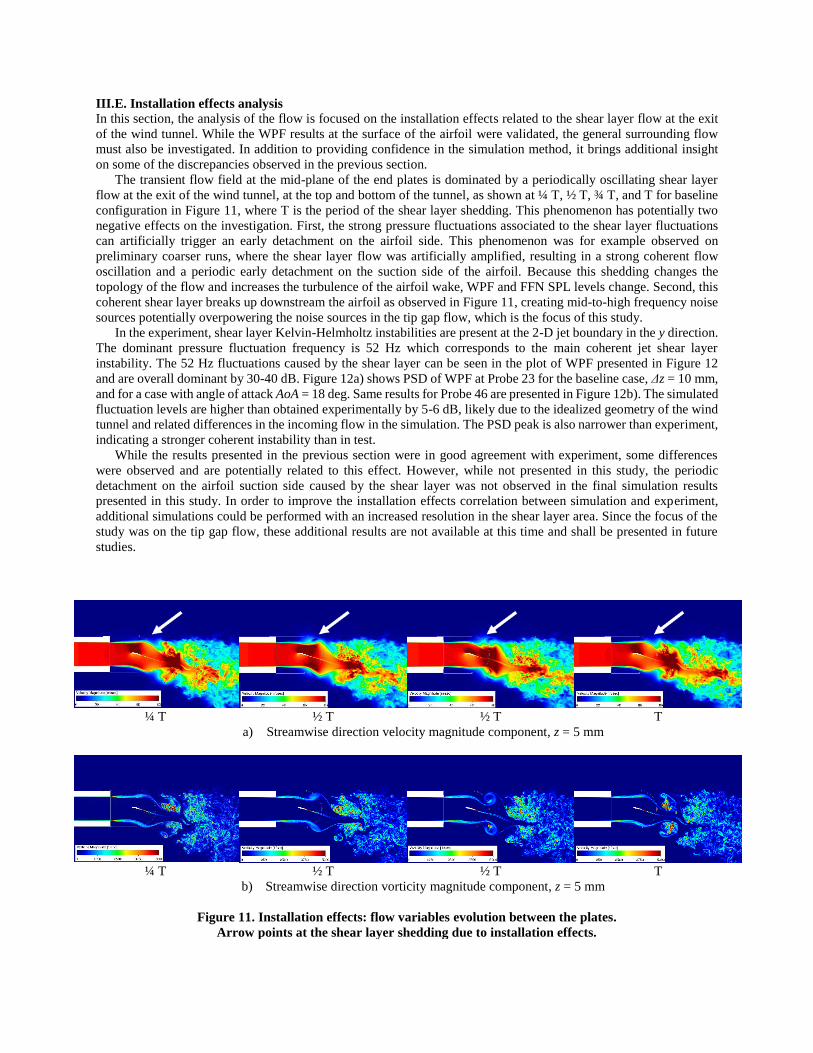
The transient flow field at the mid-plane of the end plates is dominated by a periodically oscillating shear layer
flow at the exit of the wind tunnel, at the top and bottom of the tunnel, as shown at ¼ T, ½ T, ¾ T, and T for baseline
configuration in Figure 11, where T is the period of the shear layer shedding. This phenomenon has potentially two
negative effects on the investigation. First, the strong pressure fluctuations associated to the shear layer fluctuations
can artificially trigger an early detachment on the airfoil side. This phenomenon was for example observed on
preliminary coarser runs, where the shear layer flow was artificially amplified, resulting in a strong coherent flow
oscillation and a periodic early detachment on the suction side of the airfoil. Because this shedding changes the
topology of the flow and increases the turbulence of the airfoil wake, WPF and FFN SPL levels change. Second, this
coherent shear layer breaks up downstream the airfoil as observed in Figure 11, creating mid-to-high frequency noise
sources potentially overpowering the noise sources in the tip gap flow, which is the focus of this study.
In the experiment, shear layer Kelvin-Helmholtz instabilities are present at the 2-D jet boundary in the y direction.
The dominant pressure fluctuation frequency is 52 Hz which corresponds to the main coherent jet shear layer
instability. The 52 Hz fluctuations caused by the shear layer can be seen in the plot of WPF presented in Figure 12
and are overall dominant by 30-40 dB. Figure 12a) shows PSD of WPF at Probe 23 for the baseline case, Δz = 10 mm,
and for a case with angle of attack AoA = 18 deg. Same results for Probe 46 are presented in Figure 12b). The simulated
fluctuation levels are higher than obtained experimentally by 5-6 dB, likely due to the idealized geometry of the wind
tunnel and related differences in the incoming flow in the simulation. The PSD peak is also narrower than experiment,
indicating a stronger coherent instability than in test.
While the results presented in the previous section were in good agreement with experiment, some differences
were observed and are potentially related to this effect. However, while not presented in this study, the periodic
detachment on the airfoil suction side caused by the shear layer was not observed in the final simulation results
presented in this study. In order to improve the installation effects correlation between simulation and experiment,
additional simulations could be performed with an increased resolution in the shear layer area. Since the focus of the
study was on the tip gap flow, these additional results are not available at this time and shall be presented in future
studies.
¼ T ½ T ½ T T
a) Streamwise direction velocity magnitude component, z = 5 mm
¼ T ½ T ½ T T
b) Streamwise direction vorticity magnitude component, z = 5 mm
Figure 11. Installation effects: flow variables evolution between the plates.
Arrow points at the shear layer shedding due to installation effects.
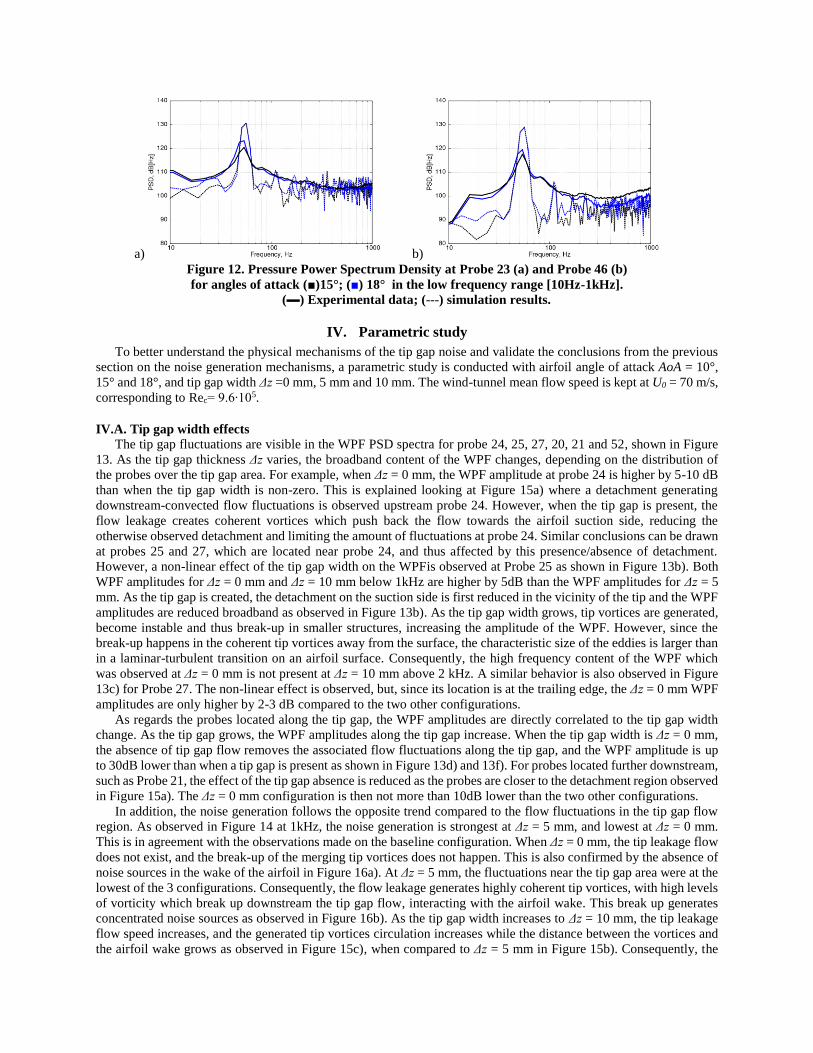
a) b)
Figure 12. Pressure Power Spectrum Density at Probe 23 (a) and Probe 46 (b)
for angles of attack (■)15°; (■) 18° in the low frequency range [10Hz-1kHz].
(▬) Experimental data; (---) simulation results.
IV. Parametric study
To better understand the physical mechanisms of the tip gap noise and validate the conclusions from the previous
section on the noise generation mechanisms, a parametric study is conducted with airfoil angle of attack AoA = 10°,
15° and 18°, and tip gap width Δz =0 mm, 5 mm and 10 mm. The wind-tunnel mean flow speed is kept at U0 = 70 m/s,
corresponding to Rec= 9.6∙105.
IV.A. Tip gap width effects
The tip gap fluctuations are visible in the WPF PSD spectra for probe 24, 25, 27, 20, 21 and 52, shown in Figure
13. As the tip gap thickness Δz varies, the broadband content of the WPF changes, depending on the distribution of
the probes over the tip gap area. For example, when Δz = 0 mm, the WPF amplitude at probe 24 is higher by 5-10 dB
than when the tip gap width is non-zero. This is explained looking at Figure 15a) where a detachment generating
downstream-convected flow fluctuations is observed upstream probe 24. However, when the tip gap is present, the
flow leakage creates coherent vortices which push back the flow towards the airfoil suction side, reducing the
otherwise observed detachment and limiting the amount of fluctuations at probe 24. Similar conclusions can be drawn
at probes 25 and 27, which are located near probe 24, and thus affected by this presence/absence of detachment.
However, a non-linear effect of the tip gap width on the WPFis observed at Probe 25 as shown in Figure 13b). Both
WPF amplitudes for Δz = 0 mm and Δz = 10 mm below 1kHz are higher by 5dB than the WPF amplitudes for Δz = 5
mm. As the tip gap is created, the detachment on the suction side is first reduced in the vicinity of the tip and the WPF
amplitudes are reduced broadband as observed in Figure 13b). As the tip gap width grows, tip vortices are generated,
become instable and thus break-up in smaller structures, increasing the amplitude of the WPF. However, since the
break-up happens in the coherent tip vortices away from the surface, the characteristic size of the eddies is larger than
in a laminar-turbulent transition on an airfoil surface. Consequently, the high frequency content of the WPF which
was observed at Δz = 0 mm is not present at Δz = 10 mm above 2 kHz. A similar behavior is also observed in Figure
13c) for Probe 27. The non-linear effect is observed, but, since its location is at the trailing edge, the Δz = 0 mm WPF
amplitudes are only higher by 2-3 dB compared to the two other configurations.
As regards the probes located along the tip gap, the WPF amplitudes are directly correlated to the tip gap width
change. As the tip gap grows, the WPF amplitudes along the tip gap increase. When the tip gap width is Δz = 0 mm,
the absence of tip gap flow removes the associated flow fluctuations along the tip gap, and the WPF amplitude is up
to 30dB lower than when a tip gap is present as shown in Figure 13d) and 13f). For probes located further downstream,
such as Probe 21, the effect of the tip gap absence is reduced as the probes are closer to the detachment region observed
in Figure 15a). The Δz = 0 mm configuration is then not more than 10dB lower than the two other configurations.
In addition, the noise generation follows the opposite trend compared to the flow fluctuations in the tip gap flow
region. As observed in Figure 14 at 1kHz, the noise generation is strongest at Δz = 5 mm, and lowest at Δz = 0 mm.
This is in agreement with the observations made on the baseline configuration. When Δz = 0 mm, the tip leakage flow
does not exist, and the break-up of the merging tip vortices does not happen. This is also confirmed by the absence of
noise sources in the wake of the airfoil in Figure 16a). At Δz = 5 mm, the fluctuations near the tip gap area were at the
lowest of the 3 configurations. Consequently, the flow leakage generates highly coherent tip vortices, with high levels
of vorticity which break up downstream the tip gap flow, interacting with the airfoil wake. This break up generates
concentrated noise sources as observed in Figure 16b). As the tip gap width increases to Δz = 10 mm, the tip leakage
flow speed increases, and the generated tip vortices circulation increases while the distance between the vortices and
the airfoil wake grows as observed in Figure 15c), when compared to Δz = 5 mm in Figure 15b). Consequently, the
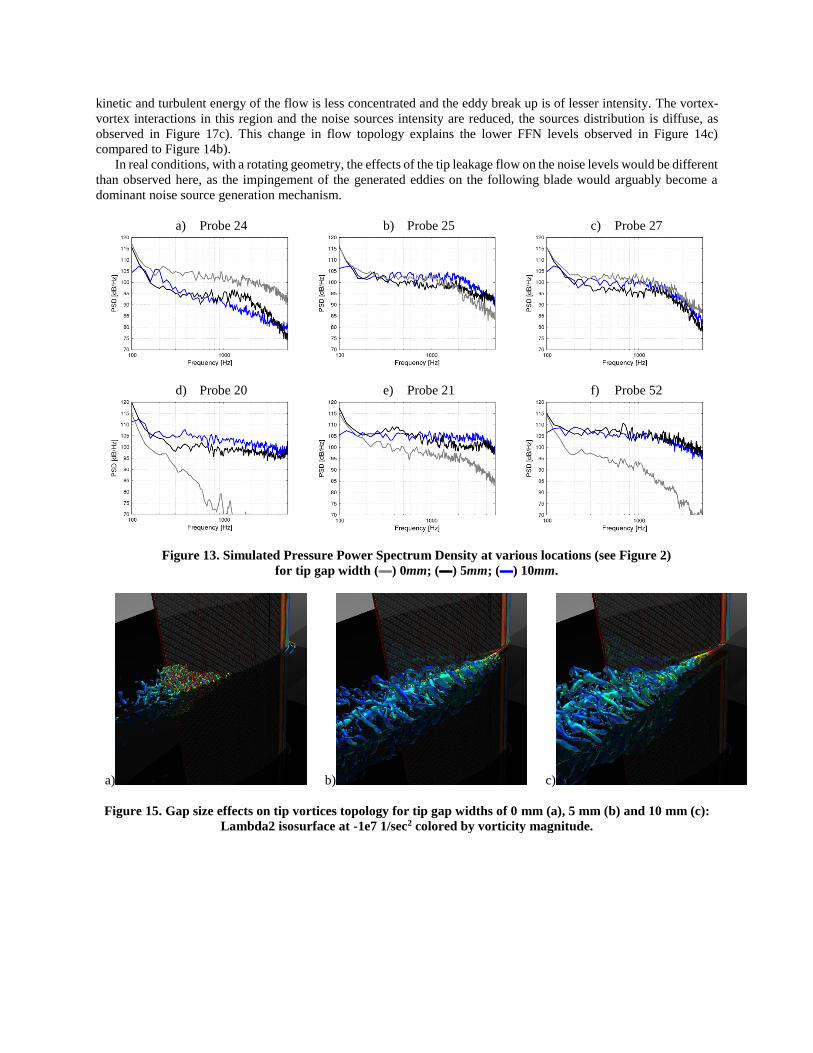
kinetic and turbulent energy of the flow is less concentrated and the eddy break up is of lesser intensity. The vortex-
vortex interactions in this region and the noise sources intensity are reduced, the sources distribution is diffuse, as
observed in Figure 17c). This change in flow topology explains the lower FFN levels observed in Figure 14c)
compared to Figure 14b).
In real conditions, with a rotating geometry, the effects of the tip leakage flow on the noise levels would be different
than observed here, as the impingement of the generated eddies on the following blade would arguably become a
dominant noise source generation mechanism.
a) Probe 24 b) Probe 25 c) Probe 27
d) Probe 20 e) Probe 21 f) Probe 52
Figure 13. Simulated Pressure Power Spectrum Density at various locations (see Figure 2)
for tip gap width (▬) 0mm; (▬) 5mm; (▬) 10mm.
a)
b) c)
Figure 15. Gap size effects on tip vortices topology for tip gap widths of 0 mm (a), 5 mm (b) and 10 mm (c):
Lambda2 isosurface at -1e7 1/sec2 colored by vorticity magnitude.
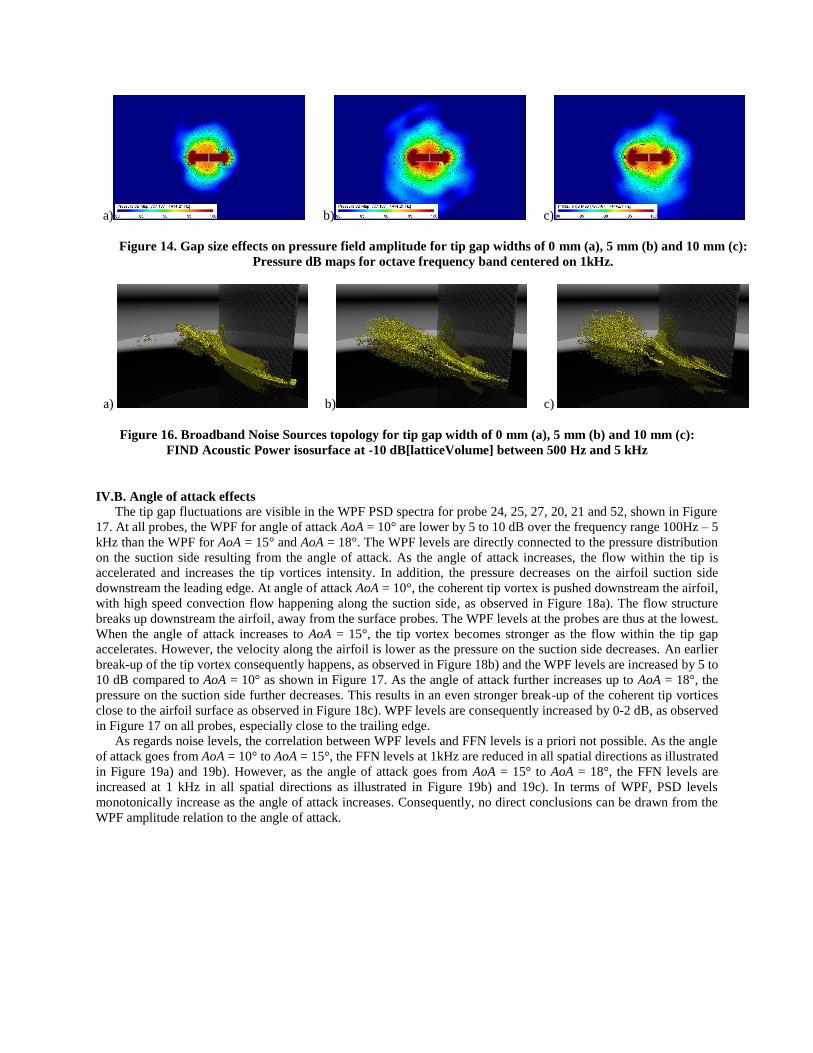
a)
b) c)
Figure 14. Gap size effects on pressure field amplitude for tip gap widths of 0 mm (a), 5 mm (b) and 10 mm (c):
Pressure dB maps for octave frequency band centered on 1kHz.
a)
b) c)
Figure 16. Broadband Noise Sources topology for tip gap width of 0 mm (a), 5 mm (b) and 10 mm (c):
FIND Acoustic Power isosurface at -10 dB[latticeVolume] between 500 Hz and 5 kHz
IV.B. Angle of attack effects
The tip gap fluctuations are visible in the WPF PSD spectra for probe 24, 25, 27, 20, 21 and 52, shown in Figure
17. At all probes, the WPF for angle of attack AoA = 10° are lower by 5 to 10 dB over the frequency range 100Hz – 5
kHz than the WPF for AoA = 15° and AoA = 18°. The WPF levels are directly connected to the pressure distribution
on the suction side resulting from the angle of attack. As the angle of attack increases, the flow within the tip is
accelerated and increases the tip vortices intensity. In addition, the pressure decreases on the airfoil suction side
downstream the leading edge. At angle of attack AoA = 10°, the coherent tip vortex is pushed downstream the airfoil,
with high speed convection flow happening along the suction side, as observed in Figure 18a). The flow structure
breaks up downstream the airfoil, away from the surface probes. The WPF levels at the probes are thus at the lowest.
When the angle of attack increases to AoA = 15°, the tip vortex becomes stronger as the flow within the tip gap
accelerates. However, the velocity along the airfoil is lower as the pressure on the suction side decreases. An earlier
break-up of the tip vortex consequently happens, as observed in Figure 18b) and the WPF levels are increased by 5 to
10 dB compared to AoA = 10° as shown in Figure 17. As the angle of attack further increases up to AoA = 18°, the
pressure on the suction side further decreases. This results in an even stronger break-up of the coherent tip vortices
close to the airfoil surface as observed in Figure 18c). WPF levels are consequently increased by 0-2 dB, as observed
in Figure 17 on all probes, especially close to the trailing edge.
As regards noise levels, the correlation between WPF levels and FFN levels is a priori not possible. As the angle
of attack goes from AoA = 10° to AoA = 15°, the FFN levels at 1kHz are reduced in all spatial directions as illustrated
in Figure 19a) and 19b). However, as the angle of attack goes from AoA = 15° to AoA = 18°, the FFN levels are
increased at 1 kHz in all spatial directions as illustrated in Figure 19b) and 19c). In terms of WPF, PSD levels
monotonically increase as the angle of attack increases. Consequently, no direct conclusions can be drawn from the
WPF amplitude relation to the angle of attack.
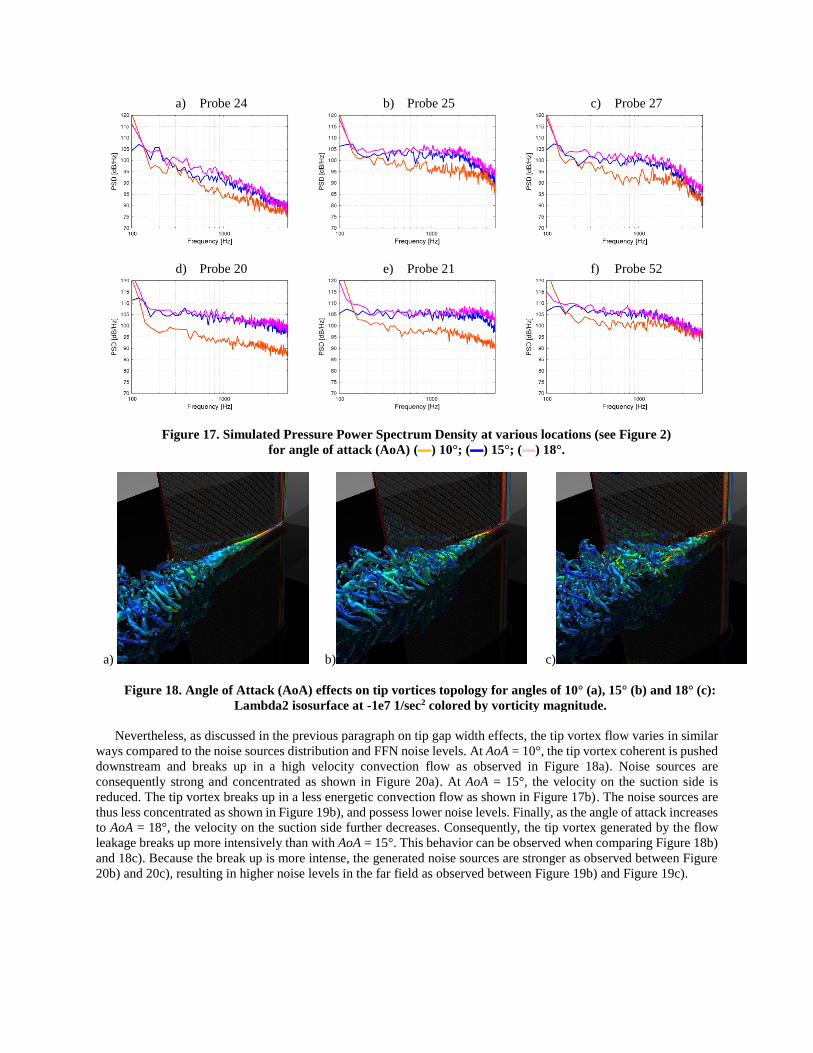
a) Probe 24 b) Probe 25 c) Probe 27
d) Probe 20 e) Probe 21 f) Probe 52
Figure 17. Simulated Pressure Power Spectrum Density at various locations (see Figure 2)
for angle of attack (AoA) (▬) 10°; (▬) 15°; (▬) 18°.
a)
b) c)
Figure 18. Angle of Attack (AoA) effects on tip vortices topology for angles of 10° (a), 15° (b) and 18° (c):
Lambda2 isosurface at -1e7 1/sec2 colored by vorticity magnitude.
Nevertheless, as discussed in the previous paragraph on tip gap width effects, the tip vortex flow varies in similar
ways compared to the noise sources distribution and FFN noise levels. At AoA = 10°, the tip vortex coherent is pushed
downstream and breaks up in a high velocity convection flow as observed in Figure 18a). Noise sources are
consequently strong and concentrated as shown in Figure 20a). At AoA = 15°, the velocity on the suction side is
reduced. The tip vortex breaks up in a less energetic convection flow as shown in Figure 17b). The noise sources are
thus less concentrated as shown in Figure 19b), and possess lower noise levels. Finally, as the angle of attack increases
to AoA = 18°, the velocity on the suction side further decreases. Consequently, the tip vortex generated by the flow
leakage breaks up more intensively than with AoA = 15°. This behavior can be observed when comparing Figure 18b)
and 18c). Because the break up is more intense, the generated noise sources are stronger as observed between Figure
20b) and 20c), resulting in higher noise levels in the far field as observed between Figure 19b) and Figure 19c).
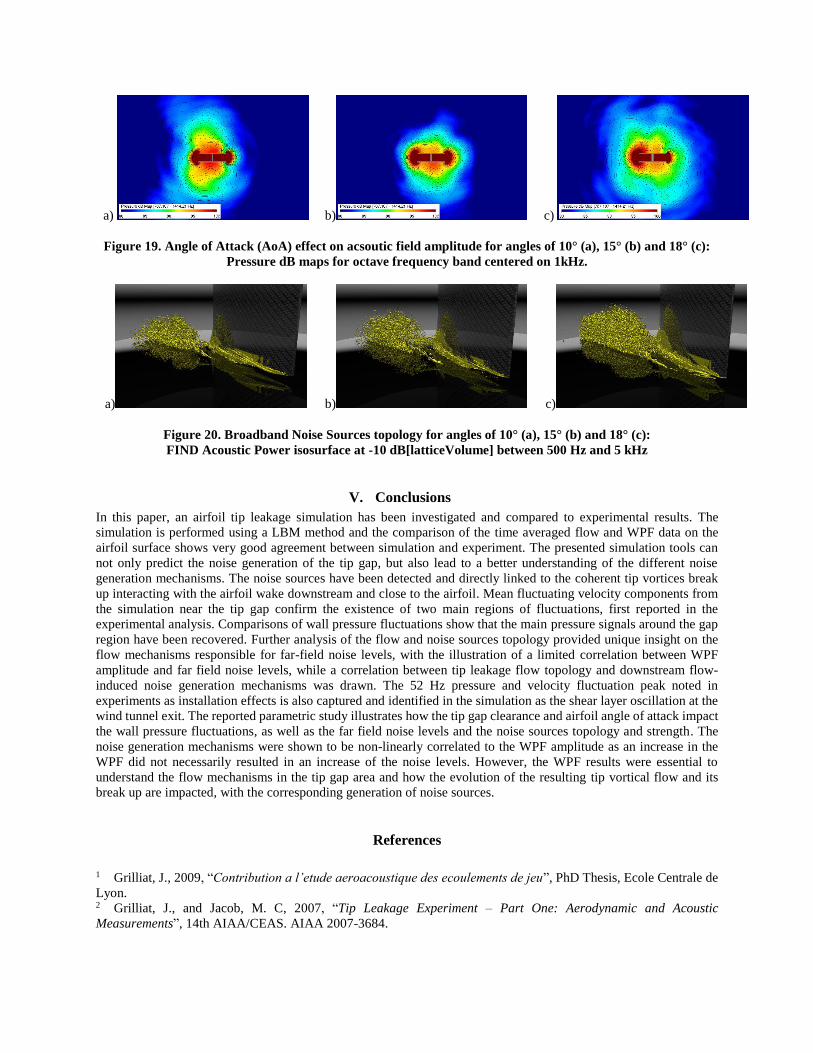
a)
b) c)
Figure 19. Angle of Attack (AoA) effect on acsoutic field amplitude for angles of 10° (a), 15° (b) and 18° (c):
Pressure dB maps for octave frequency band centered on 1kHz.
a)
b) c)
Figure 20. Broadband Noise Sources topology for angles of 10° (a), 15° (b) and 18° (c):
FIND Acoustic Power isosurface at -10 dB[latticeVolume] between 500 Hz and 5 kHz
V. Conclusions
In this paper, an airfoil tip leakage simulation has been investigated and compared to experimental results. The
simulation is performed using a LBM method and the comparison of the time averaged flow and WPF data on the
airfoil surface shows very good agreement between simulation and experiment. The presented simulation tools can
not only predict the noise generation of the tip gap, but also lead to a better understanding of the different noise
generation mechanisms. The noise sources have been detected and directly linked to the coherent tip vortices break
up interacting with the airfoil wake downstream and close to the airfoil. Mean fluctuating velocity components from
the simulation near the tip gap confirm the existence of two main regions of fluctuations, first reported in the
experimental analysis. Comparisons of wall pressure fluctuations show that the main pressure signals around the gap
region have been recovered. Further analysis of the flow and noise sources topology provided unique insight on the
flow mechanisms responsible for far-field noise levels, with the illustration of a limited correlation between WPF
amplitude and far field noise levels, while a correlation between tip leakage flow topology and downstream flow-
induced noise generation mechanisms was drawn. The 52 Hz pressure and velocity fluctuation peak noted in
experiments as installation effects is also captured and identified in the simulation as the shear layer oscillation at the
wind tunnel exit. The reported parametric study illustrates how the tip gap clearance and airfoil angle of attack impact
the wall pressure fluctuations, as well as the far field noise levels and the noise sources topology and strength. The
noise generation mechanisms were shown to be non-linearly correlated to the WPF amplitude as an increase in the
WPF did not necessarily resulted in an increase of the noise levels. However, the WPF results were essential to
understand the flow mechanisms in the tip gap area and how the evolution of the resulting tip vortical flow and its
break up are impacted, with the corresponding generation of noise sources.
References
1 Grilliat, J., 2009, “Contribution a l’etude aeroacoustique des ecoulements de jeu”, PhD Thesis, Ecole Centrale de
Lyon. 2 Grilliat, J., and Jacob, M. C, 2007, “Tip Leakage Experiment – Part One: Aerodynamic and Acoustic
Measurements”, 14th AIAA/CEAS. AIAA 2007-3684.
3 Jacob, M. C., Grilliat, J., Camussi, R., and Gennaro, G. C., 2010, “Aeroacoustic investigation of a single airfoil tip
leakage flow”, International Journal of Aeroacoustics, Vol. 9-3, pp. 253-272. 4 Jacob, M. C., Grilliat, J., Roger, M., and Camussi, R., “Aeroacoustic Investigation of a Tip Clearance Flow”, 14th
ICSV 2007. 5 Frisch, U., Hasslacher, B. and Pomeau, Y., 1986, “Lattice-gas Automata for the Navier-Stokes Equations”, Phys.
Rev. Lett., Vol. 56, pp.1505-1508. 6 Chen, H., Teixeira, C. and Molvig, K., 1997, “Digital physics approach to computational fluid dynamics: Some
basic theoretical features”, Intl. J. Mod. Phys. C 9 (8), 675. 7 Guo, Z., Zhen, C. and Shi, B., 2002, “Discrete lattice effects on the forcing term in the lattice Boltzmann method”,
Phys. Rev. E, 65, 046308. 8 Li, Y., Shock, R., Zhang, R., and Chen, H., 2004, “Numerical Study of Flow Past an Impulsively Started Cylinder
by Lattice Boltzmann Method” J. Fluid Mech., Vol. 519, pp. 273-300. 9 Shan, X. and Chen, H., 2007, “A general multiple-relaxation-time Boltzmann collision model”, International
Journal of Modern Physics C 18, 635 10 Shan, X. and Chen, H., 1993, “Lattice Boltzmann model for simulating flows with multiple phases and
components”, Phys. Rev. E, 47, 1815-1819. 11 Zhang, R., Shan, X. and Chen, H., 2006, “Efficient Kinetic Method for fluid simulation beyond Navier-Stokes
equation”, Phys. Rev. E, 74, 046703. 12 Thantanapally, C., Singh, S., Succi, S., and Ansumali, S., 2013, “Quasi-equilibrium lattice Boltzmann models with
tunable Prandtl number for incompressible hydrodynamics”, International Journal of Modern Physics C 24 (12),
1340004. 13 Moron, P., Powel, R., Freed, D., Pérot, F., Crouse, B., Neuhierl, B., Ullrich, F., Holl, M., Waibl, A., Fertl, C.,
2009,“A CFD/SEA approach for prediction of vehicle interior noise due to wind noise”, SAE 2009 Noise and
Vibration Conference and Exhibition, 2009-01-2203. 14 Brès, G.A., Pérot, F., Freed, D., 2009, “Properties of the Lattice-Boltzmann Method for Acoustics”, AIAA paper
2009-3395. 15 Casalino, D., Ribeiro, A., Fares, E., 2014, " Facing rim cavities fluctuation modes", Journal of Sound and Vibration
333 (2014) 2812–2830 16 Oettle, N., Meskine, M., Senthooran, S., Bissell, A., Balasubramanian, G., Powell, R., 2015,“A Computational
Approach to Assess Buffeting and Broadband Noise Generated by a Vehicle Sunroof”, SAE World Congress, 2015-
01-1532 17 Mann, A., Kim, M., Neuhierl, B., Perot, F. et al., 2015, "Exhaust and Muffler Aeroacoustics Predictions using
Lattice Boltzmann Method", SAE Int. J. Passeng. Cars - Mech. Syst. 8(3):1009-1017, 2015, doi:10.4271/2015-01-
2314. 18 Pérot, F., Kim, M. S., Moreau, S., Henner, M., Neal, D., 2010, “Direct aeroacoustic prediction of a low-speed
axial fan”, AIAA paper 2010-3887. 19 Pérot, F., Kim, M. S., Moreau, S., Neal, D., 2010, “Investigation of the flow generated by an axial 3-blade fan”,
13th ISROMAC 2010-082. 20 Pérot, F., Kim, M. S., Meskine, M., Freed, D., 2012, “NREL wind turbine aerodynamic validation and noise
predictions using Lattice Boltzmann Method”, AIAA paper 2012-2290. 21 Mann, A., Pérot, F., Kim, M., Casalino, D., Fares, E., 2012, “Advanced Noise Control Fan Direct Aeroacoustics
Predictions using a Lattice-Boltzmann Method”, AIAA paper 2012-2287. 22 Pérot, F., Wada, K., Norisada, K., Kitada, M., Hirayama, S., Sakai, M., Imahigasi, S., Sasaki, N., 2011, “HVAC
Blower Aeroacoustics Predictions Based on the Lattice Boltzmann Method”, AJK2011-23018, AJK Conference,
Hamamatsu, Japan. 23 Pérot, F., Meskine, M., Le Goff, V., Vidal, V., Gille, F., Vergne, S., Dupuy, F., 2012, “Flow-induced noise
predictions of complete HVAC systems using Lattice-Botlzmann Method”, SIA 7th Automotive and Railway Comfort
Conference 2012. 24 Aissaoui, A., Tupake, R., Bijwe, V., Meskine, M. et al., 2015, "Flow-Induced Noise Optimization of SUV HVAC
System using a Lattice Boltzmann Method" SAE Int. J. Passeng. Cars - Mech. Syst. 8(3):1053-1062, 2015,
doi:10.4271/2015-01-2323. 25 Bhatnagar, P., Gross, E. and Krook, M., 1954, “A model for collision processes in gases. I. small amplitude
processes in charged and neutral one-component systems”, Phys. Rev., vol.94, pp.511-525. 26 Chapman, S. and Cowling, T., 1990, “The Mathematical Theory of Non-Uniform Gases”, Cambridge University
Press.
27 Chen, H., Chen, S., Matthaeus, W. H., 1992, "Recovery of the Navier-Stokes equations through a lattice gas
Boltzmann equation method", Physical Review A, vol.45, 5339. 28 Chen, H., Kandasamy, S., Orszag, S., Shock, R., Succi, S. and Yakhot, V., 2003, “Extended Boltzmann Kinetic
Equation for Turbulent Flows”, Science, Vol. 301, pp. 633-636. 29 Yakhot, V., 2003, “Extended Boltzmann Kinetic Equation for Turbulent Flows”, Science, Vol. 301, pp. 633-636 30 Chen, H., 1998, “Volumetric Formulation of the Lattice Boltzmann Method for Fluid Dynamics: Basic Concept”,
Phys. Rev. E, Vol. 58, pp. 3955-3963. 31 Chen, H., Orszag, S., Staroselsky, I. and Succi, S., 2004, “Expanded Analogy between Boltzmann Kinetic Theory
of Fluid and Turbulence”, J. Fluid Mech., Vol. 519, pp. 307-314. 32 Chen, H., Goldhirsh, I., Orszag, S., 2008, “Discrete rotational symmetry, moment isotropy, and higher order lattice
Boltzmann models" J. Sci. Computing, Vol. 34, Iss. 1, pp 87-112. 33 Chen, H., Teixeira, C., Molvig, K., 1998, “Realization of Fluid Boundary Conditions via Discrete Boltzmann
Dynamics”, Intl J. Mod. Phys. C, Vol. 9 (8), pp. 1281-1292. 34 Powell, A. 1964 “Theory of vortex sound” Journal of the Acoustical Society of America, 36(1), pp. 177–195. 35 Mann, A., Pérot, F., Meskine, M., Kim, M.-S., 2015, “Designing quieter HVAC systems coupling LBM and flow-
induced noise source identification methods”, 10th FKFS-Conference, Progress in Vehicle Aerodynamics and Thermal
Management 36 Senthooran, S., Powell, R., Choi, E.S., Cyr, S., 2015, “Computational prediction of interior noise for design
variations on a simplified vehicle”, Internoise 2015. 37 Rougier, T., Bouvy. Q., Casalino, D., Appelbaum, J., Kleinclaus, C., 2015, "Design of quieter landing gears
through lattice-Boltzmann CFD simulations", AIAA 2015-3259.
Related Documents