Aircraft Market Indices and Aircraft Financing Prepared for the ERA Regional Airline Conference 2015 | Rome, April 15 th , 2015

Welcome message from author
This document is posted to help you gain knowledge. Please leave a comment to let me know what you think about it! Share it to your friends and learn new things together.
Transcript
Aircraft Market Indices and Aircraft Financing
Prepared for the ERA Regional Airline Conference 2015 | Rome, April 15th, 2015

Aircraft Market Indices and Aircraft Finance | Prepared for ERA Regional Airline Conference 2015
Table of Contents
1
2
9
18
21
26
Key Market Factors for Lessors and Lenders ……….…………………………….………
Key Credit Considerations that Drive Lessors and Lenders ………………………..
Key Financing Considerations For Airlines ………………………………………………...
Aircraft Financing Alternatives ………………..……………………………………………….
Concluding Observations/Guidance For Regional Airline Financing ………….

Aircraft Market Indices and Aircraft Finance | Prepared for ERA Regional Airline Conference 2015
2
KEY MARKET FACTORS FOR LENDERS AND LESSORS
Aircraft Market Indices and Aircraft Finance | Prepared for ERA Regional Airline Conference 2015
Key Drivers for Lenders and Lessors
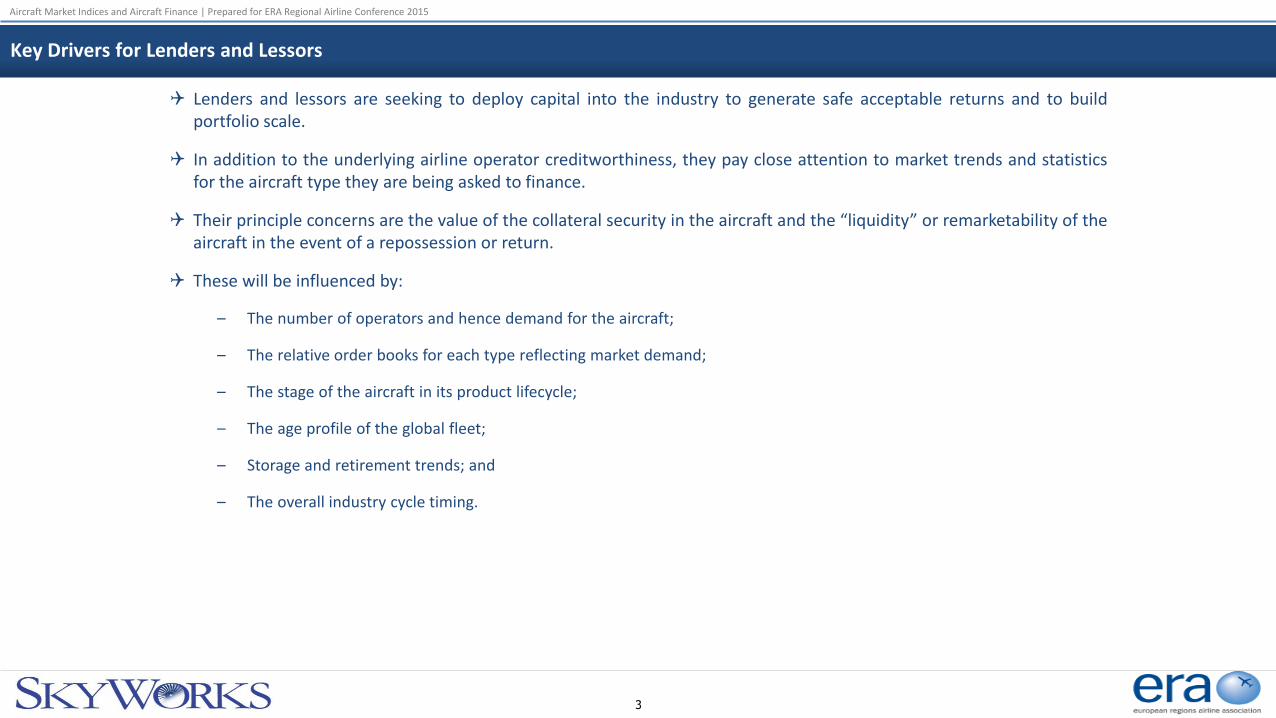
Lenders and lessors are seeking to deploy capital into the industry to generate safe acceptable returns and to build portfolio scale.
In addition to the underlying airline operator creditworthiness, they pay close attention to market trends and statistics for the aircraft type they are being asked to finance.
Their principle concerns are the value of the collateral security in the aircraft and the “liquidity” or remarketability of the aircraft in the event of a repossession or return.
These will be influenced by:
– The number of operators and hence demand for the aircraft;
– The relative order books for each type reflecting market demand;
– The stage of the aircraft in its product lifecycle;
– The age profile of the global fleet;
– Storage and retirement trends; and
– The overall industry cycle timing.
3
Aircraft Market Indices and Aircraft Finance | Prepared for ERA Regional Airline Conference 2015
SkyWorks Aircraft Valuation Index (“AVI”)
4
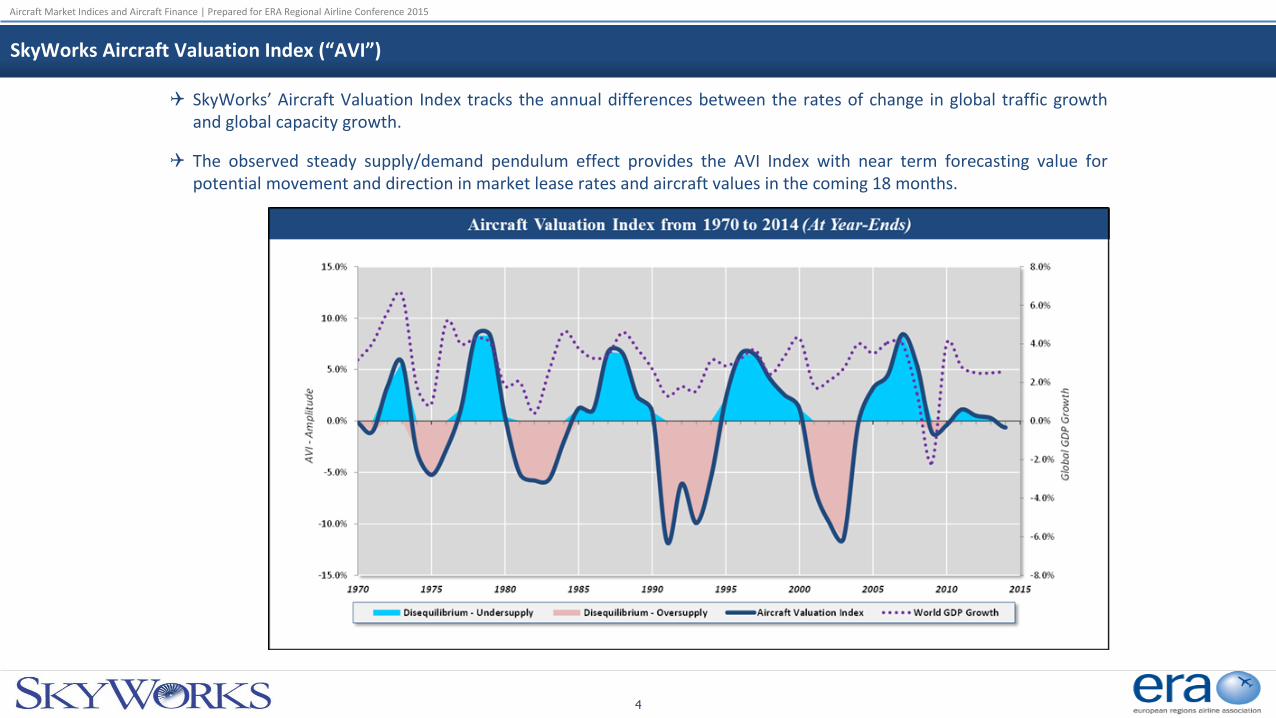
SkyWorks’ Aircraft Valuation Index tracks the annual differences between the rates of change in global traffic growth and global capacity growth.
The observed steady supply/demand pendulum effect provides the AVI Index with near term forecasting value for potential movement and direction in market lease rates and aircraft values in the coming 18 months.

Aircraft Market Indices and Aircraft Finance | Prepared for ERA Regional Airline Conference 2015
Select Large Regional Aircraft Appraisal Values
5
Current Market Value ($mm) Base Value ($mm)
Build Year 1999 2004 2009 2014
Modern Regional Jets > 50 Seats Modern Regional Jets > 50 Seats
CRJ-700 7.90 9.25 12.75 21.00
CRJ-900 N/A 11.10 14.60 23.00
E-170LR N/A 13.00 16.65 25.35
E-175LR N/A N/A 18.80 27.65
Modern Turboprops Modern Turboprops
ATR 42-500 5.65 7.30 9.95 N/A
ATR 42-600 N/A N/A N/A 15.30
ATR 72-500 7.50 10.10 13.80 N/A
ATR 72-600 N/A N/A N/A 20.20
Dash 8-400 6.75 8.50 12.00 19.20
Base Value ($mm) Market Lease Rates ($mm)
Build Year 1999 2004 2009 2014
Modern Regional Jets > 50 Seats Modern Regional Jets > 50 Seats
CRJ-700 9.66 10.67 14.34 24.15
CRJ-900 N/A 12.78 16.79 26.53
E-170LR N/A 13.74 17.48 25.85
E-175LR N/A N/A 19.50 27.97
Modern Turboprops Modern Turboprops
ATR 42-500 4.77 6.39 9.16 N/A
ATR 42-600 N/A N/A N/A 15.45
ATR 72-500 6.92 9.55 13.37 N/A
ATR 72-600 N/A N/A N/A 20.40
Dash 8-400 7.26 8.78 12.50 20.15
Market Lease Rates ($mm)
Build Year 1999 2004 2009 2014
Modern Regional Jets > 50 Seats
CRJ-700 0.095 0.120 0.155 0.235
CRJ-900 N/A 0.145 0.180 0.260
E-170LR N/A 0.145 0.170 0.245
E-175LR N/A N/A 0.175 0.250
Modern Turboprops
ATR 42-500 0.071 0.091 0.114 N/A
ATR 42-600 N/A N/A N/A 0.145
ATR 72-500 0.085 0.110 0.135 N/A
ATR 72-600 N/A N/A N/A 0.185
Dash 8-400 0.100 0.125 0.150 0.185
1. Values and lease rates are based on half-life aircraft with Ascend default specifications.
2. Source: Ascend Database as of 8/21/2014. 2014 Data

Aircraft Market Indices and Aircraft Finance | Prepared for ERA Regional Airline Conference 2015
ATR 72-500/600 World Fleet Overview
6
ATR 72-500/600 Current Fleet Overview
Fleet Status Quantity Region Aircraft
Aircraft in Service 472 Europe 136
Aircraft in Storage 28 North America 2
Aircraft on Order 294 Asia-Pacific 220
Number of Operators* 93 Latin America 91
Number of Lessors 25 Africa 40
Lessor Fleet** 185 Middle East 11
Lessor Orders 103 Unknown -
Lessor Orders Placed with Customers 311 Only included aircraft for commercial use. Source: Ascend database as of 8/19/2014.
* Includes only aircraft in service and in storage.
** Includes owned and managed aircraft in service and in storage.
Geographic Distribution of ATR 72-500/600 Aircraft
Latin America 18%
North America0.4%
Africa8%
Europe27%
Middle East2%
Asia-Pacific44%
Top 10 ATR 72-500/600 Operators
Operator Aircraft
Azul 49
Wings Air 28
JetKonnect 18
UTair Express 15
Mount Cook Airline 15
FireFly 15
MASWings 13
Virgin Australia 13
Air Algerie 12
Flybe Nordic 12
Vietnam Airlines 12
Total Top 10 Operators 202
Total (All Operators) 483
Top 10 ATR 72-500/600 Lessors
Lessor Aircraft
Nordic Aviation Capital 49
Air Lease Corporation 19
GECAS 15
Avation Plc 15
Investec Bank 12
TAT Leasing Services Ltd 10
Avinco Ltd 10
Showa Leasing Co Ltd 10
Transportation Partners Pte Ltd 8
Erik Thun AB 5
Vietnam Aircraft Leasing Company 5
Total Top 10 Lessors 158
Total (All Lessors) 185
Top 10 ATR 72-500/600 Orderbooks
Owner Aircraft
Unannounced commercial customer 65
Nordic Aviation Capital 43
Wings Air 22
DAE Capital 19
Azul 15
GECAS 11
Passaredo Transportes Aereos 10
Avation Plc 10
Synergy Aerospace 10
Air Lease Corporation 10
Top Customer Orders 215
Total (All Orders) 294
2014 Data

Aircraft Market Indices and Aircraft Finance | Prepared for ERA Regional Airline Conference 2015
Turboprop Liquidity and Storage by Aircraft Type
7
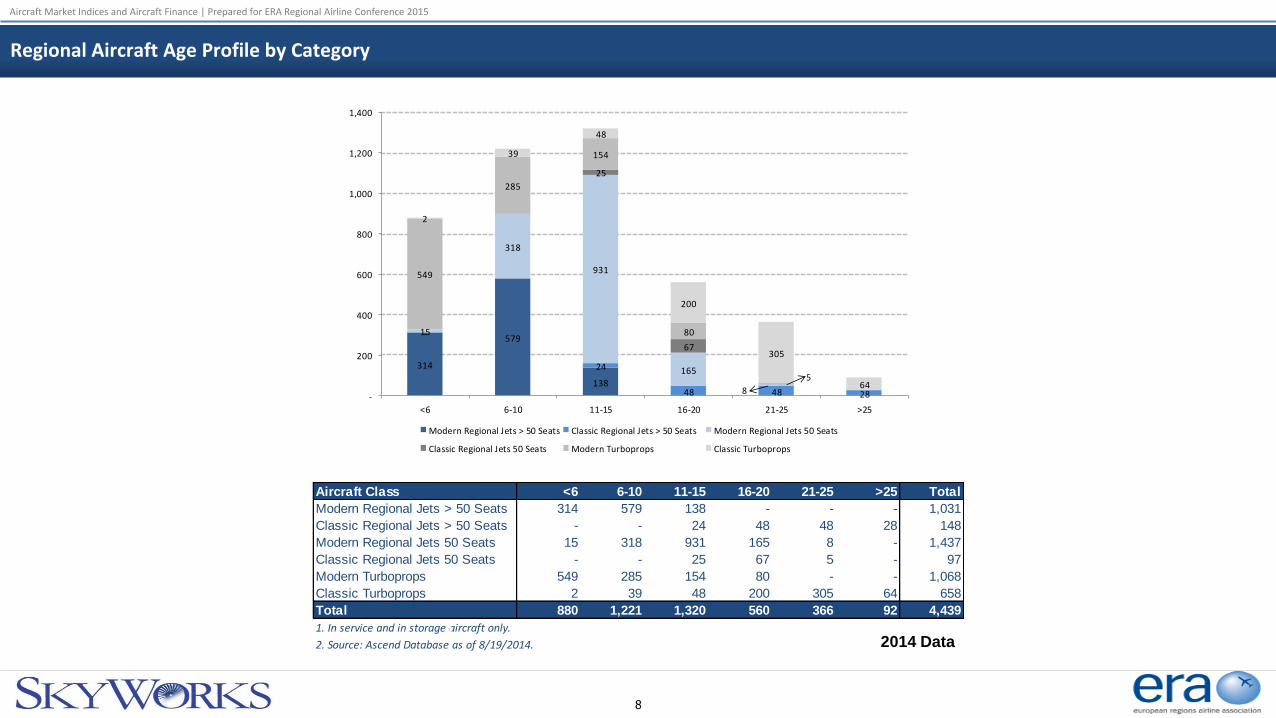
Total number of operators and total number of aircraft in service are key metrics for determining the ‘liquidity’ or ease of remarketing of an aircraft type.
The Dash-8 and ATR families that are in production today remain popular models among operators worldwide.
Source: Ascend Fleets database as of October 2, 2014.
Dash 8-100
Saab 340B EMB-120 Brasilia
ATR 42-300ATR 42-500
Dash 8-200
Dornier 328Saab 340A
Bombardier 3600
50
100
150
200
250
0 10 20 30 40 50 60 70 80 90
Nu
mb
er
of
Air
craf
t
Number of Operators
Turboprop Aircraft Liquidity (30-49 Seats)
24%
11%
50%
8%
8%
28%
18%
38%
23%
0% 10% 20% 30% 40% 50%
ATR 42-300
ATR 42-500
Bombardier 360
Dash 8-100
Dash 8-200
EMB-120 Brasilia
Dornier 328
Saab 340A
Saab 340B
% of Aircraft in Storage
Select Turboprop Storage Ratios (30-49 Seats)
2014 Data
Aircraft Market Indices and Aircraft Finance | Prepared for ERA Regional Airline Conference 2015
Regional Aircraft Age Profile by Category
8
314
579
138
-
24
48 48 28
15
318
931
165
8
25
67
5
549
285
154
80
2
39
48
200
305
64-
200
400
600
800
1,000
1,200
1,400
<6 6-10 11-15 16-20 21-25 >25
Modern Regional Jets > 50 Seats Classic Regional Jets > 50 Seats Modern Regional Jets 50 Seats
Classic Regional Jets 50 Seats Modern Turboprops Classic Turboprops
Aircraft Class <6 6-10 11-15 16-20 21-25 >25 Total
Modern Regional Jets > 50 Seats 314 579 138 - - - 1,031
Classic Regional Jets > 50 Seats - - 24 48 48 28 148
Modern Regional Jets 50 Seats 15 318 931 165 8 - 1,437
Classic Regional Jets 50 Seats - - 25 67 5 - 97
Modern Turboprops 549 285 154 80 - - 1,068
Classic Turboprops 2 39 48 200 305 64 658
Total 880 1,221 1,320 560 366 92 4,439
1. In service and in storage aircraft only.
2. Source: Ascend Database as of 8/19/2014. 2014 Data
Aircraft Market Indices and Aircraft Finance | Prepared for ERA Regional Airline Conference 2015
9
KEY CREDIT CONSIDERATIONS THAT DRIVE LENDERS AND LESSORS

Aircraft Market Indices and Aircraft Finance | Prepared for ERA Regional Airline Conference 2015
Key Lender/Lessor Credit Considerations
Most lenders and lessors have robust credit review processes that they employ to select and approve airline customers for whom they are willing and able to provide financing.
Classic credit analysis involves an in-depth quantitative analysis of:
– Operating profitability;
– Cash flow adequacy;
– Capital structure;
– Financial flexibility; and
– Unencumbered Assets.
The quantitative financial analysis will be supported by a qualitative assessment that typically focuses on the following key areas:
– Route structures;
– Management team;
– Cost structure;
– Financial flexibility;
– Technology, including fleet and IT systems;
– Brand loyalty; and
– Government support.
These are often referred to as Key Success Factors.
10

Aircraft Market Indices and Aircraft Finance | Prepared for ERA Regional Airline Conference 2015
Key Success Factors – Route System
The key attributes of the Route System considered are:
– For major international airlines
• Dominant position at key hub(s)
• Breadth of network and diversity of revenue streams across different geographies
• Insulation from major global conflicts
• Exposure to Low Cost Carriers and other competition
– Niche Carriers
• Exclusivity on routes, due to some combinations of:
Geographic isolation
Government protection
Low fares which cannot be matched due to uncompetitive cost structure
The key metrics are:
– Percentage of total traffic at hub airports/main base
– Geographic breakdown of revenues.
11
Aircraft Market Indices and Aircraft Finance | Prepared for ERA Regional Airline Conference 2015
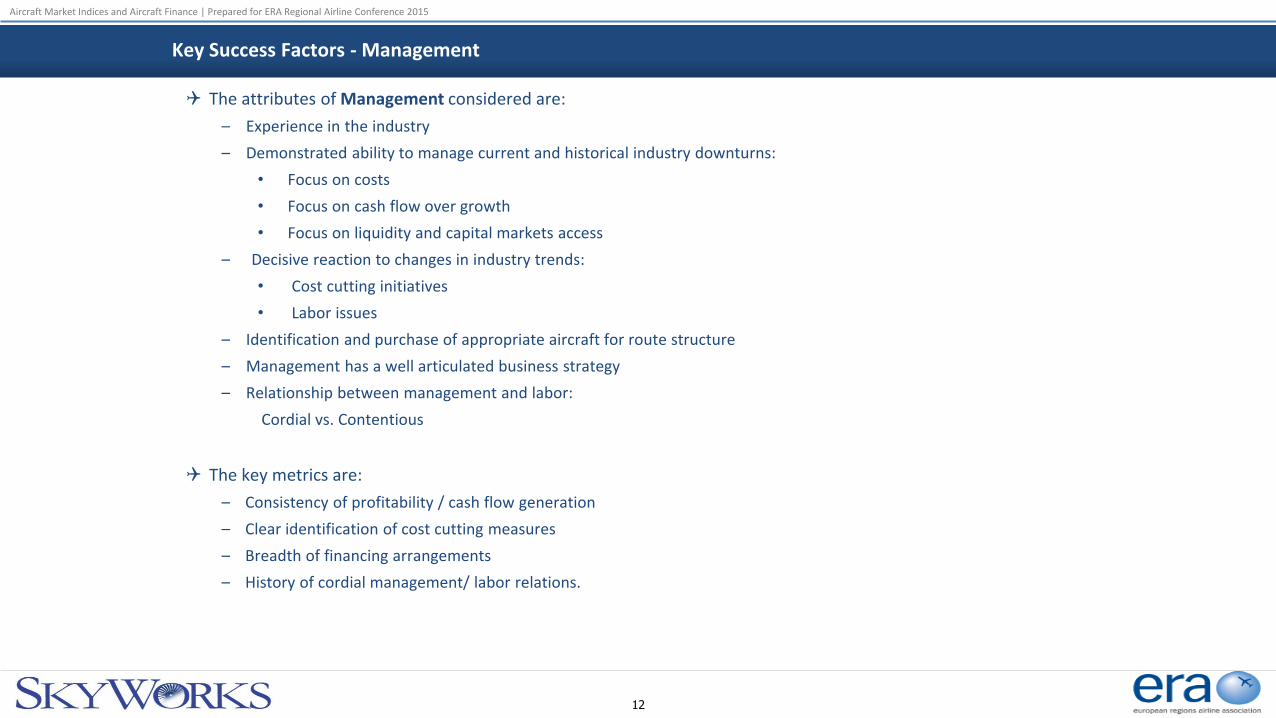
The attributes of Management considered are:
– Experience in the industry
– Demonstrated ability to manage current and historical industry downturns:
• Focus on costs
• Focus on cash flow over growth
• Focus on liquidity and capital markets access
– Decisive reaction to changes in industry trends:
• Cost cutting initiatives
• Labor issues
– Identification and purchase of appropriate aircraft for route structure
– Management has a well articulated business strategy
– Relationship between management and labor:
Cordial vs. Contentious
The key metrics are:
– Consistency of profitability / cash flow generation
– Clear identification of cost cutting measures
– Breadth of financing arrangements
– History of cordial management/ labor relations.
Key Success Factors - Management
12

Aircraft Market Indices and Aircraft Finance | Prepared for ERA Regional Airline Conference 2015
The attributes of Cost Structure considered are:
– Unit costs (CASM) at or below unit revenue (RASM)
– Competitive unit costs(CASM) with direct competition on any route
Effective cost structure achieved through:
– Competitive labor costs:
• Open contract negotiations, wage rates
• Flexibility (or lack thereof ) of scope clauses
• Employee productivity
• % of workforce unionized / Non-unionized
– Economies of scale:
• Purchasing of aircraft and fuel, including use of fuel hedges
– Fleet simplification and maintenance costs
– Operating efficiency:
• Utilization (block hours per day)
The key metrics are:
– CASM relative to industry average and company specific RASM
– Labor contract negotiations/status
– Fuel hedging
– Aircraft utilization
– Scope clause restrictions (mostly US only).
Key Success Factors – Cost Structure
13
Aircraft Market Indices and Aircraft Finance | Prepared for ERA Regional Airline Conference 2015
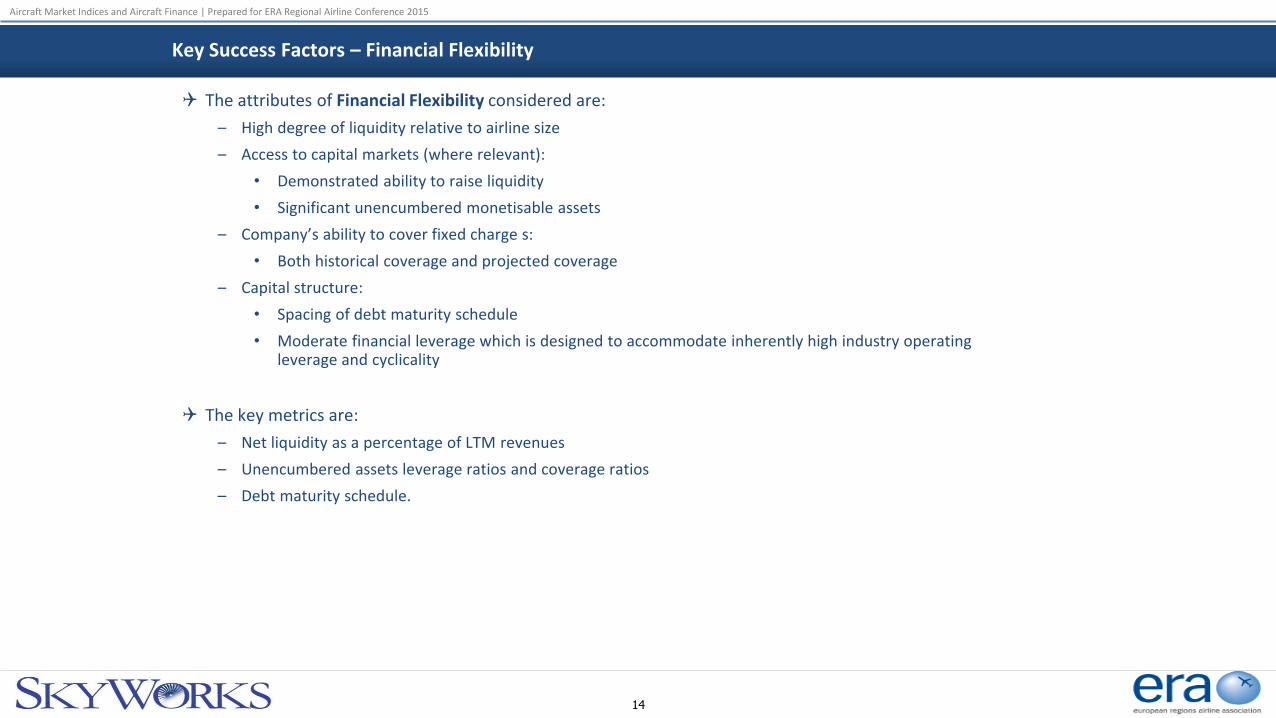
The attributes of Financial Flexibility considered are:
– High degree of liquidity relative to airline size
– Access to capital markets (where relevant):
• Demonstrated ability to raise liquidity
• Significant unencumbered monetisable assets
– Company’s ability to cover fixed charge s:
• Both historical coverage and projected coverage
– Capital structure:
• Spacing of debt maturity schedule
• Moderate financial leverage which is designed to accommodate inherently high industry operating leverage and cyclicality
The key metrics are:
– Net liquidity as a percentage of LTM revenues
– Unencumbered assets leverage ratios and coverage ratios
– Debt maturity schedule.
Key Success Factors – Financial Flexibility
14
Aircraft Market Indices and Aircraft Finance | Prepared for ERA Regional Airline Conference 2015
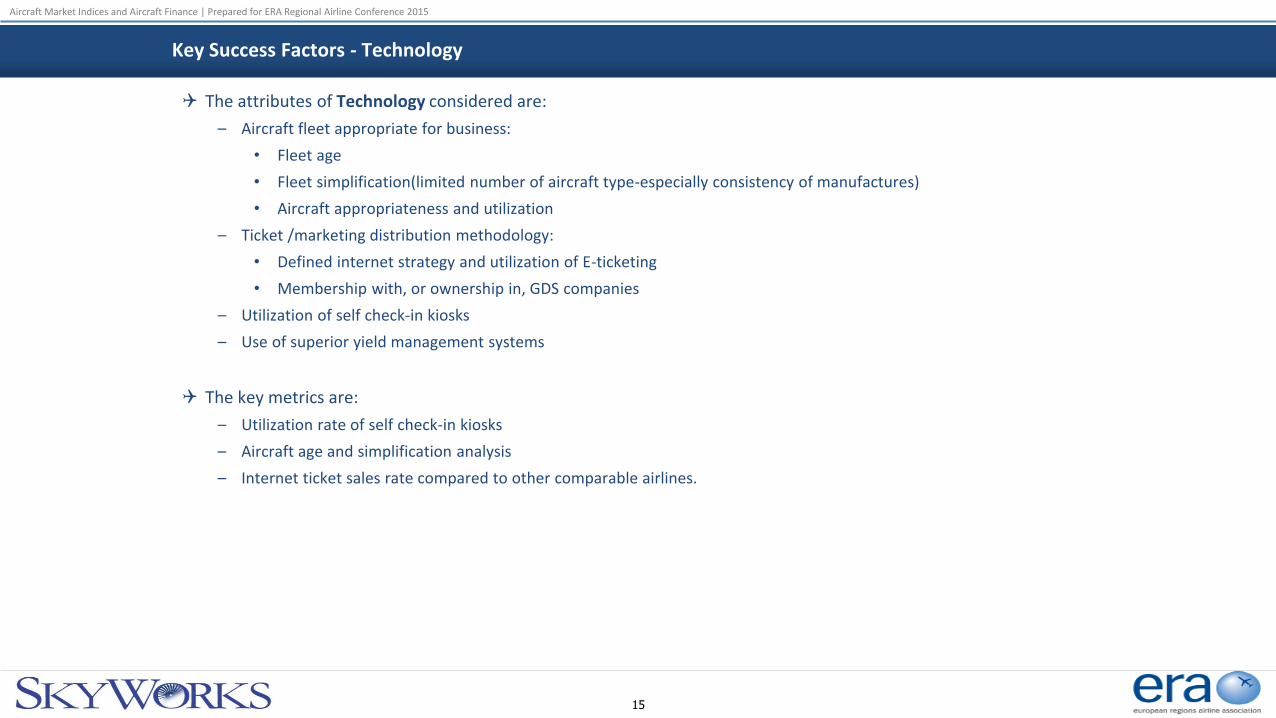
The attributes of Technology considered are:
– Aircraft fleet appropriate for business:
• Fleet age
• Fleet simplification(limited number of aircraft type-especially consistency of manufactures)
• Aircraft appropriateness and utilization
– Ticket /marketing distribution methodology:
• Defined internet strategy and utilization of E-ticketing
• Membership with, or ownership in, GDS companies
– Utilization of self check-in kiosks
– Use of superior yield management systems
The key metrics are:
– Utilization rate of self check-in kiosks
– Aircraft age and simplification analysis
– Internet ticket sales rate compared to other comparable airlines.
Key Success Factors - Technology
15

Aircraft Market Indices and Aircraft Finance | Prepared for ERA Regional Airline Conference 2015
The attributes of Brand Loyalty considered are:
– Yield premium
– Brand loyalty programs:
• Partnership programs with other airlines though codeshare and alliances
• Frequent flyer program (in markets where such marketing techniques exist)
• Affinity card programs
• Other product offerings which encourage brand loyalty – vacation programs
– Service image:
• Hard to win customers over but easy to drive them away
• Reliability
• Customer services awards
The key metrics are:
– On-time statistics
– Frequent flyer program and number of partners
– Customer service awards
– Yield premium.
Key Success Factors – Brand Loyalty
16
Aircraft Market Indices and Aircraft Finance | Prepared for ERA Regional Airline Conference 2015
The attributes of Government Support considered are:
– Direct ownership:
• Important government has the wherewithal and inclination to provide financial support
– Government-regulated barriers to entry:
• Restrictive bilateral agreements
• Restrictions on creation of domestic airline competition
• Government-initiated domestic consolidation designed to create one strong domestic airline out of two or more weak competitors
– Government support to achieve bilateral “fairness”:
• If foreign airlines are allowed access to domestic markets, government must assure that domestic airlines have reciprocal access to foreign markets
• Government must allow free flow of foreign capital into domestic airlines
• Must be prepared to yield local control to assure international competitiveness
– Government intervention:
• Demonstrated willingness to support airline industry
The key metrics are:
– % ownership by government
– Amount of direct support through tax concessions and subsidies
– Amount of intervention within industry by government
– Economic stability of country.
Key Success Factors – Government Support
17

Aircraft Market Indices and Aircraft Finance | Prepared for ERA Regional Airline Conference 2015
18
KEY FINANCING CONSIDERATIONS FOR AIRLINES

Aircraft Market Indices and Aircraft Finance | Prepared for ERA Regional Airline Conference 2015
Aircraft Financing – Key Considerations for Airlines
Each type of financing comes with its own pros and cons and these need to be assessed in relation to the overall long-term fleet and financial plan the airline is seeking to achieve.
Some of the many considerations include:
– The true long-term cost and benefit of the financing alternatives, not just margins, fees or LRFs
– The desire to hedge out future residual value exposure through leasing versus owning and in what proportion
– Future fleet flexibility requirements
– Desired financing term in relation to future fleet planning timelines
– The need to raise or indeed utilise existing cash raised versus the cost of doing so
– The ability to find others, such as lessors, to fund/assume PDP obligations
– The need for a balanced fixed versus floating interest rate hedging result
– For new aircraft orders PDP financing to limit the airline’s capital outlay
– The ability to achieve forward commitments if possible
– The ability to achieve any degree of manufacturer involvement such as through backstop financing or PDP alternatives
– The preference for underwritten proposals versus one-off deals versus club deals.
Available aircraft financing structures and methods will largely depend on the following key factors:
– Market conditions and appetite at the time of going to market.
– Competing transactions in the market.
– The perceived credit profile of the airline and its future business plan.
– The aircraft type and new technologies involved, if any.
19

Aircraft Market Indices and Aircraft Finance | Prepared for ERA Regional Airline Conference 2015
Telling the Story – Giving the Banks the Key Information They Need
20
Recognising the banks’ Key Success Factor assessment, one of the most important steps is to develop a comprehensive information pack that presents the airline’s story as clearly and as comprehensively as possible.
The document or presentation should highlight at least:
– The latest ownership and corporate structure of the airline, emphasizing strong support from key shareholders and/or the Government, where relevant;
– Overview of the airline’s network and fleet plan, highlighting the basis of its future success and market potential;
– In-depth financial analysis of the airline, including detailed forward financial projections and the basis of such;
– The airline’s competitive environment and why it is well positioned;
– Statement of the airline’s management philosophy with emphasis on its commercial drive; and
– Update on the airline’s own country economy and its economic prospects.
Every effort should then be made to communicate this story to as wide a base of potential financiers as possible.
– Focus should be placed on educating the export credit agencies, commercial banks, aircraft lessors, and other special situational lenders that have interest in asset-based lending.
– This approach starts to get market familiar with the story and the credit over what will be a multiple year financing process.
– Getting lenders comfortable with the airline’s own jurisdiction will also be important.
– Part of the strategy in approaching a wide potential lender base is to ensure that the airline’s story is known to a wide variety of key lenders.

Aircraft Market Indices and Aircraft Finance | Prepared for ERA Regional Airline Conference 2015
21
FINANCING SUPPLY AND DEMAND OUTLOOK

Aircraft Market Indices and Aircraft Finance | Prepared for ERA Regional Airline Conference 2015
Financing Alternatives – Tightening Security And Preference For Liquid Aircraft Types
The funding structures and capital sources which are available for financing of commercial aircraft have continuously evolved in response to changes in the airline and aircraft sectors, as well as past lessons learned by financiers of aircraft during periods of airline industry distress.
The first major shift in the commercial aircraft financing landscape over the past decade has been toward the use of financing structures that provide stronger collateralization for the financier, e.g.:
– Operating leases requiring larger deposits/reserves for weaker credits, and
– Commercial debt financing with shorter tenors and lower LTV levels.
The second major shift has been strong financier preference for aircraft types with high liquidity (i.e., favorable remarketing prospects as evidenced by a large and growing operator base), e.g.:
– B737NG and A320 family single aisle aircraft types, and
– B787 and A350 family twin aisle aircraft types.
These market shifts have resulted in favorable access to commercial financing in the case of liquid aircraft types even for the weakest airline credits.
22

Aircraft Market Indices and Aircraft Finance | Prepared for ERA Regional Airline Conference 2015
Financing Alternatives – Changing Mix of Supply And Large Growth In Funding Need
These shifts in the aircraft financing market are illustrated in the below chart produced by Boeing Capital which highlights recent trends in commercial aircraft funding sources as well as outlook for total financing requirements through 2019.
Of particular note is the growing use of the capital markets, compared to commercial debt, Export Credits and operating lease products.
Source: Boeing Capital Aircraft Finance Market Outlook, 2014-2034.
23
Aircraft Market Indices and Aircraft Finance | Prepared for ERA Regional Airline Conference 2015
Financing Alternatives – Generally Improving Financing Environment
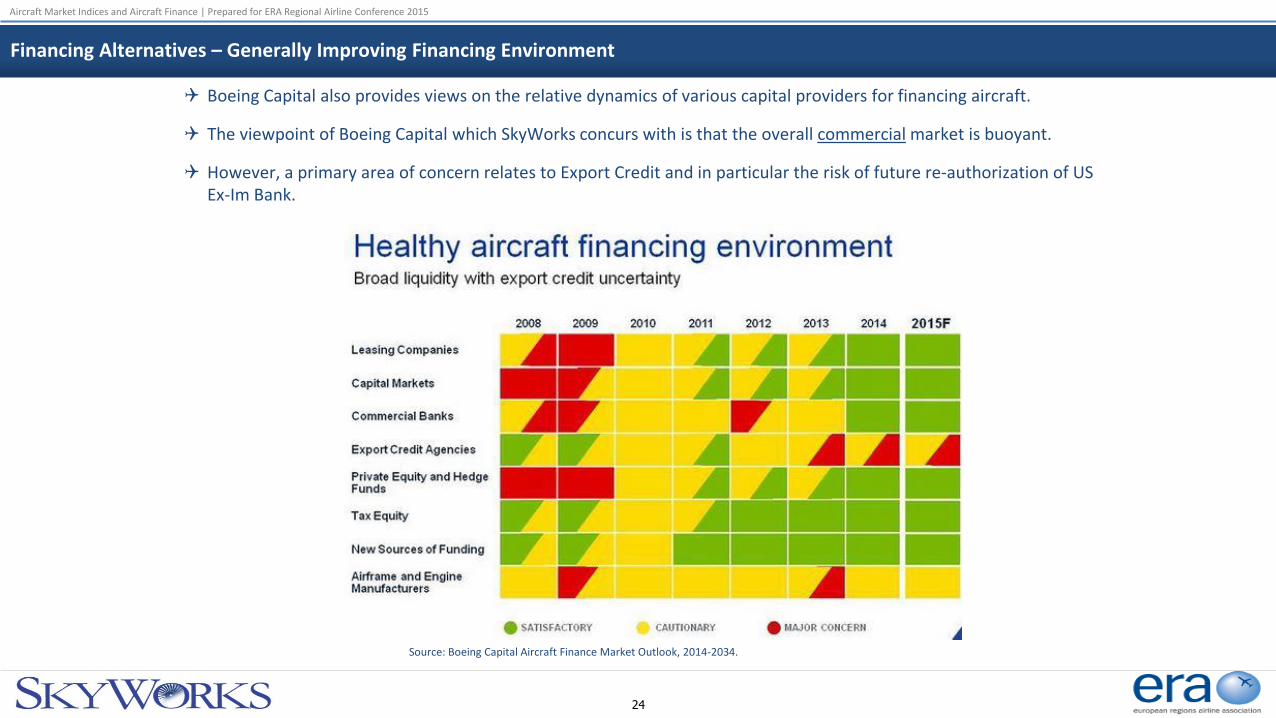
Boeing Capital also provides views on the relative dynamics of various capital providers for financing aircraft.
The viewpoint of Boeing Capital which SkyWorks concurs with is that the overall commercial market is buoyant.
However, a primary area of concern relates to Export Credit and in particular the risk of future re-authorization of US Ex-Im Bank.
Source: Boeing Capital Aircraft Finance Market Outlook, 2014-2034.
24

Aircraft Market Indices and Aircraft Finance | Prepared for ERA Regional Airline Conference 2015
Financing Alternatives – Shifts in Global Lending Supply
25
The commercial bank market has become increasingly robust in the years since the 2008-2009 liquidity crisis. Even though a number of European banks (the German landesbanks, in particular) have permanently exited the market, a few new entrants from commercial banks in Japan, Australia, the Middle East and China have joined the remaining US and European banks. According to Boeing Capital, commercial banks today fund approximately 25% of new aircraft deliveries.
Source: BCC Current Aircraft Finance Market Outlook, 2014-2018.

Aircraft Market Indices and Aircraft Finance | Prepared for ERA Regional Airline Conference 2015
26
CONCLUDING OBSERVATIONS/GUIDANCE FOR REGIONAL AIRLINE FINANCING

Aircraft Market Indices and Aircraft Finance | Prepared for ERA Regional Airline Conference 2015
Concluding Observations For Regional Aviation Financing
27
1. Plenty of Liquidity Since the previous market downturn of 2007/2008, there has certainly been a revival of bank and investor interest in aircraft financing and there is no shortage of liquidity looking for deals with a positive outlook for 2015.
2. Asset Type More Important Than Before In addition to standard credit analysis on the airline borrower, banks and lessors now tend to pay more attention than previously to the aircraft type in question and the technology and market factors for the aircraft in question.
3. Provide Banks The Information They Need Airlines can improve the appetite from potential financiers by providing good information that gives them what they need to know to complete their internal credit assessments.
4. Tell a Good Story A strong story describing a robust and sensible business plan will be well regarded.
5. Highlight Unique Advantages Particular local market or niche advantages should be highlighted.
6. Go Global Whilst building good trusted relationships with local or relationship banks is important, airlines should seek to broaden the list of financiers invited to bid, particularly to tap into new global players from Asia Pacific and China.
Related Documents