PM 2.5 Quantitative Hot‐spot Analysis Page 1 Air Quality Technical Report PM 2.5 Quantitative Hot‐spot Analysis I‐65, SR44 to Southport Road (Segmented from SR44 to Main Street and Main Street to Southport Road) A. Introduction This technical report outlines the methodology, inputs and results of the PM 2.5 quantitative hot‐spot analysis for the I‐65, SR44 to Southport Road (segmented from SR44 to Main Street and Main Street to Southport Road) project in Indiana. The environmental document for this project is being developed as a Categorical Exclusion (CE). This report will be included as a technical appendix to the CE document when it is completed. The project is within the Central Indiana nonattainment area for the 1997 annual fine particles (PM 2.5 ) National Ambient Air Quality Standard (NAAQS). On March 10, 2006, the U.S. Environmental Protection Agency (EPA) published a Final Rule (71 FR 12468) that establishes transportation conformity criteria and procedures for determining which transportation projects must be analyzed for local air quality impacts in PM 2.5 and PM 10 nonattainment and maintenance areas. A quantitative PM hot‐spot analysis using EPA’s MOVES emission model is required for those projects that are identified as projects of local air quality concern. Quantitative PM hot‐spot analyses are not required for other projects. The interagency consultation process plays an important role in evaluating which projects require quantitative hot‐spot analyses and determining the methods and procedures for such analyses. The air quality analysis for the I‐65, SR44 to Southport Road project included modeling techniques to estimate project‐specific emission factors from vehicle exhaust and local PM 2.5 concentrations due to project operation. Emissions and dispersion modeling techniques were consistent with EPA’s latest quantitative PM hot‐spot analysis guidance, “Transportation Conformity Guidance for Quantitative Hot‐spot Analysis in PM 2.5 and PM 10 Nonattainment and Maintenance Areas“ (USEPA, 2013) 1 that was updated in November, 2013. B. Interagency Consultation The conformity rule requires that federal, state and local transportation and air quality agencies establish formal procedures for interagency coordination. This analysis included participation from the following agencies: FHWA Indiana Division and Resource Center Indiana Department of Environmental Management (IDEM) Indiana Department of Transportation (INDOT) Indianapolis Metropolitan Planning Organization (MPO) EPA Region 5 1 US EPA. 2013. Transportation Conformity Guidance for Quantitative Hot‐spot Analyses in PM2.5 and PM10 Nonattainment and Maintenance Areas” (EPA‐420‐B‐13‐053) located online at: http://www.epa.gov/oms/stateresources/transconf/policy/420b13053‐sec.pdf

Welcome message from author
This document is posted to help you gain knowledge. Please leave a comment to let me know what you think about it! Share it to your friends and learn new things together.
Transcript
PM2.5 Quantitative Hot‐spot Analysis Page 1
AirQualityTechnicalReport
PM2.5QuantitativeHot‐spotAnalysisI‐65,SR44toSouthportRoad (SegmentedfromSR44toMainStreetandMainStreettoSouthportRoad)
A.Introduction
This technical report outlines the methodology, inputs and results of the PM2.5 quantitative hot‐spot
analysis for the I‐65, SR44 to Southport Road (segmented from SR44 to Main Street and Main Street to
Southport Road) project in Indiana. The environmental document for this project is being developed as a
Categorical Exclusion (CE). This report will be included as a technical appendix to the CE document when
it is completed. The project is within the Central Indiana nonattainment area for the 1997 annual fine
particles (PM2.5) National Ambient Air Quality Standard (NAAQS).
On March 10, 2006, the U.S. Environmental Protection Agency (EPA) published a Final Rule (71 FR
12468) that establishes transportation conformity criteria and procedures for determining which
transportation projects must be analyzed for local air quality impacts in PM2.5 and PM10 nonattainment
and maintenance areas. A quantitative PM hot‐spot analysis using EPA’s MOVES emission model is
required for those projects that are identified as projects of local air quality concern. Quantitative PM
hot‐spot analyses are not required for other projects. The interagency consultation process plays an
important role in evaluating which projects require quantitative hot‐spot analyses and determining the
methods and procedures for such analyses.
The air quality analysis for the I‐65, SR44 to Southport Road project included modeling techniques to
estimate project‐specific emission factors from vehicle exhaust and local PM2.5 concentrations due to
project operation. Emissions and dispersion modeling techniques were consistent with EPA’s latest
quantitative PM hot‐spot analysis guidance, “Transportation Conformity Guidance for Quantitative
Hot‐spot Analysis in PM2.5 and PM10 Nonattainment and Maintenance Areas“ (USEPA, 2013)1 that was
updated in November, 2013.
B.InteragencyConsultation
The conformity rule requires that federal, state and local transportation and air quality agencies
establish formal procedures for interagency coordination. This analysis included participation from the
following agencies:
FHWA Indiana Division and Resource Center
Indiana Department of Environmental Management (IDEM)
Indiana Department of Transportation (INDOT)
Indianapolis Metropolitan Planning Organization (MPO)
EPA Region 5
1 US EPA. 2013. Transportation Conformity Guidance for Quantitative Hot‐spot Analyses in PM2.5 and PM10
Nonattainment and Maintenance Areas” (EPA‐420‐B‐13‐053) located online at: http://www.epa.gov/oms/stateresources/transconf/policy/420b13053‐sec.pdf

PM2.5 Quantitative Hot‐spot Analysis Page 2
Interagency consultation provides an opportunity to reach agreements on key assumptions to be used in
conformity analyses, strategies to reduce mobile source emissions, specific impacts of major projects,
and issues associated with travel demand and emissions modeling for hot‐spot analyses. 40 CFR
93.105(c)(1)(i) requires interagency consultation to “evaluate and choose models and associated
methods and assumptions.” Per Section 2.3 of EPA’s hot‐spot guidance, “for many aspects of PM
hot‐spot analyses, the general requirement of interagency consultation can be satisfied without
consulting separately on each and every specific decision that arises. In general, as long as the
consultation requirements are met, agencies have discretion as to how they consult on hot‐spot
analyses.”
For this project, an interagency consultation conference call was held on May 20, 2014. As a result of
the meeting, a decision was made to proceed with a quantitative PM2.5 hot‐spot analysis, even though a
formal determination was not made with respect to whether this project was determined to be a
project of local air quality concern. Subsequent input from the ICG was provided via email consultation
between May 29 and May 30, 2014. The meeting and review process were used to obtain feedback on
the document text and technical analysis assumptions. Exhibit 1 provides a summary of the meeting
topics and the key decisions by the interagency consultation group (ICG). Additional consultation via
email was conducted between June 26 and June 27 to review the preliminary version of the technical
report, offer feedback, and to advance the document for public comment.
Exhibit 1: Key ICG Decisions on Quantitative Methods and Data
Topic Key Decisions/Considerations
Analysis Approach • Compare results of the Build analyses to the NAAQS.
Study Area • Focus on the I-65 / Southport Road Interchange. It was determined this location was
the location with highest emissions.
Analysis Years • 2017
Type of PM Emissions Analyzed
• Direct PM2.5 mobile source running emissions (exhaust, crankcase, brake/tire wear) • Construction emissions are not considered (< 5 years in duration) • No major non-road sources near the project location • Road dust is not considered a significant source
Emission and Air Quality Models
• MOVES2010b • AERMOD (run using “Area” method)
Background Concentrations
• Based on an average of three monitor locations • Average monitor reading 2011-2013 = 11.27
Receptor Locations • Placed according to EPA guidance
Other Input Parameters • MOVES inputs consistent with SIP/Conformity analysis by Indianapolis MPO • Recommendations from hot-spot training • AERMOD meteorology from IDEM
C.OverviewoftheAnalysisApproach
EPA released updated guidance for quantifying the local air quality impacts of certain transportation
projects for the PM2.5 and PM10 NAAQS in November 2013. This guidance must be used by state and
local agencies to conduct quantitative hot‐spot analyses for new or expanded highway or transit
PM2.5 Quantitative Hot‐spot Analysis Page 3
projects with significant increases in diesel traffic in nonattainment or maintenance areas.
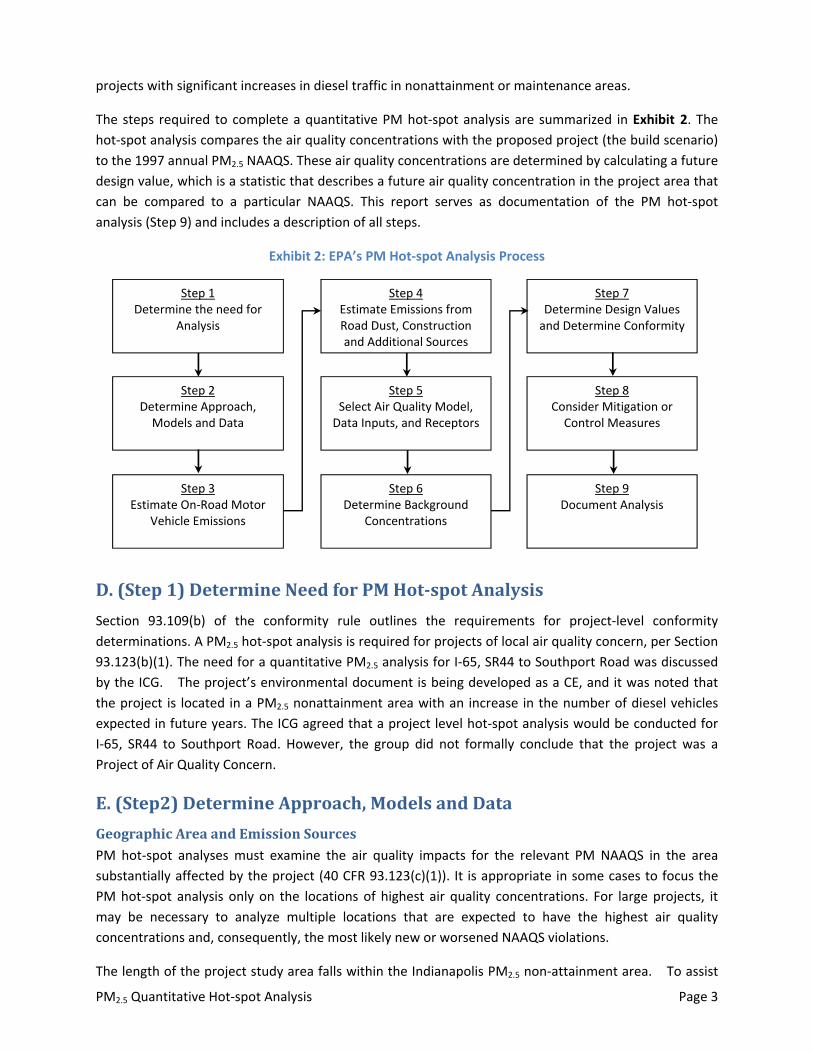
The steps required to complete a quantitative PM hot‐spot analysis are summarized in Exhibit 2. The
hot‐spot analysis compares the air quality concentrations with the proposed project (the build scenario)
to the 1997 annual PM2.5 NAAQS. These air quality concentrations are determined by calculating a future
design value, which is a statistic that describes a future air quality concentration in the project area that
can be compared to a particular NAAQS. This report serves as documentation of the PM hot‐spot
analysis (Step 9) and includes a description of all steps.
Exhibit 2: EPA’s PM Hot‐spot Analysis Process
D.(Step1)DetermineNeedforPMHot‐spotAnalysis
Section 93.109(b) of the conformity rule outlines the requirements for project‐level conformity
determinations. A PM2.5 hot‐spot analysis is required for projects of local air quality concern, per Section
93.123(b)(1). The need for a quantitative PM2.5 analysis for I‐65, SR44 to Southport Road was discussed
by the ICG. The project’s environmental document is being developed as a CE, and it was noted that
the project is located in a PM2.5 nonattainment area with an increase in the number of diesel vehicles
expected in future years. The ICG agreed that a project level hot‐spot analysis would be conducted for
I‐65, SR44 to Southport Road. However, the group did not formally conclude that the project was a
Project of Air Quality Concern.
E.(Step2)DetermineApproach,ModelsandData
GeographicAreaandEmissionSourcesPM hot‐spot analyses must examine the air quality impacts for the relevant PM NAAQS in the area
substantially affected by the project (40 CFR 93.123(c)(1)). It is appropriate in some cases to focus the
PM hot‐spot analysis only on the locations of highest air quality concentrations. For large projects, it
may be necessary to analyze multiple locations that are expected to have the highest air quality
concentrations and, consequently, the most likely new or worsened NAAQS violations.
The length of the project study area falls within the Indianapolis PM2.5 non‐attainment area. To assist
Step 2 Determine Approach, Models and Data
Step 4Estimate Emissions from Road Dust, Construction and Additional Sources
Step 5Select Air Quality Model, Data Inputs, and Receptors
Step 1 Determine the need for
Analysis
Step 7 Determine Design Values and Determine Conformity
Step 8 Consider Mitigation or Control Measures
Step 3 Estimate On‐Road Motor
Vehicle Emissions
Step 6Determine Background
Concentrations
Step 9 Document Analysis
PM2.5 Quantitative Hot‐spot Analysis Page 4
in identifying the location of potential highest emissions, the ICG reviewed available traffic data
including INDOT 2010 traffic counts and forecast (2035) no‐build and build volumes from the INDOT
Statewide Travel Demand Model (ISTDM). The average annual daily traffic (AADT) and truck
percentages are summarized in Exhibit 3. Results from Indianapolis MPO regional traffic modeling were
also evaluated to determine how local traffic patterns would likely be affected by the project.
Exhibit 3: Current and Projected Traffic Volumes in Study Area
2010 Traffic* 2035 Traffic**
I-65 Segment AADT Truck
Volume % Truck AADT
Truck Volume
% Truck
County Line Rd to Southport Rd 98,921 16,670 17% 125,695 19,806 16%
Main St to County Line Rd 77,910 18,400 24% 97,182 22,442 23%
Whiteland Rd to Main St 63,150 15,870 25% 83,383 22,025 26%
SR-44 to Whiteland Rd 56,220 14,850 26% 68,559 18,457 27% *Count Data (http://dotmaps.indot.in.gov/apps/trafficcounts/) **Generated by ISTDM
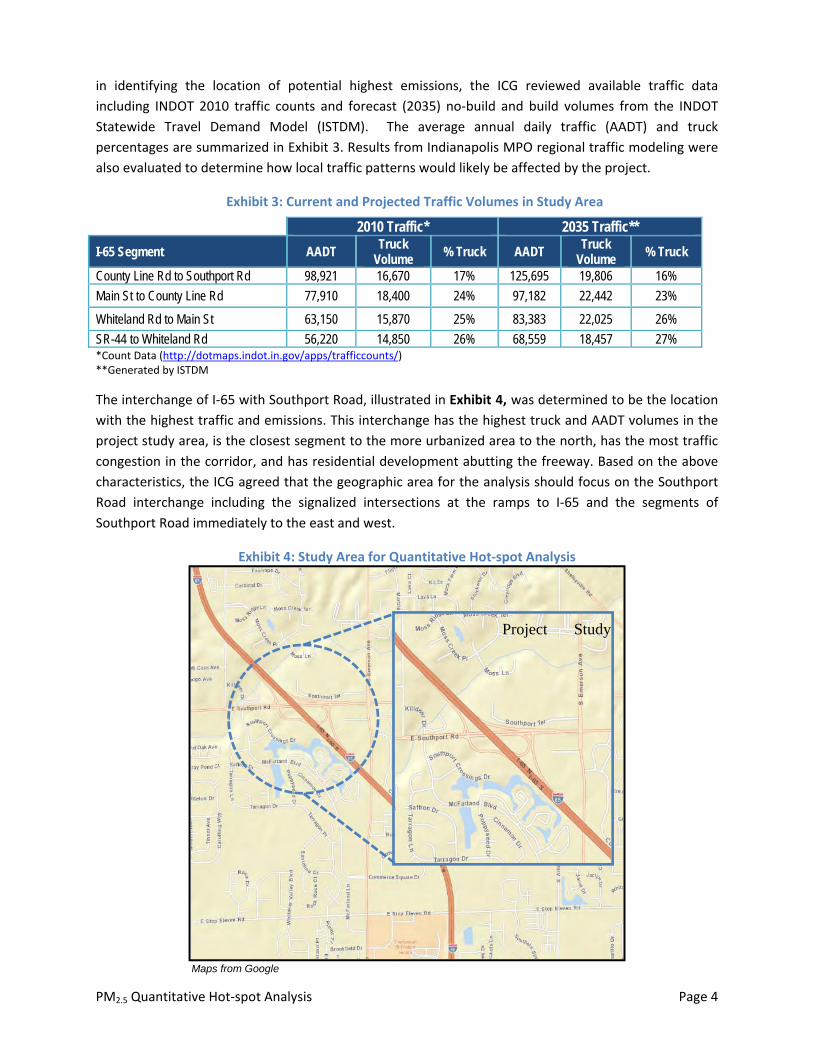
The interchange of I‐65 with Southport Road, illustrated in Exhibit 4, was determined to be the location
with the highest traffic and emissions. This interchange has the highest truck and AADT volumes in the
project study area, is the closest segment to the more urbanized area to the north, has the most traffic
congestion in the corridor, and has residential development abutting the freeway. Based on the above
characteristics, the ICG agreed that the geographic area for the analysis should focus on the Southport
Road interchange including the signalized intersections at the ramps to I‐65 and the segments of
Southport Road immediately to the east and west.
Exhibit 4: Study Area for Quantitative Hot‐spot Analysis
Maps from Google
Project Study
PM2.5 Quantitative Hot‐spot Analysis Page 5
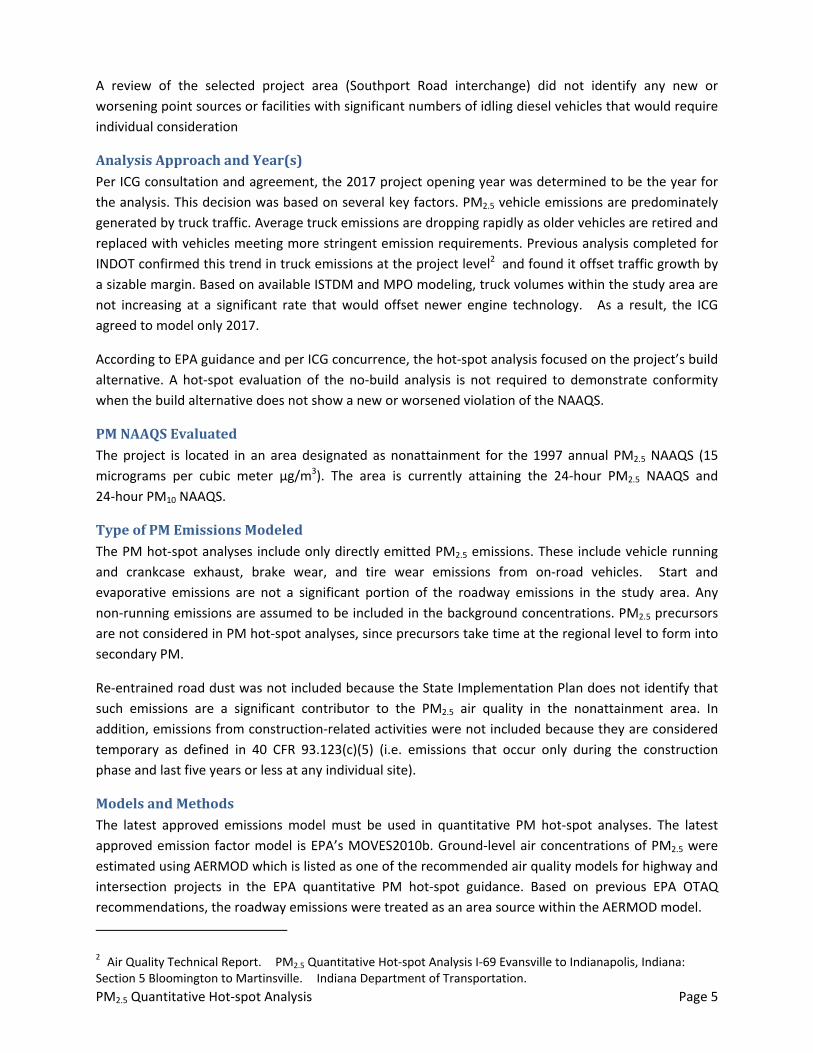
A review of the selected project area (Southport Road interchange) did not identify any new or
worsening point sources or facilities with significant numbers of idling diesel vehicles that would require
individual consideration
AnalysisApproachandYear(s)Per ICG consultation and agreement, the 2017 project opening year was determined to be the year for
the analysis. This decision was based on several key factors. PM2.5 vehicle emissions are predominately
generated by truck traffic. Average truck emissions are dropping rapidly as older vehicles are retired and
replaced with vehicles meeting more stringent emission requirements. Previous analysis completed for
INDOT confirmed this trend in truck emissions at the project level2 and found it offset traffic growth by
a sizable margin. Based on available ISTDM and MPO modeling, truck volumes within the study area are
not increasing at a significant rate that would offset newer engine technology. As a result, the ICG
agreed to model only 2017.
According to EPA guidance and per ICG concurrence, the hot‐spot analysis focused on the project’s build
alternative. A hot‐spot evaluation of the no‐build analysis is not required to demonstrate conformity
when the build alternative does not show a new or worsened violation of the NAAQS.
PMNAAQSEvaluatedThe project is located in an area designated as nonattainment for the 1997 annual PM2.5 NAAQS (15
micrograms per cubic meter µg/m3). The area is currently attaining the 24‐hour PM2.5 NAAQS and
24‐hour PM10 NAAQS.
TypeofPMEmissionsModeledThe PM hot‐spot analyses include only directly emitted PM2.5 emissions. These include vehicle running
and crankcase exhaust, brake wear, and tire wear emissions from on‐road vehicles. Start and
evaporative emissions are not a significant portion of the roadway emissions in the study area. Any
non‐running emissions are assumed to be included in the background concentrations. PM2.5 precursors
are not considered in PM hot‐spot analyses, since precursors take time at the regional level to form into
secondary PM.
Re‐entrained road dust was not included because the State Implementation Plan does not identify that
such emissions are a significant contributor to the PM2.5 air quality in the nonattainment area. In
addition, emissions from construction‐related activities were not included because they are considered
temporary as defined in 40 CFR 93.123(c)(5) (i.e. emissions that occur only during the construction
phase and last five years or less at any individual site).
ModelsandMethods The latest approved emissions model must be used in quantitative PM hot‐spot analyses. The latest
approved emission factor model is EPA’s MOVES2010b. Ground‐level air concentrations of PM2.5 were
estimated using AERMOD which is listed as one of the recommended air quality models for highway and
intersection projects in the EPA quantitative PM hot‐spot guidance. Based on previous EPA OTAQ
recommendations, the roadway emissions were treated as an area source within the AERMOD model.
2 Air Quality Technical Report. PM2.5 Quantitative Hot‐spot Analysis I‐69 Evansville to Indianapolis, Indiana: Section 5 Bloomington to Martinsville. Indiana Department of Transportation.

PM2.5 Quantitative Hot‐spot Analysis Page 6
Project‐SpecificDataThe conformity rule requires that the latest planning assumptions (available at the time that the analysis
begins) must be used in conformity determinations (40 CFR 93.110). In addition, the regulation states
that hot‐spot analysis assumptions must be consistent with those assumptions used in the regional
emissions analysis for any inputs that are required for both analyses (40 CFR 93.123(c)(3)).
Traffic Data In the absence of readily available traffic projections within the study corridor, a simple traffic
forecasting effort was undertaken to support the air quality analysis. The forecasted 2017 traffic
volumes were developed using runs of the Indianapolis MPO regional travel demand model (as
conducted by the MPO) and traffic count/vehicle classification data from INDOT’s Average Daily Traffic
and Commercial Vehicles Interactive Map website3. Methods consistent with NCHRP Report 765:
Analytical Travel Forecasting Approaches for Project‐Level Planning and Design4 were used to develop
the forecasted volumes. Note that NCHRP Report 765 is an update to the long‐standing NCHRP Report
255 which served as the definitive guidebook to the application of travel demand models for project
evaluation analysis purposes. Where possible, conservative traffic assumptions were used to ensure
the resulting air quality analysis would be conservative.
A traffic signal analysis of the intersections of the I‐65 ramps at Southport Road was completed using the
Synchro analysis tool and available 2010 traffic count data. The signal analysis was used to identify
potential queue lengths and used for defining link types within the MOVES emission model. The
percentage of trucks within the total traffic volume was based on INDOT traffic volume classification
count data and was developed for each time period. Classification counts were not available on
Southport Road, and in these cases the truck percentage was obtained from the travel demand model.
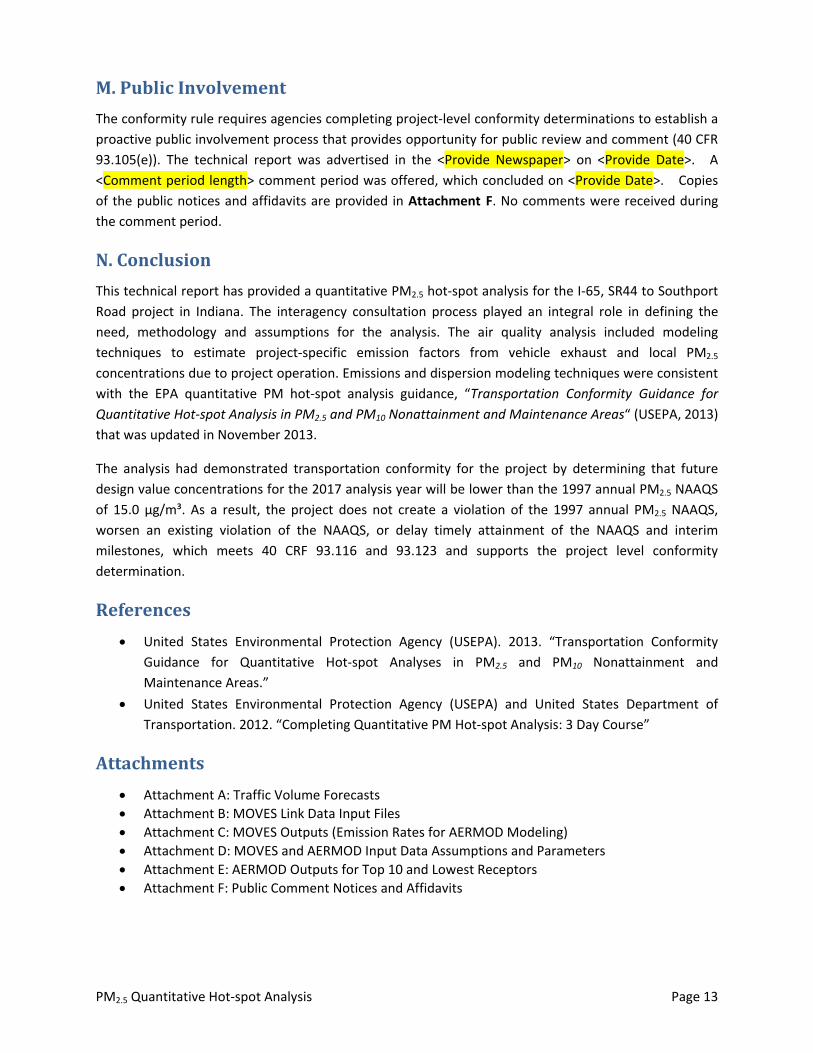
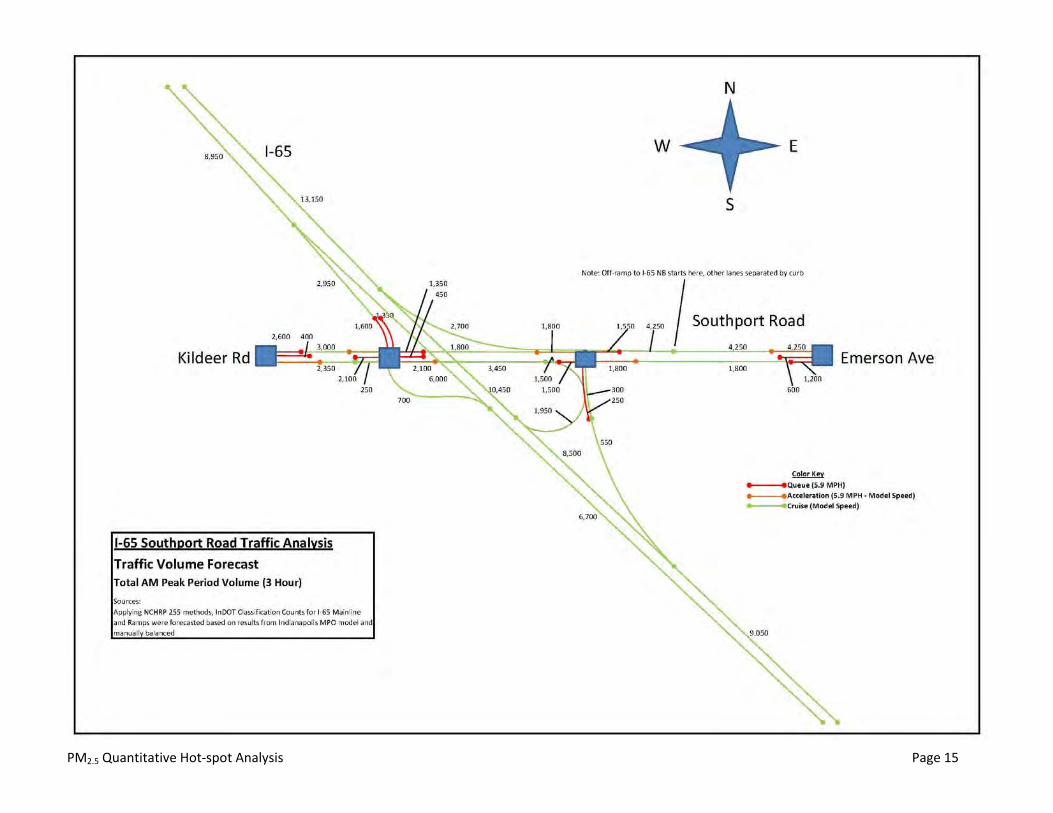
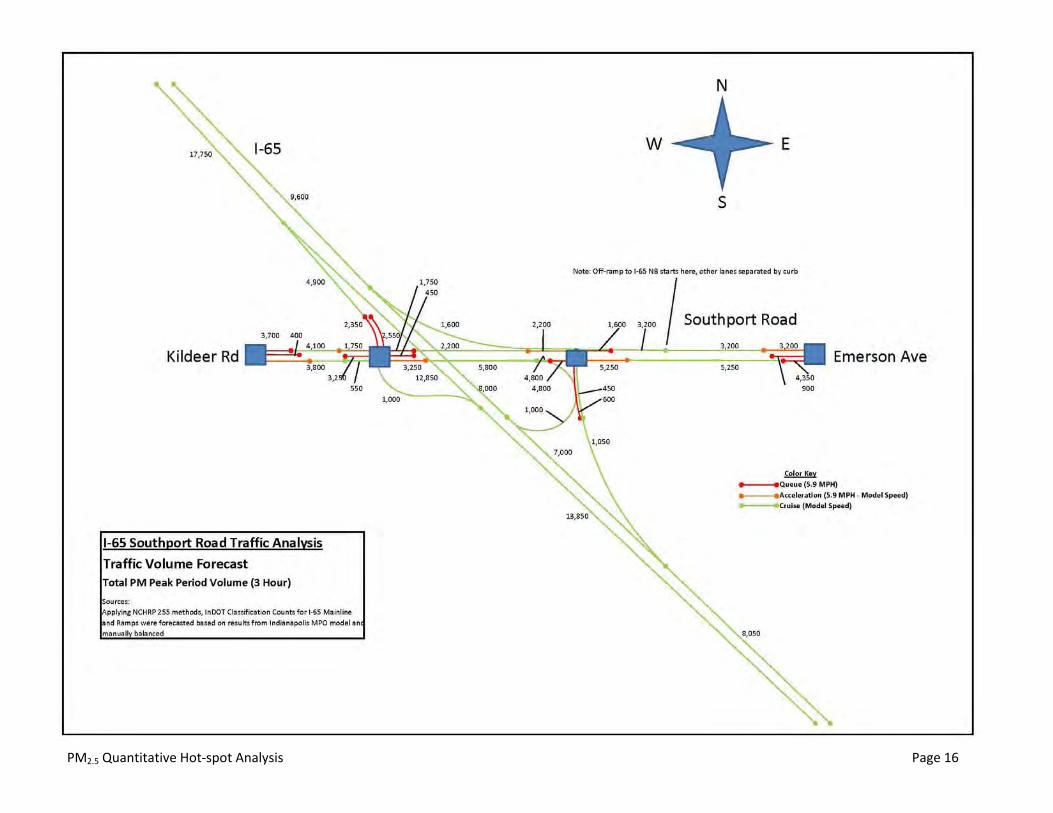
The forecasted 2017 traffic volumes for the 3‐hour AM, 3‐Hour PM, and remaining off‐peak periods are
provided in Attachment A.
Roadway Elevation Data To support the MOVES modeling of specific roadway links, geographic digital elevation files, obtained
from the Indianapolis Mapping and Geographic Infrastructure System (imagis), and available Google
Earth elevations were used to estimate a link‐specific grade that impacted the resulting emission factors
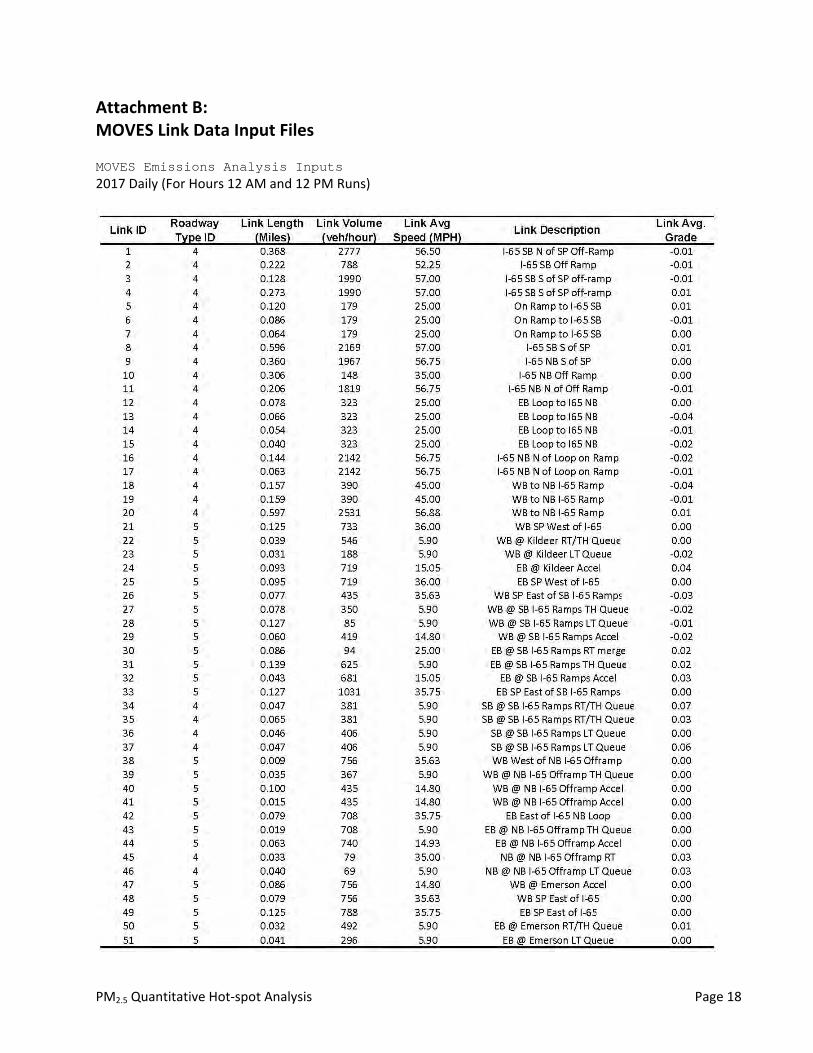
from MOVES. Attachment B summarizes the MOVES input data for each roadway link.
Emissions and Air Quality Data This quantitative analysis uses local‐specific data for both emissions and air quality modeling whenever
possible, though default inputs may be appropriate in some cases. The Indianapolis MPO provided
MOVES input files that were used for regional emissions analyses, including vehicle/fleet
characterization data (age, fleet mix etc.), meteorological data, fuel, and control strategy parameters.
Hourly meteorological data is used for dispersion modeling and must be representative of the project
area. The most recent available years (2006‐2010) of off‐site meteorological data prepared by IDEM was
downloaded from the IDEM website (http://www.in.gov/idem/airquality/2376.htm). Surface
3 http://dotmaps.indot.in.gov/apps/trafficcounts/ 4 http://onlinepubs.trb.org/onlinepubs/nchrp/nchrp_rpt_765.pdf
PM2.5 Quantitative Hot‐spot Analysis Page 7
meteorological data is from the National Weather Service Site for Indianapolis, IN, while upper air
meteorological data is from the Lincoln, IL station.
F.(Step3)EstimateOn‐RoadVehicleEmissions
On‐road vehicle emissions were estimated using the MOVES emission factor model. As discussed in the
previous section, the MOVES inputs are consistent with recent SIP and conformity analyses conducted
by the Indianapolis MPO. The modeling undertaken for this project includes traffic estimates subdivided
into light duty vehicles (autos) and trucks. These values were allocated into the various MOVES
source‐type (vehicle) classifications by applying vehicle distributions used in the development of the
on‐road mobile source emissions inventory found in the SIP.
The MOVES input traffic information relies on link‐specific data, a distinction that is particularly
important when employing it for project level analysis. A link file includes the vehicle volume, average
speed, facility type, and grade. The PM emissions vary by time of day and time of year. Volume and
speed data for each link were provided by the traffic analysts for AM peak, PM peak, and daily average
traffic conditions.
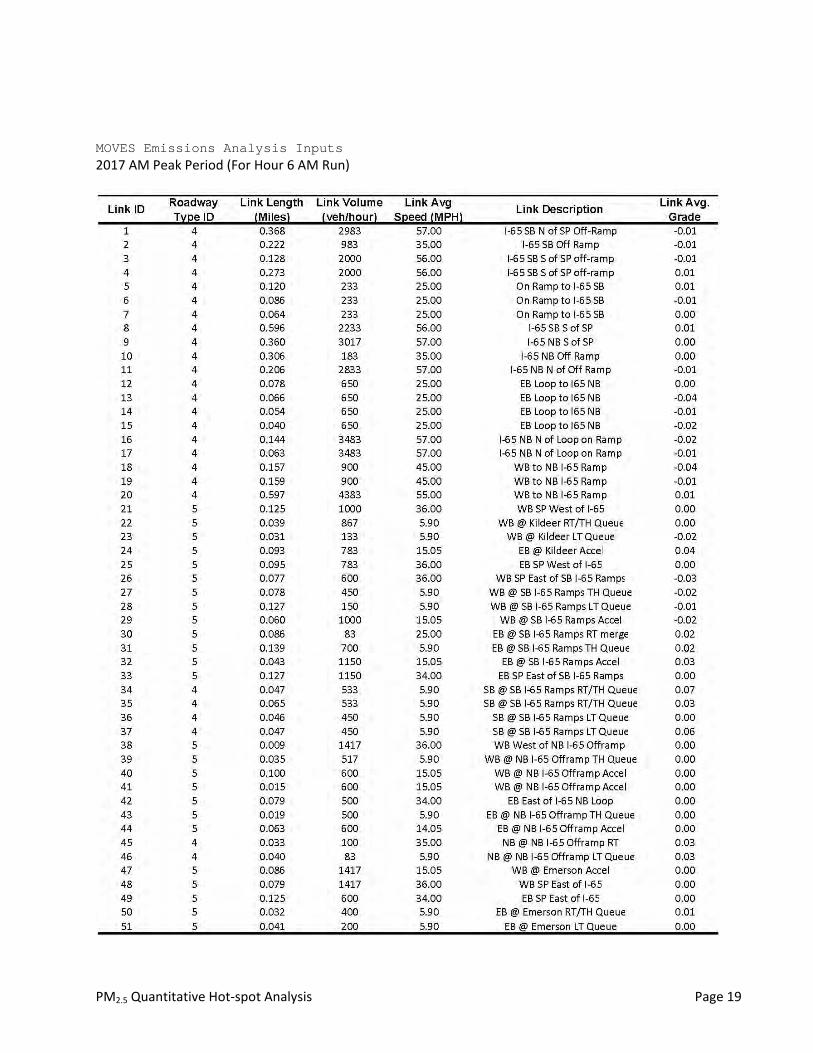
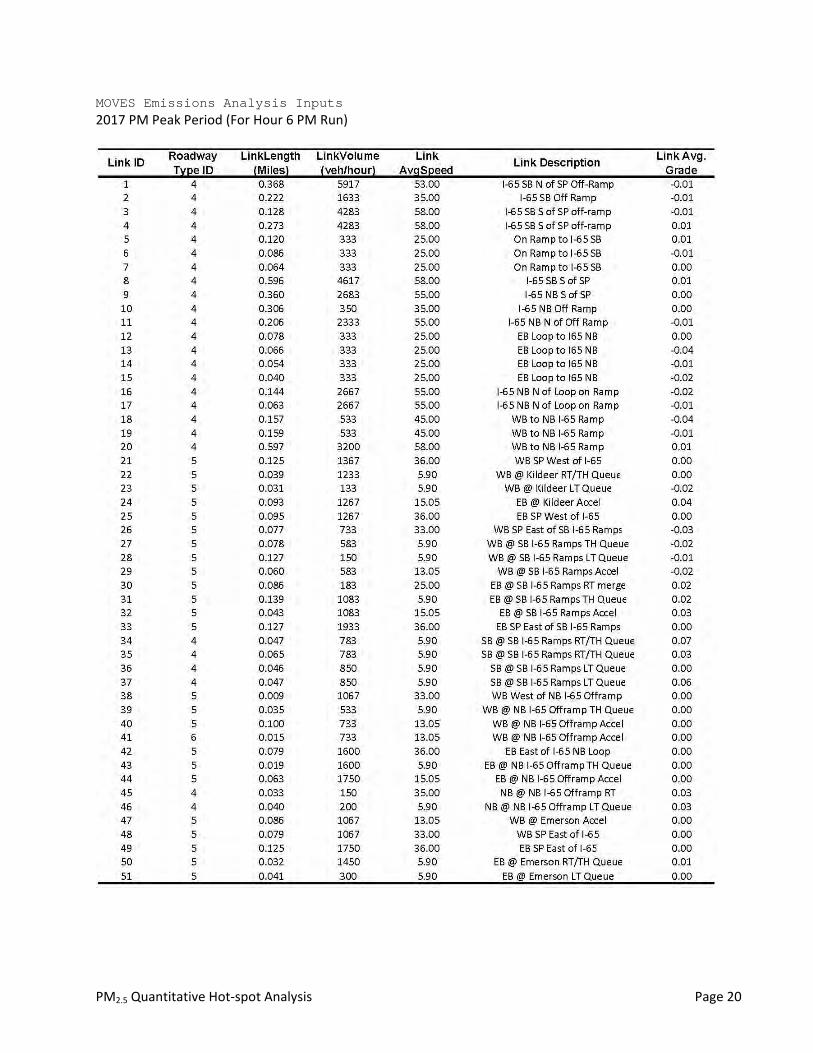
MOVES was run for four weekday time periods (AM peak, midday, PM peak, and overnight) for four
different months (January, April, July, and October) to account for different climate conditions
throughout the year. The AM and PM peak time periods were run with peak‐hour traffic activity while
the midday and overnight time periods were run with average‐hour activity. Time periods were
represented by the following hours:
6 AM was used to represent the AM time period (6 AM – 9 AM)
12 PM was used to represent the midday time period (9 AM – 3 PM)
6 PM was used to represent PM peak time period (3 PM – 6 PM)
12 AM was used to represent the overnight time period (6 PM – 6 AM)
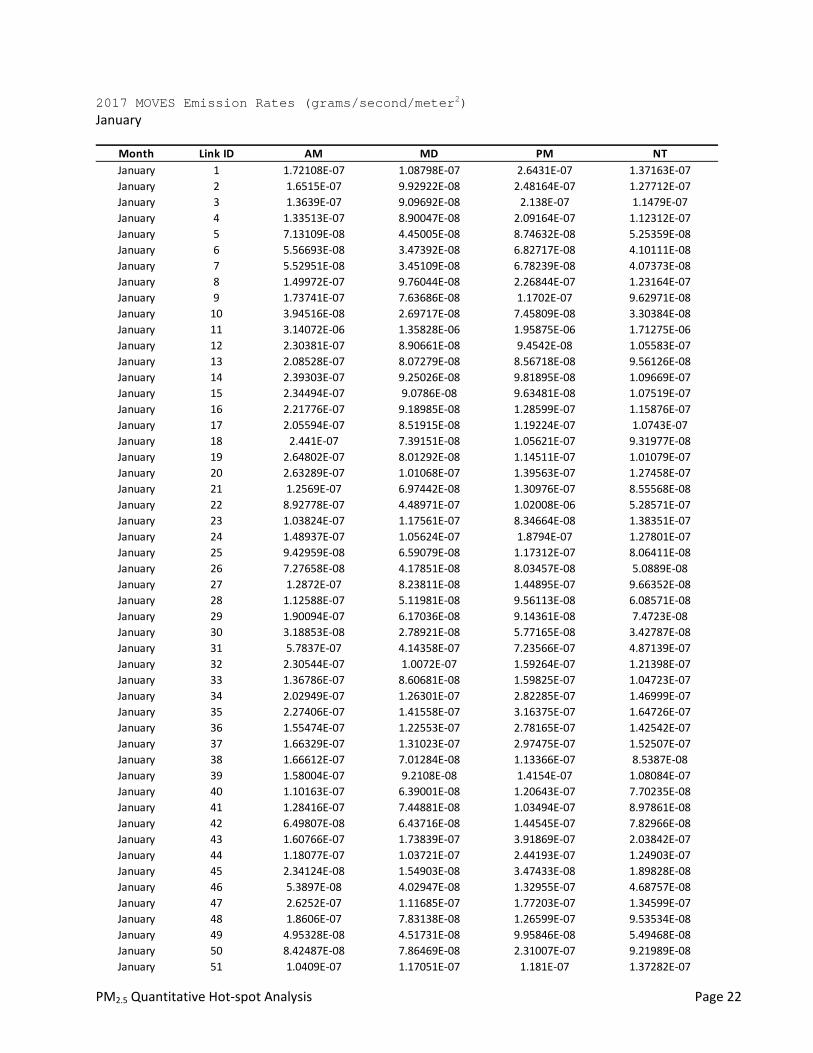
The results of the four hours were extrapolated to cover the entire day. The MOVES2AERMOD tool
downloaded from the EPA website was utilized to post‐process MOVES outputs for generating the
“EMISFACT” portion of an AERMOD input file. The emission rates as input to AERMOD are in units of
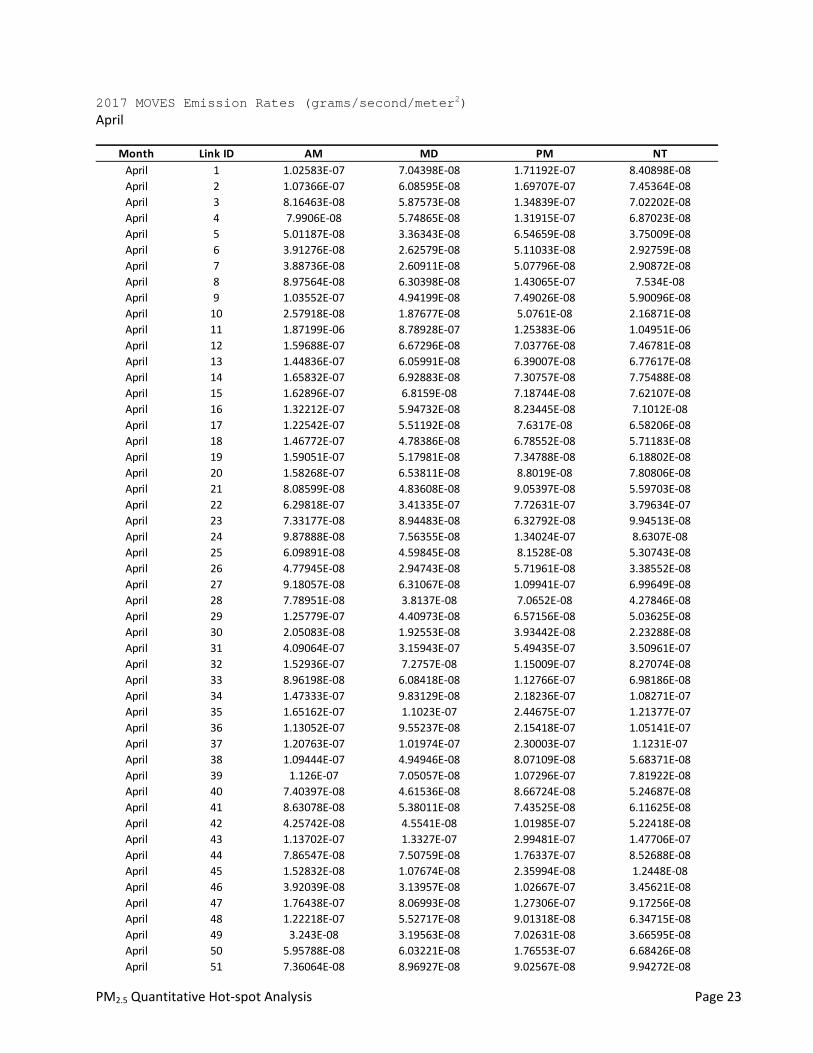
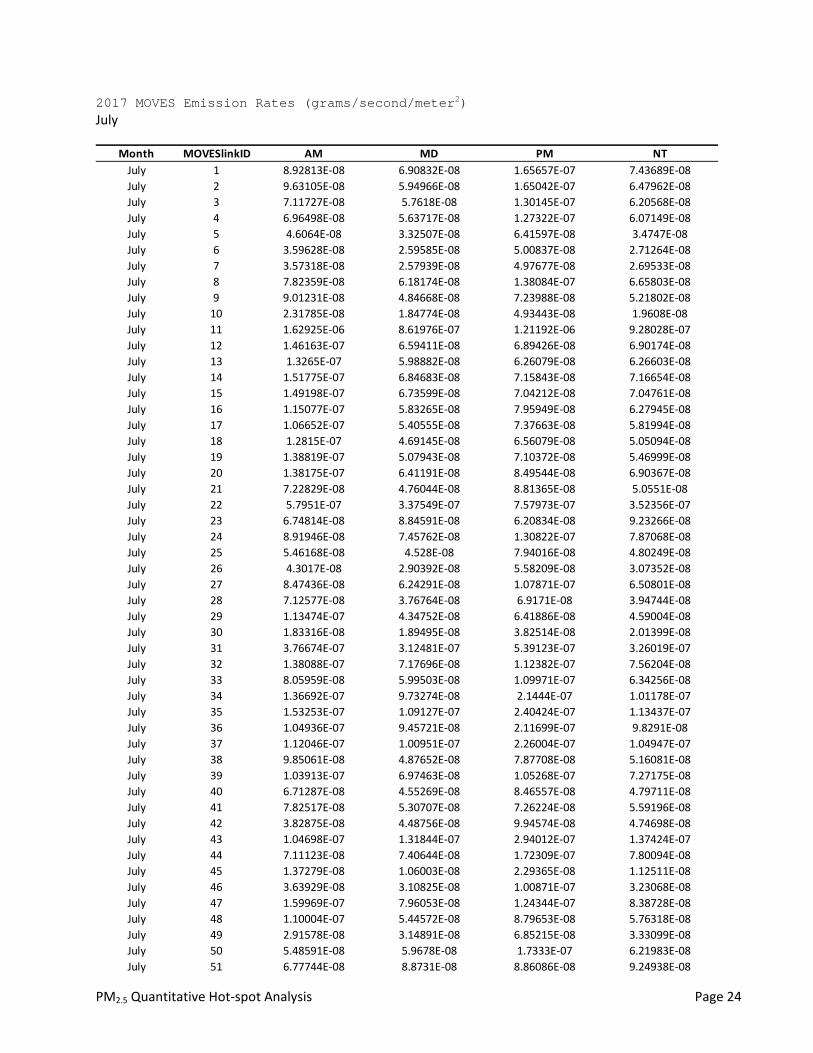
grams per second per square meter. Attachment C summarizes MOVES emission rates by four
representative time periods for each of the four representative months. A checklist summarizing
MOVES “Run Spec” and input assumptions is shown in Attachment D.
G.(Step4)RoadDust,Construction,andAdditionalSources
Road dust emissions were not included in the analysis as described in Step 2. Construction emissions
were not included as the period of construction for this segment will be for less than five years. No
additional sources of PM2.5 emissions were included in this analysis. It is assumed that PM2.5
concentrations due to any nearby emissions sources are included in the ambient monitor values that are
used as background concentrations. In addition, this project is not expected to result in changes to
emissions from existing nearby sources or support any new facilities that would impact localized PM2.5
levels.
PM2.5 Quantitative Hot‐spot Analysis Page 8
H.(Step5)Air‐QualityModel,DataInputs,andReceptors
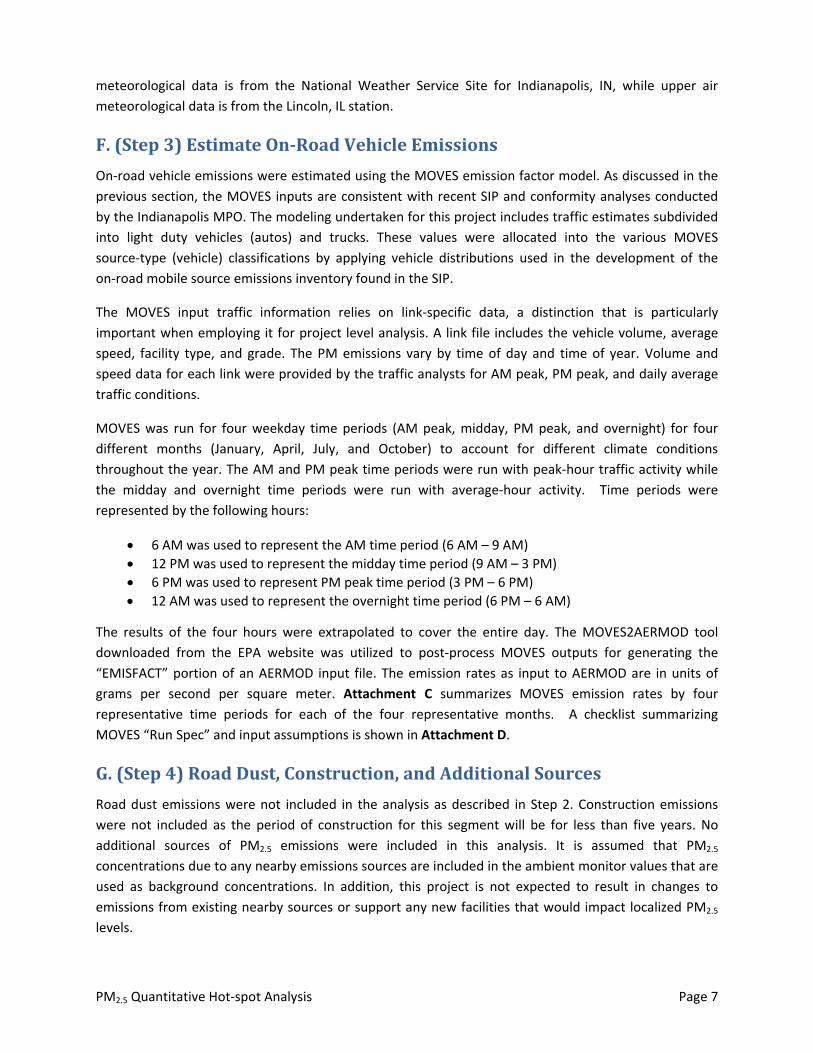
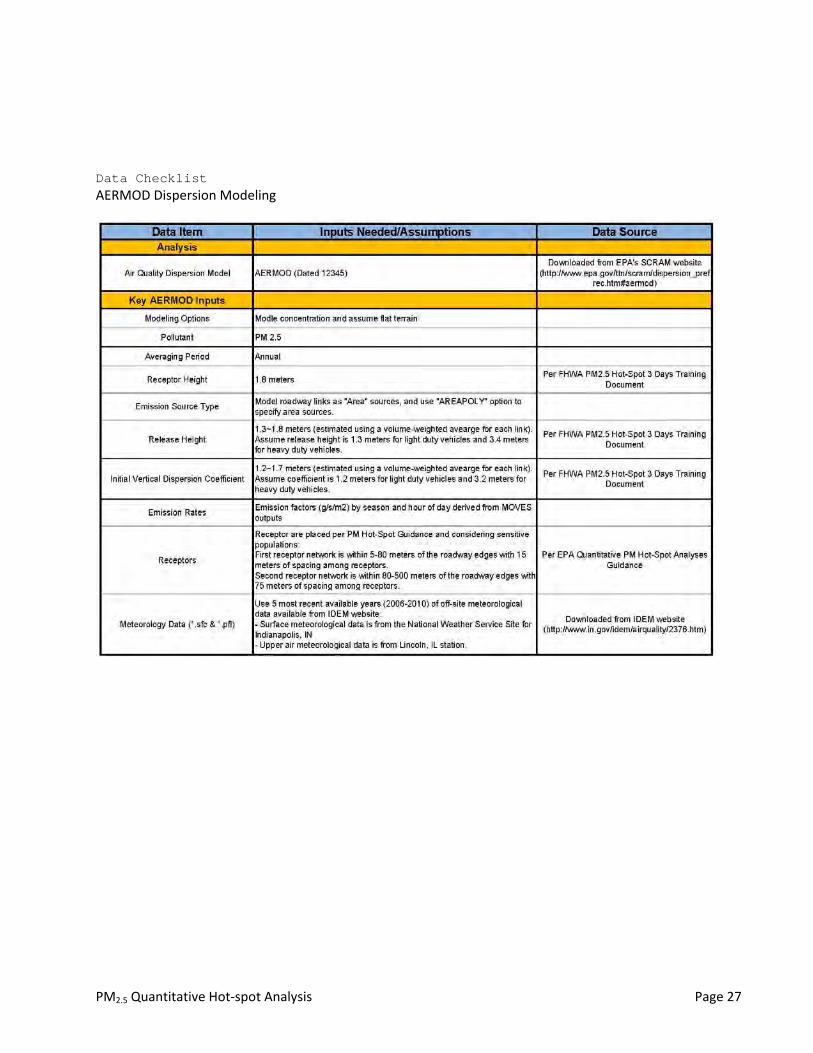
The following provides an overview of the air quality modeling undertaken including the assumptions
used in EPA’s AERMOD model that was used to estimate concentrations of PM2.5. The AERMOD model
requires the determination of the emission sources (e.g. the roadway) and the locations to measure air
quality concentrations (e.g. the receptors). Exhibit 5 illustrates the extents used to define the source
and receptor locations.
Exhibit 5: Extent of Emissions and Air Quality Modeling
Defined areas were used to delineate the emission sources. Using GIS software, polygons were created
having the same roadway segmentation as found in the traffic forecasting and MOVES modeling, with
the width set to the width of the travel lanes.
As recommended in the EPA PM hot‐spot guidance, receptors were placed in order to estimate the
highest concentrations of PM2.5 and to determine any possible violations of the NAAQS. Areas with
higher concentrations of PM2.5 are expected nearest the interchange and along the I‐65 right–of‐way.
An area within 5m of the edge of all roadways was excluded as were medians and other areas to which
the public would not have access.
GIS software was used to define an area within 80 meters of the roadway edges. Within this area (but
outside the excluded areas) receptors were located in a 15m diagonal grid formation. A second area was
then defined between 80m and 500m of the edge of the roadways. Within this area, receptors were
located in 75m diagonal grid formation. The extensive grid of receptors is used to evaluate the impact of
the roadway emissions within the study area. Exhibit 6 illustrates the extent area for receptor
locations.

PM2.5 Quantitative Hot‐spot Analysis Page 9
Exhibit 6: Modeled Receptor Locations
I.(Step6)BackgroundConcentrationsfromNearbyandOtherSources
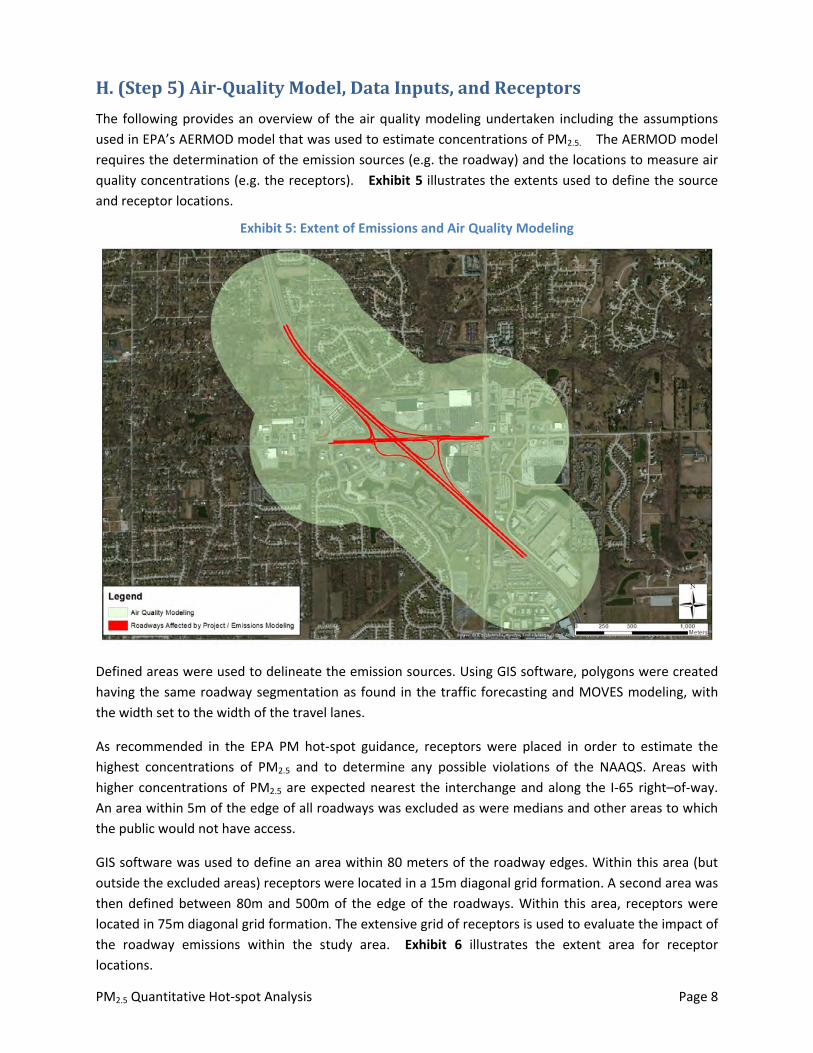
The determination of background emissions was based on readings available from monitors in the
region. No monitor is located immediately within the study area. Nearby monitors are shown in
Exhibit 7.
Key references used in determining the appropriate background concentration levels to use include:
The EPA PM Hot‐spot guidance (Section 8)
Conformity rule, Sections 93.105(c)(1)(i) and 93.123(c)
40 CFR Part 51, Appendix W, Section 8.2.1 and 8.2.3
Monitor air quality data from EPA’s Air Quality System was obtained from the EPA’s AirData website
(http://www.epa.gov/airdata/). Factors in choosing the monitors included:
Distance of monitor from project area
Wind patterns between monitor from project area
Similar characteristics between the monitor location and project area
Based on ICG discussions, no single ambient monitor was found to be sufficiently representative of the
project area. The ICG chose to interpolate background concentrations between several monitors as
described in the EPA PM Hot‐Spot Guidance. Specifically, the weighted average interpolation
methodology was used. This methodology was chosen because it placed greater weight on nearby
monitors by using the inverse distance between the project site and the monitor to weight each
monitor’s 3‐year average (2011‐2013) value. The ICG agreed that a value of 11.27 µg/m3 reasonably
PM2.5 Qua
reflected
the avera
County) a
*Per IDEM
antitative Hot
the backgrou
ges of the tw
nd the Bloom
Exhibit
M, monitor site
*
*
t‐spot Analysi
und concentr
wo closest mo
mington, IN m
t 7: Monitor
es 1 and 5 are c
*
*
is
ration in this
nitors to the
monitor, site n
Locations and
considered “so
region. This v
project locat
number 6.
d Average An
urce specific,”
value, as illus
tion (site num
nnual PM2.5 L
and are not ap
strated in Exh
mbers 2 and 4
Levels Report
ppropriate for
Pa
hibit 8, repre
4 located in M
ted
NAAQS compa
age 10
esents
Marion
arison

PM2.5 Quantitative Hot‐spot Analysis Page 11
Exhibit 8: Monitor Locations and Average Annual PM2.5 Levels Reported
Site Number
Site ID Distance from Project Area
Monitor Value 3-Year Avg. (μg/m3)
Weight Weighted
Monitor Value
2 180970078 10.12 11.20 0.39 4.39
4 180970083 7.73 11.57 0.51 5.93
6 181050003 41.39 9.90 0.10 0.95
Inverse Distance Weighted Average Concentration μg/m3 11.27
The Monroe County monitor was selected because prevailing winds are from the southwest during most
of the year (http://iclimate.org/narrative.asp). The ICG agreed that this was a key component in
determining the project area’s background emissions, but noted that the monitor is located at a greater
distance than the monitors located in Marion County. To ensure a conservative and accurate
background concentration, the closest monitors to the project area were also included in the
calculations as their 3‐year values were higher than the Monroe County monitor.
In addition, these values are conservative because it is expected that ambient PM2.5 concentrations will
be lower in future years as a result of the State Implementation Plan and the general trend in declining
vehicle emissions due to technological advances. This value was added to the AERMOD modeled
receptor values to yield a design values for comparison to the NAAQS.
J.(Step7)CalculateDesignValuesandDetermineConformity
The previous steps of the PM hot‐spot analysis were combined to determine design values that were
compared to the NAAQS for each analysis year. The annual PM2.5 design values are defined as the
average of three consecutive years’ annual averages, each estimated using equally‐weighted quarterly
averages. This NAAQS is met when the three‐year average concentration is less than or equal to the
1997 annual PM2.5 NAAQS.
AERMOD was run to provide the annual average PM2.5 concentrations at each receptor. For the receptor
with the maximum modeled concentration (in each analysis year), the following steps were used to
determine the design value, as outlined in EPA’s guidance.
1. Obtain the average annual concentration for the receptor with the maximum modeled
concentration from AERMOD output.
2. Add the average annual background concentration (11.27 µg/m³ as described in Step 6) to the
average annual modeled concentration to determine the total average annual concentration.
3. Exhibit 9 summarizes the design values that correspond to the receptor with the maximum
modeled concentration for each analysis year. All design values for the maximum receptor
location are below the 1997 annual PM2.5 NAAQS of 15.0 µg/m³.
4. It is implied that the design value for all other receptors within the model domain are equal to,
or lower than, the values in Exhibit 9, and therefore, are also below the NAAQS.
PM2.5 Quantitative Hot‐spot Analysis Page 12
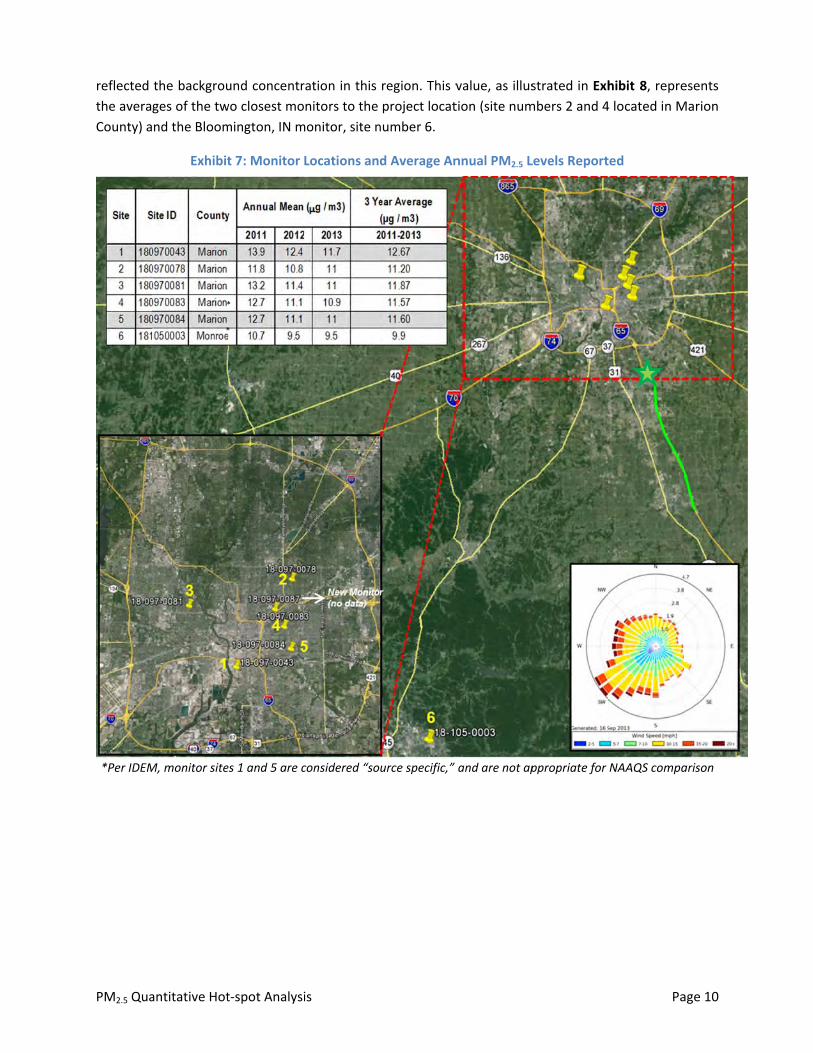
Exhibit 9: Estimated 2017 Design Value
Analysis Year Background Concentration
(µg/m³)
AERMOD Modeling Results*
(µg/m³)
Design Value (µg/m³)
(rounded to one decimal per EPA Guidance)
2017 11.27 0.76 12.0
Notes: Modeling results are for the receptors with the maximum concentration. 1997 annual PM2.5 NAAQS is 15 µg/m³ µg/m³ = micrograms per cubic meter
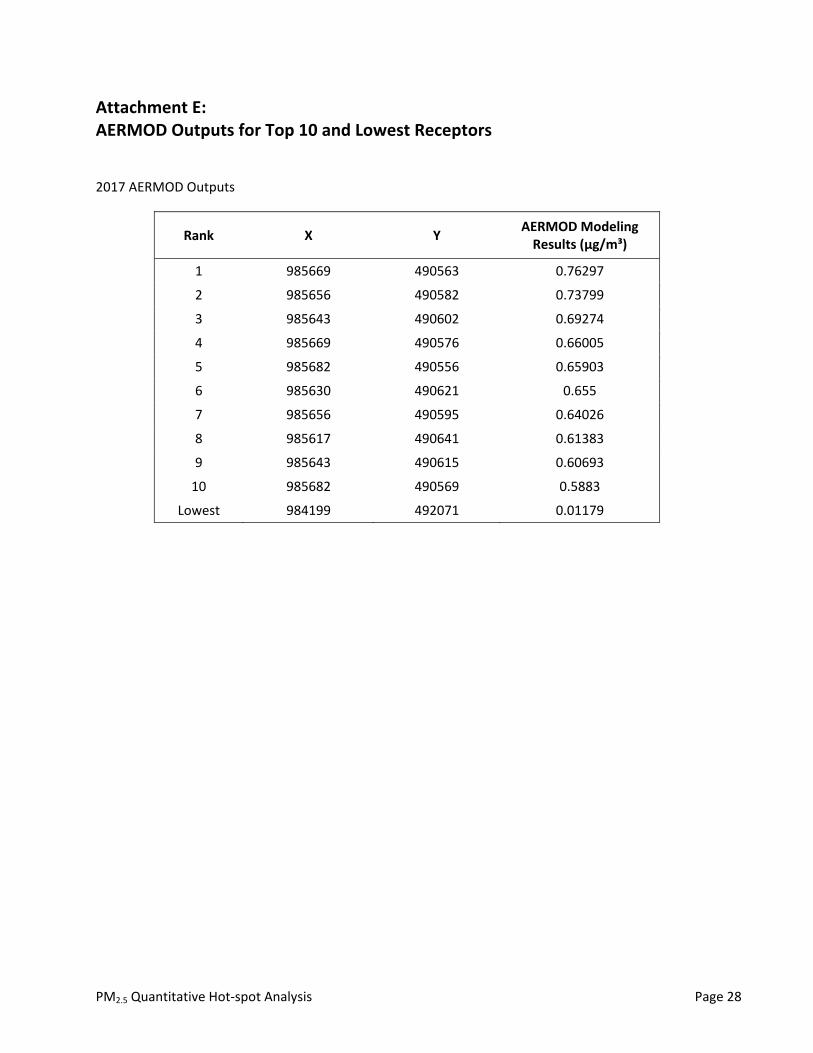
Exhibit 10 illustrates the top 10 receptors with the highest concentrations from the modeling results.
The project does not create a violation of the 1997 annual PM2.5 NAAQS or worsen an existing
exceedance of the NAAQS, which supports the project level conformity determination. Attachment E
summarizes the AERMOD modeling results for top 10 receptors with the highest concentrations and the
receptor with lowest concentration for 2017.
Exhibit 10: Receptors with Highest Concentrations
K.(Step8)MitigationorControlMeasures
No mitigation of air quality effects was proposed. All modeled annual PM2.5 concentrations are below
the NAAQS.
L.(Step9)DocumentthePMHot‐SpotAnalysis
This report documents the PM hot‐spot analysis. Because of the large volume of input and output files,
they are not included in this report and are available electronically upon request.
PM2.5 Quantitative Hot‐spot Analysis Page 13
M.PublicInvolvement
The conformity rule requires agencies completing project‐level conformity determinations to establish a
proactive public involvement process that provides opportunity for public review and comment (40 CFR
93.105(e)). The technical report was advertised in the <Provide Newspaper> on <Provide Date>. A
<Comment period length> comment period was offered, which concluded on <Provide Date>. Copies
of the public notices and affidavits are provided in Attachment F. No comments were received during
the comment period.
N.Conclusion
This technical report has provided a quantitative PM2.5 hot‐spot analysis for the I‐65, SR44 to Southport
Road project in Indiana. The interagency consultation process played an integral role in defining the
need, methodology and assumptions for the analysis. The air quality analysis included modeling
techniques to estimate project‐specific emission factors from vehicle exhaust and local PM2.5
concentrations due to project operation. Emissions and dispersion modeling techniques were consistent
with the EPA quantitative PM hot‐spot analysis guidance, “Transportation Conformity Guidance for
Quantitative Hot‐spot Analysis in PM2.5 and PM10 Nonattainment and Maintenance Areas“ (USEPA, 2013)
that was updated in November 2013.
The analysis had demonstrated transportation conformity for the project by determining that future
design value concentrations for the 2017 analysis year will be lower than the 1997 annual PM2.5 NAAQS
of 15.0 µg/m³. As a result, the project does not create a violation of the 1997 annual PM2.5 NAAQS,
worsen an existing violation of the NAAQS, or delay timely attainment of the NAAQS and interim
milestones, which meets 40 CRF 93.116 and 93.123 and supports the project level conformity
determination.
References
United States Environmental Protection Agency (USEPA). 2013. “Transportation Conformity
Guidance for Quantitative Hot‐spot Analyses in PM2.5 and PM10 Nonattainment and
Maintenance Areas.”
United States Environmental Protection Agency (USEPA) and United States Department of
Transportation. 2012. “Completing Quantitative PM Hot‐spot Analysis: 3 Day Course”
Attachments
Attachment A: Traffic Volume Forecasts
Attachment B: MOVES Link Data Input Files
Attachment C: MOVES Outputs (Emission Rates for AERMOD Modeling)
Attachment D: MOVES and AERMOD Input Data Assumptions and Parameters
Attachment E: AERMOD Outputs for Top 10 and Lowest Receptors
Attachment F: Public Comment Notices and Affidavits

PM2.5 Quantitative Hot‐spot Analysis Page 14
Attachment A: Traffic Volume Forecasts I‐65 SR44 at Southport Road <Volume Plots Begin on Following Page>
PM2.5 Quantitative Hot‐spot Analysis Page 15
PM2.5 Quantitative Hot‐spot Analysis Page 16
PM2.5 Quantitative Hot‐spot Analysis Page 17
PM2.5 Quantitative Hot‐spot Analysis Page 18
Attachment B: MOVES Link Data Input Files MOVES Emissions Analysis Inputs 2017 Daily (For Hours 12 AM and 12 PM Runs)
PM2.5 Quantitative Hot‐spot Analysis Page 19
MOVES Emissions Analysis Inputs 2017 AM Peak Period (For Hour 6 AM Run)
PM2.5 Quantitative Hot‐spot Analysis Page 20
MOVES Emissions Analysis Inputs 2017 PM Peak Period (For Hour 6 PM Run)

PM2.5 Quantitative Hot‐spot Analysis Page 21
Attachment C:
MOVES Outputs (Emission Rates for AERMOD Modeling)
<Data Outputs Begin on Following Page>
PM2.5 Quantitative Hot‐spot Analysis Page 22
2017 MOVES Emission Rates (grams/second/meter2) January
Month Link ID AM MD PM NT
January 1 1.72108E‐07 1.08798E‐07 2.6431E‐07 1.37163E‐07
January 2 1.6515E‐07 9.92922E‐08 2.48164E‐07 1.27712E‐07
January 3 1.3639E‐07 9.09692E‐08 2.138E‐07 1.1479E‐07
January 4 1.33513E‐07 8.90047E‐08 2.09164E‐07 1.12312E‐07
January 5 7.13109E‐08 4.45005E‐08 8.74632E‐08 5.25359E‐08
January 6 5.56693E‐08 3.47392E‐08 6.82717E‐08 4.10111E‐08
January 7 5.52951E‐08 3.45109E‐08 6.78239E‐08 4.07373E‐08
January 8 1.49972E‐07 9.76044E‐08 2.26844E‐07 1.23164E‐07
January 9 1.73741E‐07 7.63686E‐08 1.1702E‐07 9.62971E‐08
January 10 3.94516E‐08 2.69717E‐08 7.45809E‐08 3.30384E‐08
January 11 3.14072E‐06 1.35828E‐06 1.95875E‐06 1.71275E‐06
January 12 2.30381E‐07 8.90661E‐08 9.4542E‐08 1.05583E‐07
January 13 2.08528E‐07 8.07279E‐08 8.56718E‐08 9.56126E‐08
January 14 2.39303E‐07 9.25026E‐08 9.81895E‐08 1.09669E‐07
January 15 2.34494E‐07 9.0786E‐08 9.63481E‐08 1.07519E‐07
January 16 2.21776E‐07 9.18985E‐08 1.28599E‐07 1.15876E‐07
January 17 2.05594E‐07 8.51915E‐08 1.19224E‐07 1.0743E‐07
January 18 2.441E‐07 7.39151E‐08 1.05621E‐07 9.31977E‐08
January 19 2.64802E‐07 8.01292E‐08 1.14511E‐07 1.01079E‐07
January 20 2.63289E‐07 1.01068E‐07 1.39563E‐07 1.27458E‐07
January 21 1.2569E‐07 6.97442E‐08 1.30976E‐07 8.55568E‐08
January 22 8.92778E‐07 4.48971E‐07 1.02008E‐06 5.28571E‐07
January 23 1.03824E‐07 1.17561E‐07 8.34664E‐08 1.38351E‐07
January 24 1.48937E‐07 1.05624E‐07 1.8794E‐07 1.27801E‐07
January 25 9.42959E‐08 6.59079E‐08 1.17312E‐07 8.06411E‐08
January 26 7.27658E‐08 4.17851E‐08 8.03457E‐08 5.0889E‐08
January 27 1.2872E‐07 8.23811E‐08 1.44895E‐07 9.66352E‐08
January 28 1.12588E‐07 5.11981E‐08 9.56113E‐08 6.08571E‐08
January 29 1.90094E‐07 6.17036E‐08 9.14361E‐08 7.4723E‐08
January 30 3.18853E‐08 2.78921E‐08 5.77165E‐08 3.42787E‐08
January 31 5.7837E‐07 4.14358E‐07 7.23566E‐07 4.87139E‐07
January 32 2.30544E‐07 1.0072E‐07 1.59264E‐07 1.21398E‐07
January 33 1.36786E‐07 8.60681E‐08 1.59825E‐07 1.04723E‐07
January 34 2.02949E‐07 1.26301E‐07 2.82285E‐07 1.46999E‐07
January 35 2.27406E‐07 1.41558E‐07 3.16375E‐07 1.64726E‐07
January 36 1.55474E‐07 1.22553E‐07 2.78165E‐07 1.42542E‐07
January 37 1.66329E‐07 1.31023E‐07 2.97475E‐07 1.52507E‐07
January 38 1.66612E‐07 7.01284E‐08 1.13366E‐07 8.5387E‐08
January 39 1.58004E‐07 9.2108E‐08 1.4154E‐07 1.08084E‐07
January 40 1.10163E‐07 6.39001E‐08 1.20643E‐07 7.70235E‐08
January 41 1.28416E‐07 7.44881E‐08 1.03494E‐07 8.97861E‐08
January 42 6.49807E‐08 6.43716E‐08 1.44545E‐07 7.82966E‐08
January 43 1.60766E‐07 1.73839E‐07 3.91869E‐07 2.03842E‐07
January 44 1.18077E‐07 1.03721E‐07 2.44193E‐07 1.24903E‐07
January 45 2.34124E‐08 1.54903E‐08 3.47433E‐08 1.89828E‐08
January 46 5.3897E‐08 4.02947E‐08 1.32955E‐07 4.68757E‐08
January 47 2.6252E‐07 1.11685E‐07 1.77203E‐07 1.34599E‐07
January 48 1.8606E‐07 7.83138E‐08 1.26599E‐07 9.53534E‐08
January 49 4.95328E‐08 4.51731E‐08 9.95846E‐08 5.49468E‐08
January 50 8.42487E‐08 7.86469E‐08 2.31007E‐07 9.21989E‐08
January 51 1.0409E‐07 1.17051E‐07 1.181E‐07 1.37282E‐07
PM2.5 Quantitative Hot‐spot Analysis Page 23
2017 MOVES Emission Rates (grams/second/meter2) April
Month Link ID AM MD PM NT
April 1 1.02583E‐07 7.04398E‐08 1.71192E‐07 8.40898E‐08
April 2 1.07366E‐07 6.08595E‐08 1.69707E‐07 7.45364E‐08
April 3 8.16463E‐08 5.87573E‐08 1.34839E‐07 7.02202E‐08
April 4 7.9906E‐08 5.74865E‐08 1.31915E‐07 6.87023E‐08
April 5 5.01187E‐08 3.36343E‐08 6.54659E‐08 3.75009E‐08
April 6 3.91276E‐08 2.62579E‐08 5.11033E‐08 2.92759E‐08
April 7 3.88736E‐08 2.60911E‐08 5.07796E‐08 2.90872E‐08
April 8 8.97564E‐08 6.30398E‐08 1.43065E‐07 7.534E‐08
April 9 1.03552E‐07 4.94199E‐08 7.49026E‐08 5.90096E‐08
April 10 2.57918E‐08 1.87677E‐08 5.0761E‐08 2.16871E‐08
April 11 1.87199E‐06 8.78928E‐07 1.25383E‐06 1.04951E‐06
April 12 1.59688E‐07 6.67296E‐08 7.03776E‐08 7.46781E‐08
April 13 1.44836E‐07 6.05991E‐08 6.39007E‐08 6.77617E‐08
April 14 1.65832E‐07 6.92883E‐08 7.30757E‐08 7.75488E‐08
April 15 1.62896E‐07 6.8159E‐08 7.18744E‐08 7.62107E‐08
April 16 1.32212E‐07 5.94732E‐08 8.23445E‐08 7.1012E‐08
April 17 1.22542E‐07 5.51192E‐08 7.6317E‐08 6.58206E‐08
April 18 1.46772E‐07 4.78386E‐08 6.78552E‐08 5.71183E‐08
April 19 1.59051E‐07 5.17981E‐08 7.34788E‐08 6.18802E‐08
April 20 1.58268E‐07 6.53811E‐08 8.8019E‐08 7.80806E‐08
April 21 8.08599E‐08 4.83608E‐08 9.05397E‐08 5.59703E‐08
April 22 6.29818E‐07 3.41335E‐07 7.72631E‐07 3.79634E‐07
April 23 7.33177E‐08 8.94483E‐08 6.32792E‐08 9.94513E‐08
April 24 9.87888E‐08 7.56355E‐08 1.34024E‐07 8.6307E‐08
April 25 6.09891E‐08 4.59845E‐08 8.1528E‐08 5.30743E‐08
April 26 4.77945E‐08 2.94743E‐08 5.71961E‐08 3.38552E‐08
April 27 9.18057E‐08 6.31067E‐08 1.09941E‐07 6.99649E‐08
April 28 7.78951E‐08 3.8137E‐08 7.0652E‐08 4.27846E‐08
April 29 1.25779E‐07 4.40973E‐08 6.57156E‐08 5.03625E‐08
April 30 2.05083E‐08 1.92553E‐08 3.93442E‐08 2.23288E‐08
April 31 4.09064E‐07 3.15943E‐07 5.49435E‐07 3.50961E‐07
April 32 1.52936E‐07 7.2757E‐08 1.15009E‐07 8.27074E‐08
April 33 8.96198E‐08 6.08418E‐08 1.12766E‐07 6.98186E‐08
April 34 1.47333E‐07 9.83129E‐08 2.18236E‐07 1.08271E‐07
April 35 1.65162E‐07 1.1023E‐07 2.44675E‐07 1.21377E‐07
April 36 1.13052E‐07 9.55237E‐08 2.15418E‐07 1.05141E‐07
April 37 1.20763E‐07 1.01974E‐07 2.30003E‐07 1.1231E‐07
April 38 1.09444E‐07 4.94946E‐08 8.07109E‐08 5.68371E‐08
April 39 1.126E‐07 7.05057E‐08 1.07296E‐07 7.81922E‐08
April 40 7.40397E‐08 4.61536E‐08 8.66724E‐08 5.24687E‐08
April 41 8.63078E‐08 5.38011E‐08 7.43525E‐08 6.11625E‐08
April 42 4.25742E‐08 4.5541E‐08 1.01985E‐07 5.22418E‐08
April 43 1.13702E‐07 1.3327E‐07 2.99481E‐07 1.47706E‐07
April 44 7.86547E‐08 7.50759E‐08 1.76337E‐07 8.52688E‐08
April 45 1.52832E‐08 1.07674E‐08 2.35994E‐08 1.2448E‐08
April 46 3.92039E‐08 3.13957E‐08 1.02667E‐07 3.45621E‐08
April 47 1.76438E‐07 8.06993E‐08 1.27306E‐07 9.17256E‐08
April 48 1.22218E‐07 5.52717E‐08 9.01318E‐08 6.34715E‐08
April 49 3.243E‐08 3.19563E‐08 7.02631E‐08 3.66595E‐08
April 50 5.95788E‐08 6.03221E‐08 1.76553E‐07 6.68426E‐08
April 51 7.36064E‐08 8.96927E‐08 9.02567E‐08 9.94272E‐08
PM2.5 Quantitative Hot‐spot Analysis Page 24
2017 MOVES Emission Rates (grams/second/meter2) July
Month MOVESlinkID AM MD PM NT
July 1 8.92813E‐08 6.90832E‐08 1.65657E‐07 7.43689E‐08
July 2 9.63105E‐08 5.94966E‐08 1.65042E‐07 6.47962E‐08
July 3 7.11727E‐08 5.7618E‐08 1.30145E‐07 6.20568E‐08
July 4 6.96498E‐08 5.63717E‐08 1.27322E‐07 6.07149E‐08
July 5 4.6064E‐08 3.32507E‐08 6.41597E‐08 3.4747E‐08
July 6 3.59628E‐08 2.59585E‐08 5.00837E‐08 2.71264E‐08
July 7 3.57318E‐08 2.57939E‐08 4.97677E‐08 2.69533E‐08
July 8 7.82359E‐08 6.18174E‐08 1.38084E‐07 6.65803E‐08
July 9 9.01231E‐08 4.84668E‐08 7.23988E‐08 5.21802E‐08
July 10 2.31785E‐08 1.84774E‐08 4.93443E‐08 1.9608E‐08
July 11 1.62925E‐06 8.61976E‐07 1.21192E‐06 9.28028E‐07
July 12 1.46163E‐07 6.59411E‐08 6.89426E‐08 6.90174E‐08
July 13 1.3265E‐07 5.98882E‐08 6.26079E‐08 6.26603E‐08
July 14 1.51775E‐07 6.84683E‐08 7.15843E‐08 7.16654E‐08
July 15 1.49198E‐07 6.73599E‐08 7.04212E‐08 7.04761E‐08
July 16 1.15077E‐07 5.83265E‐08 7.95949E‐08 6.27945E‐08
July 17 1.06652E‐07 5.40555E‐08 7.37663E‐08 5.81994E‐08
July 18 1.2815E‐07 4.69145E‐08 6.56079E‐08 5.05094E‐08
July 19 1.38819E‐07 5.07943E‐08 7.10372E‐08 5.46999E‐08
July 20 1.38175E‐07 6.41191E‐08 8.49544E‐08 6.90367E‐08
July 21 7.22829E‐08 4.76044E‐08 8.81365E‐08 5.0551E‐08
July 22 5.7951E‐07 3.37549E‐07 7.57973E‐07 3.52356E‐07
July 23 6.74814E‐08 8.84591E‐08 6.20834E‐08 9.23266E‐08
July 24 8.91946E‐08 7.45762E‐08 1.30822E‐07 7.87068E‐08
July 25 5.46168E‐08 4.528E‐08 7.94016E‐08 4.80249E‐08
July 26 4.3017E‐08 2.90392E‐08 5.58209E‐08 3.07352E‐08
July 27 8.47436E‐08 6.24291E‐08 1.07871E‐07 6.50801E‐08
July 28 7.12577E‐08 3.76764E‐08 6.9171E‐08 3.94744E‐08
July 29 1.13474E‐07 4.34752E‐08 6.41886E‐08 4.59004E‐08
July 30 1.83316E‐08 1.89495E‐08 3.82514E‐08 2.01399E‐08
July 31 3.76674E‐07 3.12481E‐07 5.39123E‐07 3.26019E‐07
July 32 1.38088E‐07 7.17696E‐08 1.12382E‐07 7.56204E‐08
July 33 8.05959E‐08 5.99503E‐08 1.09971E‐07 6.34256E‐08
July 34 1.36692E‐07 9.73274E‐08 2.1444E‐07 1.01178E‐07
July 35 1.53253E‐07 1.09127E‐07 2.40424E‐07 1.13437E‐07
July 36 1.04936E‐07 9.45721E‐08 2.11699E‐07 9.8291E‐08
July 37 1.12046E‐07 1.00951E‐07 2.26004E‐07 1.04947E‐07
July 38 9.85061E‐08 4.87652E‐08 7.87708E‐08 5.16081E‐08
July 39 1.03913E‐07 6.97463E‐08 1.05268E‐07 7.27175E‐08
July 40 6.71287E‐08 4.55269E‐08 8.46557E‐08 4.79711E‐08
July 41 7.82517E‐08 5.30707E‐08 7.26224E‐08 5.59196E‐08
July 42 3.82875E‐08 4.48756E‐08 9.94574E‐08 4.74698E‐08
July 43 1.04698E‐07 1.31844E‐07 2.94012E‐07 1.37424E‐07
July 44 7.11123E‐08 7.40644E‐08 1.72309E‐07 7.80094E‐08
July 45 1.37279E‐08 1.06003E‐08 2.29365E‐08 1.12511E‐08
July 46 3.63929E‐08 3.10825E‐08 1.00871E‐07 3.23068E‐08
July 47 1.59969E‐07 7.96053E‐08 1.24344E‐07 8.38728E‐08
July 48 1.10004E‐07 5.44572E‐08 8.79653E‐08 5.76318E‐08
July 49 2.91578E‐08 3.14891E‐08 6.85215E‐08 3.33099E‐08
July 50 5.48591E‐08 5.9678E‐08 1.7333E‐07 6.21983E‐08
July 51 6.77744E‐08 8.8731E‐08 8.86086E‐08 9.24938E‐08

PM2.5 Quantitative Hot‐spot Analysis Page 25
2017 MOVES Emission Rates (grams/second/meter2) October
Month MOVESlinkID AM MD PM NT
October 1 1.40236E‐07 9.15772E‐08 2.22607E‐07 1.12851E‐07
October 2 1.38659E‐07 8.20374E‐08 2.13026E‐07 1.03351E‐07
October 3 1.11294E‐07 7.65078E‐08 1.78437E‐07 9.43726E‐08
October 4 1.08938E‐07 7.48546E‐08 1.74567E‐07 9.23348E‐08
October 5 6.15955E‐08 3.96219E‐08 7.76112E‐08 4.56482E‐08
October 6 4.80861E‐08 3.09314E‐08 6.05824E‐08 3.56352E‐08
October 7 4.7767E‐08 3.07307E‐08 6.01904E‐08 3.54004E‐08
October 8 1.22367E‐07 8.20869E‐08 1.89323E‐07 1.01256E‐07
October 9 1.41564E‐07 6.42701E‐08 9.81576E‐08 7.9216E‐08
October 10 3.31895E‐08 2.32885E‐08 6.39126E‐08 2.78384E‐08
October 11 2.55911E‐06 1.14308E‐06 1.64305E‐06 1.40892E‐06
October 12 1.97973E‐07 7.90379E‐08 8.37192E‐08 9.14252E‐08
October 13 1.7933E‐07 7.16906E‐08 7.5921E‐08 8.2854E‐08
October 14 2.05621E‐07 8.20799E‐08 8.69417E‐08 9.49546E‐08
October 15 2.01671E‐07 8.06273E‐08 8.53871E‐08 9.31762E‐08
October 16 1.80717E‐07 7.73413E‐08 1.07884E‐07 9.53244E‐08
October 17 1.67521E‐07 7.16906E‐08 1.00008E‐07 8.83689E‐08
October 18 1.9948E‐07 6.22078E‐08 8.87065E‐08 7.66693E‐08
October 19 2.16321E‐07 6.74096E‐08 9.6134E‐08 8.31216E‐08
October 20 2.15145E‐07 8.50466E‐08 1.16479E‐07 1.04839E‐07
October 21 1.05139E‐07 6.01441E‐08 1.12866E‐07 7.20031E‐08
October 22 7.72231E‐07 4.00646E‐07 9.09258E‐07 4.60345E‐07
October 23 8.98391E‐08 1.04939E‐07 7.44255E‐08 1.20531E‐07
October 24 1.25948E‐07 9.21605E‐08 1.63793E‐07 1.08792E‐07
October 25 7.90271E‐08 5.69632E‐08 1.01286E‐07 6.80129E‐08
October 26 6.13183E‐08 3.62583E‐08 6.99778E‐08 4.30858E‐08
October 27 1.11798E‐07 7.37278E‐08 1.29241E‐07 8.44181E‐08
October 28 9.66837E‐08 4.53341E‐08 8.44328E‐08 5.25779E‐08
October 29 1.6061E‐07 5.3799E‐08 7.99167E‐08 6.35633E‐08
October 30 2.66696E‐08 2.40144E‐08 4.9488E‐08 2.88043E‐08
October 31 5.00756E‐07 3.70173E‐07 6.45579E‐07 4.24758E‐07
October 32 1.94966E‐07 8.81653E‐08 1.39444E‐07 1.03674E‐07
October 33 1.15164E‐07 7.47428E‐08 1.38749E‐07 8.87334E‐08
October 34 1.77453E‐07 1.13735E‐07 2.53599E‐07 1.29258E‐07
October 35 1.98872E‐07 1.27492E‐07 2.84262E‐07 1.44868E‐07
October 36 1.36026E‐07 1.10418E‐07 2.50062E‐07 1.25409E‐07
October 37 1.45441E‐07 1.1798E‐07 2.67256E‐07 1.34092E‐07
October 38 1.40405E‐07 6.08648E‐08 9.87412E‐08 7.23084E‐08
October 39 1.3719E‐07 8.24095E‐08 1.26204E‐07 9.43909E‐08
October 40 9.36031E‐08 5.59326E‐08 1.05429E‐07 6.5775E‐08
October 41 1.09113E‐07 6.52006E‐08 9.04429E‐08 7.66737E‐08
October 42 5.47091E‐08 5.59178E‐08 1.25485E‐07 6.63611E‐08
October 43 1.39191E‐07 1.55626E‐07 3.50494E‐07 1.78127E‐07
October 44 1.00005E‐07 9.08605E‐08 2.13803E‐07 1.06747E‐07
October 45 1.96857E‐08 1.33699E‐08 2.97522E‐08 1.59892E‐08
October 46 4.71614E‐08 3.62992E‐08 1.1939E‐07 4.12348E‐08
October 47 2.23058E‐07 9.7774E‐08 1.54856E‐07 1.14959E‐07
October 48 1.56794E‐07 6.79692E‐08 1.10267E‐07 8.07486E‐08
October 49 4.16923E‐08 3.92394E‐08 8.64529E‐08 4.65696E‐08
October 50 7.29393E‐08 7.04197E‐08 2.0662E‐07 8.05834E‐08
October 51 9.01159E‐08 1.04768E‐07 1.05631E‐07 1.19942E‐07

PM2.5 Quantitative Hot‐spot Analysis Page 26
Attachment D: MOVES and AERMOD Input Data Assumptions and Parameters Data Checklist MOVES Project‐Level Emission Modeling
PM2.5 Quantitative Hot‐spot Analysis Page 27
Data Checklist AERMOD Dispersion Modeling
PM2.5 Quantitative Hot‐spot Analysis Page 28
Attachment E: AERMOD Outputs for Top 10 and Lowest Receptors 2017 AERMOD Outputs
Rank X Y AERMOD Modeling Results (µg/m³)
1 985669 490563 0.76297
2 985656 490582 0.73799
3 985643 490602 0.69274
4 985669 490576 0.66005
5 985682 490556 0.65903
6 985630 490621 0.655
7 985656 490595 0.64026
8 985617 490641 0.61383
9 985643 490615 0.60693
10 985682 490569 0.5883
Lowest 984199 492071 0.01179

PM2.5 Quantitative Hot‐spot Analysis Page 29
Attachment F: Public Comment Notices and Affidavits <Notices and Affidavits Begin on Following Page>
Related Documents