Spelthorne Borough Council Air Quality Strategy “Action Plan” January 2005

Welcome message from author
This document is posted to help you gain knowledge. Please leave a comment to let me know what you think about it! Share it to your friends and learn new things together.
Transcript

Spelthorne Borough Council
Air Quality Strategy “Action Plan”
January 2005

Spelthorne Borough Council Air Quality Strategy: Action Plan
Page 2 of 105 January 2005
CONTACT DETAILS
Spelthorne Borough Council is interested in receiving your views on this Air Quality Action
Plan. If you wish to pass your thoughts on to us please send them to:
Tracey Willmott-French
Principal Pollution Control Officer
Spelthorne Borough Council
Council Offices
Knowle Green
Staines
Middlesex
TW18 1BX
Telephone: 01784 446259
Fax: 01784 446437
Email: [email protected]
Spelthorne Website: http://www.spelthorne.gov.uk

Spelthorne Borough Council Air Quality Strategy: Action Plan
Page 3 of 105 January 2005
GLOSSARY OF TERMS
General
Air Quality A general description of the extent to which the atmosphere contains pollutants principally from man-made sources.
Ambient Describes conditions that are found in the atmosphere to which individuals may be exposed.
AQMA Air Quality Management Area
BAA BAA Plc
Background A diffusion tube monitoring position typically in a residential housing area at least 50 metres in any direction from any busy road with continuous moving traffic.
CERC Cambridge Environmental Research Consultants Ltd
CES Consultants in Environmental Sciences Ltd
CBA Chris Blandford Associates
Cost-Benefit Analysis
Statutory requirement for any proposed air quality action plan, and provide a means of informed decision-making. Cost-effectiveness is determination by analysing the emission-effect chain. These range from £/tonne abated to £/(£-worth of effect). Explicit benefits analysis can help justify actions, and identify potential pitfalls in Action Plan development.
DETR Department of the Environment, Transport and the Regions, now superseded by DEFRA.
Diffusion Tubes
Are passive gas collection devices consisting of a small tube (7cmx1cm) containing a chemical absorbent. After exposure, the absorbed gas (e.g. NO2) is determined by chemical analysis. Diffusion tubes (samplers) are used to determine relatively long period average concentrations, typically weekly, fortnightly or monthly.
DoE Department of the Environment
EA Environment Agency
EC European Community
Emission Rate The rate at which a source emits a given pollutant, expressed as mass of pollutant emitted per unit time or distance travelled as required.
EPAQS Expert Panel on Air Quality Standards (which was set up by the Department of the Environment).
HA Highways Agency
Intermediate A diffusion tube monitoring position where a tube is located 20 - 30 metres back from the kerb of a busy road.
IPC Integrated Pollution Control
Kerbside A diffusion tube monitoring position where a tube is located on or close to a pavement of a busy road where people walk. Typically a worst-case position where highest levels of pollutants are likely to be found.
LAHT5 Local Authorities Heathrow Terminal 5 Group
LAPC Local Air Pollution Control
LAQM Local Air Quality Management
LAQS Local Air Quality Strategy
NAQS National Air Quality Strategy
Part A or B Process
An industrial processes prescribed under the Environmental Protection (Prescribed Processes and Substances) Regulation 1991 as amended. Emissions from these processes are controlled by the Environment Agency in the case of Integrated Pollution Control (IPC) for Part A2 processes (more polluting) and by Local Authorities in the case of Local Authority Air Pollution Control (LAPC) for Part A2 and B processes, the lesser polluting processes.
Pollutants Primary are substances emitted to the atmosphere as that substance. Secondary are formed from primary pollutants by chemical reactions in the atmosphere
QUARG Quality of Urban Air Review Group
Running Average An average (or mean) calculated over a specified number of consecutive hours or days within the period
Secondary Particles Produced by condensation of gaseous material through gas-particle conversion processes and comprises mainly sulphate and nitrates.
Sensitive Location A location (or receptor) where people might be subject to a change in air quality. In this context people would include susceptible people in locations such as schools and hospitals.
SEPA Scottish Environmental Protection Agency
Spelthorne Borough Council Air Quality Strategy: Action Plan
Page 4 of 105 January 2005
T5 Terminal 5.
UKNAQS United Kingdom National Air Quality Strategy
USANAAQS United States National Ambient Air Quality Standards
VOC Volatile Organic Compounds
Substances
Benzene A hydrocarbon that is a component of some solvents and fuels. It is emitted from a wide variety of combustion and transportation sources. It can also be released by evaporation from the use and storage of some hydrocarbons. Chemical formula: C6H6.
Carbon monoxide A chemical compound formed from the partial combustion of a fuel containing carbon (for example, motor fuel). Chemical formula: CO.
Lead A metal that is added to a proportion of petrol sold in the UK to improve combustion. Lead compounds are emitted from the exhausts of vehicles using leaded petrol. Chemical symbol: Pb.
Nitric oxide
A chemical compound formed during the combustion of compounds containing nitrogen (N), from any high-temperature combustion in the presence of air, and by secondary processes in the atmosphere. A component of oxides of nitrogen. Nitric oxide is the predominant oxide of nitrogen produced in the combustion process. Chemical formula: NO.
Nitrogen dioxide
A chemical compound formed during the combustion of compounds containing nitrogen (N), from any high temperature combustion process in the presence of excess air (or oxygen; O2) and by secondary processes in the atmosphere. A component of oxides of nitrogen chemical formula: NO2.
Nitrogen Oxides See Oxides of Nitrogen.
Oxides of Nitrogen A group of chemical compounds that may be inter-converted in the atmosphere. The principal oxides of nitrogen are nitric oxide and nitrogen dioxide. Usual chemical formula: NOx.
Oxygen A naturally occurring molecule that makes up approximately 20% of the earth’s atmosphere. Chemical formula: O2.
Particulate Matter Very small particles of any material. They may be natural (for example, wind generated dust), or man-made (for example, smoke from combustion processes).
PM10 Particulate matter with a median aerodynamic diameter of less than 10 microns (10-6m or 10µm).
Sulphur dioxide A chemical compound formed during the combustion of any fuel containing sulphur(s) in air. Chemical formula: SO2.
Units
k kilo (10³) hence 1 km = 1000m; kg = 1000g
m milli (10-³) hence 1 mg = 0.001g
µ micro (10-6) hence l µg = 0.000001g; 1 mg = 1000µg
n nano (10-9) hence 1 nm = 0.000001 mm
l litre
g gram
kg kilogram
mg milligram
µg microgram
te or t tonne, equivalent to one thousand kilograms
µg/m³ (micrograms per cubic metre)
A unit of concentration. A pollutant concentration of one microgram per cubic metre indicates that one cubic metre of air contains 10
-6 grams (or 1µg) of the pollutant.
ppm (parts per million) A unit of concentration. A pollutant concentration of one part per million indicates that in a given volume of air, 10-6 of that volume is occupied by the pollutant.
ppb (parts per billion) A unit of concentration. A pollutant concentration of one part per billion indicates that in a given volume or air, 10-9 of that volume is occupied by the pollutant.

Spelthorne Borough Council Air Quality Strategy: Action Plan
Page 5 of 105 January 2005
Conversion Factors
(@ 20°C and 1 atmosphere pressure)
NO2 (ppb) * 1.913 = NO2 (µg/m³)
NO (ppb) * 1.248 = NO (µg/m³)
NO (ppm) * 1.165 = NO (mg/m³)
SO2 (ppb) * 1.913 = SO2 (µg/m³)
O3 (ppb) * 1.996 = O3 (µg/m³)
NMHC (ppm) * 0.667 = NMHC (mg/m³)
Benzene (ppb) * 3.245 = benzene (µg/m³)
1,3 butadiene (ppb) * 2.247
= 1,3 butadiene (µg/m³)

Spelthorne Borough Council Air Quality Strategy: Action Plan
Page 6 of 105 January 2005
TABLE OF CONTENTS
EXECUTIVE SUMMARY 8
1.0 CONCLUSIONS OF THE 4TH STAGE REVIEW & ASSESSMENT 10
1.1 Nitrogen dioxide .........................................................................................................................................10
1.2 Particulate matter .......................................................................................................................................10 1.3 Declaration of the Air Quality Management Area .......................................................................................10 1.4 The Revision ..............................................................................................................................................11
2.0 THE REDUCTION OF NITROGEN DIOXIDE EMISSIONS TO AIR 13
2.1 European Measures for the Reduction of Air Pollution...............................................................................13 2.2 National Measures for the Reduction of Air Pollution .................................................................................13 2.3 Regional and Local Partnerships for the Improvement of Air Quality .........................................................14
2.4 Local Measures for the Reduction of Air Pollution......................................................................................15 2.5 The Development of an Action Plan...........................................................................................................15
3.0 WHAT THE PUBLIC THINK SHOULD BE DONE TO REDUCE NO2 LEVELS WITHIN
SPELTHORNE 17
4.0 NITROGEN DIOXIDE SOURCES WITHIN SPELTHORNE 20
4.1 Source Apportionment................................................................................................................................20
4.2 The Source Apportionment Study ..............................................................................................................21 4.3 Apportionment of Emissions Sources.........................................................................................................22
4.3.1 Apportionment of Emissions by source group...............................................................................22 4.3.2 Breakdown of traffic emissions by vehicle type.............................................................................24
4.3.2 Breakdown of traffic emissions by vehicle type.............................................................................24 4.3.3 Breakdown of traffic emissions by road types ...............................................................................26 4.3.3 Breakdown of traffic emissions by road types ...............................................................................26 4.3.4 Breakdown of traffic emissions into Heathrow & non-Heathrow traffic ..........................................28
4.3.4 Breakdown of traffic emissions into Heathrow & non-Heathrow traffic ..........................................28 4.3.5 Breakdown of Heathrow Airport Emission Sources.......................................................................30 4.3.6 Apportionment of Heathrow Airborne Aircraft Sources by Height..................................................32
5.0 EMISSION REDUCTION SCENARIO MODELLING 36
6.0 SPELTHORNE’S PLAN FOR THE REDUCTION OF NO2 38
6.1 Reduction of Emissions from Road Vehicles..............................................................................................38 6.1.1 Scenario Modelling: Reduction in traffic flows by 30%.................................................................38 6.1.2 Scenario Modelling: Low Emission Zones....................................................................................39 6.1.3 Scenario Modelling: Low Emission Zone (EURO II).....................................................................41
6.2 Control of Emissions Emanating from Highway Agency Controlled Roads................................................43 6.2.1 The M25 Orbital RMS Study .........................................................................................................44 6.2.2 Thames Valley Multi-Modal Study (TVMMS).................................................................................44 6.2.3 The M3 Route Management Strategy ...........................................................................................46 6.2.4 The Highway Agency & Development Control ..............................................................................46
6.2.5 General Actions.............................................................................................................................47 6.3 Control of Emissions Emanating from County Council Maintained Roads .................................................48
6.3.1 Surrey County Council’s Local Transport Plan (2001 to 2006) .....................................................48 6.3.2 Implementation of Surrey County Council’s Transport Plan within Spelthorne..............................52
6.3.2.1 Reduction of Road Traffic Emissions Caused by Travelling to School 53 6.3.2.2 General Actions for the reduction of Emissions from Road Vehicles on County Council
Controlled Roads in Spelthorne 56 6.4 Actions to reduce NOx Emissions Caused by Road Vehicles in General ...................................................65
6.4.1 Cleaner Technology ......................................................................................................................65 Funding Programmes for Cleaner Vehicles 65
6.4.2 Cleaner Fuels................................................................................................................................66 Financial Relief for Cleaner Fuel Use 67
6.4.3 Spelthorne’s Plan to Encouraging use of cleaner vehicles............................................................67 6.4.4 Business Travel Plans - Local businesses ....................................................................................68
6.5 Reducing emissions from the Council’s Activities ......................................................................................69 6.5.1 Spelthorne’s Business Transport Plan (SBTP)..............................................................................69
6.5.2 Reducing Emissions from Spelthorne Fleet Vehicles....................................................................72 6.6 Actions to reduce NO2 emissions resulting from activities at Heathrow Airport..........................................74
6.6.1 Scenario Modelling: Reduction of 50% in airborne aircraft emissions...........................................74

Spelthorne Borough Council Air Quality Strategy: Action Plan
Page 7 of 105 January 2005
6.6.2 Working in Partnership..................................................................................................................75 6.7 Reducing Air Pollution through Land Use Planning....................................................................................76
6.7.1 The Local Plan ..............................................................................................................................76
6.7.3 Supplementary Planning Guidance: A Parking Strategy For Surrey .............................................77 6.7.3.1 Parking Standards in Spelthorne 79
6.7.2 Local Development Control ...........................................................................................................80 6.8 Regulation of Industrial sources .................................................................................................................81
6.9 Smoke & Bonfire Control............................................................................................................................82 6.9.1 Smoke Control Areas ....................................................................................................................82 6.9.2 Bonfires.........................................................................................................................................82
Enforcement of Statutory Provisions for the Control of Smoke from bonfires 82
6.10 Awareness raising, education and public information to promote air pollution issues........................84 6.11 Working in Partnership.......................................................................................................................85
6.11.1 Local Authority Partners................................................................................................................85 6.11.2 Non Local Authority Partners ........................................................................................................85
6.12 Proposed Extension of the Air Quality NO2 Monitoring Strategy........................................................86 6.13 Energy Efficiency within Buildings......................................................................................................88
6.14 Summary of Actions To Reduce Nitrogen Dioxide Emissions within Spelthorne ...............................90
7.0 THE IMPACT OF IMPLEMENTING SPELTHORNE’S AIR QUALITY ACTION PLAN 96
7.1 Highway Agency Maintained Roads...........................................................................................................96 7.2 Surrey County Maintained Road ................................................................................................................96 7.3 Actions for the Reduction of Nitrogen Dioxide Emissions in the Sunbury Cross ........................................96
8.0 APPROPRIATENESS, PROPORTIONALITY AND FUNDING OF AIR QUALITY
MANAGEMENT ACTION PLAN 98
8.1 Analysis of Cost-Benefits & Wider Impacts ................................................................................................98 8.1.1 Road and Transport Related Projects ...........................................................................................98
8.2 Funding Implications of the Air Quality Management Action Plan ............................................................100 8.3 Costing Criteria ........................................................................................................................................100
8.4 Impacts on Air Quality ..............................................................................................................................100
APPENDICES 101
Appendix 1 - Action to reduce NOx Emissions Caused by Road Transport........................................................102 Appendix 2 - Action to reduce NOx Emissions Caused by Road Transport........................................................104
Spelthorne Borough Council Air Quality Strategy: Action Plan
Page 8 of 105 January 2005
EXECUTIVE SUMMARY
As detailed within Spelthorne’s 4th stage Review & Assessment of air quality, it is predicted
that the National Air Quality Strategy’s (NAQS) annual objective for nitrogen dioxide will be
exceeded at a number of hotspot locations in Spelthorne (section 1 refers). The principal
source of the nitrogen dioxide levels within Spelthorne is from road vehicles using Highway
Agency controlled roads and Surrey County Council controlled roads (section 4.0 refers).
This report summarises the actions that will be taken by Spelthorne Borough Council,
Surrey County Council and other stakeholders to improve air quality and tackle the causes
of the elevated nitrogen dioxide across the borough, and in particular at exceedance
locations.
On their own, it is not within Spelthorne Borough Council‘s gift to bring about reductions in
nitrogen dioxide emissions; this can only be attained by the Council working together with
it’s partners, the Highways Agency, and in particular Surrey County Council; and other
stakeholders such as BAA. However, achievement of the NAQS objectives for 2005 will not
be a realistic possibility at all locations within the borough of Spelthorne. It will only be
through the development and implementation of effective national policies, programmes and
projects that NAQS objectives will be achieved in areas adjacent to these continuing
exceedance locations.
The Control of Emissions From Surrey County Council Controlled Roads
The actions detailed within this action plan in respect of controlling of emissions emanating
from Surrey County Council controlled roads are aimed at widening peoples choice of
transport alternatives and reducing the dependency on the car as a means of private
transportation. While infrastructure alterations that purely offer solutions to increase road
traffic flow rates can reduce pollution levels within the immediate vicinity, this is a short-term
solution. The environmental and economic costs of this approach are too high, moreover,
they have been found to generate even greater traffic growth, which exacerbates the
problem in the long-term. It therefore follows that the only real sustainable options available
for the reduction of emissions from road vehicles using SCC controlled roads is through:
• Widening travel choice and encourage more journeys by public transport, cycle or walking
as a result of enhancing the public transport, cycle and pedestrian network and facilities;
• Bringing about the long-term reduction of emissions from vehicles transporting children to
school;
• Managing traffic and restraining the demand for travel;
• Providing a more integrated transport system;
• Planning and managing the highway network;
• Helping to make freight distribution more sustainable;

Spelthorne Borough Council Air Quality Strategy: Action Plan
Page 9 of 105 January 2005
With the exception of Sunbury Cross, it is anticipated that the measures detailed within this
action plan will satisfactory reduce nitrogen dioxide levels sufficiently so that the NAQS
annual objective for nitrogen dioxide will not be exceeded. At Sunbury Cross however, it
remains likely that the NAQS annual objective for nitrogen dioxide will be exceeded beyond
December 20051. The question as to whether this exceedance will continue beyond 20102
is being considered as part of a “detailed assessment” of air quality which currently being
undertaken by Spelthorne Borough Council.
The Surrey County Council transport related component of this air quality action plan is
currently separate from the Local Transport Plan; however, it will be integrated into the next
Local Transport Plan, which will be published in 2006. This will allow air quality problems
arising from Surrey County Council roads to be dealt with in a more corporate and multi-
disciplinary way. The close links formed between Spelthorne Borough Council and Surrey
County Council will remain unaffected by this integration as the Council and the County
Council will continue to work together to reduce emissions from County Council roads within
Spelthorne.
The Control of Emissions From Highways Agency Controlled Roads
The Highways Agency has initiated a number of actions that will help reduce emissions from
road vehicles using its roads. However, even with the implementation of these actions, it is
likely that the NAQS annual objective for nitrogen dioxide will continue to be exceeded at
various locations adjacent to the M25 and the M3 where members of the pubic are likely be
exposed to elevated levels of nitrogen dioxide beyond 2005.
Achieval of the NAQS objectives along these roads will require a very significant reduction in
traffic flows. However this is unlikely to happen as there are no alternative forms of
transport that could cope with the enormous extra demand and provide equivalent journey
times that are required. Consequently, it will only be through the development and
implementation of effective national policies, programmes and projects that NAQS
objectives will be achieved in areas adjacent to these Highway Agency controlled roads.
Consultation
In the development of this action plan we have sought and taken account of the views and
concerns of a number interested parties, including those of local businesses and members
of the community. Further details in respect of whom we consulted and how, along with
their opinions is provided in section 3.
1 The NAQS annual objective of 40 µg/m
3 must be achieved by 31 December 2005;
2 The European Union’s Air Quality Framework and Daughter Directive prescribed limit value for nitrogen dioxide of 40 µg/m
3
(as measured as an annual mean) must be achieved by 2010.

Spelthorne Borough Council Air Quality Strategy: Action Plan
Page 10 of 105 January 2005
1.0 CONCLUSIONS OF THE 4TH STAGE REVIEW & ASSESSMENT
1.1 Nitrogen dioxide
The modelling study carried out for the 4th Stage review and assessment predicted the
likelihood that the annual average National Air Quality Strategy (NAQS) objective for
nitrogen dioxide (NO2) will be exceeded in 2005 at various locations within the borough of
Spelthorne. Areas of predicted exceedance are those adjoining the busiest roads and
junctions, and in particulate the A30, M3 and M25.
The annual average concentrations of NO2 are predicted to be highest in the northwest of
the Borough, reaching more than 26 ppb (50 µg/m3) along the M25. Elsewhere in the
Borough concentrations are generally predicted to be below the NAQS objective value.
Stage 4 predictions indicate that members of the public will not be exposed to elevated
levels of NO2 in respect of the NAQS 99.79th percentile hourly average objective at any
location within the Borough, consequently, this hourly objective will not be exceeded at any
location within the borough of Spelthorne.
1.2 Particulate matter
Stage 4 predictions indicate that neither the 90.41st percentile of the daily maximum running
24-hour mean (50 µgm3) or the annual average (40 µgm3) NAQS objectives for 2004 would
be exceeded at any location within the borough of Spelthorne where members of the pubic
would reasonably be exposed.
1.3 Declaration of the Air Quality Management Area
In December 1999, the whole of the borough of Spelthorne was declared an air quality
management area (AQMA). This was in response to predictions made through the
3rd Stage assessment that the NAQS objectives for NOx would be exceeded, for both annual
average concentration and the 99.79th percentile of hourly average concentration in the
areas of Stanwell Moor, Stanwell, Ashford and Staines (figure 1.3 below refers).
When the Council set the AQMA boundary in 1999, it recognised that there was a level of
uncertainty present within the modelling process and that the potential existed for residents
of the Borough to be exposed to pollutants across a wider area than suggested by the
modelling study. In consideration of this risk, Spelthorne Borough Council adopted a
precautionary approached and declared whole of the Borough as an AQMA. Further details
on this issue can be found within the Stage 3 report which can be viewed on-line at the
Councils website (www.spelthorne.gov.uk), or it can be viewed by contacting the
Environmental Health team.
The modelling carried out as part of the 4th Stage of the review and assessment of air quality
determined that the 99.79th percentile hourly average NO2 objective for 2005 will not be
exceeded at any location within the borough of Spelthorne where members of the pubic

Spelthorne Borough Council Air Quality Strategy: Action Plan
Page 11 of 105 January 2005
could reasonably be exposed. The 4th Stage predictions are more accurate than those of
the 3rd Stage due to improvements in the ADMS-Urban model and recent revisions of the
emissions inventory data used in the set-up of the model. Further explanations of the
improvements and revisions can be found within appendix 3 of the Stage 4 Review and
Assessment report on the Council’s website.
Figure 1.3: Annual Average Nitrogen Dioxide concentrations (µg/m3) for 2005 (NAQS objective 40 µg/m3).
1.4 The Revision
Guidance LAQM.TG4(00) states that “local authorities should not consider exceedances of
objectives at any location where relevant public exposure would not be realistic.” The
reason being that the objective levels for NO2 are for the protection of public health.
In light of the fact that the stage 4 review and assessment of air quality determined that the
99.79th percentile of hourly average concentration for NO2 will not be exceeded at any
location within the Borough where members of the public will be exposed, therefore the air
quality management area has been revised such that the Spelthorne Borough Council no
longer declares for the 99.79th percentile of hourly average concentration for NO2.
It should be noted that no change has been made to the declaration of the AQMA in terms
of the annual average NO2 concentrations. While the Stage 4 assessment shows a
significant reduction in the extent of the exceedance area in terms of the annual average
Spelthorne Borough Council Air Quality Strategy: Action Plan
Page 12 of 105 January 2005
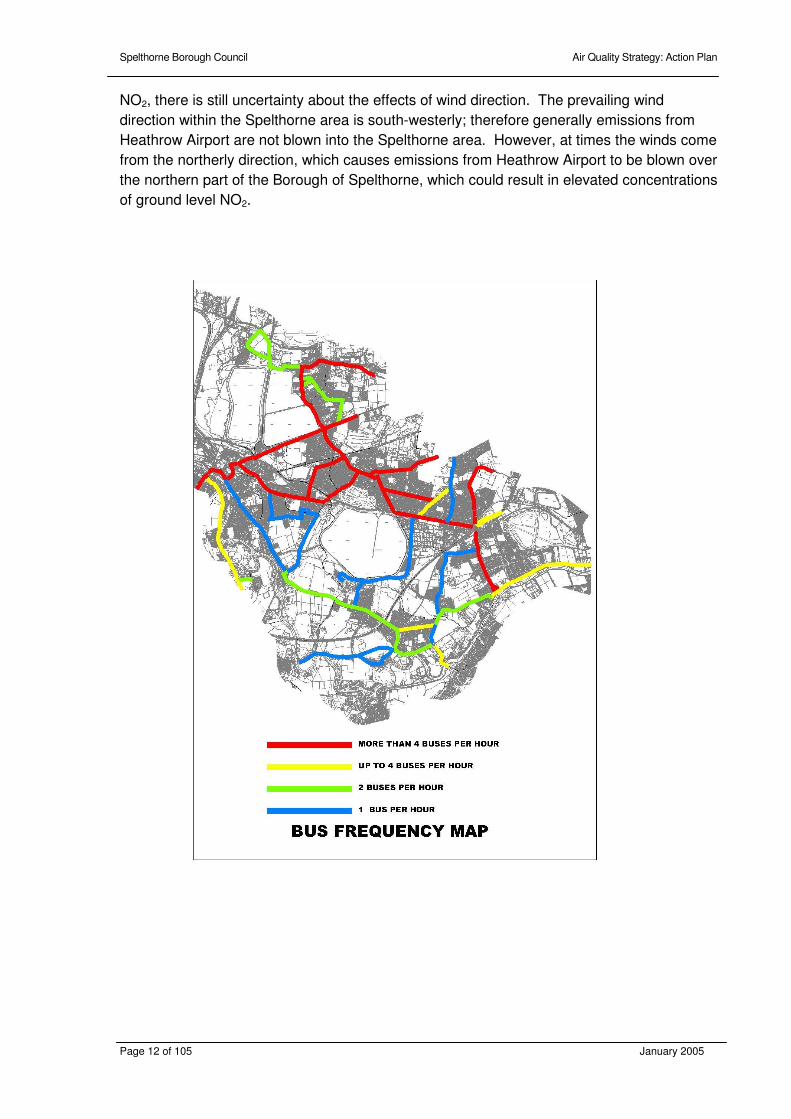
NO2, there is still uncertainty about the effects of wind direction. The prevailing wind
direction within the Spelthorne area is south-westerly; therefore generally emissions from
Heathrow Airport are not blown into the Spelthorne area. However, at times the winds come
from the northerly direction, which causes emissions from Heathrow Airport to be blown over
the northern part of the Borough of Spelthorne, which could result in elevated concentrations
of ground level NO2.

Spelthorne Borough Council Air Quality Strategy: Action Plan
Page 13 of 105 January 2005
2.0 THE REDUCTION OF NITROGEN DIOXIDE EMISSIONS TO AIR
2.1 European Measures for the Reduction of Air Pollution
Air quality is a key indicator for Europe’s progression towards achieving sustainable
development, a goal of which is the protection people’s health and the environment. For the
last 20 years, the European Union has been legislating for the control of emissions of air
pollutants and the introduction of air quality objectives.
Consolidation of the various pieces of legislation has resulted in the Air Quality Framework
Directive setting out a strategic framework for tackling ambient air quality through
assessment and management. Under this Directive provision has been made for the
development of a series of daughter directives covering 12 specific pollutants.
The first Daughter Directive (which sets limits for nitrogen dioxide and small particles for
2005 and 2010) has already been adopted into UK legislation via the Environment Act 1995.
Other European initiatives for improving air quality through the control of emissions to the
atmosphere include:
• The Auto-Oil Programme made provision for the introduced stringent emission standards
from all new cars and light vans sold from 1 January 2001 (known as Euro III Standards);
emissions standards will be further tightened (Euro IV standard) from
1 January 2006.
* Stringent emission standards were introduced for heavy-duty diesel engines in 2000. By
2005, heavy-duty diesel vehicles will need to be fitted with particulate traps that can reduce
PM10 emissions by up to 90%;
* Cleaner specification standards for petrol and diesel sold from 1 January 2000 and 2005,
including the general ban on lead in petrol in January 2000;
• The Large Combustion Plant Directive which further reduces sulphur dioxide, nitrogen
dioxide emissions, and particulate emissions from new large combustion plant such as
power stations, large boilers, and refinery boilers;
• The National Emissions Ceilings Directive which sets maximum limits for emissions from
each EU Member State of sulphur dioxide, nitrogen dioxide, ammonia and volatile organic
compounds to be achieved by 2010;
• The Ozone Daughter Directive which sets maximum limits for emissions from each EU
Member State that contributes to the formation of ground-level ozone;
• The Solvents Directive which will reduce VOC emissions from specific industrial
installations by 57% by 2007, when compared to a 1990 baseline;
2.2 National Measures for the Reduction of Air Pollution
All national policies are shaped by European legislation, which has resulted in EU legislation
being incorporated into UK policy through the introduction of new legislation or its integration
into existing legislation. Examples of UK policy having direct control of air quality include:
• The Environmental Protection Act, 1990 – which made provision for the setting of emission

Spelthorne Borough Council Air Quality Strategy: Action Plan
Page 14 of 105 January 2005
limits and environmental quality standards for pollutants, and on the total amounts of
pollutants that could be emitted;
• The Environment Act, 1995 – which made provision for the for a National Air Quality
Strategy and the introduction of the “Local Air Quality Management” system;
• The Pollution and Prevention Control Act, 1999 – which is replacing Part 1 of the 1990
Environmental Protection Act, for the control of emissions to the environment (including air)
from specified industrial processes.
In addition to the national policies that have a direct influence over air quality, there are
numerous other policies that are integral to improving air quality.
• Land-use planning - which requires local authorities to consider air quality when preparing
their development plans, transport plans, and when determining planning applications.
• The 10-year plan for Transport - which sets out an investment programme for reducing
traffic congestion, improving public transport, increasing personal travel choices, and cut
pollution levels.
As can be seen above, European and national policy has been integrated to actively reduce
pollution and improve air quality. In order to implement policy in a cost-effective and locally
applicable manner local authorities have been given the responsibility for much of its
delivery.
2.3 Regional and Local Partnerships for the Improvement of Air Quality
The NAQS points out that “air pollution does not respect local authority boundaries and
there is much to be gained if local authorities act collectively in an air quality management
grouping to address air quality over a much larger area, in conjunction with other agencies,
as appropriate.” The NAQS also states that local authorities should liaise and co-operate
with neighbouring and county authorities.
In assessing and implementing the options that the Spelthorne Borough Council can take
forward to improve air quality, it should be made clear that the Council cannot meet the
NAQS objectives through its own actions, achieving the NAQS objectives can only be done
by working in partnership with a number of different organisations including neighbouring
local authorities, other statutory agencies (e.g. Highways Agency, Environment Agency),
residents and local businesses to ensure that the proposed measures are successfully
implemented.
Spelthorne Borough Council is positioned such that it adjoins 2 distinct regional air quality
groups, these being the Surrey Air Quality Group and the West London Air Quality Group.
In consideration of the above, and in line with recommendations for the improvement of air
quality over the wider area, Spelthorne Borough Council is a member of both air quality
groups, working to improve air quality, both for Spelthorne and that of its neighbouring local
authorities, which due to the transboundary nature of air pollution are largely one and the
same.

Spelthorne Borough Council Air Quality Strategy: Action Plan
Page 15 of 105 January 2005
2.4 Local Measures for the Reduction of Air Pollution
The NAQS sets out a process for implementation of local air quality management (LAQM)
by local authorities. The process requires all local authorities to review and assess their air
quality. If it is found that any of the 7 pollution objectives are predicted to be exceeded by
the dates specified in the NAQS, the locality in which the exceedance occurs must
designate that area an air quality management area (AQMA).
2.5 The Development of an Action Plan
Where an AQMA has been designated, section 84(2) of the Environment Act 1995 requires
the local authority to draw up an action plan setting out what it intends to do to meet the
NAQS objectives and the timescales in which those actions will be implemented. Guidance
states that the purpose of the “Air Quality Action Plan” (AQAP) is to “ultimately provide the
mechanism by which local authorities, in collaboration with national agencies and others, will
state their intentions for working towards the air quality objectives through the use of the
powers they have available”.
Figure 2.5: The Process for Developing an Air Quality Action Plan
Source: NSCA, Air Quality Action Plans: Interim Guidance
NAQS objective/s
exceedances identified and
AQMA designated
Identify the sources and
devlop the optionsavailable
Roles and reponsibilities for
implementation of optionsidentified
Authority planning function
integration
Consider perceptions and
practicabilities of optionsidenfied
Consider non-air
quality impacts of
options identified Consider thecost-effectiveness of
options
Consider the air
quality improvementsthat maybe achieved
by implementation of
the option
Air Quality Action Plan
Prioritisation of
options
Spelthorne Borough Council Air Quality Strategy: Action Plan
Page 16 of 105 January 2005
In the development of AQAP Guidance (LAQM.TG(03)) advises Local Authorities:
• Action plan development should involve all relevant local authority professionals and
departments to ensure a properly balanced and corporately integrated approach to
improving air quality. This requires there to be effective links between all relevant
departments (environmental health, planning, transport planning and management, energy
reduction, waste management, economic development);
• Action plan development should involve other relevant agencies, in particular, the County
Council, the Environment Agency and the Highways Agency, neighbouring local
authorities, and the Public Health Care Trust;
• Action plan development should involve effective consultation and interaction with the
general public (local residents, community groups and local businesses) to ensure that
their views are taken into consideration, and to enlist their support for the air quality action
plan;
• To strike an appropriate balance between the use of regulatory powers and other non-
regulatory measures;
• To ensure that the relative contributions of industry, transport and individuals to air quality
improvement are cost-effective and proportionate;
• To carefully assess the options available to them to improve air within the AQMA; and
• To appraise and where possible quantify the wider environmental, economic and social
consequences of each option.
In the development of this “air quality action plan” the following documents have been
considered:
• Spelthorne’s “4th Stage Air Quality Review & Assessment”;
• Spelthorne’s “Air Quality Upgrading & Screening Assessment”;
• Spelthorne’s Community Plan;
• Surrey’s Local Transport Plan;
• Spelthorne’s Local Development Plan;
• Supplementary Planning Guidance: A Parking Strategy For Surrey, March 2003
• Spelthorne’s Draft Health Promotion Strategy;
• Spelthorne Corporate Plan (2004-2007)
• Best Value Performance Plan;
• Local Air Quality Management Technical Guidance LAQM.TG(03);
• Local Air Quality Management Technical Guidance LAQM.PG(03);
• The Air Quality Strategy for England, Scotland, Wales and Northern Ireland: Addendum;

Spelthorne Borough Council Air Quality Strategy: Action Plan
Page 17 of 105 January 2005
3.0 WHAT THE PUBLIC THINK SHOULD BE DONE TO REDUCE NO2 LEVELS WITHIN SPELTHORNE
Local authorities are required to consult widely with those who have an interest in air quality.
The purpose of consultation is to give interested parties the opportunity to make known their
views and to allow areas of concern to be highlighted.
It is this Authority’s aim to keep everyone in Spelthorne informed and to notify consultees of
progress and findings throughout the various stages of the process. Accordingly, in the
development of this air quality management action plan, Spelthorne Borough Council sought
the opinion of its statutory consultees (listed below), its residents and the business
community. A list of the consultees and the mechanisms for consultation are provided
below:
Statutory Consultees
• The Secretary of State;
• The Environment Agency;
• The Highways Authority;
• Surrey County Council;
• The Mayor of London;
• Neighbouring local authorities (the London Borough of Hillingdon; the London Borough of
Hounslow; the London Borough of Richmond upon Thames; Slough Borough Council; the
Royal Borough of Windsor and Maidenhead; and Runnymede Borough Council.
Departments within Spelthorne Borough Council
• Planning Policy
• Development Control
• Environment Services
Method of Consultation
In the development of this AQAP, the opinions of Spelthorne’s residential and business
communities have been sought on the many different issues relating to air quality.
Principally this has been carried out through a series of workshops attended by
representative members of the borough of Spelthorne comprising:
• Residents of Spelthorne - these representatives were randomly selected from the Borough
of Spelthorne’s Environmental Health database of persons who in the past have contacted
the Environmental Health Department to express their concern with regard to air quality
issues;
• The Student Council - the Student Council is a body of young people between 11 and 19
years of age who attend school or college in the Spelthorne area. Members of the Student
Council are elected to sit on the Student Council by their school/college;
• Representatives of Spelthorne’s business community – among others these included the

Spelthorne Borough Council Air Quality Strategy: Action Plan
Page 18 of 105 January 2005
Spelthorne’s Chamber of Commerce, BUPA, and London United Buses;
• Representatives of public bodies and agencies – including the Highways Agency, the
Environment Agency, Surrey County Council, and neighbouring local authorities;
Issues raised during the workshops included the negative impacts such as the effect that
elevated levels of NO2 may have on people’s health; and the perceived potential harmful
effects on Spelthorne’s community that some actions may cause, such as the burden those
actions such as congestion charging may place on individuals and businesses within the
Borough. Positive aspects were also considered, such as the enhanced quality of life that
would result from increased socialisation due to people using alternative modes of travel
other than the isolation of the private car.
A summary of the main actions that the representative members of the borough of
Spelthorne considered would be effective in reducing NO2 to below NAQS levels are
detained in box 3.1 below:
Box 3.1: A summary of actions considered to be effective in reducing NO2 levels
• Create a vision of how Spelthorne would achieve clean air through traffic reduction and ensure that
business supports that vision to implementation. This needs a well-cemented partnership so that everybody
feeling they are working towards something permanent. There must also be a political commitment to move
towards it;
• Work with the bus companies to ensure the Borough is bus friendly and the network of routes is well
publicised and supported;
• Better integration of transport networks so it is possible to take the bus to catch the train, etc;
• Run hotspot campaigns to reduce unnecessary journeys and reduce congestion in a tactical way;
• Keep facilities local to ensure people don’t have to drive to them;
• Ensure that Spelthorne Borough Council is pro-active in resisting development that may have a negative
impact on air quality;
• Lobby Central Government and invest money to ensure technology works to reduce emissions from
vehicles;
• Ensure that the Council is doing everything it can to minimise their own impact on the environment;
• Place more emphasis on other methods of transport and the provision of facilities to use them. For example
integrated cycle-lanes and showers at work. Most agreed that the only long term way to tackle to the
causes of the air quality problem was to improve the alternative facilities to an extent where it was beneficial
for people to use them rather than to take away liberties like using the car and force people on to public
transport;
• Ensure that the monitoring of air quality monitoring within the Borough is the best it can be. Make the
resulting information available to the community.
• Raise the community’s awareness about air pollution issues, and provide encouragement and information
so that behaviours can be changed in a manner that will improve air quality.
• The consultees would like information about the air quality of the area and an understanding on the actions
being taken forward.

Spelthorne Borough Council Air Quality Strategy: Action Plan
Page 19 of 105 January 2005
In addition to the workshops mentioned above, individual views of the community have been
sought. A survey was placed in the September 2002 issue of the “The Bulletin”; the
Borough’s monthly magazine. The questionnaire was also made available electronically
through the Borough of Spelthorne’s website (www.spelthorne.gov.uk).
Table 3.1: A summary of specific things actions members of the community would like to
see being done to improve the air quality in the area considered to be
effective in reducing NO2 levels.
ACTIONS %
Reduce or restrict further growth at H/row 17
Better public transport 13
Better traffic controls/reduce queuing 12
Avoid car use for school runs 8
Restrict/reduce lorry traffic 7
Tree Planting 7
Improved facilities for cyclists 6
Reduce residential bonfires 5
Car Share 4
Reduce/enforce speed limits 3
Monitoring/curbing of exhaust emissions 3
Use of vehicles for long journeys only 2
Encourage use of alternative fuels 2
Alternative power generation 1
Congestion Charging 1
Home Zone Streets 1
Reduce number of lanes on M25 1
No bonfires (except 5/11) 1
Reroute aircraft away from housing 1
Reduce no. cars visiting waste centres 1
Encourage families to have only 1 car 1
Walking buses scheme 1
School buses 1
Free bus passes for elderly/disabled 1
Improved segregated cycle lanes 1
Car Share to schools 1
Strict vehicle emission testing with fines 1
The opinions and suggestions given by the representatives of Spelthorne obtained from
both the workshops and the survey have been taken into consideration in the development
of Spelthorne’s air quality action plan.
Spelthorne Borough Council Air Quality Strategy: Action Plan
Page 20 of 105 January 2005
4.0 NITROGEN DIOXIDE SOURCES WITHIN SPELTHORNE
4.1 Source Apportionment
Prior to considering the actions required to reduce Nitrogen dioxide (NO2) emissions within
an AQMA, it is essential that an understanding of the extent that the different sources of
emissions contribute to exceedances be obtained. This allows the selection of the most
cost-effective actions to be targeted upon reducing emissions from those sources
responsible for the greatest proportion of emissions. In order to obtain such an
understanding it is necessary to make an assessment of the relative contribution of the
different source types make to the air pollution within the AQMA.
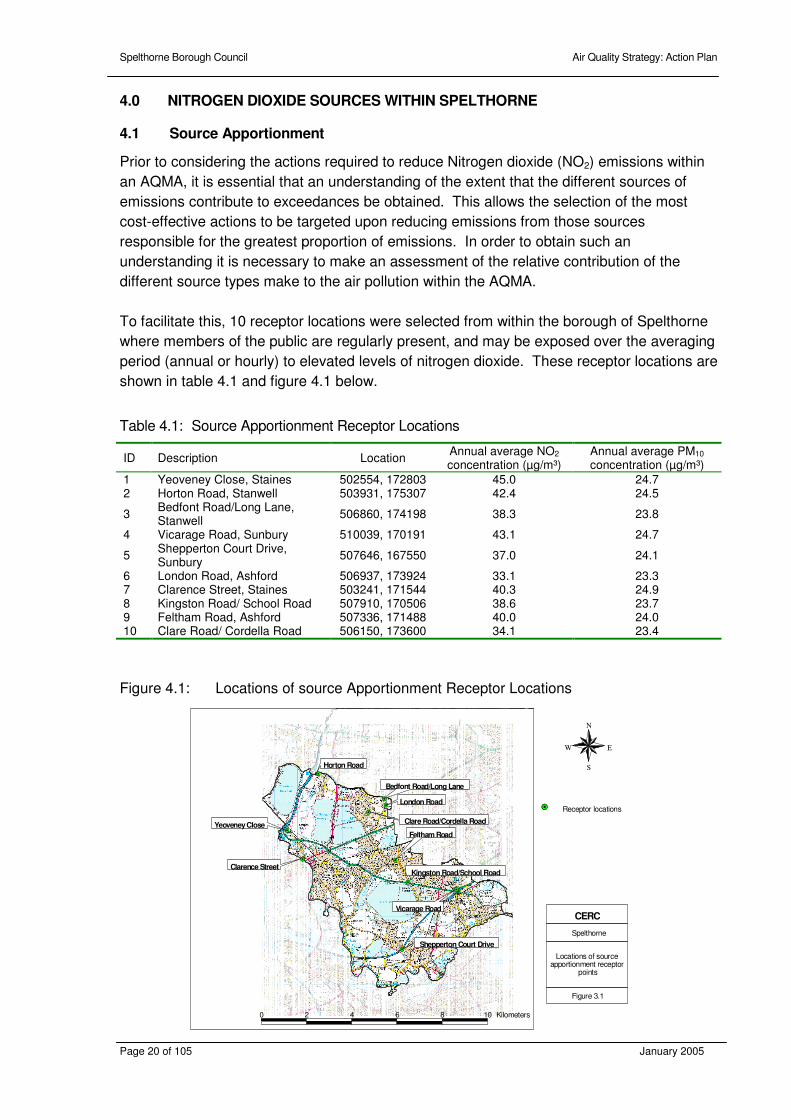
To facilitate this, 10 receptor locations were selected from within the borough of Spelthorne
where members of the public are regularly present, and may be exposed over the averaging
period (annual or hourly) to elevated levels of nitrogen dioxide. These receptor locations are
shown in table 4.1 and figure 4.1 below.
Table 4.1: Source Apportionment Receptor Locations
ID Description Location Annual average NO2 concentration (µg/m³)
Annual average PM10 concentration (µg/m³)
1 Yeoveney Close, Staines 502554, 172803 45.0 24.7 2 Horton Road, Stanwell 503931, 175307 42.4 24.5
3 Bedfont Road/Long Lane, Stanwell
506860, 174198 38.3 23.8
4 Vicarage Road, Sunbury 510039, 170191 43.1 24.7
5 Shepperton Court Drive, Sunbury
507646, 167550 37.0 24.1
6 London Road, Ashford 506937, 173924 33.1 23.3 7 Clarence Street, Staines 503241, 171544 40.3 24.9 8 Kingston Road/ School Road 507910, 170506 38.6 23.7 9 Feltham Road, Ashford 507336, 171488 40.0 24.0 10 Clare Road/ Cordella Road 506150, 173600 34.1 23.4
Figure 4.1: Locations of source Apportionment Receptor Locations
R e c e p t o r l o c a t i o n s # Y
N
E W
S
F i g u r e 3 . 1
L o c a t i o n s o f
s o u r c e
a p p o r t i o n m e n t r e c e p t o r
p o i n t s
S p e l t h o r n e
C E R C
# Y
# Y
# Y
# Y
# Y
# Y
# Y
# Y
# Y
# Y
H o r t o n R o a d
B e d f o n t R o a d / L o n g
L a n e
L o n d o n R o a d
C l a r e R o a d / C o r d e l l a
R o a d
F e l t h a m R o a d
Y e o v e n e y C l o s e
C l a r e n c e S t r e e t
K i n g s t o n R o a d / S c h o o l
R o a d
V i c a r a g e R o a d
S h e p p e r t o n C o u r t
D r i v e
0 2 4 6 8 1 0 K i l o m e t e r s

Spelthorne Borough Council Air Quality Strategy: Action Plan
Page 21 of 105 January 2005
4.2 The Source Apportionment Study
Nitrogen dioxide (NO2) and nitric oxide (NO) are collectively referred to as NOx. All
combustion processes produce some NOx, mainly in the form of NO, which is then
converted to NO2. The amount of NO2 created will depend on many factors including
emissions from other sources in the area. Therefore the total NO2 concentration cannot be
broken down simply into concentrations resulting from different sources, as it will depend on
emissions from the other sources in the area. Consequently, the source apportionment
study has been carried out using NOx concentrations, assuming that all NOx is NO2. This
will give an indication of which sources are contributing most to the concentrations of NO2;
however, the results should be treated with caution because, for example, a 10% reduction
in NOx concentrations will not bring about a 10% reduction in NO2 concentrations.
The pollutant concentrations occurring at any location are the result of emissions from a
wide range of sources of different types and in different locations. The modelling carried out
for the review and assessment of air quality considered all the emission sources in the area
whilst taking into account the effect of emissions from outside the area by using rural
background concentration data. Emissions data for the model was taken from four different
sources: the emissions inventory for Heathrow, 1998; the London Atmospheric Emissions
Inventory (LAEI), supplied by the Greater London Authority (GLA), February 2002; the
Surrey Traffic Model; and the February 2002 emissions inventory for Slough.
Meteorological data from Heathrow for the year 1999 were used in the modelling.
Background concentration data were obtained from rural monitoring sites and adjusted to be
appropriate for year 2005. The emissions and annual average concentrations have been
apportioned in the following ways:
• By major source group;
• Breakdown of traffic sources by vehicle type;
• Breakdown of traffic sources by road type, i.e. which organisation has responsibility;
• Breakdown of traffic sources into Heathrow and non-Heathrow traffic;
• Breakdown of Heathrow airport sources; and
• Breakdown of Heathrow airborne aircraft sources by height.
The source apportionment study has been carried out to predict emissions and
concentrations in 2005 for NOx using the models EMIT and ADMS-Urban. Spelthorne
Borough Council commissioned CERC (Cambridge Environmental Research Consultants
Ltd) to carry out the source apportionment work.
The source apportionment exercise reported here quantifies the relative contribution of each
source group to the total emissions, and to the resulting annual average ground level
concentration at 10 receptor locations throughout the Borough of Spelthorne.

Spelthorne Borough Council Air Quality Strategy: Action Plan
Page 22 of 105 January 2005
4.3 Apportionment of Emissions Sources
4.3.1 Apportionment of Emissions by source group
Emissions
The emissions from all the sources in the borough have been divided according to their
source type. The total emissions from each source group from within the borough, the study
area and the entire area covered by the emissions inventories have been calculated. The
contributions to the ground level concentrations from each source group, due to emissions
from the entire inventory area, have been calculated at each of the receptor locations. The
source types used are:
• Major road sources;
• Heathrow Airport sources, including airborne aircraft, taxiing and aircraft holding, heating,
and on-site traffic, car parks and taxi ranks;
• Industrial, including Part A’s, Part B’s and boilers rated greater than 2 megawatt; and
• Other sources, including other transport sources and commercial and domestic fuel use.
Table 4.2 shows the emissions of NOx from within Spelthorne, from within the West London
area, and from the whole area covered by the emissions inventory broken down into the
major source groups. These emissions are shown represented as a percentage of the total
emissions in figure 4.2 below.
Table 4.2: NOx emissions broken down by source type (tonnes per year)
Major roads Airport Industrial Other Total
Spelthorne 712 347 6 139 1204
West
London
2573 3438 201 1125 7337
EI area 17248 6243 17592 24191 65275
Figure 4.2: Emissions of NOx from within Spelthorne.
29%
1%12%
58%
Road Transport
Airport
Industrial
Other

Spelthorne Borough Council Air Quality Strategy: Action Plan
Page 23 of 105 January 2005
The NOx levels within the Borough entitled ‘Other’ sources in the above table include road
transport outside the Borough of Spelthorne; space heating within domestic and commercial
premises; and railway transport sources. Concentrations
Figure 4.3 shows the contributions of each of the source groups given above to the total
annual average NOx concentrations at each of the receptor points considered in the study.
Figure 4.4 shows these values as percentages of the totals. The concentrations presented
are those resulting from emissions over the whole of London not just from within Spelthorne.
Figure 4.3: Contribution of major source groups to annual average NOx concentrations
Figure 4.4: Percentage contribution of major source groups to annual average NOx
concentrations
15.3 68.8 1.92.4
5.5
15.3 54.5 2.8 5.3 5.9
15.3 24.4 2.3 21.4 7.7
15.3 45.7 2.2 4.5 11.7
15.3 44.4 1.82.6 8.7
15.3 16.6 2.2 15.1 7.4
15.3 18.4 1.82.8 6.4
15.3 34.1 2.0 4.4 8.2
15.3 38.1 2.05.5
8.7
15.3 21.3 2.2 11.0 7.4
0 10 20 30 40 50 60 70 80 90 100
Annual average NOx concentration (µg/m³)
Yeoveney Cl
Horton Rd
Bedfont Rd/Long Ln
Vicarage Rd
Shepperton Ct Dr
London Road
Clarence St
Kingston Rd/School Rd
Feltham Rd
Clare Rd/Cordella Rd
Background
Major roads
Industrial
Airport
Other
16 73 2 3 6
18 65 3 6 7
22 34 3 30 11
19 58 3 6 15
21 61 2 4 12
27 29 4 27 13
34 41 4 6 14
24 53 3 7 13
22 55 3 8 13
27 37 4 19 13
0 20 40 60 80 100
Percentage of total NOx concentration
Yeoveney Cl
Horton Rd
Bedfont Rd/Long Ln
Vicarage Rd
Shepperton Ct Dr
London Road
Clarence St
Kingston Rd/School Rd
Feltham Rd
Clare Rd/Cordella Rd
Background
Major roads
Industrial
Airport
Other
Spelthorne Borough Council Air Quality Strategy: Action Plan
Page 24 of 105 January 2005
4.3.2 Breakdown of traffic emissions by vehicle type
Emissions
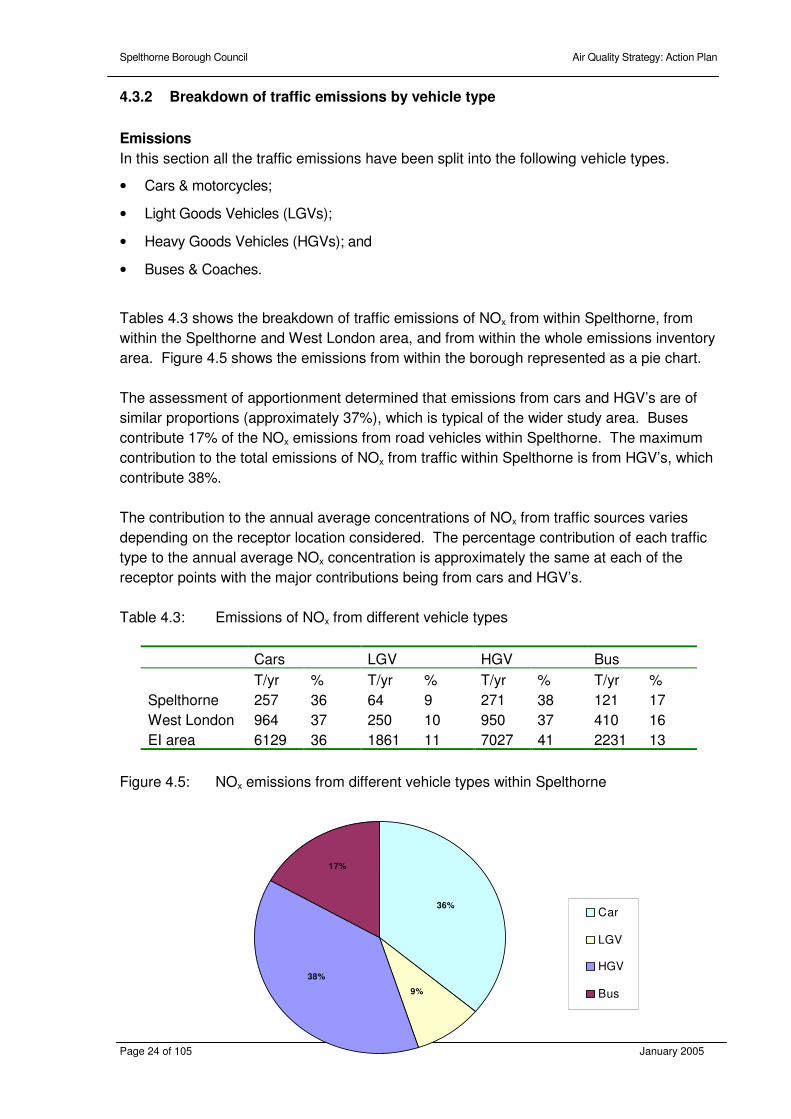
In this section all the traffic emissions have been split into the following vehicle types.
• Cars & motorcycles;
• Light Goods Vehicles (LGVs);
• Heavy Goods Vehicles (HGVs); and
• Buses & Coaches.
Tables 4.3 shows the breakdown of traffic emissions of NOx from within Spelthorne, from
within the Spelthorne and West London area, and from within the whole emissions inventory
area. Figure 4.5 shows the emissions from within the borough represented as a pie chart.
The assessment of apportionment determined that emissions from cars and HGV’s are of
similar proportions (approximately 37%), which is typical of the wider study area. Buses
contribute 17% of the NOx emissions from road vehicles within Spelthorne. The maximum
contribution to the total emissions of NOx from traffic within Spelthorne is from HGV’s, which
contribute 38%.
The contribution to the annual average concentrations of NOx from traffic sources varies
depending on the receptor location considered. The percentage contribution of each traffic
type to the annual average NOx concentration is approximately the same at each of the
receptor points with the major contributions being from cars and HGV’s.
Table 4.3: Emissions of NOx from different vehicle types
Cars LGV HGV Bus
T/yr % T/yr % T/yr % T/yr %
Spelthorne 257 36 64 9 271 38 121 17
West London 964 37 250 10 950 37 410 16
EI area 6129 36 1861 11 7027 41 2231 13
Figure 4.5: NOx emissions from different vehicle types within Spelthorne
9%
38%
17%
36%Car
LGV
HGV
Bus

Spelthorne Borough Council Air Quality Strategy: Action Plan
Page 25 of 105 January 2005
Concentrations
The annual average NOx concentrations resulting from each vehicle type have been
calculated at each of the receptor points and these are shown in Figure 4.6. Figure 4.7
shows the percentage contribution of each source group to the total annual average NOx
concentration resulting from traffic emissions. Note that the concentrations presented are
those resulting from emissions over the whole of London not just from within Spelthorne.
Figure 4.6: Contribution of different vehicle types to annual average NOx concentrations
Figure 4.7: Percentage contribution of different vehicle types to annual average NOx
concentrations
21.4 5.0 29.5 12.8
18.7 4.5 22.0 9.1
8.2 2.2 10.0 3.9
15.4 4.1 18.3 7.9
21.5 5.0 12.9 5.5
5.7 1.5 6.9 2.6
6.0 1.5 7.7 3.1
11.6 3.2 13.7 5.8
11.9 3.5 15.9 6.8
7.0 1.9 8.9 3.5
0 10 20 30 40 50 60 70
Annual average NOx concentration (µg/m³)
Yeoveney Cl
Horton Rd
Bedfont Rd/Long Ln
Vicarage Rd
Shepperton Ct Dr
London Road
Clarence St
Kingston Rd/School Rd
Feltham Rd
Clare Rd/Cordella Rd
Car/Taxi
LGV
HGV
Bus/Coach
31 7 43 19
34 8 41 17
34 9 41 16
34 9 40 17
48 11 29 12
34 9 41 16
33 8 42 17
34 9 40 17
31 9 42 18
33 9 42 16
0 20 40 60 80 100
Percentage of total NOx concentration
Yeoveney Cl
Horton Rd
Bedfont Rd/Long Ln
Vicarage Rd
Shepperton Ct Dr
London Road
Clarence St
Kingston Rd/School Rd
Feltham Rd
Clare Rd/Cordella Rd
Car/Taxi
LGV
HGV
Bus/Coach
Spelthorne Borough Council Air Quality Strategy: Action Plan
Page 26 of 105 January 2005
4.3.3 Breakdown of traffic emissions by road types
Emissions
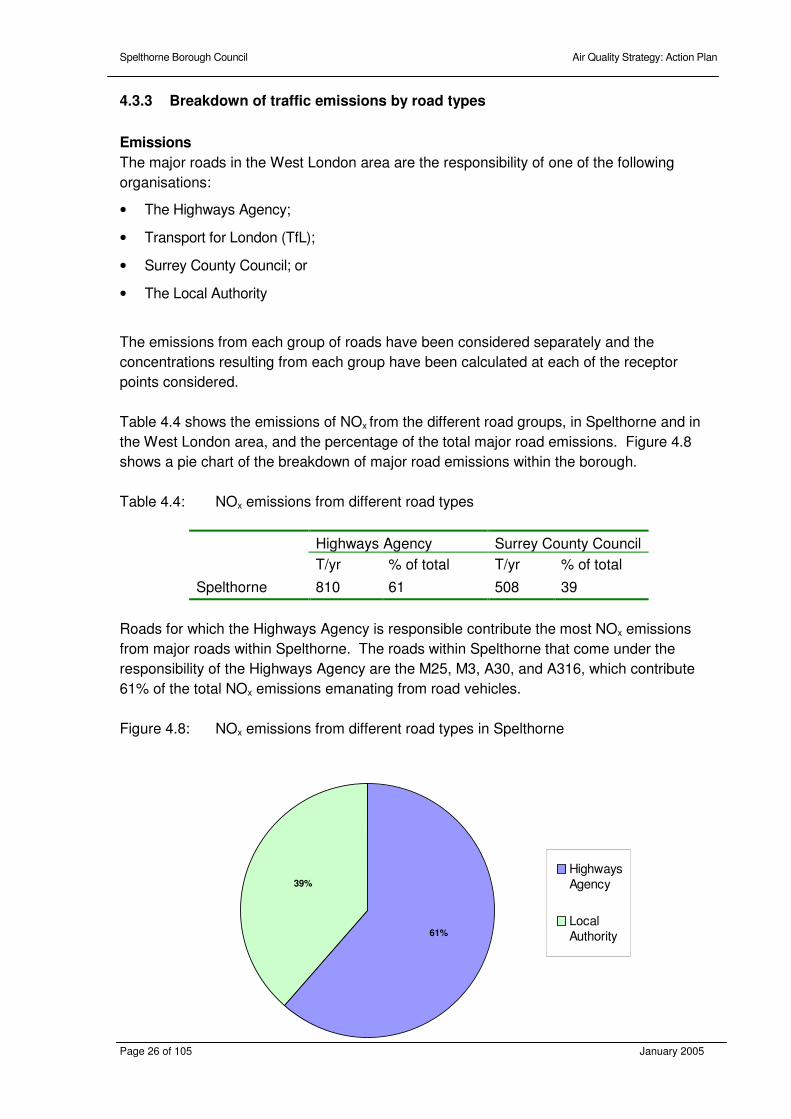
The major roads in the West London area are the responsibility of one of the following
organisations:
• The Highways Agency;
• Transport for London (TfL);
• Surrey County Council; or
• The Local Authority
The emissions from each group of roads have been considered separately and the
concentrations resulting from each group have been calculated at each of the receptor
points considered.
Table 4.4 shows the emissions of NOx from the different road groups, in Spelthorne and in
the West London area, and the percentage of the total major road emissions. Figure 4.8
shows a pie chart of the breakdown of major road emissions within the borough.
Table 4.4: NOx emissions from different road types
Highways Agency Surrey County Council
T/yr % of total T/yr % of total
Spelthorne 810 61 508 39
Roads for which the Highways Agency is responsible contribute the most NOx emissions
from major roads within Spelthorne. The roads within Spelthorne that come under the
responsibility of the Highways Agency are the M25, M3, A30, and A316, which contribute
61% of the total NOx emissions emanating from road vehicles.
Figure 4.8: NOx emissions from different road types in Spelthorne
39%
61%
HighwaysAgency
LocalAuthority
Spelthorne Borough Council Air Quality Strategy: Action Plan
Page 27 of 105 January 2005
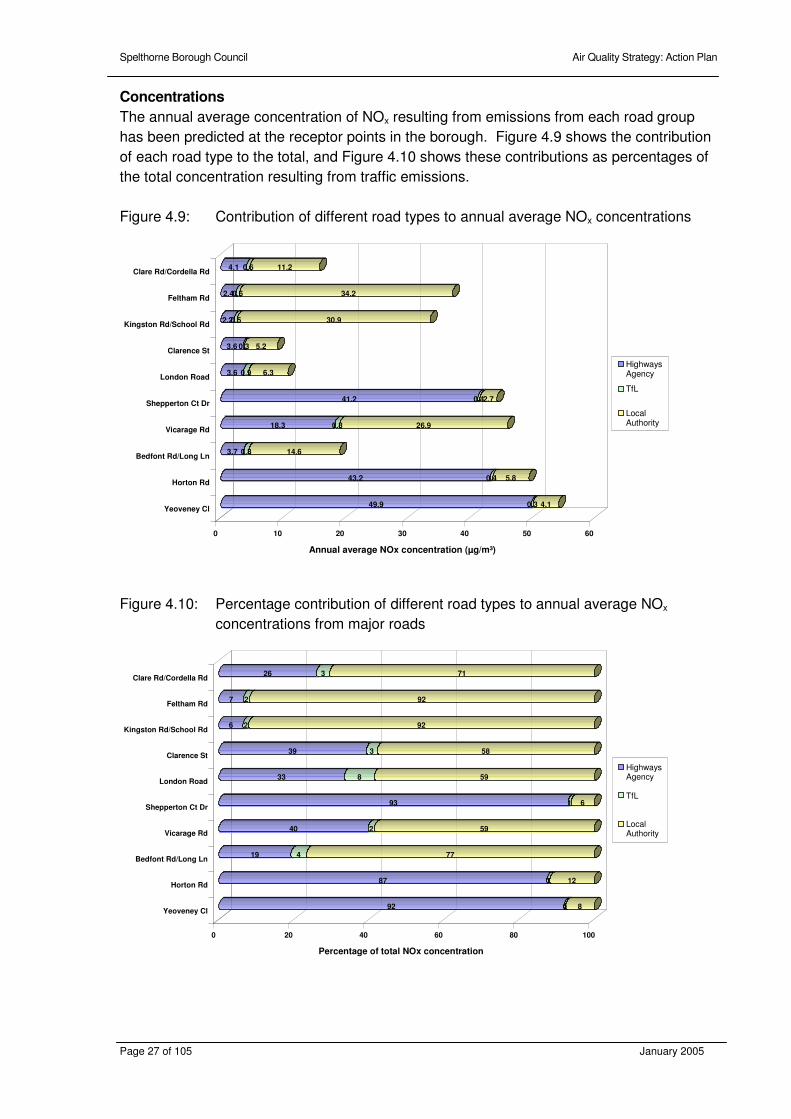
Concentrations
The annual average concentration of NOx resulting from emissions from each road group
has been predicted at the receptor points in the borough. Figure 4.9 shows the contribution
of each road type to the total, and Figure 4.10 shows these contributions as percentages of
the total concentration resulting from traffic emissions.
Figure 4.9: Contribution of different road types to annual average NOx concentrations
Figure 4.10: Percentage contribution of different road types to annual average NOx
concentrations from major roads
49.9 0.3 4.1
43.2 0.4 5.8
3.7 0.8 14.6
18.3 0.8 26.9
41.2 0.42.7
3.6 0.9 6.3
3.6 0.3 5.2
2.20.5 30.9
2.40.6 34.2
4.1 0.6 11.2
0 10 20 30 40 50 60
Annual average NOx concentration (µg/m³)
Yeoveney Cl
Horton Rd
Bedfont Rd/Long Ln
Vicarage Rd
Shepperton Ct Dr
London Road
Clarence St
Kingston Rd/School Rd
Feltham Rd
Clare Rd/Cordella Rd
HighwaysAgency
TfL
LocalAuthority
92 0 8
87 1 12
19 4 77
40 2 59
93 1 6
33 8 59
39 3 58
6 2 92
7 2 92
26 3 71
0 20 40 60 80 100
Percentage of total NOx concentration
Yeoveney Cl
Horton Rd
Bedfont Rd/Long Ln
Vicarage Rd
Shepperton Ct Dr
London Road
Clarence St
Kingston Rd/School Rd
Feltham Rd
Clare Rd/Cordella Rd
HighwaysAgency
TfL
LocalAuthority
Spelthorne Borough Council Air Quality Strategy: Action Plan
Page 28 of 105 January 2005
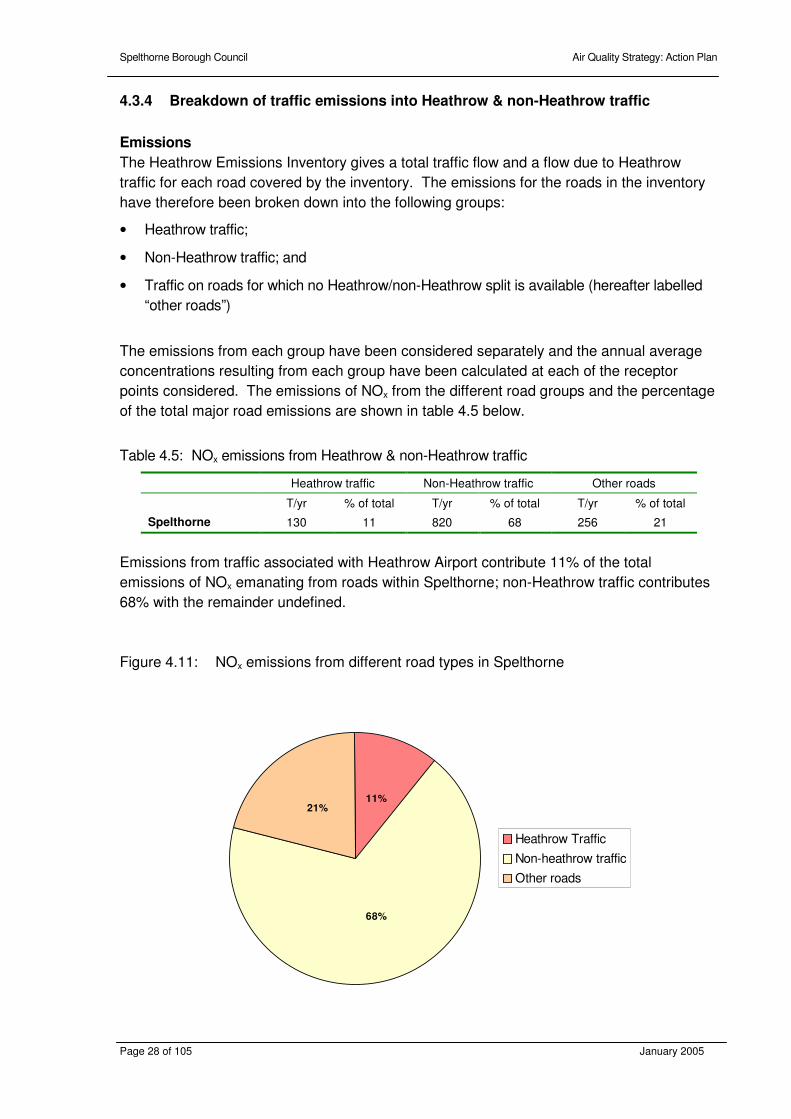
4.3.4 Breakdown of traffic emissions into Heathrow & non-Heathrow traffic
Emissions
The Heathrow Emissions Inventory gives a total traffic flow and a flow due to Heathrow
traffic for each road covered by the inventory. The emissions for the roads in the inventory
have therefore been broken down into the following groups:
• Heathrow traffic;
• Non-Heathrow traffic; and
• Traffic on roads for which no Heathrow/non-Heathrow split is available (hereafter labelled
“other roads”)
The emissions from each group have been considered separately and the annual average
concentrations resulting from each group have been calculated at each of the receptor
points considered. The emissions of NOx from the different road groups and the percentage
of the total major road emissions are shown in table 4.5 below.
Table 4.5: NOx emissions from Heathrow & non-Heathrow traffic
Heathrow traffic Non-Heathrow traffic Other roads
T/yr % of total T/yr % of total T/yr % of total
Spelthorne 130 11 820 68 256 21
Emissions from traffic associated with Heathrow Airport contribute 11% of the total
emissions of NOx emanating from roads within Spelthorne; non-Heathrow traffic contributes
68% with the remainder undefined.
Figure 4.11: NOx emissions from different road types in Spelthorne
11%
68%
21%
Heathrow Traffic
Non-heathrow traffic
Other roads

Spelthorne Borough Council Air Quality Strategy: Action Plan
Page 29 of 105 January 2005
Concentrations
Annual Average NOx Levels at Receptor Sites due to Heathrow Airport traffic
The annual average concentration of NOx resulting from emissions from each road type has
been predicted at the receptor location points in the borough. Figure 4.13 shows these
contributions as percentages of the total concentrations.
Figure 4.12: Contribution of Heathrow traffic to annual average NOx concentrations
Figure 4.13: Percentage contribution of Heathrow traffic to annual average NOx
concentrations from major roads
7.6 61.7 3.4
9.4 42.9 4.9
6.9 13.8 4.5
0.8 4.5 40.2
0.53.5 40.2
3.0 9.5 4.2
2.3 63.6 3.3
2.0 31.3 4.4
3.9 34.5 4.2
1.8 16.1 4.2
0 10 20 30 40 50 60 70 80
Annual average NOx concentration (µg/m³)
Yeoveney Cl
Horton Rd
Bedfont Rd/Long Ln
Vicarage Rd
Shepperton Ct Dr
London Road
Clarence St
Kingston Rd/School Rd
Feltham Rd
Clare Rd/Cordella Rd
Heathrowtraffic
Non-Heathrowtraffic
Other traffic
10 85 5
16 75 9
27 55 18
2 10 88
1 8 91
18 57 25
3 92 5
5 83 12
9 81 10
8 73 19
0 20 40 60 80 100
Percentage of total NOx concentration
Yeoveney Cl
Horton Rd
Bedfont Rd/Long Ln
Vicarage Rd
Shepperton Ct Dr
London Road
Clarence St
Kingston Rd/School Rd
Feltham Rd
Clare Rd/Cordella Rd
Heathrowtraffic
Non-Heathrowtraffic
Other traffic

Spelthorne Borough Council Air Quality Strategy: Action Plan
Page 30 of 105 January 2005
4.3.5 Breakdown of Heathrow Airport Emission Sources
Emissions from Heathrow Airport have been broken down according to the following source
types:
• Emissions from road vehicles, including Heathrow traffic, on-site traffic, car parks and taxi
ranks;
• Emissions from airborne aircraft;
• Emissions from aircraft taxiing and holding;
• Emissions from heating; and
• Other emissions.
Based upon information provided by the Heathrow Airport Emissions Inventory, 11% of the
total NOx emissions from road vehicles are due to traffic flows throughout the borough of
Spelthorne known to be associated with activities associated with Heathrow Airport,
accounting for 22% of the total NOx emissions emitted by activities associated with
Heathrow Airport. The remaining 78% of the total NOx emissions emitted by activities
associated with Heathrow Airport are airport related emissions from within Spelthorne only;
that is, airborne aircraft and road traffic only. It does not take into account airport related
sources outside the borough, such as the ‘on-airport’ sources such as taxiing, airside
vehicles etc. The contribution to the annual average concentrations of NOx from each road
group varies depending on the receptor location considered.
Table 4.6: NOx Emissions from Heathrow Airport
Road vehicles Airborne aircraft Taxiing & aircraft holding
Heating Other
(T/yr) % of total (T/yr) % of total (T/yr) % of total (T/yr) % of total (T/yr) % of total
Spelthorne 130 22 447 78 trace - trace - trace -
Figure 4.14: NOx emissions from different Heathrow source groups in Spelthorne
22%
78%
Road vehicles
Airborne aircraft
Taxiing & aircraft holding
Heating
Other

Spelthorne Borough Council Air Quality Strategy: Action Plan
Page 31 of 105 January 2005
Concentrations
Heathrow Airport is the second highest cause of nitrogen dioxide emissions within the
Borough of Spelthorne. Being responsible for 29% of the total NOx emissions within the
Borough of Spelthorne. These emissions arise almost wholly a result of road vehicles and
airborne aircraft. Figure 4.16 shows, as a percentage, the contribution of NOx at each of the
receptor locations arising from the from the source groups within Heathrow Airport.
The locations of these emissions relative to the receptor locations are dependent upon the
receptor’s location with respect to the airport. At receptor locations close to the airport, the
airport emissions will contribute significantly to ground level concentrations (up to about
32%). However, in the south of the borough the airport emissions will be much less
significant, and contribute less than 10% of the ground level concentrations.
Figure 4.15: Contribution of Heathrow sources to annual average NOx concentrations
Figure 4.16 Percentage contributions from Heathrow sources groups to the annual
average NOx concentrations at each of the receptor locations.
7.6 1.80.3
0.2
0.1
9.4 4.2
0.5
0.4
0.2
7.0 12.6 3.3 4.2 1.3
0.8 2.8 0.80.5
0.5
0.6 1.70.4
0.2
0.2
3.0 10.1 1.5 2.6 0.8
2.3 1.90.4
0.3
0.2
2.0 2.9 0.6
0.4
0.4
4.0 3.6 0.80.6
0.5
1.9 6.9 1.5 1.8 0.8
0 5 10 15 20 25 30
Annual average NOx concentration (µg/m³)
Yeoveney Cl
Horton Rd
Bedfont Rd/Long Ln
Vicarage Rd
Shepperton Ct Dr
London Rd
Clarence St
Kingston Rd/School Rd
Feltham Rd
Clare Rd/Cordella Rd
Road vehicles
Airborne aircraft
Taxiing & aircraftholding
Heating
Other
76 18 3 2 2
64 29 3 3 2
25 44 11 15 5
15 52 15 9 9
18 56 12 7 7
17 56 8 14 4
45 38 7 5 4
32 46 10 7 6
42 38 9 6 5
15 54 12 14 6
0 20 40 60 80 100
Percentage of annual average NOx concentration due to Heathrow
Yeoveney Cl
Horton Rd
Bedfont Rd/Long Ln
Vicarage Rd
Shepperton Ct Dr
London Rd
Clarence St
Kingston Rd/School Rd
Feltham Rd
Clare Rd/Cordella Rd
Road vehicles
Airborne aircraft
Taxiing & aircraftholding
Heating
Other

Spelthorne Borough Council Air Quality Strategy: Action Plan
Page 32 of 105 January 2005
4.3.6 Apportionment of Heathrow Airborne Aircraft Sources by Height
Activities carried on at Heathrow Airport make the 2nd largest single contribution to NO2
levels within Spelthorne, accounting for an average 29% of the total NOx emissions within
the Borough of Spelthorne. These emissions arise almost wholly as a result of road
vehicles and airborne aircraft. The locations of these emissions relative to the receptor
locations are dependent upon the receptor’s location with respect to the airport. At receptor
locations close to the airport, the airport emissions will contribute significantly to ground level
concentrations (up to about 32%). However, in the south of the borough the airport
emissions will be much less significant, and contribute less than 10% of the ground level
concentrations.
Based upon information provided by the Heathrow Airport Emissions Inventory, 11% of the
total NOx emissions from road vehicles are due to traffic flows throughout the borough of
Spelthorne known to be associated with activities associated with Heathrow Airport,
accounting for 22% of the total NOx emissions emitted by activities associated with
Heathrow Airport. The remaining 78% of the total NOx emissions emitted by activities
associated with Heathrow Airport are airport related emissions from within Spelthorne only;
that is, airborne aircraft and road traffic only. It does not take into account airport related
sources outside the borough, such as the ‘on-airport’ sources such as taxiing, airside
vehicles etc. The contribution to the annual average concentrations of NOx from each road
group varies depending on the receptor location considered. Aircraft Emissions
Detailed information on the emission rates of aircraft in different stages of the Landing and
Take-Off (LTO) cycle were given in the Heathrow Emissions Inventory. For the purposes of
the modelling this information was used to define a set of volume sources, of different
dimensions and with different emission rates, to represent the aircraft emissions. Table 4.7
shows the dimensions and emission rates of each of the volume sources. Figures 4.17 and
4.18 show the dimensions of the volume sources in plan and elevation.
Table 4.7 shows that more NOx and PM10 are emitted from aircraft above 450m high than
from those close to ground level. However, the impact of the emissions from different
heights on ground level concentrations will vary because of the distance from the ground
and because of the area over which the pollutants are emitted. Table 4.7: Explicitly modelled Heathrow Airport volume sources
Source Base height
(m)
Top height
(m)
Length (m)
Width (m)
NOx emission rate (T/yr)
NOx emission rate (g/m
3/s)
PM10 emission rate
(T/yr)
PM10 emission rate (g/m
3/s)
G1 0 50 4701 100 713 9.62E-07 3.1 4.23E-09 G2 0 50 4456 100 981 1.40E-06 3.6 5.16E-09 M1 50 450 7633 400 117 3.04E-09 2.1 5.40E-11 M2 50 450 9995 400 566 1.12E-08 3.4 6.80E-11 M3 50 450 10261 400 808 1.56E-08 2.4 4.65E-11 M4 50 450 10021 400 800 1.58E-08 3.2 6.33E-11 T1 450 1000 16695 3000 1112 1.28E-09 7.7 8.85E-12 T2 450 1000 15759 3000 2848 3.47E-09 8.7 1.07E-11
Total 7945 34.3

Spelthorne Borough Council Air Quality Strategy: Action Plan
Page 33 of 105 January 2005
Figure 4.17: Diagram showing the aircraft volume sources in plan Figure 4.18: Diagram showing the aircraft volume sources in elevation (view from South)
The contribution of all the airborne aircraft to the annual average concentrations of NOx
varies depending on the receptor location. Although in all cases the greatest contribution is
from the airborne aircraft closest to the ground (between 0 and 50 metres above ground
level), contributing between 78% and 96% (that is, between 0.9 and 8.3 µg/m³) of NOx
towards the annual average NOx concentrations. The impact of the aircraft above 450m
high is very small, contributing at most 2% of the total NOx concentration resulting from
airborne aircraft emissions, and this occurs at sites where the overall contributions are
smallest.
To determine the relative impacts of the aircraft at different heights, the volume sources
used in the modelling have been divided into three sets according to the heights they
represent (0 to 50m; 50m to 450m; and 450m to 1000m) and have been modelled
separately. The annual average concentrations of NOx resulting from emissions from each
set of sources have been predicted at each of the receptor points in the borough.
T1T2
M4
M3M2
G1M1
G2
Hillingdon
Spelthorne
Hounslow
0 5 10 15 20 Kilometers
50m
450m
1000m
Not to scale
Ground level
T1 T2
M3 M2 G2

Spelthorne Borough Council Air Quality Strategy: Action Plan
Page 34 of 105 January 2005
Figure 4.19 shows the contribution of each set to the total and Figure 4.20 shows these
contributions as percentages of the total concentrations resulting from airborne aircraft
emissions.
Figure 4.19: Contribution of aircraft at different heights to annual average NOx
concentrations
Figure 4.20: Percentage contribution to the annual average NOx concentrations from
Heathrow’s airborne aircraft flying at different heights
78 20 2
81 18 1
96 4 0
91 8 1
89 10 2
95 5 0
84 14 2
91 8 1
92 7 1
93 6 1
0 20 40 60 80 100
Percentage of annual average NOx concentration due to Heathrow
Yeoveney Cl
Horton Rd
Bedfont Rd/Long Ln
Vicarage Rd
Shepperton Ct Dr
London Rd
Clarence St
Kingston Rd/School Rd
Feltham Rd
Clare Rd/Cordella Rd
0 to 50m
50m to 450m
450m to 1000m
0.9 0.2 0.0
2.3 0.5 0.0
8.3 0.4 0.0
1.7 0.1 0.0
1.1 0.1 0.0
6.6 0.3 0.0
1.1 0.2 0.0
1.8 0.2 0.0
2.3 0.2 0.0
4.4 0.3 0.0
0 1 2 3 4 5 6 7 8 9
Annual average NOx concentration (µg/m³)
Yeoveney Cl
Horton Rd
Bedfont Rd/Long Ln
Vicarage Rd
Shepperton Ct Dr
London Rd
Clarence St
Kingston Rd/School Rd
Feltham Rd
Clare Rd/Cordella Rd
0 to 50m
50m to 450m
450m to 1000m

Spelthorne Borough Council Air Quality Strategy: Action Plan
Page 35 of 105 January 2005
The maximum contribution to the emissions of NOx emanating from Heathrow Airport
sources within Spelthorne is from airborne aircraft, which contribute 78%. Consequently, at
various locations within Spelthorne close to the airport, a major contribution to NOx
concentrations resulting from the airport emissions is from airborne aircraft.
Spelthorne Borough Council Air Quality Strategy: Action Plan
Page 36 of 105 January 2005
5.0 EMISSION REDUCTION SCENARIO MODELLING
As part of the action plan formulation work, Cambridge Environmental Research
Consultants Ltd (CERC) was jointly commissioned by Spelthorne Borough Council and the
London Boroughs of Hillingdon and Hounslow to carry out a scenario testing study for the
area covered by the three boroughs.
There are two main source groups of NO2 emissions which impact upon air quality within the
borough of Spelthorne (section 4 refers). Consequently, 3 nitrogen dioxide emission
reduction scenarios have been investigated. These scenarios involved modelling the
reduction in NO2 emissions from major roads and from aircraft. In order to observe the
effects of the scenarios modelling has therefore been carried out for a “do-nothing” scenario
and for the following three scenarios:
• Scenario 1: Reduction of 30% in traffic flows;
• Scenario 2: Low Emission Zone (EURO II); and
• Scenario 3: Reduction of 50% in airborne aircraft emissions;
The Emissions Inventory Toolkit (EMIT) was used to set up the emissions scenarios. All
emissions data and other parameters used within the model were the same as those used
for Spelthorne’s “Stage 4 - review and assessment” and “Source Apportionment” studies
(which is available at http://www.spelthorne.gov.uk). All scenarios have been modelled for
the year 2005, which is the year by which the Air Quality Strategy annual objective values
for NO2 must be achieved.
For each scenario, annual average concentrations of both NOx and NO2 have been
predicted at each of ten receptor points. The ten receptor point locations are the same as
those used for the ‘stage 4’ source apportionment exercise. In each case the predicted
reduction in concentrations is given in µg/m³ and as a percentage. It should be noted that
the reductions in NO2 concentrations are smaller than those for NOx, which is due to the
nature of chemical reactions that take place in NOx chemistry.
From table 5.1, it can be seen that for the “do nothing” scenario, the annual average NO2
concentrations are predicted (2005) to exceed the NAQS annual objective value of 40µg/m³
at five of the ten-receptor points considered. The results of the three scenarios can be
found over the next few pages.

Spelthorne Borough Council Air Quality Strategy: Action Plan
Page 37 of 105 January 2005
Table 5.1: Source apportionment receptor point locations within Spelthorne
ID Description Location Predicted (2005) Annual average
NO2 concentration (µg/m³)
1 Yeoveney Close, Staines 502554, 172803 45.0 2 Horton Road, Stanwell 503931, 175307 42.4
3 Bedfont Road/Long Lane, Stanwell
506860, 174198 38.3
4 Vicarage Road, Sunbury 510039, 170191 43.1 5 Shepperton Court Drive, Sunbury 507646, 167550 37.0 6 London Road, Ashford 506937, 173924 33.1 7 Clarence Street, Staines 503241, 171544 40.3 8 Kingston Road/ School Road 507910, 170506 38.6 9 Feltham Road, Ashford 507336, 171488 40.0 10 Clare Road/ Cordella Road 506150, 173600 34.1

Spelthorne Borough Council Air Quality Strategy: Action Plan
Page 38 of 105 January 2005
6.0 SPELTHORNE’S PLAN FOR THE REDUCTION OF NO2
6.1 Reduction of Emissions from Road Vehicles
6.1.1 Scenario Modelling: Reduction in traffic flows by 30%
The source apportionment study determined that the greatest contributor to NOx levels
within Spelthorne is from road transport, especially those using the major roads (M25, M3,
A30, A308, and A316), which contributes 58% to the total NOx emissions.
The predicted annual average concentrations of NOx and NO2 for the modelled scenario to
reduce road traffic flows by 30% are presented in tables 6.1 and 6.2, respectively.
Table 6.1: Predicted annual average NOx concentrations for “do nothing” and the
modelled scenario to reduce road traffic flows by 30% Annual average NOx concentration (µg/m³)
Do Nothing Reduction in traffic of 30%
Difference % Reduction
Yeoveney Close 77.4 64.4 13.0 17 Horton Road 69.8 59.2 10.6 15 Bedfont Road 59.9 55.7 4.2 7 Vicarage Road 67.2 58.0 9.2 14 Shepperton Court Drive 60.6 52.0 8.6 14 London Road 48.6 46.0 2.5 5 Clarence Street 71.5 61.0 10.5 15 Kingston Road 56.0 49.0 7.0 12 Feltham Road 59.7 52.2 7.5 13 Clare Road 49.4 45.7 3.7 7
Table 6.2: Predicted annual average NO2 concentrations for “do nothing” and
modelled scenario to reduce road traffic flows by 30% Annual average NO2 concentration (µg/m³)
Do Nothing Reduction in traffic of 30%
Difference % Reduction
Yeoveney Close 45.0 41.2 3.8 8 Horton Road 42.4 38.8 3.6 8 Bedfont Road 38.3 36.5 1.7 5 Vicarage Road 43.1 39.7 3.4 8 Shepperton Court Drive 37.0 34.5 2.6 7 London Road 33.1 31.9 1.2 4 Clarence Street 40.3 37.8 2.4 6 Kingston Road 38.6 35.4 3.2 8 Feltham Road 40.0 36.9 3.1 8 Clare Road 34.1 32.3 1.8 5
The predicted reduction in the annual average NO2 concentrations if road traffic flows could
be reduced by 30% would range from 4% at London Road to 8% at Yeoveney Close, Horton
Road, Vicarage Road, Kingston Road and Feltham Road.
Of the original 5-receptor locations predicted to exceed the NAQS annual objective for NO2,
a 30% reduction in road traffic flows is predicted to improve NO2 concentrations at 3 of these
locations such that the NAQS annual objective for NO2 would no longer be exceeded. The
remaining 2 receptor locations predicted to exceed the NAQS annual objective for NO2 are
those located close to junction 13 on the M25 and the M3.
Spelthorne Borough Council Air Quality Strategy: Action Plan
Page 39 of 105 January 2005
From the findings of the assessment of source apportionment and the testing of the above-
mentioned scenario, actions to reduce NO2 concentrations within Spelthorne to below the
NAQS annual objective limit will require appreciable attention to reducing NO2 emissions
from road traffic; in some places a road traffic reduction in excess of 30% will be required if
the NAQS annual object is to be achieved.
6.1.2 Scenario Modelling: Low Emission Zones
Low Emission Zones (LEZ) are designated areas designed to reduce air pollution in air
quality management areas, particularly in the centres of towns and cities, although other
benefits may include reductions in traffic and noise which may in turn help to promote
increased cycling and walking. An LEZ is an area in which certain categories of vehicle are
barred from entering unless they meet specified pollution emission standards. The
categories of vehicle barred, and the standards to be achieved are not set in any national
legislation but work is currently on going to determine an appropriate national standard for
LEZ’s.
A study has been carried out to investigate the feasibility of an LEZ in London, providing
information to allow a determination as to whether low emission zones would work towards
meeting London’s air quality targets and whether they should be taken forward to
implementation. The study has considered a large number of different options, and the
conclusions from the study, should a low emission zone for London be taken forward, are as
follows:
Area. The study recommends that the most appropriate option for a London LEZ would be a
scheme including all of the Greater London area.
Vehicles. The study recommends that the low emission zone start with a scheme that
targets lorries, London buses and coaches. These vehicles have disproportionately high
emissions per vehicle and targeting them produces greatest emissions reductions for least
cost. However, the study recommends that the zone be potentially extended in later years
to include vans (subject to further investigation of the socio-economic effects of such a
scheme on small companies/owner drivers) and taxis (though taxis should be addressed
earlier through the licensing process). The study does not recommend that cars are
included in the scheme, but does recommend that some action is needed, alongside any
LEZ, to target the removal of very old cars in London (those built before 1993).
Implementation Date. The work necessary to set up the legal basis for a London LEZ
would make it extremely difficult to implement a fully operational scheme before the middle
of 2006, and more realistically before late 2006. Therefore, the first LEZ that could be
introduced in London would not be early enough to help progress towards the initial air
quality targets for 2005. However, there is one advantage from a slightly later LEZ
introduction, because it would tie in with the availability of Euro 4 vehicles (manufactured
from late 2006 onwards), which have much lower emissions. Should an LEZ be introduced,
the study recommends that it is progressive, i.e. it would apply tighter emission criteria in
future years. Any scheme needs to be clear about these future criteria so that operators can

Spelthorne Borough Council Air Quality Strategy: Action Plan
Page 40 of 105 January 2005
plan their future vehicle purchases accordingly.
Emission Criteria. The emission criteria set for a London low emission zone will dictate the
air quality benefits and the costs to operators. The study recommends that for lorries, buses
and coaches the criteria be based on Euro standard (age) and other emission standards
(the Reduced Pollution Certificate (RPC)). The study recommends that vehicles should
meet an initial criterion of Euro 2 plus RPC (or equivalent) in 2006/7. It also recommends
that this criterion be tightened to Euro 3 plus RPC (or equivalent) in 2010. However, there
are two additional conclusions put forward alongside this latter recommendation. Firstly, a
NOx based RPC scheme would help the effectiveness of the scheme and could allow
greater NO2 improvements. Secondly that it might be beneficial to introduce the Euro 3 plus
RPC criterion earlier than 2010 using a rolling approach (applying the RPC to Euro 3
vehicles based on age). The study recommends a different approach for vans, should these
vehicles be included, using a rolling ten-year-old age limit. A similar age-based standard is
also recommended for licensed taxis and private hire vehicles.
Stakeholder consultation. Survey work has indicated that operators would be broadly
supportive of a London low emission zone. Most operators would comply with the zone,
though this might be achieved by transferring the older vehicles in their fleets outside
London and moving newer vehicles into London (or onto London routes). Any LEZ would be
likely to have greatest impact on operators of specialist vehicles and smaller companies.
More investigation of the potential impacts of any LEZ on van operators is needed.
Air Quality. A London low emission zone would have modest benefits in improving overall
emission levels and absolute air quality concentrations in London, but it would make a larger
contribution to reducing exceedances of the air quality targets. The recommended LEZ
would have greatest impact in targeting PM10 emissions and air quality exceedances. It is
estimated that the recommended scheme would achieve a 23% reduction in total London
PM10 emissions in 2010. It would also achieve a 43% reduction in the area of London
exceeding the relevant PM10 air quality target in 2010, and a 19% reduction in the area of
London exceeding the relevant NO2 air quality target in 2010.
Table 6.3: Air Quality Benefits of the Recommended LEZ. Reduction in Emissions
Reduction in Emissions
(relative to baseline) Reduction in Area Exceedance Target
(relative to baseline)
Pollutant 2007 2010 A) 2010 B) 2007 2010 A) 2010 B) NOx (NO2) 1.5% 2.7% 3.8% 4.7% 12% 18.9% PM10 9.0% 19% 23% 0%* 32.6%** 42.9%** * London should meet the relevant air quality for PM10 in this year without any additional action for an average year’s weather. ** Exceedance of the annual meanPM10 objective. The 2007 scheme only includes lorries, buses and coaches. In 2010: A) includes lorries, buses and coaches and B) includes lorries, buses and coaches, vans and taxis.
It is stressed that the results of the above study have to be seen in the context of a changing
scenario with respect to the technical options, the reliability of the air quality predictions, and
a number of other uncertainties. Changes in a number of key areas including the emission
factors, the relative health impacts or importance of different pollutants, the estimates of air

Spelthorne Borough Council Air Quality Strategy: Action Plan
Page 41 of 105 January 2005
quality background in future years, and the costs of different technical options, would have a
significant impact on the recommendations above. A number of areas are highlighted as
warranting further investigation. These include:
• The potential for considering older cars in a low emission zone, or targeting these vehicles
through alternative action.
• The assessment of the socio-economic effects on van owners and operators from an LEZ,
particularly on small companies and owner-drivers.
• Further consideration of extending the current PM10 based RPC schemes forward in time,
to all heavy vehicles, and to include NOX.
• The consideration of a ‘rolling’ scheme for heavy vehicles after 2007, based on a 5-6 year
age limit for these vehicles (beyond which time the vehicles would need to meet the RPC
criteria).
Finally, a number of key tasks have been identified, that would need agreement and
collaboration before the introduction of any LEZ. These include:
• A joint decision on whether to implement the zone between the Mayor, London boroughs,
and the
• Government;
• Public consultation over the scheme, and agreement over any proposed modifications;
• Agreement on the approach for bus regulation and taxi licensing (TfL);
• Agreement on the format of the TRO and any associated Bill, and if relevant, regulations to
• Decriminalise offences;
• Agreement on the national certification system; and
• Agreement over the funding and division of responsibilities.
6.1.3 Scenario Modelling: Low Emission Zone (EURO II)
At the time of writing this air quality action plan, the above-mentioned study was being
undertaken, and as such the nature and extent of the London LEZ had not been decided
upon. However, in order to examine the impacts upon Spelthorne’s air quality that a London
wide LEZ may cause, the model was set-up to predict the effects of a LEZ that extends from
the centre of London to the M25. The type of LEZ modelled was one that would exclude
from the LEZ area all vehicles with engines that do not meet the standard of EURO II with
particulate traps, with the exception of private cars. The total number of vehicles has been
assumed to remain the same.
The predicted annual average concentrations of NOx and NO2 for modelled scenario for the
setting-up of a LEZ from the centre of London to the M25 are presented in tables 6.4 and
6.5, respectively.

Spelthorne Borough Council Air Quality Strategy: Action Plan
Page 42 of 105 January 2005
Table 6.4: Predicted annual average NOx concentrations for “do nothing” and a LEZ
covering the centre of London to the M25 scenario.
Annual average NOx concentration (µg/m³)
Existing LEZ Scenario Difference % Reduction Yeoveney Close 77.4 77.4 0.1 0 Horton Road 69.8 68.5 1.4 2 Bedfont Road 59.9 59.6 0.3 1 Vicarage Road 67.2 67.1 0.1 0 Shepperton Court Drive 60.6 60.6 0.0 0 London Road 48.6 48.4 0.2 0 Clarence Street 71.5 71.4 0.0 0 Kingston Road 56.0 55.9 0.1 0 Feltham Road 59.7 59.6 0.1 0 Clare Road 49.4 49.3 0.1 0
Table 6.5: Predicted annual average NO2 concentrations for “do nothing” and
a LEZ covering the centre of London to the M25 scenario.
Annual average NO2 concentration (µg/m³)
Existing LEZ Scenario Difference % Reduction Yeoveney Close 45.0 45.0 0.0 0 Horton Road 42.4 42.0 0.4 1 Bedfont Road 38.3 38.2 0.1 0 Vicarage Road 43.1 43.1 0.0 0 Shepperton Court Drive 37.0 37.0 0.0 0 London Road 33.1 33.1 0.1 0 Clarence Street 40.3 40.3 0.0 0 Kingston Road 38.6 38.6 0.0 0 Feltham Road 40.0 40.0 0.0 0 Clare Road 34.1 34.1 0.0 0
The modelling has predicted that if the Greater London Authority was to establish a LEZ that
extended from the centre of London to the M25 there would be almost no impact on the of
background concentration of NO2. That is, there would be almost no reduction in NO2 levels
at the receptor locations, with the exception of Horton Road where the predicted reduction
would be less than half %.
If the implementation of LEZ’s within neighbouring Boroughs is considered to cause a
negative impact on Spelthorne’s air quality mitigation measures will be examined and
implemented as appropriate.
Spelthorne Borough Council Air Quality Strategy: Action Plan
Page 43 of 105 January 2005
6.2 Control of Emissions Emanating from Highway Agency Controlled Roads
Analysis of NOx emissions arising from the road network system within the Spelthorne area
determined that roads falling under the responsibility of the Highways Agency are
accountable for 61% of the total ground-level concentrations of NOx. The relevant roads
(M25, A30, M3, and A316) are gateway roads for movement into, out of, and around London
and the southeast.
6.2.1 Continuing Exceedance of NAQS Objectives at locations adjacent to Highway Agency Controlled Roads
Even with a 30% reduction in the number of road vehicles using Highways Agency control
roads (namely A315/M3 and M25) (see modelling scenario 1, section 6.1.1) nitrogen dioxide
concentrations at locations adjacent to these roads will still exceed the NAQS objectives for
2005, however, the Highways Agency are confident that a number of these continuing
exceedance locations will achieve the EU objective for 2010. The examination of continuing
exceedance locations is currently being examined by Spelthorne Borough Council through
the “Detailed Assessment” process. Either way, it will only be through the development and
implementation of effective national policies, programmes and projects that NAQS
objectives will be achieved in these locations.
The Highways Agency’s stated objectives for working to reduce emissions from their roads
are:
• To work in partnership with Local Authorities towards the delivery of the National Air Quality
Strategy;
• To maintain and support guidance on air quality assessment, making available Highways
Agency air quality monitoring data via the internet;
• To develop and evaluate traffic control systems that reduce vehicle emissions;
• To work towards improved performance in emissions control during construction and
maintenance activities; and
• To reduce congestion on the network which will have air quality benefits
One method of delivery for achieving the above objectives are “Route Management
Strategies” (RMS). These are a techniques developed by the Highways Agency to provide
a framework for managing individual trunk routes as part of wider transport networks. RMS
will interlock with local transport strategies (set out in Local Transport Plans) within the
context established by Regional Planning Guidance'. (Paragraph 3.1.34 of 'A New Deal for
Transport: Better for Everyone' refers). RMS’s take a strategic approach to the
maintenance, operation and improvement of a road network, leading to the adoption of a 10-
year strategy and 3-year investment plan for each of the routes comprising that strategic
network.
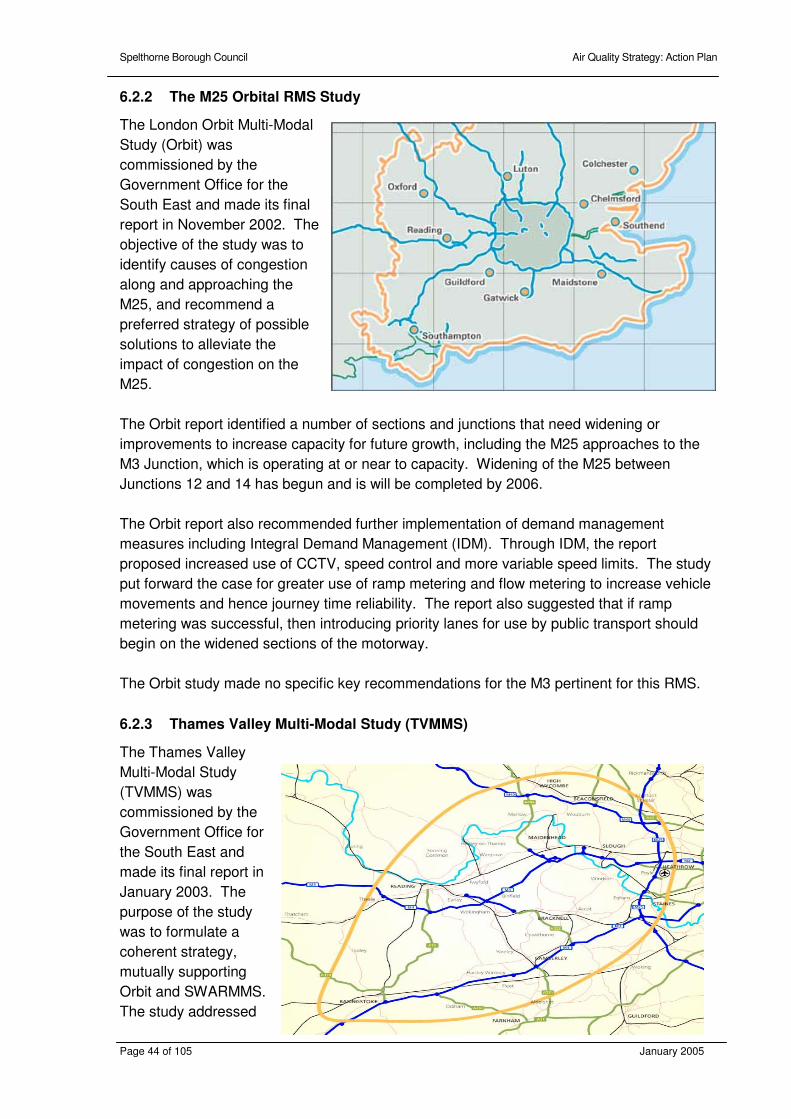
Spelthorne Borough Council Air Quality Strategy: Action Plan
Page 44 of 105 January 2005
6.2.2 The M25 Orbital RMS Study
The London Orbit Multi-Modal
Study (Orbit) was
commissioned by the
Government Office for the
South East and made its final
report in November 2002. The
objective of the study was to
identify causes of congestion
along and approaching the
M25, and recommend a
preferred strategy of possible
solutions to alleviate the
impact of congestion on the
M25.
The Orbit report identified a number of sections and junctions that need widening or
improvements to increase capacity for future growth, including the M25 approaches to the
M3 Junction, which is operating at or near to capacity. Widening of the M25 between
Junctions 12 and 14 has begun and is will be completed by 2006.
The Orbit report also recommended further implementation of demand management
measures including Integral Demand Management (IDM). Through IDM, the report
proposed increased use of CCTV, speed control and more variable speed limits. The study
put forward the case for greater use of ramp metering and flow metering to increase vehicle
movements and hence journey time reliability. The report also suggested that if ramp
metering was successful, then introducing priority lanes for use by public transport should
begin on the widened sections of the motorway.
The Orbit study made no specific key recommendations for the M3 pertinent for this RMS.
6.2.3 Thames Valley Multi-Modal Study (TVMMS)
The Thames Valley
Multi-Modal Study
(TVMMS) was
commissioned by the
Government Office for
the South East and
made its final report in
January 2003. The
purpose of the study
was to formulate a
coherent strategy,
mutually supporting
Orbit and SWARMMS.
The study addressed

Spelthorne Borough Council Air Quality Strategy: Action Plan
Page 45 of 105 January 2005
the importance of transport in the region and its influence regarding land use with special
regard to protecting the environment, providing for social needs and maintaining economic
growth.
The report did not make specific recommendations, however it did presented broad strategic
measures that, if introduced, would achieve in part the aspirations of the social, business
and environmental communities. In these broader measures, the TVMMS did not favour
widening of the M3, preferring to increase the management of the existing infrastructure.
TVMMS recommended greater use of CCTV, variable speed limits and incident detection.
While the TVMMS report states that these methods of traffic flow management will not
substantially increase capacity; but does recognise that they can increase journey time
reliability, recognising that M3 as a corridor needing better management.
The TVMMS recommended giving priority access to public transport, high occupancy
vehicles and freight traffic. The TVMMS report did not make any specific recommendation
measures for the M3 approaches to the M25. The report suggested a park and ride facility
near to the M25, to alleviate traffic congestion approaching London's Heathrow airport.
The TVMMS made known that any measures on the strategic trunk road network need
identifying, designing and appraising through the RMS framework mechanism.
Finally, despite giving priority to freight traffic on the trunk road network, the TVMMS
supported the transfer of freight traffic from road to rail, and called for transfer sites in the
Thames Valley region to be brought forward. The report highlighted three Strategic Rail
Authority schemes; Southampton to West Midlands (2006), north east to south west (2010)
and the Great Western Main Line gauge clearance to Bristol and Cardiff (2010). These
schemes are likely to be delivered within the timescale of both the Multi-Modal Study and
this RMS. The TVMMS report anticipated that these schemes would go some way in
providing a feasible alternative to the carriage of freight on the road.
The Secretary of State considered these recommendations. He supported the conclusion
that general motorway widening is not required in the study area before 2016 and he asked
the Highways Agency (HA):
• To identify and develop smaller scale improvements on the trunk road network to address
localised congestion problems in key corridors and to submit proposals in due course;
• To develop appropriate management measures for the trunk road and motorway network
in the Blackwater Valley and north west Surrey, including better detection and
management of incidents, and to submit proposals in due course which take account, inter
alia, of the opening of Heathrow Terminal 5 in 2008;
• To continue to monitor the performance and journey time reliability of the motorway and
trunk road network as these measures are taken forward.
The Secretary of State also asked the HA to consider the case for priority measures on appropriate parts of the motorway and trunk road network which would support the development of bus and coach services.
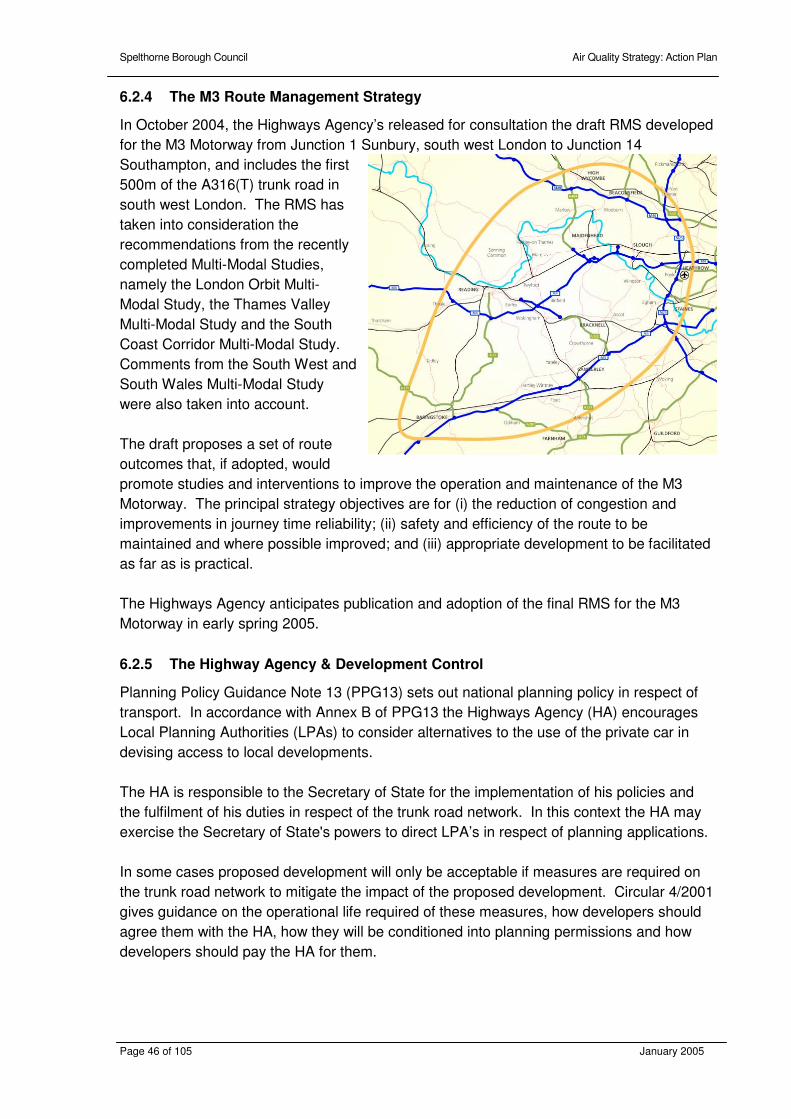
Spelthorne Borough Council Air Quality Strategy: Action Plan
Page 46 of 105 January 2005
6.2.4 The M3 Route Management Strategy
In October 2004, the Highways Agency’s released for consultation the draft RMS developed
for the M3 Motorway from Junction 1 Sunbury, south west London to Junction 14
Southampton, and includes the first
500m of the A316(T) trunk road in
south west London. The RMS has
taken into consideration the
recommendations from the recently
completed Multi-Modal Studies,
namely the London Orbit Multi-
Modal Study, the Thames Valley
Multi-Modal Study and the South
Coast Corridor Multi-Modal Study.
Comments from the South West and
South Wales Multi-Modal Study
were also taken into account.
The draft proposes a set of route
outcomes that, if adopted, would
promote studies and interventions to improve the operation and maintenance of the M3
Motorway. The principal strategy objectives are for (i) the reduction of congestion and
improvements in journey time reliability; (ii) safety and efficiency of the route to be
maintained and where possible improved; and (iii) appropriate development to be facilitated
as far as is practical.
The Highways Agency anticipates publication and adoption of the final RMS for the M3
Motorway in early spring 2005.
6.2.5 The Highway Agency & Development Control
Planning Policy Guidance Note 13 (PPG13) sets out national planning policy in respect of
transport. In accordance with Annex B of PPG13 the Highways Agency (HA) encourages
Local Planning Authorities (LPAs) to consider alternatives to the use of the private car in
devising access to local developments.
The HA is responsible to the Secretary of State for the implementation of his policies and
the fulfilment of his duties in respect of the trunk road network. In this context the HA may
exercise the Secretary of State's powers to direct LPA’s in respect of planning applications.
In some cases proposed development will only be acceptable if measures are required on
the trunk road network to mitigate the impact of the proposed development. Circular 4/2001
gives guidance on the operational life required of these measures, how developers should
agree them with the HA, how they will be conditioned into planning permissions and how
developers should pay the HA for them.

Spelthorne Borough Council Air Quality Strategy: Action Plan
Page 47 of 105 January 2005
6.2.6 General Actions
Actions the Highways Agency is in the process of implementing within the borough of
Spelthorne that will assist in the reduction of traffic emissions include:
• The installation of variable message signs on the M25 to provide information to drivers, for
example the presence of area diversions in the event of motorway closure;
• Improved advance notification of roadwork’s and provision of information to allow road
users to seek alternative routes;
• Improvements to the A30 Crooked Billet junction and A30 Town Lane junction to improve
the signalling and provide cycle facilities;
• HA Traffic Officers who will patrol the network and keep traffic moving. This will reduce
emissions from queuing vehicles. They will deal with incidents and clear obstructions and
can stop and direct traffic as needed;
More generally, the Highways Agency will be launching the “Influencing Driver Behaviour”
initiative that will promote soft demand management measures to reduce demand for the
network. They will be working with developers, employers, freight transport association,
local authorities, coach operators and tourist boards on this. Also, they look to encourage
the vehicle and construction industries to play their part in reducing emissions. The
Highways Agency also supports the Government’s proposals for long-term sustainable
transport solutions for the southeast region.
Neither Spelthorne Borough Council nor Surrey County Council have any authority over
Highway Agency controlled road, however, we both have an ongoing working relationship
with the Highways Agency and meet regularly to discuss air quality issues. This work will
continue.
Action - Roads Emissions 1
The Borough of Spelthorne together with Surrey County Council will continue
to work with the Highways Agency to seek and implement
long-term solutions for the reduction of emissions from road vehicles using
Highways Agency controlled trunk roads within Spelthorne.
Spelthorne Borough Council Air Quality Strategy: Action Plan
Page 48 of 105 January 2005
6.3 Control of Emissions Emanating from County Council Maintained Roads
At various hotspot locations within the borough of Spelthorne, emissions emanating from
roads that fall under the direct responsibility of Surrey County Council are predicted to
exceed the NAQS annual objective NO2 limit; 39% of the total NOx emissions within the
borough of Spelthorne is caused by vehicles using roads maintained by Surrey County
Council. Section 86 of the Environment Act 1995, places a duty on county councils to
submit to the local authority for inclusion with the area’s air quality action plan:
• Proposals for the control of emissions emanating from county maintained road that they
themselves can implement to work towards meeting the air quality objectives in designated
areas; and
• A statement detailing the timescales for the implementation of each of the proposals.
The Government is recommending that local authorities responsible for local air quality
management integrate Air Quality Action Plans, where transport is the primary factor, into
the Local Transport Plan covering their area. This approach, through the integration should
enable air quality problems to be dealt with in a more corporate and multi-disciplinary way;
further encouraging county council transport planners to work more closely with district
council air quality officers in devising appropriate solutions. While the transport related
component of this air quality action plan is currently separate from the Local Transport Plan,
it will be integrated into the next Local Transport Plan, which will be published in 2006.
Spelthorne Borough Council and Surrey County Council are working in partnership to
reduce emissions from road vehicles at locations throughout the borough that are predicted
to exceed NAQS objectives.
6.3.1 Surrey County Council’s Local Transport Plan (2001 to 2006)
In consultation with its district Councils, Surrey County Council is responsible for developing
the Local Transport Plan (LTP), which is the statement of the County’s transport strategy.
The main objectives of the transport plan are:
• Objective A - Integration - to improve co-ordination between all forms of transport, and to
integrate transport with other policies. The policies referred to include those for land use
planning, health, education, wealth creation and social exclusion;
• Objective B - Environment - to protect and improve the environment of Surrey and health of
its people by reducing the adverse effects of motorized transport;
• Objective C - Safety - to improve the safety and security of transport for all travellers. This
is in response to the Crime and Disorder Audit, which highlighted transport security as one
of the principal concerns of Surrey residents. However, it should be recognised that this is
largely a perceived problem; police records indicate a relatively low incidence of transport
related crime in Surrey;
• Objective D - Economy - to promote an efficient transport system that supports a
sustainable economy;

Spelthorne Borough Council Air Quality Strategy: Action Plan
Page 49 of 105 January 2005
• Objective E - Accessibility - to make it easier for everyone to travel to everyday facilities,
especially people without a car, thus improve accessibility whilst reducing the overall need
to travel.
The Government has certain national transport targets and the standards it has set for road
casualty reduction, increasing cycling and improving air quality. These targets are reflected
in the Surrey LTP; the following target areas for priority in the county:
• Improvements in accessibility to encourage more public transport use, walking and cycling,
linked with complementary measures to achieve traffic reduction ~ Improvements in
accessibility will be supported by complementary measures to restrain and manage traffic,
however, until considerable improvements in accessibility are made to encourage public
transport, walking and cycling, it is less likely that a shift toward these modes of transport
will occur, or that traffic reduction can be achieved;
• Road safety measures to address the severe problem of road accident casualties in
Surrey;
• Maintenance of the highway network, aimed at reducing the serious backlog of
maintenance work;
Table 6.6 presents the subject areas of the eight LTP targets, showing which of the five
objectives each is most closely associated with. In most cases, the targets are related to
several objectives. (The LTP is currently being reviewed; it is likely that some of the targets
identified in table 6.6 may change.)
Table 6.6: Targets related to objectives
Objectives Targets
(To gauge progress towards the objectives) Integration Environment Safety Economy Accessibility
1. Traffic reduction
2. Improved accessibility by non-car modes
3. More walking, cycling and use of public transport
4. Road casualty reduction
5. Reduced vehicle emissions
6. Increased proportion of major developments located in accessible urban centres
7. Improved condition of the highway network
8. Improved provision for freight transport

Spelthorne Borough Council Air Quality Strategy: Action Plan
Page 50 of 105 January 2005
Local Transport Plan Targets
The protection and improvement the Spelthorne’s environment and the health of its people
by reducing the adverse effects of motorised transport is relevant to all 8 of the LTP targets
(objective B and table 6.6 refer). Target 1 - Traffic reduction Measures
To limit road traffic levels on county roads to zero
growth above the 1998 level by 2016 with a
reduction thereafter. The milestone targets for
2006 and 2011 are 8% and 10% above the 1998
level respectively. Survey data together with the
Surrey County Transportation Model is used to
monitor this target.
Target 2 - Improved Accessibility by Public Transport, Cycling and Walking
To increase the proportion of the population who have good access (within 20 minutes) to
town centres, schools and secondary education colleges, by the following amounts:
There has been strong public support
for improving accessibility by the non-
car transport modes but good
accessibility is seen as being less
than the 30 minutes used in the provisional LTP. Therefore, 20 minutes door to door in the
morning peak hour is now taken to represent a good level of accessibility to aim for. The
target requires that by 2006, 2011 and 2016 the proportion of the population within 20
minutes of a town centre should be 40%, 45% and 50% respectively.
Target 3 - More Walking, Cycling and Public Transport Use
To increase the percentage of all journeys and school journeys by non-car modes to the
following levels:
Given the steady decline in the use of
bus and train, walking and cycling as
modes of transport to work over the
past decades, revealed by the Census
journey to work data, the target is
challenging. It should be achievable,
however, provided sufficient resources
are employed to make these modes sufficiently attractive. The achievement of the longer-
term targets will be dependent on the introduction of restraints on car use, and road space
reallocation. The target to double the mode share for cycling by 2006 and double it again by
2016 is more ambitious than the national target.
1999 2006 2011 2016
Public Transport 30% 40% 45% 50%
Cycling 55% 60% 65% 70%
Walking 22% N/A N/A N/A
1999 2006 2011 2016
All Journeys Public Transport 9% 12% 15% 18% Cycling 2% 4% 6% 8% Walking 21% 22% 23% 24% School Journeys Public Transport 18% 20% 25% 30% Cycling 7% 9% 15% 20% Walking 19% 21% 25% 30%
Spelthorne Borough Council Air Quality Strategy: Action Plan
Page 51 of 105 January 2005
The decline in the use of non-car modes for the journey to school has been greater in
Surrey than nationally. In the light of past trends, the reversal of this decline is challenging.
However the Safe Routes to School initiatives including new conventional bus services and
Green Travel Plans at some schools and colleges have produced dramatic reductions in car
use.
The mode share figures for 1999 are taken from a Travel Diary Survey undertaken in 1999.
It is intended to repeat this, or a similar survey, each year to monitor the all-journeys target.
The repeats of the Travel Diary Survey will be the principal means of monitoring the school
journey mode split target. Studies at individual schools will supplement the Travel Diary
Survey.
Target 4 - Road Casualty Reduction
To reduce road casualties by the following amounts:
2002 2006 (National Target)
2010 2011 2016
Killed and Seriously Injured 25% 29% 40% 43% 57%
Children Killed and Seriously Injured 28% 36% 50% 53% 71%
Slight Casualties (per 100 million Vehicle Km) 15% 7% 10% 11% 14%
The Surrey targets are based on the new national targets but have been re-calculated to
reflect the LTP milestone years of 2006 and 2011 and extended to 2016 to bring these
target dates into line with all the others in this LTP. It is, however, recognised that the
National Target is likely to be changed before 2010, which will necessitate a change in the
2011 and 2016 milestones. This target will be monitored by reference to police accident
records and estimated vehicle kilometres from the Surrey County Transportation Model.
Target 5 - Reduced Vehicle Emissions
To ensure that road traffic emissions do not cause national air quality standards to be
exceeded.
While implementation of the LTP will bring about an improvement in the air quality of the
Borough, target 5 promises “Where AQMA’s have been declared, and where road traffic on
County roads contributes significantly to the problem, the LTP implementation programme
will be adjusted to take account of proposals for the reduction of emissions from road traffic”.
Where AQMA’s have been declared, the transport programmes in these areas are to be
prioritised accordingly and measures introduced to help reduce vehicle emissions. The level
of transport emissions will be monitored using the EVAL programme on the County
Transportation Model.

Spelthorne Borough Council Air Quality Strategy: Action Plan
Page 52 of 105 January 2005
Target 6 - Increased Proportion of Major Developments Located in Accessible Urban Centres
To ensure that at least 50% of major developments are located within existing urban areas
at sites that have good access by public transport, cycling and walking. The location of
major development within urban areas, at locations that are highly accessible by means
other than the private car, should reduce the need to travel, especially by car. There has
been strong public support for improving accessibility by the non-car transport modes but
good accessibility is seen as being less than the 30 minutes used in the provisional LTP.
Therefore, 20 minutes door to door in the morning peak hour is now taken to represent a
good level of accessibility to aim for.
Target 7: Improved Condition of the Highway Network
To increase the proportion of the Surrey Priority Network in good structural condition to 72%
by 2006, 80% by 2011 and 85% by 2016.
Smooth and unimpeded flow traffic is essential for ensuring that emissions of NOx from road
traffic are kept to a minimum, consequently effective road maintenance is essential. In
addition to maintaining the condition of roads for use by motorised vehicles, cycleways and
footpaths need to be maintained to make them attractive to the user. Therefore it is
necessary to ensure a higher level of repair and maintenance of footways, cycle tracks,
cycle lanes, and the near-side edges of roads without specific provision for cyclists, to
achieve safe, even surfaces.
6.3.2 Implementation of Surrey County Council’s Transport Plan within Spelthorne
One of the principal elements of Surrey County Councils transport programme for
Spelthorne that has a direct impact on improving air quality within the borough is to “widen
travel choice and encourage more journeys by public transport, cycle or walking as a result
of enhancing the public transport, cycle and pedestrian network and facilities”.
The County Councils objectives to “improve road safety by carrying out local safety
schemes, junction improvements and traffic calming” will facilitate the above-mentioned
objective.
In 2006, Surrey County Council will publish a revised Local Transport Plan (LTP) that will
take forward their transport strategy for the years 2006 to 2011. The revised LTP will
integrate the actions detailed within this “Air Quality Strategy Action Plan” that will reduce
emissions emanating from Surrey County Council maintained roads.
Action – Road Emissions 2
Spelthorne Borough Council and Surrey County Council will continue to
work together to identify, prioritise and implement actions to reduce vehicle
emissions emanating from county maintained roads within NAQS
exceedance locations throughout the borough of Spelthorne.

Spelthorne Borough Council Air Quality Strategy: Action Plan
Page 53 of 105 January 2005
6.3.2.1 Reduction of Road Traffic Emissions Caused by Travelling to School
A number of incentives have been developed that will result in the reduction of emissions
from vehicles transporting children to school. Such incentives include the introduction of
‘safe routes to school’, ‘school travel plans’ and ‘walking buses’.
Safe Routes to School
“Safe routes to school” projects are designed to encourage more people to walk, cycle or
use public transport to travel to school, by making these options safer and easier. Safe
routes to schools projects aim to:
1) Help people who already walk, cycle, and use the bus or the train;
2) Have fewer cars making the school trip, by making the other modes of travel more
attractive than the car.
3) Avoid accidents and improve skills and confidence in dealing with traffic.
There are four types of activity that when combined can make a successful project in a
school:
• Engineering works - to create a safer and more convenient travelling environment;
• Education and training – to improve people’s skills and confidence;
• Marketing and Communications – to encourage people to use more sustainable forms of
transport and to create a dialogue between service providers and users,
• Data Collection – to quantify impact and provide attitudinal information. At any one school,
there is a mix of these measures that will realise maximum potential. Doing this is usually
an ongoing process as opportunities emerge through dialogue. In this way, detailed
participation is proving to be the lifeblood of SRS projects both in Surrey and in the whole
country generally.
Safe Routes to School within Spelthorne
Surrey County Council established the nation’s first countywide “Safe Routes to Schools”
project. Safe Routes to School (SRS) projects have been undertaken in Spelthorne for the
past 3 years. Due to the large number of schools in the Sunbury area, this work
commenced in Sunbury in 2001. The work will progress through the borough area by area
with the engineered aspects due for completion in 2006.
These works form part of a larger strategy for ensuring safe routes to schools throughout
Spelthorne. An overview of this strategy is given in table 6.7 below.

Spelthorne Borough Council Air Quality Strategy: Action Plan
Page 54 of 105 January 2005
Table 6.7: Safe Route to School Programme 2000/2006
2000 2001 2002 2003 2004 2005 2006
Data Collection
'Before’ surveys Sunbury Ashford Staines Stanwell
'After’ surveys Sunbury Ashford
Engineering
Highways phase 1 Sunbury phase 1 Ashford phase 1
Staines phase 1
Stanwell phase 1
Highways phase 2
Sunbury phase 2
Ashford phase 2
Staines phase 2
Highways phase 3 - cycle parking
Sunbury phase 3
Ashford phase 3
Marketing & Communications
Survey feedback
Ashford autumn
Staines, Sunbury
Ashford, Stanwell
Borough newsletter Spring
County newsletter October
School travel plans:
Recruit interested schools
Sunbury, Ashford
Schools sign up to site specific advise scheme
Sunbury, Ashford
Individual school programmes produced through working groups
Sunbury, Ashford
Promotions and events
Golden Boot Challenge Five schools
Initiatives emerging from STP's Ongoing
Education and Training
Ongoing programme Ongoing
Programme tailored to fit engineering and promotion timetable
Chertsey Rd,
Nursery Rd,
Squires Bridge Rd
Woodthorpe Road
Funding for SRS schemes is provided for as part of the Local Transport Plan on an annual
basis (the 2003/04 allocation was £171,246). This funding has been allocated to two main
schemes (Nursery Road and Squires Bridge Road) and a number of other smaller projects
have been identified for work in 2003 and 2004 SRS schemes programme. Works
incorporated within the 2003/2004 programme include:
• Nursery Road traffic-calming construction (£58,000);
• Squires Bridge Road - puffin construction (£35,000);
Spelthorne Borough Council Air Quality Strategy: Action Plan
Page 55 of 105 January 2005
Action – Road Emissions 4
Surrey County Council will
continue to work with
Spelthorne’s schools for the
development, implementation and
the annual review of School
Travel Plans.
• Chertsey Road, Sunbury - puffin construction;
• Green Lane, Shepperton – pelican adaptations;
• Woodthorpe Road - puffin construction;
School Travel Plans
A “School Travel Plan” is a document containing a series of practical steps for improving
children’s safety on the school journey. The plan has benefits for both the individual school
and the wider community. It aims to reduce dangers, ease congestion, improve health and
promote the use of alternative transport.
Schools within Spelthorne will be actively encouraged to develop School Travel Plans.
Work on school travel plans will commence with the
Sunbury schools, where works have been recently
completed or are to be completed shortly and
selected Ashford schools. Government assistance
may be available for this in the short-term, but in the
longer term, Surrey County Council’s Local
Transportation Services in Surrey have allocated
dedicated resources to provide for 1 full-time
equivalent post for an officer to cover the School
Travel, Travel Plan, and Mobility Management
projects.
Walking Buses
Walking buses are a simple but effective idea for families who live up to 1 mile from school.
Walking buses not only improve air quality and traffic congestion, it also improve children’s
health through regular exercise, making them more alert in class, and provides a valuable
social opportunity.
Parents organise themselves on a rota basis to
walk their children to school, collecting other
children on the way. Adults and children wear
fluorescent and reflective tabards so that the
walking bus can be easily identified and seen by
drivers.
Action – Road Emissions 5
Surrey County Council will
continue their work to help schools
in Spelthorne organise “Walking
Buses”.
Action – Road Emissions 3
Surrey County Council will continue to work with Spelthorne’s schools for
the development and implementation of safer routes to schools program.

Spelthorne Borough Council Air Quality Strategy: Action Plan
Page 56 of 105 January 2005
Cycling Proficiency and Cycle Skills training
Surrey County Council’s Road Safety Officers regularly arranges cycling proficiency and
cycle skills within schools for school children. This work will continue as part of Surrey
County Council’s work.
6.3.2.2 General Actions for the reduction of Emissions from Road Vehicles on County Council Controlled Roads in Spelthorne
Vehicle Activated Signs
Vehicle Activated Signs (VAS) has been developed to address the problem of inappropriate
speed where conventional signing has not been effective.
VAS are to be introduced on roads within the borough of Spelthorne where traffic calming
may not be appropriate, such as classified roads or roads within conservation areas and
have been erected to encourage drivers to comply with the speed limit. Drivers exceeding a
set threshold speed trigger the VAS, which warns the driver they are travelling at an
inappropriate speed, or of a hazard, or that they may be in the vicinity of a school.
While new road signs and changes to the road layout have an initial effect on traffic speeds.
However, after a period of time regular users of a road become familiar with the new layout
and tend to increase their speeds. For this reason Spelthorne local Transportation Service
has devised a programme whereby the roads on the rolling program undergo the following
changes:
• The road is without any speed indicators
• Posters are erected along the length of the road
• The road is without any speed indicators
• VAS are erected
• The roads on the programme have been selected for the following reasons:
• Classified roads with high accident rates but on which traffic calming would be
inappropriate.
• Near schools
• Requests from the public
Action – Road Emissions 6
Surrey County Council will continue their work to help schools teach pupils
cycling proficiency training and cycle skills.
Action – Road Emissions 7
Surrey County Council will install Vehicle Activated Signs to control road
traffic speeds at appropriate locations within Spelthorne.
Spelthorne Borough Council Air Quality Strategy: Action Plan
Page 57 of 105 January 2005
Variable Message Signs
To allow choice of travel modes people need information on the alternatives available.
There are now a variety of transport schemes available, information systems should
stimulate interest and demand, and increase awareness of the opportunities. Travel
information needs to be up-to-date and reliable.
Surrey County Council’s Network Management and Information Centre (NMIC) in
Leatherhead are currently exploring the use of variable message signs to:
• To advise travellers on issues such as journey time, availability of parking spaces and
actual air quality, all of which could be coordinated from the NMIC.
• Make bus timetable information and “real time passenger information” available at bus
stops, on the Internet, and also accessible by text messaging. This is part of the “real-time
passenger information” project in which bus stops are being provided with the ability to tell
those waiting at them when the next bus will arrive. It does this using satellite technology
connected to the bus. The signals counting down its arrival are coming from the bus, and
not from a theoretical timetable. This information would also be available on NMIC website
and also to people telephoning the NMIC contact centre, and eventually (hopeful) through
“short messaging service” (SMS) technology used by mobile phones. All of this supports
our aim to enable more people to get out of their cars and on to reliable buses, easing
Surrey’s significant traffic congestion problems.
• SCC are exploring the possibility of connecting real time air quality monitoring equipment
through the common database at the NMIC and then distributing this information to
roadside VMS in Spelthorne. This would give the public up to date information on current
air quality and hence promote the modal shift that is aimed at.
Traffic Management
The new Traffic Manager for SCC has a brief to 'keep traffic moving' with respect to
reducing delays from roadworks and other both planned and unplanned events. This is
particularly important with regards to reducing the amount of standing traffic, especially in
the Sunbury Cross area.
Action – Road Emissions 8
Surrey County Council will investigate the feasibility of installing Variable
Message Signs to provide travel advice information at appropriate locations
in and around the borough of Spelthorne.
Spelthorne Borough Council Air Quality Strategy: Action Plan
Page 58 of 105 January 2005
Decriminalised Parking Enforcement
Decriminalised Parking Enforcement (DPE) is the means by which enforcement of all
waiting and loading restrictions becomes a civil offence, thereby enforceable by the Local
Authority, or its contractor.
Spelthorne Borough Council is a member of Surrey’s DPE working party, the aim of which is
to achieve "Effective enforcement of parking restrictions, leading to better traffic
management, reduced congestion, improved road safety, fairer distribution of available
parking spaces, elimination of obstruction on narrow roads, better management and
appropriate distribution of commuter / shopper parking.”
It is intended that parking enforcement becomes self-financing across the county as a
whole. Surrey County Council will pay for all DPE start up costs, with the exception of
existing plans, such as those planned by Spelthorne Borough Council for its car park
services, these will be identified as a contribution towards the costs. Where there are no
such plans, Surrey County Council will cover all costs. Surrey County Council has agreed to
underwrite any losses over the first 5 years. Any
surplus will be held by Surrey County Council,
which will consider its use. To enable DPE to be
self-financing by year 5, Spelthorne Borough
Council shall identify gap-closing measures by the
end of the first year of operation, as a decision has
to be made by the end of the second year whether
to continue the Agency agreement or not (by either
party).
As part of its work in establishing DPE within Spelthorne, information explaining the DPE scheme will be given to borough residents through the Council's Borough Bulletin.
Controlled parking zones
Controlled parking zones (CPZs) (also known as a “Permitted Parking Areas”) are areas
where all on-street parking is controlled. This helps keep roads free from dangerous parking
and give priority to residents and local businesses, who must display parking permit or
voucher.
Designated parking bays are shown by white road
markings and the remainder of the kerbside is subject
to parking restrictions. There are signs at the entry
roads to all CPZs stating the hours during which the
Action – Road Emissions 9
Spelthorne Borough Council will work in partnership with Surrey County Council for the implementation of decriminalised parking enforcement within the borough of Spelthorne.
Action – Road Emissions 11
Spelthorne Borough Council will
investigate the feasibility of
establishing CPZ at various
locations in the borough.
Action – Road Emissions 10
Spelthorne Borough Council will publicise the establishment of DPE within the borough of Spelthorne.

Spelthorne Borough Council Air Quality Strategy: Action Plan
Page 59 of 105 January 2005
controls and yellow line restrictions are operational. Visitors parking in the bays during these
hours must use the pay and display machines as traffic wardens monitor the controlled
parking zones.
Once the DPE has been established. Spelthorne Borough Council will look at the feasibility
of establishing CPZ’s and additional restrictions at various locations in the borough.
Freight Quality Partnership
Surrey County Council are to conduct a feasibility study into the development of a lorry
routing strategy. The principal objectives are:
• To investigate the movement of HGVs inside the M25 orbital motorway in the area between
the M3/ A308/ A309 and the A3. The area under consideration is mainly contained within
the Surrey boroughs of Spelthorne and Elmbridge, either side of the Thames at Walton.
The study boundary does extend further to include the M25 to the west and south and the
A308 north and eastwards into Richmond and Kingston;
• Medium term practical action plan as to the development of an HGV routeing strategy and
other measures for the area and advise on a likely programme of measures for
implementing the strategy; and
• Other recommendations as to how the work could be developed further taking into account
the eventual implementation of the new bridge at Walton.
The feasibility study shall include;
• Liaison with Local Authority stakeholders to identify optimum locations for investigations;
• 3 specialised goods vehicle counts;
• Analysis of information including traffic count details from current bi-annual counts; and
• Development of recommendations.
The purpose of the specialised vehicle counts is to observe traffic on a length of road or at a
junction and assess the age, vehicle size and type, direction of travel and industry category
of the commercial vehicles that are using the transport infrastructure. This in depth
knowledge of traffic type can help planners make informed decisions, develop ideas or
provide information for further study or analysis. The analysis can provide a good indication
of the main industries generating commercial traffic in the area and the destinations
attracting large volumes of lorries. A proportion of company names and contact details are
also recorded and this can help with discussions with relevant stakeholders in local industry.
When summarised, this information can later be related to the Euro engine emission
standards and the contribution of light commercial traffic and buses can be more accurately
modelled. The output of this quantitative process offers the potential not only for more
accurate modelling of the impact of goods vehicles but also offers an insight into the ways in
which goods vehicle emissions can be reduced. The information will also be compared to
Spelthorne Borough Council Air Quality Strategy: Action Plan
Page 60 of 105 January 2005
our national database of vehicle types and nature of freight. The information will also be
combined with the bi-annual traffic surveys.
Other issues that will be considered include:
• M25 and possible rat-running through the area;
• Industrial development around Heathrow airport;
• The redevelopment of Walton Town Centre;
• Replacement bridge over the Thames at Walton on Thames;
• Understanding of freight issues in preparation for the Walton bridge Public Inquiry; and
• Tesco at Brooklands have distribution centres in the area in Weybridge.
• Effect of a weight limit on Walton Bridge for over 17tonnes vehicles in light of new
information
The logistics planning process for the
area will also be considered including the
supply chain descriptions and trends
where evidence is uncovered.
Public Transport Integration
Improvement and integration of passenger transport systems are central to the success of
Surrey’s (and thus Spelthorne’s) local transport plan target for reducing car dependency,
which in turn will reduce emissions of air pollutants from road transport.
Spelthorne is well placed in terms of being able to exploit public transport systems as a
means of reducing car dependency. Spelthorne has 5 railway stations offering direct and
regular services between London Waterloo and Reading, Weybridge and Windsor.
Spelthorne’s bus routing is widely distributed across the borough providing good network
coverage to most areas of the borough, in addition to neighbouring boroughs and London.
About 1/3rd of the network is served by routes having more than 4 buses per hour during
core hours (7am - 7pm). In most instances bus routes are integrated with train stations
throughout the borough: -
• Staines train station is serviced by 4 regular and 4 restricted bus services. In addition to
the buses calling directly to the train station, Staines bus garage is within a 5-minute walk.
The bus garage supports 706 bus movements each working day, accessing various parts
of the borough via 17 regular and 8 restricted bus routes.
• Sunbury train station is supported by 436 bus movements each working day during core
hours (7am - 7pm). These buses access various parts of the borough via 7 regular and
6 restricted bus routes. Five of these bus services (all regular) call directly at the train
Action – Road Emissions 12
Carry out a feasibility study into the
development of a lorry routing strategy.

Spelthorne Borough Council Air Quality Strategy: Action Plan
Page 61 of 105 January 2005
station, the other bus routes are all accessible within a 5 to 10 minute walk of the station.
• Ashford train station is accessed by 5 regular services and 1 restricted bus service. In
addition to those buses calling directly to the train station, there are 4 other regular service
and 1 restricted service bus routes within 5 to 10 minute walk of the station.
• Shepperton train station is accessed by 6 regular and 2 restricted bus services.
Emissions from buses
Emissions from buses account for 17% of all ground-level NOx emitted by road vehicles in
Spelthorne. In terms of actual emission levels, this is a relatively small amount, although it
is anticipated that this will increase as the number of buses on Spelthorne’s road rise.
However, ensuring that buses having the lowest emissions operate bus-routes within the
Spelthorne area can offset this. For that
reason, whilst working to enhance and
improve public transport, bus companies will
be encouraged to use the lowest emission
buses on bus-routes along critical corridors
within the Spelthorne area. Weekend Nightbus Service
Spelthorne Borough Council in partnership
with Surrey Police and other stakeholders have established a nightbus service that operates
on Friday and Saturday nights. Two routes have been set up, both of which originating from
Staines town centre:
• Service N100: Departs from Staines (Blue Anchor) at 2230, 0050 & 0210, stopping at
Egham, Royal Holloway College, Virginia Water, Addlestone, Chertsey & Pooley Green as
required by those boarding at Staines.
• Service N200: Departs from Staines (Blue Anchor & Post Office) at 0010, 0130 & 0250
stopping at Stanwell, Ashford, Sunbury Cross, Upper Halliford, Shepperton & Laleham as
required by those boarding at Staines. The departure at 0250 also serves Feltham on
request.
Action – Road Emissions 15
Buses operating along critical corridors
within the borough of Spelthorne will be
encouraged to have Euro III compliant
engines.
Action – Road Emissions 13
To promote integrated public transport as a good alternative form
of transport to the car and improve facilities at bus stops within
Spelthorne.
Action – Road Emissions 14
To promote bus travel as a good alternative form of transport to
the car and improve facilities at bus stops within Spelthorne.
Spelthorne Borough Council Air Quality Strategy: Action Plan
Page 62 of 105 January 2005
The cost to travel is £2.00 per person. Further information is available from Centra
(telephone number 0208 569 6901 or 01932 859250.
Bus infrastructure and Quality Partnerships
The 555/6/7 bus route carries a million passengers annually through the borough on the
Heathrow route. A bus priority study
has identified a number of
improvements that will aid bus services
through congestion trouble spots,
reducing bus journey times and
improving the reliability of the service.
The improvements identified include:
• Bus priority at traffic signals ~ seven key traffic signals along the route have recently been
fitted with equipment that gives buses priority.
• The provision of a bus lane along Staines Road West (A308) and one on Walton Bridge
Road
• The provision of raised kerbs to complement the low-floor buses and improve lighting and
surfacing around bus stops to make them safer.
• Parking restrictions.
Cycle Routes
Increasing the number of journeys undertaken by cycle will play a direct part in achieving
Surrey’s Local Transport Plan (LTP) modal share targets and will contribute to the overall
vision on sustainable transport, especially the environment (air quality) and accessibility
objectives. Census and travel diary information shows around 2% of all journeys are made
by cycle in Surrey.
Analysis has been made of the main current deterrents to cycling in Surrey and considers
what opportunities there are to overcome these and so increase the proportion of people
who cycle. Most journeys are less than five miles, which makes it physically possible for the
target for increased cycling to be reached, provided improvements could be made in the
quality of the journey and the facilities at the cyclist’s destination. Equally crucial is
improved safety; Surrey’s cycling strategy dovetails with that on road safety in seeking a
dramatic fall in the risk per kilometre cycled, so that cycling levels can rise while casualties
fall. The strategy also involves close liaison with the school travel, passenger transport and
travel awareness topic strategies. The main actions identified for they cycling strategy
throughout Surrey include:
• To implement at least 1,000 kilometres of new cycle facilities within five years, roughly
tripling the current 470 kilometres of on or off-road cycle network.
• To give more priority to facilities that improve journey times for cyclists.
Action – Road Emissions 16
Bus prioritised infrastructures will be installed
at strategic locations within Spelthorne.

Spelthorne Borough Council Air Quality Strategy: Action Plan
Page 63 of 105 January 2005
• To continue developing local co-operative working through district cycle forums.
• To increase the levels of cycling skills and confidence in Surrey’s population.
• To complete sections of the SUSTRANS National Cycle Network in Surrey, and create
links to other parts of the county and to adjoining authorities.
• Take action on cycle parking at rail and bus stations, and carriage of cycles on trains in
ways that complement the Council’s aim of greater passenger transport patronage.
• Establish cycle monitoring cordons for all districts in the county to collect detailed local
information that will supplement countywide travel diary data.
• Include cycling in Company Travel Plans and School Travel Plans.
• Integrate the needs of cyclists into
the town centre pedestrian access
project, so that shared opportunities
for vulnerable road users can be
maximised and the points of conflict
minimised.
Walton Lane in Shepperton is mostly one way and used by cyclists travelling in both
directions, bringing them into possible conflict with vehicles. A new segregated cycle lane is
to be introduced at the section of the road
where cyclists are most at risk, on a
widened footway, with the cycle lane
continuing on the carriageway to Walton
Bridge Road.
Surrey Cycle Guides
Surrey County Council will produce a
series of Cycle Guides that will detail all
the cycle routes throughout Surrey. The
guides will be made available, free of
charge, from local libraries, cycle shops,
district councils and from Surrey County
Council direct.
River Thames Passenger Ferry
A regular ferry service is provided across the River Thames from at Ferry Lane on
Shepperton bank of the Thames, to Thames Street on the Weybridge bank of the Thames.
The ferry will operate on request of passengers arriving on either side of the riverbank at the
times shown below.
Action – Road Emissions 17
Increase the number of journeys made by cycle
from 2% to 4% above 2001 base level.
Action – Road Emissions 18
Introduce a linked, segregated cycle land
between Chertsey Bridge and Walton Bridge
Road.
Action – Road Emissions 19
Surrey County Council will produce a series of
Cycle Guides that will detail all the cycle
routes throughout Surrey.

Spelthorne Borough Council Air Quality Strategy: Action Plan
Page 64 of 105 January 2005
Mondays to Fridays 0800 to 1730 (running every 15 minutes)
Saturdays 0900 to 1730 (running every 15 minutes)
Sundays 1000 to 1730 (running every 15 minutes)
Nauticalia Ferry operates the ferry in partnership with the Environment Agency, the
Countryside Commission and Spelthorne and Elmbridge Borough Councils. Further
information can be obtained by telephoning Nauticalia Ferry on 01932-254844.
Spelthorne Borough Council Air Quality Strategy: Action Plan
Page 65 of 105 January 2005
6.4 Actions to reduce NOx Emissions Caused by Road Vehicles in General
Motor vehicle engines emit many types of pollutants including nitrogen oxides (NOx), volatile
organic compounds (VOC’s), carbon monoxide (CO), carbon dioxide (CO2), particulates
(PM’s), and sulphur dioxide (SO2).
A number of factors affect the volume of pollutants emitted. Such factors include the engine
energy efficiency, the type of fuel, speed (engines are inefficient at low speeds and during
idling), volume of traffic using route, route congestion, and the traffic components using the
route, for example the number of heavy goods vehicles.
6.4.1 Cleaner Technology
In general, diesel cars are cleaner than petrol cars without catalysts for all pollutants except
particulates. Diesel cars have very different emission characteristics, by comparison with
catalyst cars, diesels engines emit less carbon monoxide, hydrocarbon and carbon dioxide,
but emit higher levels of nitrogen oxides and particulates. Diesel cars have greater fuel
economy and reduced maintenance requirements. However, an increase in diesel cars at
the expense of petrol cars could have important implications on urban air quality, smog
formation, global warming and other environmental issues.
Petrol cars with catalysts produce higher levels of carbon monoxide and hydrocarbon than
diesel cars, although exhaust emissions of NOx and particulates are much lower than diesel
cars. This is due to the carbon monoxide and oxides of nitrogen being converted to less
harmful substances (water, nitrogen and carbon dioxide) when exhaust gasses pass
through the catalyst. Catalysts are also effective for hydrocarbons, aldehydes and carbon
monoxide.
When petrol cars without catalysts are compared to petrol cars with catalysts, catalyst cars
have much lower carbon monoxide, hydrocarbon and oxides of nitrogen emissions, but
higher carbon dioxide emissions due to the oxidation of carbon monoxide.
Alternatively fuelled vehicles that produce fewer emissions can make an important
contribution to reducing air pollution in urban areas. Many new vehicles are being produced
which are dual fuelled so they can run on petrol and gas. Electric vehicles, which are
becoming more widely available, produce no emissions at point of use, and while they have
a limited range they are ideal for short trips around towns and cities.
Funding Programmes for Cleaner Vehicles
Government provides funding to the Energy Savings Trust’s Transport Action programmes
“Powershift” and “CleanUp”, which are complementary programmes. Powershift aims to
create a sustainable market in the UK for new, mainly small vehicles (cars and vans) that
run on clean fuels. CleanUp focuses on reducing the emissions of larger diesel vehicles
over 3.5 tonnes (such as lorries, buses, emergency vehicles and refuse trucks) and black
cabs, either by converting their engines to run on natural gas or by fitting emissions
reduction equipment such as particulate traps to the exhausts of diesel vehicles.
Spelthorne Borough Council Air Quality Strategy: Action Plan
Page 66 of 105 January 2005
• The Powershift programme was originally launched in 1996, and will continue until self-
sustaining clean fuel vehicle markets have been established. For the 3-year period 2001 to
2004, Powershift's budget is £33m. Powershift has helped to increase the number of
cleaner vehicles on the road. There are now over 750 Compressed Natural Gas vehicles
and around 20,000 Liquid Petroleum Gas vehicles registered in Britain. The program
makes provision for grant funding for vehicles having engines that have been produced to
Euro II, Euro III or Euro IV emissions standards. For passenger cars and car-derived vans,
this means that most vehicles manufactured since January 1997 might be eligible. For
larger vans most vehicles manufactured since January 1998 might be eligible. One
condition of grant funding is that vehicle must be included on the ‘PowerShift Register’.
• The CleanUp programme aims to improve air quality in the UK by encouraging the fitting of
emissions reduction equipment to the most polluting diesel vehicles. The programme
commenced in 2000, and money has been guaranteed until, at least April 2004. Over
1,700 vehicles have been fitted with emissions reduction technology to date through direct
funding by the CleanUp programme. Grant assistance is available for reducing the
emissions of larger diesel vehicles over 3.5 tonnes (such as lorries, buses, emergency
vehicles and refuse trucks) and black cabs, either by converting their engines to run on
road fuel gas or by fitting emissions reduction equipment such as particulate traps or
oxidation catalysts to the vehicle exhausts. CleanUp also supports the replacement of
older diesel engines with newer, cleaner engines (called 'repowering').
6.4.2 Cleaner Fuels
To replace pollutant fuels (petrol and diesel), cleaner alternative fuels are continually being
developed and produced to a higher specification with the specific aim of reducing
emissions from vehicles using them.
• City diesel is a petroleum-based lower emission diesel. Exhaust emissions from vehicles
fuelled with city diesel compare favourably with exhaust emissions from equivalent vehicles
fuelled with conventional diesel. The main benefit of city diesel is that its combustion
reduces particulate emissions by 34 - 84% depending on engine type and type of
particulate measured. An additional benefit of city diesel is that it is a low sulphur fuel,
which is necessary for the optimum running of oxidation catalytic converters.
• Low benzene petrol (trade name) has less benzene than conventional petrol.
• Liquid petroleum gas (LPG) is cleaner than petrol or diesel. It is suitable for vans and light
goods vehicles. While LPG is 25% less efficient than conventional fuels, it’s about 30%
cheaper and much cleaner in terms of producing far less emissions when compared to
petrol or diesel. For light goods vehicles emissions are reduced by in excess of 20% for
carbon monoxide, 30% for oxides of nitrogen, and by over 40% for hydrocarbons. Where
used in heavy goods vehicles, the reductions are much greater; carbon monoxide
emissions are reduced by over 90%, hydrocarbons by over 80% and oxides of nitrogen by
over 60%. There are virtually no particle emissions from LPG engines.
• Compressed natural gas (CNG) is also cleaner than petrol or diesel, and is suitable for
heavy goods vehicles due to the size of tank required to hold the fuel. By comparison with
diesel, heavy goods vehicles running on CNG produce 50% less carbon monoxide, 85%
less oxides of nitrogen, and nearly 70% less particle emissions. CNG reduces emissions
Spelthorne Borough Council Air Quality Strategy: Action Plan
Page 67 of 105 January 2005
of other pollutants such as hydrocarbons and sulphur dioxide.
• Hydrogen can be used to power fuel cells using catalytic energy release. It is the cleanest
of all the alternative fuels since it produces only water as a by-product. Fuel cells are still at
the prototype stage and are extremely expensive to produce, although there is a great deal
of research currently focused on fuel cell technology, in particular, how this technology can
be mass produced at a cost which is reasonable to the consumer.
Financial Relief for Cleaner Fuel Use
Vehicle Excise Duty (VED) is graduated for all new cars from March 2001 and a company
car tax relief system, with discounted rates are given for cars that run on cleaner, alternative
fuels. In 1999, VED for buses and lorries meeting stringent particle emission standards was
cut by up to £500 to encourage bus and lorry operators to use cleaner vehicles. Older
vehicles are able to meet the tighter standards by retrofitting the vehicle with a particulate
trap, or a new engine of a higher standard, or converting to gas. So far, over 40,000
vehicles have qualified for this concession. In 2001 a VED cut introduced for HGV’s,
bringing UK rates down to among the lowest in Europe for the cleanest lorries. Plans have
been announced for the introduction of new lower VED rates for lorries meeting latest Euro-
IV standards from around 2004 (LAQM.G3(00)).
6.4.3 Spelthorne’s Plan to Encouraging use of cleaner vehicles
One of the principle means of encouraging vehicle owners and drivers to use cleaner fuels
is to increase their availability. At this present time there are currently no commercial filling
stations for LPG in the borough, accordingly the Spelthorne Borough Council will encourage
all petrol companies that have stations in the Borough to supply LPG, and any new
developments to consider the installation of LPG filling facilities where appropriate.
As previously stated, electric vehicles produce no emissions at their point of use and are
ideally suited to people and businesses that mainly drive locally. As electric vehicles only
have a range of about 60 miles before the need for recharging, it is important to ensure that
there are sufficient charging points available throughout the borough to allow charging.
Spelthorne Borough Council will encourage local companies to use electric vehicles and
make provision for the installation of recharging points within their premises. In addition, the
Spelthorne Borough Council will encourage new developments, were appropriate, to make
provision for recharging points.
Action – Road Emissions 19
Spelthorne Borough Council will promote the use of “cleaner technology
and fuels” within Spelthorne.
Spelthorne Borough Council Air Quality Strategy: Action Plan
Page 68 of 105 January 2005
6.4.4 Business Travel Plans - Local businesses
Spelthorne Borough Council in association with Surrey County Council will actively
encourage and promote the implementation of Business Travel Plans by local businesses.
This will be through direct contact with local businesses, and through representatives of
local businesses, such as Spelthorne’s Chamber of Commerce and Staines Town Centre
Management.
Communication with local businesses will be through meetings, mail shots, and newsletters.
Such opportunities will be used to inform businesses of the environmental impact of vehicle
fleets, the need for improvements in emissions, and availability of funding through the
Energy Savings Trust’s Transport Action programs and the reduced Vehicle Excise Duty for
cleaner vehicles.
Action – Road Emissions 20
Spelthorne Borough Council in association with Surrey County Council will
promote the development and implementation of “business travel plans” by
companies located within the borough of Spelthorne.
Spelthorne Borough Council Air Quality Strategy: Action Plan
Page 69 of 105 January 2005
6.5 Reducing emissions from the Council’s Activities
6.5.1 Spelthorne’s Business Transport Plan (SBTP)
The Council agreed Spelthorne’s Transport Plan in February 1999. The Plan sets the
framework by which we can all manage our travel needs - getting to work and at work - in a
more efficient and environmentally friendly way. It seeks to reduce car dependency and
facilitate transport choice by encouraging alternatives to car use along with changes in
working arrangements. The vision of the SBTP is to:
• Reduce congestion, pollution, the number of accidents, and staff stress;
• Work more efficiently;
• Improve the motivation of people at work; and
• Build a healthier environment and a more successful economy for all.
The Spelthorne Borough Council is committed to a Company Transport Plan for the Council
and its employees. The general principles of Spelthorne's Company Transport Plan have
been endorsed by UNISON on behalf of staff and agreed by the Council in February 1999.
It is acknowledged that such a Plan can only be successful if supported by everyone at all
levels throughout the organisation. The aims of the Plan are “to manage the travel needs of
our staff in a more effective and environmentally friendly way”, by:
• Promoting the use of alternatives to car travel either by different modes of travel or by
different ways of working.
• Reducing car journeys to work and work related car usage by staff by 20% in
2 years and 30% in 5 years.
• Setting an example to other employers in the area and encourage them to adopt similar
plans.
• To make staff aware of the challenges and encourage them to consider their means of
transport getting to their workplace and carrying out their duties.
There are 3 main strands to the approach adopted: (i) Working arrangements; (ii) Promoting
alternatives to car travel; and (iii) Promoting less car use.
Working Arrangements
There is scope to influence the number of journeys to work and the time of day at which they
are made. For example:
(i) Make changes to the flexitime system - by extending the flexible working hours with an
earlier start and later finish time (7.30am to 7.30pm) and removal of core hours. This would
encourage travel to work at less congested times of day. Allowing staff to take two flexi
days per four-week period and an increased maximum carry over of hours per period could
lead to less travel days per year.

Spelthorne Borough Council Air Quality Strategy: Action Plan
Page 70 of 105 January 2005
(ii) Consider Home Working Arrangements - current technology enables people to work from
home, where previously this was not possible. Not all posts lend themselves to home
working; nevertheless there are a number of posts where a certain amount of work can be
done from home without detriment to either the standard of work or service to the customer.
A separate policy on eligibility for home working will be produced to complement this plan.
(iii) Make better use of all of our accommodation - although the Borough Council has
accommodation around Spelthorne, staff based at Knowle Green need to return here for
administrative purposes. Greater use will be made of all Borough Council accommodation
and new technology so as to reduce the need to travel to and from Knowle Green through
improved communication.
Pilots for (i) and (ii) above were introduced in 1999 as a way of assessing the strengths.
Promoting Alternatives to Car Travel to Work
Most staff travel to their work place by car (even though about half of staff live in the
Borough or have journeys less than 4 miles from their workplace). As a means of promoting
alternatives to car travel the Council will
• Provide interest-free season ticket loans - it is already Council policy to provide these, but
the scheme will be more widely promoted;
• Provide bus and train information - to ensure accurate travel information is available;
• Encourage cycling - In the past, little encouragement has been given to people to cycle to
work by the Borough Council. The provision of good quality cycle storage, showers /
changing rooms and interest-free loans for purchase of cycles (coupled with negotiated
discounts for purchase from local suppliers) will be evaluated in the light of cost and likely
usage. Depending on the outcome, a campaign to promote cycling will be launched;
• Promote walking - many work journeys are less than a mile and can easily be made on
foot.
Promoting less Car Use
The Council accepts that some members of staff do need to travel to work by car or use a
car for their work. However, there is still scope to reduce the amount of car usage.
Measures include:
• Reviewing the car leasing scheme to make it more environmentally friendly, including a
financial incentive to staff to reduce the size of car, offering a travelling allowance to staff as
an alternative to car leasing;
• Reviewing the car allowance scheme to discourage high mileage;
• Reviewing working arrangements to consider work practices such as reporting in to the
Knowle Green office first thing in the morning, after lunch and in the evening; use of
modern equipment. Some journeys would be unnecessary as well as leading to a more
efficient and quicker service for the customer;

Spelthorne Borough Council Air Quality Strategy: Action Plan
Page 71 of 105 January 2005
• Introducing a car sharing system through a register for those interested plus a guarantee of
a lift home to anyone let down by a car share arrangement or who needs to make an
emergency trip home, amending the current home relocation scheme to reduce length of
journeys into work (reduce present 30 mile radius to 20 miles);
• Phasing out the lunchtime car-parking pass in Staines;
• Other initiatives that could be looked at in the light of any Central Government measures
could include (a) car-park charging at the place of work, and
(b) departmental targets for reduction of car mileage
The Future
It is hoped that other initiatives will be forthcoming, subject to further consultation with staff
and negotiation with Unison as appropriate. A taskforce has been set up to look at further
initiatives as well as promoting the current Plan. This plan will be reviewed in the light of
experience gained through the implementation of the various pilots, increased awareness
and any further Central Government measures, and no later than 12 months after the
implementation of this policy.
Action – Reducing emissions from the Council’s Activities 1
Spelthorne Borough Council will continue to seek to reduce car
dependency and facilitate transport choice by encouraging alternatives to
car use along with changes in working arrangements.
Action – Reducing emissions from the Council’s Activities 2
Spelthorne Borough Council will review its Business Travel Plan within 12
months.

Spelthorne Borough Council Air Quality Strategy: Action Plan
Page 72 of 105 January 2005
6.5.2 Reducing Emissions from Spelthorne Fleet Vehicles
The Spelthorne Borough Council operates a diverse range of vehicles in the performance of
its activities; these range from small vans, trucks through to refuse collection vehicles and
road sweepers. The current Council fleet contains a large number of vehicles that are pre-
Euro I, and Euro I emission standards. The Council has provided for the reduction of
emissions by ensuring that vehicles using cleaner fuels will progressively replace the fleet,
and where appropriate and cost effective, the use of alternatively fuelled vehicles will be
considered.
Table 6.8: Spelthorne Borough Council’s Fleet Vehicles
Total No Vehicle Type Breakdown
No Fuel Type* Standard
7 Refuse Collection (LGV's) 3 Diesel Pre-Euro
4 Diesel Euro II
15 Street Cleansing 4 Diesel Pre-Euro
9 Diesel Euro II
2 Diesel N/A
3 Citroen Berlingo Van 3 Diesel Euro II
1 Vauxhall Movano Van 1 Diesel Euro II
1 Volvo Whale Tanker 1 Diesel Euro II
5 Citroen Dispatch Chefmobil 5 Diesel Euro II
2 Vauxhall Novas 2 Petrol Pre-Euro
1 Ford Fiesta 1 Petrol Euro I
7 Ford Transit 190D 1 Diesel Pre-Euro
(16 seat bus) 2 Diesel Euro I
4 Petrol Pre-Euro
2 Renault Master T35D 1 Diesel Euro I
(16 seat bus) 1 Diesel Euro II
1 LDV 400 Convoy D 1 Diesel Euro I
(16 seat bus)
2 Volkswagen 31 2 Petrol Pre-Euro
(16 seat bus)
1 Leyland DAF 400 D 1 Diesel Pre-Euro
(16 seat bus)
1 Ford Transit 190 2.5 D 1 Diesel Pre-Euro
1 Vauxhall Combo Van 1.7 1 Petrol/LPG
(duel Fuel)
* All diesel vehicles are run on ultra low sulphur diesel
The environmental performance of the fleet will be one of the criteria used to evaluate future
tenders. All new contracts which will end before 2005 will therefore specify that 50% of the
vehicle fleet should meet as a minimum Euro II emission standards with particulate traps
fitted. The remaining 50% should meet Euro III emissions or higher. These standards will
be reviewed each year. By the end of 2005 all contracts will specify Euro III emissions or
higher, since December 2005 is the deadline for meeting the NO2 objective.
In addition to those vehicles provided by contract, other vehicles operated by the Spelthorne
Borough Council will be brought up to the minimum Euro II standard by 2005 by the

Spelthorne Borough Council Air Quality Strategy: Action Plan
Page 73 of 105 January 2005
retrofitting of emission control devices (both for particulates and gasses). Help with the
funding for the retrofits will be sought from the Energy Savings Trust who is able to provide
up to 75% of the funding. Once the traps are fitted, the vehicle will also qualify for a reduced
pollution certificate and a reduction in the Vehicle Excise Duty.
The Spelthorne Borough Council is considering the replacement of vehicles that are 7 years
or older. All new vehicles purchased will be required to meet Euro III emissions as a
minimum, additionally, where appropriate, the use of alternatively fuelled vehicles will be
considered.
Action – Reducing emissions from the Council’s Activities 3
All new fleet vehicles purchased by Spelthorne Borough Council will be
meet Euro III emissions as a minimum, additionally, where appropriate, the
use of alternatively fuelled vehicles will be considered.

Spelthorne Borough Council Air Quality Strategy: Action Plan
Page 74 of 105 January 2005
6.6 Actions to reduce NO2 emissions resulting from activities at Heathrow Airport
Based upon information provided by the Heathrow Airport Emissions Inventory, 11% of the
total NOx emissions from road vehicles are due to traffic flows throughout the borough of
Spelthorne known to be associated with activities associated with Heathrow Airport,
accounting for 22% of the total NOx emissions emitted by activities associated with
Heathrow Airport.
The remaining 78% of the total NOx emissions emitted by activities associated with
Heathrow Airport are airport related emissions from within Spelthorne only; that is, airborne
aircraft and road traffic only. It does not take into account airport related sources outside the
borough, such as the ‘on-airport’ sources such as taxiing, airside vehicles etc. The
contribution to the annual average concentrations of NOx from each road group varies
depending on the receptor location considered.
6.6.1 Scenario Modelling: Reduction of 50% in airborne aircraft emissions
The predicted annual average concentrations of NOx and NO2 for the scenario of reducing
emissions from airborne aircraft by 50% are presented in Tables 6.9 and 6.10, respectively.
Table 6.9: Predicted annual average NOx concentrations for 50% reduction in airborne
aircraft emissions and “do nothing” Annual average NOx concentration (µg/m³)
Existing Scenario Difference % Reduction
Yeoveney Close 77.4 76.7 0.7 1 Horton Road 69.8 68.2 1.6 2 Bedfont Road 59.9 55.4 4.5 8 Vicarage Road 67.2 66.2 1.0 1 Shepperton Court Drive 60.6 60.0 0.6 1 London Road 48.6 44.8 3.7 8 Clarence Street 71.5 70.8 0.7 1 Kingston Road 56.0 54.9 1.1 2 Feltham Road 59.7 58.4 1.3 2 Clare Road 49.4 46.9 2.5 5
Table 6.10: Predicted annual average NO2 concentrations for 50% reduction in airborne
aircraft emissions and “do nothing”
Annual average NO2 concentration (µg/m³)
Existing Scenario Difference % Reduction
Yeoveney Close 45.0 44.7 0.3 1 Horton Road 42.4 41.7 0.7 2 Bedfont Road 38.3 37.0 1.3 3 Vicarage Road 43.1 42.8 0.3 1 Shepperton Court Drive 37.0 36.9 0.2 0 London Road 33.1 31.9 1.2 4 Clarence Street 40.3 40.0 0.3 1 Kingston Road 38.6 38.3 0.3 1 Feltham Road 40.0 39.6 0.5 1 Clare Road 34.1 33.3 0.8 2
Spelthorne Borough Council Air Quality Strategy: Action Plan
Page 75 of 105 January 2005
The predicted reduction in annual average NO2 concentrations due to a 50% reduction in
airborne aircraft emissions ranges from zero at Shepperton Court Drive to 4% at London
Road.
6.6.2 Working in Partnership
While local authorities have no legal powers over aircraft movements, they can enter into
agreements with airport operators for the reduction of emissions resulting from airport
operations. For this reason a number of groups have become established to facilitate this.
• The “Heathrow Airport Transport Forum” has been established specifically to develop
strategies to make surface access to Heathrow Airport more sustainable by improving its
integrated public transport systems. A key aim of the forum is to have 40% of passengers
arriving and departing by public transport. Members of the airport transport forum include
BAA, surrounding local authorities (including Spelthorne), bus, train and airline operators.
• The “Dispersion Modelling of Emissions Arising from Aircraft Operations at Heathrow
Airport” steering group has also been established. The main aim of this group is to
establish protocols for the modelling and monitoring of emissions emanating from aircraft
operations at Heathrow Airport. Members of the group include BAA, surrounding local
authorities (including Spelthorne), aircraft operators, aircraft engine manufacturers,
academic institutions, DEFRA, and DfT.
• The Heathrow Air Quality Working Team, consisting of BAA’s Environment team and the
Air Quality Officers of the 4 surrounding local authorities, meet on a regular basis to discuss
issues such as the development, review, and implementation of Heathrow Airport’s “Air
Quality Action Plan”; which is required under a Condition of planning permission granted for
Terminal 5 under the Town and Country Planning Act 1990. (Can be viewed on BAA’s
website at http://www.baa.co.uk).
• In addition to the above-mentioned action plan, BAA must also produce an inventory of all
the emissions caused by activities associated with Heathrow Airport. This emissions
inventory is reviewed on a regular basis. The 4 surrounding local authorities, as well as
BAA, use the emissions inventory in their air quality review and assessment work.
Consequently, the content of the Heathrow’s emissions inventory is an area of ongoing
discussion and work for BAA and the 4 local authorities.
Action – Heathrow Emissions 1
Spelthorne Borough Council will continue to work to in partnership to
minimise the impacts on air quality caused by the activities of Heathrow
Airport air.

Spelthorne Borough Council Air Quality Strategy: Action Plan
Page 76 of 105 January 2005
6.7 Reducing Air Pollution through Land Use Planning
The Government documents ‘Planning Policy Statement 23: Planning & Pollution Control’,
and the ‘Local air quality management Guidance (LAQM.G4(00))’ states that “the land use
planning system is central to improving air quality and minimising the adverse effects of
potential pollution on present and future land”. When preparing local plans or assessing
how a proposed development may affect air quality, Local Planning Authorities, Local
Transport Authorities and Pollution Control Authorities are advised to work together to
ensure development has a beneficial impact on the environment, taking account of the
NAQS objectives, the results of air quality ‘review and assessments’, and the content of air
quality action plans. Where a development is likely to significantly affect air quality such that
the NAQS objectives are likely to be exceeded, it does not necessarily follow that the Local
Planning Authority should refuse all development proposals within that area. In such
instants where practicable, the above-mentioned authorities must work together to secure
mitigation measures that would allow the proposal to proceed.
6.7.1 The Local Plan
Each Local Planning Authority must produce a Local Development Framework for its area.
This sets out the council's policies and proposals for how land within its area is used and
developed over a period of up to 10 years in the future. These plans provide developers
and local people with a clear idea of the types of development that would and would not be
acceptable in particular parts of their area. Decisions on planning applications and appeals
must be made in line with the development plan, unless there are very good reasons to do
otherwise.
Government guidance (PPG3) requires local planning authorities to build in ways that
"exploit and deliver accessibility by public transport to jobs, education and health facilities,
shopping, leisure and local services". PPG3 also requires local authorities to "place the
needs of people before ease of traffic movement in designing the layout of residential
developments" and to "seek to reduce car dependence by facilitating more walking and
cycling, by improving linkages by public transport between housing, jobs, local services and
local amenity, and by planning for mixed use". To facilitate this planning policy guidance
advises local authorities to make maximum use of the most accessible sites, such as those
in town centres and others that are, or will be, close to major transport interchanges. These
opportunities may be scarce. They should be pro-active in promoting intensive development
in these areas and on such sites.
Spelthorne Borough Council’s main planning policy is set out in the Local Plan
(www.spelthorne.gov.uk). Policy M1 commits Spelthorne Borough Council to work with
Surrey County Council to “use all appropriate measures to manage and control the demand
for travel by car in order to secure environmental improvements, improve safety, and reduce
congestion and pollution”. Policy M1 identifies the mechanism by which this will be
achieved as being:-
(a) Encouraging the use of public transport, cycling or walking
Spelthorne Borough Council Air Quality Strategy: Action Plan
Page 77 of 105 January 2005
(b) Implementing appropriate calming and traffic management measures to contain the use and impact of cars and give positive advantage to other forms of transport
(c) Bringing forward specific schemes to assist public transport
(d) Refusing developments with significant extra movement implications where there is not an overriding need or where a more appropriate location e.g. town centre may reduce the movement implications to an acceptable level. Proposals for development will be encouraged to locate close to public transport facilities.
While currently there are no policies that
deal specifically with air quality, the Local
Plan is due to be revised in 2006 and
replaced by a new Development
Framework, at this time policies in respect
of air quality will be enhanced to ensure
the continued improvement and protection
of air quality.
6.7.3 Supplementary Planning Guidance: A Parking Strategy For Surrey
Surrey has some of the most congested roads in the country. It is difficult to travel around
the County not only during peak hours but increasingly off peak as well. Pollution levels are
high, and the environment in many town centres is unacceptable due to traffic.
Consultations and surveys conducted on behalf of Surrey County Council show this to be a
key concern of Surrey residents. The cost of congestion is also a major concern to the
business sector.
It is impossible to provide enough road space in Surrey for all the cars that want to use our
roads, particularly in town centres. Ways have to be found to discourage the use of the car
where possible. Nationally, the Transport White Paper and Planning Policy Guidance
(PPG13) on Transport set out a number of initiatives to control the demand for travel.
Locally, the County Council has produced a Local Transport Plan, which sets out our own
initiatives. These initiatives in particular focus on providing alternatives to the use of the car
(see section 6.3.1). Alongside that, one of the main ways of gaining some control over car
use is the regulation of parking provision. Surrey County Council has therefore responded
to public concerns by developing a parking strategy in conjunction with the Surrey District
Councils.
The strategy aims to complement policies to reduce traffic growth by limiting the availability
of parking spaces and managing the overall supply to better meet priority uses. In this way,
parking management supports policies to promote economic development and support town
centres by reducing the levels of congestion. The objectives of the strategy are to:
• Manage travel demand through integrated planning ~ integrate transport and land use at all
Action – Land Use Planning 1
Spelthorne Borough Council will ensure that
the new Development Framework
incorporates planning policy that will not
adversely impact air quality, but furthermore,
enhance air quality where possible.

Spelthorne Borough Council Air Quality Strategy: Action Plan
Page 78 of 105 January 2005
levels, so that transport and planning work together to support more sustainable travel
choices and forms of development;
• Reduce the need to travel ~ make an effective contribution to reducing unnecessary travel
by locating major traffic generators in existing centres where they can be reached without
needing a car;
• Introduce restraint-based parking standards ~ avoid the over-provision of parking spaces
by the replacement of minimum with maximum parking standards consistent with the
restraint of car use and the intensification of development;
• Sustain and enhance the vitality of town centres ~ transport policies should support the
prosperity of town centres by providing a balance of good public transport and short stay
parking and by reducing congestion;
• Effectively manage the total parking supply ~ parking management plans should include all
types of parking and consider short stay priorities, regulation, charging and enforcement.
• Encourages a reduction in workplace parking, particularly by promoting alternatives to the
car, for example, through Travel Plans;
• Enables consistent local parking management plans to be developed by Districts through
an approach that reflects the diversity of conditions and required solutions;
The parking strategy also meets a number of objectives of the County Council’s Common
Agenda for Sustainable Development since it addresses longer-term concerns about the
growth in congestion and pollution.
The Strategy covers all aspects of parking across Surrey. It provides a framework within
which the District Councils are producing their own parking management plans, covering the
more detailed issues. Parking management plans form an important element of the
implementation of the Local Transport Plan. To do this, the County strategy reviews the
current parking standards, and proposes the application of new standards based on four
parking area packages. Each area package has different levels of parking provision
depending on the type of centre. It is for District Councils to decide where the boundaries of
the parking area packages areas should be, based on the criteria set out in the strategy. In
some areas, Districts may also decide to amalgamate the third and fourth package into one
parking package area where local circumstances suggest this would provide clearer, more
defensible boundaries.
The County Council is responsible for matters of overall policy and strategy, which includes
the definition of maximum parking standards for new developments. District Councils are
responsible for off street parking management within their areas and it is intended that they
implement the strategy through the preparation of local parking management plans. It is
intended that the strategy will be included as appropriate within Districts’ adopted Local
Plans.
The implementation and monitoring of the strategy at all levels will be co-ordinated through
the County Council’s Local Transport Plan and District Council’s Local Plans. In preparing
local parking management plans, the District Councils will consider where the boundaries of

Spelthorne Borough Council Air Quality Strategy: Action Plan
Page 79 of 105 January 2005
the parking package areas should lie based on the criteria provided and their local
knowledge. They will also consider whether the implementation of the strategy needs to be
phased to safeguard the vitality and viability of town centres, and to enable development
patterns to reflect potential improvements to public transport services, for example through
green travel plans. This phasing could mean that areas are placed in a more generous
parking band until public transport or economic improvements allow it to be moved into the
next band where less parking is allowed. If local authorities are intending to phase the
introduction of the parking standards in this way, a clear review process and associated
timetable will be specified.
Further information on the Surrey parking strategy can be found by using the search facility
on Surrey County Council’s website (http://www.surreycc.gov.uk).
6.7.3.1 Parking Standards in Spelthorne
In 2001, Spelthorne Borough Council produced supplementary planning guidance in support
of Policy M8 of the Spelthorne Borough Local Plan 2001. The standards were prepared in
consideration of Government guidance in PPG13 (Transport) and RPG9 (Regional Planning
Guidance for the South East) and Surrey County Council’s parking strategy. They also take
account of surveys of parking demand in residential and commercial developments in the
Borough. All development proposals with borough of Spelthorne that affect parking
provision within existing developments will be considered against these parking standards.
The standards define the maximum acceptable provision for most common forms of
development. Provision above this level is not normally permitted, except only in special
circumstances and at the discretion of the planning authority. A minimum requirement is not
normally imposed unless under-provision would result in road safety implications that cannot
be resolved through the introduction or enforcement of on-street parking controls. However,
car-parking provision below the maximum standard is required in areas well served by
public transport, particularly town centres.
In determining the appropriate scale of reduction on the maximum standard regard is had
to:-
• The existing accessibility of the site by non car-based modes of travel;
• Any committed proposals to improve the accessibility of the site by non-car-based modes
of travel, including relevant provisions of Business Travel Plans accompanying
development proposals;
• The existence of measures to control on-street parking in the vicinity of the site, including
measures secured as part of development proposals;
• In the case of business development, the extent of any essential car user requirements
necessary for the operation of the business;
• The business standards include specific consideration of development in the commercial
area of Staines town centre.
Where improvements in accessibility by non car-based modes, or controls over on-street

Spelthorne Borough Council Air Quality Strategy: Action Plan
Page 80 of 105 January 2005
parking are necessary to enable a development to go ahead, then development proposals
are expected to either contribute to the cost of such improvements, or to incorporate specific
improvements into the development.
Further information on the Spelthorne’s parking standards can be found by using the search
facility on Spelthorne Borough Council’s website (http://www.spelthorne.gov.uk).
6.7.2 Local Development Control
In consideration of the above Guidance and that provided within Planning Policy Statement
(No. 23) on Pollution Control, the Spelthorne Borough Council, through its function as the
Local Planning Authority, will take air quality into account as a material consideration where
development may have an adverse impact upon air quality. Therefore, where appropriate,
the following measures will used to guard against further deterioration of air quality within
the borough that may arise from the impacts of development.
• Where development may have a significant impact on air quality, either due to processes
carried out or potential traffic generation, the applicant will be expected to carry out an
assessment of the likely impacts.
• Where the assessment shows that there is likely to be a harmful impact on air quality OR
that the development could harm attempts to bring about necessary improvements to air
quality to meet national standards, developers will be expected to incorporate mitigation
measures into the development and demonstrate that the proposed measures will reduce
impacts to an acceptable level. Such measures could include controls or modifications to
production processes, or measures to reduce traffic generation including support for non-
car based modes of travel, business travel plans, and parking restrictions.
• Where it appears to the Council that harmful impacts on air quality cannot be overcome by
mitigation measures then the Council may refuse planning permission on air quality
grounds.
All applications for development inside AQMA’s must be supported by sufficient information
to allow a full consideration of their likely impact on local air quality. It is therefore important
that developers are aware of the existence of any AQMA’s.
In certain circumstances it may be appropriate
for the developer to fund mitigation measures
elsewhere inside the AQMA to offset any
increase in local pollutant emissions as a
consequence of the proposed development, or to
pay for the purchase of monitoring equipment.
Where appropriate, these measures will be
introduced through section 106 agreements.
Action – Land Use Planning 2
Spelthorne Borough Council will
ensure that the future development of
land will not adversely impact on air
quality.
Spelthorne Borough Council Air Quality Strategy: Action Plan
Page 81 of 105 January 2005
6.8 Regulation of Industrial sources
Industrial sources account for 1% of the total NOx emissions within the borough of
Spelthorne.
Since 1990, in order to control the emission of specific pollutants to the environment, certain
industrial processes (known as prescribed processes) require an operator’s licence before
they can be operated. These prescribed processes are regulated under Part I of the
Environmental Protection Act, Part I, with the Environment Agency being responsible for the
regulation of larger industries (known as Part A processes) and local authorities being
responsible for regulating smaller industrial processes (known as Part B processes). At this
present time there are 21 ‘Part B’ processes (15 of which are petrol filling stations) and no
‘A1 or A2’ processes within the Borough.
The regulation of ‘prescribed processes’ by local authorities and the Environment Agency is
progressively being transferred to the provision of the Pollution Prevention and Control Act
1999, bringing the UK in line with European legislation. The introduction of this new
legislation within the borough of Spelthorne is unlikely to have any significant impact on the
number of industrial processes, or the manner in which they are regulated.
With the advent of the Solvents Emissions
Regulations, the release of solvents to the
atmosphere is also now controlled. Within
the UK the requirements of these new
Regulations are largely being implemented
through Part 1 of the Environmental
Protection Act 1990 and the Pollution
Prevention and Control Act 1999.
Action – Industrial Sources 1
The Borough of Spelthorne will continue to
ensure that emissions from all ‘prescribed
processes’ remain tightly controlled and
regulated in line with National Policy.

Spelthorne Borough Council Air Quality Strategy: Action Plan
Page 82 of 105 January 2005
6.9 Smoke & Bonfire Control
6.9.1 Smoke Control Areas
Nearly the whole of the borough of Spelthorne is designated as a Smoke Control area. This
means that smoke is prohibited from being emitted from chimneys from the burning of coal,
wood or other non-authorised fuels on open fires or in unauthorised stoves or boilers.
The Council does from time to time receive complaints about smoke nuisance where coal or
wood is burnt on open fireplaces. The Council
normally deals with these complaints by informing
the perpetrators that their actions are prohibited,
and this is normally sufficient to stop the practice.
However the Council retains the power to
prosecute offenders, and will do so if offences are
repeated.
6.9.2 Bonfires
Spelthorne Borough Council discourages the
disposal of green garden waste on bonfires and
instead promotes composting and offers free
collection of garden waste. Garden waste can
also be taken for composting at any of
Spelthorne’s waste transfer centres. Information
about these subjects is made freely available to
the public via the Spelthorne’s web site and in
leaflets available from the Council offices at
Knowle Green, or libraries throughout the borough.
Enforcement of Statutory Provisions for the Control of Smoke from bonfires
Statutory Nuisance
The Environmental Protection Act 1990 provides that smoke, smell or ash emitted from
premises can be a statutory nuisance and action can be taken in this matter. The Council
has legal powers to stop bonfires if a statutory nuisance occurs and may even prosecute
offenders. However, to be considered a nuisance a bonfire would have to be a regular
problem and interfere substantially with a neighbour’s well being, or the comfort and
enjoyment of their property.
There is no legislation to prohibit domestic bonfires
and therefore there is no prescribed time
considered appropriate for their use. Spelthorne
Borough Council provides the NSCA leaflet 'Good
Bonfire Guidelines' with recommendations for
appropriate and safe use of bonfires.
Action – Smoke Emissions 1
The Borough of Spelthorne will
continue to ensure that the Smoke
Control Areas within the Borough of
Spelthorne continue to be enforced.
Action – Smoke Emissions 2
The Borough of Spelthorne will
encourage the recycling of the
green waste generated in the
borough and discourage the
burning of domestic waste as a
means of waste disposal.
Action – Smoke Emissions 3
Spelthorne Borough Council will
enforce against bonfires that are
causing a statutory nuisance.

Spelthorne Borough Council Air Quality Strategy: Action Plan
Page 83 of 105 January 2005
Dark Smoke
The Clean Air Act 1993 makes it an offence to emit dark smoke from any trade or industrial
premises (including demolition sites and agricultural land). This offence also applies to any
material burnt in connection with any industrial or trade process and to the burning of
material likely to give rise to dark smoke.
Dark smoke is a shade of grey defined in law and
in order for the Council to take action in this
matter an authorised council officer would have to
witness the offence. However, there are certain
limited circumstances where burning material that
gives rise to dark smoke would not be regarded
as an offence.
Burning of Trade Waste
The Environment Agency use a number of different enforcement powers to control the
burning of waste on trade premises.
If a business wishes to dispose or treat any waste material on its premises it must have a
Waste Management License issued by the Environment Agency. Exemptions from this
licensing system relate to the burning of wood, bark and plant material at the site of
production provided fires do not cause persistent problems to neighbours. However, these
fires still have to be registered with the Environment Agency and it is an offence not to do
so.
If a bonfire at a commercial property located
within Spelthorne is reported to the Council,
the Council will pass the details of the bonfire
to the Environment Agency for their
enforcement as appropriate.
Action – Smoke Emissions 4
Where appropriate the Borough of
Spelthorne will use its enforcement
powers to control dark smoke from
bonfires.
Action – Smoke Emissions 5
Bonfires at commercial premises will be
passed to the Environment Agency for
enforcement purposes.

Spelthorne Borough Council Air Quality Strategy: Action Plan
Page 84 of 105 January 2005
6.10 Awareness raising, education and public information to promote air pollution issues
Without the engagement of the residents and business communities of Spelthorne this air
quality action plan will not succeed, consequently it would not be possible to achieve the
NAQS annual objective for NO2 with the borough of Spelthorne. It is therefore vital that the
public are provided with information that will allow them to make informed choices.
Information is currently provided on air pollution matters through the Spelthorne Borough
Council’s web site (www.spelthorne.gov.uk) and through the provision of leaflets on air
quality, health and transport. Spelthorne Borough Council will improve and enhance the
provision of air quality and related information through:
• The borough magazine “The Bulletin” is distributed to every household in the Borough.
Articles and information about local air quality issues will regularly feature in this magazine.
Information reported will include publicising: cleaner fuels and cleaner vehicle technology;
air quality campaigns; and the implementation of initiatives designed to improve air quality
within the borough of Spelthorne;
• Reporting on Spelthorne’s website and in the “Borough Bulletin” analysis of Spelthorne’s
local air quality trends and a comparison with air quality objectives.
• To promote Surrey County Council’s transport carried out within the borough Spelthorne,
for example, school and business travel plans.
Action – Raising Awareness and the Provision of Information 1
To raise the public’s awareness of initiatives that will improve the
quality of air within the borough of Spelthorne.

Spelthorne Borough Council Air Quality Strategy: Action Plan
Page 85 of 105 January 2005
6.11 Working in Partnership
Spelthorne Borough Council recognises the transboundary nature of air pollution, therefore
the Council understands the need to work with its neighbours in order to robust
assessments of air quality within the area, and likewise the successfully development,
implementation and management of an effective air quality action plan.
6.11.1 Local Authority Partners
The Council is committed to working with its neighbouring boroughs and Surrey County
Council for the improvement of local air quality:
• Spelthorne Borough Council participates in the “Surrey Air Quality Group” and the “Surrey
Air Quality Sub-Group”;
• Spelthorne Borough Council also works with the neighbouring local authorities, Slough
Borough Council, the London Borough of Hillingdon, and the London Borough of
Hounslow. This work includes working together for the development of consistent and
robust air quality review and assessments for the area covered by the 4 local authorities;
6.11.2 Non Local Authority Partners
Spelthorne Borough Council also works with a number of other partners to improve local air
quality. Two of these, the Highways Agency and Surrey County Council have already been
mentioned in the sections above. Others would include the “Heathrow Airport Transport
Forum”, the steering group for the “Dispersion Modelling of Emissions Arising from Aircraft
Operations at Heathrow Airport”, and the “Heathrow Air Quality Working Team”. Spelthorne
Borough Council will continue to work in partnership with these partners,
Spelthorne Borough Council will actively seek opportunities to work with organisations and
form new partnerships that will lead to the improvement of air quality within Spelthorne.
Action – Working in Partnership 1
Spelthorne Borough Council will continue to work, in partnership with
its neighbouring boroughs and others for the control of air pollution
and continued improvement of air quality.
Action – Working in Partnership 2
Spelthorne Borough Council will seek opportunities for effective
partnerships for the continued improvement of air quality.

Spelthorne Borough Council Air Quality Strategy: Action Plan
Page 86 of 105 January 2005
6.12 Proposed Extension of the Air Quality NO2 Monitoring Strategy
Following on from the Stage 4 Review and Assessment, it is essential that NO2 be
accurately and reliably monitored, as required by statutory guidance LAQM.TG(03). The
existing NO2 monitoring network will be extended so that:
• A better understanding of the air quality within the borough of Spelthorne can be
developed. As mentioned above due to the lack of monitored air quality data within the
borough of Spelthorne, computer-based models have generated all information relating to
the exceedance areas within the Borough. While these are commonly used and necessary
for predictive work, they do not produce results as accurate as real data.
• So that the Council can provide detailed information to the public and DEFRA in respect of
the air quality within the borough of Spelthorne.
• So that the Council can find cost-effective actions to reduce the impact of emissions from
road vehicles. Action for the improvement of air quality within an exceedance area should
be cost-effective, dealing with the least expensive but with the best rate of return (high NO2
reduction) first.
Nitrogen dioxide is currently monitored within Spelthorne Borough Council through a
network of 26 passive NO2 tubes sited at various locations through out the borough, 3 of
which are collocated with BAA’s automatic air quality monitoring station. The existing NO2
monitoring network will be enhanced by the addition of:
• The siting of at least a further 16 passive samplers at locations where members of the
public might reasonable be exposed to levels of NO2 predicted to exceed the NAQS
objective limits;
• The introduction of a continuous automatic monitor to be located where members of the
public might reasonable be exposed to levels of NO2 predicted to exceed the NAQS
objective limits;
• The introduction of two electrochemical NO2 sensors, each to be accompanied by a traffic
count logger system.
Action – Air Quality Monitoring 1
Spelthorne Borough Council will enhance the NO2 monitoring network
within Spelthorne in order to develop a better understanding of the air
quality within Spelthorne.
Action – Air Quality Monitoring 2
Spelthorne Borough Council will make available regularly updated
detailed information about the quality of air within Spelthorne on the
Council’s website (http://www.spelthorne.gov.uk).

Spelthorne Borough Council Air Quality Strategy: Action Plan
Page 87 of 105 January 2005
Action – Air Quality Monitoring 3
Spelthorne Borough Council will use the data obtained, in partnership
with Surrey County Council to find further cost-effective measures to
reduce emissions emanating from County maintained roads within
Spelthorne.
Spelthorne Borough Council Air Quality Strategy: Action Plan
Page 88 of 105 January 2005
6.13 Energy Efficiency within Buildings
Spelthorne Borough Council is committed to issues that are directly related to climate
change and reducing green house gases. Thus, energy efficiency flags out as one our main
priorities.
The recent (February 2002) House Condition and Energy Survey carried out indicates that
the total number of properties at risk of fuel poverty is 4648 or 12.1% of the total number of
households in the Borough. These figures will be further investigated and updated during
the forthcoming stock survey 2005-06.
Given the findings at both the National and Local levels, Spelthorne Borough Council has
adopted the following mission statement.
“To provide access to warmth, comfort and well-being of its residents and reduce the
percentage of households in fuel poverty. This will be achieved by raising awareness of its
effects, providing appropriate advice on access to grants and support to enable people to
reduce their fuel bills and achieve adequate warmth in their homes. We will also develop a
strategy to tackle ill health and eliminate early deaths caused by cold homes. We will
achieve this by developing partnerships with other organization both in the private sector
and the public sectors.”
In May 2001, the Council appointed a part time Energy Coordinator who reported directly to
the Energy Manager of the Council. The main duties of the officer were to raise awareness
of Energy Efficiency both internally and to the residents of the Borough. Since November
2002, the council has adopted a policy to investigate the potentials of introducing renewable
energy measures and raising the energy efficiency profile to both our building stock and that
belonging to the various housing associations in the borough. A number of initiatives have
already been implemented and others are being actively investigated. Those already in
place are:
• Energy Efficiency training for existing staff and coordinating with other stakeholders from
other agencies dealing with the elderly, particularly those attending the day centres;
• Launching a major exercise to record the whole borough current thermal status and
integrate the obtained database within our GIS system, using thermal imaging techniques.
The survey was executed in March 2003; the database will be finalised in 2004-2005.
• Successful bidding for several major governmental grants (e.g. major development grant,
EU LCIP, and community heating schemes), to introduce renewable energy measures into
the borough, (e.g. Photo voltaic and biomass).
• Adoption of a target of purchasing 25% of the Council’s electrical energy from renewable
sources by 2010, this target has already been surpassed and we are now buying 100% of
our electricity with a green tariff.
• Continue to improve environmental sustainability in areas over, which the Council has no
direct control or is in partnership with others.
• Workshop sessions at each of the day centres since October 2001 in conjunction with

Spelthorne Borough Council Air Quality Strategy: Action Plan
Page 89 of 105 January 2005
British Gas to the staff and the day centres users;
• Active participation in the all the regional and national bodies that are involved in energy
efficiency and renewables, in order to learn and tap into the available resourcing.
• Advertisements have been placed in year planners and diaries circulating locally publishing
the availability of grants and the Local Energy Efficiency Advice centre services; which is
currently working in partnership with the council.
• Publicity for new Warm Front scheme in the Council’s free publication the “Borough
Bulletin” distributed to all householders;
• Access to Warmer Homes initiative started with the Mayors Fund and British Gas funding in
partnership with Age Concern Spelthorne, Help with Aged, British Gas and the Borough;
• Promotional activities such as the Shepperton Fair and articles in the local papers and
Borough Bulletin;
• Targeted mail shot to customers on benefits from various grants and funds available
through relevant bodies (i.e. Energy Saving Trust, DTI, etc.).
Action – Energy Efficiency within Buildings 3 Link the Fuel Poverty Strategy to the weekly heating costs of properties occupied by vulnerable residents to a percentage of the state pension by 2010 start of the project 2008.
Action – Energy Efficiency within Buildings 1 Spelthorne Borough Council will establish the innovations programme; “Future Green”, which seeks to fund and promote energy efficient services and measures. Delivery timetable (2004-2007)
Action – Energy Efficiency within Buildings 4
Achieve the Home Energy Conservation Act (HECA) target of eradicating
fuel poverty by 2010.
Action – Energy Efficiency within Buildings 2
Utilize the results of the Borough thermal imaging survey to promote the
benefits and potential for energy efficiency in all sectors. Delivery timetable
2004-07
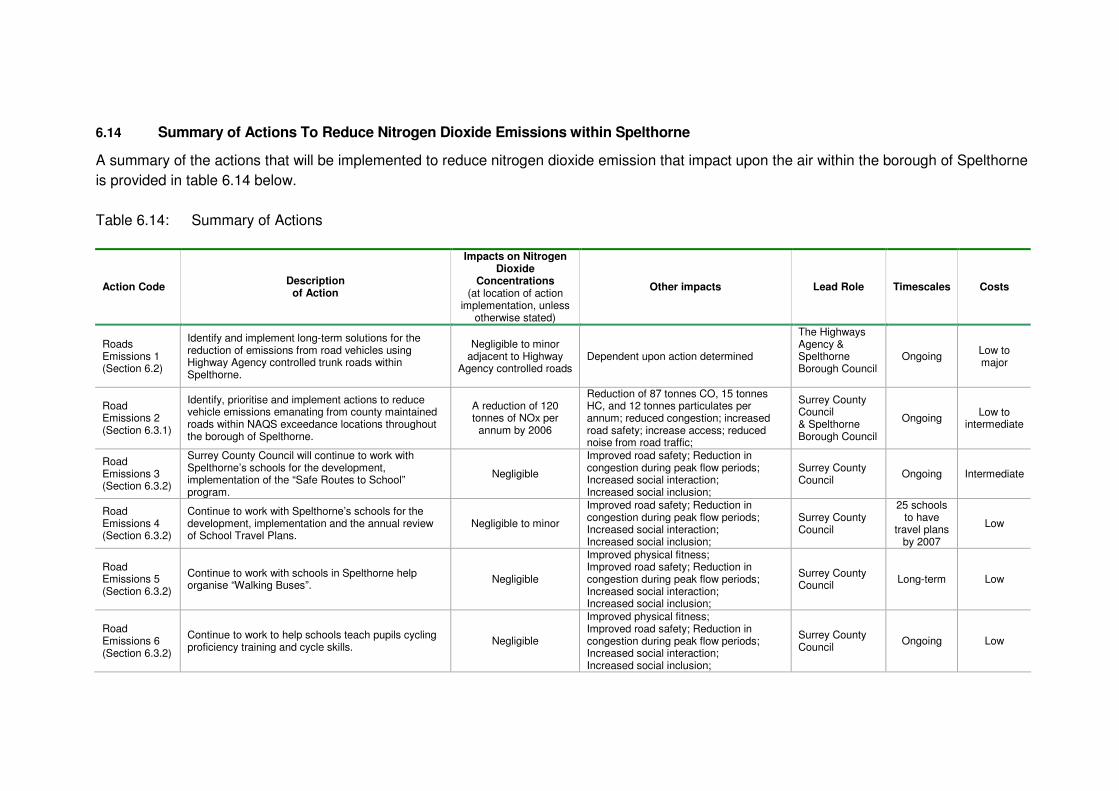
6.14 Summary of Actions To Reduce Nitrogen Dioxide Emissions within Spelthorne
A summary of the actions that will be implemented to reduce nitrogen dioxide emission that impact upon the air within the borough of Spelthorne
is provided in table 6.14 below.
Table 6.14: Summary of Actions
Action Code Description
of Action
Impacts on Nitrogen Dioxide
Concentrations (at location of action
implementation, unless otherwise stated)
Other impacts Lead Role Timescales Costs
Roads Emissions 1 (Section 6.2)
Identify and implement long-term solutions for the reduction of emissions from road vehicles using Highway Agency controlled trunk roads within Spelthorne.
Negligible to minor adjacent to Highway
Agency controlled roads Dependent upon action determined
The Highways Agency & Spelthorne Borough Council
Ongoing Low to major
Road Emissions 2 (Section 6.3.1)
Identify, prioritise and implement actions to reduce vehicle emissions emanating from county maintained roads within NAQS exceedance locations throughout the borough of Spelthorne.
A reduction of 120 tonnes of NOx per
annum by 2006
Reduction of 87 tonnes CO, 15 tonnes HC, and 12 tonnes particulates per annum; reduced congestion; increased road safety; increase access; reduced noise from road traffic;
Surrey County Council & Spelthorne Borough Council
Ongoing Low to
intermediate
Road Emissions 3 (Section 6.3.2)
Surrey County Council will continue to work with Spelthorne’s schools for the development, implementation of the “Safe Routes to School” program.
Negligible
Improved road safety; Reduction in congestion during peak flow periods; Increased social interaction; Increased social inclusion;
Surrey County Council
Ongoing Intermediate
Road Emissions 4 (Section 6.3.2)
Continue to work with Spelthorne’s schools for the development, implementation and the annual review of School Travel Plans.
Negligible to minor
Improved road safety; Reduction in congestion during peak flow periods; Increased social interaction; Increased social inclusion;
Surrey County Council
25 schools to have
travel plans by 2007
Low
Road Emissions 5 (Section 6.3.2)
Continue to work with schools in Spelthorne help organise “Walking Buses”.
Negligible
Improved physical fitness; Improved road safety; Reduction in congestion during peak flow periods; Increased social interaction; Increased social inclusion;
Surrey County Council
Long-term Low
Road Emissions 6 (Section 6.3.2)
Continue to work to help schools teach pupils cycling proficiency training and cycle skills.
Negligible
Improved physical fitness; Improved road safety; Reduction in congestion during peak flow periods; Increased social interaction; Increased social inclusion;
Surrey County Council
Ongoing Low

Spelthorne Borough Council Air Quality Strategy: Action Plan
Page 91 of 105 January 2005
Action Code Description
of Action
Impacts on Nitrogen Dioxide Concentrations
(at location of action implementation, unless
otherwise stated)
Other impacts Lead Role Timescales Costs
Road Emissions 7 (Section 6.3.2)
Install vehicle activated signs to control road traffic speeds at appropriate locations within Spelthorne.
Negligible Improved road safety; Reduction in congestion due to smoother traffic flow;
Surrey County Council
Long-term Low to
medium
Road Emissions 8 (Section 6.3.2)
Investigate the feasibility of installing variable message signs to provide travel advice information at appropriate locations in and around the borough of Spelthorne.
Negligible Improved public information & awareness; Improved road safety; reduction in road traffic noise;
Surrey County Council
Long-term Low
Road Emissions 9 (Section 6.3.2)
Implement decriminalised parking enforcement within the borough of Spelthorne
Negligible Improved road safety; Reduced congestion caused by blocked roads; improved journey times;
Spelthorne Borough Council & Surrey County Council
From 2005 Medium but self-funding after 5 years
Road Emissions 10 (Section 6.3.2)
Publicise the establishment of decriminalised parking enforcement within the borough of Spelthorne
Negligible Raising public awareness Spelthorne Borough Council
From 2005 Low
Road Emissions 11 (Section 6.3.2)
Investigate the feasibility of establishing controlled parking zones at various locations within the borough of Spelthorne
Negligible
Improved road safety; Reduction in congestion; Increased social interaction; Increased social inclusion;
Surrey County Council
Long-term Low
Road Emissions 12 (Section 6.3.2)
Carry out a feasibility study into the development of a lorry routing strategy.
Negligible to minor Improved road safety; Surrey County Council
Autumn 2004
Low
Road Emissions 13 (Section 6.3.2
To promote integrated public transport as a good alternative form of transport to the car and improve facilities at bus stops within Spelthorne
Negligible to minor
Improved road safety; Reduction in congestion; Increased social interaction; Increased social inclusion & accessibility
Surrey County Council & Spelthorne Borough Council
Long-term Low
Road Emissions 14 (Section 6.3.2)
Promote bus travel as a good alternative form of transport to the car and improve facilities at bus stops within Spelthorne.
Negligible
Improved road safety; Reduction in congestion; Increased social interaction; Increased social inclusion & accessibility;
Surrey County Council & Spelthorne Borough Council
From 2004 Low
Road Emissions 15 (Section 6.3.2)
Buses operating along critical corridors within the borough of Spelthorne will be encouraged to have Euro III compliant engines.
Negligible to minor Reduced particulates and some climate change gases
Surrey County Council
Ongoing Low
Road Emissions 16 (Section 6.3.2)
Bus prioritised infrastructure will be installed at strategic locations throughout Spelthorne.
Moderate
More reliable bus journey times; Increased social inclusion & accessibility; Reduction in climate change gases
Surrey County Council
From 2004 High
Road Emissions 17 (Section 6.3.2)
Increase the number of journeys made by cycle from 2% to 4% above 2001 base level.
Negligible
Improved physical fitness; Improved road safety; Reduction in congestion during peak flow periods; Increased social interaction; Increased social inclusion & accessibility; Improved choice;
Surrey County Council
2001 - 2006 Low to
medium

Spelthorne Borough Council Air Quality Strategy: Action Plan
Page 92 of 105 January 2005
Action Code Description
of Action
Impacts on Nitrogen Dioxide Concentrations
(at location of action implementation, unless
otherwise stated)
Other impacts Lead Role Timescales Costs
Road Emissions 18 (Section 6.3.2)
Introduce a linked, segregated cycle land between Chertsey Bridge and Walton Bridge Road.
Negligible
Improved physical fitness; Improved road safety; Reduction in congestion; Increased social interaction; Increased social inclusion & accessibility;
Surrey County Council
Road Emissions 18 (Section 6.3.2)
The production of a series of Cycle Guides that will detail all the cycle routes throughout Surrey.
Negligible
Improved physical fitness; Improved road safety; Reduction in congestion during peak flow periods; Increased social interaction; Increased social inclusion & accessibility;
Surrey County Council
Short-term Low
Road Emissions 19 (Section 6.4.1)
Promote the use of “cleaner technology and fuels” within Spelthorne.
Negligible to minor Reduction in emissions of other air quality pollutants; Increased travel choice
Spelthorne Borough Council
Long-term Low
Road Emissions 20 (Section 6.4.4)
Promote the development and implementation of “business travel plans” by companies located within the borough of Spelthorne.
Negligible to minor
Reduction in emissions of other air quality pollutants; Improved choice; Improved relationships between employer & employees; Improved travel choice;
Surrey County Council & Spelthorne Borough Council
Long-term Low
Reducing emissions from the Council’s Activities 1 (Section 6.5.1)
Reduce car dependency and facilitate transport choice by encouraging alternatives to car use along with changes in working arrangements.
Negligible to minor
Reduction in emissions of other air quality pollutants; Improved choice; Improved relationships between employer & employees; Improved travel choice;
Spelthorne Borough Council (Chief Executive Team)
Long-term Low
Reducing emissions from the Council’s Activities 2 (Section 6.5.1)
Spelthorne Borough Council will review its Business Travel Plan.
Negligible
Reduction in emissions of other air quality pollutants; Improved choice; Improved relationships between employer & employees; Improved travel choice;
Spelthorne Borough Council (Chief Executive Team)
2005 Low
Reducing emissions from the Council’s Activities 3 (Section 6.5.2)
All new fleet vehicles purchased by Spelthorne Borough Council will be meet Euro III emissions as a minimum, additionally, where appropriate, the use of alternatively fuelled vehicles will be considered.
Negligible Reduction in emissions of other air quality pollutants;
Spelthorne Borough Council (Direct Services)
Ongoing Medium
Heathrow Emissions 1 (Section 6.6.2)
Spelthorne Borough Council will continue to work to in partnership to minimise the impacts on air quality caused by the activities of Heathrow Airport air.
- Dependent upon actions taken
Spelthorne Borough Council (Environmental Health) & BAA, and the airline industries
Ongoing Low

Spelthorne Borough Council Air Quality Strategy: Action Plan
Page 93 of 105 January 2005
Action Code Description
of Action
Impacts on Nitrogen Dioxide
Concentrations (at location of action
implementation, unless otherwise stated)
Other impacts Lead Role Timescales Costs
Land Use Planning 1 (Section 6.7.1)
Ensure that the new Development Framework incorporates planning policy that will not adversely impact air quality, but furthermore, enhance air quality where possible.
Negligible to major - Spelthorne Borough Council (Planning Policy)
2005 Low
Land Use Planning 2 (Section 6.7.2)
Ensure that the future development of land will not adversely impact on air quality.
Negligible to minor (this is based on the
consideration of individual cases)
Dependent upon development proposals and decisions taken
Spelthorne Borough Council (Development Control & Environmental Health); Surrey County Council (Transportation Development Control)
Ongoing Low
Sunbury Cross Area (Section 7.3)
As part of the planning process, Spelthorne Borough Council will ensure that the impacts on air quality caused by the future development of land within the Sunbury Cross area will be taken into consideration, and where necessary mitigated again in line with the polluter pays principal.
Negligible to minor (this is based on the
consideration of individual cases)
Dependent upon development proposals and decisions taken
Spelthorne Borough Council (Development Control & Environmental Health); Surrey County Council (Transportation Development Control)
Ongoing Low
Industrial Sources 1 (Section 6.8)
Continue to ensure that emissions from all ‘prescribed processes’ remain controlled and regulated in line with national policy.
Negligible -
Spelthorne Borough Council (Environmental Health)
Ongoing Low
Smoke Emissions 1 (Section 6.9.1)
Continue to enforce the Smoke Control Areas within the borough.
Negligible Reduction in climate change gases, particulates and dioxins; improved air quality indoors;
Spelthorne Borough Council (Environmental Health)
Ongoing Low
Smoke Emissions 2 (Section 6.9.2)
The Borough of Spelthorne will encourage the recycling of the green waste generated in the borough and discourage the burning of domestic waste as a means of waste disposal.
Negligible
Improved soil quality; Reduction in climate change gases; dioxins and particulates; improved air quality indoors;
Spelthorne Borough Council (Environment Services & Environmental Health)
Ongoing Low
Smoke Emissions 3 (Section 6.9.2)
Enforce against bonfires that are causing a statutory nuisance.
Negligible Reduction in climate change gases; dioxins and particulates; improved neighbour relations;
Spelthorne Borough Council (Environmental Health)
Ongoing Low

Spelthorne Borough Council Air Quality Strategy: Action Plan
Page 94 of 105 January 2005
Action Code Description
of Action
Impacts on Nitrogen Dioxide
Concentrations (at location of action
implementation, unless otherwise stated)
Other impacts Lead Role Timescales Costs
Smoke Emissions 4 (Section 6.9.2)
Where appropriate, use enforcement powers to control dark smoke from bonfires
Negligible May reduce climate change gases; dioxins and particulates; improved air quality indoors;
Spelthorne Borough Council (Environmental Health)
Ongoing Low
Smoke Emissions 5 (Section 6.9.2)
Bonfires at commercial premises will be passed to the Environment Agency for enforcement purposes.
Negligible May reduce climate change gases; dioxins and particulates; improved air quality indoors;
Spelthorne Borough Council (Environmental Health)
Ongoing Low
Raising Awareness and the Provision of Information 1 (Section 6.10)
Raise the public’s awareness of initiatives that will improve the quality of air within the borough of Spelthorne.
Negligible Increased social responsibility; more informed decision-making.
Spelthorne Borough Council (Environmental Health)
Ongoing Low
Working in Partnership 1 (Section 6.11)
Spelthorne Borough Council will continue to work, in partnership with its neighbouring boroughs and others for the control of air pollution and continued improvement of air quality.
Negligible to moderate Dependent upon actions taken
Spelthorne Borough Council (Environmental Health)
Ongoing Low
Working in Partnership 2 (Section 6.11)
Spelthorne Borough Council will seek opportunities for effective partnerships for the continued improvement of air quality
Negligible Dependent upon actions taken
Spelthorne Borough Council (Environmental Health)
Ongoing Low
Air Quality Monitoring 1 (Section 6.12)
Spelthorne Borough Council will enhance the NO2 monitoring network within Spelthorne in order to develop a better understanding of the air quality within Spelthorne.
- Raising public awareness; Informed decision making;
Spelthorne Borough Council (Environmental Health)
Ongoing Low
Air Quality Monitoring 2 (Section 6.12)
Spelthorne Borough Council will make available regularly updated detailed information about the quality of air within Spelthorne on the Council’s website (http://www.spelthorne.gov.uk).
Negligible Raising public awareness; Raised social responsibility
Spelthorne Borough Council (Environmental Health)
Ongoing Low
Air Quality Monitoring 3 (Section 6.14)
Spelthorne Borough Council will use the data obtained, in partnership with Surrey County Council to find further cost-effective measures to reduce emissions emanating from County maintained roads within Spelthorne.
Negligible Informed decision making;
Spelthorne Borough Council (Environmental Health)
Ongoing Low
Energy Efficiency in Buildings 1 (Section 6.15)
Establish the innovations programme; “Future Green”, which seeks to fund and promote energy efficient services and measures.
Negligible Reduced CO2 emissions, improved societal equity, health, and quality of life
Spelthorne Borough Council (Environment Services)
2004 -2007 Low

Spelthorne Borough Council Air Quality Strategy: Action Plan
Page 95 of 105 January 2005
Action Code Description
of Action
Impacts on Nitrogen Dioxide
Concentrations (at location of action
implementation, unless otherwise stated)
Other impacts Lead Role Timescales Costs
Energy Efficiency in Buildings 2 (Section 6.15)
Utilize the results of the Borough thermal imaging survey to promote the benefits and potential for energy efficiency in all sectors.
Negligible Reduced CO2 emissions, improved societal equity, health, and quality of life
Spelthorne Borough Council (Environment Services)
2004 - 2007 Low
Energy Efficiency in Buildings 3 (Section 6.15)
Link the Fuel Poverty Strategy to the weekly heating costs of properties occupied by vulnerable residents to a percentage of the state pension.
Negligible Reduced CO2 emissions, improved societal equity, health, and quality of life
Spelthorne Borough Council (Environment Services)
2008 - 2010 Low
Energy Efficiency in Buildings 4 (Section 6.15)
Achieve the Home Energy Conservation Act (HECA) target of eradicating fuel poverty within the borough of Spelthorne.
Negligible Reduced CO2 emissions, improved societal equity, health, and quality of life
Spelthorne Borough Council (Environment Services)
2010 Low

Spelthorne Borough Council Air Quality Strategy: Action Plan
Page 96 of 105 January 2005
7.0 THE IMPACT OF IMPLEMENTING SPELTHORNE’S AIR QUALITY ACTION PLAN
7.1 Highway Agency Maintained Roads
While the Highways Agency has initiated a number of actions (section 6.2 refers) that will
help reduce emissions from road vehicles, even with the implementation of these actions,
after 31 December 2005 it is likely that the NAQS annual objective for nitrogen dioxide will
be exceeded at various locations adjacent to the M25 and the M3 where members of the
pubic are likely be exposed to elevated levels of nitrogen dioxide. These roads are
maintained by the Highways Agency.
In order to achieve the NAQS objectives along these Highways Agency maintained roads
there would need to be a very significant reduction in traffic flows. However this is unlikely
to happen; this is because there are no alternative forms of transport that could cope with
the enormous extra demand and provide equivalent journey times that are required.
It will only be through the development and implementation of effective national policies,
programmes and projects that emissions from vehicles along these Highways Agency
maintained roads that the NAQS objectives will be achieved.
7.2 Surrey County Maintained Road
Largely, implementation of this air quality management action plan should counter the
predicted exceedances of the NAQS annual objective for nitrogen dioxide caused by road
traffic using Surrey County Council maintained roads within the borough of Spelthorne.
However, even though the background level of nitrogen dioxide across the borough will be
reduced due to the actions laid out within this action plan, there is still the likelihood that the
NAQS annual objective for nitrogen dioxide will be exceeded at the Sunbury Cross
Roundabout beyond 2005. Whether this exceedance continues beyond 2010 will be subject
to examination during Spelthorne’s “Detailed Assessment” under the Review and
Assessment system.
7.3 Actions for the Reduction of Nitrogen Dioxide Emissions in the Sunbury Cross
Road Transport
The Sunbury Cross junction serves as a crossroads for 7 roads, the busiest four of which
are the slip roads serving the M3/A316 flyover, and the A308/A308. Actions that maybe
employed to reduce emissions through this junction are limited:
• Traffic management options that will improve traffic flows through the junction are the most
readily available tool to control/improve emissions from road traffic at Sunbury Cross.
However the options available are considerably limited by the need to give priority to
vehicles accessing and exiting the M3/A316, thus ensuring the road safety of vehicles
using the M3/A316.
• Re-routing of traffic has also been considered, however, this is not a viable option as the
re-routing of traffic would be either is through already congested roads, or through
Spelthorne Borough Council Air Quality Strategy: Action Plan
Page 97 of 105 January 2005
residential roads.
• The Sunbury Cross roundabout is land-locked. That is, one half of the Sunbury Cross
junction is constrained by railway infrastructure (which includes railway lines, 2 railway
bridges, and a train station), plus various office and warehouse premises. While the other
side of the junction is constrained by several high-rise buildings (comprising retail, office
and residential premises) and terraced retail premises with residential accommodation
above. Alterations in the infrastructure at Sunbury Cross junction may also be an option.
Such alterations may include the installation of an underpass, or the compulsory purchase
and subsequent demolition of various existing premises to make way for adaptation of
existing road infrastructure, however these are not cost-beneficial options.
While the implementation of traffic management schemes and infrastructure alterations may
offer a solution to increase road traffic flow rates, and thereby reduce pollution levels within
the immediate vicinity, this is only a short-term resolution. It has been recognised that
merely providing additional road space can no longer solve transport problems. The
environmental and economic costs of this approach are too high, and have been found to
generate even greater traffic growth that exacerbated the problems. In consideration of this,
it therefore follows that the only real sustainable options available for the reduction of
emissions from road vehicles within the Sunbury Cross area are those which are being
implemented across the borough, and as discussed within this action plan.
Planning Guidance for the Sunbury Cross Area
In recognising air quality as a material planning consideration within individual planning
applications made for the Sunbury Cross area, Spelthorne Borough Council will pay
particular attention to developments that may generate increased traffic, and that may
adversely impact upon air quality. While it is not the Council’s intention to refuse all such
development proposals within the Sunbury Cross area, it is necessary for individual
proposals and applications to be examined more extensively. For that reason, all
applications should be supported by such information as is necessary to allow a full
consideration of the impact of the proposal on the air quality within the area.
Where appropriate, the use of planning conditions or section 106 agreements will be
explored in terms of their potential for securing air quality improvements prior to
developments going ahead or to offset subsequent air quality impacts from the
development. Further, in some instances it may be appropriate for the developer to fund
mitigation measures elsewhere within the borough to offset any increase in local pollutant
emissions.
Action – Sunbury Cross Area ~ Land Use Planning 1
As part of the planning process, Spelthorne Borough Council will ensure
that the impacts on air quality caused by the future development of land
within the Sunbury Cross area will be taken into consideration, and where
necessary mitigated again in line with the polluter pays principal.

Spelthorne Borough Council Air Quality Strategy: Action Plan
Page 98 of 105 January 2005
8.0 APPROPRIATENESS, PROPORTIONALITY AND FUNDING OF AIR QUALITY MANAGEMENT ACTION PLAN
8.1 Analysis of Cost-Benefits & Wider Impacts
Achieving a balance between cost and effectiveness is an essential consideration when
deciding upon the actions to be employed to reduce emission levels of NAQS pollutants.
While a full quantification of cost-effectiveness/benefit is not requires, an estimation that will
allow a balanced and realistic approach to be taken by local authorities in their pursuit of
achieving the NAQS air quality objectives is required. Statutory guidance LAQM.PG(03)
states that the key aspects that should be considered are:
• How much of an improvement in ambient air quality is likely to result from a particular
action or policy measure;
• How much the implementation of a particular action or policy measure is likely to cost, both
directly and indirectly, and on whom the costs are likely to fall;
• Whether there might have been other policy options for delivering the same result, and if
so, why they were considered to be less cost-effective (if they were no real alternatives that
could have been considered, this should be explained within the action plan);
• Doing nothing is not always a cost-free option, as there might be indirect costs involved,
such as health impacts on the local community;
8.1.1 Road and Transport Related Projects
Highway investments have for many years been appraised using procedures that take
account both of impacts measured in monetary units, such as construction costs, time
savings and reductions in accident costs, and of social and environmental impacts that may
be quantified but not valued (such as the number of houses suffering specified increases in
noise) or assessed only in qualitative terms (such as impacts on landscape). In 1998 DETR
developed a multi-criteria analysis approach in the form of the “New Approach to Appraisal
for transport projects” (NATA). NATA enables decision makers to consider the economic,
environmental and social impacts of transport projects or policies in light of the
Government's five main objectives for transport, which are show below and in table 8.1:
• To protect and enhance the natural and built environment. Environment is divided into
noise, local air quality, landscape, biodiversity, heritage, and water, while the impact on
carbon dioxide emissions is also distinguished separately:
• To improve safety for all travellers;
• To contribute to an efficient economy, and to support sustainable economic growth in
appropriate locations. Economy is divided into journey times plus vehicle operating costs
(VOC), highway construction and maintenance cost, reliability, and regeneration; and
• To promote accessibility to everyday facilities for all, especially those without a car;
Accessibility is divided into public transport, severance, and pedestrians and others; and
• To promote the integration of all forms of transport and land use planning, leading to a

Spelthorne Borough Council Air Quality Strategy: Action Plan
Page 99 of 105 January 2005
better, more efficient transport system.
Table 8.1: New Approach to Appraisal of Transport Investment (NATA)
Objective Description Point Score
IInntteeggrraattiioonn New road building with no additional facilities for cycling, walking and public transport
-4 points
New road building with no additional facilities for either cycling, walking or public transport
-3 points
Promote car use on existing network -2 points Deters change in mode -1 point Does not promote change in mode 0 points Supports existing measures 1 point Promotes 1 initiative 2 points Promotes 2 initiatives 3 points Scheme close to school or school route 3 points Scheme gives priority to vulnerable modes 4 points
Environment Significant negative effect in combination of factors -4 points Quantifiable negative effect in combination of factors -3 points Quantifiable reduction in air quality -2 points Quantifiable increase light pollution -1 point Noise from calming features -1 point No benefit or + and - cancel 0 points Deters rat running or reduce traffic or enhances conservation area 1 points Improve air quality 2 points Quantifiable improvement in combination of factors 3 points Significant improvement in combination of factors 4 points
Safety May increase accident rate by more than 5 accidents per year -4 points May increase accident rate by approx. 3 to 5 PIA per year -3 points May increase accident rate by approx. 1 to 3 PIA per year -2 points May increase accident rate by approx. 1 PIA per year -1 point Save 0 accidents 0 points Increase perception of personal safety or save 1 accident 1 point Save between 1 and 3 accidents 2 points Save 3 to 5 accidents 3 points Save 5 or more accidents 4 points
Economy Average legal journey time increased by over 1 minute -4 points Average legal journey time increased by up to 1 minute -3 points Reduces access to local shops for all modes -2 points Reduces access to shops for one mode -1 point No outside funding available 0 points Part funding from outside source 1 point Improve facilities near shops 1 point
Developer funding to improve shopping area or complete funding from outside source
2 points
Average legal journey times improved by up to 1 minute 3 points Average legal journey times improved by over 1 minute 4 points
Accessibility Prohibit cycling and walking, sever community -4 points Increase journey times for walking and cycling -3 points Increases severance -2 points Minimal effect on negative accessibility -1 point Has no effect on accessibility 0 points Minimal positive effect on accessibility 1 point Improves access for walk or cycle 2 points Reduces severance 2 points Improve access to school, or shop or leisure facility 2 points Improve access for walk and cycle 3 points Improve access to school and/or shop and/or leisure 3 points
Surrey County Council’s transport planners used the NATA assessment approach in the
selection process of road and transport related projects by application of table 8.1 above.
Spelthorne Borough Council Air Quality Strategy: Action Plan
Page 100 of 105 January 2005
8.2 Funding Implications of the Air Quality Management Action Plan
The principal sources of funding for works for improving air quality include;
• Surrey County Council is responsible for funding the maintenance and repair of non-
motorway and non-truck roads, footpaths and cycleways, including lighting schemes within
the borough of Spelthorne. Consequently, financial provision for the implementing “air
quality management actions” relevant to the control of emissions from Surry County
Council maintained roads will come from Surrey County Council’s Local Transport Plan
provision.
• The cost of implementing “air quality management actions” relevant to the control of
emissions from roads maintained by the Highways Agency (motorways and trunk roads)
will fall to the Highways Agency.
• The cost of implementing “air quality management actions” that fall within the Councils
responsibility will be met from within Spelthorne Borough Council’s annual budget;
• Where works are required to mitigate against air pollution caused by new development,
funding for action plan initiatives or air quality monitoring will be sought from developers
though section 106 agreements or by planning condition.
8.3 Costing Criteria
The cost of implementing “air quality management” actions are presented within this document at table 6.14 using the following criteria: Low = less than £50,000 Medium = £50,000 to £100,000 Intermediate = £100,000 to £400,000 High = £400,000 to £5,000,000 Major = more than £5,000,000
8.4 Impacts on Air Quality
The following criteria have been used to describe the impact of actions in terms of the
reduction of nitrogen dioxide.
Negligible = less than 0.4 µgm-3
Minor = 0.4 µgm-3 to 1.0 µgm-3
Moderate = 1.0 µgm-3 to 2.0 µgm-3
Major = more than 2.0 µgm-3
While individual actions may offer only a small reduction in nitrogen dioxide level, the
cumulative impact of many actions across the borough will have a significant impact upon
the reduction of nitrogen dioxide levels, both at hotspot locations and of the background.

Spelthorne Borough Council Air Quality Strategy: Action Plan
Page 101 of 105 January 2005
APPENDICES

Spelthorne Borough Council Air Quality Strategy: Action Plan
Page 102 of 105 January 2005
Appendix 1 – Action Planning Process Checklist
Reference Location Comments
1. Local Authority Information Page 2
2. Process Adherence to Guidelines and
Consideration of Policies
Have Statutory Consultees been consulted:
Secretary of State
Environment Agency
Highways Agency
Surrey County Council
Contiguous Authorities
Section 3
Have other local authority departments been
consulted
Planning Policy
Development Control
Environment Services
Section 3
Have other relevant consultees been consulted:
Public Authorities
Business Interests
Others
Section 3
Has a statement of the problem causing the AQMA,
as identified in the Stage 4, been clearly stated? Section 1
Have the principal sources of the pollutants causing
the exceedance been identified? Section 4
Have other local authority plans/policies been
considered? Section 2.5
Has an options timescale been included? Section 6.14
Have costs of options/plan been set out? Section 8
Have impacts been assessed? Section 8
Evidence to support the local authorities’ selection or rejection of each considered measure would be sought by identifying the following issues:
Reference Location Comments
Road Transport Measures Low emission zones Section 6.1.2
Parking management & charging Section 6.3.2
Public transport initiatives - Bus Section 6.3.2 Development of cycling and walking Section 6.3.2
Partnerships & travel plans (workplace & school) Section 6.11 Promotion, education & awareness raising Section 6.10
Fleet management & clean fuels Section 6.5.1
Land use planning Section 6.7.1 & 6.7.2 Freight measures Section 6.3.2
Industrial Measures Local abatement Section 6.8
Domestic Measures
Energy conservation Section 6.15
Appliance improvement Section 6.15 Smoke control Section 6.9.1
Nuisance policy (bonfires etc.) Section 6.9.2
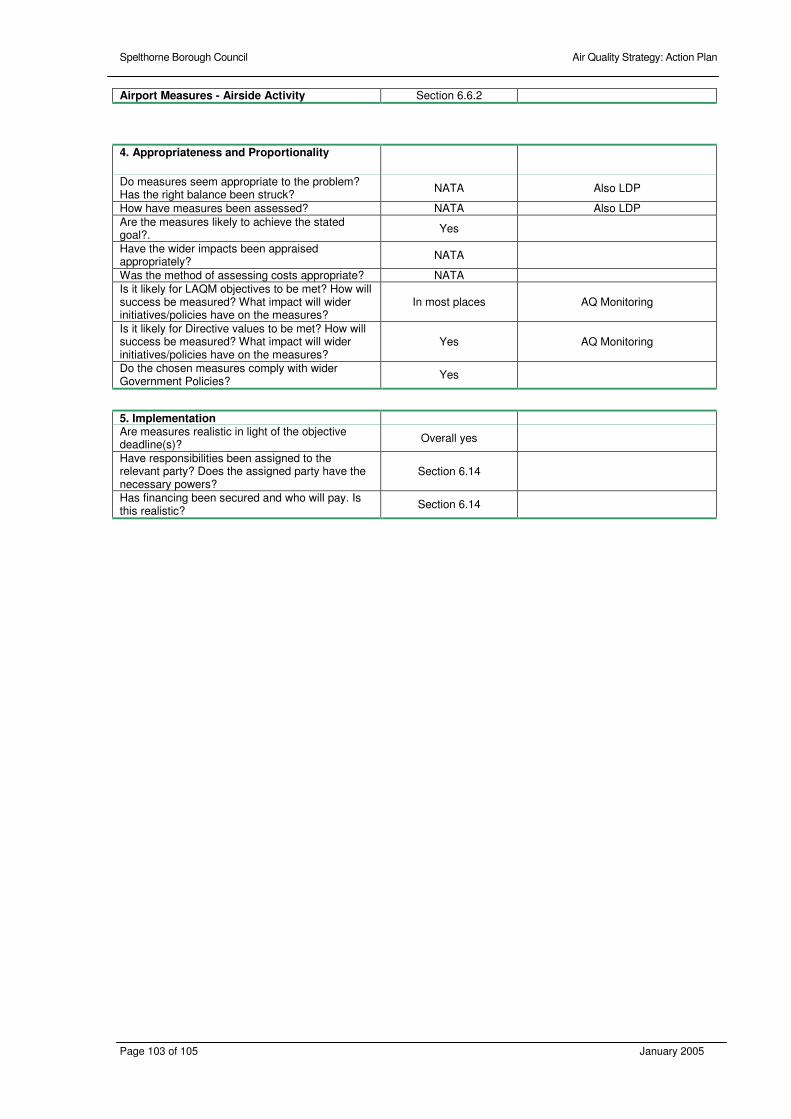
Spelthorne Borough Council Air Quality Strategy: Action Plan
Page 103 of 105 January 2005
Airport Measures - Airside Activity Section 6.6.2
4. Appropriateness and Proportionality
Do measures seem appropriate to the problem? Has the right balance been struck?
NATA Also LDP
How have measures been assessed? NATA Also LDP
Are the measures likely to achieve the stated goal?.
Yes
Have the wider impacts been appraised appropriately?
NATA
Was the method of assessing costs appropriate? NATA Is it likely for LAQM objectives to be met? How will success be measured? What impact will wider initiatives/policies have on the measures?
In most places AQ Monitoring
Is it likely for Directive values to be met? How will success be measured? What impact will wider initiatives/policies have on the measures?
Yes AQ Monitoring
Do the chosen measures comply with wider Government Policies?
Yes
5. Implementation Are measures realistic in light of the objective deadline(s)?
Overall yes
Have responsibilities been assigned to the relevant party? Does the assigned party have the necessary powers?
Section 6.14
Has financing been secured and who will pay. Is this realistic?
Section 6.14

Spelthorne Borough Council Air Quality Strategy: Action Plan
Page 104 of 105 January 2005
Appendix 2 - Action to reduce NOx Emissions Caused by Road Transport
Motor vehicle engines emit many types of pollutants including nitrogen oxides, volatile
organic compounds, carbon monoxide, carbon dioxide, particulates, and sulphur dioxide. A
number of factors affect the volume of pollutants emitted, such as the engine energy
efficiency, the type of fuel, speed (engines are inefficient at low speeds and during idling),
volume of traffic using route, route congestion, and the traffic components using the route,
for example the number of heavy goods vehicles.
New specifications for vehicle engines and fuel quality are ensuring continued
improvements in the reduction of emissions from road transport. Since 1992, there have
been ongoing improvements in the reduction of emissions from road vehicles. Further
improvements are expected with the introduction of more stringent emissions standards for
new vehicles in 2005 (Euro IV). Table A1.1 summarises the various mandatory emissions
standards and when they are being introduced.
Table A1.1: Mandatory Vehicle Emissions Euro Standards
Standard Directive Type of vehicle Date of introduction (for type approval)
91/444/EEC passenger cars 31 December 1992 93/59/EEC light commercial vehicles 1 October 1994 Euro I
91/542/EEC heavy diesels 1 October 1993 94/12/EC passenger cars 1 January 1997
96/69/EC light commercial vehicles 1 October 1997 Euro II
91/542/ heavy diesels 1 October 1996
Euro III 98/69/EC Common position
passenger cars and light commercial vehicles heavy diesels
1 January 2001
Euro IV 98/69/EC Common position
passenger cars and light commercial vehicles heavy diesels
1 January 2006
Source: LAQM.G3(00)
The emissions from pre-Euro I vehicles are significantly higher than for vehicles in
production now (Euro III) and those that will be produced under Euro IV (table A1.2 below
refers).

Spelthorne Borough Council Air Quality Strategy: Action Plan
Page 105 of 105 January 2005
Table A1.2: Relative Emission Performance of Different Vehicle Types by Fuel and Emission Standards on Urban Test Cycle*
Type of vehicle
Emission standard Carbon
monoxide Hydrocarbons
Oxides of Nitrogen
Particulates
Petrol car pre-Euro I Euro I Euro II Euro III Euro IV
100 15 10 7 4
100 9 4 3 2
100 19 9 6 3
5 2 2 2 2
Diesel car pre-Euro I Euro I Euro II Euro III Euro IV
7 4 3 2 2
10 4 3 2 1
43 29 21 13 7
100 55 31 20 10
Petrol LGV pre-Euro I Euro I Euro II Euro III Euro IV
151 30 21 17 7
120 6 3 2 1
114 21 9 6 3
10 5 5 5 5
Diesel LGV pre-Euro I Euro I Euro II Euro III Euro IV
10 8 6 4 3
20 15 9 4 3
82 40 30 26 13
209 115 63 41 20
Rigid HGV pre-Euro I Euro I Euro II Euro III Euro IV
38 21 17 9 6
192 113 105 47 33
640 440 316 224 158
484 318 168 113 22
Articulated HGV
pre-Euro I Euro I Euro II Euro III Euro IV
44 22 18 9 7
183 87 78 47 33
1704 893 650 641 325
700 482 185 124 24
Bus pre-Euro I Euro I Euro II Euro III Euro IV
63 28 22 11 8
83 90 84 50 35
795 859 614 436 307
458 304 187 125 24
Motorcycle Less than 50cc: two stroke greater than 50cc: two stroke greater than 50cc: four stroke
34 74 67
135 338 68
2 4
13
- - -
*Emissions performance indexed to petrol car without three-way catalyst (Pre-Euro I = 100), except for particulates where it is indexed to pre-Euro I diesel car. Legislative standards for particulates only exist for diesel vehicles (petrol figures for particulates are included for comparison). Euro standards do not apply to motorcycles at the moment.
Source: LAQM.G3(00)
Related Documents