Air quality modelling to support the Elmbridge Local Plan - future scenarios (2037) Final report Prepared for Elmbridge Borough Council 20 th April 2022

Welcome message from author
This document is posted to help you gain knowledge. Please leave a comment to let me know what you think about it! Share it to your friends and learn new things together.
Transcript
Air quality modelling to support the Elmbridge Local Plan -
future scenarios (2037)
Final report
Prepared for
Elmbridge Borough Council
20th April 2022

Report Information
CERC Job Number: FM1213
Job Title: Air quality modelling to support the
Elmbridge Local Plan - future scenarios
(2037)
Prepared for: Elmbridge Borough Council
Report Status: Final
Report Reference: FM1213/S8/22
Issue Date: 20th April 2022
Author(s): Charlotte Aves
Reviewer(s): Sarah Strickland
Issue Date Comments
1 18/03/21 Draft report
2
3
17/06/21
24/06/21
Draft report – includes mitigation scenario
Draft report with mitigation measures
4 29/06/21 Draft report – minor changes
5 15/12/21 Draft report – 2037 scenarios
6 21/01/22 Draft report – 2037 scenarios including
mitigation
7
8
17/02/22
20/04/22
Draft report – edits
Final report (no changes)
Main File(s): FM1213_Elmbridge_CERC_S8_20Apr22.
Air quality modelling to support the Elmbridge Local Plan
Future Scenarios (2037)
1
Contents
1 SUMMARY .............................................................................................................................................. 2
1.1 HUMAN HEALTH IMPACTS ............................................................................................................................... 2
1.2 SENSITIVE HABITATS IMPACTS .......................................................................................................................... 3
2 INTRODUCTION ...................................................................................................................................... 4
3 SIGNIFICANCE CRITERIA .......................................................................................................................... 5
4 MODEL SET-UP ....................................................................................................................................... 6
4.1 MODELLING SOFTWARE .................................................................................................................................. 6
4.2 BACKGROUND DATA ....................................................................................................................................... 6
4.3 STREET CANYONS .......................................................................................................................................... 7
5 EMISSIONS .............................................................................................................................................. 8
5.1 ROAD TRANSPORT ......................................................................................................................................... 8
Emission factors .............................................................................................................................. 8
Activity data .................................................................................................................................... 8
5.2 OTHER EMISSIONS ......................................................................................................................................... 9
Domestic emissions ......................................................................................................................... 9
6 2037 SCENARIOS: HUMAN HEALTH IMPACTS ....................................................................................... 10
6.1 CONCENTRATION CONTOURS ......................................................................................................................... 10
6.2 DIFFERENCE PLOTS ....................................................................................................................................... 26
6.3 HEALTH RECEPTORS ..................................................................................................................................... 33
6.4 MORTALITY BURDEN .................................................................................................................................... 40
7 2037 SCENARIOS: SENSITIVE HABITAT IMPACTS ................................................................................... 44
7.1 CRITICAL LEVELS .......................................................................................................................................... 44
7.2 CRITICAL LOADS .......................................................................................................................................... 51
Nitrogen deposition maps ............................................................................................................. 51
8 DISCUSSION .......................................................................................................................................... 61
8.1 HUMAN HEALTH IMPACTS ............................................................................................................................. 61
8.2 SENSITIVE HABITATS IMPACTS ........................................................................................................................ 61
APPENDIX A: SUMMARY OF LOCAL PLAN DEVELOPMENTS ............................................................................ 63
APPENDIX B: SUMMARY OF ADMS-URBAN ................................................................................................... 69
Air quality modelling to support the Elmbridge Local Plan
Future Scenarios (2037)
2
1 Summary
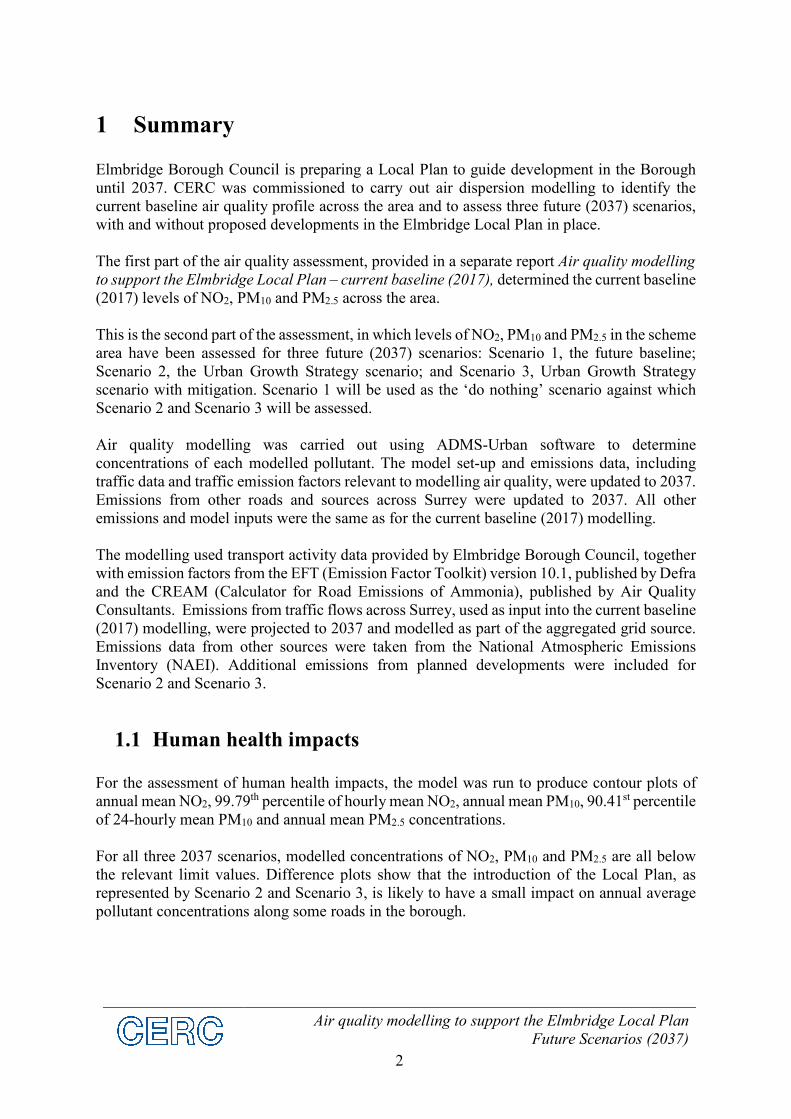
Elmbridge Borough Council is preparing a Local Plan to guide development in the Borough
until 2037. CERC was commissioned to carry out air dispersion modelling to identify the
current baseline air quality profile across the area and to assess three future (2037) scenarios,
with and without proposed developments in the Elmbridge Local Plan in place.
The first part of the air quality assessment, provided in a separate report Air quality modelling
to support the Elmbridge Local Plan – current baseline (2017), determined the current baseline
(2017) levels of NO2, PM10 and PM2.5 across the area.
This is the second part of the assessment, in which levels of NO2, PM10 and PM2.5 in the scheme
area have been assessed for three future (2037) scenarios: Scenario 1, the future baseline;
Scenario 2, the Urban Growth Strategy scenario; and Scenario 3, Urban Growth Strategy
scenario with mitigation. Scenario 1 will be used as the ‘do nothing’ scenario against which
Scenario 2 and Scenario 3 will be assessed.
Air quality modelling was carried out using ADMS-Urban software to determine
concentrations of each modelled pollutant. The model set-up and emissions data, including
traffic data and traffic emission factors relevant to modelling air quality, were updated to 2037.
Emissions from other roads and sources across Surrey were updated to 2037. All other
emissions and model inputs were the same as for the current baseline (2017) modelling.
The modelling used transport activity data provided by Elmbridge Borough Council, together
with emission factors from the EFT (Emission Factor Toolkit) version 10.1, published by Defra
and the CREAM (Calculator for Road Emissions of Ammonia), published by Air Quality
Consultants. Emissions from traffic flows across Surrey, used as input into the current baseline
(2017) modelling, were projected to 2037 and modelled as part of the aggregated grid source.
Emissions data from other sources were taken from the National Atmospheric Emissions
Inventory (NAEI). Additional emissions from planned developments were included for
Scenario 2 and Scenario 3.
1.1 Human health impacts
For the assessment of human health impacts, the model was run to produce contour plots of
annual mean NO2, 99.79th percentile of hourly mean NO2, annual mean PM10, 90.41st percentile
of 24-hourly mean PM10 and annual mean PM2.5 concentrations.
For all three 2037 scenarios, modelled concentrations of NO2, PM10 and PM2.5 are all below
the relevant limit values. Difference plots show that the introduction of the Local Plan, as
represented by Scenario 2 and Scenario 3, is likely to have a small impact on annual average
pollutant concentrations along some roads in the borough.
Air quality modelling to support the Elmbridge Local Plan
Future Scenarios (2037)
3
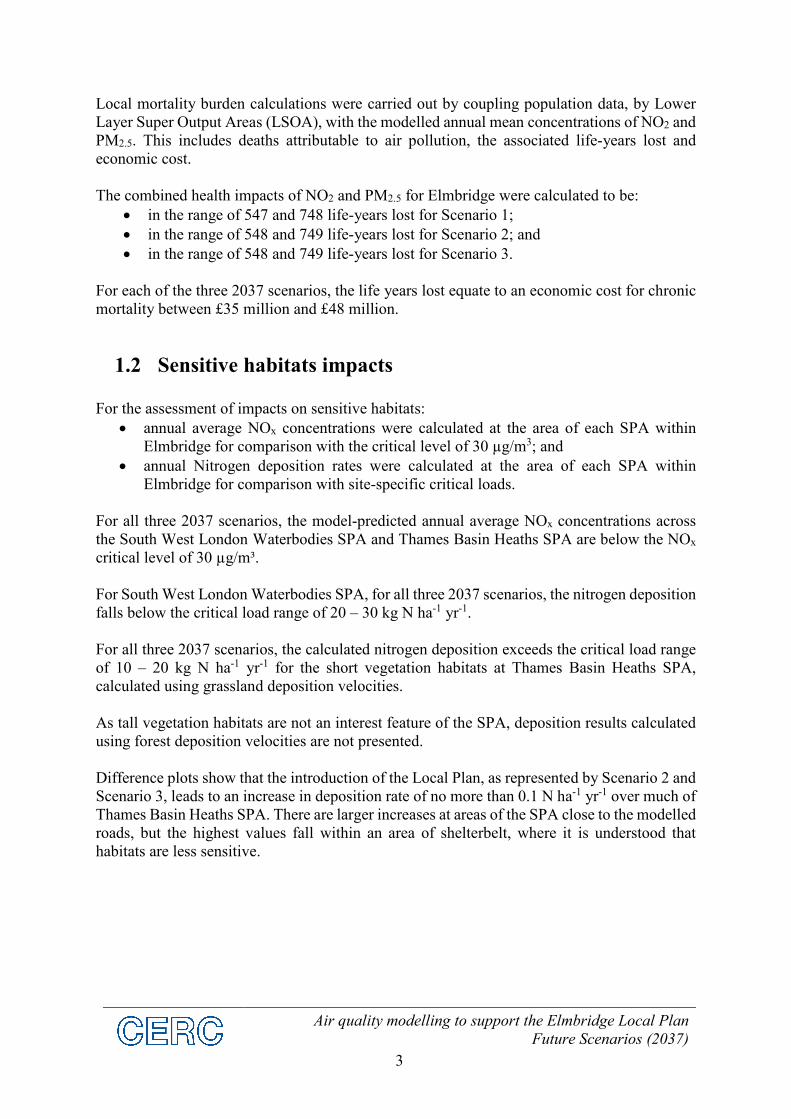
Local mortality burden calculations were carried out by coupling population data, by Lower
Layer Super Output Areas (LSOA), with the modelled annual mean concentrations of NO2 and
PM2.5. This includes deaths attributable to air pollution, the associated life-years lost and
economic cost.
The combined health impacts of NO2 and PM2.5 for Elmbridge were calculated to be:
in the range of 547 and 748 life-years lost for Scenario 1;
in the range of 548 and 749 life-years lost for Scenario 2; and
in the range of 548 and 749 life-years lost for Scenario 3.
For each of the three 2037 scenarios, the life years lost equate to an economic cost for chronic
mortality between £35 million and £48 million.
1.2 Sensitive habitats impacts
For the assessment of impacts on sensitive habitats:
annual average NOx concentrations were calculated at the area of each SPA within
Elmbridge for comparison with the critical level of 30 µg/m3; and
annual Nitrogen deposition rates were calculated at the area of each SPA within
Elmbridge for comparison with site-specific critical loads.
For all three 2037 scenarios, the model-predicted annual average NOx concentrations across
the South West London Waterbodies SPA and Thames Basin Heaths SPA are below the NOx
critical level of 30 µg/m³.
For South West London Waterbodies SPA, for all three 2037 scenarios, the nitrogen deposition
falls below the critical load range of 20 – 30 kg N ha-1 yr-1.
For all three 2037 scenarios, the calculated nitrogen deposition exceeds the critical load range
of 10 – 20 kg N ha-1 yr-1 for the short vegetation habitats at Thames Basin Heaths SPA,
calculated using grassland deposition velocities.
As tall vegetation habitats are not an interest feature of the SPA, deposition results calculated
using forest deposition velocities are not presented.
Difference plots show that the introduction of the Local Plan, as represented by Scenario 2 and
Scenario 3, leads to an increase in deposition rate of no more than 0.1 N ha-1 yr-1 over much of
Thames Basin Heaths SPA. There are larger increases at areas of the SPA close to the modelled
roads, but the highest values fall within an area of shelterbelt, where it is understood that
habitats are less sensitive.
Air quality modelling to support the Elmbridge Local Plan
Future Scenarios (2037)
4
2 Introduction
Elmbridge Borough Council (the Council) is preparing a Local Plan to guide development in
the Borough until 2037.
The main source of air pollution in Elmbridge is road transport from major roads;
implementation of a Local Plan can lead to changes in the magnitude and location of these
emissions. CERC was commissioned to carry out air dispersion modelling to identify the
current baseline air quality profile across the area and to assess three future (2037) scenarios,
with and without proposed developments in the Elmbridge Local Plan in place, represented by:
Scenario 1: 2037 Baseline;
Scenario 2: Urban Growth Strategy scenario; and
Scenario 3: Urban Growth Strategy scenario with mitigation.
The first part of the air quality assessment, provided in a separate report Air quality modelling
to support the Elmbridge Local Plan – current baseline (2017), determined the current baseline
(2017) levels of NO2, PM10 and PM2.5 across the area.
This is the second part of the assessment, in which levels of NO2, PM10 and PM2.5 in the scheme
area have been assessed for the three future (2037) scenarios. Scenario 1 will be used as the
‘do nothing’ scenario against which Scenario 2 and Scenario 3 will be assessed.
High resolution air quality maps of concentrations of NO2, PM10 and PM2.5 across Elmbridge
were generated for the future scenarios, for comparison against relevant air quality standards.
Local mortality burdens were carried out by coupling population data with the modelled annual
mean concentrations of NO2 and PM2.5.
The modelling also considers the impacts on sensitive habitat sites: the annual average NOx
concentrations and Nitrogen deposition rates were considered for each of the SPAs within
Elmbridge.
In this report, Section 3 presents the criteria used to carry out the impact magnitude assessment
of the 2037 modelling. With the exception of changes to the model set up and traffic emissions
data outlined in Section 4 and 5 of this report, the model set-up is the same as that used in the
2017 assessment.
The results of the modelling of the future (2037) scenarios are then presented: the human health
impacts in Section 6, which includes concentration maps, difference maps, health receptor
concentrations, and mortality burden calculations. Sensitive habitat impacts are presented in
Section 7. A discussion of the results is presented in Section 8.
A summary of the commercial and domestic developments expected as part of the Local Plan are
included in Appendix A. Finally, a summary of the ADMS-Urban model is included as
Appendix B.
Air quality modelling to support the Elmbridge Local Plan
Future Scenarios (2037)
5
3 Significance Criteria
The significance of the air quality impacts as a result of the Local Plan was assessed using The
Environmental Protection UK (EPUK) and Institute of Air Quality Management (IAQM)
guidance for Land-Use Planning & Development Control1.
The impact magnitude criteria presented in the EPUK and IAQM guidance can be applied to
any Air Quality Assessment Level (AQAL), such as the air quality objectives considered in
this assessment.
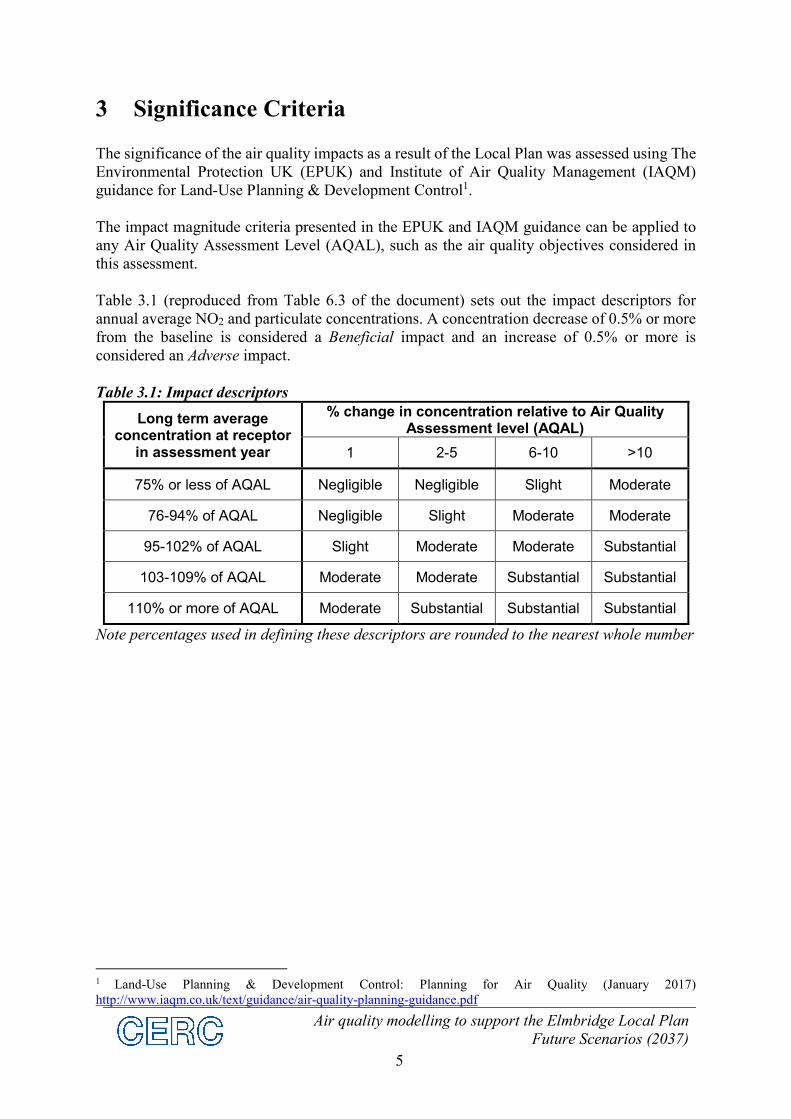
Table 3.1 (reproduced from Table 6.3 of the document) sets out the impact descriptors for
annual average NO2 and particulate concentrations. A concentration decrease of 0.5% or more
from the baseline is considered a Beneficial impact and an increase of 0.5% or more is
considered an Adverse impact.
Table 3.1: Impact descriptors
Long term average concentration at receptor
in assessment year
% change in concentration relative to Air Quality Assessment level (AQAL)
1 2-5 6-10 >10
75% or less of AQAL Negligible Negligible Slight Moderate
76-94% of AQAL Negligible Slight Moderate Moderate
95-102% of AQAL Slight Moderate Moderate Substantial
103-109% of AQAL Moderate Moderate Substantial Substantial
110% or more of AQAL Moderate Substantial Substantial Substantial
Note percentages used in defining these descriptors are rounded to the nearest whole number
1 Land-Use Planning & Development Control: Planning for Air Quality (January 2017)
http://www.iaqm.co.uk/text/guidance/air-quality-planning-guidance.pdf
Air quality modelling to support the Elmbridge Local Plan
Future Scenarios (2037)
6
4 Model set-up
This section outlines the changes to the current baseline (2017) model set-up to represent the
future (2037) scenarios. Unless otherwise stated, the model set-up is the same as outlined in
Section 5 of the current baseline (2017) report. The following sections are not included as the
inputs have remained the same:
Surface roughness;
Monin-Obukhov length;
Meteorological data; and
Chemistry.
Section 5 outlines the changes to the emissions data to represent the future (2037) scenarios.
4.1 Modelling software
All modelling was carried out using ADMS-Urban2 version 5.0.0.1, developed by CERC.
4.2 Background data
Projections of background concentrations for 2037 were based on Local Air Quality
Management background air pollution maps, published by Defra3. The maps provide annual
average background concentrations on a 1 km by 1 km grid square basis, with projections up
to the year 2030. The 2030 background maps were used to project the 2017 background
concentrations to the year 2037 at each of the monitoring sites. This is likely to be a
conservative approach, as background concentrations are expected to decrease slightly each
year due to expected reduction in pollutant emissions, for example through newer vehicle
technologies into the road transport fleet mix.
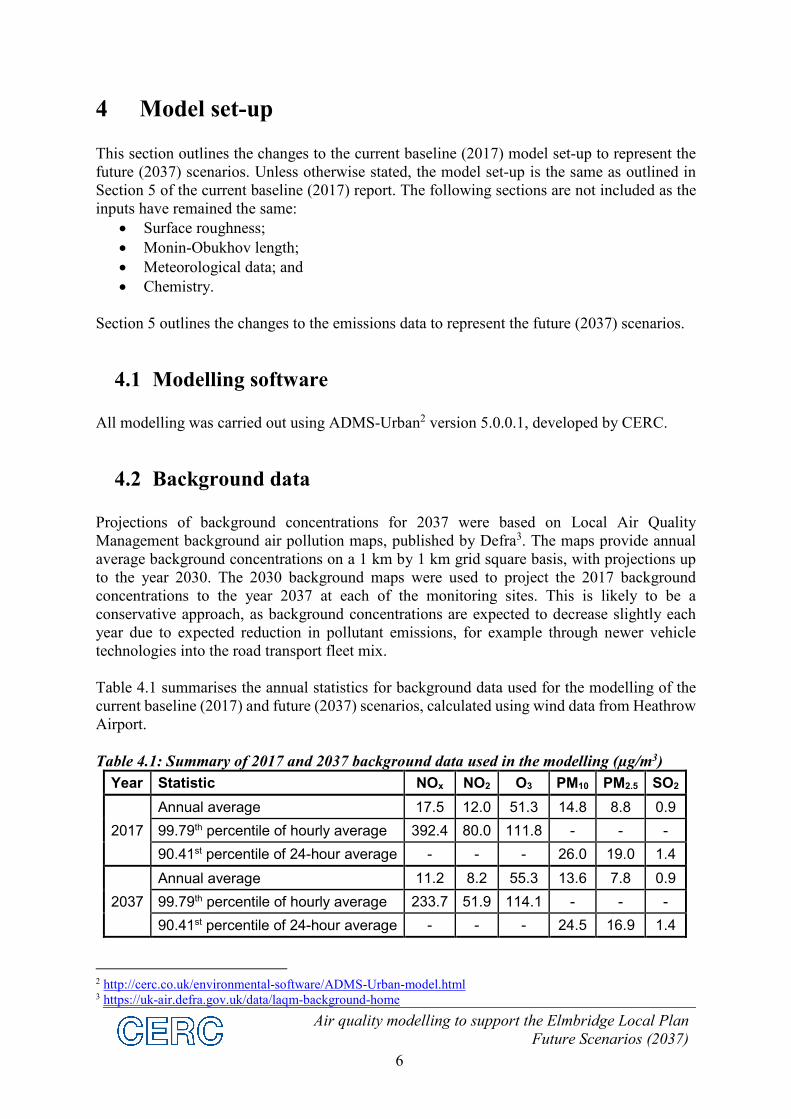
Table 4.1 summarises the annual statistics for background data used for the modelling of the
current baseline (2017) and future (2037) scenarios, calculated using wind data from Heathrow
Airport.
Table 4.1: Summary of 2017 and 2037 background data used in the modelling (µg/m3)
Year Statistic NOx NO2 O3 PM10 PM2.5 SO2
2017
Annual average 17.5 12.0 51.3 14.8 8.8 0.9
99.79th percentile of hourly average 392.4 80.0 111.8 - - -
90.41st percentile of 24-hour average - - - 26.0 19.0 1.4
2037
Annual average 11.2 8.2 55.3 13.6 7.8 0.9
99.79th percentile of hourly average 233.7 51.9 114.1 - - -
90.41st percentile of 24-hour average - - - 24.5 16.9 1.4
2 http://cerc.co.uk/environmental-software/ADMS-Urban-model.html 3 https://uk-air.defra.gov.uk/data/laqm-background-home

Air quality modelling to support the Elmbridge Local Plan
Future Scenarios (2037)
7
4.3 Street canyons
The advanced street canyon module option in ADMS-Urban was used to modify the dispersion
of pollutants from a road source according to the presence and properties of canyon walls on one
or both sides of the road. Street canyon parameters, calculated from Ordnance Survey Mastermap
topographic data in the current baseline (2017) modelling, were used as input to the ADMS
Advanced Canyon option for the future (2037) scenarios modelling, supplemented with advanced
canyon inputs calculated for the additional roads.
Air quality modelling to support the Elmbridge Local Plan
Future Scenarios (2037)
8
5 Emissions
Emission inventories were compiled for each of the scenarios modelled, using CERC’s EMIT4
emissions inventory tool, version 3.7. This section outlines the changes to the current baseline
(2017) emissions inventory to represent the future (2037) scenarios. Unless otherwise stated,
the emissions data are the same as outlined in Section 6 of the current baseline (2017) report.
The following sections are not included as the inputs have remained the same:
Time varying emissions; and
Point sources.
5.1 Road transport
Emissions from road transport were calculated using an activity data approach, whereby
Annual Average Daily Traffic flows (AADTs) for each road link were combined with emission
factors and speed data to calculate emissions for each road link on a vehicle-by-vehicle basis.
This methodology is described below.
Emission factors
Traffic emissions of NOx, NO2, PM10 and PM2.5 were calculated from traffic flows using EFT
v10.1 emission factors based on Euro vehicle emissions categories. This dataset includes
speed-emissions data that are based COPERT 55 emission factors. EFT v10.1 include exhaust,
brake, tyre and road wear for PM10 and PM2.5.
Note that projected vehicle fleet data is only available up to the year 2030; vehicle emissions
data were therefore calculated using traffic flows for 2037 and vehicle fleet compositions for
2030. This is likely to be a conservative approach as vehicle emissions are predicted to
decrease slightly each year with the uptake of newer, cleaner vehicles.
Traffic emissions of NH3 were calculated from traffic flows using Air Quality Consultants’
ammonia emissions factor tool CREAM V1A6. The vehicle fleet projections in CREAM are
provided up to 2035; vehicle emissions data were therefore calculated using traffic flows for
2037 and vehicle fleet compositions for 2035.
Activity data
Traffic activity data were provided by Elmbridge Borough Council for the future scenarios, in
the same format as the Surrey Traffic Model. The data comprised AM peak and PM peak traffic
flows split by vehicle type and a derived AADT, calculated using factors provided by Surrey
County Council. For each scenario, updated traffic emissions were calculated based on the
traffic data provided.
4 http://cerc.co.uk/environmental-software/EMIT-tool.html 5http://www.emisia.com/copert/General.html 6 https://www.aqconsultants.co.uk/resources/calculator-for-road-emissions-of-ammonia
Air quality modelling to support the Elmbridge Local Plan
Future Scenarios (2037)
9
As with the current baseline (2017) modelling, the future scenario (2037) speeds were derived
by calculating a weighted average speed on each road, based on the flow of each vehicle
throughout the day.
Emissions from traffic flows across Surrey, used as input into the current baseline (2017)
modelling, were modelled as part of the aggregated grid source described in Section 5.2. The
traffic flows were projected to 2037, based on the change in vehicle kilometres between 2017
and Scenario 1 data for Elmbridge roads.
5.2 Other emissions
Spatially-diffuse emissions from sources other than those explicitly modelled, such as
emissions from domestic combustion, were represented by a set of 1-km square grid sources
with a depth of 10 m. Gridded emissions data for 2015 from the NAEI7 were used to represent
these sources.
Local Air Quality Management background air pollution maps, published by Defra 8, provide
annual average background concentrations on a 1 km by 1 km grid square basis, with
projections up to the year 2030. The background data was used to project the 2015 NAEI
gridded data to 2030 for each grid square and emissions sector.
Domestic emissions
Emissions from commercial and domestic developments expected as part of the Local Plan
were included for Scenario 2 and 3. The domestic emissions were calculated based on the
number of units and the commercial emissions were calculated based on the area of floor space
assigned to each development. A summary of the developments is included in Appendix A.
Emission factors were obtained from the NAEI and a representative energy demand was
obtained from the Department of Energy and Climate Change (DECC) Energy demand
benchmarks. A value of 200 kWh per square metre per year was used for the calculation of
commercial emissions and a value of 10,000 kWh per year was used for the calculation of
domestic emissions, based on an average of the energy demand benchmarks for different types
of houses, as shown in Table 5.1. The emissions were modelled as 1-km resolution grid sources,
consistent with the modelling of current domestic and commercial emissions.
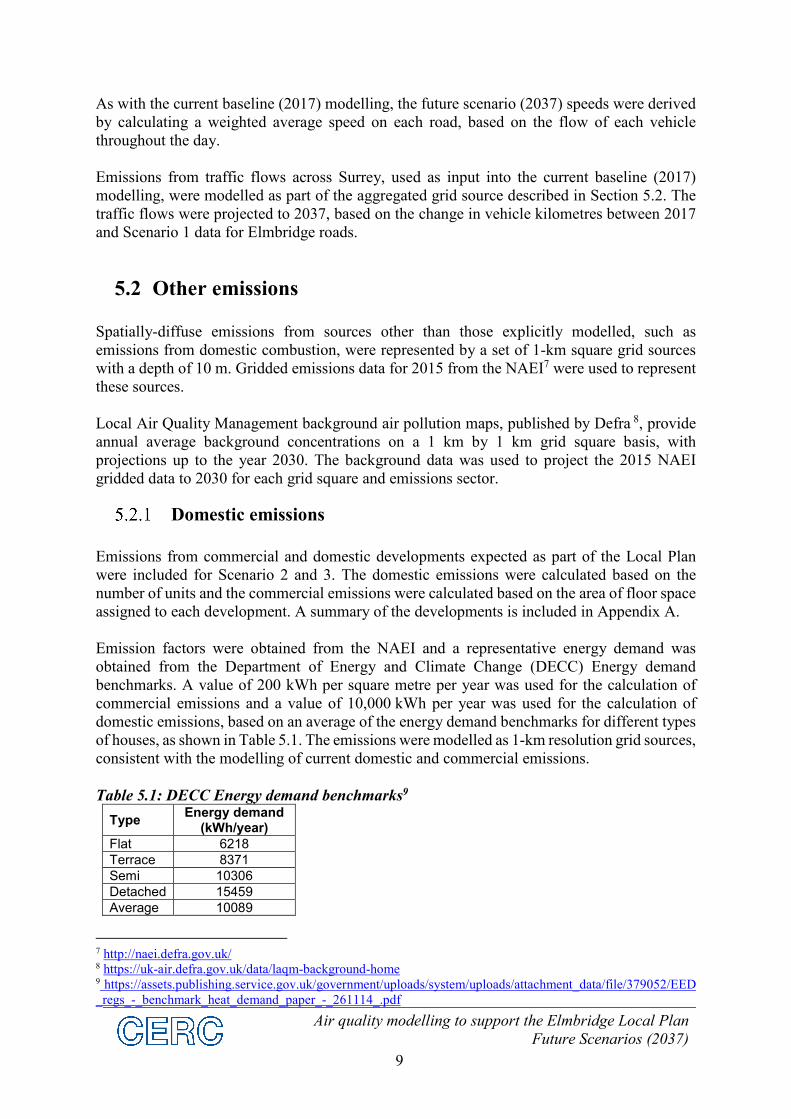
Table 5.1: DECC Energy demand benchmarks9
Type Energy demand
(kWh/year)
Flat 6218
Terrace 8371
Semi 10306
Detached 15459
Average 10089
7 http://naei.defra.gov.uk/ 8 https://uk-air.defra.gov.uk/data/laqm-background-home 9 https://assets.publishing.service.gov.uk/government/uploads/system/uploads/attachment_data/file/379052/EED
_regs_-_benchmark_heat_demand_paper_-_261114_.pdf
Air quality modelling to support the Elmbridge Local Plan
Future Scenarios (2037)
10
6 2037 scenarios: human health impacts
6.1 Concentration contours
This section comprises borough-wide air quality maps for the three 2037 scenarios, for
comparison against air quality objectives for NO2, PM10 and PM2.5.
Pollutant concentrations were generated at a set of output points on a 100 m regular grid across
the region, along with additional output points along modelled roads to capture the steep
concentration gradients at roadside. These model-calculated concentrations were used to
generate 10 m resolution air quality maps in GIS software, using the Natural Neighbour
interpolation method.
In the air quality maps, exceedences of the air quality objective are shown in orange and red,
and pollutant concentrations below the objective are shown in blue, green and yellow.
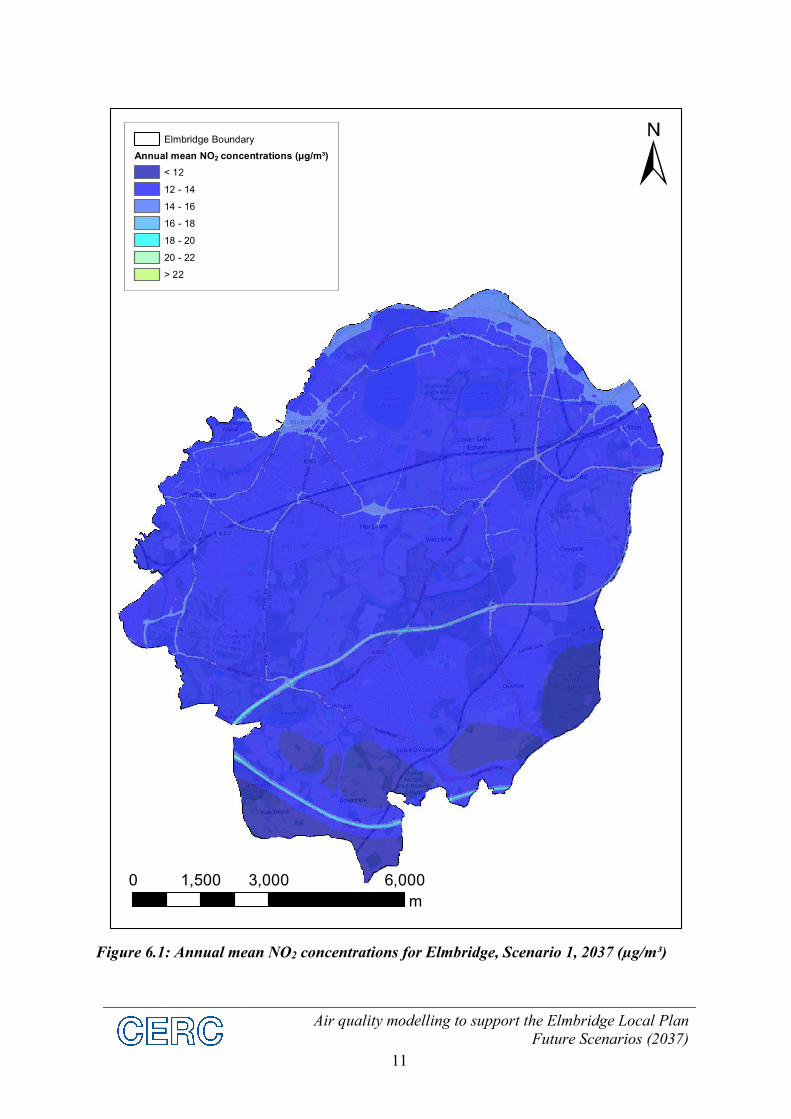
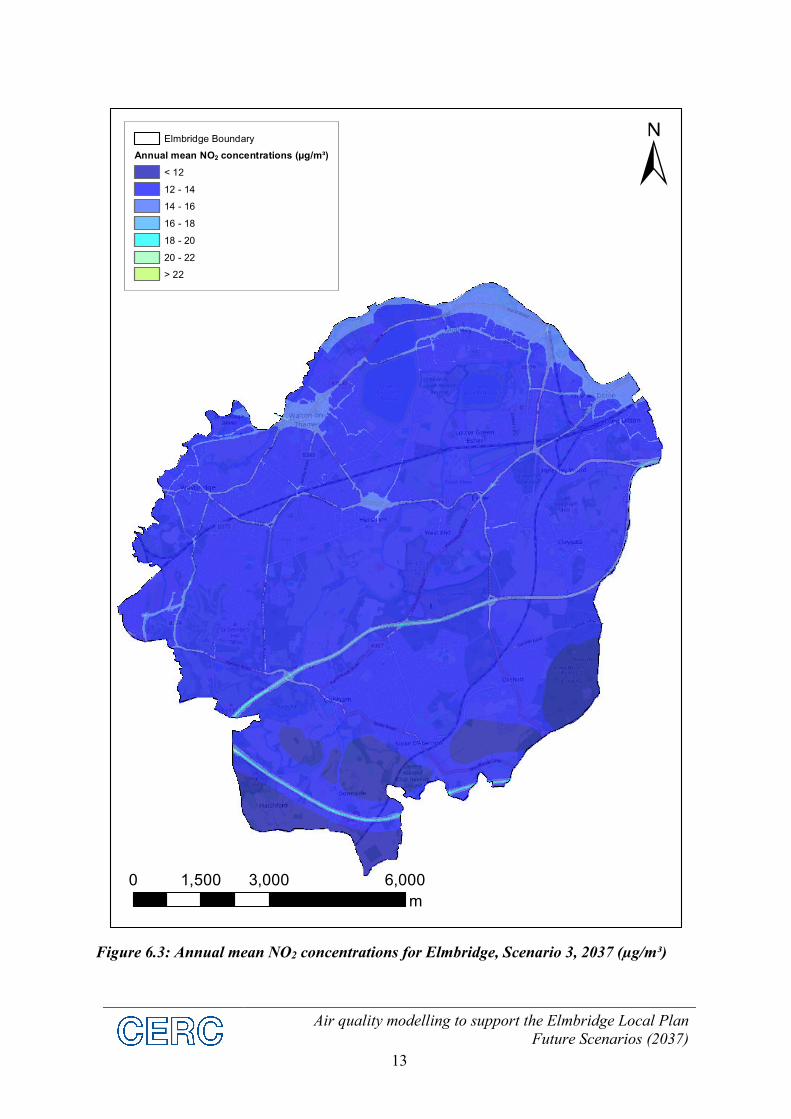
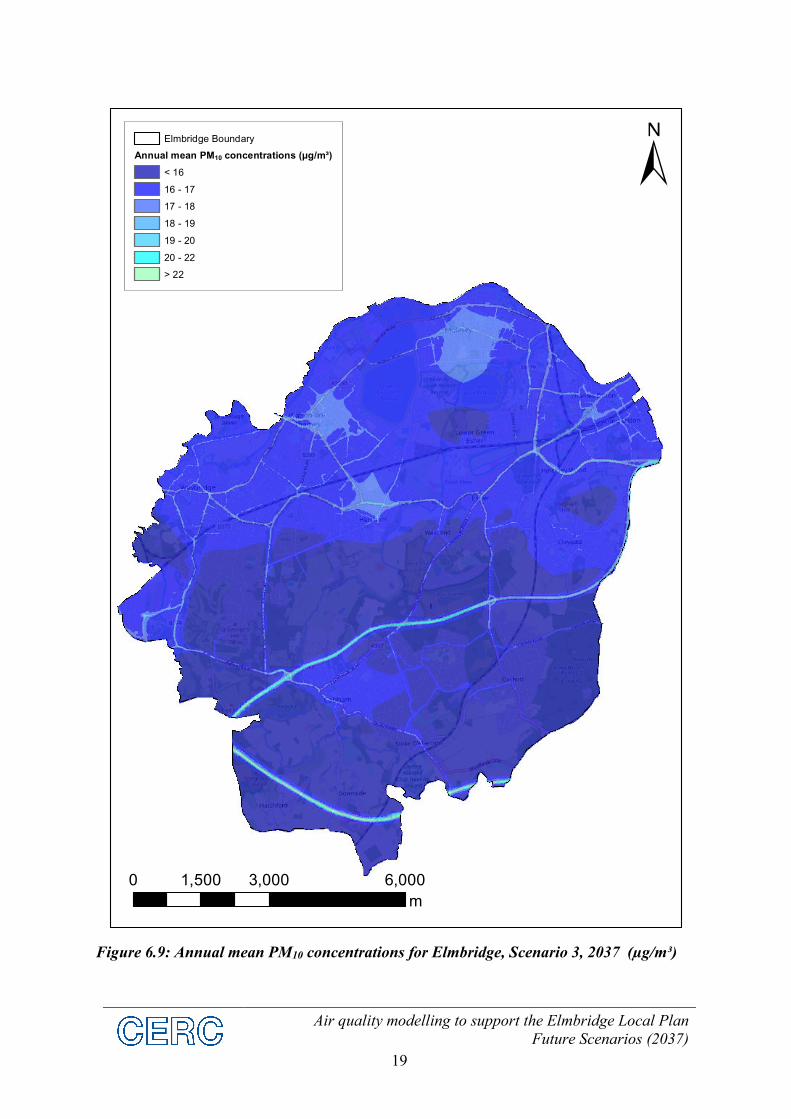
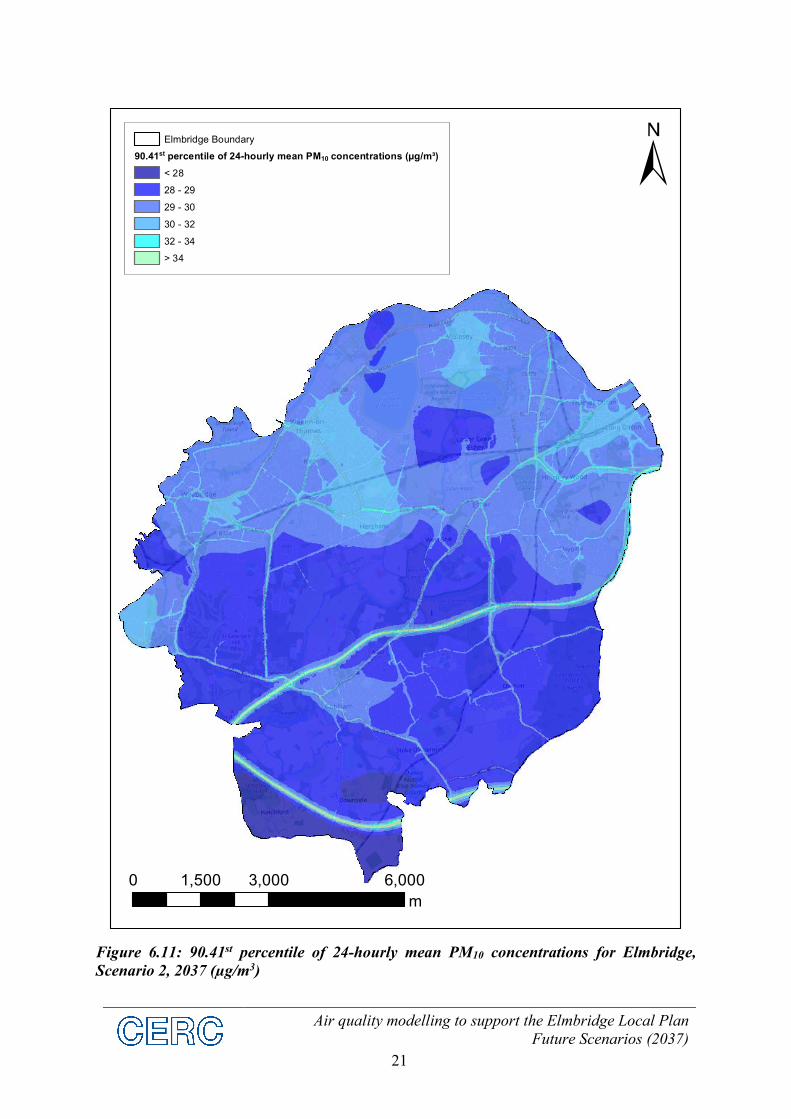
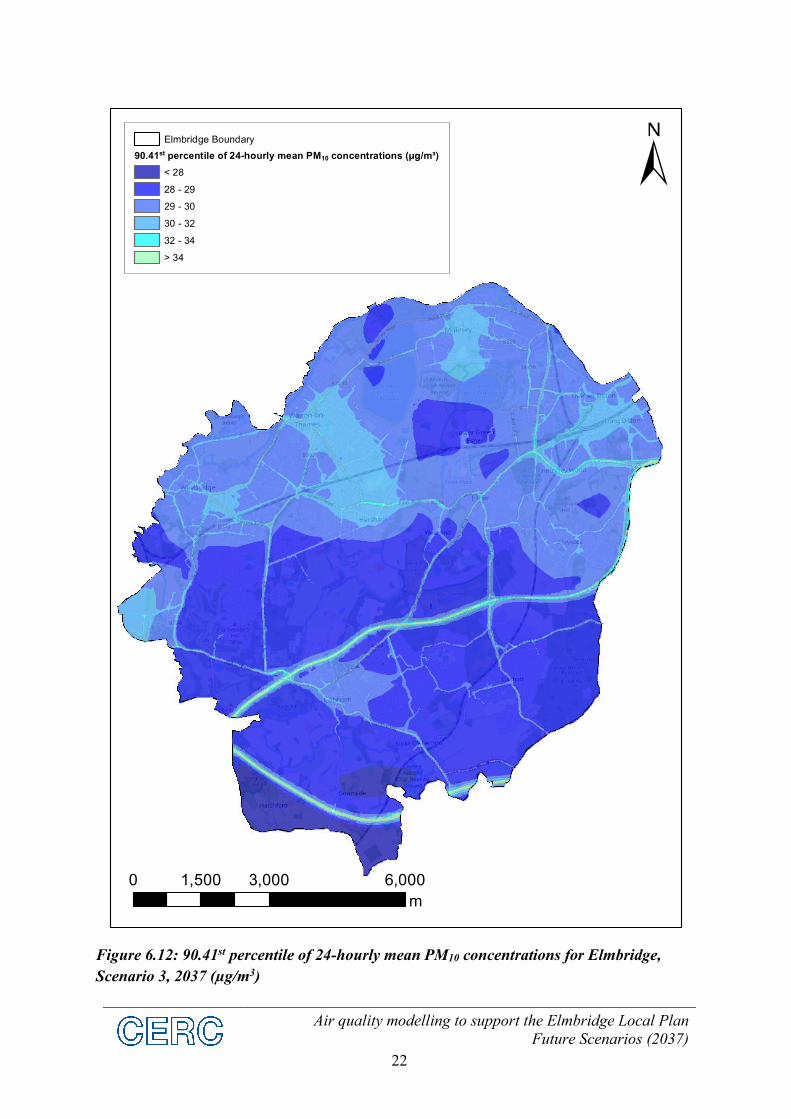
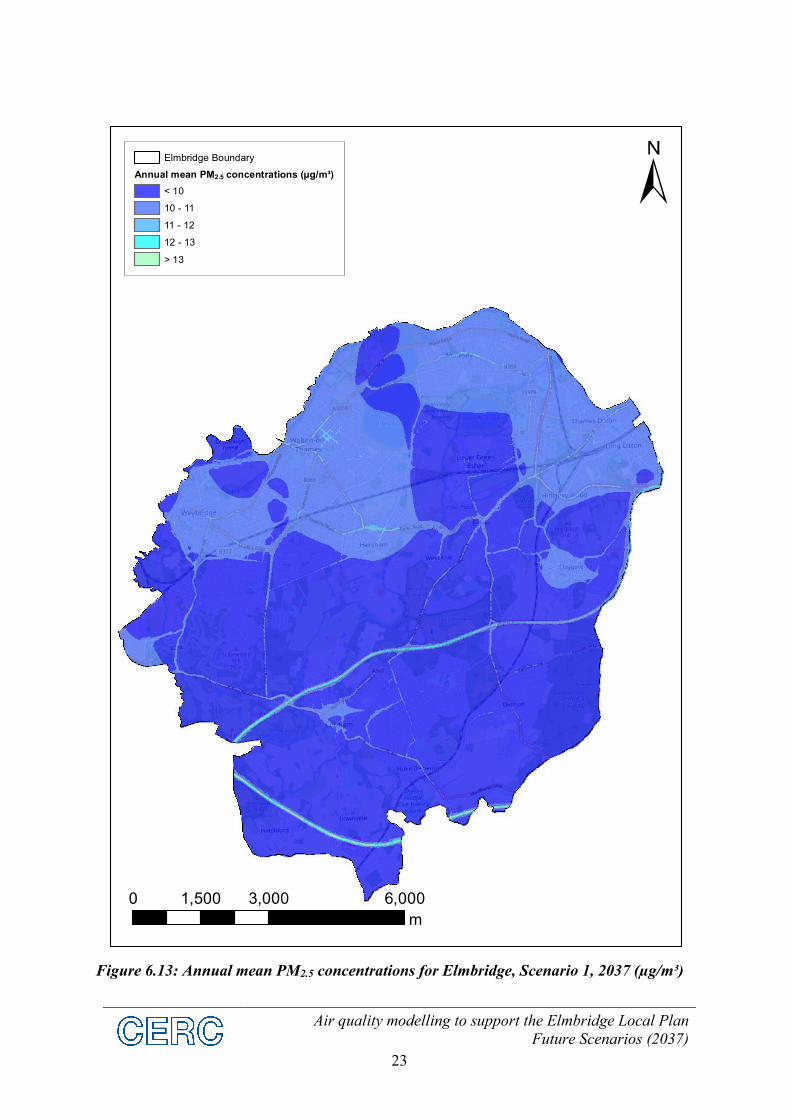
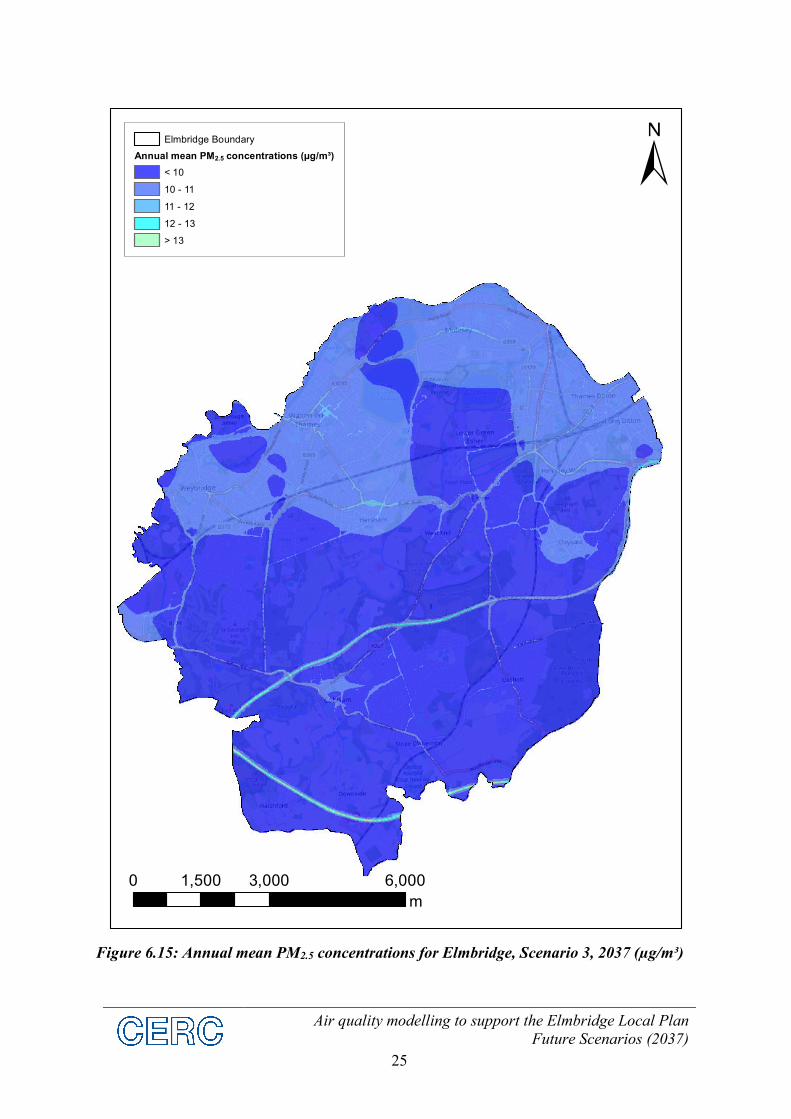
Figure 6.1 to Figure 6.15 present contour plots of the modelled annual and hourly mean NO2
concentrations, the modelled annual and daily mean PM10 concentrations and the annual mean
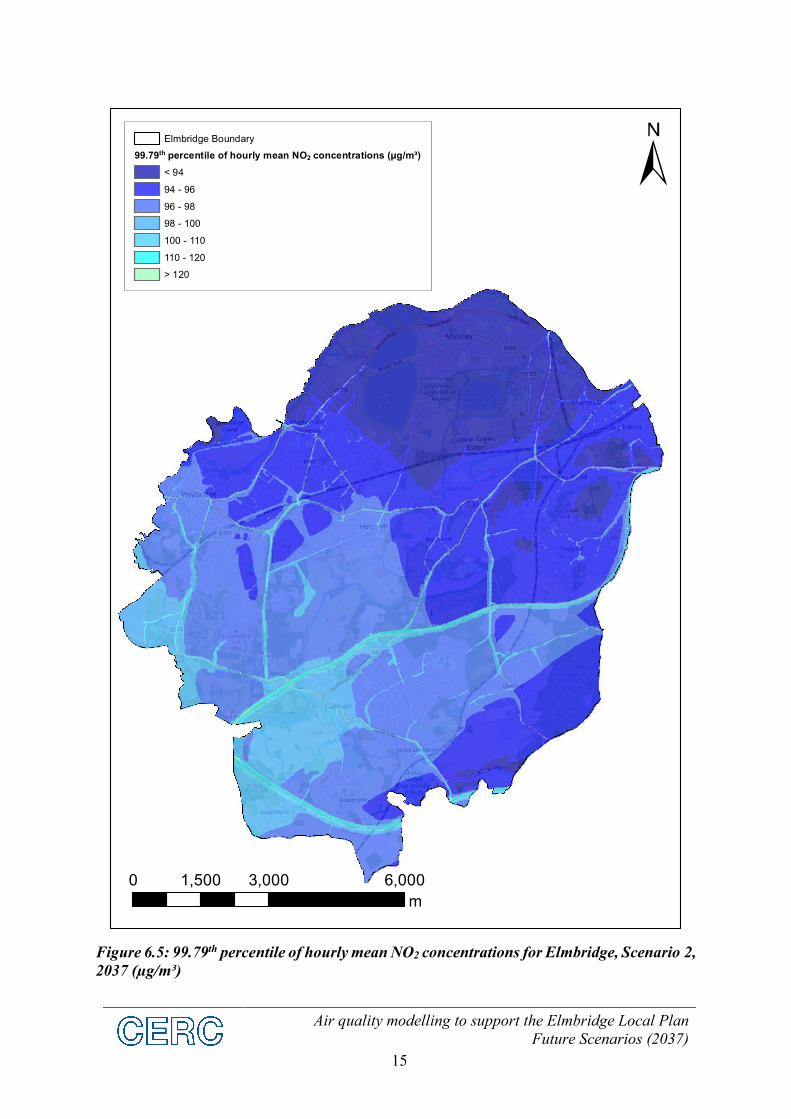
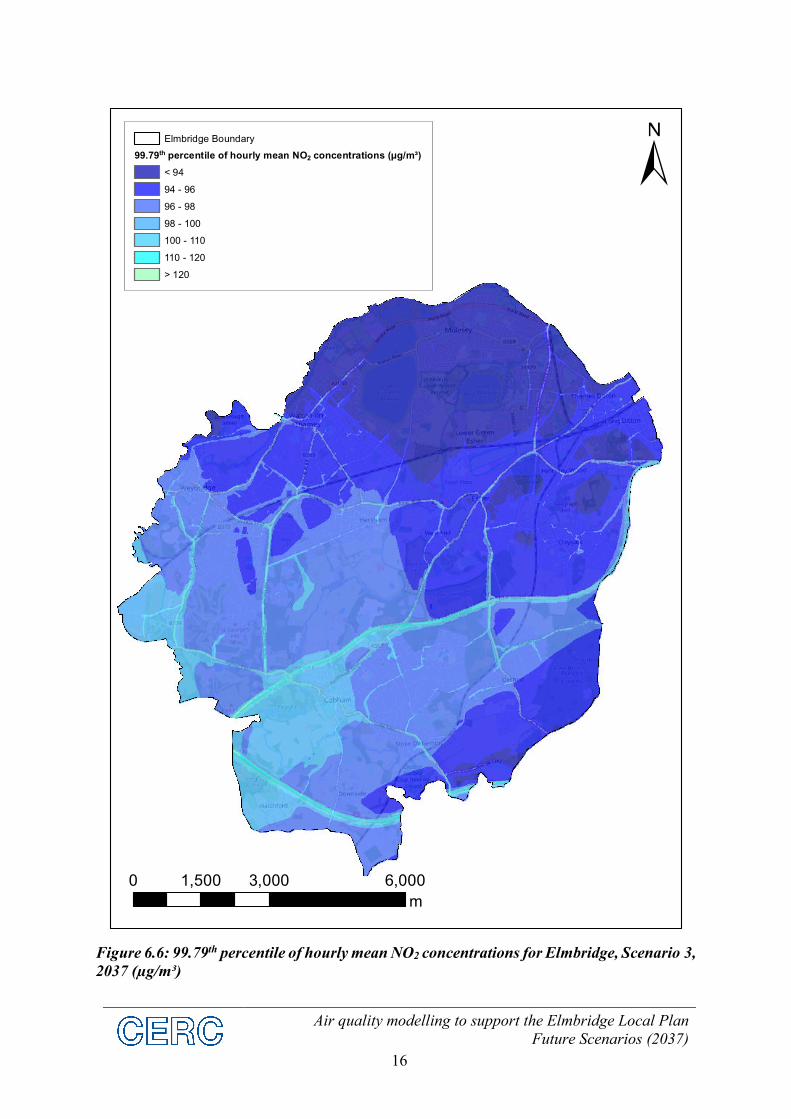
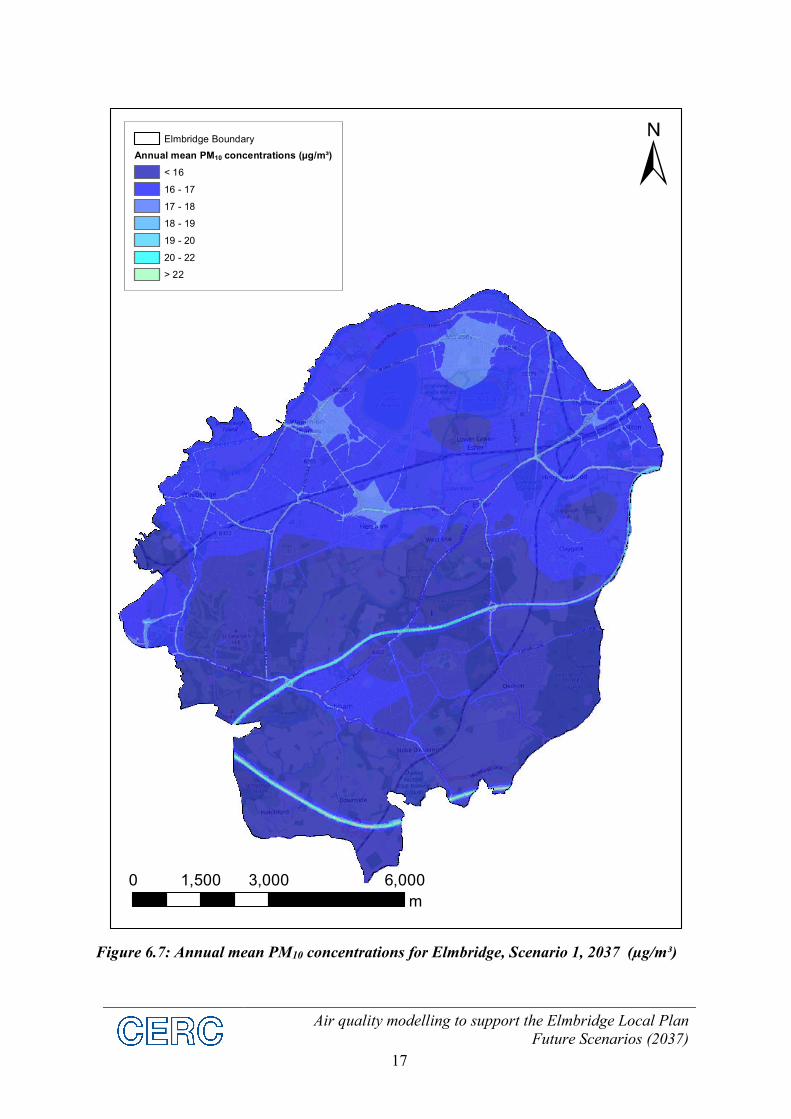
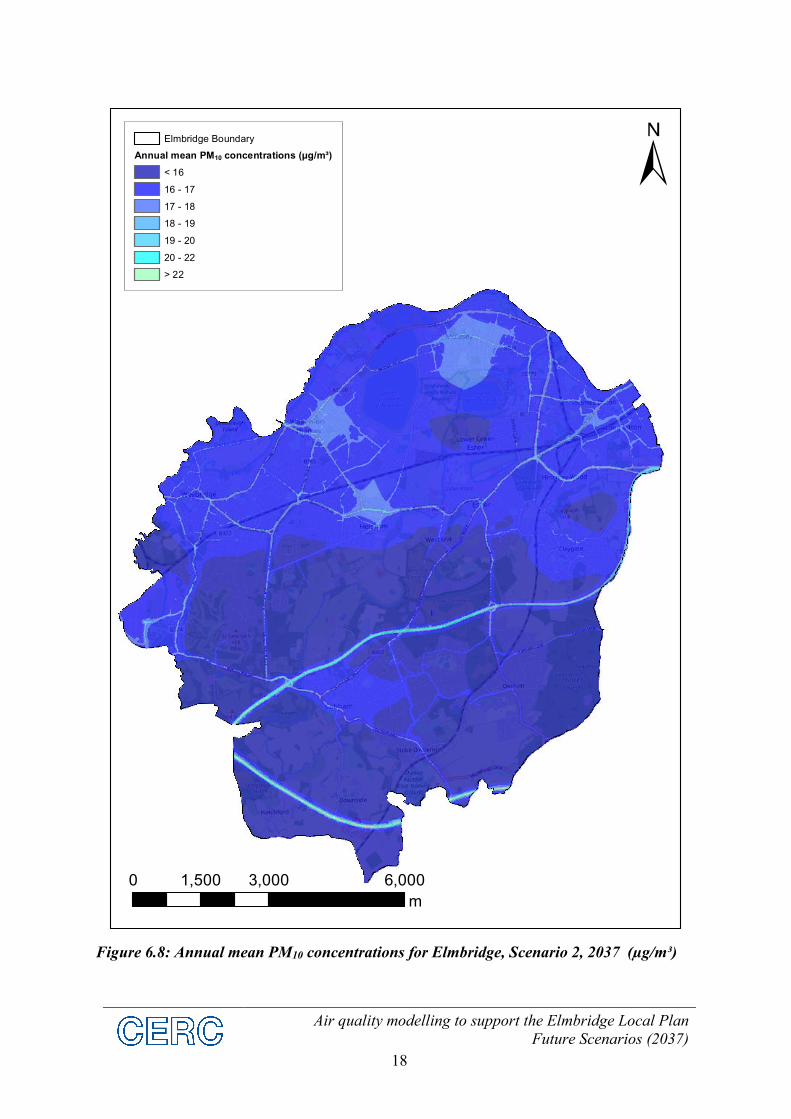
PM2.5 concentrations across Elmbridge for the 2037 scenarios. There are no exceedences of the
relevant air quality objectives in each case.
Air quality modelling to support the Elmbridge Local Plan
Future Scenarios (2037)
11
Figure 6.1: Annual mean NO2 concentrations for Elmbridge, Scenario 1, 2037 (µg/m³)
0 3,000 6,0001,500
m
Elmbridge Boundary
Annual mean NO2 concentrations (µg/m³)
< 12
12 - 14
14 - 16
16 - 18
18 - 20
20 - 22
> 22

Air quality modelling to support the Elmbridge Local Plan
Future Scenarios (2037)
12
Figure 6.2: Annual mean NO2 concentrations for Elmbridge, Scenario 2, 2037 (µg/m³)
0 3,000 6,0001,500
m
Elmbridge Boundary
Annual mean NO2 concentrations (µg/m³)
< 12
12 - 14
14 - 16
16 - 18
18 - 20
20 - 22
> 22
Air quality modelling to support the Elmbridge Local Plan
Future Scenarios (2037)
13
Figure 6.3: Annual mean NO2 concentrations for Elmbridge, Scenario 3, 2037 (µg/m³)
0 3,000 6,0001,500
m
Elmbridge Boundary
Annual mean NO2 concentrations (µg/m³)
< 12
12 - 14
14 - 16
16 - 18
18 - 20
20 - 22
> 22

Air quality modelling to support the Elmbridge Local Plan
Future Scenarios (2037)
14
Figure 6.4: 99.79th percentile of hourly mean NO2 concentrations for Elmbridge, Scenario 1,
2037 (µg/m³)
0 3,000 6,0001,500
m
Elmbridge Boundary
99.79th percentile of hourly mean NO2 concentrations (µg/m³)
< 94
94 - 96
96 - 98
98 - 100
100 - 110
110 - 120
> 120
Air quality modelling to support the Elmbridge Local Plan
Future Scenarios (2037)
15
Figure 6.5: 99.79th percentile of hourly mean NO2 concentrations for Elmbridge, Scenario 2,
2037 (µg/m³)
0 3,000 6,0001,500
m
Elmbridge Boundary
99.79th percentile of hourly mean NO2 concentrations (µg/m³)
< 94
94 - 96
96 - 98
98 - 100
100 - 110
110 - 120
> 120
Air quality modelling to support the Elmbridge Local Plan
Future Scenarios (2037)
16
Figure 6.6: 99.79th percentile of hourly mean NO2 concentrations for Elmbridge, Scenario 3,
2037 (µg/m³)
0 3,000 6,0001,500
m
Elmbridge Boundary
99.79th percentile of hourly mean NO2 concentrations (µg/m³)
< 94
94 - 96
96 - 98
98 - 100
100 - 110
110 - 120
> 120
Air quality modelling to support the Elmbridge Local Plan
Future Scenarios (2037)
17
Figure 6.7: Annual mean PM10 concentrations for Elmbridge, Scenario 1, 2037 (µg/m³)
0 3,000 6,0001,500
m
Elmbridge Boundary
Annual mean PM10 concentrations (µg/m³)
< 16
16 - 17
17 - 18
18 - 19
19 - 20
20 - 22
> 22
Air quality modelling to support the Elmbridge Local Plan
Future Scenarios (2037)
18
Figure 6.8: Annual mean PM10 concentrations for Elmbridge, Scenario 2, 2037 (µg/m³)
0 3,000 6,0001,500
m
Elmbridge Boundary
Annual mean PM10 concentrations (µg/m³)
< 16
16 - 17
17 - 18
18 - 19
19 - 20
20 - 22
> 22
Air quality modelling to support the Elmbridge Local Plan
Future Scenarios (2037)
19
Figure 6.9: Annual mean PM10 concentrations for Elmbridge, Scenario 3, 2037 (µg/m³)
0 3,000 6,0001,500
m
Elmbridge Boundary
Annual mean PM10 concentrations (µg/m³)
< 16
16 - 17
17 - 18
18 - 19
19 - 20
20 - 22
> 22

Air quality modelling to support the Elmbridge Local Plan
Future Scenarios (2037)
20
Figure 6.10: 90.41st percentile of 24-hourly mean PM10 concentrations for Elmbridge,
Scenario 1, 2037 (µg/m3)
0 3,000 6,0001,500
m
Elmbridge Boundary
90.41st percentile of 24-hourly mean PM10 concentrations (µg/m³)
< 28
28 - 29
29 - 30
30 - 32
32 - 34
> 34
Air quality modelling to support the Elmbridge Local Plan
Future Scenarios (2037)
21
Figure 6.11: 90.41st percentile of 24-hourly mean PM10 concentrations for Elmbridge,
Scenario 2, 2037 (µg/m3)
0 3,000 6,0001,500
m
Elmbridge Boundary
90.41st percentile of 24-hourly mean PM10 concentrations (µg/m³)
< 28
28 - 29
29 - 30
30 - 32
32 - 34
> 34
Air quality modelling to support the Elmbridge Local Plan
Future Scenarios (2037)
22
Figure 6.12: 90.41st percentile of 24-hourly mean PM10 concentrations for Elmbridge,
Scenario 3, 2037 (µg/m3)
0 3,000 6,0001,500
m
Elmbridge Boundary
90.41st percentile of 24-hourly mean PM10 concentrations (µg/m³)
< 28
28 - 29
29 - 30
30 - 32
32 - 34
> 34
Air quality modelling to support the Elmbridge Local Plan
Future Scenarios (2037)
23
Figure 6.13: Annual mean PM2.5 concentrations for Elmbridge, Scenario 1, 2037 (µg/m³)
0 3,000 6,0001,500
m
Elmbridge Boundary
Annual mean PM2.5 concentrations (µg/m³)
< 10
10 - 11
11 - 12
12 - 13
> 13

Air quality modelling to support the Elmbridge Local Plan
Future Scenarios (2037)
24
Figure 6.14: Annual mean PM2.5 concentrations for Elmbridge, Scenario 2, 2037 (µg/m³)
0 3,000 6,0001,500
m
Elmbridge Boundary
Annual mean PM2.5 concentrations (µg/m³)
< 10
10 - 11
11 - 12
12 - 13
> 13
Air quality modelling to support the Elmbridge Local Plan
Future Scenarios (2037)
25
Figure 6.15: Annual mean PM2.5 concentrations for Elmbridge, Scenario 3, 2037 (µg/m³)
0 3,000 6,0001,500
m
Elmbridge Boundary
Annual mean PM2.5 concentrations (µg/m³)
< 10
10 - 11
11 - 12
12 - 13
> 13

Air quality modelling to support the Elmbridge Local Plan
Future Scenarios (2037)
26
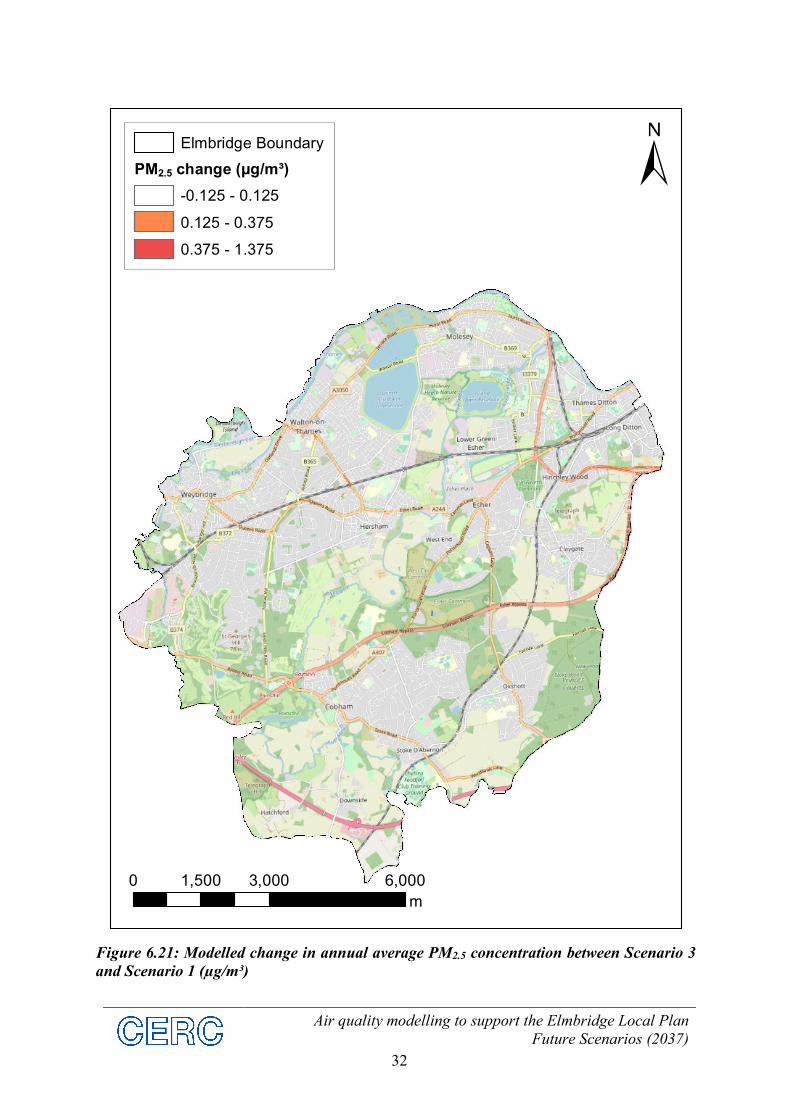
6.2 Difference plots
Difference plots were calculated by subtracting the modelled annual average concentrations of
Scenario 1, the future baseline, from Scenario 2, the Urban Growth Strategy scenario; or from
Scenario 3, the Urban Growth Strategy scenario with mitigation. The resulting concentrations
are shown as maps: areas coloured red show an increase in concentrations; areas coloured blue
show a decrease in concentrations; and areas with no colour show no significant change in
concentrations. The colour scale used in the difference plots reflects the percentage change
criteria used for IAQM EPUK significance assessments; a change of less than 0.5% of the
standard is generally considered to be negligible.
Figure 6.16 to Figure 6.21 show the modelled change in annual average NO2, PM10 and PM2.5
concentrations between Scenario 1 and Scenarios 2 and 3, with the Local Plan in place. In the
majority of the modelled area, the concentrations change by less than 0.5% of the relevant limit
values. Along some roads, the modelled changes in concentrations are greater, with the change
less than 1% at the majority of locations with relevant exposure.

Air quality modelling to support the Elmbridge Local Plan
Future Scenarios (2037)
27
Figure 6.16: Modelled change in annual average NO2 concentration between Scenario 2
and Scenario 1 (µg/m³)
0 3,000 6,0001,500
m
Elmbridge Boundary
NO2 change (µg/m³)
-0.2 - 0.2
0.2 - 0.6
0.6 - 2.2

Air quality modelling to support the Elmbridge Local Plan
Future Scenarios (2037)
28
Figure 6.17: Modelled change in annual average NO2 concentration between Scenario 3
and Scenario 1 (µg/m³)
0 3,000 6,0001,500
m
Elmbridge Boundary
NO2 change (µg/m³)
-0.2 - 0.2
0.2 - 0.6
0.6 - 2.2

Air quality modelling to support the Elmbridge Local Plan
Future Scenarios (2037)
29
Figure 6.18: Modelled change in annual average PM10 concentration between Scenario 2
and Scenario 1 (µg/m³)
0 3,000 6,0001,500
m
Elmbridge Boundary
PM10 change (µg/m³)
-0.2 - 0.2
0.2 - 0.6
0.6 - 2.2

Air quality modelling to support the Elmbridge Local Plan
Future Scenarios (2037)
30
Figure 6.19: Modelled change in annual average PM10 concentration between Scenario 3
and Scenario 1 (µg/m³)
0 3,000 6,0001,500
m
Elmbridge Boundary
PM10 change (µg/m³)
-0.2 - 0.2
0.2 - 0.6
0.6 - 2.2

Air quality modelling to support the Elmbridge Local Plan
Future Scenarios (2037)
31
Figure 6.20: Modelled change in annual average PM2.5 concentration between Scenario 2
and Scenario 1 (µg/m³)
0 3,000 6,0001,500
m
Elmbridge Boundary
PM2.5 change (µg/m³)
-0.125 - 0.125
0.125 - 0.375
0.375 - 1.375
Air quality modelling to support the Elmbridge Local Plan
Future Scenarios (2037)
32
Figure 6.21: Modelled change in annual average PM2.5 concentration between Scenario 3
and Scenario 1 (µg/m³)
0 3,000 6,0001,500
m
Elmbridge Boundary
PM2.5 change (µg/m³)
-0.125 - 0.125
0.125 - 0.375
0.375 - 1.375

Air quality modelling to support the Elmbridge Local Plan
Future Scenarios (2037)
33
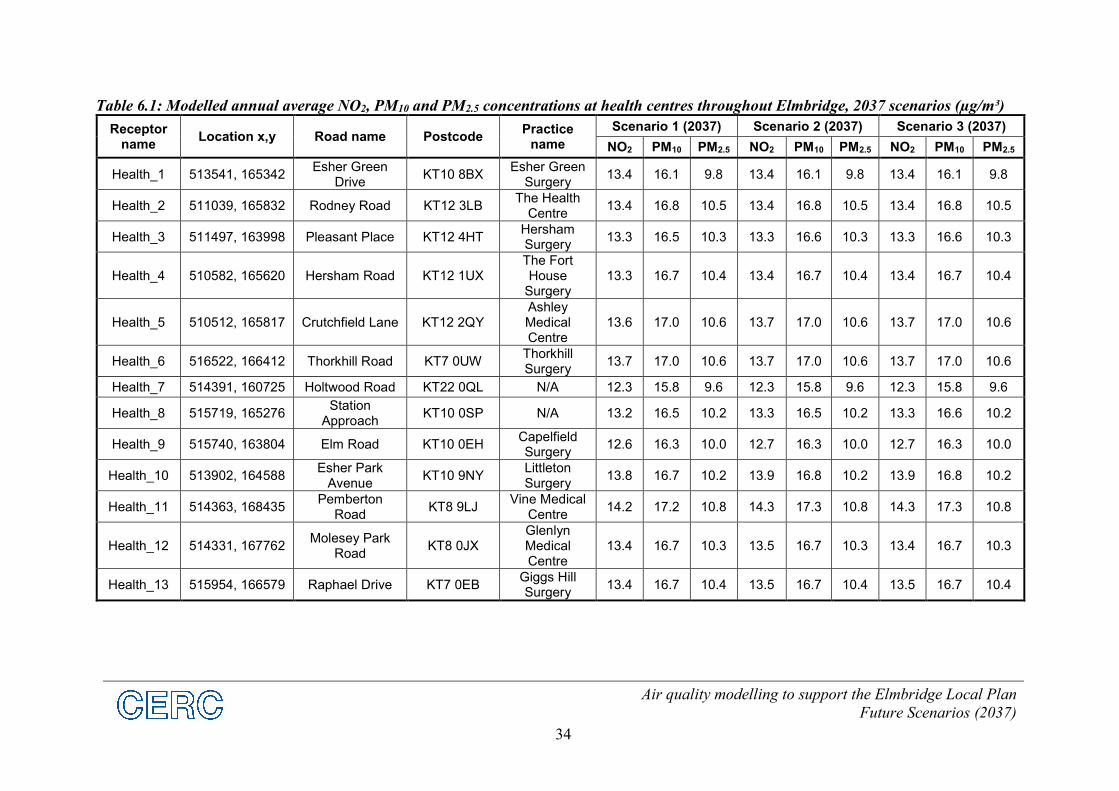
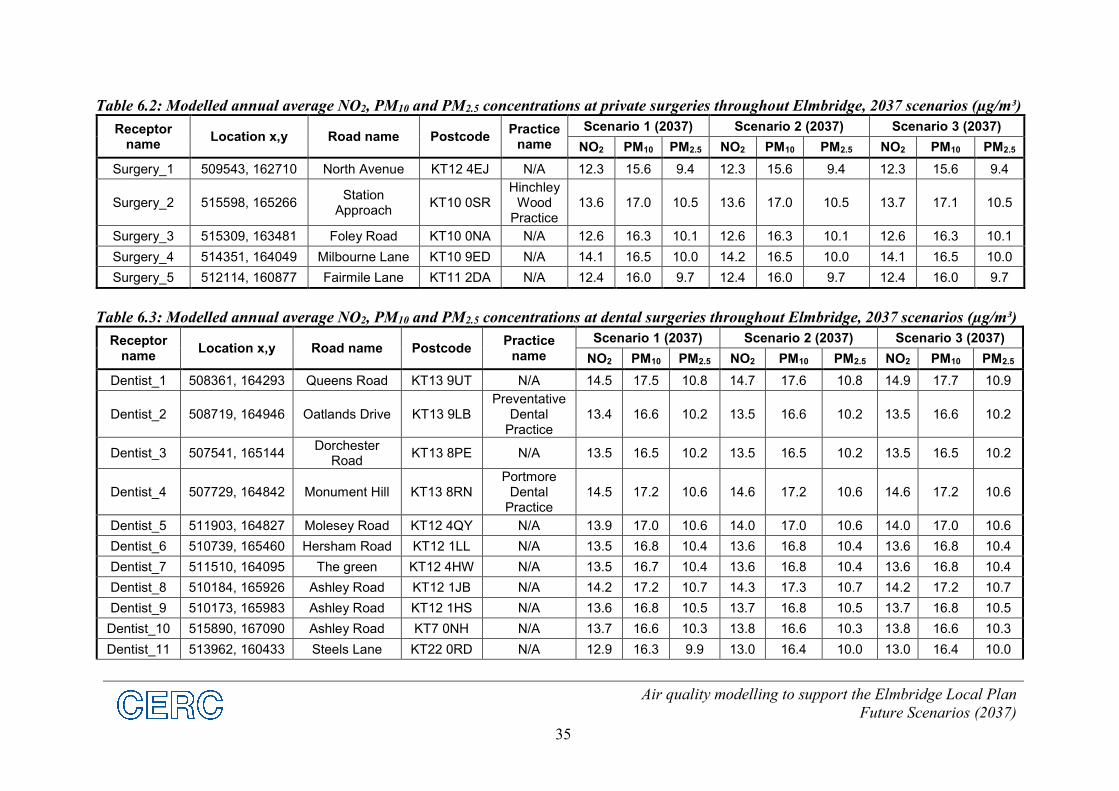
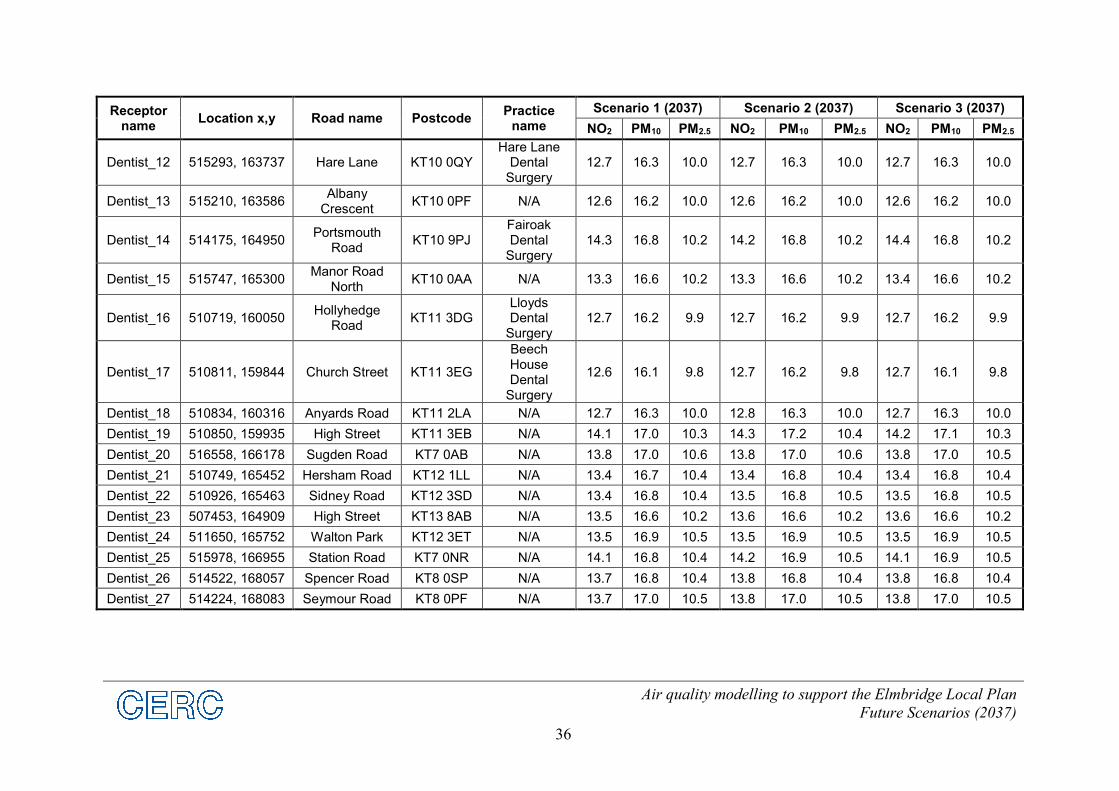
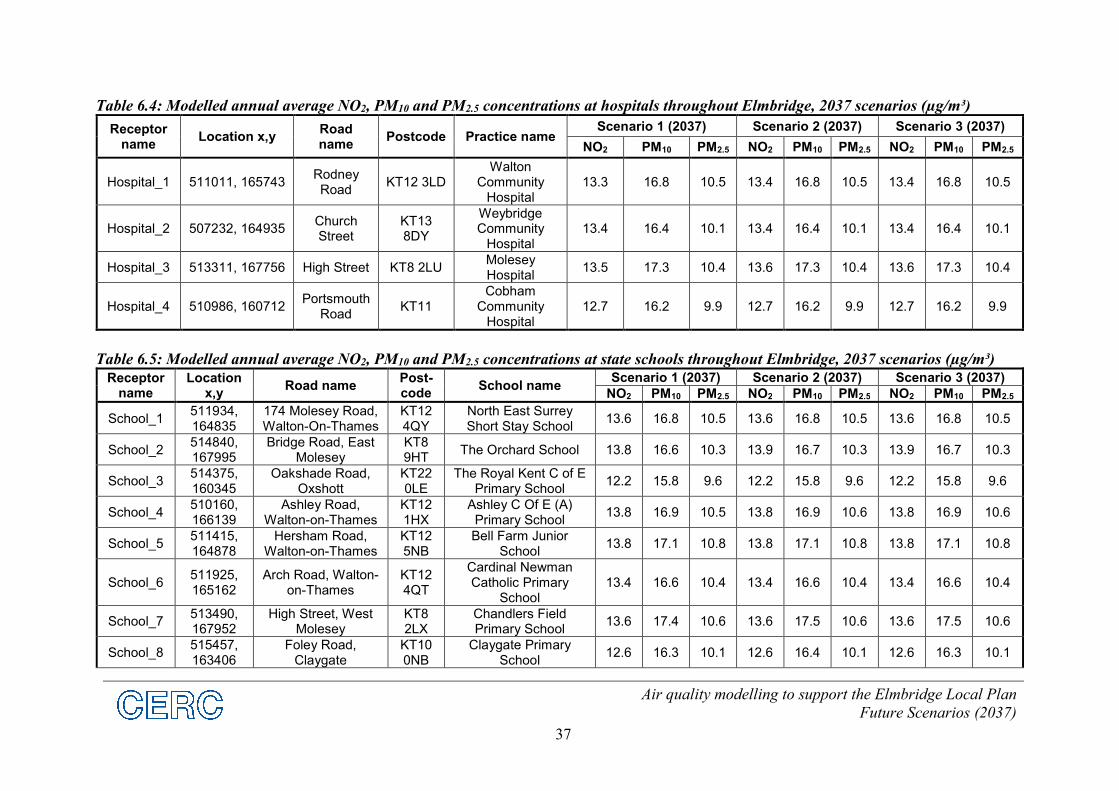
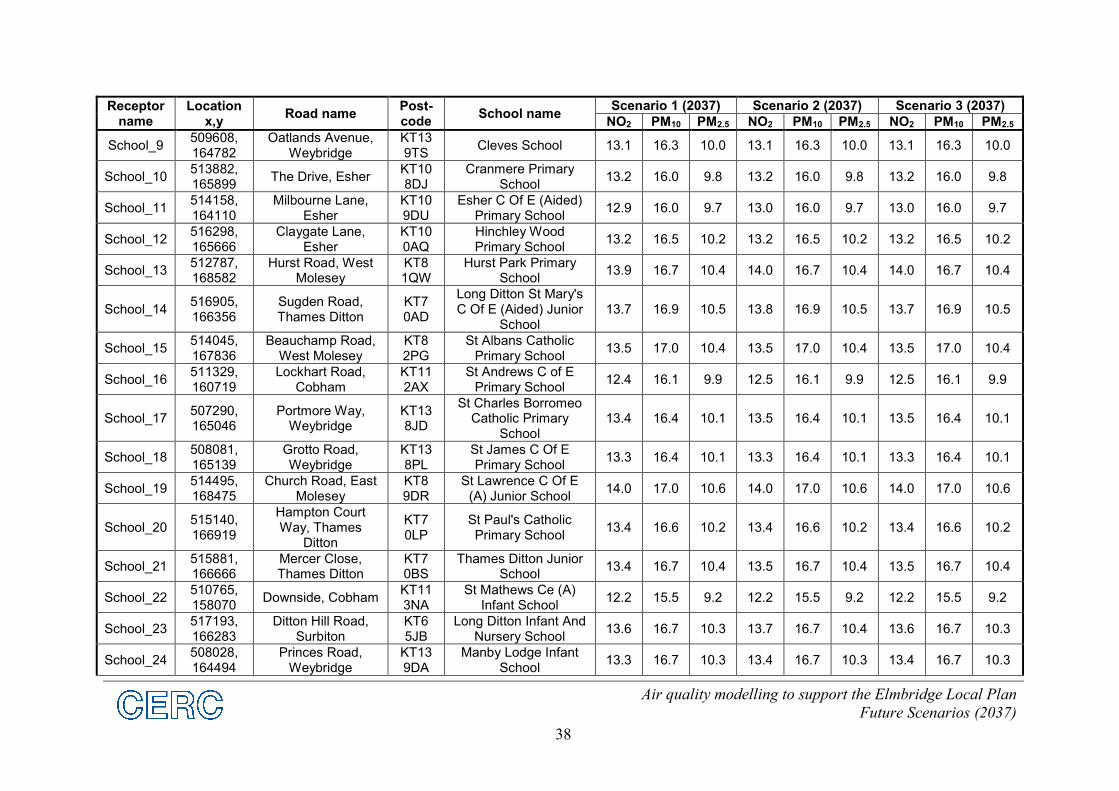
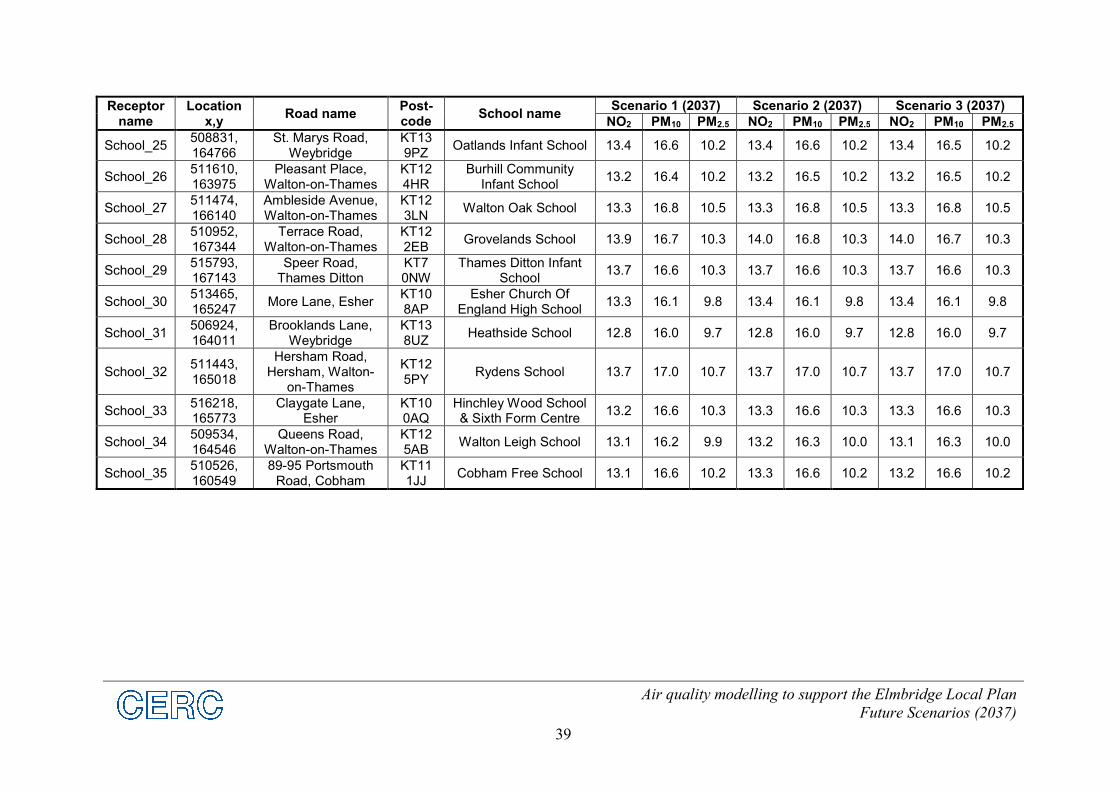
6.3 Health receptors
The following tables present the modelled concentrations for Scenario 1, 2 and 3 of NO2, PM10
and PM2.5:
Table 6.1 at health centres throughout Elmbridge
Table 6.2 at private surgeries throughout Elmbridge
Table 6.3 at dental surgeries throughout Elmbridge
Table 6.4 at hospitals throughout Elmbridge
Table 6.5 at state schools throughout Elmbridge
Air quality modelling to support the Elmbridge Local Plan
Future Scenarios (2037)
34
Table 6.1: Modelled annual average NO2, PM10 and PM2.5 concentrations at health centres throughout Elmbridge, 2037 scenarios (µg/m³)
Receptor name
Location x,y Road name Postcode Practice
name
Scenario 1 (2037) Scenario 2 (2037) Scenario 3 (2037)
NO2 PM10 PM2.5 NO2 PM10 PM2.5 NO2 PM10 PM2.5
Health_1 513541, 165342 Esher Green
Drive KT10 8BX
Esher Green Surgery
13.4 16.1 9.8 13.4 16.1 9.8 13.4 16.1 9.8
Health_2 511039, 165832 Rodney Road KT12 3LB The Health
Centre 13.4 16.8 10.5 13.4 16.8 10.5 13.4 16.8 10.5
Health_3 511497, 163998 Pleasant Place KT12 4HT Hersham Surgery
13.3 16.5 10.3 13.3 16.6 10.3 13.3 16.6 10.3
Health_4 510582, 165620 Hersham Road KT12 1UX The Fort House
Surgery 13.3 16.7 10.4 13.4 16.7 10.4 13.4 16.7 10.4
Health_5 510512, 165817 Crutchfield Lane KT12 2QY Ashley Medical Centre
13.6 17.0 10.6 13.7 17.0 10.6 13.7 17.0 10.6
Health_6 516522, 166412 Thorkhill Road KT7 0UW Thorkhill Surgery
13.7 17.0 10.6 13.7 17.0 10.6 13.7 17.0 10.6
Health_7 514391, 160725 Holtwood Road KT22 0QL N/A 12.3 15.8 9.6 12.3 15.8 9.6 12.3 15.8 9.6
Health_8 515719, 165276 Station
Approach KT10 0SP N/A 13.2 16.5 10.2 13.3 16.5 10.2 13.3 16.6 10.2
Health_9 515740, 163804 Elm Road KT10 0EH Capelfield Surgery
12.6 16.3 10.0 12.7 16.3 10.0 12.7 16.3 10.0
Health_10 513902, 164588 Esher Park
Avenue KT10 9NY
Littleton Surgery
13.8 16.7 10.2 13.9 16.8 10.2 13.9 16.8 10.2
Health_11 514363, 168435 Pemberton
Road KT8 9LJ
Vine Medical Centre
14.2 17.2 10.8 14.3 17.3 10.8 14.3 17.3 10.8
Health_12 514331, 167762 Molesey Park
Road KT8 0JX
Glenlyn Medical Centre
13.4 16.7 10.3 13.5 16.7 10.3 13.4 16.7 10.3
Health_13 515954, 166579 Raphael Drive KT7 0EB Giggs Hill Surgery
13.4 16.7 10.4 13.5 16.7 10.4 13.5 16.7 10.4
Air quality modelling to support the Elmbridge Local Plan
Future Scenarios (2037)
35
Table 6.2: Modelled annual average NO2, PM10 and PM2.5 concentrations at private surgeries throughout Elmbridge, 2037 scenarios (µg/m³)
Receptor name
Location x,y Road name Postcode Practice
name
Scenario 1 (2037) Scenario 2 (2037) Scenario 3 (2037)
NO2 PM10 PM2.5 NO2 PM10 PM2.5 NO2 PM10 PM2.5
Surgery_1 509543, 162710 North Avenue KT12 4EJ N/A 12.3 15.6 9.4 12.3 15.6 9.4 12.3 15.6 9.4
Surgery_2 515598, 165266 Station
Approach KT10 0SR
Hinchley Wood
Practice 13.6 17.0 10.5 13.6 17.0 10.5 13.7 17.1 10.5
Surgery_3 515309, 163481 Foley Road KT10 0NA N/A 12.6 16.3 10.1 12.6 16.3 10.1 12.6 16.3 10.1
Surgery_4 514351, 164049 Milbourne Lane KT10 9ED N/A 14.1 16.5 10.0 14.2 16.5 10.0 14.1 16.5 10.0
Surgery_5 512114, 160877 Fairmile Lane KT11 2DA N/A 12.4 16.0 9.7 12.4 16.0 9.7 12.4 16.0 9.7
Table 6.3: Modelled annual average NO2, PM10 and PM2.5 concentrations at dental surgeries throughout Elmbridge, 2037 scenarios (µg/m³)
Receptor name
Location x,y Road name Postcode Practice
name
Scenario 1 (2037) Scenario 2 (2037) Scenario 3 (2037)
NO2 PM10 PM2.5 NO2 PM10 PM2.5 NO2 PM10 PM2.5
Dentist_1 508361, 164293 Queens Road KT13 9UT N/A 14.5 17.5 10.8 14.7 17.6 10.8 14.9 17.7 10.9
Dentist_2 508719, 164946 Oatlands Drive KT13 9LB Preventative
Dental Practice
13.4 16.6 10.2 13.5 16.6 10.2 13.5 16.6 10.2
Dentist_3 507541, 165144 Dorchester
Road KT13 8PE N/A 13.5 16.5 10.2 13.5 16.5 10.2 13.5 16.5 10.2
Dentist_4 507729, 164842 Monument Hill KT13 8RN Portmore
Dental Practice
14.5 17.2 10.6 14.6 17.2 10.6 14.6 17.2 10.6
Dentist_5 511903, 164827 Molesey Road KT12 4QY N/A 13.9 17.0 10.6 14.0 17.0 10.6 14.0 17.0 10.6
Dentist_6 510739, 165460 Hersham Road KT12 1LL N/A 13.5 16.8 10.4 13.6 16.8 10.4 13.6 16.8 10.4
Dentist_7 511510, 164095 The green KT12 4HW N/A 13.5 16.7 10.4 13.6 16.8 10.4 13.6 16.8 10.4
Dentist_8 510184, 165926 Ashley Road KT12 1JB N/A 14.2 17.2 10.7 14.3 17.3 10.7 14.2 17.2 10.7
Dentist_9 510173, 165983 Ashley Road KT12 1HS N/A 13.6 16.8 10.5 13.7 16.8 10.5 13.7 16.8 10.5
Dentist_10 515890, 167090 Ashley Road KT7 0NH N/A 13.7 16.6 10.3 13.8 16.6 10.3 13.8 16.6 10.3
Dentist_11 513962, 160433 Steels Lane KT22 0RD N/A 12.9 16.3 9.9 13.0 16.4 10.0 13.0 16.4 10.0
Air quality modelling to support the Elmbridge Local Plan
Future Scenarios (2037)
36
Receptor name
Location x,y Road name Postcode Practice
name
Scenario 1 (2037) Scenario 2 (2037) Scenario 3 (2037)
NO2 PM10 PM2.5 NO2 PM10 PM2.5 NO2 PM10 PM2.5
Dentist_12 515293, 163737 Hare Lane KT10 0QY Hare Lane
Dental Surgery
12.7 16.3 10.0 12.7 16.3 10.0 12.7 16.3 10.0
Dentist_13 515210, 163586 Albany
Crescent KT10 0PF N/A 12.6 16.2 10.0 12.6 16.2 10.0 12.6 16.2 10.0
Dentist_14 514175, 164950 Portsmouth
Road KT10 9PJ
Fairoak Dental
Surgery 14.3 16.8 10.2 14.2 16.8 10.2 14.4 16.8 10.2
Dentist_15 515747, 165300 Manor Road
North KT10 0AA N/A 13.3 16.6 10.2 13.3 16.6 10.2 13.4 16.6 10.2
Dentist_16 510719, 160050 Hollyhedge
Road KT11 3DG
Lloyds Dental
Surgery 12.7 16.2 9.9 12.7 16.2 9.9 12.7 16.2 9.9
Dentist_17 510811, 159844 Church Street KT11 3EG
Beech House Dental
Surgery
12.6 16.1 9.8 12.7 16.2 9.8 12.7 16.1 9.8
Dentist_18 510834, 160316 Anyards Road KT11 2LA N/A 12.7 16.3 10.0 12.8 16.3 10.0 12.7 16.3 10.0
Dentist_19 510850, 159935 High Street KT11 3EB N/A 14.1 17.0 10.3 14.3 17.2 10.4 14.2 17.1 10.3
Dentist_20 516558, 166178 Sugden Road KT7 0AB N/A 13.8 17.0 10.6 13.8 17.0 10.6 13.8 17.0 10.5
Dentist_21 510749, 165452 Hersham Road KT12 1LL N/A 13.4 16.7 10.4 13.4 16.8 10.4 13.4 16.8 10.4
Dentist_22 510926, 165463 Sidney Road KT12 3SD N/A 13.4 16.8 10.4 13.5 16.8 10.5 13.5 16.8 10.5
Dentist_23 507453, 164909 High Street KT13 8AB N/A 13.5 16.6 10.2 13.6 16.6 10.2 13.6 16.6 10.2
Dentist_24 511650, 165752 Walton Park KT12 3ET N/A 13.5 16.9 10.5 13.5 16.9 10.5 13.5 16.9 10.5
Dentist_25 515978, 166955 Station Road KT7 0NR N/A 14.1 16.8 10.4 14.2 16.9 10.5 14.1 16.9 10.5
Dentist_26 514522, 168057 Spencer Road KT8 0SP N/A 13.7 16.8 10.4 13.8 16.8 10.4 13.8 16.8 10.4
Dentist_27 514224, 168083 Seymour Road KT8 0PF N/A 13.7 17.0 10.5 13.8 17.0 10.5 13.8 17.0 10.5
Air quality modelling to support the Elmbridge Local Plan
Future Scenarios (2037)
37
Table 6.4: Modelled annual average NO2, PM10 and PM2.5 concentrations at hospitals throughout Elmbridge, 2037 scenarios (µg/m³)
Receptor name
Location x,y Road name
Postcode Practice name Scenario 1 (2037) Scenario 2 (2037) Scenario 3 (2037)
NO2 PM10 PM2.5 NO2 PM10 PM2.5 NO2 PM10 PM2.5
Hospital_1 511011, 165743 Rodney Road
KT12 3LD Walton
Community Hospital
13.3 16.8 10.5 13.4 16.8 10.5 13.4 16.8 10.5
Hospital_2 507232, 164935 Church Street
KT13 8DY
Weybridge Community
Hospital 13.4 16.4 10.1 13.4 16.4 10.1 13.4 16.4 10.1
Hospital_3 513311, 167756 High Street KT8 2LU Molesey Hospital
13.5 17.3 10.4 13.6 17.3 10.4 13.6 17.3 10.4
Hospital_4 510986, 160712 Portsmouth
Road KT11
Cobham Community
Hospital 12.7 16.2 9.9 12.7 16.2 9.9 12.7 16.2 9.9
Table 6.5: Modelled annual average NO2, PM10 and PM2.5 concentrations at state schools throughout Elmbridge, 2037 scenarios (µg/m³)
Receptor name
Location x,y
Road name Post-code
School name Scenario 1 (2037) Scenario 2 (2037) Scenario 3 (2037)
NO2 PM10 PM2.5 NO2 PM10 PM2.5 NO2 PM10 PM2.5
School_1 511934, 164835
174 Molesey Road, Walton-On-Thames
KT12 4QY
North East Surrey Short Stay School
13.6 16.8 10.5 13.6 16.8 10.5 13.6 16.8 10.5
School_2 514840, 167995
Bridge Road, East Molesey
KT8 9HT
The Orchard School 13.8 16.6 10.3 13.9 16.7 10.3 13.9 16.7 10.3
School_3 514375, 160345
Oakshade Road, Oxshott
KT22 0LE
The Royal Kent C of E Primary School
12.2 15.8 9.6 12.2 15.8 9.6 12.2 15.8 9.6
School_4 510160, 166139
Ashley Road, Walton-on-Thames
KT12 1HX
Ashley C Of E (A) Primary School
13.8 16.9 10.5 13.8 16.9 10.6 13.8 16.9 10.6
School_5 511415, 164878
Hersham Road, Walton-on-Thames
KT12 5NB
Bell Farm Junior School
13.8 17.1 10.8 13.8 17.1 10.8 13.8 17.1 10.8
School_6 511925, 165162
Arch Road, Walton-on-Thames
KT12 4QT
Cardinal Newman Catholic Primary
School 13.4 16.6 10.4 13.4 16.6 10.4 13.4 16.6 10.4
School_7 513490, 167952
High Street, West Molesey
KT8 2LX
Chandlers Field Primary School
13.6 17.4 10.6 13.6 17.5 10.6 13.6 17.5 10.6
School_8 515457, 163406
Foley Road, Claygate
KT10 0NB
Claygate Primary School
12.6 16.3 10.1 12.6 16.4 10.1 12.6 16.3 10.1
Air quality modelling to support the Elmbridge Local Plan
Future Scenarios (2037)
38
Receptor name
Location x,y
Road name Post-code
School name Scenario 1 (2037) Scenario 2 (2037) Scenario 3 (2037)
NO2 PM10 PM2.5 NO2 PM10 PM2.5 NO2 PM10 PM2.5
School_9 509608, 164782
Oatlands Avenue, Weybridge
KT13 9TS
Cleves School 13.1 16.3 10.0 13.1 16.3 10.0 13.1 16.3 10.0
School_10 513882, 165899
The Drive, Esher KT10 8DJ
Cranmere Primary School
13.2 16.0 9.8 13.2 16.0 9.8 13.2 16.0 9.8
School_11 514158, 164110
Milbourne Lane, Esher
KT10 9DU
Esher C Of E (Aided) Primary School
12.9 16.0 9.7 13.0 16.0 9.7 13.0 16.0 9.7
School_12 516298, 165666
Claygate Lane, Esher
KT10 0AQ
Hinchley Wood Primary School
13.2 16.5 10.2 13.2 16.5 10.2 13.2 16.5 10.2
School_13 512787, 168582
Hurst Road, West Molesey
KT8 1QW
Hurst Park Primary School
13.9 16.7 10.4 14.0 16.7 10.4 14.0 16.7 10.4
School_14 516905, 166356
Sugden Road, Thames Ditton
KT7 0AD
Long Ditton St Mary's C Of E (Aided) Junior
School 13.7 16.9 10.5 13.8 16.9 10.5 13.7 16.9 10.5
School_15 514045, 167836
Beauchamp Road, West Molesey
KT8 2PG
St Albans Catholic Primary School
13.5 17.0 10.4 13.5 17.0 10.4 13.5 17.0 10.4
School_16 511329, 160719
Lockhart Road, Cobham
KT11 2AX
St Andrews C of E Primary School
12.4 16.1 9.9 12.5 16.1 9.9 12.5 16.1 9.9
School_17 507290, 165046
Portmore Way, Weybridge
KT13 8JD
St Charles Borromeo Catholic Primary
School 13.4 16.4 10.1 13.5 16.4 10.1 13.5 16.4 10.1
School_18 508081, 165139
Grotto Road, Weybridge
KT13 8PL
St James C Of E Primary School
13.3 16.4 10.1 13.3 16.4 10.1 13.3 16.4 10.1
School_19 514495, 168475
Church Road, East Molesey
KT8 9DR
St Lawrence C Of E (A) Junior School
14.0 17.0 10.6 14.0 17.0 10.6 14.0 17.0 10.6
School_20 515140, 166919
Hampton Court Way, Thames
Ditton
KT7 0LP
St Paul's Catholic Primary School
13.4 16.6 10.2 13.4 16.6 10.2 13.4 16.6 10.2
School_21 515881, 166666
Mercer Close, Thames Ditton
KT7 0BS
Thames Ditton Junior School
13.4 16.7 10.4 13.5 16.7 10.4 13.5 16.7 10.4
School_22 510765, 158070
Downside, Cobham KT11 3NA
St Mathews Ce (A) Infant School
12.2 15.5 9.2 12.2 15.5 9.2 12.2 15.5 9.2
School_23 517193, 166283
Ditton Hill Road, Surbiton
KT6 5JB
Long Ditton Infant And Nursery School
13.6 16.7 10.3 13.7 16.7 10.4 13.6 16.7 10.3
School_24 508028, 164494
Princes Road, Weybridge
KT13 9DA
Manby Lodge Infant School
13.3 16.7 10.3 13.4 16.7 10.3 13.4 16.7 10.3
Air quality modelling to support the Elmbridge Local Plan
Future Scenarios (2037)
39
Receptor name
Location x,y
Road name Post-code
School name Scenario 1 (2037) Scenario 2 (2037) Scenario 3 (2037)
NO2 PM10 PM2.5 NO2 PM10 PM2.5 NO2 PM10 PM2.5
School_25 508831, 164766
St. Marys Road, Weybridge
KT13 9PZ
Oatlands Infant School 13.4 16.6 10.2 13.4 16.6 10.2 13.4 16.5 10.2
School_26 511610, 163975
Pleasant Place, Walton-on-Thames
KT12 4HR
Burhill Community Infant School
13.2 16.4 10.2 13.2 16.5 10.2 13.2 16.5 10.2
School_27 511474, 166140
Ambleside Avenue, Walton-on-Thames
KT12 3LN
Walton Oak School 13.3 16.8 10.5 13.3 16.8 10.5 13.3 16.8 10.5
School_28 510952, 167344
Terrace Road, Walton-on-Thames
KT12 2EB
Grovelands School 13.9 16.7 10.3 14.0 16.8 10.3 14.0 16.7 10.3
School_29 515793, 167143
Speer Road, Thames Ditton
KT7 0NW
Thames Ditton Infant School
13.7 16.6 10.3 13.7 16.6 10.3 13.7 16.6 10.3
School_30 513465, 165247
More Lane, Esher KT10 8AP
Esher Church Of England High School
13.3 16.1 9.8 13.4 16.1 9.8 13.4 16.1 9.8
School_31 506924, 164011
Brooklands Lane, Weybridge
KT13 8UZ
Heathside School 12.8 16.0 9.7 12.8 16.0 9.7 12.8 16.0 9.7
School_32 511443, 165018
Hersham Road, Hersham, Walton-
on-Thames
KT12 5PY
Rydens School 13.7 17.0 10.7 13.7 17.0 10.7 13.7 17.0 10.7
School_33 516218, 165773
Claygate Lane, Esher
KT10 0AQ
Hinchley Wood School & Sixth Form Centre
13.2 16.6 10.3 13.3 16.6 10.3 13.3 16.6 10.3
School_34 509534, 164546
Queens Road, Walton-on-Thames
KT12 5AB
Walton Leigh School 13.1 16.2 9.9 13.2 16.3 10.0 13.1 16.3 10.0
School_35 510526, 160549
89-95 Portsmouth Road, Cobham
KT11 1JJ
Cobham Free School 13.1 16.6 10.2 13.3 16.6 10.2 13.2 16.6 10.2
Air quality modelling to support the Elmbridge Local Plan
Future Scenarios (2037)
40
6.4 Mortality burden
This section summarises local mortality burden of air pollution calculations. It includes the
calculation of the number of deaths attributable to air pollution, the associated life-years lost
and economic cost.
The mortality burden was assessed using the approach set out in Section 8.3 of the current
baseline (2017) report.
The Office for National Statistics (ONS) population10 and death11 data split by age for each
LSOA was updated to the latest available data, for the year 2019.
The economic cost of £42,780 for chronic mortality at 2017 prices in the Defra guidance12 was
projected to £62,569 for 2037, using a 2% per annum uplift. This approach is based on the
methodology used for the activity and damage costs in the Defra guidance.
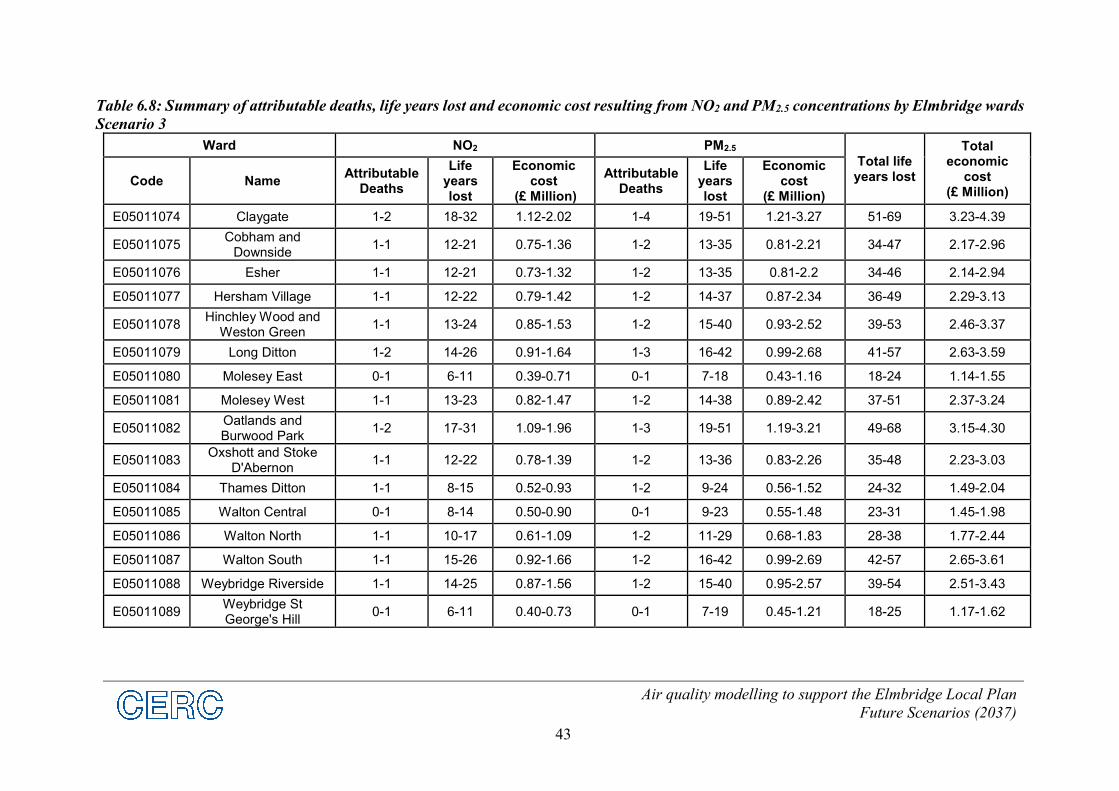
Table 6.6 to Table 6.8 present a mortality burden associated with NO2 and PM2.5 concentrations
by ward, across Elmbridge, for Scenarios 1, 2 and 3.
10https://www.ons.gov.uk/peoplepopulationandcommunity/populationandmigration/populationestimates/datasets
/lowersuperoutputareamidyearpopulationestimates 11https://www.ons.gov.uk/peoplepopulationandcommunity/birthsdeathsandmarriages/deaths/adhocs/12668deathr
egistrationsbylowerlayersuperoutputarealsoaenglandandwales2019 12 https://www.gov.uk/government/publications/assess-the-impact-of-air-quality/air-quality-appraisal-impact-
pathways-approach

Air quality modelling to support the Elmbridge Local Plan
Future Scenarios (2037)
41
Table 6.6: Summary of attributable deaths, life years lost and economic cost resulting from NO2 and PM2.5 concentrations by Elmbridge wards
Scenario 1
Ward NO2 PM2.5
Total life years lost
Total economic
cost (£ Million)
Code Name Attributable
Deaths
Life years lost
Economic cost
(£ Million)
Attributable Deaths
Life years lost
Economic cost
(£ Million)
E05011074 Claygate 1-2 18-32 1.12-2.01 1-4 19-51 1.21-3.26 51-69 3.22-4.38
E05011075 Cobham and
Downside 1-1 12-21 0.75-1.35 1-2 13-35 0.81-2.2 34-46 2.16-2.95
E05011076 Esher 1-1 11-21 0.73-1.32 1-2 13-35 0.81-2.2 33-46 2.13-2.93
E05011077 Hersham Village 1-1 12-22 0.79-1.41 1-2 14-37 0.87-2.34 36-49 2.28-3.13
E05011078 Hinchley Wood and
Weston Green 1-1 13-24 0.85-1.52 1-2 15-40 0.93-2.51 39-53 2.45-3.36
E05011079 Long Ditton 1-2 14-26 0.91-1.64 1-3 16-42 0.99-2.68 41-56 2.63-3.59
E05011080 Molesey East 0-1 6-11 0.39-0.71 0-1 7-18 0.43-1.16 18-24 1.13-1.55
E05011081 Molesey West 1-1 13-23 0.81-1.47 1-2 14-38 0.89-2.42 37-51 2.36-3.23
E05011082 Oatlands and Burwood Park
1-2 17-31 1.09-1.95 1-3 19-50 1.19-3.21 49-68 3.14-4.29
E05011083 Oxshott and Stoke
D'Abernon 1-1 12-22 0.77-1.39 1-2 13-35 0.83-2.25 35-48 2.22-3.03
E05011084 Thames Ditton 1-1 8-15 0.52-0.93 1-2 9-24 0.56-1.52 23-32 1.49-2.04
E05011085 Walton Central 0-1 8-14 0.50-0.90 0-1 9-23 0.55-1.48 23-31 1.45-1.98
E05011086 Walton North 1-1 9-17 0.60-1.09 1-2 11-29 0.67-1.83 28-38 1.76-2.43
E05011087 Walton South 1-1 14-26 0.92-1.65 1-2 16-42 0.99-2.68 42-57 2.64-3.60
E05011088 Weybridge Riverside 1-1 14-24 0.86-1.55 1-2 15-40 0.95-2.57 39-54 2.50-3.43
E05011089 Weybridge St George's Hill
0-1 6-11 0.40-0.72 0-1 7-19 0.45-1.21 18-25 1.17-1.61

Air quality modelling to support the Elmbridge Local Plan
Future Scenarios (2037)
42
Table 6.7: Summary of attributable deaths, life years lost and economic cost resulting from NO2 and PM2.5 concentrations by Elmbridge wards
Scenario 2
Ward NO2 PM2.5
Total life years lost
Total economic
cost (£ Million)
Code Name Attributable
Deaths
Life years lost
Economic cost
(£ Million)
Attributable Deaths
Life years lost
Economic cost
(£ Million)
E05011074 Claygate 1-2 18-32 1.12-2.02 1-4 19-51 1.21-3.27 51-69 3.23-4.39
E05011075 Cobham and
Downside 1-1 12-21 0.75-1.36 1-2 13-35 0.81-2.20 34-47 2.17-2.96
E05011076 Esher 1-1 12-21 0.73-1.32 1-2 13-35 0.81-2.20 34-46 2.14-2.94
E05011077 Hersham Village 1-1 12-22 0.79-1.42 1-2 14-37 0.87-2.34 36-49 2.29-3.13
E05011078 Hinchley Wood and
Weston Green 1-1 13-24 0.85-1.53 1-2 15-40 0.93-2.52 39-53 2.46-3.37
E05011079 Long Ditton 1-2 14-26 0.91-1.64 1-3 16-42 0.99-2.68 41-57 2.63-3.6
E05011080 Molesey East 0-1 6-11 0.39-0.71 0-1 7-18 0.43-1.16 18-24 1.14-1.55
E05011081 Molesey West 1-1 13-23 0.82-1.47 1-2 14-38 0.89-2.42 37-51 2.37-3.24
E05011082 Oatlands and Burwood Park
1-2 17-31 1.09-1.96 1-3 19-51 1.19-3.21 49-68 3.15-4.30
E05011083 Oxshott and Stoke
D'Abernon 1-1 12-22 0.78-1.39 1-2 13-36 0.83-2.26 35-48 2.23-3.03
E05011084 Thames Ditton 1-1 8-15 0.52-0.93 1-2 9-24 0.56-1.52 24-32 1.50-2.04
E05011085 Walton Central 0-1 8-14 0.50-0.90 0-1 9-23 0.55-1.48 23-31 1.45-1.98
E05011086 Walton North 1-1 10-17 0.61-1.09 1-2 11-29 0.68-1.83 28-38 1.77-2.43
E05011087 Walton South 1-1 15-26 0.92-1.66 1-2 16-42 0.99-2.69 42-57 2.65-3.61
E05011088 Weybridge Riverside 1-1 14-25 0.87-1.56 1-2 15-40 0.95-2.57 39-54 2.51-3.44
E05011089 Weybridge St George's Hill
0-1 6-11 0.40-0.73 0-1 7-19 0.45-1.21 18-25 1.17-1.62
Air quality modelling to support the Elmbridge Local Plan
Future Scenarios (2037)
43
Table 6.8: Summary of attributable deaths, life years lost and economic cost resulting from NO2 and PM2.5 concentrations by Elmbridge wards
Scenario 3
Ward NO2 PM2.5
Total life years lost
Total economic
cost (£ Million)
Code Name Attributable
Deaths
Life years lost
Economic cost
(£ Million)
Attributable Deaths
Life years lost
Economic cost
(£ Million)
E05011074 Claygate 1-2 18-32 1.12-2.02 1-4 19-51 1.21-3.27 51-69 3.23-4.39
E05011075 Cobham and
Downside 1-1 12-21 0.75-1.36 1-2 13-35 0.81-2.21 34-47 2.17-2.96
E05011076 Esher 1-1 12-21 0.73-1.32 1-2 13-35 0.81-2.2 34-46 2.14-2.94
E05011077 Hersham Village 1-1 12-22 0.79-1.42 1-2 14-37 0.87-2.34 36-49 2.29-3.13
E05011078 Hinchley Wood and
Weston Green 1-1 13-24 0.85-1.53 1-2 15-40 0.93-2.52 39-53 2.46-3.37
E05011079 Long Ditton 1-2 14-26 0.91-1.64 1-3 16-42 0.99-2.68 41-57 2.63-3.59
E05011080 Molesey East 0-1 6-11 0.39-0.71 0-1 7-18 0.43-1.16 18-24 1.14-1.55
E05011081 Molesey West 1-1 13-23 0.82-1.47 1-2 14-38 0.89-2.42 37-51 2.37-3.24
E05011082 Oatlands and Burwood Park
1-2 17-31 1.09-1.96 1-3 19-51 1.19-3.21 49-68 3.15-4.30
E05011083 Oxshott and Stoke
D'Abernon 1-1 12-22 0.78-1.39 1-2 13-36 0.83-2.26 35-48 2.23-3.03
E05011084 Thames Ditton 1-1 8-15 0.52-0.93 1-2 9-24 0.56-1.52 24-32 1.49-2.04
E05011085 Walton Central 0-1 8-14 0.50-0.90 0-1 9-23 0.55-1.48 23-31 1.45-1.98
E05011086 Walton North 1-1 10-17 0.61-1.09 1-2 11-29 0.68-1.83 28-38 1.77-2.44
E05011087 Walton South 1-1 15-26 0.92-1.66 1-2 16-42 0.99-2.69 42-57 2.65-3.61
E05011088 Weybridge Riverside 1-1 14-25 0.87-1.56 1-2 15-40 0.95-2.57 39-54 2.51-3.43
E05011089 Weybridge St George's Hill
0-1 6-11 0.40-0.73 0-1 7-19 0.45-1.21 18-25 1.17-1.62
Air quality modelling to support the Elmbridge Local Plan
Future Scenarios (2037)
44
7 2037 scenarios: sensitive habitat impacts
7.1 Critical levels
Contour plots of annual average NOx concentration were generated for the future (2037)
scenarios using model output on a 100 m regular grid across each SPA within Elmbridge, along
with additional output points along modelled roads to capture the steep concentration gradients
at roadsides. These model-calculated concentrations were interpolated to generate 10 m
resolution air quality maps.
In the air quality maps, exceedences of the NOx critical level are shown in yellow, orange and
red and pollutant concentrations below the critical level are shown in green.
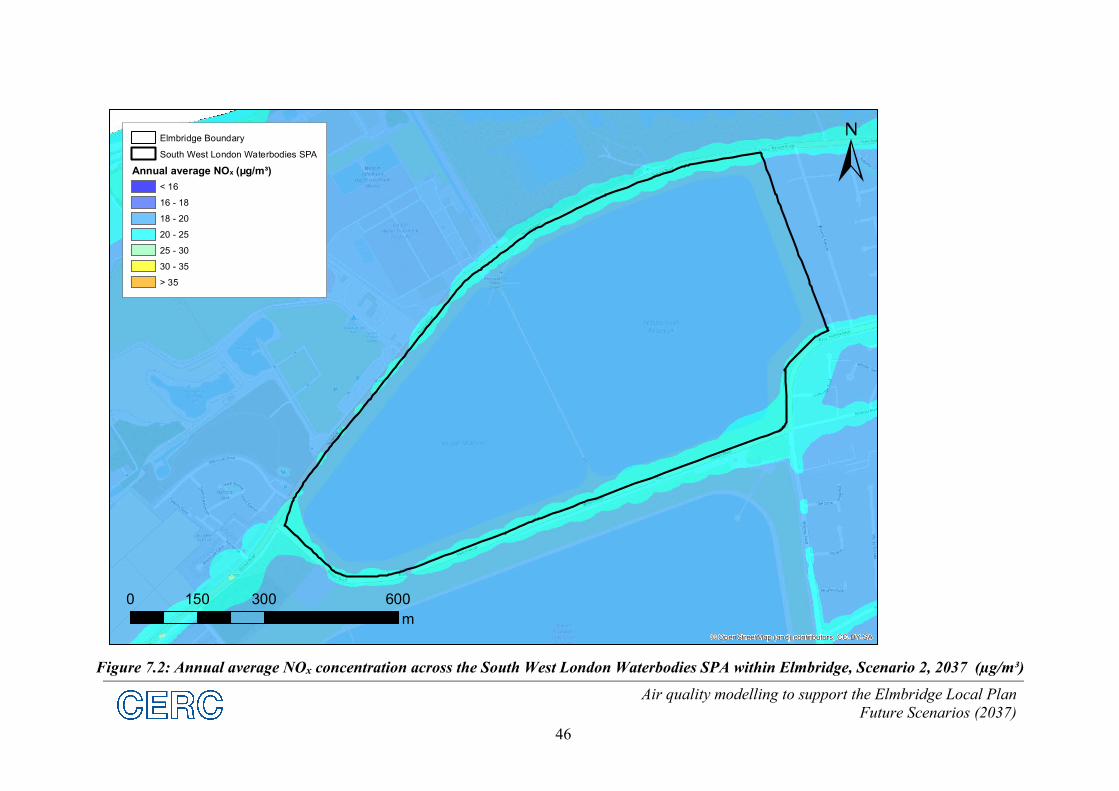
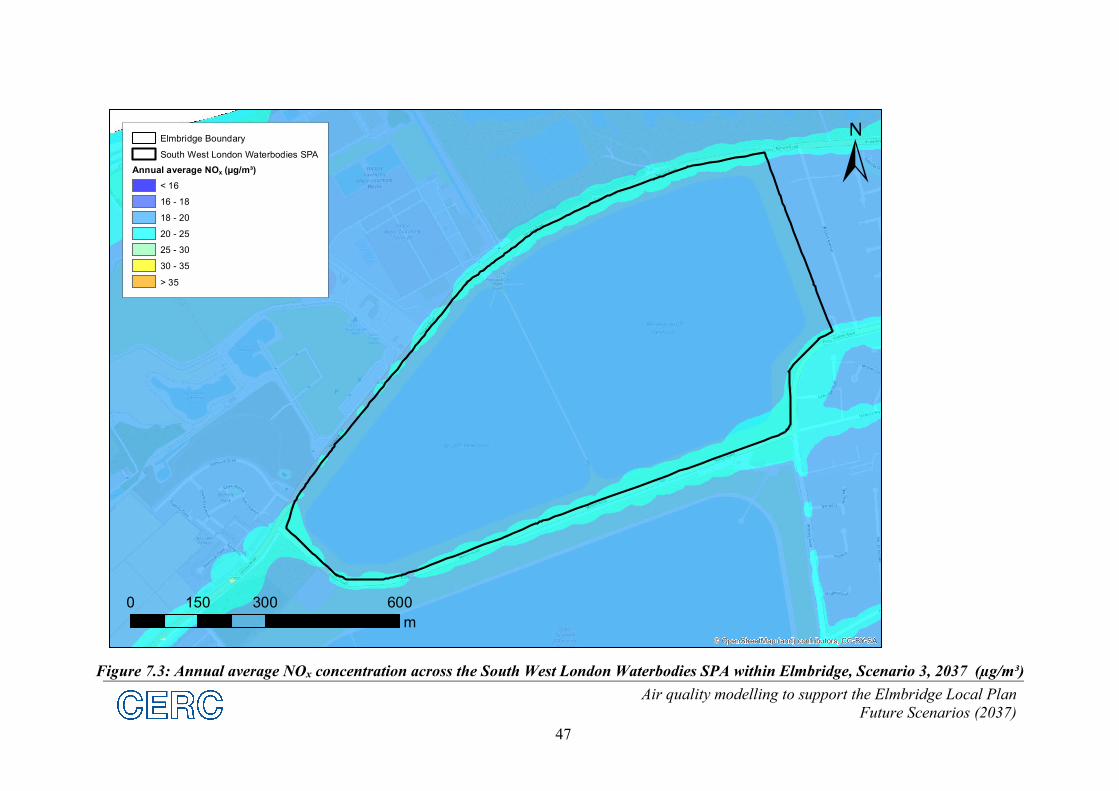
Figure 7.1 to Figure 7.3 present contour plots of the modelled annual average NOx
concentration across the South West London Waterbodies SPA for the 2037 scenarios.
Modelled concentrations show no exceedences of the 30 µg/m³ NOx critical level across the
SPA.
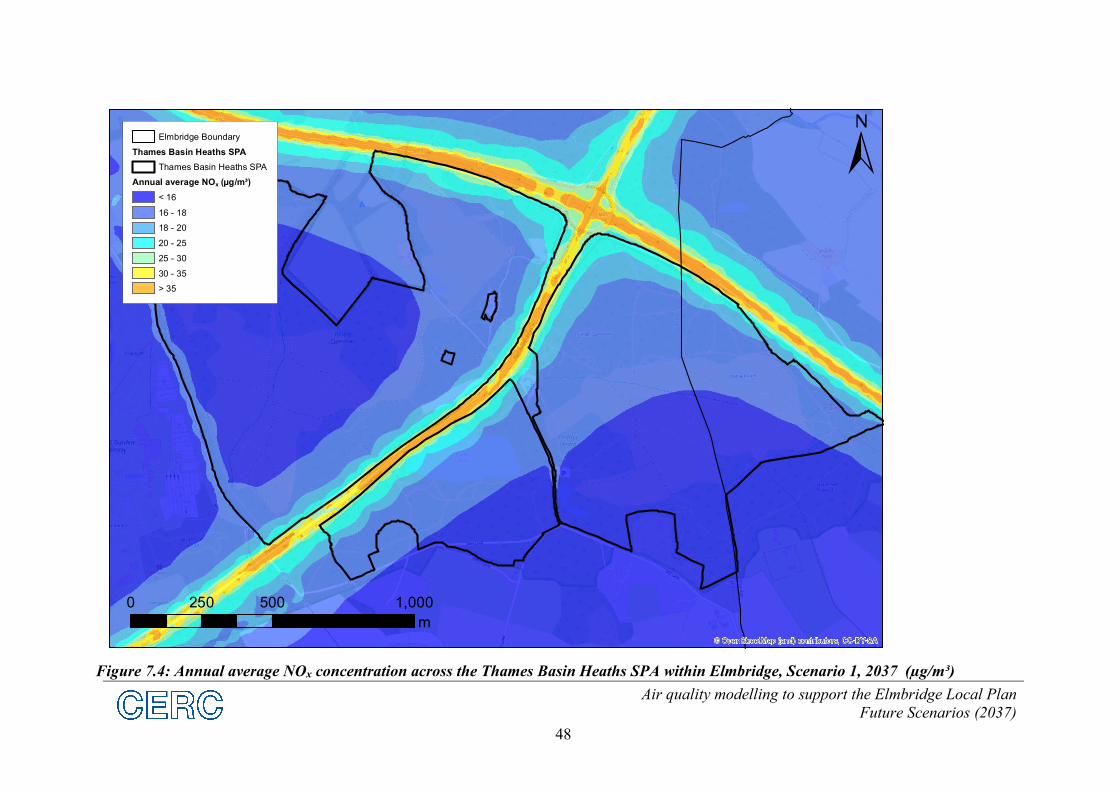
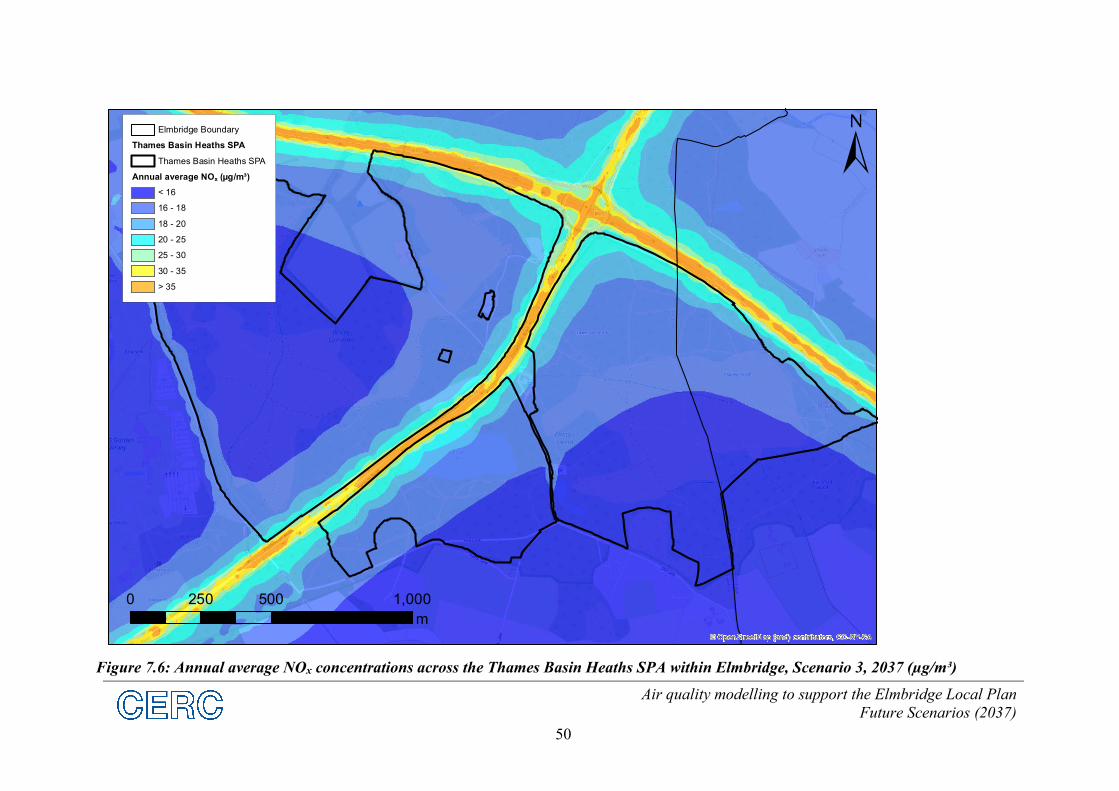
Figure 7.4 to Figure 7.6 present contour plots of the modelled annual average NOx
concentrations across the Thames Basin Heaths SPA for the 2037 scenarios. Modelled
concentrations show no exceedences of the 30 µg/m³ NOx critical level across the SPA.

Air quality modelling to support the Elmbridge Local Plan
Future Scenarios (2037)
45
Figure 7.1: Annual average NOx concentration across the South West London Waterbodies SPA within Elmbridge, Scenario 1, 2037 (µg/m³)
© OpenStreetMap (and) contributors, CC-BY-SA
0 300 600150
m
Elmbridge Boundary
South West London Waterbodies SPA
Annual average NOx (µg/m³)
< 16
16 - 18
18 - 20
20 - 25
25 - 30
30 - 35
> 35
Air quality modelling to support the Elmbridge Local Plan
Future Scenarios (2037)
46
Figure 7.2: Annual average NOx concentration across the South West London Waterbodies SPA within Elmbridge, Scenario 2, 2037 (µg/m³)
© OpenStreetMap (and) contributors, CC-BY-SA
0 300 600150
m
Elmbridge Boundary
South West London Waterbodies SPA
Annual average NOx (µg/m³)
< 16
16 - 18
18 - 20
20 - 25
25 - 30
30 - 35
> 35
Air quality modelling to support the Elmbridge Local Plan
Future Scenarios (2037)
47
Figure 7.3: Annual average NOx concentration across the South West London Waterbodies SPA within Elmbridge, Scenario 3, 2037 (µg/m³)
© OpenStreetMap (and) contributors, CC-BY-SA
0 300 600150
m
Elmbridge Boundary
South West London Waterbodies SPA
Annual average NOx (µg/m³)
< 16
16 - 18
18 - 20
20 - 25
25 - 30
30 - 35
> 35
Air quality modelling to support the Elmbridge Local Plan
Future Scenarios (2037)
48
Figure 7.4: Annual average NOx concentration across the Thames Basin Heaths SPA within Elmbridge, Scenario 1, 2037 (µg/m³)
© OpenStreetMap (and) contributors, CC-BY-SA
0 500 1,000250
m
Elmbridge Boundary
Thames Basin Heaths SPA
Thames Basin Heaths SPA
Annual average NOx (µg/m³)
< 16
16 - 18
18 - 20
20 - 25
25 - 30
30 - 35
> 35

Air quality modelling to support the Elmbridge Local Plan
Future Scenarios (2037)
49
Figure 7.5: Annual average NOx concentrations across the Thames Basin Heaths SPA within Elmbridge, Scenario 2, 2037 (µg/m³)
© OpenStreetMap (and) contributors, CC-BY-SA
0 500 1,000250
m
Elmbridge Boundary
Thames Basin Heaths SPA
Thames Basin Heaths SPA
Annual average NOx (µg/m³)
< 16
16 - 18
18 - 20
20 - 25
25 - 30
30 - 35
> 35
Air quality modelling to support the Elmbridge Local Plan
Future Scenarios (2037)
50
Figure 7.6: Annual average NOx concentrations across the Thames Basin Heaths SPA within Elmbridge, Scenario 3, 2037 (µg/m³)
© OpenStreetMap (and) contributors, CC-BY-SA
0 500 1,000250
m
Elmbridge Boundary
Thames Basin Heaths SPA
Thames Basin Heaths SPA
Annual average NOx (µg/m³)
< 16
16 - 18
18 - 20
20 - 25
25 - 30
30 - 35
> 35
Air quality modelling to support the Elmbridge Local Plan
Future Scenarios (2037)
51
7.2 Critical loads
Material emitted into the atmosphere can be lost to the ground, at the surface of the ground (dry
deposition), and through wash out with precipitation (wet deposition). Deposition of pollutants
may lead to detrimental effects at sensitive habitats due to acidification and nitrogen
eutrophication. In this assessment, modelling was carried out to predict the nitrogen deposition
rate across the two SPAs.
As described in Section 9.2 of the current baseline (2017) report, for each SPA, model-output
annual average ground level NO2 concentrations were multiplied by an appropriate deposition
velocity to calculate the NO2 contribution to nitrogen deposition.
Since the modelling for the current baseline was carried out, in 2018, ammonia traffic emission
factors have become available6. These were used to model annual average ammonia (NH3)
concentrations for road traffic impacts, as described in Section 5.1.1. The NH3 concentrations
were multiplied by an appropriate deposition velocity to calculate the NH3 contribution to nitrogen
deposition.
The contribution to nitrogen deposition from non-traffic NH3 and ammonium (NH4) was
represented by adding the reduced nitrogen contribution to nitrogen deposition for each SPA,
taken from the APIS (Air Pollution Information System) web site. A value of 8.2 kg N ha-1 yr-1 is
provided for Thames Basin Heaths SPA and a value of 4.6 kg N ha-1 yr-1 is provided for South
West London Waterbodies SPA1314.
Finally, the impact from nitrate (NO3) and nitric acid (HNO3) was calculated in the same way as
described in the current baseline (2017) report, using concentrations of these species measured at
the Rothamsted non-automatic monitoring site. A concentration of 0.27 µg/m³ was used for HNO3
and a concentration of 3.4 µg/m³ was used for NO3, calculated from the latest available monitoring
data, for the year 2019.
Nitrogen deposition maps
Contour plots of annual nitrogen deposition were generated for the future (2037) scenarios using
model output NO2 on a 100 m regular grid across each SPA, along with additional output points
along modelled roads to capture the steep concentration gradients at the roadside. These
model-calculated concentrations were interpolated to generate a 10 m resolution deposition map.
The contributions from NH3, NH4, NO3 and HNO3 were then added, as described above.
In the deposition maps, values that fall within or exceed the nitrogen deposition critical load
range are shown in yellow, orange and red and values below the critical level range are shown
in blue and green.
13http://www.apis.ac.uk/srcl/source-
attribution?submit=Source+Attribution&sitetype=SPA&sitecode=UK9012141&sitename=Thames+Basin+Heat
hs 14http://www.apis.ac.uk/srcl/source-
attribution?submit=Source+Attribution&sitetype=SPA&sitecode=UK9012171&sitename=South+West+London
+Waterbodies
Air quality modelling to support the Elmbridge Local Plan
Future Scenarios (2037)
52
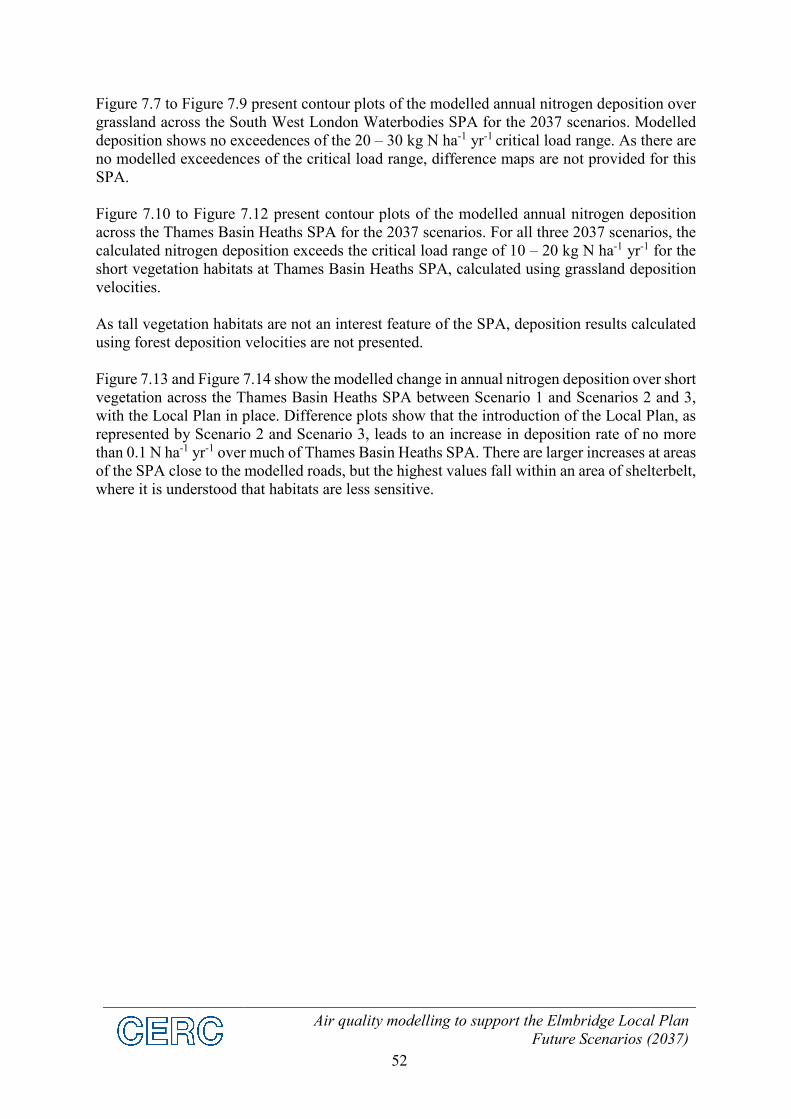
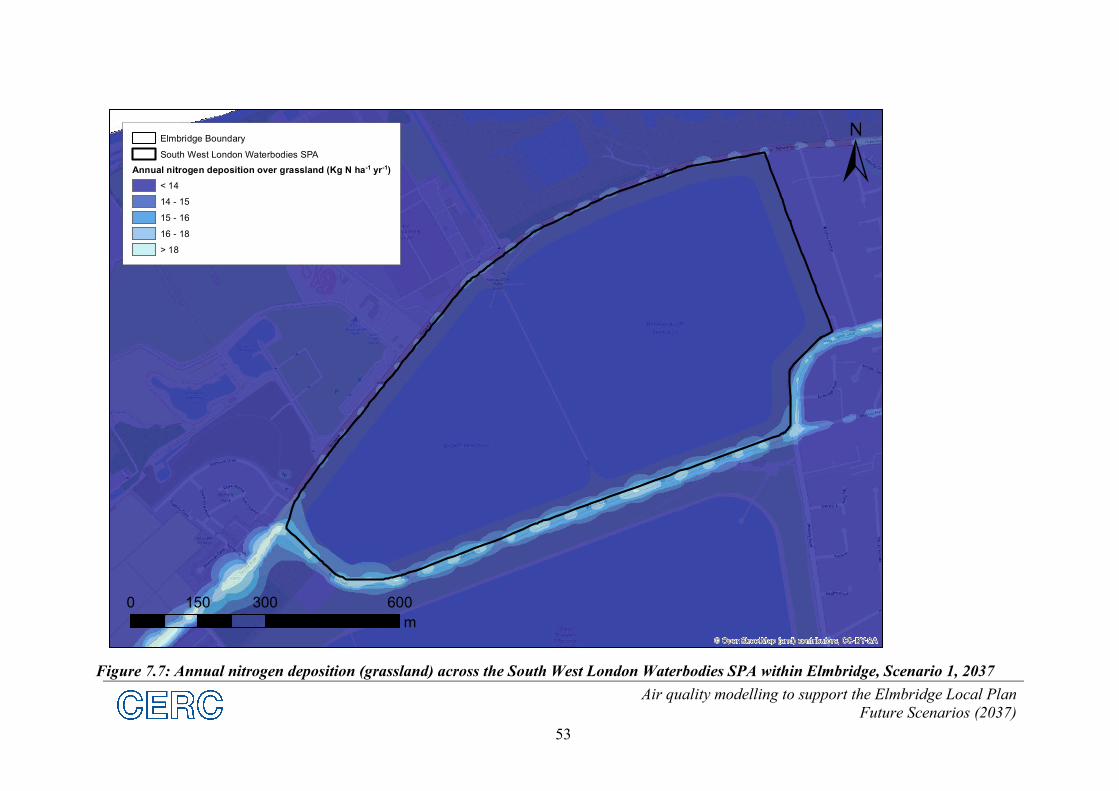
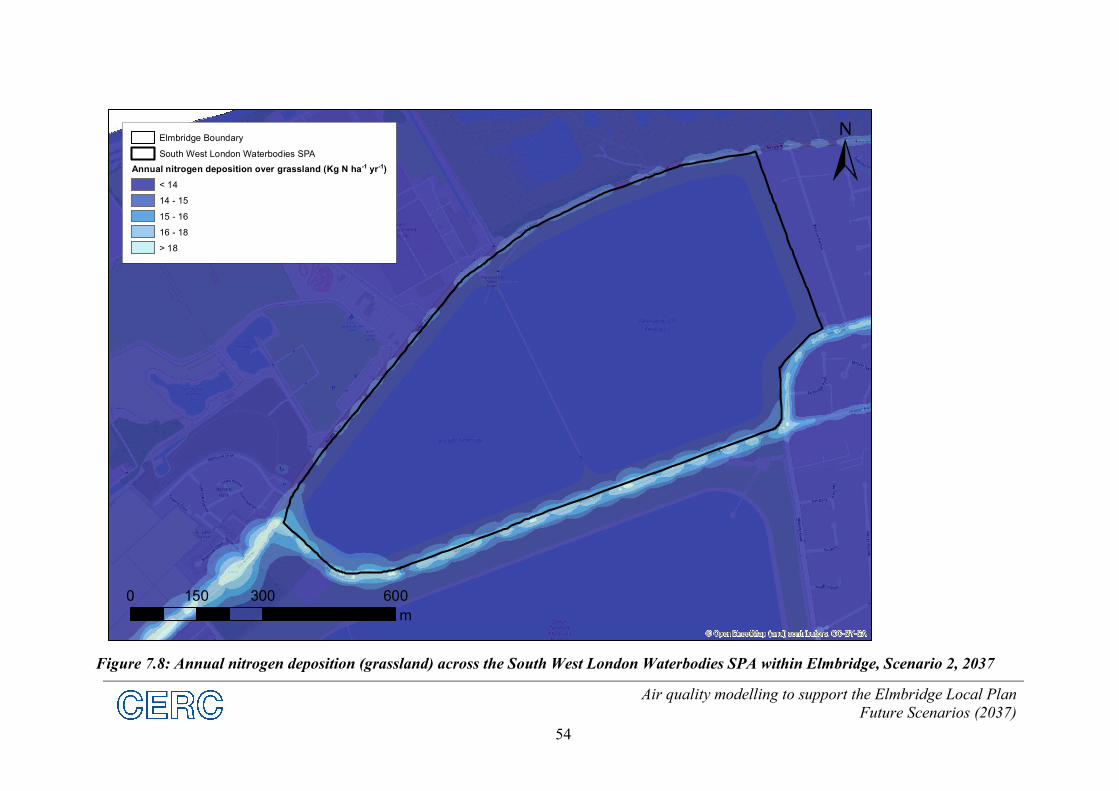
Figure 7.7 to Figure 7.9 present contour plots of the modelled annual nitrogen deposition over
grassland across the South West London Waterbodies SPA for the 2037 scenarios. Modelled
deposition shows no exceedences of the 20 – 30 kg N ha-1 yr-1 critical load range. As there are
no modelled exceedences of the critical load range, difference maps are not provided for this
SPA.
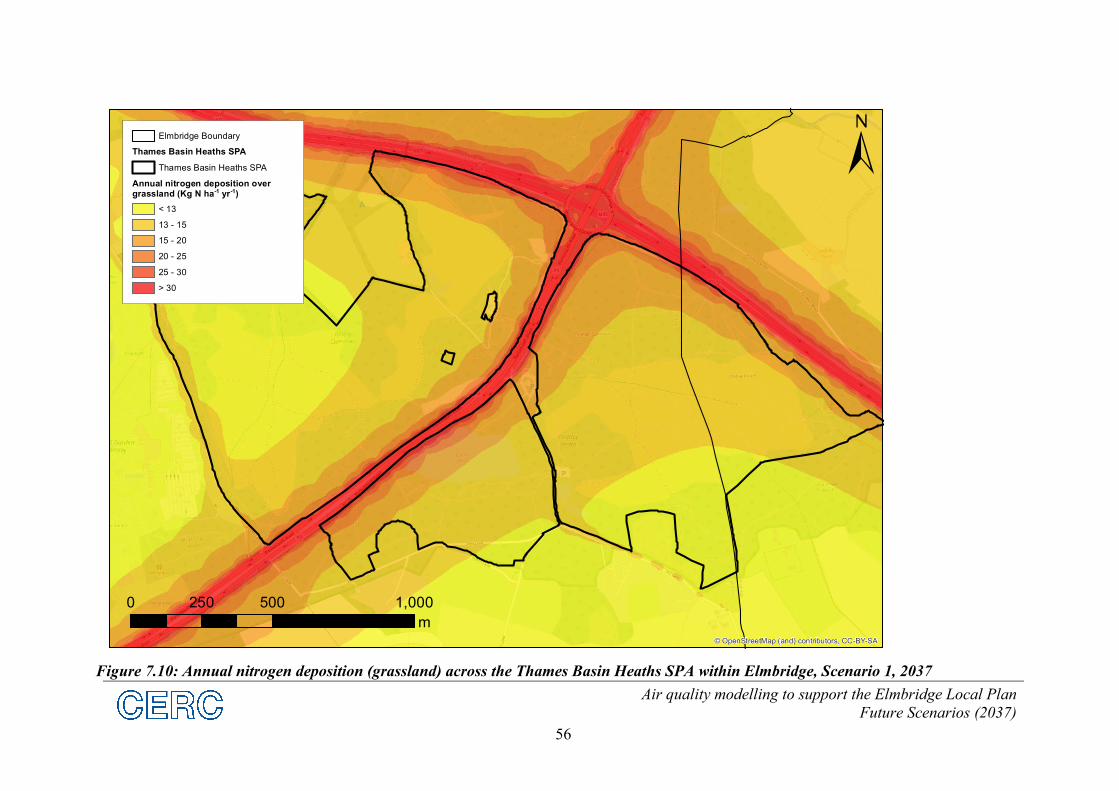
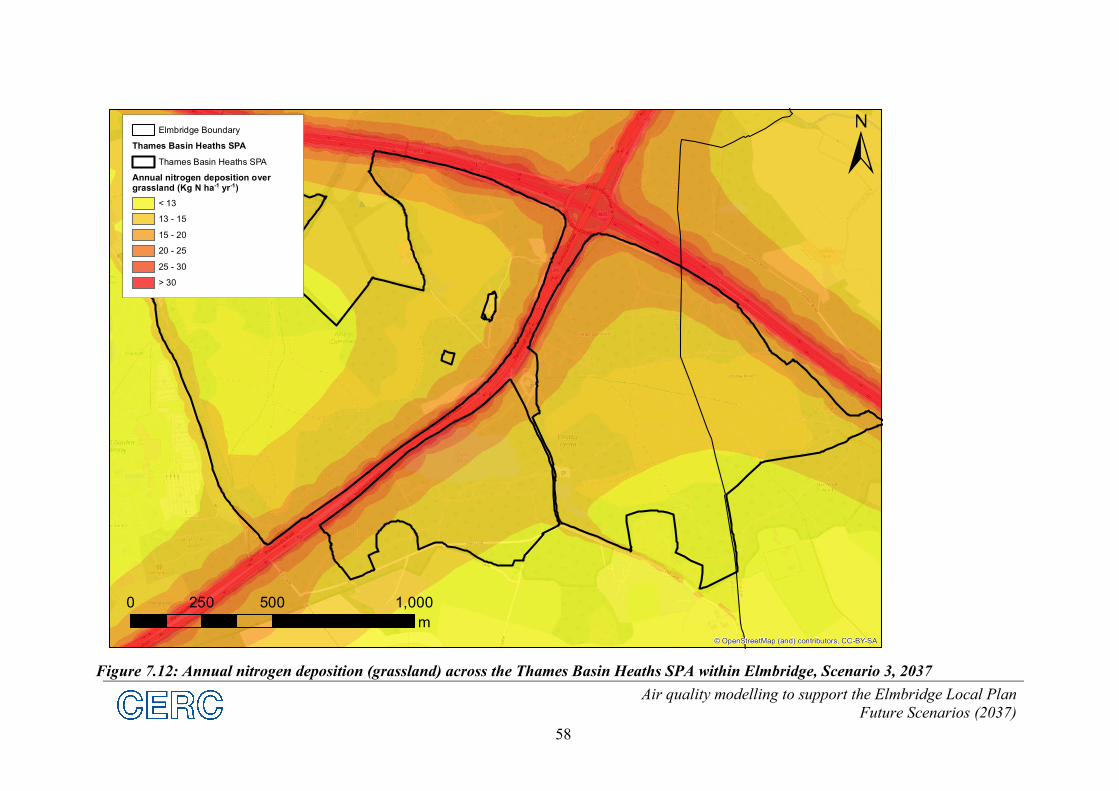
Figure 7.10 to Figure 7.12 present contour plots of the modelled annual nitrogen deposition
across the Thames Basin Heaths SPA for the 2037 scenarios. For all three 2037 scenarios, the
calculated nitrogen deposition exceeds the critical load range of 10 – 20 kg N ha-1 yr-1 for the
short vegetation habitats at Thames Basin Heaths SPA, calculated using grassland deposition
velocities.
As tall vegetation habitats are not an interest feature of the SPA, deposition results calculated
using forest deposition velocities are not presented.
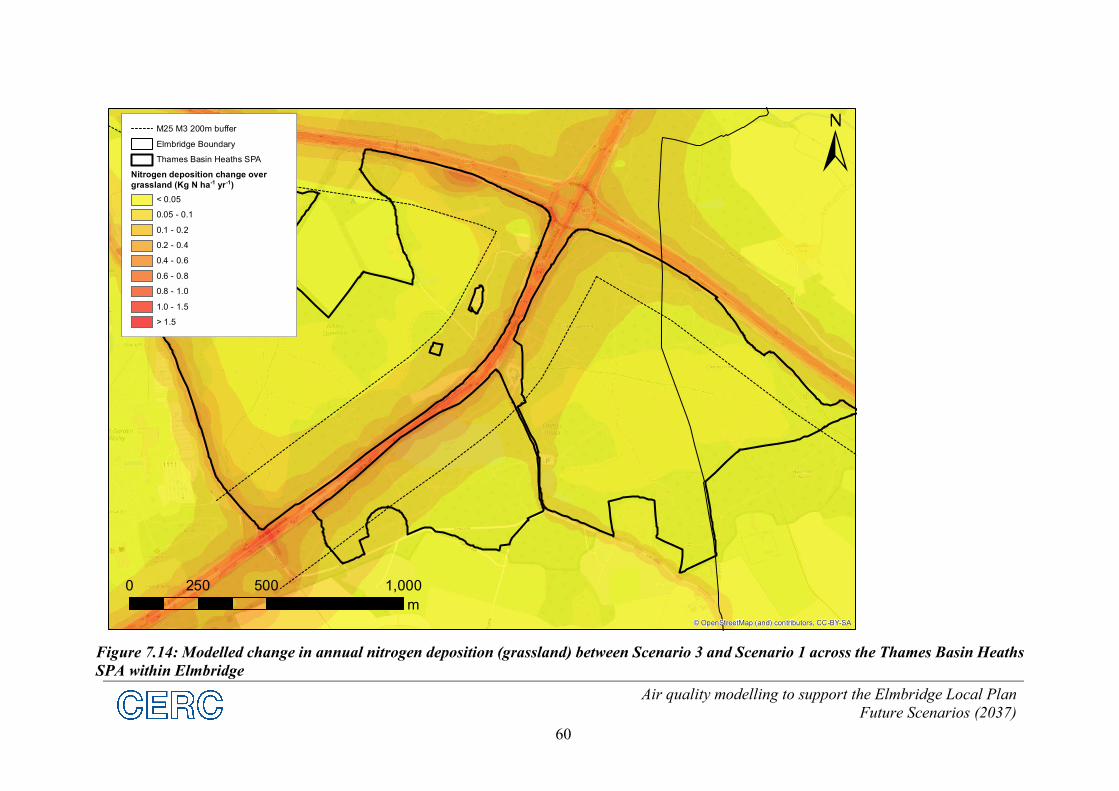
Figure 7.13 and Figure 7.14 show the modelled change in annual nitrogen deposition over short
vegetation across the Thames Basin Heaths SPA between Scenario 1 and Scenarios 2 and 3,
with the Local Plan in place. Difference plots show that the introduction of the Local Plan, as
represented by Scenario 2 and Scenario 3, leads to an increase in deposition rate of no more
than 0.1 N ha-1 yr-1 over much of Thames Basin Heaths SPA. There are larger increases at areas
of the SPA close to the modelled roads, but the highest values fall within an area of shelterbelt,
where it is understood that habitats are less sensitive.
Air quality modelling to support the Elmbridge Local Plan
Future Scenarios (2037)
53
Figure 7.7: Annual nitrogen deposition (grassland) across the South West London Waterbodies SPA within Elmbridge, Scenario 1, 2037
© OpenStreetMap (and) contributors, CC-BY-SA
0 300 600150
m
Elmbridge Boundary
South West London Waterbodies SPA
Annual nitrogen deposition over grassland (Kg N ha-1 yr-1)
< 14
14 - 15
15 - 16
16 - 18
> 18
Air quality modelling to support the Elmbridge Local Plan
Future Scenarios (2037)
54
Figure 7.8: Annual nitrogen deposition (grassland) across the South West London Waterbodies SPA within Elmbridge, Scenario 2, 2037
© OpenStreetMap (and) contributors, CC-BY-SA
0 300 600150
m
Elmbridge Boundary
South West London Waterbodies SPA
Annual nitrogen deposition over grassland (Kg N ha-1 yr-1)
< 14
14 - 15
15 - 16
16 - 18
> 18
Air quality modelling to support the Elmbridge Local Plan
Future Scenarios (2037)
55
Figure 7.9: Annual nitrogen deposition (grassland) across the South West London Waterbodies SPA within Elmbridge, Scenario 3, 2037
© OpenStreetMap (and) contributors, CC-BY-SA
0 300 600150
m
Elmbridge Boundary
South West London Waterbodies SPA
Annual nitrogen deposition over grassland (Kg N ha-1 yr-1)
< 14
14 - 15
15 - 16
16 - 18
> 18
Air quality modelling to support the Elmbridge Local Plan
Future Scenarios (2037)
56
Figure 7.10: Annual nitrogen deposition (grassland) across the Thames Basin Heaths SPA within Elmbridge, Scenario 1, 2037
© OpenStreetMap (and) contributors, CC-BY-SA
0 500 1,000250
m
Elmbridge Boundary
Thames Basin Heaths SPA
Thames Basin Heaths SPA
Annual nitrogen deposition overgrassland (Kg N ha-1 yr-1)
< 13
13 - 15
15 - 20
20 - 25
25 - 30
> 30

Air quality modelling to support the Elmbridge Local Plan
Future Scenarios (2037)
57
Figure 7.11: Annual nitrogen deposition (grassland) across the Thames Basin Heaths SPA within Elmbridge, Scenario 2, 2037
© OpenStreetMap (and) contributors, CC-BY-SA
0 500 1,000250
m
Elmbridge Boundary
Thames Basin Heaths SPA
Thames Basin Heaths SPA
Annual nitrogen deposition overgrassland (Kg N ha-1 yr-1)
< 13
13 - 15
15 - 20
20 - 25
25 - 30
> 30
Air quality modelling to support the Elmbridge Local Plan
Future Scenarios (2037)
58
Figure 7.12: Annual nitrogen deposition (grassland) across the Thames Basin Heaths SPA within Elmbridge, Scenario 3, 2037
© OpenStreetMap (and) contributors, CC-BY-SA
0 500 1,000250
m
Elmbridge Boundary
Thames Basin Heaths SPA
Thames Basin Heaths SPA
Annual nitrogen deposition overgrassland (Kg N ha-1 yr-1)
< 13
13 - 15
15 - 20
20 - 25
25 - 30
> 30

Air quality modelling to support the Elmbridge Local Plan
Future Scenarios (2037)
59
Figure 7.13: Modelled change in annual nitrogen deposition (grassland) between Scenario 2 and Scenario 1 across the Thames Basin Heaths
SPA within Elmbridge
© OpenStreetMap (and) contributors, CC-BY-SA
0 500 1,000250
m
M25 M3 200m buffer
Elmbridge Boundary
Thames Basin Heaths SPA
Nitrogen deposition change over
grassland (Kg N ha-1 yr-1)
< 0.05
0.05 - 0.1
0.1 - 0.2
0.2 - 0.4
0.4 - 0.6
0.6 - 0.8
0.8 - 1.0
1.0 - 1.5
> 1.5
Air quality modelling to support the Elmbridge Local Plan
Future Scenarios (2037)
60
Figure 7.14: Modelled change in annual nitrogen deposition (grassland) between Scenario 3 and Scenario 1 across the Thames Basin Heaths
SPA within Elmbridge
© OpenStreetMap (and) contributors, CC-BY-SA
0 500 1,000250
m
M25 M3 200m buffer
Elmbridge Boundary
Thames Basin Heaths SPA
Nitrogen deposition change over
grassland (Kg N ha-1 yr-1)
< 0.05
0.05 - 0.1
0.1 - 0.2
0.2 - 0.4
0.4 - 0.6
0.6 - 0.8
0.8 - 1.0
1.0 - 1.5
> 1.5
Air quality modelling to support the Elmbridge Local Plan
Future Scenarios (2037)
61
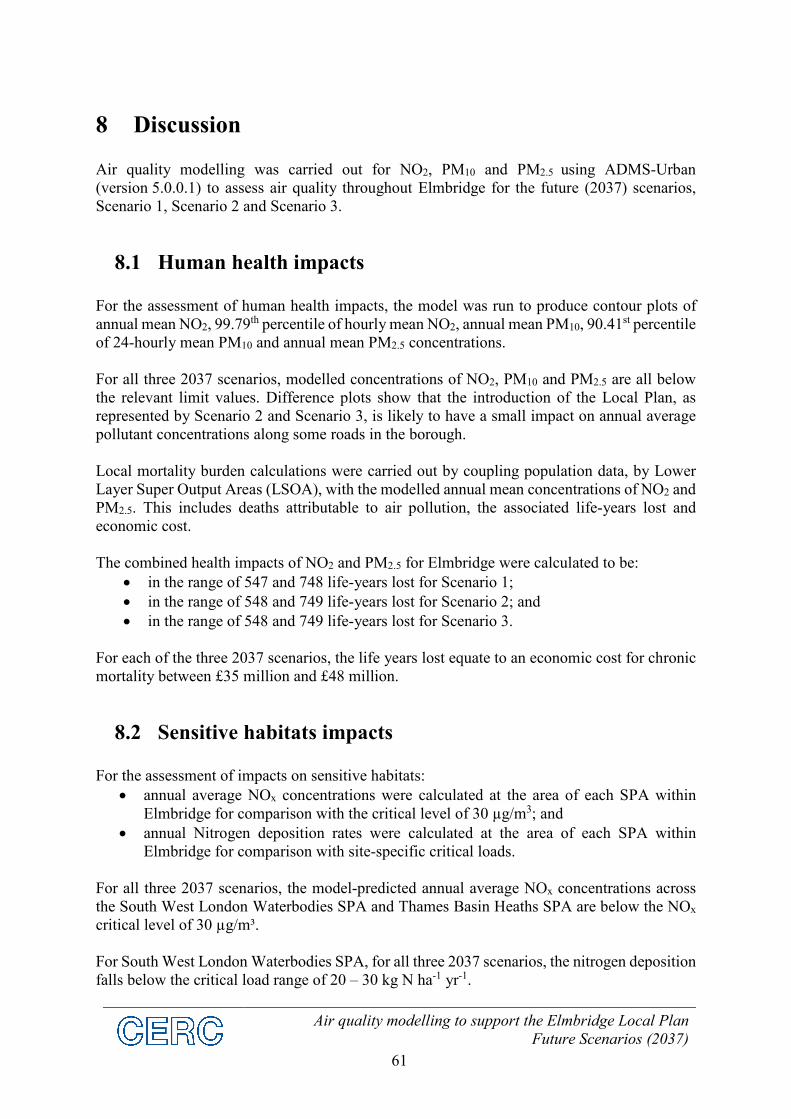
8 Discussion
Air quality modelling was carried out for NO2, PM10 and PM2.5 using ADMS-Urban
(version 5.0.0.1) to assess air quality throughout Elmbridge for the future (2037) scenarios,
Scenario 1, Scenario 2 and Scenario 3.
8.1 Human health impacts
For the assessment of human health impacts, the model was run to produce contour plots of
annual mean NO2, 99.79th percentile of hourly mean NO2, annual mean PM10, 90.41st percentile
of 24-hourly mean PM10 and annual mean PM2.5 concentrations.
For all three 2037 scenarios, modelled concentrations of NO2, PM10 and PM2.5 are all below
the relevant limit values. Difference plots show that the introduction of the Local Plan, as
represented by Scenario 2 and Scenario 3, is likely to have a small impact on annual average
pollutant concentrations along some roads in the borough.
Local mortality burden calculations were carried out by coupling population data, by Lower
Layer Super Output Areas (LSOA), with the modelled annual mean concentrations of NO2 and
PM2.5. This includes deaths attributable to air pollution, the associated life-years lost and
economic cost.
The combined health impacts of NO2 and PM2.5 for Elmbridge were calculated to be:
in the range of 547 and 748 life-years lost for Scenario 1;
in the range of 548 and 749 life-years lost for Scenario 2; and
in the range of 548 and 749 life-years lost for Scenario 3.
For each of the three 2037 scenarios, the life years lost equate to an economic cost for chronic
mortality between £35 million and £48 million.
8.2 Sensitive habitats impacts
For the assessment of impacts on sensitive habitats:
annual average NOx concentrations were calculated at the area of each SPA within
Elmbridge for comparison with the critical level of 30 µg/m3; and
annual Nitrogen deposition rates were calculated at the area of each SPA within
Elmbridge for comparison with site-specific critical loads.
For all three 2037 scenarios, the model-predicted annual average NOx concentrations across
the South West London Waterbodies SPA and Thames Basin Heaths SPA are below the NOx
critical level of 30 µg/m³.
For South West London Waterbodies SPA, for all three 2037 scenarios, the nitrogen deposition
falls below the critical load range of 20 – 30 kg N ha-1 yr-1.
Air quality modelling to support the Elmbridge Local Plan
Future Scenarios (2037)
62
For all three 2037 scenarios, the calculated nitrogen deposition exceeds the critical load range
of 10 – 20 kg N ha-1 yr-1 for the short vegetation habitats at Thames Basin Heaths SPA,
calculated using grassland deposition velocities.
As tall vegetation habitats are not an interest feature of the SPA, deposition results calculated
using forest deposition velocities are not presented.
Difference plots show that the introduction of the Local Plan, as represented by Scenario 2 and
Scenario 3, leads to an increase in deposition rate of no more than 0.1 N ha-1 yr-1 over much of
Thames Basin Heaths SPA. There are larger increases at areas of the SPA close to the modelled
roads, but the highest values fall within an area of shelterbelt, where it is understood that
habitats are less sensitive.

Air quality modelling to support the Elmbridge Local Plan
Future Scenarios (2037)
63
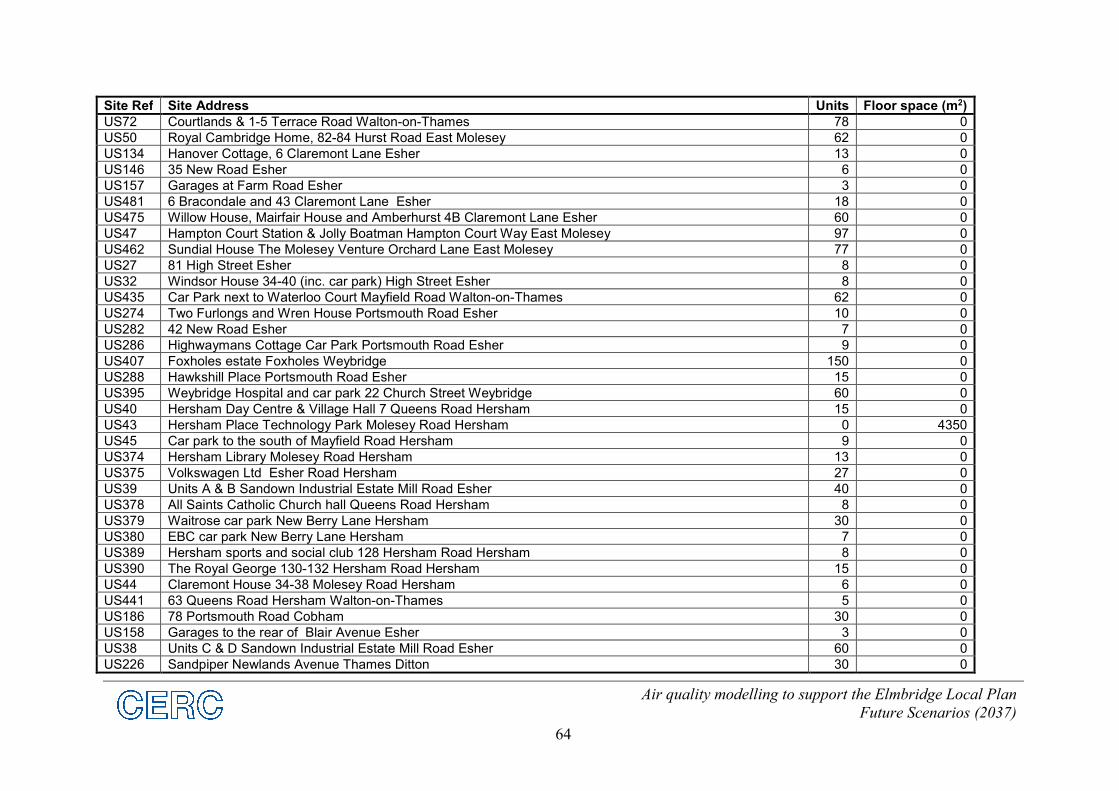
APPENDIX A: Summary of Local Plan developments Table A.1: Local Plan development areas
Site Ref Site Address Units Floor space (m2)
US155 Garages to the rear of Holroyd Road Claygate 3 0
US156 Garages to the rear of Foxwarren Claygate 5 0
US6 Crown House Church Road Claygate 12 0
US2 Hare Lane Car Park Hare Lane Claygate 7 0
US3 Torrington Lodge Car Park Hare Lane Claygate 8 0
US169 Claygate Station Car park The Parade Claygate 15 0
US174 Claygate Village Youth Club Elm Road Claygate 6 0
US175 Claygate Centre Elm Road Claygate 14 0
US177 Claygate Lawn Tennis Club Torrington Close Claygate 24 0
US159 Garages to the rear of 6-24 Lockhart Road Cobham 4 0
US160 Garages at Bennett Close Cobham 3 0
US162 Site B Garages at Wyndham Avenue Cobham 4 0
US163 Site C Garages at Wyndham Avenue Cobham 3 0
US164 Cobham Health Centre and Garages off Tartar Road Cobham 11 0
US92 Glaxo SmithKline St George's Avenue Weybridge 100 0
US7 20 Stoke Road Cobham 9 0
US84 Elm Grove, 1 Hersham Road Walton-on-Thames 70 0
US183 BMW Cobham 18-22 Portsmouth Road Cobham 27 0
US187 87 Portsmouth Road Cobham 10 0
US188 97 Portsmouth Road Cobham 21 0
US189 101 Portsmouth Road Cobham 7 0
US190 270 Portsmouth Road Cobham 10 0
US191 73 Between Streets Cobham 40 0
US194 Protech House Copse Road Cobham 28 0
US83 Homebase New Zealand Avenue Walton-on-Thames 200 0
US201 Tiltwood Care Home Hogshill Lane Cobham 88 0
US214 Waitrose 16-18 Between Streets Cobham 20 0
US215 38 Copse Road Cobham 7 0
US217 68 Between Streets and 7-11 White Lion Gate Cobham 11 0
US218 Coveham House, Downside Bridge Road and The Royal British Legion Hollyhedge Road Cobham 14 0
US221 Garages and parking to the rear of Cobham Gate Cobham 8 0
Air quality modelling to support the Elmbridge Local Plan
Future Scenarios (2037)
64
Site Ref Site Address Units Floor space (m2)
US72 Courtlands & 1-5 Terrace Road Walton-on-Thames 78 0
US50 Royal Cambridge Home, 82-84 Hurst Road East Molesey 62 0
US134 Hanover Cottage, 6 Claremont Lane Esher 13 0
US146 35 New Road Esher 6 0
US157 Garages at Farm Road Esher 3 0
US481 6 Bracondale and 43 Claremont Lane Esher 18 0
US475 Willow House, Mairfair House and Amberhurst 4B Claremont Lane Esher 60 0
US47 Hampton Court Station & Jolly Boatman Hampton Court Way East Molesey 97 0
US462 Sundial House The Molesey Venture Orchard Lane East Molesey 77 0
US27 81 High Street Esher 8 0
US32 Windsor House 34-40 (inc. car park) High Street Esher 8 0
US435 Car Park next to Waterloo Court Mayfield Road Walton-on-Thames 62 0
US274 Two Furlongs and Wren House Portsmouth Road Esher 10 0
US282 42 New Road Esher 7 0
US286 Highwaymans Cottage Car Park Portsmouth Road Esher 9 0
US407 Foxholes estate Foxholes Weybridge 150 0
US288 Hawkshill Place Portsmouth Road Esher 15 0
US395 Weybridge Hospital and car park 22 Church Street Weybridge 60 0
US40 Hersham Day Centre & Village Hall 7 Queens Road Hersham 15 0
US43 Hersham Place Technology Park Molesey Road Hersham 0 4350
US45 Car park to the south of Mayfield Road Hersham 9 0
US374 Hersham Library Molesey Road Hersham 13 0
US375 Volkswagen Ltd Esher Road Hersham 27 0
US39 Units A & B Sandown Industrial Estate Mill Road Esher 40 0
US378 All Saints Catholic Church hall Queens Road Hersham 8 0
US379 Waitrose car park New Berry Lane Hersham 30 0
US380 EBC car park New Berry Lane Hersham 7 0
US389 Hersham sports and social club 128 Hersham Road Hersham 8 0
US390 The Royal George 130-132 Hersham Road Hersham 15 0
US44 Claremont House 34-38 Molesey Road Hersham 6 0
US441 63 Queens Road Hersham Walton-on-Thames 5 0
US186 78 Portsmouth Road Cobham 30 0
US158 Garages to the rear of Blair Avenue Esher 3 0
US38 Units C & D Sandown Industrial Estate Mill Road Esher 60 0
US226 Sandpiper Newlands Avenue Thames Ditton 30 0
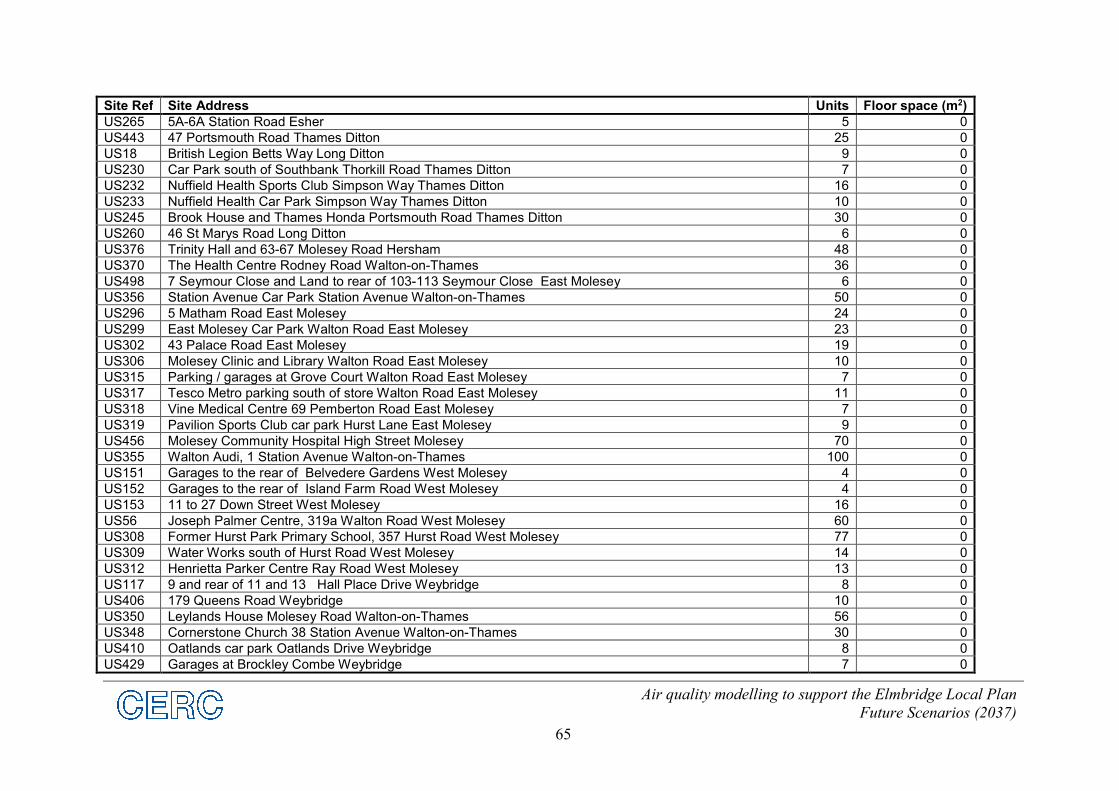
Air quality modelling to support the Elmbridge Local Plan
Future Scenarios (2037)
65
Site Ref Site Address Units Floor space (m2)
US265 5A-6A Station Road Esher 5 0
US443 47 Portsmouth Road Thames Ditton 25 0
US18 British Legion Betts Way Long Ditton 9 0
US230 Car Park south of Southbank Thorkill Road Thames Ditton 7 0
US232 Nuffield Health Sports Club Simpson Way Thames Ditton 16 0
US233 Nuffield Health Car Park Simpson Way Thames Ditton 10 0
US245 Brook House and Thames Honda Portsmouth Road Thames Ditton 30 0
US260 46 St Marys Road Long Ditton 6 0
US376 Trinity Hall and 63-67 Molesey Road Hersham 48 0
US370 The Health Centre Rodney Road Walton-on-Thames 36 0
US498 7 Seymour Close and Land to rear of 103-113 Seymour Close East Molesey 6 0
US356 Station Avenue Car Park Station Avenue Walton-on-Thames 50 0
US296 5 Matham Road East Molesey 24 0
US299 East Molesey Car Park Walton Road East Molesey 23 0
US302 43 Palace Road East Molesey 19 0
US306 Molesey Clinic and Library Walton Road East Molesey 10 0
US315 Parking / garages at Grove Court Walton Road East Molesey 7 0
US317 Tesco Metro parking south of store Walton Road East Molesey 11 0
US318 Vine Medical Centre 69 Pemberton Road East Molesey 7 0
US319 Pavilion Sports Club car park Hurst Lane East Molesey 9 0
US456 Molesey Community Hospital High Street Molesey 70 0
US355 Walton Audi, 1 Station Avenue Walton-on-Thames 100 0
US151 Garages to the rear of Belvedere Gardens West Molesey 4 0
US152 Garages to the rear of Island Farm Road West Molesey 4 0
US153 11 to 27 Down Street West Molesey 16 0
US56 Joseph Palmer Centre, 319a Walton Road West Molesey 60 0
US308 Former Hurst Park Primary School, 357 Hurst Road West Molesey 77 0
US309 Water Works south of Hurst Road West Molesey 14 0
US312 Henrietta Parker Centre Ray Road West Molesey 13 0
US117 9 and rear of 11 and 13 Hall Place Drive Weybridge 8 0
US406 179 Queens Road Weybridge 10 0
US350 Leylands House Molesey Road Walton-on-Thames 56 0
US348 Cornerstone Church 38 Station Avenue Walton-on-Thames 30 0
US410 Oatlands car park Oatlands Drive Weybridge 8 0
US429 Garages at Brockley Combe Weybridge 7 0
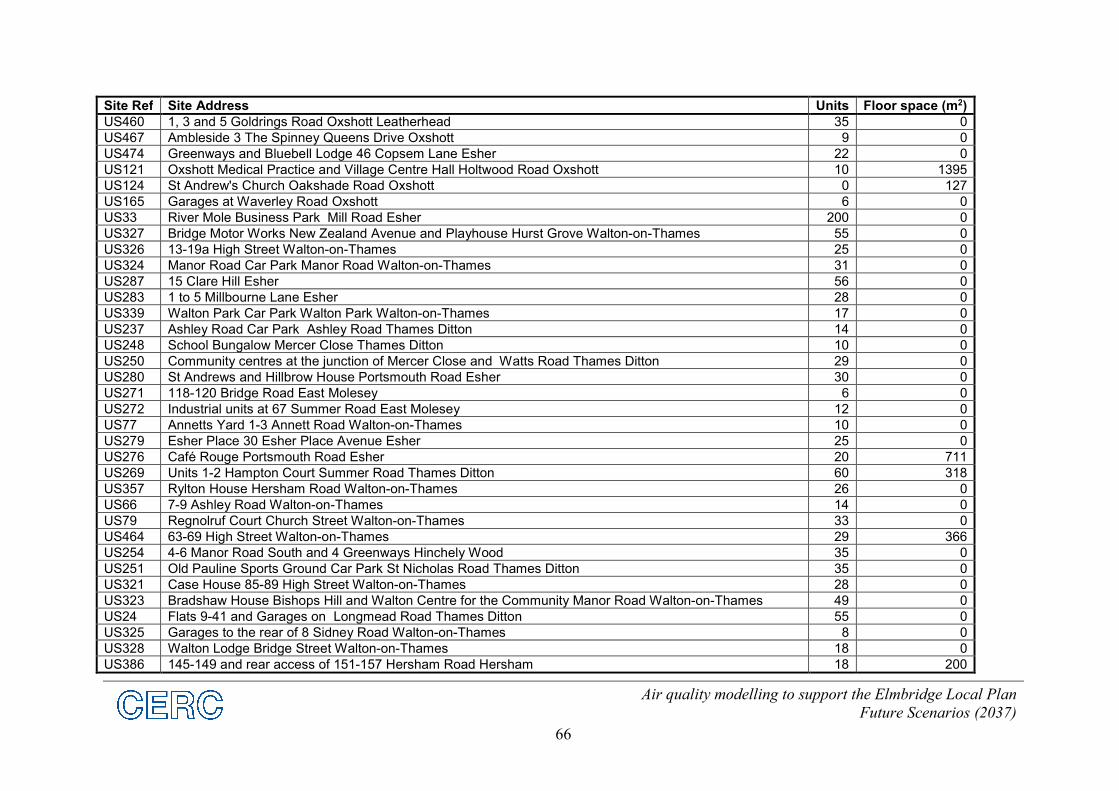
Air quality modelling to support the Elmbridge Local Plan
Future Scenarios (2037)
66
Site Ref Site Address Units Floor space (m2)
US460 1, 3 and 5 Goldrings Road Oxshott Leatherhead 35 0
US467 Ambleside 3 The Spinney Queens Drive Oxshott 9 0
US474 Greenways and Bluebell Lodge 46 Copsem Lane Esher 22 0
US121 Oxshott Medical Practice and Village Centre Hall Holtwood Road Oxshott 10 1395
US124 St Andrew's Church Oakshade Road Oxshott 0 127
US165 Garages at Waverley Road Oxshott 6 0
US33 River Mole Business Park Mill Road Esher 200 0
US327 Bridge Motor Works New Zealand Avenue and Playhouse Hurst Grove Walton-on-Thames 55 0
US326 13-19a High Street Walton-on-Thames 25 0
US324 Manor Road Car Park Manor Road Walton-on-Thames 31 0
US287 15 Clare Hill Esher 56 0
US283 1 to 5 Millbourne Lane Esher 28 0
US339 Walton Park Car Park Walton Park Walton-on-Thames 17 0
US237 Ashley Road Car Park Ashley Road Thames Ditton 14 0
US248 School Bungalow Mercer Close Thames Ditton 10 0
US250 Community centres at the junction of Mercer Close and Watts Road Thames Ditton 29 0
US280 St Andrews and Hillbrow House Portsmouth Road Esher 30 0
US271 118-120 Bridge Road East Molesey 6 0
US272 Industrial units at 67 Summer Road East Molesey 12 0
US77 Annetts Yard 1-3 Annett Road Walton-on-Thames 10 0
US279 Esher Place 30 Esher Place Avenue Esher 25 0
US276 Café Rouge Portsmouth Road Esher 20 711
US269 Units 1-2 Hampton Court Summer Road Thames Ditton 60 318
US357 Rylton House Hersham Road Walton-on-Thames 26 0
US66 7-9 Ashley Road Walton-on-Thames 14 0
US79 Regnolruf Court Church Street Walton-on-Thames 33 0
US464 63-69 High Street Walton-on-Thames 29 366
US254 4-6 Manor Road South and 4 Greenways Hinchely Wood 35 0
US251 Old Pauline Sports Ground Car Park St Nicholas Road Thames Ditton 35 0
US321 Case House 85-89 High Street Walton-on-Thames 28 0
US323 Bradshaw House Bishops Hill and Walton Centre for the Community Manor Road Walton-on-Thames 49 0
US24 Flats 9-41 and Garages on Longmead Road Thames Ditton 55 0
US325 Garages to the rear of 8 Sidney Road Walton-on-Thames 8 0
US328 Walton Lodge Bridge Street Walton-on-Thames 18 0
US386 145-149 and rear access of 151-157 Hersham Road Hersham 18 200
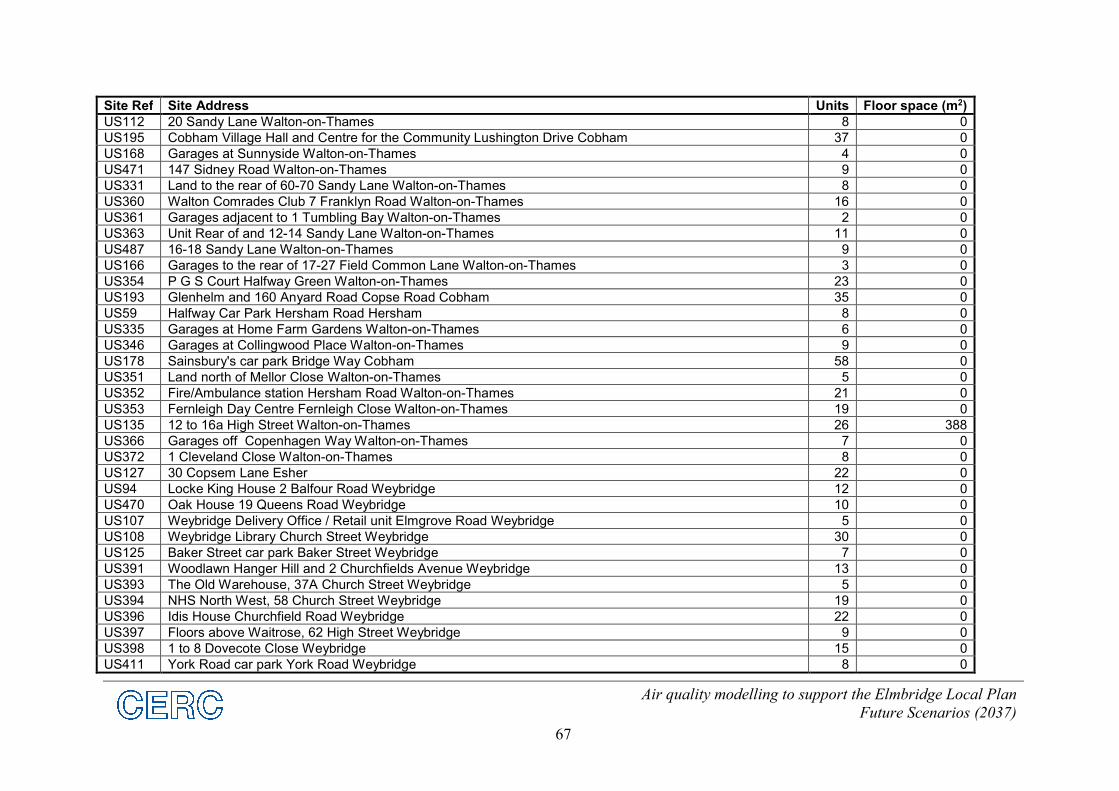
Air quality modelling to support the Elmbridge Local Plan
Future Scenarios (2037)
67
Site Ref Site Address Units Floor space (m2)
US112 20 Sandy Lane Walton-on-Thames 8 0
US195 Cobham Village Hall and Centre for the Community Lushington Drive Cobham 37 0
US168 Garages at Sunnyside Walton-on-Thames 4 0
US471 147 Sidney Road Walton-on-Thames 9 0
US331 Land to the rear of 60-70 Sandy Lane Walton-on-Thames 8 0
US360 Walton Comrades Club 7 Franklyn Road Walton-on-Thames 16 0
US361 Garages adjacent to 1 Tumbling Bay Walton-on-Thames 2 0
US363 Unit Rear of and 12-14 Sandy Lane Walton-on-Thames 11 0
US487 16-18 Sandy Lane Walton-on-Thames 9 0
US166 Garages to the rear of 17-27 Field Common Lane Walton-on-Thames 3 0
US354 P G S Court Halfway Green Walton-on-Thames 23 0
US193 Glenhelm and 160 Anyard Road Copse Road Cobham 35 0
US59 Halfway Car Park Hersham Road Hersham 8 0
US335 Garages at Home Farm Gardens Walton-on-Thames 6 0
US346 Garages at Collingwood Place Walton-on-Thames 9 0
US178 Sainsbury's car park Bridge Way Cobham 58 0
US351 Land north of Mellor Close Walton-on-Thames 5 0
US352 Fire/Ambulance station Hersham Road Walton-on-Thames 21 0
US353 Fernleigh Day Centre Fernleigh Close Walton-on-Thames 19 0
US135 12 to 16a High Street Walton-on-Thames 26 388
US366 Garages off Copenhagen Way Walton-on-Thames 7 0
US372 1 Cleveland Close Walton-on-Thames 8 0
US127 30 Copsem Lane Esher 22 0
US94 Locke King House 2 Balfour Road Weybridge 12 0
US470 Oak House 19 Queens Road Weybridge 10 0
US107 Weybridge Delivery Office / Retail unit Elmgrove Road Weybridge 5 0
US108 Weybridge Library Church Street Weybridge 30 0
US125 Baker Street car park Baker Street Weybridge 7 0
US391 Woodlawn Hanger Hill and 2 Churchfields Avenue Weybridge 13 0
US393 The Old Warehouse, 37A Church Street Weybridge 5 0
US394 NHS North West, 58 Church Street Weybridge 19 0
US396 Idis House Churchfield Road Weybridge 22 0
US397 Floors above Waitrose, 62 High Street Weybridge 9 0
US398 1 to 8 Dovecote Close Weybridge 15 0
US411 York Road car park York Road Weybridge 8 0
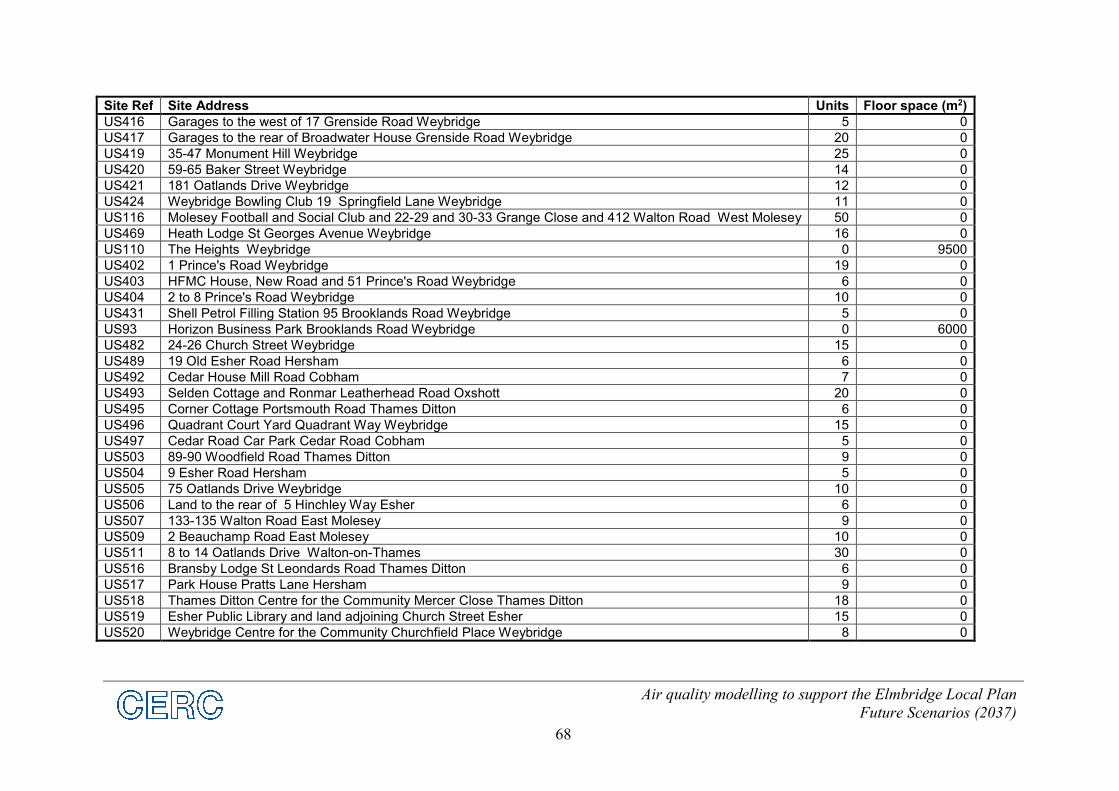
Air quality modelling to support the Elmbridge Local Plan
Future Scenarios (2037)
68
Site Ref Site Address Units Floor space (m2)
US416 Garages to the west of 17 Grenside Road Weybridge 5 0
US417 Garages to the rear of Broadwater House Grenside Road Weybridge 20 0
US419 35-47 Monument Hill Weybridge 25 0
US420 59-65 Baker Street Weybridge 14 0
US421 181 Oatlands Drive Weybridge 12 0
US424 Weybridge Bowling Club 19 Springfield Lane Weybridge 11 0
US116 Molesey Football and Social Club and 22-29 and 30-33 Grange Close and 412 Walton Road West Molesey 50 0
US469 Heath Lodge St Georges Avenue Weybridge 16 0
US110 The Heights Weybridge 0 9500
US402 1 Prince's Road Weybridge 19 0
US403 HFMC House, New Road and 51 Prince's Road Weybridge 6 0
US404 2 to 8 Prince's Road Weybridge 10 0
US431 Shell Petrol Filling Station 95 Brooklands Road Weybridge 5 0
US93 Horizon Business Park Brooklands Road Weybridge 0 6000
US482 24-26 Church Street Weybridge 15 0
US489 19 Old Esher Road Hersham 6 0
US492 Cedar House Mill Road Cobham 7 0
US493 Selden Cottage and Ronmar Leatherhead Road Oxshott 20 0
US495 Corner Cottage Portsmouth Road Thames Ditton 6 0
US496 Quadrant Court Yard Quadrant Way Weybridge 15 0
US497 Cedar Road Car Park Cedar Road Cobham 5 0
US503 89-90 Woodfield Road Thames Ditton 9 0
US504 9 Esher Road Hersham 5 0
US505 75 Oatlands Drive Weybridge 10 0
US506 Land to the rear of 5 Hinchley Way Esher 6 0
US507 133-135 Walton Road East Molesey 9 0
US509 2 Beauchamp Road East Molesey 10 0
US511 8 to 14 Oatlands Drive Walton-on-Thames 30 0
US516 Bransby Lodge St Leondards Road Thames Ditton 6 0
US517 Park House Pratts Lane Hersham 9 0
US518 Thames Ditton Centre for the Community Mercer Close Thames Ditton 18 0
US519 Esher Public Library and land adjoining Church Street Esher 15 0
US520 Weybridge Centre for the Community Churchfield Place Weybridge 8 0
Air quality modelling to support the Elmbridge Local Plan
Future Scenarios (2037)
69
APPENDIX B: Summary of ADMS-Urban
ADMS-Urban is a scientifically advanced but practical air pollution modelling tool, which has
been developed to provide high resolution calculations of pollution concentrations for all sizes
of study area relevant to the urban environment. The model can be used to look at
concentrations near a single road junction or over a region extending across the whole of a
major city. ADMS-Urban is used worldwide to assess air quality impact for a wide range of
planning and policy studies, incorporating elements such as Low Emission Zones, traffic
management, clean vehicle technologies and modal shift. In the UK, it is used extensively for
air quality review and assessment carried out by local government.
The following is a summary of the capabilities and validation of ADMS-Urban. More details
can be found on the CERC web site15.
ADMS-Urban is a development of the Atmospheric Dispersion Modelling System (ADMS),
which has been developed to investigate the impacts of emissions from industrial facilities.
ADMS-Urban allows full characterisation of the wide variety of emissions in urban areas,
including an extensively validated road traffic emissions model. It also includes a number of
other features, which include consideration of:
the effects of vehicle movement on the dispersion of traffic emissions;
the behaviour of material released into street-canyons;
the chemical reactions occurring between nitrogen oxides, ozone and Volatile Organic
Compounds (VOCs);
the pollution entering a study area from beyond its boundaries;
the effects of complex terrain on the dispersion of pollutants;
the effects of the urban canopy on the dispersion of pollutants; and
the effects of a building on the dispersion of pollutants emitted nearby.
Further details of these features are provided below.
Studies of extensive urban areas are necessarily complex, requiring the manipulation of large
amounts of data. To allow users to cope effectively with this requirement, ADMS-Urban runs
in Windows 10 and Windows 8 environments. The manipulation of data is further facilitated
by the ADMS-Urban Mapper, which allows for the visualisation and manipulation of
geospatial information, and by the CERC Emissions Inventory Toolkit, EMIT.
15 https://www.cerc.co.uk/environmental-software/ADMS-Urban-model.html

Air quality modelling to support the Elmbridge Local Plan
Future Scenarios (2037)
70
Dispersion Modelling
ADMS and ADMS-Urban use boundary layer similarity profiles to parameterise the variation of
turbulence with height within the boundary layer, and the use of a skewed-Gaussian distribution
to determine the vertical variation of pollutant concentrations in the plume under convective
conditions.
The main dispersion modelling features of ADMS-Urban are as follows:
ADMS-Urban is an advanced dispersion model in which the boundary layer structure is
characterised by the height of the boundary layer and the Monin-Obukhov length, a length
scale dependent on the friction velocity and the heat flux at the surface. This method
supersedes methods based on Pasquill Stability Categories, as used in, for example, the US
models Caline and ISC. Concentrations are calculated hour by hour and are fully dependent
on prevailing weather conditions.
For convective conditions, a non-Gaussian vertical profile of concentration allows for
the skewed nature of turbulence within the atmospheric boundary layer, which can lead to
high concentrations near to the source.
A meteorological processor calculates boundary layer parameters from a variety of input
data, typically including date and time, wind speed and direction, surface temperature and
cloud cover. Meteorological data may be raw, hourly averaged or statistically analysed
data.
Emissions
Emissions into the atmosphere across an urban area typically come from a wide variety of
sources. There are likely to be emissions from road traffic, as well as from domestic heating
systems and industrial emissions from chimneys. To represent the full range of emissions
configurations, the explicit source types available within ADMS-Urban are:
Roads, for which emissions are specified in terms of vehicle flows and the additional initial
dispersion caused by moving vehicles is also taken into account.
Industrial points, for which plume rise and stack downwash are included in the modelling.
Areas, where a source or sources is best represented as uniformly spread over an area.
Volumes, where a source or sources is best represented as uniformly spread throughout a
volume.
In addition, sources can also be modelled as a regular grid of emissions. This allows the
contributions of large numbers of minor sources to be efficiently included in a study while the
majority of the modelling effort is used for the relatively few significant sources.
ADMS-Urban can be used in conjunction with CERC’s Emissions Inventory Toolkit, EMIT,
which facilitates the management and manipulation of large and complex data sets into usable
emissions inventories.
Air quality modelling to support the Elmbridge Local Plan
Future Scenarios (2037)
71
Presentation of Results
The results from the model can be based on a wide range of averaging times, and include rolling
averages. Maximum concentration values and percentiles can be calculated where appropriate
meteorological input data have been input to the model. This allows ADMS-Urban to be used
to calculate concentrations for direct comparison with existing air quality limits, guidelines and
objectives, in whatever form they are specified.
ADMS-Urban has an integrated Mapper which facilitates both the compilation and
manipulation of the emissions information required as input to the model and the interpretation
and presentation of the air quality results provided. ADMS-Urban can also be integrated with
ArcGIS or MapInfo.
Complex Effects - Street Canyons
ADMS-Urban incorporates two methods for representing the effect of street canyons on the
dispersion of road traffic emissions: a basic canyon method based on the Operational Street
Pollution Model (OSPM) 16 , developed by the Danish National Environmental Research
Institute (NERI); and an advanced street canyon module, developed by CERC. The basic
canyon model was designed for simple symmetric canyons with height similar to width and
assumes that road traffic emissions originate throughout the base of the canyon, i.e. that the
emissions are spread across both the road and neighbouring pavements.
The advanced canyon model17 was developed to overcome these limitations and is our model
of choice. It represents the effects of channelling flow along and recirculating flow across a
street canyon, dispersion out of the canyon through gaps in the walls, over the top of the
buildings or out of the end of the canyon. It can take into account canyon asymmetry and
restricts the emissions area to the road carriageway.
Complex Effects - Chemistry
ADMS-Urban includes the Generic Reaction Set (GRS)18 atmospheric chemistry scheme. The
original scheme has seven reactions, including those occurring between nitrogen oxides and
ozone and parameterisations of the large number of reactions involving a wide range of Volatile
Organic Compounds (VOCs). In addition, an eighth reaction has been included within ADMS-
Urban for the situation when high concentrations of nitric oxide (NO) can convert to nitrogen
dioxide (NO2) using molecular oxygen.
16 Hertel, O., Berkowicz, R. and Larssen, S., 1990, ‘The Operational Street Pollution Model (OSPM).’ 18th
International meeting of NATO/CCMS on Air Pollution Modelling and its Applications. Vancouver, Canada,
pp741-749. 17 Hood C, Carruthers D, Seaton M, Stocker J and Johnson K, 2014. Urban canopy flow field and advanced street
canyon modelling in ADMS-Urban.16th International Conference on Harmonisation within Atmospheric
Dispersion Modelling for Regulatory Purposes, Varna, Bulgaria, September 2014.
http://www.harmo.org/Conferences/Proceedings/_Varna/publishedSections/H16-067-Hood-EA.pdf 18 Venkatram, A., Karamchandani, P., Pai, P. and Goldstein, R., 1994, ‘The Development and Application of a
Simplified Ozone Modelling System.’ Atmospheric Environment, Vol 28, No 22, pp3665-3678.
Air quality modelling to support the Elmbridge Local Plan
Future Scenarios (2037)
72
In addition to the basic GRS scheme, ADMS-Urban also includes a trajectory model19 for use
when modelling large areas. This permits the chemical conversions of the emissions and
background concentrations upwind of each location to be properly taken into account.
Complex Effects - Terrain
As well as the effect that complex terrain has on wind direction and, consequently, pollution
transport, it can also enhance turbulence and therefore increase dispersion. These effects are
taken into account in ADMS-Urban using the FLOWSTAR20 model developed by CERC.
Complex Effects – Urban Canopy
As wind approaches an urban area of relatively densely packed buildings, the wind profile is
vertically displaced. The wind speed and turbulence levels are also reduced within the area of
buildings. These effects are taken into account in ADMS-Urban by modifying the wind speed
and turbulence profiles based on parameters describing the amount and size of buildings within
an urban area.
Data Comparisons – Model Validation
ADMS-Urban is a development of the Atmospheric Dispersion Modelling System (ADMS),
which is used throughout the UK by industry and the Environment Agency to model emissions
from industrial sources. ADMS has been subject to extensive validation, both of individual
components (e.g. point source, street canyon, building effects and meteorological pre-processor)
and of its overall performance.
ADMS-Urban has been extensively tested and validated against monitoring data for large urban
areas in the UK and overseas, including London, Birmingham, Manchester, Glasgow, Riga,
Cape Town, Hong Kong and Beijing, as part of projects supported by local governments and
research organisations. A summary of model validation studies is available online21. CERC
have co-authored 22 a number of papers presenting results from ADMS-Urban, and other
organisations have published the outcomes of their applications of the model23.
19 Singles, R.J., Sutton, M.A. and Weston, K.J., 1997, ‘A multi-layer model to describe the atmospheric transport
and deposition of ammonia in Great Britain.’ In: International Conference on Atmospheric Ammonia: Emission,
Deposition and Environmental Impacts. Atmospheric Environment, Vol 32, No 3. 20 Carruthers D.J., Hunt J.C.R. and Weng W-S. 1988. ‘A computational model of stratified turbulent airflow over
hills – FLOWSTAR I.’ Proceedings of Envirosoft. In: Computer Techniques in Environmental Studies, P. Zanetti
(Ed) pp 481-492. Springer-Verlag. 21 www.cerc.co.uk/Validation 22 www.cerc.co.uk/CERCCoAuthorPublications 23 www.cerc.co.uk/CERCSoftwarePublications
Related Documents