Report Air Quality Impact Assessment Pheasants Nest, NSW Justin and Renee Camilleri C/- Tattersall Lander 30 November 2017 Rev 1 (Final)

Welcome message from author
This document is posted to help you gain knowledge. Please leave a comment to let me know what you think about it! Share it to your friends and learn new things together.
Transcript

Report
Air Quality Impact Assessment
Pheasants Nest, NSW
Justin and Renee Camilleri C/- Tattersall
Lander
30 November 2017
Rev 1 (Final)
Report Details
Air Quality Impact Assessment - Pheasants Nest, NSW
Job #: J0160298, Folder #: F14719, Revision: 1 (Final), Date: 30 November 2017
Filename: 14719 AQIA Pheasants Nest Poultry Farm Rev1.docx
Prepared For
Justin and Renee Camilleri C/- Tattersall Lander
Bob Lander, Director
Email: [email protected], Telephone: 02 4987 1500, Mobile: 0408 497 657
PO Box 580 Raymond Terrace NSW 2324
Prepared By
Advitech Pty Limited t/a Advitech Environmental
ABN: 29 003 433 458
Patrick McGaw, Process Engineer
Email: [email protected], Telephone: 02 4924 5400,
Facsimile: 02 4967 3772, Web: www.advitech.com.au, General Email: [email protected]
7 Riverside Drive Mayfield West NSW 2304 PO Box 207 Mayfield NSW 2304
History
Date Revision Comments
30 October 2017 0 Final Issue
30 November 2017 1 Final Issue with Client Comments Included
Endorsements
Function Signature Name and Title Date
Prepared By Patrick McGaw
Process Engineer 30 November 2017
Checked & Authorised By
Dr Carl Fung – Lead Consultant Process Engineering & Sustainability, (CAQP-CASANZ)
30 November 2017
DISCLAIMER - Any representation, statement, opinion or advice expressed or implied in this document
is made in good faith, but on the basis that liability (whether by reason of negligence or otherwise) is
strictly limited to that expressed on our standard “Conditions of Engagement”.
INTELLECTUAL PROPERTY – All Intellectual Property rights in this document remain the property
of Advitech Pty Ltd. This document must only be used for the purposes for which it is provided and not otherwise reproduced, copied or distributed without the express consent of Advitech.

Air Quality Impact Assessment
Justin and Renee Camilleri C/- Tattersall Lander
14719 AQIA Pheasants Nest Poultry Farm Rev1.docx
30 November 2017
i
TABLE OF CONTENTS
1. INTRODUCTION ____________________________________________________________ 3
1.1 Project Overview 3
1.2 Site Location 3
1.3 Process Description 6
1.4 Sensitive Receivers 6
1.5 Site Topography 10
2. AIR QUALITY GUIDELINES __________________________________________________ 11
3. GROUND LEVEL CONCENTRATIONS _________________________________________ 11
4. CLIMATE AND DISPERSION METEOROLOGY __________________________________ 13
4.1 Pheasants Nest Locality 13
4.2 CALMET Meteorological Domain 14
5. POULTRY FARM SITE METEOROLOGY _______________________________________ 15
5.1 Wind Direction 15
5.2 Atmospheric Stability 16
5.3 Mixing Height 17
6. MODELLING APPROACH/METHODOLOGY _____________________________________ 18
7. EXISTING AIR QUALITY ENVIRONMENT _______________________________________ 19
7.1 Odour 19
7.2 Particulates 19
8. AIR EMISSION APPROACH/METHODOLOGY ___________________________________ 21
8.1 Ventilation 21
8.2 Odour Emissions 22
8.3 Particulate Emissions 24
9. DISPERSION MODELLING __________________________________________________ 25
9.1 Meteorological Model Configuration 25
9.2 Dispersion Modelling Configuration 26
9.3 Modelling Scenarios 26
9.4 Assumptions 27
10. EMISSIONS SOURCES _____________________________________________________ 28
11. DISPERSION MODELLING RESULTS __________________________________________ 29
11.1 Odour 29
11.2 Particulates 34
12. DISCUSSION _____________________________________________________________ 50
13. CONCLUSIONS ___________________________________________________________ 50

Air Quality Impact Assessment
Justin and Renee Camilleri C/- Tattersall Lander
14719 AQIA Pheasants Nest Poultry Farm Rev1.docx
30 November 2017
ii
14. REFERENCES ____________________________________________________________ 51
APPENDICES
APPENDIX I
Example CALMET and CALPUFF Input Files
APPENDIX II
24 Hour Average PM10 – Level 2 Contemporaneous Impact and Background Assessments
APPENDIX III
24 Hour Average PM2.5 – Level 2 Contemporaneous Impact and Background Assessments

Air Quality Impact Assessment
Justin and Renee Camilleri C/- Tattersall Lander
14719 AQIA Pheasants Nest Poultry Farm Rev1.docx
30 November 2017
3
1. INTRODUCTION
Advitech Pty Limited (trading as Advitech Environmental) was engaged by Tattersall Lander (TL) to
prepare an Air Quality Impact Assessment for a proposed poultry farm at the 180 Mockingbird Road,
Pheasants Nest, NSW.
It should be noted that this report was prepared by Advitech Pty Limited for Justin and Renee Camilleri
C/- Tattersall Lander (“the customer”) in accordance with the scope of work and specific requirements
agreed between Advitech and the customer. This report was prepared with background information,
terms of reference and assumptions agreed with the customer. The report is not intended for use by
any other individual or organisation and as such, Advitech will not accept liability for use of the
information contained in this report, other than that which was intended at the time of writing.
1.1 Project Overview
Advitech Environmental understands that the proposed poultry farm would house up to 315,000 birds
destined for meat production. The proposed development consists of 7 newly constructed tunnel
ventilated poultry sheds.
The growing period for birds within each shed would occur concurrently, with delivery of bedding (litter)
and day-old chicks at the beginning of each growing cycle. Birds would be picked-up for processing
between days 32 and 50. Birds would be likely picked-up during night and early-morning periods and
is subject to the processors requirements. At the end of the growing cycle, the sheds would be
cleaned-out (e.g. removal of manure and litter) and sterilised prior to the next delivery of chicks. The
used litter is stored in a composting shed and used in the composting of dead poultry.
Feed would be delivered twice weekly. This would typically occur during the day period, however
under some circumstances, feed may be delivered during the night or evening period.
1.2 Site Location
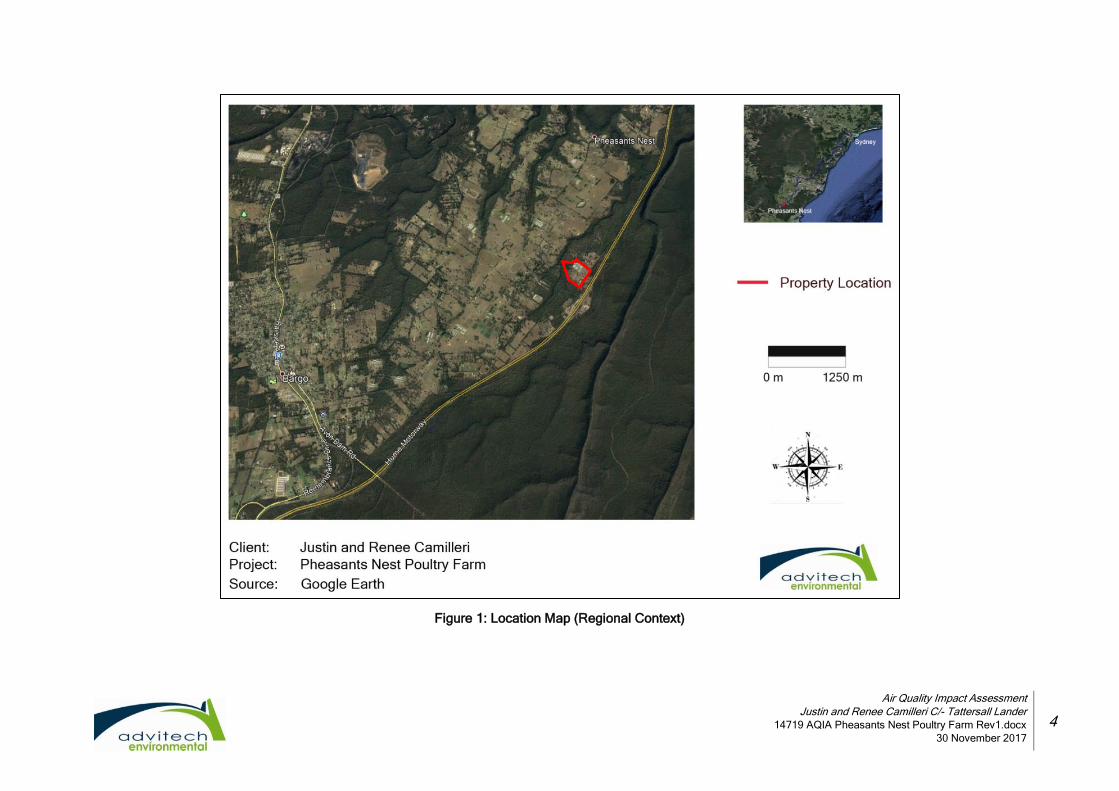
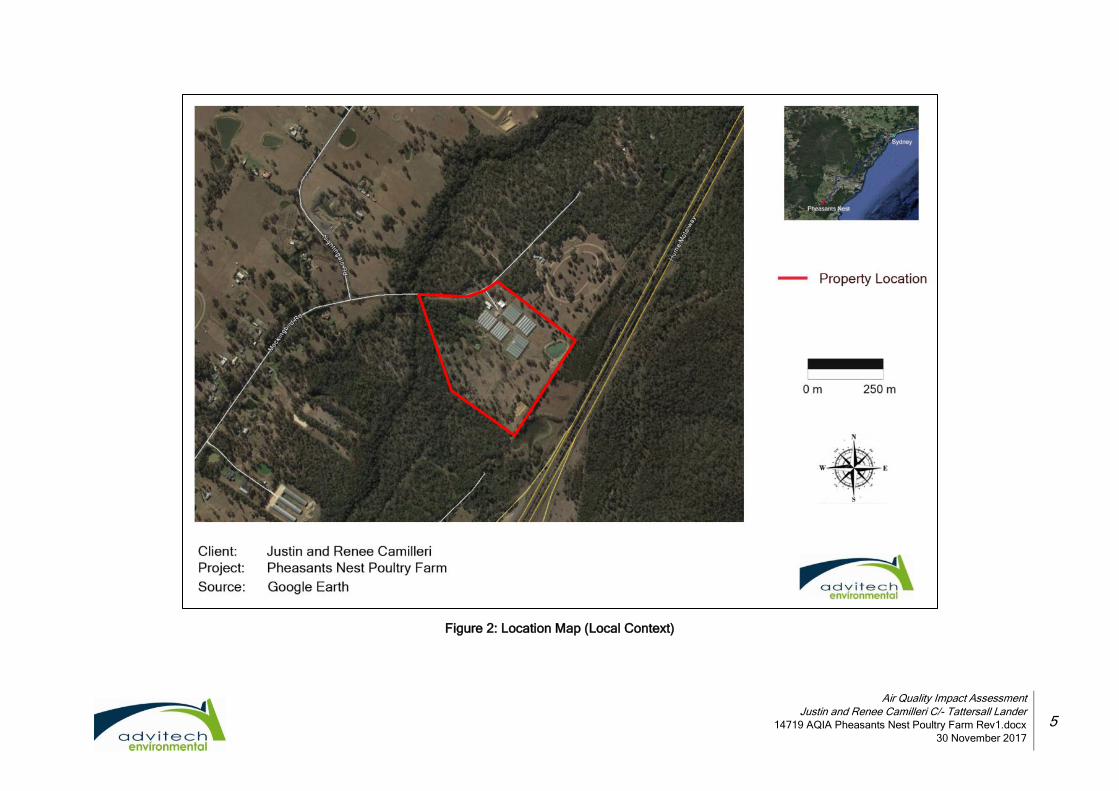
The site is located approximately five kilometres (km) east-northeast of Bargo. The subject site is
described as Lot 264 on DP 625326, also known as 180 Mockingbird Road, Pheasants Nest. The
current site is utilised for the purpose of a market garden. Land uses immediately surrounding the site
are primarily rural (small acreages and farms). Figure 1 and Figure 2 display the regional and local
context of the subject site.
Air Quality Impact Assessment
Justin and Renee Camilleri C/- Tattersall Lander
14719 AQIA Pheasants Nest Poultry Farm Rev1.docx
30 November 2017
4
Figure 1: Location Map (Regional Context)
Air Quality Impact Assessment
Justin and Renee Camilleri C/- Tattersall Lander
14719 AQIA Pheasants Nest Poultry Farm Rev1.docx
30 November 2017
5
Figure 2: Location Map (Local Context)

Air Quality Impact Assessment
Justin and Renee Camilleri C/- Tattersall Lander
14719 AQIA Pheasants Nest Poultry Farm Rev1.docx
30 November 2017
6
1.3 Process Description
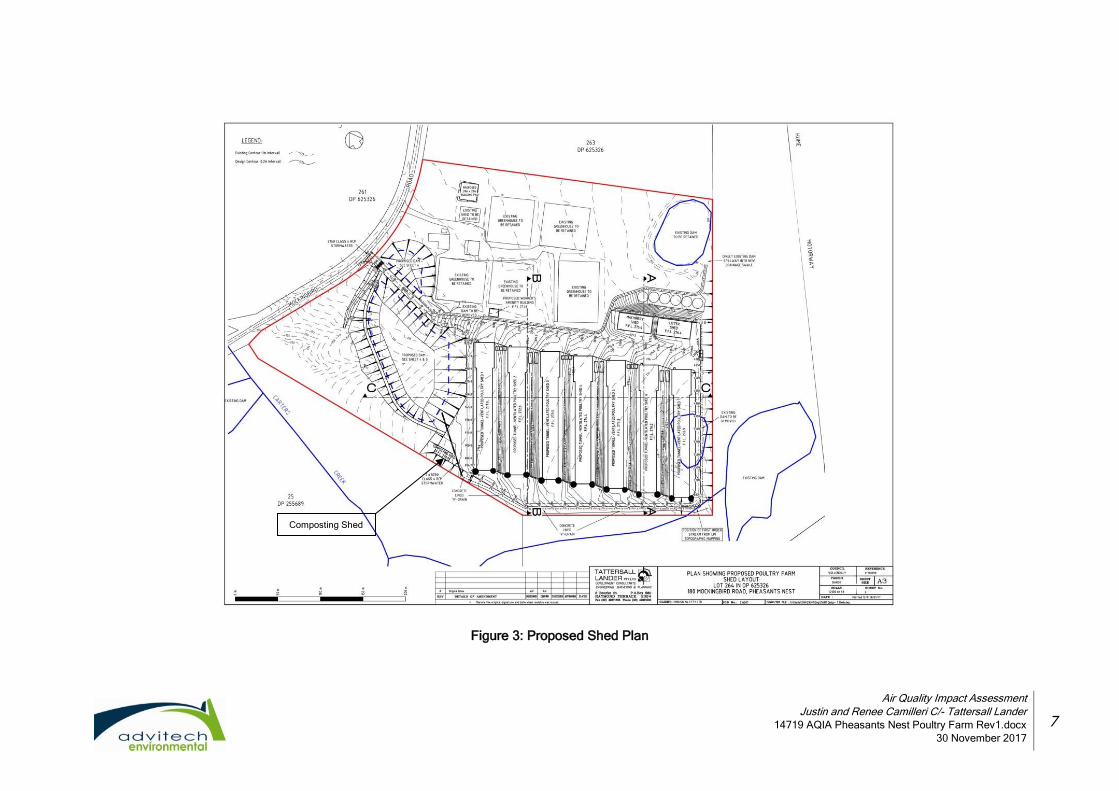
Advitech Environmental understands that the proposal involves installation of seven new tunnel
ventilated poultry sheds located at Lot 264 DP 625326 180 Mockingbird Road, Pheasants Nest, New
South Wales (refer to Figure 3 and Figure 4). The proposed sheds would be approximately orientated
in a north east to south west direction. Ventilation would be provided by 15 axial fans per shed
directed through a 10 metre (m) stack positioned at the earth mound facing end of the shed. The
proposed sheds measure 150 m by 18.3 m, giving a total floor area of 2,745 m2. The birds will remain
in the sheds at all times.
The proposed layout of the sheds is shown in Figure 3. Access to the site would be via Mockingbird
Road adjacent to the northern site boundary.
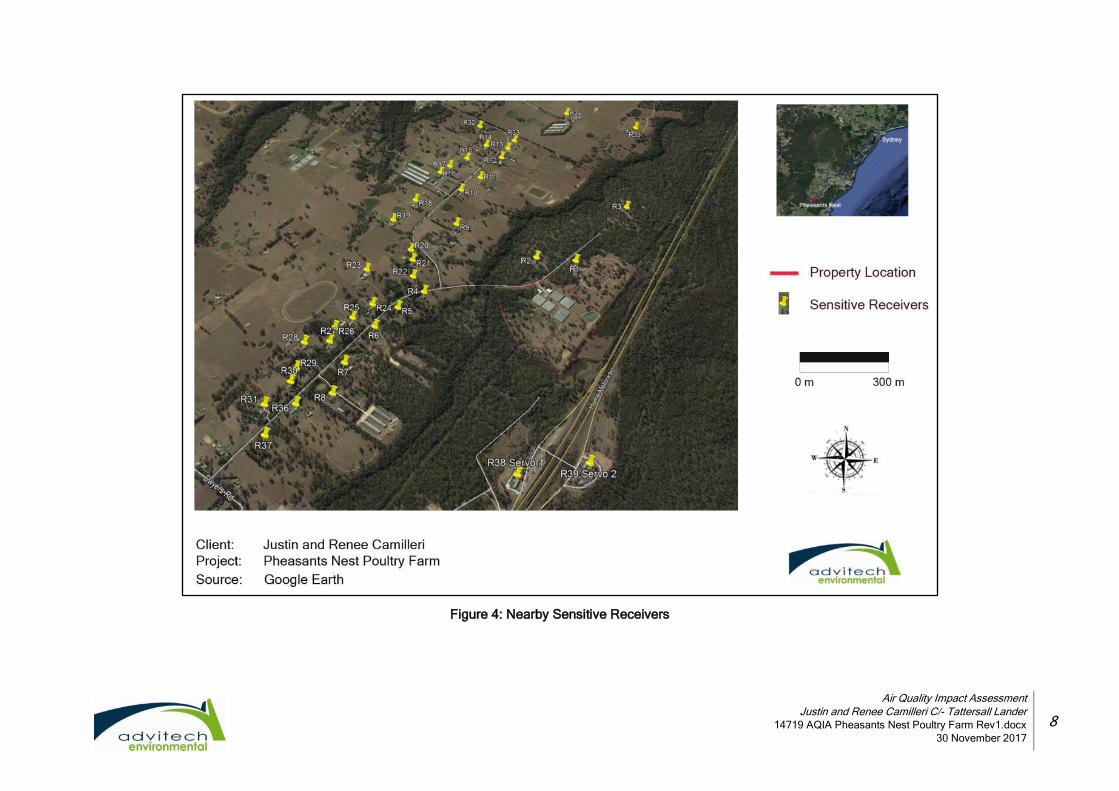
1.4 Sensitive Receivers
The site is positioned in a rural receiving environment, with small acreages surrounding the site. The
closest urban settlement to the proposed development is Bargo located approximately 5 km to the
west.
Of the 39 identified sensitive receivers within a radius of approximately 1.5 km of the proposed site,
37 are residential receivers and 2 are service stations on the Hume Motorway. Sensitive receivers
were identified based on their proximity and exposure to the subject site. The locations of nearby
sensitive receivers are shown in Figure 4 and detailed in Table 1.
Air Quality Impact Assessment
Justin and Renee Camilleri C/- Tattersall Lander
14719 AQIA Pheasants Nest Poultry Farm Rev1.docx
30 November 2017
7
Figure 3: Proposed Shed Plan
Composting Shed
Air Quality Impact Assessment
Justin and Renee Camilleri C/- Tattersall Lander
14719 AQIA Pheasants Nest Poultry Farm Rev1.docx
30 November 2017
8
Figure 4: Nearby Sensitive Receivers
Air Quality Impact Assessment
Justin and Renee Camilleri C/- Tattersall Lander
14719 AQIA Pheasants Nest Poultry Farm Rev1.docx
30 November 2017
9
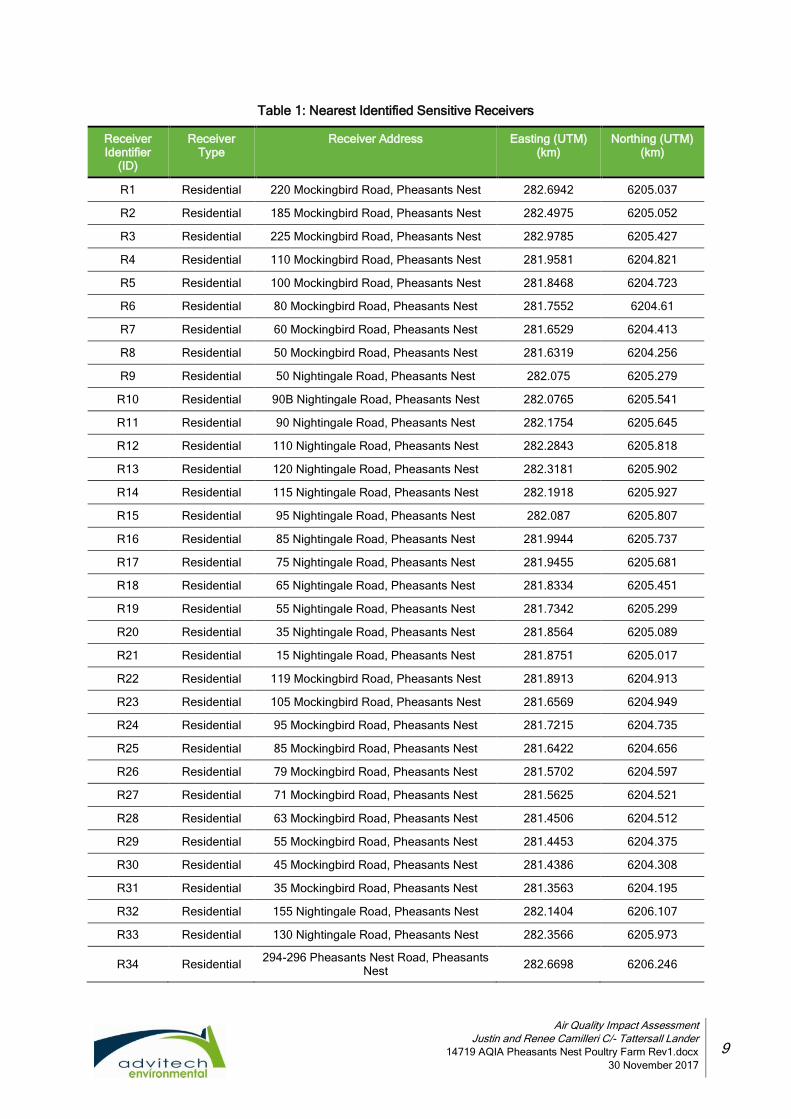
Table 1: Nearest Identified Sensitive Receivers
Receiver Identifier
(ID)
Receiver Type
Receiver Address Easting (UTM) (km)
Northing (UTM) (km)
R1 Residential 220 Mockingbird Road, Pheasants Nest 282.6942 6205.037
R2 Residential 185 Mockingbird Road, Pheasants Nest 282.4975 6205.052
R3 Residential 225 Mockingbird Road, Pheasants Nest 282.9785 6205.427
R4 Residential 110 Mockingbird Road, Pheasants Nest 281.9581 6204.821
R5 Residential 100 Mockingbird Road, Pheasants Nest 281.8468 6204.723
R6 Residential 80 Mockingbird Road, Pheasants Nest 281.7552 6204.61
R7 Residential 60 Mockingbird Road, Pheasants Nest 281.6529 6204.413
R8 Residential 50 Mockingbird Road, Pheasants Nest 281.6319 6204.256
R9 Residential 50 Nightingale Road, Pheasants Nest 282.075 6205.279
R10 Residential 90B Nightingale Road, Pheasants Nest 282.0765 6205.541
R11 Residential 90 Nightingale Road, Pheasants Nest 282.1754 6205.645
R12 Residential 110 Nightingale Road, Pheasants Nest 282.2843 6205.818
R13 Residential 120 Nightingale Road, Pheasants Nest 282.3181 6205.902
R14 Residential 115 Nightingale Road, Pheasants Nest 282.1918 6205.927
R15 Residential 95 Nightingale Road, Pheasants Nest 282.087 6205.807
R16 Residential 85 Nightingale Road, Pheasants Nest 281.9944 6205.737
R17 Residential 75 Nightingale Road, Pheasants Nest 281.9455 6205.681
R18 Residential 65 Nightingale Road, Pheasants Nest 281.8334 6205.451
R19 Residential 55 Nightingale Road, Pheasants Nest 281.7342 6205.299
R20 Residential 35 Nightingale Road, Pheasants Nest 281.8564 6205.089
R21 Residential 15 Nightingale Road, Pheasants Nest 281.8751 6205.017
R22 Residential 119 Mockingbird Road, Pheasants Nest 281.8913 6204.913
R23 Residential 105 Mockingbird Road, Pheasants Nest 281.6569 6204.949
R24 Residential 95 Mockingbird Road, Pheasants Nest 281.7215 6204.735
R25 Residential 85 Mockingbird Road, Pheasants Nest 281.6422 6204.656
R26 Residential 79 Mockingbird Road, Pheasants Nest 281.5702 6204.597
R27 Residential 71 Mockingbird Road, Pheasants Nest 281.5625 6204.521
R28 Residential 63 Mockingbird Road, Pheasants Nest 281.4506 6204.512
R29 Residential 55 Mockingbird Road, Pheasants Nest 281.4453 6204.375
R30 Residential 45 Mockingbird Road, Pheasants Nest 281.4386 6204.308
R31 Residential 35 Mockingbird Road, Pheasants Nest 281.3563 6204.195
R32 Residential 155 Nightingale Road, Pheasants Nest 282.1404 6206.107
R33 Residential 130 Nightingale Road, Pheasants Nest 282.3566 6205.973
R34 Residential 294-296 Pheasants Nest Road, Pheasants
Nest 282.6698 6206.246
Air Quality Impact Assessment
Justin and Renee Camilleri C/- Tattersall Lander
14719 AQIA Pheasants Nest Poultry Farm Rev1.docx
30 November 2017
10
Receiver Identifier
(ID)
Receiver Type
Receiver Address Easting (UTM) (km)
Northing (UTM) (km)
R35 Residential 180 Whipbird Road, Pheasants Nest 283.0833 6206.116
R36 Residential 40 Mockingbird Road, Pheasants Nest 281.4869 6204.200
R37 Residential 20 Mockingbird Road, Pheasants Nest 281.3952 6204.054
R38 Commercial Northbound Service Station, Hume
Highway, Pheasants Nest 282.4349 6203.911
R39 Commercial Southbound Service Station, Hume
Highway, Pheasants Nest 282.7217 6203.969
UTM – Universal Transverse Mercator coordinate System based on the WGS84 Datum
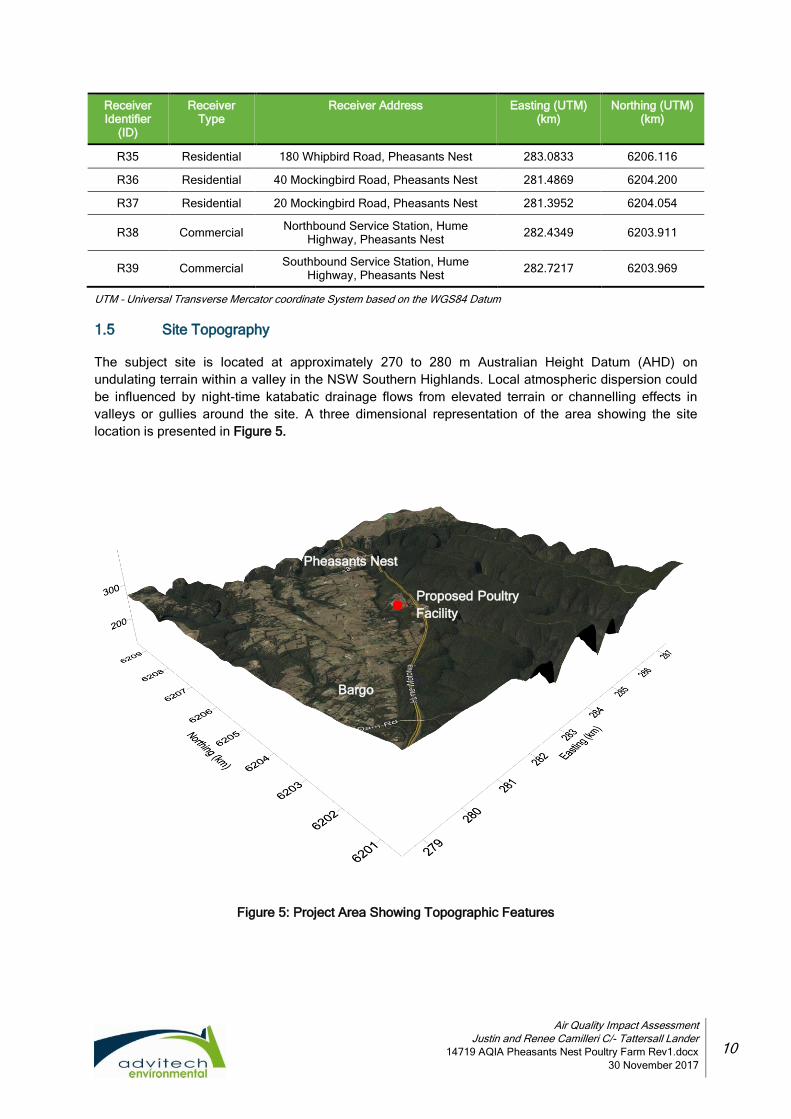
1.5 Site Topography
The subject site is located at approximately 270 to 280 m Australian Height Datum (AHD) on
undulating terrain within a valley in the NSW Southern Highlands. Local atmospheric dispersion could
be influenced by night-time katabatic drainage flows from elevated terrain or channelling effects in
valleys or gullies around the site. A three dimensional representation of the area showing the site
location is presented in Figure 5.
Figure 5: Project Area Showing Topographic Features
Proposed Poultry
Facility
Bargo
Pheasants Nest
Air Quality Impact Assessment
Justin and Renee Camilleri C/- Tattersall Lander
14719 AQIA Pheasants Nest Poultry Farm Rev1.docx
30 November 2017
11
2. AIR QUALITY GUIDELINES
The NSW Office of Environment and Heritage (OEH) specify impact assessment criteria for emissions
to air and permissible ground level concentrations (GLCs).
Note: The NSW Office of Environment and Heritage (OEH) came into existence in
April 2011. OEH was previously part of the Department of Environment, Climate Change
and Water (DECCW). The DECCW was also recently known as the Department of
Environment and Climate Change (DECC), and prior to that the Department of Environment
and Conservation (DEC). The terms OEH, DECCW, DECC and DEC are interchangeable
in this report.
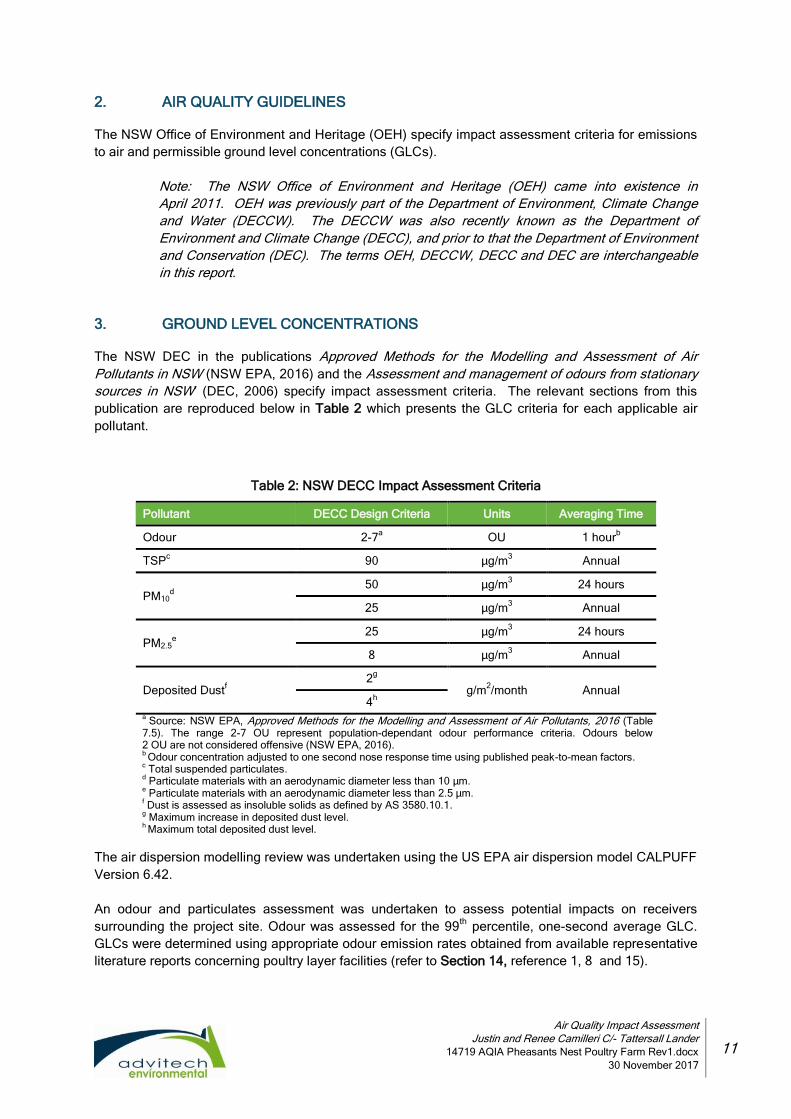
3. GROUND LEVEL CONCENTRATIONS
The NSW DEC in the publications Approved Methods for the Modelling and Assessment of Air
Pollutants in NSW (NSW EPA, 2016) and the Assessment and management of odours from stationary
sources in NSW’ (DEC, 2006) specify impact assessment criteria. The relevant sections from this
publication are reproduced below in Table 2 which presents the GLC criteria for each applicable air
pollutant.
Table 2: NSW DECC Impact Assessment Criteria
Pollutant DECC Design Criteria Units Averaging Time
Odour 2-7a OU 1 hour
b
TSPc 90 µg/m
3 Annual
PM10d
50 µg/m3 24 hours
25 µg/m3 Annual
PM2.5e
25 µg/m3 24 hours
8 µg/m3 Annual
Deposited Dustf
2g
g/m2/month Annual
4h
a Source: NSW EPA, Approved Methods for the Modelling and Assessment of Air Pollutants, 2016 (Table
7.5). The range 2-7 OU represent population-dependant odour performance criteria. Odours below 2 OU are not considered offensive (NSW EPA, 2016).
b Odour concentration adjusted to one second nose response time using published peak-to-mean factors.
c Total suspended particulates.
d Particulate materials with an aerodynamic diameter less than 10 µm.
e Particulate materials with an aerodynamic diameter less than 2.5 µm.
f Dust is assessed as insoluble solids as defined by AS 3580.10.1.
g Maximum increase in deposited dust level.
h Maximum total deposited dust level.
The air dispersion modelling review was undertaken using the US EPA air dispersion model CALPUFF
Version 6.42.
An odour and particulates assessment was undertaken to assess potential impacts on receivers
surrounding the project site. Odour was assessed for the 99th
percentile, one-second average GLC.
GLCs were determined using appropriate odour emission rates obtained from available representative
literature reports concerning poultry layer facilities (refer to Section 14, reference 1, 8 and 15).
Air Quality Impact Assessment
Justin and Renee Camilleri C/- Tattersall Lander
14719 AQIA Pheasants Nest Poultry Farm Rev1.docx
30 November 2017
12
TSP, PM10 and PM2.5 was assessed for the 100th
percentile over the respective averaging period using
one year of meteorological data.
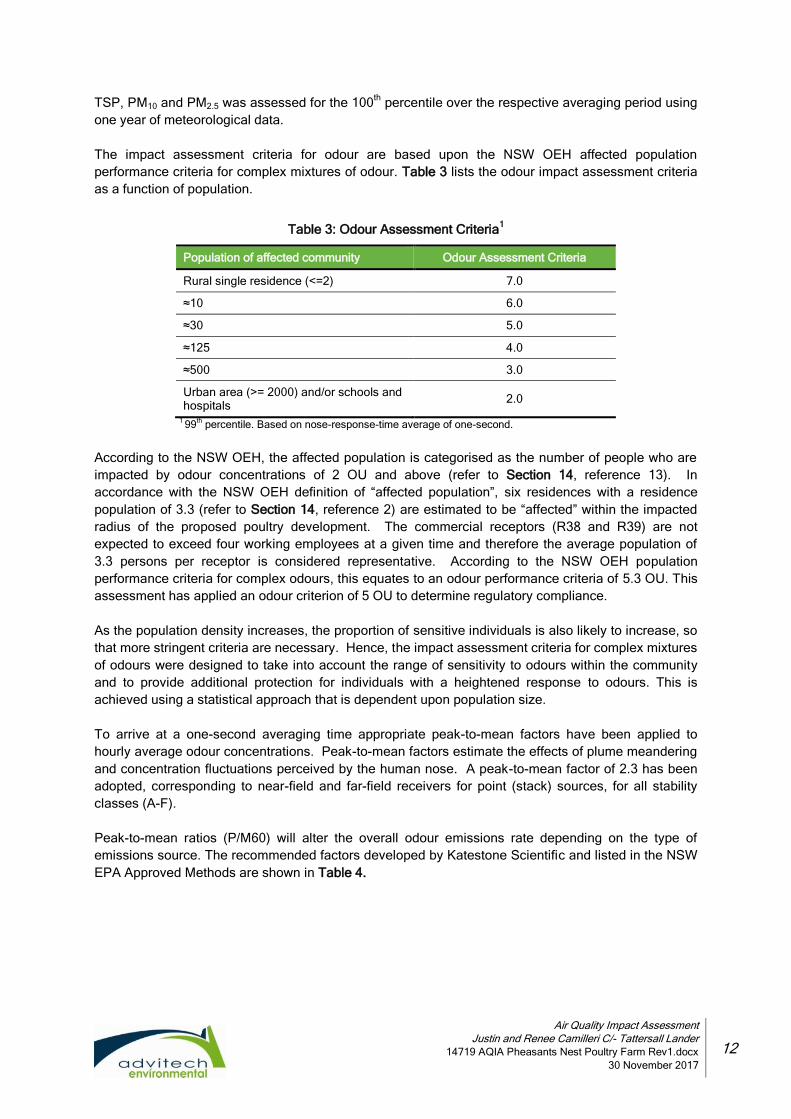
The impact assessment criteria for odour are based upon the NSW OEH affected population
performance criteria for complex mixtures of odour. Table 3 lists the odour impact assessment criteria
as a function of population.
Table 3: Odour Assessment Criteria1
Population of affected community Odour Assessment Criteria
Rural single residence (<=2) 7.0
≈10 6.0
≈30 5.0
≈125 4.0
≈500 3.0
Urban area (>= 2000) and/or schools and hospitals
2.0
1 99
th percentile. Based on nose-response-time average of one-second.
According to the NSW OEH, the affected population is categorised as the number of people who are
impacted by odour concentrations of 2 OU and above (refer to Section 14, reference 13). In
accordance with the NSW OEH definition of “affected population”, six residences with a residence
population of 3.3 (refer to Section 14, reference 2) are estimated to be “affected” within the impacted
radius of the proposed poultry development. The commercial receptors (R38 and R39) are not
expected to exceed four working employees at a given time and therefore the average population of
3.3 persons per receptor is considered representative. According to the NSW OEH population
performance criteria for complex odours, this equates to an odour performance criteria of 5.3 OU. This
assessment has applied an odour criterion of 5 OU to determine regulatory compliance.
As the population density increases, the proportion of sensitive individuals is also likely to increase, so
that more stringent criteria are necessary. Hence, the impact assessment criteria for complex mixtures
of odours were designed to take into account the range of sensitivity to odours within the community
and to provide additional protection for individuals with a heightened response to odours. This is
achieved using a statistical approach that is dependent upon population size.
To arrive at a one-second averaging time appropriate peak-to-mean factors have been applied to
hourly average odour concentrations. Peak-to-mean factors estimate the effects of plume meandering
and concentration fluctuations perceived by the human nose. A peak-to-mean factor of 2.3 has been
adopted, corresponding to near-field and far-field receivers for point (stack) sources, for all stability
classes (A-F).
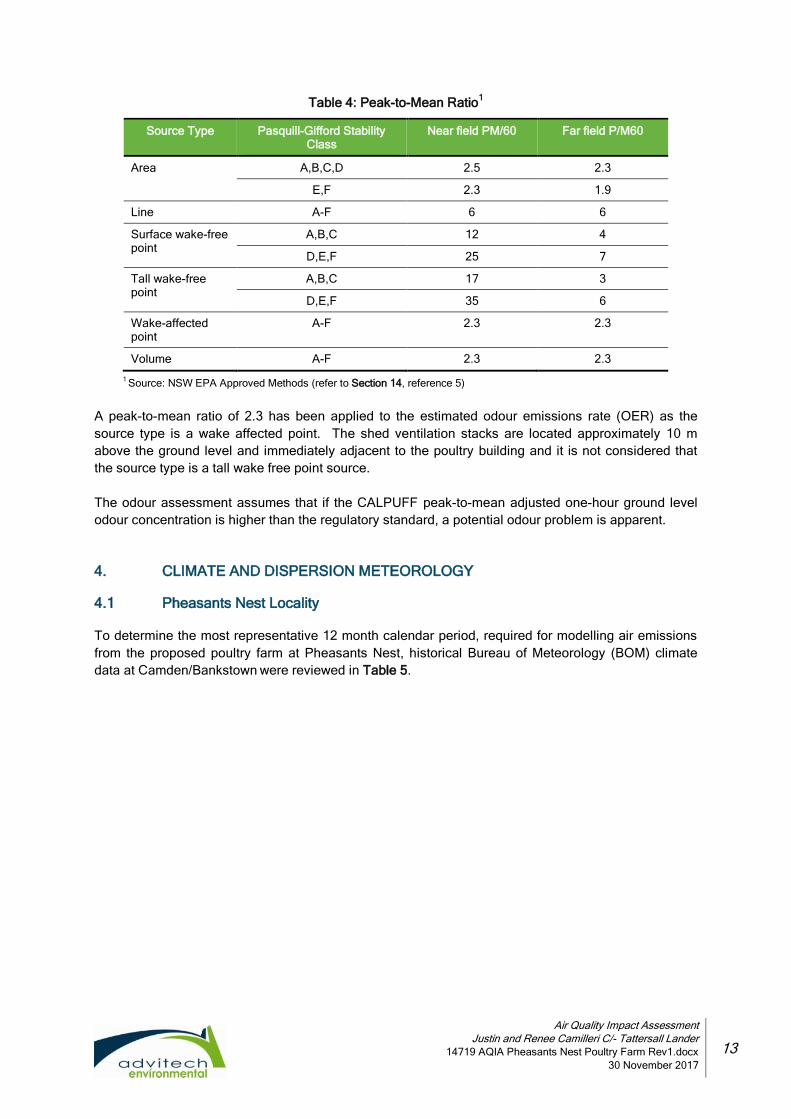
Peak-to-mean ratios (P/M60) will alter the overall odour emissions rate depending on the type of
emissions source. The recommended factors developed by Katestone Scientific and listed in the NSW
EPA Approved Methods are shown in Table 4.
Air Quality Impact Assessment
Justin and Renee Camilleri C/- Tattersall Lander
14719 AQIA Pheasants Nest Poultry Farm Rev1.docx
30 November 2017
13
Table 4: Peak-to-Mean Ratio1
Source Type Pasquill-Gifford Stability Class
Near field PM/60 Far field P/M60
Area A,B,C,D 2.5 2.3
E,F 2.3 1.9
Line A-F 6 6
Surface wake-free point
A,B,C 12 4
D,E,F 25 7
Tall wake-free point
A,B,C 17 3
D,E,F 35 6
Wake-affected point
A-F 2.3 2.3
Volume A-F 2.3 2.3
1 Source: NSW EPA Approved Methods (refer to Section 14, reference 5)
A peak-to-mean ratio of 2.3 has been applied to the estimated odour emissions rate (OER) as the
source type is a wake affected point. The shed ventilation stacks are located approximately 10 m
above the ground level and immediately adjacent to the poultry building and it is not considered that
the source type is a tall wake free point source.
The odour assessment assumes that if the CALPUFF peak-to-mean adjusted one-hour ground level
odour concentration is higher than the regulatory standard, a potential odour problem is apparent.
4. CLIMATE AND DISPERSION METEOROLOGY
4.1 Pheasants Nest Locality
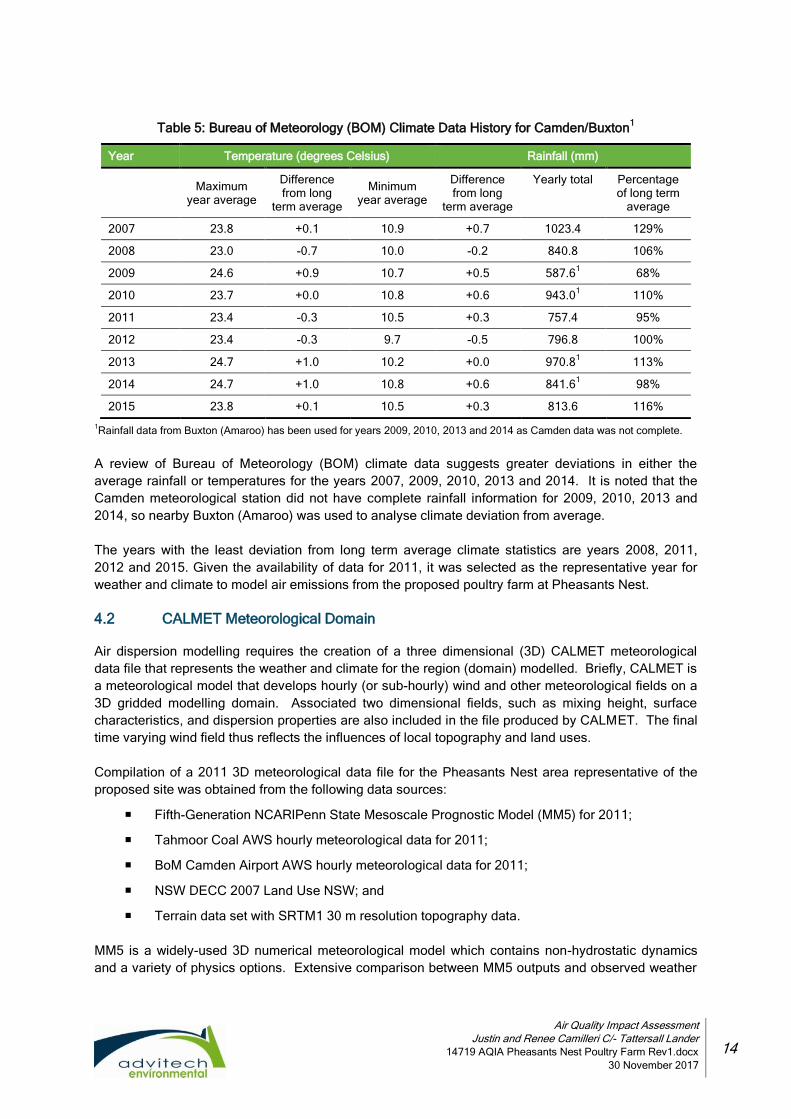
To determine the most representative 12 month calendar period, required for modelling air emissions
from the proposed poultry farm at Pheasants Nest, historical Bureau of Meteorology (BOM) climate
data at Camden/Bankstown were reviewed in Table 5.
Air Quality Impact Assessment
Justin and Renee Camilleri C/- Tattersall Lander
14719 AQIA Pheasants Nest Poultry Farm Rev1.docx
30 November 2017
14
Table 5: Bureau of Meteorology (BOM) Climate Data History for Camden/Buxton1
Year Temperature (degrees Celsius) Rainfall (mm)
Maximum
year average
Difference from long
term average
Minimum year average
Difference from long
term average
Yearly total Percentage of long term
average
2007 23.8 +0.1 10.9 +0.7 1023.4 129%
2008 23.0 -0.7 10.0 -0.2 840.8 106%
2009 24.6 +0.9 10.7 +0.5 587.61
68%
2010 23.7 +0.0 10.8 +0.6 943.01
110%
2011 23.4 -0.3 10.5 +0.3 757.4
95%
2012 23.4 -0.3 9.7 -0.5 796.8 100%
2013 24.7 +1.0 10.2 +0.0 970.81
113%
2014 24.7 +1.0 10.8 +0.6 841.61
98%
2015 23.8 +0.1 10.5 +0.3 813.6 116%
1Rainfall data from Buxton (Amaroo) has been used for years 2009, 2010, 2013 and 2014 as Camden data was not complete.
A review of Bureau of Meteorology (BOM) climate data suggests greater deviations in either the
average rainfall or temperatures for the years 2007, 2009, 2010, 2013 and 2014. It is noted that the
Camden meteorological station did not have complete rainfall information for 2009, 2010, 2013 and
2014, so nearby Buxton (Amaroo) was used to analyse climate deviation from average.
The years with the least deviation from long term average climate statistics are years 2008, 2011,
2012 and 2015. Given the availability of data for 2011, it was selected as the representative year for
weather and climate to model air emissions from the proposed poultry farm at Pheasants Nest.
4.2 CALMET Meteorological Domain
Air dispersion modelling requires the creation of a three dimensional (3D) CALMET meteorological
data file that represents the weather and climate for the region (domain) modelled. Briefly, CALMET is
a meteorological model that develops hourly (or sub-hourly) wind and other meteorological fields on a
3D gridded modelling domain. Associated two dimensional fields, such as mixing height, surface
characteristics, and dispersion properties are also included in the file produced by CALMET. The final
time varying wind field thus reflects the influences of local topography and land uses.
Compilation of a 2011 3D meteorological data file for the Pheasants Nest area representative of the
proposed site was obtained from the following data sources:
Fifth-Generation NCARlPenn State Mesoscale Prognostic Model (MM5) for 2011;
Tahmoor Coal AWS hourly meteorological data for 2011;
BoM Camden Airport AWS hourly meteorological data for 2011;
NSW DECC 2007 Land Use NSW; and
Terrain data set with SRTM1 30 m resolution topography data.
MM5 is a widely-used 3D numerical meteorological model which contains non-hydrostatic dynamics
and a variety of physics options. Extensive comparison between MM5 outputs and observed weather

Air Quality Impact Assessment
Justin and Renee Camilleri C/- Tattersall Lander
14719 AQIA Pheasants Nest Poultry Farm Rev1.docx
30 November 2017
15
data has validated its use for application in the preparation of 3D CALMET weather files (refer to
Section 14, reference 18). MM5 is capable of simulating a variety of meteorological phenomena such
as tropical cyclones, severe convective storms, sea-land breezes, and terrain forced flows such as
mountain valley wind systems.
Hourly weather information for 2011 was obtained from the nearby Tahmoor Coal facility. The
Tahmoor Coal monitoring station is located approximately 4.5 km west of the proposed poultry farm.
The subsequent generated 3D meteorological file used in this report was developed using high
resolution MM5 meteorological information and the Tahmoor Coal weather data.
The recording of hourly weather information is not undertaken at Pheasants Nest by the BOM. The
nearest BOM weather station recording good quality hourly weather data is at Camden Airport, and is
located approximately 26 km north of the proposed poultry farm. This report has not considered the
Camden Airport meteorological observations as representative to the assessment location, although
was included in the CALMET model to ensure a complete observational data set for 2011.
The MM5 wind field was used as an initial guess in CALMET. Final wind fields were generated by
applying observational meteorological data to the initial wind field and then adjusted to account for the
kinematic and thermal effects of terrain on wind.
5. POULTRY FARM SITE METEOROLOGY
5.1 Wind Direction
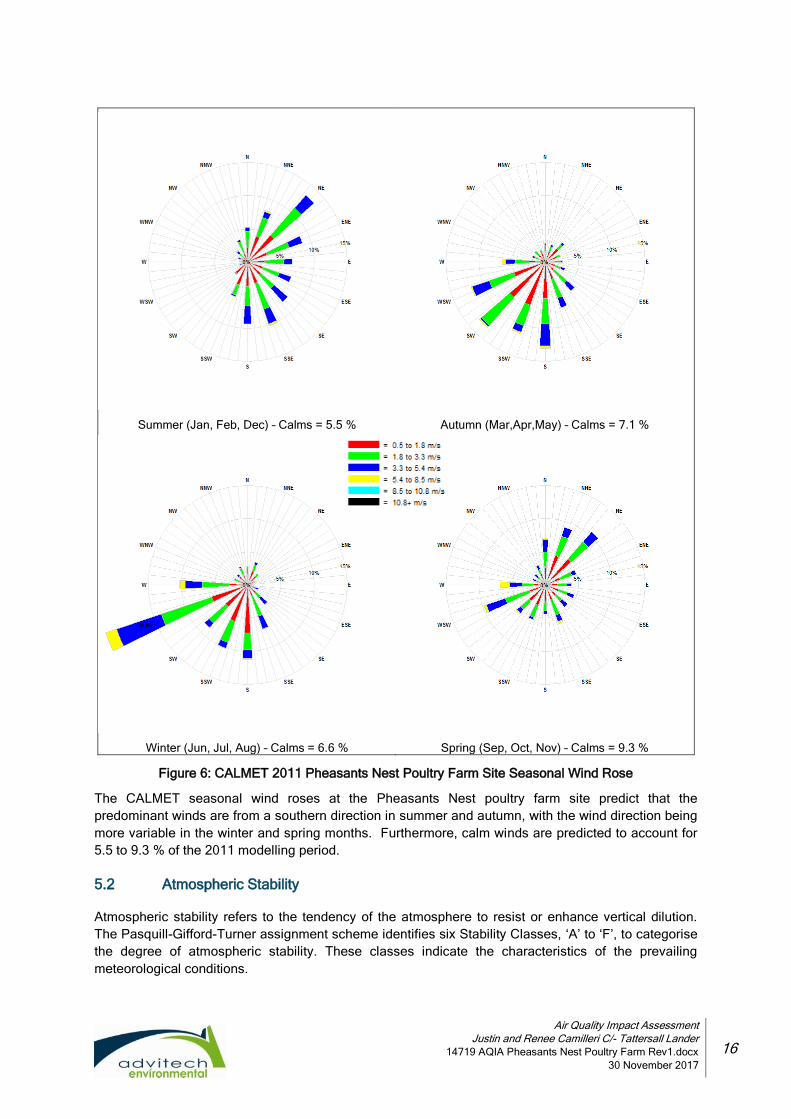
The CALMET model wind field predictions of seasonal wind speed, direction and frequency for the
year 2011 at the Pheasants Nest poultry farm site are presented in Figure 6.
Air Quality Impact Assessment
Justin and Renee Camilleri C/- Tattersall Lander
14719 AQIA Pheasants Nest Poultry Farm Rev1.docx
30 November 2017
16
Summer (Jan, Feb, Dec) – Calms = 5.5 % Autumn (Mar,Apr,May) – Calms = 7.1 %
Winter (Jun, Jul, Aug) – Calms = 6.6 % Spring (Sep, Oct, Nov) – Calms = 9.3 %
Figure 6: CALMET 2011 Pheasants Nest Poultry Farm Site Seasonal Wind Rose
The CALMET seasonal wind roses at the Pheasants Nest poultry farm site predict that the
predominant winds are from a southern direction in summer and autumn, with the wind direction being
more variable in the winter and spring months. Furthermore, calm winds are predicted to account for
5.5 to 9.3 % of the 2011 modelling period.
5.2 Atmospheric Stability
Atmospheric stability refers to the tendency of the atmosphere to resist or enhance vertical dilution.
The Pasquill-Gifford-Turner assignment scheme identifies six Stability Classes, ‘A’ to ‘F’, to categorise
the degree of atmospheric stability. These classes indicate the characteristics of the prevailing
meteorological conditions.
Air Quality Impact Assessment
Justin and Renee Camilleri C/- Tattersall Lander
14719 AQIA Pheasants Nest Poultry Farm Rev1.docx
30 November 2017
17
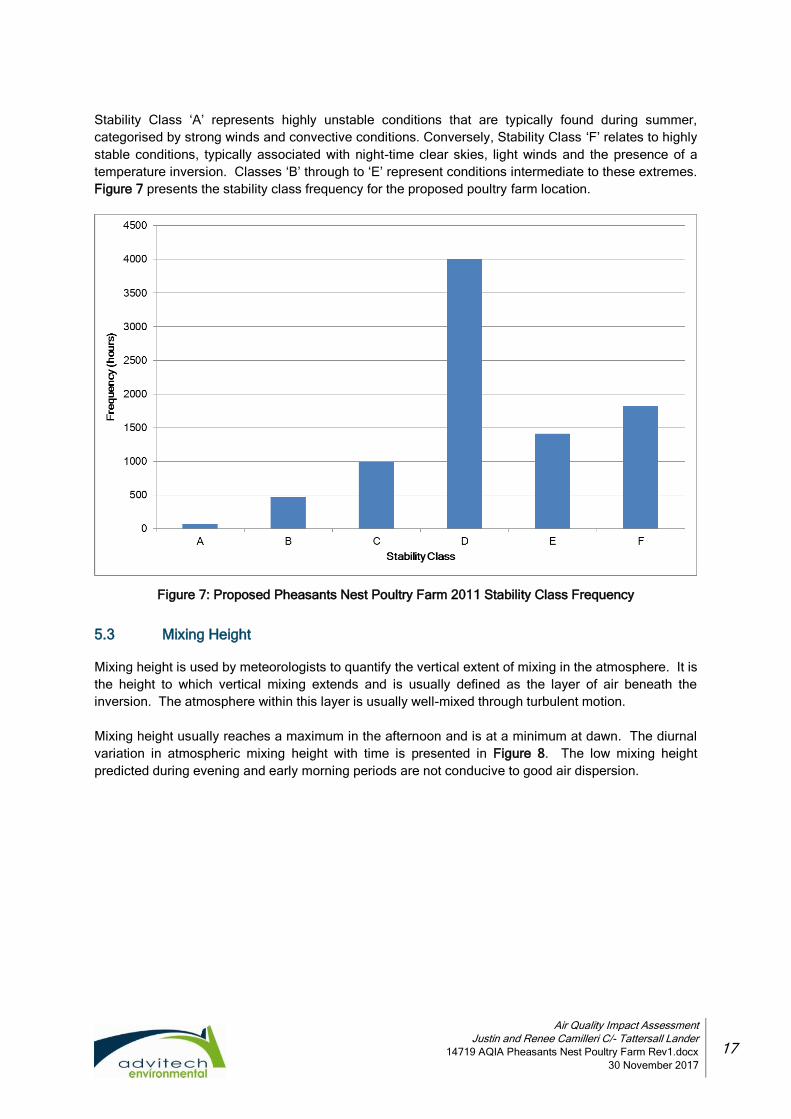
Stability Class ‘A’ represents highly unstable conditions that are typically found during summer,
categorised by strong winds and convective conditions. Conversely, Stability Class ‘F’ relates to highly
stable conditions, typically associated with night-time clear skies, light winds and the presence of a
temperature inversion. Classes ‘B’ through to ‘E’ represent conditions intermediate to these extremes.
Figure 7 presents the stability class frequency for the proposed poultry farm location.
Figure 7: Proposed Pheasants Nest Poultry Farm 2011 Stability Class Frequency
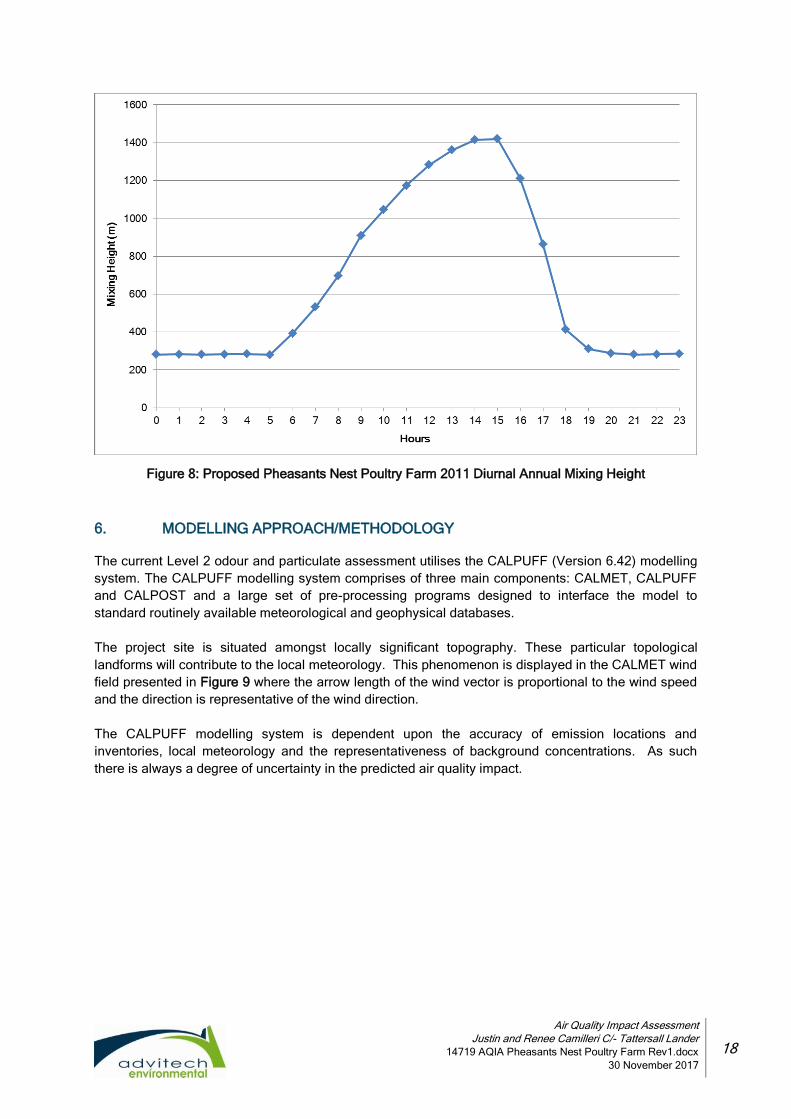
5.3 Mixing Height
Mixing height is used by meteorologists to quantify the vertical extent of mixing in the atmosphere. It is
the height to which vertical mixing extends and is usually defined as the layer of air beneath the
inversion. The atmosphere within this layer is usually well-mixed through turbulent motion.
Mixing height usually reaches a maximum in the afternoon and is at a minimum at dawn. The diurnal
variation in atmospheric mixing height with time is presented in Figure 8. The low mixing height
predicted during evening and early morning periods are not conducive to good air dispersion.
Air Quality Impact Assessment
Justin and Renee Camilleri C/- Tattersall Lander
14719 AQIA Pheasants Nest Poultry Farm Rev1.docx
30 November 2017
18
Figure 8: Proposed Pheasants Nest Poultry Farm 2011 Diurnal Annual Mixing Height
6. MODELLING APPROACH/METHODOLOGY
The current Level 2 odour and particulate assessment utilises the CALPUFF (Version 6.42) modelling
system. The CALPUFF modelling system comprises of three main components: CALMET, CALPUFF
and CALPOST and a large set of pre-processing programs designed to interface the model to
standard routinely available meteorological and geophysical databases.
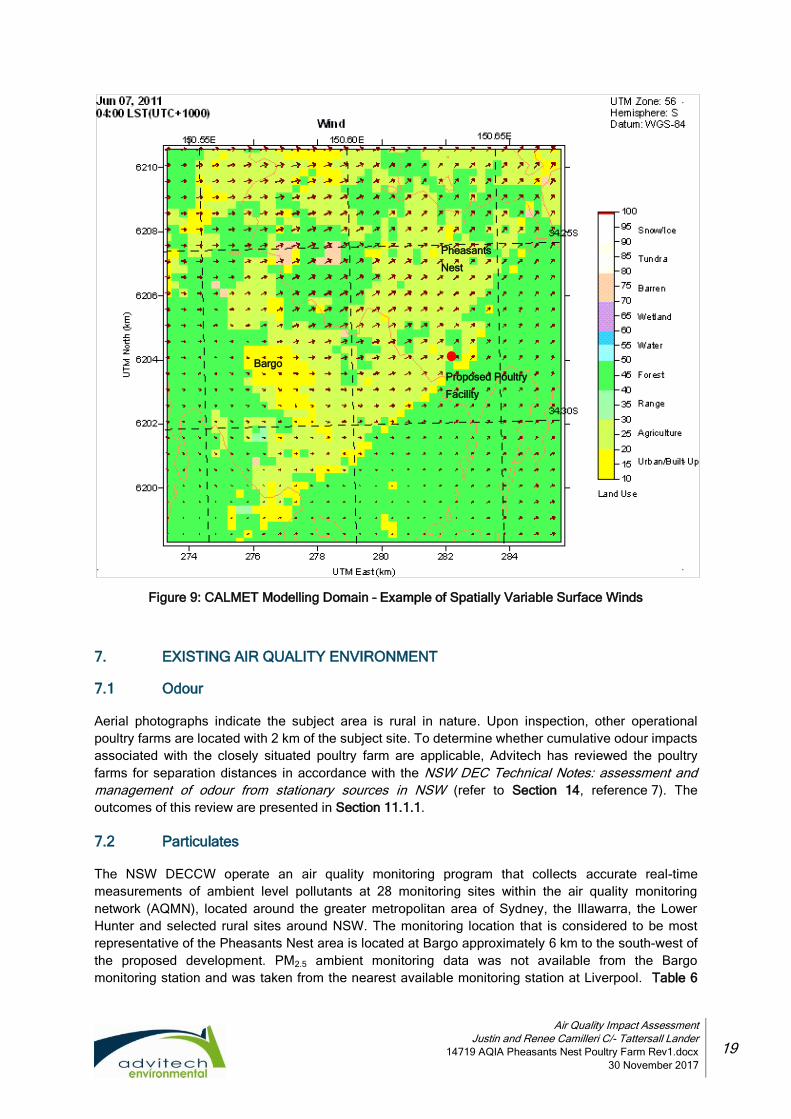
The project site is situated amongst locally significant topography. These particular topological
landforms will contribute to the local meteorology. This phenomenon is displayed in the CALMET wind
field presented in Figure 9 where the arrow length of the wind vector is proportional to the wind speed
and the direction is representative of the wind direction.
The CALPUFF modelling system is dependent upon the accuracy of emission locations and
inventories, local meteorology and the representativeness of background concentrations. As such
there is always a degree of uncertainty in the predicted air quality impact.
Air Quality Impact Assessment
Justin and Renee Camilleri C/- Tattersall Lander
14719 AQIA Pheasants Nest Poultry Farm Rev1.docx
30 November 2017
19
Figure 9: CALMET Modelling Domain – Example of Spatially Variable Surface Winds
7. EXISTING AIR QUALITY ENVIRONMENT
7.1 Odour
Aerial photographs indicate the subject area is rural in nature. Upon inspection, other operational
poultry farms are located with 2 km of the subject site. To determine whether cumulative odour impacts
associated with the closely situated poultry farm are applicable, Advitech has reviewed the poultry
farms for separation distances in accordance with the NSW DEC Technical Notes: assessment and
management of odour from stationary sources in NSW (refer to Section 14, reference 7). The
outcomes of this review are presented in Section 11.1.1.
7.2 Particulates
The NSW DECCW operate an air quality monitoring program that collects accurate real-time
measurements of ambient level pollutants at 28 monitoring sites within the air quality monitoring
network (AQMN), located around the greater metropolitan area of Sydney, the Illawarra, the Lower
Hunter and selected rural sites around NSW. The monitoring location that is considered to be most
representative of the Pheasants Nest area is located at Bargo approximately 6 km to the south-west of
the proposed development. PM2.5 ambient monitoring data was not available from the Bargo
monitoring station and was taken from the nearest available monitoring station at Liverpool. Table 6
Proposed Poultry
Facility
Bargo
Pheasants
Nest
Air Quality Impact Assessment
Justin and Renee Camilleri C/- Tattersall Lander
14719 AQIA Pheasants Nest Poultry Farm Rev1.docx
30 November 2017
20
displays the background particulate concentrations at the Bargo and Liverpool monitoring station for
the 2011 monitoring year (refer to Section 14, reference 14).
Table 6: OEH Background Air Quality
Pollutant Background Concentration
a
Units Averaging Time
TSP 25.8b µg/m
3 Annual
Dust Deposition na g/m2/month Annual
PM10
Variable (refer to Figure 10)
µg/m3 24 Hours
12.9 µg/m3 Annual
PM2.5
Variablec
(refer to Figure 10)
µg/m3 24 Hours
5.9 µg/m3 Annual
a Reported value is the average 24 hour result
b Assumed from PM10 background (TSP = 2 x PM10)
na - Not available
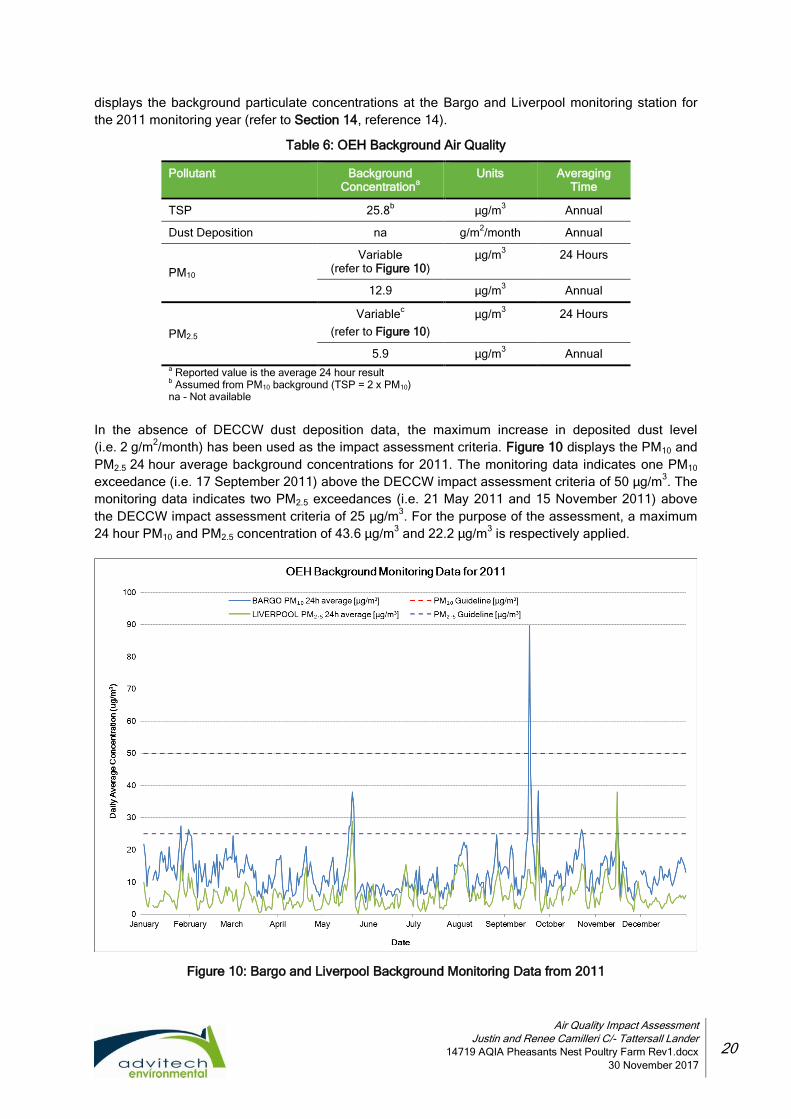
In the absence of DECCW dust deposition data, the maximum increase in deposited dust level
(i.e. 2 g/m2/month) has been used as the impact assessment criteria. Figure 10 displays the PM10 and
PM2.5 24 hour average background concentrations for 2011. The monitoring data indicates one PM10
exceedance (i.e. 17 September 2011) above the DECCW impact assessment criteria of 50 µg/m3. The
monitoring data indicates two PM2.5 exceedances (i.e. 21 May 2011 and 15 November 2011) above
the DECCW impact assessment criteria of 25 µg/m3. For the purpose of the assessment, a maximum
24 hour PM10 and PM2.5 concentration of 43.6 µg/m3 and 22.2 µg/m
3 is respectively applied.
Figure 10: Bargo and Liverpool Background Monitoring Data from 2011
Air Quality Impact Assessment
Justin and Renee Camilleri C/- Tattersall Lander
14719 AQIA Pheasants Nest Poultry Farm Rev1.docx
30 November 2017
21
8. AIR EMISSION APPROACH/METHODOLOGY
There has been considerable research into describing and characterising odour emissions from poultry
facilities (refer to Section 14, references 1, 9 and 17). It is generally accepted that the poultry shed
OER is a function of:
The number of birds;
The bird age/mass;
The shed ventilation rate; and
The ambient temperature.
The shed OER is dependent upon the ventilation rate at any particular time, and can vary substantially
should growing conditions within the shed change.
This report has assumed a three-phase production cycle for the project site. The first phase is the
brooding phase, which begins from day 1 to 22. During this phase the ventilation system is operated
under minimum ventilation. The second phase is between day 23 and 50, where the ventilation
system is operated under tunnel ventilation mode. During this growing cycle gradual flock thinning is
undertaken to maintain optimum flock health, as well as to account for partial flock harvesting. After
day 50, the sheds are cleaned and sterilized and remain ready for chick restocking. This last phase
takes 17 days.
This report assessed one year of farm operation for both properties that includes approximately
5.5 growing batches per shed. All sheds (i.e. seven sheds) are assumed to operate in a synchronous
fashion i.e. the batches in all sheds started and finished at the same time, and so peak odour and
particulate emission rates from the farm are considered in the modelling. This potentially represents a
worst-case operating scenario from an air quality (i.e. odour and particulates) perspective. This is
consistent with the modern poultry industry policy of poultry facilities operating on an “all in, all out”
basis.
8.1 Ventilation
Ventilation requirements for all types of poultry houses are dependent upon ambient temperatures, the
age and bodyweight of the birds and the number of birds housed. There are two dominant modes of
shed ventilation offered during the bird growing cycle, ‘minimum’ and ‘tunnel’.
Minimum ventilation is achieved by utilising chimney fans for the proposed poultry farm, located along
the roof of the shed. This report has assumed eight horizontal discharge chimney fans equally spaced
along the length of the shed roof. Minimum ventilation is the dominant ventilation type applied during
the initial 22 days of the bird growing cycle. During this period, birds require warmer conditions for
optimal growth. As the growing phase continues throughout the 22 day period the rate of minimum
ventilation is increased to account for increases in bird mass. The odour emissions from each
chimney fan were modelled with a release height of 4.6 m and a constant efflux velocity of 8 m/s.
After day 22 of the growing cycle, the ventilation mode transitions to ‘tunnel ventilation’. Tunnel
ventilation is achieved with the mounting of large axial flow fans at the end of the sheds, resulting in a
more controlled and consistent flow of air through the shed. During this period, odour emissions from
each fan were modelled considering a vertical release at a height of 10 m and a constant efflux
velocity of 8 m/s. This report has assumed that air would be extracted by 15 exhaust fans for the
proposed sheds, providing a maximum ventilation rate of approximately 125 m3/s for each new shed.
Air Quality Impact Assessment
Justin and Renee Camilleri C/- Tattersall Lander
14719 AQIA Pheasants Nest Poultry Farm Rev1.docx
30 November 2017
22
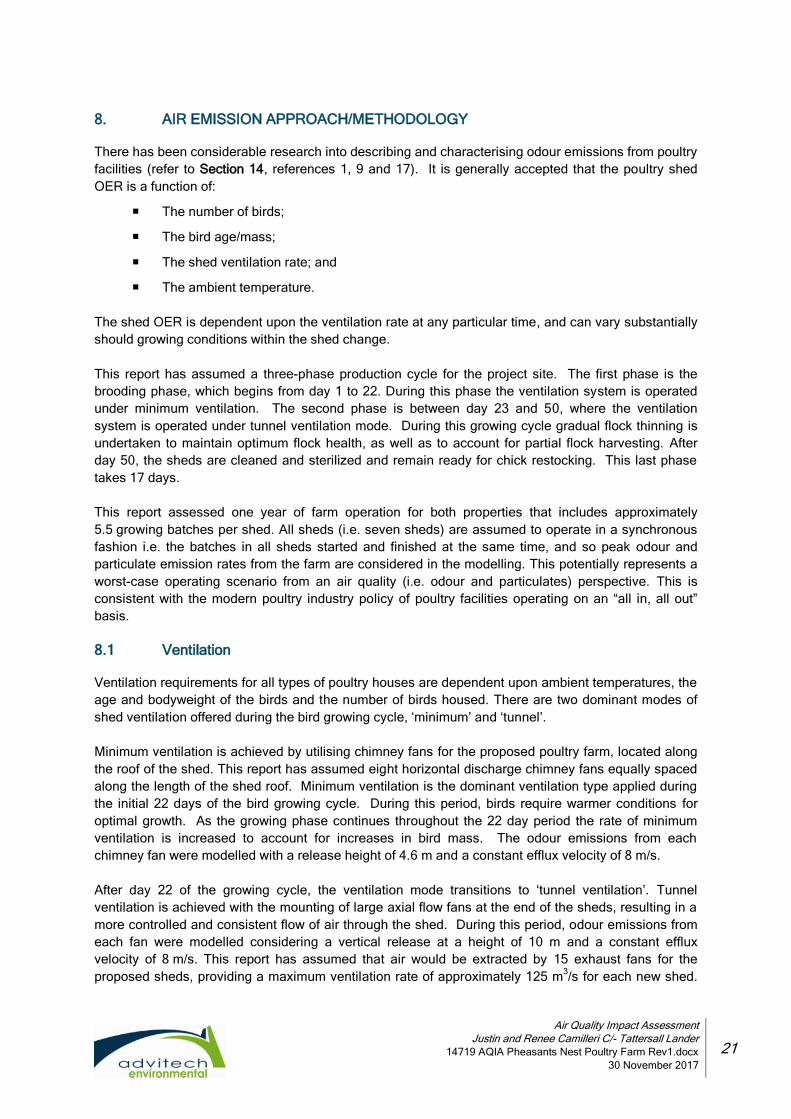
To compensate for reduced tunnel ventilation flowrates during cooler periods, this report assumes that
the 8 m/s efflux velocity is maintained by numbers of fans switched off while the remaining operational
fans operate at full capacity. 10 m stacks are to be constructed to achieve a vertical release at the
poultry sheds.
It is also recognised that guidelines regarding the ventilation rate can vary considerably between
environments/climates, the bird species farmed and specific poultry grower ventilation program
settings (refer to Section 14, reference 3 and 17). This is significant because the shed ventilation rate
can greatly influence the predicted odour GLC’s during cool overnight conditions when the atmosphere
is generally too stable to affect good odour dispersion. It is generally accepted that high OERs that are
modelled during cool overnight conditions will significantly impact on the peak percentile GLCs.
The ventilation rate profile for the first growing cycle in the modelled year is presented in Figure 11.
Figure 11: Ventilation Rate Profile – Example for One Proposed Shed
8.2 Odour Emissions
The OER for each ventilated shed (i.e. minimum or tunnel ventilated shed) at any given stage of the
growth cycle was calculated according to the following equation (refer to Section 14, Reference 9):
OER = 0.025 × K × A × D × V0.5
where:
OER is the odour emission rate (OU.m³/s).
K = 2.2 (empirical factor unitless). A value of 2.2 represents new poultry facilities
confirming to best practice. This is considered conservative as the literature indicates that
the value of K may be one (1) for very well designed and managed sheds that operate with
Air Quality Impact Assessment
Justin and Renee Camilleri C/- Tattersall Lander
14719 AQIA Pheasants Nest Poultry Farm Rev1.docx
30 November 2017
23
minimal odour emissions, and a value of K may be five (5) for a very poorly managed shed
with high odour emissions.
A is the total shed floor area (m²).
D is the average shed bird density (kg/m²). Bird density (D) is related to the age of the birds
and the stocking density i.e. the number of birds placed per unit area.
V is the ventilation rate (m³/s).
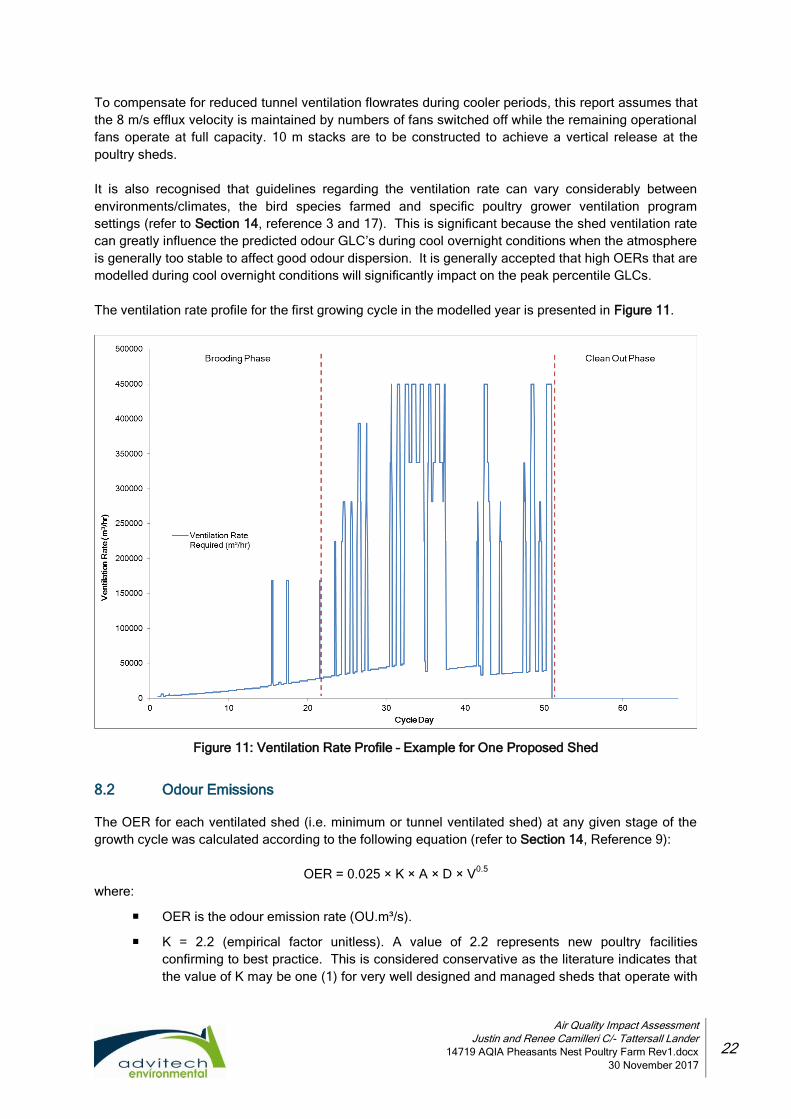
The odour emissions profile for the first growing cycle in the modelled year is presented in Figure 12.
The corresponding hourly time series odour emissions profile, commensurate of all shed odour
emission locations, was generated and included into the CALPUFF modelling dispersion program.
Figure 12: Odour Emission Rate Profile – Example for One Proposed Shed
The clean out phase of the growing cycle occurs after all the birds have been removed from shed. It is
understood that the removal of the litter during this phase can be an odorous process. The complete
removal of the litter has been assumed to occur during day 52 – 59 between 11 am – 2 pm. The odour
emissions have been modelled as a volume source from the open shed doors with an odour
concentration of 553 OU/m3 and 0.5 air changes per hour (refer to Section 14, reference 1).
On site composting will be undertaken in an enclosed shed within four internal composting bays. Only
one composting bay will be used for active composting. The remaining bays will be used for storing
used litter, storing mature compost and a vacant bay ready for the next cycle. The compost consists of
layers of dead poultry covered by used litter. The compost will not be turned throughout the process
and will remain in the composting bay for at least five weeks after the last layer is added to the
composting bay before being removed from the site. Once the active composting bay is at capacity, a
new composting layer will begin in a vacant composting bay.
Air Quality Impact Assessment
Justin and Renee Camilleri C/- Tattersall Lander
14719 AQIA Pheasants Nest Poultry Farm Rev1.docx
30 November 2017
24
A representative odour emission rate was taken from Heggies. (2006). Woodlawn Alternative Waste
Technology Facility – Air Quality Impact Assessment (refer to Section 14, reference 10). The specific
odour emission rate for fresh putrescible waste (5.65 OUV/m2/s) is considered appropriate for the
composting on site. The composting shed was modelled as a continuous volume source with an
assumed active composting area (i.e. actively worked composting bay) of 50 m2.
8.3 Particulate Emissions
The maximum particulate emission concentration (PEC) for a given total bird mass is calculated by the
following equation (refer to Section 14, Reference 16):
PEC = aM + b
where:
PEC is the maximum particulate emission concentration (mg/m3).
M is the total mass of birds (tonnes).
a = 0.270 for TSP or 0.115 for PM10, b = 0.385 for TSP or 0.917 for PM10.
To account for the dilution that occurs under higher flow rates, the particulate emission concentration
(PECv) is calculated using the equation below:
PECν = PEC × (cVd)
where:
PECν is the particulate emission concentration (mg/m3).
PEC is the maximum particulate emission concentration (mg/m3).
V is the shed ventilation rate (m3/s).
c = 3.3 for TSP and 4.11 for PM10.
d = -0.49 for TSP and -0.58 for PM10.
A particulate emission rate (PER) is calculated by multiplying the PECv by the ventilation rate (V).
Wheel generated PM10 and TSP emissions are calculated using default estimates from the NPI Manual
for Mining Version 3.1 (refer to Section 14, reference 8).
PM2.5 emission rates are estimated using available literature for poultry shed and wheel generated
emissions. The poultry shed PM2.5 emissions are estimated using a PM10 to PM2.5 ratio determined
from measured data in the report produced by the Australian Poultry CRC (refer to Section 14,
reference 1). Wheel generated PM2.5 emissions are calculated using estimates in AP42 Section 13.2.2
Unpaved Roads (refer to Section 14, reference 21).
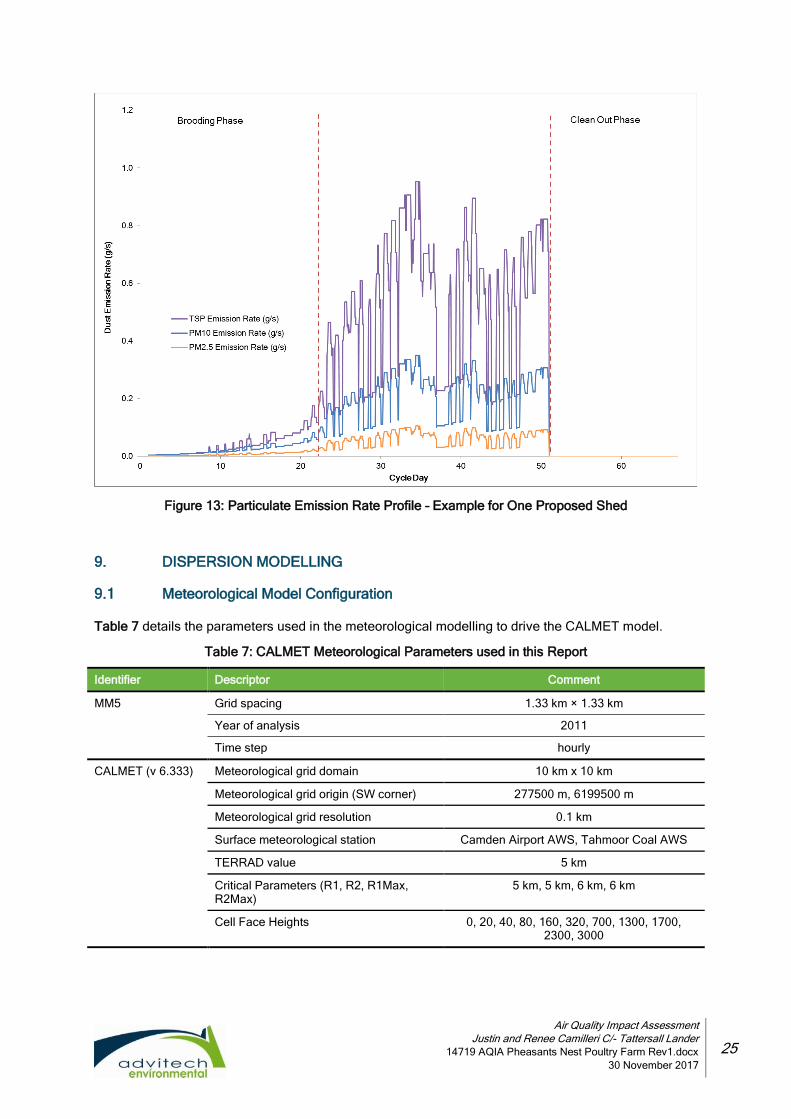
The particulate emissions profile for the first growing cycle in the modelled year is presented in
Figure 13. The corresponding hourly time series particulate emissions profile, commensurate of all
shed particulate emission locations, was generated and included into the CALPUFF modelling
dispersion program.
Air Quality Impact Assessment
Justin and Renee Camilleri C/- Tattersall Lander
14719 AQIA Pheasants Nest Poultry Farm Rev1.docx
30 November 2017
25
Figure 13: Particulate Emission Rate Profile – Example for One Proposed Shed
9. DISPERSION MODELLING
9.1 Meteorological Model Configuration
Table 7 details the parameters used in the meteorological modelling to drive the CALMET model.
Table 7: CALMET Meteorological Parameters used in this Report
Identifier Descriptor Comment
MM5 Grid spacing 1.33 km × 1.33 km
Year of analysis 2011
Time step hourly
CALMET (v 6.333) Meteorological grid domain 10 km x 10 km
Meteorological grid origin (SW corner) 277500 m, 6199500 m
Meteorological grid resolution 0.1 km
Surface meteorological station Camden Airport AWS, Tahmoor Coal AWS
TERRAD value 5 km
Critical Parameters (R1, R2, R1Max, R2Max)
5 km, 5 km, 6 km, 6 km
Cell Face Heights 0, 20, 40, 80, 160, 320, 700, 1300, 1700, 2300, 3000
Air Quality Impact Assessment
Justin and Renee Camilleri C/- Tattersall Lander
14719 AQIA Pheasants Nest Poultry Farm Rev1.docx
30 November 2017
26
9.2 Dispersion Modelling Configuration
CALPUFF is an advanced non-steady-state meteorological and air quality modelling system. The
model advects ‘puffs’ of material emitted from modelled sources, simulating the dispersion and
transformation processes along the way. The model has been adopted by the U.S. Environmental
Protection Agency (U.S. EPA) in its guideline on air quality models. CALPUFF uses the 3D wind fields
generated by CALMET with the primary output files from CALPUFF processed in CALPOST to
produce time based concentration or deposition fluxes evaluated at selected receiver locations.
Odour and particulate concentrations were simulated for a regular Cartesian receiver grid covering a
10 km by 10 km computational domain, set within the CALMET modelling domain and centred over the
project area, with a grid resolution of 0.1 km. High resolution MM5 meteorological data for the year
2011 has been used in conjunction with locality specific meteorological data.
Section 9.4 outlines the assumptions made for the odour assessment. Appendix I contains example
CALMET and CALPOST input files.
9.3 Modelling Scenarios
The assessment of particulate and odour emissions from the proposed poultry farm involved modelling
45,000 birds per shed.
Odour and particulate emissions from sheds were modelled as point (stack) sources for the entire
2011 growing cycle period. Poultry sheds have traditionally been modelled as volume sources. Over
time it has become known that this approach does not allow for appropriate temperature buoyancy to
be considered. It has therefore become more appropriate to model tunnel ventilated poultry sheds as
point (stack) sources (refer to Section 14, reference 15).
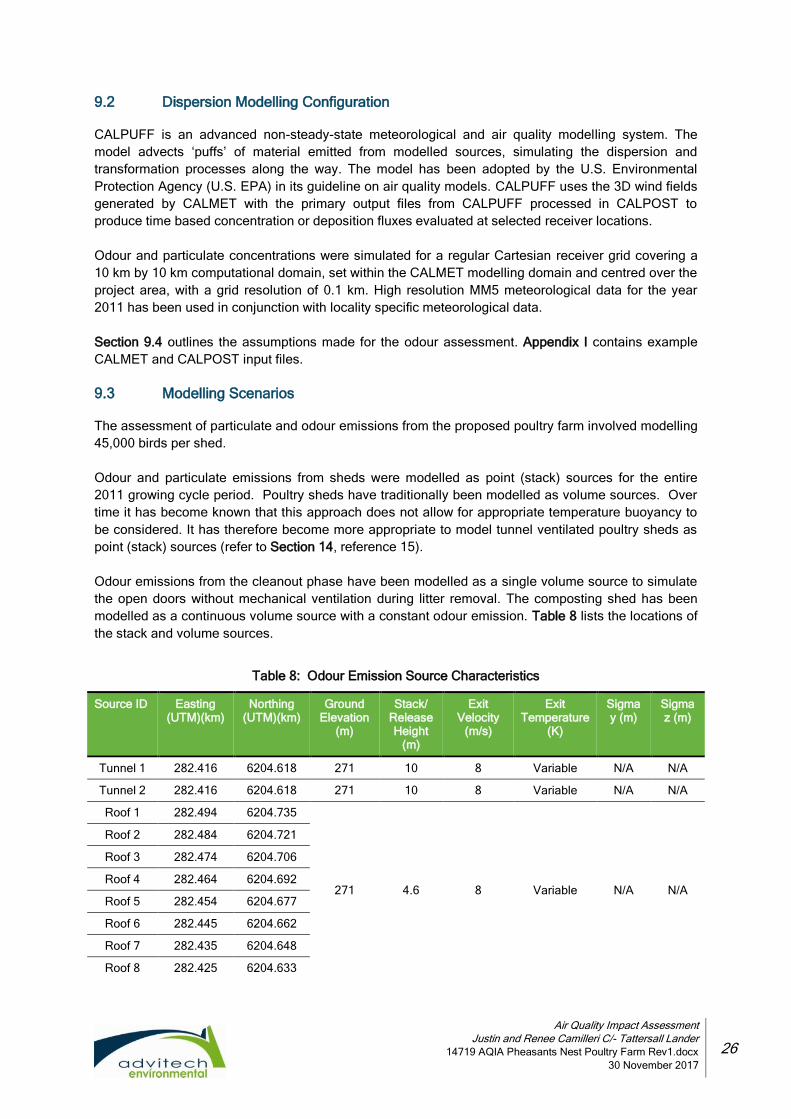
Odour emissions from the cleanout phase have been modelled as a single volume source to simulate
the open doors without mechanical ventilation during litter removal. The composting shed has been
modelled as a continuous volume source with a constant odour emission. Table 8 lists the locations of
the stack and volume sources.
Table 8: Odour Emission Source Characteristics
Source ID Easting (UTM)(km)
Northing (UTM)(km)
Ground Elevation
(m)
Stack/ Release Height
(m)
Exit Velocity
(m/s)
Exit Temperature
(K)
Sigma y (m)
Sigma z (m)
Tunnel 1 282.416 6204.618 271 10 8 Variable N/A N/A
Tunnel 2 282.416 6204.618 271 10 8 Variable N/A N/A
Roof 1 282.494 6204.735
271 4.6 8 Variable N/A N/A
Roof 2 282.484 6204.721
Roof 3 282.474 6204.706
Roof 4 282.464 6204.692
Roof 5 282.454 6204.677
Roof 6 282.445 6204.662
Roof 7 282.435 6204.648
Roof 8 282.425 6204.633
Air Quality Impact Assessment
Justin and Renee Camilleri C/- Tattersall Lander
14719 AQIA Pheasants Nest Poultry Farm Rev1.docx
30 November 2017
27
Source ID Easting (UTM)(km)
Northing (UTM)(km)
Ground Elevation
(m)
Stack/ Release Height
(m)
Exit Velocity
(m/s)
Exit Temperature
(K)
Sigma y (m)
Sigma z (m)
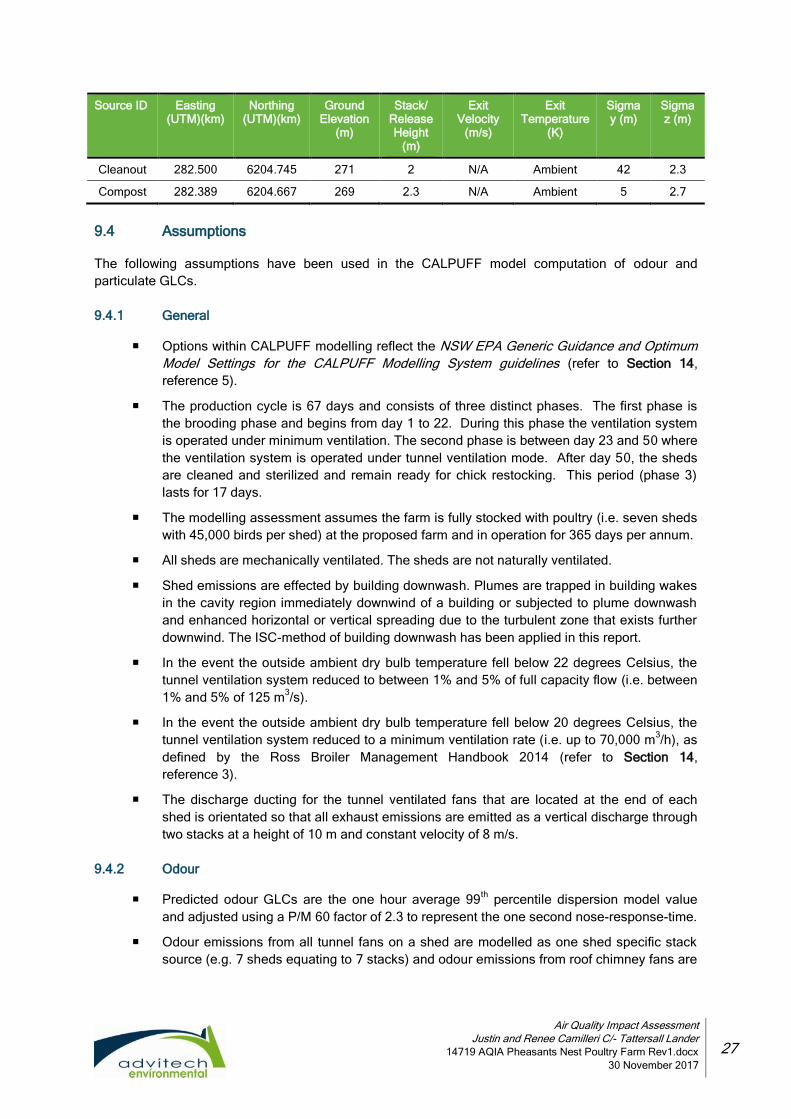
Cleanout 282.500 6204.745 271 2 N/A Ambient 42 2.3
Compost 282.389 6204.667 269 2.3 N/A Ambient 5 2.7
9.4 Assumptions
The following assumptions have been used in the CALPUFF model computation of odour and
particulate GLCs.
9.4.1 General
Options within CALPUFF modelling reflect the NSW EPA Generic Guidance and Optimum
Model Settings for the CALPUFF Modelling System guidelines (refer to Section 14,
reference 5).
The production cycle is 67 days and consists of three distinct phases. The first phase is
the brooding phase and begins from day 1 to 22. During this phase the ventilation system
is operated under minimum ventilation. The second phase is between day 23 and 50 where
the ventilation system is operated under tunnel ventilation mode. After day 50, the sheds
are cleaned and sterilized and remain ready for chick restocking. This period (phase 3)
lasts for 17 days.
The modelling assessment assumes the farm is fully stocked with poultry (i.e. seven sheds
with 45,000 birds per shed) at the proposed farm and in operation for 365 days per annum.
All sheds are mechanically ventilated. The sheds are not naturally ventilated.
Shed emissions are effected by building downwash. Plumes are trapped in building wakes
in the cavity region immediately downwind of a building or subjected to plume downwash
and enhanced horizontal or vertical spreading due to the turbulent zone that exists further
downwind. The ISC-method of building downwash has been applied in this report.
In the event the outside ambient dry bulb temperature fell below 22 degrees Celsius, the
tunnel ventilation system reduced to between 1% and 5% of full capacity flow (i.e. between
1% and 5% of 125 m3/s).
In the event the outside ambient dry bulb temperature fell below 20 degrees Celsius, the
tunnel ventilation system reduced to a minimum ventilation rate (i.e. up to 70,000 m3/h), as
defined by the Ross Broiler Management Handbook 2014 (refer to Section 14,
reference 3).
The discharge ducting for the tunnel ventilated fans that are located at the end of each
shed is orientated so that all exhaust emissions are emitted as a vertical discharge through
two stacks at a height of 10 m and constant velocity of 8 m/s.
9.4.2 Odour
Predicted odour GLCs are the one hour average 99th
percentile dispersion model value
and adjusted using a P/M 60 factor of 2.3 to represent the one second nose-response-time.
Odour emissions from all tunnel fans on a shed are modelled as one shed specific stack
source (e.g. 7 sheds equating to 7 stacks) and odour emissions from roof chimney fans are
Air Quality Impact Assessment
Justin and Renee Camilleri C/- Tattersall Lander
14719 AQIA Pheasants Nest Poultry Farm Rev1.docx
30 November 2017
28
modelled as individual stack sources (e.g. eight roof fans on one shed equating to eight
stacks per shed).
Minimum turbulence velocity, sigma v, is set to 0.2 for all stability classes as per NSW EPA
Generic Guidance and Optimum Model Settings for the CALPUFF Modelling System
guidelines (refer to Section 14, reference 5).
Odour emissions from the removal of shed litter are modelled as one specific volume
source (i.e. large shed doors at north-eastern end of the shed).
Shed litter remains in the shed after the final bird pickup, and is removed from the sheds
during the following week. A portion of used shed litter is taken to the composting shed and
the remained of used litter is taken off site.
Composting of used litter does not involve mechanical turning or any addition of water.
Odours from the composting shed have been modelled as a constant odour emission
represented as a volume source.
No odours are generated from loading, storage and distribution of feed material into sheds.
9.4.3 Particulates
Wheel generated emissions modelling is based on the expected truck movements during
the growing cycle. It is assumed six trucks per shed are required during each poultry
thinning and two trucks per week for feed delivery.
Wheel generated particulate emissions are estimated using the default emission rate from
the National Pollutant Inventory (NPI) Emission Estimation Technique (EET) manual for
mining version 3.1.
Predicted PM10 and PM2.5 GLCs are the 24 hour average 100th
percentile dispersion model
value and predicted TSP GLCs are the annual average 100th
percentile dispersion model
value.
Particulate air emissions from poultry shed ventilation use a geometric mass mean
diameter of 1.96 µm and a geometric standard deviation of 1.54 µm (refer to Section 14,
reference 1).
Particulate air emissions from unpaved haul roads use a geometric mass mean diameter of
8.30 µm and a geometric standard deviation of 1.18 µm (refer to Section 14, reference 21).
10. EMISSIONS SOURCES
Odour and particulate emission rates vary diurnally, seasonally, throughout the life of the flock and will
be different at different poultry facilities depending on management and infrastructure (refer to
Section 14, reference 1). The main source of odour from poultry facilities is typically the litter within the
chicken sheds. As the litter (made up of dry organic litter, manure, dust and feathers) begins to break
down odorous compounds are created which then volatilise. High litter moisture content, low oxygen
levels, small particle size, high temperatures and low pH levels encourage anaerobic bacterial activity
and the generation of odour. The rate at which the compounds then volatilise is dependent on the litter
pH and temperature, ventilation rates and climate (refer to Section 14, reference 12).
Air Quality Impact Assessment
Justin and Renee Camilleri C/- Tattersall Lander
14719 AQIA Pheasants Nest Poultry Farm Rev1.docx
30 November 2017
29
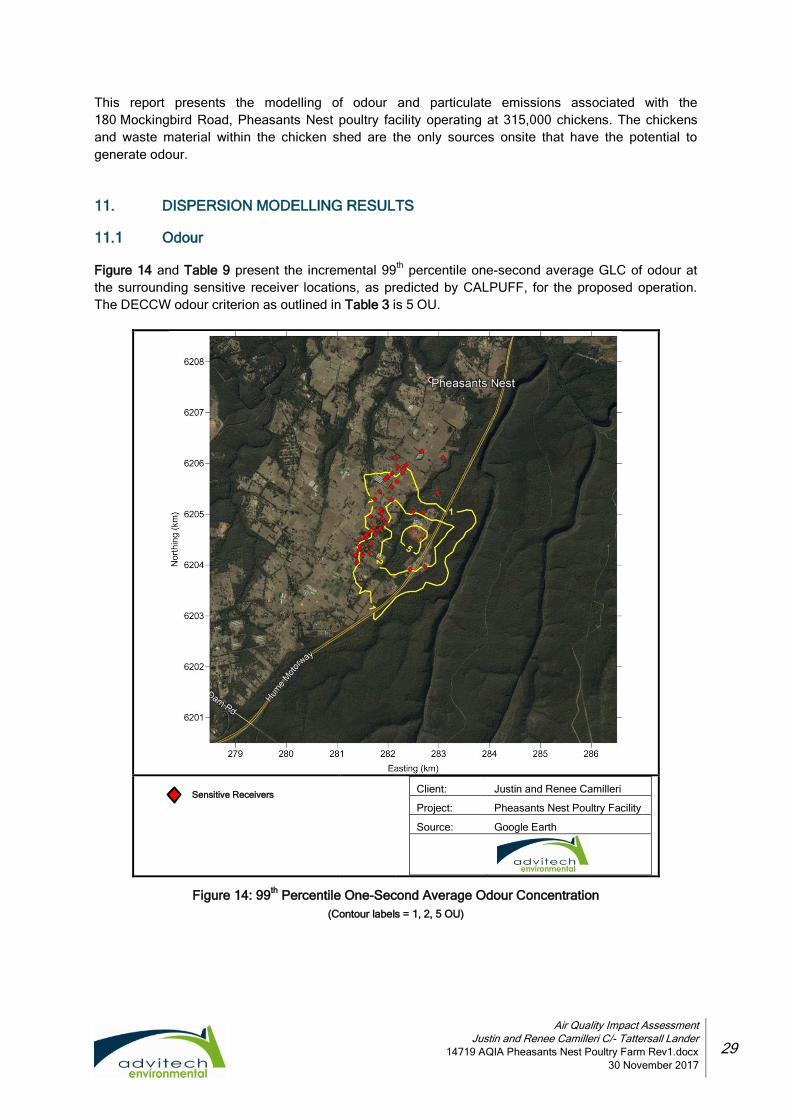
This report presents the modelling of odour and particulate emissions associated with the
180 Mockingbird Road, Pheasants Nest poultry facility operating at 315,000 chickens. The chickens
and waste material within the chicken shed are the only sources onsite that have the potential to
generate odour.
11. DISPERSION MODELLING RESULTS
11.1 Odour
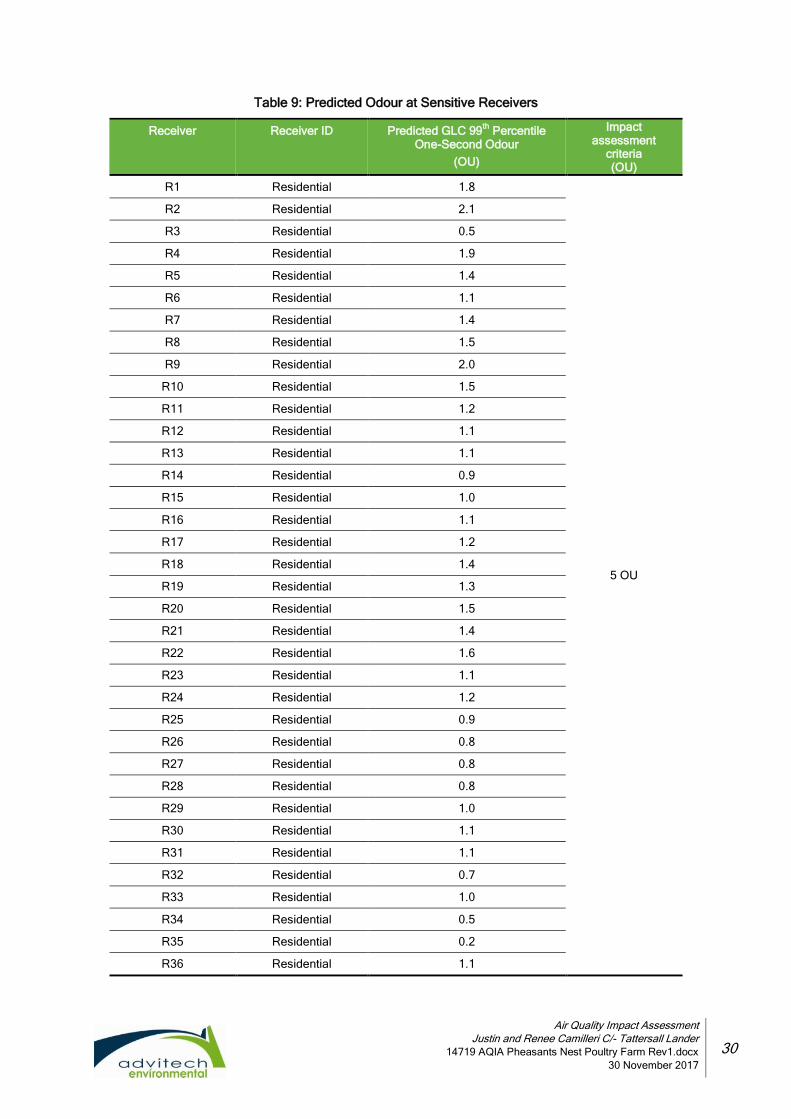
Figure 14 and Table 9 present the incremental 99th
percentile one-second average GLC of odour at
the surrounding sensitive receiver locations, as predicted by CALPUFF, for the proposed operation.
The DECCW odour criterion as outlined in Table 3 is 5 OU.
Client: Justin and Renee Camilleri
Project: Pheasants Nest Poultry Facility
Source: Google Earth
Figure 14: 99th
Percentile One-Second Average Odour Concentration
(Contour labels = 1, 2, 5 OU)
Sensitive Receivers
Air Quality Impact Assessment
Justin and Renee Camilleri C/- Tattersall Lander
14719 AQIA Pheasants Nest Poultry Farm Rev1.docx
30 November 2017
30
Table 9: Predicted Odour at Sensitive Receivers
Receiver Receiver ID Predicted GLC 99th
Percentile One-Second Odour
(OU)
Impact assessment
criteria (OU)
R1 Residential 1.8
5 OU
R2 Residential 2.1
R3 Residential 0.5
R4 Residential 1.9
R5 Residential 1.4
R6 Residential 1.1
R7 Residential 1.4
R8 Residential 1.5
R9 Residential 2.0
R10 Residential 1.5
R11 Residential 1.2
R12 Residential 1.1
R13 Residential 1.1
R14 Residential 0.9
R15 Residential 1.0
R16 Residential 1.1
R17 Residential 1.2
R18 Residential 1.4
R19 Residential 1.3
R20 Residential 1.5
R21 Residential 1.4
R22 Residential 1.6
R23 Residential 1.1
R24 Residential 1.2
R25 Residential 0.9
R26 Residential 0.8
R27 Residential 0.8
R28 Residential 0.8
R29 Residential 1.0
R30 Residential 1.1
R31 Residential 1.1
R32 Residential 0.7
R33 Residential 1.0
R34 Residential 0.5
R35 Residential 0.2
R36 Residential 1.1
Air Quality Impact Assessment
Justin and Renee Camilleri C/- Tattersall Lander
14719 AQIA Pheasants Nest Poultry Farm Rev1.docx
30 November 2017
31
Receiver Receiver ID Predicted GLC 99th
Percentile One-Second Odour
(OU)
Impact assessment
criteria (OU)
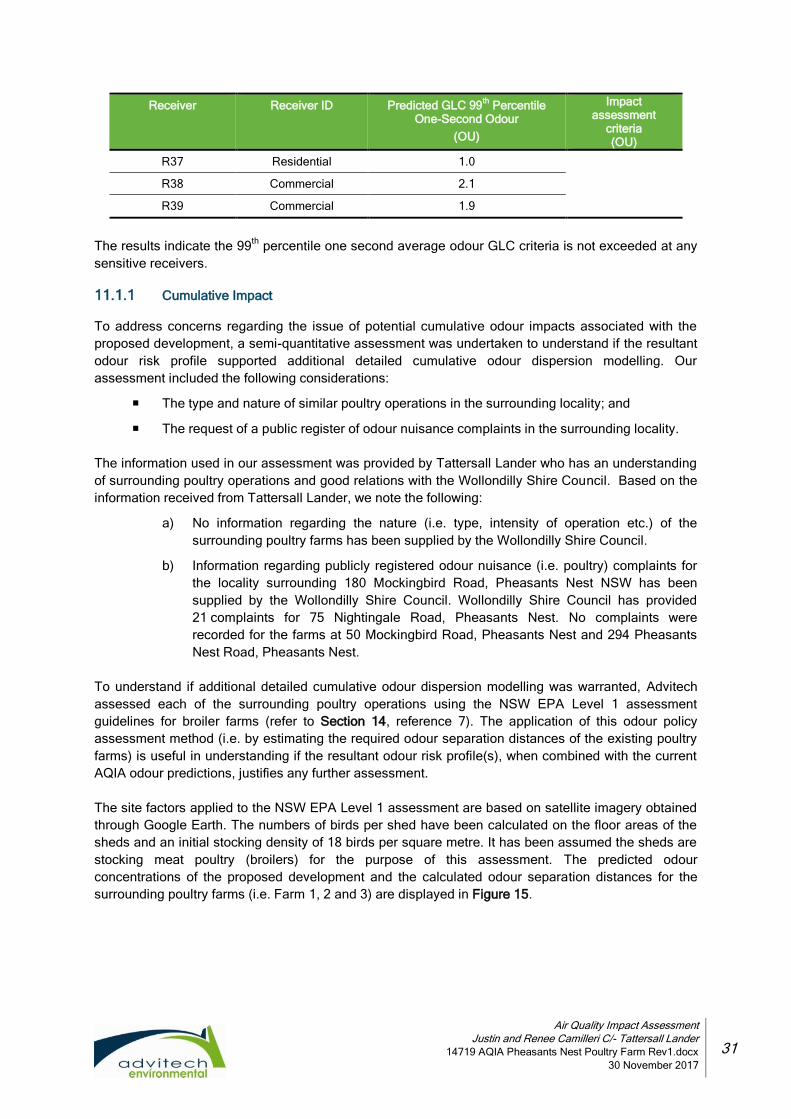
R37 Residential 1.0
R38 Commercial 2.1
R39 Commercial 1.9
The results indicate the 99th
percentile one second average odour GLC criteria is not exceeded at any
sensitive receivers.
11.1.1 Cumulative Impact
To address concerns regarding the issue of potential cumulative odour impacts associated with the
proposed development, a semi-quantitative assessment was undertaken to understand if the resultant
odour risk profile supported additional detailed cumulative odour dispersion modelling. Our
assessment included the following considerations:
The type and nature of similar poultry operations in the surrounding locality; and
The request of a public register of odour nuisance complaints in the surrounding locality.
The information used in our assessment was provided by Tattersall Lander who has an understanding
of surrounding poultry operations and good relations with the Wollondilly Shire Council. Based on the
information received from Tattersall Lander, we note the following:
a) No information regarding the nature (i.e. type, intensity of operation etc.) of the
surrounding poultry farms has been supplied by the Wollondilly Shire Council.
b) Information regarding publicly registered odour nuisance (i.e. poultry) complaints for
the locality surrounding 180 Mockingbird Road, Pheasants Nest NSW has been
supplied by the Wollondilly Shire Council. Wollondilly Shire Council has provided
21 complaints for 75 Nightingale Road, Pheasants Nest. No complaints were
recorded for the farms at 50 Mockingbird Road, Pheasants Nest and 294 Pheasants
Nest Road, Pheasants Nest.
To understand if additional detailed cumulative odour dispersion modelling was warranted, Advitech
assessed each of the surrounding poultry operations using the NSW EPA Level 1 assessment
guidelines for broiler farms (refer to Section 14, reference 7). The application of this odour policy
assessment method (i.e. by estimating the required odour separation distances of the existing poultry
farms) is useful in understanding if the resultant odour risk profile(s), when combined with the current
AQIA odour predictions, justifies any further assessment.
The site factors applied to the NSW EPA Level 1 assessment are based on satellite imagery obtained
through Google Earth. The numbers of birds per shed have been calculated on the floor areas of the
sheds and an initial stocking density of 18 birds per square metre. It has been assumed the sheds are
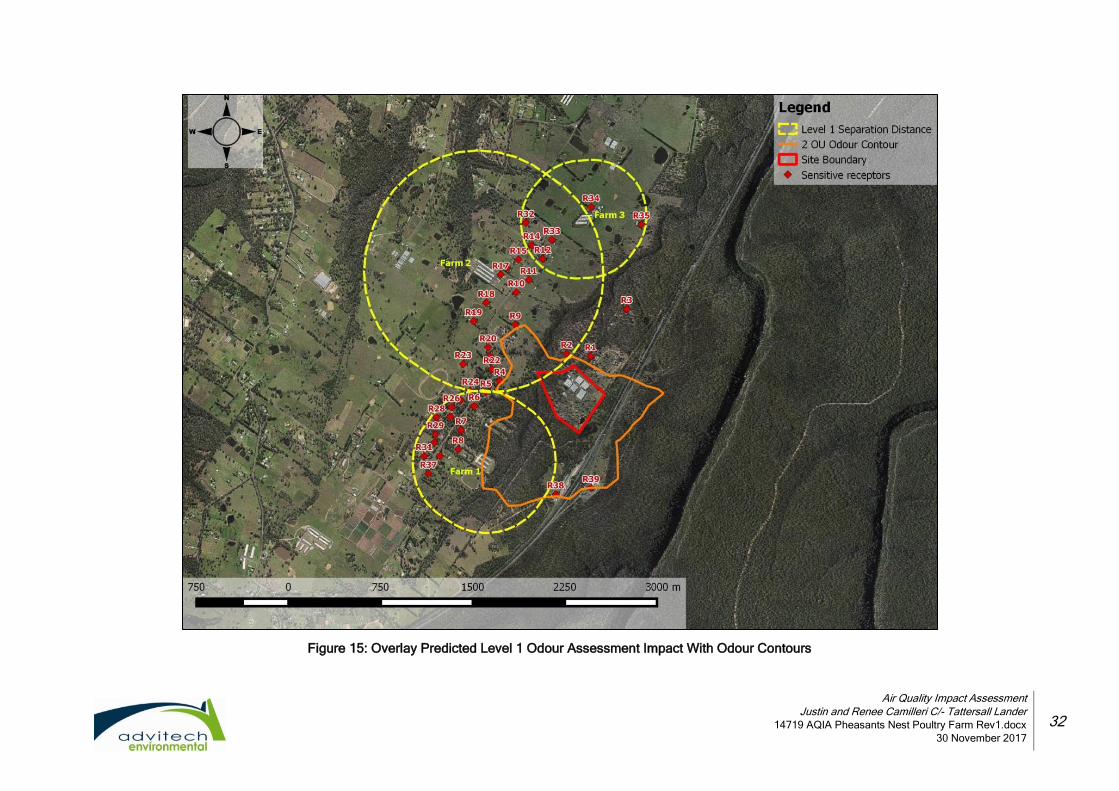
stocking meat poultry (broilers) for the purpose of this assessment. The predicted odour
concentrations of the proposed development and the calculated odour separation distances for the
surrounding poultry farms (i.e. Farm 1, 2 and 3) are displayed in Figure 15.
Air Quality Impact Assessment
Justin and Renee Camilleri C/- Tattersall Lander
14719 AQIA Pheasants Nest Poultry Farm Rev1.docx
30 November 2017
32
Figure 15: Overlay Predicted Level 1 Odour Assessment Impact With Odour Contours

Air Quality Impact Assessment
Justin and Renee Camilleri C/- Tattersall Lander
14719 AQIA Pheasants Nest Poultry Farm Rev1.docx
30 November 2017
33
As outlined in Section 3, the odour population dependency criterion is 5 OU. Figure 15 indicates that
the calculated Level 1 odour separation distances from surrounding poultry farms overlap the subject
site and the predicted 2 OU contour isopleth. It is also noted that the predicted incremental 2 OU
isopleth from the proposed poultry farm does not intersect any off-site receptor. Furthermore, it is not
expected that odour concentrations in excess of the 5 OU criterion will occur where the AQIA odour
contour (i.e. 2 OU) and separation distance boundaries overlap.
On the balance of information used in this assessment, it is our opinion that the contribution of odour
from surrounding poultry related operations will not materially impact on the outcomes and additional
odour modelling will not be required.
Air Quality Impact Assessment
Justin and Renee Camilleri C/- Tattersall Lander
14719 AQIA Pheasants Nest Poultry Farm Rev1.docx
30 November 2017
34
11.2 Particulates
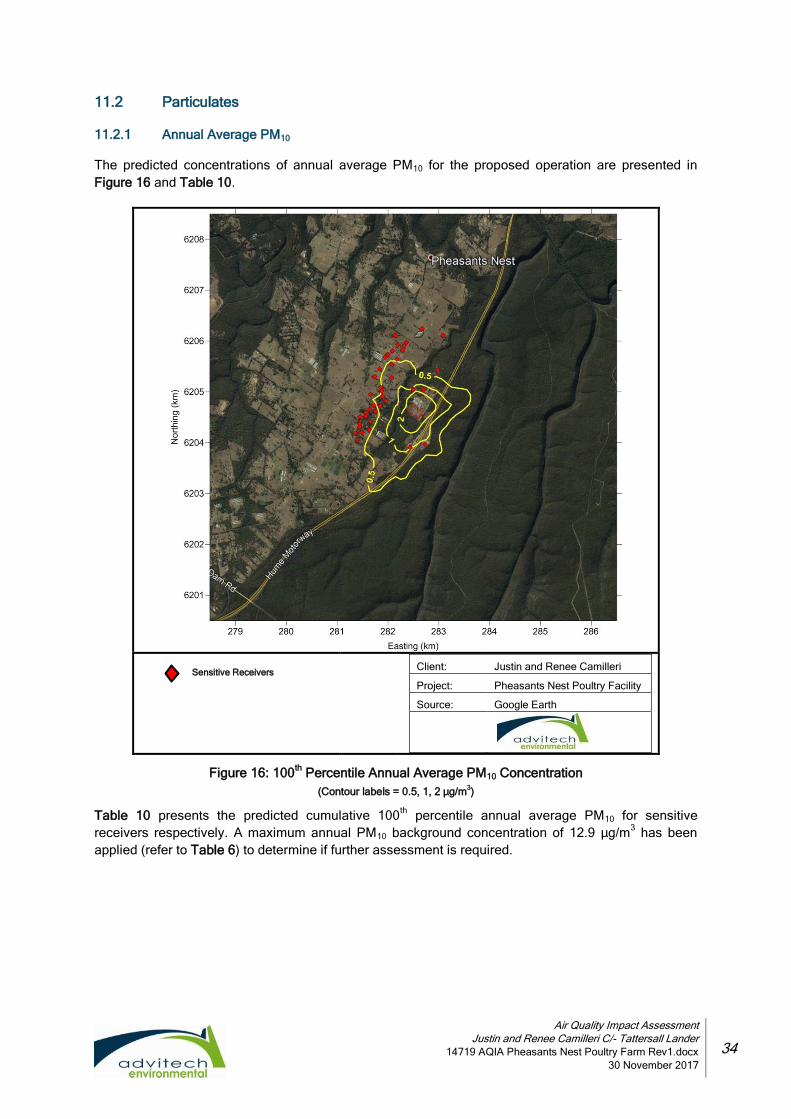
11.2.1 Annual Average PM10
The predicted concentrations of annual average PM10 for the proposed operation are presented in
Figure 16 and Table 10.
Client: Justin and Renee Camilleri
Project: Pheasants Nest Poultry Facility
Source: Google Earth
Figure 16: 100th
Percentile Annual Average PM10 Concentration
(Contour labels = 0.5, 1, 2 µg/m3)
Table 10 presents the predicted cumulative 100th
percentile annual average PM10 for sensitive
receivers respectively. A maximum annual PM10 background concentration of 12.9 µg/m3 has been
applied (refer to Table 6) to determine if further assessment is required.
Sensitive Receivers
Air Quality Impact Assessment
Justin and Renee Camilleri C/- Tattersall Lander
14719 AQIA Pheasants Nest Poultry Farm Rev1.docx
30 November 2017
35
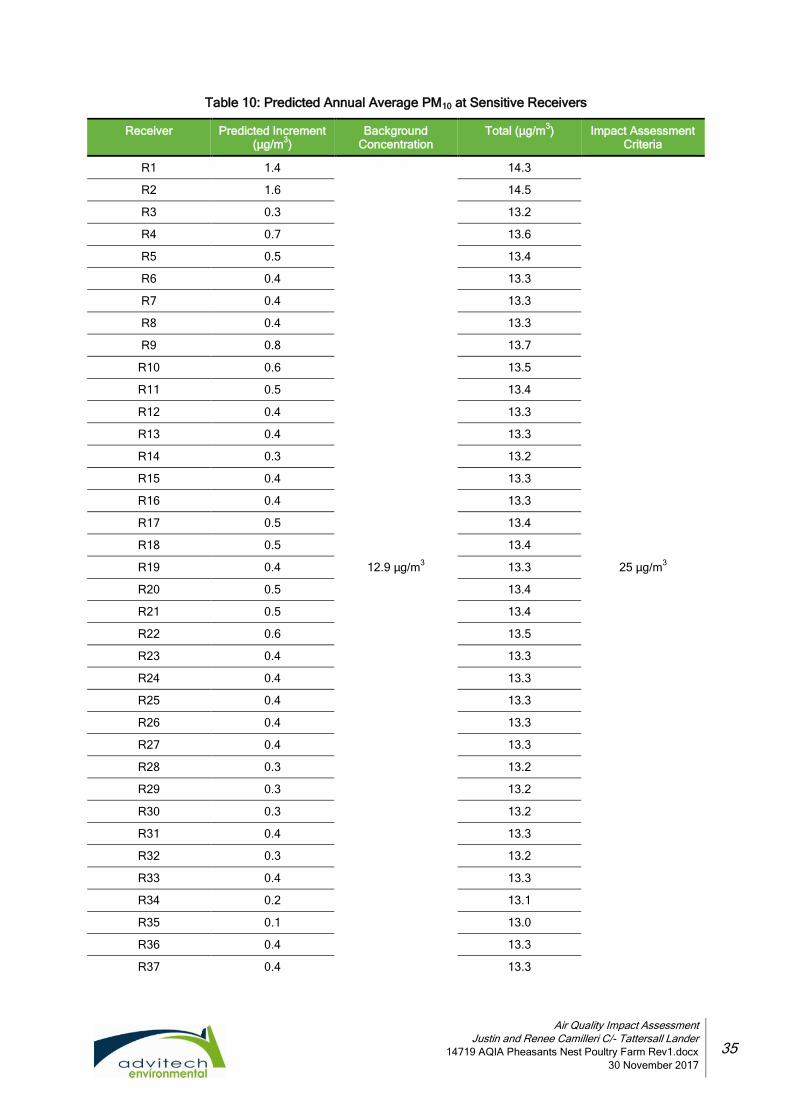
Table 10: Predicted Annual Average PM10 at Sensitive Receivers
Receiver Predicted Increment (µg/m
3)
Background Concentration
Total (µg/m3) Impact Assessment
Criteria
R1 1.4
12.9 µg/m3
14.3
25 µg/m3
R2 1.6 14.5
R3 0.3 13.2
R4 0.7 13.6
R5 0.5 13.4
R6 0.4 13.3
R7 0.4 13.3
R8 0.4 13.3
R9 0.8 13.7
R10 0.6 13.5
R11 0.5 13.4
R12 0.4 13.3
R13 0.4 13.3
R14 0.3 13.2
R15 0.4 13.3
R16 0.4 13.3
R17 0.5 13.4
R18 0.5 13.4
R19 0.4 13.3
R20 0.5 13.4
R21 0.5 13.4
R22 0.6 13.5
R23 0.4 13.3
R24 0.4 13.3
R25 0.4 13.3
R26 0.4 13.3
R27 0.4 13.3
R28 0.3 13.2
R29 0.3 13.2
R30 0.3 13.2
R31 0.4 13.3
R32 0.3 13.2
R33 0.4 13.3
R34 0.2 13.1
R35 0.1 13.0
R36 0.4 13.3
R37 0.4 13.3
Air Quality Impact Assessment
Justin and Renee Camilleri C/- Tattersall Lander
14719 AQIA Pheasants Nest Poultry Farm Rev1.docx
30 November 2017
36
Receiver Predicted Increment (µg/m
3)
Background Concentration
Total (µg/m3) Impact Assessment
Criteria
R38 1.1 14.0
R39 0.8 13.7
The annual PM10 impact assessment criteria are not exceeded at any sensitive receivers. According to
the NSW OEH guidance, no additional contemporaneous assessment of annual average PM10 is
required.
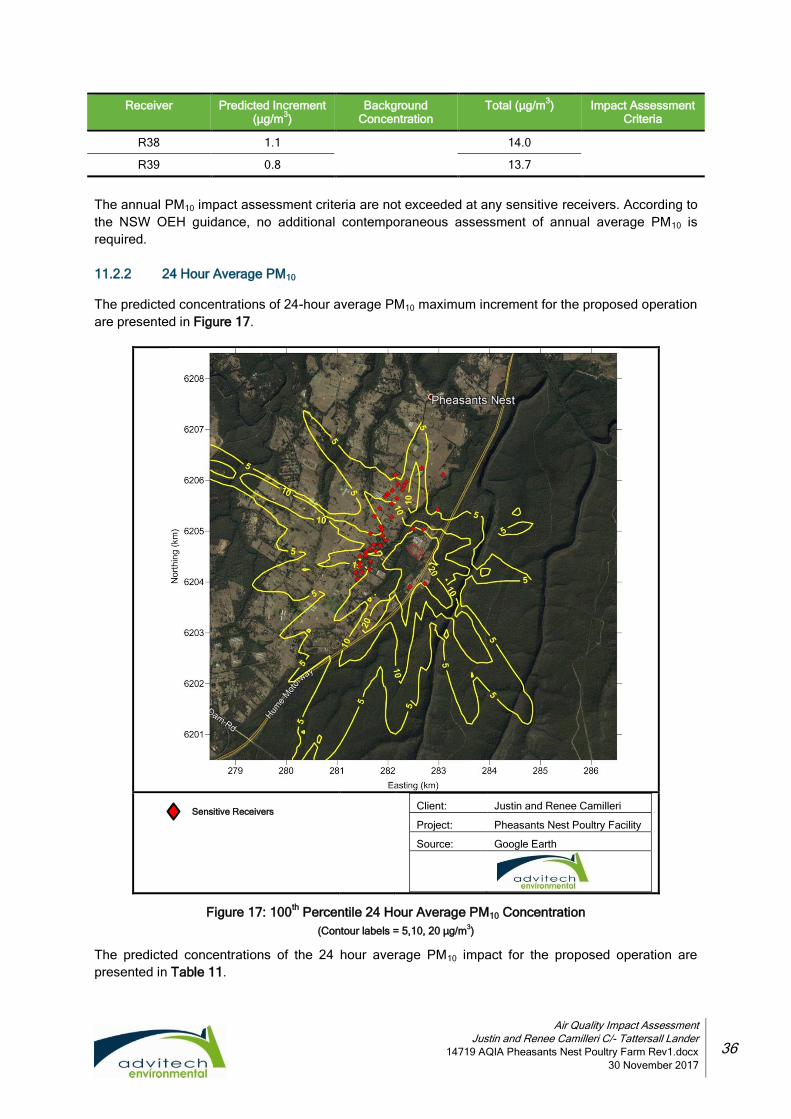
11.2.2 24 Hour Average PM10
The predicted concentrations of 24-hour average PM10 maximum increment for the proposed operation
are presented in Figure 17.
Client: Justin and Renee Camilleri
Project: Pheasants Nest Poultry Facility
Source: Google Earth
Figure 17: 100th
Percentile 24 Hour Average PM10 Concentration
(Contour labels = 5,10, 20 µg/m3)
The predicted concentrations of the 24 hour average PM10 impact for the proposed operation are
presented in Table 11.
Sensitive Receivers
Air Quality Impact Assessment
Justin and Renee Camilleri C/- Tattersall Lander
14719 AQIA Pheasants Nest Poultry Farm Rev1.docx
30 November 2017
37
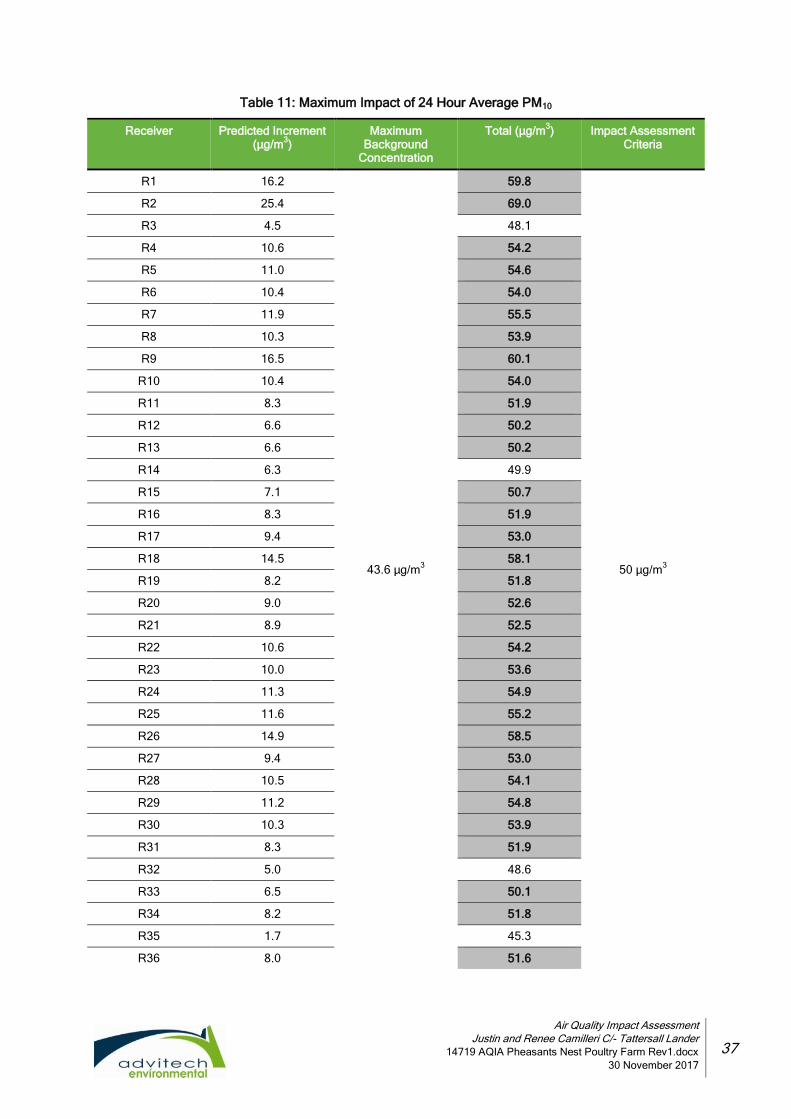
Table 11: Maximum Impact of 24 Hour Average PM10
Receiver Predicted Increment (µg/m
3)
Maximum Background
Concentration
Total (µg/m3) Impact Assessment
Criteria
R1 16.2
43.6 µg/m3
59.8
50 µg/m3
R2 25.4 69.0
R3 4.5 48.1
R4 10.6 54.2
R5 11.0 54.6
R6 10.4 54.0
R7 11.9 55.5
R8 10.3 53.9
R9 16.5 60.1
R10 10.4 54.0
R11 8.3 51.9
R12 6.6 50.2
R13 6.6 50.2
R14 6.3 49.9
R15 7.1 50.7
R16 8.3 51.9
R17 9.4 53.0
R18 14.5 58.1
R19 8.2 51.8
R20 9.0 52.6
R21 8.9 52.5
R22 10.6 54.2
R23 10.0 53.6
R24 11.3 54.9
R25 11.6 55.2
R26 14.9 58.5
R27 9.4 53.0
R28 10.5 54.1
R29 11.2 54.8
R30 10.3 53.9
R31 8.3 51.9
R32 5.0 48.6
R33 6.5 50.1
R34 8.2 51.8
R35 1.7 45.3
R36 8.0 51.6

Air Quality Impact Assessment
Justin and Renee Camilleri C/- Tattersall Lander
14719 AQIA Pheasants Nest Poultry Farm Rev1.docx
30 November 2017
38
Receiver Predicted Increment (µg/m
3)
Maximum Background
Concentration
Total (µg/m3) Impact Assessment
Criteria
R37 9.1 52.7
R38 27.2 70.8
R39 21.8 65.4
1 The background concentration of 89.7 µg/m
3 has been discounted as it is above the impact assessment criteria.
Bold and grey highlighted text indicates exceedances above the assessment criteria (i.e. 50 µg/m3).
The exceedances at nearby sensitive receivers of the 24 hour average PM10 concentration presented
in Table 11 indicates that a Level 2 contemporaneous impact and background assessment is required
to determine any additional exceedances as a result of the proposed operation. A summary of the
24 hour average PM10 contemporaneous impact and background assessment (Level 2 Assessment)
for identified sensitive receivers are presented in Table 12. The detailed results of the
contemporaneous impact and background assessment for each receiver are given in Appendix II.
Air Quality Impact Assessment
Justin and Renee Camilleri C/- Tattersall Lander
14719 AQIA Pheasants Nest Poultry Farm Rev1.docx
30 November 2017
39
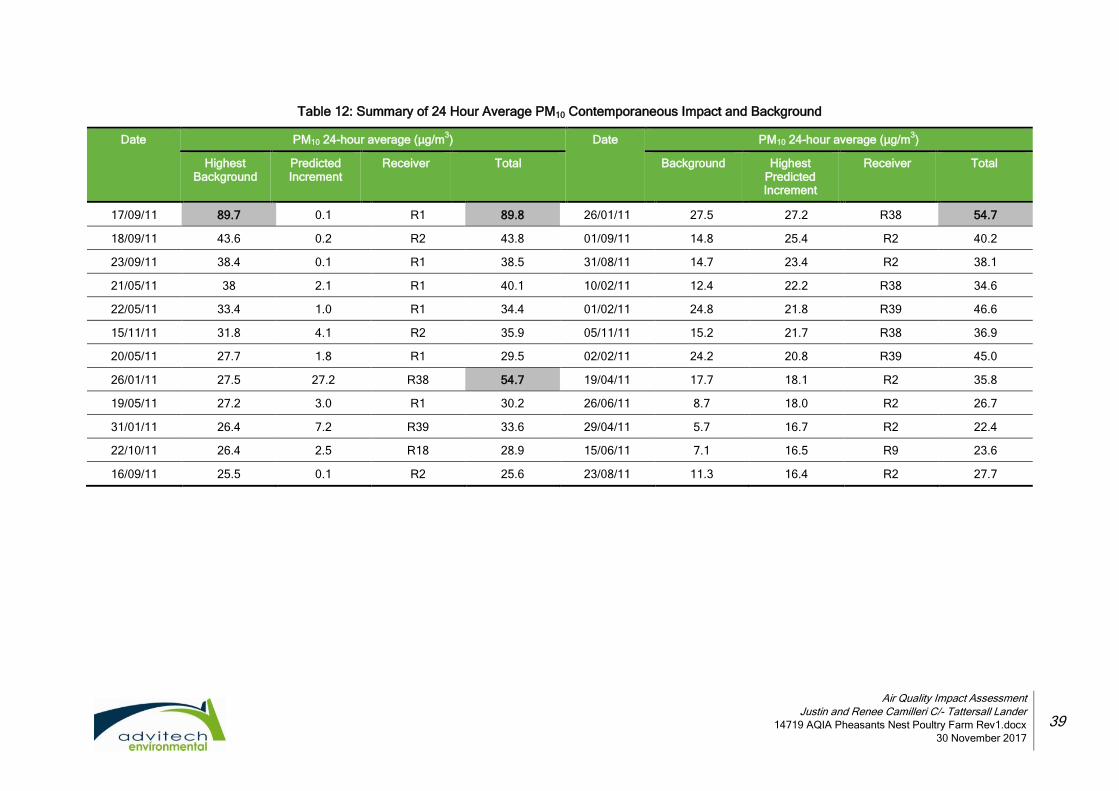
Table 12: Summary of 24 Hour Average PM10 Contemporaneous Impact and Background
Date
PM10 24-hour average (µg/m3) Date PM10 24-hour average (µg/m
3)
Highest Background
Predicted Increment
Receiver Total Background Highest Predicted Increment
Receiver Total
17/09/11 89.7 0.1 R1 89.8 26/01/11 27.5 27.2 R38 54.7
18/09/11 43.6 0.2 R2 43.8 01/09/11 14.8 25.4 R2 40.2
23/09/11 38.4 0.1 R1 38.5 31/08/11 14.7 23.4 R2 38.1
21/05/11 38 2.1 R1 40.1 10/02/11 12.4 22.2 R38 34.6
22/05/11 33.4 1.0 R1 34.4 01/02/11 24.8 21.8 R39 46.6
15/11/11 31.8 4.1 R2 35.9 05/11/11 15.2 21.7 R38 36.9
20/05/11 27.7 1.8 R1 29.5 02/02/11 24.2 20.8 R39 45.0
26/01/11 27.5 27.2 R38 54.7 19/04/11 17.7 18.1 R2 35.8
19/05/11 27.2 3.0 R1 30.2 26/06/11 8.7 18.0 R2 26.7
31/01/11 26.4 7.2 R39 33.6 29/04/11 5.7 16.7 R2 22.4
22/10/11 26.4 2.5 R18 28.9 15/06/11 7.1 16.5 R9 23.6
16/09/11 25.5 0.1 R2 25.6 23/08/11 11.3 16.4 R2 27.7
Air Quality Impact Assessment
Justin and Renee Camilleri C/- Tattersall Lander
14719 AQIA Pheasants Nest Poultry Farm Rev1.docx
30 November 2017
40
The detailed results of the contemporaneous impact and background assessment for each highlighted
receiver as shown in Table 12 are given in Appendix II. There is one additional exceedance
(i.e. 26 January 2011) of the 24 hour PM10 impact assessment criteria at nearby sensitive receivers.
According to the NSW OEH guidance, mitigation measures or emission controls that reduce emissions
are required.
The exceedances of the criteria are a result of the combination of the ambient dust concentration,
poultry shed emissions and wheel generated emissions. It is recommended that particulate emissions
be managed by the implementation of an air quality management plan which details best management
practices.
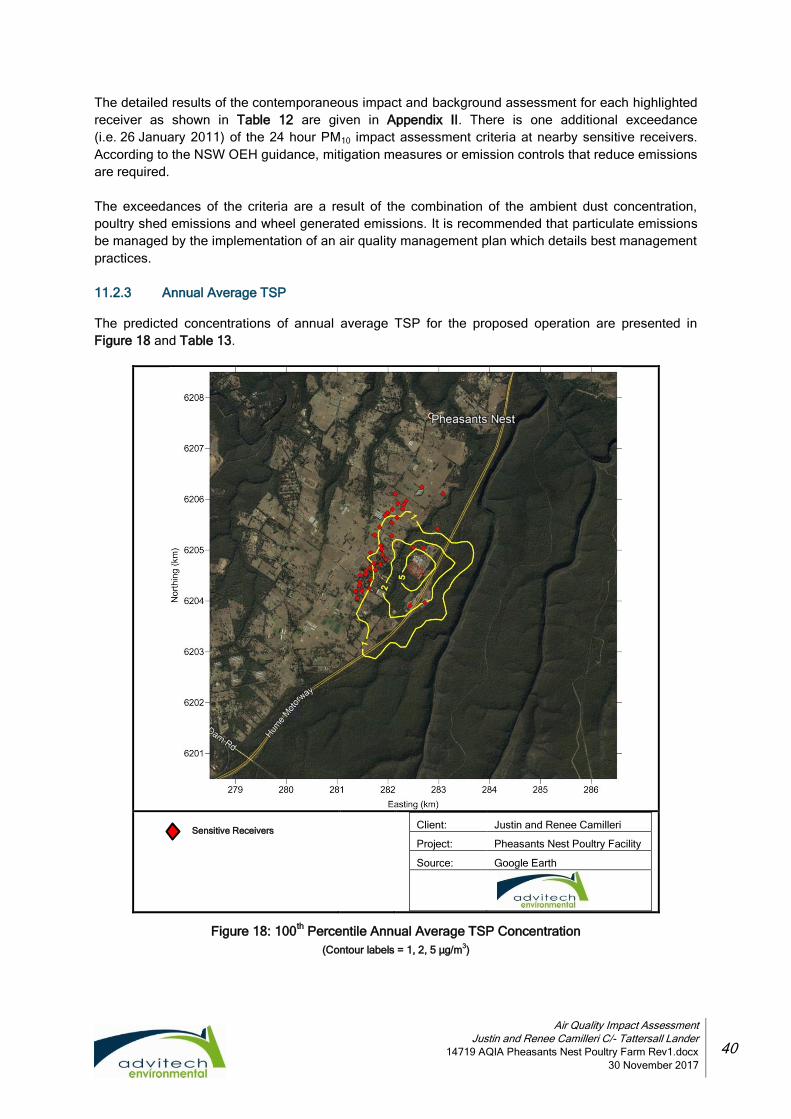
11.2.3 Annual Average TSP
The predicted concentrations of annual average TSP for the proposed operation are presented in
Figure 18 and Table 13.
Client: Justin and Renee Camilleri
Project: Pheasants Nest Poultry Facility
Source: Google Earth
Figure 18: 100th
Percentile Annual Average TSP Concentration
(Contour labels = 1, 2, 5 µg/m3)
Sensitive Receivers
Air Quality Impact Assessment
Justin and Renee Camilleri C/- Tattersall Lander
14719 AQIA Pheasants Nest Poultry Farm Rev1.docx
30 November 2017
41
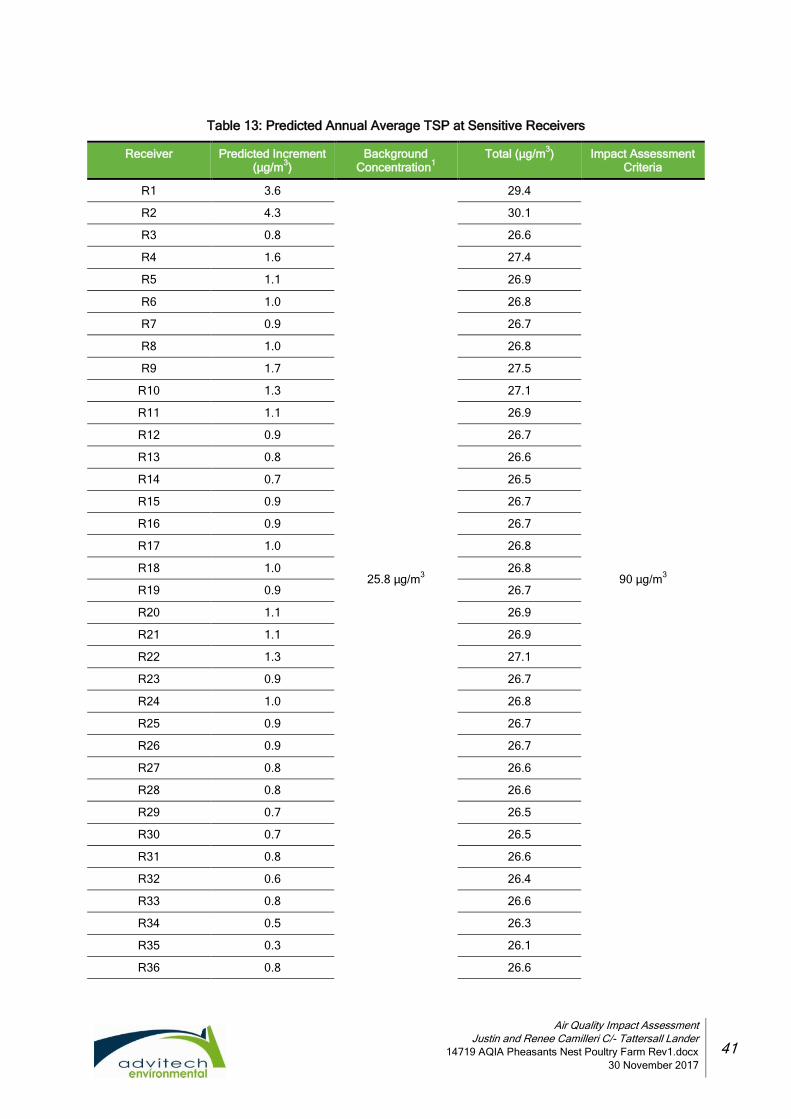
Table 13: Predicted Annual Average TSP at Sensitive Receivers
Receiver Predicted Increment (µg/m
3)
Background Concentration
1
Total (µg/m3) Impact Assessment
Criteria
R1 3.6
25.8 µg/m3
29.4
90 µg/m3
R2 4.3 30.1
R3 0.8 26.6
R4 1.6 27.4
R5 1.1 26.9
R6 1.0 26.8
R7 0.9 26.7
R8 1.0 26.8
R9 1.7 27.5
R10 1.3 27.1
R11 1.1 26.9
R12 0.9 26.7
R13 0.8 26.6
R14 0.7 26.5
R15 0.9 26.7
R16 0.9 26.7
R17 1.0 26.8
R18 1.0 26.8
R19 0.9 26.7
R20 1.1 26.9
R21 1.1 26.9
R22 1.3 27.1
R23 0.9 26.7
R24 1.0 26.8
R25 0.9 26.7
R26 0.9 26.7
R27 0.8 26.6
R28 0.8 26.6
R29 0.7 26.5
R30 0.7 26.5
R31 0.8 26.6
R32 0.6 26.4
R33 0.8 26.6
R34 0.5 26.3
R35 0.3 26.1
R36 0.8 26.6
Air Quality Impact Assessment
Justin and Renee Camilleri C/- Tattersall Lander
14719 AQIA Pheasants Nest Poultry Farm Rev1.docx
30 November 2017
42
Receiver Predicted Increment (µg/m
3)
Background Concentration
1
Total (µg/m3) Impact Assessment
Criteria
R37 0.8 26.6
R38 2.6 28.4
R39 1.9 27.7
1Considered to be twice the annual average PM10 value (refer to Table 5)
The modelling results for the proposed operation indicate that the predicted GLCs for annual average
TSP at all receivers surrounding the facility will not exceed the impact assessment criteria of 90 µg/m3.
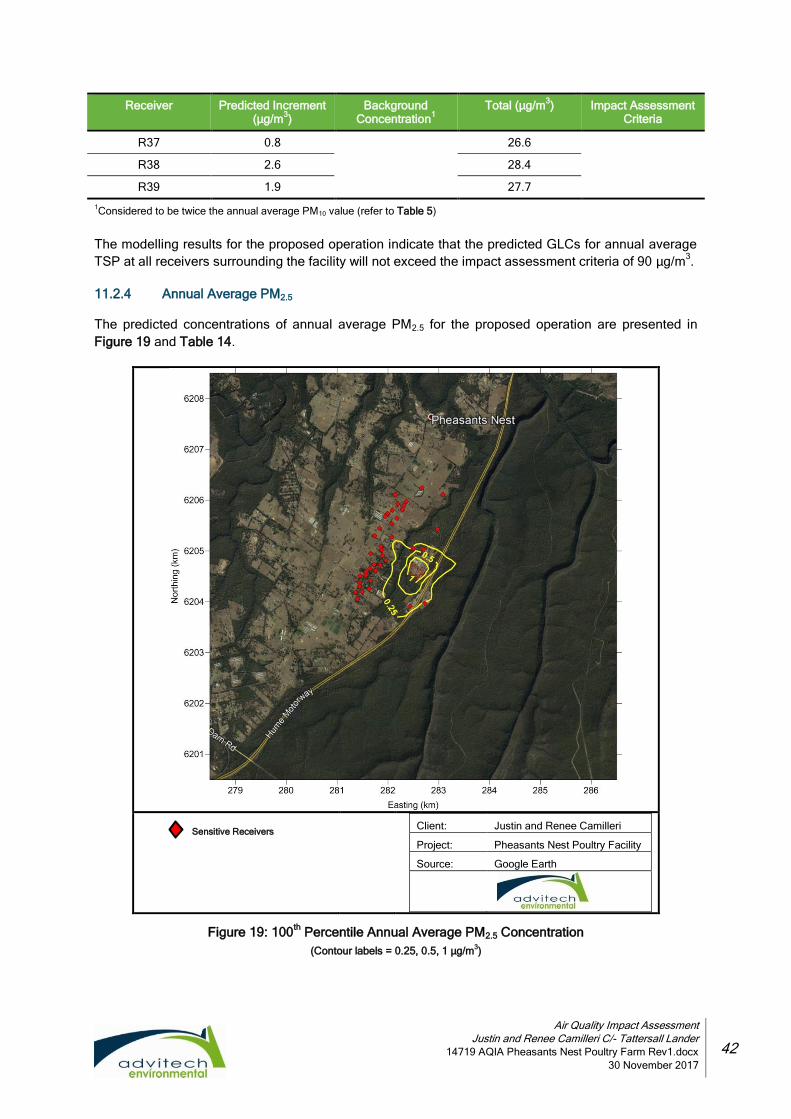
11.2.4 Annual Average PM2.5
The predicted concentrations of annual average PM2.5 for the proposed operation are presented in
Figure 19 and Table 14.
Client: Justin and Renee Camilleri
Project: Pheasants Nest Poultry Facility
Source: Google Earth
Figure 19: 100th
Percentile Annual Average PM2.5 Concentration
(Contour labels = 0.25, 0.5, 1 µg/m3)
Sensitive Receivers
Air Quality Impact Assessment
Justin and Renee Camilleri C/- Tattersall Lander
14719 AQIA Pheasants Nest Poultry Farm Rev1.docx
30 November 2017
43
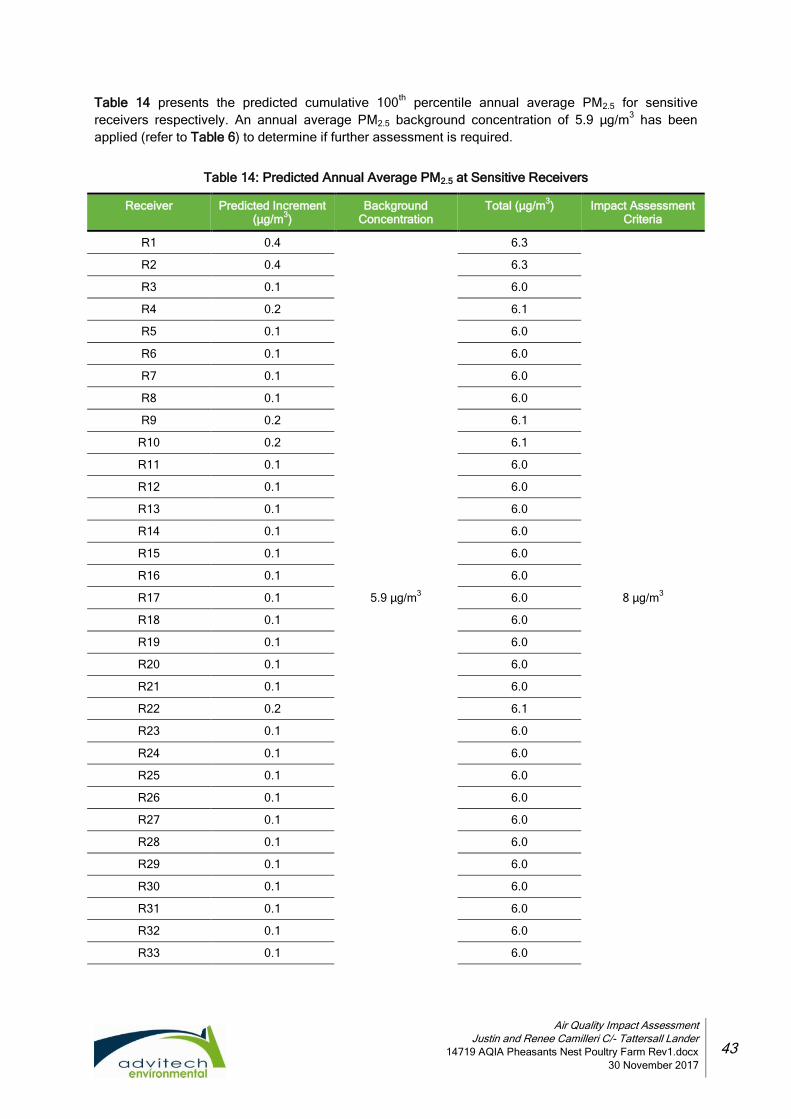
Table 14 presents the predicted cumulative 100th
percentile annual average PM2.5 for sensitive
receivers respectively. An annual average PM2.5 background concentration of 5.9 µg/m3 has been
applied (refer to Table 6) to determine if further assessment is required.
Table 14: Predicted Annual Average PM2.5 at Sensitive Receivers
Receiver Predicted Increment (µg/m
3)
Background Concentration
Total (µg/m3) Impact Assessment
Criteria
R1 0.4
5.9 µg/m3
6.3
8 µg/m3
R2 0.4 6.3
R3 0.1 6.0
R4 0.2 6.1
R5 0.1 6.0
R6 0.1 6.0
R7 0.1 6.0
R8 0.1 6.0
R9 0.2 6.1
R10 0.2 6.1
R11 0.1 6.0
R12 0.1 6.0
R13 0.1 6.0
R14 0.1 6.0
R15 0.1 6.0
R16 0.1 6.0
R17 0.1 6.0
R18 0.1 6.0
R19 0.1 6.0
R20 0.1 6.0
R21 0.1 6.0
R22 0.2 6.1
R23 0.1 6.0
R24 0.1 6.0
R25 0.1 6.0
R26 0.1 6.0
R27 0.1 6.0
R28 0.1 6.0
R29 0.1 6.0
R30 0.1 6.0
R31 0.1 6.0
R32 0.1 6.0
R33 0.1 6.0

Air Quality Impact Assessment
Justin and Renee Camilleri C/- Tattersall Lander
14719 AQIA Pheasants Nest Poultry Farm Rev1.docx
30 November 2017
44
Receiver Predicted Increment (µg/m
3)
Background Concentration
Total (µg/m3) Impact Assessment
Criteria
R34 0.1 6.0
R35 0.0 5.9
R36 0.1 6.0
R37 0.1 6.0
R38 0.3 6.2
R39 0.2 6.1
The annual PM2.5 impact assessment criteria are not exceeded at any sensitive receivers. According to
the NSW OEH guidance, no additional contemporaneous assessment of annual average PM2.5 is
required.
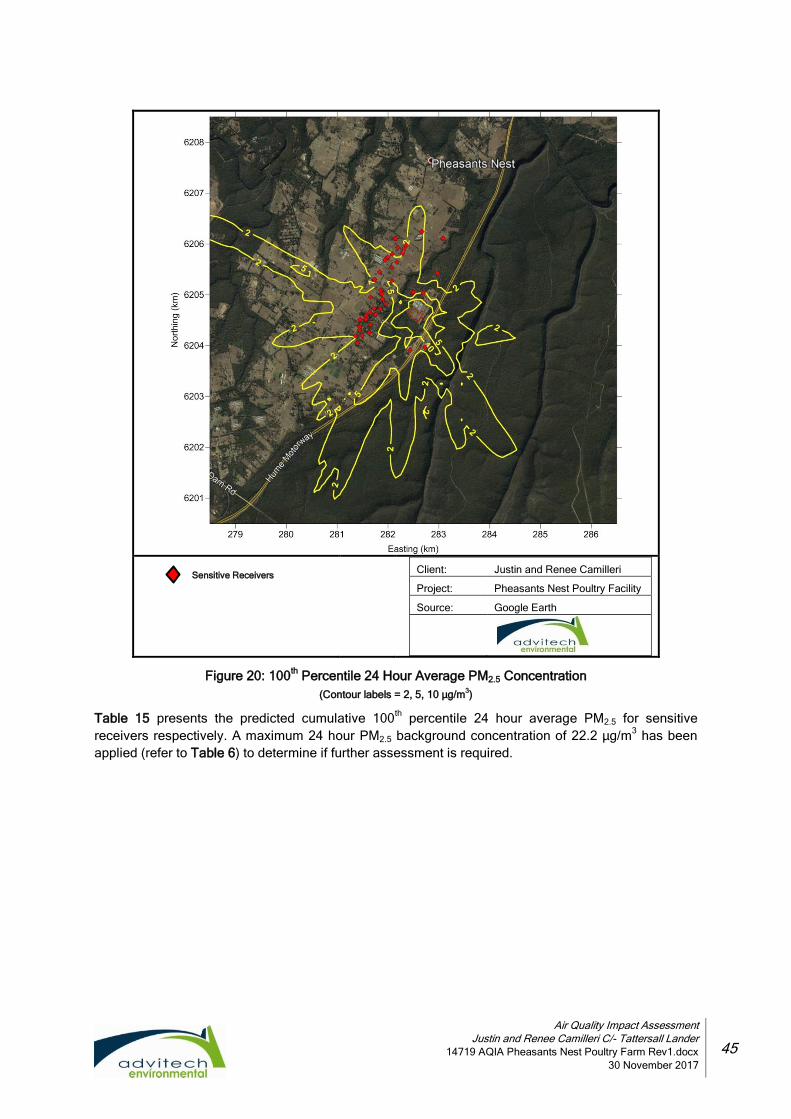
11.2.5 24 Hour Average PM2.5
The predicted concentrations of 24 hour average PM2.5 for the proposed operation are presented in
Figure 20 and Table 15.
Air Quality Impact Assessment
Justin and Renee Camilleri C/- Tattersall Lander
14719 AQIA Pheasants Nest Poultry Farm Rev1.docx
30 November 2017
45
Client: Justin and Renee Camilleri
Project: Pheasants Nest Poultry Facility
Source: Google Earth
Figure 20: 100th
Percentile 24 Hour Average PM2.5 Concentration
(Contour labels = 2, 5, 10 µg/m3)
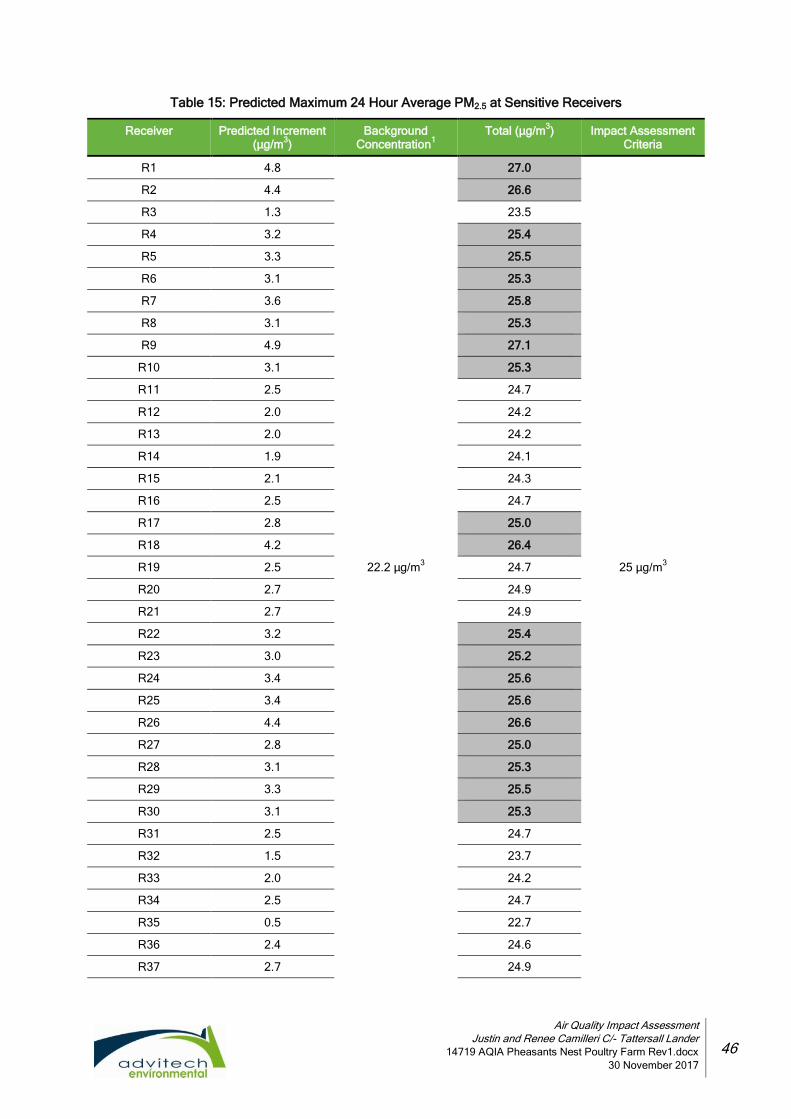
Table 15 presents the predicted cumulative 100th
percentile 24 hour average PM2.5 for sensitive
receivers respectively. A maximum 24 hour PM2.5 background concentration of 22.2 µg/m3 has been
applied (refer to Table 6) to determine if further assessment is required.
Sensitive Receivers
Air Quality Impact Assessment
Justin and Renee Camilleri C/- Tattersall Lander
14719 AQIA Pheasants Nest Poultry Farm Rev1.docx
30 November 2017
46
Table 15: Predicted Maximum 24 Hour Average PM2.5 at Sensitive Receivers
Receiver Predicted Increment (µg/m
3)
Background Concentration
1
Total (µg/m3) Impact Assessment
Criteria
R1 4.8
22.2 µg/m3
27.0
25 µg/m3
R2 4.4 26.6
R3 1.3 23.5
R4 3.2 25.4
R5 3.3 25.5
R6 3.1 25.3
R7 3.6 25.8
R8 3.1 25.3
R9 4.9 27.1
R10 3.1 25.3
R11 2.5 24.7
R12 2.0 24.2
R13 2.0 24.2
R14 1.9 24.1
R15 2.1 24.3
R16 2.5 24.7
R17 2.8 25.0
R18 4.2 26.4
R19 2.5 24.7
R20 2.7 24.9
R21 2.7 24.9
R22 3.2 25.4
R23 3.0 25.2
R24 3.4 25.6
R25 3.4 25.6
R26 4.4 26.6
R27 2.8 25.0
R28 3.1 25.3
R29 3.3 25.5
R30 3.1 25.3
R31 2.5 24.7
R32 1.5 23.7
R33 2.0 24.2
R34 2.5 24.7
R35 0.5 22.7
R36 2.4 24.6
R37 2.7 24.9

Air Quality Impact Assessment
Justin and Renee Camilleri C/- Tattersall Lander
14719 AQIA Pheasants Nest Poultry Farm Rev1.docx
30 November 2017
47
Receiver Predicted Increment (µg/m
3)
Background Concentration
1
Total (µg/m3) Impact Assessment
Criteria
R38 8.2 30.4
R39 6.5 28.7
1 The background concentration of 38 µg/m
3 and 28.9 µg/m
3 has been discounted as it is above the impact assessment criteria.
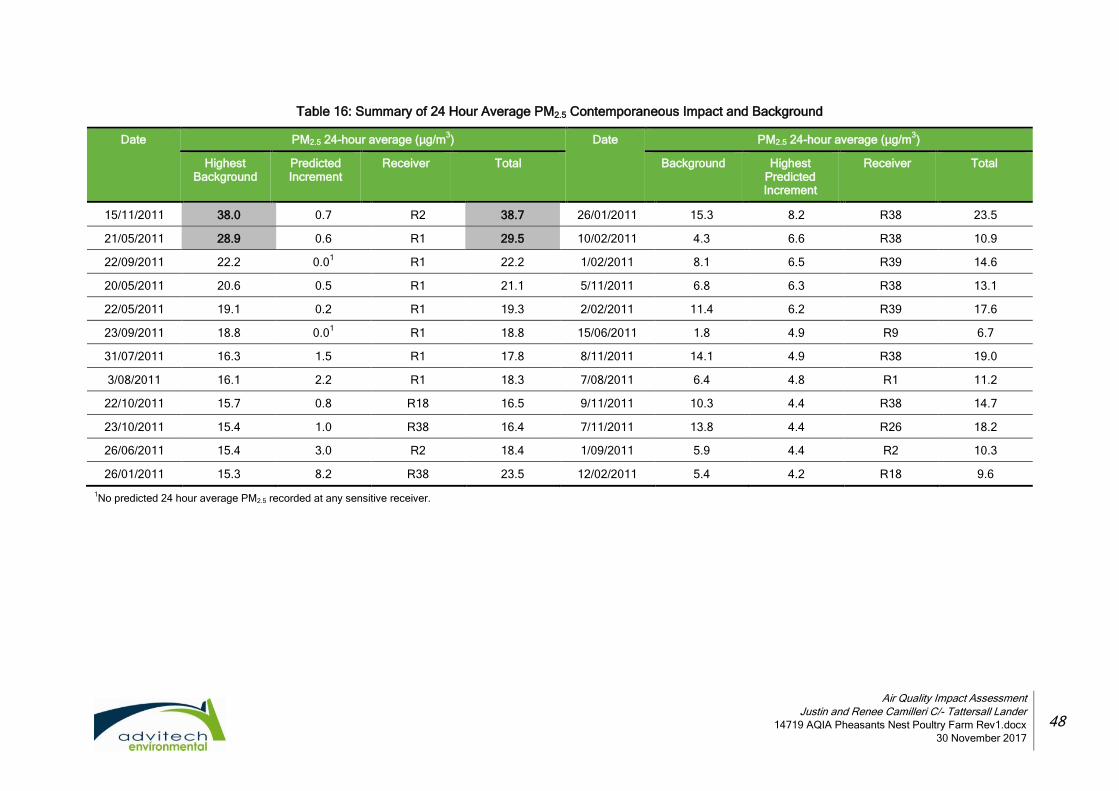
The exceedances at nearby sensitive receivers of the 24 hour average PM2.5 concentration presented
in Table 16 indicates that a Level 2 contemporaneous impact and background assessment was
required to determine any additional exceedances as a result of the proposed operation. A summary of
the 24 hour average PM2.5 contemporaneous impact and background assessment (Level 2
Assessment) for identified sensitive receivers are presented in Table 17. The detailed results of the
contemporaneous impact and background assessment for each highlighted receiver are given in
Appendix III.
.
Air Quality Impact Assessment
Justin and Renee Camilleri C/- Tattersall Lander
14719 AQIA Pheasants Nest Poultry Farm Rev1.docx
30 November 2017
48
Table 16: Summary of 24 Hour Average PM2.5 Contemporaneous Impact and Background
Date
PM2.5 24-hour average (µg/m3) Date PM2.5 24-hour average (µg/m
3)
Highest Background
Predicted Increment
Receiver Total Background Highest Predicted Increment
Receiver Total
15/11/2011 38.0 0.7 R2 38.7 26/01/2011 15.3 8.2 R38 23.5
21/05/2011 28.9 0.6 R1 29.5 10/02/2011 4.3 6.6 R38 10.9
22/09/2011 22.2 0.01
R1 22.2 1/02/2011 8.1 6.5 R39 14.6
20/05/2011 20.6 0.5 R1 21.1 5/11/2011 6.8 6.3 R38 13.1
22/05/2011 19.1 0.2 R1 19.3 2/02/2011 11.4 6.2 R39 17.6
23/09/2011 18.8 0.01
R1 18.8 15/06/2011 1.8 4.9 R9 6.7
31/07/2011 16.3 1.5 R1 17.8 8/11/2011 14.1 4.9 R38 19.0
3/08/2011 16.1 2.2 R1 18.3 7/08/2011 6.4 4.8 R1 11.2
22/10/2011 15.7 0.8 R18 16.5 9/11/2011 10.3 4.4 R38 14.7
23/10/2011 15.4 1.0 R38 16.4 7/11/2011 13.8 4.4 R26 18.2
26/06/2011 15.4 3.0 R2 18.4 1/09/2011 5.9 4.4 R2 10.3
26/01/2011 15.3 8.2 R38 23.5 12/02/2011 5.4 4.2 R18 9.6
1No predicted 24 hour average PM2.5 recorded at any sensitive receiver.
Air Quality Impact Assessment
Justin and Renee Camilleri C/- Tattersall Lander
14719 AQIA Pheasants Nest Poultry Farm Rev1.docx
30 November 2017
49
There are no additional exceedances of the 24 hour PM2.5 impact assessment criteria at nearby
sensitive receivers. According to the NSW OEH guidance, no additional assessment of 24 hour
average PM2.5 is required.
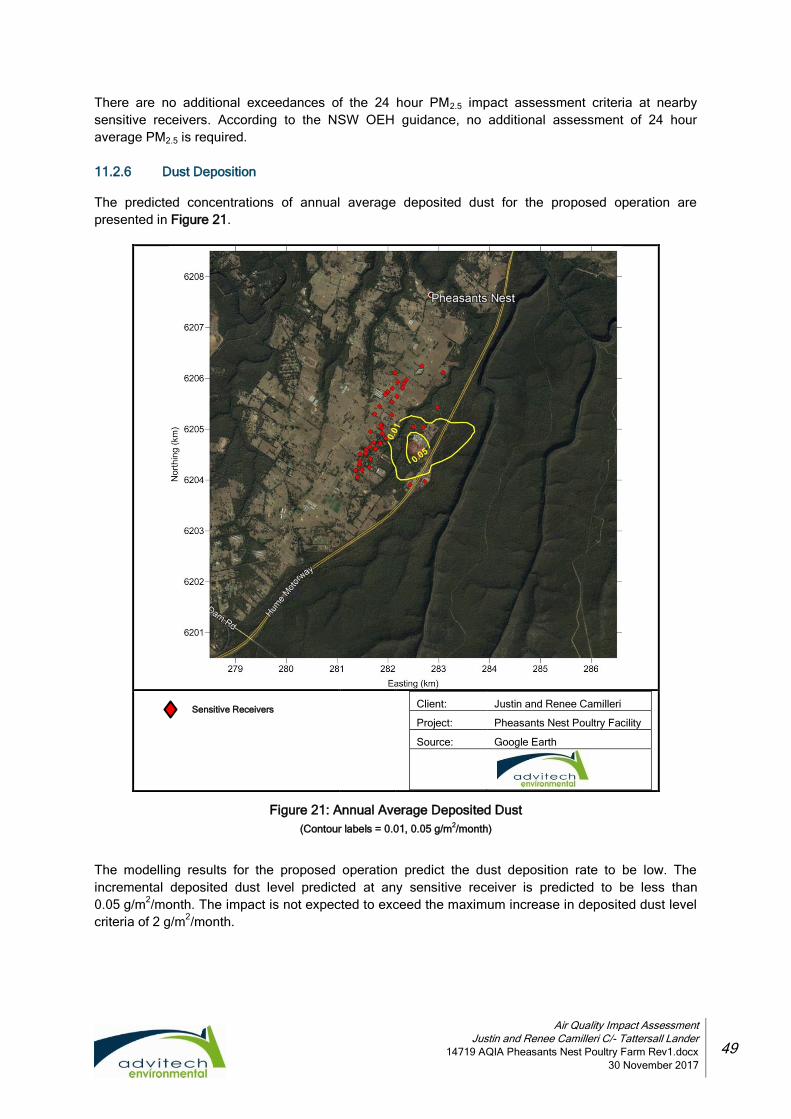
11.2.6 Dust Deposition
The predicted concentrations of annual average deposited dust for the proposed operation are
presented in Figure 21.
Client: Justin and Renee Camilleri
Project: Pheasants Nest Poultry Facility
Source: Google Earth
Figure 21: Annual Average Deposited Dust
(Contour labels = 0.01, 0.05 g/m2/month)
The modelling results for the proposed operation predict the dust deposition rate to be low. The
incremental deposited dust level predicted at any sensitive receiver is predicted to be less than
0.05 g/m2/month. The impact is not expected to exceed the maximum increase in deposited dust level
criteria of 2 g/m2/month.
Sensitive Receivers
Air Quality Impact Assessment
Justin and Renee Camilleri C/- Tattersall Lander
14719 AQIA Pheasants Nest Poultry Farm Rev1.docx
30 November 2017
50
12. DISCUSSION
The air quality impact assessment indicates that odour GLCs at sensitive receivers will not exceed the
impact assessment criteria. It should be noted that the odour nuisance risk to the transient service
station users at R38 and R39 has been consider to be low due to the short duration of a visit and low
predicted odour concentration. Based on the assessment bases outlined in Section 9.4, it is a
requirement that the development of the poultry farms be constructed with 10 m stacks to achieve air
quality compliance.
The particulate dispersion modelling indicates that there may be an additional exceedance of the
24 hour average PM10 impact assessment criteria at nearby sensitive receivers. The exceedance of
the criteria is a result of the combination of the ambient dust concentration, poultry shed emissions and
wheel generated emissions. It should be noted that wheel generated dust emissions are based on
emission factors from the AP42 Section 13.2.2 Unpaved Roads (refer to Section 14, reference 21) and
may be considered conservative for this application.
Particulate exceedances during periods of high background concentrations can be minimised by the
implementation of best management practices such as:
Moderate driving speeds (<40 km/h) are maintained on unsealed internal roads;
Loads are securely covered for transport;
Farm operations are planned and performed by taking into account weather conditions and
forecasts (e.g. wind direction and strength) to minimise the impact of windblown dust on
nearby sensitive land uses;
Roads are wetted as a contingency action if unacceptable dust impacts on neighbours
during peak periods of truck movement are likely during pick‑up (e.g. in particularly dry and
windy conditions); and
Vegetative screens, impact walls, earthen mounds or enclosures at the end of tunnel
ventilated sheds are installed as control measures against unacceptable dust impact.
It is recommended that particulate emissions be managed by the preparation and implementation of
an air quality management plan which details best management practices. To assist with the
management of air quality impacts from the poultry facility, it is recommended that a weather
monitoring station is installed on-site.
13. CONCLUSIONS
CALPUFF modelling for odour and particulates for the proposed poultry facility was undertaken to
enable assessment of air quality impacts. It should be noted that air dispersion models such as
CALPUFF are predictive models.
A population dependent complex odour criterion of 5 OU (99th
percentile nose response time) was
applied to modelled odour emissions from the poultry facility. Based on the assessment bases outlined
in this report, the result of CALPUFF modelling suggests that predicted cumulative odour GLCs above
the 5 OU criterion will not be encountered at any identified sensitive receivers. The highest predicted
off-site odour concentration of 2.1 OU is at sensitive receiver R2 and R38.
Modelling results suggest that particulate GLCs may cause additional exceedances of the impact
assessment criteria at off-site discrete receivers. It is recommended that particulate emissions be
managed by the implementation of an air quality management plan which details best management

Air Quality Impact Assessment
Justin and Renee Camilleri C/- Tattersall Lander
14719 AQIA Pheasants Nest Poultry Farm Rev1.docx
30 November 2017
51
practices. To assist with the management of air quality impacts from the poultry facility, it is
recommended that a weather monitoring station is installed on-site.
14. REFERENCES
The following information was used in the preparation of this report:
1. Australian Poultry CRC, Dust and Odour Emissions from Layer Sheds, September 2011.
2. Australian Bureau of Statistics, Pheasants Nest (NSW) 2016 Census Quickstats accessed
via http://www.censusdata.abs.gov.au/ on 26 September, 2017.
3. Aviagen, Ross Broiler Management Handbook, 2014.
4. Bureau of Meteorology Climate Statistics accessed via
http://www.bom.gov.au/climate/data/ on 26 September, 2017.
5. NSW EPA, 2011, Generic Guidance and Optimum Model Settings for the CALPUFF
Modelling System for Inclusion into the ‘Approved Methods for the Modeling and
Assessments of Air Pollutants in NSW, Australia’.
6. NSW EPA, 2016, Approved Methods for the Modelling and Assessment of Air Pollutants in
New South Wales.
7. DEC, 2006, Technical framework (and notes): assessment and management of odour from
stationary sources in NSW.
8. Department of Sustainability, Environment, Water, Population and Communities, 2012
Emission Estimation Technique (EET) Manual for Mining - Version 3.1.
9. Featherston, D., Pollock, T., and Power, M., 2014. Odour dispersion modelling of meat
chicken farms.
10. Heggies. (2006). Woodlawn Alternative Waste Technology Facility – Air Quality Impact
Assessment.
11. JBS Environmental, Odour Assessment: NSW Department of Planning and Infrastructure,
Austral and Leppington North Precincts, NSW, August 2011.
12. NSW Agriculture, Odour Management Options for Meat Chicken Farms, January 2004.
13. NSW OEH, Conversation with Janelle Pickup from the Air Services Unit, 19 May 2013 and
25 August 2016.
14. NSW OEH Air Quality Monitoring Network accessed via
http://www.environment.nsw.gov.au/AQMS/ on 14 October, 2016.
15. Ormerod, R.J., Turatti F and D’Abreton, P.C., 2003. Variations in community responses to
odour: implications for policy and management. Proc. CASN03 Clean Air Conference,
Newcastle, November 2003. Clean Air Society of Australia & New Zealand.
16. Pacific Environment Limited, Air Quality Impact Assessment – Jeanella South Poultry
Complex, August 2015.
17. PAEHolmes, Best practice guidance for the Queensland poultry industry – plume dispersion
modelling and meteorological processing, May 2011.
18. Scire, J., 2011 supplied information and personal communications.
19. Scire, J., and Barclay, J., 2011. CALPUFF Training Course - April 4-6, 2011, Melbourne.

Air Quality Impact Assessment
Justin and Renee Camilleri C/- Tattersall Lander
14719 AQIA Pheasants Nest Poultry Farm Rev1.docx
30 November 2017
52
20. Tattersall Lander emailed supplied information or personal communications.
21. US EPA, 2006. AP 42 Section 13.2.2 Unpaved Roads.
22. SPCC, 1983. Air Pollution from Coal Mining and Related Developments.

Appendix I
E x amp le CA LME T a n d C AL P UF F I n pu t F i l e s
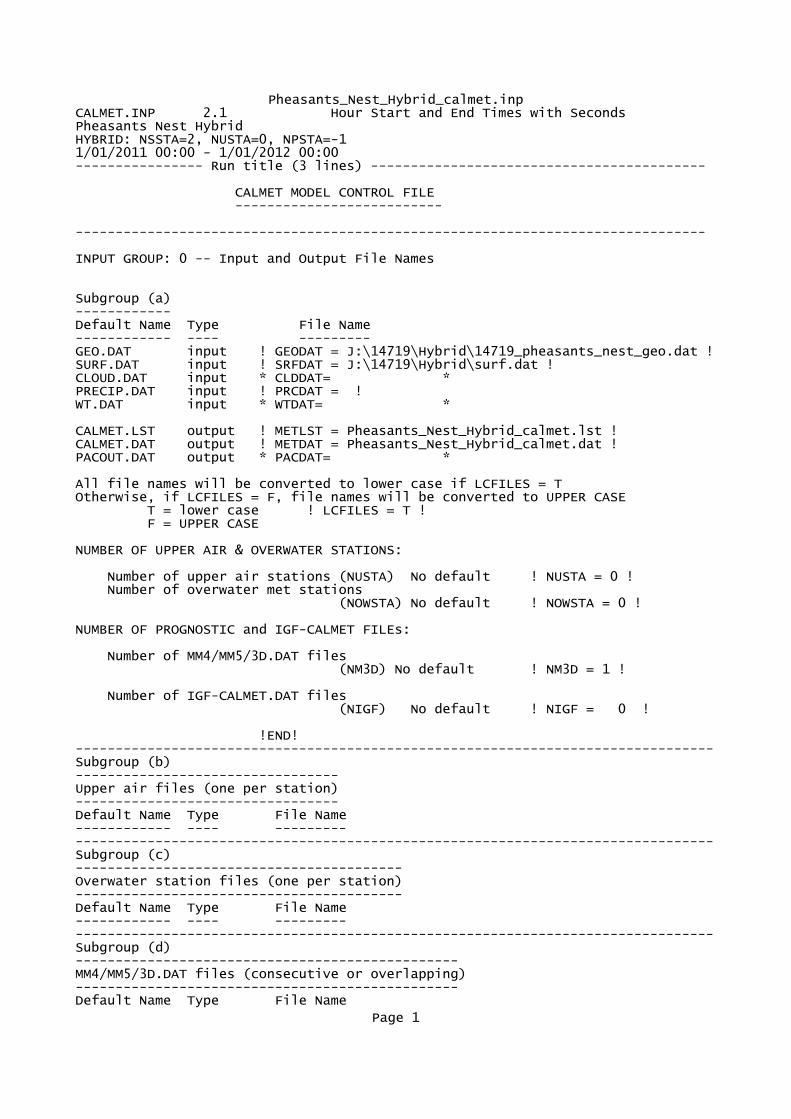
Pheasants_Nest_Hybrid_calmet.inpCALMET.INP 2.1 Hour Start and End Times with SecondsPheasants Nest HybridHYBRID: NSSTA=2, NUSTA=0, NPSTA=-11/01/2011 00:00 - 1/01/2012 00:00---------------- Run title (3 lines) ------------------------------------------
CALMET MODEL CONTROL FILE --------------------------
-------------------------------------------------------------------------------
INPUT GROUP: 0 -- Input and Output File Names
Subgroup (a)------------Default Name Type File Name------------ ---- ---------GEO.DAT input ! GEODAT = J:\14719\Hybrid\14719_pheasants_nest_geo.dat !SURF.DAT input ! SRFDAT = J:\14719\Hybrid\surf.dat !CLOUD.DAT input * CLDDAT= *PRECIP.DAT input ! PRCDAT = !WT.DAT input * WTDAT= *
CALMET.LST output ! METLST = Pheasants_Nest_Hybrid_calmet.lst !CALMET.DAT output ! METDAT = Pheasants_Nest_Hybrid_calmet.dat !PACOUT.DAT output * PACDAT= *
All file names will be converted to lower case if LCFILES = TOtherwise, if LCFILES = F, file names will be converted to UPPER CASE T = lower case ! LCFILES = T ! F = UPPER CASE
NUMBER OF UPPER AIR & OVERWATER STATIONS:
Number of upper air stations (NUSTA) No default ! NUSTA = 0 ! Number of overwater met stations (NOWSTA) No default ! NOWSTA = 0 !
NUMBER OF PROGNOSTIC and IGF-CALMET FILEs:
Number of MM4/MM5/3D.DAT files (NM3D) No default ! NM3D = 1 !
Number of IGF-CALMET.DAT files (NIGF) No default ! NIGF = 0 !
!END!--------------------------------------------------------------------------------Subgroup (b)---------------------------------Upper air files (one per station)---------------------------------Default Name Type File Name------------ ---- -----------------------------------------------------------------------------------------Subgroup (c)-----------------------------------------Overwater station files (one per station)-----------------------------------------Default Name Type File Name------------ ---- -----------------------------------------------------------------------------------------Subgroup (d)------------------------------------------------MM4/MM5/3D.DAT files (consecutive or overlapping)------------------------------------------------Default Name Type File Name
Page 1
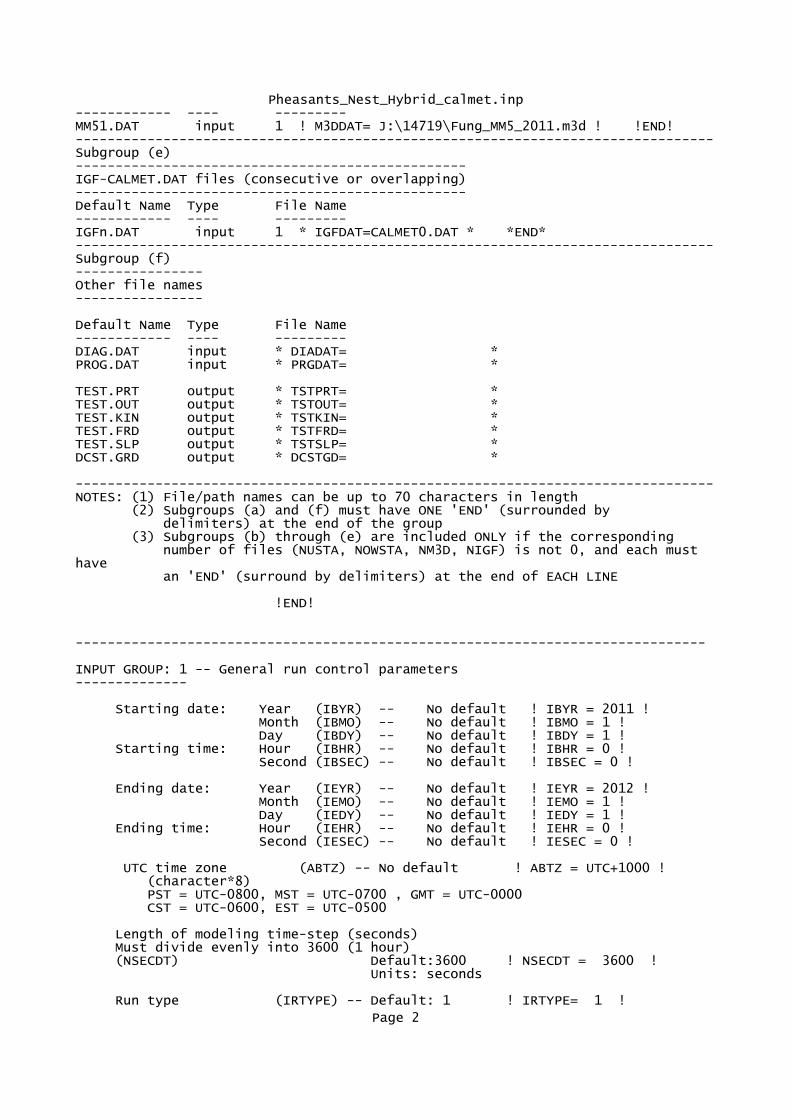
Pheasants_Nest_Hybrid_calmet.inp------------ ---- ---------MM51.DAT input 1 ! M3DDAT= J:\14719\Fung_MM5_2011.m3d ! !END!--------------------------------------------------------------------------------Subgroup (e)-------------------------------------------------IGF-CALMET.DAT files (consecutive or overlapping)-------------------------------------------------Default Name Type File Name------------ ---- ---------IGFn.DAT input 1 * IGFDAT=CALMET0.DAT * *END*--------------------------------------------------------------------------------Subgroup (f)----------------Other file names----------------
Default Name Type File Name------------ ---- ---------DIAG.DAT input * DIADAT= *PROG.DAT input * PRGDAT= *
TEST.PRT output * TSTPRT= *TEST.OUT output * TSTOUT= *TEST.KIN output * TSTKIN= *TEST.FRD output * TSTFRD= *TEST.SLP output * TSTSLP= *DCST.GRD output * DCSTGD= *
--------------------------------------------------------------------------------NOTES: (1) File/path names can be up to 70 characters in length (2) Subgroups (a) and (f) must have ONE 'END' (surrounded by delimiters) at the end of the group (3) Subgroups (b) through (e) are included ONLY if the corresponding number of files (NUSTA, NOWSTA, NM3D, NIGF) is not 0, and each must have an 'END' (surround by delimiters) at the end of EACH LINE
!END!
-------------------------------------------------------------------------------
INPUT GROUP: 1 -- General run control parameters--------------
Starting date: Year (IBYR) -- No default ! IBYR = 2011 ! Month (IBMO) -- No default ! IBMO = 1 ! Day (IBDY) -- No default ! IBDY = 1 ! Starting time: Hour (IBHR) -- No default ! IBHR = 0 ! Second (IBSEC) -- No default ! IBSEC = 0 !
Ending date: Year (IEYR) -- No default ! IEYR = 2012 ! Month (IEMO) -- No default ! IEMO = 1 ! Day (IEDY) -- No default ! IEDY = 1 ! Ending time: Hour (IEHR) -- No default ! IEHR = 0 ! Second (IESEC) -- No default ! IESEC = 0 !
UTC time zone (ABTZ) -- No default ! ABTZ = UTC+1000 ! (character*8) PST = UTC-0800, MST = UTC-0700 , GMT = UTC-0000 CST = UTC-0600, EST = UTC-0500
Length of modeling time-step (seconds) Must divide evenly into 3600 (1 hour) (NSECDT) Default:3600 ! NSECDT = 3600 ! Units: seconds
Run type (IRTYPE) -- Default: 1 ! IRTYPE= 1 !
Page 2
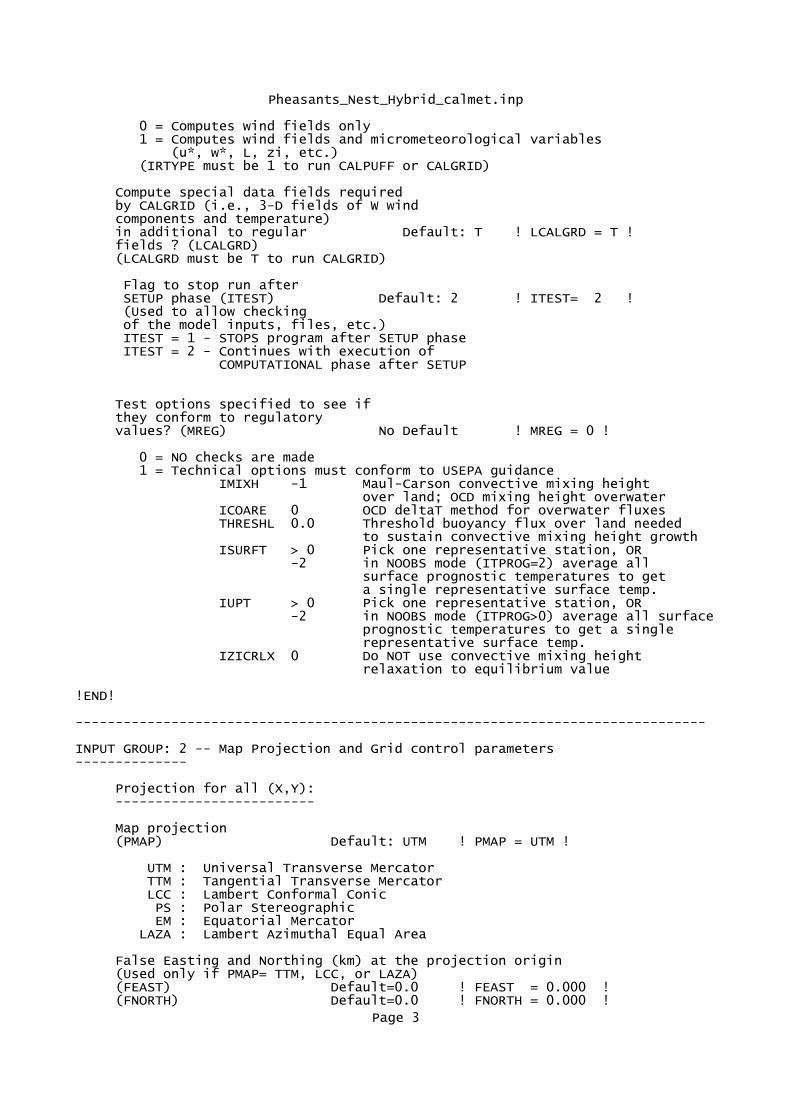
Pheasants_Nest_Hybrid_calmet.inp
0 = Computes wind fields only 1 = Computes wind fields and micrometeorological variables (u*, w*, L, zi, etc.) (IRTYPE must be 1 to run CALPUFF or CALGRID)
Compute special data fields required by CALGRID (i.e., 3-D fields of W wind components and temperature) in additional to regular Default: T ! LCALGRD = T ! fields ? (LCALGRD) (LCALGRD must be T to run CALGRID)
Flag to stop run after SETUP phase (ITEST) Default: 2 ! ITEST= 2 ! (Used to allow checking of the model inputs, files, etc.) ITEST = 1 - STOPS program after SETUP phase ITEST = 2 - Continues with execution of COMPUTATIONAL phase after SETUP
Test options specified to see if they conform to regulatory values? (MREG) No Default ! MREG = 0 !
0 = NO checks are made 1 = Technical options must conform to USEPA guidance IMIXH -1 Maul-Carson convective mixing height over land; OCD mixing height overwater ICOARE 0 OCD deltaT method for overwater fluxes THRESHL 0.0 Threshold buoyancy flux over land needed to sustain convective mixing height growth ISURFT > 0 Pick one representative station, OR -2 in NOOBS mode (ITPROG=2) average all surface prognostic temperatures to get a single representative surface temp. IUPT > 0 Pick one representative station, OR -2 in NOOBS mode (ITPROG>0) average all surface prognostic temperatures to get a single representative surface temp. IZICRLX 0 Do NOT use convective mixing height relaxation to equilibrium value
!END!
-------------------------------------------------------------------------------
INPUT GROUP: 2 -- Map Projection and Grid control parameters--------------
Projection for all (X,Y): -------------------------
Map projection (PMAP) Default: UTM ! PMAP = UTM !
UTM : Universal Transverse Mercator TTM : Tangential Transverse Mercator LCC : Lambert Conformal Conic PS : Polar Stereographic EM : Equatorial Mercator LAZA : Lambert Azimuthal Equal Area
False Easting and Northing (km) at the projection origin (Used only if PMAP= TTM, LCC, or LAZA) (FEAST) Default=0.0 ! FEAST = 0.000 ! (FNORTH) Default=0.0 ! FNORTH = 0.000 !
Page 3
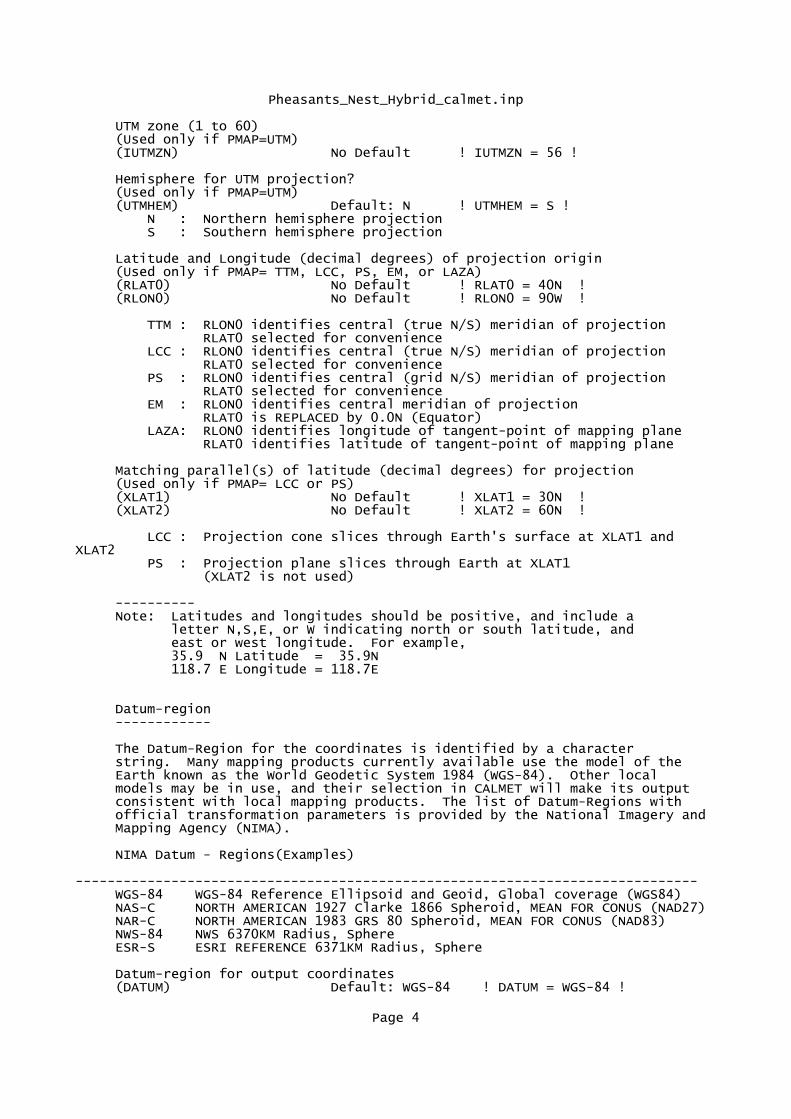
Pheasants_Nest_Hybrid_calmet.inp
UTM zone (1 to 60) (Used only if PMAP=UTM) (IUTMZN) No Default ! IUTMZN = 56 !
Hemisphere for UTM projection? (Used only if PMAP=UTM) (UTMHEM) Default: N ! UTMHEM = S ! N : Northern hemisphere projection S : Southern hemisphere projection
Latitude and Longitude (decimal degrees) of projection origin (Used only if PMAP= TTM, LCC, PS, EM, or LAZA) (RLAT0) No Default ! RLAT0 = 40N ! (RLON0) No Default ! RLON0 = 90W !
TTM : RLON0 identifies central (true N/S) meridian of projection RLAT0 selected for convenience LCC : RLON0 identifies central (true N/S) meridian of projection RLAT0 selected for convenience PS : RLON0 identifies central (grid N/S) meridian of projection RLAT0 selected for convenience EM : RLON0 identifies central meridian of projection RLAT0 is REPLACED by 0.0N (Equator) LAZA: RLON0 identifies longitude of tangent-point of mapping plane RLAT0 identifies latitude of tangent-point of mapping plane
Matching parallel(s) of latitude (decimal degrees) for projection (Used only if PMAP= LCC or PS) (XLAT1) No Default ! XLAT1 = 30N ! (XLAT2) No Default ! XLAT2 = 60N !
LCC : Projection cone slices through Earth's surface at XLAT1 and XLAT2 PS : Projection plane slices through Earth at XLAT1 (XLAT2 is not used)
---------- Note: Latitudes and longitudes should be positive, and include a letter N,S,E, or W indicating north or south latitude, and east or west longitude. For example, 35.9 N Latitude = 35.9N 118.7 E Longitude = 118.7E
Datum-region ------------
The Datum-Region for the coordinates is identified by a character string. Many mapping products currently available use the model of the Earth known as the World Geodetic System 1984 (WGS-84). Other local models may be in use, and their selection in CALMET will make its output consistent with local mapping products. The list of Datum-Regions with official transformation parameters is provided by the National Imagery and Mapping Agency (NIMA).
NIMA Datum - Regions(Examples) ------------------------------------------------------------------------------ WGS-84 WGS-84 Reference Ellipsoid and Geoid, Global coverage (WGS84) NAS-C NORTH AMERICAN 1927 Clarke 1866 Spheroid, MEAN FOR CONUS (NAD27) NAR-C NORTH AMERICAN 1983 GRS 80 Spheroid, MEAN FOR CONUS (NAD83) NWS-84 NWS 6370KM Radius, Sphere ESR-S ESRI REFERENCE 6371KM Radius, Sphere
Datum-region for output coordinates (DATUM) Default: WGS-84 ! DATUM = WGS-84 !
Page 4
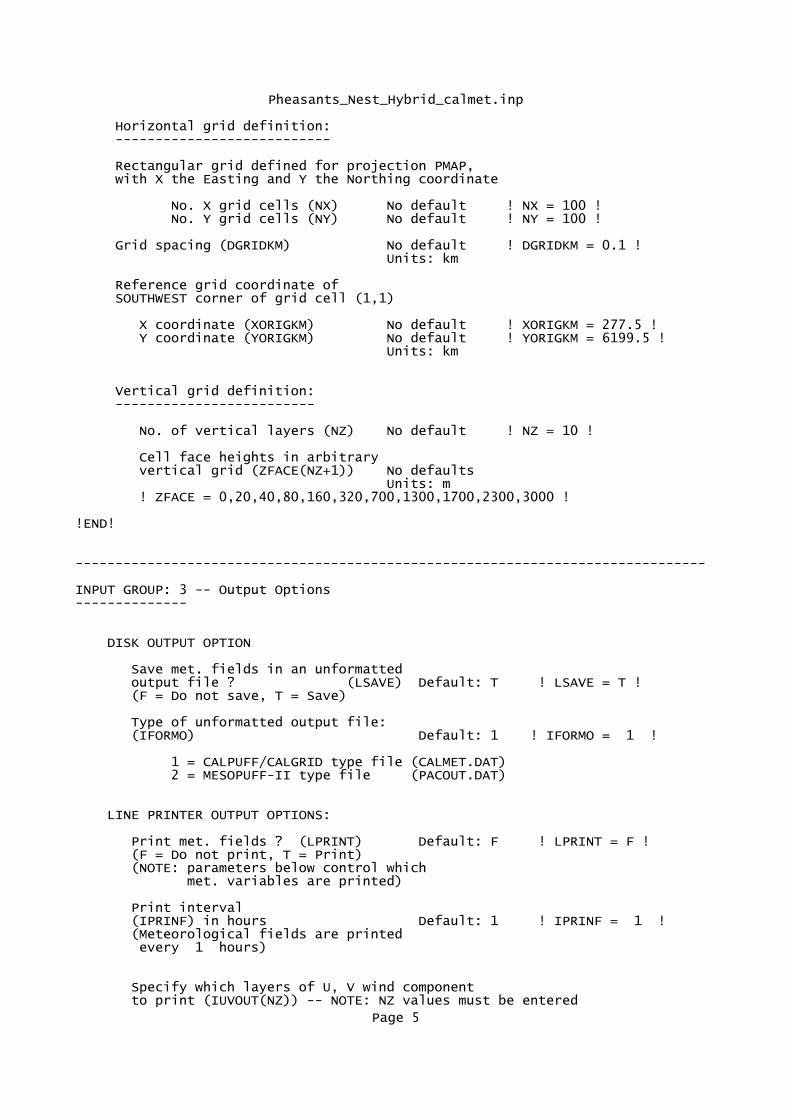
Pheasants_Nest_Hybrid_calmet.inp
Horizontal grid definition: ---------------------------
Rectangular grid defined for projection PMAP, with X the Easting and Y the Northing coordinate
No. X grid cells (NX) No default ! NX = 100 ! No. Y grid cells (NY) No default ! NY = 100 !
Grid spacing (DGRIDKM) No default ! DGRIDKM = 0.1 ! Units: km
Reference grid coordinate of SOUTHWEST corner of grid cell (1,1)
X coordinate (XORIGKM) No default ! XORIGKM = 277.5 ! Y coordinate (YORIGKM) No default ! YORIGKM = 6199.5 ! Units: km
Vertical grid definition: -------------------------
No. of vertical layers (NZ) No default ! NZ = 10 !
Cell face heights in arbitrary vertical grid (ZFACE(NZ+1)) No defaults Units: m ! ZFACE = 0,20,40,80,160,320,700,1300,1700,2300,3000 !
!END!
-------------------------------------------------------------------------------
INPUT GROUP: 3 -- Output Options--------------
DISK OUTPUT OPTION
Save met. fields in an unformatted output file ? (LSAVE) Default: T ! LSAVE = T ! (F = Do not save, T = Save)
Type of unformatted output file: (IFORMO) Default: 1 ! IFORMO = 1 !
1 = CALPUFF/CALGRID type file (CALMET.DAT) 2 = MESOPUFF-II type file (PACOUT.DAT)
LINE PRINTER OUTPUT OPTIONS:
Print met. fields ? (LPRINT) Default: F ! LPRINT = F ! (F = Do not print, T = Print) (NOTE: parameters below control which met. variables are printed)
Print interval (IPRINF) in hours Default: 1 ! IPRINF = 1 ! (Meteorological fields are printed every 1 hours)
Specify which layers of U, V wind component to print (IUVOUT(NZ)) -- NOTE: NZ values must be entered
Page 5
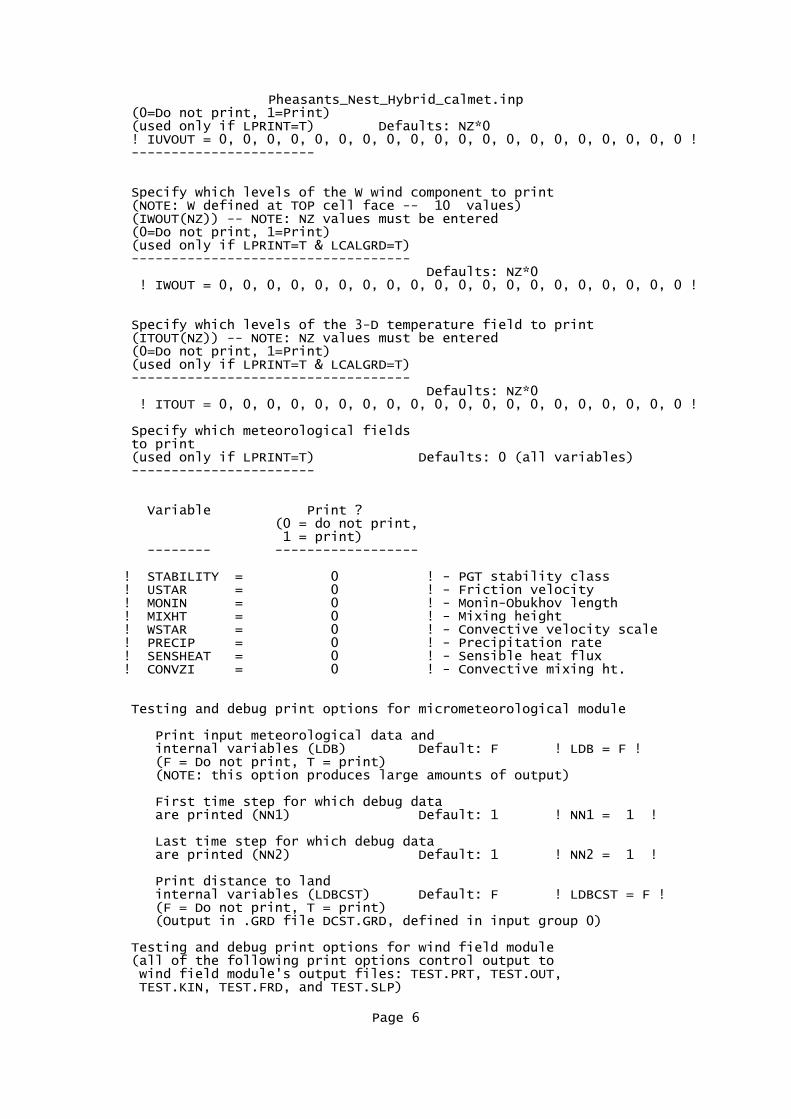
Pheasants_Nest_Hybrid_calmet.inp (0=Do not print, 1=Print) (used only if LPRINT=T) Defaults: NZ*0 ! IUVOUT = 0, 0, 0, 0, 0, 0, 0, 0, 0, 0, 0, 0, 0, 0, 0, 0, 0, 0, 0, 0 ! -----------------------
Specify which levels of the W wind component to print (NOTE: W defined at TOP cell face -- 10 values) (IWOUT(NZ)) -- NOTE: NZ values must be entered (0=Do not print, 1=Print) (used only if LPRINT=T & LCALGRD=T) ----------------------------------- Defaults: NZ*0 ! IWOUT = 0, 0, 0, 0, 0, 0, 0, 0, 0, 0, 0, 0, 0, 0, 0, 0, 0, 0, 0, 0 !
Specify which levels of the 3-D temperature field to print (ITOUT(NZ)) -- NOTE: NZ values must be entered (0=Do not print, 1=Print) (used only if LPRINT=T & LCALGRD=T) ----------------------------------- Defaults: NZ*0 ! ITOUT = 0, 0, 0, 0, 0, 0, 0, 0, 0, 0, 0, 0, 0, 0, 0, 0, 0, 0, 0, 0 !
Specify which meteorological fields to print (used only if LPRINT=T) Defaults: 0 (all variables) -----------------------
Variable Print ? (0 = do not print, 1 = print) -------- ------------------
! STABILITY = 0 ! - PGT stability class ! USTAR = 0 ! - Friction velocity ! MONIN = 0 ! - Monin-Obukhov length ! MIXHT = 0 ! - Mixing height ! WSTAR = 0 ! - Convective velocity scale ! PRECIP = 0 ! - Precipitation rate ! SENSHEAT = 0 ! - Sensible heat flux ! CONVZI = 0 ! - Convective mixing ht.
Testing and debug print options for micrometeorological module
Print input meteorological data and internal variables (LDB) Default: F ! LDB = F ! (F = Do not print, T = print) (NOTE: this option produces large amounts of output)
First time step for which debug data are printed (NN1) Default: 1 ! NN1 = 1 !
Last time step for which debug data are printed (NN2) Default: 1 ! NN2 = 1 !
Print distance to land internal variables (LDBCST) Default: F ! LDBCST = F ! (F = Do not print, T = print) (Output in .GRD file DCST.GRD, defined in input group 0)
Testing and debug print options for wind field module (all of the following print options control output to wind field module's output files: TEST.PRT, TEST.OUT, TEST.KIN, TEST.FRD, and TEST.SLP)
Page 6
Pheasants_Nest_Hybrid_calmet.inp Control variable for writing the test/debug wind fields to disk files (IOUTD) (0=Do not write, 1=write) Default: 0 ! IOUTD = 0 !
Number of levels, starting at the surface, to print (NZPRN2) Default: 1 ! NZPRN2 = 0 !
Print the INTERPOLATED wind components ? (IPR0) (0=no, 1=yes) Default: 0 ! IPR0 = 0 !
Print the TERRAIN ADJUSTED surface wind components ? (IPR1) (0=no, 1=yes) Default: 0 ! IPR1 = 0 !
Print the SMOOTHED wind components and the INITIAL DIVERGENCE fields ? (IPR2) (0=no, 1=yes) Default: 0 ! IPR2 = 0 !
Print the FINAL wind speed and direction fields ? (IPR3) (0=no, 1=yes) Default: 0 ! IPR3 = 0 !
Print the FINAL DIVERGENCE fields ? (IPR4) (0=no, 1=yes) Default: 0 ! IPR4 = 0 !
Print the winds after KINEMATIC effects are added ? (IPR5) (0=no, 1=yes) Default: 0 ! IPR5 = 0 !
Print the winds after the FROUDE NUMBER adjustment is made ? (IPR6) (0=no, 1=yes) Default: 0 ! IPR6 = 0 !
Print the winds after SLOPE FLOWS are added ? (IPR7) (0=no, 1=yes) Default: 0 ! IPR7 = 0 !
Print the FINAL wind field components ? (IPR8) (0=no, 1=yes) Default: 0 ! IPR8 = 0 !
!END!
-------------------------------------------------------------------------------
INPUT GROUP: 4 -- Meteorological data options--------------
NO OBSERVATION MODE (NOOBS) Default: 0 ! NOOBS = 1 ! 0 = Use surface, overwater, and upper air stations 1 = Use surface and overwater stations (no upper air observations) Use MM4/MM5/3D.DAT for upper air data 2 = No surface, overwater, or upper air observations Use MM4/MM5/3D.DAT for surface, overwater, and upper air data
NUMBER OF SURFACE & PRECIP. METEOROLOGICAL STATIONS
Number of surface stations (NSSTA) No default ! NSSTA = 2 !
Number of precipitation stations (NPSTA=-1: flag for use of MM5/3D.DAT precip data) (NPSTA) No default ! NPSTA = -1 !
CLOUD DATA OPTIONS Gridded cloud fields: (ICLOUD) Default: 0 ! ICLOUD = 4 ! ICLOUD = 0 - Gridded clouds not used ICLOUD = 1 - Gridded CLOUD.DAT generated as OUTPUT
Page 7
Pheasants_Nest_Hybrid_calmet.inp ICLOUD = 2 - Gridded CLOUD.DAT read as INPUT ICLOUD = 3 - Gridded cloud cover from Prognostic Rel. Humidity at 850mb (Teixera) ICLOUD = 4 - Gridded cloud cover from Prognostic Rel. Humidity at all levels (MM5toGrads algorithm)
FILE FORMATS
Surface meteorological data file format (IFORMS) Default: 2 ! IFORMS = 2 ! (1 = unformatted (e.g., SMERGE output)) (2 = formatted (free-formatted user input))
Precipitation data file format (IFORMP) Default: 2 ! IFORMP = 2 ! (1 = unformatted (e.g., PMERGE output)) (2 = formatted (free-formatted user input))
Cloud data file format (IFORMC) Default: 2 ! IFORMC = 2 ! (1 = unformatted - CALMET unformatted output) (2 = formatted - free-formatted CALMET output or user input)
!END!
-------------------------------------------------------------------------------
INPUT GROUP: 5 -- Wind Field Options and Parameters--------------
WIND FIELD MODEL OPTIONS Model selection variable (IWFCOD) Default: 1 ! IWFCOD = 1 ! 0 = Objective analysis only 1 = Diagnostic wind module
Compute Froude number adjustment effects ? (IFRADJ) Default: 1 ! IFRADJ = 1 ! (0 = NO, 1 = YES)
Compute kinematic effects ? (IKINE) Default: 0 ! IKINE = 0 ! (0 = NO, 1 = YES)
Use O'Brien procedure for adjustment of the vertical velocity ? (IOBR) Default: 0 ! IOBR = 0 ! (0 = NO, 1 = YES)
Compute slope flow effects ? (ISLOPE) Default: 1 ! ISLOPE = 1 ! (0 = NO, 1 = YES)
Extrapolate surface wind observations to upper layers ? (IEXTRP) Default: -4 ! IEXTRP = -4 ! (1 = no extrapolation is done, 2 = power law extrapolation used, 3 = user input multiplicative factors for layers 2 - NZ used (see FEXTRP array) 4 = similarity theory used -1, -2, -3, -4 = same as above except layer 1 data at upper air stations are ignored
Extrapolate surface winds even if calm? (ICALM) Default: 0 ! ICALM = 0 ! (0 = NO, 1 = YES)
Layer-dependent biases modifying the weights of surface and upper air stations (BIAS(NZ)) -1<=BIAS<=1
Page 8
Pheasants_Nest_Hybrid_calmet.inp Negative BIAS reduces the weight of upper air stations (e.g. BIAS=-0.1 reduces the weight of upper air stations by 10%; BIAS= -1, reduces their weight by 100 %) Positive BIAS reduces the weight of surface stations (e.g. BIAS= 0.2 reduces the weight of surface stations by 20%; BIAS=1 reduces their weight by 100%) Zero BIAS leaves weights unchanged (1/R**2 interpolation) Default: NZ*0 ! BIAS = -1.0,-1.0,-1.0,-1.0,0.5,1.0,1.0,1.0,1.0,1.0 !
Minimum distance from nearest upper air station to surface station for which extrapolation of surface winds at surface station will be allowed (RMIN2: Set to -1 for IEXTRP = 4 or other situations where all surface stations should be extrapolated) Default: 4. ! RMIN2 = 4.0 !
Use gridded prognostic wind field model output fields as input to the diagnostic wind field model (IPROG) Default: 0 ! IPROG = 14 ! (0 = No, [IWFCOD = 0 or 1] 1 = Yes, use CSUMM prog. winds as Step 1 field, [IWFCOD = 0] 2 = Yes, use CSUMM prog. winds as initial guess field [IWFCOD = 1] 3 = Yes, use winds from MM4.DAT file as Step 1 field [IWFCOD = 0] 4 = Yes, use winds from MM4.DAT file as initial guess field [IWFCOD = 1] 5 = Yes, use winds from MM4.DAT file as observations [IWFCOD = 1] 13 = Yes, use winds from MM5/3D.DAT file as Step 1 field [IWFCOD = 0] 14 = Yes, use winds from MM5/3D.DAT file as initial guess field [IWFCOD = 1] 15 = Yes, use winds from MM5/3D.DAT file as observations [IWFCOD = 1]
Timestep (seconds) of the prognostic model input data (ISTEPPGS) Default: 3600 ! ISTEPPGS = 3600 !
Use coarse CALMET fields as initial guess fields (IGFMET) (overwrites IGF based on prognostic wind fields if any) Default: 0 ! IGFMET = 0 !
RADIUS OF INFLUENCE PARAMETERS
Use varying radius of influence Default: F ! LVARY = F ! (if no stations are found within RMAX1,RMAX2, or RMAX3, then the closest station will be used)
Maximum radius of influence over land in the surface layer (RMAX1) No default ! RMAX1 = 6 ! Units: km Maximum radius of influence over land aloft (RMAX2) No default ! RMAX2 = 6 ! Units: km Maximum radius of influence over water (RMAX3) No default ! RMAX3 = ! Units: km
OTHER WIND FIELD INPUT PARAMETERS
Minimum radius of influence used in the wind field interpolation (RMIN) Default: 0.1 ! RMIN = 0.1 ! Units: km Radius of influence of terrain features (TERRAD) No default ! TERRAD = 5 !
Units: km Relative weighting of the first guess field and observations in the SURFACE layer (R1) No default ! R1 = 5 !
Page 9
Pheasants_Nest_Hybrid_calmet.inp (R1 is the distance from an Units: km observational station at which the observation and first guess field are equally weighted)
Relative weighting of the first guess field and observations in the layers ALOFT (R2) No default ! R2 = 5 ! (R2 is applied in the upper layers Units: km in the same manner as R1 is used in the surface layer).
Relative weighting parameter of the prognostic wind field data (RPROG) No default ! RPROG = 0. ! (Used only if IPROG = 1) Units: km ------------------------
Maximum acceptable divergence in the divergence minimization procedure (DIVLIM) Default: 5.E-6 ! DIVLIM= 5.0E-06 !
Maximum number of iterations in the divergence min. procedure (NITER) Default: 50 ! NITER = 50 !
Number of passes in the smoothing procedure (NSMTH(NZ)) NOTE: NZ values must be entered Default: 2,(mxnz-1)*4 ! NSMTH = 2, 4, 4, 4, 4, 4, 4, 4, 4, 4, 4, 4, 4, 4, 4, 4, 4, 4, 4, 4 !
Maximum number of stations used in each layer for the interpolation of data to a grid point (NINTR2(NZ)) NOTE: NZ values must be entered Default: 99. ! NINTR2 = 5, 5, 5, 5, 5, 5, 5, 5, 5, 5, 5, 5, 5, 5, 5, 5, 5, 5, 5, 5 !
Critical Froude number (CRITFN) Default: 1.0 ! CRITFN = 1. !
Empirical factor controlling the influence of kinematic effects (ALPHA) Default: 0.1 ! ALPHA = 0.1 !
Multiplicative scaling factor for extrapolation of surface observations to upper layers (FEXTR2(NZ)) Default: NZ*0.0 ! FEXTR2 = 0., 0., 0., 0., 0., 0., 0., 0., 0., 0., 0., 0., 0., 0., 0., 0., 0., 0., 0., 0. ! (Used only if IEXTRP = 3 or -3)
BARRIER INFORMATION
Number of barriers to interpolation of the wind fields (NBAR) Default: 0 ! NBAR = 0 !
Level (1 to NZ) up to which barriers apply (KBAR) Default: NZ ! KBAR = 10 !
THE FOLLOWING 4 VARIABLES ARE INCLUDED ONLY IF NBAR > 0 NOTE: NBAR values must be entered No defaults for each variable Units: km
X coordinate of BEGINNING of each barrier (XBBAR(NBAR)) ! XBBAR = 0. ! Y coordinate of BEGINNING of each barrier (YBBAR(NBAR)) ! YBBAR = 0. !
Page 10
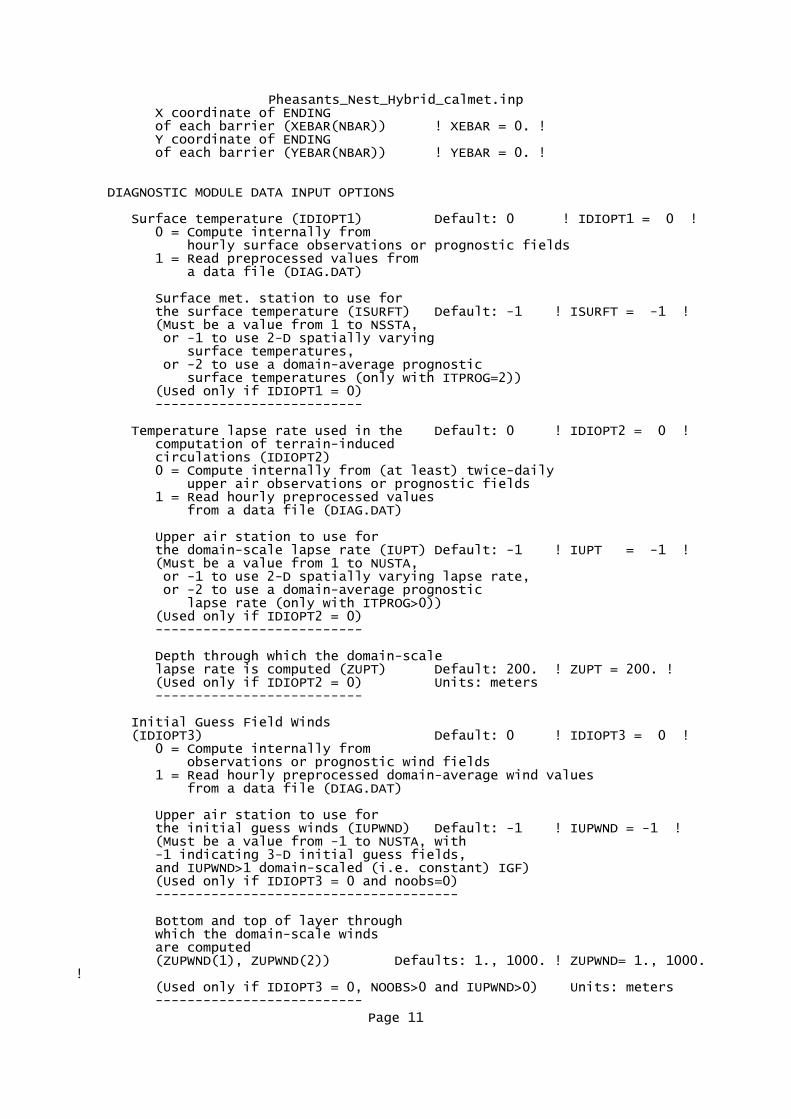
Pheasants_Nest_Hybrid_calmet.inp X coordinate of ENDING of each barrier (XEBAR(NBAR)) ! XEBAR = 0. ! Y coordinate of ENDING of each barrier (YEBAR(NBAR)) ! YEBAR = 0. !
DIAGNOSTIC MODULE DATA INPUT OPTIONS
Surface temperature (IDIOPT1) Default: 0 ! IDIOPT1 = 0 ! 0 = Compute internally from hourly surface observations or prognostic fields 1 = Read preprocessed values from a data file (DIAG.DAT)
Surface met. station to use for the surface temperature (ISURFT) Default: -1 ! ISURFT = -1 ! (Must be a value from 1 to NSSTA, or -1 to use 2-D spatially varying surface temperatures, or -2 to use a domain-average prognostic surface temperatures (only with ITPROG=2)) (Used only if IDIOPT1 = 0) --------------------------
Temperature lapse rate used in the Default: 0 ! IDIOPT2 = 0 ! computation of terrain-induced circulations (IDIOPT2) 0 = Compute internally from (at least) twice-daily upper air observations or prognostic fields 1 = Read hourly preprocessed values from a data file (DIAG.DAT)
Upper air station to use for the domain-scale lapse rate (IUPT) Default: -1 ! IUPT = -1 ! (Must be a value from 1 to NUSTA, or -1 to use 2-D spatially varying lapse rate, or -2 to use a domain-average prognostic lapse rate (only with ITPROG>0)) (Used only if IDIOPT2 = 0) --------------------------
Depth through which the domain-scale lapse rate is computed (ZUPT) Default: 200. ! ZUPT = 200. ! (Used only if IDIOPT2 = 0) Units: meters --------------------------
Initial Guess Field Winds (IDIOPT3) Default: 0 ! IDIOPT3 = 0 ! 0 = Compute internally from observations or prognostic wind fields 1 = Read hourly preprocessed domain-average wind values from a data file (DIAG.DAT)
Upper air station to use for the initial guess winds (IUPWND) Default: -1 ! IUPWND = -1 ! (Must be a value from -1 to NUSTA, with -1 indicating 3-D initial guess fields, and IUPWND>1 domain-scaled (i.e. constant) IGF) (Used only if IDIOPT3 = 0 and noobs=0) --------------------------------------
Bottom and top of layer through which the domain-scale winds are computed (ZUPWND(1), ZUPWND(2)) Defaults: 1., 1000. ! ZUPWND= 1., 1000. ! (Used only if IDIOPT3 = 0, NOOBS>0 and IUPWND>0) Units: meters --------------------------
Page 11
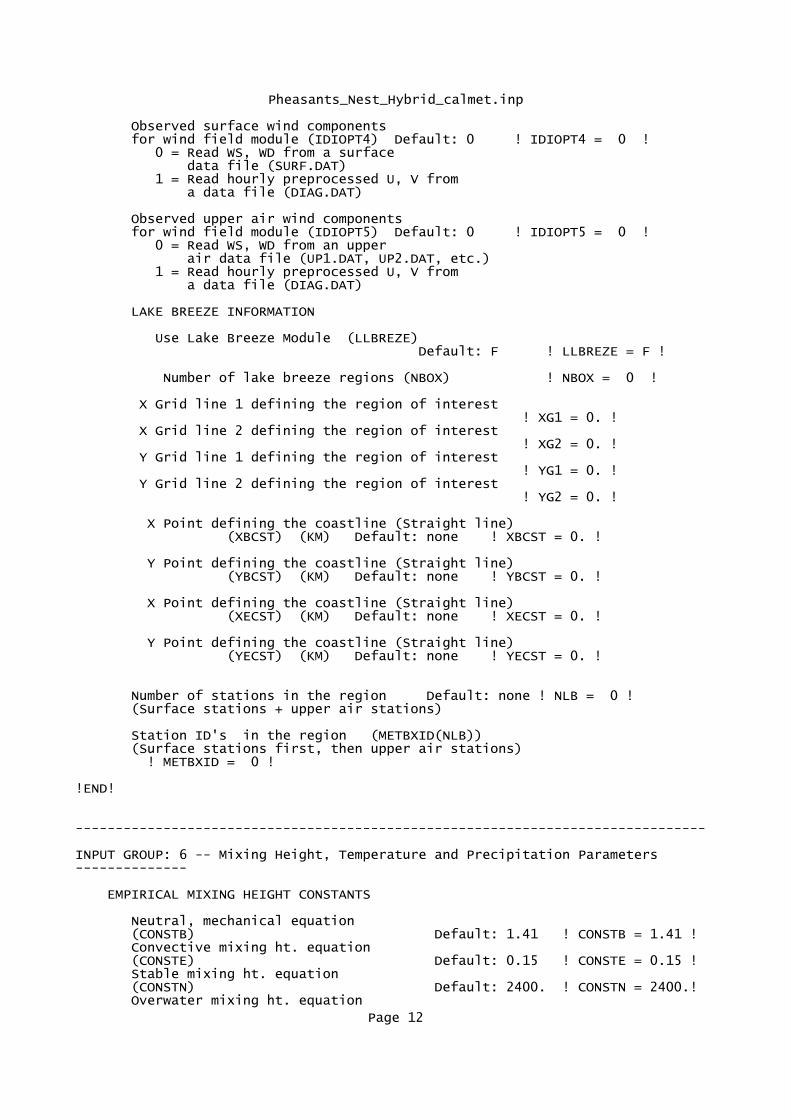
Pheasants_Nest_Hybrid_calmet.inp
Observed surface wind components for wind field module (IDIOPT4) Default: 0 ! IDIOPT4 = 0 ! 0 = Read WS, WD from a surface data file (SURF.DAT) 1 = Read hourly preprocessed U, V from a data file (DIAG.DAT)
Observed upper air wind components for wind field module (IDIOPT5) Default: 0 ! IDIOPT5 = 0 ! 0 = Read WS, WD from an upper air data file (UP1.DAT, UP2.DAT, etc.) 1 = Read hourly preprocessed U, V from a data file (DIAG.DAT)
LAKE BREEZE INFORMATION
Use Lake Breeze Module (LLBREZE) Default: F ! LLBREZE = F !
Number of lake breeze regions (NBOX) ! NBOX = 0 !
X Grid line 1 defining the region of interest ! XG1 = 0. ! X Grid line 2 defining the region of interest ! XG2 = 0. ! Y Grid line 1 defining the region of interest ! YG1 = 0. ! Y Grid line 2 defining the region of interest ! YG2 = 0. !
X Point defining the coastline (Straight line) (XBCST) (KM) Default: none ! XBCST = 0. !
Y Point defining the coastline (Straight line) (YBCST) (KM) Default: none ! YBCST = 0. !
X Point defining the coastline (Straight line) (XECST) (KM) Default: none ! XECST = 0. !
Y Point defining the coastline (Straight line) (YECST) (KM) Default: none ! YECST = 0. !
Number of stations in the region Default: none ! NLB = 0 ! (Surface stations + upper air stations)
Station ID's in the region (METBXID(NLB)) (Surface stations first, then upper air stations) ! METBXID = 0 !
!END!
-------------------------------------------------------------------------------
INPUT GROUP: 6 -- Mixing Height, Temperature and Precipitation Parameters--------------
EMPIRICAL MIXING HEIGHT CONSTANTS
Neutral, mechanical equation (CONSTB) Default: 1.41 ! CONSTB = 1.41 ! Convective mixing ht. equation (CONSTE) Default: 0.15 ! CONSTE = 0.15 ! Stable mixing ht. equation (CONSTN) Default: 2400. ! CONSTN = 2400.! Overwater mixing ht. equation
Page 12
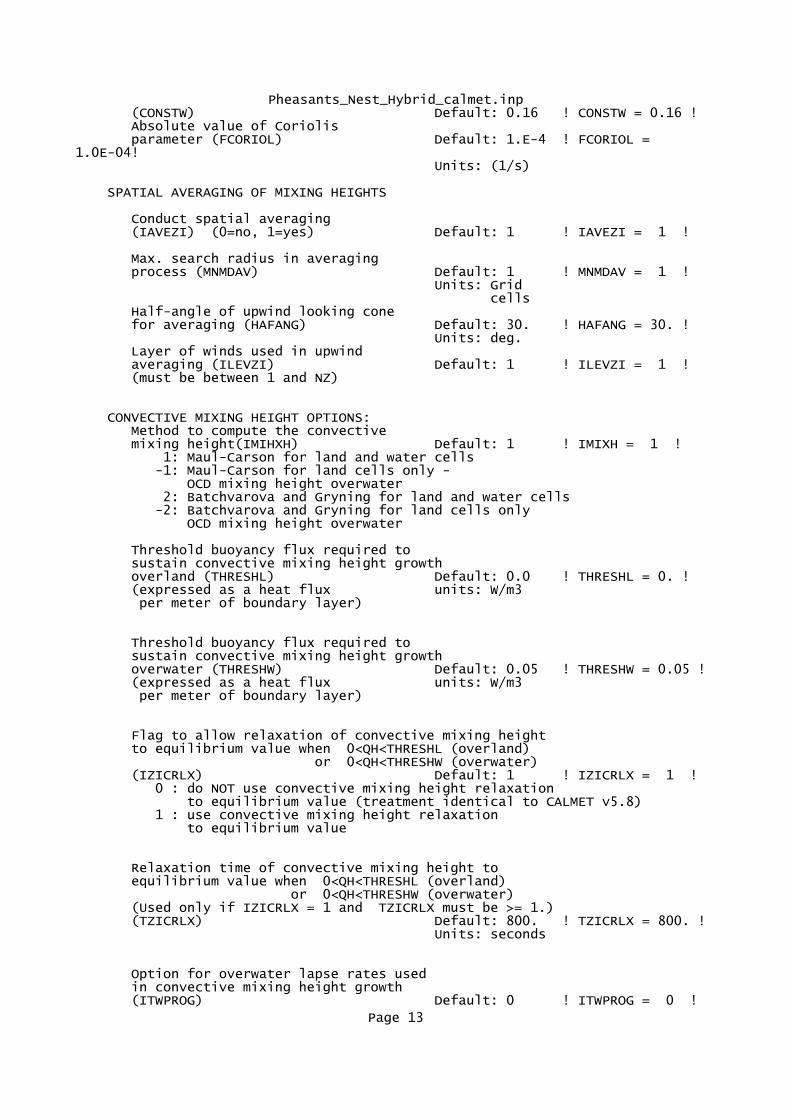
Pheasants_Nest_Hybrid_calmet.inp (CONSTW) Default: 0.16 ! CONSTW = 0.16 ! Absolute value of Coriolis parameter (FCORIOL) Default: 1.E-4 ! FCORIOL = 1.0E-04! Units: (1/s)
SPATIAL AVERAGING OF MIXING HEIGHTS
Conduct spatial averaging (IAVEZI) (0=no, 1=yes) Default: 1 ! IAVEZI = 1 !
Max. search radius in averaging process (MNMDAV) Default: 1 ! MNMDAV = 1 ! Units: Grid cells Half-angle of upwind looking cone for averaging (HAFANG) Default: 30. ! HAFANG = 30. ! Units: deg. Layer of winds used in upwind averaging (ILEVZI) Default: 1 ! ILEVZI = 1 ! (must be between 1 and NZ)
CONVECTIVE MIXING HEIGHT OPTIONS: Method to compute the convective mixing height(IMIHXH) Default: 1 ! IMIXH = 1 ! 1: Maul-Carson for land and water cells -1: Maul-Carson for land cells only - OCD mixing height overwater 2: Batchvarova and Gryning for land and water cells -2: Batchvarova and Gryning for land cells only OCD mixing height overwater
Threshold buoyancy flux required to sustain convective mixing height growth overland (THRESHL) Default: 0.0 ! THRESHL = 0. ! (expressed as a heat flux units: W/m3 per meter of boundary layer)
Threshold buoyancy flux required to sustain convective mixing height growth overwater (THRESHW) Default: 0.05 ! THRESHW = 0.05 ! (expressed as a heat flux units: W/m3 per meter of boundary layer)
Flag to allow relaxation of convective mixing height to equilibrium value when 0<QH<THRESHL (overland) or 0<QH<THRESHW (overwater) (IZICRLX) Default: 1 ! IZICRLX = 1 ! 0 : do NOT use convective mixing height relaxation to equilibrium value (treatment identical to CALMET v5.8) 1 : use convective mixing height relaxation to equilibrium value
Relaxation time of convective mixing height to equilibrium value when 0<QH<THRESHL (overland) or 0<QH<THRESHW (overwater) (Used only if IZICRLX = 1 and TZICRLX must be >= 1.) (TZICRLX) Default: 800. ! TZICRLX = 800. ! Units: seconds
Option for overwater lapse rates used in convective mixing height growth (ITWPROG) Default: 0 ! ITWPROG = 0 !
Page 13
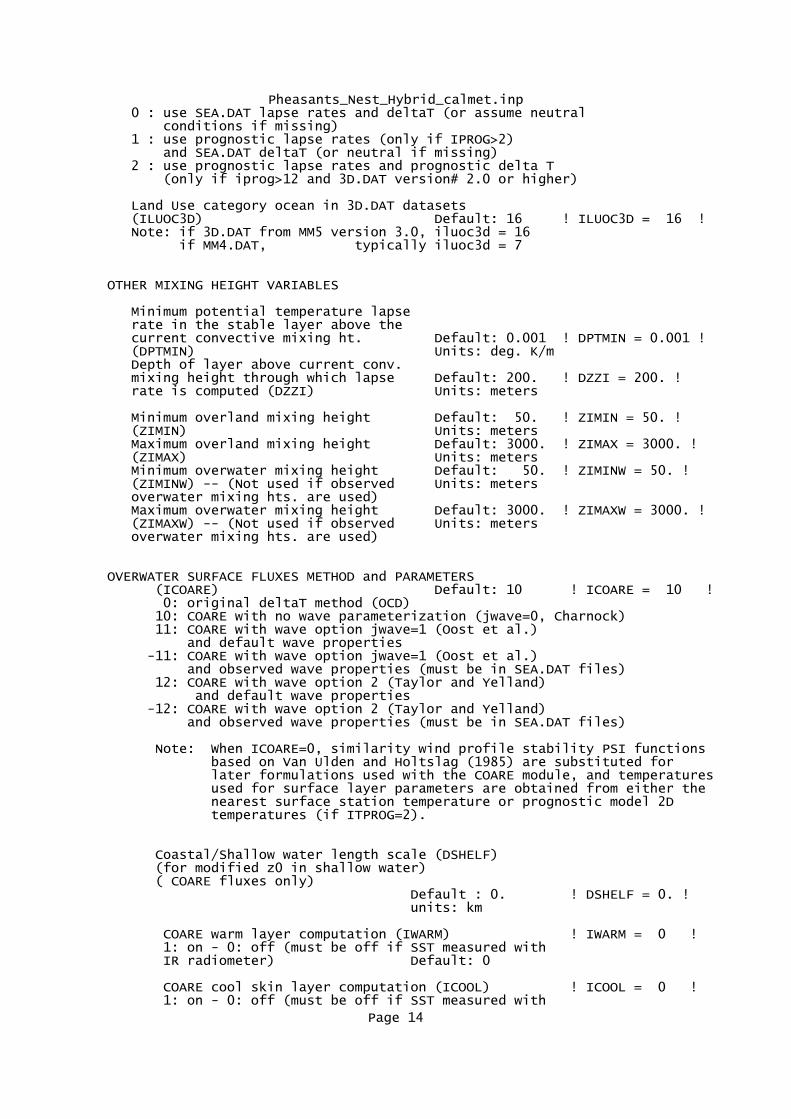
Pheasants_Nest_Hybrid_calmet.inp 0 : use SEA.DAT lapse rates and deltaT (or assume neutral conditions if missing) 1 : use prognostic lapse rates (only if IPROG>2) and SEA.DAT deltaT (or neutral if missing) 2 : use prognostic lapse rates and prognostic delta T (only if iprog>12 and 3D.DAT version# 2.0 or higher)
Land Use category ocean in 3D.DAT datasets (ILUOC3D) Default: 16 ! ILUOC3D = 16 ! Note: if 3D.DAT from MM5 version 3.0, iluoc3d = 16 if MM4.DAT, typically iluoc3d = 7
OTHER MIXING HEIGHT VARIABLES
Minimum potential temperature lapse rate in the stable layer above the current convective mixing ht. Default: 0.001 ! DPTMIN = 0.001 ! (DPTMIN) Units: deg. K/m Depth of layer above current conv. mixing height through which lapse Default: 200. ! DZZI = 200. ! rate is computed (DZZI) Units: meters
Minimum overland mixing height Default: 50. ! ZIMIN = 50. ! (ZIMIN) Units: meters Maximum overland mixing height Default: 3000. ! ZIMAX = 3000. ! (ZIMAX) Units: meters Minimum overwater mixing height Default: 50. ! ZIMINW = 50. ! (ZIMINW) -- (Not used if observed Units: meters overwater mixing hts. are used) Maximum overwater mixing height Default: 3000. ! ZIMAXW = 3000. ! (ZIMAXW) -- (Not used if observed Units: meters overwater mixing hts. are used)
OVERWATER SURFACE FLUXES METHOD and PARAMETERS (ICOARE) Default: 10 ! ICOARE = 10 ! 0: original deltaT method (OCD) 10: COARE with no wave parameterization (jwave=0, Charnock) 11: COARE with wave option jwave=1 (Oost et al.) and default wave properties -11: COARE with wave option jwave=1 (Oost et al.) and observed wave properties (must be in SEA.DAT files) 12: COARE with wave option 2 (Taylor and Yelland) and default wave properties -12: COARE with wave option 2 (Taylor and Yelland) and observed wave properties (must be in SEA.DAT files)
Note: When ICOARE=0, similarity wind profile stability PSI functions based on Van Ulden and Holtslag (1985) are substituted for later formulations used with the COARE module, and temperatures used for surface layer parameters are obtained from either the nearest surface station temperature or prognostic model 2D temperatures (if ITPROG=2).
Coastal/Shallow water length scale (DSHELF) (for modified z0 in shallow water) ( COARE fluxes only) Default : 0. ! DSHELF = 0. ! units: km
COARE warm layer computation (IWARM) ! IWARM = 0 ! 1: on - 0: off (must be off if SST measured with IR radiometer) Default: 0
COARE cool skin layer computation (ICOOL) ! ICOOL = 0 ! 1: on - 0: off (must be off if SST measured with
Page 14
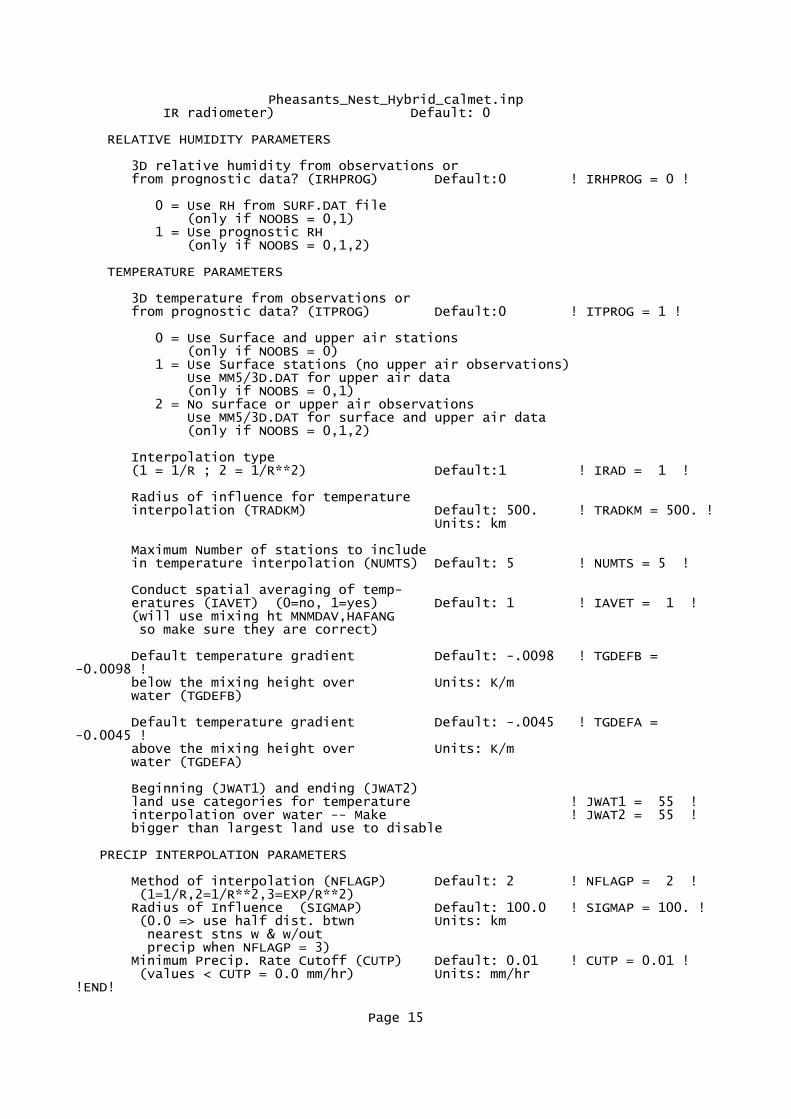
Pheasants_Nest_Hybrid_calmet.inp IR radiometer) Default: 0
RELATIVE HUMIDITY PARAMETERS
3D relative humidity from observations or from prognostic data? (IRHPROG) Default:0 ! IRHPROG = 0 !
0 = Use RH from SURF.DAT file (only if NOOBS = 0,1) 1 = Use prognostic RH (only if NOOBS = 0,1,2)
TEMPERATURE PARAMETERS
3D temperature from observations or from prognostic data? (ITPROG) Default:0 ! ITPROG = 1 !
0 = Use Surface and upper air stations (only if NOOBS = 0) 1 = Use Surface stations (no upper air observations) Use MM5/3D.DAT for upper air data (only if NOOBS = 0,1) 2 = No surface or upper air observations Use MM5/3D.DAT for surface and upper air data (only if NOOBS = 0,1,2)
Interpolation type (1 = 1/R ; 2 = 1/R**2) Default:1 ! IRAD = 1 !
Radius of influence for temperature interpolation (TRADKM) Default: 500. ! TRADKM = 500. ! Units: km
Maximum Number of stations to include in temperature interpolation (NUMTS) Default: 5 ! NUMTS = 5 !
Conduct spatial averaging of temp- eratures (IAVET) (0=no, 1=yes) Default: 1 ! IAVET = 1 ! (will use mixing ht MNMDAV,HAFANG so make sure they are correct)
Default temperature gradient Default: -.0098 ! TGDEFB = -0.0098 ! below the mixing height over Units: K/m water (TGDEFB)
Default temperature gradient Default: -.0045 ! TGDEFA = -0.0045 ! above the mixing height over Units: K/m water (TGDEFA)
Beginning (JWAT1) and ending (JWAT2) land use categories for temperature ! JWAT1 = 55 ! interpolation over water -- Make ! JWAT2 = 55 ! bigger than largest land use to disable
PRECIP INTERPOLATION PARAMETERS
Method of interpolation (NFLAGP) Default: 2 ! NFLAGP = 2 ! (1=1/R,2=1/R**2,3=EXP/R**2) Radius of Influence (SIGMAP) Default: 100.0 ! SIGMAP = 100. ! (0.0 => use half dist. btwn Units: km nearest stns w & w/out precip when NFLAGP = 3) Minimum Precip. Rate Cutoff (CUTP) Default: 0.01 ! CUTP = 0.01 ! (values < CUTP = 0.0 mm/hr) Units: mm/hr!END!
Page 15
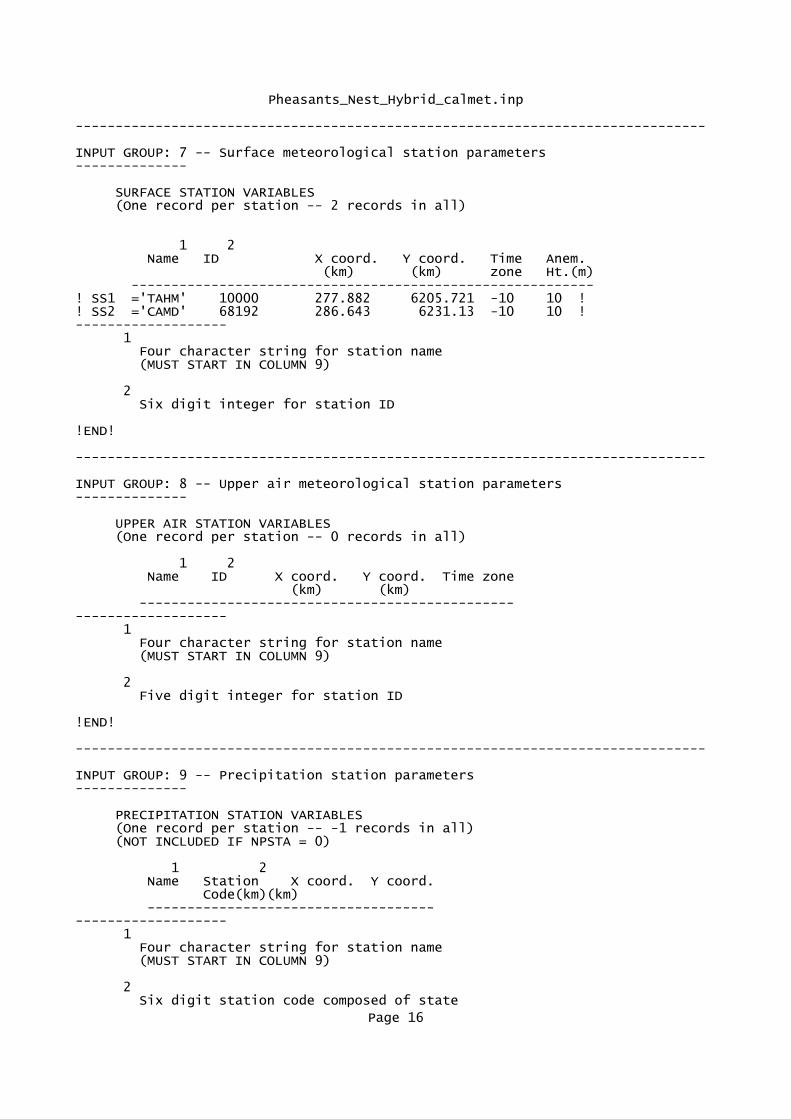
Pheasants_Nest_Hybrid_calmet.inp
-------------------------------------------------------------------------------
INPUT GROUP: 7 -- Surface meteorological station parameters--------------
SURFACE STATION VARIABLES (One record per station -- 2 records in all)
1 2 Name ID X coord. Y coord. Time Anem. (km) (km) zone Ht.(m) ----------------------------------------------------------! SS1 ='TAHM' 10000 277.882 6205.721 -10 10 !! SS2 ='CAMD' 68192 286.643 6231.13 -10 10 !------------------- 1 Four character string for station name (MUST START IN COLUMN 9)
2 Six digit integer for station ID
!END!
-------------------------------------------------------------------------------
INPUT GROUP: 8 -- Upper air meteorological station parameters--------------
UPPER AIR STATION VARIABLES (One record per station -- 0 records in all)
1 2 Name ID X coord. Y coord. Time zone (km) (km) ------------------------------------------------------------------ 1 Four character string for station name (MUST START IN COLUMN 9)
2 Five digit integer for station ID
!END!
-------------------------------------------------------------------------------
INPUT GROUP: 9 -- Precipitation station parameters--------------
PRECIPITATION STATION VARIABLES (One record per station -- -1 records in all) (NOT INCLUDED IF NPSTA = 0)
1 2 Name Station X coord. Y coord. Code(km)(km) ------------------------------------------------------- 1 Four character string for station name (MUST START IN COLUMN 9)
2 Six digit station code composed of state
Page 16

Pheasants_Nest_Hybrid_calmet.inp code (first 2 digits) and station ID (last 4 digits)
!END!
Page 17
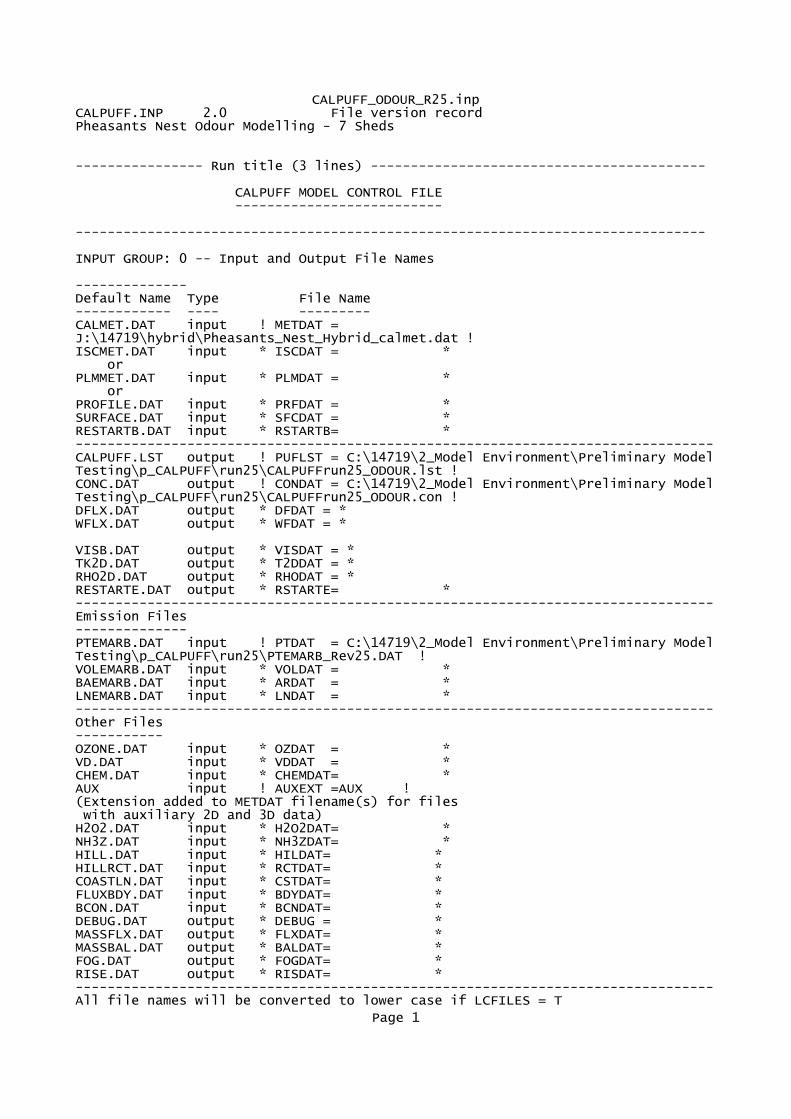
CALPUFF_ODOUR_R25.inpCALPUFF.INP 2.0 File version recordPheasants Nest Odour Modelling - 7 Sheds
---------------- Run title (3 lines) ------------------------------------------
CALPUFF MODEL CONTROL FILE --------------------------
-------------------------------------------------------------------------------
INPUT GROUP: 0 -- Input and Output File Names
--------------Default Name Type File Name------------ ---- ---------CALMET.DAT input ! METDAT = J:\14719\hybrid\Pheasants_Nest_Hybrid_calmet.dat !ISCMET.DAT input * ISCDAT = * orPLMMET.DAT input * PLMDAT = * orPROFILE.DAT input * PRFDAT = *SURFACE.DAT input * SFCDAT = *RESTARTB.DAT input * RSTARTB= *--------------------------------------------------------------------------------CALPUFF.LST output ! PUFLST = C:\14719\2_Model Environment\Preliminary ModelTesting\p_CALPUFF\run25\CALPUFFrun25_ODOUR.lst !CONC.DAT output ! CONDAT = C:\14719\2_Model Environment\Preliminary ModelTesting\p_CALPUFF\run25\CALPUFFrun25_ODOUR.con !DFLX.DAT output * DFDAT = *WFLX.DAT output * WFDAT = *
VISB.DAT output * VISDAT = *TK2D.DAT output * T2DDAT = *RHO2D.DAT output * RHODAT = *RESTARTE.DAT output * RSTARTE= *--------------------------------------------------------------------------------Emission Files--------------PTEMARB.DAT input ! PTDAT = C:\14719\2_Model Environment\Preliminary ModelTesting\p_CALPUFF\run25\PTEMARB_Rev25.DAT !VOLEMARB.DAT input * VOLDAT = *BAEMARB.DAT input * ARDAT = *LNEMARB.DAT input * LNDAT = *--------------------------------------------------------------------------------Other Files-----------OZONE.DAT input * OZDAT = *VD.DAT input * VDDAT = *CHEM.DAT input * CHEMDAT= *AUX input ! AUXEXT =AUX !(Extension added to METDAT filename(s) for files with auxiliary 2D and 3D data)H2O2.DAT input * H2O2DAT= *NH3Z.DAT input * NH3ZDAT= *HILL.DAT input * HILDAT= *HILLRCT.DAT input * RCTDAT= *COASTLN.DAT input * CSTDAT= *FLUXBDY.DAT input * BDYDAT= *BCON.DAT input * BCNDAT= *DEBUG.DAT output * DEBUG = *MASSFLX.DAT output * FLXDAT= *MASSBAL.DAT output * BALDAT= *FOG.DAT output * FOGDAT= *RISE.DAT output * RISDAT= *--------------------------------------------------------------------------------All file names will be converted to lower case if LCFILES = T
Page 1
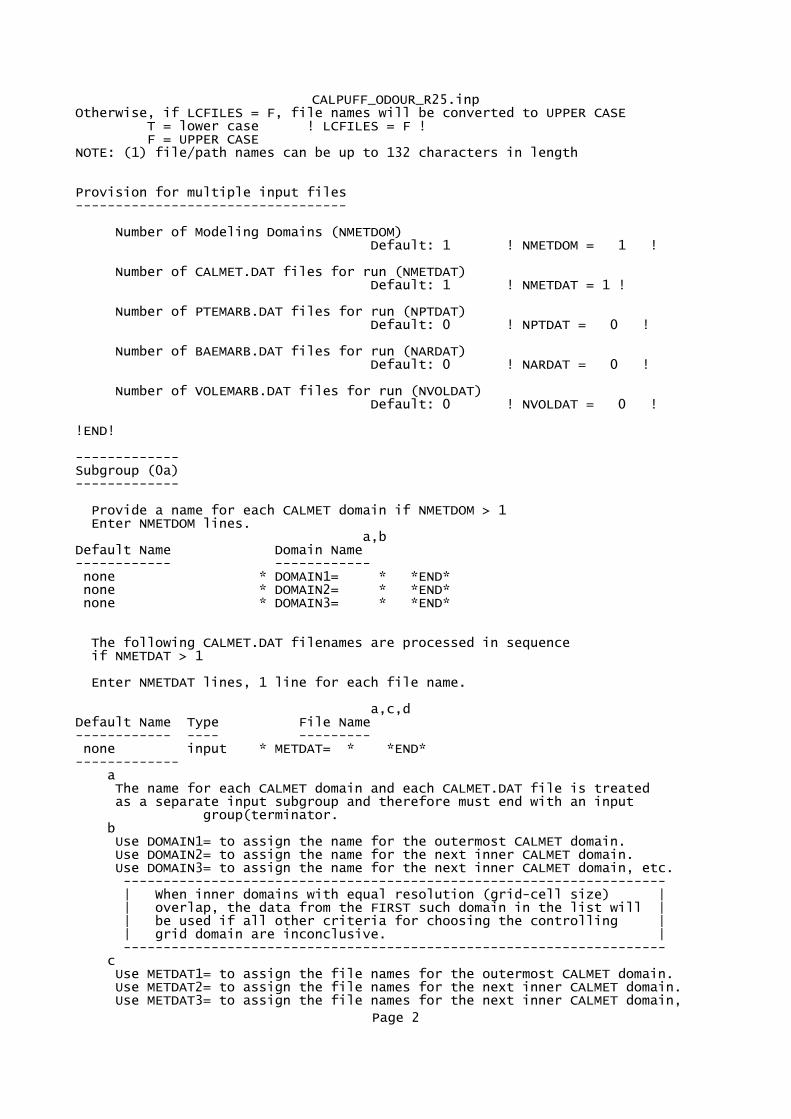
CALPUFF_ODOUR_R25.inpOtherwise, if LCFILES = F, file names will be converted to UPPER CASE T = lower case ! LCFILES = F ! F = UPPER CASENOTE: (1) file/path names can be up to 132 characters in length
Provision for multiple input files----------------------------------
Number of Modeling Domains (NMETDOM) Default: 1 ! NMETDOM = 1 !
Number of CALMET.DAT files for run (NMETDAT) Default: 1 ! NMETDAT = 1 !
Number of PTEMARB.DAT files for run (NPTDAT) Default: 0 ! NPTDAT = 0 !
Number of BAEMARB.DAT files for run (NARDAT) Default: 0 ! NARDAT = 0 !
Number of VOLEMARB.DAT files for run (NVOLDAT) Default: 0 ! NVOLDAT = 0 !
!END!
-------------Subgroup (0a)-------------
Provide a name for each CALMET domain if NMETDOM > 1 Enter NMETDOM lines. a,bDefault Name Domain Name------------ ------------ none * DOMAIN1= * *END* none * DOMAIN2= * *END* none * DOMAIN3= * *END*
The following CALMET.DAT filenames are processed in sequence if NMETDAT > 1
Enter NMETDAT lines, 1 line for each file name.
a,c,dDefault Name Type File Name------------ ---- --------- none input * METDAT= * *END*------------- a The name for each CALMET domain and each CALMET.DAT file is treated as a separate input subgroup and therefore must end with an input group(terminator. b Use DOMAIN1= to assign the name for the outermost CALMET domain. Use DOMAIN2= to assign the name for the next inner CALMET domain. Use DOMAIN3= to assign the name for the next inner CALMET domain, etc. -------------------------------------------------------------------- | When inner domains with equal resolution (grid-cell size) | | overlap, the data from the FIRST such domain in the list will | | be used if all other criteria for choosing the controlling | | grid domain are inconclusive. | -------------------------------------------------------------------- c Use METDAT1= to assign the file names for the outermost CALMET domain. Use METDAT2= to assign the file names for the next inner CALMET domain. Use METDAT3= to assign the file names for the next inner CALMET domain,
Page 2
CALPUFF_ODOUR_R25.inpetc. d The filenames for each domain must be provided in sequential order
-------------Subgroup (0b)-------------
The following PTEMARB.DAT filenames are processed if NPTDAT>0 (Each file contains a subset of the sources, for the entire simulation)
Default Name Type File Name------------ ---- --------- none input * PTDAT= * *END*
-------------Subgroup (0c)-------------
The following BAEMARB.DAT filenames are processed if NARDAT>0 (Each file contains a subset of the sources, for the entire simulation)
Default Name Type File Name------------ ---- --------- none input * ARDAT= * *END*
-------------Subgroup (0d)-------------
The following VOLEMARB.DAT filenames are processed if NVOLDAT>0 (Each file contains a subset of the sources, for the entire simulation)
Default Name Type File Name------------ ---- --------- none input * VOLDAT= * *END*
--------------------------------------------------------------------------------
INPUT GROUP: 1 -- General run control parameters--------------
Option to run all periods found in the met. file (METRUN) Default: 0 ! METRUN = 0 !
METRUN = 0 - Run period explicitly defined below METRUN = 1 - Run all periods in met. file
Starting date: Year (IBYR) -- No default ! IBYR = 2011 ! Month (IBMO) -- No default ! IBMO = 1 ! Day (IBDY) -- No default ! IBDY = 1 ! Starting time: Hour (IBHR) -- No default ! IBHR = 1 ! Minute (IBMIN) -- No default ! IBMIN = 0 ! Second (IBSEC) -- No default ! IBSEC = 0 !
Ending date: Year (IEYR) -- No default ! IEYR = 2012 ! Month (IEMO) -- No default ! IEMO = 1 ! Day (IEDY) -- No default ! IEDY = 1 ! Ending time: Hour (IEHR) -- No default ! IEHR = 0 ! Minute (IEMIN) -- No default ! IEMIN = 0 ! Second (IESEC) -- No default ! IESEC = 0 !
(These are only used if METRUN = 0)
Base time zone: (ABTZ) -- No default ! ABTZ = UTC+1000 !
Page 3
CALPUFF_ODOUR_R25.inp (character*8) The modeling domain may span multiple time zones. ABTZ defines the base time zone used for the entire simulation. This must match the base time zone of the meteorological data. Examples: Los Angeles, USA = UTC-0800 New York, USA = UTC-0500 Santiago, Chile = UTC-0400 Greenwich Mean Time (GMT) = UTC+0000 Rome, Italy = UTC+0100 Cape Town, S.Africa = UTC+0200 Sydney, Australia = UTC+1000
Length of modeling time-step (seconds) Equal to update period in the primary meteorological data files, or an integer fraction of it (1/2, 1/3 ...) Must be no larger than 1 hour (NSECDT) Default:3600 ! NSECDT = 3600 ! Units: seconds
Number of chemical species (NSPEC) Default: 5 ! NSPEC = 1 !
Number of chemical species to be emitted (NSE) Default: 3 ! NSE = 1 !
Flag to stop run after SETUP phase (ITEST) Default: 2 ! ITEST = 2 ! (Used to allow checking of the model inputs, files, etc.) ITEST = 1 - STOPS program after SETUP phase ITEST = 2 - Continues with execution of program after SETUP
Restart Configuration:
Control flag (MRESTART) Default: 0 ! MRESTART = 0 !
0 = Do not read or write a restart file 1 = Read a restart file at the beginning of the run 2 = Write a restart file during run 3 = Read a restart file at beginning of run and write a restart file during run
Number of periods in Restart output cycle (NRESPD) Default: 0 ! NRESPD = 0 !
0 = File written only at last period >0 = File updated every NRESPD periods
Meteorological Data Format (METFM) Default: 1 ! METFM = 1 !
METFM = 1 - CALMET binary file (CALMET.MET) METFM = 2 - ISC ASCII file (ISCMET.MET) METFM = 3 - AUSPLUME ASCII file (PLMMET.MET) METFM = 4 - CTDM plus tower file (PROFILE.DAT) and surface parameters file (SURFACE.DAT) METFM = 5 - AERMET tower file (PROFILE.DAT) and surface parameters file (SURFACE.DAT)
Meteorological Profile Data Format (MPRFFM) (used only for METFM = 1, 2, 3) Default: 1 ! MPRFFM = 1 !
MPRFFM = 1 - CTDM plus tower file (PROFILE.DAT)
Page 4
CALPUFF_ODOUR_R25.inp MPRFFM = 2 - AERMET tower file (PROFILE.DAT)
PG sigma-y is adjusted by the factor (AVET/PGTIME)**0.2 Averaging Time (minutes) (AVET) Default: 60.0 ! AVET = 60. ! PG Averaging Time (minutes) (PGTIME) Default: 60.0 ! PGTIME = 60. !
Output units for binary concentration and flux files written in Dataset v2.2 or later formats (IOUTU) Default: 1 ! IOUTU = 1 ! 1 = mass - g/m3 (conc) or g/m2/s (dep) 2 = odour - odour_units (conc) 3 = radiation - Bq/m3 (conc) or Bq/m2/s (dep)
Output Dataset format for binary concentration and flux files (e.g., CONC.DAT) (IOVERS) Default: 2 ! IOVERS = 2 ! 1 = Dataset Version 2.1 2 = Dataset Version 2.2
!END!
-------------------------------------------------------------------------------
INPUT GROUP: 2 -- Technical options--------------
Vertical distribution used in the near field (MGAUSS) Default: 1 ! MGAUSS = 1 ! 0 = uniform 1 = Gaussian
Terrain adjustment method (MCTADJ) Default: 3 ! MCTADJ = 3 ! 0 = no adjustment 1 = ISC-type of terrain adjustment 2 = simple, CALPUFF-type of terrain adjustment 3 = partial plume path adjustment
Subgrid-scale complex terrain flag (MCTSG) Default: 0 ! MCTSG = 0 ! 0 = not modeled 1 = modeled
Near-field puffs modeled as elongated slugs? (MSLUG) Default: 0 ! MSLUG = 0 ! 0 = no 1 = yes (slug model used)
Transitional plume rise modeled? (MTRANS) Default: 1 ! MTRANS = 1 ! 0 = no (i.e., final rise only) 1 = yes (i.e., transitional rise computed)
Stack tip downwash? (MTIP) Default: 1 ! MTIP = 1 ! 0 = no (i.e., no stack tip downwash) 1 = yes (i.e., use stack tip downwash)
Method used to compute plume rise for point sources not subject to building downwash? (MRISE) Default: 1 ! MRISE = 1 !
Page 5
CALPUFF_ODOUR_R25.inp 1 = Briggs plume rise 2 = Numerical plume rise
Method used to simulate building downwash? (MBDW) Default: 1 ! MBDW = 1 ! 1 = ISC method 2 = PRIME method
Vertical wind shear modeled above stack top (modified Briggs plume rise)? (MSHEAR) Default: 0 ! MSHEAR = 0 ! 0 = no (i.e., vertical wind shear not modeled) 1 = yes (i.e., vertical wind shear modeled)
Puff splitting allowed? (MSPLIT) Default: 0 ! MSPLIT = 0 ! 0 = no (i.e., puffs not split) 1 = yes (i.e., puffs are split)
Chemical mechanism flag (MCHEM) Default: 1 ! MCHEM = 0 ! 0 = chemical transformation not modeled 1 = transformation rates computed internally (MESOPUFF II scheme) 2 = user-specified transformation rates used 3 = transformation rates computed internally (RIVAD/ARM3 scheme) 4 = secondary organic aerosol formation computed (MESOPUFF II scheme for OH) 5 = user-specified half-life with or without transfer to child species 6 = transformation rates computed internally (Updated RIVAD scheme with ISORROPIA equilibrium) 7 = transformation rates computed internally (Updated RIVAD scheme with ISORROPIA equilibrium and CalTech SOA)
Aqueous phase transformation flag (MAQCHEM) (Used only if MCHEM = 6, or 7) Default: 0 ! MAQCHEM = 0 ! 0 = aqueous phase transformation not modeled 1 = transformation rates and wet scavenging coefficients adjusted for in-cloud aqueous phase reactions (adapted from RADM cloud model implementation in CMAQ/SCICHEM)
Liquid Water Content flag (MLWC) (Used only if MAQCHEM = 1) Default: 1 ! MLWC = 1 ! 0 = water content estimated from cloud cover and presence of precipitation 1 = gridded cloud water data read from CALMET water content output files (filenames are the CALMET.DAT names PLUS the extension AUXEXT provided in Input Group 0)
Wet removal modeled ? (MWET) Default: 1 ! MWET = 0 ! 0 = no 1 = yes
Dry deposition modeled ? (MDRY) Default: 1 ! MDRY = 0 ! 0 = no 1 = yes (dry deposition method specified for each species in Input Group 3)
Page 6
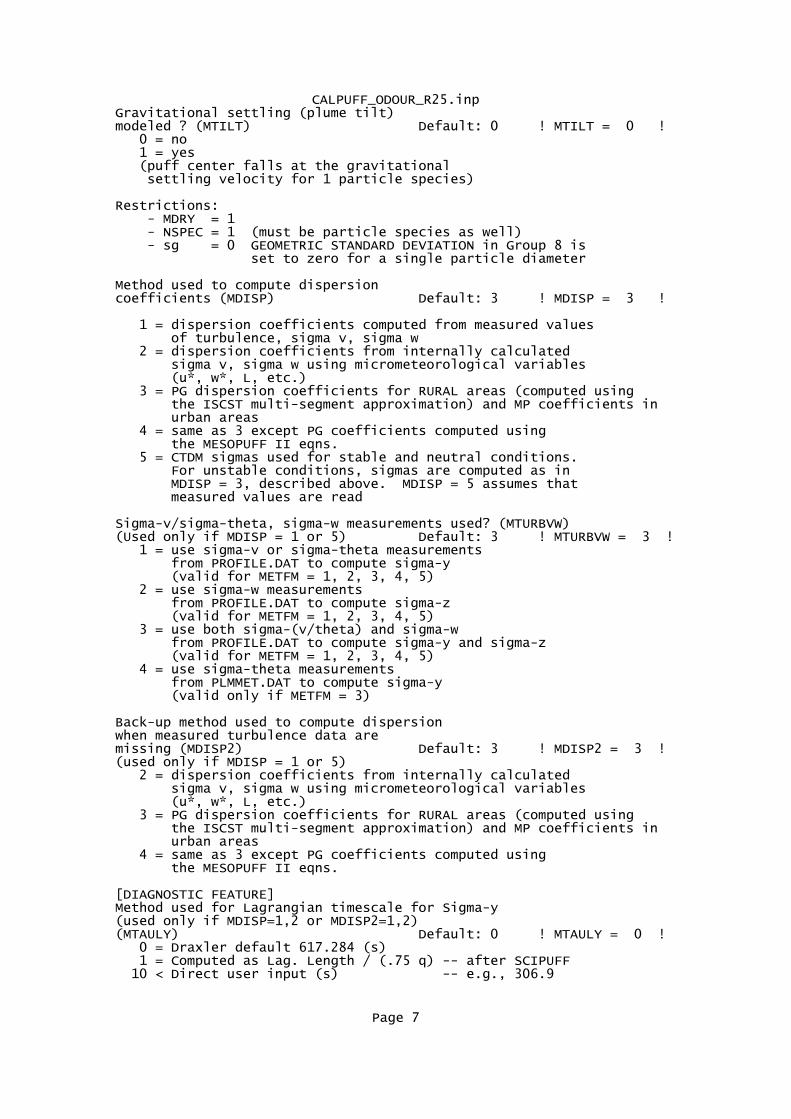
CALPUFF_ODOUR_R25.inp Gravitational settling (plume tilt) modeled ? (MTILT) Default: 0 ! MTILT = 0 ! 0 = no 1 = yes (puff center falls at the gravitational settling velocity for 1 particle species)
Restrictions: - MDRY = 1 - NSPEC = 1 (must be particle species as well) - sg = 0 GEOMETRIC STANDARD DEVIATION in Group 8 is set to zero for a single particle diameter
Method used to compute dispersion coefficients (MDISP) Default: 3 ! MDISP = 3 !
1 = dispersion coefficients computed from measured values of turbulence, sigma v, sigma w 2 = dispersion coefficients from internally calculated sigma v, sigma w using micrometeorological variables (u*, w*, L, etc.) 3 = PG dispersion coefficients for RURAL areas (computed using the ISCST multi-segment approximation) and MP coefficients in urban areas 4 = same as 3 except PG coefficients computed using the MESOPUFF II eqns. 5 = CTDM sigmas used for stable and neutral conditions. For unstable conditions, sigmas are computed as in MDISP = 3, described above. MDISP = 5 assumes that measured values are read
Sigma-v/sigma-theta, sigma-w measurements used? (MTURBVW) (Used only if MDISP = 1 or 5) Default: 3 ! MTURBVW = 3 ! 1 = use sigma-v or sigma-theta measurements from PROFILE.DAT to compute sigma-y (valid for METFM = 1, 2, 3, 4, 5) 2 = use sigma-w measurements from PROFILE.DAT to compute sigma-z (valid for METFM = 1, 2, 3, 4, 5) 3 = use both sigma-(v/theta) and sigma-w from PROFILE.DAT to compute sigma-y and sigma-z (valid for METFM = 1, 2, 3, 4, 5) 4 = use sigma-theta measurements from PLMMET.DAT to compute sigma-y (valid only if METFM = 3)
Back-up method used to compute dispersion when measured turbulence data are missing (MDISP2) Default: 3 ! MDISP2 = 3 ! (used only if MDISP = 1 or 5) 2 = dispersion coefficients from internally calculated sigma v, sigma w using micrometeorological variables (u*, w*, L, etc.) 3 = PG dispersion coefficients for RURAL areas (computed using the ISCST multi-segment approximation) and MP coefficients in urban areas 4 = same as 3 except PG coefficients computed using the MESOPUFF II eqns.
[DIAGNOSTIC FEATURE] Method used for Lagrangian timescale for Sigma-y (used only if MDISP=1,2 or MDISP2=1,2) (MTAULY) Default: 0 ! MTAULY = 0 ! 0 = Draxler default 617.284 (s) 1 = Computed as Lag. Length / (.75 q) -- after SCIPUFF 10 < Direct user input (s) -- e.g., 306.9
Page 7
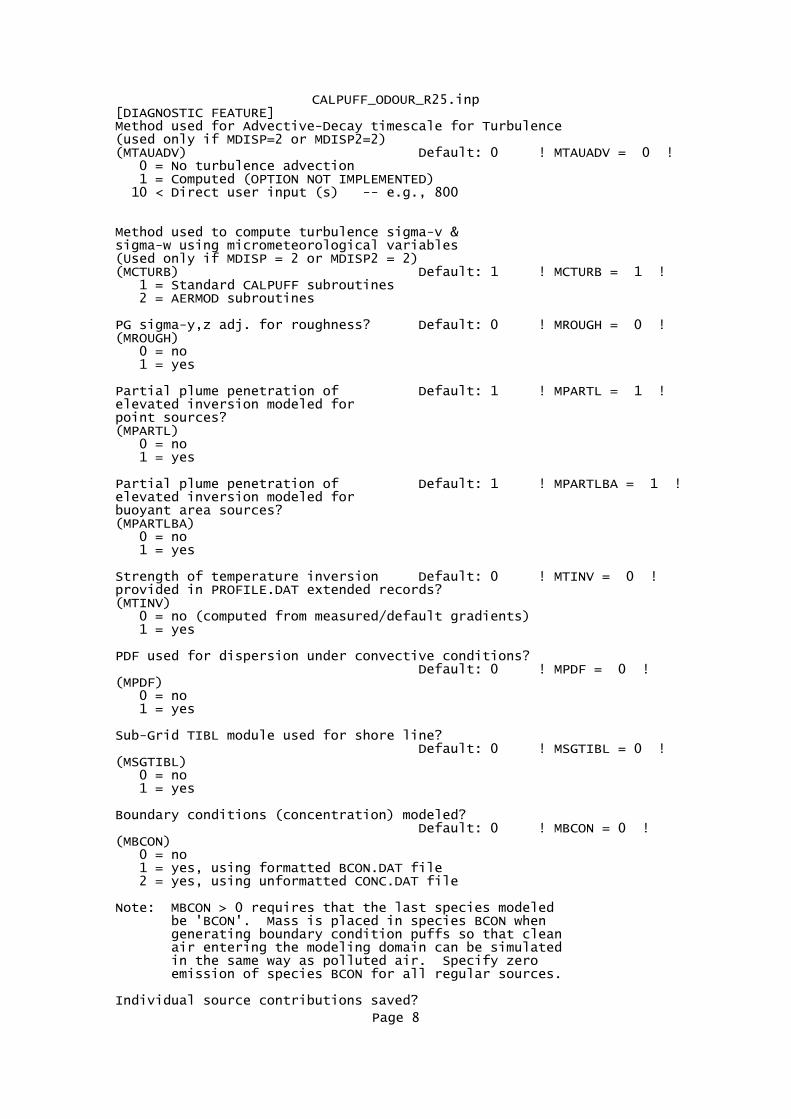
CALPUFF_ODOUR_R25.inp [DIAGNOSTIC FEATURE] Method used for Advective-Decay timescale for Turbulence (used only if MDISP=2 or MDISP2=2) (MTAUADV) Default: 0 ! MTAUADV = 0 ! 0 = No turbulence advection 1 = Computed (OPTION NOT IMPLEMENTED) 10 < Direct user input (s) -- e.g., 800
Method used to compute turbulence sigma-v & sigma-w using micrometeorological variables (Used only if MDISP = 2 or MDISP2 = 2) (MCTURB) Default: 1 ! MCTURB = 1 ! 1 = Standard CALPUFF subroutines 2 = AERMOD subroutines
PG sigma-y,z adj. for roughness? Default: 0 ! MROUGH = 0 ! (MROUGH) 0 = no 1 = yes
Partial plume penetration of Default: 1 ! MPARTL = 1 ! elevated inversion modeled for point sources? (MPARTL) 0 = no 1 = yes
Partial plume penetration of Default: 1 ! MPARTLBA = 1 ! elevated inversion modeled for buoyant area sources? (MPARTLBA) 0 = no 1 = yes
Strength of temperature inversion Default: 0 ! MTINV = 0 ! provided in PROFILE.DAT extended records? (MTINV) 0 = no (computed from measured/default gradients) 1 = yes
PDF used for dispersion under convective conditions? Default: 0 ! MPDF = 0 ! (MPDF) 0 = no 1 = yes
Sub-Grid TIBL module used for shore line? Default: 0 ! MSGTIBL = 0 ! (MSGTIBL) 0 = no 1 = yes
Boundary conditions (concentration) modeled? Default: 0 ! MBCON = 0 ! (MBCON) 0 = no 1 = yes, using formatted BCON.DAT file 2 = yes, using unformatted CONC.DAT file
Note: MBCON > 0 requires that the last species modeled be 'BCON'. Mass is placed in species BCON when generating boundary condition puffs so that clean air entering the modeling domain can be simulated in the same way as polluted air. Specify zero emission of species BCON for all regular sources.
Individual source contributions saved?
Page 8
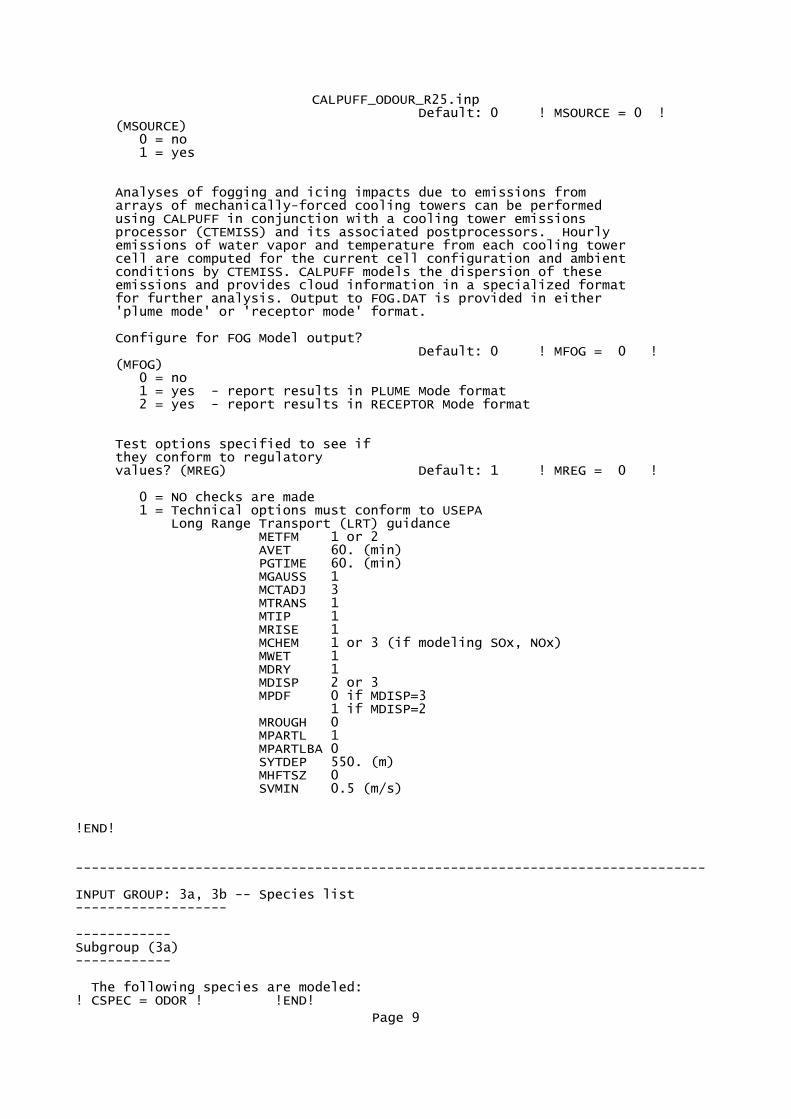
CALPUFF_ODOUR_R25.inp Default: 0 ! MSOURCE = 0 ! (MSOURCE) 0 = no 1 = yes
Analyses of fogging and icing impacts due to emissions from arrays of mechanically-forced cooling towers can be performed using CALPUFF in conjunction with a cooling tower emissions processor (CTEMISS) and its associated postprocessors. Hourly emissions of water vapor and temperature from each cooling tower cell are computed for the current cell configuration and ambient conditions by CTEMISS. CALPUFF models the dispersion of these emissions and provides cloud information in a specialized format for further analysis. Output to FOG.DAT is provided in either 'plume mode' or 'receptor mode' format.
Configure for FOG Model output? Default: 0 ! MFOG = 0 ! (MFOG) 0 = no 1 = yes - report results in PLUME Mode format 2 = yes - report results in RECEPTOR Mode format
Test options specified to see if they conform to regulatory values? (MREG) Default: 1 ! MREG = 0 !
0 = NO checks are made 1 = Technical options must conform to USEPA Long Range Transport (LRT) guidance METFM 1 or 2 AVET 60. (min) PGTIME 60. (min) MGAUSS 1 MCTADJ 3 MTRANS 1 MTIP 1 MRISE 1 MCHEM 1 or 3 (if modeling SOx, NOx) MWET 1 MDRY 1 MDISP 2 or 3 MPDF 0 if MDISP=3 1 if MDISP=2 MROUGH 0 MPARTL 1 MPARTLBA 0 SYTDEP 550. (m) MHFTSZ 0 SVMIN 0.5 (m/s)
!END!
-------------------------------------------------------------------------------
INPUT GROUP: 3a, 3b -- Species list-------------------
------------Subgroup (3a)------------
The following species are modeled:! CSPEC = ODOR ! !END!
Page 9
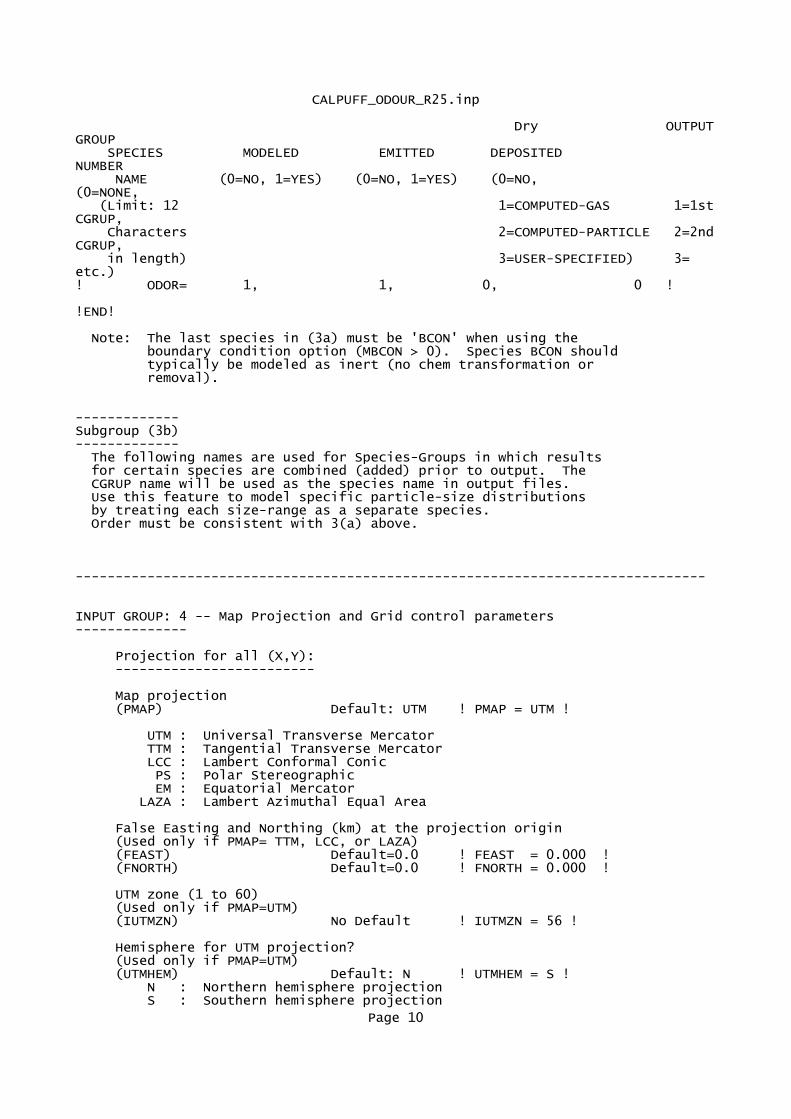
CALPUFF_ODOUR_R25.inp
Dry OUTPUTGROUP SPECIES MODELED EMITTED DEPOSITED NUMBER NAME (0=NO, 1=YES) (0=NO, 1=YES) (0=NO, (0=NONE, (Limit: 12 1=COMPUTED-GAS 1=1stCGRUP, Characters 2=COMPUTED-PARTICLE 2=2ndCGRUP, in length) 3=USER-SPECIFIED) 3= etc.)! ODOR= 1, 1, 0, 0 !
!END!
Note: The last species in (3a) must be 'BCON' when using the boundary condition option (MBCON > 0). Species BCON should typically be modeled as inert (no chem transformation or removal).
-------------Subgroup (3b)------------- The following names are used for Species-Groups in which results for certain species are combined (added) prior to output. The CGRUP name will be used as the species name in output files. Use this feature to model specific particle-size distributions by treating each size-range as a separate species. Order must be consistent with 3(a) above.
-------------------------------------------------------------------------------
INPUT GROUP: 4 -- Map Projection and Grid control parameters--------------
Projection for all (X,Y): -------------------------
Map projection (PMAP) Default: UTM ! PMAP = UTM !
UTM : Universal Transverse Mercator TTM : Tangential Transverse Mercator LCC : Lambert Conformal Conic PS : Polar Stereographic EM : Equatorial Mercator LAZA : Lambert Azimuthal Equal Area
False Easting and Northing (km) at the projection origin (Used only if PMAP= TTM, LCC, or LAZA) (FEAST) Default=0.0 ! FEAST = 0.000 ! (FNORTH) Default=0.0 ! FNORTH = 0.000 !
UTM zone (1 to 60) (Used only if PMAP=UTM) (IUTMZN) No Default ! IUTMZN = 56 !
Hemisphere for UTM projection? (Used only if PMAP=UTM) (UTMHEM) Default: N ! UTMHEM = S ! N : Northern hemisphere projection S : Southern hemisphere projection
Page 10
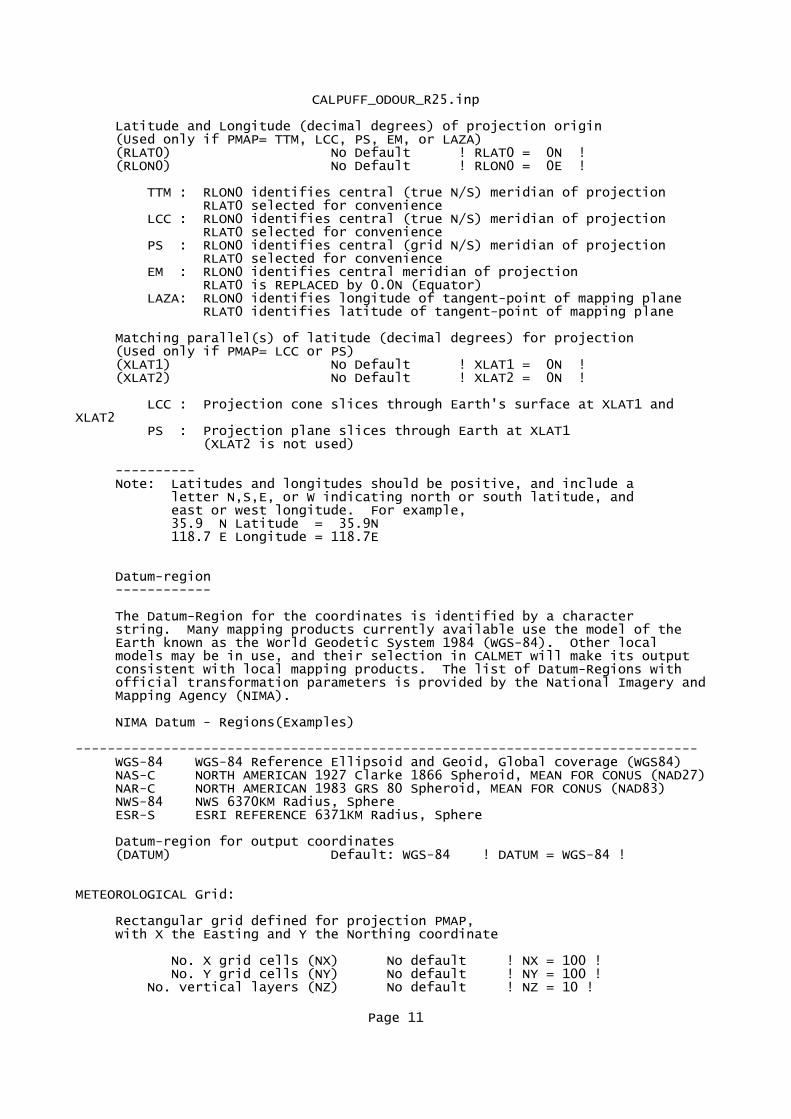
CALPUFF_ODOUR_R25.inp
Latitude and Longitude (decimal degrees) of projection origin (Used only if PMAP= TTM, LCC, PS, EM, or LAZA) (RLAT0) No Default ! RLAT0 = 0N ! (RLON0) No Default ! RLON0 = 0E !
TTM : RLON0 identifies central (true N/S) meridian of projection RLAT0 selected for convenience LCC : RLON0 identifies central (true N/S) meridian of projection RLAT0 selected for convenience PS : RLON0 identifies central (grid N/S) meridian of projection RLAT0 selected for convenience EM : RLON0 identifies central meridian of projection RLAT0 is REPLACED by 0.0N (Equator) LAZA: RLON0 identifies longitude of tangent-point of mapping plane RLAT0 identifies latitude of tangent-point of mapping plane
Matching parallel(s) of latitude (decimal degrees) for projection (Used only if PMAP= LCC or PS) (XLAT1) No Default ! XLAT1 = 0N ! (XLAT2) No Default ! XLAT2 = 0N !
LCC : Projection cone slices through Earth's surface at XLAT1 and XLAT2 PS : Projection plane slices through Earth at XLAT1 (XLAT2 is not used)
---------- Note: Latitudes and longitudes should be positive, and include a letter N,S,E, or W indicating north or south latitude, and east or west longitude. For example, 35.9 N Latitude = 35.9N 118.7 E Longitude = 118.7E
Datum-region ------------
The Datum-Region for the coordinates is identified by a character string. Many mapping products currently available use the model of the Earth known as the World Geodetic System 1984 (WGS-84). Other local models may be in use, and their selection in CALMET will make its output consistent with local mapping products. The list of Datum-Regions with official transformation parameters is provided by the National Imagery and Mapping Agency (NIMA).
NIMA Datum - Regions(Examples) ------------------------------------------------------------------------------ WGS-84 WGS-84 Reference Ellipsoid and Geoid, Global coverage (WGS84) NAS-C NORTH AMERICAN 1927 Clarke 1866 Spheroid, MEAN FOR CONUS (NAD27) NAR-C NORTH AMERICAN 1983 GRS 80 Spheroid, MEAN FOR CONUS (NAD83) NWS-84 NWS 6370KM Radius, Sphere ESR-S ESRI REFERENCE 6371KM Radius, Sphere
Datum-region for output coordinates (DATUM) Default: WGS-84 ! DATUM = WGS-84 !
METEOROLOGICAL Grid:
Rectangular grid defined for projection PMAP, with X the Easting and Y the Northing coordinate
No. X grid cells (NX) No default ! NX = 100 ! No. Y grid cells (NY) No default ! NY = 100 ! No. vertical layers (NZ) No default ! NZ = 10 !
Page 11
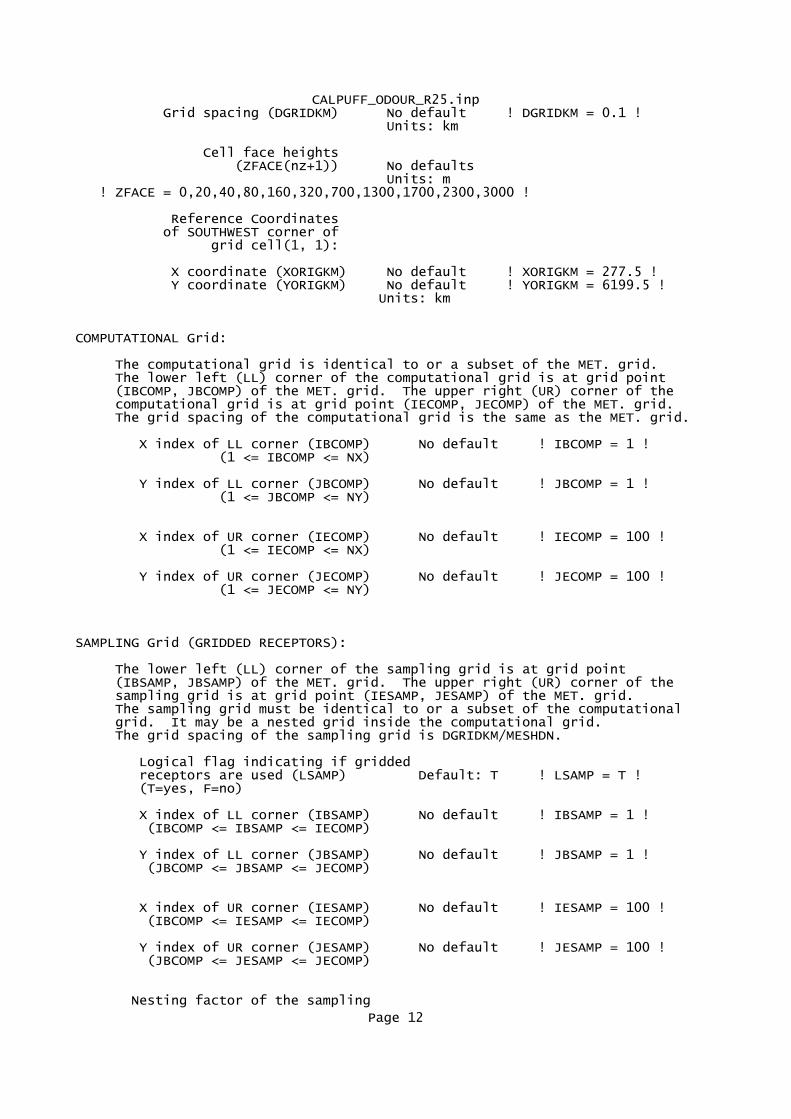
CALPUFF_ODOUR_R25.inp Grid spacing (DGRIDKM) No default ! DGRIDKM = 0.1 ! Units: km
Cell face heights (ZFACE(nz+1)) No defaults Units: m ! ZFACE = 0,20,40,80,160,320,700,1300,1700,2300,3000 !
Reference Coordinates of SOUTHWEST corner of grid cell(1, 1):
X coordinate (XORIGKM) No default ! XORIGKM = 277.5 ! Y coordinate (YORIGKM) No default ! YORIGKM = 6199.5 ! Units: km
COMPUTATIONAL Grid:
The computational grid is identical to or a subset of the MET. grid. The lower left (LL) corner of the computational grid is at grid point (IBCOMP, JBCOMP) of the MET. grid. The upper right (UR) corner of the computational grid is at grid point (IECOMP, JECOMP) of the MET. grid. The grid spacing of the computational grid is the same as the MET. grid.
X index of LL corner (IBCOMP) No default ! IBCOMP = 1 ! (1 <= IBCOMP <= NX)
Y index of LL corner (JBCOMP) No default ! JBCOMP = 1 ! (1 <= JBCOMP <= NY)
X index of UR corner (IECOMP) No default ! IECOMP = 100 ! (1 <= IECOMP <= NX)
Y index of UR corner (JECOMP) No default ! JECOMP = 100 ! (1 <= JECOMP <= NY)
SAMPLING Grid (GRIDDED RECEPTORS):
The lower left (LL) corner of the sampling grid is at grid point (IBSAMP, JBSAMP) of the MET. grid. The upper right (UR) corner of the sampling grid is at grid point (IESAMP, JESAMP) of the MET. grid. The sampling grid must be identical to or a subset of the computational grid. It may be a nested grid inside the computational grid. The grid spacing of the sampling grid is DGRIDKM/MESHDN.
Logical flag indicating if gridded receptors are used (LSAMP) Default: T ! LSAMP = T ! (T=yes, F=no)
X index of LL corner (IBSAMP) No default ! IBSAMP = 1 ! (IBCOMP <= IBSAMP <= IECOMP)
Y index of LL corner (JBSAMP) No default ! JBSAMP = 1 ! (JBCOMP <= JBSAMP <= JECOMP)
X index of UR corner (IESAMP) No default ! IESAMP = 100 ! (IBCOMP <= IESAMP <= IECOMP)
Y index of UR corner (JESAMP) No default ! JESAMP = 100 ! (JBCOMP <= JESAMP <= JECOMP)
Nesting factor of the sampling
Page 12
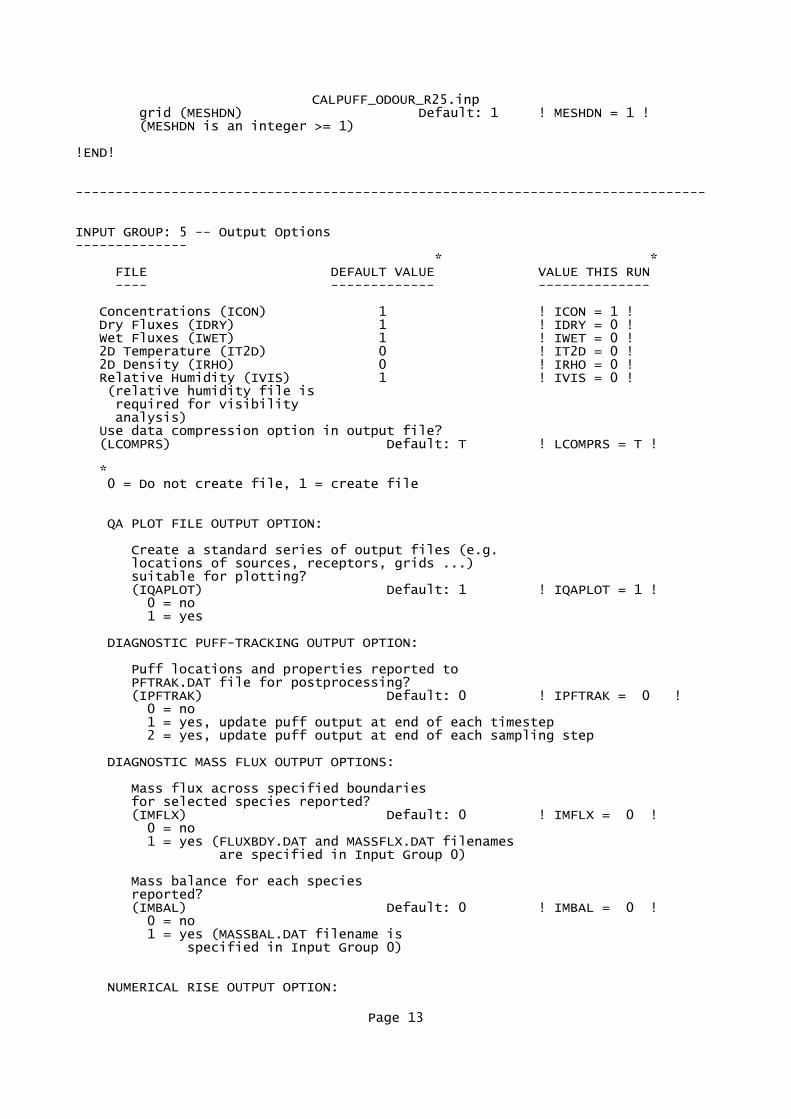
CALPUFF_ODOUR_R25.inp grid (MESHDN) Default: 1 ! MESHDN = 1 ! (MESHDN is an integer >= 1)
!END!
-------------------------------------------------------------------------------
INPUT GROUP: 5 -- Output Options-------------- * * FILE DEFAULT VALUE VALUE THIS RUN ---- ------------- --------------
Concentrations (ICON) 1 ! ICON = 1 ! Dry Fluxes (IDRY) 1 ! IDRY = 0 ! Wet Fluxes (IWET) 1 ! IWET = 0 ! 2D Temperature (IT2D) 0 ! IT2D = 0 ! 2D Density (IRHO) 0 ! IRHO = 0 ! Relative Humidity (IVIS) 1 ! IVIS = 0 ! (relative humidity file is required for visibility analysis) Use data compression option in output file? (LCOMPRS) Default: T ! LCOMPRS = T !
* 0 = Do not create file, 1 = create file
QA PLOT FILE OUTPUT OPTION:
Create a standard series of output files (e.g. locations of sources, receptors, grids ...) suitable for plotting? (IQAPLOT) Default: 1 ! IQAPLOT = 1 ! 0 = no 1 = yes
DIAGNOSTIC PUFF-TRACKING OUTPUT OPTION:
Puff locations and properties reported to PFTRAK.DAT file for postprocessing? (IPFTRAK) Default: 0 ! IPFTRAK = 0 ! 0 = no 1 = yes, update puff output at end of each timestep 2 = yes, update puff output at end of each sampling step
DIAGNOSTIC MASS FLUX OUTPUT OPTIONS:
Mass flux across specified boundaries for selected species reported? (IMFLX) Default: 0 ! IMFLX = 0 ! 0 = no 1 = yes (FLUXBDY.DAT and MASSFLX.DAT filenames are specified in Input Group 0)
Mass balance for each species reported? (IMBAL) Default: 0 ! IMBAL = 0 ! 0 = no 1 = yes (MASSBAL.DAT filename is specified in Input Group 0)
NUMERICAL RISE OUTPUT OPTION:
Page 13
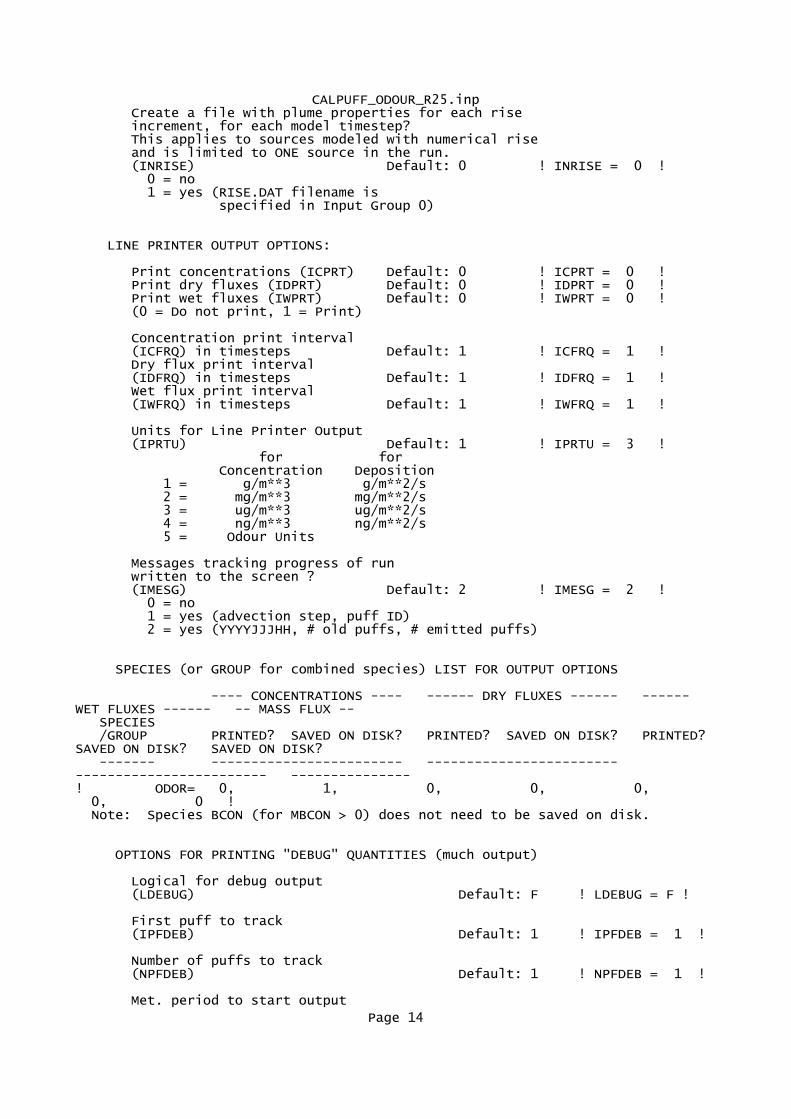
CALPUFF_ODOUR_R25.inp Create a file with plume properties for each rise increment, for each model timestep? This applies to sources modeled with numerical rise and is limited to ONE source in the run. (INRISE) Default: 0 ! INRISE = 0 ! 0 = no 1 = yes (RISE.DAT filename is specified in Input Group 0)
LINE PRINTER OUTPUT OPTIONS:
Print concentrations (ICPRT) Default: 0 ! ICPRT = 0 ! Print dry fluxes (IDPRT) Default: 0 ! IDPRT = 0 ! Print wet fluxes (IWPRT) Default: 0 ! IWPRT = 0 ! (0 = Do not print, 1 = Print)
Concentration print interval (ICFRQ) in timesteps Default: 1 ! ICFRQ = 1 ! Dry flux print interval (IDFRQ) in timesteps Default: 1 ! IDFRQ = 1 ! Wet flux print interval (IWFRQ) in timesteps Default: 1 ! IWFRQ = 1 !
Units for Line Printer Output (IPRTU) Default: 1 ! IPRTU = 3 ! for for Concentration Deposition 1 = g/m**3 g/m**2/s 2 = mg/m**3 mg/m**2/s 3 = ug/m**3 ug/m**2/s 4 = ng/m**3 ng/m**2/s 5 = Odour Units
Messages tracking progress of run written to the screen ? (IMESG) Default: 2 ! IMESG = 2 ! 0 = no 1 = yes (advection step, puff ID) 2 = yes (YYYYJJJHH, # old puffs, # emitted puffs)
SPECIES (or GROUP for combined species) LIST FOR OUTPUT OPTIONS
---- CONCENTRATIONS ---- ------ DRY FLUXES ------ ------ WET FLUXES ------ -- MASS FLUX -- SPECIES /GROUP PRINTED? SAVED ON DISK? PRINTED? SAVED ON DISK? PRINTED? SAVED ON DISK? SAVED ON DISK? ------- ------------------------ ------------------------ ------------------------ ---------------! ODOR= 0, 1, 0, 0, 0, 0, 0 ! Note: Species BCON (for MBCON > 0) does not need to be saved on disk.
OPTIONS FOR PRINTING "DEBUG" QUANTITIES (much output)
Logical for debug output (LDEBUG) Default: F ! LDEBUG = F !
First puff to track (IPFDEB) Default: 1 ! IPFDEB = 1 !
Number of puffs to track (NPFDEB) Default: 1 ! NPFDEB = 1 !
Met. period to start output
Page 14
CALPUFF_ODOUR_R25.inp (NN1) Default: 1 ! NN1 = 1 !
Met. period to end output (NN2) Default: 10 ! NN2 = 10 !
!END!
-------------------------------------------------------------------------------
INPUT GROUP: 6a, 6b, & 6c -- Subgrid scale complex terrain inputs-------------------------
---------------Subgroup (6a)--------------- Number of terrain features (NHILL) Default: 0 ! NHILL = 0 !
Number of special complex terrain receptors (NCTREC) Default: 0 ! NCTREC = 0 !
Terrain and CTSG Receptor data for CTSG hills input in CTDM format ? (MHILL) No Default ! MHILL = 0 ! 1 = Hill and Receptor data created by CTDM processors & read from HILL.DAT and HILLRCT.DAT files 2 = Hill data created by OPTHILL & input below in Subgroup (6b); Receptor data in Subgroup (6c)
Factor to convert horizontal dimensions Default: 1.0 ! XHILL2M = 1.0 ! to meters (MHILL=1)
Factor to convert vertical dimensions Default: 1.0 ! ZHILL2M = 1.0 ! to meters (MHILL=1)
X-origin of CTDM system relative to No Default ! XCTDMKM = 0 ! CALPUFF coordinate system, in Kilometers (MHILL=1)
Y-origin of CTDM system relative to No Default ! YCTDMKM = 0 ! CALPUFF coordinate system, in Kilometers (MHILL=1)
! END !
---------------Subgroup (6b)---------------
1 ** HILL information
HILL XC YC THETAH ZGRID RELIEF EXPO 1 EXPO 2 SCALE 1 SCALE 2 AMAX1 AMAX2 NO. (km) (km) (deg.) (m) (m) (m) (m) (m) (m) (m) (m)---- ---- ---- ------ ----- ------ ------ ------ ------- ------- ----- ----- ---------------Subgroup (6c)---------------
COMPLEX TERRAIN RECEPTOR INFORMATION
XRCT YRCT ZRCT XHH
Page 15
CALPUFF_ODOUR_R25.inp (km) (km) (m) ------ ----- ------ ----
-------------------1 Description of Complex Terrain Variables: XC, YC = Coordinates of center of hill THETAH = Orientation of major axis of hill (clockwise from North) ZGRID = Height of the 0 of the grid above mean sea level RELIEF = Height of the crest of the hill above the grid elevation EXPO 1 = Hill-shape exponent for the major axis EXPO 2 = Hill-shape exponent for the major axis SCALE 1 = Horizontal length scale along the major axis SCALE 2 = Horizontal length scale along the minor axis AMAX = Maximum allowed axis length for the major axis BMAX = Maximum allowed axis length for the major axis
XRCT, YRCT = Coordinates of the complex terrain receptors ZRCT = Height of the ground (MSL) at the complex terrain Receptor XHH = Hill number associated with each complex terrain receptor (NOTE: MUST BE ENTERED AS A REAL NUMBER)
** NOTE: DATA for each hill and CTSG receptor are treated as a separate input subgroup and therefore must end with an input group terminator.
-------------------------------------------------------------------------------
INPUT GROUP: 7 -- Chemical parameters for dry deposition of gases--------------
SPECIES DIFFUSIVITY ALPHA STAR REACTIVITY MESOPHYLL RESISTANCE HENRY'S LAW COEFFICIENT NAME (cm**2/s) (s/cm) (dimensionless) ------- ----------- ---------- ---------- -------------------- -----------------------
!END!
-------------------------------------------------------------------------------
INPUT GROUP: 8 -- Size parameters for dry deposition of particles--------------
For SINGLE SPECIES, the mean and standard deviation are used to compute a deposition velocity for NINT (see group 9) size-ranges, and these are then averaged to obtain a mean deposition velocity.
For GROUPED SPECIES, the size distribution should be explicitly specified (by the 'species' in the group), and the standard deviation for each should be entered as 0. The model will then use the deposition velocity for the stated mean diameter.
SPECIES GEOMETRIC MASS MEAN GEOMETRIC STANDARD NAME DIAMETER DEVIATION (microns) (microns) ------- ------------------- ------------------
Page 16
CALPUFF_ODOUR_R25.inp
!END!
-------------------------------------------------------------------------------
INPUT GROUP: 9 -- Miscellaneous dry deposition parameters--------------
Reference cuticle resistance (s/cm) (RCUTR) Default: 30 ! RCUTR = 30.0 ! Reference ground resistance (s/cm) (RGR) Default: 10 ! RGR = 10.0 ! Reference pollutant reactivity (REACTR) Default: 8 ! REACTR = 8.0 !
Number of particle-size intervals used to evaluate effective particle deposition velocity (NINT) Default: 9 ! NINT = 9 !
Vegetation state in unirrigated areas (IVEG) Default: 1 ! IVEG = 1 ! IVEG=1 for active and unstressed vegetation IVEG=2 for active and stressed vegetation IVEG=3 for inactive vegetation
!END!
-------------------------------------------------------------------------------
INPUT GROUP: 10 -- Wet Deposition Parameters---------------
Scavenging Coefficient -- Units: (sec)**(-1)
Pollutant Liquid Precip. Frozen Precip. --------- -------------- --------------
!END!
-------------------------------------------------------------------------------
INPUT GROUP: 11a, 11b -- Chemistry Parameters---------------------
---------------Subgroup (11a)---------------
Several parameters are needed for one or more of the chemical transformation mechanisms. Those used for each mechanism are: M B A B R R R C B N B V C N N N M K C O D C M G K I I I H H K F V E M K N N N T T T 2 2 P R C C O O H H H E E E O O M A N A Mechanism (MCHEM) Z 3 3 3 3 1 2 3 2 2 F C X Y -------------------- -------------------------------------------- 0 None . . . . . . . . . . . . . .
Page 17
CALPUFF_ODOUR_R25.inp 1 MESOPUFF II X X . . X X X X . . . . . . 2 User Rates . . . . . . . . . . . . . . 3 RIVAD X X . . X . . . . . . . . . 4 SOA X X . . . . . . . . X X X . 5 Radioactive Decay . . . . . . . . . . . . . X 6 RIVAD/ISORRPIA X X X X X X . . X X . . . . 7 RIVAD/ISORRPIA/SOA X X X X X X . . X X X X . .
Ozone data input option (MOZ) Default: 1 ! MOZ = 0 ! (Used only if MCHEM = 1, 3, 4, 6, or 7) 0 = use a monthly background ozone value 1 = read hourly ozone concentrations from the OZONE.DAT data file
Monthly ozone concentrations in ppb (BCKO3) (Used only if MCHEM = 1,3,4,6, or 7 and either MOZ = 0, or MOZ = 1 and all hourly O3 data missing) Default: 12*80. ! BCKO3 = 80.00, 80.00, 80.00, 80.00, 80.00, 80.00, 80.00, 80.00, 80.00, 80.00, 80.00, 80.00 ! Ammonia data option (MNH3) Default: 0 ! MNH3 = 0 ! (Used only if MCHEM = 6 or 7) 0 = use monthly background ammonia values (BCKNH3) - no vertical variation 1 = read monthly background ammonia values for each layer from the NH3Z.DAT data file
Ammonia vertical averaging option (MAVGNH3) (Used only if MCHEM = 6 or 7, and MNH3 = 1) 0 = use NH3 at puff center height (no averaging is done) 1 = average NH3 values over vertical extent of puff Default: 1 ! MAVGNH3 = 1 !
Monthly ammonia concentrations in ppb (BCKNH3) (Used only if MCHEM = 1 or 3, or if MCHEM = 6 or 7, and MNH3 = 0) Default: 12*10. ! BCKNH3 = 10.00, 10.00, 10.00, 10.00, 10.00, 10.00, 10.00, 10.00, 10.00, 10.00, 10.00, 10.00 !
Nighttime SO2 loss rate in %/hour (RNITE1) (Used only if MCHEM = 1, 6 or 7) This rate is used only at night for MCHEM=1 and is added to the computed rate both day and night for MCHEM=6,7 (heterogeneous reactions) Default: 0.2 ! RNITE1 = .2 !
Nighttime NOx loss rate in %/hour (RNITE2) (Used only if MCHEM = 1) Default: 2.0 ! RNITE2 = 2.0 !
Nighttime HNO3 formation rate in %/hour (RNITE3) (Used only if MCHEM = 1) Default: 2.0 ! RNITE3 = 2.0 !
H2O2 data input option (MH2O2) Default: 1 ! MH2O2 = 1 ! (Used only if MCHEM = 6 or 7, and MAQCHEM = 1) 0 = use a monthly background H2O2 value 1 = read hourly H2O2 concentrations from the H2O2.DAT data file
Monthly H2O2 concentrations in ppb (BCKH2O2) (Used only if MQACHEM = 1 and either MH2O2 = 0 or MH2O2 = 1 and all hourly H2O2 data missing)
Page 18
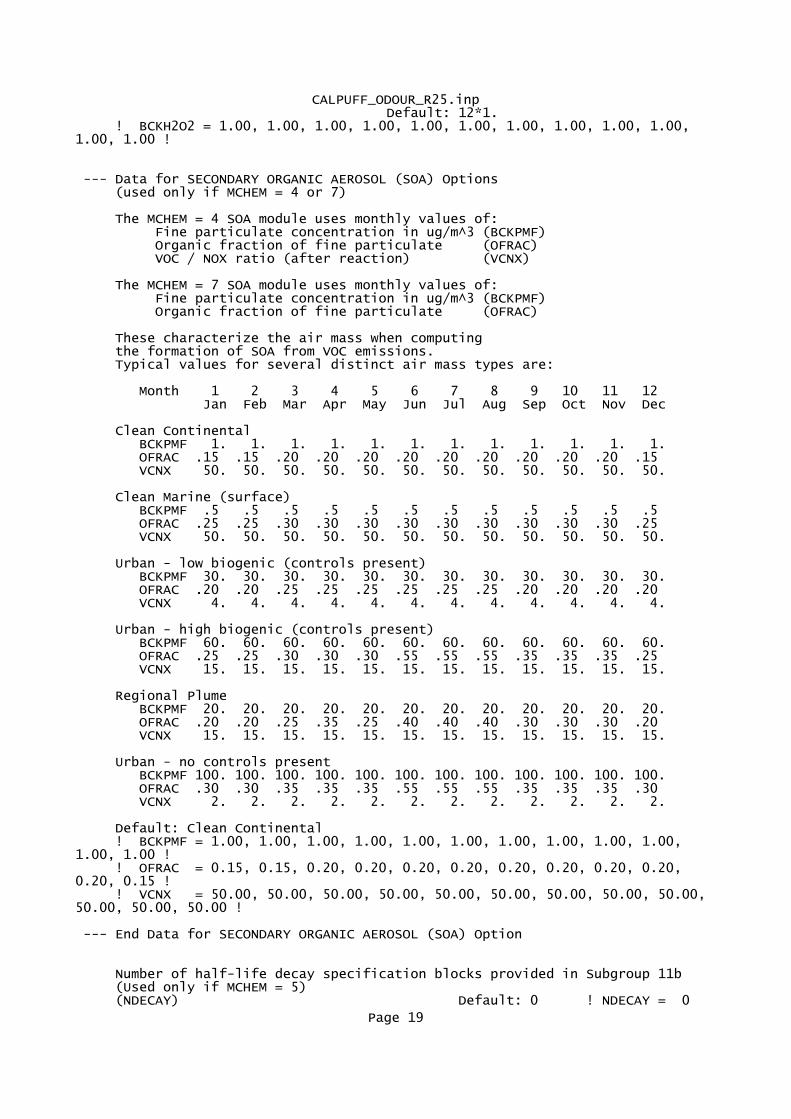
CALPUFF_ODOUR_R25.inp Default: 12*1. ! BCKH2O2 = 1.00, 1.00, 1.00, 1.00, 1.00, 1.00, 1.00, 1.00, 1.00, 1.00, 1.00, 1.00 !
--- Data for SECONDARY ORGANIC AEROSOL (SOA) Options (used only if MCHEM = 4 or 7)
The MCHEM = 4 SOA module uses monthly values of: Fine particulate concentration in ug/m^3 (BCKPMF) Organic fraction of fine particulate (OFRAC) VOC / NOX ratio (after reaction) (VCNX)
The MCHEM = 7 SOA module uses monthly values of: Fine particulate concentration in ug/m^3 (BCKPMF) Organic fraction of fine particulate (OFRAC)
These characterize the air mass when computing the formation of SOA from VOC emissions. Typical values for several distinct air mass types are:
Month 1 2 3 4 5 6 7 8 9 10 11 12 Jan Feb Mar Apr May Jun Jul Aug Sep Oct Nov Dec
Clean Continental BCKPMF 1. 1. 1. 1. 1. 1. 1. 1. 1. 1. 1. 1. OFRAC .15 .15 .20 .20 .20 .20 .20 .20 .20 .20 .20 .15 VCNX 50. 50. 50. 50. 50. 50. 50. 50. 50. 50. 50. 50.
Clean Marine (surface) BCKPMF .5 .5 .5 .5 .5 .5 .5 .5 .5 .5 .5 .5 OFRAC .25 .25 .30 .30 .30 .30 .30 .30 .30 .30 .30 .25 VCNX 50. 50. 50. 50. 50. 50. 50. 50. 50. 50. 50. 50.
Urban - low biogenic (controls present) BCKPMF 30. 30. 30. 30. 30. 30. 30. 30. 30. 30. 30. 30. OFRAC .20 .20 .25 .25 .25 .25 .25 .25 .20 .20 .20 .20 VCNX 4. 4. 4. 4. 4. 4. 4. 4. 4. 4. 4. 4.
Urban - high biogenic (controls present) BCKPMF 60. 60. 60. 60. 60. 60. 60. 60. 60. 60. 60. 60. OFRAC .25 .25 .30 .30 .30 .55 .55 .55 .35 .35 .35 .25 VCNX 15. 15. 15. 15. 15. 15. 15. 15. 15. 15. 15. 15.
Regional Plume BCKPMF 20. 20. 20. 20. 20. 20. 20. 20. 20. 20. 20. 20. OFRAC .20 .20 .25 .35 .25 .40 .40 .40 .30 .30 .30 .20 VCNX 15. 15. 15. 15. 15. 15. 15. 15. 15. 15. 15. 15.
Urban - no controls present BCKPMF 100. 100. 100. 100. 100. 100. 100. 100. 100. 100. 100. 100. OFRAC .30 .30 .35 .35 .35 .55 .55 .55 .35 .35 .35 .30 VCNX 2. 2. 2. 2. 2. 2. 2. 2. 2. 2. 2. 2.
Default: Clean Continental ! BCKPMF = 1.00, 1.00, 1.00, 1.00, 1.00, 1.00, 1.00, 1.00, 1.00, 1.00, 1.00, 1.00 ! ! OFRAC = 0.15, 0.15, 0.20, 0.20, 0.20, 0.20, 0.20, 0.20, 0.20, 0.20, 0.20, 0.15 ! ! VCNX = 50.00, 50.00, 50.00, 50.00, 50.00, 50.00, 50.00, 50.00, 50.00, 50.00, 50.00, 50.00 !
--- End Data for SECONDARY ORGANIC AEROSOL (SOA) Option
Number of half-life decay specification blocks provided in Subgroup 11b (Used only if MCHEM = 5) (NDECAY) Default: 0 ! NDECAY = 0
Page 19
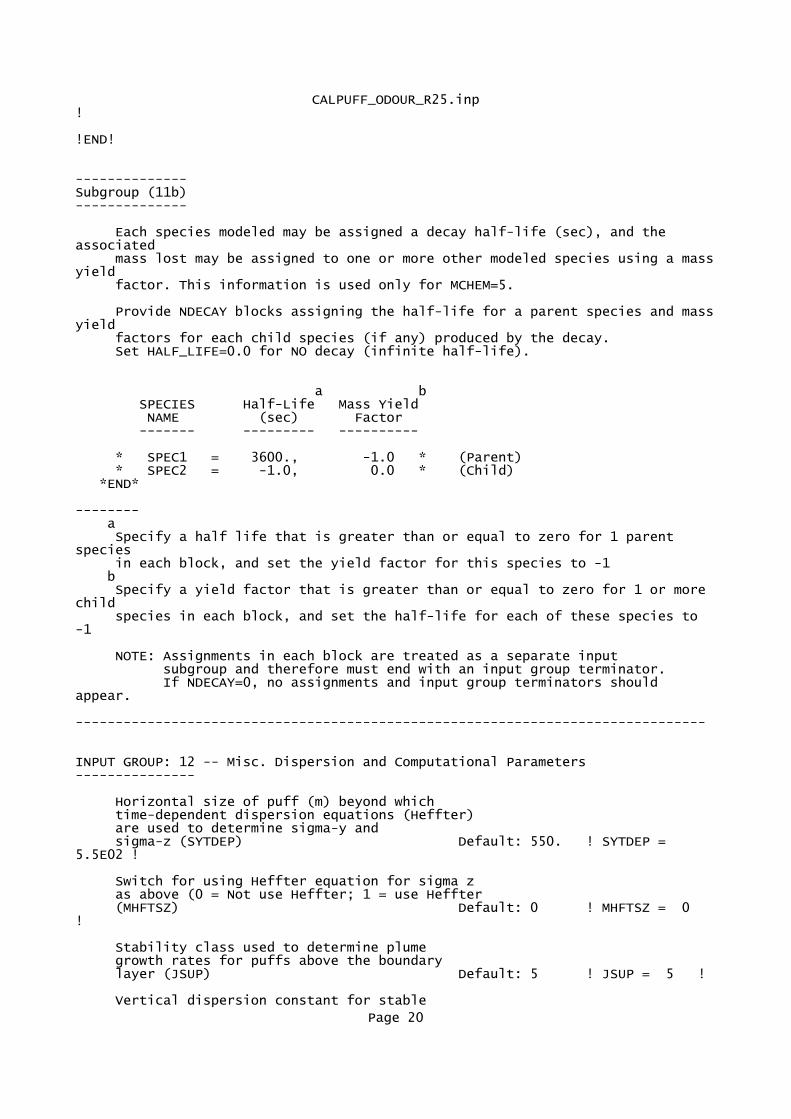
CALPUFF_ODOUR_R25.inp!
!END!
--------------Subgroup (11b)--------------
Each species modeled may be assigned a decay half-life (sec), and the associated mass lost may be assigned to one or more other modeled species using a massyield factor. This information is used only for MCHEM=5.
Provide NDECAY blocks assigning the half-life for a parent species and massyield factors for each child species (if any) produced by the decay. Set HALF_LIFE=0.0 for NO decay (infinite half-life).
a b SPECIES Half-Life Mass Yield NAME (sec) Factor ------- --------- ----------
* SPEC1 = 3600., -1.0 * (Parent) * SPEC2 = -1.0, 0.0 * (Child) *END*
-------- a Specify a half life that is greater than or equal to zero for 1 parent species in each block, and set the yield factor for this species to -1 b Specify a yield factor that is greater than or equal to zero for 1 or more child species in each block, and set the half-life for each of these species to -1
NOTE: Assignments in each block are treated as a separate input subgroup and therefore must end with an input group terminator. If NDECAY=0, no assignments and input group terminators should appear.
-------------------------------------------------------------------------------
INPUT GROUP: 12 -- Misc. Dispersion and Computational Parameters---------------
Horizontal size of puff (m) beyond which time-dependent dispersion equations (Heffter) are used to determine sigma-y and sigma-z (SYTDEP) Default: 550. ! SYTDEP = 5.5E02 !
Switch for using Heffter equation for sigma z as above (0 = Not use Heffter; 1 = use Heffter (MHFTSZ) Default: 0 ! MHFTSZ = 0 !
Stability class used to determine plume growth rates for puffs above the boundary layer (JSUP) Default: 5 ! JSUP = 5 !
Vertical dispersion constant for stable
Page 20
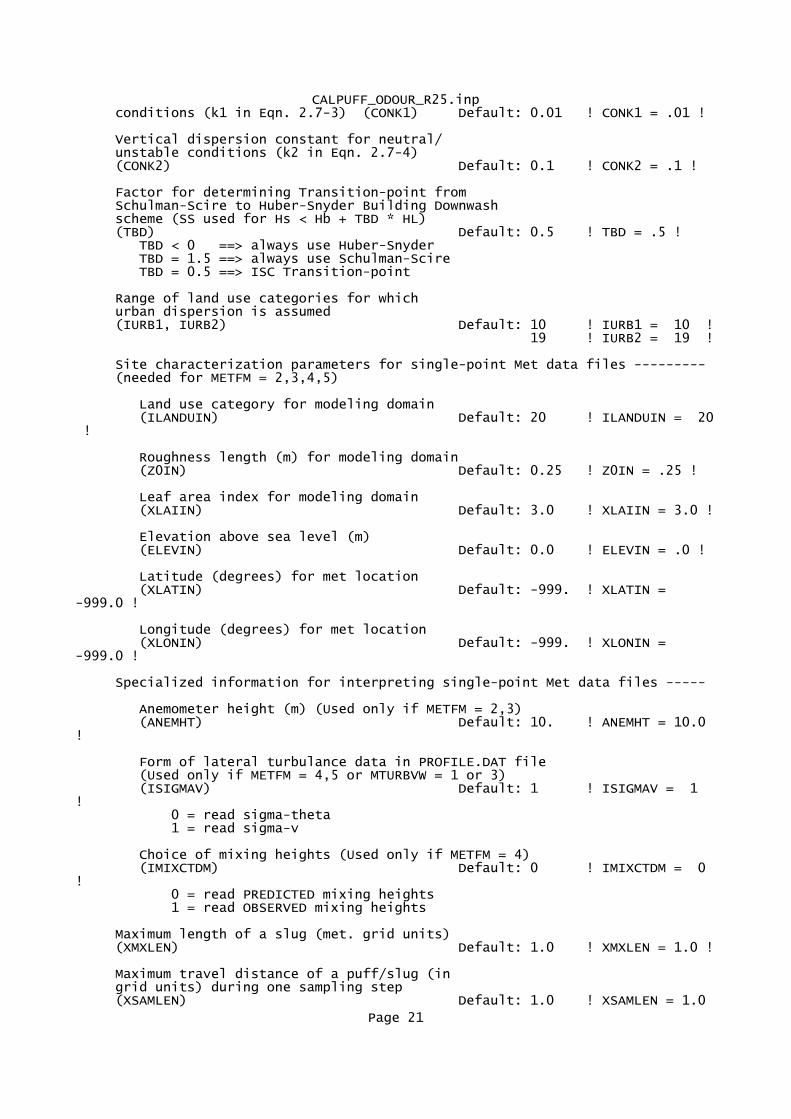
CALPUFF_ODOUR_R25.inp conditions (k1 in Eqn. 2.7-3) (CONK1) Default: 0.01 ! CONK1 = .01 !
Vertical dispersion constant for neutral/ unstable conditions (k2 in Eqn. 2.7-4) (CONK2) Default: 0.1 ! CONK2 = .1 !
Factor for determining Transition-point from Schulman-Scire to Huber-Snyder Building Downwash scheme (SS used for Hs < Hb + TBD * HL) (TBD) Default: 0.5 ! TBD = .5 ! TBD < 0 ==> always use Huber-Snyder TBD = 1.5 ==> always use Schulman-Scire TBD = 0.5 ==> ISC Transition-point
Range of land use categories for which urban dispersion is assumed (IURB1, IURB2) Default: 10 ! IURB1 = 10 ! 19 ! IURB2 = 19 !
Site characterization parameters for single-point Met data files --------- (needed for METFM = 2,3,4,5)
Land use category for modeling domain (ILANDUIN) Default: 20 ! ILANDUIN = 20 !
Roughness length (m) for modeling domain (Z0IN) Default: 0.25 ! Z0IN = .25 !
Leaf area index for modeling domain (XLAIIN) Default: 3.0 ! XLAIIN = 3.0 !
Elevation above sea level (m) (ELEVIN) Default: 0.0 ! ELEVIN = .0 !
Latitude (degrees) for met location (XLATIN) Default: -999. ! XLATIN = -999.0 !
Longitude (degrees) for met location (XLONIN) Default: -999. ! XLONIN = -999.0 !
Specialized information for interpreting single-point Met data files -----
Anemometer height (m) (Used only if METFM = 2,3) (ANEMHT) Default: 10. ! ANEMHT = 10.0 !
Form of lateral turbulance data in PROFILE.DAT file (Used only if METFM = 4,5 or MTURBVW = 1 or 3) (ISIGMAV) Default: 1 ! ISIGMAV = 1 ! 0 = read sigma-theta 1 = read sigma-v
Choice of mixing heights (Used only if METFM = 4) (IMIXCTDM) Default: 0 ! IMIXCTDM = 0 ! 0 = read PREDICTED mixing heights 1 = read OBSERVED mixing heights
Maximum length of a slug (met. grid units) (XMXLEN) Default: 1.0 ! XMXLEN = 1.0 !
Maximum travel distance of a puff/slug (in grid units) during one sampling step (XSAMLEN) Default: 1.0 ! XSAMLEN = 1.0
Page 21
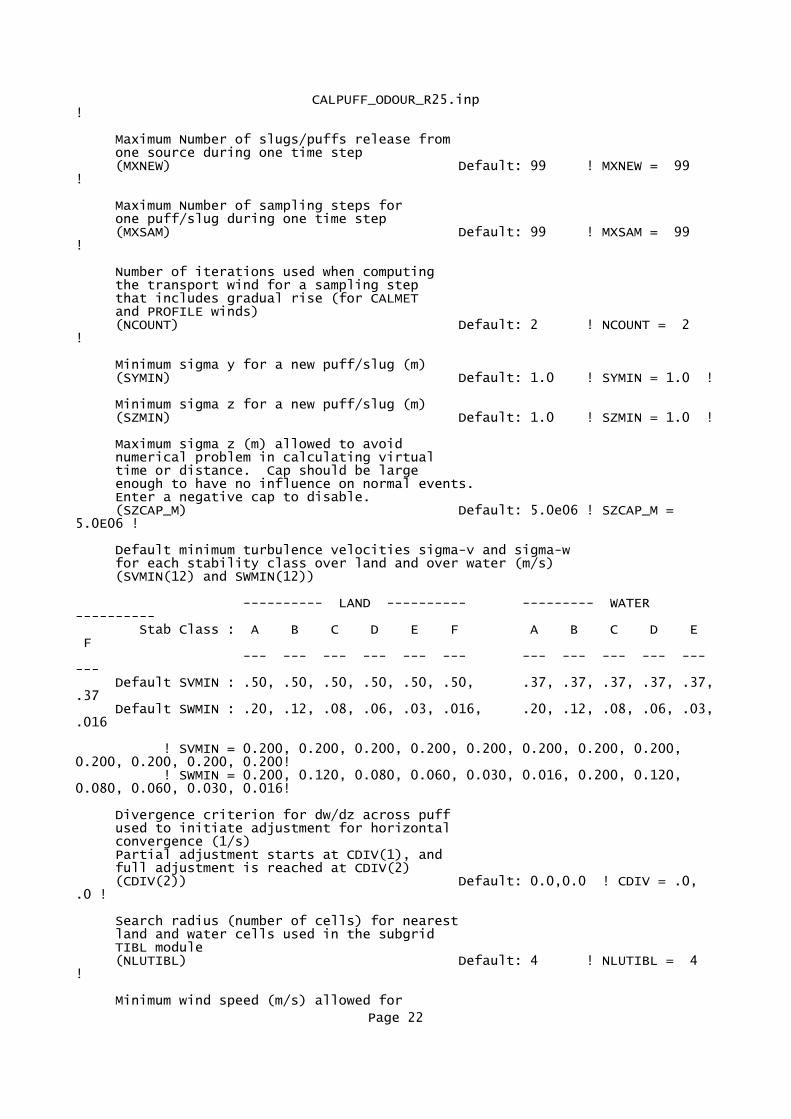
CALPUFF_ODOUR_R25.inp!
Maximum Number of slugs/puffs release from one source during one time step (MXNEW) Default: 99 ! MXNEW = 99 !
Maximum Number of sampling steps for one puff/slug during one time step (MXSAM) Default: 99 ! MXSAM = 99 !
Number of iterations used when computing the transport wind for a sampling step that includes gradual rise (for CALMET and PROFILE winds) (NCOUNT) Default: 2 ! NCOUNT = 2 !
Minimum sigma y for a new puff/slug (m) (SYMIN) Default: 1.0 ! SYMIN = 1.0 !
Minimum sigma z for a new puff/slug (m) (SZMIN) Default: 1.0 ! SZMIN = 1.0 !
Maximum sigma z (m) allowed to avoid numerical problem in calculating virtual time or distance. Cap should be large enough to have no influence on normal events. Enter a negative cap to disable. (SZCAP_M) Default: 5.0e06 ! SZCAP_M = 5.0E06 !
Default minimum turbulence velocities sigma-v and sigma-w for each stability class over land and over water (m/s) (SVMIN(12) and SWMIN(12))
---------- LAND ---------- --------- WATER ---------- Stab Class : A B C D E F A B C D E F --- --- --- --- --- --- --- --- --- --- --- --- Default SVMIN : .50, .50, .50, .50, .50, .50, .37, .37, .37, .37, .37,.37 Default SWMIN : .20, .12, .08, .06, .03, .016, .20, .12, .08, .06, .03,.016
! SVMIN = 0.200, 0.200, 0.200, 0.200, 0.200, 0.200, 0.200, 0.200, 0.200, 0.200, 0.200, 0.200! ! SWMIN = 0.200, 0.120, 0.080, 0.060, 0.030, 0.016, 0.200, 0.120, 0.080, 0.060, 0.030, 0.016!
Divergence criterion for dw/dz across puff used to initiate adjustment for horizontal convergence (1/s) Partial adjustment starts at CDIV(1), and full adjustment is reached at CDIV(2) (CDIV(2)) Default: 0.0,0.0 ! CDIV = .0, .0 !
Search radius (number of cells) for nearest land and water cells used in the subgrid TIBL module (NLUTIBL) Default: 4 ! NLUTIBL = 4 !
Minimum wind speed (m/s) allowed for
Page 22
CALPUFF_ODOUR_R25.inp non-calm conditions. Also used as minimum speed returned when using power-law extrapolation toward surface (WSCALM) Default: 0.5 ! WSCALM = .5 !
Maximum mixing height (m) (XMAXZI) Default: 3000. ! XMAXZI = 3000.0 !
Minimum mixing height (m) (XMINZI) Default: 50. ! XMINZI = 50.0 !
Default wind speed classes -- 5 upper bounds (m/s) are entered; the 6th class has no upper limit (WSCAT(5)) Default : ISC RURAL : 1.54, 3.09, 5.14, 8.23, 10.8 (10.8+)
Wind Speed Class : 1 2 3 4 5 --- --- --- --- --- ! WSCAT = 1.54, 3.09, 5.14, 8.23, 10.80 !
Default wind speed profile power-law exponents for stabilities 1-6 (PLX0(6)) Default : ISC RURAL values ISC RURAL : .07, .07, .10, .15, .35, .55 ISC URBAN : .15, .15, .20, .25, .30, .30
Stability Class : A B C D E F --- --- --- --- --- --- ! PLX0 = 0.07, 0.07, 0.10, 0.15, 0.35, 0.55 !
Default potential temperature gradient for stable classes E, F (degK/m) (PTG0(2)) Default: 0.020, 0.035 ! PTG0 = 0.020, 0.035 !
Default plume path coefficients for each stability class (used when option for partial plume height terrain adjustment is selected -- MCTADJ=3) (PPC(6)) Stability Class : A B C D E F Default PPC : .50, .50, .50, .50, .35, .35 --- --- --- --- --- --- ! PPC = 0.50, 0.50, 0.50, 0.50, 0.35, 0.35 !
Slug-to-puff transition criterion factor equal to sigma-y/length of slug (SL2PF) Default: 10. ! SL2PF = 10.0 !
Puff-splitting control variables ------------------------
VERTICAL SPLIT --------------
Number of puffs that result every time a puff is split - nsplit=2 means that 1 puff splits into 2 (NSPLIT) Default: 3 ! NSPLIT = 3 !
Page 23
CALPUFF_ODOUR_R25.inp
Time(s) of a day when split puffs are eligible to be split once again; this is typically set once per day, around sunset before nocturnal shear develops. 24 values: 0 is midnight (00:00) and 23 is 11 PM (23:00) 0=do not re-split 1=eligible for re-split (IRESPLIT(24)) Default: Hour 17 = 1 ! IRESPLIT = 0,0,0,0,0,0,0,0,0,0,0,0,0,0,0,0,0,1,0,0,0,0,0,0 !
Split is allowed only if last hour's mixing height (m) exceeds a minimum value (ZISPLIT) Default: 100. ! ZISPLIT = 100.0!
Split is allowed only if ratio of last hour's mixing ht to the maximum mixing ht experienced by the puff is less than a maximum value (this postpones a split until a nocturnal layer develops) (ROLDMAX) Default: 0.25 ! ROLDMAX = 0.25 !
HORIZONTAL SPLIT ----------------
Number of puffs that result every time a puff is split - nsplith=5 means that 1 puff splits into 5 (NSPLITH) Default: 5 ! NSPLITH = 5 !
Minimum sigma-y (Grid Cells Units) of puff before it may be split (SYSPLITH) Default: 1.0 ! SYSPLITH = 1.0 !
Minimum puff elongation rate (SYSPLITH/hr) due to wind shear, before it may be split (SHSPLITH) Default: 2. ! SHSPLITH = 2.0 !
Minimum concentration (g/m^3) of each species in puff before it may be split Enter array of NSPEC values; if a single value is entered, it will be used for ALL species (CNSPLITH) Default: 1.0E-07 ! CNSPLITH = 1.0E-07 !
Integration control variables ------------------------
Fractional convergence criterion for numerical SLUG sampling integration (EPSSLUG) Default: 1.0e-04 ! EPSSLUG = 1.0E-04 !
Fractional convergence criterion for numerical AREA source integration (EPSAREA) Default: 1.0e-06 ! EPSAREA = 1.0E-06 !
Trajectory step-length (m) used for numerical rise integration (DSRISE) Default: 1.0 ! DSRISE = 1.0 !
Boundary Condition (BC) Puff control variables ------------------------
Minimum height (m) to which BC puffs are mixed as they are emitted (MBCON=2 ONLY). Actual height is reset to the current mixing height at the release point if greater than this minimum.
Page 24
CALPUFF_ODOUR_R25.inp (HTMINBC) Default: 500. ! HTMINBC = 500.0!
Search radius (km) about a receptor for sampling nearest BC puff. BC puffs are typically emitted with a spacing of one grid cell length, so the search radius should be greater than DGRIDKM. (RSAMPBC) Default: 10. ! RSAMPBC = 10.0 !
Near-Surface depletion adjustment to concentration profile used when sampling BC puffs? (MDEPBC) Default: 1 ! MDEPBC = 1 ! 0 = Concentration is NOT adjusted for depletion 1 = Adjust Concentration for depletion
!END!
-------------------------------------------------------------------------------
INPUT GROUPS: 13a, 13b, 13c, 13d -- Point source parameters--------------------------------
---------------Subgroup (13a)---------------
Number of point sources with parameters provided below (NPT1) No default ! NPT1 = 0 !
Units used for point source emissions below (IPTU) Default: 1 ! IPTU = 1 ! 1 = g/s 2 = kg/hr 3 = lb/hr 4 = tons/yr 5 = Odour Unit * m**3/s (vol. flux of odour compound) 6 = Odour Unit * m**3/min 7 = metric tons/yr 8 = Bq/s (Bq = becquerel = disintegrations/s) 9 = GBq/yr
Number of source-species combinations with variable emissions scaling factors provided below in (13d) (NSPT1) Default: 0 ! NSPT1 = 0 !
Number of point sources with variable emission parameters provided in external file (NPT2) No default ! NPT2 = 70 !
(If NPT2 > 0, these point source emissions are read from the file: PTEMARB.DAT)
!END!
---------------Subgroup (13b)--------------- a POINT SOURCE: CONSTANT DATA ----------------------------- b c Source X Y Stack Base Stack Exit Exit Bldg. Emission
Page 25
CALPUFF_ODOUR_R25.inp No. Coordinate Coordinate Height Elevation Diameter Vel. Temp. Dwash Rates (km) (km) (m) (m) (m) (m/s) (deg. K) ------ ---------- ---------- ------ ------ -------- ----- -------- ----- --------
--------
a Data for each source are treated as a separate input subgroup and therefore must end with an input group terminator.
SRCNAM is a 12-character name for a source (No default) X is an array holding the source data listed by the column headings (No default) SIGYZI is an array holding the initial sigma-y and sigma-z (m) (Default: 0.,0.) FMFAC is a vertical momentum flux factor (0. or 1.0) used to represent the effect of rain-caps or other physical configurations that reduce momentum rise associated with the actual exit velocity. (Default: 1.0 -- full momentum used) ZPLTFM is the platform height (m) for sources influenced by an isolated structure that has a significant open area between the surface and the bulk of the structure, such as an offshore oil platform. The Base Elevation is that of the surface (ground or ocean), and the Stack Height is the release height above the Base (not above the platform). Building heights entered in Subgroup 13c must be those of the buildings on the platform, measured from the platform deck. ZPLTFM is used only with MBDW=1 (ISC downwash method) for sources with building downwash. (Default: 0.0)
b 0. = No building downwash modeled 1. = Downwash modeled for buildings resting on the surface 2. = Downwash modeled for buildings raised above the surface (ZPLTFM > 0.) NOTE: must be entered as a REAL number (i.e., with decimal point)
c An emission rate must be entered for every pollutant modeled. Enter emission rate of zero for secondary pollutants that are modeled, but not emitted. Units are specified by IPTU (e.g. 1 for g/s).
---------------Subgroup (13c)---------------
BUILDING DIMENSION DATA FOR SOURCES SUBJECT TO DOWNWASH -------------------------------------------------------Source a No. Effective building height, width, length and X/Y offset (in meters) every 10 degrees. LENGTH, XBADJ, and YBADJ are only needed for MBDW=2 (PRIME downwash option)------ --------------------------------------------------------------------
--------
a Building height, width, length, and X/Y offset from the source are treated as a separate input subgroup for each source and therefore must end with an input group terminator. The X/Y offset is the position, relative to the stack, of the center of the upwind face of the projected building, with the x-axis pointing along the flow direction.
Page 26

CALPUFF_ODOUR_R25.inp
Page 27

CALPUFF_ODOUR_R25.inp
Page 28
CALPUFF_ODOUR_R25.inp
---------------Subgroup (13d)--------------- a POINT SOURCE: VARIABLE EMISSIONS DATA ---------------------------------------
Use this subgroup to describe temporal variations in the emission rates given in 13b. Factors entered multiply the rates in 13b. Skip sources here that have constant emissions. For more elaborate variation in source parameters, use PTEMARB.DAT and NPT2 > 0.
IVARY determines the type of variation, and is source-specific: (IVARY) Default: 0 0 = Constant 1 = Diurnal cycle (24 scaling factors: hours 1-24) 2 = Monthly cycle (12 scaling factors: months 1-12) 3 = Hour & Season (4 groups of 24 hourly scaling factors, where first group is DEC-JAN-FEB) 4 = Speed & Stab. (6 groups of 6 scaling factors, where first group is Stability Class A, and the speed classes have upper bounds (m/s) defined in Group 12 5 = Temperature (12 scaling factors, where temperature classes have upper bounds (C) of: 0, 5, 10, 15, 20, 25, 30, 35, 40, 45, 50, 50+)
-------- a Data for each species are treated as a separate input subgroup and therefore must end with an input group terminator.
-------------------------------------------------------------------------------
INPUT GROUPS: 14a, 14b, 14c, 14d -- Area source parameters--------------------------------
---------------Subgroup (14a)---------------
Number of polygon area sources with parameters specified below (NAR1) No default ! NAR1 = 0 !
Units used for area source emissions below (IARU) Default: 1 ! IARU = 1 ! 1 = g/m**2/s 2 = kg/m**2/hr 3 = lb/m**2/hr 4 = tons/m**2/yr 5 = Odour Unit * m/s (vol. flux/m**2 of odour compound)
Page 29
CALPUFF_ODOUR_R25.inp 6 = Odour Unit * m/min 7 = metric tons/m**2/yr 8 = Bq/m**2/s (Bq = becquerel = disintegrations/s) 9 = GBq/m**2/yr
Number of source-species combinations with variable emissions scaling factors provided below in (14d) (NSAR1) Default: 0 ! NSAR1 = 0 !
Number of buoyant polygon area sources with variable location and emission parameters (NAR2) No default ! NAR2 = 0 ! (If NAR2 > 0, ALL parameter data for these sources are read from the file: BAEMARB.DAT)
!END!
---------------Subgroup (14b)--------------- a AREA SOURCE: CONSTANT DATA ---------------------------- bSource Effect. Base Initial Emission No. Height Elevation Sigma z Rates (m) (m) (m) ------- ------ ------ -------- ---------
-------- a Data for each source are treated as a separate input subgroup and therefore must end with an input group terminator. b An emission rate must be entered for every pollutant modeled. Enter emission rate of zero for secondary pollutants that are modeled, but not emitted. Units are specified by IARU (e.g. 1 for g/m**2/s).
---------------Subgroup (14c)---------------
COORDINATES (km) FOR EACH VERTEX(4) OF EACH POLYGON --------------------------------------------------------Source a No. Ordered list of X followed by list of Y, grouped by source------ ------------------------------------------------------------
-------- a Data for each source are treated as a separate input subgroup and therefore must end with an input group terminator.
---------------Subgroup (14d)--------------- a AREA SOURCE: VARIABLE EMISSIONS DATA --------------------------------------
Use this subgroup to describe temporal variations in the emission rates given in 14b. Factors entered multiply the rates in 14b. Skip sources here that have constant emissions. For more elaborate variation in source parameters, use BAEMARB.DAT and NAR2 > 0.
Page 30
CALPUFF_ODOUR_R25.inp IVARY determines the type of variation, and is source-specific: (IVARY) Default: 0 0 = Constant 1 = Diurnal cycle (24 scaling factors: hours 1-24) 2 = Monthly cycle (12 scaling factors: months 1-12) 3 = Hour & Season (4 groups of 24 hourly scaling factors, where first group is DEC-JAN-FEB) 4 = Speed & Stab. (6 groups of 6 scaling factors, where first group is Stability Class A, and the speed classes have upper bounds (m/s) defined in Group 12 5 = Temperature (12 scaling factors, where temperature classes have upper bounds (C) of: 0, 5, 10, 15, 20, 25, 30, 35, 40, 45, 50, 50+)
-------- a Data for each species are treated as a separate input subgroup and therefore must end with an input group terminator.
-------------------------------------------------------------------------------
INPUT GROUPS: 15a, 15b, 15c -- Line source parameters---------------------------
---------------Subgroup (15a)---------------
Number of buoyant line sources with variable location and emission parameters (NLN2) No default ! NLN2 = 0 !
(If NLN2 > 0, ALL parameter data for these sources are read from the file: LNEMARB.DAT)
Number of buoyant line sources (NLINES) No default ! NLINES = 0 !
Units used for line source emissions below (ILNU) Default: 1 ! ILNU = 1 ! 1 = g/s 2 = kg/hr 3 = lb/hr 4 = tons/yr 5 = Odour Unit * m**3/s (vol. flux of odour compound) 6 = Odour Unit * m**3/min 7 = metric tons/yr 8 = Bq/s (Bq = becquerel = disintegrations/s) 9 = GBq/yr
Number of source-species combinations with variable emissions scaling factors provided below in (15c) (NSLN1) Default: 0 ! NSLN1 = 0 !
Maximum number of segments used to model each line (MXNSEG) Default: 7 ! MXNSEG = 7 !
The following variables are required only if NLINES > 0. They are used in the buoyant line source plume rise calculations.
Number of distances at which Default: 6 ! NLRISE = 6 ! transitional rise is computed
Page 31
CALPUFF_ODOUR_R25.inp Average building length (XL) No default ! XL = .0 ! (in meters)
Average building height (HBL) No default ! HBL = .0 ! (in meters)
Average building width (WBL) No default ! WBL = .0 ! (in meters)
Average line source width (WML) No default ! WML = .0 ! (in meters)
Average separation between buildings (DXL) No default ! DXL = .0 ! (in meters)
Average buoyancy parameter (FPRIMEL) No default ! FPRIMEL = .0 ! (in m**4/s**3)
!END!
---------------Subgroup (15b)---------------
BUOYANT LINE SOURCE: CONSTANT DATA ---------------------------------- aSource Beg. X Beg. Y End. X End. Y Release Base Emission No. Coordinate Coordinate Coordinate Coordinate Height Elevation Rates (km) (km) (km) (km) (m) (m)
------ ---------- ---------- --------- ---------- ------- --------- ---------
--------
a Data for each source are treated as a separate input subgroup and therefore must end with an input group terminator.
b An emission rate must be entered for every pollutant modeled. Enter emission rate of zero for secondary pollutants that are modeled, but not emitted. Units are specified by ILNTU (e.g. 1 for g/s).
---------------Subgroup (15c)--------------- a BUOYANT LINE SOURCE: VARIABLE EMISSIONS DATA ----------------------------------------------
Use this subgroup to describe temporal variations in the emission rates given in 15b. Factors entered multiply the rates in 15b. Skip sources here that have constant emissions.
IVARY determines the type of variation, and is source-specific: (IVARY) Default: 0 0 = Constant 1 = Diurnal cycle (24 scaling factors: hours 1-24) 2 = Monthly cycle (12 scaling factors: months 1-12) 3 = Hour & Season (4 groups of 24 hourly scaling factors, where first group is DEC-JAN-FEB)
Page 32
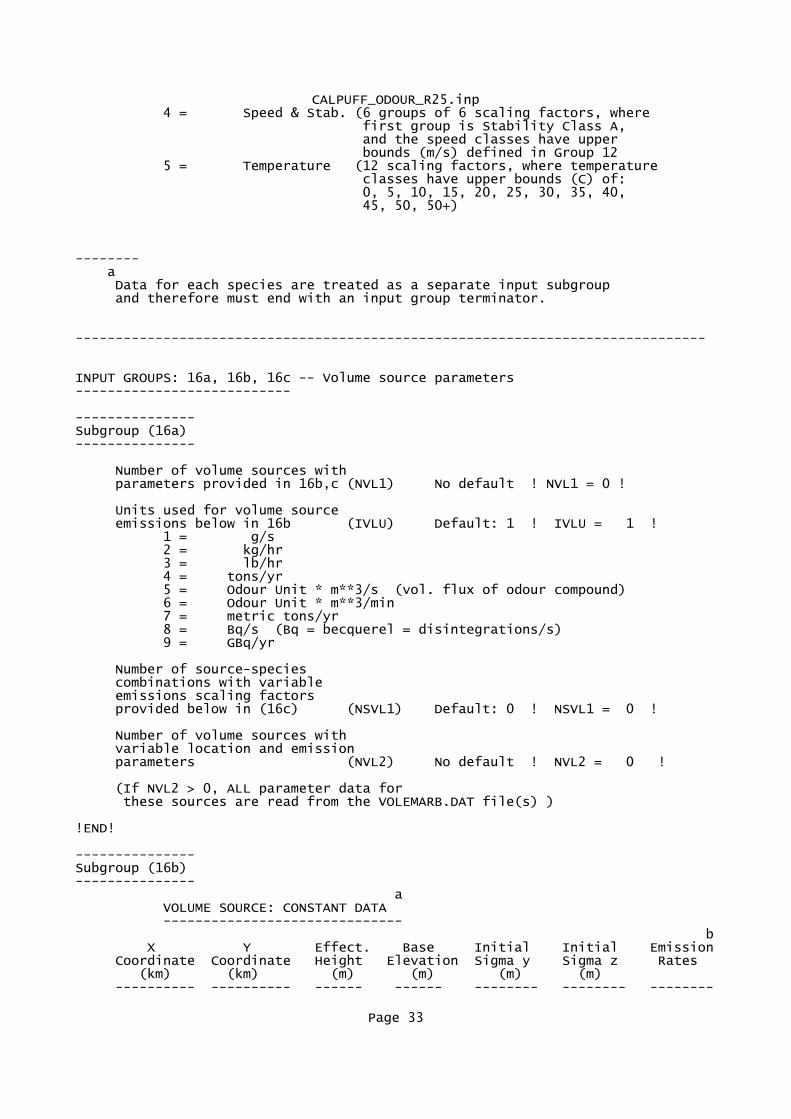
CALPUFF_ODOUR_R25.inp 4 = Speed & Stab. (6 groups of 6 scaling factors, where first group is Stability Class A, and the speed classes have upper bounds (m/s) defined in Group 12 5 = Temperature (12 scaling factors, where temperature classes have upper bounds (C) of: 0, 5, 10, 15, 20, 25, 30, 35, 40, 45, 50, 50+)
-------- a Data for each species are treated as a separate input subgroup and therefore must end with an input group terminator.
-------------------------------------------------------------------------------
INPUT GROUPS: 16a, 16b, 16c -- Volume source parameters---------------------------
---------------Subgroup (16a)---------------
Number of volume sources with parameters provided in 16b,c (NVL1) No default ! NVL1 = 0 !
Units used for volume source emissions below in 16b (IVLU) Default: 1 ! IVLU = 1 ! 1 = g/s 2 = kg/hr 3 = lb/hr 4 = tons/yr 5 = Odour Unit * m**3/s (vol. flux of odour compound) 6 = Odour Unit * m**3/min 7 = metric tons/yr 8 = Bq/s (Bq = becquerel = disintegrations/s) 9 = GBq/yr
Number of source-species combinations with variable emissions scaling factors provided below in (16c) (NSVL1) Default: 0 ! NSVL1 = 0 !
Number of volume sources with variable location and emission parameters (NVL2) No default ! NVL2 = 0 !
(If NVL2 > 0, ALL parameter data for these sources are read from the VOLEMARB.DAT file(s) )
!END!
---------------Subgroup (16b)--------------- a VOLUME SOURCE: CONSTANT DATA ------------------------------ b X Y Effect. Base Initial Initial Emission Coordinate Coordinate Height Elevation Sigma y Sigma z Rates (km) (km) (m) (m) (m) (m) ---------- ---------- ------ ------ -------- -------- --------
Page 33
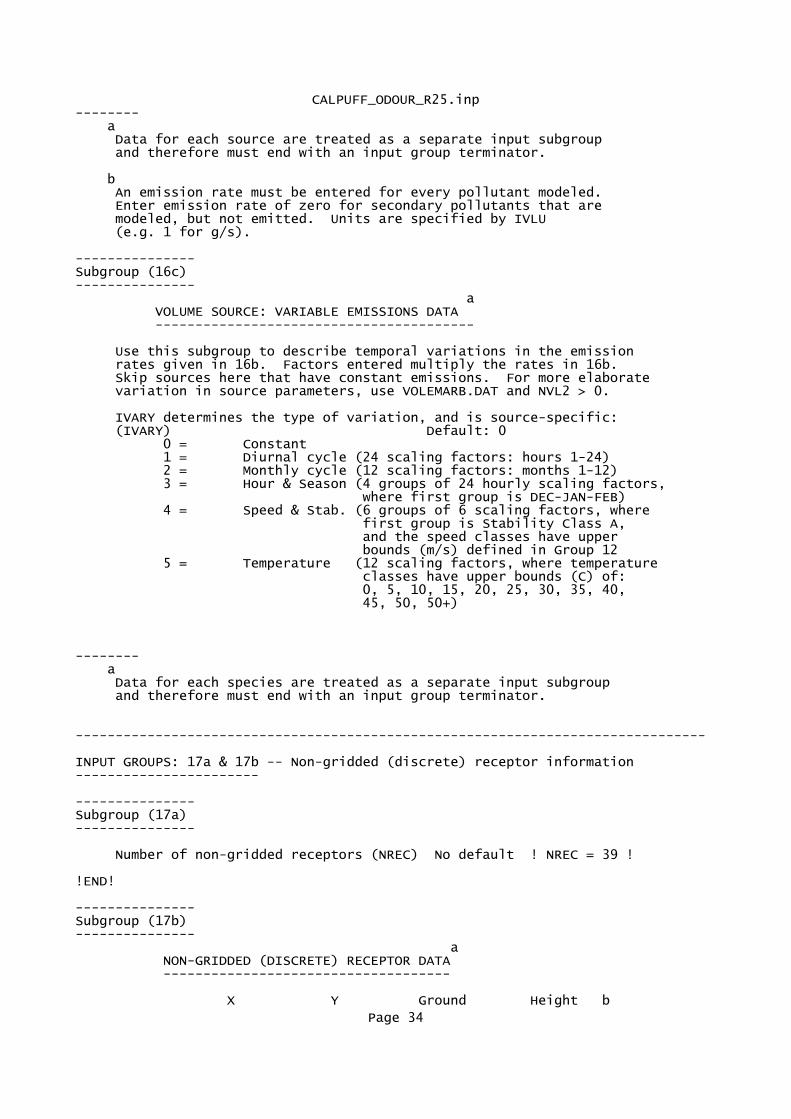
CALPUFF_ODOUR_R25.inp-------- a Data for each source are treated as a separate input subgroup and therefore must end with an input group terminator.
b An emission rate must be entered for every pollutant modeled. Enter emission rate of zero for secondary pollutants that are modeled, but not emitted. Units are specified by IVLU (e.g. 1 for g/s).
---------------Subgroup (16c)--------------- a VOLUME SOURCE: VARIABLE EMISSIONS DATA ----------------------------------------
Use this subgroup to describe temporal variations in the emission rates given in 16b. Factors entered multiply the rates in 16b. Skip sources here that have constant emissions. For more elaborate variation in source parameters, use VOLEMARB.DAT and NVL2 > 0.
IVARY determines the type of variation, and is source-specific: (IVARY) Default: 0 0 = Constant 1 = Diurnal cycle (24 scaling factors: hours 1-24) 2 = Monthly cycle (12 scaling factors: months 1-12) 3 = Hour & Season (4 groups of 24 hourly scaling factors, where first group is DEC-JAN-FEB) 4 = Speed & Stab. (6 groups of 6 scaling factors, where first group is Stability Class A, and the speed classes have upper bounds (m/s) defined in Group 12 5 = Temperature (12 scaling factors, where temperature classes have upper bounds (C) of: 0, 5, 10, 15, 20, 25, 30, 35, 40, 45, 50, 50+)
-------- a Data for each species are treated as a separate input subgroup and therefore must end with an input group terminator.
-------------------------------------------------------------------------------
INPUT GROUPS: 17a & 17b -- Non-gridded (discrete) receptor information-----------------------
---------------Subgroup (17a)---------------
Number of non-gridded receptors (NREC) No default ! NREC = 39 !
!END!
---------------Subgroup (17b)--------------- a NON-GRIDDED (DISCRETE) RECEPTOR DATA ------------------------------------
X Y Ground Height b
Page 34
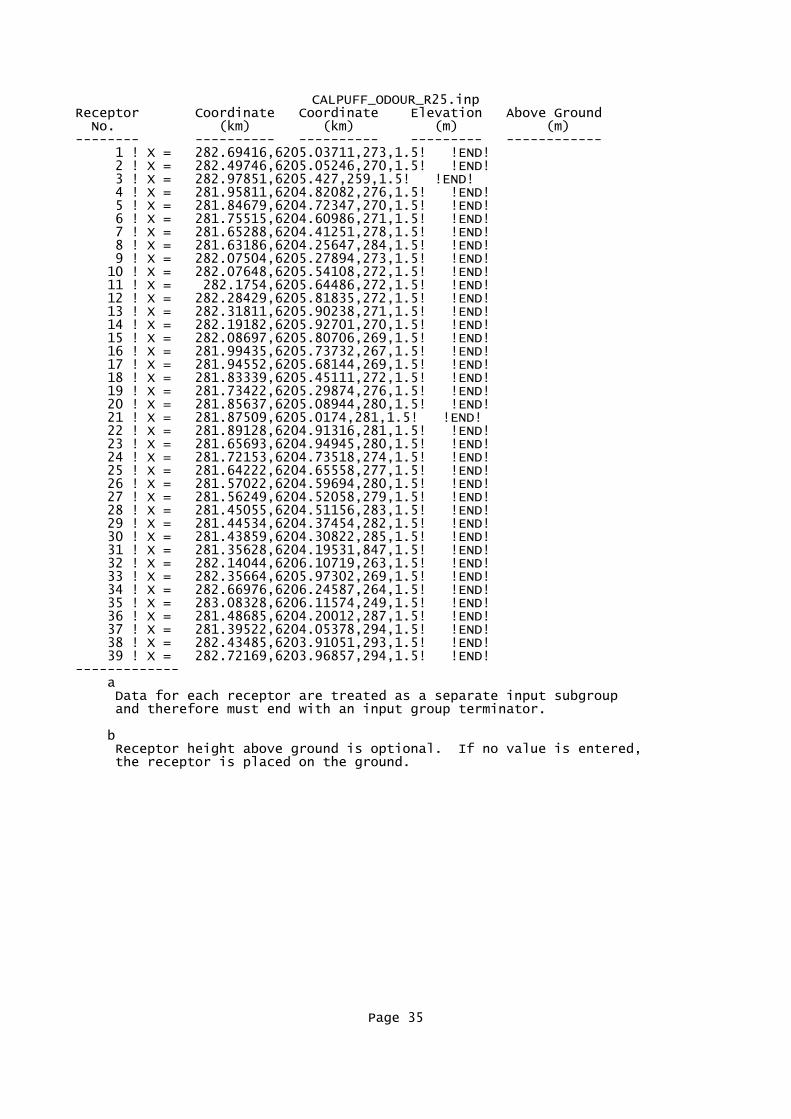
CALPUFF_ODOUR_R25.inpReceptor Coordinate Coordinate Elevation Above Ground No. (km) (km) (m) (m)-------- ---------- ---------- --------- ------------ 1 ! X = 282.69416,6205.03711,273,1.5! !END! 2 ! X = 282.49746,6205.05246,270,1.5! !END! 3 ! X = 282.97851,6205.427,259,1.5! !END! 4 ! X = 281.95811,6204.82082,276,1.5! !END! 5 ! X = 281.84679,6204.72347,270,1.5! !END! 6 ! X = 281.75515,6204.60986,271,1.5! !END! 7 ! X = 281.65288,6204.41251,278,1.5! !END! 8 ! X = 281.63186,6204.25647,284,1.5! !END! 9 ! X = 282.07504,6205.27894,273,1.5! !END! 10 ! X = 282.07648,6205.54108,272,1.5! !END! 11 ! X = 282.1754,6205.64486,272,1.5! !END! 12 ! X = 282.28429,6205.81835,272,1.5! !END! 13 ! X = 282.31811,6205.90238,271,1.5! !END! 14 ! X = 282.19182,6205.92701,270,1.5! !END! 15 ! X = 282.08697,6205.80706,269,1.5! !END! 16 ! X = 281.99435,6205.73732,267,1.5! !END! 17 ! X = 281.94552,6205.68144,269,1.5! !END! 18 ! X = 281.83339,6205.45111,272,1.5! !END! 19 ! X = 281.73422,6205.29874,276,1.5! !END! 20 ! X = 281.85637,6205.08944,280,1.5! !END! 21 ! X = 281.87509,6205.0174,281,1.5! !END! 22 ! X = 281.89128,6204.91316,281,1.5! !END! 23 ! X = 281.65693,6204.94945,280,1.5! !END! 24 ! X = 281.72153,6204.73518,274,1.5! !END! 25 ! X = 281.64222,6204.65558,277,1.5! !END! 26 ! X = 281.57022,6204.59694,280,1.5! !END! 27 ! X = 281.56249,6204.52058,279,1.5! !END! 28 ! X = 281.45055,6204.51156,283,1.5! !END! 29 ! X = 281.44534,6204.37454,282,1.5! !END! 30 ! X = 281.43859,6204.30822,285,1.5! !END! 31 ! X = 281.35628,6204.19531,847,1.5! !END! 32 ! X = 282.14044,6206.10719,263,1.5! !END! 33 ! X = 282.35664,6205.97302,269,1.5! !END! 34 ! X = 282.66976,6206.24587,264,1.5! !END! 35 ! X = 283.08328,6206.11574,249,1.5! !END! 36 ! X = 281.48685,6204.20012,287,1.5! !END! 37 ! X = 281.39522,6204.05378,294,1.5! !END! 38 ! X = 282.43485,6203.91051,293,1.5! !END! 39 ! X = 282.72169,6203.96857,294,1.5! !END!------------- a Data for each receptor are treated as a separate input subgroup and therefore must end with an input group terminator.
b Receptor height above ground is optional. If no value is entered, the receptor is placed on the ground.
Page 35

Appendix I I
2 4 Ho ur A ver ag e PM 1 0 – Lev e l 2 Co n t emp or an eo us I mp ac t a nd
B a ck gro un d A ss essme nt s
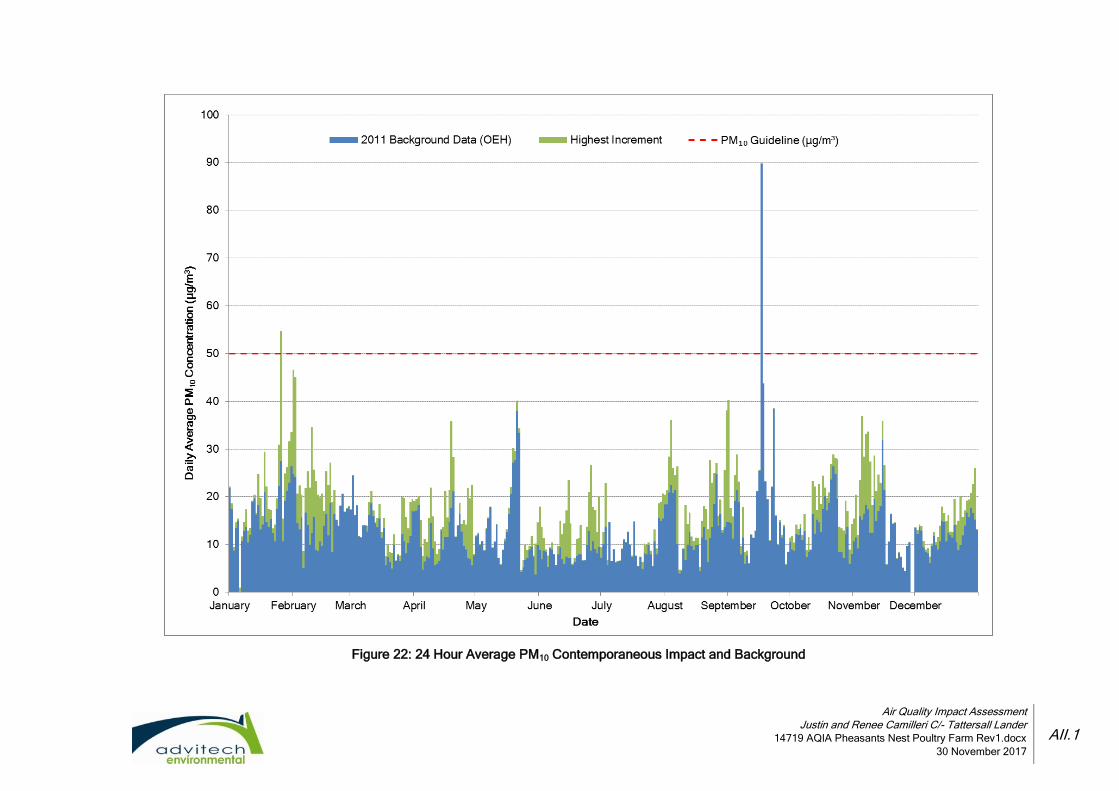
Air Quality Impact Assessment
Justin and Renee Camilleri C/- Tattersall Lander
14719 AQIA Pheasants Nest Poultry Farm Rev1.docx
30 November 2017
AII.1
Figure 22: 24 Hour Average PM10 Contemporaneous Impact and Background

Appendix I I I
2 4 Ho ur A ver ag e PM 2 . 5 – L ev e l 2 C on t em p ora ne ou s I mpac t an d
B a ck gro un d A ss essme nt s
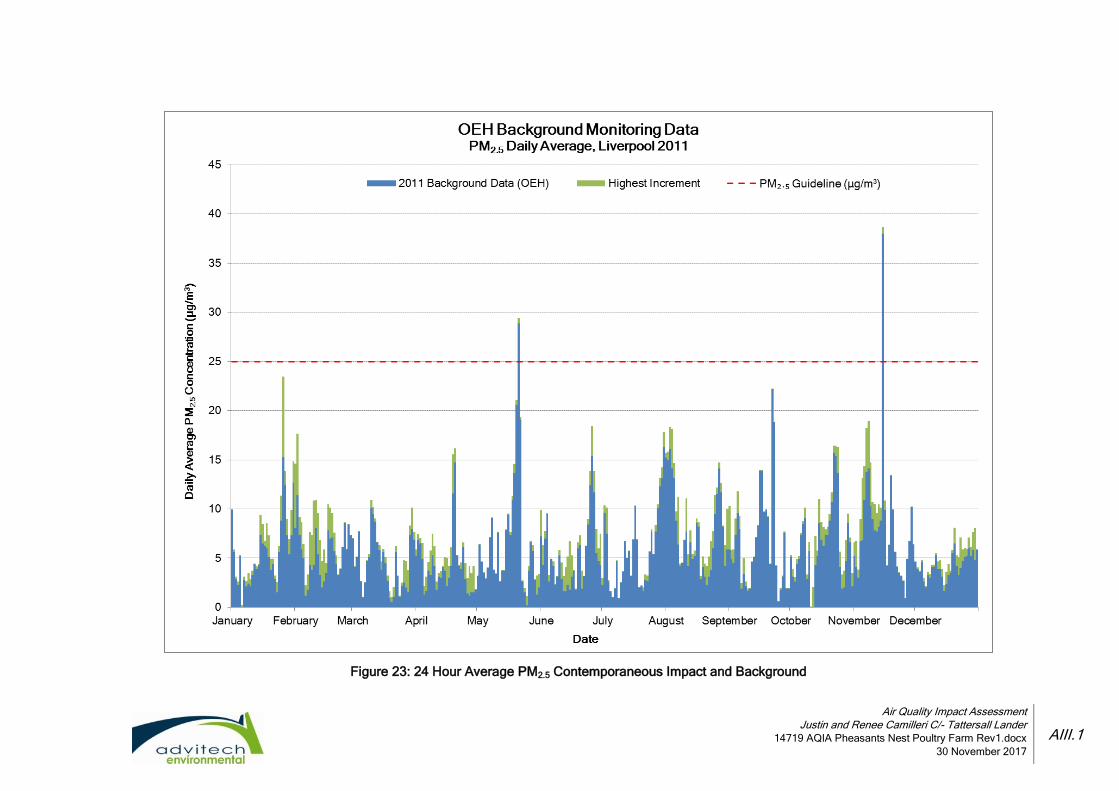
Air Quality Impact Assessment
Justin and Renee Camilleri C/- Tattersall Lander
14719 AQIA Pheasants Nest Poultry Farm Rev1.docx
30 November 2017
AIII.1
Figure 23: 24 Hour Average PM2.5 Contemporaneous Impact and Background
Related Documents