Working on behalf of Highways England AIR QUALITY FEASIBILITY STUDY: GREEN INFRASTRUCTURE A5036 Port of Liverpool Access Scheme HE550691-ARC-EAQ-A5036-RP-LE-3063 18 APRIL 2018

Welcome message from author
This document is posted to help you gain knowledge. Please leave a comment to let me know what you think about it! Share it to your friends and learn new things together.
Transcript

Working on behalf of Highways England
AIR QUALITY FEASIBILITY STUDY: GREEN INFRASTRUCTURE
A5036 Port of Liverpool Access Scheme HE550691-ARC-EAQ-A5036-RP-LE-3063 18 APRIL 2018

Arcadis (UK) Limited is a private limited company registered in England registration number: 1093549. Registered office, Arcadis House, 34 York Way, London, N1 9AB. Part of the Arcadis Group of Companies along with other entities in the UK. Regulated by RICS. Copyright © 2015 Arcadis. All rights reserved. arcadis.com
CONTACTS
PAUL MANKTELOW
Principal Consultant – Air Quality
dd 0113 360 8 276
m 07841 529481
Arcadis. 1 Whitehall Riverside Leeds LS1 4BN

Air Quality Feasibility Study: Green Infrastructure
Arcadis (UK) Limited is a private limited company registered in England registration number: 1093549. Registered office, Arcadis House, 34 York Way, London, N1 9AB. Part of the Arcadis Group of Companies along with other entities in the UK. Regulated by RICS. Copyright © 2015 Arcadis. All rights reserved. arcadis.com
working on behalf of
Document Control
Revision History Version Date Description Author
1.0 23 February 2018 First Draft Aline Bradzinski / Martina Girvan / Paul Manktelow / Joe Shaw
2.0 18 April 2018 Amendments after client comments Aline Bradzinski / Martina Girvan / Paul Manktelow / Joe Shaw
Reviewer List Name Role
Alison Morrissy Principal Consultant - Environment
Approvals Name Signature Title Date of Issue Version
Alison Morrissy Principal Consultant – Environment
18 April 2018 2.0
The original format of this document is copyright to Highways England ©.
Document Title
Air Quality Feasibility Study: Green Infrastructure
Document Number HE550691-ARC-EAQ-A5036-RP-LE-3063
Author Aline Bradzinski / Martina Girvan / Paul Manktelow / Joe Shaw
Owner Paul Manktelow
Distribution Khalid El-Reyes, Andrew Bean
Document Status
2.0

Air Quality Feasibility Study: Green Infrastructure
Arcadis (UK) Limited is a private limited company registered in England registration number: 1093549. Registered office, Arcadis House, 34 York Way, London, N1 9AB. Part of the Arcadis Group of Companies along with other entities in the UK. Regulated by RICS. Copyright © 2015 Arcadis. All rights reserved. arcadis.com
working on behalf of
Air Quality Feasibility Study: Green Infrastructure
A5036 Port of Liverpool Access Scheme
Author Joe Shaw / Aline Brodzinski / Paul Manktelow / Martina Girvan
Checker Alison Morrissy
Approver Alison Morrissy
Report No HE550691-ARC-EAQ-A5036-RP-LE-3063
Date APRIL 2018
Version Control
Version Date Author Changes
1.0 23 February 2018
Aline Bradzinski / Martina Girvan / Paul Manktelow / Joe Shaw
First Draft
2.0 18 April 2018 Aline Bradzinski / Martina Girvan / Paul Manktelow / Joe Shaw
Amended after client comments
This report dated 18/04/2018 has been prepared for Highways England (the “Client”) in accordance with the terms and conditions of appointment dated 3rd July 2017 (the “Appointment”) between the client and Arcadis Consulting (UK) Limited (“Arcadis”) for the purposes specified in the Appointment. For the avoidance of doubt, no other person(s) may use or rely upon this report or its contents, and Arcadis accepts no responsibility for any such use or reliance thereon by any other third party.

Air Quality Feasibility Study: Green Infrastructure
Arcadis (UK) Limited is a private limited company registered in England registration number: 1093549. Registered office, Arcadis House, 34 York Way, London, N1 9AB. Part of the Arcadis Group of Companies along with other entities in the UK. Regulated by RICS. Copyright © 2015 Arcadis. All rights reserved. arcadis.com
working on behalf of
CONTENTS
1 INTRODUCTION ....................................................................................................... 1
1.1 Overview ................................................................................................................................................ 1
1.2 Air Quality Regulations ........................................................................................................................ 1
2 VEGETATION AIR QUALITY EFFECTS ................................................................... 3
2.1 Efficacy of pollution removal for NOx/NO2/PM ................................................................................... 3
2.2 Effects of Vegetation on Pollution Dispersion .................................................................................. 9
2.3 Summary ............................................................................................................................................. 17
3 EMISSIONS FROM VEGETATION ......................................................................... 18
4 RESEARCH LIMITATIONS ..................................................................................... 19
5 DESIGNING FOR EFFECTIVE USE ....................................................................... 20
5.2 Vegetation Characteristics ................................................................................................................ 20
5.3 Design Characteristics ....................................................................................................................... 24
6 INSTALLATION AND MAINTENANCE................................................................... 25
6.1 Procurement Types ............................................................................................................................ 25
6.2 Installation Considerations and Costs ............................................................................................. 27
6.3 Maintenance Considerations and Costs .......................................................................................... 29
7 ADDITIONAL BENEFITS ........................................................................................ 32
7.1 Biodiversity ......................................................................................................................................... 32
7.2 Climate Attenuation ............................................................................................................................ 32
7.3 Drainage............................................................................................................................................... 32
7.4 Health and Wellbeing ......................................................................................................................... 32
7.5 Waste Water Management ................................................................................................................. 32
7.6 Amenity ................................................................................................................................................ 33
7.7 Natural Capital .................................................................................................................................... 33
8 SUMMARY .............................................................................................................. 34
8.1 Air Quality Benefits ............................................................................................................................ 34
8.2 Design, Installation and Maintenance .............................................................................................. 35
8.3 Additional Benefits ............................................................................................................................. 35

Air Quality Feasibility Study: Green Infrastructure
Arcadis (UK) Limited is a private limited company registered in England registration number: 1093549. Registered office, Arcadis House, 34 York Way, London, N1 9AB. Part of the Arcadis Group of Companies along with other entities in the UK. Regulated by RICS. Copyright © 2015 Arcadis. All rights reserved. arcadis.com
working on behalf of
9 REFERENCES ........................................................................................................ 36
Air Quality Feasibility Study: Green Infrastructure
HE550691-ARC-EAQ-A5036-RP-LE-3063 - Version 2.0 18/04/2018 1
working on behalf of
1 Introduction
1.1 Overview 1.1.1 In the UK, exposure to outdoor air pollution is estimated to contribute to 40,000 deaths and
cost the economy around £20 billion every year (Royal College of Physicians, 2016). Whilst there has been an aspiration to improve air quality over the past several decades, pollutant concentrations still exceed public health standards in many urban areas. The UK is currently failing to meet the EU Directive for ambient air quality, due to exceedances of the nitrogen dioxide (NO2) limit value. There are also widespread areas of the UK which fail to meet National Air Quality Strategy Objectives for NO2 and in a few cases, particulate matter less than 10 micrometers aerodynamic diameter (PM10). Both these pollutants are strongly associated with road traffic emissions, for example 78% of NO2 alongside the UK motorway network is estimated to originate from road traffic sources (Highways England, 2017).
1.1.2 In the Road Investment Strategy, government committed £100 million to improve air quality, on and around the strategic road network, through to 2021. Under this initiative, Arcadis has been commissioned by Highways England to undertake a review into the use of vegetation (or green infrastructure) as a mechanism of improving roadside air quality with a particular focus on NO2.
1.1.3 There has been substantial research into urban greening, exploring if vegetation can be used to achieve improvements in air quality and other environmental benefits. It is thought that vegetation can act as a sink for air pollutants and can influence dispersion, as well as having other environmental benefits for example for biodiversity, drainage, health and wellbeing. This report comprises a literature review of the effect of vegetation on NO2 and PM10 concentrations, including green/living walls, shrubs and trees. It also explores the optimum vegetation characteristics required to deliver the theoretical greatest air quality benefits. Furthermore, the report investigates the additional benefits that may be gained from green infrastructure, as well as consideration for the installation and maintenance requirements and costs.
1.2 Air Quality Regulations 1.2.1 In order to give context to the magnitude of air quality effects reported for green infrastructure,
it is important to understand existing national and EU air quality regulations.
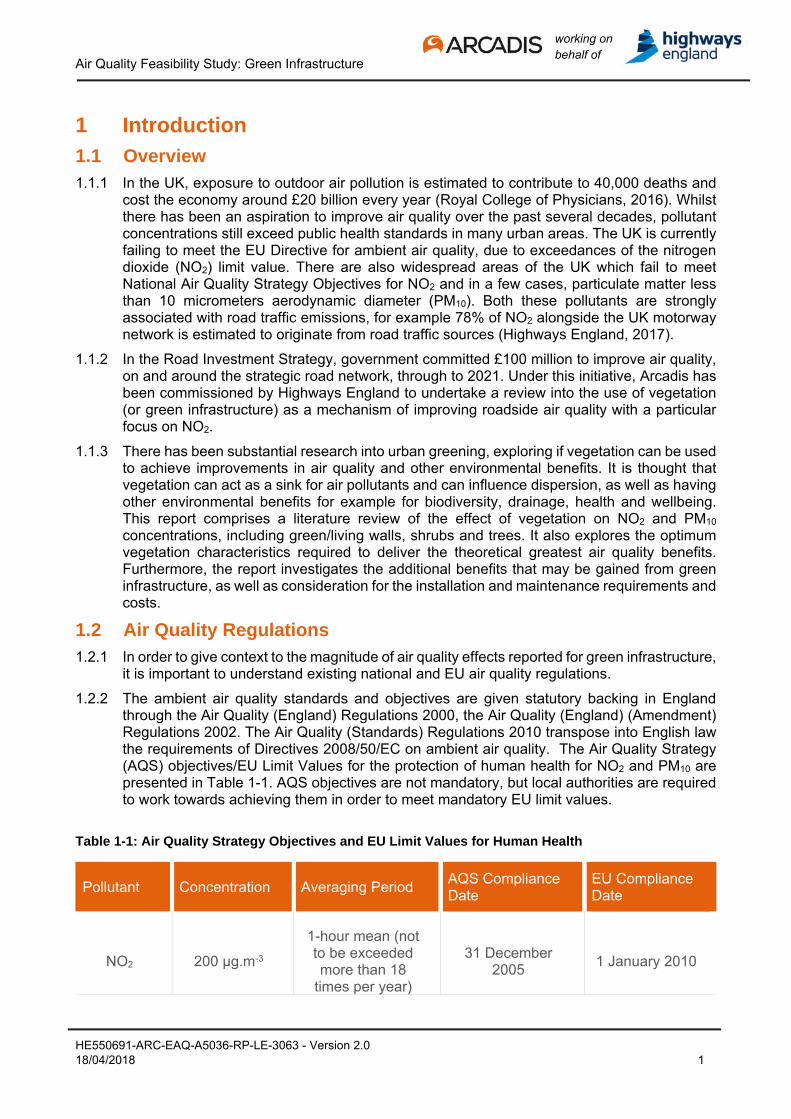
1.2.2 The ambient air quality standards and objectives are given statutory backing in England through the Air Quality (England) Regulations 2000, the Air Quality (England) (Amendment) Regulations 2002. The Air Quality (Standards) Regulations 2010 transpose into English law the requirements of Directives 2008/50/EC on ambient air quality. The Air Quality Strategy (AQS) objectives/EU Limit Values for the protection of human health for NO2 and PM10 are presented in Table 1-1. AQS objectives are not mandatory, but local authorities are required to work towards achieving them in order to meet mandatory EU limit values.
Table 1-1: Air Quality Strategy Objectives and EU Limit Values for Human Health
Pollutant Concentration Averaging Period AQS Compliance Date
EU Compliance Date
NO2 200 μg.m-3
1-hour mean (not to be exceeded more than 18
times per year)
31 December 2005
1 January 2010

Air Quality Feasibility Study: Green Infrastructure
HE550691-ARC-EAQ-A5036-RP-LE-3063 - Version 2.0 18/04/2018 2
working on behalf of
Pollutant Concentration Averaging Period AQS Compliance Date
EU Compliance Date
40 μg.m-3 annual mean 31 December
2005 1 January 2010
PM10
50 μg.m-3
24-hour mean (not to be exceeded more than 35
times per year)
31 December 2010
1 January 2005
40 μg.m-3 annual mean 31 December
2004 1 January 2005

Air Quality Feasibility Study: Green Infrastructure
HE550691-ARC-EAQ-A5036-RP-LE-3063 - Version 2.0 18/04/2018 3
working on behalf of
2 Vegetation Air Quality Effects
2.1 Efficacy of pollution removal for NOx/NO2/PM 2.1.1 It is well established that vegetation can act as a sink for gases and particulate matter.
Gaseous pollutants such as NO2 are primarily absorbed through leaf stomata (pores). Once inside the leaf, gases diffuse into intercellular spaces and can be absorbed by water films to form acids (EPA, 2015). Gases and particulates can also be removed as a result of deposition onto vegetation surfaces. Particles are removed from the atmosphere by dry or wet deposition (Fowler et al., 2001). Wet deposition is the removal of pollutants by precipitation and is not affected by land cover (i.e. vegetation would not affect wet deposition rates). Dry deposition is however affected by land cover, and occurs by gravitational settling, impaction, interception or diffusion, depending on particle size (McDonald et al. 2007).
2.1.2 Most plants have a large surface area per unit volume, increasing the probability of dry deposition compared with the smooth, manufactured surfaces present in urban areas. Vegetation typically has a higher uptake compared to brick/concrete surfaces due to the metabolic uptake of plants, the “stickiness” of the leaf surface, large surface area and their aerodynamic properties (Pugh et al. 2012).
2.1.3 Wei et al., (2017) hypothesizes that the phyllosphere (the aerial surfaces of plants) supports microbes that when exposed to air pollutants could develop mechanisms for adapting to the polluted substances which may include microbial degradation, transformation or metabolic assimilation.
2.1.4 Trees can also promote vertical transport by enhancing turbulence, providing a greater opportunity for particles to be collected on the tree surface. Table 2-1 shows typical dry deposition velocities for vegetation compared to other land surface types. The table shows that the dry deposition velocities of NO2 and PM10 on to vegetation can be respectively up to 8 and 500 times higher than brick walls.
Table 2-1 NO2 and PM10 Dry Deposition Velocities (Pugh et al. 2012)
Type of Surface NO2 (cm s-1) PM10 (cm s-1)
Brick Walls 0.05 0.02
Green Walls (100% Coverage) 0.3 0.64
Grasses 0.2-0.4 0.001-10
Broad leafed Species 0.2-0.4 0.001-10
2.1.5 The removal of gaseous pollutants by vegetation can be permanent, however vegetation
typically provides a temporary retention site for particles. Particles that have been deposited on vegetation can potentially be resuspended by turbulent winds, washed off by precipitation or deposited from leaf and twig fall.
2.1.6 A number of external factors can affect the efficiency of vegetation for the removal of pollutants. Factors include street geometry, tree cover, leaf surface area, prevailing wind direction and meteorological variables that affect tree transpiration and deposition velocities.
2.1.7 Numerous studies have investigated the influence of vegetation on the removal of pollution using modelling, wind tunnel and field measurements (Nowak et al. 2006; Pugh et al. 2012; Gundstrom. 2014; McDonald et al. 2007; Jeanjean et al.2016; Jeanjean et al. 2017). Table 2-2 summarizes the findings of a number of key research papers that have investigated the

Air Quality Feasibility Study: Green Infrastructure
HE550691-ARC-EAQ-A5036-RP-LE-3063 - Version 2.0 18/04/2018 4
working on behalf of
efficiency of pollutant removal by vegetation. The papers notably focus on removal of NO2 and PM10.

Air Quality Feasibility Study Green Infrastructure
HE550691-ARC-EAQ-A5036-RP-LE-3063 - Version 2.0 18/04/2018 5
working on behalf of
Table 2-2 Summary of Key Research Papers on the Efficacy of Pollutant Removal by Vegetation
Study/Author Method Results
Air Pollution removal by Urban Trees and Shrubs, Nowak. D.J et al, 2006
Modelling of air pollutant removal in 55 US cities and for the entire nation, using a model which includes hourly pollution and meteorological data.
Annual average air quality improvement in cities during the daytime of the vegetation in-leaf season were typically <1% percent for NO2 and PM10.
In urban areas with 100% tree cover (contiguous forest stands) short term (one hour) air quality improvements estimated as high as 9% for NO2 and 8% for PM
Effectiveness of Green Infrastructure for Improvements of Air Quality in Urban Street Canyons, Pugh.T et al, 2012
Modelling of NO2 and PM10 in a street canyon using CiTTy-Street for 3 different scenarios:
Control (brick walls/roofs)
Green Walls (100% Coverage)
Green Roof
It was assumed that NO2 and PM10 deposition velocities were within the mid-range of a wide range of values available from previous literature.
Reduced modelled average daytime (0600 – 1800) in-canyon concentrations by as much as 11% and 19% for NO2 and PM10, respectively when using green walls (at 1 m/s wind speed and canyon height(H)/width(W) ratio of 1). Predicted reductions were strongly dependent on residence time (wind speed and canyon geometry) and fraction of canyon wall greening. Simulations were carried out for daytime, when NO2 effects will be greatest due to stomata opening. It would be expected that the reduction would be lower over a 24-hour period.
Based on annual average climatology from Kew Gardens, modelled average in-canyon concentrations were reduced by 7% and 11% for NO2 and PM10 respectively (H/W of 1). The predicted reduction increased to 20% and 31% respectively when H/W was increased to 2.
Limited Effect of Urban Tree Vegetation on NO2 and O3 Concentrations near a Traffic Route, Gundstrom.M. 2014
Six one-week NO2 and O3 duplicate diffusion tube monitors within and outside a dense canopy of trees near a busy road (113,000 AADT) in Gothernburg, Sweden
Measurements were undertaken outside and inside a dense canopy of 8-10 m tall mixed broadleaved trees.
Measurements were taken at a height of 3.5m and were 8m to 12m from the closest lane of the traffic route.
Coefficient of variation of the sampling pairs observed was 1.5% indicating high precision
Average NO2 reductions of ~7% (2.7 µg m-3) over six-week period within tree canopy, statistically significant
North-south wind directions were of greater importance for the reduction in NO2 compared to west-east wind directions, despite the road being west of the trees. No

Air Quality Feasibility Study Green Infrastructure
HE550691-ARC-EAQ-A5036-RP-LE-3063 - Version 2.0 18/04/2018 6
working on behalf of
Study/Author Method Results explanation could be offered for this observation.
Quantifying the Effect of Urban Tree Planting and Concentrations and Deposition of PM10 in two UK Conurbations. McDonald, A et al. 2007
Fine Resolution Atmospheric Multi-Pollutant Exchange (FRAME) atmospheric transport model for West Midlands and Glasgow
Multi-layer trajectory model uses statistical meteorology to calculate dry and wet deposition
Model simulated primary PM10 deposition for two areas; Wolverhampton to Birmingham and Glasgow City Centre
The FRAME model uses five different land cover
types: arable, grass/moor, urban, forest and water.
Tree planting was simulated by modifying the land cover database, using GIS techniques and field surveys to estimate reasonable planting potentials. Tree planting was simulated for several future planting potential scenarios (25, 50, 75 and 100%)
Primary PM10 emissions data were obtained from the UK National Atmospheric Emission Inventory
West Midlands: Increasing total tree cover from 3.7% to 16.5% reduces primary PM10 concentrations by 10% (from 2.3 to 2.1 µg m-3). Increasing tree cover of the West Midlands to a maximum of 54% by planting all available green space would reduce the average primary PM10 concentration by 26% (from 2.3 to 1.7 µg m-3).
Glasgow: Increasing tree cover from 3.6% to 8% reduces primary PM10 concentrations by 2% (reduction of 0.03 µg m-3).
Modelling the effectiveness of urban trees and grass on PM2.5 reduction via dispersion and deposition at a city scale. Jeanjean A.P.R et al. 2016
A validated CFD model of Leicester city centre was used to simulate both the effects of tree aerodynamics and the deposition capabilities of trees and grasses.
3D LIDAR dataset used to construct buildings, and combined with a road map. Traffic assumed to be uniform across all roads with an arbitrary PM2.5 road emission value of 190 μg s−1 m−1, which roughly led to an average ground concentration of 44 μg m−3 at a wind speed of 4.6 m s−1.
The National Tree Map was used in the tree database to represent individual trees or closely grouped tree crowns.
The decrease in particle concentrations due to deposition effects on trees was calculated to be 2.8% at 4.6 m s−1 wind speeds. Deposition on trees is more important at these wind speeds and was almost insignificant at a wind speed of 1 m s−1.

Air Quality Feasibility Study Green Infrastructure
HE550691-ARC-EAQ-A5036-RP-LE-3063 - Version 2.0 18/04/2018 7
working on behalf of
Study/Author Method Results
Ranking current and prospective NO2 pollution mitigation strategies: An environmental and economic modelling investigation in Oxford Street, London. Jeanjean A.P.R et al. 2017
CFD model used to simulate airflow and NO2 dispersion in Oxford Street. Six scenarios modelled and compared to baseline situation with an empty street canyon. These scenarios included existing trees and a number of solid barrier options.
Buildings data were sourced from Ordnance Survey.
The National Tree Map was used in the tree database to represent individual trees or closely grouped tree crowns.
Average daily traffic counts from Oxford St were taken to estimate road emissions using the Emission Factor Toolkit. A background NO2 concentration of 33.8 μg m−3 was assumed.
Model enhanced with additional sink terms which take into account the deposition of NO2 on trees, buildings and walls.
Existing trees were estimated to reduce annual mean street level concentrations of NO2 by 0.2% due to deposition effects.

Air Quality Feasibility Study Green Infrastructure
HE550691-ARC-EAQ-A5036-RP-LE-3063 - Version 2.0 18/04/2018 8
working on behalf of
2.1.8 The studies presented in Table 2-2 indicate that the effects of vegetation on pollution removal are likely to vary depending on the environment and vegetation type.
2.1.9 Street canyons are a common feature in urban environments and typically consist of buildings along both sides of a road way (Abhijith et al. 2017). They are generally characterised by average building heights being greater than the road width. Street canyons have the potential to trap air pollutants at street level due to a lack of ventilation and subsequently expose pedestrians to relatively high pollutant concentrations. The study by Pugh et al (2012) which used annual climatology data from Key Gardens, showed that green walls in street canyons could remove up to 20% of NO2 and 31% of PM10 (in canyon concentrations), depending on the canyon geometry. Deposition is more effective in canyons compared to an open environment due to the higher surface to volume ratio in the canyon, the lower volume into which pollution can be initially mixed, and the higher pollutant concentrations, especially at low wind speeds. It should be noted however, that these results were based on modelling, and could vary significantly depending on the model parameters used, particularly on the assumptions made regarding deposition velocities to vegetation. Litschke and Kuttler (2008) highlighted that there can be differences in deposition velocities of an order of magnitude between measured values and the results of model calculations. Furthermore, published deposition velocities cover a range of more than four orders of magnitude.
2.1.10 In a review of the efficiency of green infrastructure on abatement of air pollution by Abhijith et al (2017), a number of papers reported that green walls in open road environments remove pollutants through deposition. However, these studies predominantly focused on the effects of dispersion and the amount of pollution specifically removed by deposition was not quantified (Joshi and Ghosh.2014; Morakinyo et al. 2016; Tong et al. 2016).
2.1.11 Limited uptake of pollution has been predicted for trees in street canyons (Jeanjean et al. 2017). Other studies shown in Table 2-2, also suggest that trees are only likely to have a modest effect on pollutant concentrations, particularly when averaged across the urban boundary layer1. This has also been the findings of work undertaken by other authors that have investigated NO2 and PM10 removal by trees. Nowak et al (2006) reported annual average air quality improvements of <1% for NO2 and PM10, Jeanjean et al (2016) reported a PM reduction of 2.8%, Gundstrom et al (2014) showed a 7% reduction (2.7µg/m3) for NO2 and Jeanjean et al (2017) showed reductions in NO2 of 0.2%.
2.1.12 With the exception of green walls in street canyon environments, the studies suggest that the uptake of pollutants by green infrastructure is likely to have only limited effects on concentrations at a local level, such as at roadside environments.
2.1.13 Although the studies above suggest that trees have a modest effect on absolute pollutant concentrations, when the reduction in pollution from all urban trees is aggregated across the population of an urban area (accounting for total population exposure), it could translate into sizeable health benefits, particularly as any reduction in PM would be beneficial for human health.
2.1.14 A study by Nowak et al (2014) modelled pollutant removal and health effects across the US. They found that trees and forests removed 17.4 million tonnes of air pollution in 2010, which equated to a cost benefit of $6.8 billion. The pollutant removal equated to an average air quality improvement of less than 1% but the health impacts included avoidance of 850 incidences of mortality and 670,000 incidences of acute respiratory symptoms.
2.1.15 A second study that investigated pollutant capture and human health benefits was Tiwary et al (2009). An integrated model over a 10x10km squared area with 25% tree cover was
1 The urban boundary layer is defined as the part of the atmosphere which is directly influenced by the earth’s surface. Its depth can range from just a few meters to several kilometres depending on the local meteorology.

Air Quality Feasibility Study Green Infrastructure
HE550691-ARC-EAQ-A5036-RP-LE-3063 - Version 2.0 18/04/2018 9
working on behalf of
estimated to remove 90.4 tonnes of PM10 annually and equated to the avoidance of two premature deaths and two respiratory hospital admissions per year.
2.1.16 It should be noted that the studies above are based entirely on modelling and will be subject to uncertainties inherent in the models used, for example regarding deposition velocities to vegetation and meteorological parameters. There is a lack of empirical evidence to support the findings of modelling studies that have investigated the uptake of pollutants by vegetation, as also highlighted by Vos et al (2013).
2.2 Effects of Vegetation on Pollution Dispersion 2.2.1 It is thought that vegetation can act as a barrier between pollutant sources and receptors and
can lead to changes in airflow and dispersion. The aerodynamic effects of vegetation can vary depending on a variety of factors including the vegetation type, porosity, meteorology and the built-up environment within which the vegetation is based.
2.2.2 Vegetation can act as an obstacle to the wind dependent on its shape and spatial configuration. It can reduce horizontal wind speeds, reducing horizontal dispersion and therefore increase street level pollution. Studies suggest however that it can also create wind shear stresses and generate mechanical turbulence, which would promote dispersion and reduce street level pollution (Abhijith et al. 2017).
2.2.3 The discussion below is separated into the aerodynamic effects of vegetation in street canyons and open roads, as each is associated with different effects.
Street Canyons
2.2.4 A number of studies have examined the air quality effects of vegetation in street canyons as summarised in Table 2-3.

Air Quality Feasibility Study Green Infrastructure
HE550691-ARC-EAQ-A5036-RP-LE-3063 - Version 2.0 18/04/2018 10
working on behalf of
Table 2-3 Summary of Key Research Papers on the Effects of Vegetation on Pollutant Dispersion within Street Canyons
Study/Author Method Results
Influence of Roadside Hedgerows on Air Quality in Urban Street Canyons, Gromke. C et al. 2016
Study performed in an atmospheric wind tunnel using a canyon model.
Two hedgerow scenarios:
On both sides (sidewise) of the outer borders of the traffic lanes (6m in front of building walls)
One central hedgerow between the main traffic lanes
Various hedge configurations of different heights, porosities and segmentations (i.e. whether continuous or discontinuous) examined. Hedges represented using foam materials.
Experiments performed with wind approaching perpendicular to canyon, except one down with parallel approach wind.
Atmospheric boundary layer simulated in the wind tunnel.
Tracer gases used to stimulate release of traffic exhaust emissions (sulphur hexafluoride) and an air carrier gas (air).
Sixteen sampling taps located at bottom of building walls and in reduced traffic zones.
Reference case (without hedgerow) showed higher ground level concentrations on leeward side of 10-20% compared to windward side of canyon (in canyon centre). This was because a canyon vortex was created (with air above being entrained into canyon on windward side) which at ground level caused flow of air and accumulation of pollutants on leeward side of canyon.
For perpendicular winds:
Area average reductions in concentrations of 18 - 39% were measured on the leeward side of the canyon (at pedestrian head height) depending on the hedge height, arrangement and permeability. These reductions were due to the hedge acting as a barrier to traffic pollution dispersion, forcing air over pedestrian height. Lesser reductions in concentration therefore occurred at greater hedge permeability. An increase in concentrations was predicted with discontinuous hedges.
A larger reduction in concentrations occurred on leeward side for central hedges compared to sideways (46 - 61%).
Increases in concentrations were however found to occur at the end of the canyon with sidewise hedges but a reduction still occurred with central hedges.
The Effects of Trees on Micrometeorology in a Real Street Canyon: Consequences for Local Air Quality. Sabatino, S et al. 2015
Street canyon site in Lecce City, Italy
51-day measurement period of leaf area index, thermal imaging of building façade, air temperature and relative humidity measurements
Anemometers took flow and turbulence measurements
Leaf area index of Small Leaved Lime tree crowns
Trees within street canyon led to wind break effects, reducing the air volume flow rate at the canyon-roof interface.
Trees resulted in canyon volume averaged pollutant concentration ~20% larger than in tree free scenario, due to these trapping effects.

Air Quality Feasibility Study Green Infrastructure
HE550691-ARC-EAQ-A5036-RP-LE-3063 - Version 2.0 18/04/2018 11
working on behalf of
Study/Author Method Results estimated from measurements of photo-synthetically active radiation
3D isothermal Computational Fluid Dynamics (CFD) modelling simulations performed to interpret field measurements by providing information on the influence of trees on pollutant dispersion.
Ranking current and prospective NO2 pollution mitigation strategies: An environmental and economic modelling investigation in Oxford Street, London. Jeanjean A.P.R et al. 2017
CFD modelling of tree and solid barrier aerodynamic and deposition effects on NO2 (inside a street canyon) See Table 2-3 for more details.
Existing trees were found to reduce annual mean NO2 concentrations by 0.1% in the pedestrian zone and by 0.5% in the road zone, due specifically to aerodynamic effects. This compared to a reduction of 2.3% (pedestrian zone) and an increase of 23.8% (road zone) with a solid barrier.

Air Quality Feasibility Study Green Infrastructure
HE550691-ARC-EAQ-A5036-RP-LE-3063 - Version 2.0 18/04/2018 12
working on behalf of
2.2.5 The modelling studies above show mixed results for the effects of vegetation on air pollution within street canyons. Sabatino et al. (2015) established that trees within street canyons had a negative effect on air pollution, as tree crowns diminished the vertical air exchange between the in-canopy volume and the air above, diminishing fumigation at the top of the canyon. On the other hand, Jeanjean et al. (2017) found that existing trees within a street canyon reduced modelled annual mean NO2 concentrations by 0.1% in the pedestrian zone as a result of enhanced turbulence/dispersion. Such as small change can however be considered highly uncertain given the accuracy of modelling practices. However, the majority of studies show an average increase of 20-96% in concentrations of different pollutants due to the presence of trees within street canyons compared to those without (Abhijith et al. 2017).
2.2.6 Roadside hedgerows within street canyons have the potential to have an overall positive effect on air pollution at street level, through diverting pollution upwards and away from footpath areas (e.g. Gromke et al. 2016). A number of other studies have also reported similar findings, reporting that within street canyons, hedgerows reduce pollutant exposure by 24-61% at the footpath area behind the hedgerows (Abhijith et al. 2017).
2.2.7 The results reported above show that vegetation is likely to have an effect on traffic pollution dispersion within a street canyon environment. Previous studies are based on modelling/wind tunnel experiments and the results will be specific to the parameters assumed, which generally represent a snap shot in time with regards to the meteorology. The results will therefore be specific to the conditions modelled, particularly the canyon geometry and local meteorological conditions (e.g. choice of specific wind speed and direction). The maximum benefits reported in modelling studies (e.g. Gromke et al. 2016) are typically specific to the optimum conditions for aerodynamic effects to occur (e.g. wind perpendicular to hedgerows and tall, continuous hedgerows of low permeability with sufficient wind speeds to lead to updrafts). In reality, the wind conditions will be highly variable in terms of direction and strength, and the overall effects on pollutant concentrations will vary in response to these effects. This would be important in terms of compliance with annual mean air quality strategy objectives/ EU Limit values, where effects would be averaged over a long period.
Open Roads
2.2.8 Open roads are described as a built environment feature in which both sides of the traffic corridors are open with generally detached, single and multi-story buildings. In open roads, planted trees and hedges, depending on their characteristics (see Table 5-3), are thought to act as a barrier between the road and the sensitive receptors and can alter near road pollutant concentrations through modifying air flow (EPA. 2016).
2.2.9 Vegetation can potentially lead to the accumulation of pollutant concentrations on the windward and upwind side of the vegetation. It is thought that dense (low porous) vegetation can act in a similar manor to a solid barrier; forcing polluted air to flow over it. Whereas, vegetation of low density (i.e. highly porous) can allow air to flow through it. Downwind of vegetation barriers, a wake zone can be created, causing pollution concentrations to reduce with increasing distance from the road (Abhijith et al, 2017).
2.2.10 A number of studies of vegetation dispersion effects within open road environments have been undertaken as summarised in Table 2-4.

Air Quality Feasibility Study Green Infrastructure
HE550691-ARC-EAQ-A5036-RP-LE-3063 - Version 2.0 18/04/2018 13
working on behalf of
Table 2-4 Summary of Key Research Papers on the Effects of Vegetation on Pollutant Dispersion within Open Road Environments
Study/Author Vegetation Type/Design
Method Results
The Impact of a Green Screen on Concentrations of Nitrogen Dioxide at Bowes Primary School, Enfield, Tremper and Green 2018
Ivy screen surrounding playground
A monitoring study at the nursery entrance area of Bowes Primary School in the London Borough of Enfield.
A 12m ivy screen was installed and designed to fill gaps in the existing barrier, reaching a height of 2.4m.
Bowes Primary School was chosen as it is located on the North Circular Road, a busy four lane road.
Bowes Primary School Local Air Quality Network (LAQN) monitoring site in playground at a similar distance from the road as the NOX analyser, but did not include a green screen.
Two chemiluminescence NOX analysers were used to assess the difference in NO2 concentration between the roadside and playground as the screen matured. The playground station was located 1m behind the screen within the school grounds.
The monitors were installed for four months in 2014 (21st Jul to 21st Nov) and again for 8 months in 2016/17 (5th Aug to 6th Apr). Pre-screen period was three weeks in Aug 2014 as the screen was not installed until the end of Aug. Oct to Nov 2014 were considered as the ivy pre-growth period. A follow up study was then carried out between 5th Aug 16 and 6th Apr 17 when the ivy screen had matured,
To quantify the measurement uncertainty, the instruments were co-located and the uncertainty for NO2 was found to be ~5%.
During the pre-screen period the daily NO2 concentration difference between the two sites was on average 4.6%. As this was the period before the screen was installed, this can be attributed to the distance between the monitors and road traffic.
After the screen was installed the daily mean concentration difference was 8.1% for Sept 14 and 4.2 % for Oct 14. This difference was though to reflect the aerodynamic effect of the immature green screen plus the distance from the traffic emissions of the background instrument.
As the ivy screen matured (Dec 16 to Mar 17) concentrations measured in the playground reduced relative to the roadside at all wind speeds from south-westerly/westerly and north-westerly winds. This led to a decrease in the daily NO2 concentrations on the playground side of the screen by 15 μg m-3 (21.8 %).
Concentrations at the playground site and the LAQN site were found to be comparable throughout sampling (including with a mature screen) even though the LAQN site did not have a green screen between it and the road.

Air Quality Feasibility Study Green Infrastructure
HE550691-ARC-EAQ-A5036-RP-LE-3063 - Version 2.0 18/04/2018 14
working on behalf of
Study/Author Vegetation Type/Design
Method Results
although data was not available for this entire period due to breakdown of the air-conditioning unit in the cabinet.
Impact of Green Screens on Concentrations of PM and NOX in Near Road Environments, Tremper et al. 2015
Ivy screen surrounding playground
Monitoring study at St. Cuthbert with St. Matthias Primary School in the Royal Borough of Kensington and Chelsea, adjacent to A3220 road.
Two Chemiluminescence NOx analysers and two Light Scattering PM analysers were located immediately either side of school fence/mesh for a year.
A 51m ivy screen was installed adjacent to an existing 2m roadside barrier, raising the height to 2.7m.
The difference in concentration between the roadside side and playground side of the screen was assessed as vegetation matured.
To quantify the measurement uncertainty, the instruments were co-located at the start and the end of the programme. This data was used to correct for systemic biases and to calculate a daily between sampler uncertainty, which was 7.2% for NO2 and 15.2% for PM10.
The screen was found to be an effective pollution barrier once the ivy had started growing and a significant reduction (i.e. greater than measurement uncertainty) could be seen once the screen had matured.
For the first two months of sampling of valid data (Feb & March for NO2) the NO2 concentration difference either side of the screen was on average 3% and increased to 10% in April. For PM10, the initial three months of valid data (Jan to March) showed an average difference of 16%. The ivy screen was immature across these periods, and this difference likely reflects the slightly greater distance from the traffic emissions of the playground instruments.
Significant reductions of 24% and 38% for NO2 and PM10 on the playground side of the ivy screen were measured once matured (between July and September). Average NO2 and PM10 concentrations were reduced by 34.4 µg m-3 and 17.6 µg m-3 behind the mature ivy screen specifically during school hours.
It should be noted that the measurements were taken immediately either side of the screen and thus may not reflect the pollutant concentrations further away from the screen

Air Quality Feasibility Study Green Infrastructure
HE550691-ARC-EAQ-A5036-RP-LE-3063 - Version 2.0 18/04/2018 15
working on behalf of
Study/Author Vegetation Type/Design
Method Results
where exposure would occur.
Investigation into the Efficiency of Green Walls in Reducing the Levels of Traffic Pollutants PM10 and Nitrogen Dioxide, Nichols. J. 2014
Free standing Green Walls
Trial at Warren School, Barking and Dagenham, which involved two types of free standing green walls in front of the school. Road A1112 runs parallel to front of school.
Two types of free standing wall tested:
15m long and 1.8m high straight wall (parallel to road)
5 individual angled panels (45° to road)
Five species of small perennial shrubs were tested in horizontal wall troughs.
NO2 monitored using triplicate passive diffusion tubes behind the wall and in other locations over period July 14 - Nov 14.
Continuous PM monitoring undertaken before and after construction of walls.
Particulate suspension measured through filtering leaf samples
Stachys byzantina greatest capture of PM2.5-10 at 0.13489 g.m-2
No significant difference in NO2 concentrations found between a control site and behind the angled and straight walls.
The Influence of Roadside Solid and Vegetation Barriers on Near-Road Air Quality. Ghasemian et al. 2017
Roadside Vegetation Barriers
Reynolds Averaged Navier-Stokes (RANS) technique coupled with the k - ε realizable turbulence model was used to investigate the flow pattern and pollutant concentration for roadside solid and vegetation barriers.
Three scenarios modelled at a wind speed ~3 m/s (at 30m height) and wind direction perpendicular to the road:
Flat terrain (no barrier)
Dense vegetation was found to act similar to solid barrier, causing vertical mixing and upward motion. This plume lofting decreased ground level pollutant concentrations.
High porosity vegetation barriers reduced wind speed but did not create updrafts, leading to higher ground level pollutant concentrations.
Dense plant canopy with leaf area density of 3.3 m-2m3 reduced ground level concentrations by 10% compared to the flat terrain scenario (averaged over 3 x 100m (width x length)

Air Quality Feasibility Study Green Infrastructure
HE550691-ARC-EAQ-A5036-RP-LE-3063 - Version 2.0 18/04/2018 16
working on behalf of
Study/Author Vegetation Type/Design
Method Results
Solid barrier (9m high, 3m thickness)
Vegetation barrier (9m high, 9m thickness)
Vegetation barrier modelled for different Leaf Area Densities. 2
area behind barrier). The solid barrier with the same height reduced concentrations by 58%.
High porosity canopy with leaf area density of 1 m-2m3 increases ground level concentrations by 15% (averaged over 3x100m area behind barrier).
The Influence of Roadside Vegetation Barrier on Airborne Nanoparticles and Pedestrian Exposure under varying Wind Conditions. Al-Dabbous. 2014
Roadside Vegetation Barriers
Particle number distribution and number concentrations measured along the A3 roadside barrier in Guilford using fast response differential mobility spectrophotometer (DMS50) and a solenoid switching system.
3.4m high and 2.2m deep vegetation barrier made up of coniferous plants
Sampling height of 1.6m. Measurements were taken at the front (0.3m from road), middle (1.4m from road) and back (2.5 from road) of the vegetation barrier and at a parallel vegetation free location (0.3m from road).
Intermittent measurements were collected for several daytime hours over six individual days.
Particle number concentrations found to be ~11% higher in front of barrier compared to at the parallel vegetation free location (during cross road winds i.e. when wind was blowing from the road onto the barrier).
Cross road winds led to a decrease in particle number concentrations of 14% and 37% within and behind the barrier, respectively, compared to in front of the barrier. These differences were insignificant during other wind directions.
2 Leaf Area Density (LAD) is defined as the ratio of leaf surface area to the total volume occupied by vegetation (m2 / m3).

Air Quality Feasibility Study: Green Infrastructure
HE550691-ARC-EAQ-A5036-RP-LE-3063 - Version 2.0 18/04/2018 17
working on behalf of
2.2.11 The above studies indicate that vegetation in the form of hedges in open road environments have both positive and negative effects on air quality based upon the vegetation characteristics. High density vegetation can act similarly to solid barriers, causing vertical mixing and upward motion of air, subsequently leading to reduced ground level pollution concentrations. The majority of studies within open road environments report reductions in concentrations between 15% and 60% behind the barriers as a result of these effects (Abhijith et al.2017). However, Ghasemian et al. (2017) demonstrated that the aerodynamic effects of hedges are unlikely to be as pronounced as for a solid barrier, where air quality improvements were 5-6 times greater than for high density vegetation. Careful consideration should also be given to vegetation density, as less dense vegetation allows polluted air to pass through the barrier and slows down wind speeds, leading to a deterioration in air quality (Ghasemian et al. 2017).
2.2.12 As discussed in Para 2.2.7, the results from modelling studies used to examine the effects of vegetation on pollutant dispersion within open roads environments will be specific to the modelling parameters used, and the maximum changes reported will be based on optimum conditions for vegetation aerodynamic effects to occur (e.g. winds perpendicular to barrier). The monitoring studies undertaken by Tremper et al. (2015, 2018) and Al Dabbous (2014) seem to support the findings of modelling studies and indicate that vegetation can have beneficial effects on air quality. However, it should be noted that in these studies, the measurements were undertaken immediately behind the vegetation barriers (on barrier wall or within 1m of wall, where the greatest effects would be anticipated) and without a control site to compare against. Further investigation would be required to understand how pollution concentrations are affected at further distances away from vegetation barriers, where public exposure would occur, and to understand how this would compare to a scenario where no barrier is present. For example, in the case of the Tremper (2018) study, the measurements behind the barrier appeared to be broadly consistent with those measured by an adjacent LAQN station, which did not have a vegetation barrier present. The results of these studies were also based on average effects over intermittent and relatively short measurement periods and are therefore specific to the meteorological conditions during sampling. Further investigation would be required to understand long term effects, as this would be important in the context of compliance with annual mean air quality regulations.
2.3 Summary
Effect of Vegetation on NO2 and PM10 Removal
2.3.1 The studies undertaken to quantify removal of NO2 and PM10 by vegetation (through deposition/stomatal uptake) suggest that the effects are likely to be greater for PM10 compared to NO2, due to its higher deposition velocity. However, the removal of both pollutants by vegetation is likely to be very limited (of the order of a few percent). There is however potential for removal to be enhanced in some cases, such as through use of green walls in street canyon environments. However, the studies undertaken to assess pollutant removal have been model based, and therefore subject to limitations. Most of the studies have also focussed on removal of NO2 and PM10 by vegetation on a regional scale, and there is a lack of research into removal at a local level, which would be important in terms of compliance with air quality regulations.
Effect of Vegetation on NO2 and PM10 Dispersion
2.3.2 Research findings suggest that the aerodynamic effects of vegetation on both NO2 and PM10 could be more important than their effect as a pollutant sink. Modelling studies suggest that dense vegetation can act a barrier to pollution, and create updrafts promoting dispersion. However, the effects quantified tend to be based on the optimum conditions for enhanced dispersion to occur. The studies also indicate that vegetation effects on pollution dispersion

Air Quality Feasibility Study: Green Infrastructure
HE550691-ARC-EAQ-A5036-RP-LE-3063 - Version 2.0 18/04/2018 18
working on behalf of
are likely to be highly complex, and in some cases, vegetation can lead to an increase in street level NO2 and PM10 through reducing horizontal wind speeds and in the case of street canyons, trapping effects which diminish vertical air exchange.
Emissions from Vegetation 3.1.1 Trees can have an effect on air quality through the emission of Biogenic Volatile Organic
Compounds (BVOCs). These are organic atmospheric gases including isoprenoids, alkenes and carbonyls (David Suzuki Foundation, 2015). Emissions of BVOCs by trees can combine with oxides of nitrogen (NOx) and contribute to the formation of ozone (O3) through secondary chemical reactions (David Suzuki Foundation, 2015). The formation of O3 from VOCs is however complex, and not directly proportional to the amount of NOx and VOCs available. These reactions are important as ground level O3 is a pollutant and is harmful to human health and to the health of plant species. Furthermore, O3 acts as an oxidant for the conversation of NOx to NO2, and so can act to increase NO2 concentrations. Different tree species emit BVOCs at different rates, and therefore selecting low BVOC emitting species can decrease the risk of increased O3 concentrations (Woodland Trust. 2012). In the UK; Willow, Oak and Poplar are significant sources of BVOCs (Donovan et al., 2005).

Air Quality Feasibility Study: Green Infrastructure
HE550691-ARC-EAQ-A5036-RP-LE-3063 - Version 2.0 18/04/2018 19
working on behalf of
4 Research Limitations 4.1.1 The findings from previous investigations have demonstrated the potential of vegetation to
reduce street level pollution. However, a key limitation of the research conducted to date is that the majority of studies are not field measurement based. Therefore, there has been a focus on wind tunnel and modelling studies which will be subject to uncertainties regarding modelling parameters. Studies which have investigated uptake of pollution to vegetation will be particularly sensitive to the choice of deposition velocity assumed. Litschke and Kuttler (2008) highlighted that published deposition velocities to vegetation vary by more than four orders of magnitude, which will add considerable uncertainty to the modelled effects.
4.1.2 Modelling studies which have examined aerodynamic air quality effects of vegetation tend to be based on parameters which allow maximum aerodynamic effects to occur (e.g. perpendicular winds to vegetation barrier). Whilst some monitoring studies have been undertaken to investigate vegetation effects on air quality, the effects reported are based on monitoring located immediately either side of green barriers, where the greatest effects would be anticipated. The studies are also based on short term intermittent measurements. Long-term monitoring, with inclusion of a control site (i.e. without a green barrier) would be required to demonstrate that such interventions are effective for improving near road air quality.
4.1.3 The limitations above highlight that there is considerable uncertainty in the outcome of previous research studies, and further research, supported by empirical evidence is required to demonstrate that use of green infrastructure can be an effective mitigation measure for improving roadside air quality.
Air Quality Feasibility Study: Green Infrastructure
HE550691-ARC-EAQ-A5036-RP-LE-3063 - Version 2.0 18/04/2018 20
working on behalf of
5 Designing for Effective Use 5.1.1 The characteristic of both vegetation and physical design of green infrastructure has the
potential to affect the efficiency of pollutant removal and dispersion. The following sections look at guidance issued in relation to vegetation characteristics and design. The vegetation characteristics will be important for influencing pollutant removal, and the design characteristics important for influencing pollutant dispersion. As discussed in Section 2, it is likely to be the effect of vegetation on pollution dispersion which is the most important mechanism by which vegetation can affect air quality.
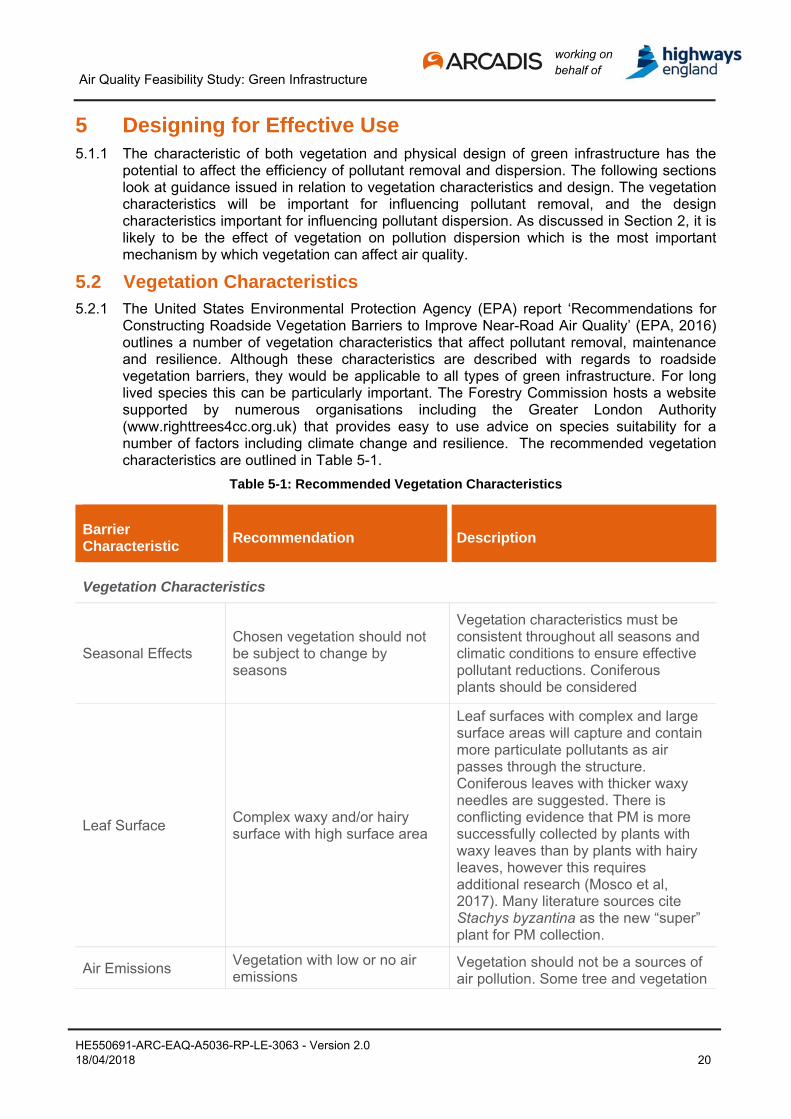
5.2 Vegetation Characteristics 5.2.1 The United States Environmental Protection Agency (EPA) report ‘Recommendations for
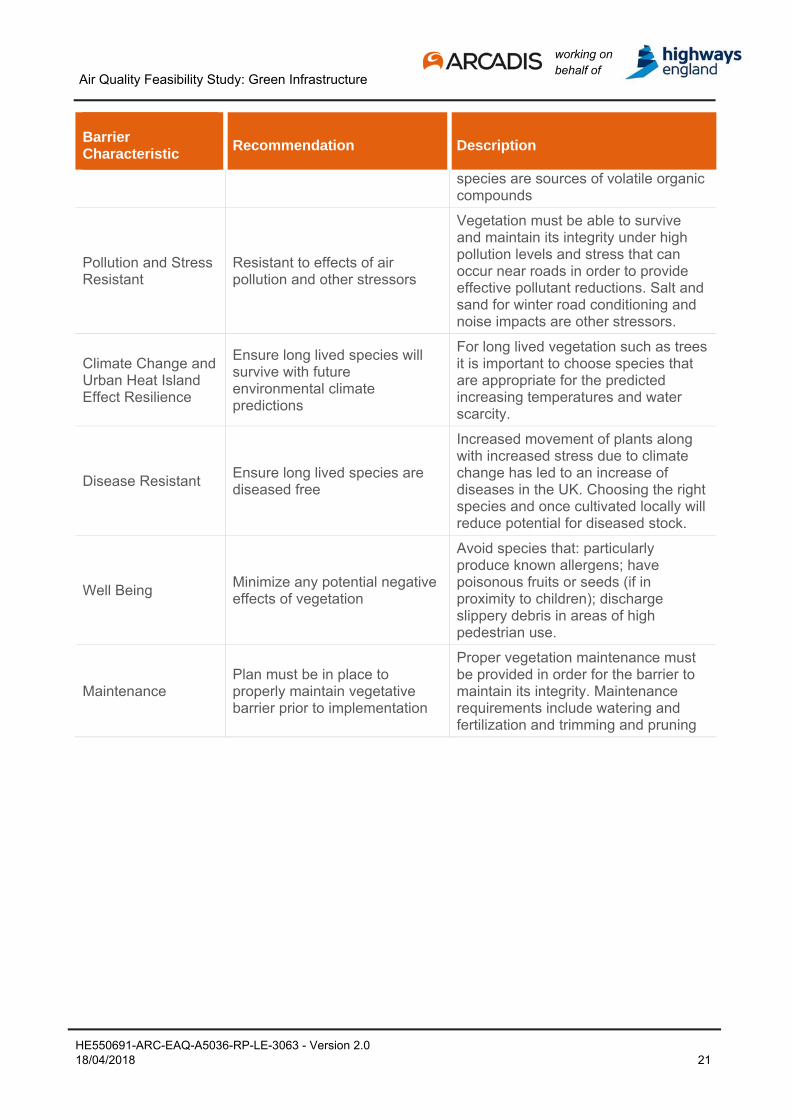
Constructing Roadside Vegetation Barriers to Improve Near-Road Air Quality’ (EPA, 2016) outlines a number of vegetation characteristics that affect pollutant removal, maintenance and resilience. Although these characteristics are described with regards to roadside vegetation barriers, they would be applicable to all types of green infrastructure. For long lived species this can be particularly important. The Forestry Commission hosts a website supported by numerous organisations including the Greater London Authority (www.righttrees4cc.org.uk) that provides easy to use advice on species suitability for a number of factors including climate change and resilience. The recommended vegetation characteristics are outlined in Table 5-1.
Table 5-1: Recommended Vegetation Characteristics
Barrier Characteristic
Recommendation Description
Vegetation Characteristics
Seasonal Effects Chosen vegetation should not be subject to change by seasons
Vegetation characteristics must be consistent throughout all seasons and climatic conditions to ensure effective pollutant reductions. Coniferous plants should be considered
Leaf Surface Complex waxy and/or hairy surface with high surface area
Leaf surfaces with complex and large surface areas will capture and contain more particulate pollutants as air passes through the structure. Coniferous leaves with thicker waxy needles are suggested. There is conflicting evidence that PM is more successfully collected by plants with waxy leaves than by plants with hairy leaves, however this requires additional research (Mosco et al, 2017). Many literature sources cite Stachys byzantina as the new “super” plant for PM collection.
Air Emissions Vegetation with low or no air emissions
Vegetation should not be a sources of air pollution. Some tree and vegetation
Air Quality Feasibility Study: Green Infrastructure
HE550691-ARC-EAQ-A5036-RP-LE-3063 - Version 2.0 18/04/2018 21
working on behalf of
Barrier Characteristic
Recommendation Description
species are sources of volatile organic compounds
Pollution and Stress Resistant
Resistant to effects of air pollution and other stressors
Vegetation must be able to survive and maintain its integrity under high pollution levels and stress that can occur near roads in order to provide effective pollutant reductions. Salt and sand for winter road conditioning and noise impacts are other stressors.
Climate Change and Urban Heat Island Effect Resilience
Ensure long lived species will survive with future environmental climate predictions
For long lived vegetation such as trees it is important to choose species that are appropriate for the predicted increasing temperatures and water scarcity.
Disease Resistant Ensure long lived species are diseased free
Increased movement of plants along with increased stress due to climate change has led to an increase of diseases in the UK. Choosing the right species and once cultivated locally will reduce potential for diseased stock.
Well Being Minimize any potential negative effects of vegetation
Avoid species that: particularly produce known allergens; have poisonous fruits or seeds (if in proximity to children); discharge slippery debris in areas of high pedestrian use.
Maintenance Plan must be in place to properly maintain vegetative barrier prior to implementation
Proper vegetation maintenance must be provided in order for the barrier to maintain its integrity. Maintenance requirements include watering and fertilization and trimming and pruning

Air Quality Feasibility Study: Green Infrastructure
HE550691-ARC-EAQ-A5036-RP-LE-3063 - Version 2.0 18/04/2018 22
working on behalf of
5.2.2 A modelling investigation by Donovan et al (2005) was undertaken to quantify the effects of trees on urban air quality. An Urban Tree Air Quality Score (UTAQS) specific to the UK was developed, which ranks tress based on their potential to improve air quality. The UTAQS is defined based on changes in O3, NO2 and other nitrogen species. Figure 1 below indicates the ranking of tree species from best to worst. Alder, Field Maple, Hawthorn, Pine, Cypress and Silver Birch have been ranked the highest for air quality improvements (Donovan et al.2005).
Figure 1: Urban Tree Air Quality Score classification for 30 most common trees in the West Midlands UK
5.2.3 I-Tree provides a tool for establishing the most effective tree species for pollutant removal within defined areas including within the UK (i-Tree,2017). The following criteria are used to identify the most effective tree species: Hardiness determined from the city or council area, mature height (user specified) and environmental factors including in this case air pollution removal.
5.2.4 Some suppliers such as Scotscape, Green City Solutions and ANS Global use certain plants in living wall systems based on characteristics that are thought to remove particulate pollution most efficiently. Table 5-2 below outlines the types of plants that they use.
Table 5-2: Types of Plants Recommended for use by Living Wall Suppliers
Study/Author Method Results
Scotscape
www.scotscape.net
A ‘Tree’ living wall has been predominantly planted with shrub and tree species that are thought to have the ability
Plants chosen include: Pinus mugo/Pinus sylvestris as waxy needles allow PM adherence; Stachys byzantina, Bello grigio and

Air Quality Feasibility Study: Green Infrastructure
HE550691-ARC-EAQ-A5036-RP-LE-3063 - Version 2.0 18/04/2018 23
working on behalf of
Study/Author Method Results to trap pollutant particulates from the air (mostly larger PM10 dust particulates but also smaller PM2.5 such as diesel exhaust fumes)
Geranium macrorrhizum densely hairy; Camelia japonica and Hedera helix waxy surfaces trap PM. Hedera helix can absorb high concentrations of pollutants such as formaldehyde and xylene with no ill effects to the plants
Exterior Plants for Particulate Matter and Nitrogen Dioxide Assimilation for us in ANS Global Living Wall System
Mosco et al.2017
Plants were selected from research papers and consideration was given to those plants which might successfully be grown in the ANS living wall system
Plants from the Apocynaceae family have been found to be most successful at collecting PM.
Native plants for PM collection Agrostis stolonifera and Plantago lanceolata could successfully be used in living wall systems
Trachelospermum jasminoides, vigorous evergreen climber, also a PM collector, provides rapid cover but requires pruning maintenance.
Certain plants from the Compositae, Myrtaceae, Salicaceae and Solanaceae families are most successful at removing nitrogen dioxide.
Medium to low NO2 assimilators, Fragaria vesca, Hedera helix ‘Pittsburgh’ and
Hedera helix ‘Wonder’ Lavandula angustifolia, Primula juliae and Thymus vulgaris work well in living wall systems.
Green City Solutions
https://greencitysolutions .de/en/
A German company which has chosen moss for their larger surface area and claims that each of their CityTree systems can absorb around 250 grams of particulate matter a day and contributes to the capture of greenhouse gases by removing 240 metric tons of CO2 a year amounting to the equivalent performance of 275 oak trees.
Moss species and Amblystegium varium and Leucobryum Glaucum have been used

Air Quality Feasibility Study: Green Infrastructure
HE550691-ARC-EAQ-A5036-RP-LE-3063 - Version 2.0 18/04/2018 24
working on behalf of
5.3 Design Characteristics 5.3.1 The United States Environmental Protection Agency (EPA) report ‘Recommendations for
Constructing Roadside Vegetation Barriers to Improve Near-Road Air Quality’ (EPA, 2016) recommends a number of design characteristics for the implementation of effective vegetation barriers, as summarised in Table 5-3.
Table 5-3: Vegetation Barrier Physical Design Characteristics
Barrier Characteristic
Recommendation Description
Physical Characteristics
Height 5 meters or higher (or extends 1m above an existing solid barrier)
Higher the vegetative barrier, the greater the pollutant reductions. A minimum of 5m should provided
Thickness 5-10m
Thickness of barrier provides the residence time to allow for particulate removal from impaction or diffusion. Vegetation thickness also forces air flow over the barrier for a longer distance. Generally, 5m to 10m is recommended (Baldauf.2017)
Porosity 0.5 to 0.9
Porosity should not be too high to allow pollutants to easily pass through the barrier or cause wind stagnation. As porosity decreases the vegetation barrier will perform similarly to a solid barrier
Length 50m or more beyond area of concern
Extending the barrier beyond the area of concern prevents against pollutants meandering around edges

Air Quality Feasibility Study: Green Infrastructure
HE550691-ARC-EAQ-A5036-RP-LE-3063 - Version 2.0 18/04/2018 25
working on behalf of
6 Installation and Maintenance
6.1 Procurement Types 6.1.1 There are numerous products on the market offering off the shelf and bespoke options. The
preferred option will depend on the site location, conditions, access and the particular solution desired. Table 6-1 presents a list of options from established suppliers.
Table 6-1 Procurement Options
System Description Key Suppliers Key Benefits of Product
Green/
Living wall irrigated (modular)
Broadly defined as vegetation growing on or against a vertical surface. Generally, the system is wall-mounted but there are bespoke options of a free-standing structure.
They range from a hydroponic growing system to a soil (often mixed with other substrates such as coir, (coconut fibre)).
Plants are chosen for their air quality attenuating characteristics.
Irrigation systems may be manual or automatic and can be monitored remotely.
Biotecture
http://www.biotecture.uk.com/
Scotscape
https://www.scotscape.net/
Ansglobal
https://www.ansgroupglobal.com
Greencity Solutions https://greencitysolutions.de/en/solutions/
Biotecture have a patented system without the use of soil. This hydroponic system is inside a plastic panel and differs from soil-based system that it allows the nutrients to be monitored much closer. Their products can also be combined with the addition of habitat boxes to support insects. Irrigation can also be controlled remotely.
Scotscape developed a living wall air quality focused advised by Prof John Dover and Dr Ross Cameron, can also attach to lamp posts and is solar powered. The company also offers a living wall training day at Scotscape HQ. They also have a trial tree wall at Ditton Nursery (results pending).
AnsGlobal have commissioned research in partnership with Greenwich University looking at the particular matter and nitrogen dioxide assimilation in their products advised by Mosco (2017). This research confirmed that plants from the Compositae, Myrtaceae, Salicaceae and Solanaceae were most successful and assimilation.
Greencity Solutions have developed CityTree which is

Air Quality Feasibility Study: Green Infrastructure
HE550691-ARC-EAQ-A5036-RP-LE-3063 - Version 2.0 18/04/2018 26
working on behalf of
System Description Key Suppliers Key Benefits of Product
a pre grown modular moss or other plant wall with technology that can send and receive data and operate remotely powered by solar panels including an automated irrigation system
Green screen (pre-grown climber based
Green screens system may comprise of pre-grown climbers on steel/metal framed screens.
Generally, Ivy is the most suited climber for the UK climate, but other climbers are also suitable to the system.
Comes off the shelf with a few different standard measurements but is possible to bespoke the size, extendable or retractable, according to specific requirements.
Ansglobal
https://www.ansgroupglobal.com/contact
Mobilane
https://mobilane.co.uk/
Inleaf
https://inleaf.co.uk/
Mobilane offers pre-grown ivy screens for up to 3m with a 45 year guarantee on the steel/metal mesh
Mobilane has also commissioned research on particulate pollution capture advised by Dover and Phillips, 2015 which demonstrated that the Green Screens along the A38 were capturing particles from the air and improving air quality and amenity value.
Vegetated retaining walls
Vegetation grown into a retaining wall system usually a stacked permeable geo-textile bag which is infilled with mixture of soil, sand and compost. Seeded via, hydro-seeding or plug planting following installation.
It can be installed as gravity retaining
Rootlok Vegetated Wall Systems
http://rootlok.co.uk/
Greenfix Soil Specialists and Erosion Control Specialists
http://greenfix.co.uk/
FlexMSE®
The Rootlok system can be used to build walls from as small as 0.42m up to 10m or higher. There are numerous construction methods dependent on the wall type and height, loadings and other specific site conditions.
This system is low maintenance and presents an effective soil retention or flood barrier system.

Air Quality Feasibility Study: Green Infrastructure
HE550691-ARC-EAQ-A5036-RP-LE-3063 - Version 2.0 18/04/2018 27
working on behalf of
System Description Key Suppliers Key Benefits of Product
wall or as means to reinforce structures (i.e. erosion control).
http://gravitasint.com/products/flexmse/
Instant Hedges
Pre-grown mature hedges planted to create an instant vegetated linear feature
Instant Hedges
http://www.instanthedges.co.uk/
Instant hedges offers mature, Instant hedge range is available in either 1m troughs for easy planting or larger, individual trimmed sections that can be linked together for any application.
Tree belts
Semi-mature and mature trees planted to create an instant linear feature
Instant Hedges
http://www.instanthedges.co.uk/
Trees can be procured at a range of maturity and a range of species. Species should be carefully selected for their local provenance and overall suitability.
6.2 Installation Considerations and Costs 6.2.1 Of the suppliers contacted many were reluctant to supply cost information due to the wide
variance in costing due to specific locational requirements. However, Table 6-2 presents a range of cost information from the suppliers who responded.
Table 6-2 Installation Considerations and Costs
System Installation Considerations Cost*
Green/Living wall irrigated (modular)
The installation of the system varies according to the specific systems and it is available as wall-mounted or free-standing option which will require a bespoke frame. The soil based and hydroponic systems requires a power supply and water source availability.
Scotscape estimates living wall installations between £350 and £480/m² depending on the size of the wall.
Larger modules for free standing walls are estimated at around £500/m² due to additional support and weight of the structure.
Greencity Solutions CityTree estimate a £35,000 plus around £3,000 for estimation for each unit which is approximately 4m by 2.93m which amounts to £3,242 per m2.
Green screen (pre-grown climber based)
The pre-grown climber-based screen is available wall-mounted or free-standing. The installations
Inleaf, standard 1.8m width pre-grown Ivy screen is the most cost effective as the installation cost is

Air Quality Feasibility Study: Green Infrastructure
HE550691-ARC-EAQ-A5036-RP-LE-3063 - Version 2.0 18/04/2018 28
working on behalf of
System Installation Considerations Cost*
specifications may vary but the climbers are generally planted directly in the ground with metal posts and fittings required.
The pre-grown moss wall is off the shelf with bespoke design.
the same as the 1.2m wide screens.
Inleaf estimates that the standard 1.8m width pre-grown Ivy screen planted in soft ground between £200 and £300 (approximately £175/m2)
Mobilane estimates supply only costs for the Helix Woerner screen (including metal posts and fixings excluding installation) of a 1.8m wide of linear meter (lm) for 25 lm (£3020), 50 lm (£5250), 100 lm (£10,100)
AnsGlobal estimates between £350 and £450per lm at 2m high screen but largely variable depending upon the choice of frame.
Vegetated retaining walls
Minimal equipment and labour needed, thus making the system very easy to install in limited access areas.
Not provided
Instant Hedges
The system is available in containers or to be directly transposed to the ground. Over soft ground there is a requirement of trenching of approximately 40 x 40 to plant hedge. Planting two specimens and spacing them out (up to 2m) ensures space for the hedge to grow and close the gaps.
Costs vary, Instant Hedges estimates between £95 and £150 per m.
Instant Hedges estimates Cypresses leylandii, 400cm height at £294 per specimen.
Tree belts
Semi-mature and mature (size from 10-12cm up to 120cm+) are available in containers or to be directly transposed to the ground. Specific installation varies according to the size and species of the specimen.
Tree pits are recommended to allow trees to flourish in aread with hardstanding such as ArborRaft System http://www.green-tech.co.uk/ArborRaft-urban-tree-planting-solution and RootSpace soil support system http://www.greenblue.com/gb/type/urban-tree-planting-systems/
It is recommended that a minimum of 5m3 is made available for a small canopied tree.
Smaller trees will establish more successfully but require more

Air Quality Feasibility Study: Green Infrastructure
HE550691-ARC-EAQ-A5036-RP-LE-3063 - Version 2.0 18/04/2018 29
working on behalf of
System Installation Considerations Cost*
maintenance.
Trees should conform to the specification for nursery stock as set out in British Standard Nos. 3936:1992 Parts 1 to 12. The use of container grown stock as opposed to root balled stock reduces the chance of transplant shock and increases the establishment rates of the newly planted trees.
Trees should be planted during the dormant season (October – March) in the autumn after leaf drop or in early spring before bud-break.
*Costs are estimated provided by suppliers in January/February 2018
6.3 Maintenance Considerations and Costs 6.3.1 Considerations and costs vary enormously due to the location and type and of planting. Table
6-3 presents a range of issues to consider and cost estimates for maintenance.
Table 6-3 Maintenance Considerations and Costs
System Maintenance / Irrigation Cost
Green/
Living wall irrigated (modular)
Maintenance
Requires plant health checks, pruning and replacement and irrigation system maintenance. AnsGlobal estimated plant replacement of between 5-10% of the species each year. Monthly visits are recommended to check the plants health checks and the irrigation calibration system.
Irrigation
Scotscape recommends a maintenance regime of quarterly visits during the first 24 months of installation with monthly visits afterwards.
Mobilane estimates that an irrigation system is essential and overflow/or drainage must be available in addition to a regular water source. The average water consumption is 5 litres/m2 per week, but this can fluctuate dependent on conditions.
The cost for the maintenance regime varies according to a variety of elements.

Air Quality Feasibility Study: Green Infrastructure
HE550691-ARC-EAQ-A5036-RP-LE-3063 - Version 2.0 18/04/2018 30
working on behalf of
System Maintenance / Irrigation Cost
The Biotecture hydroponic system indicated water consumption of 1 litre/m2 per day.
Greencity Solutions CityTree offer automated irrigation but suggest monthly visits for the lifetime of the unit.
Green screen (pre-grown climber based)
Maintenance
Green screens systems are generally a low maintenance product. Maintenance regime will depend upon choice of plants and general location.
Mobilane estimates that pruning may be necessary 1 or 2 times per year and nutrients added once per year.
Irrigation
Inleaf recommends periodical maintenance requirement between the first 6 to 12 months to ensure root systems is stablished.
Mobilane estimates the water usage for irrigation between 2 to 2.5 litres per screen per day until plants are established which may be 3 to 6 months depending on the species.
The cost for the maintenance regime varies according to a variety of elements
Vegetated retaining walls
These details were not provided by the supplier but they are designed as a long term solution with a design life of 120+ years and a 75-year warranty, FlexMSE® structures withstand almost unlimited differential settlement (up to 2m). Maintenance expected to be minimal to none following establishment.
Minimal
Instant Hedges
Maintenance
Instant hedges recommends maintenance depending on the variety of species of hedge chosen. May vary between once to twice a year.
Irrigation
Instant Hedges recommends watering within the first few summer seasons until hedge is established. If irrigating becomes an issue an Irrigation system can on dripper with a timer can be setup.
The cost for the maintenance regime varies according to a variety of elements
Tree belts Maintenance London Borough of Bexley have calculated that

Air Quality Feasibility Study: Green Infrastructure
HE550691-ARC-EAQ-A5036-RP-LE-3063 - Version 2.0 18/04/2018 31
working on behalf of
System Maintenance / Irrigation Cost
The tree maintenance and management regime varies according to the species and conditions but following establishment pruning may be required on a 2 to 5 year cycle depending on the species and the location.
Single staking should of trees for support will be sufficient in most locations. In addition to conventional stakes the use of underground guying will work better for larger tree stock.
Irrigation
Trees planted in the dormant require a basic irrigation system to be installed at the time of planting. Recommended for trees to be irrigated for the first 2 years following planting after which they would access water from the surrounding soil. For trees planted within the open landscape (grass or existing open soil) Greenleaf Root-rain is a good product.
£230 will pay for a tree planting with stakes and tree guard, as well as two years of maintenance to help the tree establish (Available at: http://www.bexleytimes.co.uk/news/tree-sponsoring-scheme-introduced-to-bexley-1-3866245)

Air Quality Feasibility Study: Green Infrastructure
HE550691-ARC-EAQ-A5036-RP-LE-3063 - Version 2.0 18/04/2018 32
working on behalf of
7 Additional Benefits
7.1 Biodiversity 7.1.1 The requirements of all year-round amenity benefits can be balanced with biodiversity value.
In addition to their inherent floral biodiversity Chiquet et al., (2013) looked at the benefits of living walls to urban birds which were more abundant in areas with living walls using the upper half of the wall for nesting, food and shelter. This included use by species of conservation concern in the UK such as House sparrow and Starling.
7.1.2 When Beech, Hawthorn and Privet hedges were tested, Hawthorn supported the greatest number and diversity of bird species (Atkins et al., 2015).
7.1.3 An invertebrate survey of green walls demonstrated that they supported an abundant and diverse invertebrate assemblage with evergreen walls having an advantage over deciduous (Chiquet et al., 2015).
7.2 Climate Attenuation 7.2.1 One of the most studied secondary benefits of living walls is with regards to climate
attenuation in terms of passive cooling and/or insulation with relation to buildings. For example, Bolton et al., (2014) demonstrated the insulation properties of ivy covering a north wall in Manchester. The covering increased the mean winter temperature by 0.5oC and reduced temperature fluctuations by over 3% resulting in an energy loss reduction of 8%, with colder climates achieving greater benefits. Similarly, in Mediterranean climates, which the UK’s urban summer temperatures are becoming increasingly similar (UK Climate Change Risk Assessment 2017 Evidence Report) to living walls and grass walls were shown to be cost effective in terms of energy saving due to the effects of shading and airflow (Pulselli et al., 2014).
7.3 Drainage 7.3.1 While the water volume attenuation capacity of living walls may not be sufficient to manage
storm events, they will contribute to slowing the flow in urban environments. Street trees in particular are known to significantly reduce storm water runoff volumes from urban catchments (Xiao and McPherson 2011). In addition, tree roots also penetrate through typically impermeable urban soil layers into more permeable zones, thus have the potential to further increase stormwater infiltration rates (Day and Dickenson, 2008).
7.4 Health and Wellbeing 7.4.1 While living walls don’t have the health benefits accessible open greenspace has they have
been shown as having importance in terms of urban rehabilitation of contemporary cities. They are considered to have a positive effect on the wellbeing of citizens enhancing urban spaces and promoting sustainability (Virtudes and Manso, 2012). It’s also been demonstrated that plants in and around the workplace can improve absenteeism, reduce fatigue, headaches and overall respiratory health (various sources collated by plants@work and available at https://plantsatwork.org.uk/index.php/plants-our-perfect-partners). A study by Nieuwenhuis et al., (2014) in the UK found that bringing plants into the workplace increased productivity by 15% and increased workplace satisfaction.
7.5 Waste Water Management 7.5.1 Perhaps surprisingly, living walls have been cost effective in waste water treatment. In a study
in Pune, effluent from an office building was effectively treated to Indian legal specifications for reuse (in irrigation and flushing) by a living wall (Masi et al., 2015). This is something that may be applied to other forms of waste water. For example, removal of turbidity, Biological

Air Quality Feasibility Study: Green Infrastructure
HE550691-ARC-EAQ-A5036-RP-LE-3063 - Version 2.0 18/04/2018 33
working on behalf of
Oxygen Demand and total nitrogen was found to be effective for living walls for small scale food and beverage manufacturers (Wolcott, 2015). As part of their natural growth cycles, urban trees have been shown to significantly reduce rainwater nitrogen and other pollution loads in stormwater runoff (Denman et. al., 2011).
7.6 Amenity 7.6.1 The amenity value of living walls has been demonstrated to add capital value in retail settings
due to the increased attention drawn by a visually attractive setting that differentiates from other retailers. For example a hair salon in Dublin experienced a 40% increase in sales in the year following a living wall installation (as reported by Ans Global available at: https://www.ansgroupglobal.com/living-wall/applications/retail-stores-and-shopping-malls)
7.6.2 Westfield living wall has been the subject of a number of case studies. One from 2009 as part of the UK Green Building Council (available at: https://www.ukgbc.org/sites/default/files/Biodiversity-case-studies.pdf) suggested that despite difficult economic conditions when the wall was installed all of the restaurant units overlooking the facility were let. This has been attributed to the attractiveness of the wall and it has also been noted that customers stay longer in this area.
7.7 Natural Capital 7.7.1 Natural capital is an emerging discipline which values the stocks of natural capital and flows
of services supplied by them. Those stocks being renewable and non-renewable natural resources (e.g. plants, animals, air, water, soils, minerals). Identifying the values/benefits provided is the first step in the natural capital approach. Some of these primary benefits (in terms of this assessment) to air quality and secondary additional benefits have been discussed in the previous sections for living walls, trees and hedgerows. Following steps in the natural capital approach involves monetising those values. While it is not the remit of this report to produce a full monetisation of these green wall solutions there are some data worth noting.
7.7.2 The overall value of an area is enhanced by vegetation. Studies in the UK and North America have shown that good tree cover can increase the value of a property between 6 and 15% (Greater London Authority, 2008 and Wolf, 2007). A study by McPherson et al., (2016) showed that for every 1$ spent on trees $5.82 in benefit is returned.
7.7.3 A cost benefit analysis (CBA) by Perini and Rosasco 2013 demonstrated that vertical greening systems can be economically sustainable. Economic incentives (tax reduction) could reduce personal initial cost allowing a wider diffusion of greening systems to reduce environmental issues in dense urban areas, such as urban heat island phenomenon and air pollution. For the vertical greening systems assessed for multiple benefits the most relevant items in terms of CBA were energy savings for summer air conditioning and the increase in rental income both around 1000 Euro per year. For all the vertical greening systems analysed the energy saving for heating is lower, less than 6.5 Euro per year.

Air Quality Feasibility Study: Green Infrastructure
HE550691-ARC-EAQ-A5036-RP-LE-3063 - Version 2.0 18/04/2018 34
working on behalf of
8 Summary
8.1 Air Quality Benefits 8.1.1 It is thought that vegetation can act as a sink for pollutants through deposition and uptake via
stomata depending on a number of factors such as vegetation type and density, meteorology and street geometry (Table 2-2). Studies of uptake of NO2 and PM10 by vegetation are based on air quality modelling and are therefore subject to limitations and uncertainties regarding modelling parameters. Modelled rates of uptake to vegetation will be highly sensitive to the deposition velocities assumed, which vary by more than four orders of magnitude. There is a lack of observational evidence available to verify the outcome of model-based studies.
8.1.2 The modelling studies undertaken to quantify removal of NO2 and PM10 by vegetation suggest that the effects are likely to be of the order of a few percent; however many of these studies tend to focus on average removal across the atmospheric boundary layer (i.e. typically the lowest 1km of atmosphere), and there are few studies that have investigated more localised effects that would occur at street level. Those modelling studies that that have been undertaken at a local level have been done in a street canyon where the same volume of polluted air can be contact with vegetation for long periods, enhancing removal.
8.1.3 The aerodynamic effects of vegetation could be more important than their effect as a sink for pollutants. Modelling studies suggest that dense vegetation can act a barrier to pollution, and create updrafts promoting dispersion. However, the effects quantified tend to be based on the optimum conditions for enhanced dispersion to occur (e.g. wind perpendicular to vegetation and at sufficient wind speed and vegetation density to generate updrafts). Research suggests, however, that vegetation barriers would be far less effective at promoting dispersion than solid barriers, which are understood to be currently undergoing trials by Highways England.
8.1.4 Modelling studies suggest that the location and density of vegetation could be important for determining their net air quality effects. Trees in street canyons may reduce vertical air exchange leading to worsening in air quality at street level, and trees and low-density hedgerows could potentially reduce horizontal wind speeds, causing pollution to disperse less efficiently. The way in which vegetation can affect air quality is therefore highly complex, and it could be wrong to assume that vegetation can be beneficial for air quality in all circumstances, particularly at a local level.
8.1.5 Some monitoring studies have been undertaken examining the aerodynamic effects of vegetation and suggest that reductions in pollution can be achieved behind vegetation barriers such as green walls. Such studies are based on monitoring located immediately either side of a barrier, where the greatest effects on dispersion would occur. Further studies are required to understand how dispersion would be affected much further behind a barrier where people reside, and human exposure would occur. These studies are also based on limited and intermittent periods of monitoring, and long-term effects have not been demonstrated. This would be important for understanding how the vegetation would affect annual mean air quality objectives/ EU Limit values, which are of most concern in roadside environments. It is however understood that Highways England are investigating how barriers can affect air quality, through undertaking long term monitoring at various distances behind solid barriers, and this could be valuable in providing evidence in this context, although solid barriers would have greater aerodynamic effects than vegetation (as they are non-porous).
8.1.6 In summary, further research, supported by empirical data is required to demonstrate that vegetation would be an effective mitigation measure in relation to improving air quality in the near road environment, particularly with regards to NO2. The current evidence, which is largely model based, suggests that aerodynamic effects of vegetation on air quality are likely to be far more important than pollution removal by uptake/deposition, but such aerodynamic
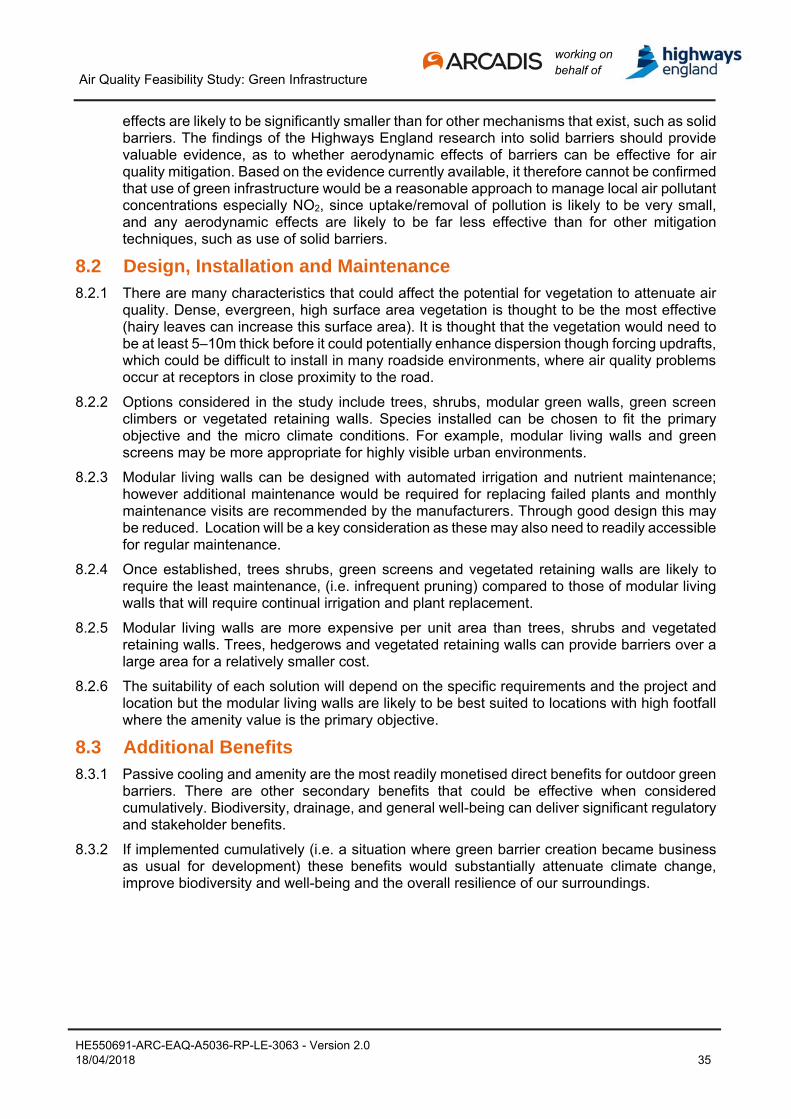
Air Quality Feasibility Study: Green Infrastructure
HE550691-ARC-EAQ-A5036-RP-LE-3063 - Version 2.0 18/04/2018 35
working on behalf of
effects are likely to be significantly smaller than for other mechanisms that exist, such as solid barriers. The findings of the Highways England research into solid barriers should provide valuable evidence, as to whether aerodynamic effects of barriers can be effective for air quality mitigation. Based on the evidence currently available, it therefore cannot be confirmed that use of green infrastructure would be a reasonable approach to manage local air pollutant concentrations especially NO2, since uptake/removal of pollution is likely to be very small, and any aerodynamic effects are likely to be far less effective than for other mitigation techniques, such as use of solid barriers.
8.2 Design, Installation and Maintenance 8.2.1 There are many characteristics that could affect the potential for vegetation to attenuate air
quality. Dense, evergreen, high surface area vegetation is thought to be the most effective (hairy leaves can increase this surface area). It is thought that the vegetation would need to be at least 5–10m thick before it could potentially enhance dispersion though forcing updrafts, which could be difficult to install in many roadside environments, where air quality problems occur at receptors in close proximity to the road.
8.2.2 Options considered in the study include trees, shrubs, modular green walls, green screen climbers or vegetated retaining walls. Species installed can be chosen to fit the primary objective and the micro climate conditions. For example, modular living walls and green screens may be more appropriate for highly visible urban environments.
8.2.3 Modular living walls can be designed with automated irrigation and nutrient maintenance; however additional maintenance would be required for replacing failed plants and monthly maintenance visits are recommended by the manufacturers. Through good design this may be reduced. Location will be a key consideration as these may also need to readily accessible for regular maintenance.
8.2.4 Once established, trees shrubs, green screens and vegetated retaining walls are likely to require the least maintenance, (i.e. infrequent pruning) compared to those of modular living walls that will require continual irrigation and plant replacement.
8.2.5 Modular living walls are more expensive per unit area than trees, shrubs and vegetated retaining walls. Trees, hedgerows and vegetated retaining walls can provide barriers over a large area for a relatively smaller cost.
8.2.6 The suitability of each solution will depend on the specific requirements and the project and location but the modular living walls are likely to be best suited to locations with high footfall where the amenity value is the primary objective.
8.3 Additional Benefits 8.3.1 Passive cooling and amenity are the most readily monetised direct benefits for outdoor green
barriers. There are other secondary benefits that could be effective when considered cumulatively. Biodiversity, drainage, and general well-being can deliver significant regulatory and stakeholder benefits.
8.3.2 If implemented cumulatively (i.e. a situation where green barrier creation became business as usual for development) these benefits would substantially attenuate climate change, improve biodiversity and well-being and the overall resilience of our surroundings.

Air Quality Feasibility Study: Green Infrastructure
HE550691-ARC-EAQ-A5036-RP-LE-3063 - Version 2.0 18/04/2018 36
working on behalf of
9 References
Abhijith.K.V, Kumar.P, Gallagher.J, McNabola.A, Baldauf.R, Pilla.F, Broderick.B, Di Sabatino.S. (2017). Air Pollution Abatement Performances of Green Infrastructure in Open Road and Built-Up Street Canyon Environments – A Review. Atmos Environ. Vol 162. pp. 71-86
Al Dabbous. A and Kumar. P (2014). The Influence of Roadside Vegetation Barriers on Airborne Nanoparticles and Pedestrians Exposure under Varying Wind Conditions. Atmos Environ. Vol 90. pp 113-124
Atkins, E., Chiquet, C., Dover, J., Swetnam R., Mitchell, P. and Smith G. (2015). The Biodiversity Value of Urban Hedges. Phd thesis. Staffordshire University.
Baldauf.R, Thoma.E, Khlystov.A, Isakov.V, Bowker.G, Long.T. (2008). Impacts of noise barriers on near-road air quality. Atmos Environ. Vol 42. pp 7502-7507
Baldauf,R. (2017). Roadside Vegetation Design Characteristics that can Improve Local Near-Road Air Quality. Transportation Research Part D. Vol 52, Part A. pp 354-361
Bolton, C., Rahman, M., Armson, D. and Ennos, A. (2014). Effectiveness of an ivy covering at insulating a building against the cold in Manchester, U.K: A preliminary investigation.
Chiquet, C., Dover, J. and Mitchell, P. (2013). Birds and the urban environment: the value of green walls. Urban Ecosystems, 16(3), pp.453-462.
Chiquet, C. (2014). The animal Biodiversity of Green Walls in the Urban Environment. PhD Thesis. Staffordshire University. David Suzuki Foundation. (2015). The Impact of Green Space on Heat and Air Pollution in Urban Communities. Found at: https://davidsuzuki.org/science-learning-centre-article/impact-green-space-heat-air-pollution-urban-communities/
Day, S.D., and S.B. Dickinson (Eds.). (2008). Managing Stormwater for Urban Sustainability using Trees and Structural Soils. Virginia Polytechnic Institute and State University, Blacksburg, VA.
Denman, E., May, P., Moore, G. (2011). Urban Trees Research Conference, “Trees, people and the built environment”, 13 & 14 April 2011 Birmingham, UK and the ISA Annual Conference, 25 – 27 April 2011, Sydney. Available at: https://www.forestry.gov.uk/pdf/Trees-people-and-the-buit-environment_Denman.pdf/$FILE/Trees-people-and-the-buit-environment_Denman.pdf
Di Sabatino.S, Buccolieri.R, Pappaccogli.G and Leo.L.S. (2015). The Effects of Trees on Micrometerology in a Real Street Canyon: Consequences for Local Air Quality. International Journal of Environment and Pollution. Vol 58. pp 100-111.
Donovan.R.G, Stewart.H.E, Owen.S.M, Mackenzie.R and Hewitt.C.N. (2005). Development and Application of an Urban Tree Air Quality Score for Photochemical Pollution Episodes using the Birmingham UK Area as a Case Study. Vol 39. pp 6730-6738
Dover J., Phillips S. (2015). Particulate Pollution Capture by Green Screens along the A38 Bristol Street in Birmingham. The Green Wall Centre, Staffordshire University
Dzierżanowski.K, Popek.R, Gawrońska.H, SæbØ.A, Gawroński.S.W. (2011). Deposition of Particulate Matter of Different Size Fractions on Lead Surfaces and in Waxes of Urban Forest Species. International Journal of Phytoremediation. Vol 13. pp 1037-1046.

Air Quality Feasibility Study: Green Infrastructure
HE550691-ARC-EAQ-A5036-RP-LE-3063 - Version 2.0 18/04/2018 37
working on behalf of
European Environment Agency. (2015). Air Pollution Key Message 2015-01-30-1654211257. Found at: https://www.eea.europa.eu/soer-2015/europe/air/keymessage-2015-01-30-1654211257
European Environment Agency. (2017). Air Pollution. Found at: https://www.eea.europa.eu/themes/air
Environmental Protection Agency. (2015). EnviroAtlas: Nitrogen Dioxide removed annually by Tree Cover. Found at: https://enviroatlas.epa.gov/enviroatlas/DataFactSheets/pdf/ESC/NitrogenDioxideremovedannuallybytreecover.pdf
Environmental Protection Agency. (2016). Recommendations for Constructing Roadside Vegetation Barriers to Improve Near-Road Air Quality. Found at: https://cfpub.epa.gov/si/si_public_record_report.cfm?direntryid=321772&subject=air%20research&showcriteria=0&searchall=air%20and%20(roads%20or%20road%20or%20roadway%20or%20roadways%20or%20traffic%20or%20%7Bnear%20road%7D)&acttype=product&timstype=published+report&sortby=revisiondate
Fowler.D, Coyle.M, Apsimon.H.M, Ashmore.M.R, Bareham.S.A, Battarbee.R.W, Derwent.R.G, Erisman.J.W, Goodwin.J, Grennfelt.P, Hornung.M, Irwin.J, Jenkins.A, Metcalfe.S.E, Ormerod.S.J, Reynolds.B, Woodin.S, Hall.J, Tipping.E, Sutton.M, Dragosits.U, Evans.C, Foot.J, Harriman.R, Monteith.D, Broadmeadow.M, Langan.S, Helliwell.R, Whyatt.D, Lee.D.S, Curtis.C. National Experts Group on Transport Air Pollution. 2001. Transboundary Air Pollution: Acidification, Eutrophication and Ground-Level Ozone in the UK NEGTAP. (2001). Found at: https://uk-air.defra.gov.uk/library/reports?report_id=109
Ghasemian.M, Amini.S, Princevac.M. (2017). Atmos Environ. Vol 170. pp 108-117.
Greater London Authority. (2008). Living Roofs and Walls Technical Report: Supporting London Plan Policy.
Gromke.C, Jamarkattel.N, Ruck.B. (2016). Influence of Roadside Hedgerows on Air Quality in Urban Street Canyons. Atmos Environ. Vol 139. pp 75-86
Gumdstrӧm.M and Pleijel.H. (2014). Limited Effect of Urban Tree Vegetation on NO2 and O3 Concentrations near a Traffic Route. Environmental Pollution. Vol 189. pp 73-76.
Hagler.G.S.W, Ming-Yeng.L, Khlystov.A, Baldauf.R.W, Isakov.V, Faircloth.J, Jackson.L.E. (2012). Field Investigations of Roadside Vegetative and Structural Barrier Impact on Near-Road Ultrafine Particle Concentrations under a Variety of Wind Conditions. Science of the Total Environment. Vol 419. pp 7-15.
Highways England. (2017). Our strategy to improve air quality.
I-Tree. (2017). I-Tree Tools for Assessing and Managing Forests and Community Trees. Found at: http://www.itreetools.org/
Janhall.S. (2015). Review on Urban Vegetation and Particle Air Pollution – Deposition and Dispersion. Atmos Environ. Vol 105. pp 130-137.
Jeanjean.A.P.R, Monks.P.S, Leigh.R.J. (2016). Modelling the Effectiveness of Urban Trees and Grass on PM2.5 Reductions via Dispersion and Deposition at a City Scale. Atmos Environ. Vol 147. pp 1-10.
Jeanjean.A.P.R, Gallagher.J, Monks.P.S, Leigh.R.J. (2017). Ranking Current and Prospective NO2 Pollution Mitigation Strategies: An Environmental and Economic Modelling Investigation in Oxford Street, London. Environmental Pollution. Vol 225. pp 587-597.

Air Quality Feasibility Study: Green Infrastructure
HE550691-ARC-EAQ-A5036-RP-LE-3063 - Version 2.0 18/04/2018 38
working on behalf of
Joshi.S.V & Ghosh.S. (2014). On the Air Cleansing Efficiency of an Extended Green Wall: A CFD analysis of Mechanistic details of Transport Processes. Journal of Theoretical Biology. Vol 361. Pp 101-110.
Masi, F., Bresciani, R., Rizzo, A., Edathoot, A., Patwardhan, N., Panse, D. and Langergraber, G. (2015). Green walls for greywater treatment and recycling in dense urban areas: a case-study in Pune. Journal of Water, Sanitation and Hygiene for Development, 6(2), pp.342-347.
McDonald.A.G, Bealey.W.J, Fowler.D, Dragosits.U, Skiba.U, Smith.R.I, Donovan.R.G, Brett.H.E, Hewitt.C.N, Nemitz.E. (2007). Quantifying the Effect of Urban Tree Planting on Concentrations and Depositions of PM10 in two UK Conurbations. Atmos Environ. Vol 41. pp 8455-8467.
McPherson, E., van Doorn, N. and de Goede, J. (2016). Structure, function and value of street trees in California, USA. Urban Forestry & Urban Greening, 17, pp.104-115.
Morakinyo,T.E, Lam.Y.F & Hao.S. (2016). Evaluating the Role of Green Infrastructures on Near-Road Pollutant Dispersion and Removal: Modelling and Measurement
Mosco S. Milliken, S, Kotzen B. (2017). Exterior Plants for Particulate Matter and Nitrogen Dioxide Assimilation for use in ANS Global Living Wall System. University of Greenwich. Draft unpublished supplied by ANSGlobal.
Nichols.A.J. (2014). An Investigation into the Efficacy of Green Walls in Reducing the Levels of Traffic Pollutants PM10 and Nitrogen Dioxide. Found at: https://www.lbbd.gov.uk/wp-content/uploads/2014/10/Alan-Nichols-Green-Wall-Dissertation.pdf
Nieuwenhuis, M., Knight, C., Postmes, T., & Haslam, S. A. (2014). Journal of Experimental Psychology: Applied, 20(3), 199-214.
Nowak.D.J, Crane.D.E, Stevens.J.C. (2006). Pollution removal by Urban Trees and Shrubs in the United States. Urban Forestry and Urban Greening. Vol 4. pp 115-123
Nowak.D.J. (2005). Strategic tree planting as an EPA encouraged pollutant reduction strategy: how urban trees can obtain credit in state implementation plans. Found at: http://www.ufei.org/files/pubs/Air_Quality_and_use_of_trees_in_SIPs.pdf
Ow, L. and Ghosh, S. (2017). Urban cities and road traffic noise: Reduction through vegetation. Applied Acoustics, 120, pp.15-20.
Perini, K. and Rosasco, P. (2013). Cost–benefit analysis for green façades and living wall systems. Building and Environment, 70, pp.110-121.
Pugh.T.AM, MacKenzie.R.A, Whyatt.D.J, Hewitt,C.N. (2012). Effectiveness of Green Infrastructure for Improvement of Air Quality in Urban Street Canyons. Environmental Science and Technology. Vol 46. pp 7692-7699.
Pulselli, R., Pulselli, F., Mazzali, U., Peron, F. and Bastianoni, S. (2014). Emergy based evaluation of environmental performances of Living Wall and Grass Wall systems. Energy and Buildings, 73, pp.200-211.
Royal College of Physicians. (2016). Every breath we take: the lifelong impact of air pollution.
Tong.Z., Baldauf R.W, Isakov.V, Deshmukh.P, Zhang.K.M. (2016). Roadside vegetation barrier designs to mitigate near- road air pollution impacts. Science of The Total Environment. Vol 541. pp 920-927.
Tremper.A.H, Green.D.C, Chatter-Singh.D, Eleftherious-Vaus.K. (2015). Impacts of Green Screens on Concentrations of Particulate Matter and Oxides of Nitrogen in Near Road

Air Quality Feasibility Study: Green Infrastructure
HE550691-ARC-EAQ-A5036-RP-LE-3063 - Version 2.0 18/04/2018 39
working on behalf of
Environments. King’s College London Environmental Research Group. Found at: http://www.londonair.org.uk/london/reports/GreenScreen_Report.pdf
Tremper.A.H and Green.D.C. (2018). The Impact of a Green Screen on Concentrations of Nitrogen Dioxide at Bowes Primary School, Enfield. Found at: https://www.londonair.org.uk/london/reports/Green_Screen_Enfield_Report_final.pdf
Tiwary.A, Sinnett. D, Peachy.C, Chalabi. Z, Vardoulakis.S, Fletcher.T, Leonardi.G, Grundy.C, Azapagic.A, and Hutchings.T. (2009). An Integrated Tool to Assess the Role of New Planting in PM10 Capture and the Human Health Benefits: A Case Study in London. Environmental Pollution. Vol 157.Pp 2645-2653
Veisten, K., Smyrnova, Y., Klæboe, R., Hornikx, M., Mosslemi, M. and Kang, J. (2012). Valuation of Green Walls and Green Roofs as Soundscape Measures: Including Monetised Amenity Values Together with Noise-attenuation Values in a Cost-benefit Analysis of a Green Wall Affecting Courtyards. International Journal of Environmental Research and Public Health, 9(12), pp.3770-3788.
Van Renterghem, T., Attenborough, K., Maennel, M., Defrance, J., Horoshenkov, K., Kang, J., Bashir, I., Taherzadeh, S., Altreuther, B., Khan, A., Smyrnova, Y. and Yang, H. (2014). Measured light vehicle noise reduction by hedges. Applied Acoustics, 78, pp.19-27.
Virtudes A., Manso M. (2012). Green Walls Benefits in Contemporary City. Epoka University Department of Architecture.
Xiao, Q. and McPherson, E. (2011). Rainfall interception of three trees in Oakland, California. Urban Ecosystems, 14(4), pp.755-769. Wei, X., Lyu, S., Yu, Y., Wang, Z., Liu, H., Pan, D. and Chen, J. (2017). Phylloremediation of Air Pollutants: Exploiting the Potential of Plant Leaves and Leaf-Associated Microbes. Frontiers in Plant Science, 8.
Wolcott, Scott, "Performance of Green Walls in Treating Brewery Wastewater". (2015). Accessed from http://scholarworks.rit.edu/other/819
Wolf, K.L. August. (2007). City Trees and Property Values. Arborist News 16, 4: 34-36.
Woodland Trust. (2012). Urban Air Quality. Found at: https://www.woodlandtrust.org.uk/mediafile/100820912/dp-wt-12-urban-air-quality-report.pdf?cb=ceb6b27e53c1445b87941ab1652172da
UK Climate Change Risk Assessment 2017 Evidence Report (2017) Committee on Climate Change (CCC) Adaptation Sub-Committee (ASC) Found at: www.theccc.org.uk/uk-climate-change-risk-assessment-2017.

Arcadis (UK) Limited
The Surrey Research Park 10 Medawar Road Guildford GU2 7AR United Kingdom
T: +44 (0)1483 803 000
arcadis.com
Related Documents